Byng, OK Map & Demographics
Byng Map
Byng Overview
$34,215
PER CAPITA INCOME
$99,375
AVG FAMILY INCOME
$83,661
AVG HOUSEHOLD INCOME
1.2%
WAGE / INCOME GAP [ % ]
98.8¢/ $1
WAGE / INCOME GAP [ $ ]
$10,780
FAMILY INCOME DEFICIT
0.36
INEQUALITY / GINI INDEX
1,473
TOTAL POPULATION
717
MALE POPULATION
756
FEMALE POPULATION
94.84
MALES / 100 FEMALES
105.44
FEMALES / 100 MALES
33.1
MEDIAN AGE
3.2
AVG FAMILY SIZE
2.8
AVG HOUSEHOLD SIZE
716
LABOR FORCE [ PEOPLE ]
67.3%
PERCENT IN LABOR FORCE
4.9%
UNEMPLOYMENT RATE
Byng Area Codes
Income in Byng
Income Overview in Byng
Per Capita Income in Byng is $34,215, while median incomes of families and households are $99,375 and $83,661 respectively.
| Characteristic | Number | Measure |
| Per Capita Income | 1,473 | $34,215 |
| Median Family Income | 408 | $99,375 |
| Mean Family Income | 408 | $108,996 |
| Median Household Income | 533 | $83,661 |
| Mean Household Income | 533 | $96,190 |
| Income Deficit | 408 | $10,780 |
| Wage / Income Gap (%) | 1,473 | 1.18% |
| Wage / Income Gap ($) | 1,473 | 98.82¢ per $1 |
| Gini / Inequality Index | 1,473 | 0.36 |
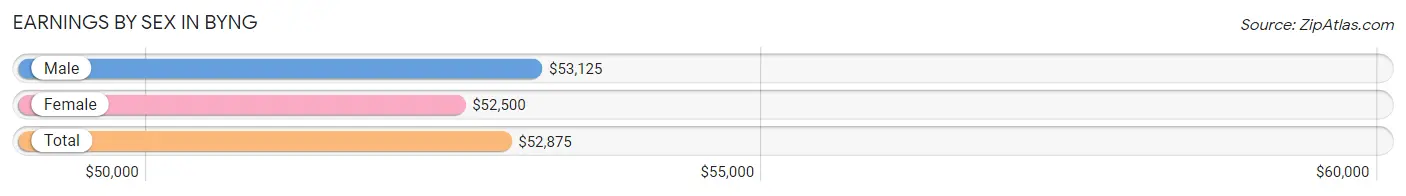
Earnings by Sex in Byng
Average Earnings in Byng are $52,875, $53,125 for men and $52,500 for women, a difference of 1.2%.
| Sex | Number | Average Earnings |
| Male | 362 (50.4%) | $53,125 |
| Female | 356 (49.6%) | $52,500 |
| Total | 718 (100.0%) | $52,875 |
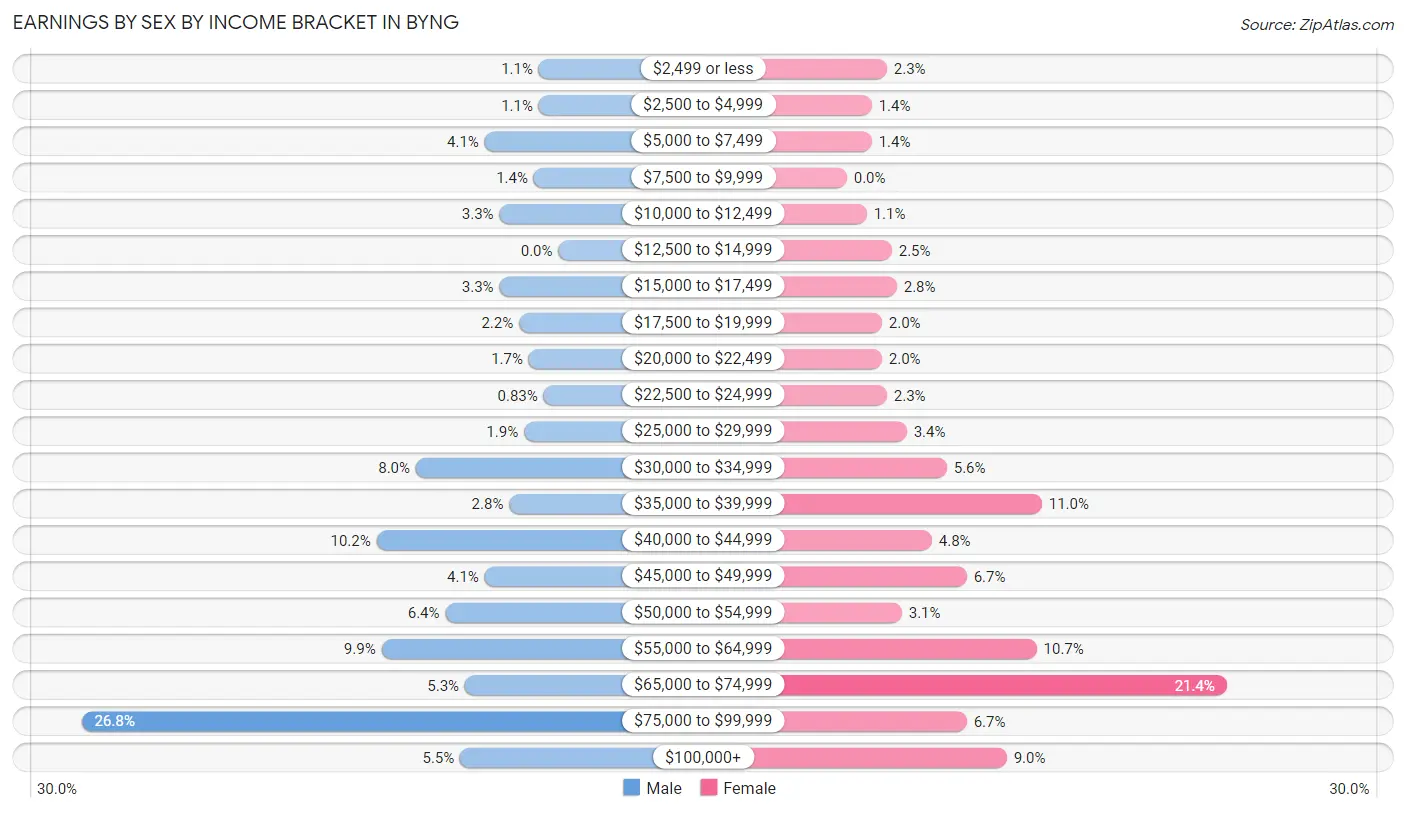
Earnings by Sex by Income Bracket in Byng
The most common earnings brackets in Byng are $75,000 to $99,999 for men (97 | 26.8%) and $65,000 to $74,999 for women (76 | 21.3%).
| Income | Male | Female |
| $2,499 or less | 4 (1.1%) | 8 (2.2%) |
| $2,500 to $4,999 | 4 (1.1%) | 5 (1.4%) |
| $5,000 to $7,499 | 15 (4.1%) | 5 (1.4%) |
| $7,500 to $9,999 | 5 (1.4%) | 0 (0.0%) |
| $10,000 to $12,499 | 12 (3.3%) | 4 (1.1%) |
| $12,500 to $14,999 | 0 (0.0%) | 9 (2.5%) |
| $15,000 to $17,499 | 12 (3.3%) | 10 (2.8%) |
| $17,500 to $19,999 | 8 (2.2%) | 7 (2.0%) |
| $20,000 to $22,499 | 6 (1.7%) | 7 (2.0%) |
| $22,500 to $24,999 | 3 (0.8%) | 8 (2.2%) |
| $25,000 to $29,999 | 7 (1.9%) | 12 (3.4%) |
| $30,000 to $34,999 | 29 (8.0%) | 20 (5.6%) |
| $35,000 to $39,999 | 10 (2.8%) | 39 (11.0%) |
| $40,000 to $44,999 | 37 (10.2%) | 17 (4.8%) |
| $45,000 to $49,999 | 15 (4.1%) | 24 (6.7%) |
| $50,000 to $54,999 | 23 (6.4%) | 11 (3.1%) |
| $55,000 to $64,999 | 36 (9.9%) | 38 (10.7%) |
| $65,000 to $74,999 | 19 (5.2%) | 76 (21.3%) |
| $75,000 to $99,999 | 97 (26.8%) | 24 (6.7%) |
| $100,000+ | 20 (5.5%) | 32 (9.0%) |
| Total | 362 (100.0%) | 356 (100.0%) |
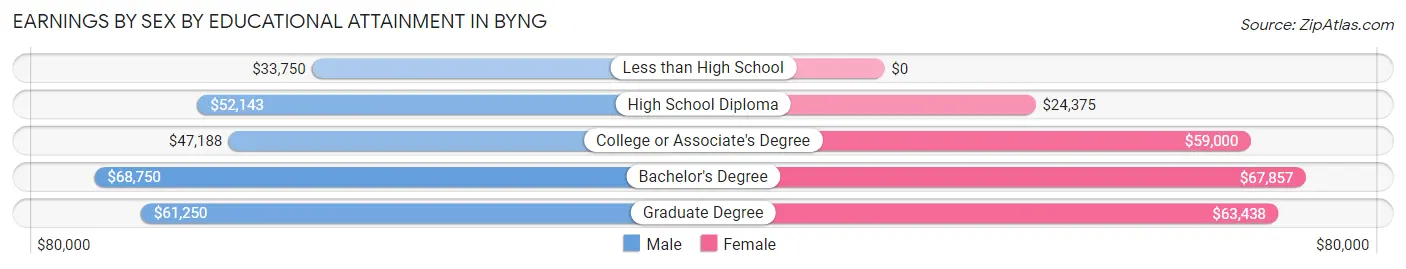
Earnings by Sex by Educational Attainment in Byng
Average earnings in Byng are $54,479 for men and $55,972 for women, a difference of 2.7%. Men with an educational attainment of bachelor's degree enjoy the highest average annual earnings of $68,750, while those with less than high school education earn the least with $33,750. Women with an educational attainment of bachelor's degree earn the most with the average annual earnings of $67,857, while those with high school diploma education have the smallest earnings of $24,375.
| Educational Attainment | Male Income | Female Income |
| Less than High School | $33,750 | $0 |
| High School Diploma | $52,143 | $24,375 |
| College or Associate's Degree | $47,188 | $59,000 |
| Bachelor's Degree | $68,750 | $67,857 |
| Graduate Degree | $61,250 | $63,438 |
| Total | $54,479 | $55,972 |
Family Income in Byng
Family Income Brackets in Byng
According to the Byng family income data, there are 108 families falling into the $150,000 to $199,999 income range, which is the most common income bracket and makes up 26.5% of all families. Conversely, the less than $10,000 income bracket is the least frequent group with only 3 families (0.7%) belonging to this category.
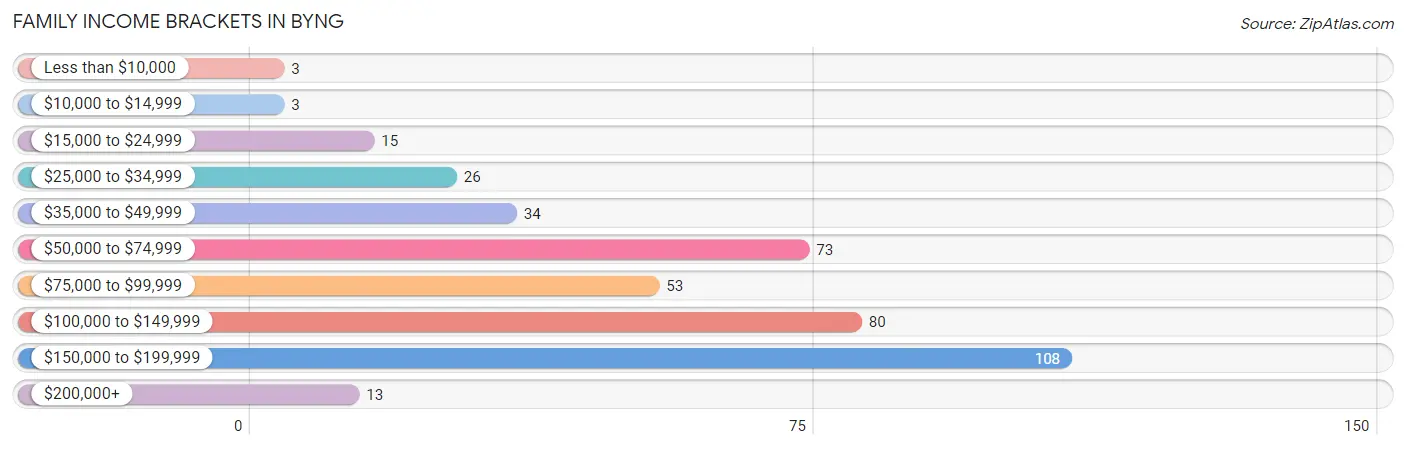
| Income Bracket | # Families | % Families |
| Less than $10,000 | 3 | 0.7% |
| $10,000 to $14,999 | 3 | 0.7% |
| $15,000 to $24,999 | 15 | 3.7% |
| $25,000 to $34,999 | 26 | 6.4% |
| $35,000 to $49,999 | 34 | 8.3% |
| $50,000 to $74,999 | 73 | 17.9% |
| $75,000 to $99,999 | 53 | 13.0% |
| $100,000 to $149,999 | 80 | 19.6% |
| $150,000 to $199,999 | 108 | 26.5% |
| $200,000+ | 13 | 3.2% |
Family Income by Famaliy Size in Byng
4-person families (151 | 37.0%) account for the highest median family income in Byng with $144,464 per family, while 2-person families (153 | 37.5%) have the highest median income of $37,054 per family member.
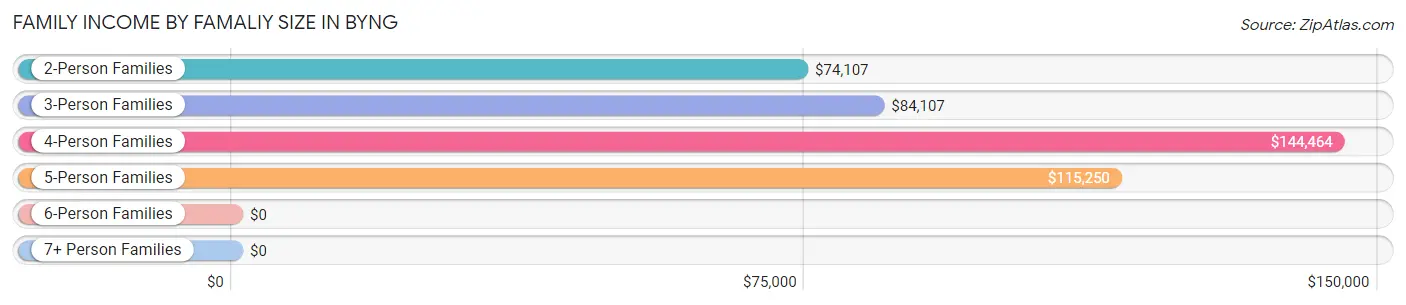
| Income Bracket | # Families | Median Income |
| 2-Person Families | 153 (37.5%) | $74,107 |
| 3-Person Families | 51 (12.5%) | $84,107 |
| 4-Person Families | 151 (37.0%) | $144,464 |
| 5-Person Families | 49 (12.0%) | $115,250 |
| 6-Person Families | 4 (1.0%) | $0 |
| 7+ Person Families | 0 (0.0%) | $0 |
| Total | 408 (100.0%) | $99,375 |
Family Income by Number of Earners in Byng
The median family income in Byng is $99,375, with families comprising 3+ earners (31) having the highest median family income of $144,063, while families with no earners (61) have the lowest median family income of $50,781, accounting for 7.6% and 14.9% of families, respectively.
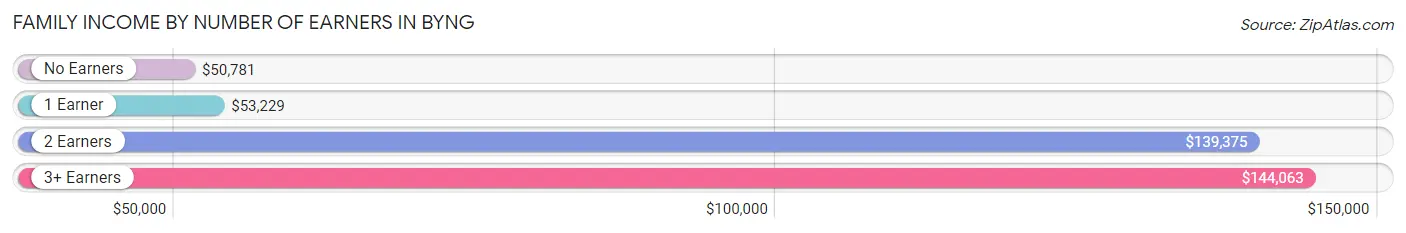
| Number of Earners | # Families | Median Income |
| No Earners | 61 (14.9%) | $50,781 |
| 1 Earner | 91 (22.3%) | $53,229 |
| 2 Earners | 225 (55.1%) | $139,375 |
| 3+ Earners | 31 (7.6%) | $144,063 |
| Total | 408 (100.0%) | $99,375 |
Household Income in Byng
Household Income Brackets in Byng
With 108 households falling in the category, the $150,000 to $199,999 income range is the most frequent in Byng, accounting for 20.3% of all households. In contrast, only 8 households (1.5%) fall into the less than $10,000 income bracket, making it the least populous group.
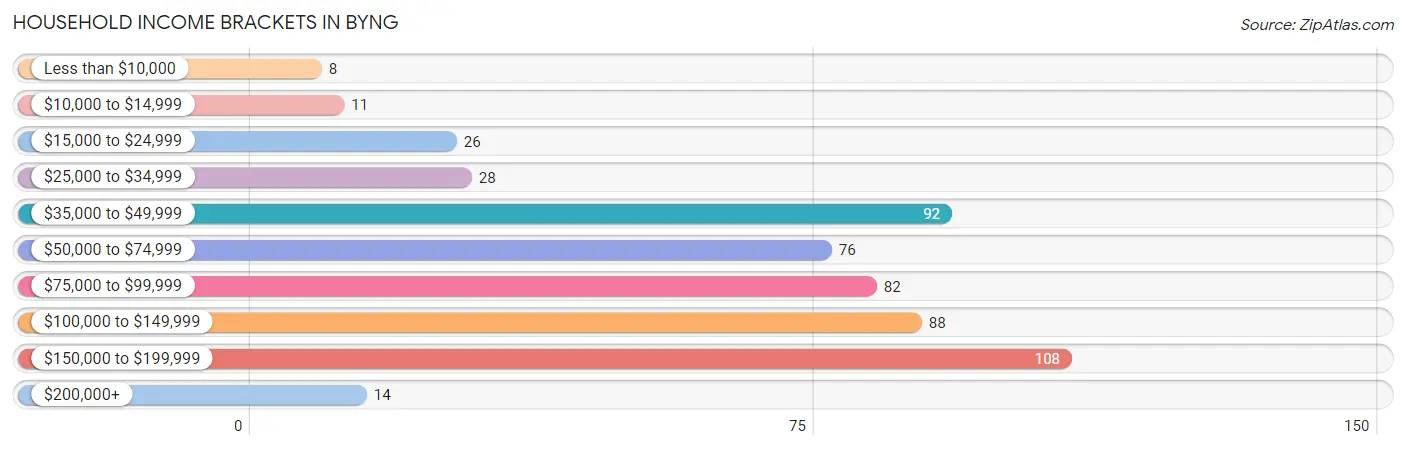
| Income Bracket | # Households | % Households |
| Less than $10,000 | 8 | 1.5% |
| $10,000 to $14,999 | 11 | 2.1% |
| $15,000 to $24,999 | 26 | 4.9% |
| $25,000 to $34,999 | 28 | 5.3% |
| $35,000 to $49,999 | 92 | 17.3% |
| $50,000 to $74,999 | 76 | 14.3% |
| $75,000 to $99,999 | 82 | 15.4% |
| $100,000 to $149,999 | 88 | 16.5% |
| $150,000 to $199,999 | 108 | 20.3% |
| $200,000+ | 14 | 2.6% |
Household Income by Householder Age in Byng
The median household income in Byng is $83,661, with the highest median household income of $135,625 found in the 25 to 44 years age bracket for the primary householder. A total of 229 households (43.0%) fall into this category. Meanwhile, the 15 to 24 years age bracket for the primary householder has the lowest median household income of $0, with 4 households (0.7%) in this group.
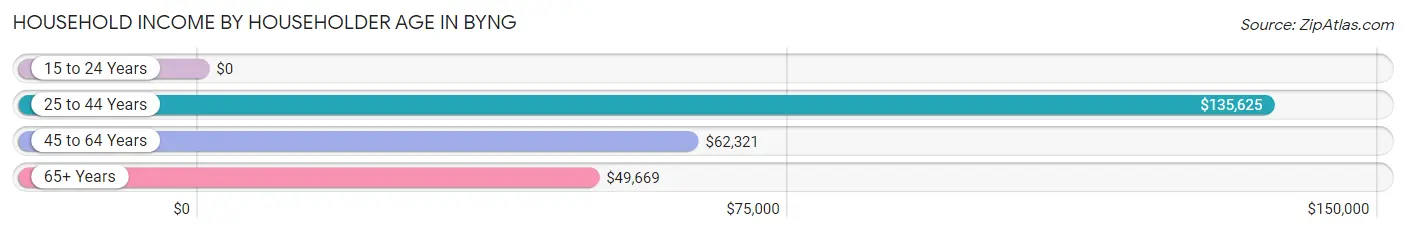
| Income Bracket | # Households | Median Income |
| 15 to 24 Years | 4 (0.7%) | $0 |
| 25 to 44 Years | 229 (43.0%) | $135,625 |
| 45 to 64 Years | 163 (30.6%) | $62,321 |
| 65+ Years | 137 (25.7%) | $49,669 |
| Total | 533 (100.0%) | $83,661 |
Poverty in Byng
Income Below Poverty by Sex and Age in Byng
With 5.5% poverty level for males and 4.6% for females among the residents of Byng, 15 year old males and 5 year old females are the most vulnerable to poverty, with 4 males (100.0%) and 3 females (50.0%) in their respective age groups living below the poverty level.
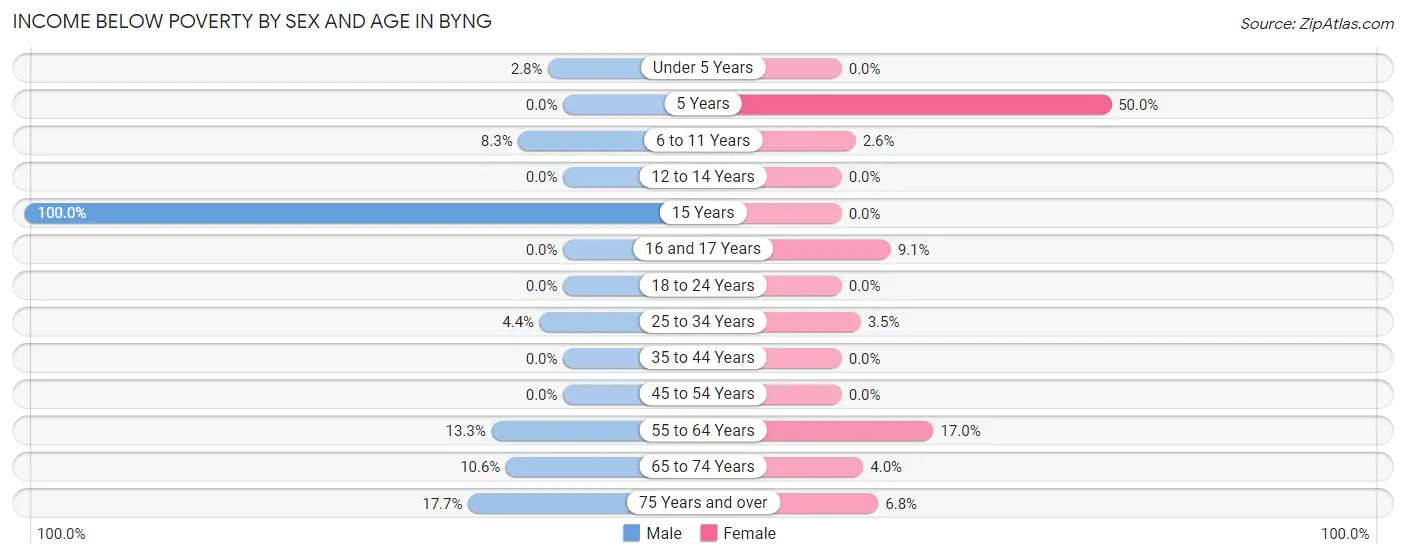
| Age Bracket | Male | Female |
| Under 5 Years | 3 (2.8%) | 0 (0.0%) |
| 5 Years | 0 (0.0%) | 3 (50.0%) |
| 6 to 11 Years | 4 (8.3%) | 2 (2.6%) |
| 12 to 14 Years | 0 (0.0%) | 0 (0.0%) |
| 15 Years | 4 (100.0%) | 0 (0.0%) |
| 16 and 17 Years | 0 (0.0%) | 2 (9.1%) |
| 18 to 24 Years | 0 (0.0%) | 0 (0.0%) |
| 25 to 34 Years | 7 (4.3%) | 6 (3.5%) |
| 35 to 44 Years | 0 (0.0%) | 0 (0.0%) |
| 45 to 54 Years | 0 (0.0%) | 0 (0.0%) |
| 55 to 64 Years | 8 (13.3%) | 16 (17.0%) |
| 65 to 74 Years | 7 (10.6%) | 2 (4.0%) |
| 75 Years and over | 6 (17.6%) | 4 (6.8%) |
| Total | 39 (5.5%) | 35 (4.6%) |
Income Above Poverty by Sex and Age in Byng
According to the poverty statistics in Byng, males aged 5 years and females aged under 5 years are the age groups that are most secure financially, with 100.0% of males and 100.0% of females in these age groups living above the poverty line.
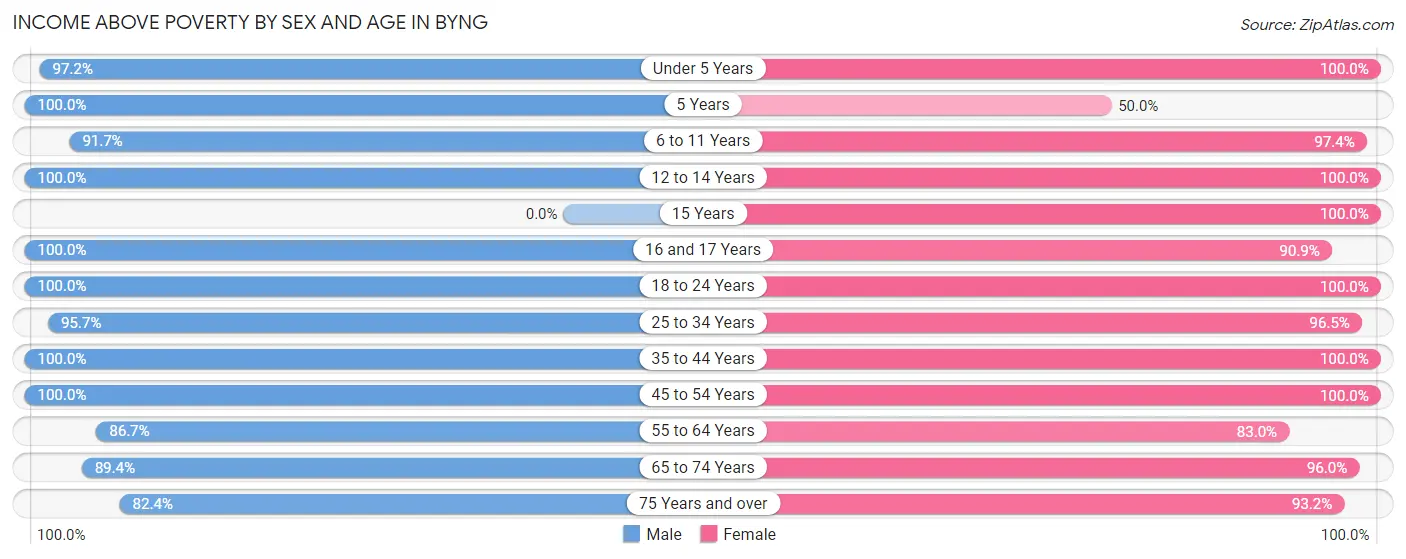
| Age Bracket | Male | Female |
| Under 5 Years | 105 (97.2%) | 64 (100.0%) |
| 5 Years | 19 (100.0%) | 3 (50.0%) |
| 6 to 11 Years | 44 (91.7%) | 75 (97.4%) |
| 12 to 14 Years | 35 (100.0%) | 36 (100.0%) |
| 15 Years | 0 (0.0%) | 6 (100.0%) |
| 16 and 17 Years | 13 (100.0%) | 20 (90.9%) |
| 18 to 24 Years | 17 (100.0%) | 23 (100.0%) |
| 25 to 34 Years | 154 (95.7%) | 165 (96.5%) |
| 35 to 44 Years | 82 (100.0%) | 98 (100.0%) |
| 45 to 54 Years | 64 (100.0%) | 50 (100.0%) |
| 55 to 64 Years | 52 (86.7%) | 78 (83.0%) |
| 65 to 74 Years | 59 (89.4%) | 48 (96.0%) |
| 75 Years and over | 28 (82.4%) | 55 (93.2%) |
| Total | 672 (94.5%) | 721 (95.4%) |
Income Below Poverty Among Married-Couple Families in Byng
The poverty statistics for married-couple families in Byng show that 4.3% or 15 of the total 352 families live below the poverty line. Families with 1 or 2 children have the highest poverty rate of 5.1%, comprising of 10 families. On the other hand, families with 3 or 4 children have the lowest poverty rate of 0.0%, which includes 0 families.
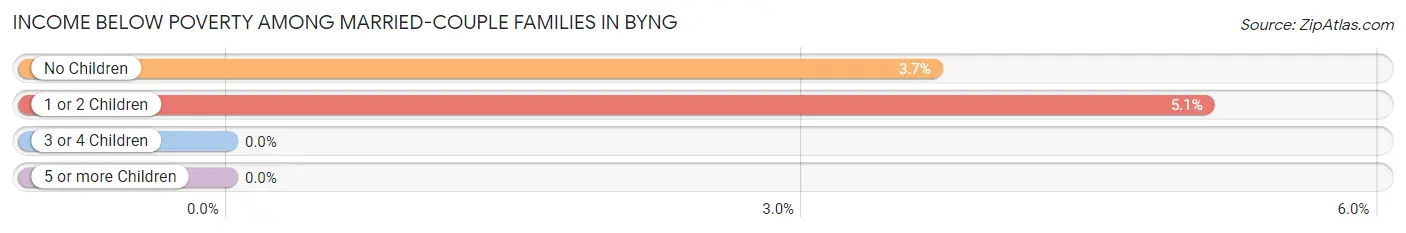
| Children | Above Poverty | Below Poverty |
| No Children | 131 (96.3%) | 5 (3.7%) |
| 1 or 2 Children | 186 (94.9%) | 10 (5.1%) |
| 3 or 4 Children | 20 (100.0%) | 0 (0.0%) |
| 5 or more Children | 0 (0.0%) | 0 (0.0%) |
| Total | 337 (95.7%) | 15 (4.3%) |
Income Below Poverty Among Single-Parent Households in Byng
| Children | Single Father | Single Mother |
| No Children | 0 (0.0%) | 0 (0.0%) |
| 1 or 2 Children | 0 (0.0%) | 0 (0.0%) |
| 3 or 4 Children | 0 (0.0%) | 0 (0.0%) |
| 5 or more Children | 0 (0.0%) | 0 (0.0%) |
| Total | 0 (0.0%) | 0 (0.0%) |
Income Below Poverty Among Married-Couple vs Single-Parent Households in Byng
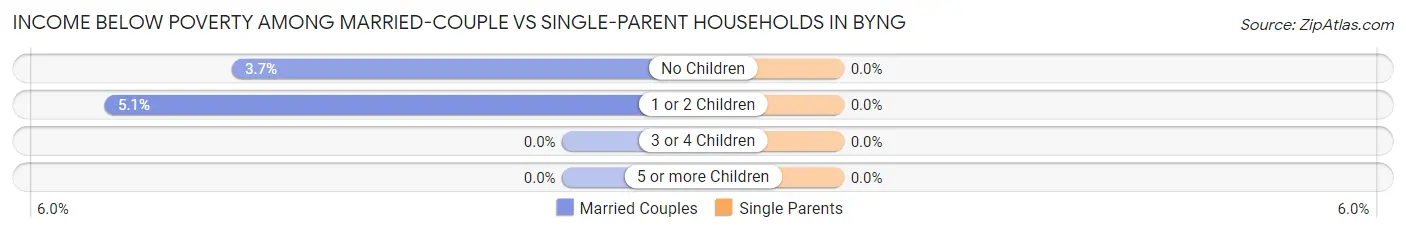
| Children | Married-Couple Families | Single-Parent Households |
| No Children | 5 (3.7%) | 0 (0.0%) |
| 1 or 2 Children | 10 (5.1%) | 0 (0.0%) |
| 3 or 4 Children | 0 (0.0%) | 0 (0.0%) |
| 5 or more Children | 0 (0.0%) | 0 (0.0%) |
| Total | 15 (4.3%) | 0 (0.0%) |
Race in Byng
The most populous races in Byng are White / Caucasian (956 | 64.9%), Native / Alaskan (368 | 25.0%), and Two or more Races (142 | 9.6%).
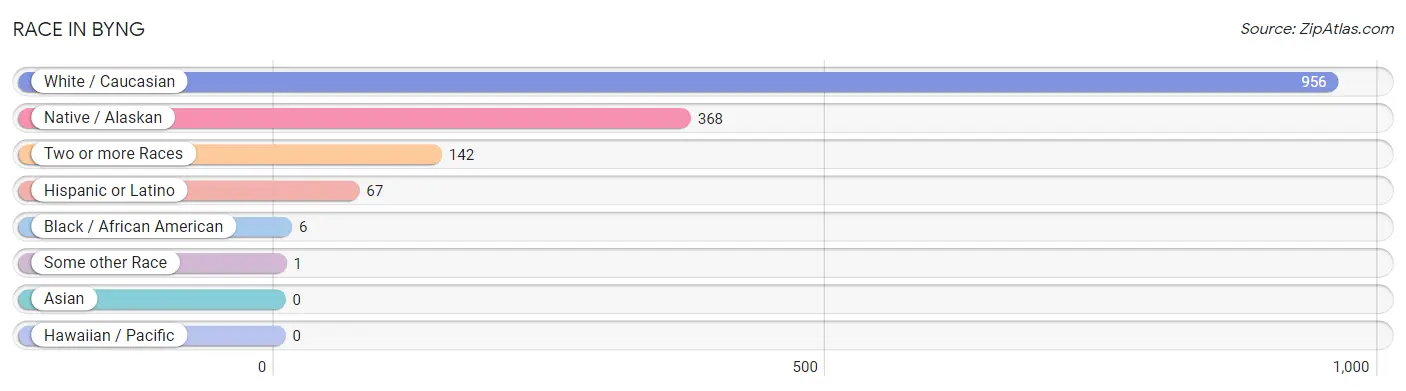
| Race | # Population | % Population |
| Asian | 0 | 0.0% |
| Black / African American | 6 | 0.4% |
| Hawaiian / Pacific | 0 | 0.0% |
| Hispanic or Latino | 67 | 4.5% |
| Native / Alaskan | 368 | 25.0% |
| White / Caucasian | 956 | 64.9% |
| Two or more Races | 142 | 9.6% |
| Some other Race | 1 | 0.1% |
| Total | 1,473 | 100.0% |
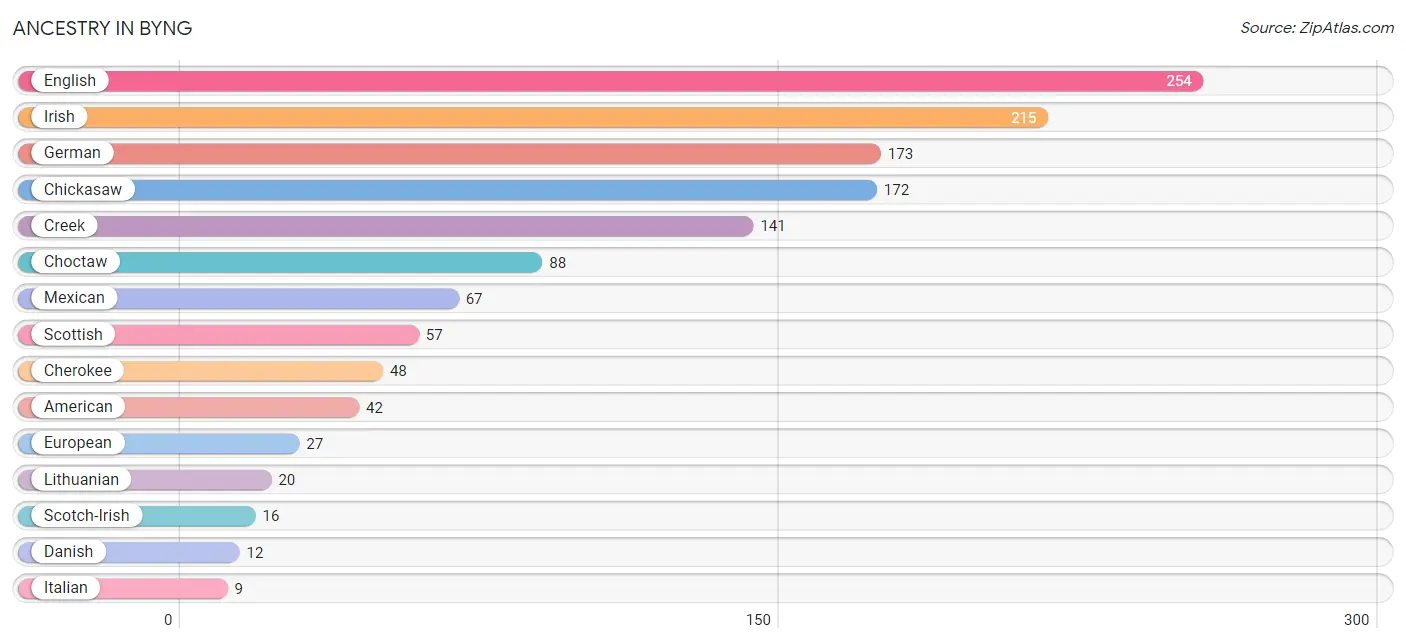
Ancestry in Byng
The most populous ancestries reported in Byng are English (254 | 17.2%), Irish (215 | 14.6%), German (173 | 11.7%), Chickasaw (172 | 11.7%), and Creek (141 | 9.6%), together accounting for 64.8% of all Byng residents.
| Ancestry | # Population | % Population |
| American | 42 | 2.9% |
| Canadian | 4 | 0.3% |
| Cherokee | 48 | 3.3% |
| Chickasaw | 172 | 11.7% |
| Choctaw | 88 | 6.0% |
| Creek | 141 | 9.6% |
| Danish | 12 | 0.8% |
| Delaware | 1 | 0.1% |
| Dutch | 8 | 0.5% |
| Dutch West Indian | 1 | 0.1% |
| Eastern European | 7 | 0.5% |
| English | 254 | 17.2% |
| European | 27 | 1.8% |
| French | 6 | 0.4% |
| German | 173 | 11.7% |
| Greek | 3 | 0.2% |
| Irish | 215 | 14.6% |
| Italian | 9 | 0.6% |
| Lithuanian | 20 | 1.4% |
| Mexican | 67 | 4.5% |
| Norwegian | 4 | 0.3% |
| Polish | 4 | 0.3% |
| Russian | 5 | 0.3% |
| Scandinavian | 5 | 0.3% |
| Scotch-Irish | 16 | 1.1% |
| Scottish | 57 | 3.9% |
| Seminole | 4 | 0.3% | View All 27 Rows |
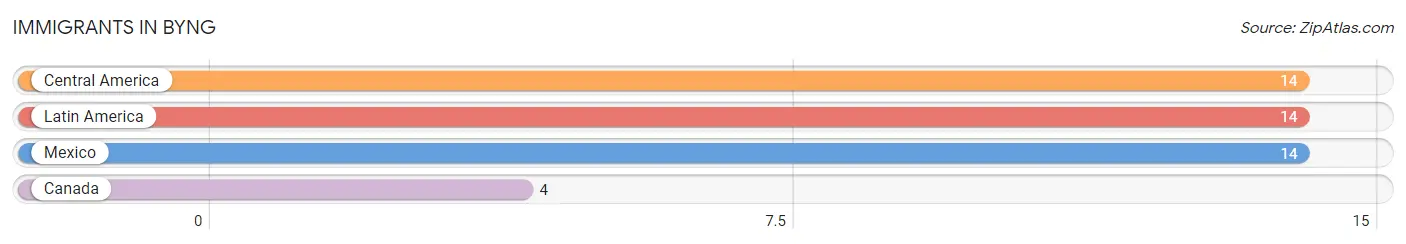
Immigrants in Byng
The most numerous immigrant groups reported in Byng came from Central America (14 | 0.9%), Latin America (14 | 0.9%), Mexico (14 | 0.9%), and Canada (4 | 0.3%), together accounting for 3.1% of all Byng residents.
| Immigration Origin | # Population | % Population |
| Canada | 4 | 0.3% |
| Central America | 14 | 0.9% |
| Latin America | 14 | 0.9% |
| Mexico | 14 | 0.9% | View All 4 Rows |
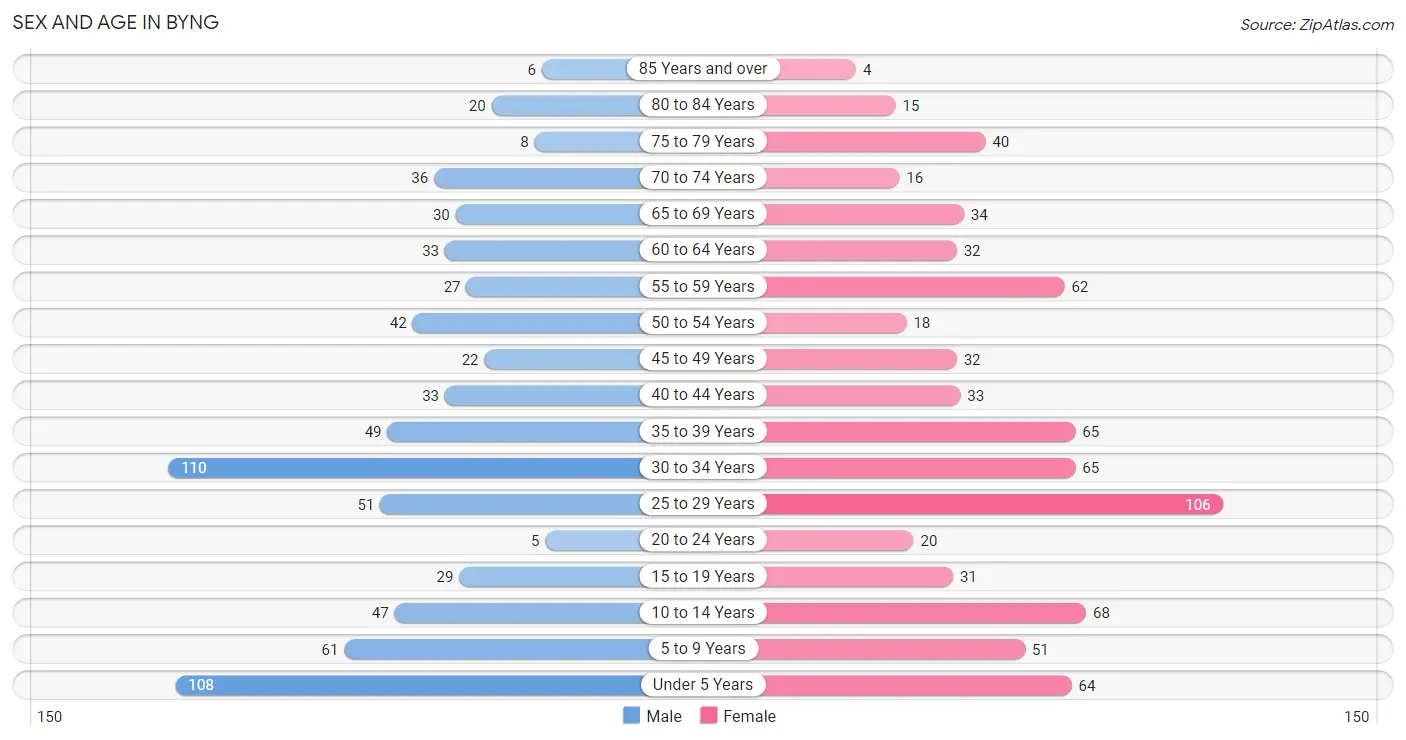
Sex and Age in Byng
Sex and Age in Byng
The most populous age groups in Byng are 30 to 34 Years (110 | 15.3%) for men and 25 to 29 Years (106 | 14.0%) for women.
| Age Bracket | Male | Female |
| Under 5 Years | 108 (15.1%) | 64 (8.5%) |
| 5 to 9 Years | 61 (8.5%) | 51 (6.8%) |
| 10 to 14 Years | 47 (6.6%) | 68 (9.0%) |
| 15 to 19 Years | 29 (4.0%) | 31 (4.1%) |
| 20 to 24 Years | 5 (0.7%) | 20 (2.6%) |
| 25 to 29 Years | 51 (7.1%) | 106 (14.0%) |
| 30 to 34 Years | 110 (15.3%) | 65 (8.6%) |
| 35 to 39 Years | 49 (6.8%) | 65 (8.6%) |
| 40 to 44 Years | 33 (4.6%) | 33 (4.4%) |
| 45 to 49 Years | 22 (3.1%) | 32 (4.2%) |
| 50 to 54 Years | 42 (5.9%) | 18 (2.4%) |
| 55 to 59 Years | 27 (3.8%) | 62 (8.2%) |
| 60 to 64 Years | 33 (4.6%) | 32 (4.2%) |
| 65 to 69 Years | 30 (4.2%) | 34 (4.5%) |
| 70 to 74 Years | 36 (5.0%) | 16 (2.1%) |
| 75 to 79 Years | 8 (1.1%) | 40 (5.3%) |
| 80 to 84 Years | 20 (2.8%) | 15 (2.0%) |
| 85 Years and over | 6 (0.8%) | 4 (0.5%) |
| Total | 717 (100.0%) | 756 (100.0%) |
Families and Households in Byng
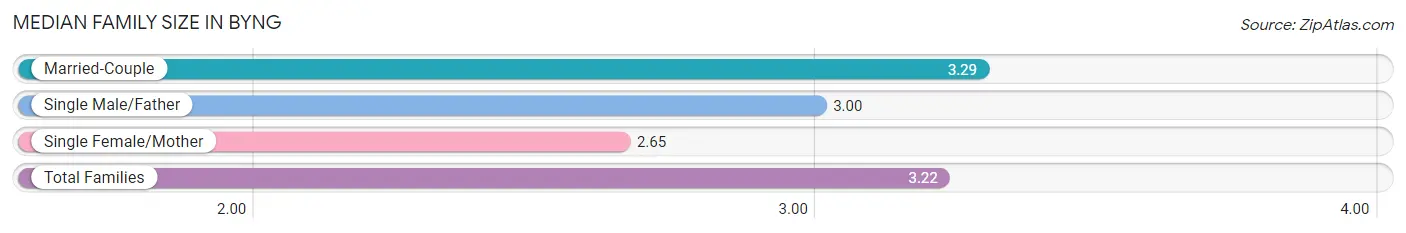
Median Family Size in Byng
The median family size in Byng is 3.22 persons per family, with married-couple families (352 | 86.3%) accounting for the largest median family size of 3.29 persons per family. On the other hand, single female/mother families (34 | 8.3%) represent the smallest median family size with 2.65 persons per family.
| Family Type | # Families | Family Size |
| Married-Couple | 352 (86.3%) | 3.29 |
| Single Male/Father | 22 (5.4%) | 3.00 |
| Single Female/Mother | 34 (8.3%) | 2.65 |
| Total Families | 408 (100.0%) | 3.22 |
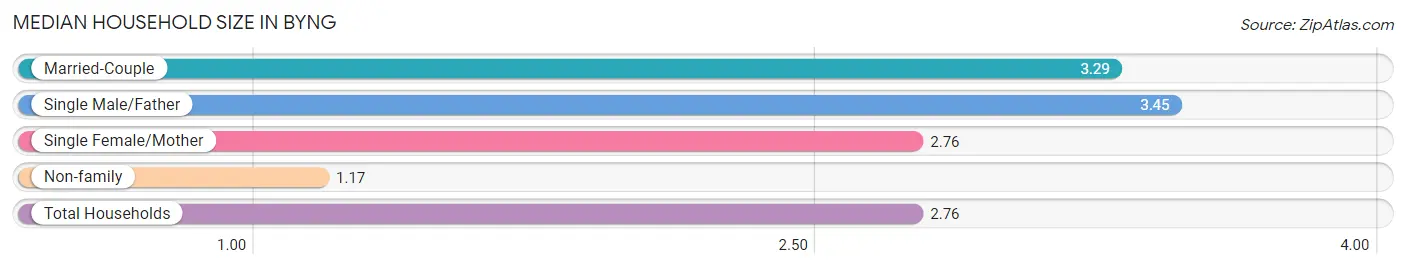
Median Household Size in Byng
The median household size in Byng is 2.76 persons per household, with single male/father households (22 | 4.1%) accounting for the largest median household size of 3.45 persons per household. non-family households (125 | 23.4%) represent the smallest median household size with 1.17 persons per household.
| Household Type | # Households | Household Size |
| Married-Couple | 352 (66.0%) | 3.29 |
| Single Male/Father | 22 (4.1%) | 3.45 |
| Single Female/Mother | 34 (6.4%) | 2.76 |
| Non-family | 125 (23.4%) | 1.17 |
| Total Households | 533 (100.0%) | 2.76 |
Household Size by Marriage Status in Byng
Out of a total of 533 households in Byng, 408 (76.5%) are family households, while 125 (23.4%) are nonfamily households. The most numerous type of family households are 4-person households, comprising 146, and the most common type of nonfamily households are 1-person households, comprising 112.
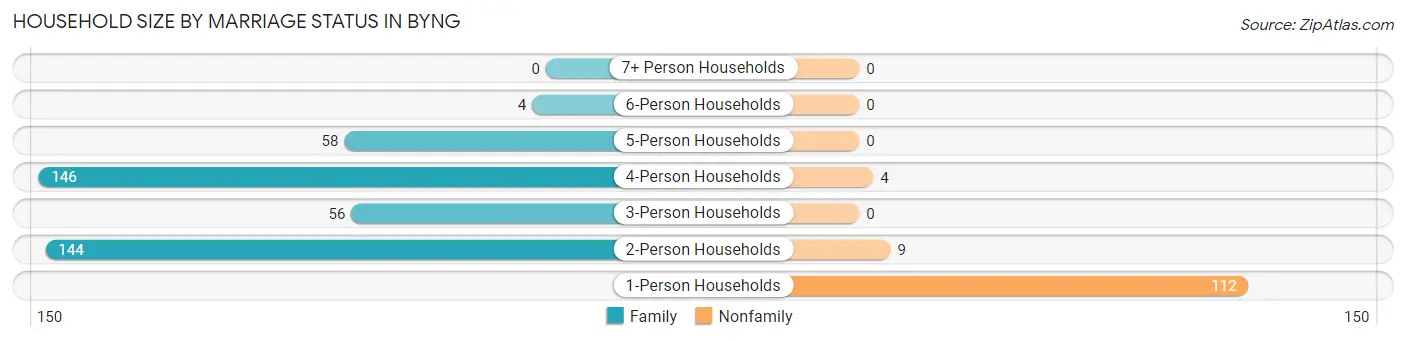
| Household Size | Family Households | Nonfamily Households |
| 1-Person Households | - | 112 (21.0%) |
| 2-Person Households | 144 (27.0%) | 9 (1.7%) |
| 3-Person Households | 56 (10.5%) | 0 (0.0%) |
| 4-Person Households | 146 (27.4%) | 4 (0.7%) |
| 5-Person Households | 58 (10.9%) | 0 (0.0%) |
| 6-Person Households | 4 (0.7%) | 0 (0.0%) |
| 7+ Person Households | 0 (0.0%) | 0 (0.0%) |
| Total | 408 (76.5%) | 125 (23.4%) |
Female Fertility in Byng
Fertility by Age in Byng
Average fertility rate in Byng is 50.0 births per 1,000 women. Women in the age bracket of 20 to 34 years have the highest fertility rate with 68.0 births per 1,000 women. Women in the age bracket of 20 to 34 years acount for 72.2% of all women with births.
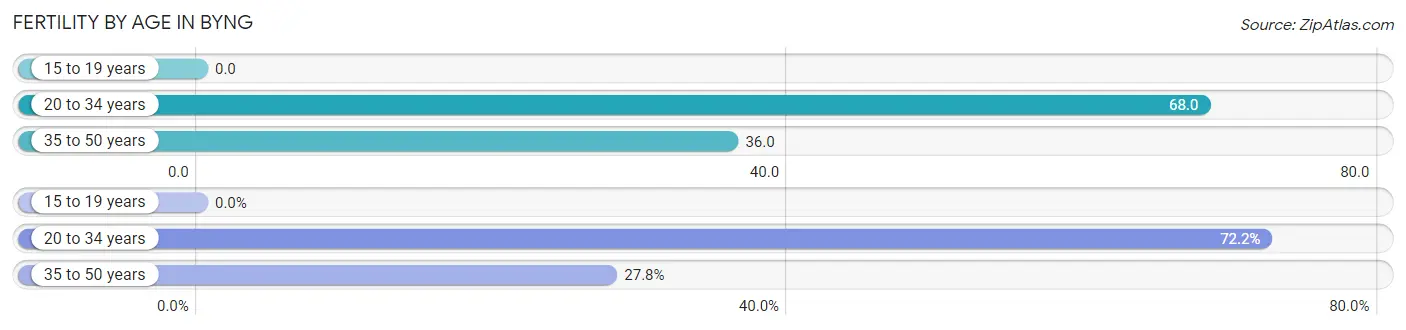
| Age Bracket | Women with Births | Births / 1,000 Women |
| 15 to 19 years | 0 (0.0%) | 0.0 |
| 20 to 34 years | 13 (72.2%) | 68.0 |
| 35 to 50 years | 5 (27.8%) | 36.0 |
| Total | 18 (100.0%) | 50.0 |
Fertility by Age by Marriage Status in Byng
94.4% of women with births (18) in Byng are married. The highest percentage of unmarried women with births falls into 20 to 34 years age bracket with 7.7% of them unmarried at the time of birth, while the lowest percentage of unmarried women with births belong to 35 to 50 years age bracket with 0.0% of them unmarried.
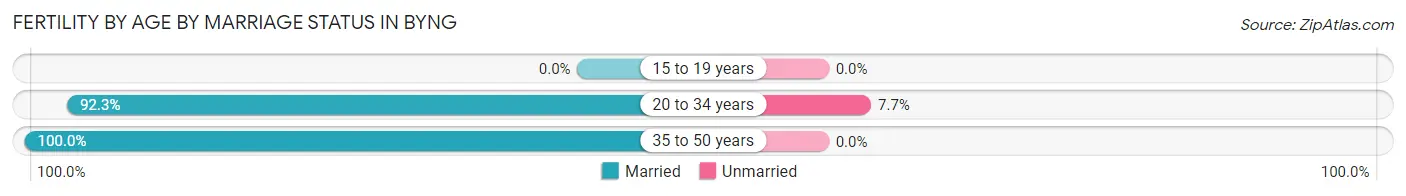
| Age Bracket | Married | Unmarried |
| 15 to 19 years | 0 (0.0%) | 0 (0.0%) |
| 20 to 34 years | 12 (92.3%) | 1 (7.7%) |
| 35 to 50 years | 5 (100.0%) | 0 (0.0%) |
| Total | 17 (94.4%) | 1 (5.6%) |
Fertility by Education in Byng
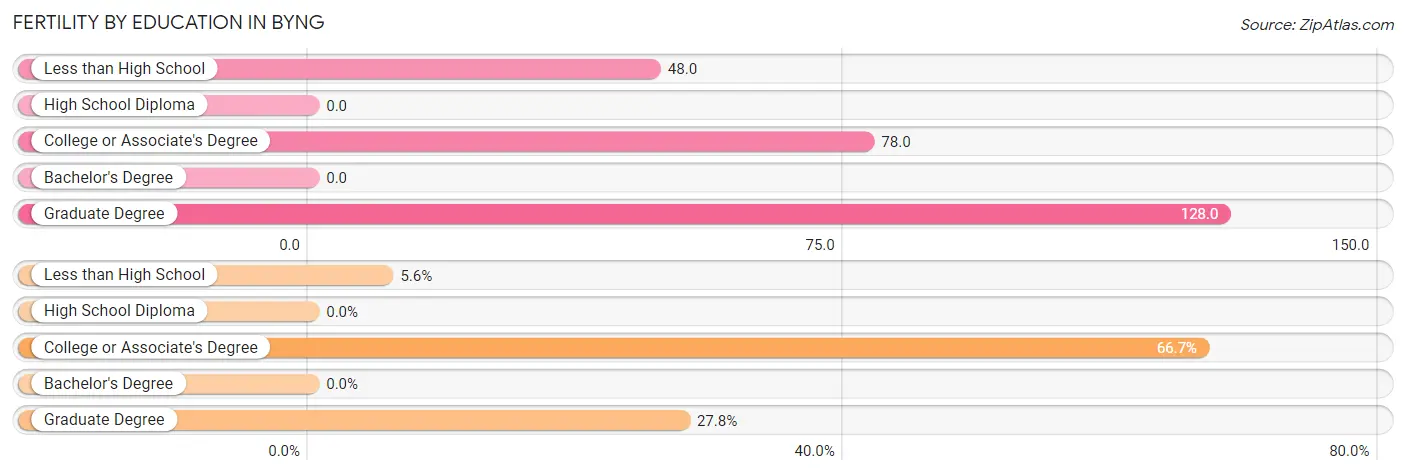
| Educational Attainment | Women with Births | Births / 1,000 Women |
| Less than High School | 1 (5.6%) | 48.0 |
| High School Diploma | 0 (0.0%) | 0.0 |
| College or Associate's Degree | 12 (66.7%) | 78.0 |
| Bachelor's Degree | 0 (0.0%) | 0.0 |
| Graduate Degree | 5 (27.8%) | 128.0 |
| Total | 18 (100.0%) | 50.0 |
Fertility by Education by Marriage Status in Byng
5.6% of women with births in Byng are unmarried. Women with the educational attainment of college or associate's degree are most likely to be married with 100.0% of them married at childbirth, while women with the educational attainment of less than high school are least likely to be married with 100.0% of them unmarried at childbirth.
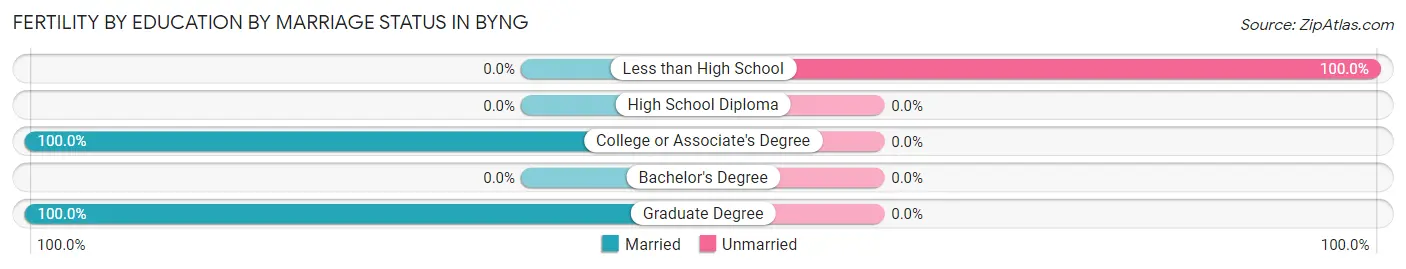
| Educational Attainment | Married | Unmarried |
| Less than High School | 0 (0.0%) | 1 (100.0%) |
| High School Diploma | 0 (0.0%) | 0 (0.0%) |
| College or Associate's Degree | 12 (100.0%) | 0 (0.0%) |
| Bachelor's Degree | 0 (0.0%) | 0 (0.0%) |
| Graduate Degree | 5 (100.0%) | 0 (0.0%) |
| Total | 17 (94.4%) | 1 (5.6%) |
Employment Characteristics in Byng
Employment by Class of Employer in Byng
Among the 670 employed individuals in Byng, private company employees (332 | 49.5%), federal government employees (111 | 16.6%), and not-for-profit organizations (85 | 12.7%) make up the most common classes of employment.
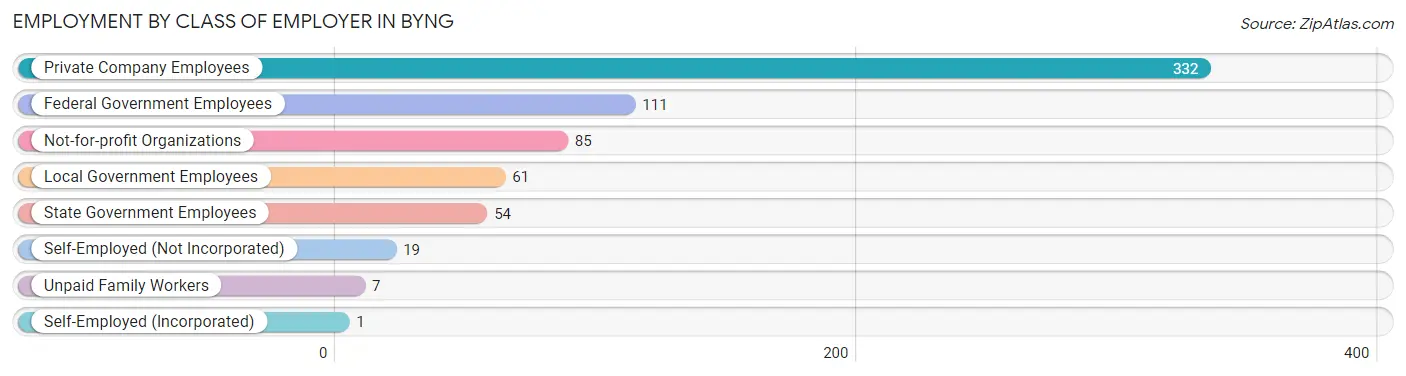
| Employer Class | # Employees | % Employees |
| Private Company Employees | 332 | 49.5% |
| Self-Employed (Incorporated) | 1 | 0.2% |
| Self-Employed (Not Incorporated) | 19 | 2.8% |
| Not-for-profit Organizations | 85 | 12.7% |
| Local Government Employees | 61 | 9.1% |
| State Government Employees | 54 | 8.1% |
| Federal Government Employees | 111 | 16.6% |
| Unpaid Family Workers | 7 | 1.0% |
| Total | 670 | 100.0% |
Employment Status by Age in Byng
According to the labor force statistics for Byng, out of the total population over 16 years of age (1,064), 67.3% or 716 individuals are in the labor force, with 4.9% or 35 of them unemployed. The age group with the highest labor force participation rate is 35 to 44 years, with 91.7% or 165 individuals in the labor force. Within the labor force, the 16 to 19 years age range has the highest percentage of unemployed individuals, with 25.0% or 4 of them being unemployed.
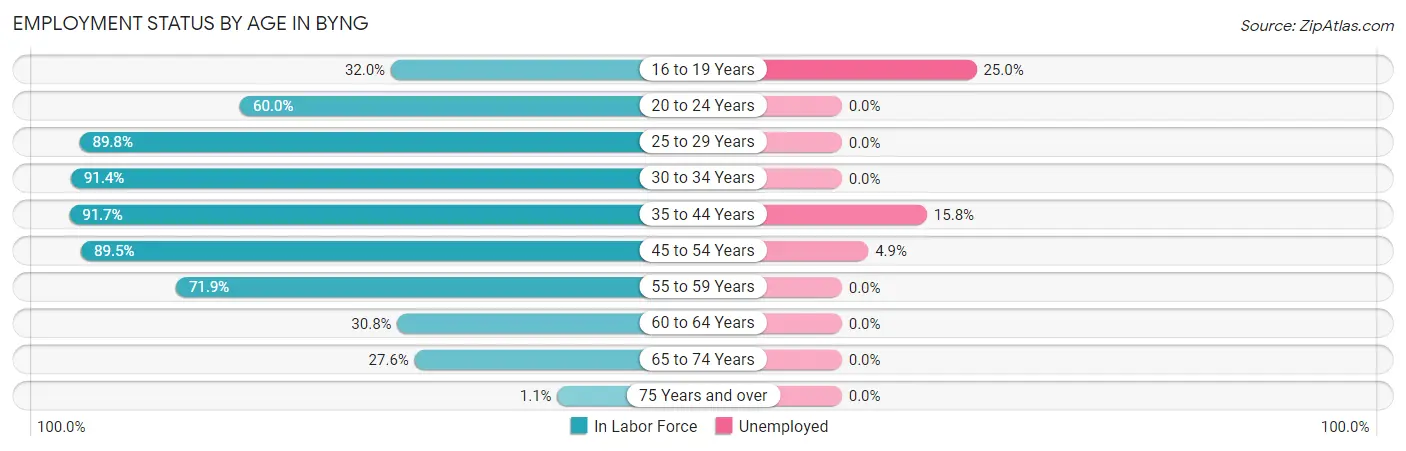
| Age Bracket | In Labor Force | Unemployed |
| 16 to 19 Years | 16 (32.0%) | 4 (25.0%) |
| 20 to 24 Years | 15 (60.0%) | 0 (0.0%) |
| 25 to 29 Years | 141 (89.8%) | 0 (0.0%) |
| 30 to 34 Years | 160 (91.4%) | 0 (0.0%) |
| 35 to 44 Years | 165 (91.7%) | 26 (15.8%) |
| 45 to 54 Years | 102 (89.5%) | 5 (4.9%) |
| 55 to 59 Years | 64 (71.9%) | 0 (0.0%) |
| 60 to 64 Years | 20 (30.8%) | 0 (0.0%) |
| 65 to 74 Years | 32 (27.6%) | 0 (0.0%) |
| 75 Years and over | 1 (1.1%) | 0 (0.0%) |
| Total | 716 (67.3%) | 35 (4.9%) |
Employment Status by Educational Attainment in Byng
According to labor force statistics for Byng, 83.6% of individuals (652) out of the total population between 25 and 64 years of age (780) are in the labor force, with 4.8% or 31 of them being unemployed. The group with the highest labor force participation rate are those with the educational attainment of bachelor's degree or higher, with 91.2% or 207 individuals in the labor force. Within the labor force, individuals with less than high school education have the highest percentage of unemployment, with 23.1% or 6 of them being unemployed.
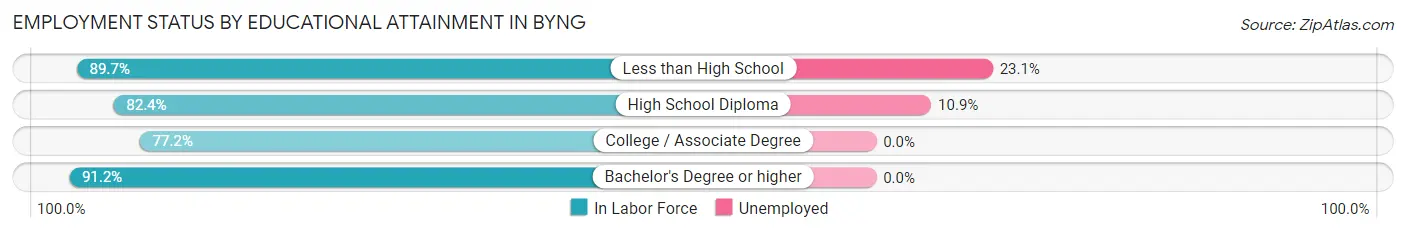
| Educational Attainment | In Labor Force | Unemployed |
| Less than High School | 26 (89.7%) | 7 (23.1%) |
| High School Diploma | 229 (82.4%) | 30 (10.9%) |
| College / Associate Degree | 190 (77.2%) | 0 (0.0%) |
| Bachelor's Degree or higher | 207 (91.2%) | 0 (0.0%) |
| Total | 652 (83.6%) | 37 (4.8%) |
Employment Occupations by Sex in Byng
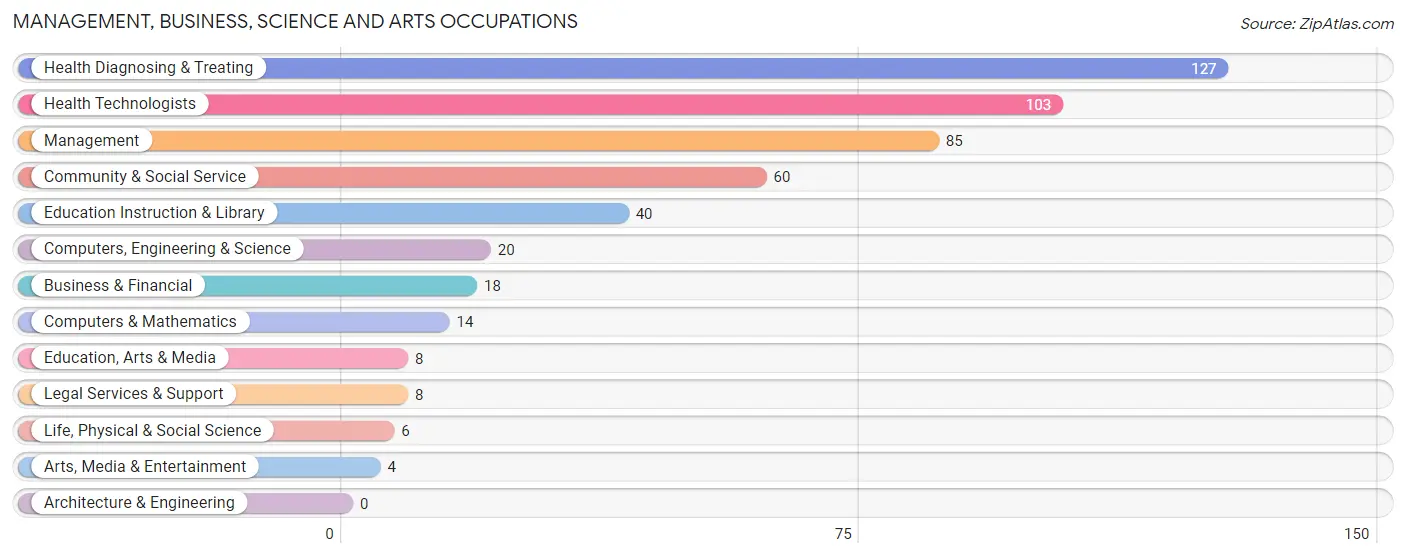
Management, Business, Science and Arts Occupations
The most common Management, Business, Science and Arts occupations in Byng are Health Diagnosing & Treating (127 | 18.6%), Health Technologists (103 | 15.1%), Management (85 | 12.5%), Community & Social Service (60 | 8.8%), and Education Instruction & Library (40 | 5.9%).
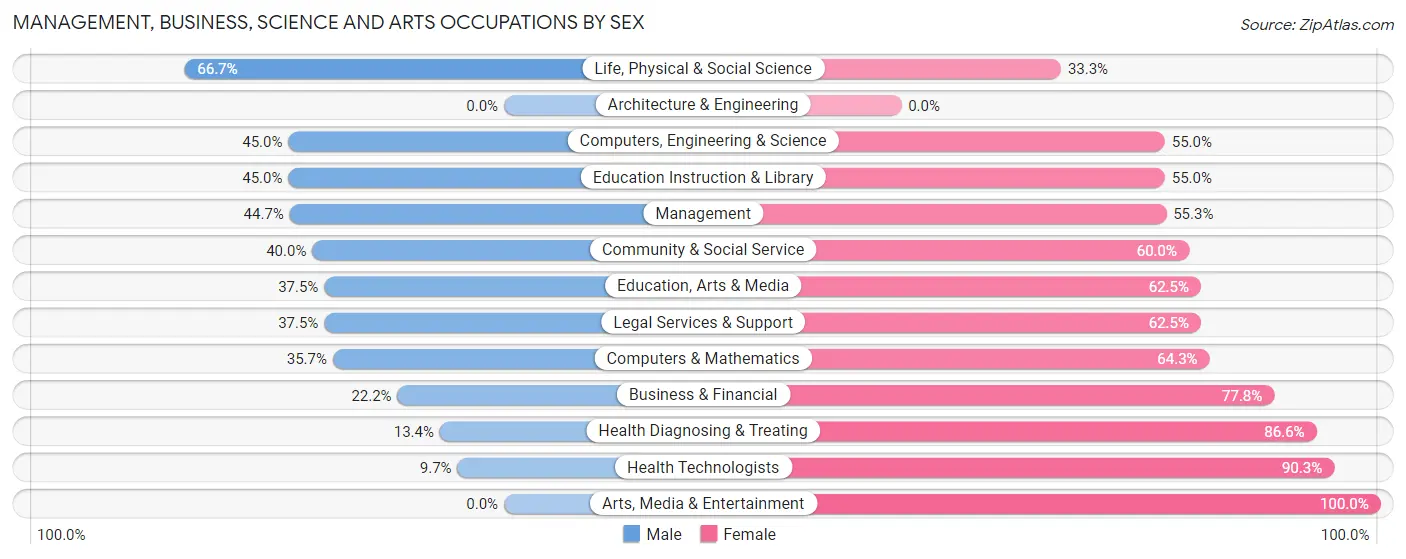
Management, Business, Science and Arts Occupations by Sex
Within the Management, Business, Science and Arts occupations in Byng, the most male-oriented occupations are Life, Physical & Social Science (66.7%), Computers, Engineering & Science (45.0%), and Education Instruction & Library (45.0%), while the most female-oriented occupations are Arts, Media & Entertainment (100.0%), Health Technologists (90.3%), and Health Diagnosing & Treating (86.6%).
| Occupation | Male | Female |
| Management | 38 (44.7%) | 47 (55.3%) |
| Business & Financial | 4 (22.2%) | 14 (77.8%) |
| Computers, Engineering & Science | 9 (45.0%) | 11 (55.0%) |
| Computers & Mathematics | 5 (35.7%) | 9 (64.3%) |
| Architecture & Engineering | 0 (0.0%) | 0 (0.0%) |
| Life, Physical & Social Science | 4 (66.7%) | 2 (33.3%) |
| Community & Social Service | 24 (40.0%) | 36 (60.0%) |
| Education, Arts & Media | 3 (37.5%) | 5 (62.5%) |
| Legal Services & Support | 3 (37.5%) | 5 (62.5%) |
| Education Instruction & Library | 18 (45.0%) | 22 (55.0%) |
| Arts, Media & Entertainment | 0 (0.0%) | 4 (100.0%) |
| Health Diagnosing & Treating | 17 (13.4%) | 110 (86.6%) |
| Health Technologists | 10 (9.7%) | 93 (90.3%) |
| Total (Category) | 92 (29.7%) | 218 (70.3%) |
| Total (Overall) | 342 (50.2%) | 339 (49.8%) |
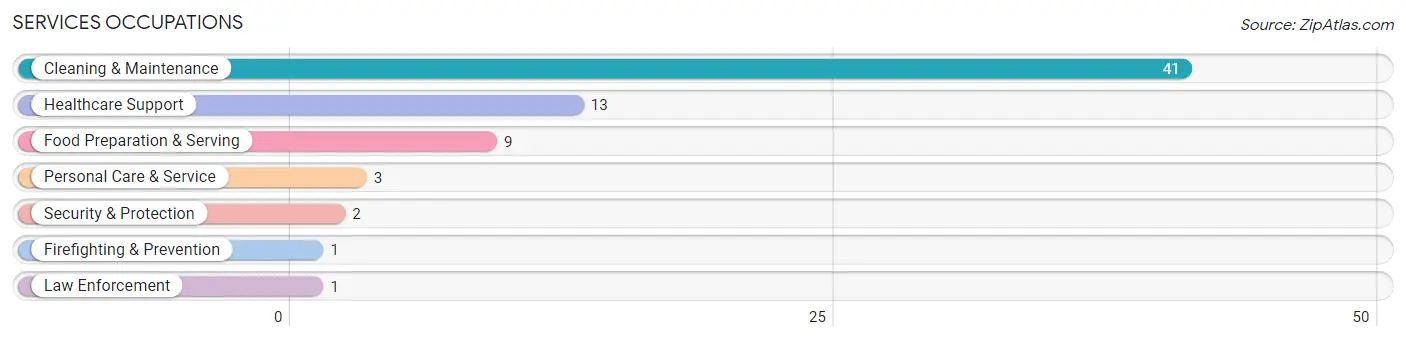
Services Occupations
The most common Services occupations in Byng are Cleaning & Maintenance (41 | 6.0%), Healthcare Support (13 | 1.9%), Food Preparation & Serving (9 | 1.3%), Personal Care & Service (3 | 0.4%), and Security & Protection (2 | 0.3%).
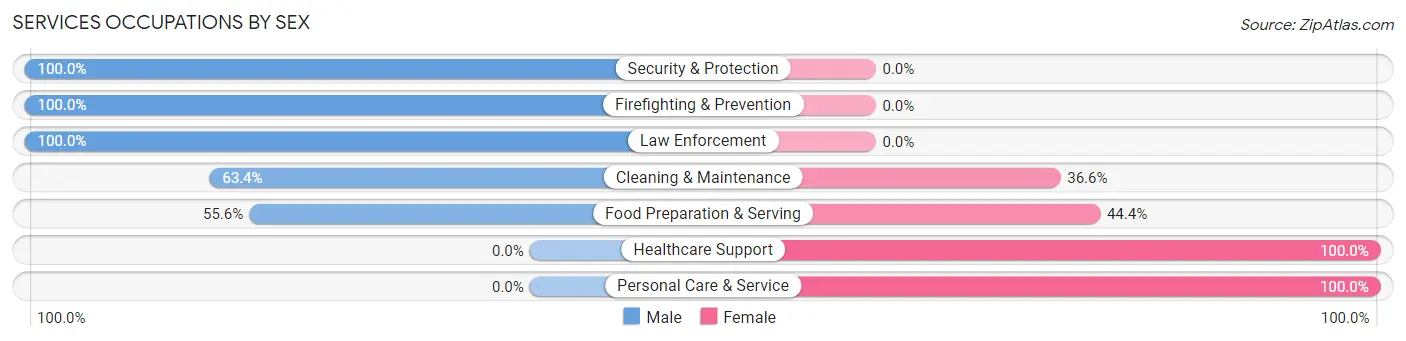
Services Occupations by Sex
Within the Services occupations in Byng, the most male-oriented occupations are Security & Protection (100.0%), Firefighting & Prevention (100.0%), and Law Enforcement (100.0%), while the most female-oriented occupations are Healthcare Support (100.0%), Personal Care & Service (100.0%), and Food Preparation & Serving (44.4%).
| Occupation | Male | Female |
| Healthcare Support | 0 (0.0%) | 13 (100.0%) |
| Security & Protection | 2 (100.0%) | 0 (0.0%) |
| Firefighting & Prevention | 1 (100.0%) | 0 (0.0%) |
| Law Enforcement | 1 (100.0%) | 0 (0.0%) |
| Food Preparation & Serving | 5 (55.6%) | 4 (44.4%) |
| Cleaning & Maintenance | 26 (63.4%) | 15 (36.6%) |
| Personal Care & Service | 0 (0.0%) | 3 (100.0%) |
| Total (Category) | 33 (48.5%) | 35 (51.5%) |
| Total (Overall) | 342 (50.2%) | 339 (49.8%) |
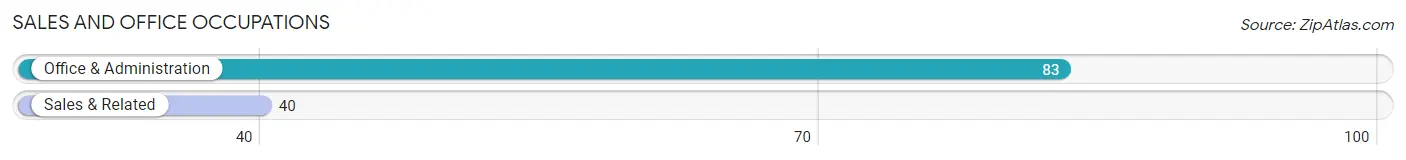
Sales and Office Occupations
The most common Sales and Office occupations in Byng are Office & Administration (83 | 12.2%), and Sales & Related (40 | 5.9%).
Sales and Office Occupations by Sex
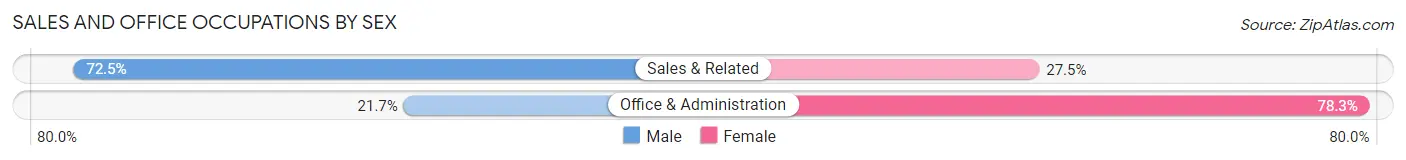
| Occupation | Male | Female |
| Sales & Related | 29 (72.5%) | 11 (27.5%) |
| Office & Administration | 18 (21.7%) | 65 (78.3%) |
| Total (Category) | 47 (38.2%) | 76 (61.8%) |
| Total (Overall) | 342 (50.2%) | 339 (49.8%) |
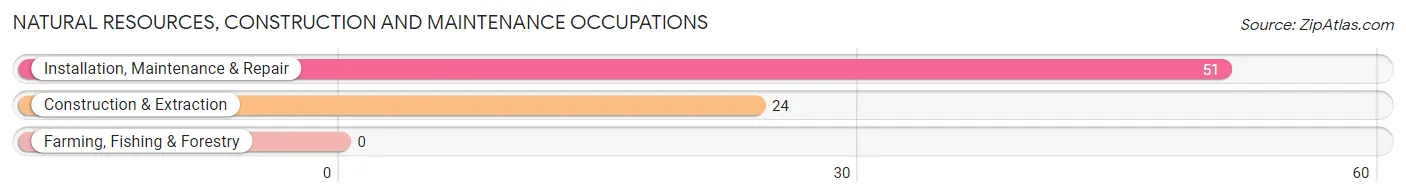
Natural Resources, Construction and Maintenance Occupations
The most common Natural Resources, Construction and Maintenance occupations in Byng are Installation, Maintenance & Repair (51 | 7.5%), and Construction & Extraction (24 | 3.5%).
Natural Resources, Construction and Maintenance Occupations by Sex
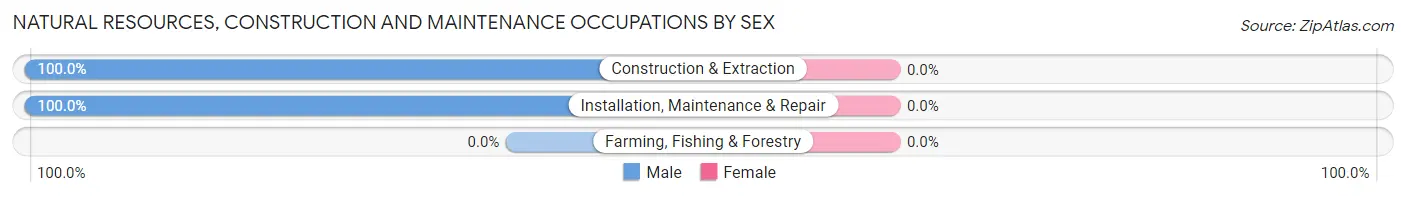
| Occupation | Male | Female |
| Farming, Fishing & Forestry | 0 (0.0%) | 0 (0.0%) |
| Construction & Extraction | 24 (100.0%) | 0 (0.0%) |
| Installation, Maintenance & Repair | 51 (100.0%) | 0 (0.0%) |
| Total (Category) | 75 (100.0%) | 0 (0.0%) |
| Total (Overall) | 342 (50.2%) | 339 (49.8%) |
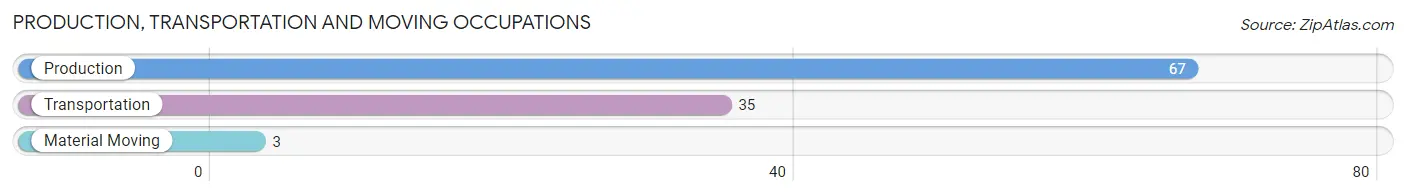
Production, Transportation and Moving Occupations
The most common Production, Transportation and Moving occupations in Byng are Production (67 | 9.8%), Transportation (35 | 5.1%), and Material Moving (3 | 0.4%).
Production, Transportation and Moving Occupations by Sex
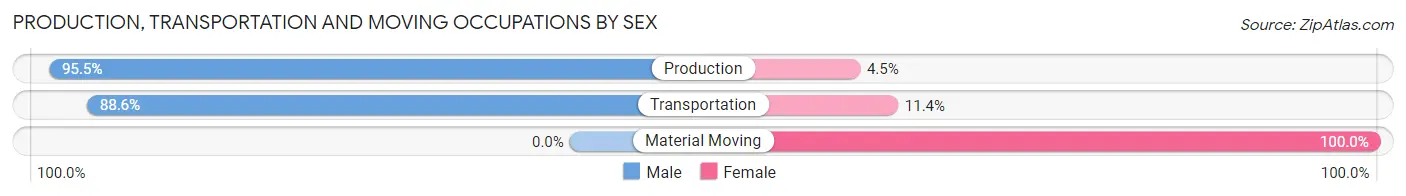
| Occupation | Male | Female |
| Production | 64 (95.5%) | 3 (4.5%) |
| Transportation | 31 (88.6%) | 4 (11.4%) |
| Material Moving | 0 (0.0%) | 3 (100.0%) |
| Total (Category) | 95 (90.5%) | 10 (9.5%) |
| Total (Overall) | 342 (50.2%) | 339 (49.8%) |
Employment Industries by Sex in Byng
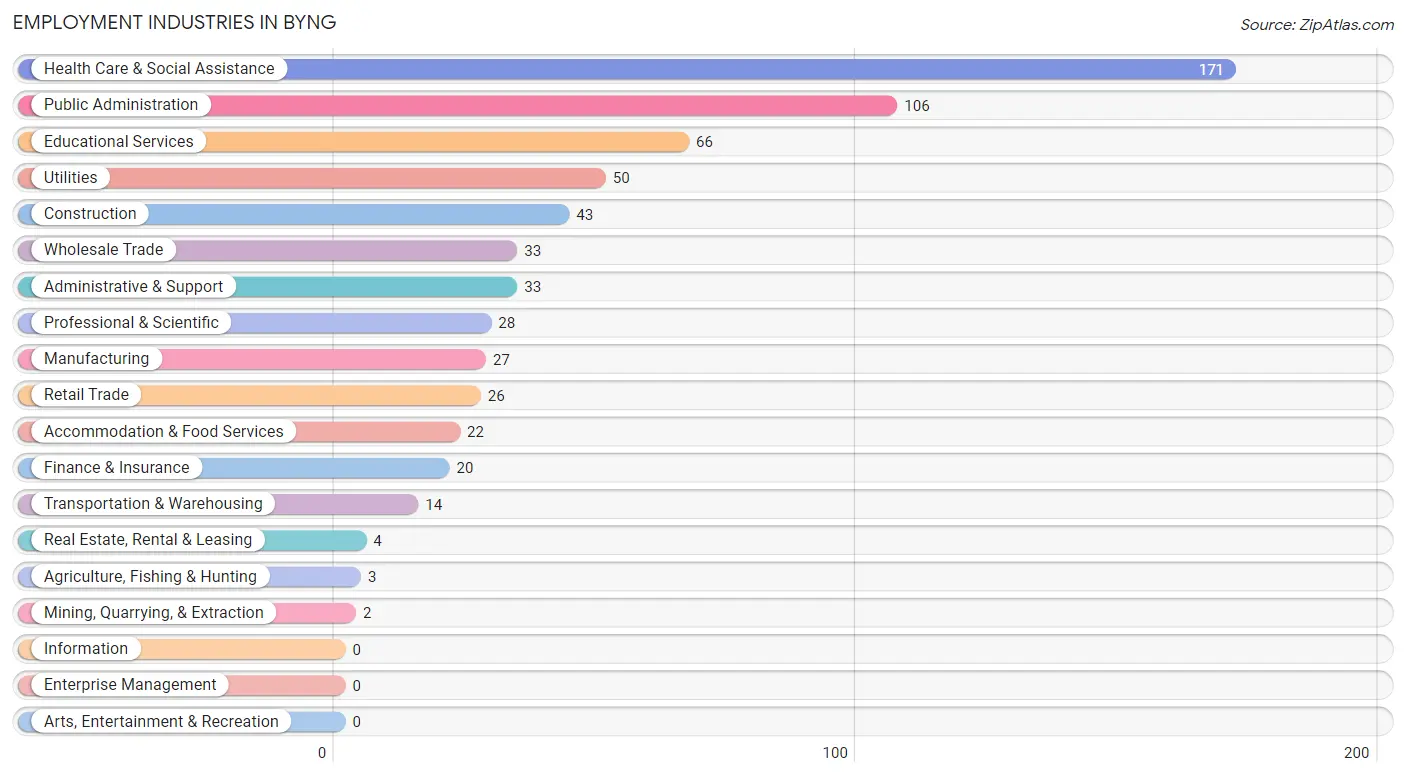
Employment Industries in Byng
The major employment industries in Byng include Health Care & Social Assistance (171 | 25.1%), Public Administration (106 | 15.6%), Educational Services (66 | 9.7%), Utilities (50 | 7.3%), and Construction (43 | 6.3%).
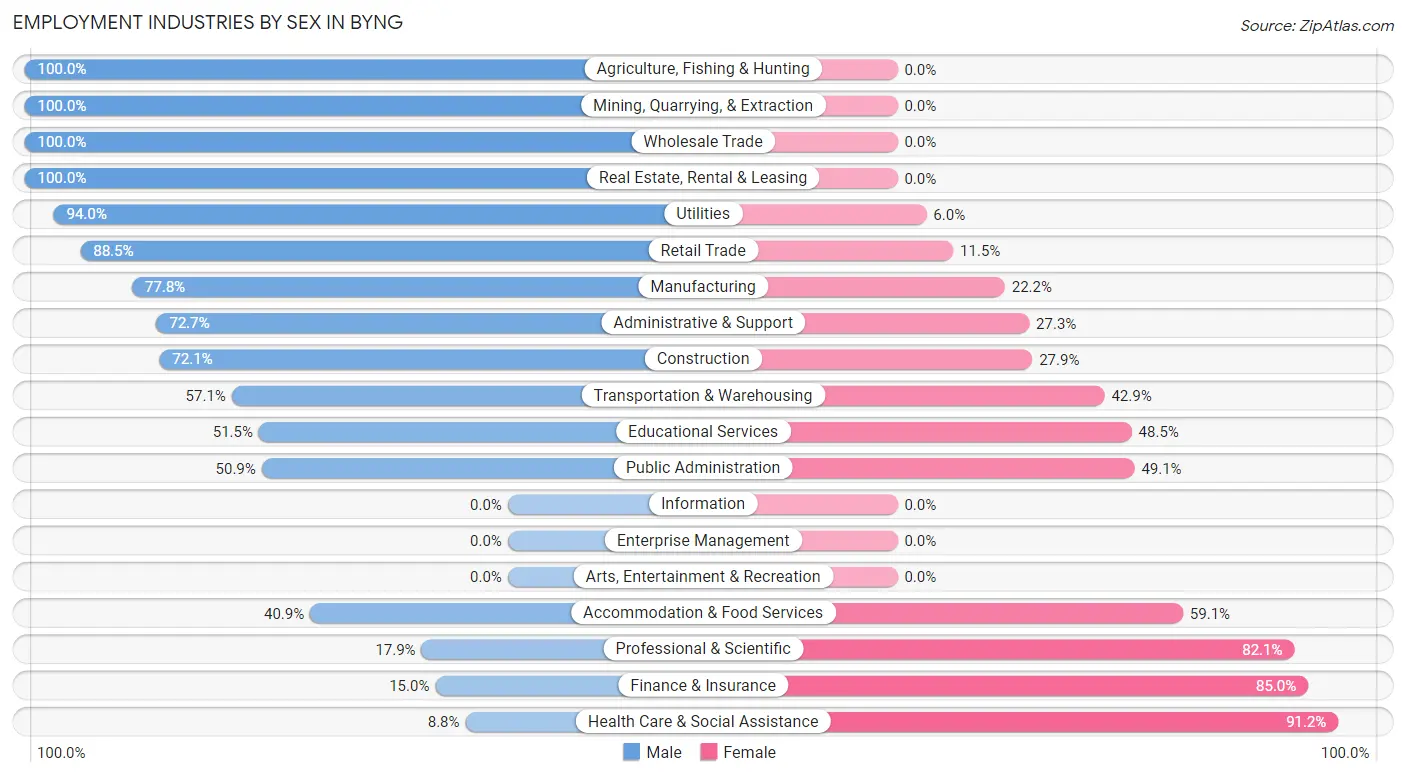
Employment Industries by Sex in Byng
The Byng industries that see more men than women are Agriculture, Fishing & Hunting (100.0%), Mining, Quarrying, & Extraction (100.0%), and Wholesale Trade (100.0%), whereas the industries that tend to have a higher number of women are Health Care & Social Assistance (91.2%), Finance & Insurance (85.0%), and Professional & Scientific (82.1%).
| Industry | Male | Female |
| Agriculture, Fishing & Hunting | 3 (100.0%) | 0 (0.0%) |
| Mining, Quarrying, & Extraction | 2 (100.0%) | 0 (0.0%) |
| Construction | 31 (72.1%) | 12 (27.9%) |
| Manufacturing | 21 (77.8%) | 6 (22.2%) |
| Wholesale Trade | 33 (100.0%) | 0 (0.0%) |
| Retail Trade | 23 (88.5%) | 3 (11.5%) |
| Transportation & Warehousing | 8 (57.1%) | 6 (42.9%) |
| Utilities | 47 (94.0%) | 3 (6.0%) |
| Information | 0 (0.0%) | 0 (0.0%) |
| Finance & Insurance | 3 (15.0%) | 17 (85.0%) |
| Real Estate, Rental & Leasing | 4 (100.0%) | 0 (0.0%) |
| Professional & Scientific | 5 (17.9%) | 23 (82.1%) |
| Enterprise Management | 0 (0.0%) | 0 (0.0%) |
| Administrative & Support | 24 (72.7%) | 9 (27.3%) |
| Educational Services | 34 (51.5%) | 32 (48.5%) |
| Health Care & Social Assistance | 15 (8.8%) | 156 (91.2%) |
| Arts, Entertainment & Recreation | 0 (0.0%) | 0 (0.0%) |
| Accommodation & Food Services | 9 (40.9%) | 13 (59.1%) |
| Public Administration | 54 (50.9%) | 52 (49.1%) |
| Total | 342 (50.2%) | 339 (49.8%) |
Education in Byng
School Enrollment in Byng
The most common levels of schooling among the 359 students in Byng are middle school (105 | 29.2%), elementary school (75 | 20.9%), and nursery / preschool (62 | 17.3%).
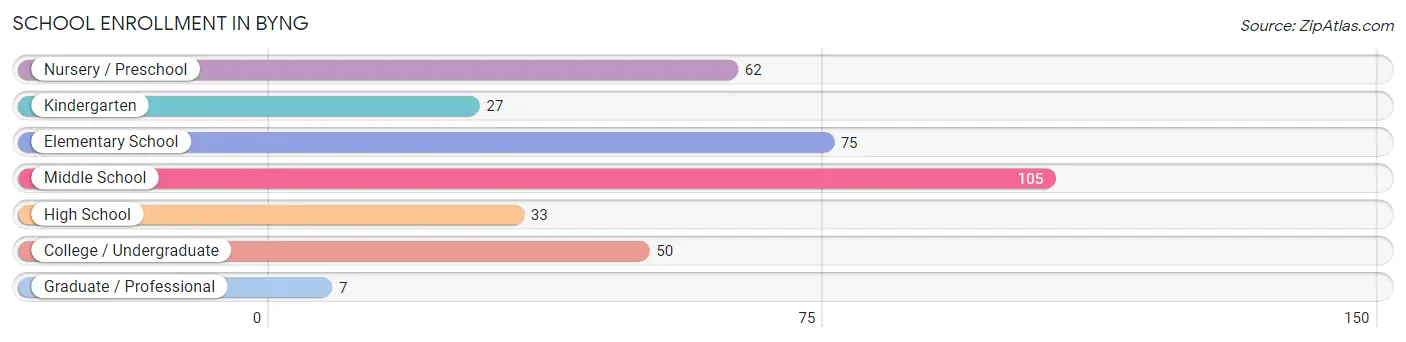
| School Level | # Students | % Students |
| Nursery / Preschool | 62 | 17.3% |
| Kindergarten | 27 | 7.5% |
| Elementary School | 75 | 20.9% |
| Middle School | 105 | 29.2% |
| High School | 33 | 9.2% |
| College / Undergraduate | 50 | 13.9% |
| Graduate / Professional | 7 | 1.9% |
| Total | 359 | 100.0% |
School Enrollment by Age by Funding Source in Byng
Out of a total of 359 students who are enrolled in schools in Byng, 8 (2.2%) attend a private institution, while the remaining 351 (97.8%) are enrolled in public schools. The age group of 35 years and over has the highest likelihood of being enrolled in private schools, with 4 (50.0% in the age bracket) enrolled. Conversely, the age group of 3 to 4 year olds has the lowest likelihood of being enrolled in a private school, with 48 (100.0% in the age bracket) attending a public institution.
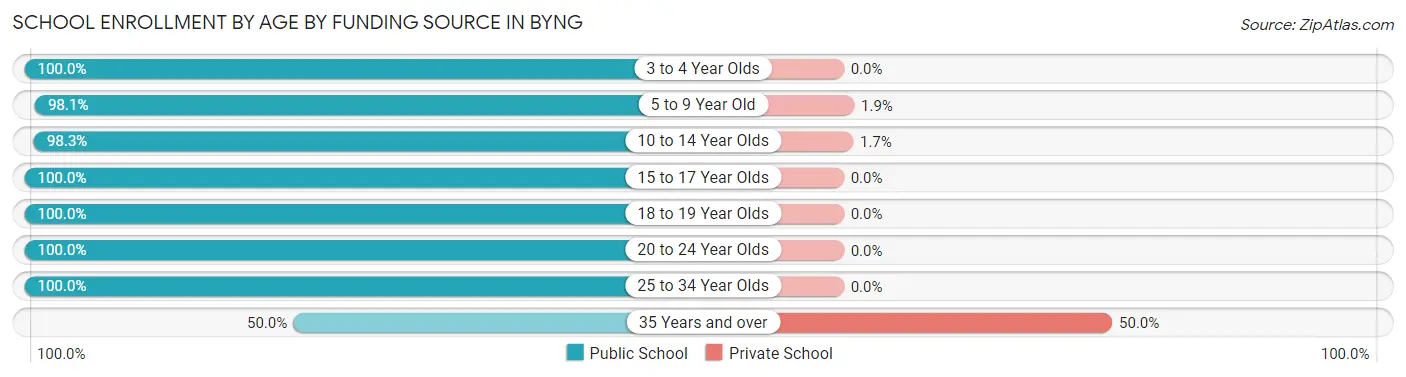
| Age Bracket | Public School | Private School |
| 3 to 4 Year Olds | 48 (100.0%) | 0 (0.0%) |
| 5 to 9 Year Old | 101 (98.1%) | 2 (1.9%) |
| 10 to 14 Year Olds | 113 (98.3%) | 2 (1.7%) |
| 15 to 17 Year Olds | 45 (100.0%) | 0 (0.0%) |
| 18 to 19 Year Olds | 14 (100.0%) | 0 (0.0%) |
| 20 to 24 Year Olds | 8 (100.0%) | 0 (0.0%) |
| 25 to 34 Year Olds | 18 (100.0%) | 0 (0.0%) |
| 35 Years and over | 4 (50.0%) | 4 (50.0%) |
| Total | 351 (97.8%) | 8 (2.2%) |
Educational Attainment by Field of Study in Byng
Education (110 | 33.9%), science & technology (49 | 15.1%), arts & humanities (48 | 14.8%), business (34 | 10.5%), and bio, nature & agricultural (20 | 6.1%) are the most common fields of study among 325 individuals in Byng who have obtained a bachelor's degree or higher.
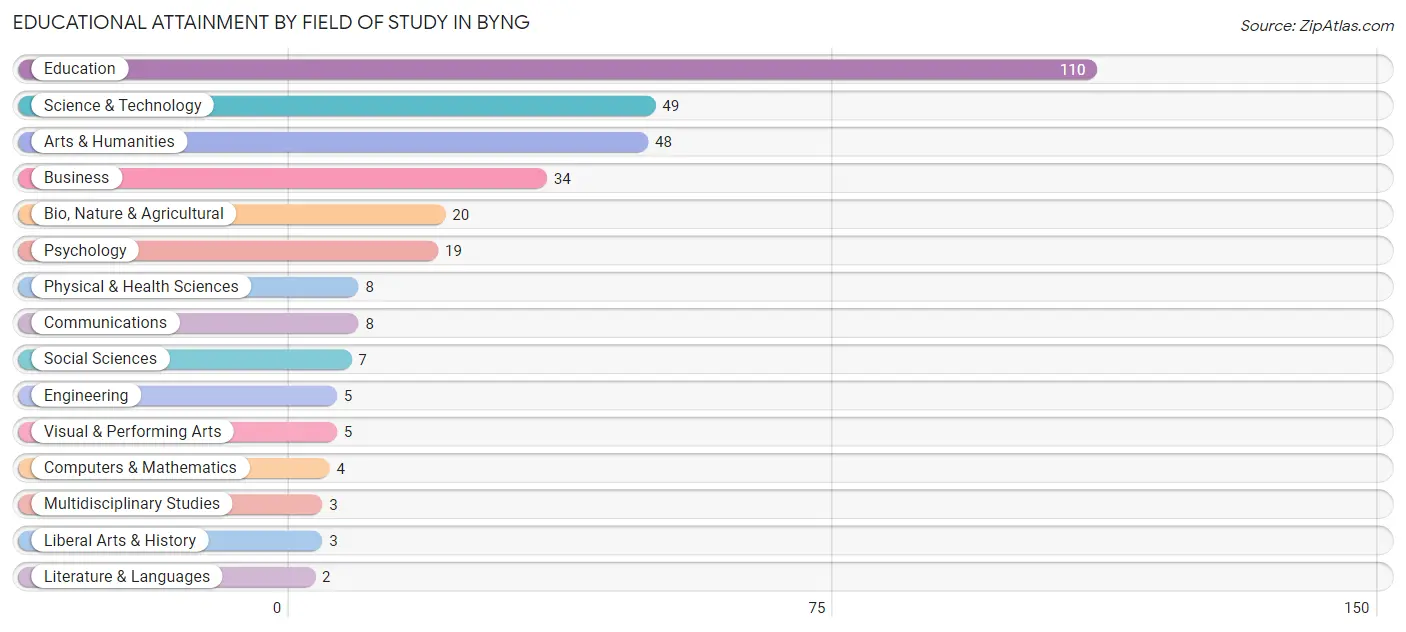
| Field of Study | # Graduates | % Graduates |
| Computers & Mathematics | 4 | 1.2% |
| Bio, Nature & Agricultural | 20 | 6.1% |
| Physical & Health Sciences | 8 | 2.5% |
| Psychology | 19 | 5.9% |
| Social Sciences | 7 | 2.1% |
| Engineering | 5 | 1.5% |
| Multidisciplinary Studies | 3 | 0.9% |
| Science & Technology | 49 | 15.1% |
| Business | 34 | 10.5% |
| Education | 110 | 33.9% |
| Literature & Languages | 2 | 0.6% |
| Liberal Arts & History | 3 | 0.9% |
| Visual & Performing Arts | 5 | 1.5% |
| Communications | 8 | 2.5% |
| Arts & Humanities | 48 | 14.8% |
| Total | 325 | 100.0% |
Transportation & Commute in Byng
Vehicle Availability by Sex in Byng
The most prevalent vehicle ownership categories in Byng are males with 2 vehicles (170, accounting for 50.9%) and females with 2 vehicles (196, making up 50.6%).
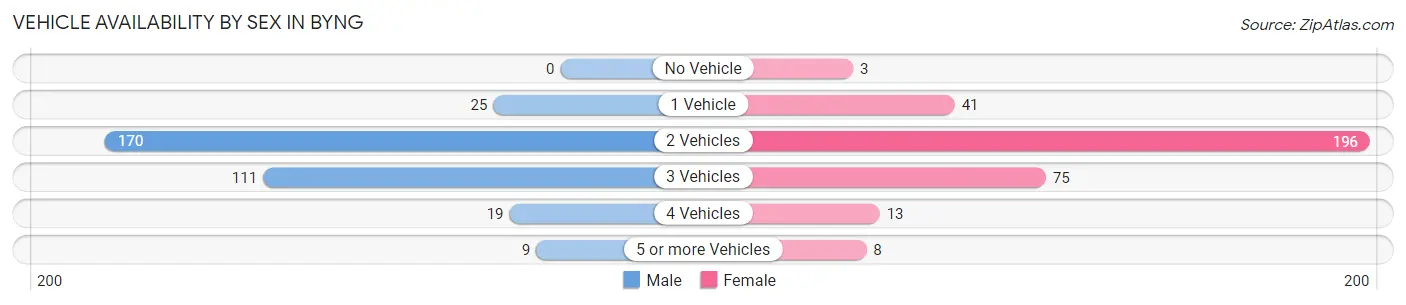
| Vehicles Available | Male | Female |
| No Vehicle | 0 (0.0%) | 3 (0.9%) |
| 1 Vehicle | 25 (7.5%) | 41 (12.2%) |
| 2 Vehicles | 170 (50.9%) | 196 (58.3%) |
| 3 Vehicles | 111 (33.2%) | 75 (22.3%) |
| 4 Vehicles | 19 (5.7%) | 13 (3.9%) |
| 5 or more Vehicles | 9 (2.7%) | 8 (2.4%) |
| Total | 334 (100.0%) | 336 (100.0%) |
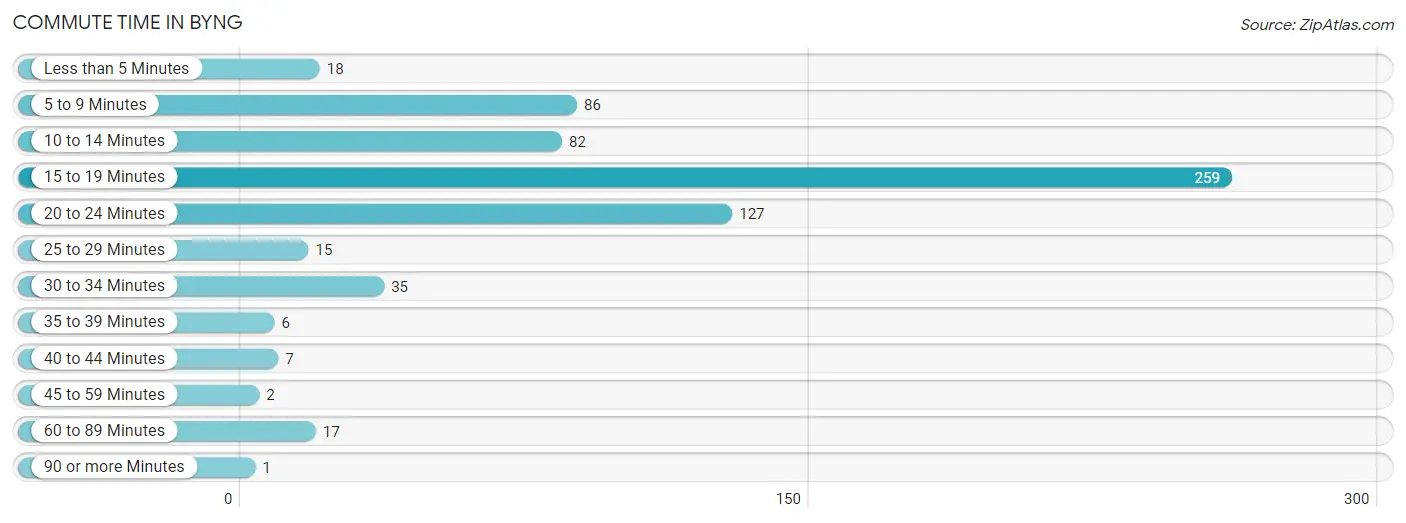
Commute Time in Byng
The most frequently occuring commute durations in Byng are 15 to 19 minutes (259 commuters, 39.5%), 20 to 24 minutes (127 commuters, 19.4%), and 5 to 9 minutes (86 commuters, 13.1%).
| Commute Time | # Commuters | % Commuters |
| Less than 5 Minutes | 18 | 2.8% |
| 5 to 9 Minutes | 86 | 13.1% |
| 10 to 14 Minutes | 82 | 12.5% |
| 15 to 19 Minutes | 259 | 39.5% |
| 20 to 24 Minutes | 127 | 19.4% |
| 25 to 29 Minutes | 15 | 2.3% |
| 30 to 34 Minutes | 35 | 5.3% |
| 35 to 39 Minutes | 6 | 0.9% |
| 40 to 44 Minutes | 7 | 1.1% |
| 45 to 59 Minutes | 2 | 0.3% |
| 60 to 89 Minutes | 17 | 2.6% |
| 90 or more Minutes | 1 | 0.2% |
Commute Time by Sex in Byng
The most common commute times in Byng are 15 to 19 minutes (91 commuters, 27.8%) for males and 15 to 19 minutes (168 commuters, 51.2%) for females.
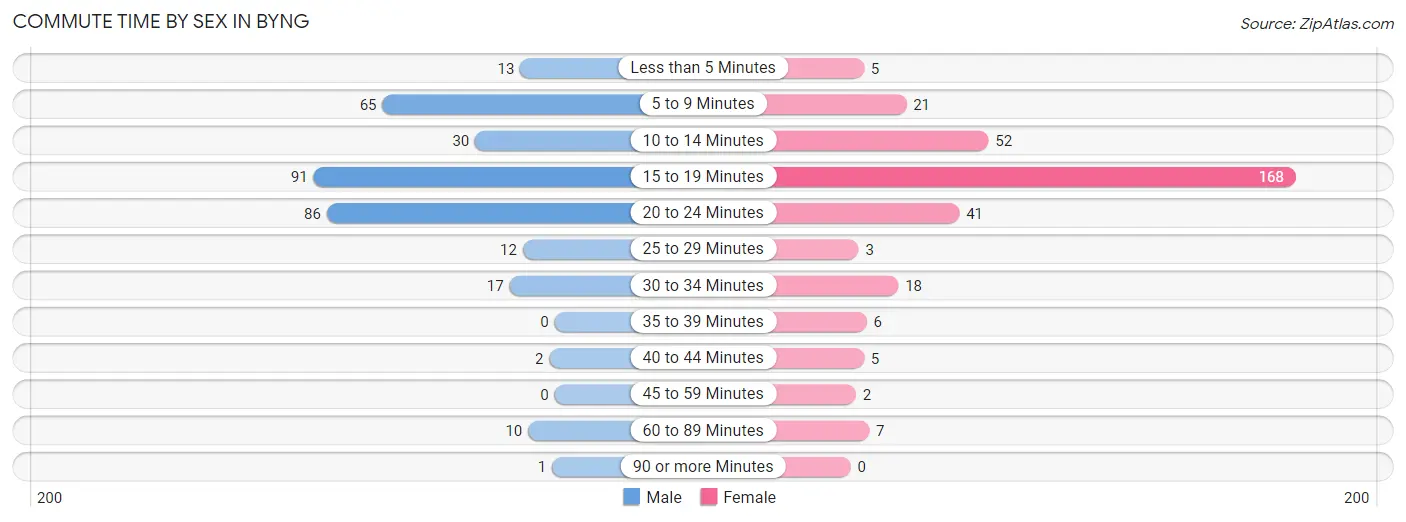
| Commute Time | Male | Female |
| Less than 5 Minutes | 13 (4.0%) | 5 (1.5%) |
| 5 to 9 Minutes | 65 (19.9%) | 21 (6.4%) |
| 10 to 14 Minutes | 30 (9.2%) | 52 (15.9%) |
| 15 to 19 Minutes | 91 (27.8%) | 168 (51.2%) |
| 20 to 24 Minutes | 86 (26.3%) | 41 (12.5%) |
| 25 to 29 Minutes | 12 (3.7%) | 3 (0.9%) |
| 30 to 34 Minutes | 17 (5.2%) | 18 (5.5%) |
| 35 to 39 Minutes | 0 (0.0%) | 6 (1.8%) |
| 40 to 44 Minutes | 2 (0.6%) | 5 (1.5%) |
| 45 to 59 Minutes | 0 (0.0%) | 2 (0.6%) |
| 60 to 89 Minutes | 10 (3.1%) | 7 (2.1%) |
| 90 or more Minutes | 1 (0.3%) | 0 (0.0%) |
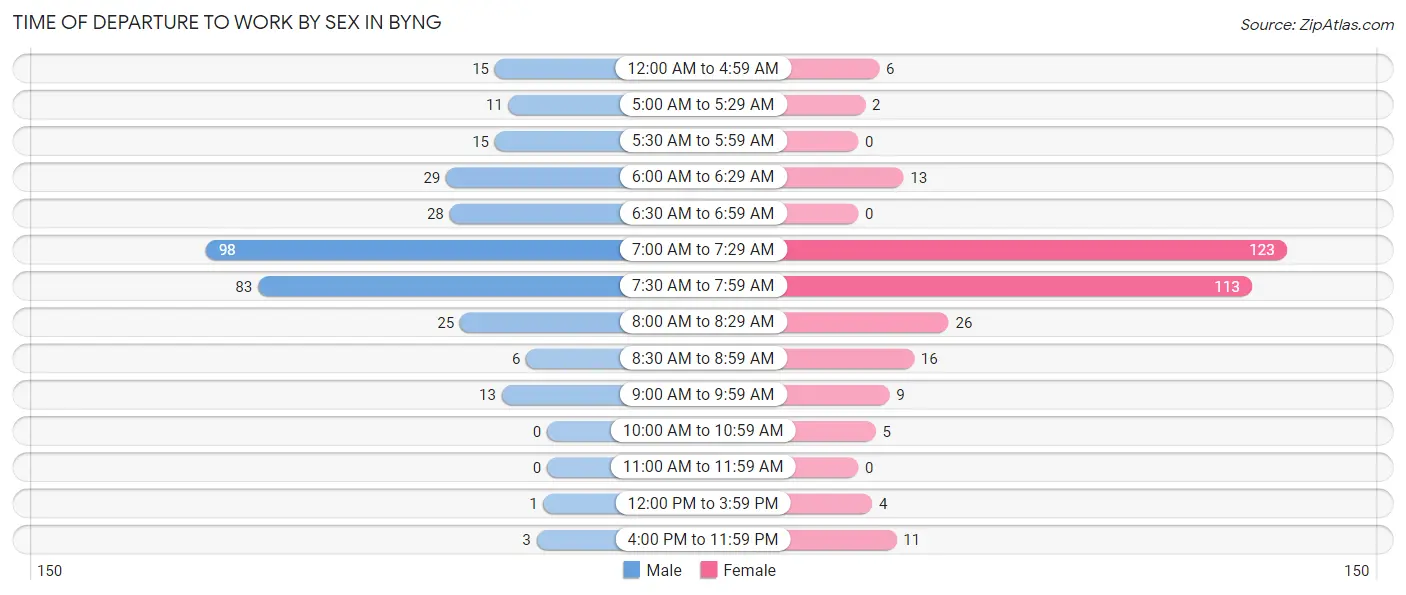
Time of Departure to Work by Sex in Byng
The most frequent times of departure to work in Byng are 7:00 AM to 7:29 AM (98, 30.0%) for males and 7:00 AM to 7:29 AM (123, 37.5%) for females.
| Time of Departure | Male | Female |
| 12:00 AM to 4:59 AM | 15 (4.6%) | 6 (1.8%) |
| 5:00 AM to 5:29 AM | 11 (3.4%) | 2 (0.6%) |
| 5:30 AM to 5:59 AM | 15 (4.6%) | 0 (0.0%) |
| 6:00 AM to 6:29 AM | 29 (8.9%) | 13 (4.0%) |
| 6:30 AM to 6:59 AM | 28 (8.6%) | 0 (0.0%) |
| 7:00 AM to 7:29 AM | 98 (30.0%) | 123 (37.5%) |
| 7:30 AM to 7:59 AM | 83 (25.4%) | 113 (34.4%) |
| 8:00 AM to 8:29 AM | 25 (7.6%) | 26 (7.9%) |
| 8:30 AM to 8:59 AM | 6 (1.8%) | 16 (4.9%) |
| 9:00 AM to 9:59 AM | 13 (4.0%) | 9 (2.7%) |
| 10:00 AM to 10:59 AM | 0 (0.0%) | 5 (1.5%) |
| 11:00 AM to 11:59 AM | 0 (0.0%) | 0 (0.0%) |
| 12:00 PM to 3:59 PM | 1 (0.3%) | 4 (1.2%) |
| 4:00 PM to 11:59 PM | 3 (0.9%) | 11 (3.4%) |
| Total | 327 (100.0%) | 328 (100.0%) |
Housing Occupancy in Byng
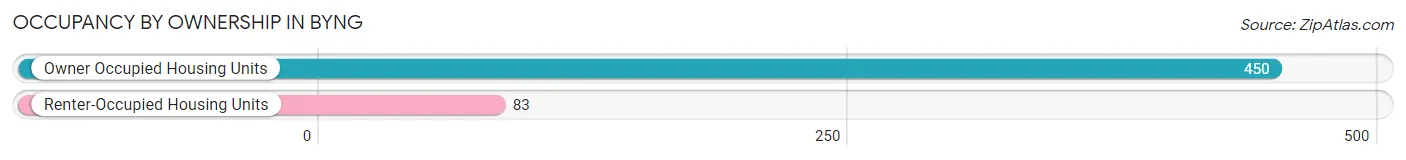
Occupancy by Ownership in Byng
Of the total 533 dwellings in Byng, owner-occupied units account for 450 (84.4%), while renter-occupied units make up 83 (15.6%).
| Occupancy | # Housing Units | % Housing Units |
| Owner Occupied Housing Units | 450 | 84.4% |
| Renter-Occupied Housing Units | 83 | 15.6% |
| Total Occupied Housing Units | 533 | 100.0% |
Occupancy by Household Size in Byng
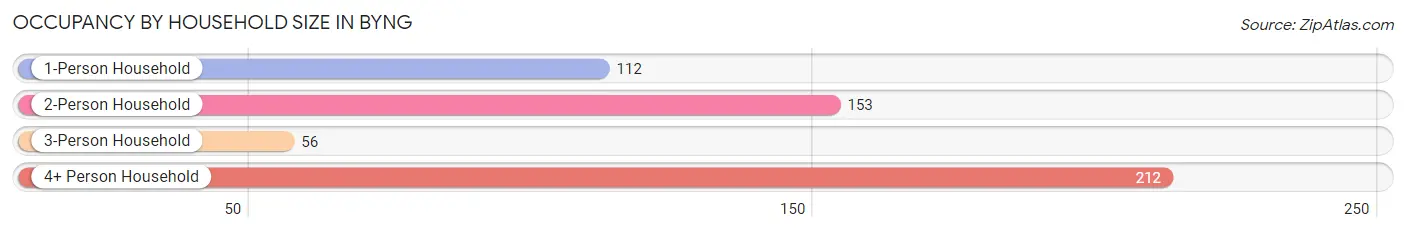
| Household Size | # Housing Units | % Housing Units |
| 1-Person Household | 112 | 21.0% |
| 2-Person Household | 153 | 28.7% |
| 3-Person Household | 56 | 10.5% |
| 4+ Person Household | 212 | 39.8% |
| Total Housing Units | 533 | 100.0% |
Occupancy by Ownership by Household Size in Byng
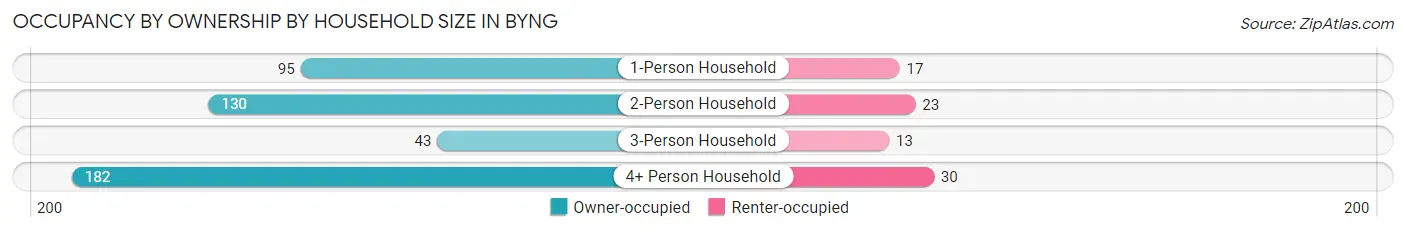
| Household Size | Owner-occupied | Renter-occupied |
| 1-Person Household | 95 (84.8%) | 17 (15.2%) |
| 2-Person Household | 130 (85.0%) | 23 (15.0%) |
| 3-Person Household | 43 (76.8%) | 13 (23.2%) |
| 4+ Person Household | 182 (85.9%) | 30 (14.1%) |
| Total Housing Units | 450 (84.4%) | 83 (15.6%) |
Occupancy by Educational Attainment in Byng
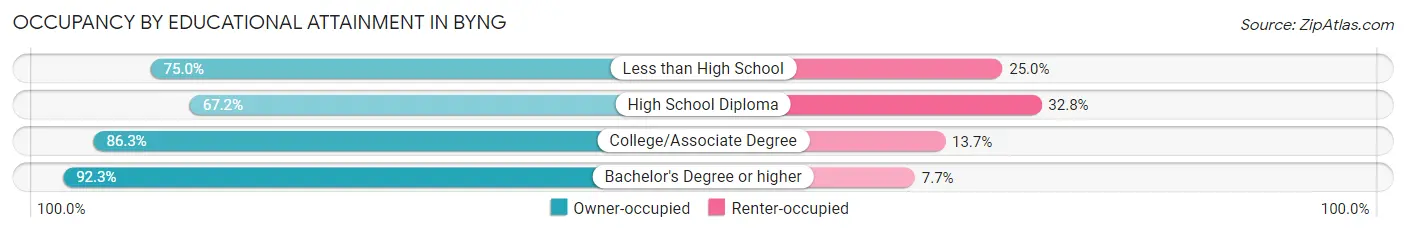
| Household Size | Owner-occupied | Renter-occupied |
| Less than High School | 9 (75.0%) | 3 (25.0%) |
| High School Diploma | 78 (67.2%) | 38 (32.8%) |
| College/Associate Degree | 158 (86.3%) | 25 (13.7%) |
| Bachelor's Degree or higher | 205 (92.3%) | 17 (7.7%) |
Occupancy by Age of Householder in Byng
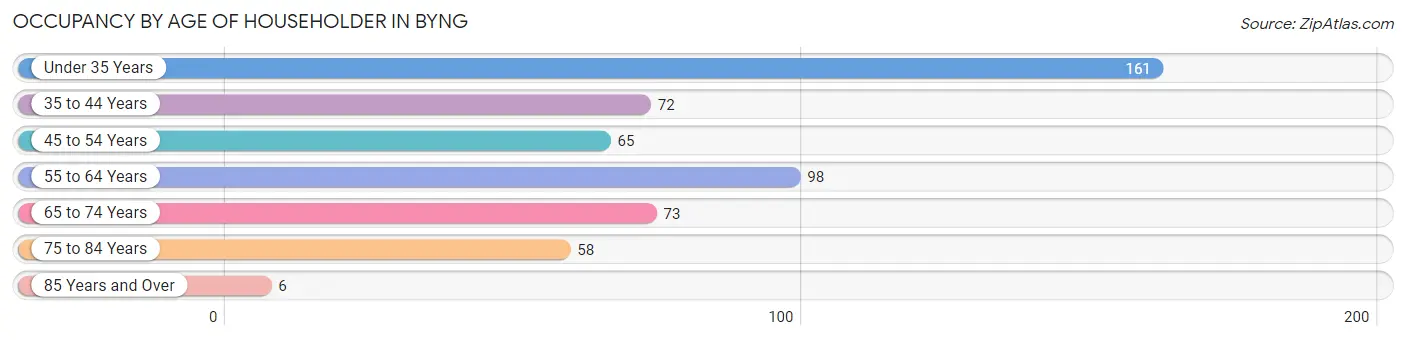
| Age Bracket | # Households | % Households |
| Under 35 Years | 161 | 30.2% |
| 35 to 44 Years | 72 | 13.5% |
| 45 to 54 Years | 65 | 12.2% |
| 55 to 64 Years | 98 | 18.4% |
| 65 to 74 Years | 73 | 13.7% |
| 75 to 84 Years | 58 | 10.9% |
| 85 Years and Over | 6 | 1.1% |
| Total | 533 | 100.0% |
Housing Finances in Byng
Median Income by Occupancy in Byng
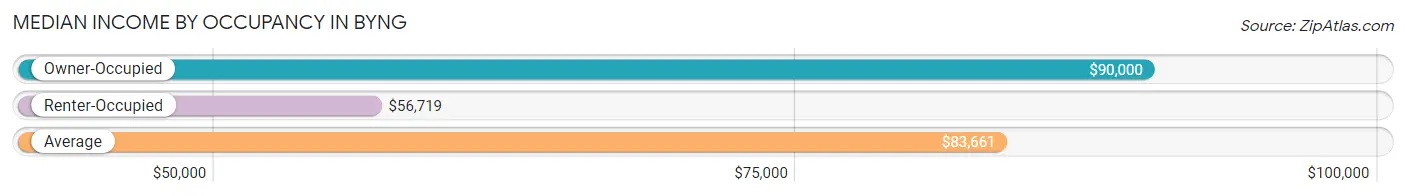
| Occupancy Type | # Households | Median Income |
| Owner-Occupied | 450 (84.4%) | $90,000 |
| Renter-Occupied | 83 (15.6%) | $56,719 |
| Average | 533 (100.0%) | $83,661 |
Occupancy by Householder Income Bracket in Byng
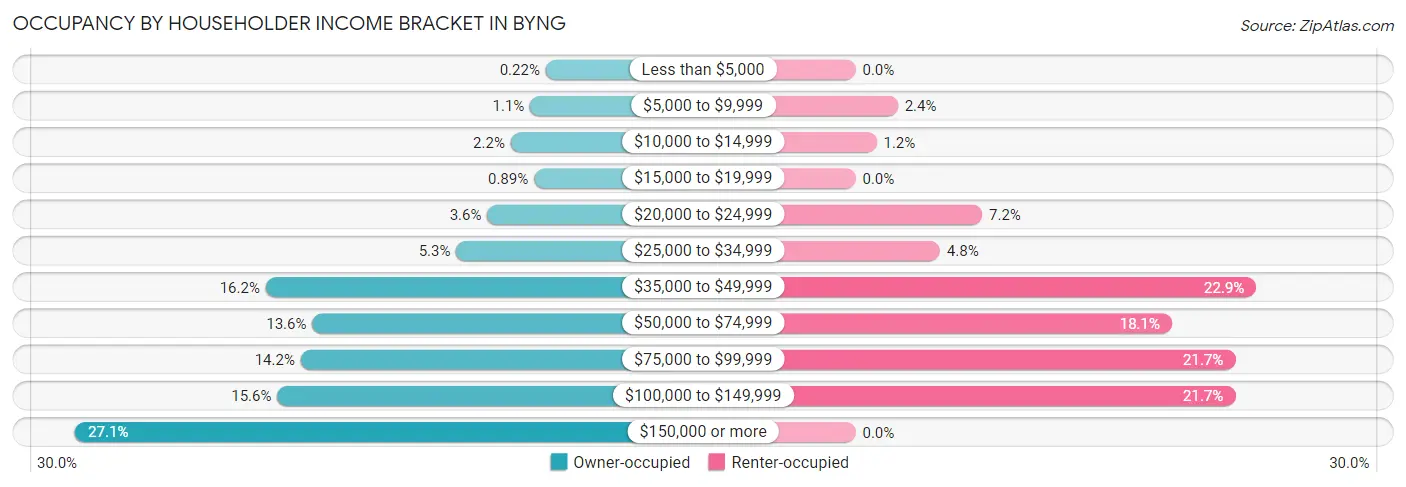
| Income Bracket | Owner-occupied | Renter-occupied |
| Less than $5,000 | 1 (0.2%) | 0 (0.0%) |
| $5,000 to $9,999 | 5 (1.1%) | 2 (2.4%) |
| $10,000 to $14,999 | 10 (2.2%) | 1 (1.2%) |
| $15,000 to $19,999 | 4 (0.9%) | 0 (0.0%) |
| $20,000 to $24,999 | 16 (3.6%) | 6 (7.2%) |
| $25,000 to $34,999 | 24 (5.3%) | 4 (4.8%) |
| $35,000 to $49,999 | 73 (16.2%) | 19 (22.9%) |
| $50,000 to $74,999 | 61 (13.6%) | 15 (18.1%) |
| $75,000 to $99,999 | 64 (14.2%) | 18 (21.7%) |
| $100,000 to $149,999 | 70 (15.6%) | 18 (21.7%) |
| $150,000 or more | 122 (27.1%) | 0 (0.0%) |
| Total | 450 (100.0%) | 83 (100.0%) |
Monthly Housing Cost Tiers in Byng
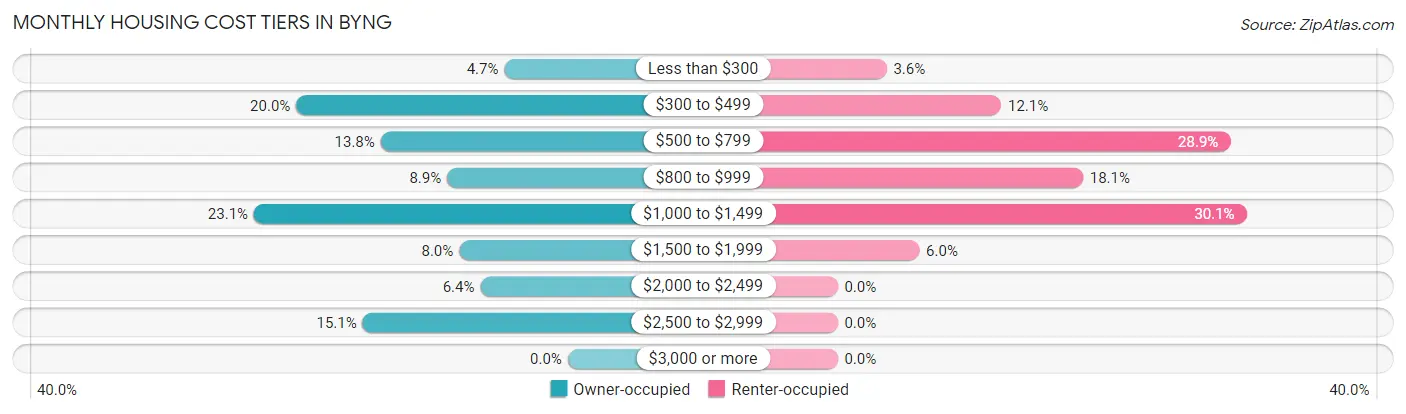
| Monthly Cost | Owner-occupied | Renter-occupied |
| Less than $300 | 21 (4.7%) | 3 (3.6%) |
| $300 to $499 | 90 (20.0%) | 10 (12.0%) |
| $500 to $799 | 62 (13.8%) | 24 (28.9%) |
| $800 to $999 | 40 (8.9%) | 15 (18.1%) |
| $1,000 to $1,499 | 104 (23.1%) | 25 (30.1%) |
| $1,500 to $1,999 | 36 (8.0%) | 5 (6.0%) |
| $2,000 to $2,499 | 29 (6.4%) | 0 (0.0%) |
| $2,500 to $2,999 | 68 (15.1%) | 0 (0.0%) |
| $3,000 or more | 0 (0.0%) | 0 (0.0%) |
| Total | 450 (100.0%) | 83 (100.0%) |
Physical Housing Characteristics in Byng
Housing Structures in Byng
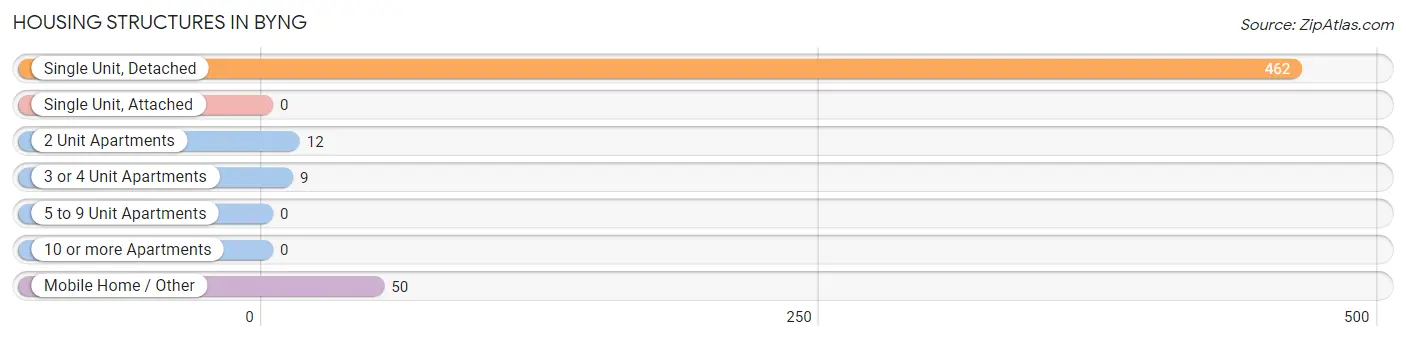
| Structure Type | # Housing Units | % Housing Units |
| Single Unit, Detached | 462 | 86.7% |
| Single Unit, Attached | 0 | 0.0% |
| 2 Unit Apartments | 12 | 2.2% |
| 3 or 4 Unit Apartments | 9 | 1.7% |
| 5 to 9 Unit Apartments | 0 | 0.0% |
| 10 or more Apartments | 0 | 0.0% |
| Mobile Home / Other | 50 | 9.4% |
| Total | 533 | 100.0% |
Housing Structures by Occupancy in Byng
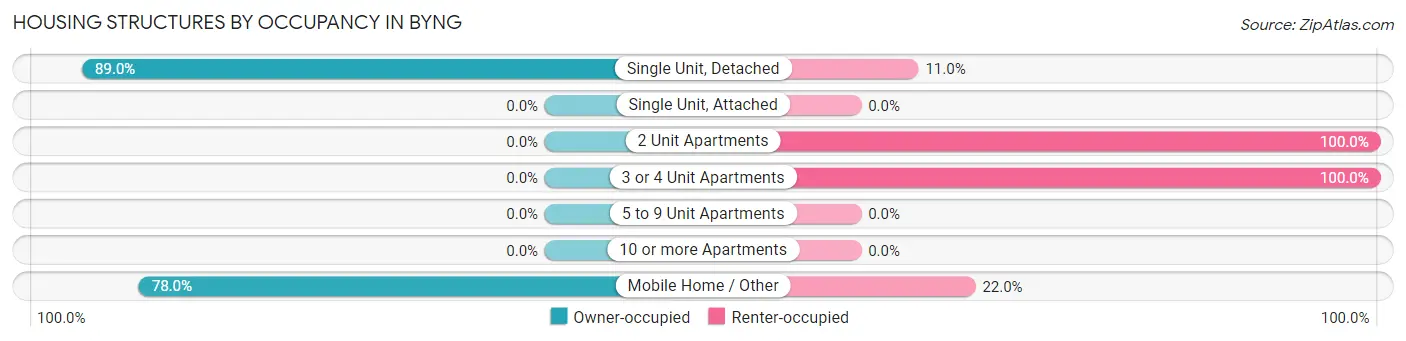
| Structure Type | Owner-occupied | Renter-occupied |
| Single Unit, Detached | 411 (89.0%) | 51 (11.0%) |
| Single Unit, Attached | 0 (0.0%) | 0 (0.0%) |
| 2 Unit Apartments | 0 (0.0%) | 12 (100.0%) |
| 3 or 4 Unit Apartments | 0 (0.0%) | 9 (100.0%) |
| 5 to 9 Unit Apartments | 0 (0.0%) | 0 (0.0%) |
| 10 or more Apartments | 0 (0.0%) | 0 (0.0%) |
| Mobile Home / Other | 39 (78.0%) | 11 (22.0%) |
| Total | 450 (84.4%) | 83 (15.6%) |
Housing Structures by Number of Rooms in Byng
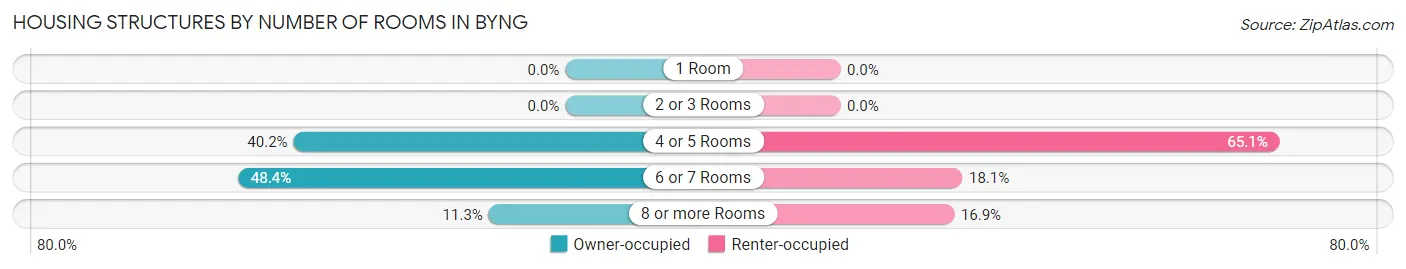
| Number of Rooms | Owner-occupied | Renter-occupied |
| 1 Room | 0 (0.0%) | 0 (0.0%) |
| 2 or 3 Rooms | 0 (0.0%) | 0 (0.0%) |
| 4 or 5 Rooms | 181 (40.2%) | 54 (65.1%) |
| 6 or 7 Rooms | 218 (48.4%) | 15 (18.1%) |
| 8 or more Rooms | 51 (11.3%) | 14 (16.9%) |
| Total | 450 (100.0%) | 83 (100.0%) |
Housing Structure by Heating Type in Byng
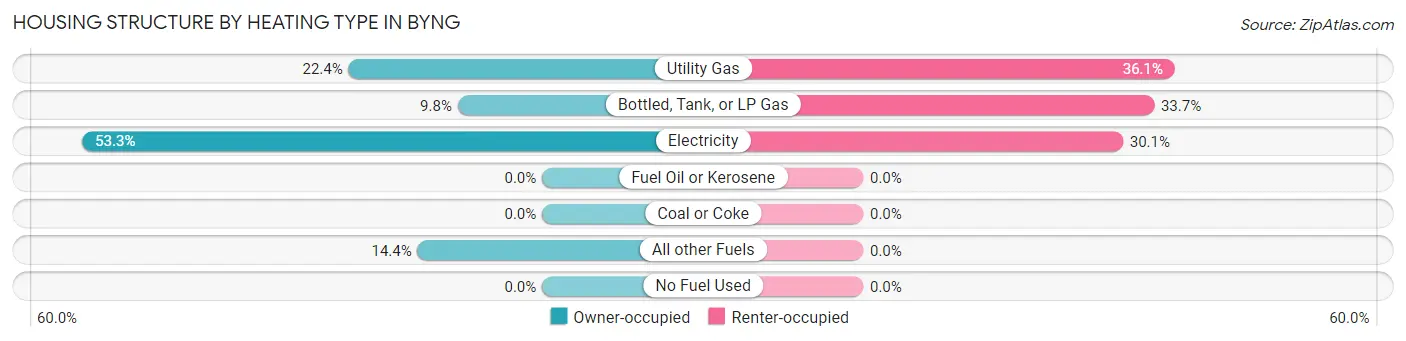
| Heating Type | Owner-occupied | Renter-occupied |
| Utility Gas | 101 (22.4%) | 30 (36.1%) |
| Bottled, Tank, or LP Gas | 44 (9.8%) | 28 (33.7%) |
| Electricity | 240 (53.3%) | 25 (30.1%) |
| Fuel Oil or Kerosene | 0 (0.0%) | 0 (0.0%) |
| Coal or Coke | 0 (0.0%) | 0 (0.0%) |
| All other Fuels | 65 (14.4%) | 0 (0.0%) |
| No Fuel Used | 0 (0.0%) | 0 (0.0%) |
| Total | 450 (100.0%) | 83 (100.0%) |
Household Vehicle Usage in Byng
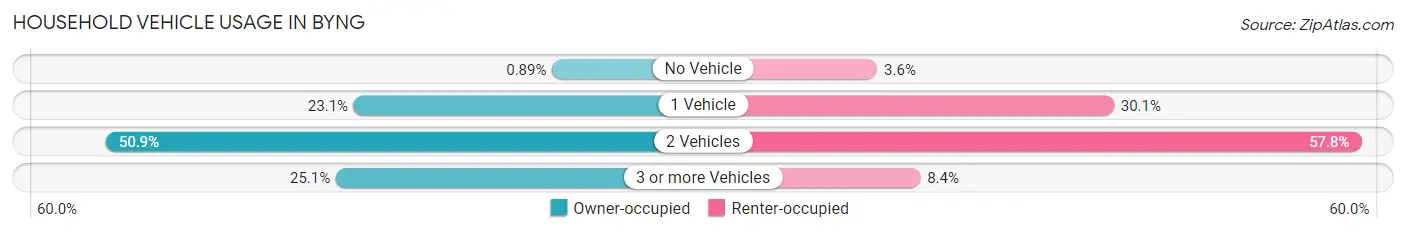
| Vehicles per Household | Owner-occupied | Renter-occupied |
| No Vehicle | 4 (0.9%) | 3 (3.6%) |
| 1 Vehicle | 104 (23.1%) | 25 (30.1%) |
| 2 Vehicles | 229 (50.9%) | 48 (57.8%) |
| 3 or more Vehicles | 113 (25.1%) | 7 (8.4%) |
| Total | 450 (100.0%) | 83 (100.0%) |
Real Estate & Mortgages in Byng
Real Estate and Mortgage Overview in Byng
| Characteristic | Without Mortgage | With Mortgage |
| Housing Units | 173 | 277 |
| Median Property Value | $118,300 | $216,100 |
| Median Household Income | $48,787 | $109 |
| Monthly Housing Costs | $443 | $0 |
| Real Estate Taxes | $640 | $16 |
Property Value by Mortgage Status in Byng
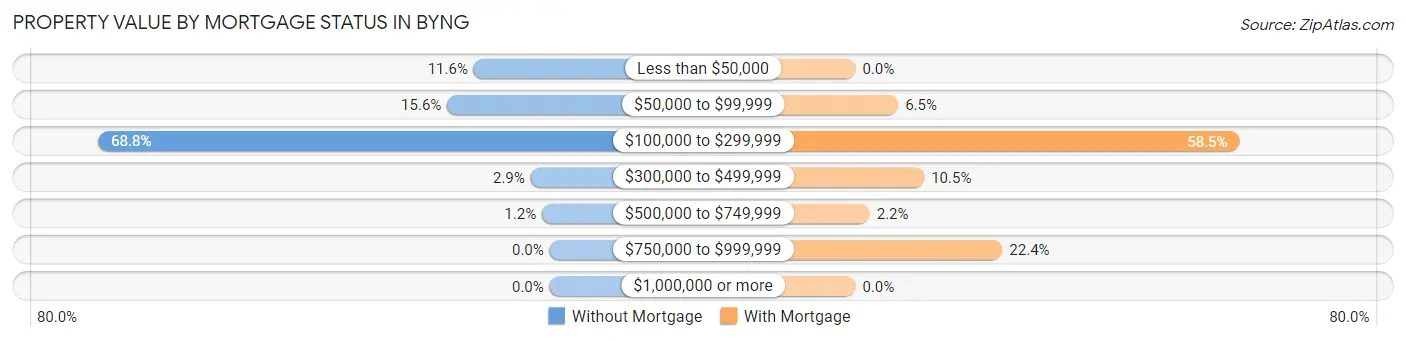
| Property Value | Without Mortgage | With Mortgage |
| Less than $50,000 | 20 (11.6%) | 0 (0.0%) |
| $50,000 to $99,999 | 27 (15.6%) | 18 (6.5%) |
| $100,000 to $299,999 | 119 (68.8%) | 162 (58.5%) |
| $300,000 to $499,999 | 5 (2.9%) | 29 (10.5%) |
| $500,000 to $749,999 | 2 (1.2%) | 6 (2.2%) |
| $750,000 to $999,999 | 0 (0.0%) | 62 (22.4%) |
| $1,000,000 or more | 0 (0.0%) | 0 (0.0%) |
| Total | 173 (100.0%) | 277 (100.0%) |
Household Income by Mortgage Status in Byng
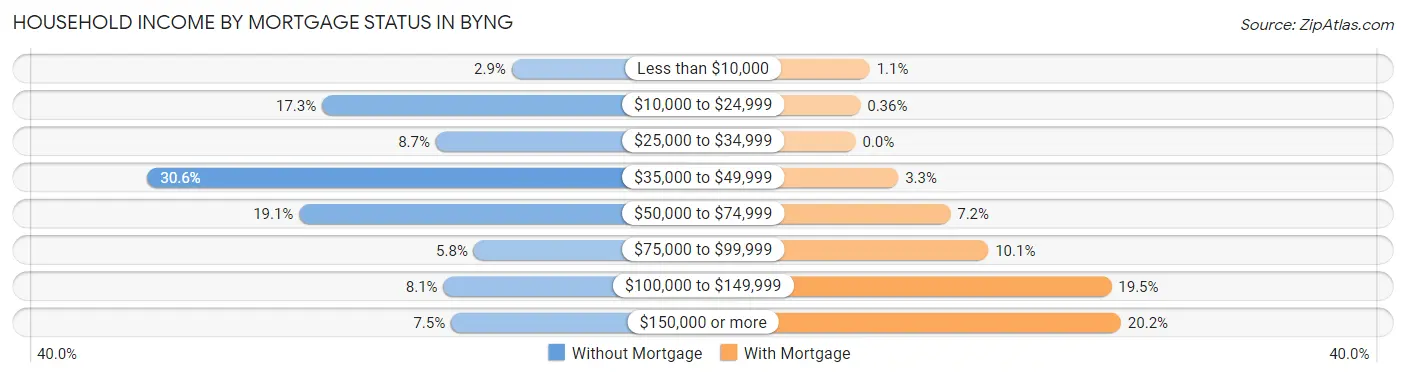
| Household Income | Without Mortgage | With Mortgage |
| Less than $10,000 | 5 (2.9%) | 3 (1.1%) |
| $10,000 to $24,999 | 30 (17.3%) | 1 (0.4%) |
| $25,000 to $34,999 | 15 (8.7%) | 0 (0.0%) |
| $35,000 to $49,999 | 53 (30.6%) | 9 (3.3%) |
| $50,000 to $74,999 | 33 (19.1%) | 20 (7.2%) |
| $75,000 to $99,999 | 10 (5.8%) | 28 (10.1%) |
| $100,000 to $149,999 | 14 (8.1%) | 54 (19.5%) |
| $150,000 or more | 13 (7.5%) | 56 (20.2%) |
| Total | 173 (100.0%) | 277 (100.0%) |
Property Value to Household Income Ratio in Byng
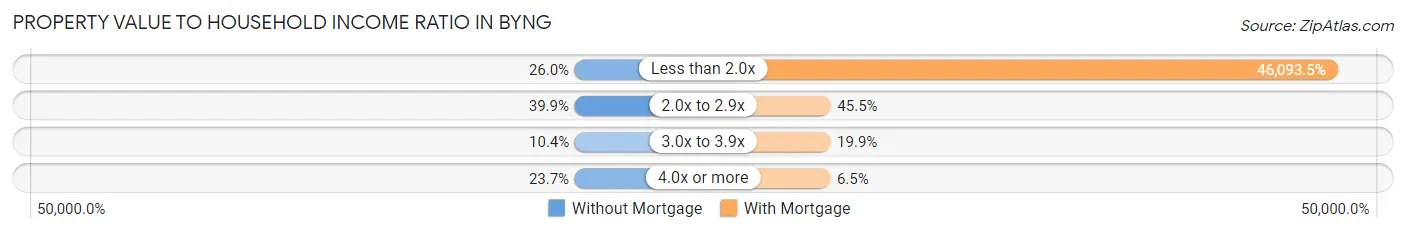
| Value-to-Income Ratio | Without Mortgage | With Mortgage |
| Less than 2.0x | 45 (26.0%) | 127,679 (46,093.5%) |
| 2.0x to 2.9x | 69 (39.9%) | 126 (45.5%) |
| 3.0x to 3.9x | 18 (10.4%) | 55 (19.9%) |
| 4.0x or more | 41 (23.7%) | 18 (6.5%) |
| Total | 173 (100.0%) | 277 (100.0%) |
Real Estate Taxes by Mortgage Status in Byng
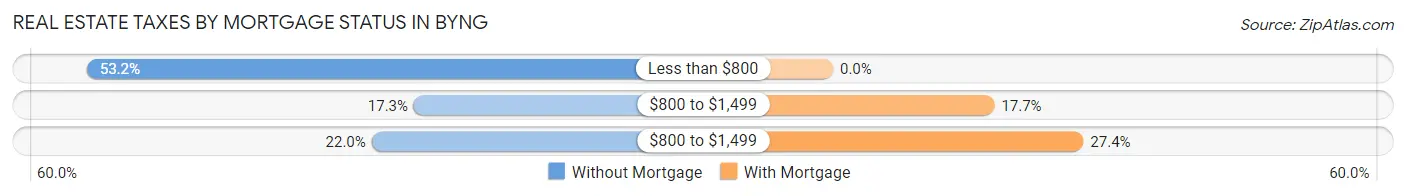
| Property Taxes | Without Mortgage | With Mortgage |
| Less than $800 | 92 (53.2%) | 0 (0.0%) |
| $800 to $1,499 | 30 (17.3%) | 49 (17.7%) |
| $800 to $1,499 | 38 (22.0%) | 76 (27.4%) |
| Total | 173 (100.0%) | 277 (100.0%) |
Health & Disability in Byng
Health Insurance Coverage by Age in Byng
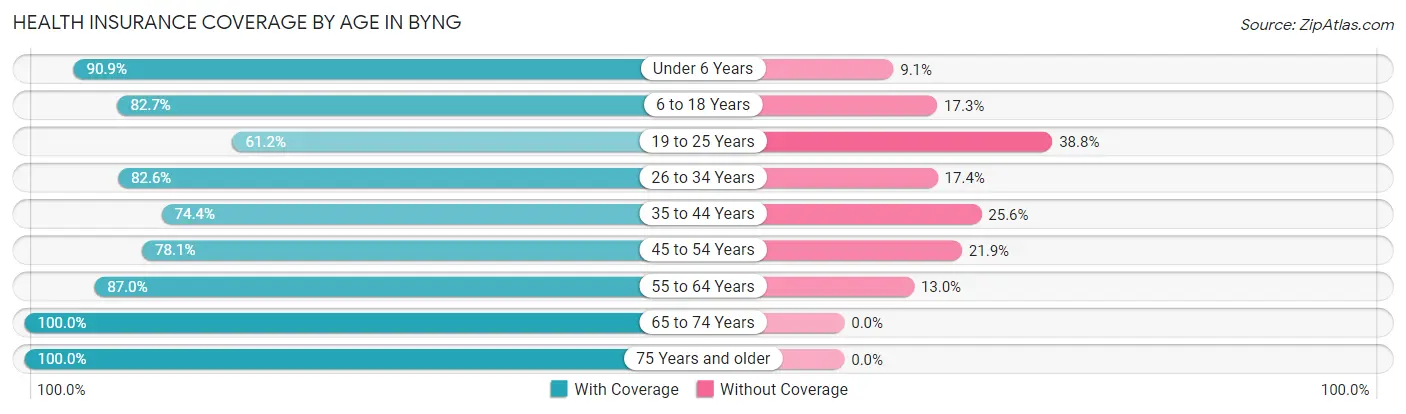
| Age Bracket | With Coverage | Without Coverage |
| Under 6 Years | 179 (90.9%) | 18 (9.1%) |
| 6 to 18 Years | 210 (82.7%) | 44 (17.3%) |
| 19 to 25 Years | 30 (61.2%) | 19 (38.8%) |
| 26 to 34 Years | 261 (82.6%) | 55 (17.4%) |
| 35 to 44 Years | 134 (74.4%) | 46 (25.6%) |
| 45 to 54 Years | 89 (78.1%) | 25 (21.9%) |
| 55 to 64 Years | 134 (87.0%) | 20 (13.0%) |
| 65 to 74 Years | 116 (100.0%) | 0 (0.0%) |
| 75 Years and older | 93 (100.0%) | 0 (0.0%) |
| Total | 1,246 (84.6%) | 227 (15.4%) |
Health Insurance Coverage by Citizenship Status in Byng
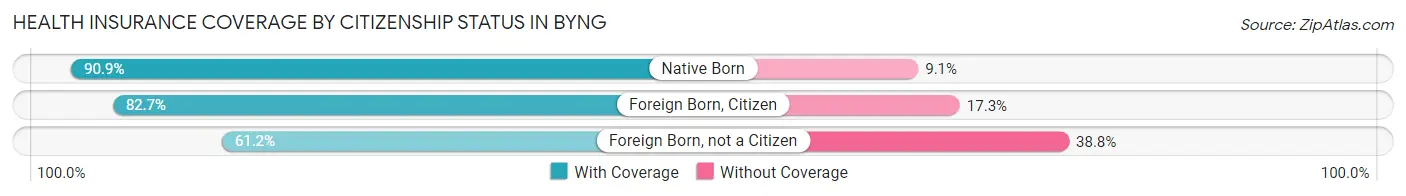
| Citizenship Status | With Coverage | Without Coverage |
| Native Born | 179 (90.9%) | 18 (9.1%) |
| Foreign Born, Citizen | 210 (82.7%) | 44 (17.3%) |
| Foreign Born, not a Citizen | 30 (61.2%) | 19 (38.8%) |
Health Insurance Coverage by Household Income in Byng
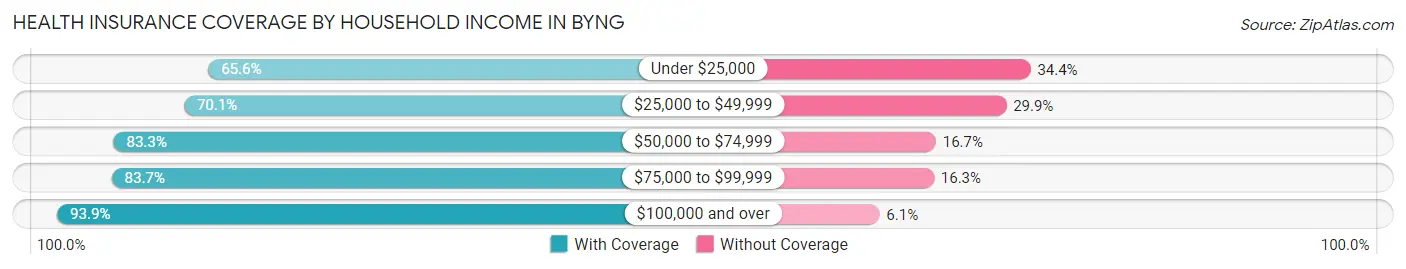
| Household Income | With Coverage | Without Coverage |
| Under $25,000 | 61 (65.6%) | 32 (34.4%) |
| $25,000 to $49,999 | 195 (70.1%) | 83 (29.9%) |
| $50,000 to $74,999 | 165 (83.3%) | 33 (16.7%) |
| $75,000 to $99,999 | 195 (83.7%) | 38 (16.3%) |
| $100,000 and over | 630 (93.9%) | 41 (6.1%) |
Public vs Private Health Insurance Coverage by Age in Byng
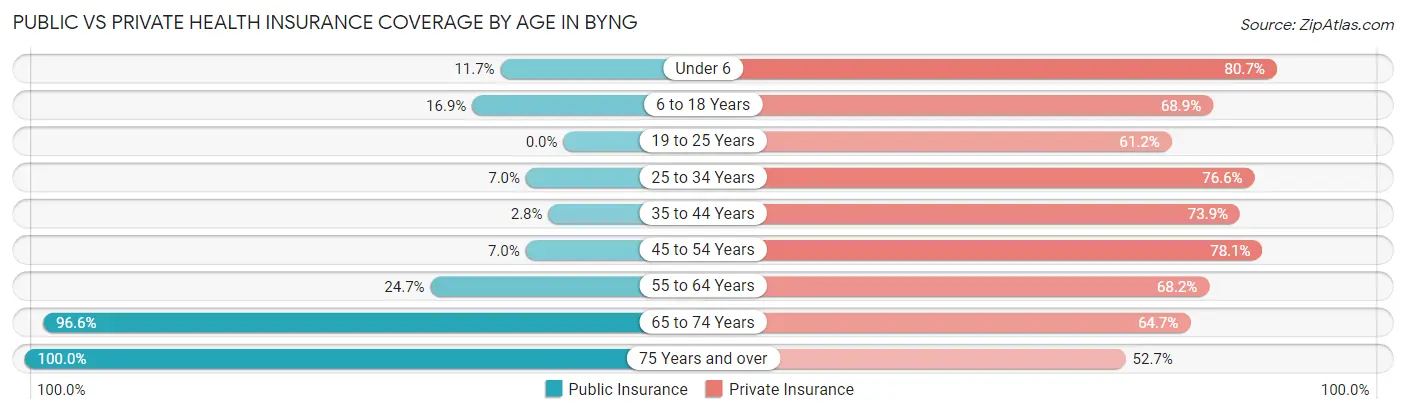
| Age Bracket | Public Insurance | Private Insurance |
| Under 6 | 23 (11.7%) | 159 (80.7%) |
| 6 to 18 Years | 43 (16.9%) | 175 (68.9%) |
| 19 to 25 Years | 0 (0.0%) | 30 (61.2%) |
| 25 to 34 Years | 22 (7.0%) | 242 (76.6%) |
| 35 to 44 Years | 5 (2.8%) | 133 (73.9%) |
| 45 to 54 Years | 8 (7.0%) | 89 (78.1%) |
| 55 to 64 Years | 38 (24.7%) | 105 (68.2%) |
| 65 to 74 Years | 112 (96.6%) | 75 (64.7%) |
| 75 Years and over | 93 (100.0%) | 49 (52.7%) |
| Total | 344 (23.4%) | 1,057 (71.8%) |
Disability Status by Sex by Age in Byng
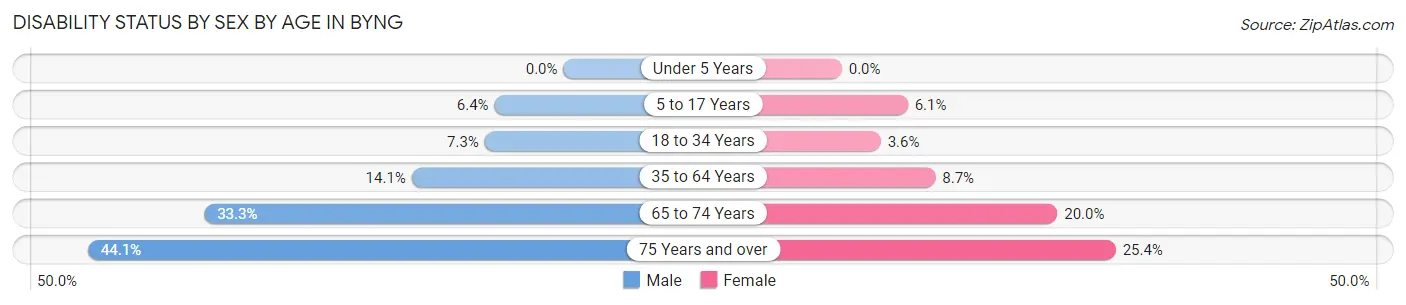
| Age Bracket | Male | Female |
| Under 5 Years | 0 (0.0%) | 0 (0.0%) |
| 5 to 17 Years | 8 (6.4%) | 9 (6.1%) |
| 18 to 34 Years | 13 (7.3%) | 7 (3.6%) |
| 35 to 64 Years | 29 (14.1%) | 21 (8.7%) |
| 65 to 74 Years | 22 (33.3%) | 10 (20.0%) |
| 75 Years and over | 15 (44.1%) | 15 (25.4%) |
Disability Class by Sex by Age in Byng
Disability Class: Hearing Difficulty
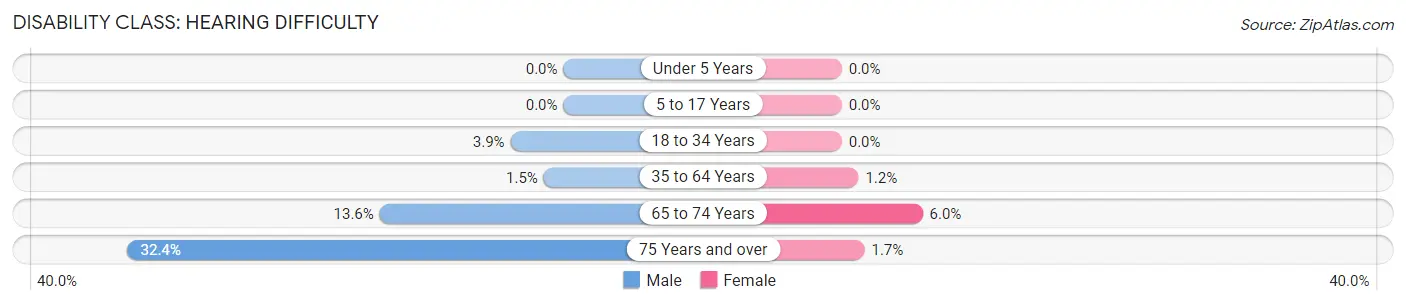
| Age Bracket | Male | Female |
| Under 5 Years | 0 (0.0%) | 0 (0.0%) |
| 5 to 17 Years | 0 (0.0%) | 0 (0.0%) |
| 18 to 34 Years | 7 (3.9%) | 0 (0.0%) |
| 35 to 64 Years | 3 (1.5%) | 3 (1.2%) |
| 65 to 74 Years | 9 (13.6%) | 3 (6.0%) |
| 75 Years and over | 11 (32.4%) | 1 (1.7%) |
Disability Class: Vision Difficulty
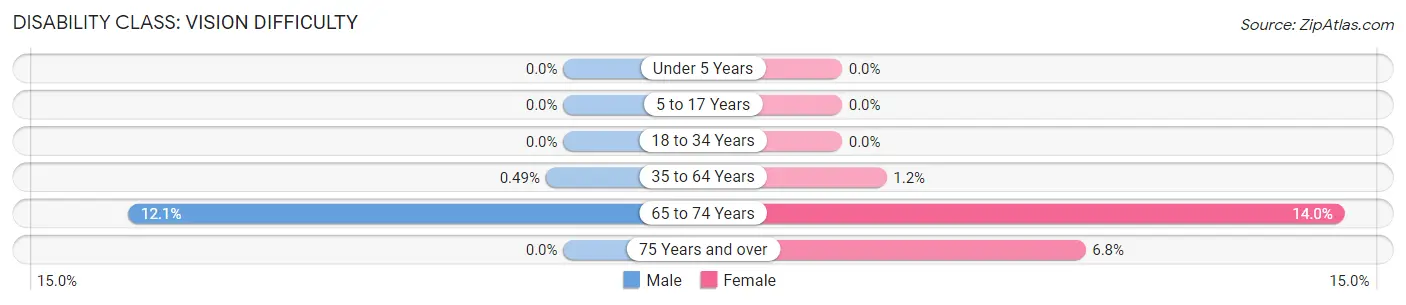
| Age Bracket | Male | Female |
| Under 5 Years | 0 (0.0%) | 0 (0.0%) |
| 5 to 17 Years | 0 (0.0%) | 0 (0.0%) |
| 18 to 34 Years | 0 (0.0%) | 0 (0.0%) |
| 35 to 64 Years | 1 (0.5%) | 3 (1.2%) |
| 65 to 74 Years | 8 (12.1%) | 7 (14.0%) |
| 75 Years and over | 0 (0.0%) | 4 (6.8%) |
Disability Class: Cognitive Difficulty
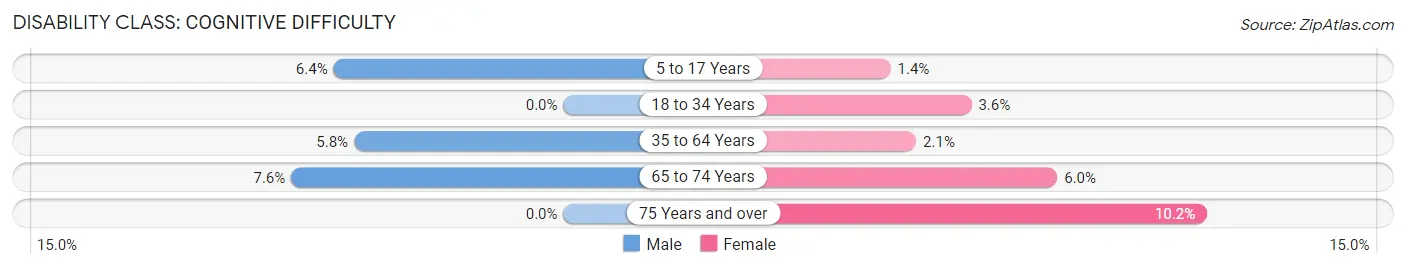
| Age Bracket | Male | Female |
| 5 to 17 Years | 8 (6.4%) | 2 (1.4%) |
| 18 to 34 Years | 0 (0.0%) | 7 (3.6%) |
| 35 to 64 Years | 12 (5.8%) | 5 (2.1%) |
| 65 to 74 Years | 5 (7.6%) | 3 (6.0%) |
| 75 Years and over | 0 (0.0%) | 6 (10.2%) |
Disability Class: Ambulatory Difficulty
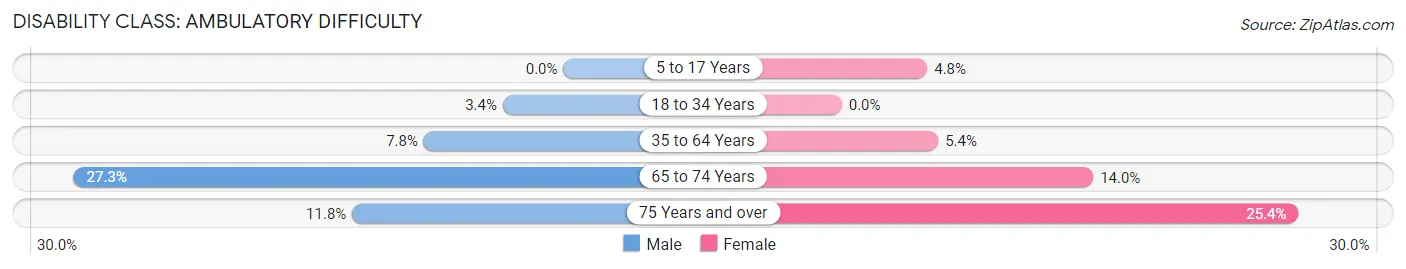
| Age Bracket | Male | Female |
| 5 to 17 Years | 0 (0.0%) | 7 (4.8%) |
| 18 to 34 Years | 6 (3.4%) | 0 (0.0%) |
| 35 to 64 Years | 16 (7.8%) | 13 (5.4%) |
| 65 to 74 Years | 18 (27.3%) | 7 (14.0%) |
| 75 Years and over | 4 (11.8%) | 15 (25.4%) |
Disability Class: Self-Care Difficulty
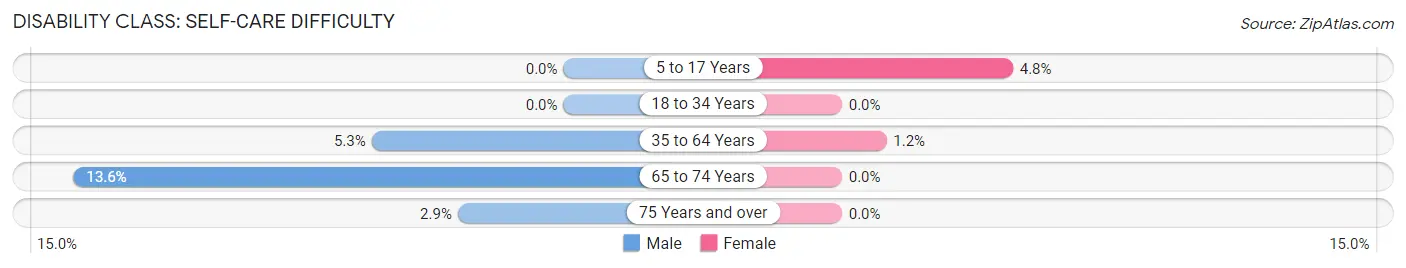
| Age Bracket | Male | Female |
| 5 to 17 Years | 0 (0.0%) | 7 (4.8%) |
| 18 to 34 Years | 0 (0.0%) | 0 (0.0%) |
| 35 to 64 Years | 11 (5.3%) | 3 (1.2%) |
| 65 to 74 Years | 9 (13.6%) | 0 (0.0%) |
| 75 Years and over | 1 (2.9%) | 0 (0.0%) |
Technology Access in Byng
Computing Device Access in Byng
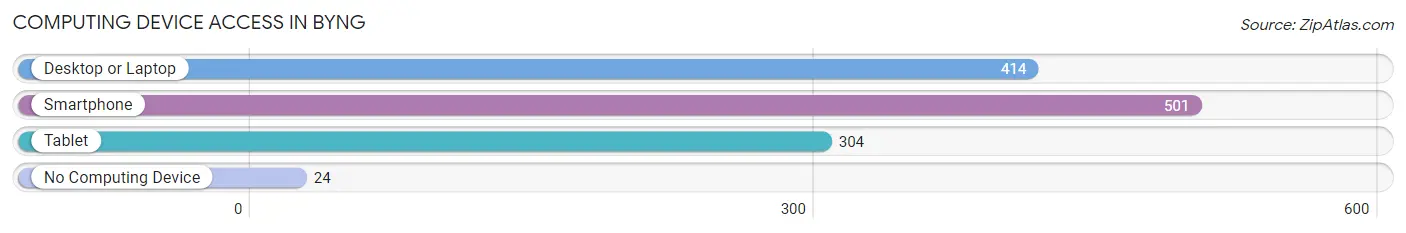
| Device Type | # Households | % Households |
| Desktop or Laptop | 414 | 77.7% |
| Smartphone | 501 | 94.0% |
| Tablet | 304 | 57.0% |
| No Computing Device | 24 | 4.5% |
| Total | 533 | 100.0% |
Internet Access in Byng
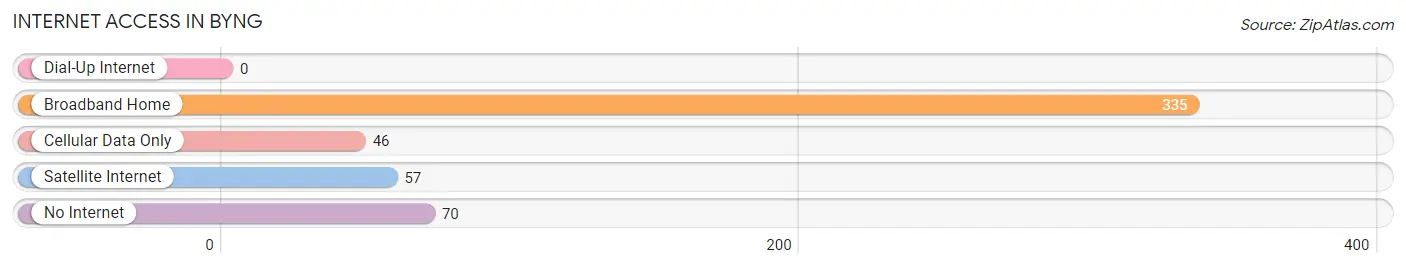
| Internet Type | # Households | % Households |
| Dial-Up Internet | 0 | 0.0% |
| Broadband Home | 335 | 62.8% |
| Cellular Data Only | 46 | 8.6% |
| Satellite Internet | 57 | 10.7% |
| No Internet | 70 | 13.1% |
| Total | 533 | 100.0% |
Byng Summary
Byng is a small town located in southeastern Oklahoma, in the county of Pontotoc. It is situated on the banks of the Clear Boggy Creek, and is approximately twenty-five miles south of Ada, the county seat. The town was founded in 1891 and was named after the British Admiral, George Byng.
Geography
Byng is located in the foothills of the Arbuckle Mountains, and is surrounded by rolling hills and wooded areas. The town is situated at an elevation of 690 feet above sea level. The climate is mild and humid, with an average annual temperature of 64 degrees Fahrenheit. The average annual precipitation is 44 inches.
Economy
Byng’s economy is largely based on agriculture. The town is home to several farms, which produce a variety of crops, including cotton, corn, soybeans, and wheat. The town also has a small manufacturing sector, which produces a variety of products, including furniture, clothing, and automotive parts.
Demographics
As of the 2010 census, the population of Byng was 1,092. The racial makeup of the town was 94.3% White, 0.7% African American, 0.3% Native American, 0.2% Asian, 0.1% Pacific Islander, and 4.4% from other races. The median household income was $30,938, and the median family income was $37,813.
Education
Byng is served by the Byng Public School District, which consists of one elementary school, one middle school, and one high school. The district also operates a vocational-technical center, which offers courses in a variety of trades. The town is also home to a branch of the Pontotoc Technology Center, which provides adult education and job training.
Conclusion
Byng is a small town located in southeastern Oklahoma, with a population of 1,092 as of the 2010 census. The town’s economy is largely based on agriculture, and it is served by the Byng Public School District. The town is situated in the foothills of the Arbuckle Mountains, and has a mild and humid climate.
Common Questions
What is Per Capita Income in Byng?
Per Capita income in Byng is $34,215.
What is the Median Family Income in Byng?
Median Family Income in Byng is $99,375.
What is the Median Household income in Byng?
Median Household Income in Byng is $83,661.
What is Income or Wage Gap in Byng?
Income or Wage Gap in Byng is 1.2%.
Women in Byng earn 98.8 cents for every dollar earned by a man.
What is Family Income Deficit in Byng?
Family Income Deficit in Byng is $10,780.
Families that are below poverty line in Byng earn $10,780 less on average than the poverty threshold level.
What is Inequality or Gini Index in Byng?
Inequality or Gini Index in Byng is 0.36.
What is the Total Population of Byng?
Total Population of Byng is 1,473.
What is the Total Male Population of Byng?
Total Male Population of Byng is 717.
What is the Total Female Population of Byng?
Total Female Population of Byng is 756.
What is the Ratio of Males per 100 Females in Byng?
There are 94.84 Males per 100 Females in Byng.
What is the Ratio of Females per 100 Males in Byng?
There are 105.44 Females per 100 Males in Byng.
What is the Median Population Age in Byng?
Median Population Age in Byng is 33.1 Years.
What is the Average Family Size in Byng
Average Family Size in Byng is 3.2 People.
What is the Average Household Size in Byng
Average Household Size in Byng is 2.8 People.
How Large is the Labor Force in Byng?
There are 716 People in the Labor Forcein in Byng.
What is the Percentage of People in the Labor Force in Byng?
67.3% of People are in the Labor Force in Byng.
What is the Unemployment Rate in Byng?
Unemployment Rate in Byng is 4.9%.