Ada, OK Map & Demographics
Ada Map
Ada Overview
$27,159
PER CAPITA INCOME
$64,075
AVG FAMILY INCOME
$47,264
AVG HOUSEHOLD INCOME
17.1%
WAGE / INCOME GAP [ % ]
82.9¢/ $1
WAGE / INCOME GAP [ $ ]
$9,901
FAMILY INCOME DEFICIT
0.47
INEQUALITY / GINI INDEX
16,537
TOTAL POPULATION
7,821
MALE POPULATION
8,716
FEMALE POPULATION
89.73
MALES / 100 FEMALES
111.44
FEMALES / 100 MALES
32.4
MEDIAN AGE
3.1
AVG FAMILY SIZE
2.4
AVG HOUSEHOLD SIZE
7,711
LABOR FORCE [ PEOPLE ]
59.8%
PERCENT IN LABOR FORCE
4.8%
UNEMPLOYMENT RATE
Ada Zip Codes
Ada Area Codes
Income in Ada
Income Overview in Ada
Per Capita Income in Ada is $27,159, while median incomes of families and households are $64,075 and $47,264 respectively.
| Characteristic | Number | Measure |
| Per Capita Income | 16,537 | $27,159 |
| Median Family Income | 3,638 | $64,075 |
| Mean Family Income | 3,638 | $82,182 |
| Median Household Income | 6,530 | $47,264 |
| Mean Household Income | 6,530 | $66,719 |
| Income Deficit | 3,638 | $9,901 |
| Wage / Income Gap (%) | 16,537 | 17.06% |
| Wage / Income Gap ($) | 16,537 | 82.94¢ per $1 |
| Gini / Inequality Index | 16,537 | 0.47 |
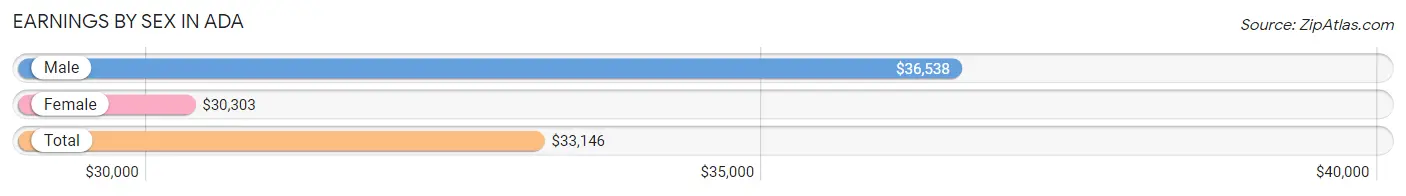
Earnings by Sex in Ada
Average Earnings in Ada are $33,146, $36,538 for men and $30,303 for women, a difference of 17.1%.
| Sex | Number | Average Earnings |
| Male | 4,148 (51.7%) | $36,538 |
| Female | 3,869 (48.3%) | $30,303 |
| Total | 8,017 (100.0%) | $33,146 |
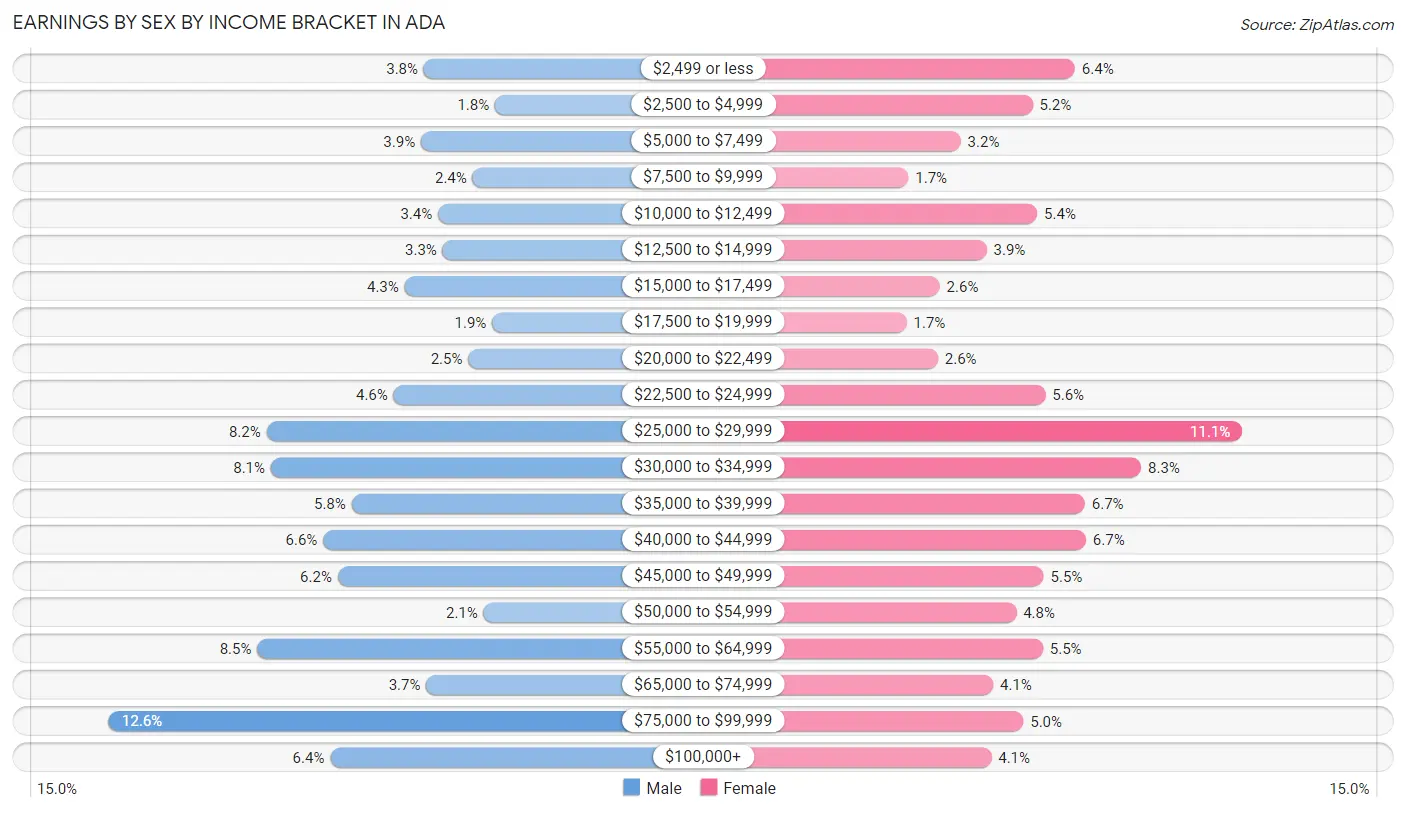
Earnings by Sex by Income Bracket in Ada
The most common earnings brackets in Ada are $75,000 to $99,999 for men (524 | 12.6%) and $25,000 to $29,999 for women (430 | 11.1%).
| Income | Male | Female |
| $2,499 or less | 157 (3.8%) | 248 (6.4%) |
| $2,500 to $4,999 | 74 (1.8%) | 202 (5.2%) |
| $5,000 to $7,499 | 160 (3.9%) | 124 (3.2%) |
| $7,500 to $9,999 | 100 (2.4%) | 67 (1.7%) |
| $10,000 to $12,499 | 140 (3.4%) | 207 (5.3%) |
| $12,500 to $14,999 | 135 (3.3%) | 152 (3.9%) |
| $15,000 to $17,499 | 179 (4.3%) | 101 (2.6%) |
| $17,500 to $19,999 | 77 (1.9%) | 65 (1.7%) |
| $20,000 to $22,499 | 105 (2.5%) | 99 (2.6%) |
| $22,500 to $24,999 | 192 (4.6%) | 216 (5.6%) |
| $25,000 to $29,999 | 340 (8.2%) | 430 (11.1%) |
| $30,000 to $34,999 | 335 (8.1%) | 320 (8.3%) |
| $35,000 to $39,999 | 241 (5.8%) | 259 (6.7%) |
| $40,000 to $44,999 | 274 (6.6%) | 260 (6.7%) |
| $45,000 to $49,999 | 257 (6.2%) | 214 (5.5%) |
| $50,000 to $54,999 | 87 (2.1%) | 184 (4.8%) |
| $55,000 to $64,999 | 351 (8.5%) | 213 (5.5%) |
| $65,000 to $74,999 | 154 (3.7%) | 159 (4.1%) |
| $75,000 to $99,999 | 524 (12.6%) | 192 (5.0%) |
| $100,000+ | 266 (6.4%) | 157 (4.1%) |
| Total | 4,148 (100.0%) | 3,869 (100.0%) |
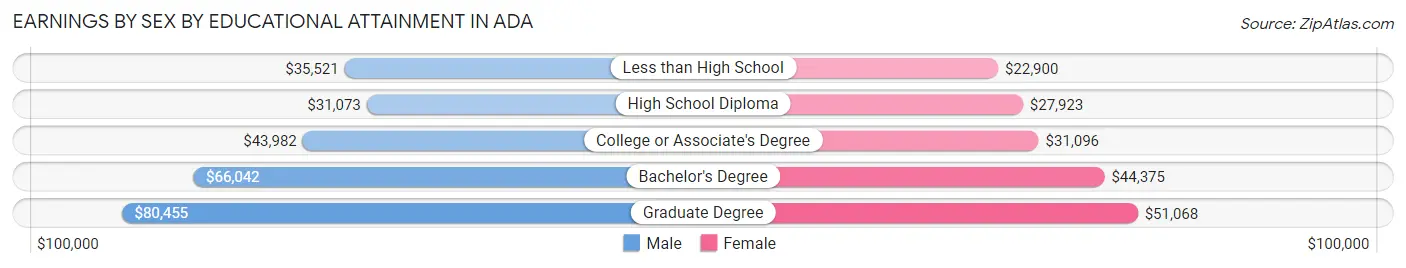
Earnings by Sex by Educational Attainment in Ada
Average earnings in Ada are $42,853 for men and $34,321 for women, a difference of 19.9%. Men with an educational attainment of graduate degree enjoy the highest average annual earnings of $80,455, while those with high school diploma education earn the least with $31,073. Women with an educational attainment of graduate degree earn the most with the average annual earnings of $51,068, while those with less than high school education have the smallest earnings of $22,900.
| Educational Attainment | Male Income | Female Income |
| Less than High School | $35,521 | $22,900 |
| High School Diploma | $31,073 | $27,923 |
| College or Associate's Degree | $43,982 | $31,096 |
| Bachelor's Degree | $66,042 | $44,375 |
| Graduate Degree | $80,455 | $51,068 |
| Total | $42,853 | $34,321 |
Family Income in Ada
Family Income Brackets in Ada
According to the Ada family income data, there are 684 families falling into the $50,000 to $74,999 income range, which is the most common income bracket and makes up 18.8% of all families. Conversely, the $10,000 to $14,999 income bracket is the least frequent group with only 135 families (3.7%) belonging to this category.
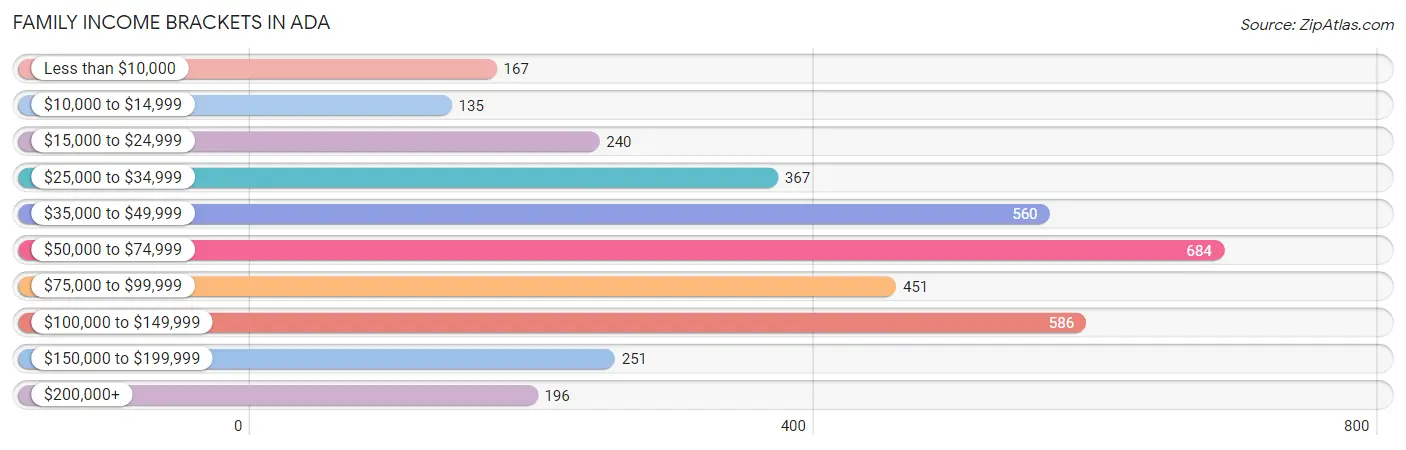
| Income Bracket | # Families | % Families |
| Less than $10,000 | 167 | 4.6% |
| $10,000 to $14,999 | 135 | 3.7% |
| $15,000 to $24,999 | 240 | 6.6% |
| $25,000 to $34,999 | 367 | 10.1% |
| $35,000 to $49,999 | 560 | 15.4% |
| $50,000 to $74,999 | 684 | 18.8% |
| $75,000 to $99,999 | 451 | 12.4% |
| $100,000 to $149,999 | 586 | 16.1% |
| $150,000 to $199,999 | 251 | 6.9% |
| $200,000+ | 196 | 5.4% |
Family Income by Famaliy Size in Ada
6-person families (95 | 2.6%) account for the highest median family income in Ada with $106,442 per family, while 2-person families (1,775 | 48.8%) have the highest median income of $26,996 per family member.
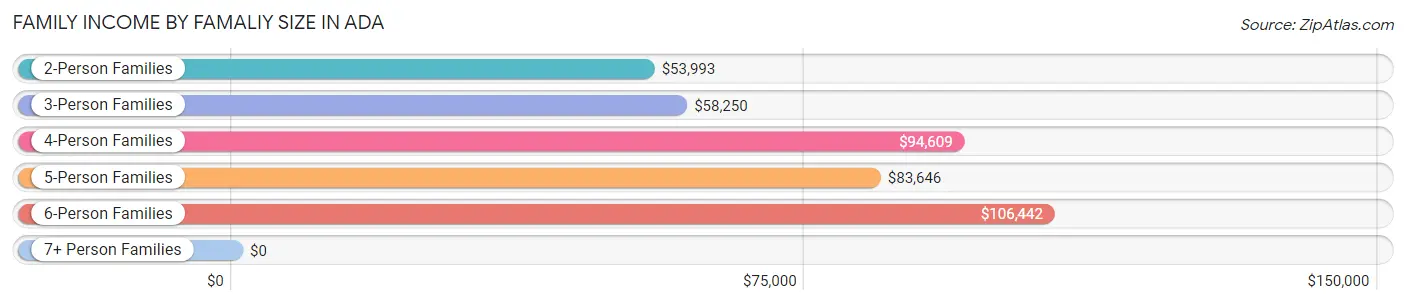
| Income Bracket | # Families | Median Income |
| 2-Person Families | 1,775 (48.8%) | $53,993 |
| 3-Person Families | 740 (20.3%) | $58,250 |
| 4-Person Families | 631 (17.3%) | $94,609 |
| 5-Person Families | 349 (9.6%) | $83,646 |
| 6-Person Families | 95 (2.6%) | $106,442 |
| 7+ Person Families | 48 (1.3%) | $0 |
| Total | 3,638 (100.0%) | $64,075 |
Family Income by Number of Earners in Ada
The median family income in Ada is $64,075, with families comprising 3+ earners (392) having the highest median family income of $122,361, while families with 1 earner (1,452) have the lowest median family income of $41,196, accounting for 10.8% and 39.9% of families, respectively.
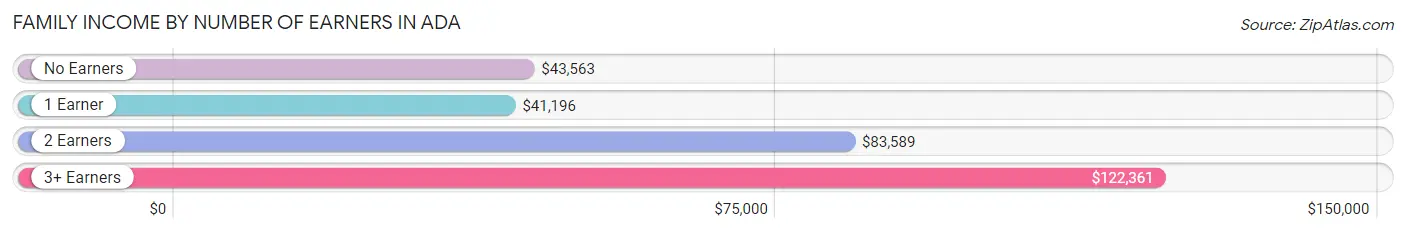
| Number of Earners | # Families | Median Income |
| No Earners | 495 (13.6%) | $43,563 |
| 1 Earner | 1,452 (39.9%) | $41,196 |
| 2 Earners | 1,299 (35.7%) | $83,589 |
| 3+ Earners | 392 (10.8%) | $122,361 |
| Total | 3,638 (100.0%) | $64,075 |
Household Income in Ada
Household Income Brackets in Ada
With 1,143 households falling in the category, the $50,000 to $74,999 income range is the most frequent in Ada, accounting for 17.5% of all households. In contrast, only 209 households (3.2%) fall into the $200,000+ income bracket, making it the least populous group.
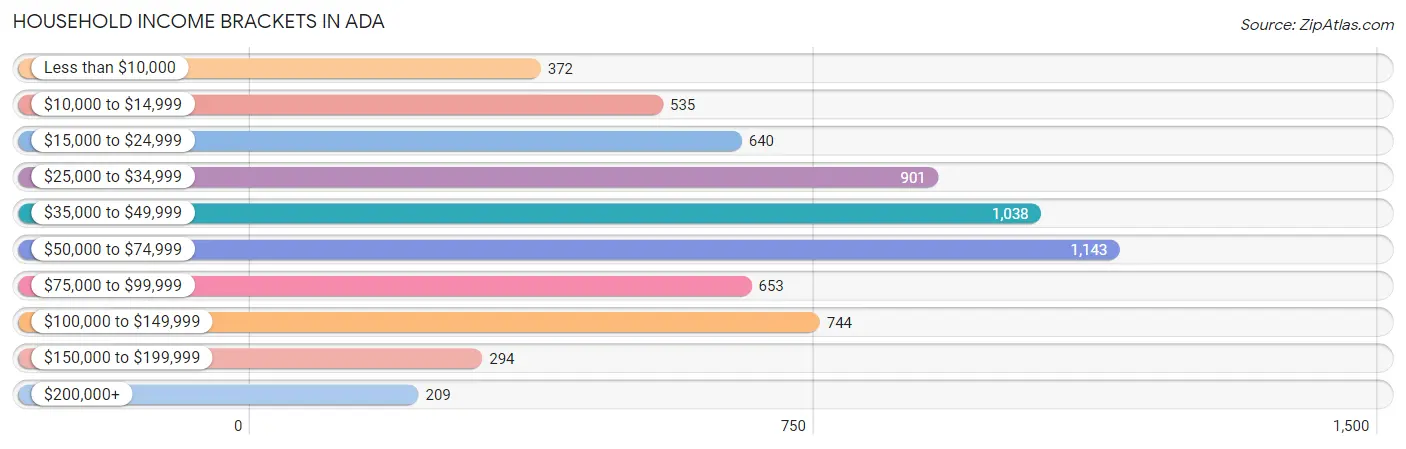
| Income Bracket | # Households | % Households |
| Less than $10,000 | 372 | 5.7% |
| $10,000 to $14,999 | 535 | 8.2% |
| $15,000 to $24,999 | 640 | 9.8% |
| $25,000 to $34,999 | 901 | 13.8% |
| $35,000 to $49,999 | 1,038 | 15.9% |
| $50,000 to $74,999 | 1,143 | 17.5% |
| $75,000 to $99,999 | 653 | 10.0% |
| $100,000 to $149,999 | 744 | 11.4% |
| $150,000 to $199,999 | 294 | 4.5% |
| $200,000+ | 209 | 3.2% |
Household Income by Householder Age in Ada
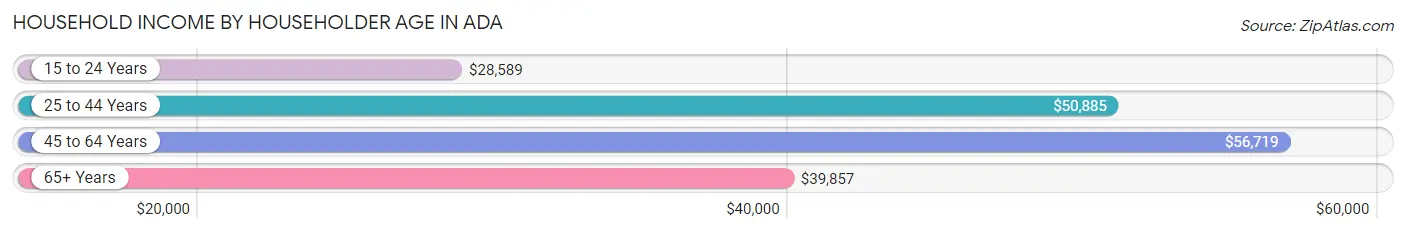
The median household income in Ada is $47,264, with the highest median household income of $56,719 found in the 45 to 64 years age bracket for the primary householder. A total of 1,935 households (29.6%) fall into this category. Meanwhile, the 15 to 24 years age bracket for the primary householder has the lowest median household income of $28,589, with 628 households (9.6%) in this group.
| Income Bracket | # Households | Median Income |
| 15 to 24 Years | 628 (9.6%) | $28,589 |
| 25 to 44 Years | 2,351 (36.0%) | $50,885 |
| 45 to 64 Years | 1,935 (29.6%) | $56,719 |
| 65+ Years | 1,616 (24.7%) | $39,857 |
| Total | 6,530 (100.0%) | $47,264 |
Poverty in Ada
Income Below Poverty by Sex and Age in Ada
With 17.8% poverty level for males and 19.0% for females among the residents of Ada, under 5 year old males and 18 to 24 year old females are the most vulnerable to poverty, with 209 males (36.6%) and 309 females (38.7%) in their respective age groups living below the poverty level.
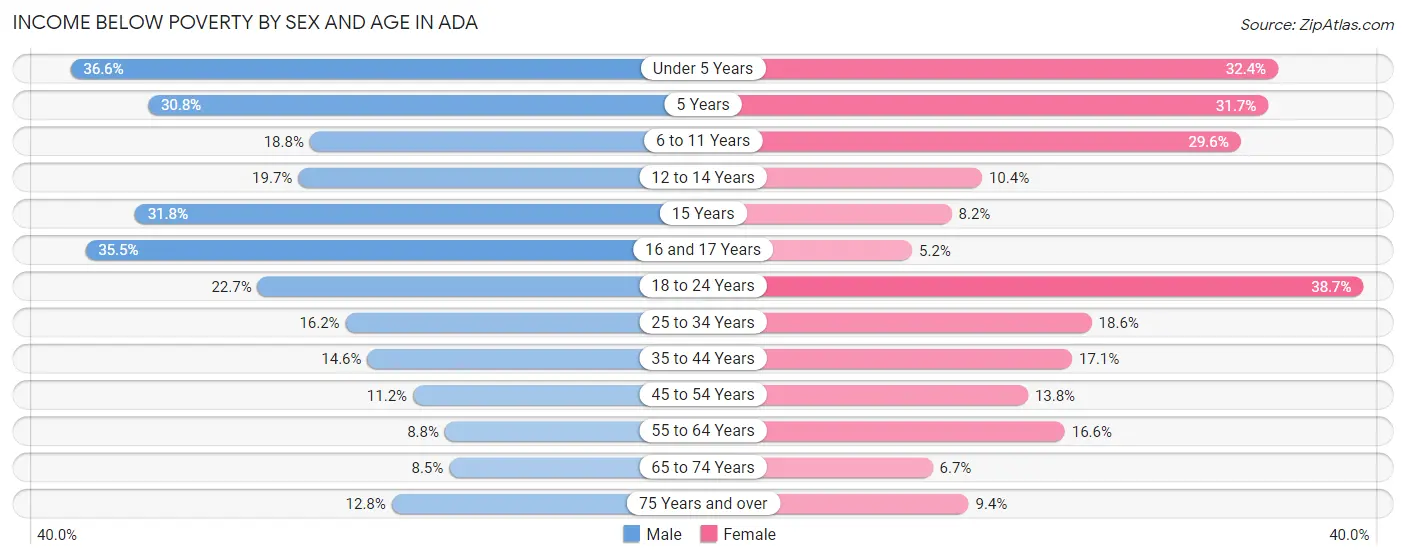
| Age Bracket | Male | Female |
| Under 5 Years | 209 (36.6%) | 170 (32.4%) |
| 5 Years | 33 (30.8%) | 25 (31.7%) |
| 6 to 11 Years | 119 (18.8%) | 214 (29.6%) |
| 12 to 14 Years | 77 (19.7%) | 38 (10.4%) |
| 15 Years | 28 (31.8%) | 11 (8.2%) |
| 16 and 17 Years | 60 (35.5%) | 12 (5.2%) |
| 18 to 24 Years | 208 (22.7%) | 309 (38.7%) |
| 25 to 34 Years | 196 (16.2%) | 228 (18.5%) |
| 35 to 44 Years | 139 (14.5%) | 177 (17.1%) |
| 45 to 54 Years | 87 (11.2%) | 123 (13.8%) |
| 55 to 64 Years | 60 (8.8%) | 131 (16.6%) |
| 65 to 74 Years | 42 (8.5%) | 51 (6.7%) |
| 75 Years and over | 39 (12.8%) | 51 (9.4%) |
| Total | 1,297 (17.8%) | 1,540 (19.0%) |
Income Above Poverty by Sex and Age in Ada
According to the poverty statistics in Ada, males aged 65 to 74 years and females aged 16 and 17 years are the age groups that are most secure financially, with 91.5% of males and 94.8% of females in these age groups living above the poverty line.
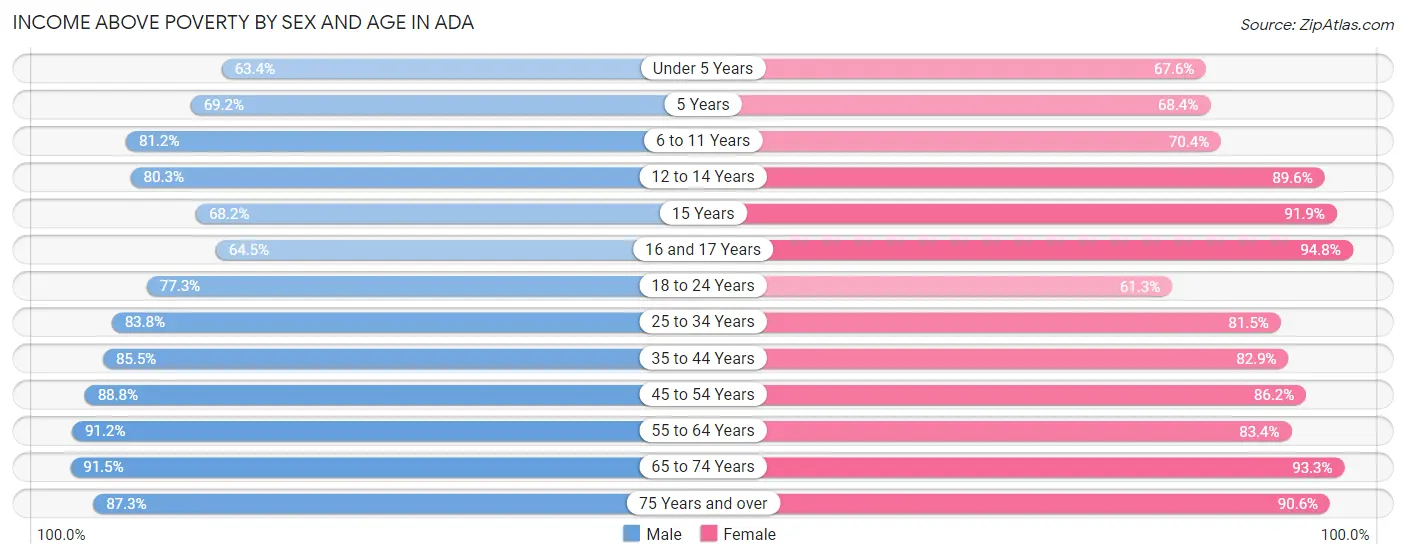
| Age Bracket | Male | Female |
| Under 5 Years | 362 (63.4%) | 355 (67.6%) |
| 5 Years | 74 (69.2%) | 54 (68.3%) |
| 6 to 11 Years | 513 (81.2%) | 509 (70.4%) |
| 12 to 14 Years | 314 (80.3%) | 327 (89.6%) |
| 15 Years | 60 (68.2%) | 124 (91.8%) |
| 16 and 17 Years | 109 (64.5%) | 218 (94.8%) |
| 18 to 24 Years | 708 (77.3%) | 489 (61.3%) |
| 25 to 34 Years | 1,015 (83.8%) | 1,001 (81.5%) |
| 35 to 44 Years | 816 (85.5%) | 858 (82.9%) |
| 45 to 54 Years | 692 (88.8%) | 767 (86.2%) |
| 55 to 64 Years | 622 (91.2%) | 660 (83.4%) |
| 65 to 74 Years | 453 (91.5%) | 706 (93.3%) |
| 75 Years and over | 267 (87.3%) | 491 (90.6%) |
| Total | 6,005 (82.2%) | 6,559 (81.0%) |
Income Below Poverty Among Married-Couple Families in Ada
The poverty statistics for married-couple families in Ada show that 4.4% or 95 of the total 2,176 families live below the poverty line. Families with 5 or more children have the highest poverty rate of 100.0%, comprising of 11 families. On the other hand, families with no children have the lowest poverty rate of 2.2%, which includes 27 families.
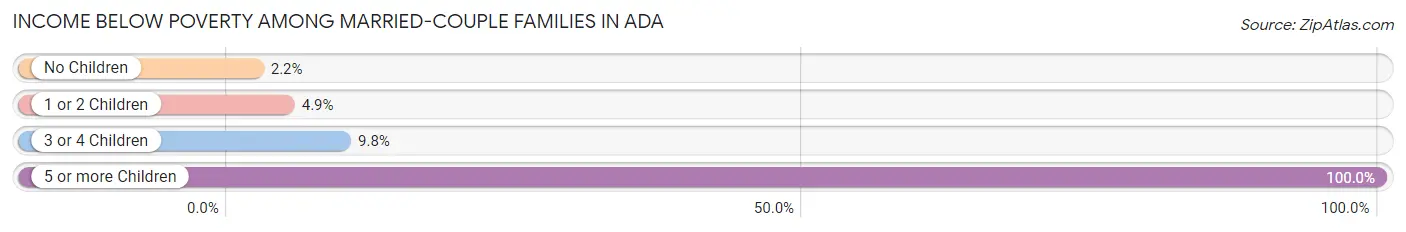
| Children | Above Poverty | Below Poverty |
| No Children | 1,176 (97.8%) | 27 (2.2%) |
| 1 or 2 Children | 731 (95.1%) | 38 (4.9%) |
| 3 or 4 Children | 174 (90.2%) | 19 (9.8%) |
| 5 or more Children | 0 (0.0%) | 11 (100.0%) |
| Total | 2,081 (95.6%) | 95 (4.4%) |
Income Below Poverty Among Single-Parent Households in Ada
According to the poverty data in Ada, 22.6% or 116 single-father households and 31.4% or 298 single-mother households are living below the poverty line. Among single-father households, those with 3 or 4 children have the highest poverty rate, with 35 households (47.9%) experiencing poverty. Likewise, among single-mother households, those with 5 or more children have the highest poverty rate, with 19 households (57.6%) falling below the poverty line.
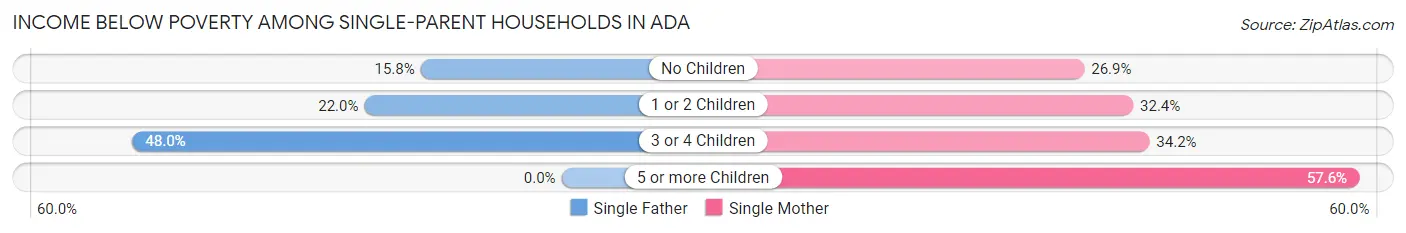
| Children | Single Father | Single Mother |
| No Children | 40 (15.8%) | 96 (26.9%) |
| 1 or 2 Children | 41 (22.0%) | 142 (32.4%) |
| 3 or 4 Children | 35 (47.9%) | 41 (34.2%) |
| 5 or more Children | 0 (0.0%) | 19 (57.6%) |
| Total | 116 (22.6%) | 298 (31.4%) |
Income Below Poverty Among Married-Couple vs Single-Parent Households in Ada
The poverty data for Ada shows that 95 of the married-couple family households (4.4%) and 414 of the single-parent households (28.3%) are living below the poverty level. Within the married-couple family households, those with 5 or more children have the highest poverty rate, with 11 households (100.0%) falling below the poverty line. Among the single-parent households, those with 5 or more children have the highest poverty rate, with 19 household (57.6%) living below poverty.
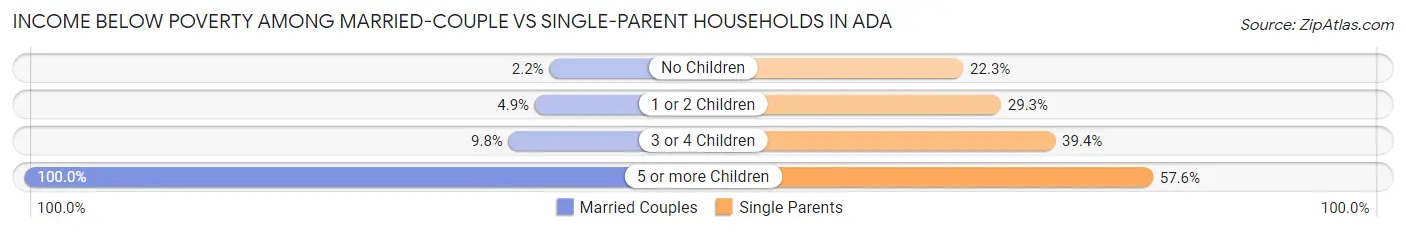
| Children | Married-Couple Families | Single-Parent Households |
| No Children | 27 (2.2%) | 136 (22.3%) |
| 1 or 2 Children | 38 (4.9%) | 183 (29.3%) |
| 3 or 4 Children | 19 (9.8%) | 76 (39.4%) |
| 5 or more Children | 11 (100.0%) | 19 (57.6%) |
| Total | 95 (4.4%) | 414 (28.3%) |
Race in Ada
The most populous races in Ada are White / Caucasian (10,007 | 60.5%), Native / Alaskan (3,031 | 18.3%), and Two or more Races (2,256 | 13.6%).
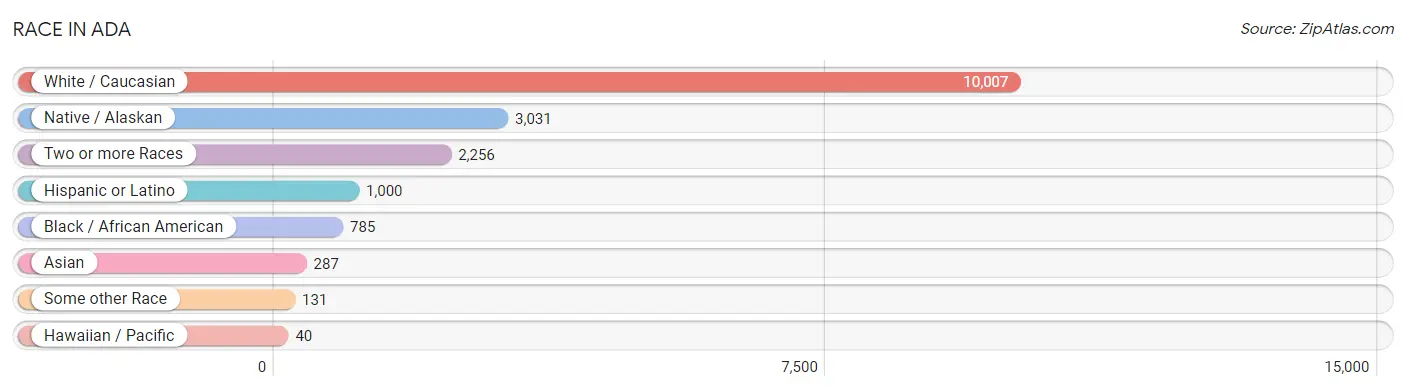
| Race | # Population | % Population |
| Asian | 287 | 1.7% |
| Black / African American | 785 | 4.8% |
| Hawaiian / Pacific | 40 | 0.2% |
| Hispanic or Latino | 1,000 | 6.0% |
| Native / Alaskan | 3,031 | 18.3% |
| White / Caucasian | 10,007 | 60.5% |
| Two or more Races | 2,256 | 13.6% |
| Some other Race | 131 | 0.8% |
| Total | 16,537 | 100.0% |
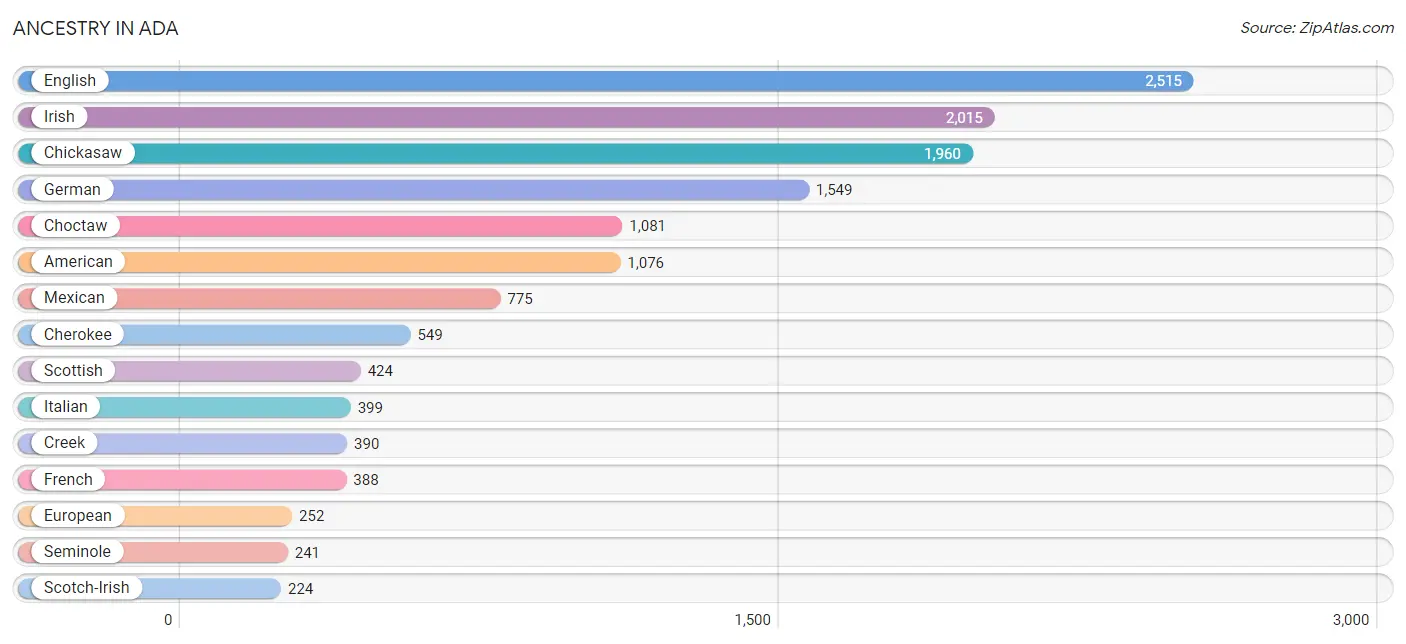
Ancestry in Ada
The most populous ancestries reported in Ada are English (2,515 | 15.2%), Irish (2,015 | 12.2%), Chickasaw (1,960 | 11.8%), German (1,549 | 9.4%), and Choctaw (1,081 | 6.5%), together accounting for 55.1% of all Ada residents.
| Ancestry | # Population | % Population |
| African | 122 | 0.7% |
| Alaska Native | 10 | 0.1% |
| American | 1,076 | 6.5% |
| Apache | 8 | 0.1% |
| Arab | 43 | 0.3% |
| Australian | 11 | 0.1% |
| Austrian | 21 | 0.1% |
| British | 116 | 0.7% |
| British West Indian | 10 | 0.1% |
| Burmese | 20 | 0.1% |
| Central American | 1 | 0.0% |
| Cherokee | 549 | 3.3% |
| Cheyenne | 62 | 0.4% |
| Chickasaw | 1,960 | 11.8% |
| Choctaw | 1,081 | 6.5% |
| Costa Rican | 1 | 0.0% |
| Creek | 390 | 2.4% |
| Czech | 11 | 0.1% |
| Czechoslovakian | 16 | 0.1% |
| Danish | 34 | 0.2% |
| Delaware | 30 | 0.2% |
| Dutch | 50 | 0.3% |
| Dutch West Indian | 40 | 0.2% |
| Eastern European | 4 | 0.0% |
| Ecuadorian | 55 | 0.3% |
| Egyptian | 43 | 0.3% |
| English | 2,515 | 15.2% |
| European | 252 | 1.5% |
| Finnish | 4 | 0.0% |
| French | 388 | 2.4% |
| French Canadian | 10 | 0.1% |
| German | 1,549 | 9.4% |
| Hungarian | 7 | 0.0% |
| Indian (Asian) | 81 | 0.5% |
| Irish | 2,015 | 12.2% |
| Iroquois | 7 | 0.0% |
| Italian | 399 | 2.4% |
| Kenyan | 4 | 0.0% |
| Kiowa | 57 | 0.3% |
| Korean | 135 | 0.8% |
| Malaysian | 15 | 0.1% |
| Mexican | 775 | 4.7% |
| Mexican American Indian | 1 | 0.0% |
| Native Hawaiian | 40 | 0.2% |
| Norwegian | 50 | 0.3% |
| Pakistani | 10 | 0.1% |
| Polish | 52 | 0.3% |
| Portuguese | 29 | 0.2% |
| Potawatomi | 59 | 0.4% |
| Pueblo | 13 | 0.1% |
| Russian | 9 | 0.1% |
| Scandinavian | 99 | 0.6% |
| Scotch-Irish | 224 | 1.3% |
| Scottish | 424 | 2.6% |
| Seminole | 241 | 1.5% |
| Shoshone | 34 | 0.2% |
| Slavic | 9 | 0.1% |
| South American | 55 | 0.3% |
| Spaniard | 48 | 0.3% |
| Spanish | 33 | 0.2% |
| Sri Lankan | 76 | 0.5% |
| Subsaharan African | 126 | 0.8% |
| Swedish | 62 | 0.4% |
| Swiss | 35 | 0.2% |
| Thai | 31 | 0.2% |
| Turkish | 77 | 0.5% |
| Welsh | 73 | 0.4% | View All 67 Rows |
Immigrants in Ada
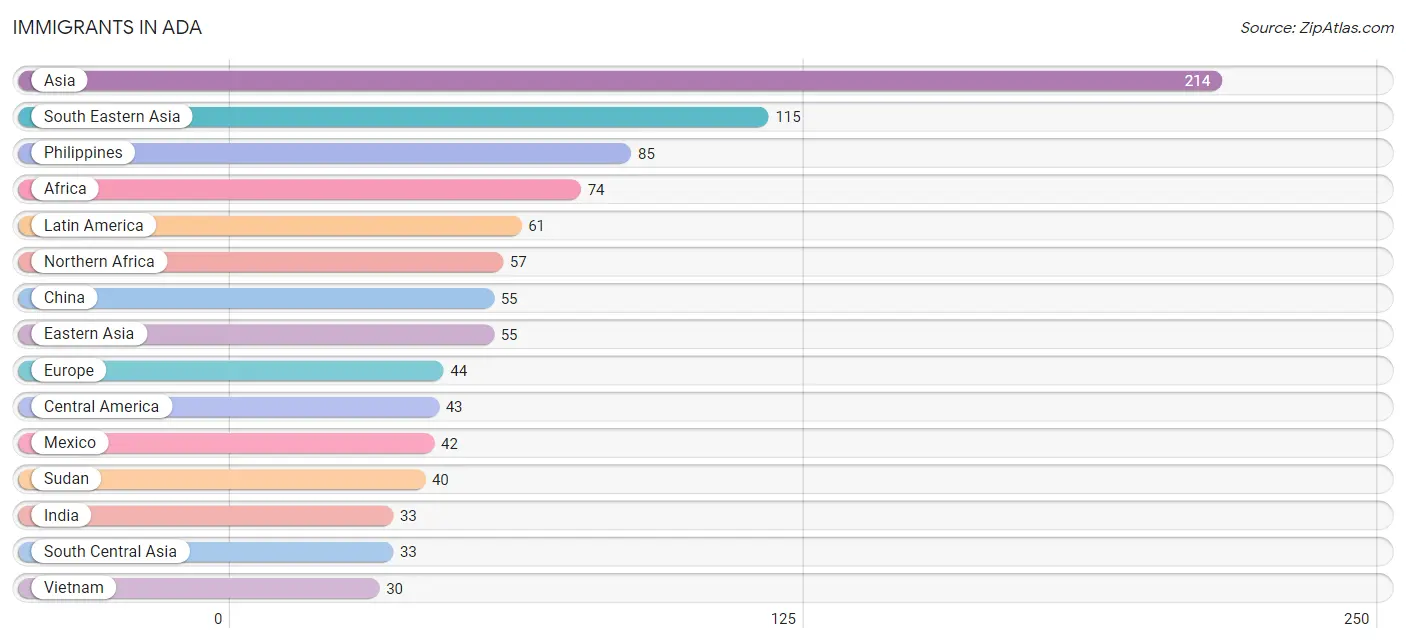
The most numerous immigrant groups reported in Ada came from Asia (214 | 1.3%), South Eastern Asia (115 | 0.7%), Philippines (85 | 0.5%), Africa (74 | 0.4%), and Latin America (61 | 0.4%), together accounting for 3.3% of all Ada residents.
| Immigration Origin | # Population | % Population |
| Africa | 74 | 0.4% |
| Asia | 214 | 1.3% |
| Australia | 15 | 0.1% |
| Canada | 11 | 0.1% |
| Caribbean | 10 | 0.1% |
| Central America | 43 | 0.3% |
| China | 55 | 0.3% |
| Costa Rica | 1 | 0.0% |
| Eastern Africa | 17 | 0.1% |
| Eastern Asia | 55 | 0.3% |
| Eastern Europe | 10 | 0.1% |
| Ecuador | 8 | 0.1% |
| Egypt | 17 | 0.1% |
| Europe | 44 | 0.3% |
| Germany | 19 | 0.1% |
| India | 33 | 0.2% |
| Kenya | 17 | 0.1% |
| Latin America | 61 | 0.4% |
| Mexico | 42 | 0.3% |
| Northern Africa | 57 | 0.3% |
| Northern Europe | 15 | 0.1% |
| Norway | 6 | 0.0% |
| Oceania | 15 | 0.1% |
| Philippines | 85 | 0.5% |
| Poland | 10 | 0.1% |
| South America | 8 | 0.1% |
| South Central Asia | 33 | 0.2% |
| South Eastern Asia | 115 | 0.7% |
| Sudan | 40 | 0.2% |
| Turkey | 11 | 0.1% |
| Vietnam | 30 | 0.2% |
| Western Asia | 11 | 0.1% |
| Western Europe | 19 | 0.1% | View All 33 Rows |
Sex and Age in Ada
Sex and Age in Ada
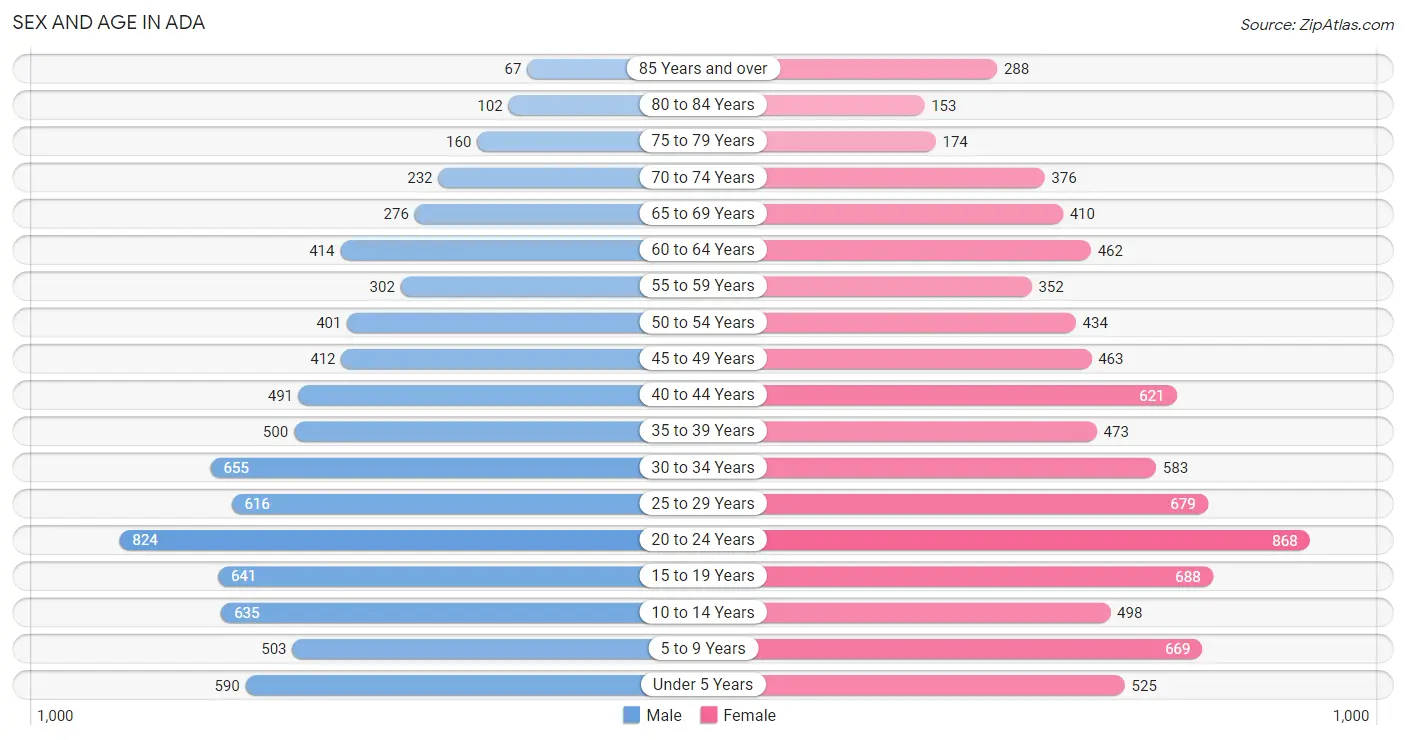
The most populous age groups in Ada are 20 to 24 Years (824 | 10.5%) for men and 20 to 24 Years (868 | 10.0%) for women.
| Age Bracket | Male | Female |
| Under 5 Years | 590 (7.5%) | 525 (6.0%) |
| 5 to 9 Years | 503 (6.4%) | 669 (7.7%) |
| 10 to 14 Years | 635 (8.1%) | 498 (5.7%) |
| 15 to 19 Years | 641 (8.2%) | 688 (7.9%) |
| 20 to 24 Years | 824 (10.5%) | 868 (10.0%) |
| 25 to 29 Years | 616 (7.9%) | 679 (7.8%) |
| 30 to 34 Years | 655 (8.4%) | 583 (6.7%) |
| 35 to 39 Years | 500 (6.4%) | 473 (5.4%) |
| 40 to 44 Years | 491 (6.3%) | 621 (7.1%) |
| 45 to 49 Years | 412 (5.3%) | 463 (5.3%) |
| 50 to 54 Years | 401 (5.1%) | 434 (5.0%) |
| 55 to 59 Years | 302 (3.9%) | 352 (4.0%) |
| 60 to 64 Years | 414 (5.3%) | 462 (5.3%) |
| 65 to 69 Years | 276 (3.5%) | 410 (4.7%) |
| 70 to 74 Years | 232 (3.0%) | 376 (4.3%) |
| 75 to 79 Years | 160 (2.1%) | 174 (2.0%) |
| 80 to 84 Years | 102 (1.3%) | 153 (1.8%) |
| 85 Years and over | 67 (0.9%) | 288 (3.3%) |
| Total | 7,821 (100.0%) | 8,716 (100.0%) |
Families and Households in Ada
Median Family Size in Ada
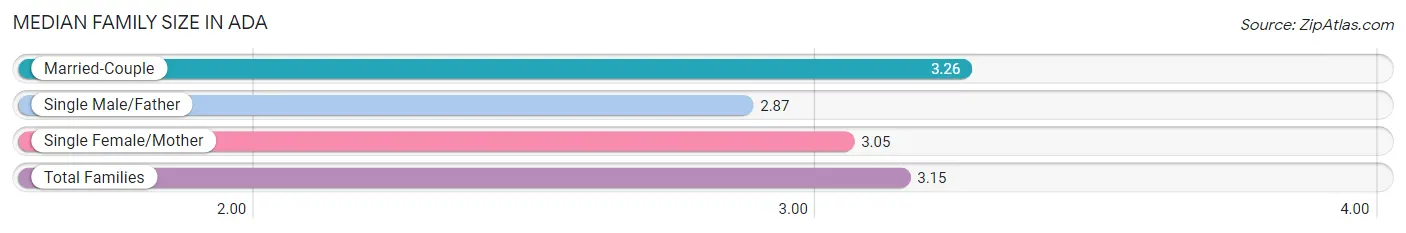
The median family size in Ada is 3.15 persons per family, with married-couple families (2,176 | 59.8%) accounting for the largest median family size of 3.26 persons per family. On the other hand, single male/father families (513 | 14.1%) represent the smallest median family size with 2.87 persons per family.
| Family Type | # Families | Family Size |
| Married-Couple | 2,176 (59.8%) | 3.26 |
| Single Male/Father | 513 (14.1%) | 2.87 |
| Single Female/Mother | 949 (26.1%) | 3.05 |
| Total Families | 3,638 (100.0%) | 3.15 |
Median Household Size in Ada
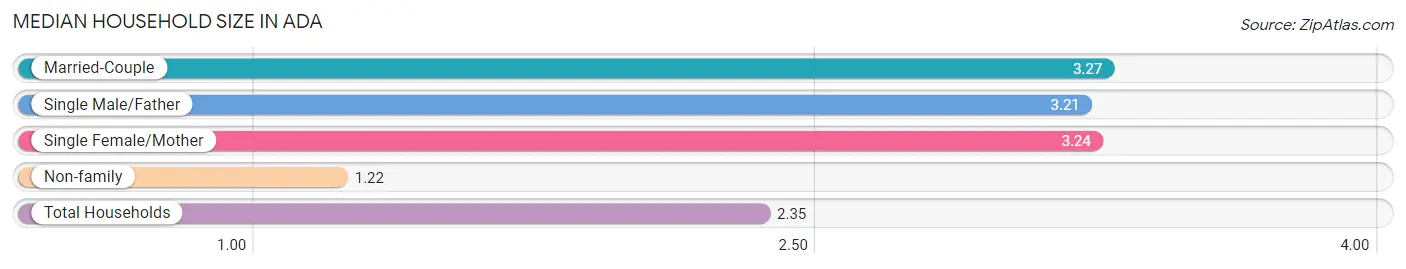
The median household size in Ada is 2.35 persons per household, with married-couple households (2,176 | 33.3%) accounting for the largest median household size of 3.27 persons per household. non-family households (2,892 | 44.3%) represent the smallest median household size with 1.22 persons per household.
| Household Type | # Households | Household Size |
| Married-Couple | 2,176 (33.3%) | 3.27 |
| Single Male/Father | 513 (7.9%) | 3.21 |
| Single Female/Mother | 949 (14.5%) | 3.24 |
| Non-family | 2,892 (44.3%) | 1.22 |
| Total Households | 6,530 (100.0%) | 2.35 |
Household Size by Marriage Status in Ada
Out of a total of 6,530 households in Ada, 3,638 (55.7%) are family households, while 2,892 (44.3%) are nonfamily households. The most numerous type of family households are 2-person households, comprising 1,599, and the most common type of nonfamily households are 1-person households, comprising 2,457.
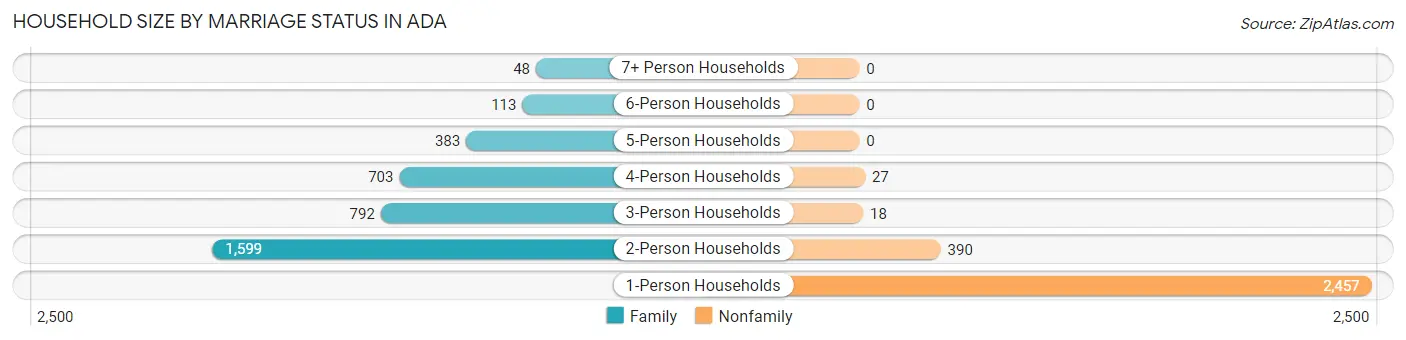
| Household Size | Family Households | Nonfamily Households |
| 1-Person Households | - | 2,457 (37.6%) |
| 2-Person Households | 1,599 (24.5%) | 390 (6.0%) |
| 3-Person Households | 792 (12.1%) | 18 (0.3%) |
| 4-Person Households | 703 (10.8%) | 27 (0.4%) |
| 5-Person Households | 383 (5.9%) | 0 (0.0%) |
| 6-Person Households | 113 (1.7%) | 0 (0.0%) |
| 7+ Person Households | 48 (0.7%) | 0 (0.0%) |
| Total | 3,638 (55.7%) | 2,892 (44.3%) |
Female Fertility in Ada
Fertility by Age in Ada
Average fertility rate in Ada is 40.0 births per 1,000 women. Women in the age bracket of 35 to 50 years have the highest fertility rate with 49.0 births per 1,000 women. Women in the age bracket of 20 to 34 years acount for 51.4% of all women with births.
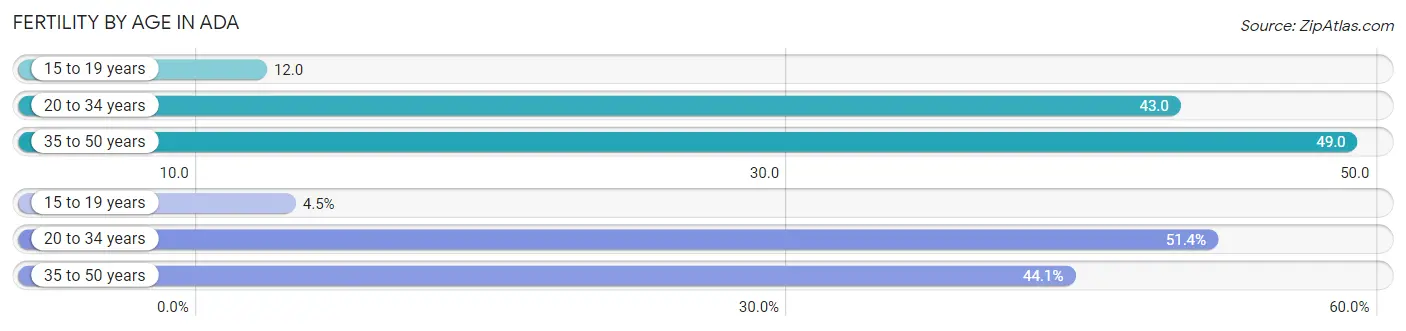
| Age Bracket | Women with Births | Births / 1,000 Women |
| 15 to 19 years | 8 (4.5%) | 12.0 |
| 20 to 34 years | 92 (51.4%) | 43.0 |
| 35 to 50 years | 79 (44.1%) | 49.0 |
| Total | 179 (100.0%) | 40.0 |
Fertility by Age by Marriage Status in Ada
60.9% of women with births (179) in Ada are married. The highest percentage of unmarried women with births falls into 15 to 19 years age bracket with 100.0% of them unmarried at the time of birth, while the lowest percentage of unmarried women with births belong to 35 to 50 years age bracket with 25.3% of them unmarried.
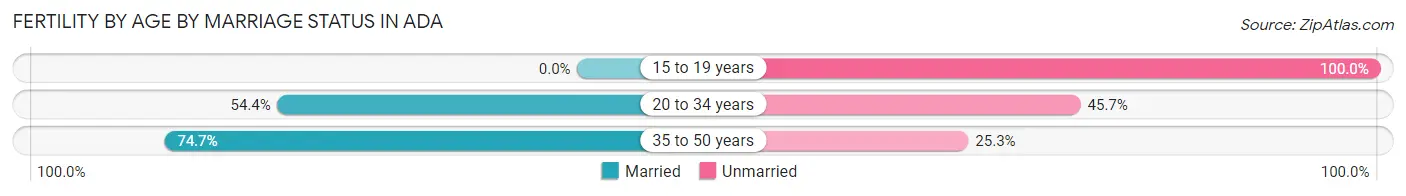
| Age Bracket | Married | Unmarried |
| 15 to 19 years | 0 (0.0%) | 8 (100.0%) |
| 20 to 34 years | 50 (54.3%) | 42 (45.7%) |
| 35 to 50 years | 59 (74.7%) | 20 (25.3%) |
| Total | 109 (60.9%) | 70 (39.1%) |
Fertility by Education in Ada
Average fertility rate in Ada is 40.0 births per 1,000 women. Women with the education attainment of graduate degree have the highest fertility rate of 90.0 births per 1,000 women, while women with the education attainment of less than high school have the lowest fertility at 8.0 births per 1,000 women. Women with the education attainment of high school diploma represent 46.9% of all women with births.
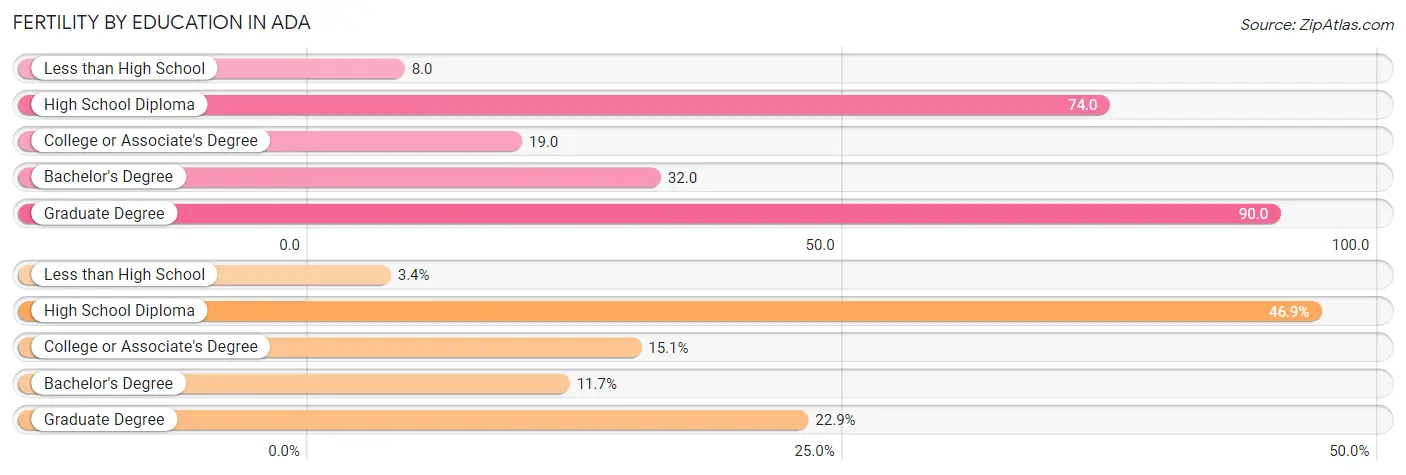
| Educational Attainment | Women with Births | Births / 1,000 Women |
| Less than High School | 6 (3.4%) | 8.0 |
| High School Diploma | 84 (46.9%) | 74.0 |
| College or Associate's Degree | 27 (15.1%) | 19.0 |
| Bachelor's Degree | 21 (11.7%) | 32.0 |
| Graduate Degree | 41 (22.9%) | 90.0 |
| Total | 179 (100.0%) | 40.0 |
Fertility by Education by Marriage Status in Ada
39.1% of women with births in Ada are unmarried. Women with the educational attainment of less than high school are most likely to be married with 100.0% of them married at childbirth, while women with the educational attainment of college or associate's degree are least likely to be married with 92.6% of them unmarried at childbirth.
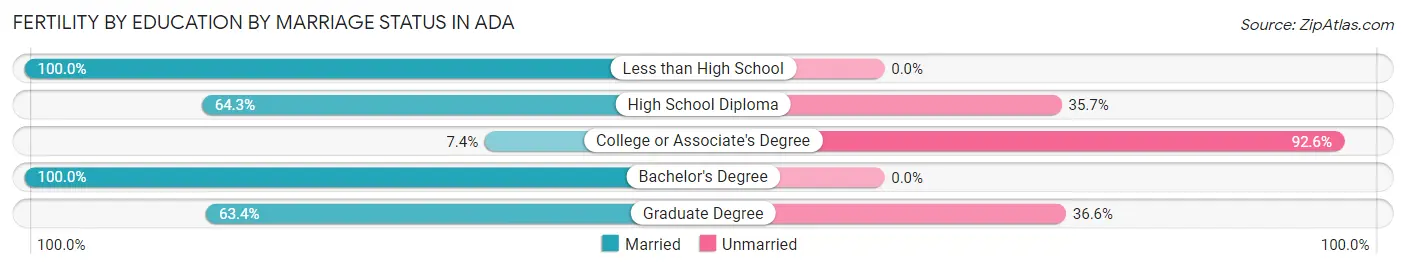
| Educational Attainment | Married | Unmarried |
| Less than High School | 6 (100.0%) | 0 (0.0%) |
| High School Diploma | 54 (64.3%) | 30 (35.7%) |
| College or Associate's Degree | 2 (7.4%) | 25 (92.6%) |
| Bachelor's Degree | 21 (100.0%) | 0 (0.0%) |
| Graduate Degree | 26 (63.4%) | 15 (36.6%) |
| Total | 109 (60.9%) | 70 (39.1%) |
Employment Characteristics in Ada
Employment by Class of Employer in Ada
Among the 7,277 employed individuals in Ada, private company employees (4,530 | 62.3%), federal government employees (919 | 12.6%), and state government employees (611 | 8.4%) make up the most common classes of employment.
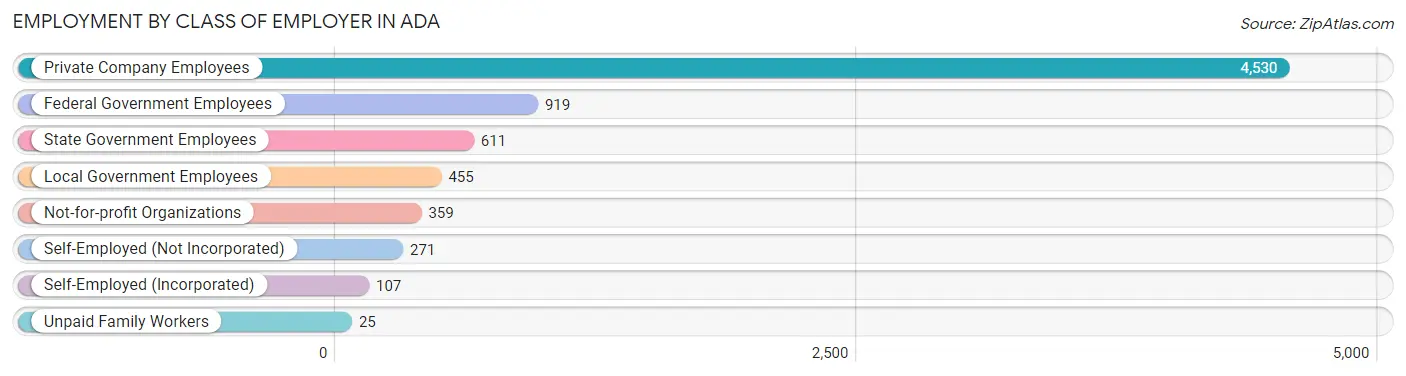
| Employer Class | # Employees | % Employees |
| Private Company Employees | 4,530 | 62.3% |
| Self-Employed (Incorporated) | 107 | 1.5% |
| Self-Employed (Not Incorporated) | 271 | 3.7% |
| Not-for-profit Organizations | 359 | 4.9% |
| Local Government Employees | 455 | 6.2% |
| State Government Employees | 611 | 8.4% |
| Federal Government Employees | 919 | 12.6% |
| Unpaid Family Workers | 25 | 0.3% |
| Total | 7,277 | 100.0% |
Employment Status by Age in Ada
According to the labor force statistics for Ada, out of the total population over 16 years of age (12,894), 59.8% or 7,711 individuals are in the labor force, with 4.8% or 370 of them unemployed. The age group with the highest labor force participation rate is 25 to 29 years, with 88.3% or 1,143 individuals in the labor force. Within the labor force, the 20 to 24 years age range has the highest percentage of unemployed individuals, with 8.6% or 85 of them being unemployed.
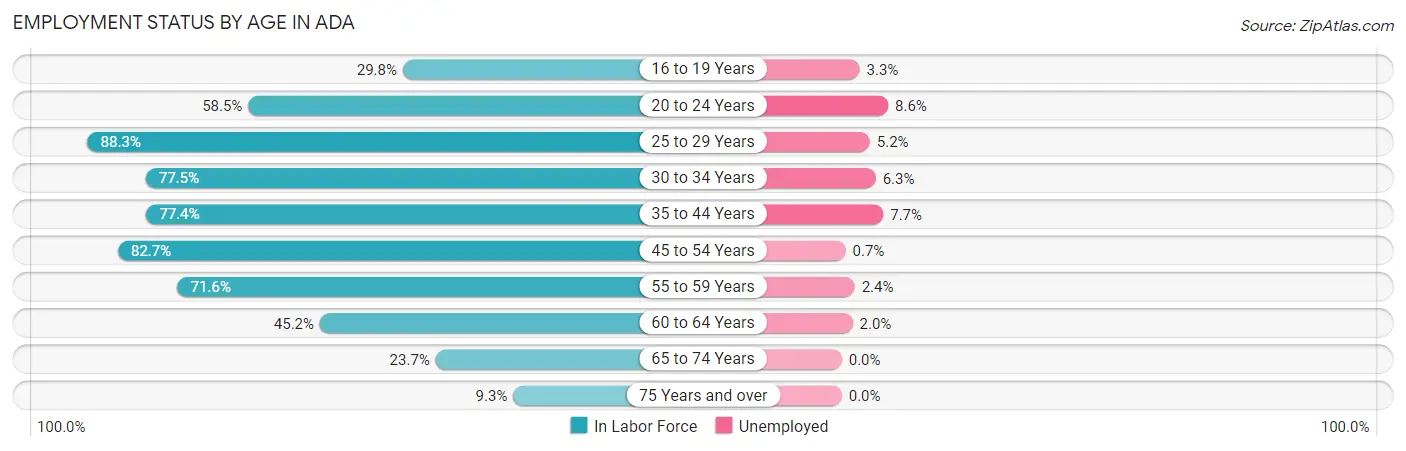
| Age Bracket | In Labor Force | Unemployed |
| 16 to 19 Years | 330 (29.8%) | 11 (3.3%) |
| 20 to 24 Years | 990 (58.5%) | 85 (8.6%) |
| 25 to 29 Years | 1,143 (88.3%) | 59 (5.2%) |
| 30 to 34 Years | 959 (77.5%) | 60 (6.3%) |
| 35 to 44 Years | 1,614 (77.4%) | 124 (7.7%) |
| 45 to 54 Years | 1,414 (82.7%) | 10 (0.7%) |
| 55 to 59 Years | 468 (71.6%) | 11 (2.4%) |
| 60 to 64 Years | 396 (45.2%) | 8 (2.0%) |
| 65 to 74 Years | 307 (23.7%) | 0 (0.0%) |
| 75 Years and over | 88 (9.3%) | 0 (0.0%) |
| Total | 7,711 (59.8%) | 370 (4.8%) |
Employment Status by Educational Attainment in Ada
According to labor force statistics for Ada, 76.3% of individuals (5,996) out of the total population between 25 and 64 years of age (7,858) are in the labor force, with 4.6% or 276 of them being unemployed. The group with the highest labor force participation rate are those with the educational attainment of bachelor's degree or higher, with 88.3% or 2,010 individuals in the labor force. Within the labor force, individuals with high school diploma education have the highest percentage of unemployment, with 5.8% or 104 of them being unemployed.
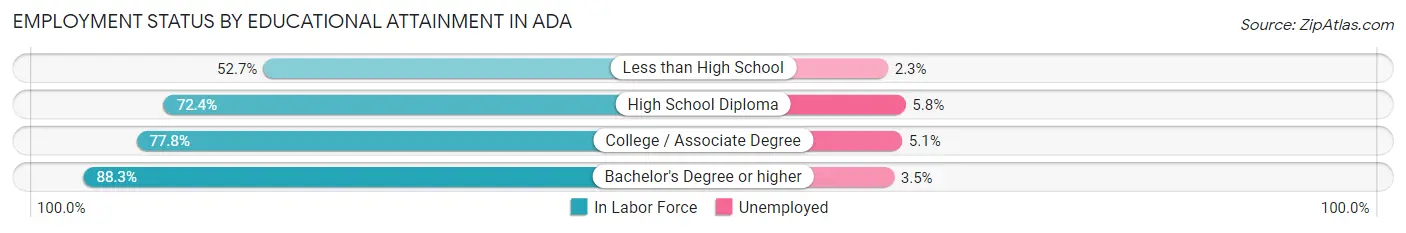
| Educational Attainment | In Labor Force | Unemployed |
| Less than High School | 474 (52.7%) | 21 (2.3%) |
| High School Diploma | 1,797 (72.4%) | 144 (5.8%) |
| College / Associate Degree | 1,712 (77.8%) | 112 (5.1%) |
| Bachelor's Degree or higher | 2,010 (88.3%) | 80 (3.5%) |
| Total | 5,996 (76.3%) | 361 (4.6%) |
Employment Occupations by Sex in Ada
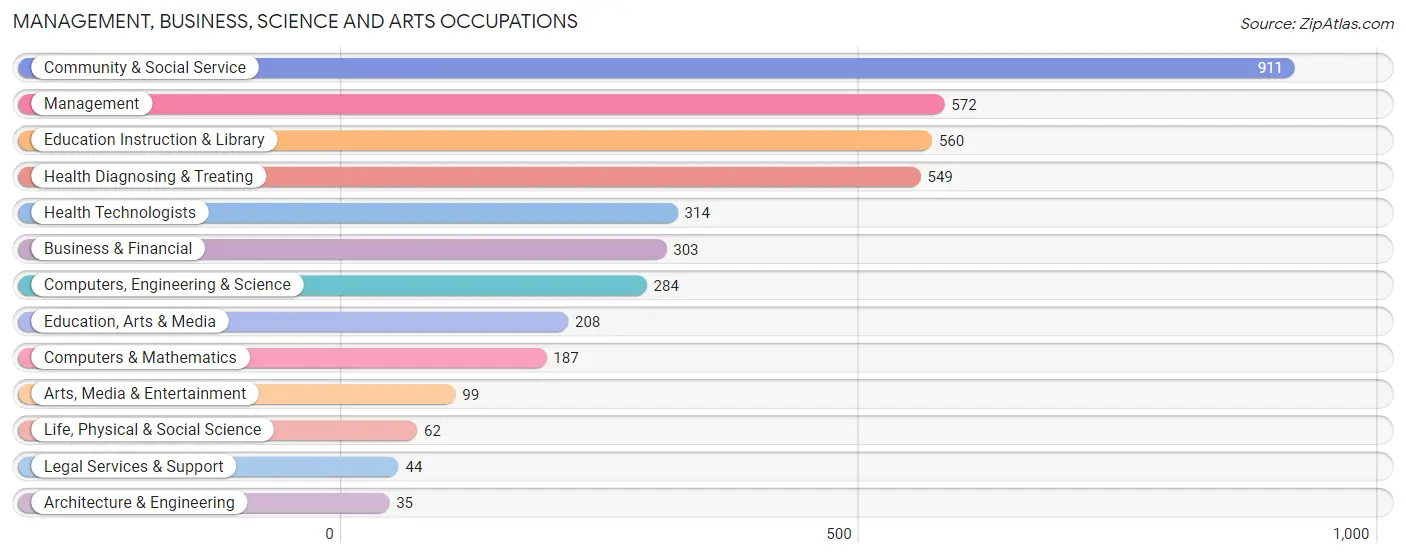
Management, Business, Science and Arts Occupations
The most common Management, Business, Science and Arts occupations in Ada are Community & Social Service (911 | 12.4%), Management (572 | 7.8%), Education Instruction & Library (560 | 7.6%), Health Diagnosing & Treating (549 | 7.5%), and Health Technologists (314 | 4.3%).
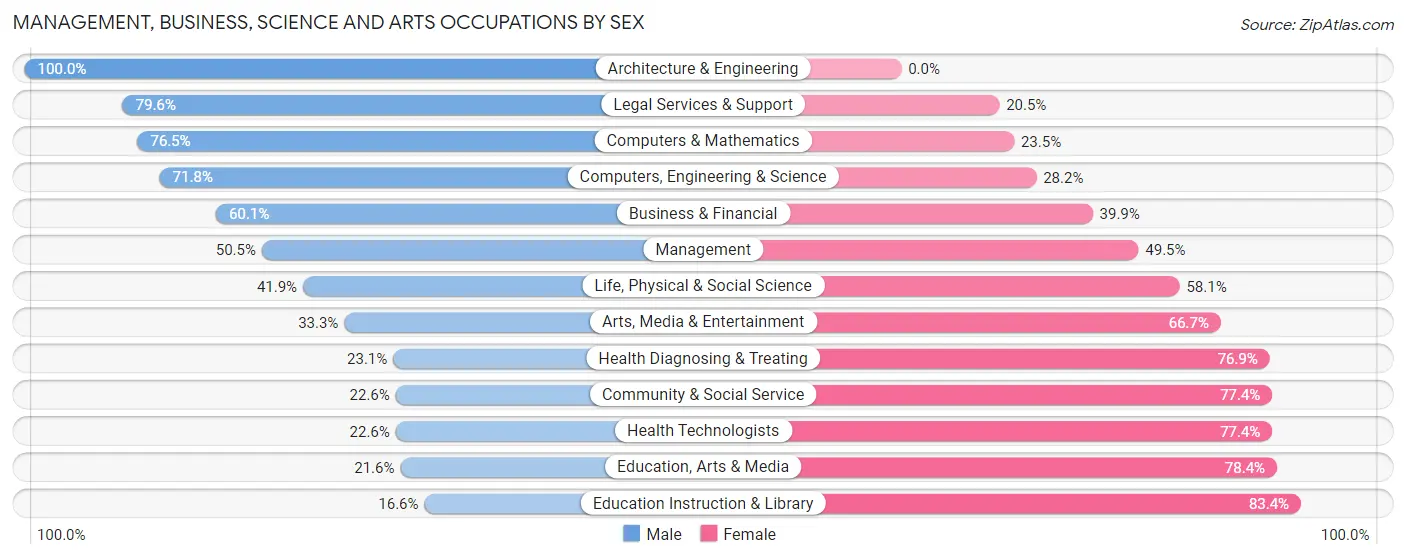
Management, Business, Science and Arts Occupations by Sex
Within the Management, Business, Science and Arts occupations in Ada, the most male-oriented occupations are Architecture & Engineering (100.0%), Legal Services & Support (79.5%), and Computers & Mathematics (76.5%), while the most female-oriented occupations are Education Instruction & Library (83.4%), Education, Arts & Media (78.4%), and Community & Social Service (77.4%).
| Occupation | Male | Female |
| Management | 289 (50.5%) | 283 (49.5%) |
| Business & Financial | 182 (60.1%) | 121 (39.9%) |
| Computers, Engineering & Science | 204 (71.8%) | 80 (28.2%) |
| Computers & Mathematics | 143 (76.5%) | 44 (23.5%) |
| Architecture & Engineering | 35 (100.0%) | 0 (0.0%) |
| Life, Physical & Social Science | 26 (41.9%) | 36 (58.1%) |
| Community & Social Service | 206 (22.6%) | 705 (77.4%) |
| Education, Arts & Media | 45 (21.6%) | 163 (78.4%) |
| Legal Services & Support | 35 (79.5%) | 9 (20.4%) |
| Education Instruction & Library | 93 (16.6%) | 467 (83.4%) |
| Arts, Media & Entertainment | 33 (33.3%) | 66 (66.7%) |
| Health Diagnosing & Treating | 127 (23.1%) | 422 (76.9%) |
| Health Technologists | 71 (22.6%) | 243 (77.4%) |
| Total (Category) | 1,008 (38.5%) | 1,611 (61.5%) |
| Total (Overall) | 3,812 (51.9%) | 3,527 (48.1%) |
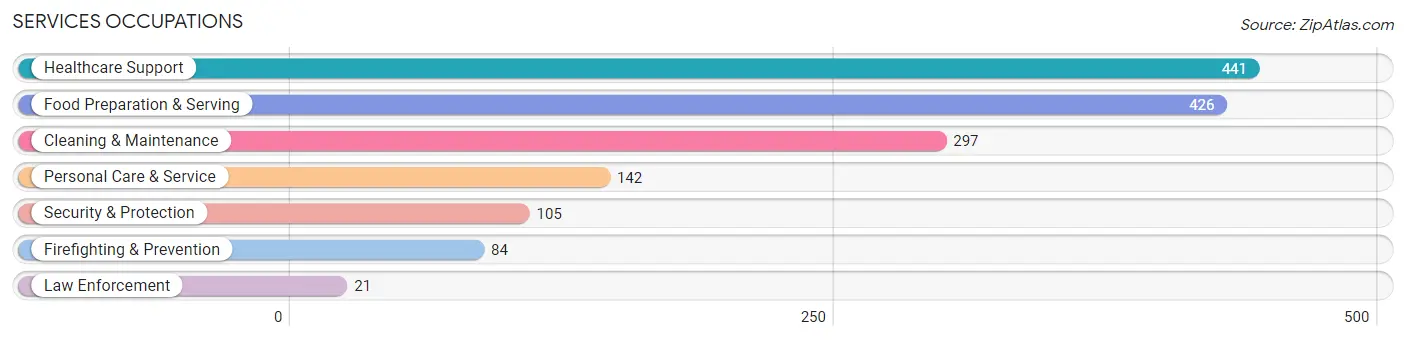
Services Occupations
The most common Services occupations in Ada are Healthcare Support (441 | 6.0%), Food Preparation & Serving (426 | 5.8%), Cleaning & Maintenance (297 | 4.1%), Personal Care & Service (142 | 1.9%), and Security & Protection (105 | 1.4%).
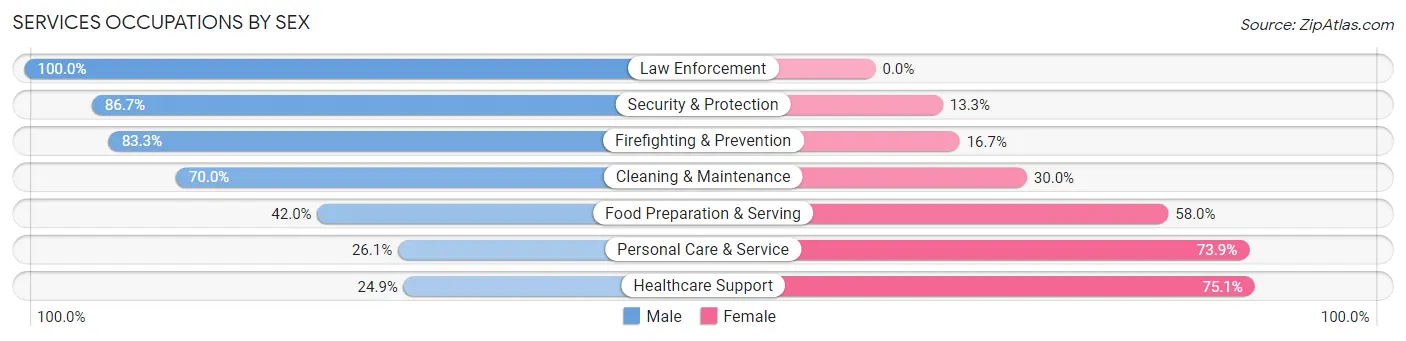
Services Occupations by Sex
Within the Services occupations in Ada, the most male-oriented occupations are Law Enforcement (100.0%), Security & Protection (86.7%), and Firefighting & Prevention (83.3%), while the most female-oriented occupations are Healthcare Support (75.1%), Personal Care & Service (73.9%), and Food Preparation & Serving (58.0%).
| Occupation | Male | Female |
| Healthcare Support | 110 (24.9%) | 331 (75.1%) |
| Security & Protection | 91 (86.7%) | 14 (13.3%) |
| Firefighting & Prevention | 70 (83.3%) | 14 (16.7%) |
| Law Enforcement | 21 (100.0%) | 0 (0.0%) |
| Food Preparation & Serving | 179 (42.0%) | 247 (58.0%) |
| Cleaning & Maintenance | 208 (70.0%) | 89 (30.0%) |
| Personal Care & Service | 37 (26.1%) | 105 (73.9%) |
| Total (Category) | 625 (44.3%) | 786 (55.7%) |
| Total (Overall) | 3,812 (51.9%) | 3,527 (48.1%) |
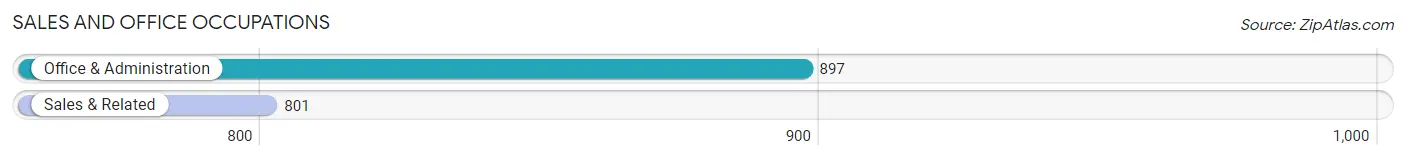
Sales and Office Occupations
The most common Sales and Office occupations in Ada are Office & Administration (897 | 12.2%), and Sales & Related (801 | 10.9%).
Sales and Office Occupations by Sex
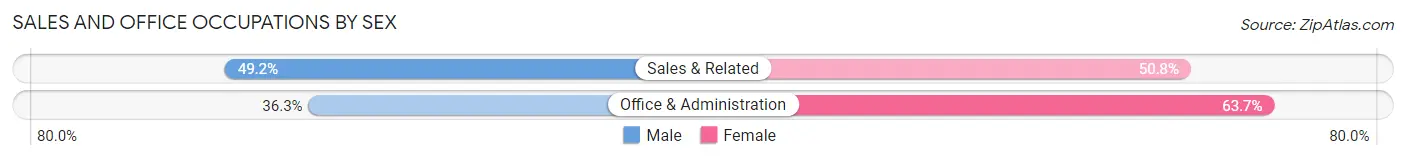
| Occupation | Male | Female |
| Sales & Related | 394 (49.2%) | 407 (50.8%) |
| Office & Administration | 326 (36.3%) | 571 (63.7%) |
| Total (Category) | 720 (42.4%) | 978 (57.6%) |
| Total (Overall) | 3,812 (51.9%) | 3,527 (48.1%) |
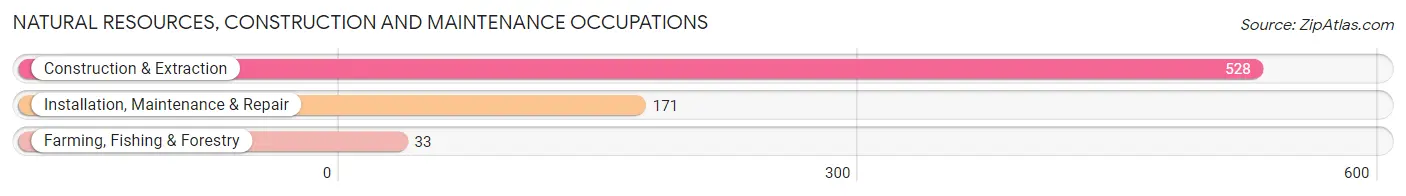
Natural Resources, Construction and Maintenance Occupations
The most common Natural Resources, Construction and Maintenance occupations in Ada are Construction & Extraction (528 | 7.2%), Installation, Maintenance & Repair (171 | 2.3%), and Farming, Fishing & Forestry (33 | 0.4%).
Natural Resources, Construction and Maintenance Occupations by Sex
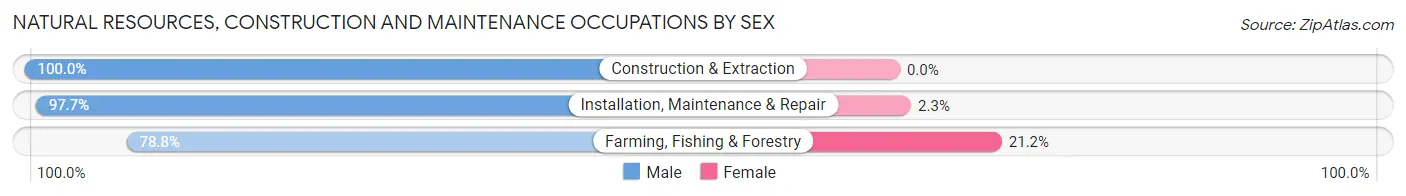
| Occupation | Male | Female |
| Farming, Fishing & Forestry | 26 (78.8%) | 7 (21.2%) |
| Construction & Extraction | 528 (100.0%) | 0 (0.0%) |
| Installation, Maintenance & Repair | 167 (97.7%) | 4 (2.3%) |
| Total (Category) | 721 (98.5%) | 11 (1.5%) |
| Total (Overall) | 3,812 (51.9%) | 3,527 (48.1%) |
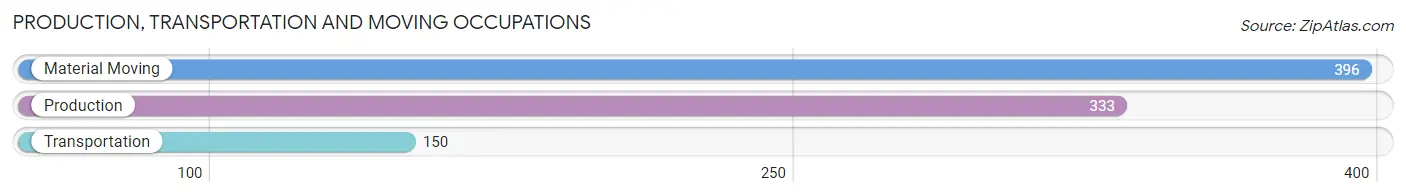
Production, Transportation and Moving Occupations
The most common Production, Transportation and Moving occupations in Ada are Material Moving (396 | 5.4%), Production (333 | 4.5%), and Transportation (150 | 2.0%).
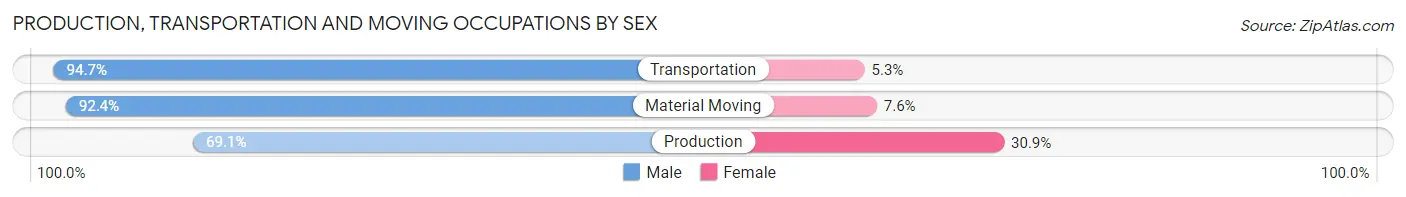
Production, Transportation and Moving Occupations by Sex
| Occupation | Male | Female |
| Production | 230 (69.1%) | 103 (30.9%) |
| Transportation | 142 (94.7%) | 8 (5.3%) |
| Material Moving | 366 (92.4%) | 30 (7.6%) |
| Total (Category) | 738 (84.0%) | 141 (16.0%) |
| Total (Overall) | 3,812 (51.9%) | 3,527 (48.1%) |
Employment Industries by Sex in Ada
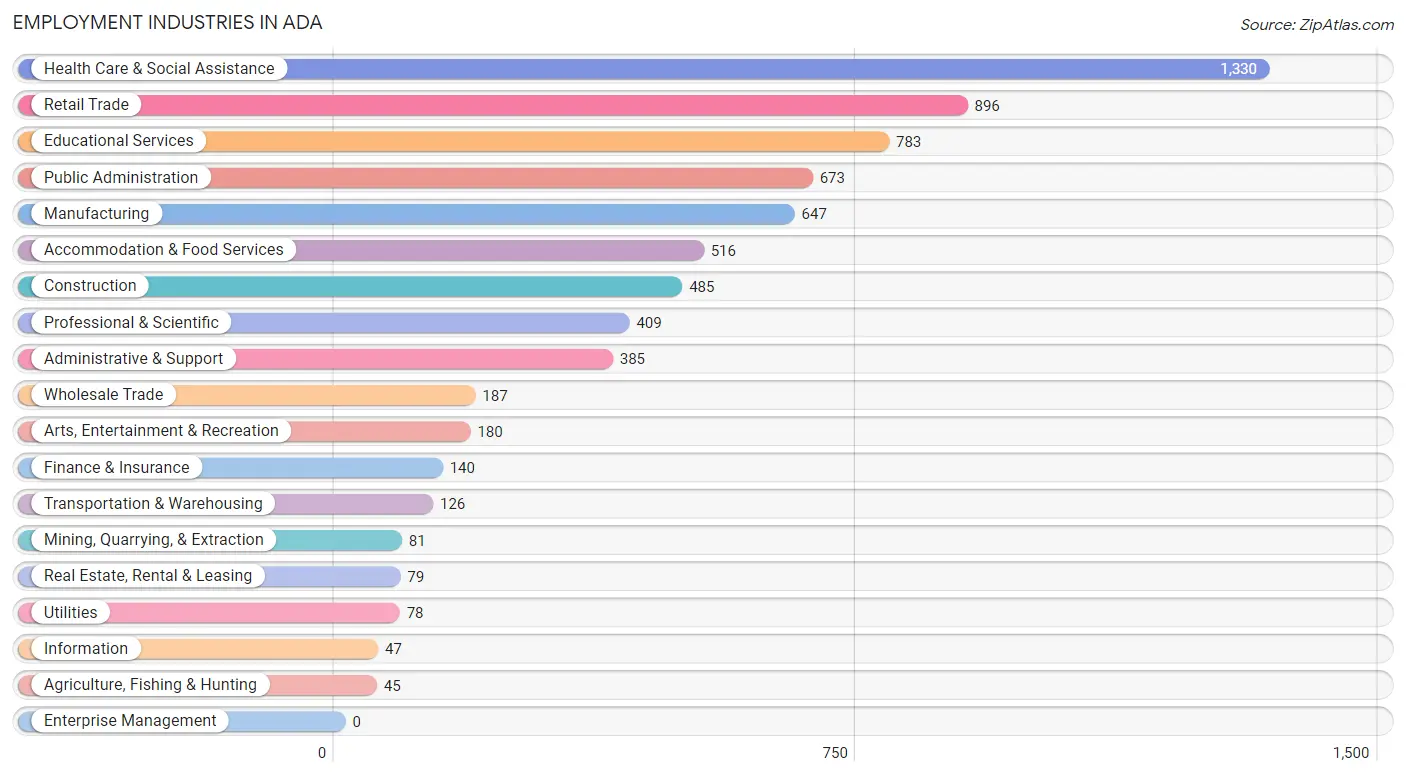
Employment Industries in Ada
The major employment industries in Ada include Health Care & Social Assistance (1,330 | 18.1%), Retail Trade (896 | 12.2%), Educational Services (783 | 10.7%), Public Administration (673 | 9.2%), and Manufacturing (647 | 8.8%).
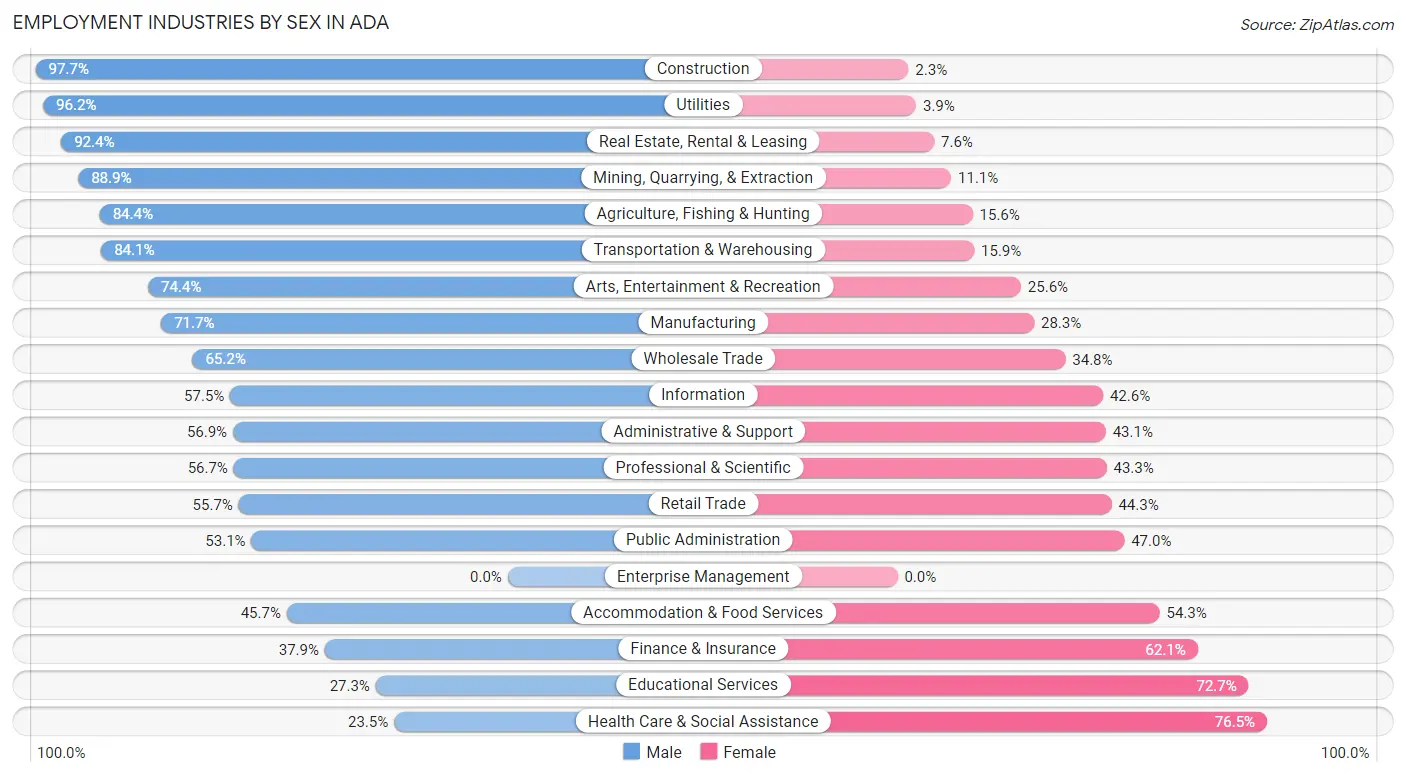
Employment Industries by Sex in Ada
The Ada industries that see more men than women are Construction (97.7%), Utilities (96.2%), and Real Estate, Rental & Leasing (92.4%), whereas the industries that tend to have a higher number of women are Health Care & Social Assistance (76.5%), Educational Services (72.7%), and Finance & Insurance (62.1%).
| Industry | Male | Female |
| Agriculture, Fishing & Hunting | 38 (84.4%) | 7 (15.6%) |
| Mining, Quarrying, & Extraction | 72 (88.9%) | 9 (11.1%) |
| Construction | 474 (97.7%) | 11 (2.3%) |
| Manufacturing | 464 (71.7%) | 183 (28.3%) |
| Wholesale Trade | 122 (65.2%) | 65 (34.8%) |
| Retail Trade | 499 (55.7%) | 397 (44.3%) |
| Transportation & Warehousing | 106 (84.1%) | 20 (15.9%) |
| Utilities | 75 (96.2%) | 3 (3.8%) |
| Information | 27 (57.5%) | 20 (42.5%) |
| Finance & Insurance | 53 (37.9%) | 87 (62.1%) |
| Real Estate, Rental & Leasing | 73 (92.4%) | 6 (7.6%) |
| Professional & Scientific | 232 (56.7%) | 177 (43.3%) |
| Enterprise Management | 0 (0.0%) | 0 (0.0%) |
| Administrative & Support | 219 (56.9%) | 166 (43.1%) |
| Educational Services | 214 (27.3%) | 569 (72.7%) |
| Health Care & Social Assistance | 313 (23.5%) | 1,017 (76.5%) |
| Arts, Entertainment & Recreation | 134 (74.4%) | 46 (25.6%) |
| Accommodation & Food Services | 236 (45.7%) | 280 (54.3%) |
| Public Administration | 357 (53.0%) | 316 (46.9%) |
| Total | 3,812 (51.9%) | 3,527 (48.1%) |
Education in Ada
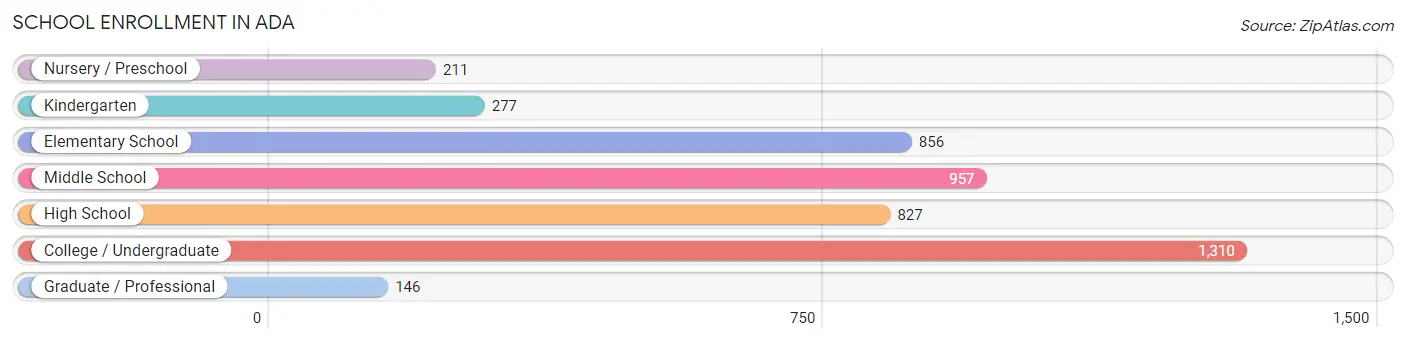
School Enrollment in Ada
The most common levels of schooling among the 4,584 students in Ada are college / undergraduate (1,310 | 28.6%), middle school (957 | 20.9%), and elementary school (856 | 18.7%).
| School Level | # Students | % Students |
| Nursery / Preschool | 211 | 4.6% |
| Kindergarten | 277 | 6.0% |
| Elementary School | 856 | 18.7% |
| Middle School | 957 | 20.9% |
| High School | 827 | 18.0% |
| College / Undergraduate | 1,310 | 28.6% |
| Graduate / Professional | 146 | 3.2% |
| Total | 4,584 | 100.0% |
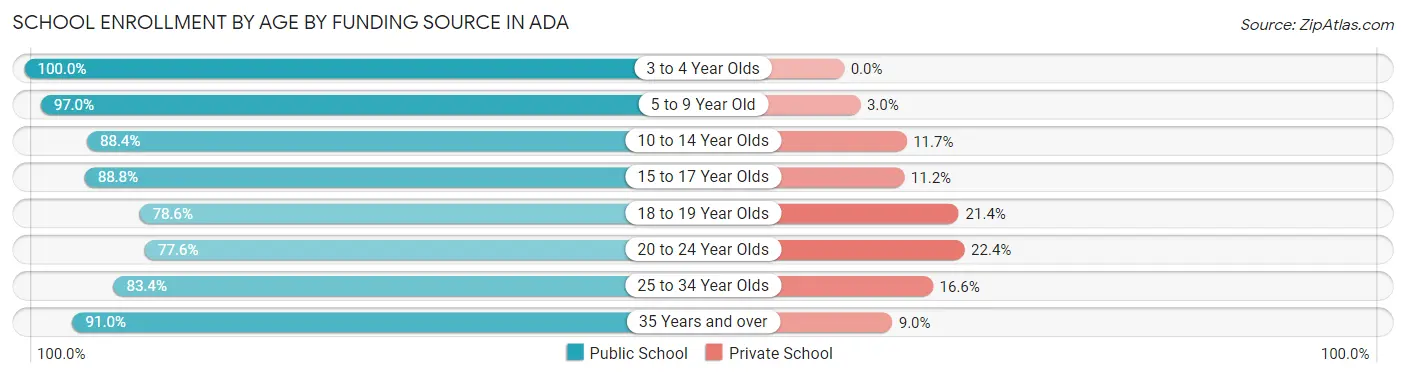
School Enrollment by Age by Funding Source in Ada
Out of a total of 4,584 students who are enrolled in schools in Ada, 550 (12.0%) attend a private institution, while the remaining 4,034 (88.0%) are enrolled in public schools. The age group of 20 to 24 year olds has the highest likelihood of being enrolled in private schools, with 160 (22.4% in the age bracket) enrolled. Conversely, the age group of 3 to 4 year olds has the lowest likelihood of being enrolled in a private school, with 172 (100.0% in the age bracket) attending a public institution.
| Age Bracket | Public School | Private School |
| 3 to 4 Year Olds | 172 (100.0%) | 0 (0.0%) |
| 5 to 9 Year Old | 1,089 (97.0%) | 34 (3.0%) |
| 10 to 14 Year Olds | 1,001 (88.3%) | 132 (11.7%) |
| 15 to 17 Year Olds | 530 (88.8%) | 67 (11.2%) |
| 18 to 19 Year Olds | 422 (78.6%) | 115 (21.4%) |
| 20 to 24 Year Olds | 553 (77.6%) | 160 (22.4%) |
| 25 to 34 Year Olds | 146 (83.4%) | 29 (16.6%) |
| 35 Years and over | 122 (91.0%) | 12 (9.0%) |
| Total | 4,034 (88.0%) | 550 (12.0%) |
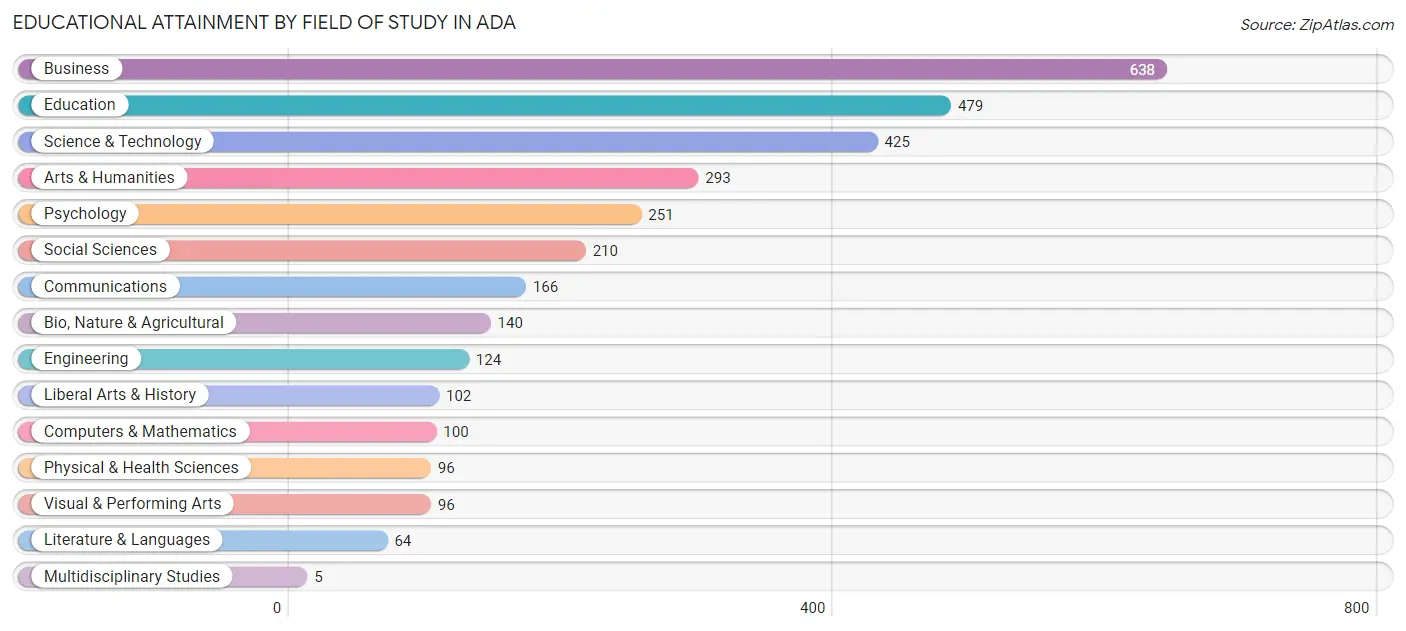
Educational Attainment by Field of Study in Ada
Business (638 | 20.0%), education (479 | 15.0%), science & technology (425 | 13.3%), arts & humanities (293 | 9.2%), and psychology (251 | 7.9%) are the most common fields of study among 3,189 individuals in Ada who have obtained a bachelor's degree or higher.
| Field of Study | # Graduates | % Graduates |
| Computers & Mathematics | 100 | 3.1% |
| Bio, Nature & Agricultural | 140 | 4.4% |
| Physical & Health Sciences | 96 | 3.0% |
| Psychology | 251 | 7.9% |
| Social Sciences | 210 | 6.6% |
| Engineering | 124 | 3.9% |
| Multidisciplinary Studies | 5 | 0.2% |
| Science & Technology | 425 | 13.3% |
| Business | 638 | 20.0% |
| Education | 479 | 15.0% |
| Literature & Languages | 64 | 2.0% |
| Liberal Arts & History | 102 | 3.2% |
| Visual & Performing Arts | 96 | 3.0% |
| Communications | 166 | 5.2% |
| Arts & Humanities | 293 | 9.2% |
| Total | 3,189 | 100.0% |
Transportation & Commute in Ada
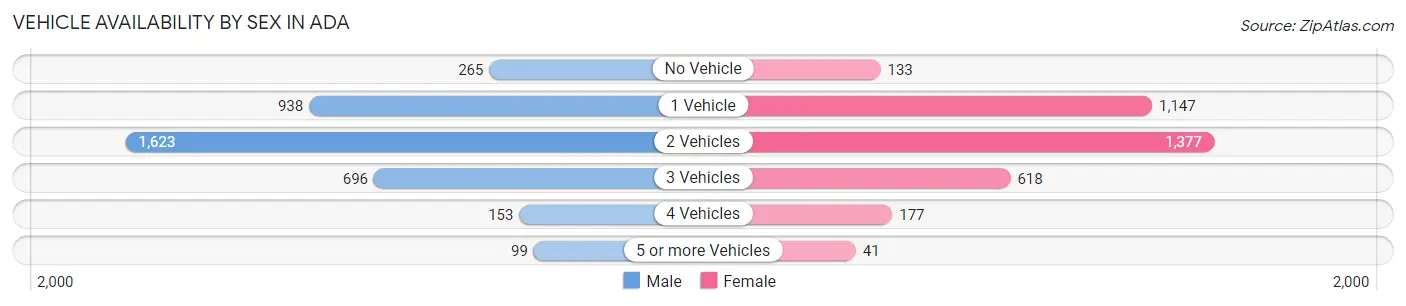
Vehicle Availability by Sex in Ada
The most prevalent vehicle ownership categories in Ada are males with 2 vehicles (1,623, accounting for 43.0%) and females with 2 vehicles (1,377, making up 46.5%).
| Vehicles Available | Male | Female |
| No Vehicle | 265 (7.0%) | 133 (3.8%) |
| 1 Vehicle | 938 (24.8%) | 1,147 (32.8%) |
| 2 Vehicles | 1,623 (43.0%) | 1,377 (39.4%) |
| 3 Vehicles | 696 (18.4%) | 618 (17.7%) |
| 4 Vehicles | 153 (4.1%) | 177 (5.1%) |
| 5 or more Vehicles | 99 (2.6%) | 41 (1.2%) |
| Total | 3,774 (100.0%) | 3,493 (100.0%) |
Commute Time in Ada
The most frequently occuring commute durations in Ada are 5 to 9 minutes (2,430 commuters, 34.7%), 10 to 14 minutes (1,788 commuters, 25.5%), and 15 to 19 minutes (1,044 commuters, 14.9%).
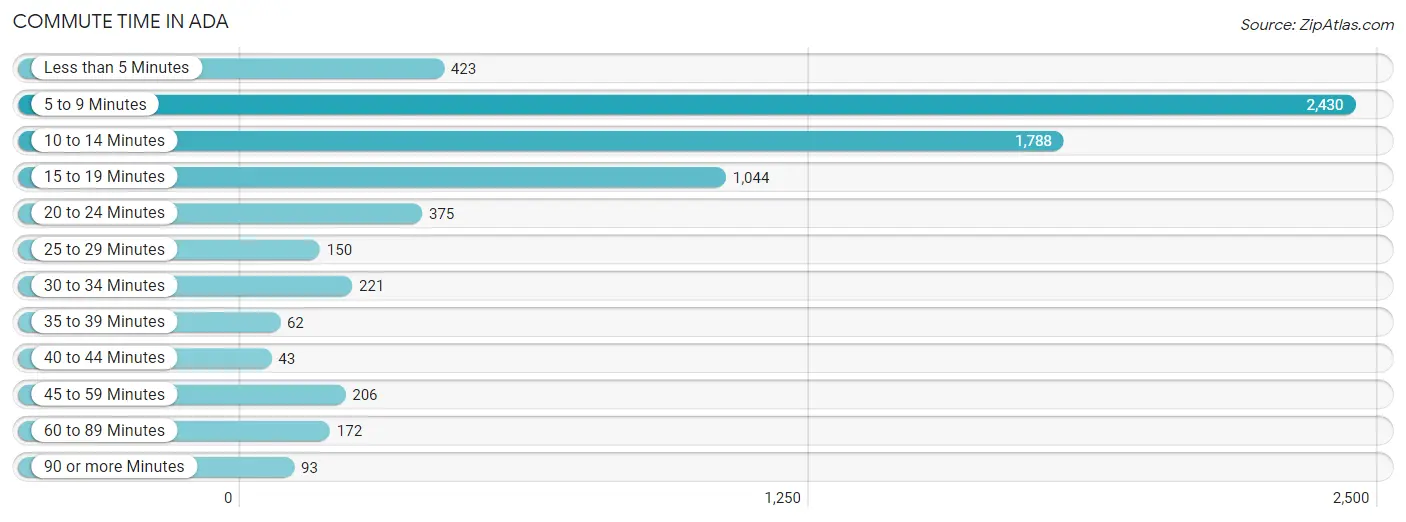
| Commute Time | # Commuters | % Commuters |
| Less than 5 Minutes | 423 | 6.0% |
| 5 to 9 Minutes | 2,430 | 34.7% |
| 10 to 14 Minutes | 1,788 | 25.5% |
| 15 to 19 Minutes | 1,044 | 14.9% |
| 20 to 24 Minutes | 375 | 5.3% |
| 25 to 29 Minutes | 150 | 2.1% |
| 30 to 34 Minutes | 221 | 3.2% |
| 35 to 39 Minutes | 62 | 0.9% |
| 40 to 44 Minutes | 43 | 0.6% |
| 45 to 59 Minutes | 206 | 2.9% |
| 60 to 89 Minutes | 172 | 2.5% |
| 90 or more Minutes | 93 | 1.3% |
Commute Time by Sex in Ada
The most common commute times in Ada are 5 to 9 minutes (1,123 commuters, 30.6%) for males and 5 to 9 minutes (1,307 commuters, 39.1%) for females.
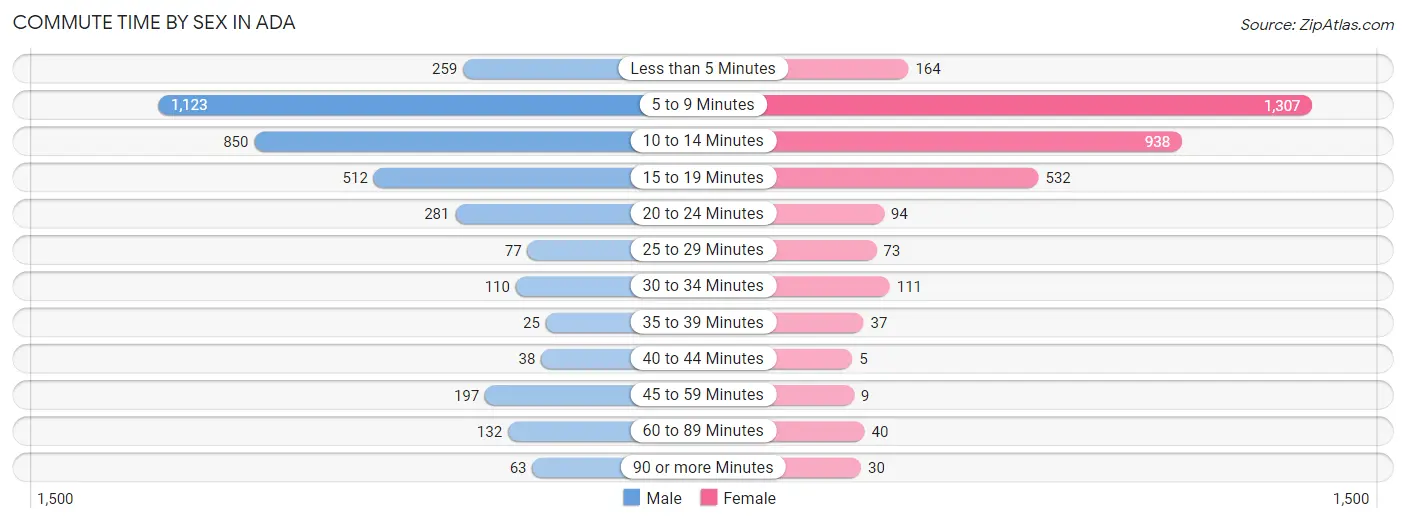
| Commute Time | Male | Female |
| Less than 5 Minutes | 259 (7.1%) | 164 (4.9%) |
| 5 to 9 Minutes | 1,123 (30.6%) | 1,307 (39.1%) |
| 10 to 14 Minutes | 850 (23.2%) | 938 (28.1%) |
| 15 to 19 Minutes | 512 (14.0%) | 532 (15.9%) |
| 20 to 24 Minutes | 281 (7.7%) | 94 (2.8%) |
| 25 to 29 Minutes | 77 (2.1%) | 73 (2.2%) |
| 30 to 34 Minutes | 110 (3.0%) | 111 (3.3%) |
| 35 to 39 Minutes | 25 (0.7%) | 37 (1.1%) |
| 40 to 44 Minutes | 38 (1.0%) | 5 (0.2%) |
| 45 to 59 Minutes | 197 (5.4%) | 9 (0.3%) |
| 60 to 89 Minutes | 132 (3.6%) | 40 (1.2%) |
| 90 or more Minutes | 63 (1.7%) | 30 (0.9%) |
Time of Departure to Work by Sex in Ada
The most frequent times of departure to work in Ada are 7:30 AM to 7:59 AM (573, 15.6%) for males and 7:30 AM to 7:59 AM (840, 25.2%) for females.
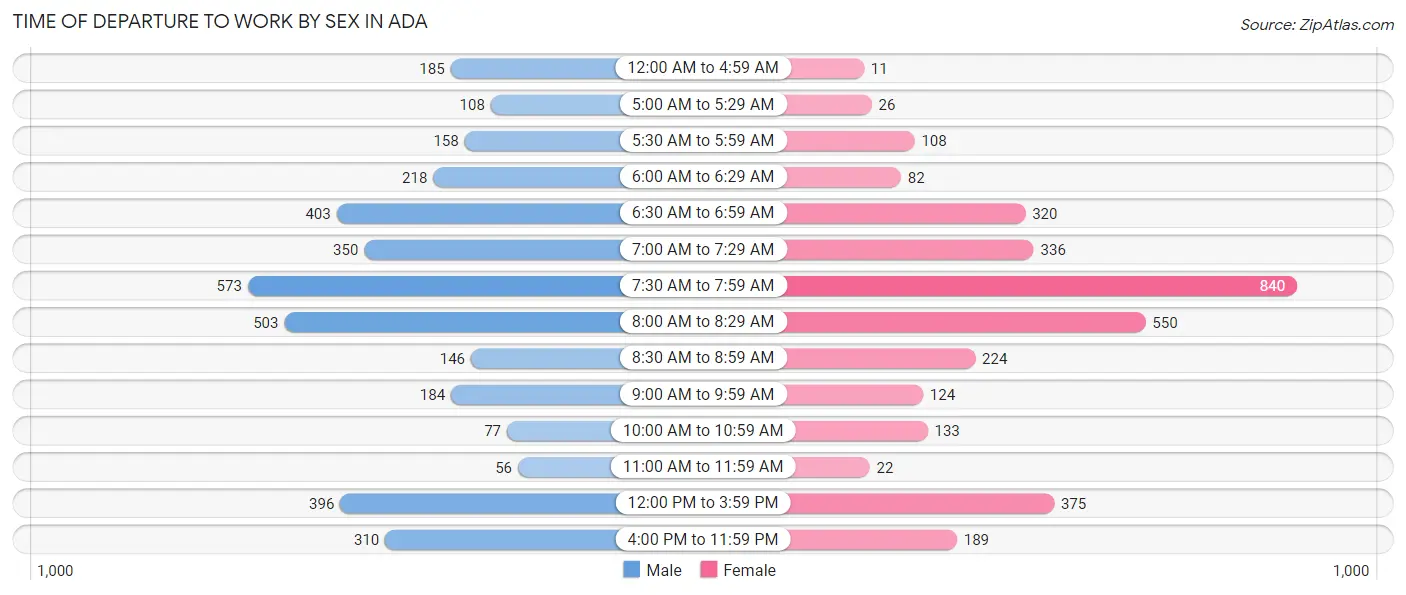
| Time of Departure | Male | Female |
| 12:00 AM to 4:59 AM | 185 (5.0%) | 11 (0.3%) |
| 5:00 AM to 5:29 AM | 108 (2.9%) | 26 (0.8%) |
| 5:30 AM to 5:59 AM | 158 (4.3%) | 108 (3.2%) |
| 6:00 AM to 6:29 AM | 218 (5.9%) | 82 (2.5%) |
| 6:30 AM to 6:59 AM | 403 (11.0%) | 320 (9.6%) |
| 7:00 AM to 7:29 AM | 350 (9.5%) | 336 (10.1%) |
| 7:30 AM to 7:59 AM | 573 (15.6%) | 840 (25.2%) |
| 8:00 AM to 8:29 AM | 503 (13.7%) | 550 (16.5%) |
| 8:30 AM to 8:59 AM | 146 (4.0%) | 224 (6.7%) |
| 9:00 AM to 9:59 AM | 184 (5.0%) | 124 (3.7%) |
| 10:00 AM to 10:59 AM | 77 (2.1%) | 133 (4.0%) |
| 11:00 AM to 11:59 AM | 56 (1.5%) | 22 (0.7%) |
| 12:00 PM to 3:59 PM | 396 (10.8%) | 375 (11.2%) |
| 4:00 PM to 11:59 PM | 310 (8.5%) | 189 (5.7%) |
| Total | 3,667 (100.0%) | 3,340 (100.0%) |
Housing Occupancy in Ada
Occupancy by Ownership in Ada
Of the total 6,530 dwellings in Ada, owner-occupied units account for 2,849 (43.6%), while renter-occupied units make up 3,681 (56.4%).
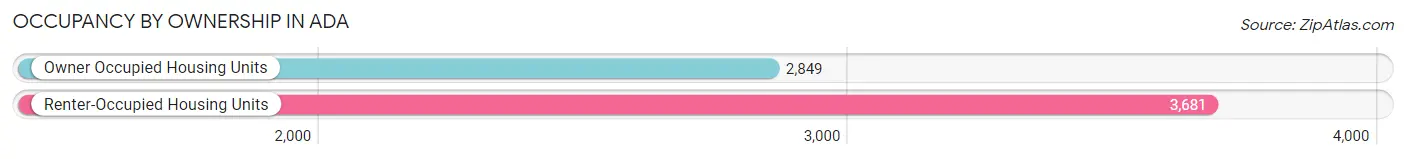
| Occupancy | # Housing Units | % Housing Units |
| Owner Occupied Housing Units | 2,849 | 43.6% |
| Renter-Occupied Housing Units | 3,681 | 56.4% |
| Total Occupied Housing Units | 6,530 | 100.0% |
Occupancy by Household Size in Ada
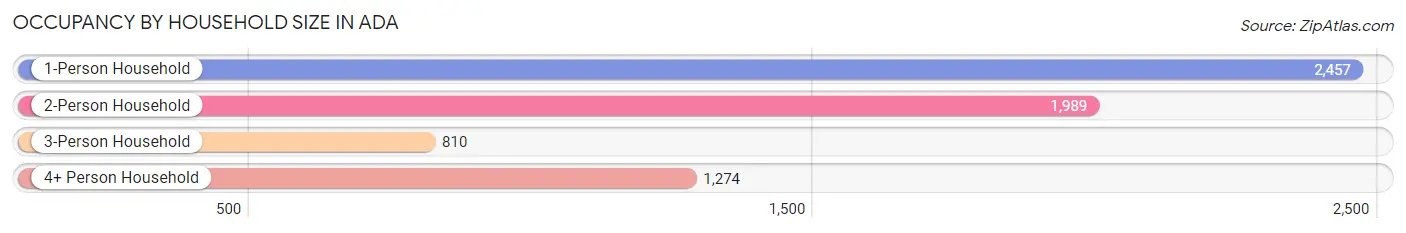
| Household Size | # Housing Units | % Housing Units |
| 1-Person Household | 2,457 | 37.6% |
| 2-Person Household | 1,989 | 30.5% |
| 3-Person Household | 810 | 12.4% |
| 4+ Person Household | 1,274 | 19.5% |
| Total Housing Units | 6,530 | 100.0% |
Occupancy by Ownership by Household Size in Ada
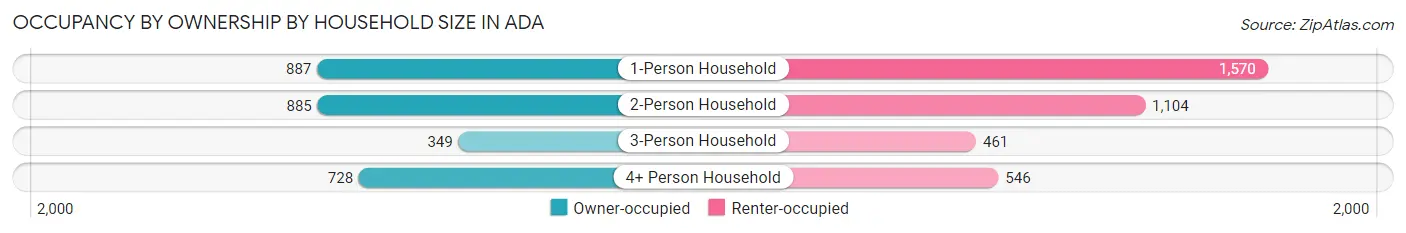
| Household Size | Owner-occupied | Renter-occupied |
| 1-Person Household | 887 (36.1%) | 1,570 (63.9%) |
| 2-Person Household | 885 (44.5%) | 1,104 (55.5%) |
| 3-Person Household | 349 (43.1%) | 461 (56.9%) |
| 4+ Person Household | 728 (57.1%) | 546 (42.9%) |
| Total Housing Units | 2,849 (43.6%) | 3,681 (56.4%) |
Occupancy by Educational Attainment in Ada
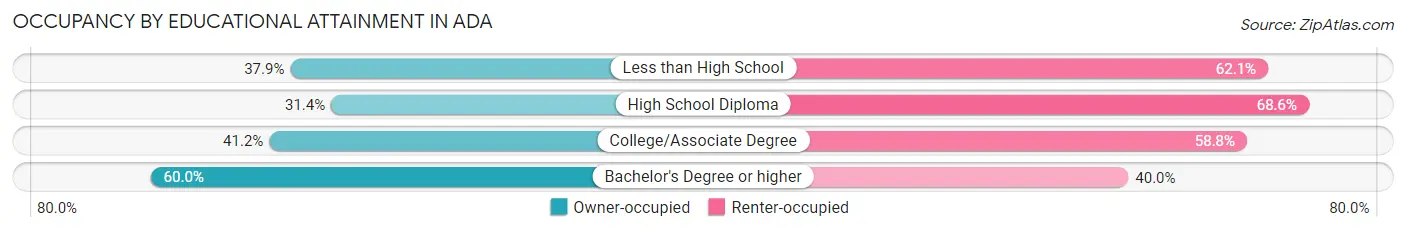
| Household Size | Owner-occupied | Renter-occupied |
| Less than High School | 267 (37.9%) | 438 (62.1%) |
| High School Diploma | 588 (31.4%) | 1,285 (68.6%) |
| College/Associate Degree | 827 (41.2%) | 1,180 (58.8%) |
| Bachelor's Degree or higher | 1,167 (60.0%) | 778 (40.0%) |
Occupancy by Age of Householder in Ada
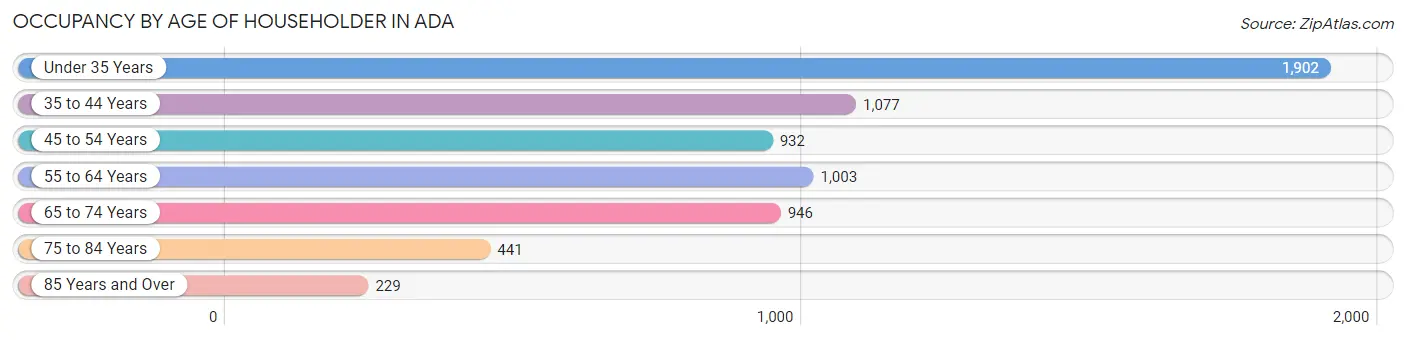
| Age Bracket | # Households | % Households |
| Under 35 Years | 1,902 | 29.1% |
| 35 to 44 Years | 1,077 | 16.5% |
| 45 to 54 Years | 932 | 14.3% |
| 55 to 64 Years | 1,003 | 15.4% |
| 65 to 74 Years | 946 | 14.5% |
| 75 to 84 Years | 441 | 6.8% |
| 85 Years and Over | 229 | 3.5% |
| Total | 6,530 | 100.0% |
Housing Finances in Ada
Median Income by Occupancy in Ada
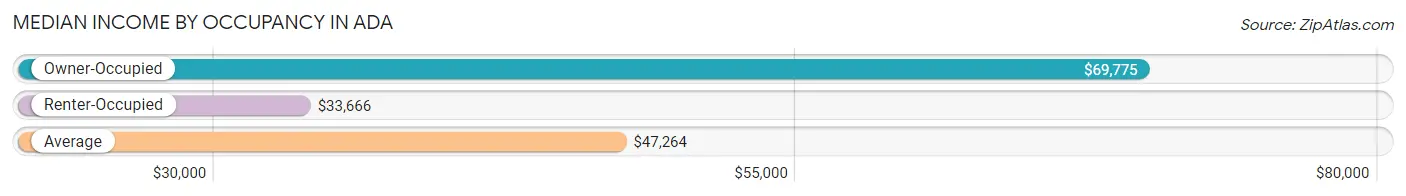
| Occupancy Type | # Households | Median Income |
| Owner-Occupied | 2,849 (43.6%) | $69,775 |
| Renter-Occupied | 3,681 (56.4%) | $33,666 |
| Average | 6,530 (100.0%) | $47,264 |
Occupancy by Householder Income Bracket in Ada
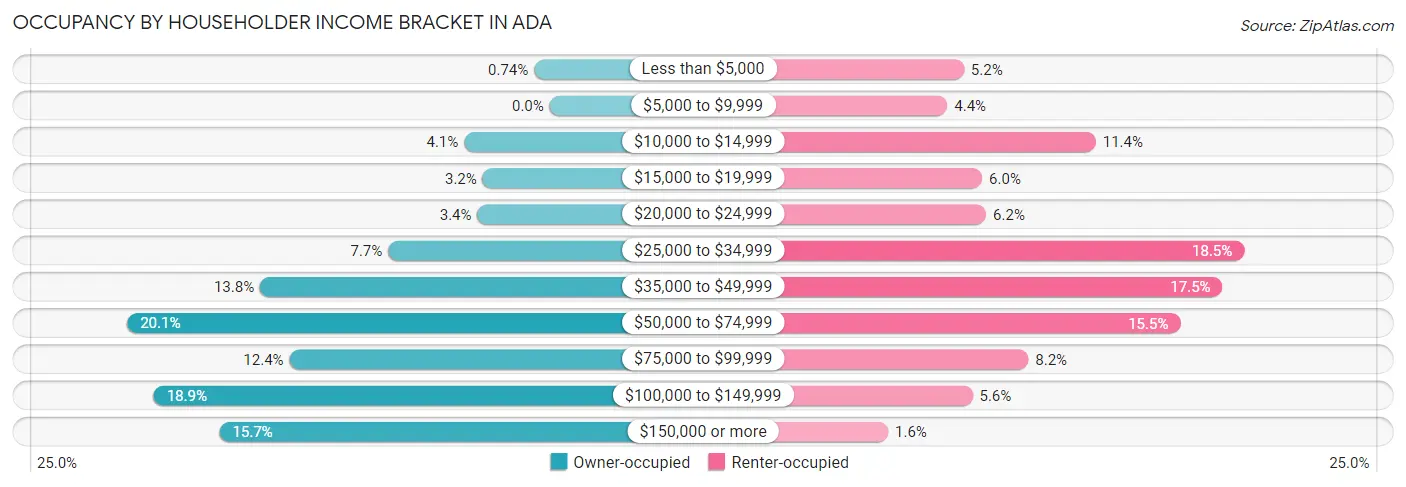
| Income Bracket | Owner-occupied | Renter-occupied |
| Less than $5,000 | 21 (0.7%) | 190 (5.2%) |
| $5,000 to $9,999 | 0 (0.0%) | 161 (4.4%) |
| $10,000 to $14,999 | 116 (4.1%) | 421 (11.4%) |
| $15,000 to $19,999 | 91 (3.2%) | 222 (6.0%) |
| $20,000 to $24,999 | 98 (3.4%) | 229 (6.2%) |
| $25,000 to $34,999 | 219 (7.7%) | 681 (18.5%) |
| $35,000 to $49,999 | 393 (13.8%) | 643 (17.5%) |
| $50,000 to $74,999 | 573 (20.1%) | 569 (15.5%) |
| $75,000 to $99,999 | 353 (12.4%) | 303 (8.2%) |
| $100,000 to $149,999 | 537 (18.9%) | 205 (5.6%) |
| $150,000 or more | 448 (15.7%) | 57 (1.5%) |
| Total | 2,849 (100.0%) | 3,681 (100.0%) |
Monthly Housing Cost Tiers in Ada
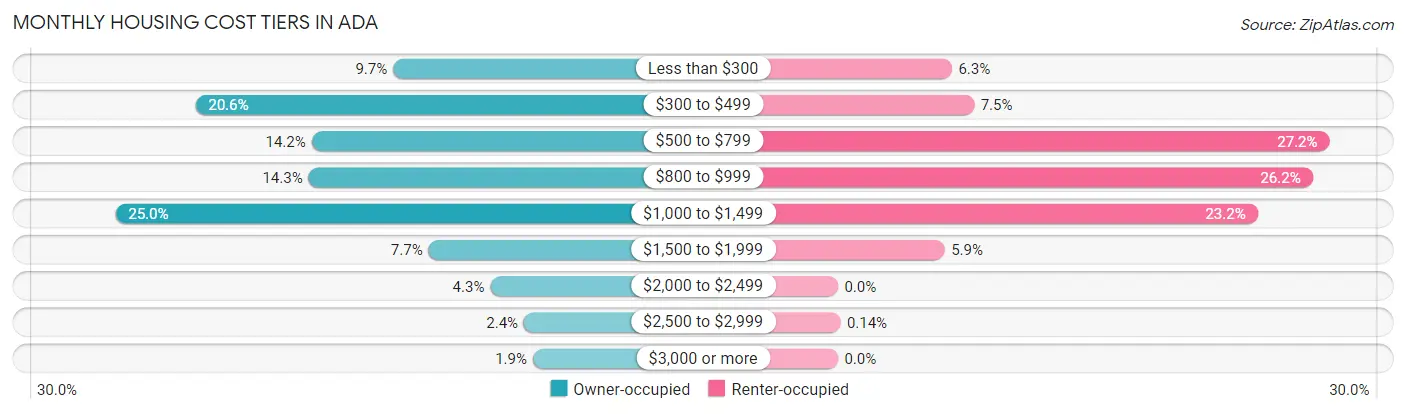
| Monthly Cost | Owner-occupied | Renter-occupied |
| Less than $300 | 275 (9.7%) | 232 (6.3%) |
| $300 to $499 | 586 (20.6%) | 277 (7.5%) |
| $500 to $799 | 403 (14.1%) | 1,000 (27.2%) |
| $800 to $999 | 408 (14.3%) | 966 (26.2%) |
| $1,000 to $1,499 | 712 (25.0%) | 854 (23.2%) |
| $1,500 to $1,999 | 219 (7.7%) | 217 (5.9%) |
| $2,000 to $2,499 | 122 (4.3%) | 0 (0.0%) |
| $2,500 to $2,999 | 69 (2.4%) | 5 (0.1%) |
| $3,000 or more | 55 (1.9%) | 0 (0.0%) |
| Total | 2,849 (100.0%) | 3,681 (100.0%) |
Physical Housing Characteristics in Ada
Housing Structures in Ada
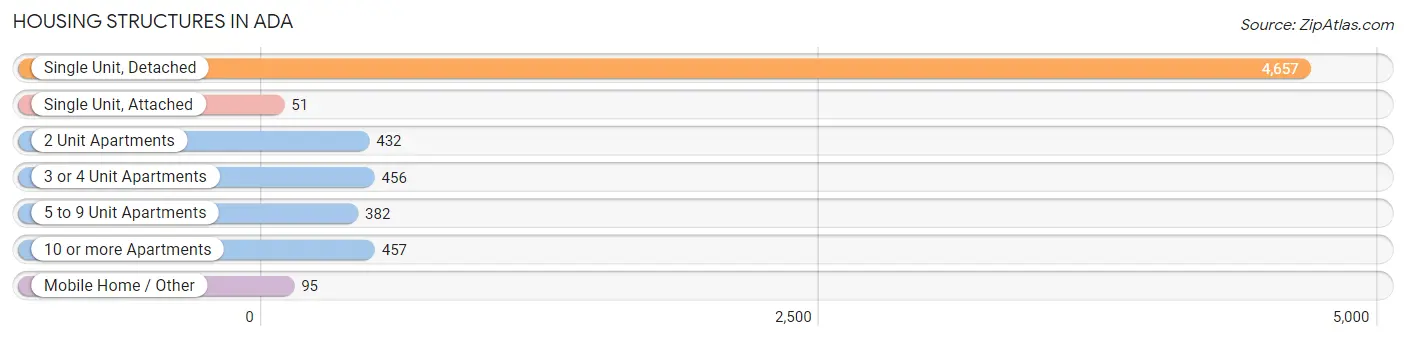
| Structure Type | # Housing Units | % Housing Units |
| Single Unit, Detached | 4,657 | 71.3% |
| Single Unit, Attached | 51 | 0.8% |
| 2 Unit Apartments | 432 | 6.6% |
| 3 or 4 Unit Apartments | 456 | 7.0% |
| 5 to 9 Unit Apartments | 382 | 5.9% |
| 10 or more Apartments | 457 | 7.0% |
| Mobile Home / Other | 95 | 1.5% |
| Total | 6,530 | 100.0% |
Housing Structures by Occupancy in Ada
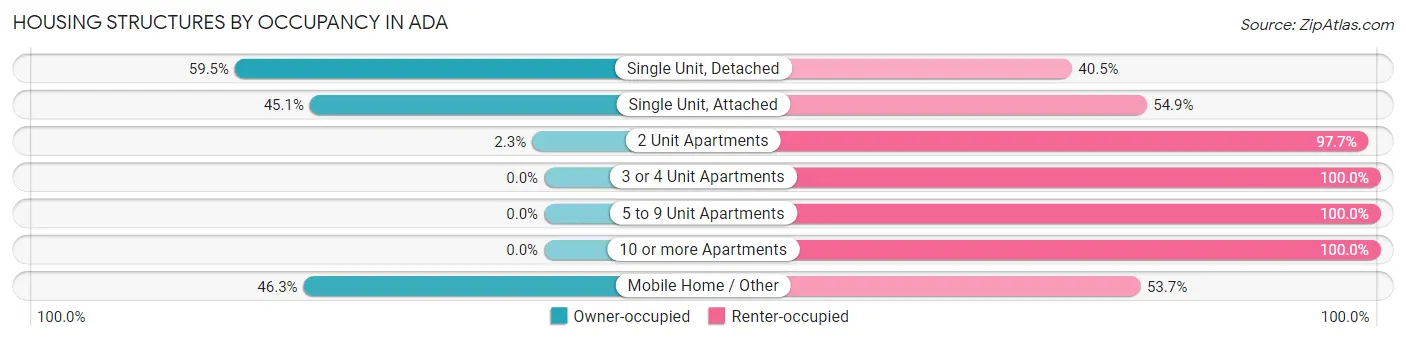
| Structure Type | Owner-occupied | Renter-occupied |
| Single Unit, Detached | 2,772 (59.5%) | 1,885 (40.5%) |
| Single Unit, Attached | 23 (45.1%) | 28 (54.9%) |
| 2 Unit Apartments | 10 (2.3%) | 422 (97.7%) |
| 3 or 4 Unit Apartments | 0 (0.0%) | 456 (100.0%) |
| 5 to 9 Unit Apartments | 0 (0.0%) | 382 (100.0%) |
| 10 or more Apartments | 0 (0.0%) | 457 (100.0%) |
| Mobile Home / Other | 44 (46.3%) | 51 (53.7%) |
| Total | 2,849 (43.6%) | 3,681 (56.4%) |
Housing Structures by Number of Rooms in Ada
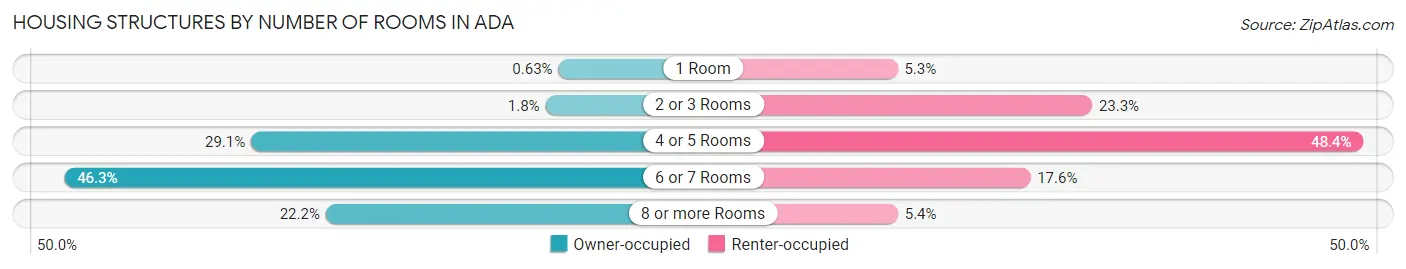
| Number of Rooms | Owner-occupied | Renter-occupied |
| 1 Room | 18 (0.6%) | 196 (5.3%) |
| 2 or 3 Rooms | 52 (1.8%) | 858 (23.3%) |
| 4 or 5 Rooms | 828 (29.1%) | 1,782 (48.4%) |
| 6 or 7 Rooms | 1,320 (46.3%) | 648 (17.6%) |
| 8 or more Rooms | 631 (22.2%) | 197 (5.3%) |
| Total | 2,849 (100.0%) | 3,681 (100.0%) |
Housing Structure by Heating Type in Ada
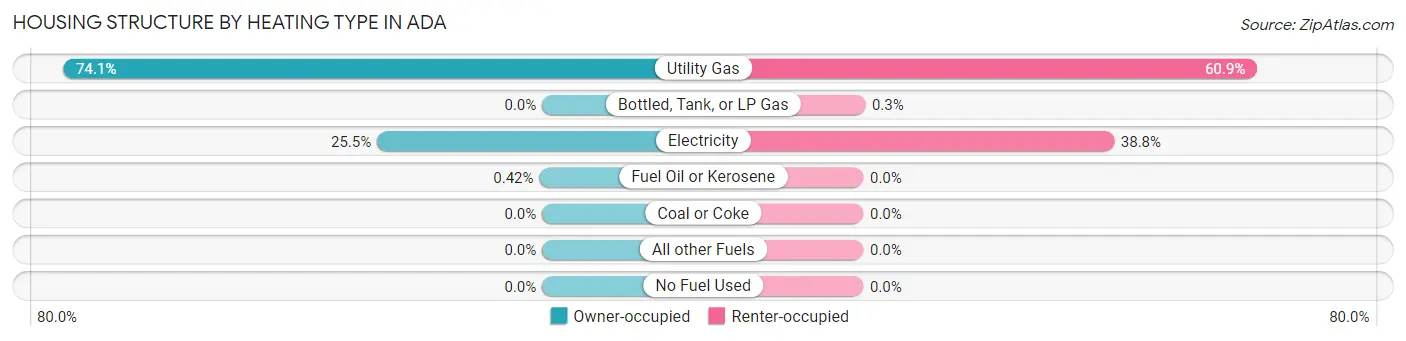
| Heating Type | Owner-occupied | Renter-occupied |
| Utility Gas | 2,110 (74.1%) | 2,243 (60.9%) |
| Bottled, Tank, or LP Gas | 0 (0.0%) | 11 (0.3%) |
| Electricity | 727 (25.5%) | 1,427 (38.8%) |
| Fuel Oil or Kerosene | 12 (0.4%) | 0 (0.0%) |
| Coal or Coke | 0 (0.0%) | 0 (0.0%) |
| All other Fuels | 0 (0.0%) | 0 (0.0%) |
| No Fuel Used | 0 (0.0%) | 0 (0.0%) |
| Total | 2,849 (100.0%) | 3,681 (100.0%) |
Household Vehicle Usage in Ada
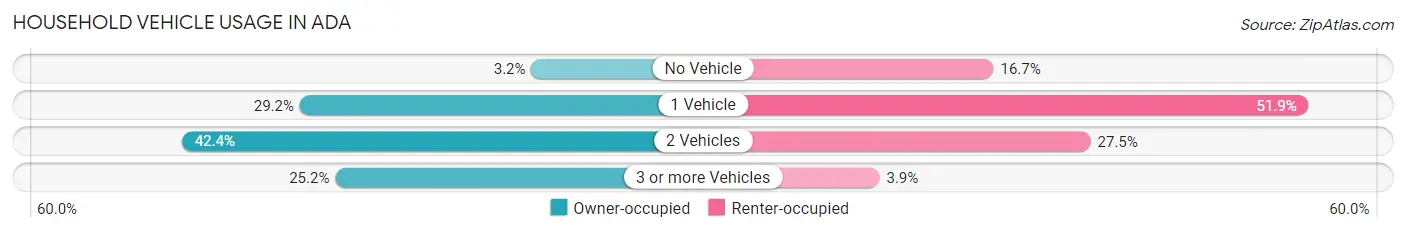
| Vehicles per Household | Owner-occupied | Renter-occupied |
| No Vehicle | 92 (3.2%) | 613 (16.7%) |
| 1 Vehicle | 831 (29.2%) | 1,912 (51.9%) |
| 2 Vehicles | 1,208 (42.4%) | 1,013 (27.5%) |
| 3 or more Vehicles | 718 (25.2%) | 143 (3.9%) |
| Total | 2,849 (100.0%) | 3,681 (100.0%) |
Real Estate & Mortgages in Ada
Real Estate and Mortgage Overview in Ada
| Characteristic | Without Mortgage | With Mortgage |
| Housing Units | 1,198 | 1,651 |
| Median Property Value | $120,300 | $139,000 |
| Median Household Income | $56,111 | $356 |
| Monthly Housing Costs | $420 | $55 |
| Real Estate Taxes | $668 | $47 |
Property Value by Mortgage Status in Ada
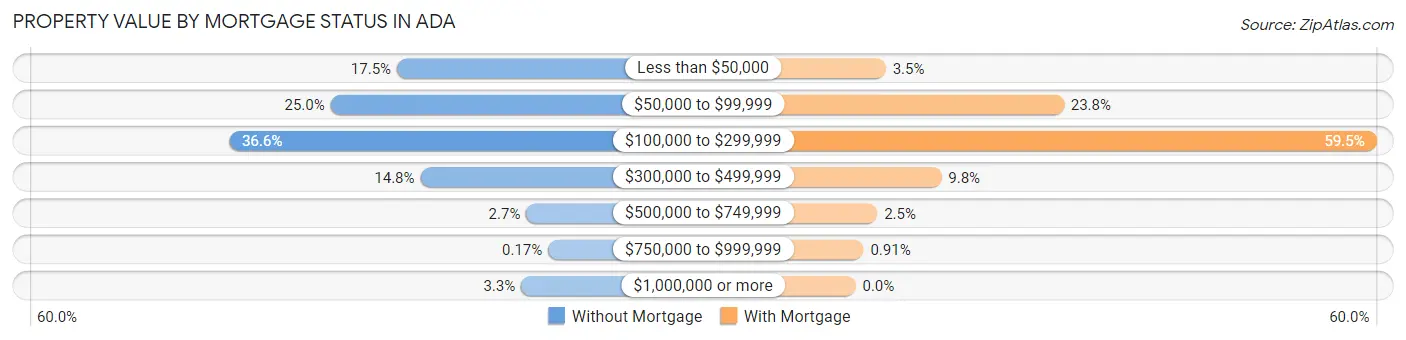
| Property Value | Without Mortgage | With Mortgage |
| Less than $50,000 | 209 (17.4%) | 57 (3.5%) |
| $50,000 to $99,999 | 300 (25.0%) | 393 (23.8%) |
| $100,000 to $299,999 | 439 (36.6%) | 983 (59.5%) |
| $300,000 to $499,999 | 177 (14.8%) | 162 (9.8%) |
| $500,000 to $749,999 | 32 (2.7%) | 41 (2.5%) |
| $750,000 to $999,999 | 2 (0.2%) | 15 (0.9%) |
| $1,000,000 or more | 39 (3.3%) | 0 (0.0%) |
| Total | 1,198 (100.0%) | 1,651 (100.0%) |
Household Income by Mortgage Status in Ada
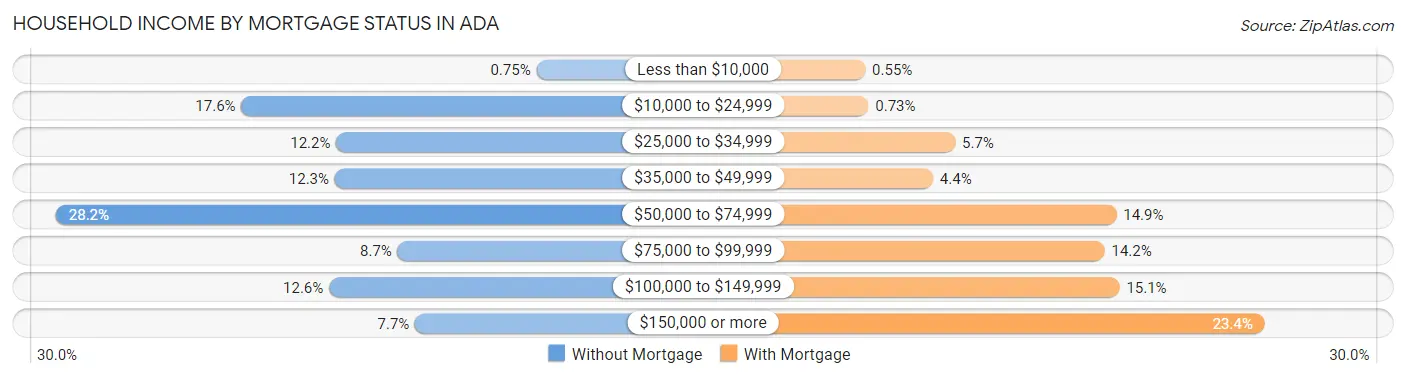
| Household Income | Without Mortgage | With Mortgage |
| Less than $10,000 | 9 (0.7%) | 9 (0.5%) |
| $10,000 to $24,999 | 211 (17.6%) | 12 (0.7%) |
| $25,000 to $34,999 | 146 (12.2%) | 94 (5.7%) |
| $35,000 to $49,999 | 147 (12.3%) | 73 (4.4%) |
| $50,000 to $74,999 | 338 (28.2%) | 246 (14.9%) |
| $75,000 to $99,999 | 104 (8.7%) | 235 (14.2%) |
| $100,000 to $149,999 | 151 (12.6%) | 249 (15.1%) |
| $150,000 or more | 92 (7.7%) | 386 (23.4%) |
| Total | 1,198 (100.0%) | 1,651 (100.0%) |
Property Value to Household Income Ratio in Ada
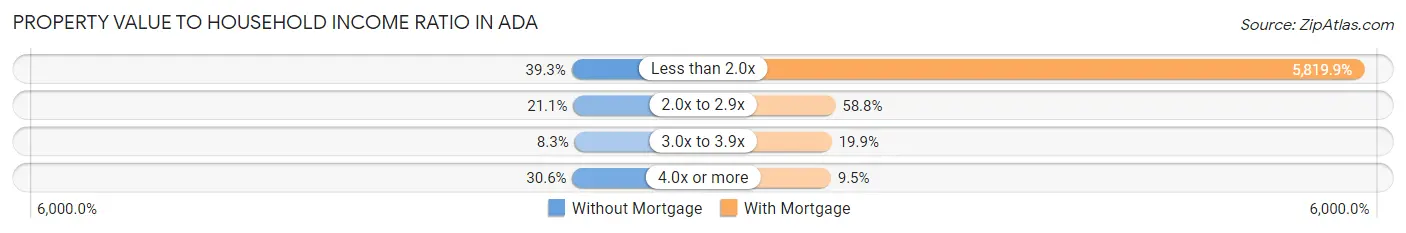
| Value-to-Income Ratio | Without Mortgage | With Mortgage |
| Less than 2.0x | 471 (39.3%) | 96,086 (5,819.9%) |
| 2.0x to 2.9x | 253 (21.1%) | 970 (58.8%) |
| 3.0x to 3.9x | 99 (8.3%) | 329 (19.9%) |
| 4.0x or more | 366 (30.5%) | 156 (9.5%) |
| Total | 1,198 (100.0%) | 1,651 (100.0%) |
Real Estate Taxes by Mortgage Status in Ada
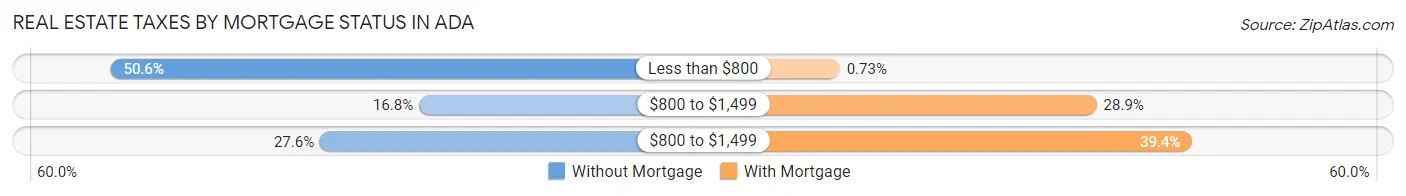
| Property Taxes | Without Mortgage | With Mortgage |
| Less than $800 | 606 (50.6%) | 12 (0.7%) |
| $800 to $1,499 | 201 (16.8%) | 477 (28.9%) |
| $800 to $1,499 | 331 (27.6%) | 650 (39.4%) |
| Total | 1,198 (100.0%) | 1,651 (100.0%) |
Health & Disability in Ada
Health Insurance Coverage by Age in Ada
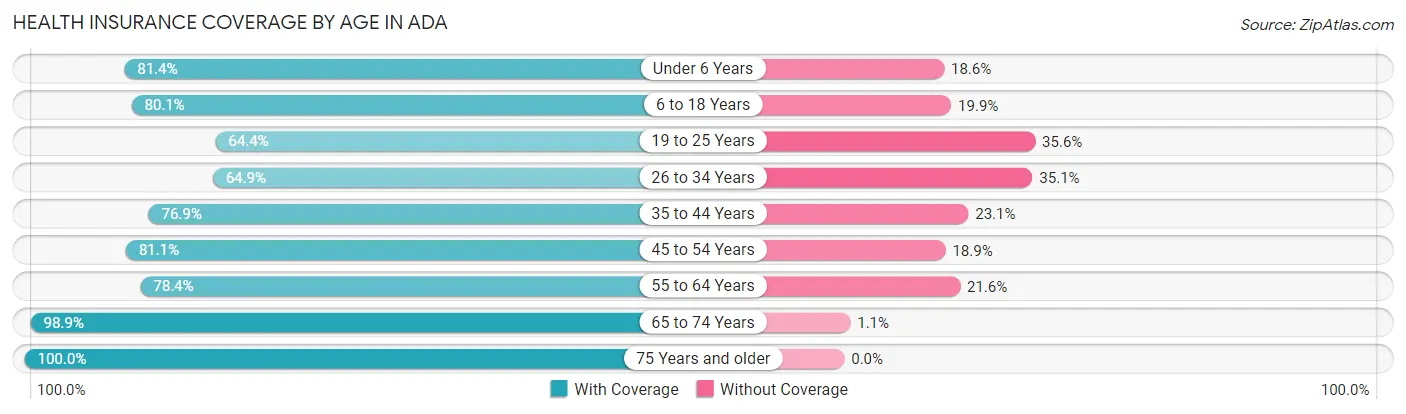
| Age Bracket | With Coverage | Without Coverage |
| Under 6 Years | 1,059 (81.4%) | 242 (18.6%) |
| 6 to 18 Years | 2,487 (80.1%) | 619 (19.9%) |
| 19 to 25 Years | 1,484 (64.4%) | 820 (35.6%) |
| 26 to 34 Years | 1,390 (64.9%) | 751 (35.1%) |
| 35 to 44 Years | 1,530 (76.9%) | 460 (23.1%) |
| 45 to 54 Years | 1,354 (81.1%) | 315 (18.9%) |
| 55 to 64 Years | 1,155 (78.4%) | 318 (21.6%) |
| 65 to 74 Years | 1,238 (98.9%) | 14 (1.1%) |
| 75 Years and older | 848 (100.0%) | 0 (0.0%) |
| Total | 12,545 (78.0%) | 3,539 (22.0%) |
Health Insurance Coverage by Citizenship Status in Ada
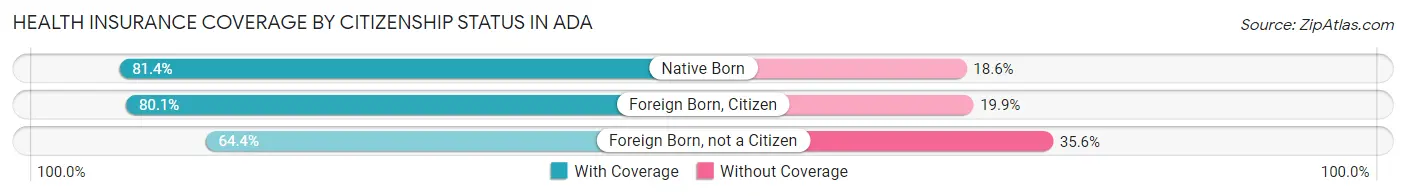
| Citizenship Status | With Coverage | Without Coverage |
| Native Born | 1,059 (81.4%) | 242 (18.6%) |
| Foreign Born, Citizen | 2,487 (80.1%) | 619 (19.9%) |
| Foreign Born, not a Citizen | 1,484 (64.4%) | 820 (35.6%) |
Health Insurance Coverage by Household Income in Ada
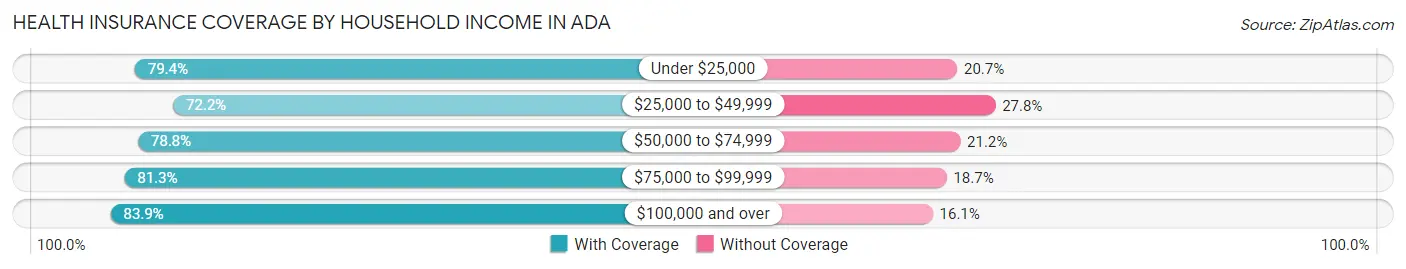
| Household Income | With Coverage | Without Coverage |
| Under $25,000 | 2,063 (79.3%) | 537 (20.6%) |
| $25,000 to $49,999 | 2,751 (72.2%) | 1,059 (27.8%) |
| $50,000 to $74,999 | 2,341 (78.8%) | 631 (21.2%) |
| $75,000 to $99,999 | 1,519 (81.3%) | 349 (18.7%) |
| $100,000 and over | 3,444 (83.9%) | 660 (16.1%) |
Public vs Private Health Insurance Coverage by Age in Ada
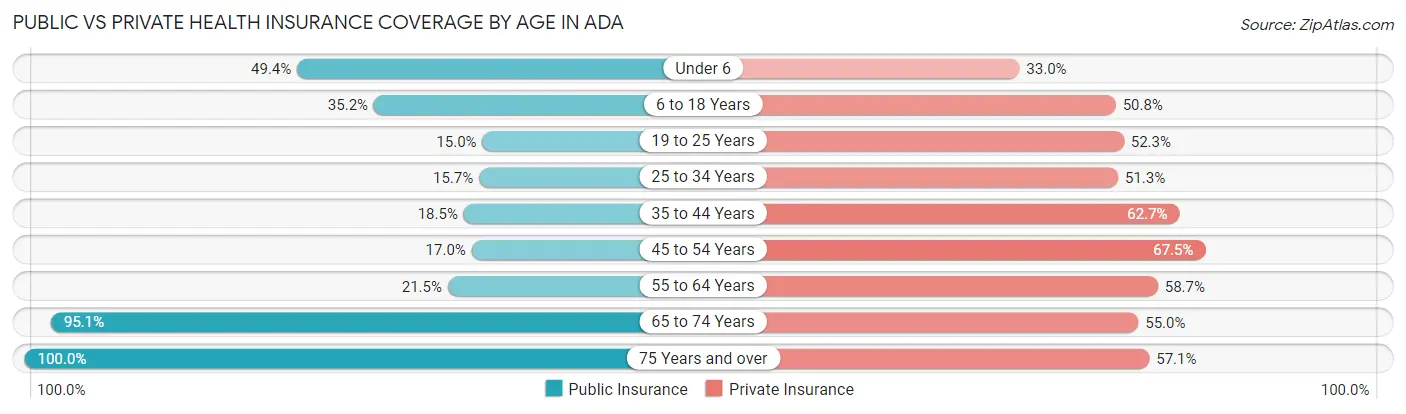
| Age Bracket | Public Insurance | Private Insurance |
| Under 6 | 643 (49.4%) | 429 (33.0%) |
| 6 to 18 Years | 1,092 (35.2%) | 1,579 (50.8%) |
| 19 to 25 Years | 346 (15.0%) | 1,206 (52.3%) |
| 25 to 34 Years | 335 (15.7%) | 1,098 (51.3%) |
| 35 to 44 Years | 368 (18.5%) | 1,247 (62.7%) |
| 45 to 54 Years | 284 (17.0%) | 1,126 (67.5%) |
| 55 to 64 Years | 316 (21.4%) | 864 (58.7%) |
| 65 to 74 Years | 1,191 (95.1%) | 689 (55.0%) |
| 75 Years and over | 848 (100.0%) | 484 (57.1%) |
| Total | 5,423 (33.7%) | 8,722 (54.2%) |
Disability Status by Sex by Age in Ada
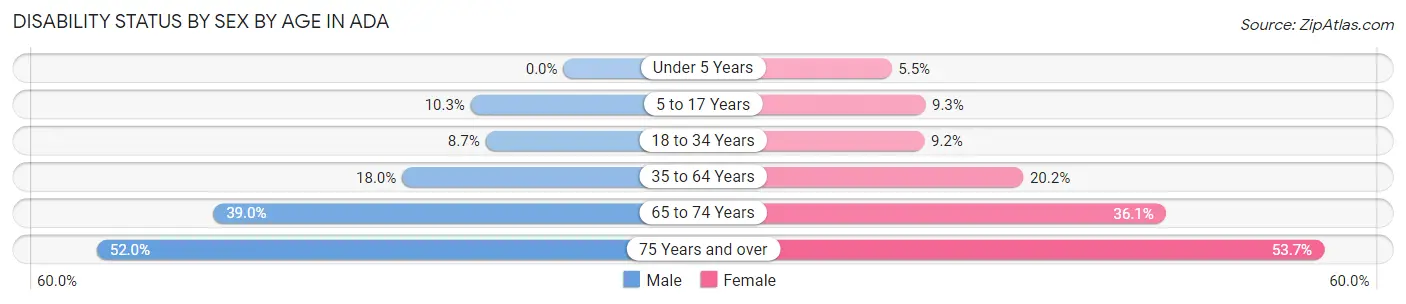
| Age Bracket | Male | Female |
| Under 5 Years | 0 (0.0%) | 29 (5.5%) |
| 5 to 17 Years | 144 (10.3%) | 142 (9.3%) |
| 18 to 34 Years | 208 (8.7%) | 221 (9.2%) |
| 35 to 64 Years | 434 (18.0%) | 548 (20.2%) |
| 65 to 74 Years | 193 (39.0%) | 273 (36.1%) |
| 75 Years and over | 159 (52.0%) | 291 (53.7%) |
Disability Class by Sex by Age in Ada
Disability Class: Hearing Difficulty
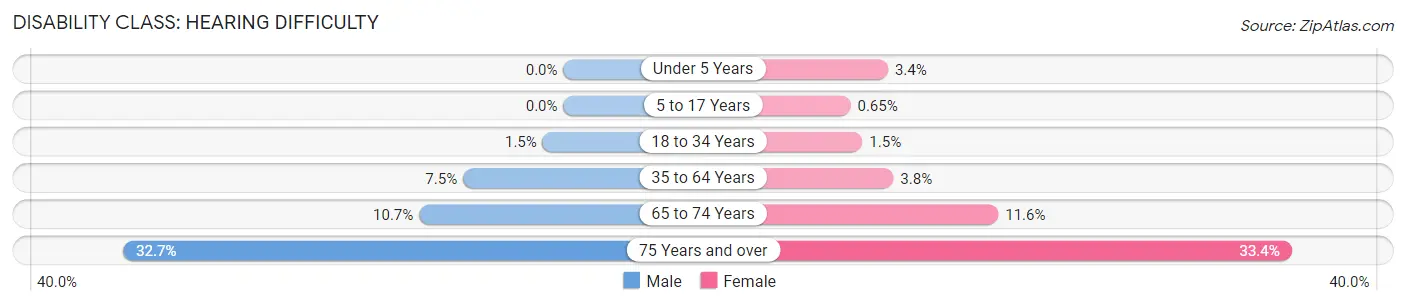
| Age Bracket | Male | Female |
| Under 5 Years | 0 (0.0%) | 18 (3.4%) |
| 5 to 17 Years | 0 (0.0%) | 10 (0.6%) |
| 18 to 34 Years | 37 (1.5%) | 37 (1.5%) |
| 35 to 64 Years | 180 (7.4%) | 104 (3.8%) |
| 65 to 74 Years | 53 (10.7%) | 88 (11.6%) |
| 75 Years and over | 100 (32.7%) | 181 (33.4%) |
Disability Class: Vision Difficulty
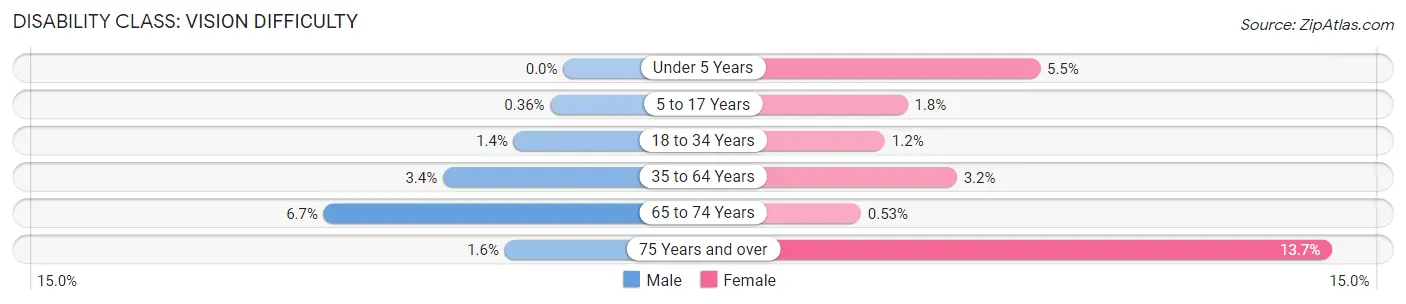
| Age Bracket | Male | Female |
| Under 5 Years | 0 (0.0%) | 29 (5.5%) |
| 5 to 17 Years | 5 (0.4%) | 28 (1.8%) |
| 18 to 34 Years | 33 (1.4%) | 29 (1.2%) |
| 35 to 64 Years | 81 (3.4%) | 87 (3.2%) |
| 65 to 74 Years | 33 (6.7%) | 4 (0.5%) |
| 75 Years and over | 5 (1.6%) | 74 (13.7%) |
Disability Class: Cognitive Difficulty
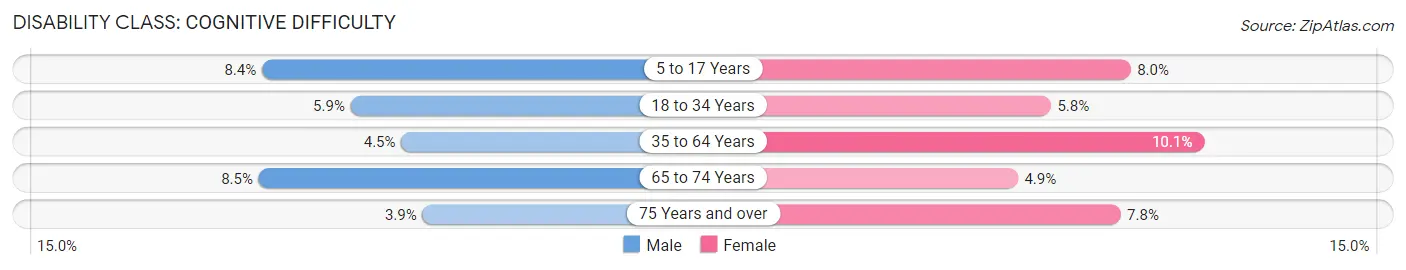
| Age Bracket | Male | Female |
| 5 to 17 Years | 117 (8.4%) | 123 (8.0%) |
| 18 to 34 Years | 142 (5.9%) | 140 (5.8%) |
| 35 to 64 Years | 109 (4.5%) | 274 (10.1%) |
| 65 to 74 Years | 42 (8.5%) | 37 (4.9%) |
| 75 Years and over | 12 (3.9%) | 42 (7.7%) |
Disability Class: Ambulatory Difficulty
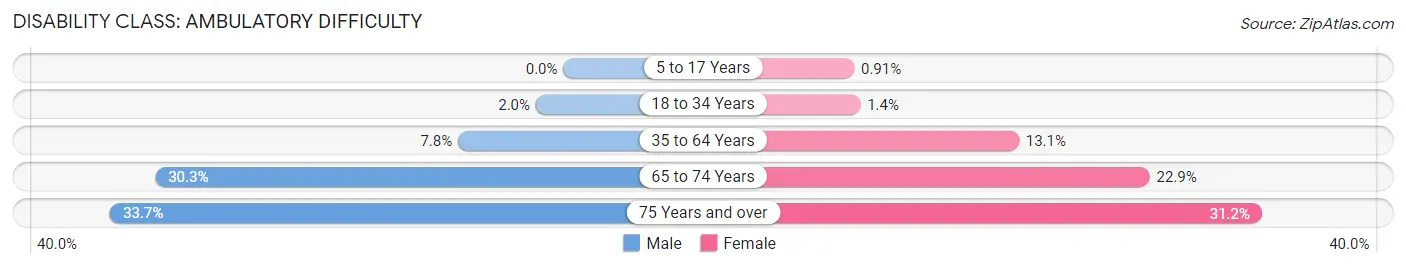
| Age Bracket | Male | Female |
| 5 to 17 Years | 0 (0.0%) | 14 (0.9%) |
| 18 to 34 Years | 49 (2.0%) | 33 (1.4%) |
| 35 to 64 Years | 189 (7.8%) | 357 (13.1%) |
| 65 to 74 Years | 150 (30.3%) | 173 (22.9%) |
| 75 Years and over | 103 (33.7%) | 169 (31.2%) |
Disability Class: Self-Care Difficulty
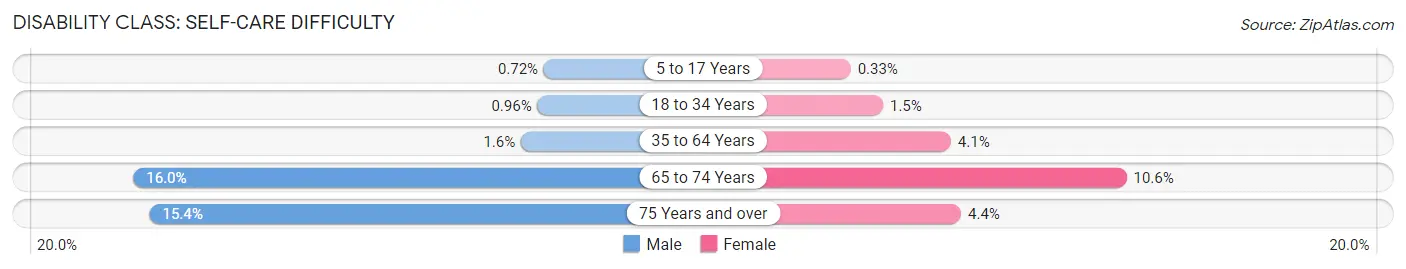
| Age Bracket | Male | Female |
| 5 to 17 Years | 10 (0.7%) | 5 (0.3%) |
| 18 to 34 Years | 23 (1.0%) | 37 (1.5%) |
| 35 to 64 Years | 38 (1.6%) | 110 (4.1%) |
| 65 to 74 Years | 79 (16.0%) | 80 (10.6%) |
| 75 Years and over | 47 (15.4%) | 24 (4.4%) |
Technology Access in Ada
Computing Device Access in Ada
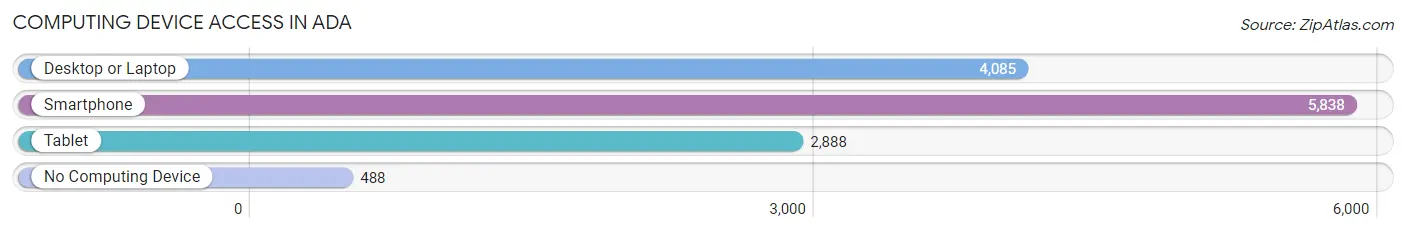
| Device Type | # Households | % Households |
| Desktop or Laptop | 4,085 | 62.6% |
| Smartphone | 5,838 | 89.4% |
| Tablet | 2,888 | 44.2% |
| No Computing Device | 488 | 7.5% |
| Total | 6,530 | 100.0% |
Internet Access in Ada
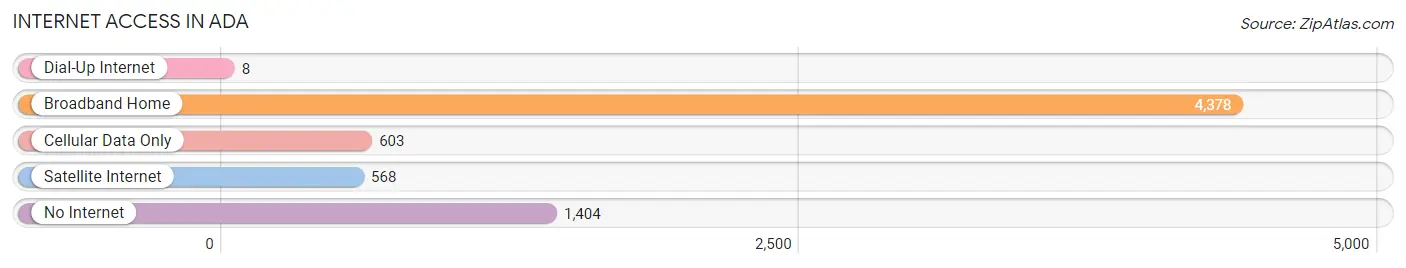
| Internet Type | # Households | % Households |
| Dial-Up Internet | 8 | 0.1% |
| Broadband Home | 4,378 | 67.0% |
| Cellular Data Only | 603 | 9.2% |
| Satellite Internet | 568 | 8.7% |
| No Internet | 1,404 | 21.5% |
| Total | 6,530 | 100.0% |
Ada Summary
Ada is a city located in Pontotoc County, Oklahoma, United States. It is the county seat of Pontotoc County and the principal city of the Ada Micropolitan Statistical Area, which includes all of Pontotoc County. The population was 16,810 at the 2010 census, an increase of 7.1 percent from 15,691 at the 2000 census.
History
Ada was named after the daughter of an early settler, Jeff Reed. The city was incorporated in 1901 and was designated as the county seat of Pontotoc County in 1907. The city was named after the daughter of an early settler, Jeff Reed.
The city was originally a trading post for the Chickasaw Nation. The city was also a major stop on the St. Louis-San Francisco Railway. The city was also the site of a major battle during the Civil War, the Battle of Ada.
Geography
Ada is located at 34°46'25" North, 96°40'17" West (34.773611, -96.671389). According to the United States Census Bureau, the city has a total area of 11.2 square miles (29.0 km2), of which 11.1 square miles (28.7 km2) is land and 0.1 square miles (0.3 km2) is water.
Economy
Ada is the home of East Central University, a public university with an enrollment of approximately 4,000 students. The city is also home to the headquarters of the Chickasaw Nation, one of the largest employers in the area. Other major employers include the Ada City Schools, the Ada Regional Medical Center, and the Ada News.
The city is also home to a variety of manufacturing and industrial businesses, including the Ada Industrial Park, which is home to several large companies.
Demographics
As of the census of 2000, there were 15,691 people, 6,093 households, and 3,845 families residing in the city. The population density was 1,417.2 people per square mile (546.9/km2). There were 6,717 housing units at an average density of 602.2 per square mile (232.3/km2). The racial makeup of the city was 75.2% White, 14.2% African American, 5.7% Native American, 0.7% Asian, 0.1% Pacific Islander, 1.2% from other races, and 3.0% from two or more races. Hispanic or Latino of any race were 3.2% of the population.
There were 6,093 households, out of which 28.2% had children under the age of 18 living with them, 45.2% were married couples living together, 14.2% had a female householder with no husband present, and 36.3% were non-families. 32.2% of all households were made up of individuals, and 14.2% had someone living alone who was 65 years of age or older. The average household size was 2.35 and the average family size was 2.97.
In the city, the population was spread out, with 22.9% under the age of 18, 16.2% from 18 to 24, 24.2% from 25 to 44, 19.7% from 45 to 64, and 17.0% who were 65 years of age or older. The median age was 34 years. For every 100 females, there were 87.2 males. For every 100 females age 18 and over, there were 82.9 males.
The median income for a household in the city was $26,845, and the median income for a family was $35,945. Males had a median income of $27,813 versus $20,813 for females. The per capita income for the city was $15,945. About 14.2% of families and 19.2% of the population were below the poverty line, including 25.2% of those under age 18 and 13.2% of those age 65 or over.
Common Questions
What is Per Capita Income in Ada?
Per Capita income in Ada is $27,159.
What is the Median Family Income in Ada?
Median Family Income in Ada is $64,075.
What is the Median Household income in Ada?
Median Household Income in Ada is $47,264.
What is Income or Wage Gap in Ada?
Income or Wage Gap in Ada is 17.1%.
Women in Ada earn 82.9 cents for every dollar earned by a man.
What is Family Income Deficit in Ada?
Family Income Deficit in Ada is $9,901.
Families that are below poverty line in Ada earn $9,901 less on average than the poverty threshold level.
What is Inequality or Gini Index in Ada?
Inequality or Gini Index in Ada is 0.47.
What is the Total Population of Ada?
Total Population of Ada is 16,537.
What is the Total Male Population of Ada?
Total Male Population of Ada is 7,821.
What is the Total Female Population of Ada?
Total Female Population of Ada is 8,716.
What is the Ratio of Males per 100 Females in Ada?
There are 89.73 Males per 100 Females in Ada.
What is the Ratio of Females per 100 Males in Ada?
There are 111.44 Females per 100 Males in Ada.
What is the Median Population Age in Ada?
Median Population Age in Ada is 32.4 Years.
What is the Average Family Size in Ada
Average Family Size in Ada is 3.1 People.
What is the Average Household Size in Ada
Average Household Size in Ada is 2.4 People.
How Large is the Labor Force in Ada?
There are 7,711 People in the Labor Forcein in Ada.
What is the Percentage of People in the Labor Force in Ada?
59.8% of People are in the Labor Force in Ada.
What is the Unemployment Rate in Ada?
Unemployment Rate in Ada is 4.8%.