Haskell, OK Map & Demographics
Haskell Map
Haskell Overview
$24,822
PER CAPITA INCOME
$59,628
AVG FAMILY INCOME
$35,119
AVG HOUSEHOLD INCOME
42.3%
WAGE / INCOME GAP [ % ]
57.7¢/ $1
WAGE / INCOME GAP [ $ ]
0.40
INEQUALITY / GINI INDEX
1,824
TOTAL POPULATION
726
MALE POPULATION
1,098
FEMALE POPULATION
66.12
MALES / 100 FEMALES
151.24
FEMALES / 100 MALES
47.4
MEDIAN AGE
3.1
AVG FAMILY SIZE
2.2
AVG HOUSEHOLD SIZE
583
LABOR FORCE [ PEOPLE ]
40.9%
PERCENT IN LABOR FORCE
7.4%
UNEMPLOYMENT RATE
Haskell Zip Codes
Haskell Area Codes
Income in Haskell
Income Overview in Haskell
Per Capita Income in Haskell is $24,822, while median incomes of families and households are $59,628 and $35,119 respectively.
| Characteristic | Number | Measure |
| Per Capita Income | 1,824 | $24,822 |
| Median Family Income | 415 | $59,628 |
| Mean Family Income | 415 | $72,844 |
| Median Household Income | 814 | $35,119 |
| Mean Household Income | 814 | $53,201 |
| Income Deficit | 415 | $0 |
| Wage / Income Gap (%) | 1,824 | 42.29% |
| Wage / Income Gap ($) | 1,824 | 57.71¢ per $1 |
| Gini / Inequality Index | 1,824 | 0.40 |
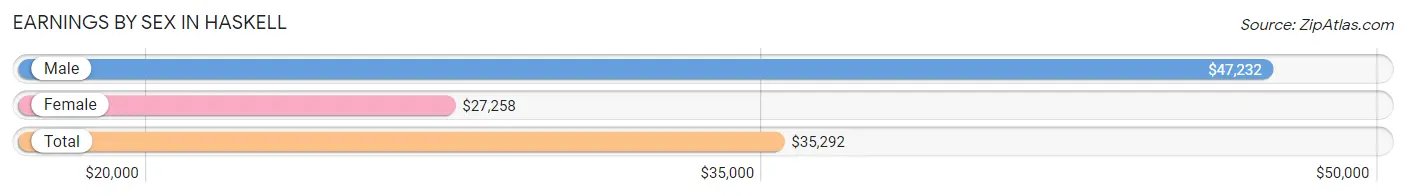
Earnings by Sex in Haskell
Average Earnings in Haskell are $35,292, $47,232 for men and $27,258 for women, a difference of 42.3%.
| Sex | Number | Average Earnings |
| Male | 293 (48.9%) | $47,232 |
| Female | 306 (51.1%) | $27,258 |
| Total | 599 (100.0%) | $35,292 |
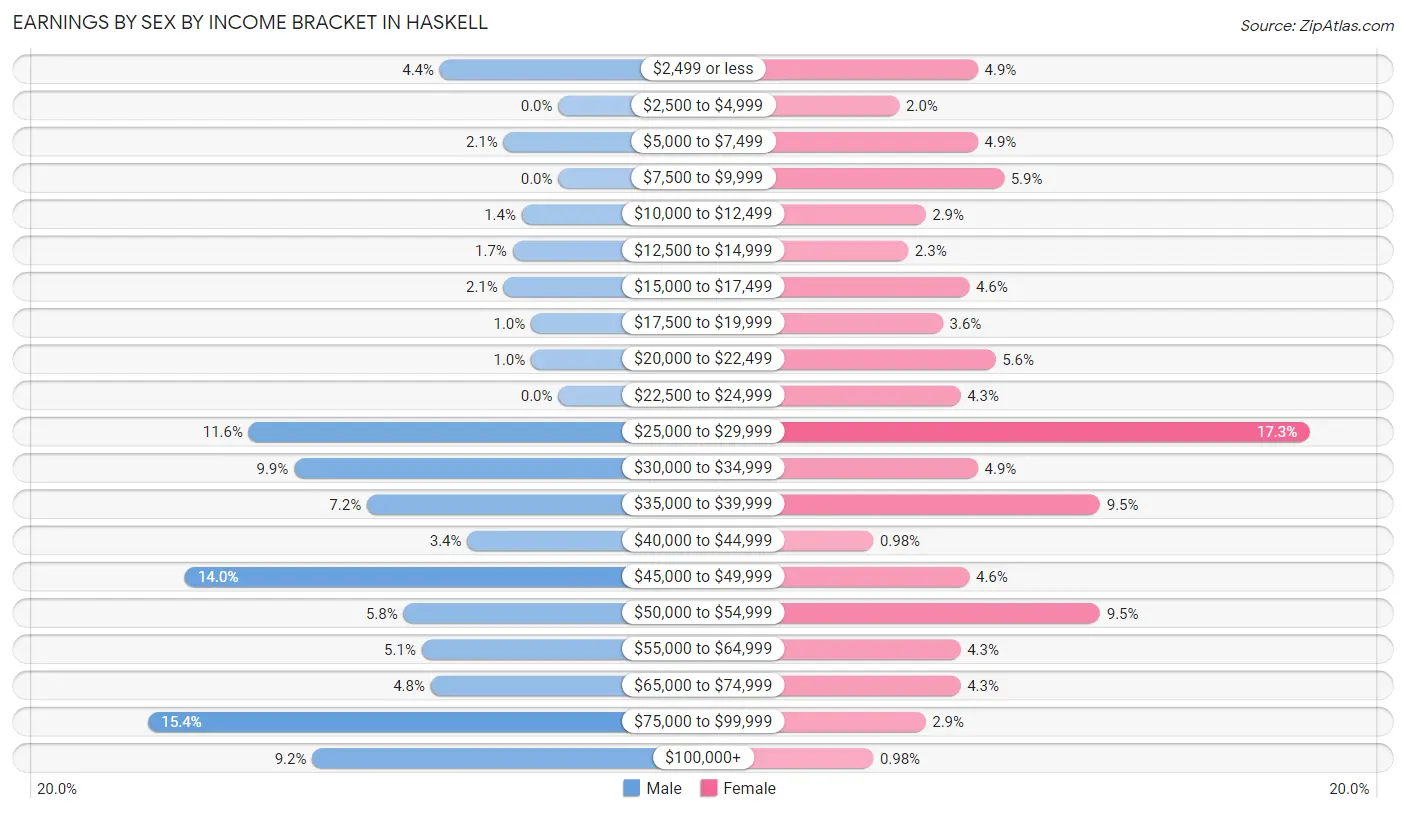
Earnings by Sex by Income Bracket in Haskell
The most common earnings brackets in Haskell are $75,000 to $99,999 for men (45 | 15.4%) and $25,000 to $29,999 for women (53 | 17.3%).
| Income | Male | Female |
| $2,499 or less | 13 (4.4%) | 15 (4.9%) |
| $2,500 to $4,999 | 0 (0.0%) | 6 (2.0%) |
| $5,000 to $7,499 | 6 (2.1%) | 15 (4.9%) |
| $7,500 to $9,999 | 0 (0.0%) | 18 (5.9%) |
| $10,000 to $12,499 | 4 (1.4%) | 9 (2.9%) |
| $12,500 to $14,999 | 5 (1.7%) | 7 (2.3%) |
| $15,000 to $17,499 | 6 (2.1%) | 14 (4.6%) |
| $17,500 to $19,999 | 3 (1.0%) | 11 (3.6%) |
| $20,000 to $22,499 | 3 (1.0%) | 17 (5.6%) |
| $22,500 to $24,999 | 0 (0.0%) | 13 (4.3%) |
| $25,000 to $29,999 | 34 (11.6%) | 53 (17.3%) |
| $30,000 to $34,999 | 29 (9.9%) | 15 (4.9%) |
| $35,000 to $39,999 | 21 (7.2%) | 29 (9.5%) |
| $40,000 to $44,999 | 10 (3.4%) | 3 (1.0%) |
| $45,000 to $49,999 | 41 (14.0%) | 14 (4.6%) |
| $50,000 to $54,999 | 17 (5.8%) | 29 (9.5%) |
| $55,000 to $64,999 | 15 (5.1%) | 13 (4.3%) |
| $65,000 to $74,999 | 14 (4.8%) | 13 (4.3%) |
| $75,000 to $99,999 | 45 (15.4%) | 9 (2.9%) |
| $100,000+ | 27 (9.2%) | 3 (1.0%) |
| Total | 293 (100.0%) | 306 (100.0%) |
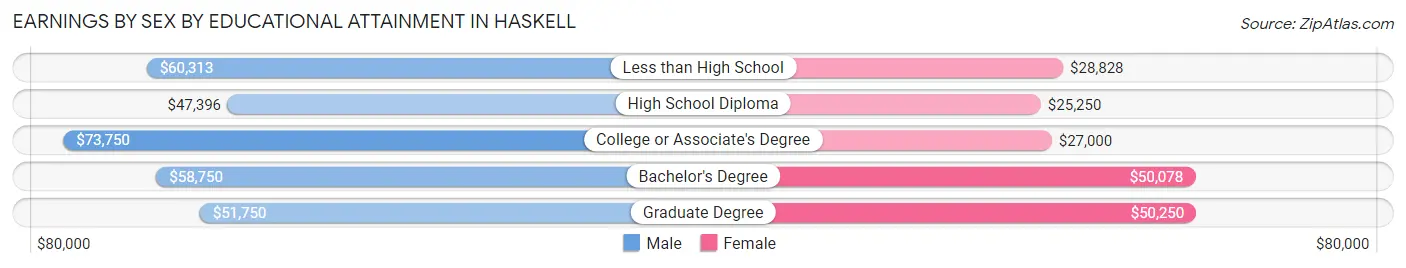
Earnings by Sex by Educational Attainment in Haskell
Average earnings in Haskell are $48,750 for men and $28,977 for women, a difference of 40.6%. Men with an educational attainment of college or associate's degree enjoy the highest average annual earnings of $73,750, while those with high school diploma education earn the least with $47,396. Women with an educational attainment of graduate degree earn the most with the average annual earnings of $50,250, while those with high school diploma education have the smallest earnings of $25,250.
| Educational Attainment | Male Income | Female Income |
| Less than High School | $60,313 | $28,828 |
| High School Diploma | $47,396 | $25,250 |
| College or Associate's Degree | $73,750 | $27,000 |
| Bachelor's Degree | $58,750 | $50,078 |
| Graduate Degree | $51,750 | $50,250 |
| Total | $48,750 | $28,977 |
Family Income in Haskell
Family Income Brackets in Haskell
According to the Haskell family income data, there are 89 families falling into the $50,000 to $74,999 income range, which is the most common income bracket and makes up 21.4% of all families. Conversely, the less than $10,000 income bracket is the least frequent group with only 6 families (1.5%) belonging to this category.
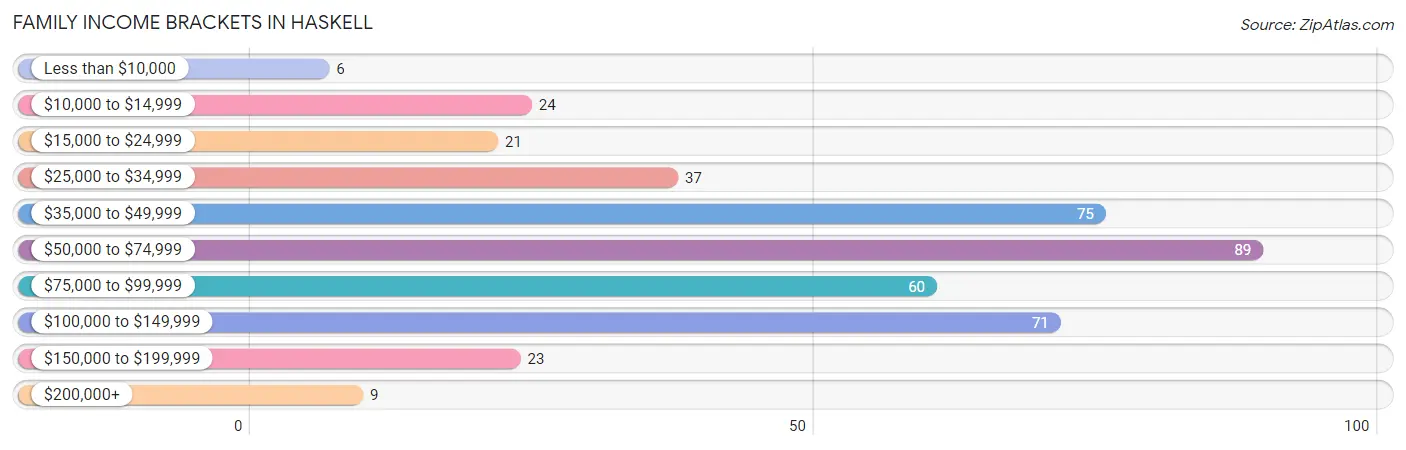
| Income Bracket | # Families | % Families |
| Less than $10,000 | 6 | 1.4% |
| $10,000 to $14,999 | 24 | 5.8% |
| $15,000 to $24,999 | 21 | 5.1% |
| $25,000 to $34,999 | 37 | 8.9% |
| $35,000 to $49,999 | 75 | 18.1% |
| $50,000 to $74,999 | 89 | 21.4% |
| $75,000 to $99,999 | 60 | 14.5% |
| $100,000 to $149,999 | 71 | 17.1% |
| $150,000 to $199,999 | 23 | 5.5% |
| $200,000+ | 9 | 2.2% |
Family Income by Famaliy Size in Haskell
6-person families (36 | 8.7%) account for the highest median family income in Haskell with $100,700 per family, while 2-person families (191 | 46.0%) have the highest median income of $29,375 per family member.
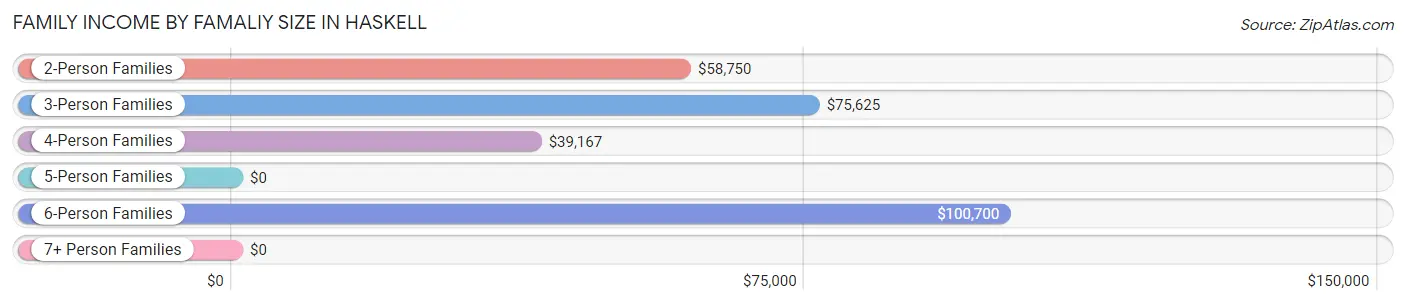
| Income Bracket | # Families | Median Income |
| 2-Person Families | 191 (46.0%) | $58,750 |
| 3-Person Families | 80 (19.3%) | $75,625 |
| 4-Person Families | 66 (15.9%) | $39,167 |
| 5-Person Families | 27 (6.5%) | $0 |
| 6-Person Families | 36 (8.7%) | $100,700 |
| 7+ Person Families | 15 (3.6%) | $0 |
| Total | 415 (100.0%) | $59,628 |
Family Income by Number of Earners in Haskell
The median family income in Haskell is $59,628, with families comprising 2 earners (149) having the highest median family income of $100,650, while families with 1 earner (135) have the lowest median family income of $39,886, accounting for 35.9% and 32.5% of families, respectively.
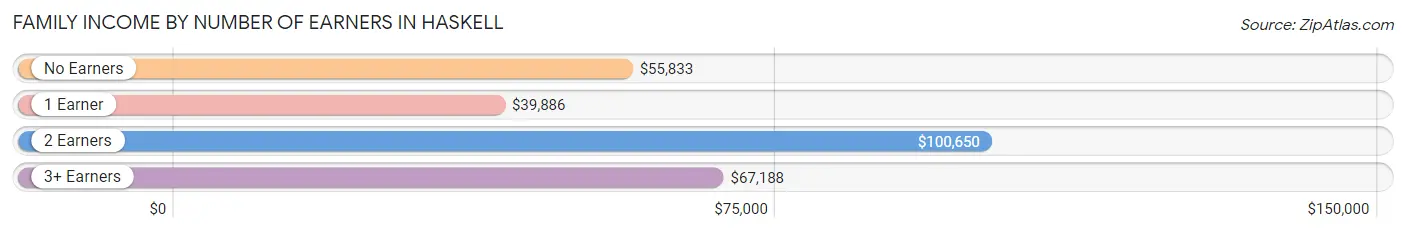
| Number of Earners | # Families | Median Income |
| No Earners | 104 (25.1%) | $55,833 |
| 1 Earner | 135 (32.5%) | $39,886 |
| 2 Earners | 149 (35.9%) | $100,650 |
| 3+ Earners | 27 (6.5%) | $67,188 |
| Total | 415 (100.0%) | $59,628 |
Household Income in Haskell
Household Income Brackets in Haskell
With 281 households falling in the category, the $25,000 to $34,999 income range is the most frequent in Haskell, accounting for 34.5% of all households. In contrast, only 9 households (1.1%) fall into the $200,000+ income bracket, making it the least populous group.
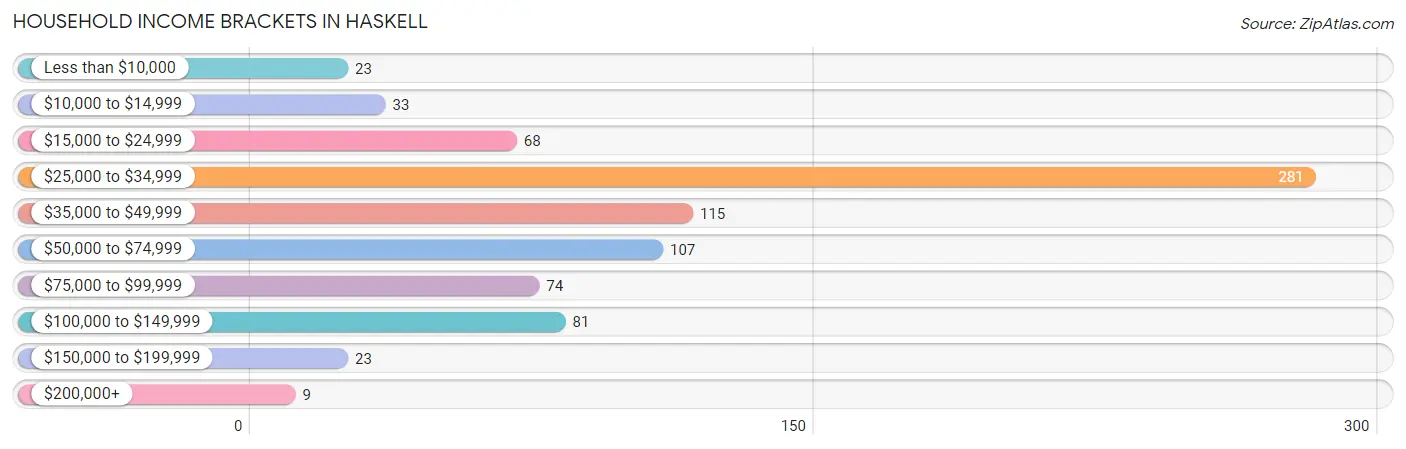
| Income Bracket | # Households | % Households |
| Less than $10,000 | 23 | 2.8% |
| $10,000 to $14,999 | 33 | 4.1% |
| $15,000 to $24,999 | 68 | 8.4% |
| $25,000 to $34,999 | 281 | 34.5% |
| $35,000 to $49,999 | 115 | 14.1% |
| $50,000 to $74,999 | 107 | 13.1% |
| $75,000 to $99,999 | 74 | 9.1% |
| $100,000 to $149,999 | 81 | 10.0% |
| $150,000 to $199,999 | 23 | 2.8% |
| $200,000+ | 9 | 1.1% |
Household Income by Householder Age in Haskell
The median household income in Haskell is $35,119, with the highest median household income of $65,833 found in the 45 to 64 years age bracket for the primary householder. A total of 236 households (29.0%) fall into this category. Meanwhile, the 65+ years age bracket for the primary householder has the lowest median household income of $26,578, with 392 households (48.2%) in this group.
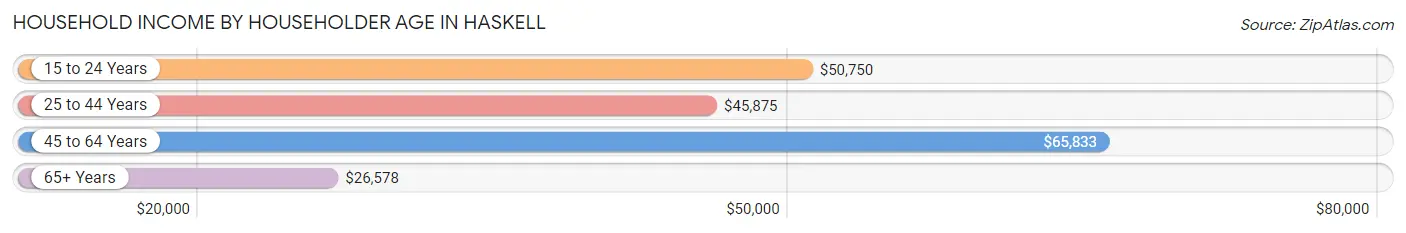
| Income Bracket | # Households | Median Income |
| 15 to 24 Years | 23 (2.8%) | $50,750 |
| 25 to 44 Years | 163 (20.0%) | $45,875 |
| 45 to 64 Years | 236 (29.0%) | $65,833 |
| 65+ Years | 392 (48.2%) | $26,578 |
| Total | 814 (100.0%) | $35,119 |
Poverty in Haskell
Income Below Poverty by Sex and Age in Haskell
With 17.1% poverty level for males and 21.0% for females among the residents of Haskell, under 5 year old males and 15 year old females are the most vulnerable to poverty, with 13 males (61.9%) and 8 females (88.9%) in their respective age groups living below the poverty level.
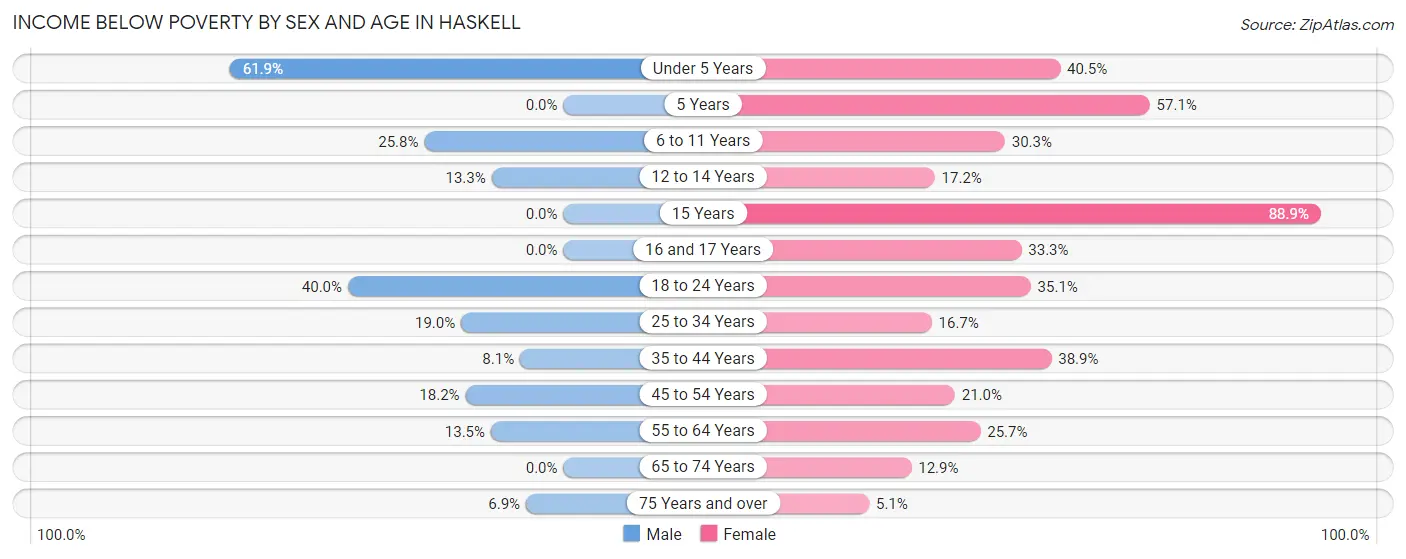
| Age Bracket | Male | Female |
| Under 5 Years | 13 (61.9%) | 32 (40.5%) |
| 5 Years | 0 (0.0%) | 4 (57.1%) |
| 6 to 11 Years | 32 (25.8%) | 23 (30.3%) |
| 12 to 14 Years | 4 (13.3%) | 5 (17.2%) |
| 15 Years | 0 (0.0%) | 8 (88.9%) |
| 16 and 17 Years | 0 (0.0%) | 5 (33.3%) |
| 18 to 24 Years | 16 (40.0%) | 27 (35.1%) |
| 25 to 34 Years | 15 (19.0%) | 15 (16.7%) |
| 35 to 44 Years | 7 (8.1%) | 28 (38.9%) |
| 45 to 54 Years | 16 (18.2%) | 30 (21.0%) |
| 55 to 64 Years | 14 (13.5%) | 18 (25.7%) |
| 65 to 74 Years | 0 (0.0%) | 8 (12.9%) |
| 75 Years and over | 5 (6.9%) | 16 (5.1%) |
| Total | 122 (17.1%) | 219 (21.0%) |
Income Above Poverty by Sex and Age in Haskell
According to the poverty statistics in Haskell, males aged 5 years and females aged 75 years and over are the age groups that are most secure financially, with 100.0% of males and 94.9% of females in these age groups living above the poverty line.
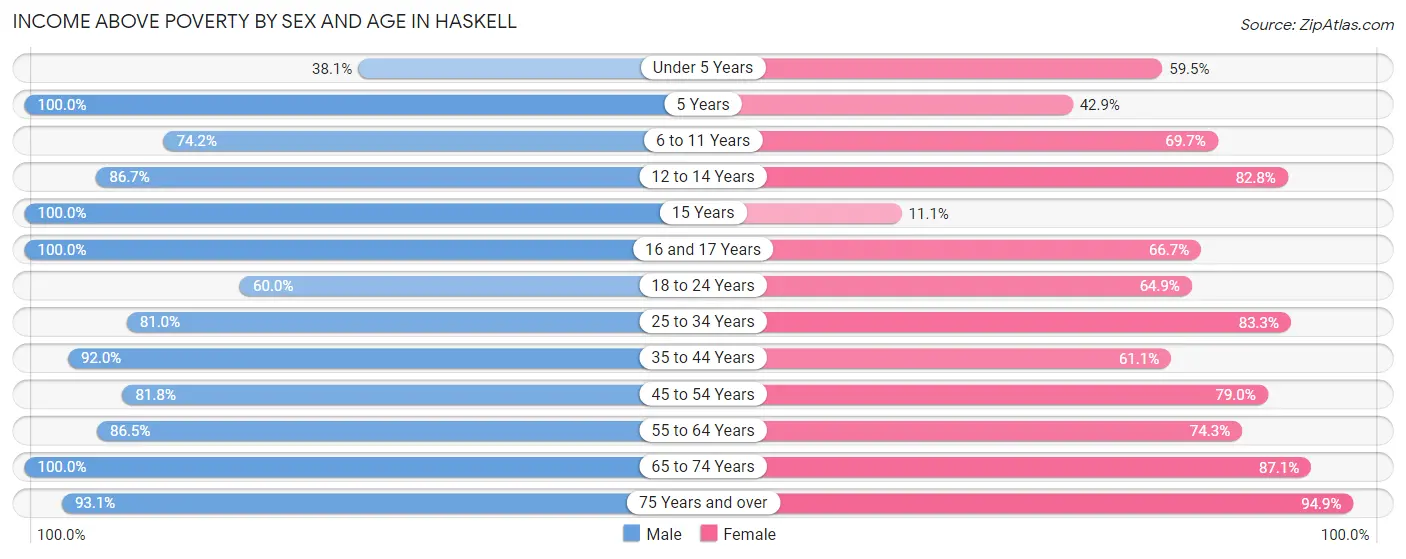
| Age Bracket | Male | Female |
| Under 5 Years | 8 (38.1%) | 47 (59.5%) |
| 5 Years | 4 (100.0%) | 3 (42.9%) |
| 6 to 11 Years | 92 (74.2%) | 53 (69.7%) |
| 12 to 14 Years | 26 (86.7%) | 24 (82.8%) |
| 15 Years | 19 (100.0%) | 1 (11.1%) |
| 16 and 17 Years | 23 (100.0%) | 10 (66.7%) |
| 18 to 24 Years | 24 (60.0%) | 50 (64.9%) |
| 25 to 34 Years | 64 (81.0%) | 75 (83.3%) |
| 35 to 44 Years | 80 (91.9%) | 44 (61.1%) |
| 45 to 54 Years | 72 (81.8%) | 113 (79.0%) |
| 55 to 64 Years | 90 (86.5%) | 52 (74.3%) |
| 65 to 74 Years | 23 (100.0%) | 54 (87.1%) |
| 75 Years and over | 67 (93.1%) | 300 (94.9%) |
| Total | 592 (82.9%) | 826 (79.0%) |
Income Below Poverty Among Married-Couple Families in Haskell
The poverty statistics for married-couple families in Haskell show that 8.0% or 23 of the total 287 families live below the poverty line. Families with 1 or 2 children have the highest poverty rate of 16.1%, comprising of 13 families. On the other hand, families with 5 or more children have the lowest poverty rate of 0.0%, which includes 0 families.
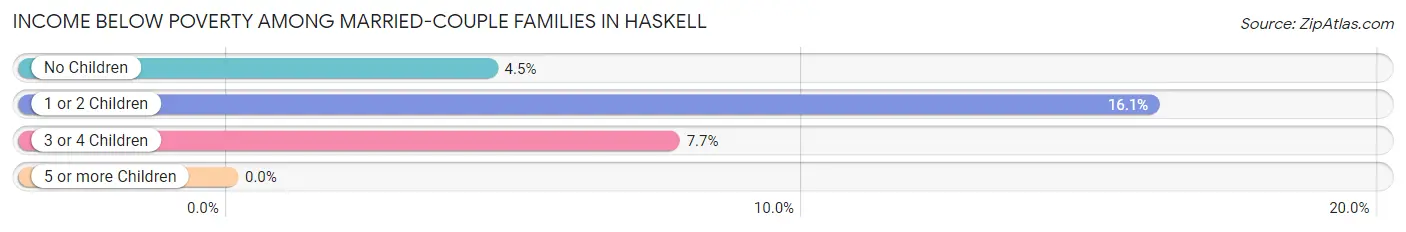
| Children | Above Poverty | Below Poverty |
| No Children | 148 (95.5%) | 7 (4.5%) |
| 1 or 2 Children | 68 (84.0%) | 13 (16.1%) |
| 3 or 4 Children | 36 (92.3%) | 3 (7.7%) |
| 5 or more Children | 12 (100.0%) | 0 (0.0%) |
| Total | 264 (92.0%) | 23 (8.0%) |
Income Below Poverty Among Single-Parent Households in Haskell
According to the poverty data in Haskell, 33.3% or 7 single-father households and 33.6% or 36 single-mother households are living below the poverty line. Among single-father households, those with no children have the highest poverty rate, with 4 households (36.4%) experiencing poverty. Likewise, among single-mother households, those with 3 or 4 children have the highest poverty rate, with 11 households (78.6%) falling below the poverty line.
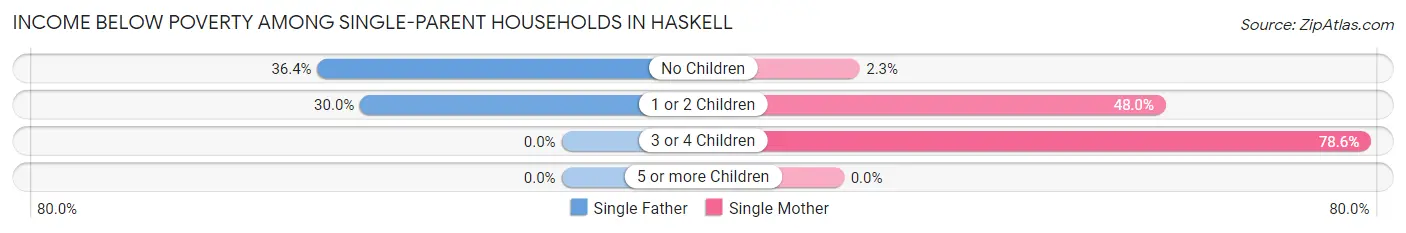
| Children | Single Father | Single Mother |
| No Children | 4 (36.4%) | 1 (2.3%) |
| 1 or 2 Children | 3 (30.0%) | 24 (48.0%) |
| 3 or 4 Children | 0 (0.0%) | 11 (78.6%) |
| 5 or more Children | 0 (0.0%) | 0 (0.0%) |
| Total | 7 (33.3%) | 36 (33.6%) |
Income Below Poverty Among Married-Couple vs Single-Parent Households in Haskell
The poverty data for Haskell shows that 23 of the married-couple family households (8.0%) and 43 of the single-parent households (33.6%) are living below the poverty level. Within the married-couple family households, those with 1 or 2 children have the highest poverty rate, with 13 households (16.1%) falling below the poverty line. Among the single-parent households, those with 3 or 4 children have the highest poverty rate, with 11 household (78.6%) living below poverty.
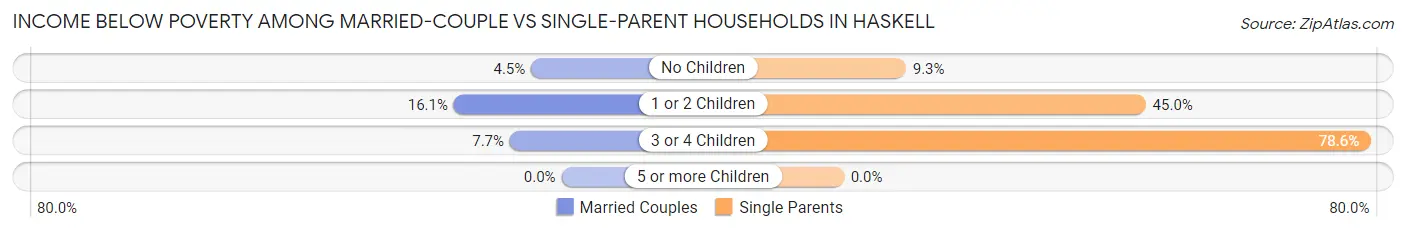
| Children | Married-Couple Families | Single-Parent Households |
| No Children | 7 (4.5%) | 5 (9.3%) |
| 1 or 2 Children | 13 (16.1%) | 27 (45.0%) |
| 3 or 4 Children | 3 (7.7%) | 11 (78.6%) |
| 5 or more Children | 0 (0.0%) | 0 (0.0%) |
| Total | 23 (8.0%) | 43 (33.6%) |
Race in Haskell
The most populous races in Haskell are White / Caucasian (1,390 | 76.2%), Native / Alaskan (176 | 9.7%), and Two or more Races (141 | 7.7%).
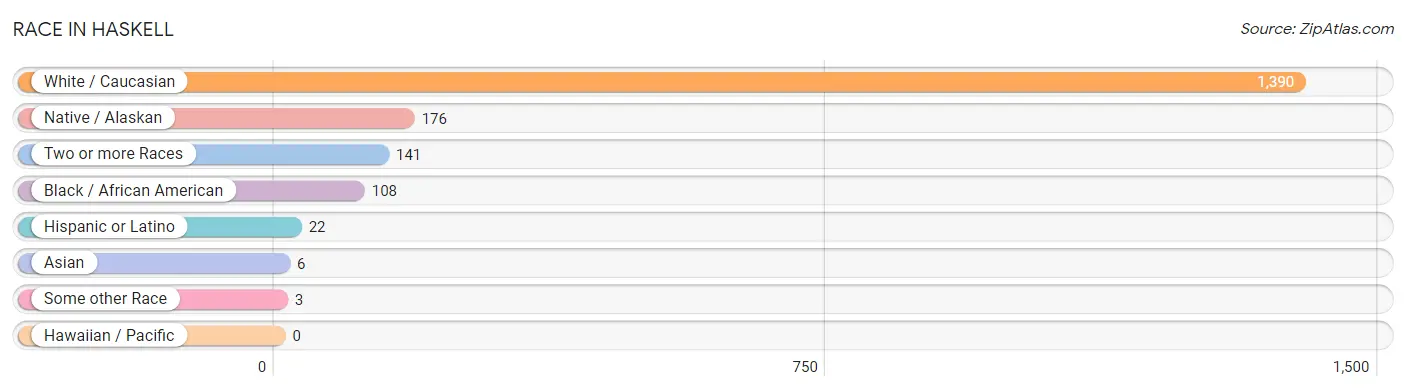
| Race | # Population | % Population |
| Asian | 6 | 0.3% |
| Black / African American | 108 | 5.9% |
| Hawaiian / Pacific | 0 | 0.0% |
| Hispanic or Latino | 22 | 1.2% |
| Native / Alaskan | 176 | 9.7% |
| White / Caucasian | 1,390 | 76.2% |
| Two or more Races | 141 | 7.7% |
| Some other Race | 3 | 0.2% |
| Total | 1,824 | 100.0% |
Ancestry in Haskell
The most populous ancestries reported in Haskell are American (358 | 19.6%), Irish (340 | 18.6%), English (233 | 12.8%), German (222 | 12.2%), and Cherokee (120 | 6.6%), together accounting for 69.8% of all Haskell residents.
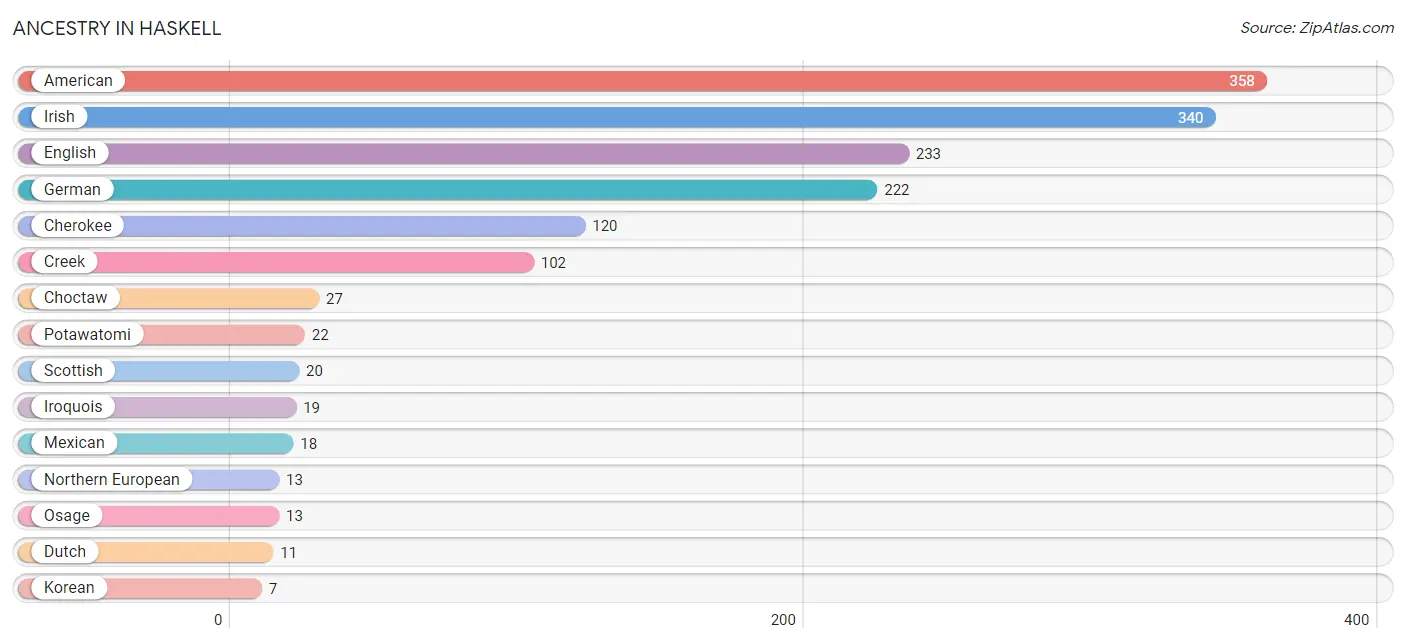
| Ancestry | # Population | % Population |
| American | 358 | 19.6% |
| Bhutanese | 6 | 0.3% |
| Canadian | 3 | 0.2% |
| Cherokee | 120 | 6.6% |
| Chickasaw | 2 | 0.1% |
| Choctaw | 27 | 1.5% |
| Creek | 102 | 5.6% |
| Danish | 4 | 0.2% |
| Dutch | 11 | 0.6% |
| English | 233 | 12.8% |
| Finnish | 3 | 0.2% |
| German | 222 | 12.2% |
| Irish | 340 | 18.6% |
| Iroquois | 19 | 1.0% |
| Italian | 5 | 0.3% |
| Korean | 7 | 0.4% |
| Mexican | 18 | 1.0% |
| Northern European | 13 | 0.7% |
| Osage | 13 | 0.7% |
| Polish | 3 | 0.2% |
| Potawatomi | 22 | 1.2% |
| Scandinavian | 3 | 0.2% |
| Scotch-Irish | 4 | 0.2% |
| Scottish | 20 | 1.1% |
| Slovene | 3 | 0.2% |
| Spaniard | 4 | 0.2% | View All 26 Rows |
Immigrants in Haskell
The most numerous immigrant groups reported in Haskell came from Latin America (5 | 0.3%), South America (5 | 0.3%), Asia (3 | 0.2%), Canada (3 | 0.2%), and China (3 | 0.2%), together accounting for 1.0% of all Haskell residents.
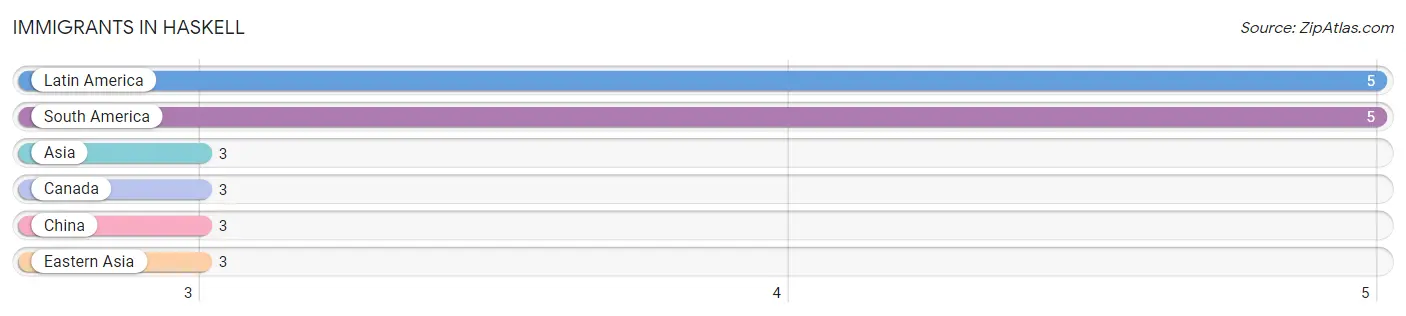
| Immigration Origin | # Population | % Population |
| Asia | 3 | 0.2% |
| Canada | 3 | 0.2% |
| China | 3 | 0.2% |
| Eastern Asia | 3 | 0.2% |
| Latin America | 5 | 0.3% |
| South America | 5 | 0.3% | View All 6 Rows |
Sex and Age in Haskell
Sex and Age in Haskell
The most populous age groups in Haskell are 5 to 9 Years (101 | 13.9%) for men and 75 to 79 Years (228 | 20.8%) for women.
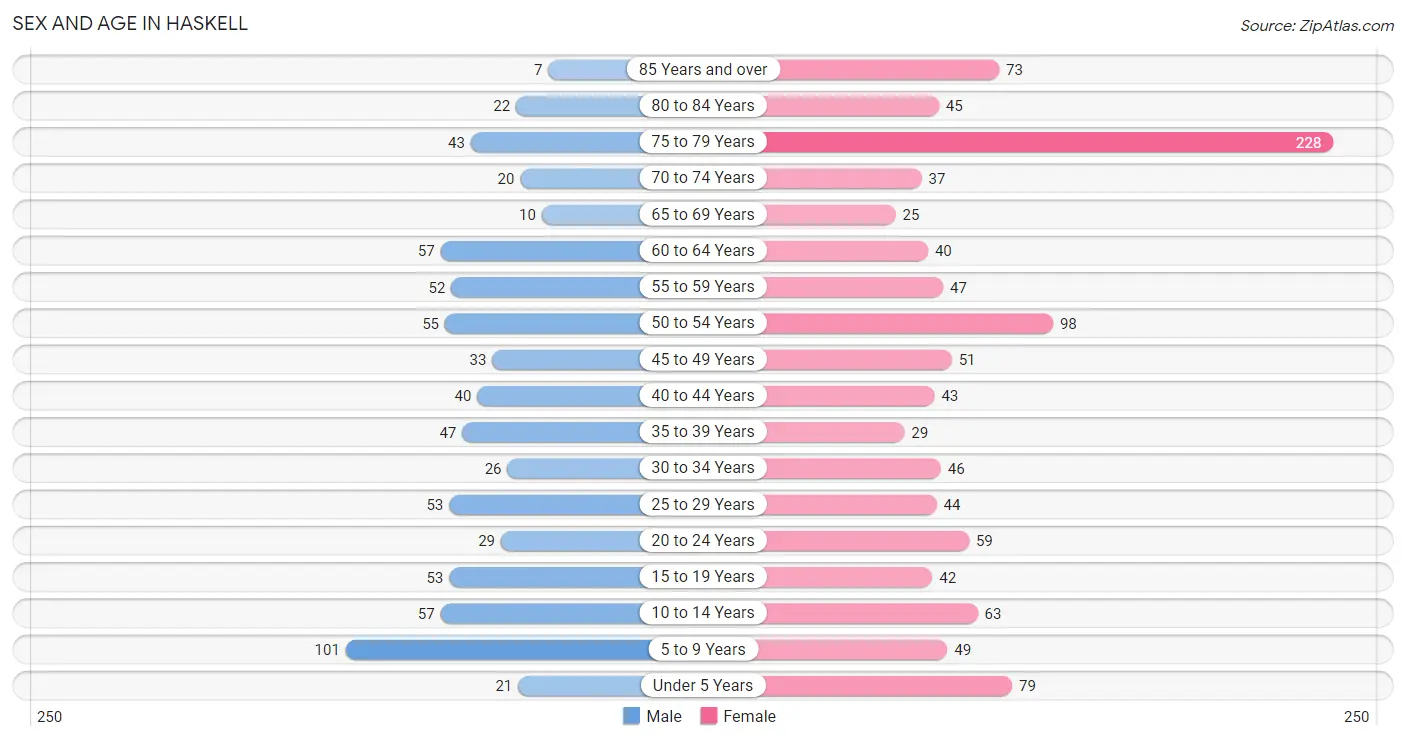
| Age Bracket | Male | Female |
| Under 5 Years | 21 (2.9%) | 79 (7.2%) |
| 5 to 9 Years | 101 (13.9%) | 49 (4.5%) |
| 10 to 14 Years | 57 (7.9%) | 63 (5.7%) |
| 15 to 19 Years | 53 (7.3%) | 42 (3.8%) |
| 20 to 24 Years | 29 (4.0%) | 59 (5.4%) |
| 25 to 29 Years | 53 (7.3%) | 44 (4.0%) |
| 30 to 34 Years | 26 (3.6%) | 46 (4.2%) |
| 35 to 39 Years | 47 (6.5%) | 29 (2.6%) |
| 40 to 44 Years | 40 (5.5%) | 43 (3.9%) |
| 45 to 49 Years | 33 (4.5%) | 51 (4.6%) |
| 50 to 54 Years | 55 (7.6%) | 98 (8.9%) |
| 55 to 59 Years | 52 (7.2%) | 47 (4.3%) |
| 60 to 64 Years | 57 (7.9%) | 40 (3.6%) |
| 65 to 69 Years | 10 (1.4%) | 25 (2.3%) |
| 70 to 74 Years | 20 (2.8%) | 37 (3.4%) |
| 75 to 79 Years | 43 (5.9%) | 228 (20.8%) |
| 80 to 84 Years | 22 (3.0%) | 45 (4.1%) |
| 85 Years and over | 7 (1.0%) | 73 (6.7%) |
| Total | 726 (100.0%) | 1,098 (100.0%) |
Families and Households in Haskell
Median Family Size in Haskell
The median family size in Haskell is 3.15 persons per family, with married-couple families (287 | 69.2%) accounting for the largest median family size of 3.38 persons per family. On the other hand, single male/father families (21 | 5.1%) represent the smallest median family size with 2.05 persons per family.
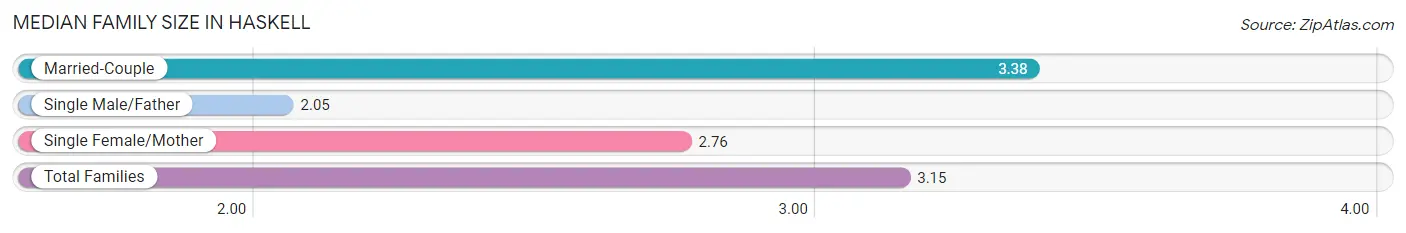
| Family Type | # Families | Family Size |
| Married-Couple | 287 (69.2%) | 3.38 |
| Single Male/Father | 21 (5.1%) | 2.05 |
| Single Female/Mother | 107 (25.8%) | 2.76 |
| Total Families | 415 (100.0%) | 3.15 |
Median Household Size in Haskell
The median household size in Haskell is 2.16 persons per household, with married-couple households (287 | 35.3%) accounting for the largest median household size of 3.38 persons per household. non-family households (399 | 49.0%) represent the smallest median household size with 1.09 persons per household.
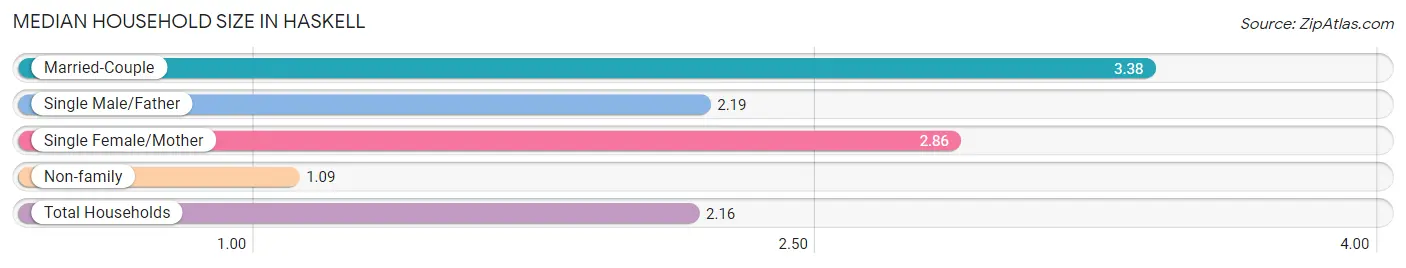
| Household Type | # Households | Household Size |
| Married-Couple | 287 (35.3%) | 3.38 |
| Single Male/Father | 21 (2.6%) | 2.19 |
| Single Female/Mother | 107 (13.1%) | 2.86 |
| Non-family | 399 (49.0%) | 1.09 |
| Total Households | 814 (100.0%) | 2.16 |
Household Size by Marriage Status in Haskell
Out of a total of 814 households in Haskell, 415 (51.0%) are family households, while 399 (49.0%) are nonfamily households. The most numerous type of family households are 2-person households, comprising 180, and the most common type of nonfamily households are 1-person households, comprising 379.
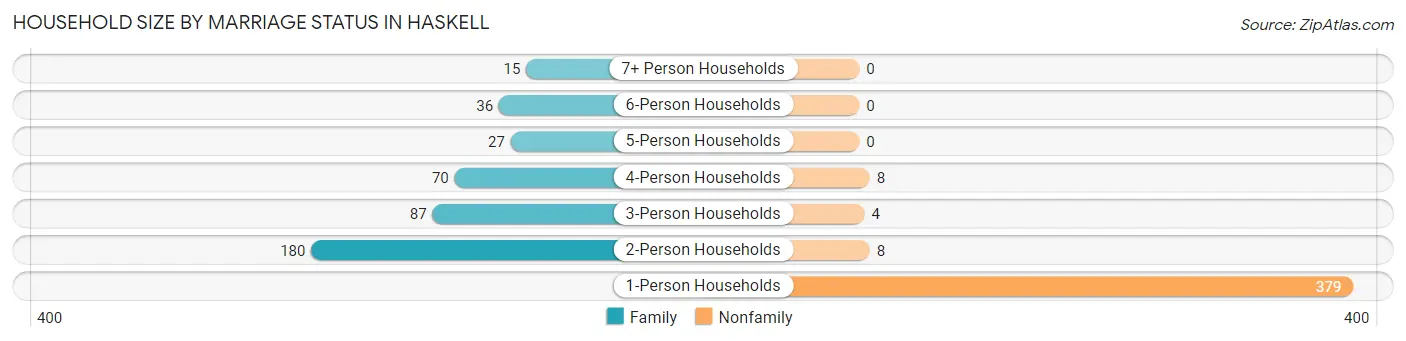
| Household Size | Family Households | Nonfamily Households |
| 1-Person Households | - | 379 (46.6%) |
| 2-Person Households | 180 (22.1%) | 8 (1.0%) |
| 3-Person Households | 87 (10.7%) | 4 (0.5%) |
| 4-Person Households | 70 (8.6%) | 8 (1.0%) |
| 5-Person Households | 27 (3.3%) | 0 (0.0%) |
| 6-Person Households | 36 (4.4%) | 0 (0.0%) |
| 7+ Person Households | 15 (1.8%) | 0 (0.0%) |
| Total | 415 (51.0%) | 399 (49.0%) |
Female Fertility in Haskell
Fertility by Age in Haskell
Average fertility rate in Haskell is 21.0 births per 1,000 women. Women in the age bracket of 20 to 34 years have the highest fertility rate with 47.0 births per 1,000 women. Women in the age bracket of 20 to 34 years acount for 100.0% of all women with births.
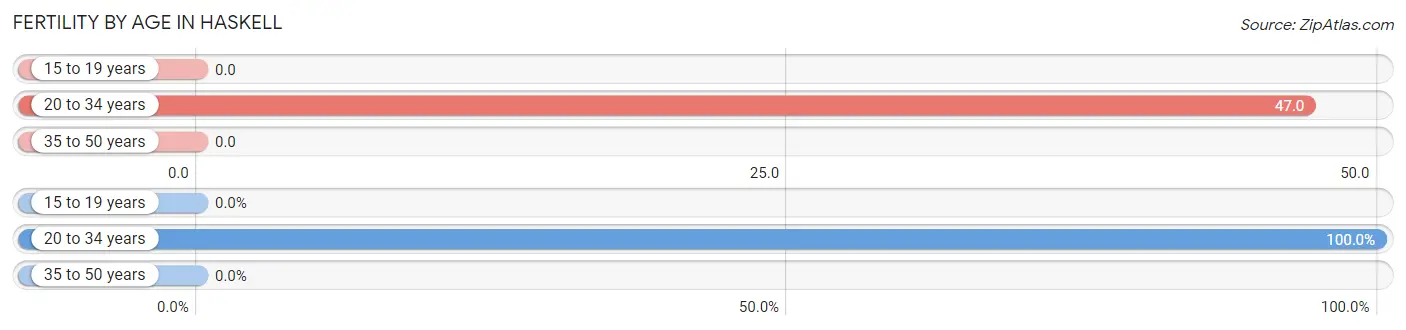
| Age Bracket | Women with Births | Births / 1,000 Women |
| 15 to 19 years | 0 (0.0%) | 0.0 |
| 20 to 34 years | 7 (100.0%) | 47.0 |
| 35 to 50 years | 0 (0.0%) | 0.0 |
| Total | 7 (100.0%) | 21.0 |
Fertility by Age by Marriage Status in Haskell
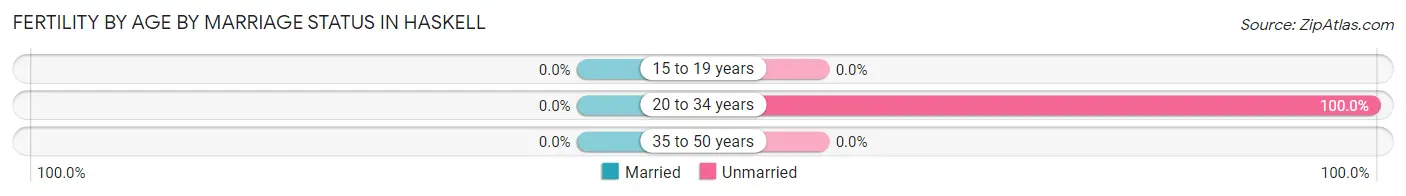
| Age Bracket | Married | Unmarried |
| 15 to 19 years | 0 (0.0%) | 0 (0.0%) |
| 20 to 34 years | 0 (0.0%) | 7 (100.0%) |
| 35 to 50 years | 0 (0.0%) | 0 (0.0%) |
| Total | 0 (0.0%) | 7 (100.0%) |
Fertility by Education in Haskell
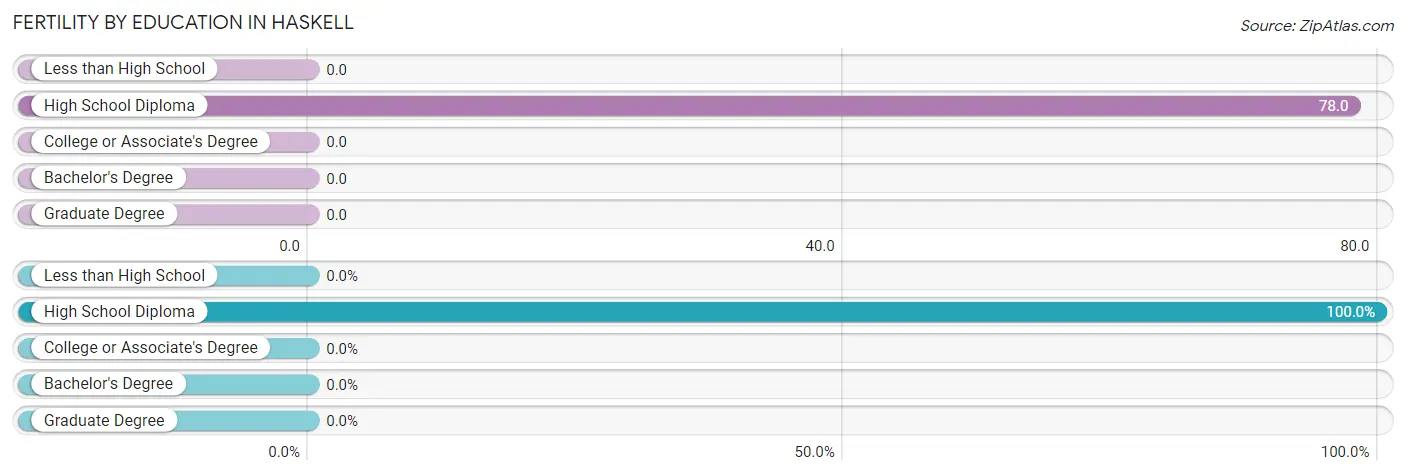
| Educational Attainment | Women with Births | Births / 1,000 Women |
| Less than High School | 0 (0.0%) | 0.0 |
| High School Diploma | 7 (100.0%) | 78.0 |
| College or Associate's Degree | 0 (0.0%) | 0.0 |
| Bachelor's Degree | 0 (0.0%) | 0.0 |
| Graduate Degree | 0 (0.0%) | 0.0 |
| Total | 7 (100.0%) | 21.0 |
Fertility by Education by Marriage Status in Haskell
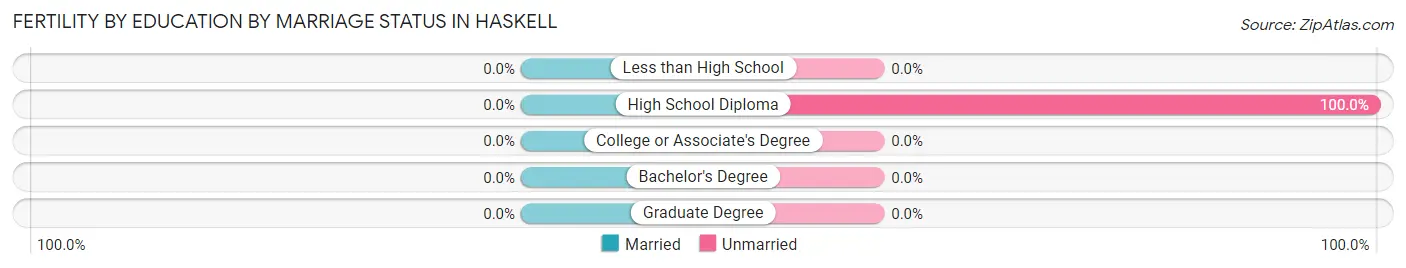
| Educational Attainment | Married | Unmarried |
| Less than High School | 0 (0.0%) | 0 (0.0%) |
| High School Diploma | 0 (0.0%) | 7 (100.0%) |
| College or Associate's Degree | 0 (0.0%) | 0 (0.0%) |
| Bachelor's Degree | 0 (0.0%) | 0 (0.0%) |
| Graduate Degree | 0 (0.0%) | 0 (0.0%) |
| Total | 0 (0.0%) | 7 (100.0%) |
Employment Characteristics in Haskell
Employment by Class of Employer in Haskell
Among the 539 employed individuals in Haskell, private company employees (413 | 76.6%), state government employees (57 | 10.6%), and local government employees (27 | 5.0%) make up the most common classes of employment.
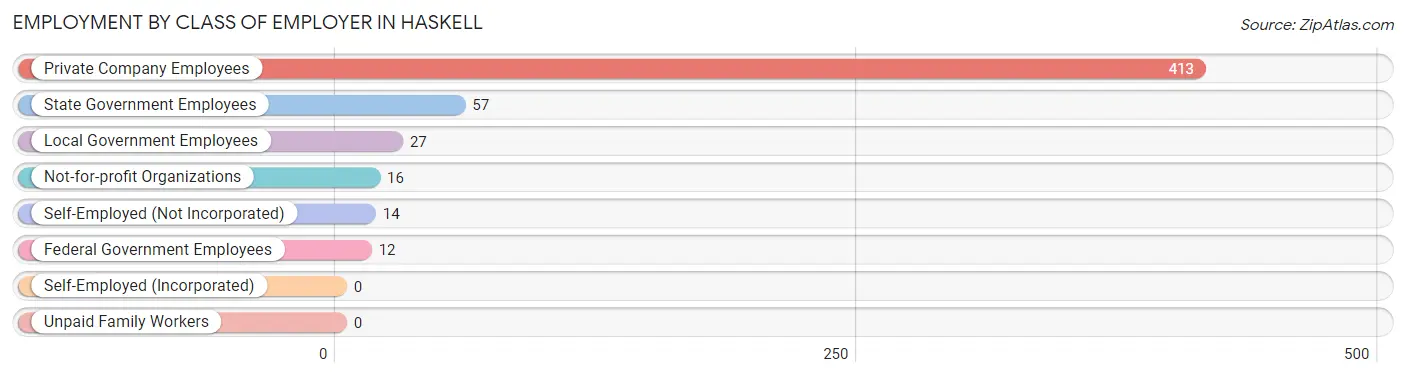
| Employer Class | # Employees | % Employees |
| Private Company Employees | 413 | 76.6% |
| Self-Employed (Incorporated) | 0 | 0.0% |
| Self-Employed (Not Incorporated) | 14 | 2.6% |
| Not-for-profit Organizations | 16 | 3.0% |
| Local Government Employees | 27 | 5.0% |
| State Government Employees | 57 | 10.6% |
| Federal Government Employees | 12 | 2.2% |
| Unpaid Family Workers | 0 | 0.0% |
| Total | 539 | 100.0% |
Employment Status by Age in Haskell
According to the labor force statistics for Haskell, out of the total population over 16 years of age (1,426), 40.9% or 583 individuals are in the labor force, with 7.4% or 43 of them unemployed. The age group with the highest labor force participation rate is 30 to 34 years, with 94.4% or 68 individuals in the labor force. Within the labor force, the 16 to 19 years age range has the highest percentage of unemployed individuals, with 31.6% or 6 of them being unemployed.
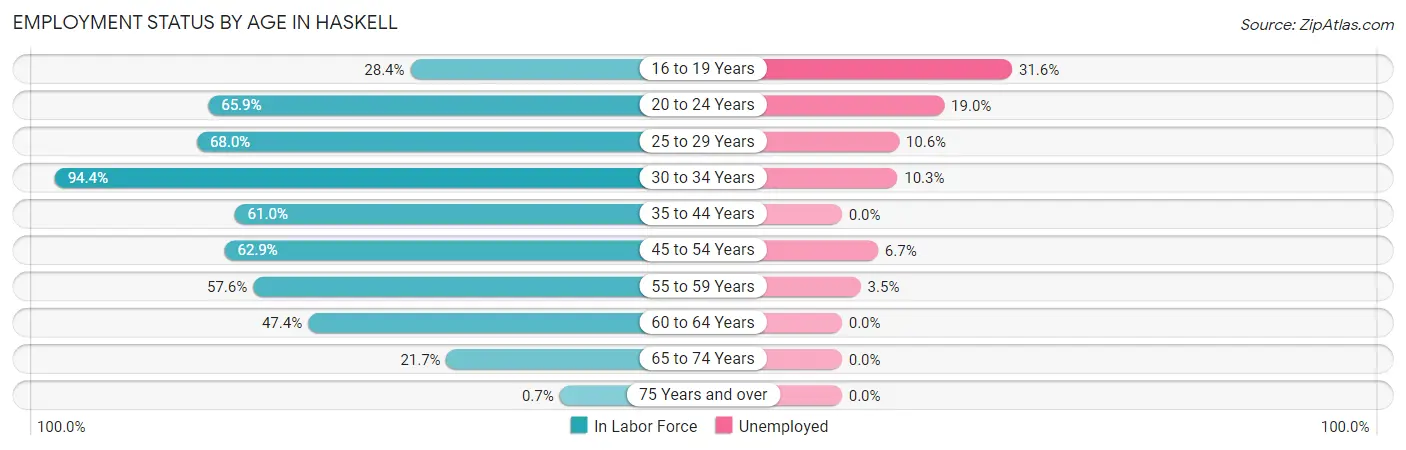
| Age Bracket | In Labor Force | Unemployed |
| 16 to 19 Years | 19 (28.4%) | 6 (31.6%) |
| 20 to 24 Years | 58 (65.9%) | 11 (19.0%) |
| 25 to 29 Years | 66 (68.0%) | 7 (10.6%) |
| 30 to 34 Years | 68 (94.4%) | 7 (10.3%) |
| 35 to 44 Years | 97 (61.0%) | 0 (0.0%) |
| 45 to 54 Years | 149 (62.9%) | 10 (6.7%) |
| 55 to 59 Years | 57 (57.6%) | 2 (3.5%) |
| 60 to 64 Years | 46 (47.4%) | 0 (0.0%) |
| 65 to 74 Years | 20 (21.7%) | 0 (0.0%) |
| 75 Years and over | 3 (0.7%) | 0 (0.0%) |
| Total | 583 (40.9%) | 43 (7.4%) |
Employment Status by Educational Attainment in Haskell
According to labor force statistics for Haskell, 63.5% of individuals (483) out of the total population between 25 and 64 years of age (761) are in the labor force, with 5.4% or 26 of them being unemployed. The group with the highest labor force participation rate are those with the educational attainment of bachelor's degree or higher, with 74.6% or 97 individuals in the labor force. Within the labor force, individuals with less than high school education have the highest percentage of unemployment, with 7.5% or 3 of them being unemployed.
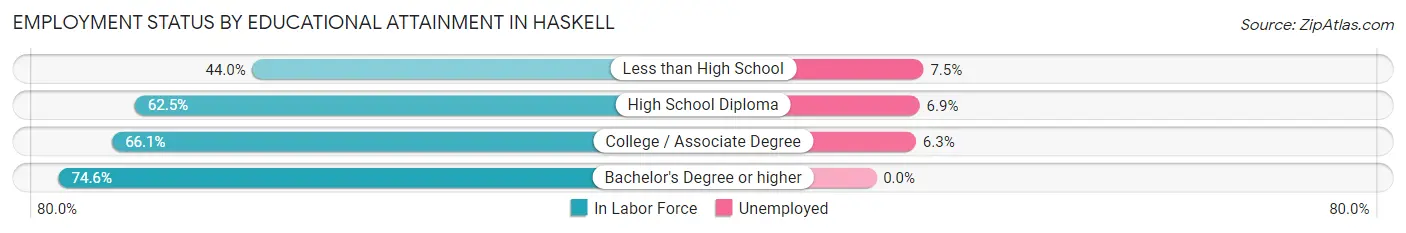
| Educational Attainment | In Labor Force | Unemployed |
| Less than High School | 40 (44.0%) | 7 (7.5%) |
| High School Diploma | 188 (62.5%) | 21 (6.9%) |
| College / Associate Degree | 158 (66.1%) | 15 (6.3%) |
| Bachelor's Degree or higher | 97 (74.6%) | 0 (0.0%) |
| Total | 483 (63.5%) | 41 (5.4%) |
Employment Occupations by Sex in Haskell
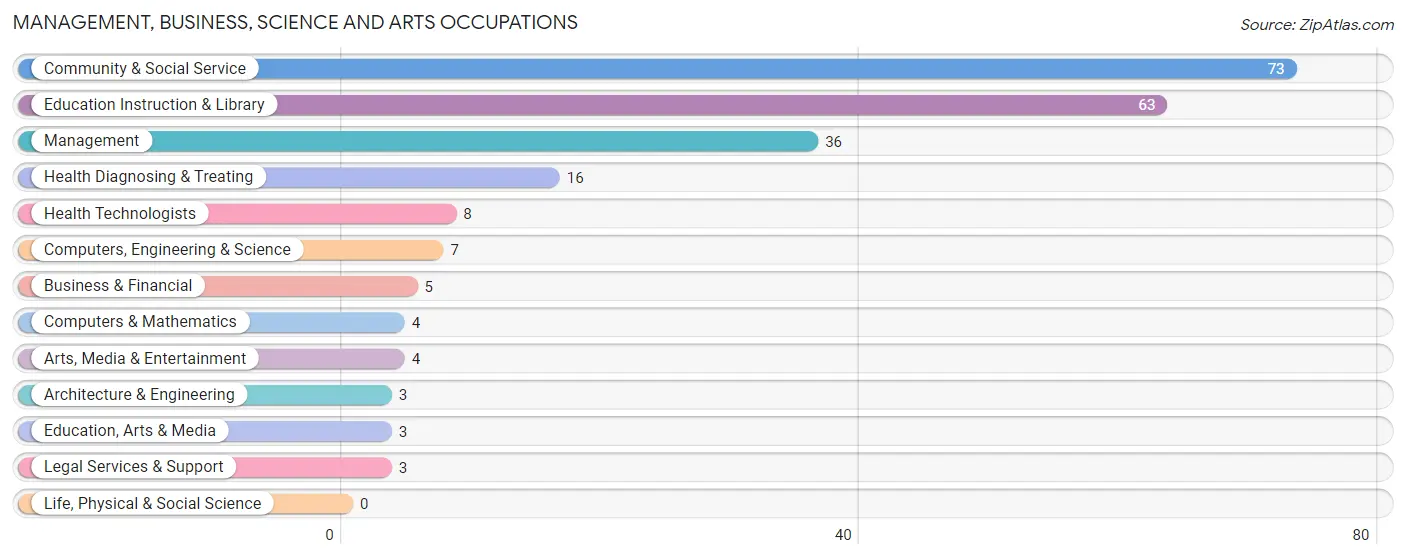
Management, Business, Science and Arts Occupations
The most common Management, Business, Science and Arts occupations in Haskell are Community & Social Service (73 | 13.5%), Education Instruction & Library (63 | 11.7%), Management (36 | 6.7%), Health Diagnosing & Treating (16 | 3.0%), and Health Technologists (8 | 1.5%).
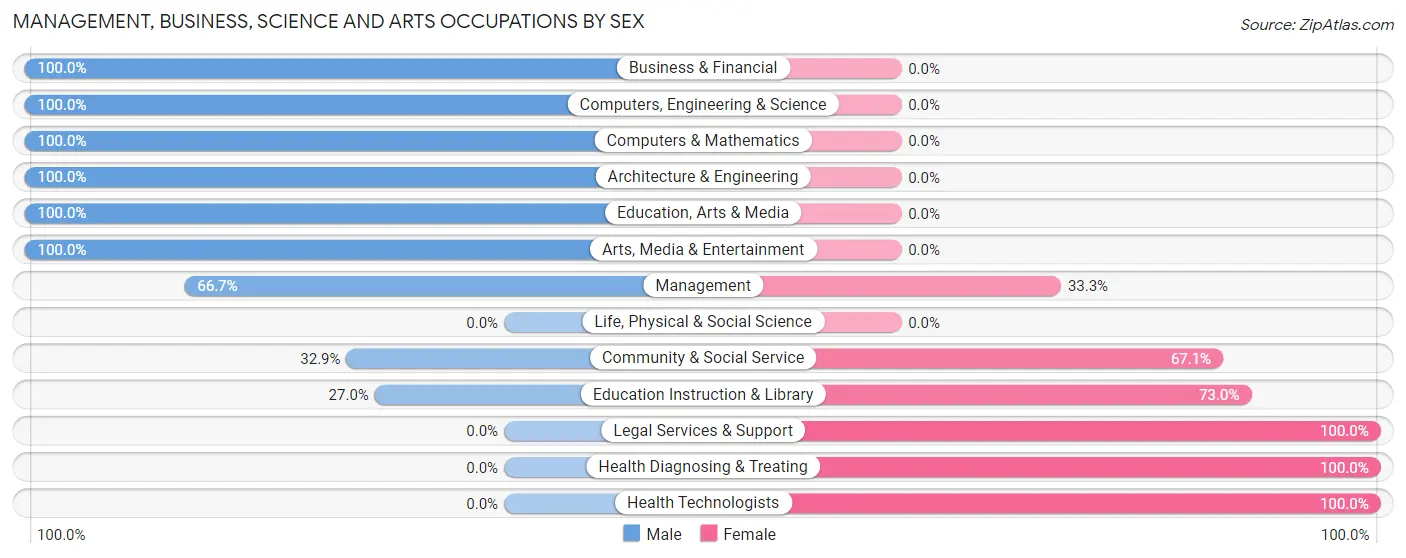
Management, Business, Science and Arts Occupations by Sex
Within the Management, Business, Science and Arts occupations in Haskell, the most male-oriented occupations are Business & Financial (100.0%), Computers, Engineering & Science (100.0%), and Computers & Mathematics (100.0%), while the most female-oriented occupations are Legal Services & Support (100.0%), Health Diagnosing & Treating (100.0%), and Health Technologists (100.0%).
| Occupation | Male | Female |
| Management | 24 (66.7%) | 12 (33.3%) |
| Business & Financial | 5 (100.0%) | 0 (0.0%) |
| Computers, Engineering & Science | 7 (100.0%) | 0 (0.0%) |
| Computers & Mathematics | 4 (100.0%) | 0 (0.0%) |
| Architecture & Engineering | 3 (100.0%) | 0 (0.0%) |
| Life, Physical & Social Science | 0 (0.0%) | 0 (0.0%) |
| Community & Social Service | 24 (32.9%) | 49 (67.1%) |
| Education, Arts & Media | 3 (100.0%) | 0 (0.0%) |
| Legal Services & Support | 0 (0.0%) | 3 (100.0%) |
| Education Instruction & Library | 17 (27.0%) | 46 (73.0%) |
| Arts, Media & Entertainment | 4 (100.0%) | 0 (0.0%) |
| Health Diagnosing & Treating | 0 (0.0%) | 16 (100.0%) |
| Health Technologists | 0 (0.0%) | 8 (100.0%) |
| Total (Category) | 60 (43.8%) | 77 (56.2%) |
| Total (Overall) | 254 (47.0%) | 286 (53.0%) |
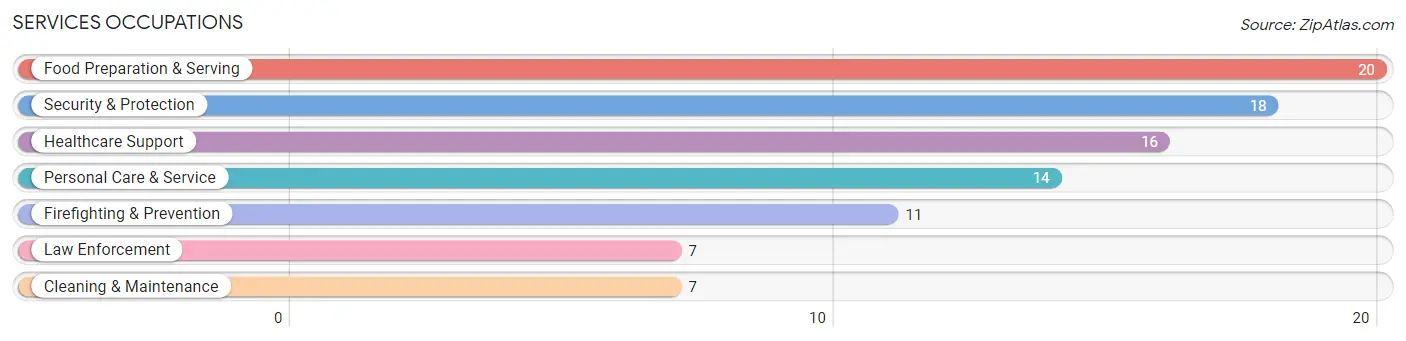
Services Occupations
The most common Services occupations in Haskell are Food Preparation & Serving (20 | 3.7%), Security & Protection (18 | 3.3%), Healthcare Support (16 | 3.0%), Personal Care & Service (14 | 2.6%), and Firefighting & Prevention (11 | 2.0%).
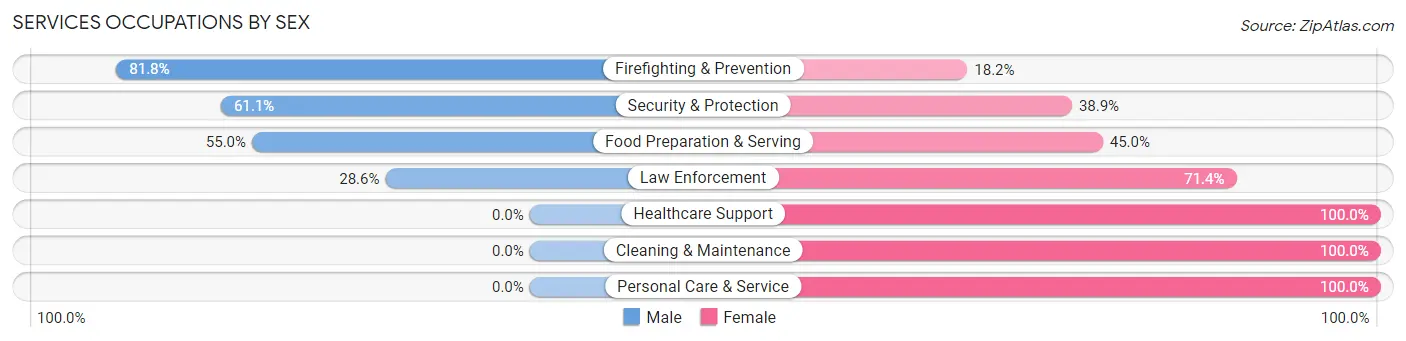
Services Occupations by Sex
Within the Services occupations in Haskell, the most male-oriented occupations are Firefighting & Prevention (81.8%), Security & Protection (61.1%), and Food Preparation & Serving (55.0%), while the most female-oriented occupations are Healthcare Support (100.0%), Cleaning & Maintenance (100.0%), and Personal Care & Service (100.0%).
| Occupation | Male | Female |
| Healthcare Support | 0 (0.0%) | 16 (100.0%) |
| Security & Protection | 11 (61.1%) | 7 (38.9%) |
| Firefighting & Prevention | 9 (81.8%) | 2 (18.2%) |
| Law Enforcement | 2 (28.6%) | 5 (71.4%) |
| Food Preparation & Serving | 11 (55.0%) | 9 (45.0%) |
| Cleaning & Maintenance | 0 (0.0%) | 7 (100.0%) |
| Personal Care & Service | 0 (0.0%) | 14 (100.0%) |
| Total (Category) | 22 (29.3%) | 53 (70.7%) |
| Total (Overall) | 254 (47.0%) | 286 (53.0%) |
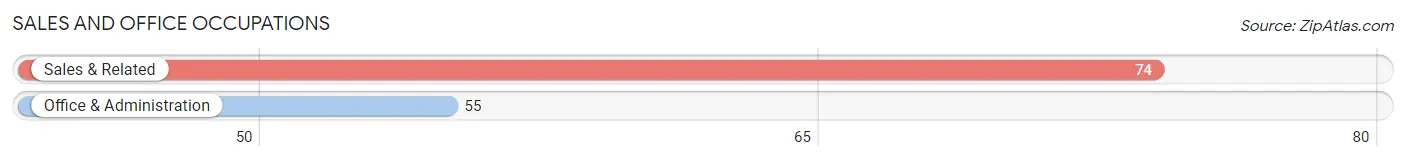
Sales and Office Occupations
The most common Sales and Office occupations in Haskell are Sales & Related (74 | 13.7%), and Office & Administration (55 | 10.2%).
Sales and Office Occupations by Sex
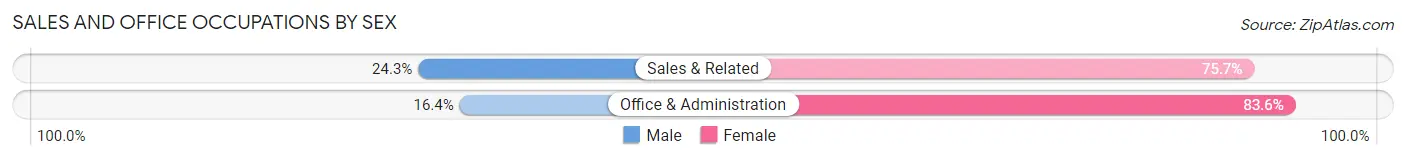
| Occupation | Male | Female |
| Sales & Related | 18 (24.3%) | 56 (75.7%) |
| Office & Administration | 9 (16.4%) | 46 (83.6%) |
| Total (Category) | 27 (20.9%) | 102 (79.1%) |
| Total (Overall) | 254 (47.0%) | 286 (53.0%) |
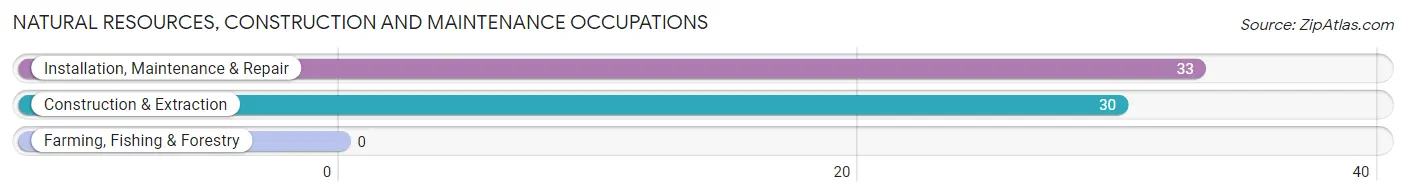
Natural Resources, Construction and Maintenance Occupations
The most common Natural Resources, Construction and Maintenance occupations in Haskell are Installation, Maintenance & Repair (33 | 6.1%), and Construction & Extraction (30 | 5.6%).
Natural Resources, Construction and Maintenance Occupations by Sex
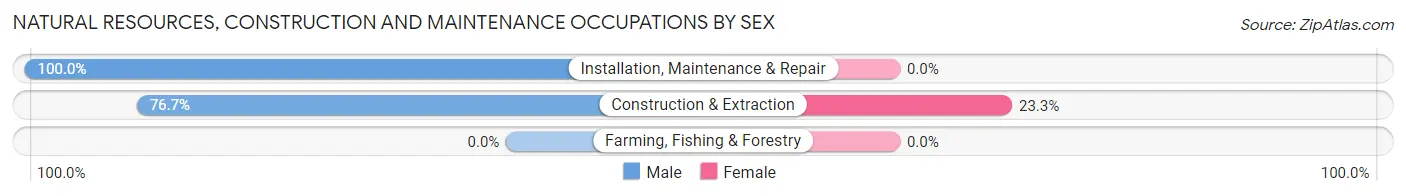
| Occupation | Male | Female |
| Farming, Fishing & Forestry | 0 (0.0%) | 0 (0.0%) |
| Construction & Extraction | 23 (76.7%) | 7 (23.3%) |
| Installation, Maintenance & Repair | 33 (100.0%) | 0 (0.0%) |
| Total (Category) | 56 (88.9%) | 7 (11.1%) |
| Total (Overall) | 254 (47.0%) | 286 (53.0%) |
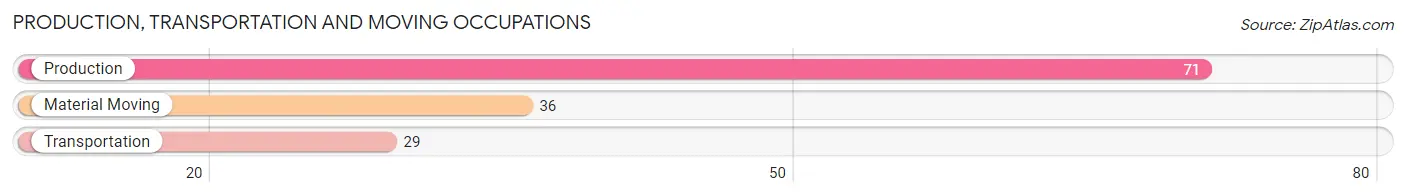
Production, Transportation and Moving Occupations
The most common Production, Transportation and Moving occupations in Haskell are Production (71 | 13.2%), Material Moving (36 | 6.7%), and Transportation (29 | 5.4%).
Production, Transportation and Moving Occupations by Sex
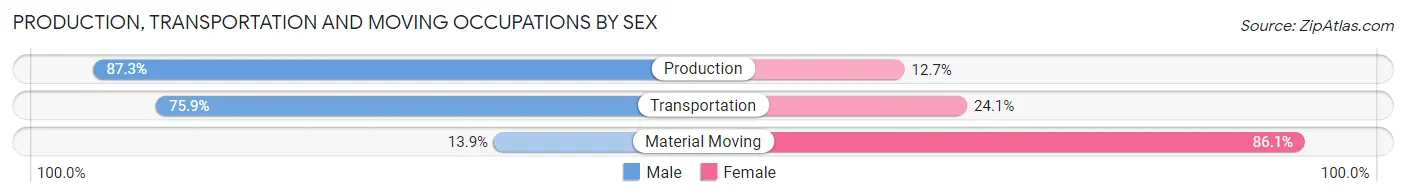
| Occupation | Male | Female |
| Production | 62 (87.3%) | 9 (12.7%) |
| Transportation | 22 (75.9%) | 7 (24.1%) |
| Material Moving | 5 (13.9%) | 31 (86.1%) |
| Total (Category) | 89 (65.4%) | 47 (34.6%) |
| Total (Overall) | 254 (47.0%) | 286 (53.0%) |
Employment Industries by Sex in Haskell
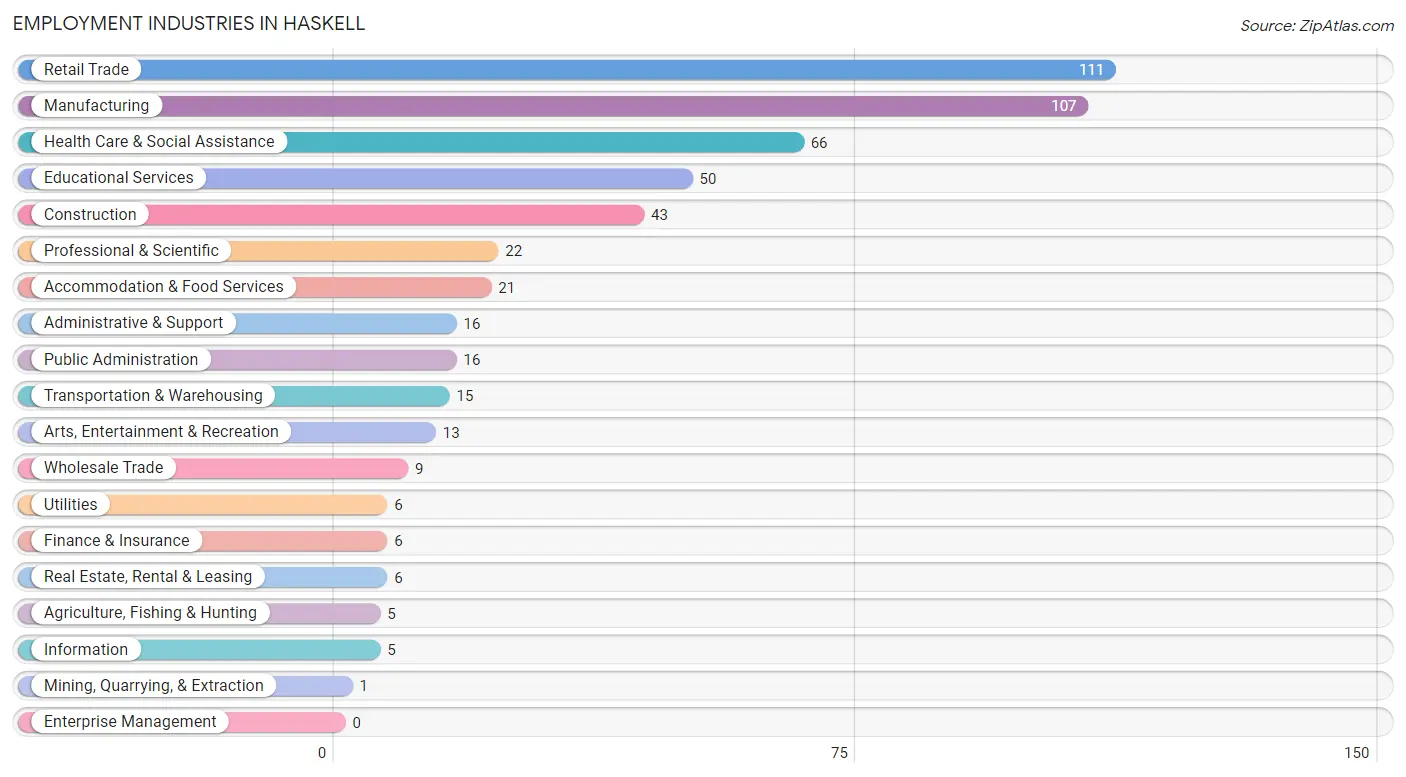
Employment Industries in Haskell
The major employment industries in Haskell include Retail Trade (111 | 20.6%), Manufacturing (107 | 19.8%), Health Care & Social Assistance (66 | 12.2%), Educational Services (50 | 9.3%), and Construction (43 | 8.0%).
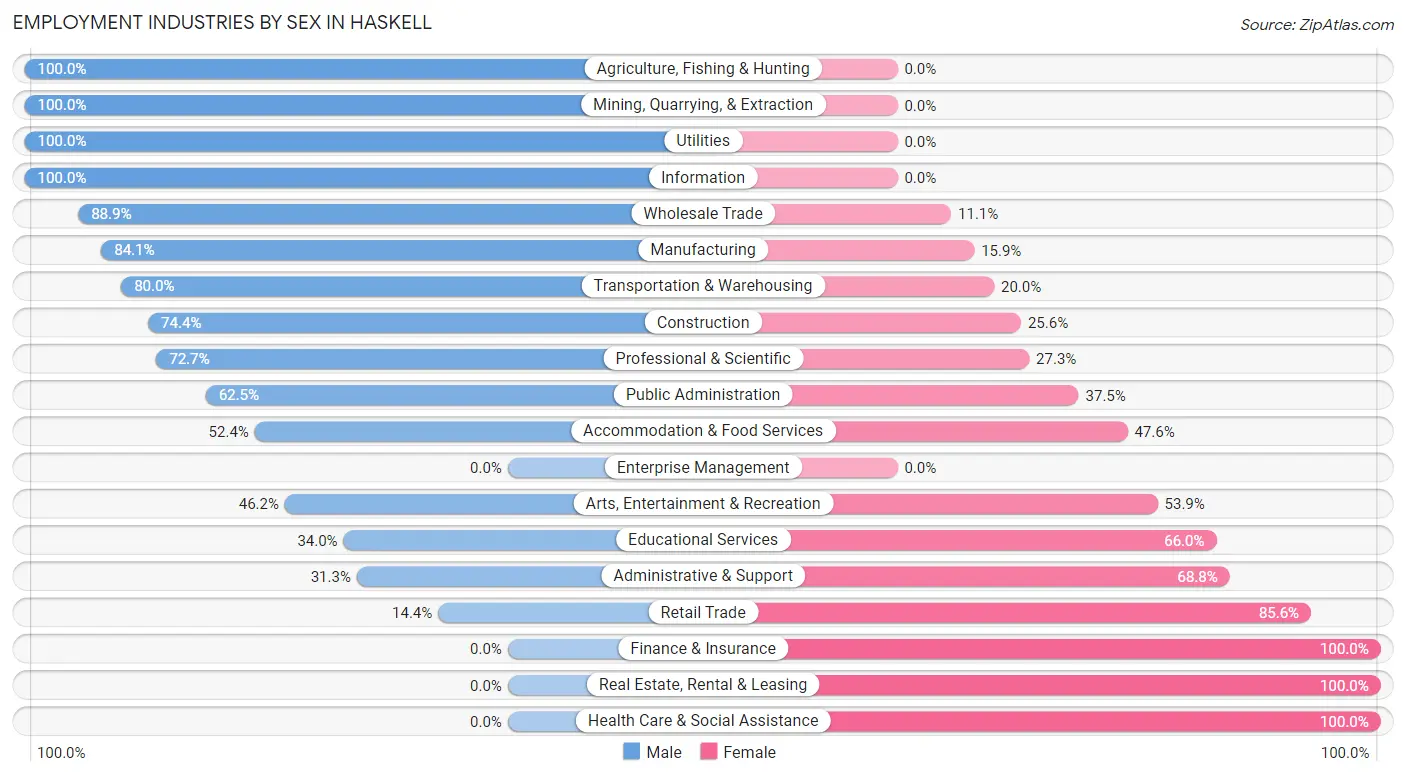
Employment Industries by Sex in Haskell
The Haskell industries that see more men than women are Agriculture, Fishing & Hunting (100.0%), Mining, Quarrying, & Extraction (100.0%), and Utilities (100.0%), whereas the industries that tend to have a higher number of women are Finance & Insurance (100.0%), Real Estate, Rental & Leasing (100.0%), and Health Care & Social Assistance (100.0%).
| Industry | Male | Female |
| Agriculture, Fishing & Hunting | 5 (100.0%) | 0 (0.0%) |
| Mining, Quarrying, & Extraction | 1 (100.0%) | 0 (0.0%) |
| Construction | 32 (74.4%) | 11 (25.6%) |
| Manufacturing | 90 (84.1%) | 17 (15.9%) |
| Wholesale Trade | 8 (88.9%) | 1 (11.1%) |
| Retail Trade | 16 (14.4%) | 95 (85.6%) |
| Transportation & Warehousing | 12 (80.0%) | 3 (20.0%) |
| Utilities | 6 (100.0%) | 0 (0.0%) |
| Information | 5 (100.0%) | 0 (0.0%) |
| Finance & Insurance | 0 (0.0%) | 6 (100.0%) |
| Real Estate, Rental & Leasing | 0 (0.0%) | 6 (100.0%) |
| Professional & Scientific | 16 (72.7%) | 6 (27.3%) |
| Enterprise Management | 0 (0.0%) | 0 (0.0%) |
| Administrative & Support | 5 (31.2%) | 11 (68.8%) |
| Educational Services | 17 (34.0%) | 33 (66.0%) |
| Health Care & Social Assistance | 0 (0.0%) | 66 (100.0%) |
| Arts, Entertainment & Recreation | 6 (46.2%) | 7 (53.8%) |
| Accommodation & Food Services | 11 (52.4%) | 10 (47.6%) |
| Public Administration | 10 (62.5%) | 6 (37.5%) |
| Total | 254 (47.0%) | 286 (53.0%) |
Education in Haskell
School Enrollment in Haskell
The most common levels of schooling among the 380 students in Haskell are elementary school (116 | 30.5%), middle school (113 | 29.7%), and high school (66 | 17.4%).
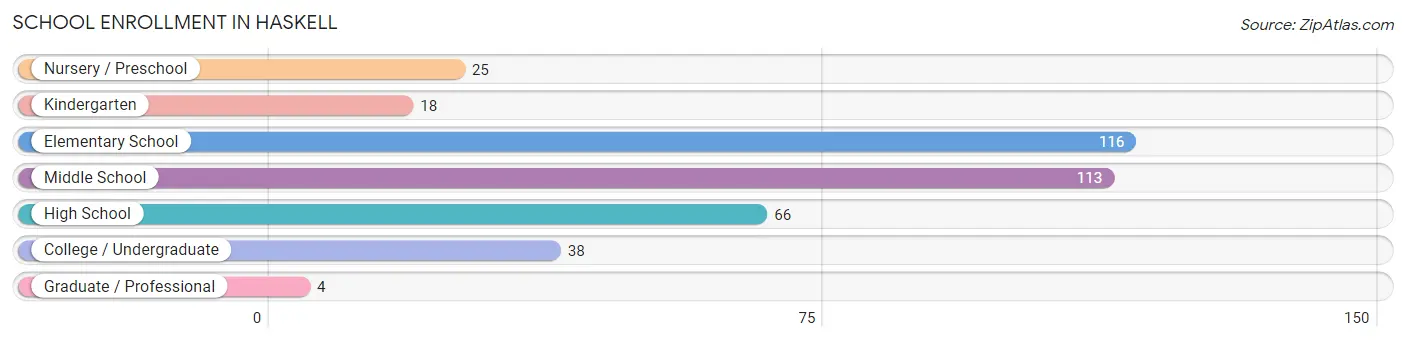
| School Level | # Students | % Students |
| Nursery / Preschool | 25 | 6.6% |
| Kindergarten | 18 | 4.7% |
| Elementary School | 116 | 30.5% |
| Middle School | 113 | 29.7% |
| High School | 66 | 17.4% |
| College / Undergraduate | 38 | 10.0% |
| Graduate / Professional | 4 | 1.1% |
| Total | 380 | 100.0% |
School Enrollment by Age by Funding Source in Haskell
Out of a total of 380 students who are enrolled in schools in Haskell, 120 (31.6%) attend a private institution, while the remaining 260 (68.4%) are enrolled in public schools. The age group of 3 to 4 year olds has the highest likelihood of being enrolled in private schools, with 19 (76.0% in the age bracket) enrolled. Conversely, the age group of 20 to 24 year olds has the lowest likelihood of being enrolled in a private school, with 17 (100.0% in the age bracket) attending a public institution.
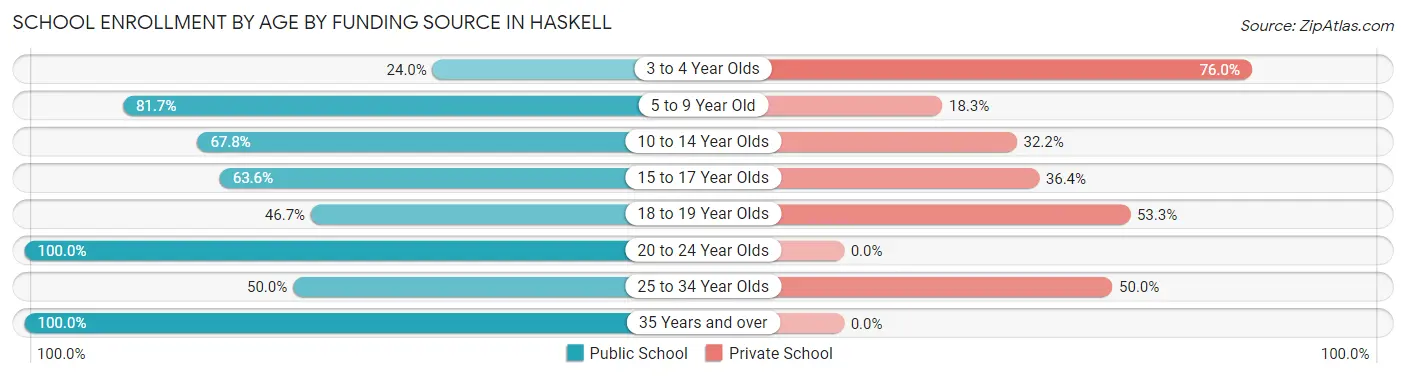
| Age Bracket | Public School | Private School |
| 3 to 4 Year Olds | 6 (24.0%) | 19 (76.0%) |
| 5 to 9 Year Old | 98 (81.7%) | 22 (18.3%) |
| 10 to 14 Year Olds | 80 (67.8%) | 38 (32.2%) |
| 15 to 17 Year Olds | 42 (63.6%) | 24 (36.4%) |
| 18 to 19 Year Olds | 7 (46.7%) | 8 (53.3%) |
| 20 to 24 Year Olds | 17 (100.0%) | 0 (0.0%) |
| 25 to 34 Year Olds | 9 (50.0%) | 9 (50.0%) |
| 35 Years and over | 1 (100.0%) | 0 (0.0%) |
| Total | 260 (68.4%) | 120 (31.6%) |
Educational Attainment by Field of Study in Haskell
Education (74 | 41.3%), engineering (29 | 16.2%), arts & humanities (21 | 11.7%), business (17 | 9.5%), and science & technology (15 | 8.4%) are the most common fields of study among 179 individuals in Haskell who have obtained a bachelor's degree or higher.
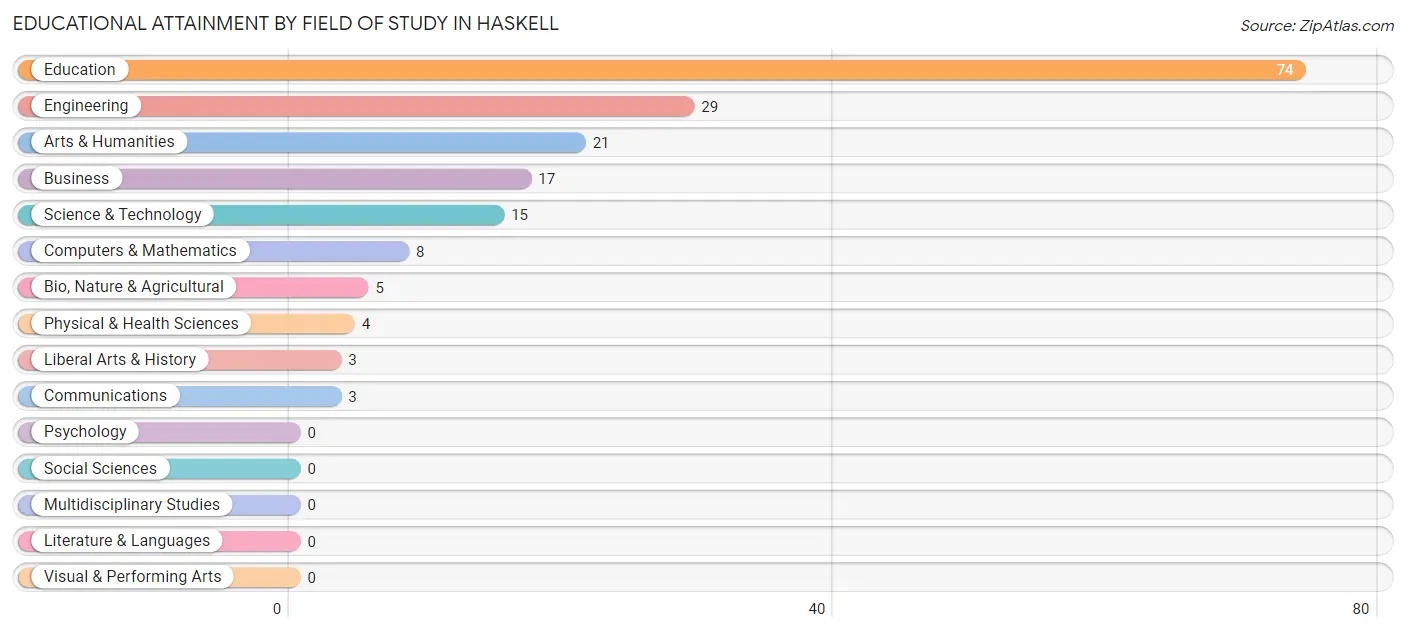
| Field of Study | # Graduates | % Graduates |
| Computers & Mathematics | 8 | 4.5% |
| Bio, Nature & Agricultural | 5 | 2.8% |
| Physical & Health Sciences | 4 | 2.2% |
| Psychology | 0 | 0.0% |
| Social Sciences | 0 | 0.0% |
| Engineering | 29 | 16.2% |
| Multidisciplinary Studies | 0 | 0.0% |
| Science & Technology | 15 | 8.4% |
| Business | 17 | 9.5% |
| Education | 74 | 41.3% |
| Literature & Languages | 0 | 0.0% |
| Liberal Arts & History | 3 | 1.7% |
| Visual & Performing Arts | 0 | 0.0% |
| Communications | 3 | 1.7% |
| Arts & Humanities | 21 | 11.7% |
| Total | 179 | 100.0% |
Transportation & Commute in Haskell
Vehicle Availability by Sex in Haskell
The most prevalent vehicle ownership categories in Haskell are males with 2 vehicles (125, accounting for 49.2%) and females with 2 vehicles (107, making up 43.9%).
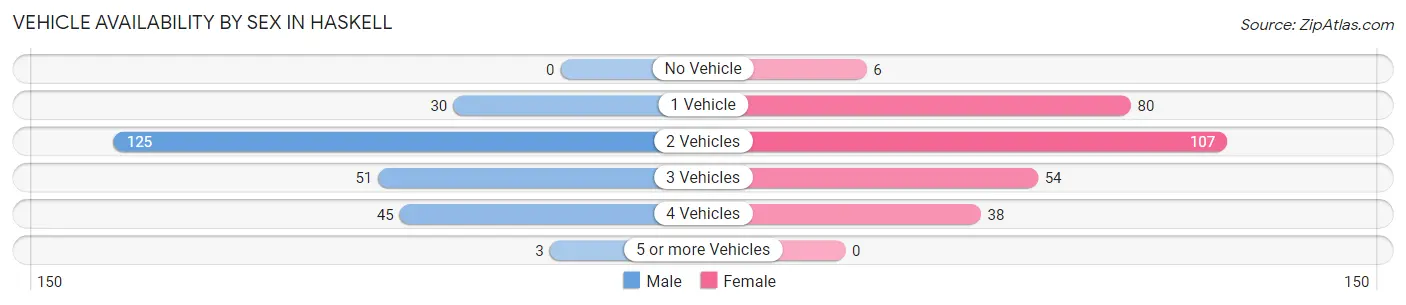
| Vehicles Available | Male | Female |
| No Vehicle | 0 (0.0%) | 6 (2.1%) |
| 1 Vehicle | 30 (11.8%) | 80 (28.1%) |
| 2 Vehicles | 125 (49.2%) | 107 (37.5%) |
| 3 Vehicles | 51 (20.1%) | 54 (19.0%) |
| 4 Vehicles | 45 (17.7%) | 38 (13.3%) |
| 5 or more Vehicles | 3 (1.2%) | 0 (0.0%) |
| Total | 254 (100.0%) | 285 (100.0%) |
Commute Time in Haskell
The most frequently occuring commute durations in Haskell are 45 to 59 minutes (105 commuters, 19.8%), 5 to 9 minutes (93 commuters, 17.5%), and 20 to 24 minutes (91 commuters, 17.2%).
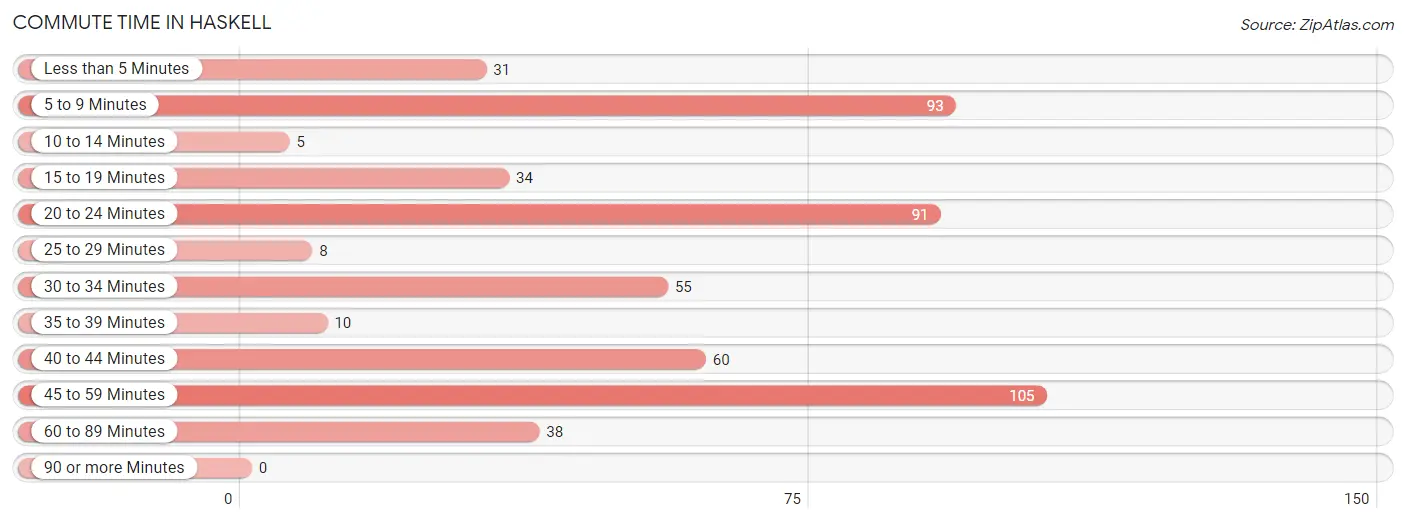
| Commute Time | # Commuters | % Commuters |
| Less than 5 Minutes | 31 | 5.9% |
| 5 to 9 Minutes | 93 | 17.5% |
| 10 to 14 Minutes | 5 | 0.9% |
| 15 to 19 Minutes | 34 | 6.4% |
| 20 to 24 Minutes | 91 | 17.2% |
| 25 to 29 Minutes | 8 | 1.5% |
| 30 to 34 Minutes | 55 | 10.4% |
| 35 to 39 Minutes | 10 | 1.9% |
| 40 to 44 Minutes | 60 | 11.3% |
| 45 to 59 Minutes | 105 | 19.8% |
| 60 to 89 Minutes | 38 | 7.2% |
| 90 or more Minutes | 0 | 0.0% |
Commute Time by Sex in Haskell
The most common commute times in Haskell are 20 to 24 minutes (50 commuters, 19.9%) for males and 5 to 9 minutes (64 commuters, 22.9%) for females.
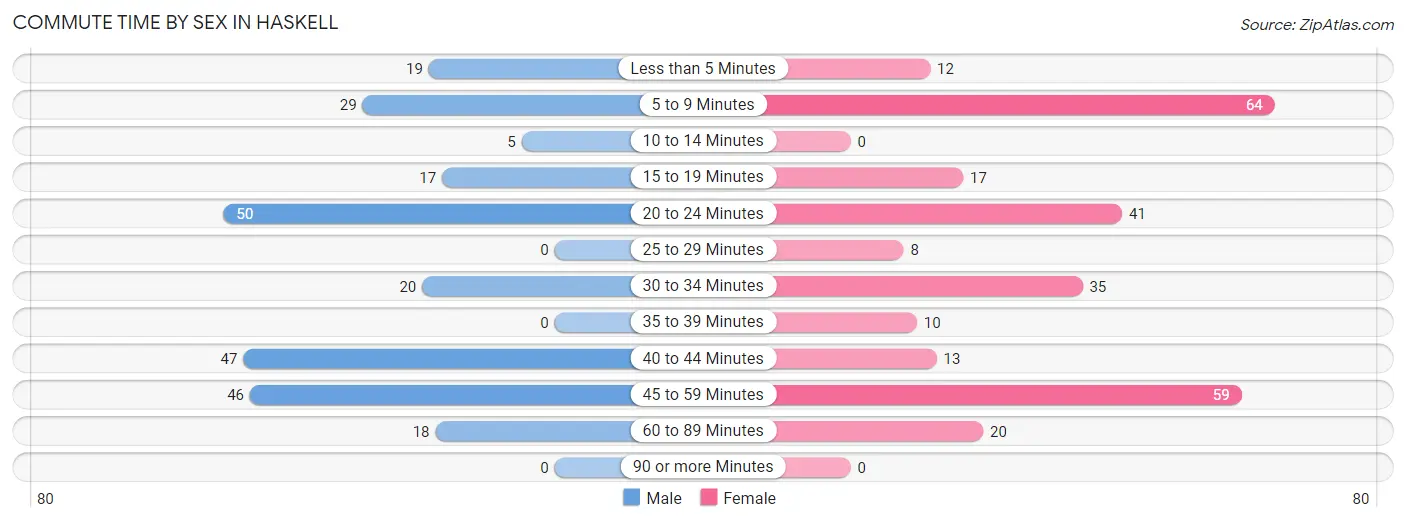
| Commute Time | Male | Female |
| Less than 5 Minutes | 19 (7.6%) | 12 (4.3%) |
| 5 to 9 Minutes | 29 (11.6%) | 64 (22.9%) |
| 10 to 14 Minutes | 5 (2.0%) | 0 (0.0%) |
| 15 to 19 Minutes | 17 (6.8%) | 17 (6.1%) |
| 20 to 24 Minutes | 50 (19.9%) | 41 (14.7%) |
| 25 to 29 Minutes | 0 (0.0%) | 8 (2.9%) |
| 30 to 34 Minutes | 20 (8.0%) | 35 (12.5%) |
| 35 to 39 Minutes | 0 (0.0%) | 10 (3.6%) |
| 40 to 44 Minutes | 47 (18.7%) | 13 (4.7%) |
| 45 to 59 Minutes | 46 (18.3%) | 59 (21.1%) |
| 60 to 89 Minutes | 18 (7.2%) | 20 (7.2%) |
| 90 or more Minutes | 0 (0.0%) | 0 (0.0%) |
Time of Departure to Work by Sex in Haskell
The most frequent times of departure to work in Haskell are 6:00 AM to 6:29 AM (53, 21.1%) for males and 12:00 AM to 4:59 AM (53, 19.0%) for females.
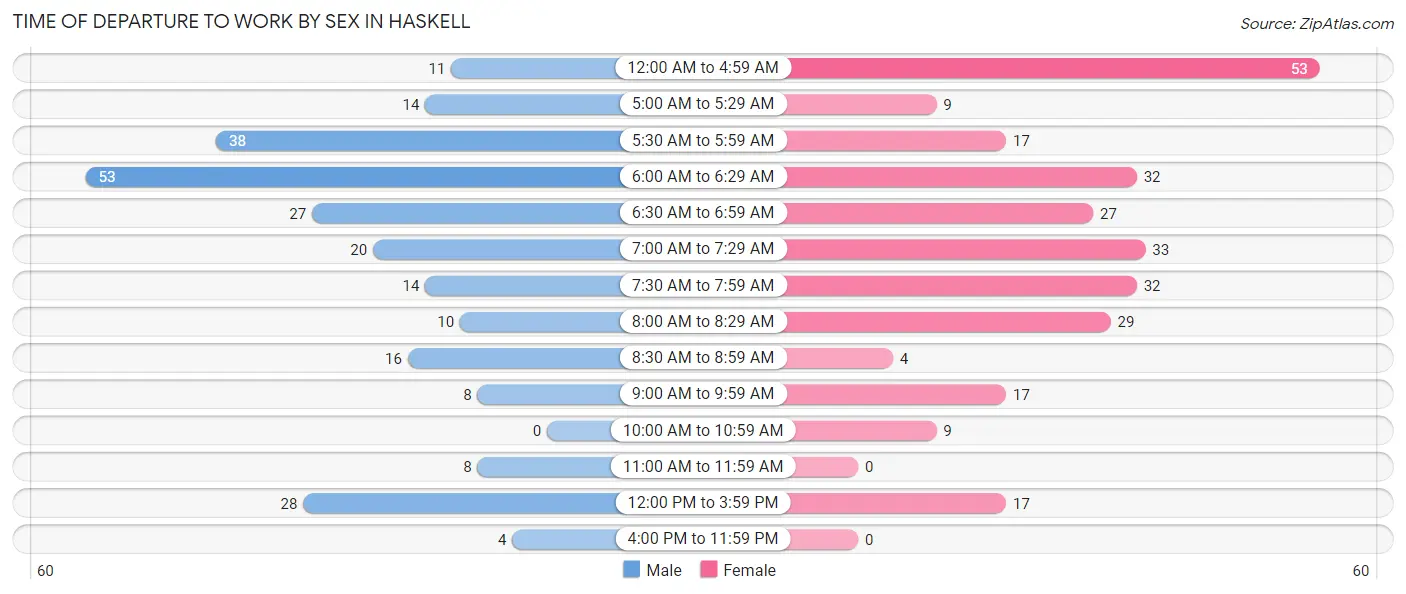
| Time of Departure | Male | Female |
| 12:00 AM to 4:59 AM | 11 (4.4%) | 53 (19.0%) |
| 5:00 AM to 5:29 AM | 14 (5.6%) | 9 (3.2%) |
| 5:30 AM to 5:59 AM | 38 (15.1%) | 17 (6.1%) |
| 6:00 AM to 6:29 AM | 53 (21.1%) | 32 (11.5%) |
| 6:30 AM to 6:59 AM | 27 (10.8%) | 27 (9.7%) |
| 7:00 AM to 7:29 AM | 20 (8.0%) | 33 (11.8%) |
| 7:30 AM to 7:59 AM | 14 (5.6%) | 32 (11.5%) |
| 8:00 AM to 8:29 AM | 10 (4.0%) | 29 (10.4%) |
| 8:30 AM to 8:59 AM | 16 (6.4%) | 4 (1.4%) |
| 9:00 AM to 9:59 AM | 8 (3.2%) | 17 (6.1%) |
| 10:00 AM to 10:59 AM | 0 (0.0%) | 9 (3.2%) |
| 11:00 AM to 11:59 AM | 8 (3.2%) | 0 (0.0%) |
| 12:00 PM to 3:59 PM | 28 (11.2%) | 17 (6.1%) |
| 4:00 PM to 11:59 PM | 4 (1.6%) | 0 (0.0%) |
| Total | 251 (100.0%) | 279 (100.0%) |
Housing Occupancy in Haskell
Occupancy by Ownership in Haskell
Of the total 814 dwellings in Haskell, owner-occupied units account for 627 (77.0%), while renter-occupied units make up 187 (23.0%).
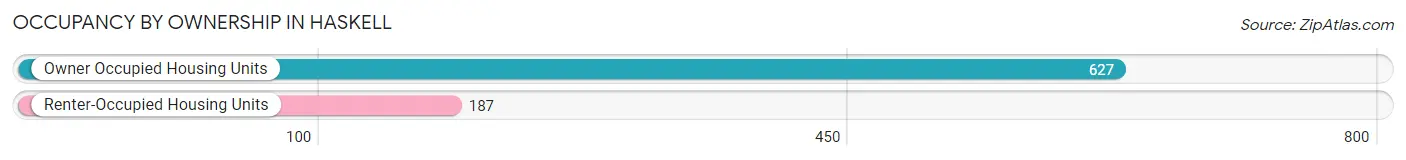
| Occupancy | # Housing Units | % Housing Units |
| Owner Occupied Housing Units | 627 | 77.0% |
| Renter-Occupied Housing Units | 187 | 23.0% |
| Total Occupied Housing Units | 814 | 100.0% |
Occupancy by Household Size in Haskell
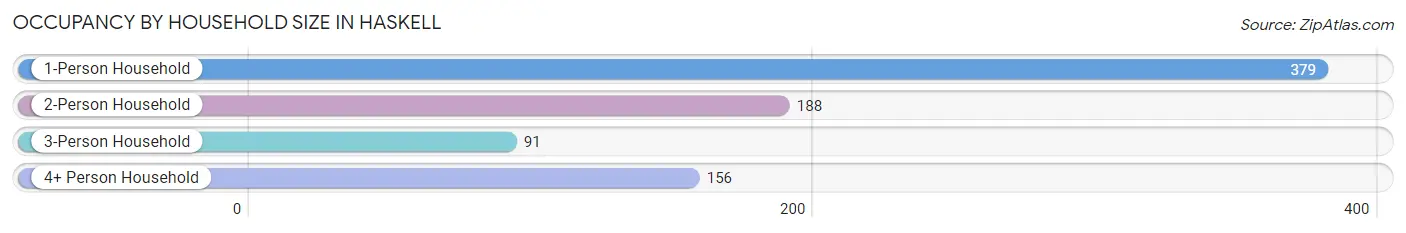
| Household Size | # Housing Units | % Housing Units |
| 1-Person Household | 379 | 46.6% |
| 2-Person Household | 188 | 23.1% |
| 3-Person Household | 91 | 11.2% |
| 4+ Person Household | 156 | 19.2% |
| Total Housing Units | 814 | 100.0% |
Occupancy by Ownership by Household Size in Haskell
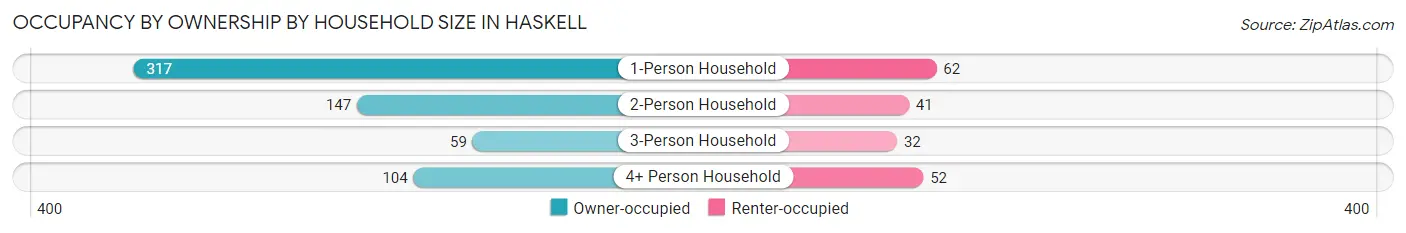
| Household Size | Owner-occupied | Renter-occupied |
| 1-Person Household | 317 (83.6%) | 62 (16.4%) |
| 2-Person Household | 147 (78.2%) | 41 (21.8%) |
| 3-Person Household | 59 (64.8%) | 32 (35.2%) |
| 4+ Person Household | 104 (66.7%) | 52 (33.3%) |
| Total Housing Units | 627 (77.0%) | 187 (23.0%) |
Occupancy by Educational Attainment in Haskell
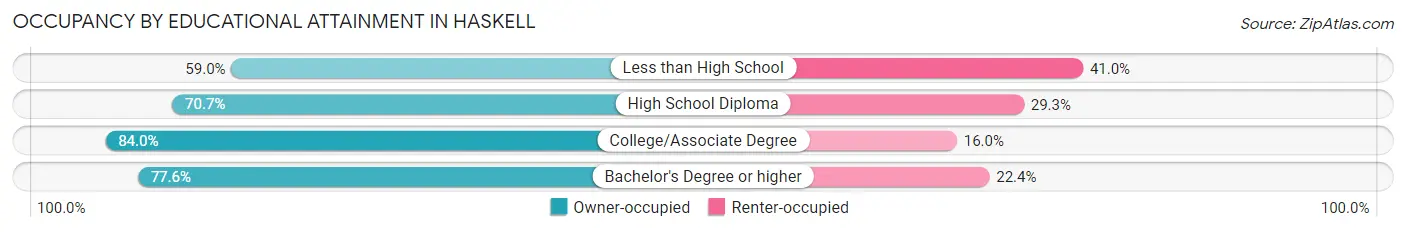
| Household Size | Owner-occupied | Renter-occupied |
| Less than High School | 59 (59.0%) | 41 (41.0%) |
| High School Diploma | 133 (70.7%) | 55 (29.3%) |
| College/Associate Degree | 352 (84.0%) | 67 (16.0%) |
| Bachelor's Degree or higher | 83 (77.6%) | 24 (22.4%) |
Occupancy by Age of Householder in Haskell
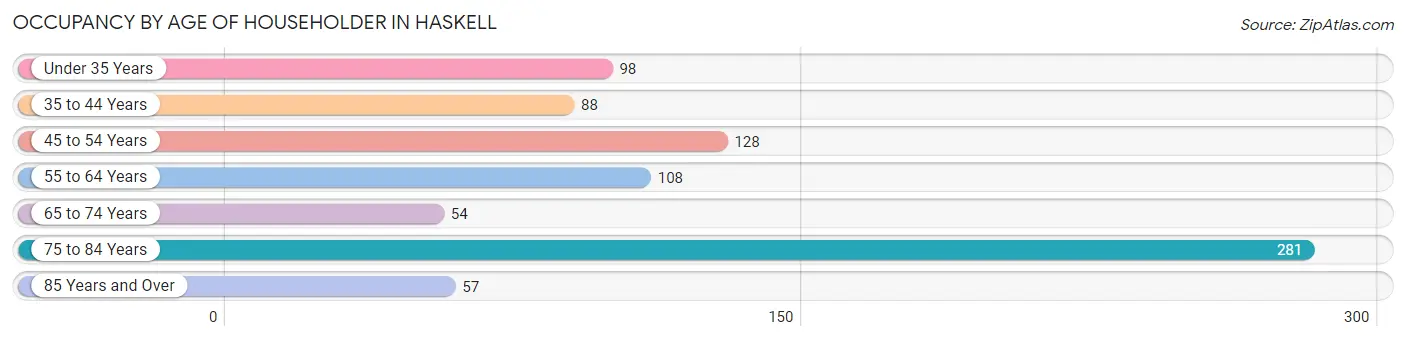
| Age Bracket | # Households | % Households |
| Under 35 Years | 98 | 12.0% |
| 35 to 44 Years | 88 | 10.8% |
| 45 to 54 Years | 128 | 15.7% |
| 55 to 64 Years | 108 | 13.3% |
| 65 to 74 Years | 54 | 6.6% |
| 75 to 84 Years | 281 | 34.5% |
| 85 Years and Over | 57 | 7.0% |
| Total | 814 | 100.0% |
Housing Finances in Haskell
Median Income by Occupancy in Haskell
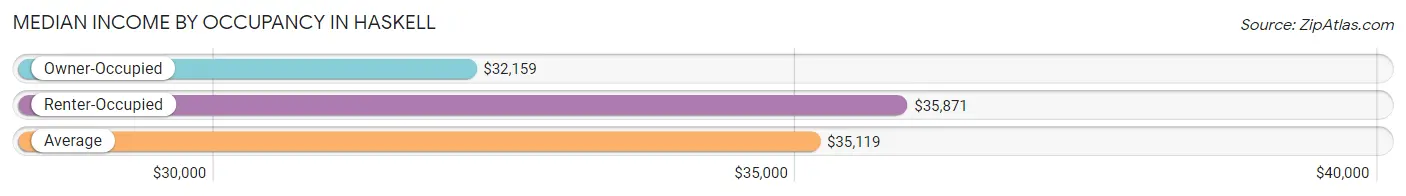
| Occupancy Type | # Households | Median Income |
| Owner-Occupied | 627 (77.0%) | $32,159 |
| Renter-Occupied | 187 (23.0%) | $35,871 |
| Average | 814 (100.0%) | $35,119 |
Occupancy by Householder Income Bracket in Haskell
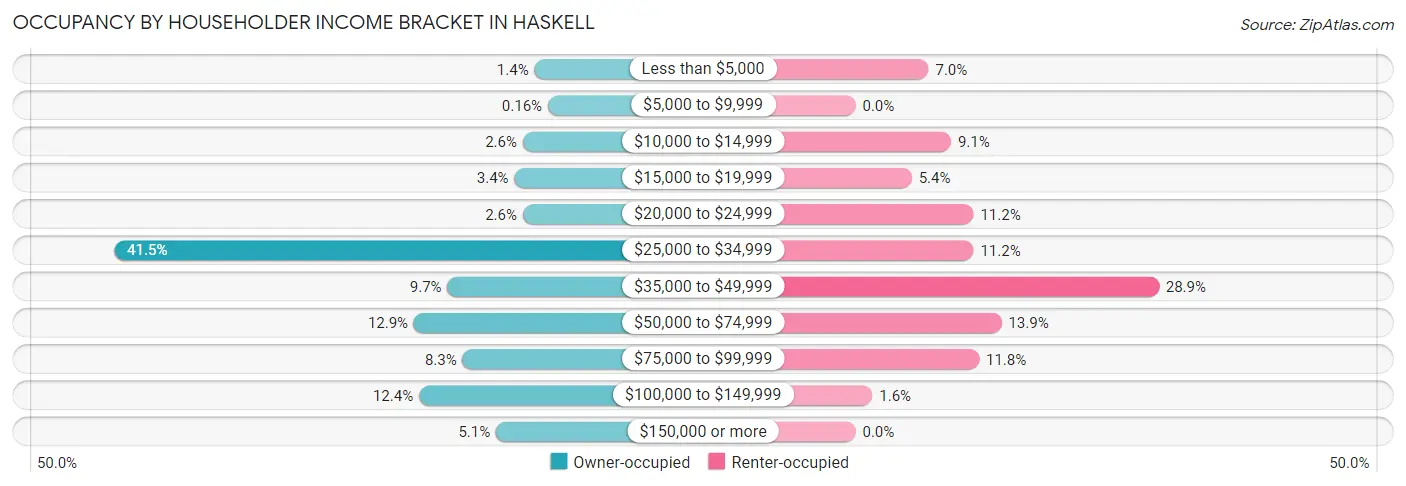
| Income Bracket | Owner-occupied | Renter-occupied |
| Less than $5,000 | 9 (1.4%) | 13 (7.0%) |
| $5,000 to $9,999 | 1 (0.2%) | 0 (0.0%) |
| $10,000 to $14,999 | 16 (2.5%) | 17 (9.1%) |
| $15,000 to $19,999 | 21 (3.4%) | 10 (5.3%) |
| $20,000 to $24,999 | 16 (2.5%) | 21 (11.2%) |
| $25,000 to $34,999 | 260 (41.5%) | 21 (11.2%) |
| $35,000 to $49,999 | 61 (9.7%) | 54 (28.9%) |
| $50,000 to $74,999 | 81 (12.9%) | 26 (13.9%) |
| $75,000 to $99,999 | 52 (8.3%) | 22 (11.8%) |
| $100,000 to $149,999 | 78 (12.4%) | 3 (1.6%) |
| $150,000 or more | 32 (5.1%) | 0 (0.0%) |
| Total | 627 (100.0%) | 187 (100.0%) |
Monthly Housing Cost Tiers in Haskell
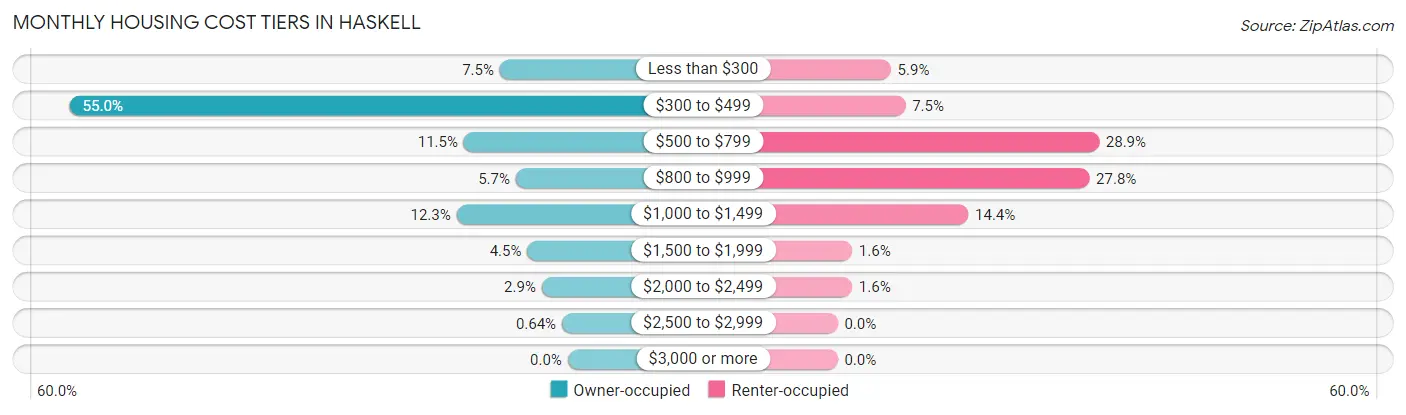
| Monthly Cost | Owner-occupied | Renter-occupied |
| Less than $300 | 47 (7.5%) | 11 (5.9%) |
| $300 to $499 | 345 (55.0%) | 14 (7.5%) |
| $500 to $799 | 72 (11.5%) | 54 (28.9%) |
| $800 to $999 | 36 (5.7%) | 52 (27.8%) |
| $1,000 to $1,499 | 77 (12.3%) | 27 (14.4%) |
| $1,500 to $1,999 | 28 (4.5%) | 3 (1.6%) |
| $2,000 to $2,499 | 18 (2.9%) | 3 (1.6%) |
| $2,500 to $2,999 | 4 (0.6%) | 0 (0.0%) |
| $3,000 or more | 0 (0.0%) | 0 (0.0%) |
| Total | 627 (100.0%) | 187 (100.0%) |
Physical Housing Characteristics in Haskell
Housing Structures in Haskell
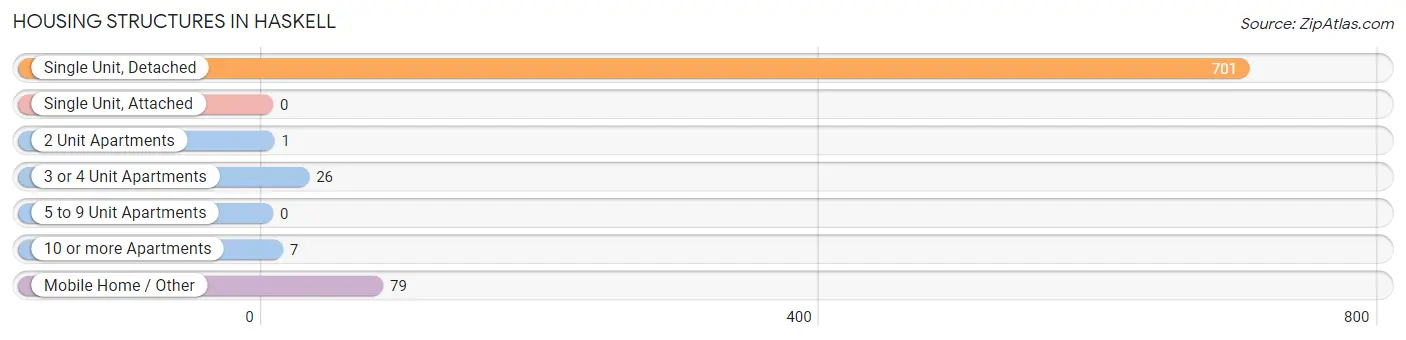
| Structure Type | # Housing Units | % Housing Units |
| Single Unit, Detached | 701 | 86.1% |
| Single Unit, Attached | 0 | 0.0% |
| 2 Unit Apartments | 1 | 0.1% |
| 3 or 4 Unit Apartments | 26 | 3.2% |
| 5 to 9 Unit Apartments | 0 | 0.0% |
| 10 or more Apartments | 7 | 0.9% |
| Mobile Home / Other | 79 | 9.7% |
| Total | 814 | 100.0% |
Housing Structures by Occupancy in Haskell
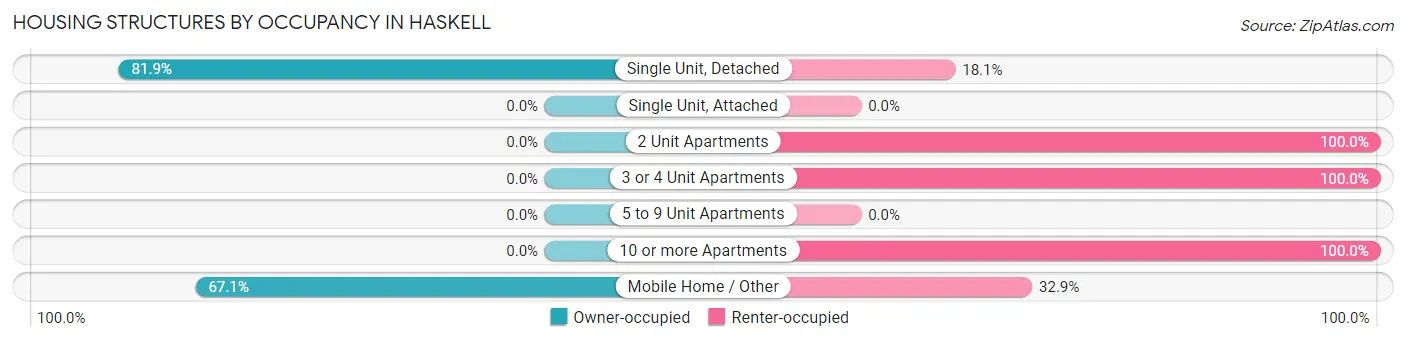
| Structure Type | Owner-occupied | Renter-occupied |
| Single Unit, Detached | 574 (81.9%) | 127 (18.1%) |
| Single Unit, Attached | 0 (0.0%) | 0 (0.0%) |
| 2 Unit Apartments | 0 (0.0%) | 1 (100.0%) |
| 3 or 4 Unit Apartments | 0 (0.0%) | 26 (100.0%) |
| 5 to 9 Unit Apartments | 0 (0.0%) | 0 (0.0%) |
| 10 or more Apartments | 0 (0.0%) | 7 (100.0%) |
| Mobile Home / Other | 53 (67.1%) | 26 (32.9%) |
| Total | 627 (77.0%) | 187 (23.0%) |
Housing Structures by Number of Rooms in Haskell
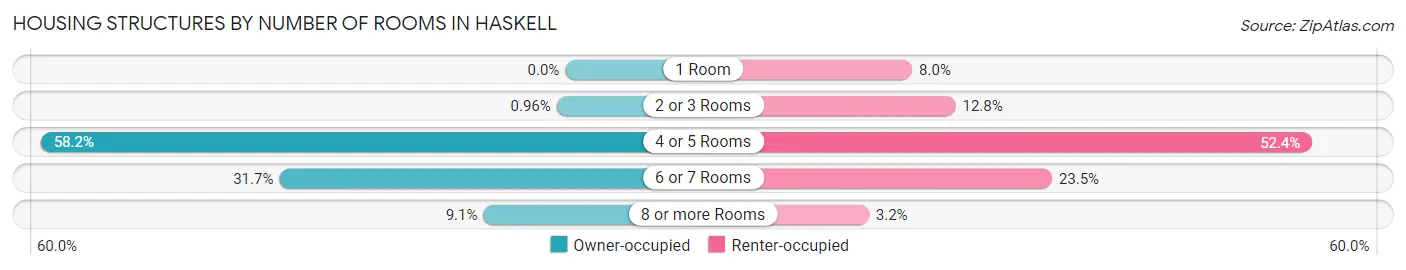
| Number of Rooms | Owner-occupied | Renter-occupied |
| 1 Room | 0 (0.0%) | 15 (8.0%) |
| 2 or 3 Rooms | 6 (1.0%) | 24 (12.8%) |
| 4 or 5 Rooms | 365 (58.2%) | 98 (52.4%) |
| 6 or 7 Rooms | 199 (31.7%) | 44 (23.5%) |
| 8 or more Rooms | 57 (9.1%) | 6 (3.2%) |
| Total | 627 (100.0%) | 187 (100.0%) |
Housing Structure by Heating Type in Haskell
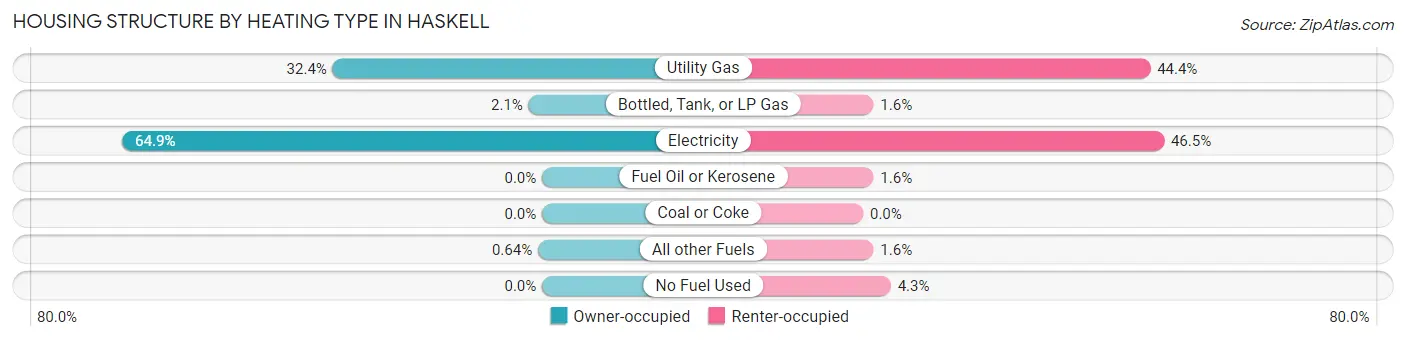
| Heating Type | Owner-occupied | Renter-occupied |
| Utility Gas | 203 (32.4%) | 83 (44.4%) |
| Bottled, Tank, or LP Gas | 13 (2.1%) | 3 (1.6%) |
| Electricity | 407 (64.9%) | 87 (46.5%) |
| Fuel Oil or Kerosene | 0 (0.0%) | 3 (1.6%) |
| Coal or Coke | 0 (0.0%) | 0 (0.0%) |
| All other Fuels | 4 (0.6%) | 3 (1.6%) |
| No Fuel Used | 0 (0.0%) | 8 (4.3%) |
| Total | 627 (100.0%) | 187 (100.0%) |
Household Vehicle Usage in Haskell
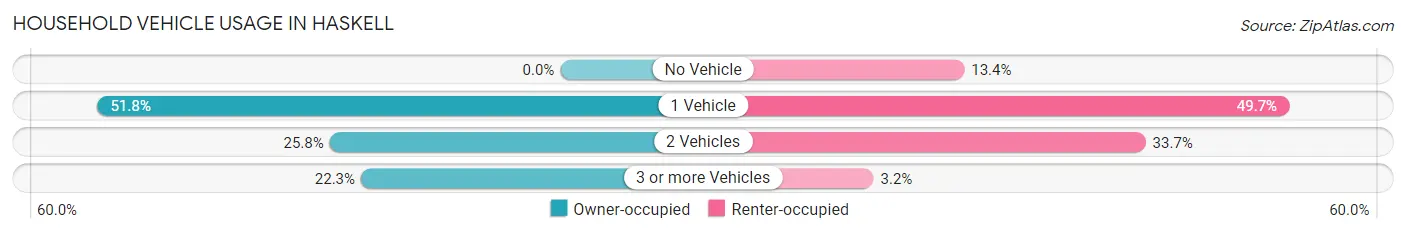
| Vehicles per Household | Owner-occupied | Renter-occupied |
| No Vehicle | 0 (0.0%) | 25 (13.4%) |
| 1 Vehicle | 325 (51.8%) | 93 (49.7%) |
| 2 Vehicles | 162 (25.8%) | 63 (33.7%) |
| 3 or more Vehicles | 140 (22.3%) | 6 (3.2%) |
| Total | 627 (100.0%) | 187 (100.0%) |
Real Estate & Mortgages in Haskell
Real Estate and Mortgage Overview in Haskell
| Characteristic | Without Mortgage | With Mortgage |
| Housing Units | 441 | 186 |
| Median Property Value | $111,700 | $116,700 |
| Median Household Income | $26,927 | $26 |
| Monthly Housing Costs | $439 | $0 |
| Real Estate Taxes | $688 | $16 |
Property Value by Mortgage Status in Haskell
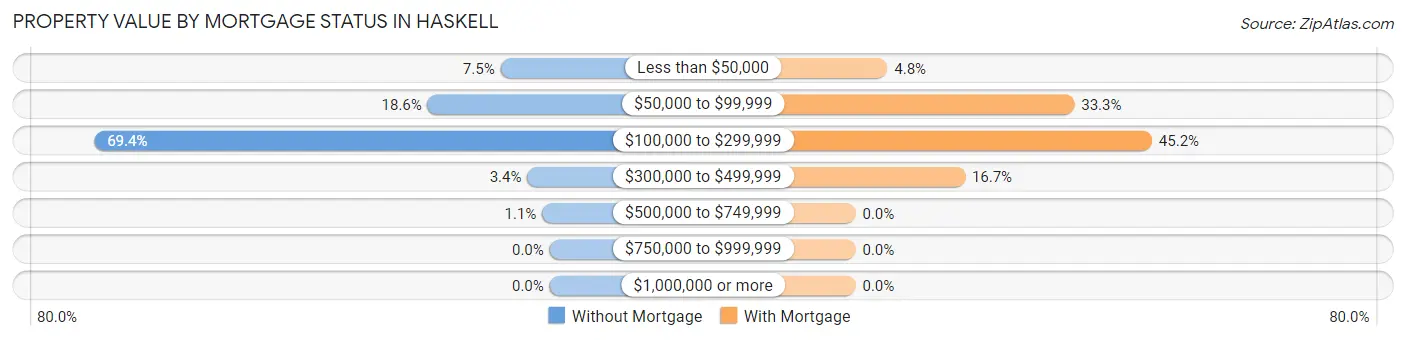
| Property Value | Without Mortgage | With Mortgage |
| Less than $50,000 | 33 (7.5%) | 9 (4.8%) |
| $50,000 to $99,999 | 82 (18.6%) | 62 (33.3%) |
| $100,000 to $299,999 | 306 (69.4%) | 84 (45.2%) |
| $300,000 to $499,999 | 15 (3.4%) | 31 (16.7%) |
| $500,000 to $749,999 | 5 (1.1%) | 0 (0.0%) |
| $750,000 to $999,999 | 0 (0.0%) | 0 (0.0%) |
| $1,000,000 or more | 0 (0.0%) | 0 (0.0%) |
| Total | 441 (100.0%) | 186 (100.0%) |
Household Income by Mortgage Status in Haskell
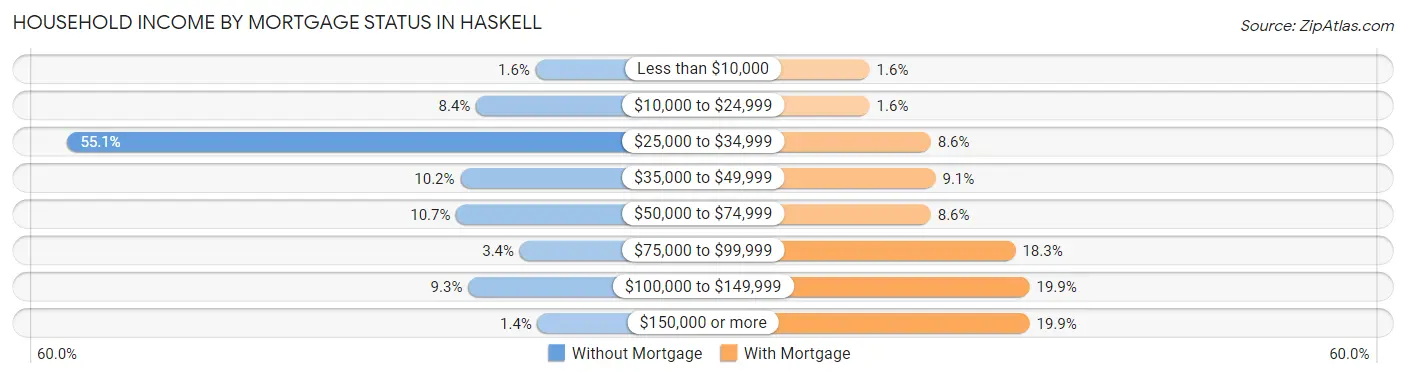
| Household Income | Without Mortgage | With Mortgage |
| Less than $10,000 | 7 (1.6%) | 3 (1.6%) |
| $10,000 to $24,999 | 37 (8.4%) | 3 (1.6%) |
| $25,000 to $34,999 | 243 (55.1%) | 16 (8.6%) |
| $35,000 to $49,999 | 45 (10.2%) | 17 (9.1%) |
| $50,000 to $74,999 | 47 (10.7%) | 16 (8.6%) |
| $75,000 to $99,999 | 15 (3.4%) | 34 (18.3%) |
| $100,000 to $149,999 | 41 (9.3%) | 37 (19.9%) |
| $150,000 or more | 6 (1.4%) | 37 (19.9%) |
| Total | 441 (100.0%) | 186 (100.0%) |
Property Value to Household Income Ratio in Haskell
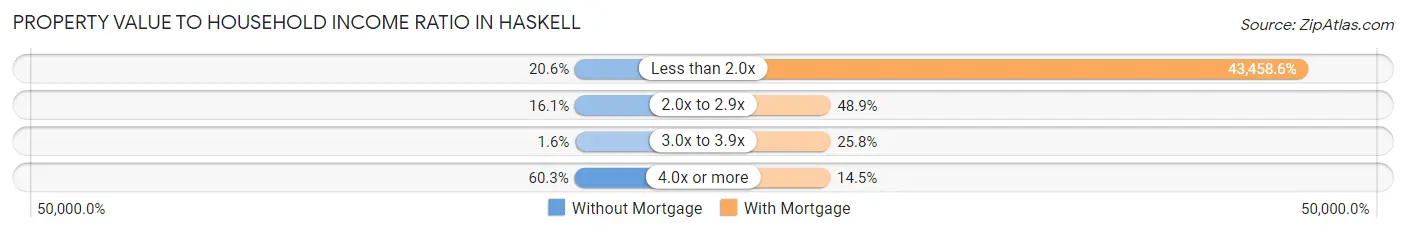
| Value-to-Income Ratio | Without Mortgage | With Mortgage |
| Less than 2.0x | 91 (20.6%) | 80,833 (43,458.6%) |
| 2.0x to 2.9x | 71 (16.1%) | 91 (48.9%) |
| 3.0x to 3.9x | 7 (1.6%) | 48 (25.8%) |
| 4.0x or more | 266 (60.3%) | 27 (14.5%) |
| Total | 441 (100.0%) | 186 (100.0%) |
Real Estate Taxes by Mortgage Status in Haskell
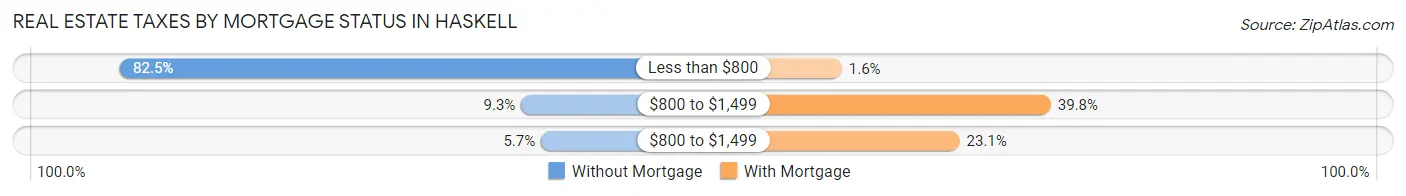
| Property Taxes | Without Mortgage | With Mortgage |
| Less than $800 | 364 (82.5%) | 3 (1.6%) |
| $800 to $1,499 | 41 (9.3%) | 74 (39.8%) |
| $800 to $1,499 | 25 (5.7%) | 43 (23.1%) |
| Total | 441 (100.0%) | 186 (100.0%) |
Health & Disability in Haskell
Health Insurance Coverage by Age in Haskell
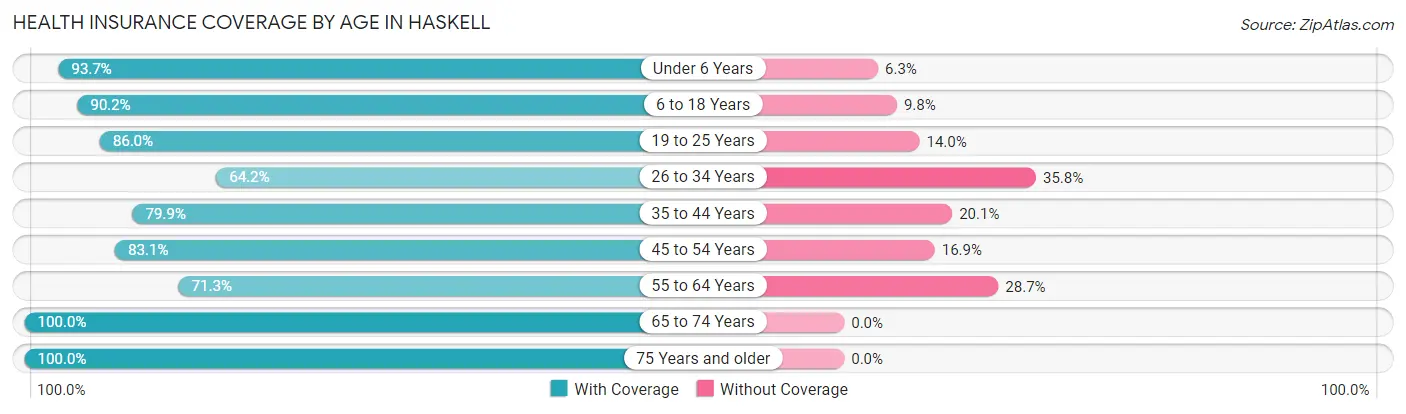
| Age Bracket | With Coverage | Without Coverage |
| Under 6 Years | 104 (93.7%) | 7 (6.3%) |
| 6 to 18 Years | 312 (90.2%) | 34 (9.8%) |
| 19 to 25 Years | 98 (86.0%) | 16 (14.0%) |
| 26 to 34 Years | 97 (64.2%) | 54 (35.8%) |
| 35 to 44 Years | 127 (79.9%) | 32 (20.1%) |
| 45 to 54 Years | 192 (83.1%) | 39 (16.9%) |
| 55 to 64 Years | 124 (71.3%) | 50 (28.7%) |
| 65 to 74 Years | 85 (100.0%) | 0 (0.0%) |
| 75 Years and older | 388 (100.0%) | 0 (0.0%) |
| Total | 1,527 (86.8%) | 232 (13.2%) |
Health Insurance Coverage by Citizenship Status in Haskell
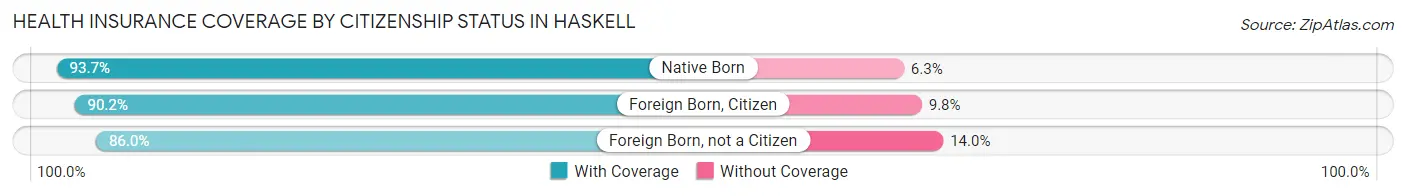
| Citizenship Status | With Coverage | Without Coverage |
| Native Born | 104 (93.7%) | 7 (6.3%) |
| Foreign Born, Citizen | 312 (90.2%) | 34 (9.8%) |
| Foreign Born, not a Citizen | 98 (86.0%) | 16 (14.0%) |
Health Insurance Coverage by Household Income in Haskell
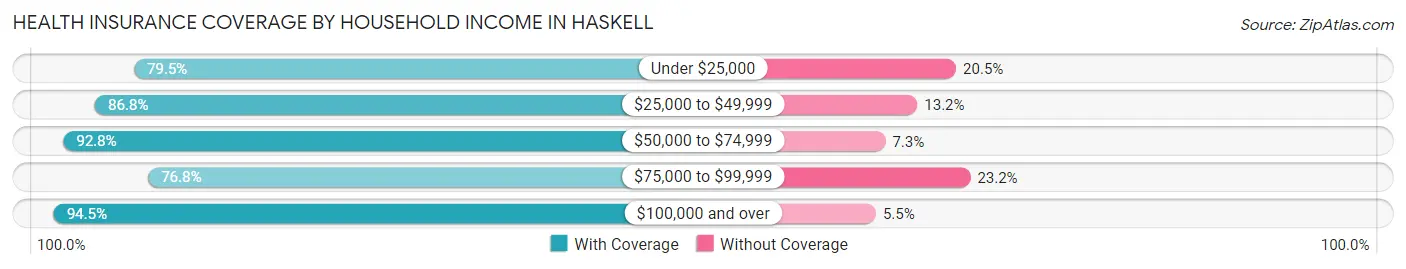
| Household Income | With Coverage | Without Coverage |
| Under $25,000 | 194 (79.5%) | 50 (20.5%) |
| $25,000 to $49,999 | 584 (86.8%) | 89 (13.2%) |
| $50,000 to $74,999 | 179 (92.7%) | 14 (7.2%) |
| $75,000 to $99,999 | 189 (76.8%) | 57 (23.2%) |
| $100,000 and over | 381 (94.5%) | 22 (5.5%) |
Public vs Private Health Insurance Coverage by Age in Haskell
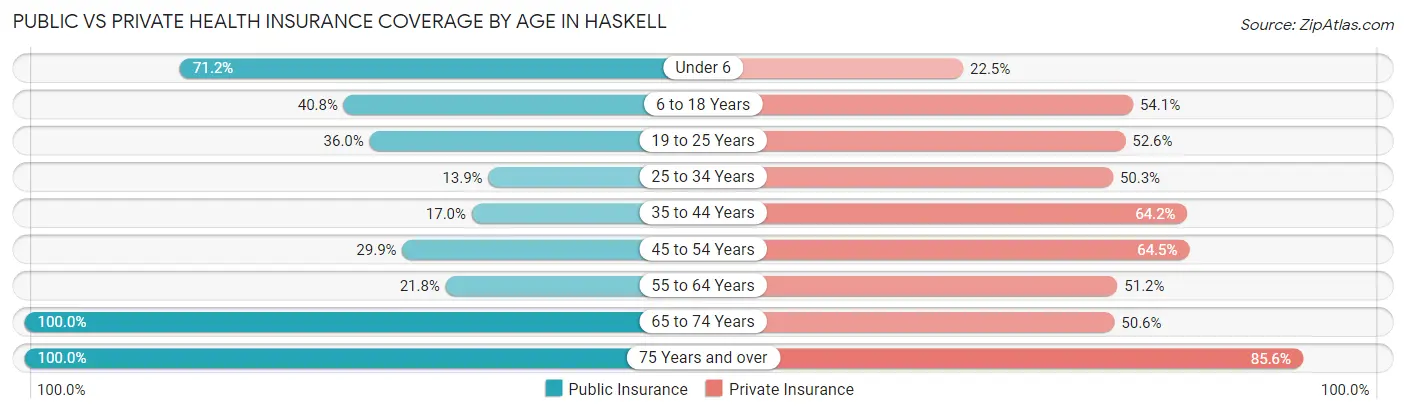
| Age Bracket | Public Insurance | Private Insurance |
| Under 6 | 79 (71.2%) | 25 (22.5%) |
| 6 to 18 Years | 141 (40.7%) | 187 (54.0%) |
| 19 to 25 Years | 41 (36.0%) | 60 (52.6%) |
| 25 to 34 Years | 21 (13.9%) | 76 (50.3%) |
| 35 to 44 Years | 27 (17.0%) | 102 (64.1%) |
| 45 to 54 Years | 69 (29.9%) | 149 (64.5%) |
| 55 to 64 Years | 38 (21.8%) | 89 (51.1%) |
| 65 to 74 Years | 85 (100.0%) | 43 (50.6%) |
| 75 Years and over | 388 (100.0%) | 332 (85.6%) |
| Total | 889 (50.5%) | 1,063 (60.4%) |
Disability Status by Sex by Age in Haskell
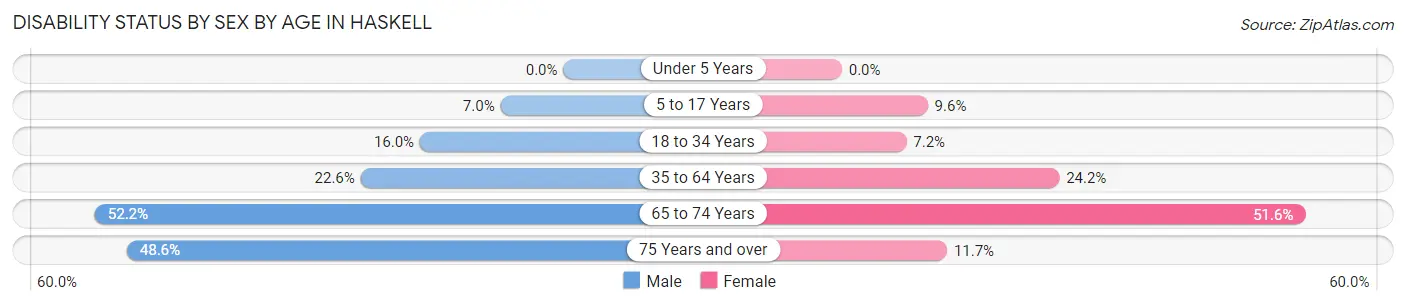
| Age Bracket | Male | Female |
| Under 5 Years | 0 (0.0%) | 0 (0.0%) |
| 5 to 17 Years | 14 (7.0%) | 13 (9.6%) |
| 18 to 34 Years | 19 (16.0%) | 12 (7.2%) |
| 35 to 64 Years | 63 (22.6%) | 69 (24.2%) |
| 65 to 74 Years | 12 (52.2%) | 32 (51.6%) |
| 75 Years and over | 35 (48.6%) | 37 (11.7%) |
Disability Class by Sex by Age in Haskell
Disability Class: Hearing Difficulty
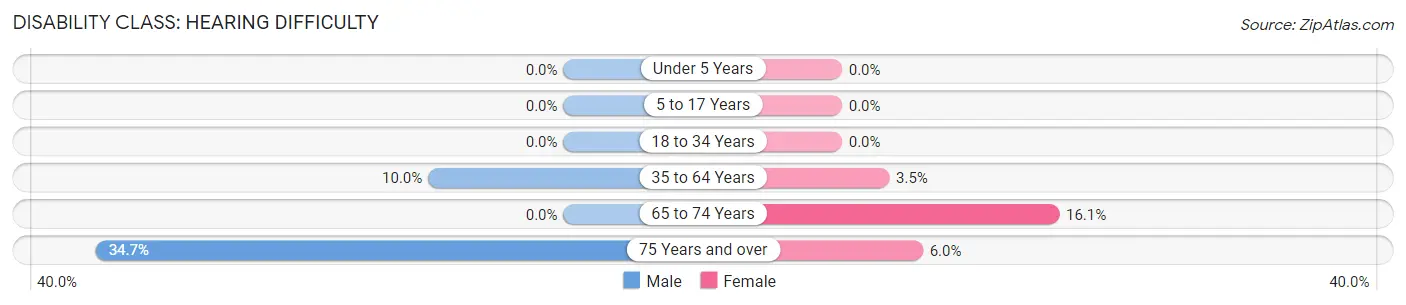
| Age Bracket | Male | Female |
| Under 5 Years | 0 (0.0%) | 0 (0.0%) |
| 5 to 17 Years | 0 (0.0%) | 0 (0.0%) |
| 18 to 34 Years | 0 (0.0%) | 0 (0.0%) |
| 35 to 64 Years | 28 (10.0%) | 10 (3.5%) |
| 65 to 74 Years | 0 (0.0%) | 10 (16.1%) |
| 75 Years and over | 25 (34.7%) | 19 (6.0%) |
Disability Class: Vision Difficulty
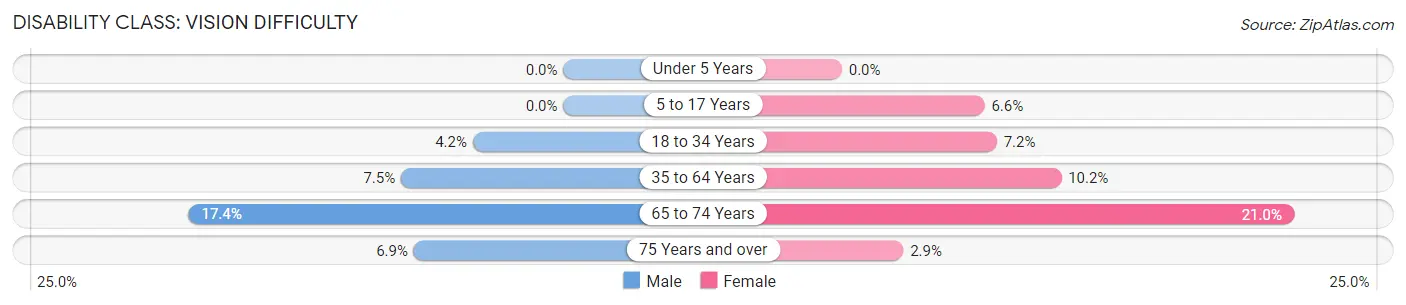
| Age Bracket | Male | Female |
| Under 5 Years | 0 (0.0%) | 0 (0.0%) |
| 5 to 17 Years | 0 (0.0%) | 9 (6.6%) |
| 18 to 34 Years | 5 (4.2%) | 12 (7.2%) |
| 35 to 64 Years | 21 (7.5%) | 29 (10.2%) |
| 65 to 74 Years | 4 (17.4%) | 13 (21.0%) |
| 75 Years and over | 5 (6.9%) | 9 (2.9%) |
Disability Class: Cognitive Difficulty
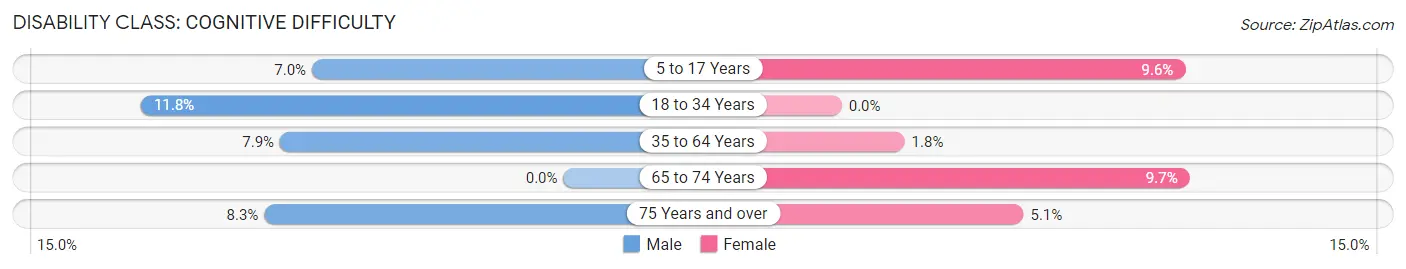
| Age Bracket | Male | Female |
| 5 to 17 Years | 14 (7.0%) | 13 (9.6%) |
| 18 to 34 Years | 14 (11.8%) | 0 (0.0%) |
| 35 to 64 Years | 22 (7.9%) | 5 (1.8%) |
| 65 to 74 Years | 0 (0.0%) | 6 (9.7%) |
| 75 Years and over | 6 (8.3%) | 16 (5.1%) |
Disability Class: Ambulatory Difficulty
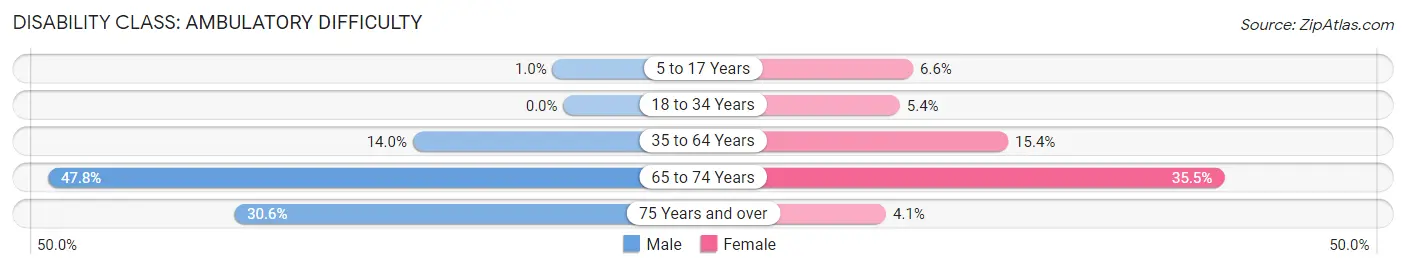
| Age Bracket | Male | Female |
| 5 to 17 Years | 2 (1.0%) | 9 (6.6%) |
| 18 to 34 Years | 0 (0.0%) | 9 (5.4%) |
| 35 to 64 Years | 39 (14.0%) | 44 (15.4%) |
| 65 to 74 Years | 11 (47.8%) | 22 (35.5%) |
| 75 Years and over | 22 (30.6%) | 13 (4.1%) |
Disability Class: Self-Care Difficulty
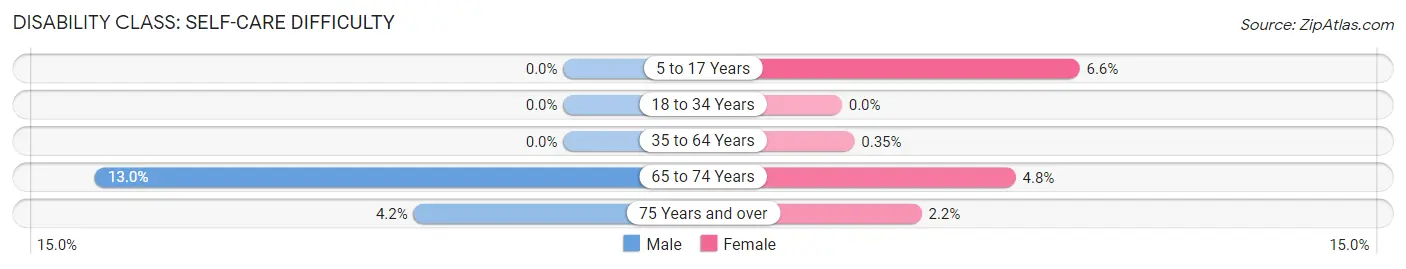
| Age Bracket | Male | Female |
| 5 to 17 Years | 0 (0.0%) | 9 (6.6%) |
| 18 to 34 Years | 0 (0.0%) | 0 (0.0%) |
| 35 to 64 Years | 0 (0.0%) | 1 (0.4%) |
| 65 to 74 Years | 3 (13.0%) | 3 (4.8%) |
| 75 Years and over | 3 (4.2%) | 7 (2.2%) |
Technology Access in Haskell
Computing Device Access in Haskell
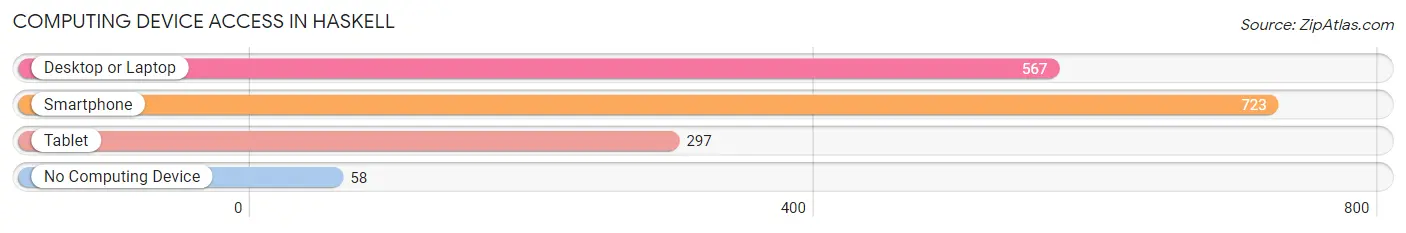
| Device Type | # Households | % Households |
| Desktop or Laptop | 567 | 69.7% |
| Smartphone | 723 | 88.8% |
| Tablet | 297 | 36.5% |
| No Computing Device | 58 | 7.1% |
| Total | 814 | 100.0% |
Internet Access in Haskell
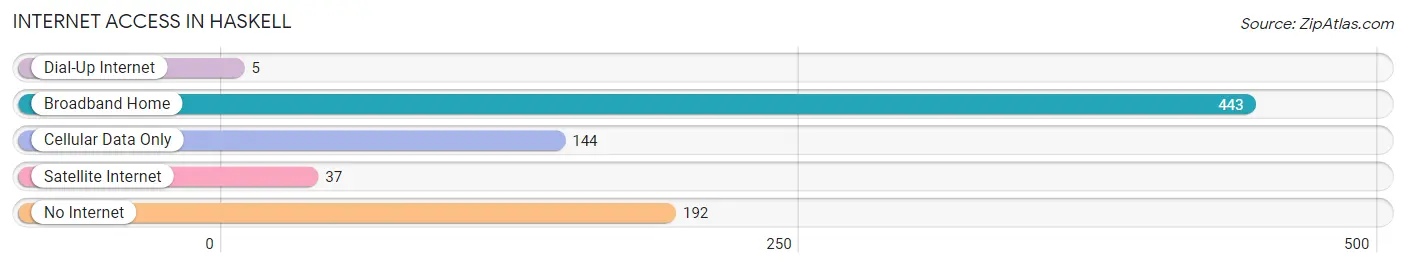
| Internet Type | # Households | % Households |
| Dial-Up Internet | 5 | 0.6% |
| Broadband Home | 443 | 54.4% |
| Cellular Data Only | 144 | 17.7% |
| Satellite Internet | 37 | 4.5% |
| No Internet | 192 | 23.6% |
| Total | 814 | 100.0% |
Haskell Summary
Haskell, Oklahoma is a small town located in Muskogee County, Oklahoma. It is situated on the Arkansas River, about 20 miles east of Muskogee. The town was founded in 1891 and named after Charles N. Haskell, the first governor of Oklahoma. The population of Haskell was 1,845 in the 2000 census.
Geography
Haskell is located in the foothills of the Ozark Mountains, and is surrounded by rolling hills and wooded areas. The town is situated on the Arkansas River, and is bordered by the towns of Muskogee, Fort Gibson, and Wagoner. The climate in Haskell is generally mild, with temperatures ranging from the mid-50s in the winter to the mid-80s in the summer.
Economy
The economy of Haskell is largely based on agriculture and manufacturing. The town is home to several large farms, which produce a variety of crops, including corn, soybeans, wheat, and hay. Haskell also has several manufacturing plants, which produce a variety of products, including furniture, clothing, and automotive parts.
Demographics
As of the 2000 census, the population of Haskell was 1,845. The racial makeup of the town was 79.2% White, 15.2% Native American, 0.7% African American, 0.3% Asian, and 4.6% from other races. The median household income was $25,938, and the median family income was $30,938.
The town is served by the Haskell Public Schools, which includes Haskell High School. The town also has several churches, including the First Baptist Church, the First United Methodist Church, and the Church of Christ.
Conclusion
Haskell, Oklahoma is a small town located in Muskogee County, Oklahoma. It is situated on the Arkansas River, about 20 miles east of Muskogee. The town was founded in 1891 and named after Charles N. Haskell, the first governor of Oklahoma. The economy of Haskell is largely based on agriculture and manufacturing, and the population of the town was 1,845 in the 2000 census. Haskell is served by the Haskell Public Schools, and has several churches, including the First Baptist Church, the First United Methodist Church, and the Church of Christ.
Common Questions
What is Per Capita Income in Haskell?
Per Capita income in Haskell is $24,822.
What is the Median Family Income in Haskell?
Median Family Income in Haskell is $59,628.
What is the Median Household income in Haskell?
Median Household Income in Haskell is $35,119.
What is Income or Wage Gap in Haskell?
Income or Wage Gap in Haskell is 42.3%.
Women in Haskell earn 57.7 cents for every dollar earned by a man.
What is Inequality or Gini Index in Haskell?
Inequality or Gini Index in Haskell is 0.40.
What is the Total Population of Haskell?
Total Population of Haskell is 1,824.
What is the Total Male Population of Haskell?
Total Male Population of Haskell is 726.
What is the Total Female Population of Haskell?
Total Female Population of Haskell is 1,098.
What is the Ratio of Males per 100 Females in Haskell?
There are 66.12 Males per 100 Females in Haskell.
What is the Ratio of Females per 100 Males in Haskell?
There are 151.24 Females per 100 Males in Haskell.
What is the Median Population Age in Haskell?
Median Population Age in Haskell is 47.4 Years.
What is the Average Family Size in Haskell
Average Family Size in Haskell is 3.1 People.
What is the Average Household Size in Haskell
Average Household Size in Haskell is 2.2 People.
How Large is the Labor Force in Haskell?
There are 583 People in the Labor Forcein in Haskell.
What is the Percentage of People in the Labor Force in Haskell?
40.9% of People are in the Labor Force in Haskell.
What is the Unemployment Rate in Haskell?
Unemployment Rate in Haskell is 7.4%.