Okay, OK Map & Demographics
Okay Map
Okay Overview
$25,980
PER CAPITA INCOME
$61,786
AVG FAMILY INCOME
$39,792
AVG HOUSEHOLD INCOME
20.8%
WAGE / INCOME GAP [ % ]
79.2¢/ $1
WAGE / INCOME GAP [ $ ]
0.41
INEQUALITY / GINI INDEX
432
TOTAL POPULATION
211
MALE POPULATION
221
FEMALE POPULATION
95.48
MALES / 100 FEMALES
104.74
FEMALES / 100 MALES
43.2
MEDIAN AGE
3.4
AVG FAMILY SIZE
2.6
AVG HOUSEHOLD SIZE
199
LABOR FORCE [ PEOPLE ]
56.4%
PERCENT IN LABOR FORCE
8.5%
UNEMPLOYMENT RATE
Okay Zip Codes
Okay Area Codes
Income in Okay
Income Overview in Okay
Per Capita Income in Okay is $25,980, while median incomes of families and households are $61,786 and $39,792 respectively.
| Characteristic | Number | Measure |
| Per Capita Income | 432 | $25,980 |
| Median Family Income | 102 | $61,786 |
| Mean Family Income | 102 | $72,393 |
| Median Household Income | 167 | $39,792 |
| Mean Household Income | 167 | $56,211 |
| Income Deficit | 102 | $0 |
| Wage / Income Gap (%) | 432 | 20.76% |
| Wage / Income Gap ($) | 432 | 79.24¢ per $1 |
| Gini / Inequality Index | 432 | 0.41 |
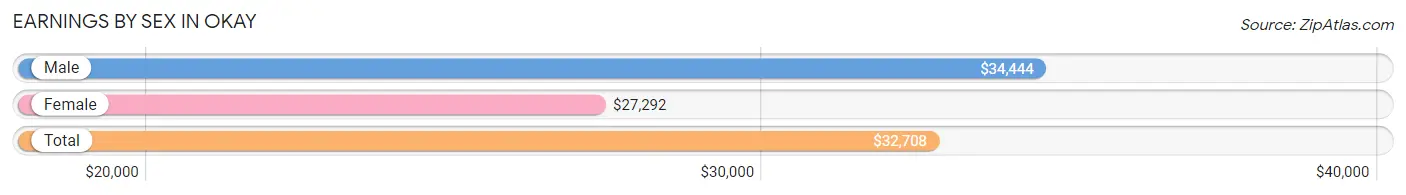
Earnings by Sex in Okay
Average Earnings in Okay are $32,708, $34,444 for men and $27,292 for women, a difference of 20.8%.
| Sex | Number | Average Earnings |
| Male | 90 (45.7%) | $34,444 |
| Female | 107 (54.3%) | $27,292 |
| Total | 197 (100.0%) | $32,708 |
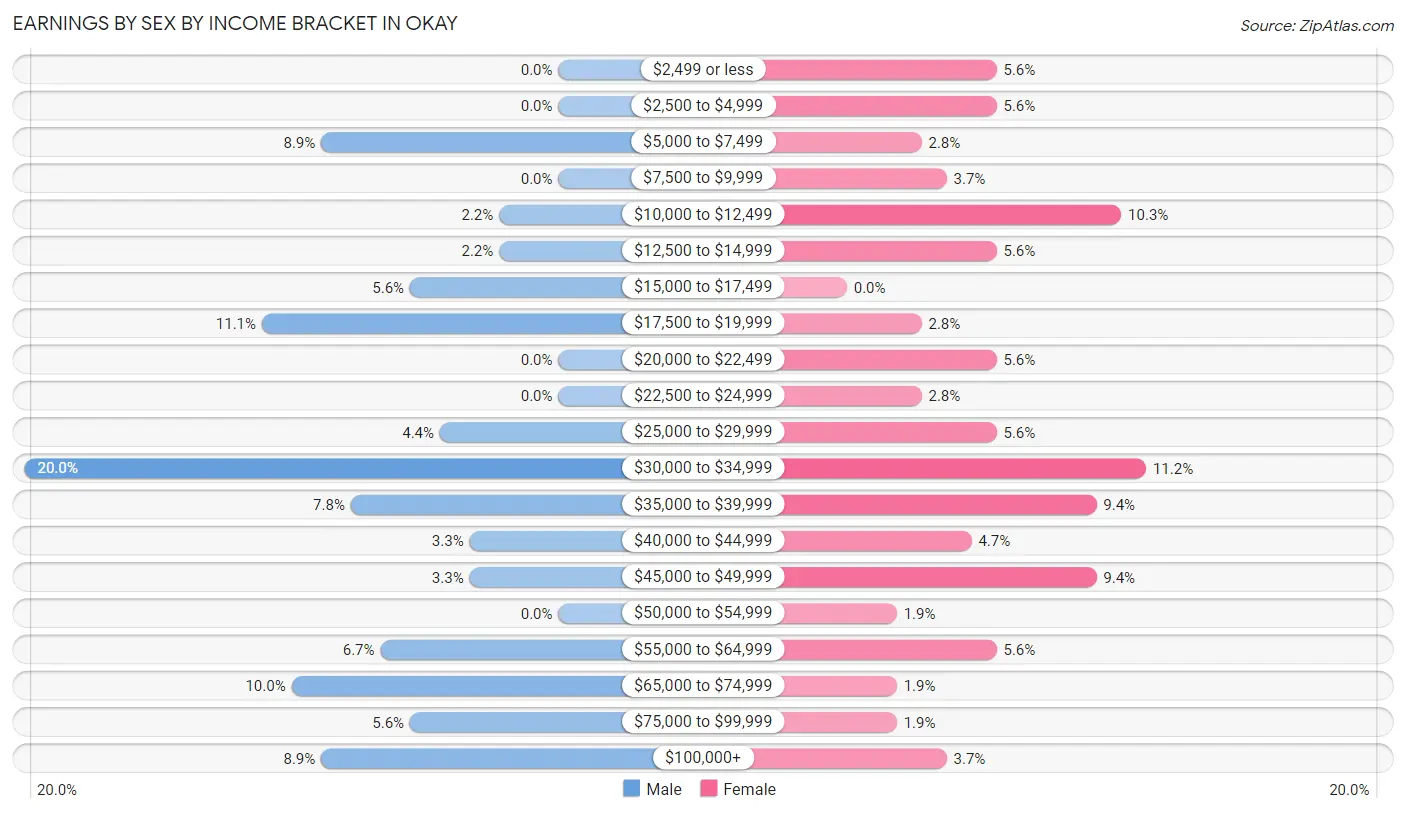
Earnings by Sex by Income Bracket in Okay
The most common earnings brackets in Okay are $30,000 to $34,999 for men (18 | 20.0%) and $30,000 to $34,999 for women (12 | 11.2%).
| Income | Male | Female |
| $2,499 or less | 0 (0.0%) | 6 (5.6%) |
| $2,500 to $4,999 | 0 (0.0%) | 6 (5.6%) |
| $5,000 to $7,499 | 8 (8.9%) | 3 (2.8%) |
| $7,500 to $9,999 | 0 (0.0%) | 4 (3.7%) |
| $10,000 to $12,499 | 2 (2.2%) | 11 (10.3%) |
| $12,500 to $14,999 | 2 (2.2%) | 6 (5.6%) |
| $15,000 to $17,499 | 5 (5.6%) | 0 (0.0%) |
| $17,500 to $19,999 | 10 (11.1%) | 3 (2.8%) |
| $20,000 to $22,499 | 0 (0.0%) | 6 (5.6%) |
| $22,500 to $24,999 | 0 (0.0%) | 3 (2.8%) |
| $25,000 to $29,999 | 4 (4.4%) | 6 (5.6%) |
| $30,000 to $34,999 | 18 (20.0%) | 12 (11.2%) |
| $35,000 to $39,999 | 7 (7.8%) | 10 (9.3%) |
| $40,000 to $44,999 | 3 (3.3%) | 5 (4.7%) |
| $45,000 to $49,999 | 3 (3.3%) | 10 (9.3%) |
| $50,000 to $54,999 | 0 (0.0%) | 2 (1.9%) |
| $55,000 to $64,999 | 6 (6.7%) | 6 (5.6%) |
| $65,000 to $74,999 | 9 (10.0%) | 2 (1.9%) |
| $75,000 to $99,999 | 5 (5.6%) | 2 (1.9%) |
| $100,000+ | 8 (8.9%) | 4 (3.7%) |
| Total | 90 (100.0%) | 107 (100.0%) |
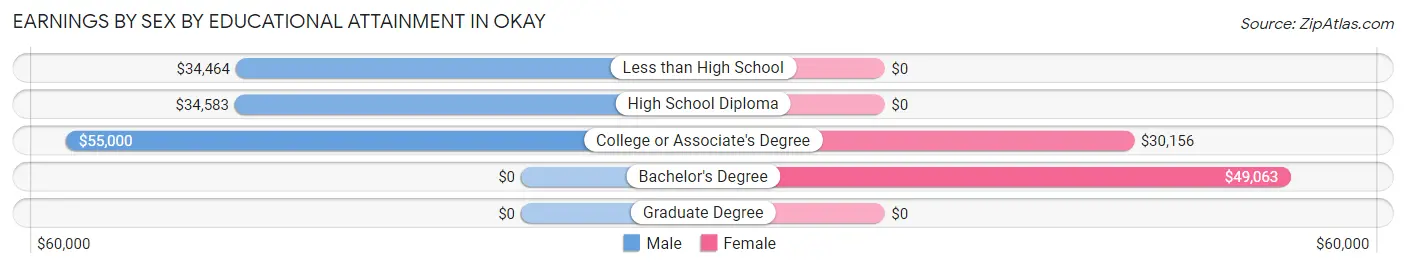
Earnings by Sex by Educational Attainment in Okay
Average earnings in Okay are $37,000 for men and $31,042 for women, a difference of 16.1%. Men with an educational attainment of college or associate's degree enjoy the highest average annual earnings of $55,000, while those with less than high school education earn the least with $34,464. Women with an educational attainment of bachelor's degree earn the most with the average annual earnings of $49,063, while those with college or associate's degree education have the smallest earnings of $30,156.
| Educational Attainment | Male Income | Female Income |
| Less than High School | $34,464 | $0 |
| High School Diploma | $34,583 | $0 |
| College or Associate's Degree | $55,000 | $30,156 |
| Bachelor's Degree | - | - |
| Graduate Degree | - | - |
| Total | $37,000 | $31,042 |
Family Income in Okay
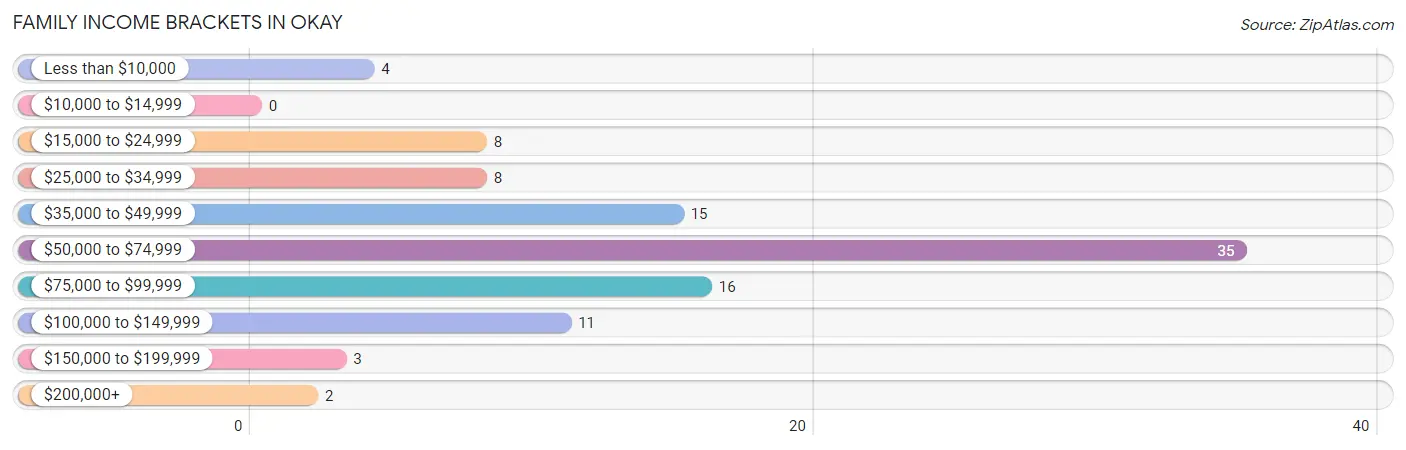
Family Income Brackets in Okay
According to the Okay family income data, there are 35 families falling into the $50,000 to $74,999 income range, which is the most common income bracket and makes up 34.3% of all families.
| Income Bracket | # Families | % Families |
| Less than $10,000 | 4 | 3.9% |
| $10,000 to $14,999 | 0 | 0.0% |
| $15,000 to $24,999 | 8 | 7.8% |
| $25,000 to $34,999 | 8 | 7.8% |
| $35,000 to $49,999 | 15 | 14.7% |
| $50,000 to $74,999 | 35 | 34.3% |
| $75,000 to $99,999 | 16 | 15.7% |
| $100,000 to $149,999 | 11 | 10.8% |
| $150,000 to $199,999 | 3 | 2.9% |
| $200,000+ | 2 | 2.0% |
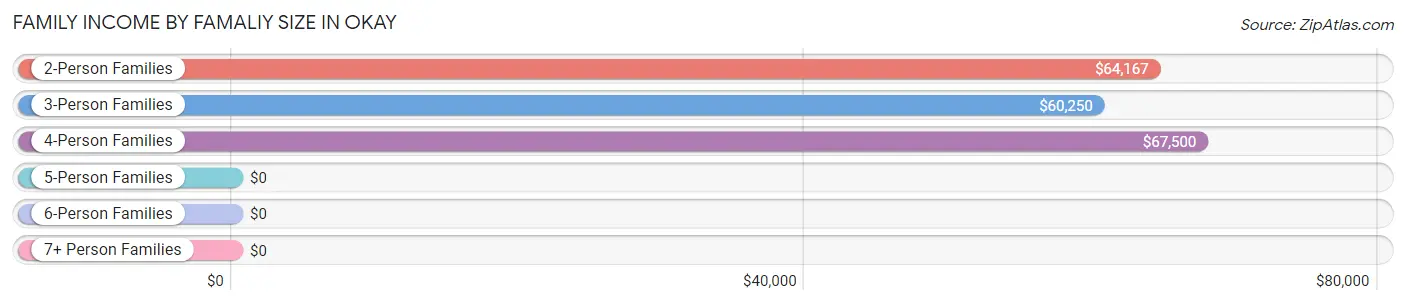
Family Income by Famaliy Size in Okay
4-person families (22 | 21.6%) account for the highest median family income in Okay with $67,500 per family, while 2-person families (42 | 41.2%) have the highest median income of $32,084 per family member.
| Income Bracket | # Families | Median Income |
| 2-Person Families | 42 (41.2%) | $64,167 |
| 3-Person Families | 27 (26.5%) | $60,250 |
| 4-Person Families | 22 (21.6%) | $67,500 |
| 5-Person Families | 6 (5.9%) | $0 |
| 6-Person Families | 2 (2.0%) | $0 |
| 7+ Person Families | 3 (2.9%) | $0 |
| Total | 102 (100.0%) | $61,786 |
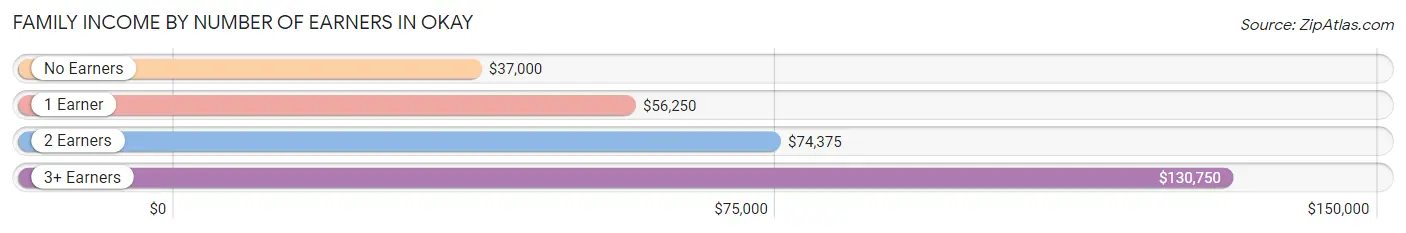
Family Income by Number of Earners in Okay
The median family income in Okay is $61,786, with families comprising 3+ earners (13) having the highest median family income of $130,750, while families with no earners (22) have the lowest median family income of $37,000, accounting for 12.8% and 21.6% of families, respectively.
| Number of Earners | # Families | Median Income |
| No Earners | 22 (21.6%) | $37,000 |
| 1 Earner | 40 (39.2%) | $56,250 |
| 2 Earners | 27 (26.5%) | $74,375 |
| 3+ Earners | 13 (12.8%) | $130,750 |
| Total | 102 (100.0%) | $61,786 |
Household Income in Okay
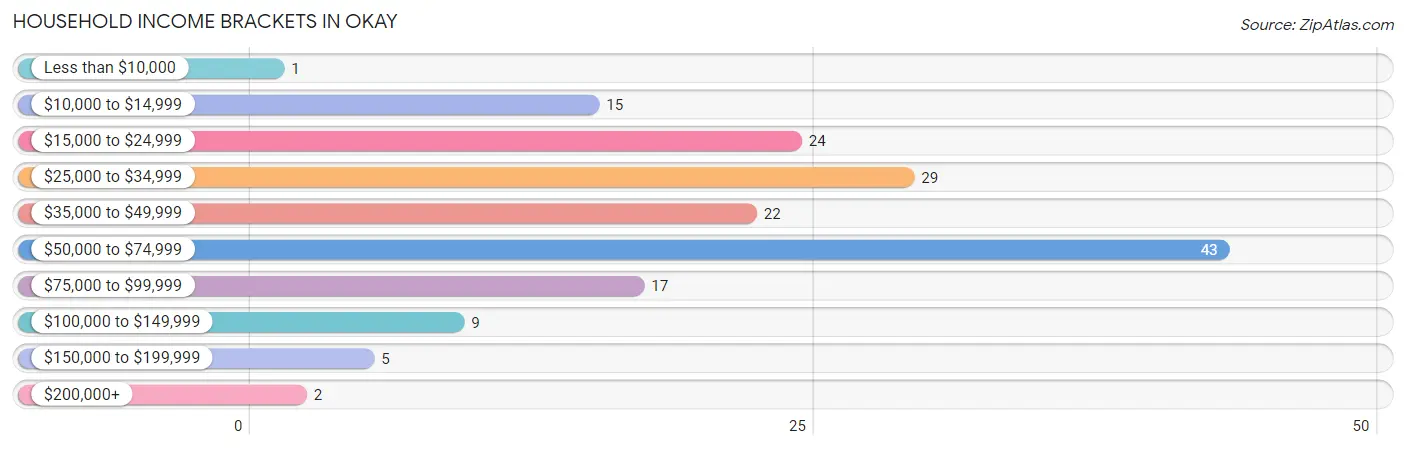
Household Income Brackets in Okay
With 43 households falling in the category, the $50,000 to $74,999 income range is the most frequent in Okay, accounting for 25.8% of all households. In contrast, only 1 households (0.6%) fall into the less than $10,000 income bracket, making it the least populous group.
| Income Bracket | # Households | % Households |
| Less than $10,000 | 1 | 0.6% |
| $10,000 to $14,999 | 15 | 9.0% |
| $15,000 to $24,999 | 24 | 14.4% |
| $25,000 to $34,999 | 29 | 17.4% |
| $35,000 to $49,999 | 22 | 13.2% |
| $50,000 to $74,999 | 43 | 25.7% |
| $75,000 to $99,999 | 17 | 10.2% |
| $100,000 to $149,999 | 9 | 5.4% |
| $150,000 to $199,999 | 5 | 3.0% |
| $200,000+ | 2 | 1.2% |
Household Income by Householder Age in Okay
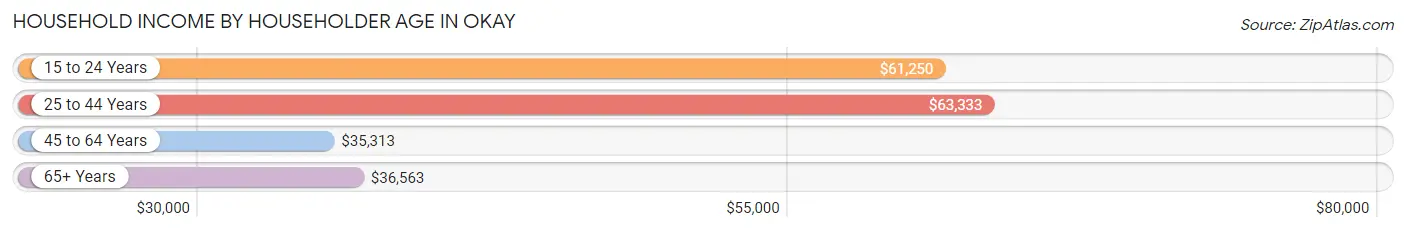
The median household income in Okay is $39,792, with the highest median household income of $63,333 found in the 25 to 44 years age bracket for the primary householder. A total of 36 households (21.6%) fall into this category. Meanwhile, the 45 to 64 years age bracket for the primary householder has the lowest median household income of $35,313, with 65 households (38.9%) in this group.
| Income Bracket | # Households | Median Income |
| 15 to 24 Years | 7 (4.2%) | $61,250 |
| 25 to 44 Years | 36 (21.6%) | $63,333 |
| 45 to 64 Years | 65 (38.9%) | $35,313 |
| 65+ Years | 59 (35.3%) | $36,563 |
| Total | 167 (100.0%) | $39,792 |
Poverty in Okay
Income Below Poverty by Sex and Age in Okay
With 11.5% poverty level for males and 21.0% for females among the residents of Okay, 55 to 64 year old males and 5 year old females are the most vulnerable to poverty, with 9 males (36.0%) and 2 females (100.0%) in their respective age groups living below the poverty level.
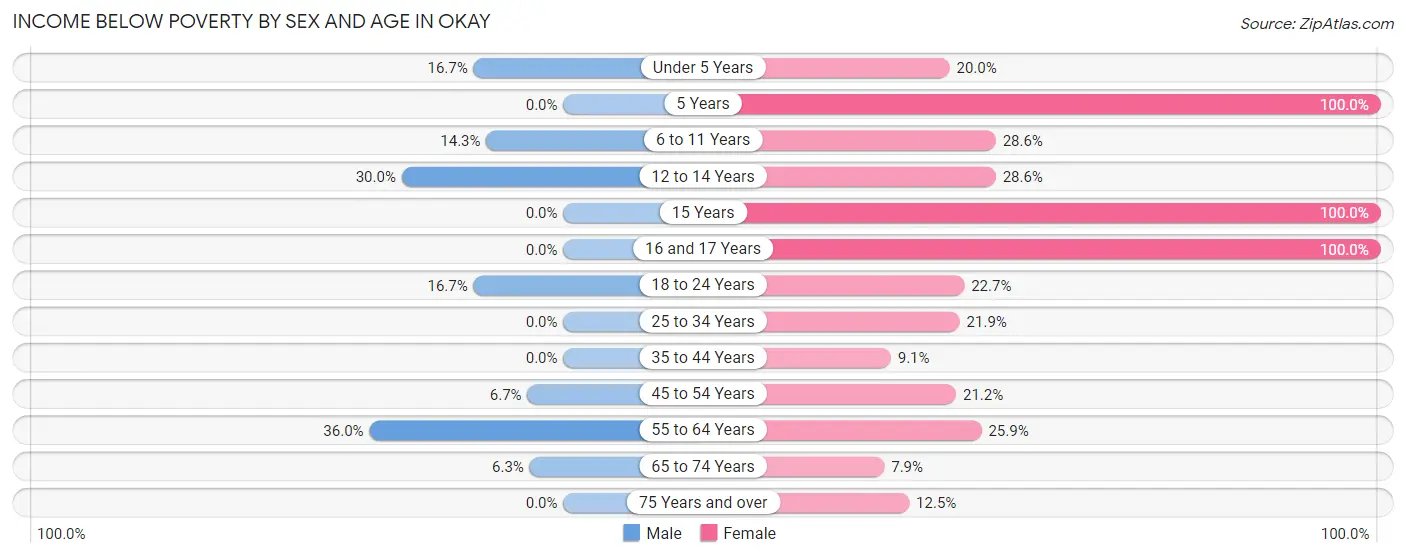
| Age Bracket | Male | Female |
| Under 5 Years | 2 (16.7%) | 2 (20.0%) |
| 5 Years | 0 (0.0%) | 2 (100.0%) |
| 6 to 11 Years | 2 (14.3%) | 4 (28.6%) |
| 12 to 14 Years | 3 (30.0%) | 2 (28.6%) |
| 15 Years | 0 (0.0%) | 2 (100.0%) |
| 16 and 17 Years | 0 (0.0%) | 2 (100.0%) |
| 18 to 24 Years | 4 (16.7%) | 5 (22.7%) |
| 25 to 34 Years | 0 (0.0%) | 7 (21.9%) |
| 35 to 44 Years | 0 (0.0%) | 2 (9.1%) |
| 45 to 54 Years | 2 (6.7%) | 7 (21.2%) |
| 55 to 64 Years | 9 (36.0%) | 7 (25.9%) |
| 65 to 74 Years | 2 (6.2%) | 3 (7.9%) |
| 75 Years and over | 0 (0.0%) | 1 (12.5%) |
| Total | 24 (11.5%) | 46 (21.0%) |
Income Above Poverty by Sex and Age in Okay
According to the poverty statistics in Okay, males aged 5 years and females aged 65 to 74 years are the age groups that are most secure financially, with 100.0% of males and 92.1% of females in these age groups living above the poverty line.
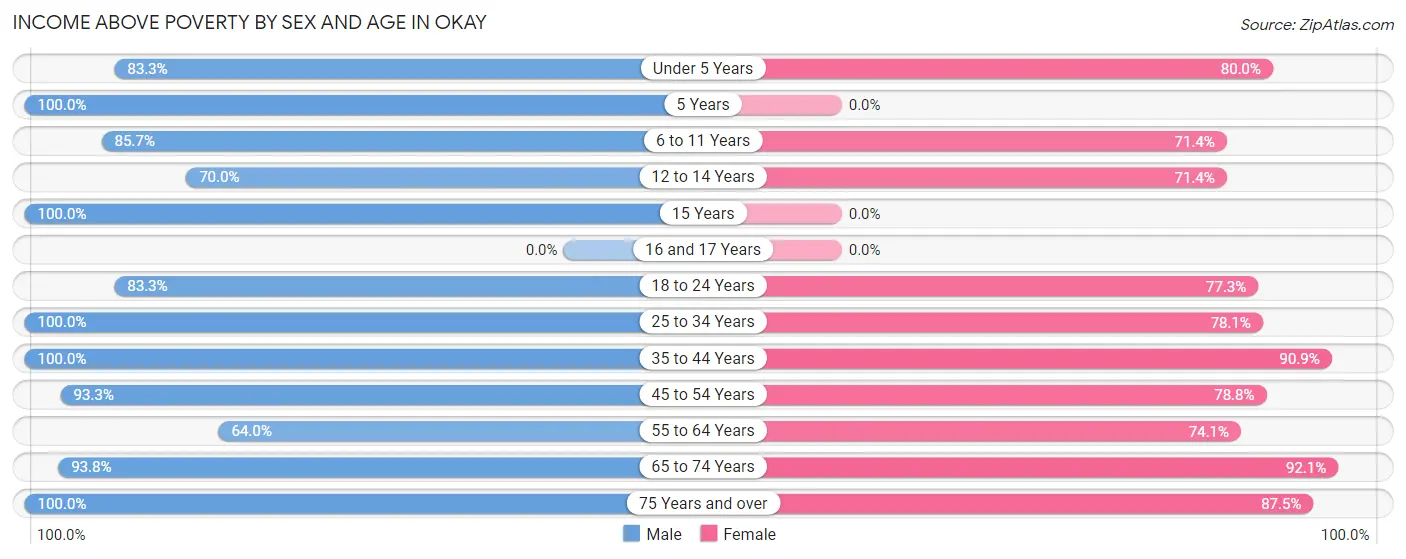
| Age Bracket | Male | Female |
| Under 5 Years | 10 (83.3%) | 8 (80.0%) |
| 5 Years | 2 (100.0%) | 0 (0.0%) |
| 6 to 11 Years | 12 (85.7%) | 10 (71.4%) |
| 12 to 14 Years | 7 (70.0%) | 5 (71.4%) |
| 15 Years | 2 (100.0%) | 0 (0.0%) |
| 16 and 17 Years | 0 (0.0%) | 0 (0.0%) |
| 18 to 24 Years | 20 (83.3%) | 17 (77.3%) |
| 25 to 34 Years | 20 (100.0%) | 25 (78.1%) |
| 35 to 44 Years | 28 (100.0%) | 20 (90.9%) |
| 45 to 54 Years | 28 (93.3%) | 26 (78.8%) |
| 55 to 64 Years | 16 (64.0%) | 20 (74.1%) |
| 65 to 74 Years | 30 (93.8%) | 35 (92.1%) |
| 75 Years and over | 10 (100.0%) | 7 (87.5%) |
| Total | 185 (88.5%) | 173 (79.0%) |
Income Below Poverty Among Married-Couple Families in Okay
The poverty statistics for married-couple families in Okay show that 6.5% or 4 of the total 62 families live below the poverty line. Families with 1 or 2 children have the highest poverty rate of 7.7%, comprising of 2 families. On the other hand, families with 5 or more children have the lowest poverty rate of 0.0%, which includes 0 families.
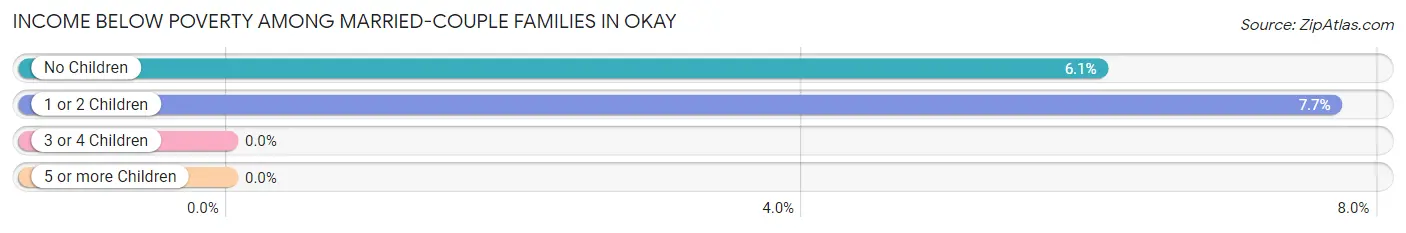
| Children | Above Poverty | Below Poverty |
| No Children | 31 (93.9%) | 2 (6.1%) |
| 1 or 2 Children | 24 (92.3%) | 2 (7.7%) |
| 3 or 4 Children | 0 (0.0%) | 0 (0.0%) |
| 5 or more Children | 3 (100.0%) | 0 (0.0%) |
| Total | 58 (93.5%) | 4 (6.5%) |
Income Below Poverty Among Single-Parent Households in Okay
According to the poverty data in Okay, 16.7% or 3 single-father households and 31.8% or 7 single-mother households are living below the poverty line. Among single-father households, those with 1 or 2 children have the highest poverty rate, with 3 households (30.0%) experiencing poverty. Likewise, among single-mother households, those with 3 or 4 children have the highest poverty rate, with 3 households (100.0%) falling below the poverty line.
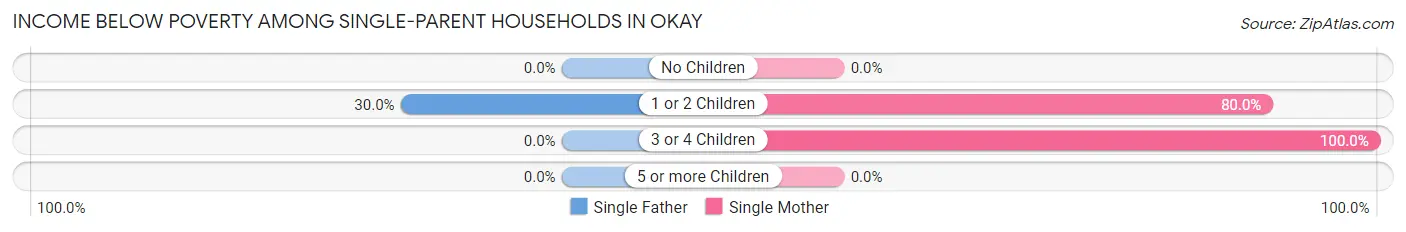
| Children | Single Father | Single Mother |
| No Children | 0 (0.0%) | 0 (0.0%) |
| 1 or 2 Children | 3 (30.0%) | 4 (80.0%) |
| 3 or 4 Children | 0 (0.0%) | 3 (100.0%) |
| 5 or more Children | 0 (0.0%) | 0 (0.0%) |
| Total | 3 (16.7%) | 7 (31.8%) |
Income Below Poverty Among Married-Couple vs Single-Parent Households in Okay
The poverty data for Okay shows that 4 of the married-couple family households (6.5%) and 10 of the single-parent households (25.0%) are living below the poverty level. Within the married-couple family households, those with 1 or 2 children have the highest poverty rate, with 2 households (7.7%) falling below the poverty line. Among the single-parent households, those with 3 or 4 children have the highest poverty rate, with 3 household (60.0%) living below poverty.
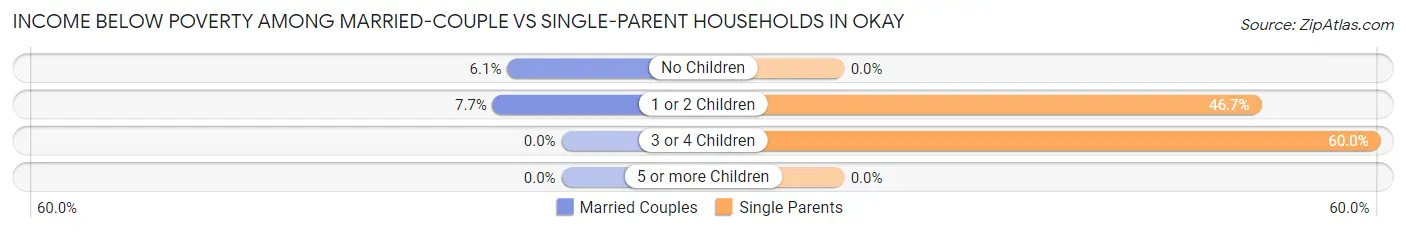
| Children | Married-Couple Families | Single-Parent Households |
| No Children | 2 (6.1%) | 0 (0.0%) |
| 1 or 2 Children | 2 (7.7%) | 7 (46.7%) |
| 3 or 4 Children | 0 (0.0%) | 3 (60.0%) |
| 5 or more Children | 0 (0.0%) | 0 (0.0%) |
| Total | 4 (6.5%) | 10 (25.0%) |
Race in Okay
The most populous races in Okay are White / Caucasian (217 | 50.2%), Native / Alaskan (107 | 24.8%), and Two or more Races (86 | 19.9%).
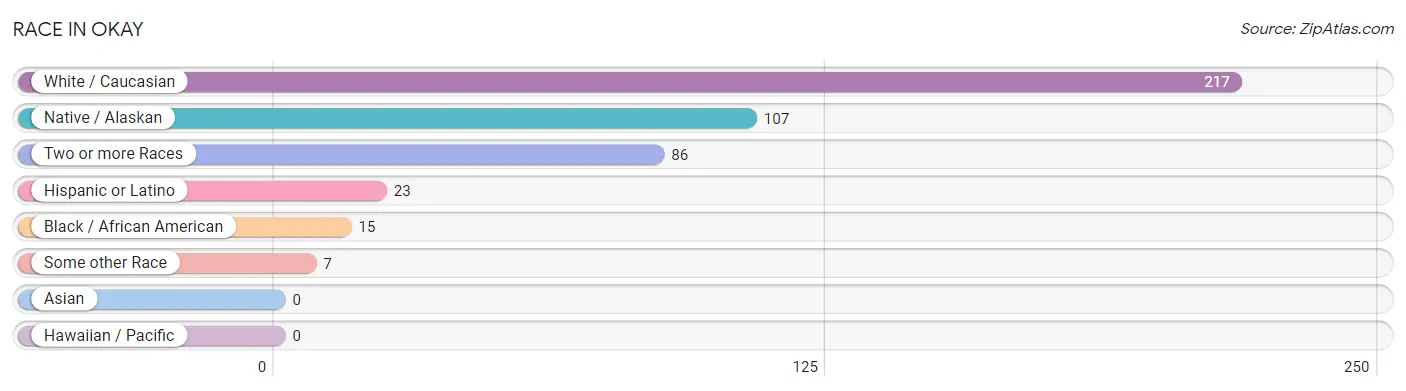
| Race | # Population | % Population |
| Asian | 0 | 0.0% |
| Black / African American | 15 | 3.5% |
| Hawaiian / Pacific | 0 | 0.0% |
| Hispanic or Latino | 23 | 5.3% |
| Native / Alaskan | 107 | 24.8% |
| White / Caucasian | 217 | 50.2% |
| Two or more Races | 86 | 19.9% |
| Some other Race | 7 | 1.6% |
| Total | 432 | 100.0% |
Ancestry in Okay
The most populous ancestries reported in Okay are Cherokee (96 | 22.2%), Irish (57 | 13.2%), Creek (30 | 6.9%), German (30 | 6.9%), and Choctaw (20 | 4.6%), together accounting for 53.9% of all Okay residents.
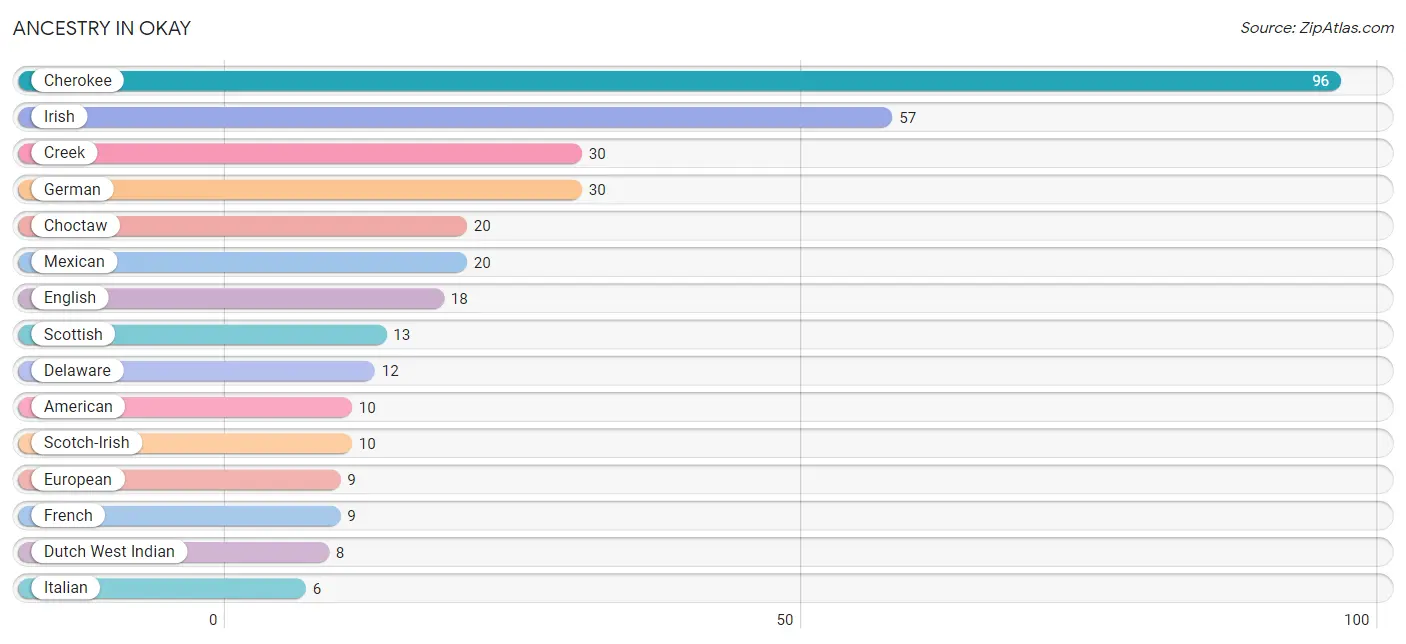
| Ancestry | # Population | % Population |
| American | 10 | 2.3% |
| Cherokee | 96 | 22.2% |
| Choctaw | 20 | 4.6% |
| Creek | 30 | 6.9% |
| Delaware | 12 | 2.8% |
| Dutch West Indian | 8 | 1.8% |
| English | 18 | 4.2% |
| European | 9 | 2.1% |
| French | 9 | 2.1% |
| German | 30 | 6.9% |
| Irish | 57 | 13.2% |
| Italian | 6 | 1.4% |
| Mexican | 20 | 4.6% |
| Northern European | 6 | 1.4% |
| Polish | 2 | 0.5% |
| Potawatomi | 4 | 0.9% |
| Scandinavian | 2 | 0.5% |
| Scotch-Irish | 10 | 2.3% |
| Scottish | 13 | 3.0% |
| Swedish | 2 | 0.5% | View All 20 Rows |
Immigrants in Okay
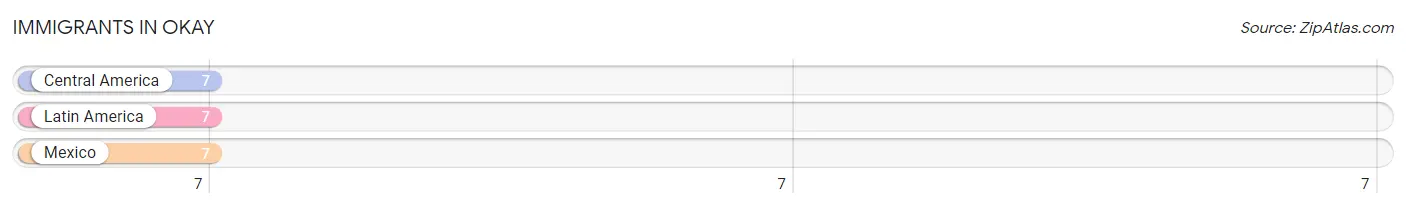
The most numerous immigrant groups reported in Okay came from Central America (7 | 1.6%), Latin America (7 | 1.6%), and Mexico (7 | 1.6%), together accounting for 4.9% of all Okay residents.
| Immigration Origin | # Population | % Population |
| Central America | 7 | 1.6% |
| Latin America | 7 | 1.6% |
| Mexico | 7 | 1.6% | View All 3 Rows |
Sex and Age in Okay
Sex and Age in Okay
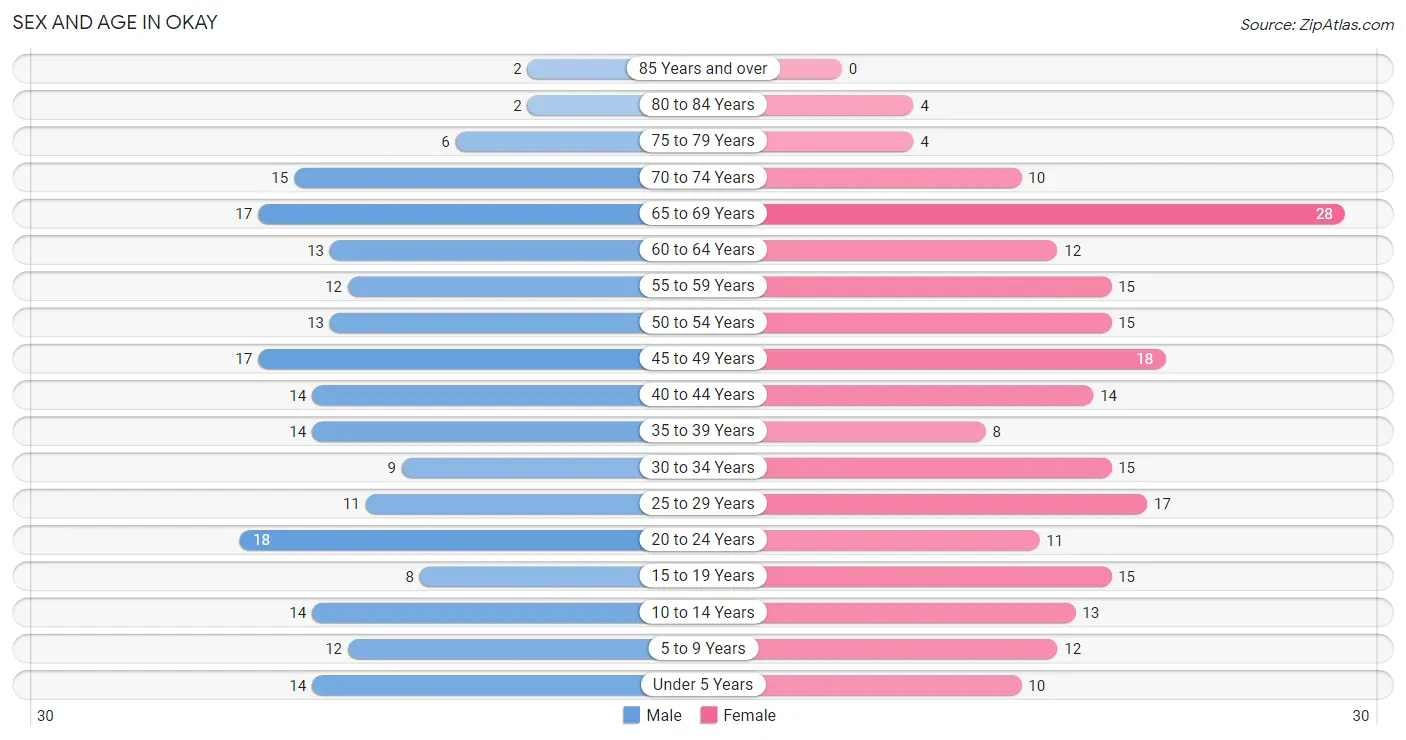
The most populous age groups in Okay are 20 to 24 Years (18 | 8.5%) for men and 65 to 69 Years (28 | 12.7%) for women.
| Age Bracket | Male | Female |
| Under 5 Years | 14 (6.6%) | 10 (4.5%) |
| 5 to 9 Years | 12 (5.7%) | 12 (5.4%) |
| 10 to 14 Years | 14 (6.6%) | 13 (5.9%) |
| 15 to 19 Years | 8 (3.8%) | 15 (6.8%) |
| 20 to 24 Years | 18 (8.5%) | 11 (5.0%) |
| 25 to 29 Years | 11 (5.2%) | 17 (7.7%) |
| 30 to 34 Years | 9 (4.3%) | 15 (6.8%) |
| 35 to 39 Years | 14 (6.6%) | 8 (3.6%) |
| 40 to 44 Years | 14 (6.6%) | 14 (6.3%) |
| 45 to 49 Years | 17 (8.1%) | 18 (8.1%) |
| 50 to 54 Years | 13 (6.2%) | 15 (6.8%) |
| 55 to 59 Years | 12 (5.7%) | 15 (6.8%) |
| 60 to 64 Years | 13 (6.2%) | 12 (5.4%) |
| 65 to 69 Years | 17 (8.1%) | 28 (12.7%) |
| 70 to 74 Years | 15 (7.1%) | 10 (4.5%) |
| 75 to 79 Years | 6 (2.8%) | 4 (1.8%) |
| 80 to 84 Years | 2 (0.9%) | 4 (1.8%) |
| 85 Years and over | 2 (0.9%) | 0 (0.0%) |
| Total | 211 (100.0%) | 221 (100.0%) |
Families and Households in Okay
Median Family Size in Okay
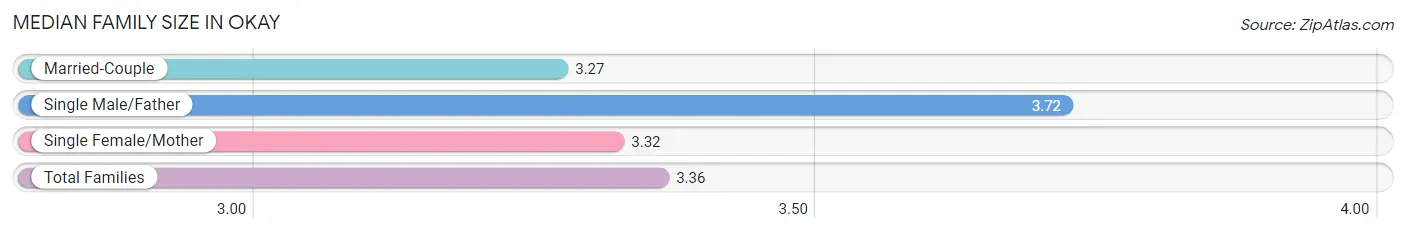
The median family size in Okay is 3.36 persons per family, with single male/father families (18 | 17.6%) accounting for the largest median family size of 3.72 persons per family. On the other hand, married-couple families (62 | 60.8%) represent the smallest median family size with 3.27 persons per family.
| Family Type | # Families | Family Size |
| Married-Couple | 62 (60.8%) | 3.27 |
| Single Male/Father | 18 (17.6%) | 3.72 |
| Single Female/Mother | 22 (21.6%) | 3.32 |
| Total Families | 102 (100.0%) | 3.36 |
Median Household Size in Okay
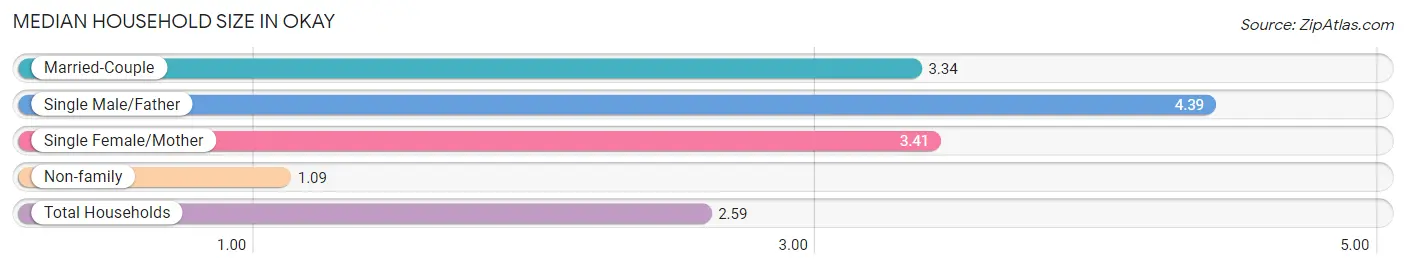
The median household size in Okay is 2.59 persons per household, with single male/father households (18 | 10.8%) accounting for the largest median household size of 4.39 persons per household. non-family households (65 | 38.9%) represent the smallest median household size with 1.09 persons per household.
| Household Type | # Households | Household Size |
| Married-Couple | 62 (37.1%) | 3.34 |
| Single Male/Father | 18 (10.8%) | 4.39 |
| Single Female/Mother | 22 (13.2%) | 3.41 |
| Non-family | 65 (38.9%) | 1.09 |
| Total Households | 167 (100.0%) | 2.59 |
Household Size by Marriage Status in Okay
Out of a total of 167 households in Okay, 102 (61.1%) are family households, while 65 (38.9%) are nonfamily households. The most numerous type of family households are 2-person households, comprising 40, and the most common type of nonfamily households are 1-person households, comprising 58.
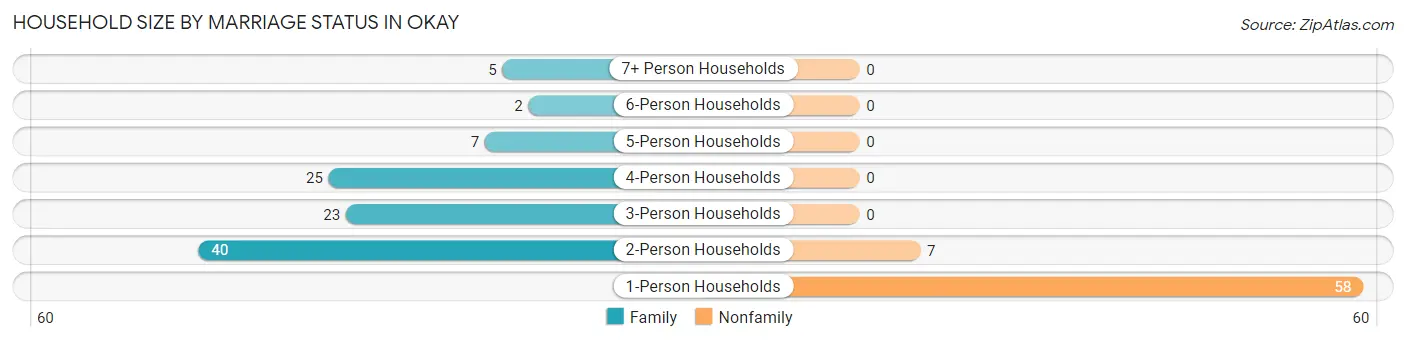
| Household Size | Family Households | Nonfamily Households |
| 1-Person Households | - | 58 (34.7%) |
| 2-Person Households | 40 (23.9%) | 7 (4.2%) |
| 3-Person Households | 23 (13.8%) | 0 (0.0%) |
| 4-Person Households | 25 (15.0%) | 0 (0.0%) |
| 5-Person Households | 7 (4.2%) | 0 (0.0%) |
| 6-Person Households | 2 (1.2%) | 0 (0.0%) |
| 7+ Person Households | 5 (3.0%) | 0 (0.0%) |
| Total | 102 (61.1%) | 65 (38.9%) |
Female Fertility in Okay
Fertility by Age in Okay
Average fertility rate in Okay is 61.0 births per 1,000 women. Women in the age bracket of 20 to 34 years have the highest fertility rate with 140.0 births per 1,000 women. Women in the age bracket of 20 to 34 years acount for 100.0% of all women with births.
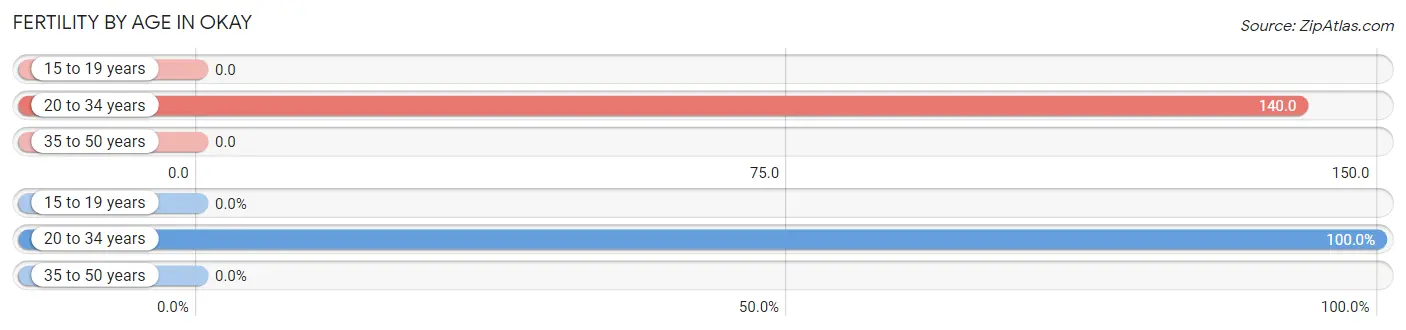
| Age Bracket | Women with Births | Births / 1,000 Women |
| 15 to 19 years | 0 (0.0%) | 0.0 |
| 20 to 34 years | 6 (100.0%) | 140.0 |
| 35 to 50 years | 0 (0.0%) | 0.0 |
| Total | 6 (100.0%) | 61.0 |
Fertility by Age by Marriage Status in Okay
83.3% of women with births (6) in Okay are married. The highest percentage of unmarried women with births falls into 20 to 34 years age bracket with 16.7% of them unmarried at the time of birth, while the lowest percentage of unmarried women with births belong to 20 to 34 years age bracket with 16.7% of them unmarried.
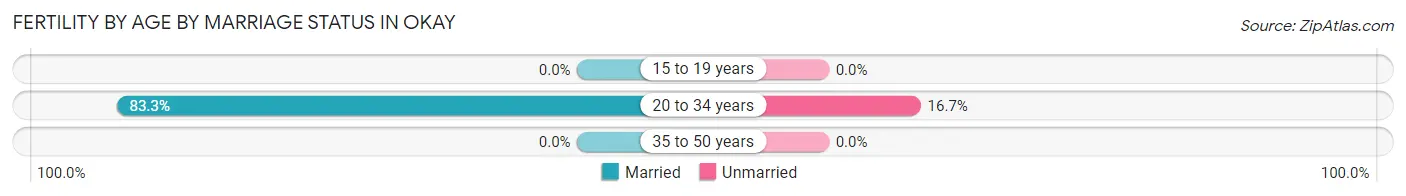
| Age Bracket | Married | Unmarried |
| 15 to 19 years | 0 (0.0%) | 0 (0.0%) |
| 20 to 34 years | 5 (83.3%) | 1 (16.7%) |
| 35 to 50 years | 0 (0.0%) | 0 (0.0%) |
| Total | 5 (83.3%) | 1 (16.7%) |
Fertility by Education in Okay
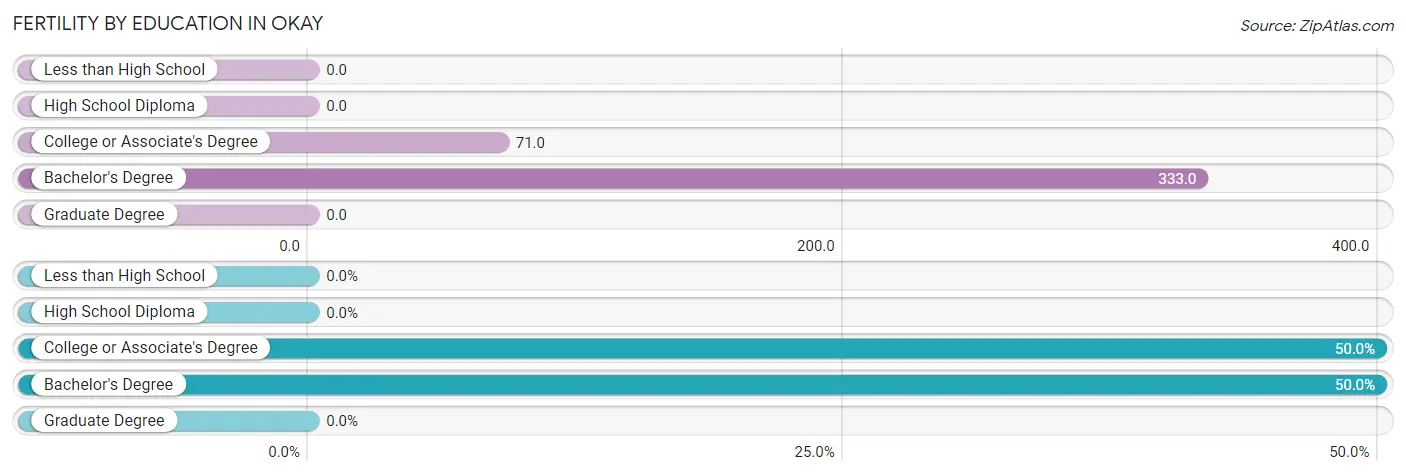
| Educational Attainment | Women with Births | Births / 1,000 Women |
| Less than High School | 0 (0.0%) | 0.0 |
| High School Diploma | 0 (0.0%) | 0.0 |
| College or Associate's Degree | 3 (50.0%) | 71.0 |
| Bachelor's Degree | 3 (50.0%) | 333.0 |
| Graduate Degree | 0 (0.0%) | 0.0 |
| Total | 6 (100.0%) | 61.0 |
Fertility by Education by Marriage Status in Okay
16.7% of women with births in Okay are unmarried. Women with the educational attainment of bachelor's degree are most likely to be married with 100.0% of them married at childbirth, while women with the educational attainment of college or associate's degree are least likely to be married with 33.3% of them unmarried at childbirth.
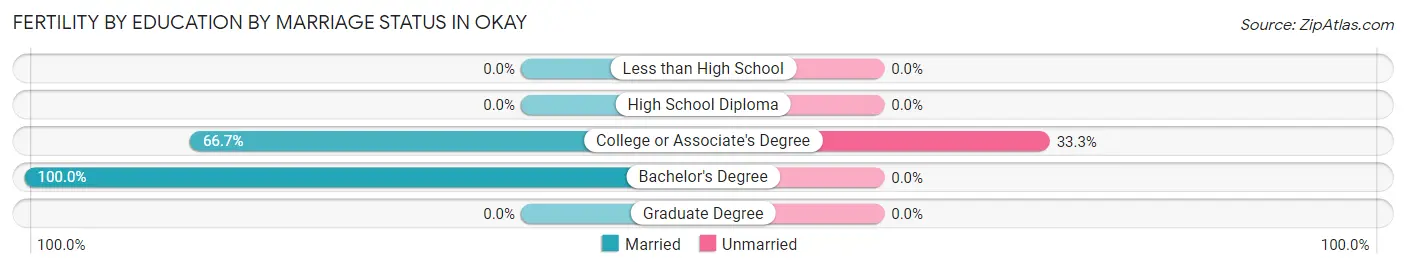
| Educational Attainment | Married | Unmarried |
| Less than High School | 0 (0.0%) | 0 (0.0%) |
| High School Diploma | 0 (0.0%) | 0 (0.0%) |
| College or Associate's Degree | 2 (66.7%) | 1 (33.3%) |
| Bachelor's Degree | 3 (100.0%) | 0 (0.0%) |
| Graduate Degree | 0 (0.0%) | 0 (0.0%) |
| Total | 5 (83.3%) | 1 (16.7%) |
Employment Characteristics in Okay
Employment by Class of Employer in Okay
Among the 166 employed individuals in Okay, private company employees (113 | 68.1%), not-for-profit organizations (14 | 8.4%), and federal government employees (14 | 8.4%) make up the most common classes of employment.
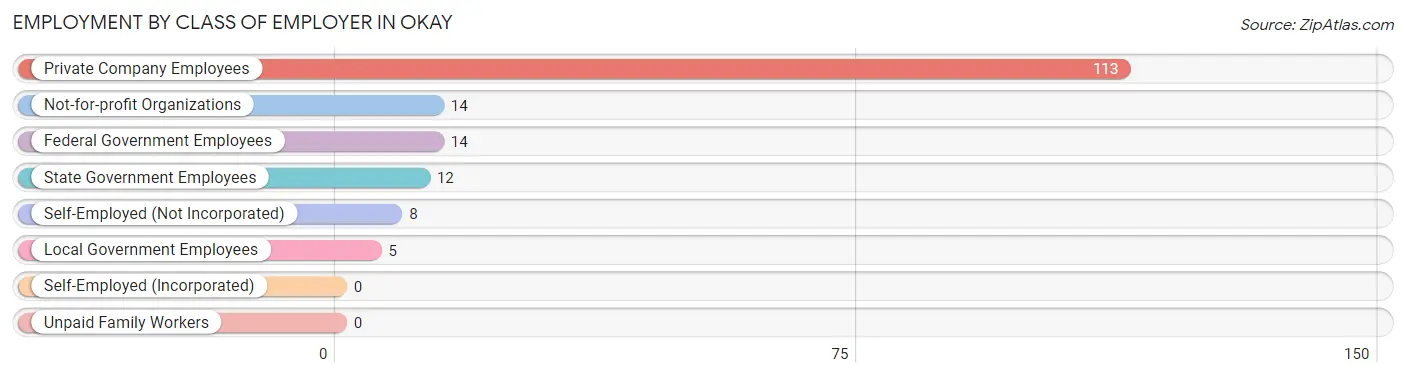
| Employer Class | # Employees | % Employees |
| Private Company Employees | 113 | 68.1% |
| Self-Employed (Incorporated) | 0 | 0.0% |
| Self-Employed (Not Incorporated) | 8 | 4.8% |
| Not-for-profit Organizations | 14 | 8.4% |
| Local Government Employees | 5 | 3.0% |
| State Government Employees | 12 | 7.2% |
| Federal Government Employees | 14 | 8.4% |
| Unpaid Family Workers | 0 | 0.0% |
| Total | 166 | 100.0% |
Employment Status by Age in Okay
According to the labor force statistics for Okay, out of the total population over 16 years of age (353), 56.4% or 199 individuals are in the labor force, with 8.5% or 17 of them unemployed. The age group with the highest labor force participation rate is 20 to 24 years, with 86.2% or 25 individuals in the labor force. Within the labor force, the 16 to 19 years age range has the highest percentage of unemployed individuals, with 27.3% or 3 of them being unemployed.
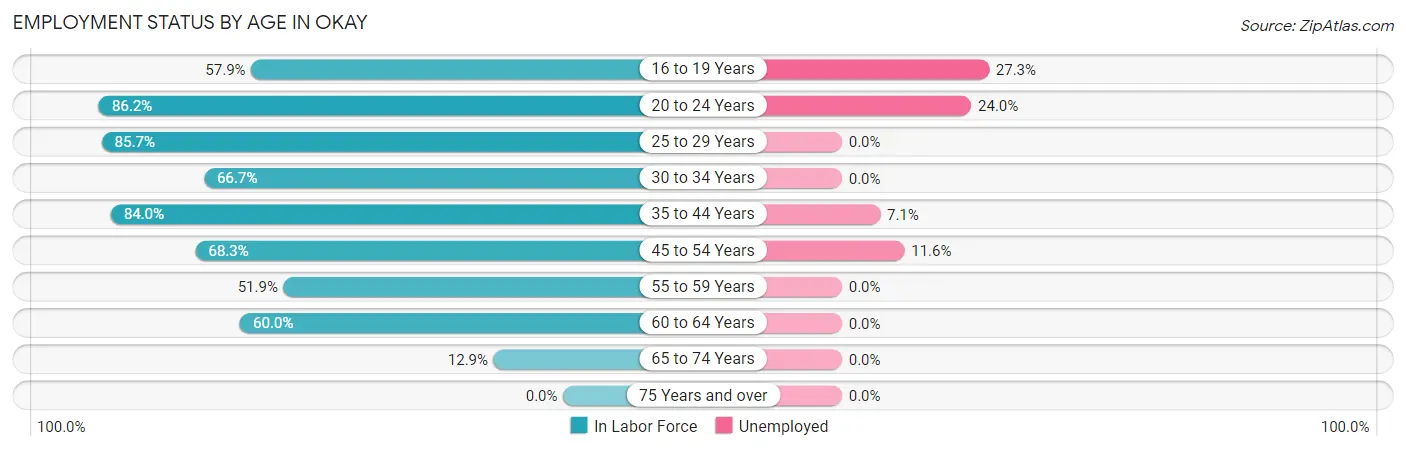
| Age Bracket | In Labor Force | Unemployed |
| 16 to 19 Years | 11 (57.9%) | 3 (27.3%) |
| 20 to 24 Years | 25 (86.2%) | 6 (24.0%) |
| 25 to 29 Years | 24 (85.7%) | 0 (0.0%) |
| 30 to 34 Years | 16 (66.7%) | 0 (0.0%) |
| 35 to 44 Years | 42 (84.0%) | 3 (7.1%) |
| 45 to 54 Years | 43 (68.3%) | 5 (11.6%) |
| 55 to 59 Years | 14 (51.9%) | 0 (0.0%) |
| 60 to 64 Years | 15 (60.0%) | 0 (0.0%) |
| 65 to 74 Years | 9 (12.9%) | 0 (0.0%) |
| 75 Years and over | 0 (0.0%) | 0 (0.0%) |
| Total | 199 (56.4%) | 17 (8.5%) |
Employment Status by Educational Attainment in Okay
According to labor force statistics for Okay, 71.0% of individuals (154) out of the total population between 25 and 64 years of age (217) are in the labor force, with 5.2% or 8 of them being unemployed. The group with the highest labor force participation rate are those with the educational attainment of bachelor's degree or higher, with 85.7% or 18 individuals in the labor force. Within the labor force, individuals with less than high school education have the highest percentage of unemployment, with 14.3% or 3 of them being unemployed.
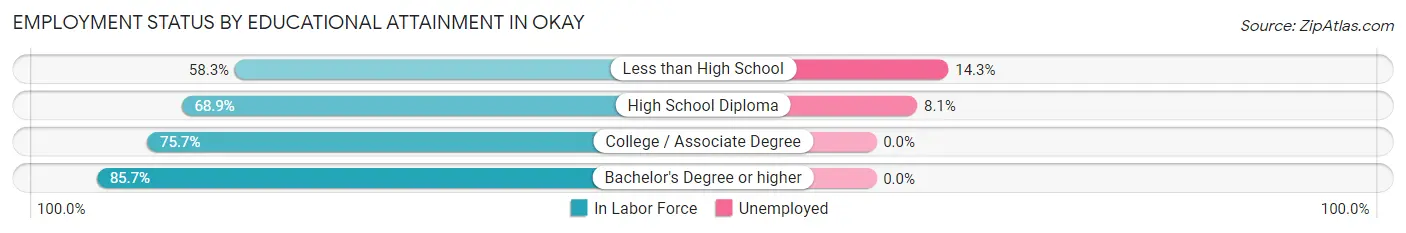
| Educational Attainment | In Labor Force | Unemployed |
| Less than High School | 21 (58.3%) | 5 (14.3%) |
| High School Diploma | 62 (68.9%) | 7 (8.1%) |
| College / Associate Degree | 53 (75.7%) | 0 (0.0%) |
| Bachelor's Degree or higher | 18 (85.7%) | 0 (0.0%) |
| Total | 154 (71.0%) | 11 (5.2%) |
Employment Occupations by Sex in Okay
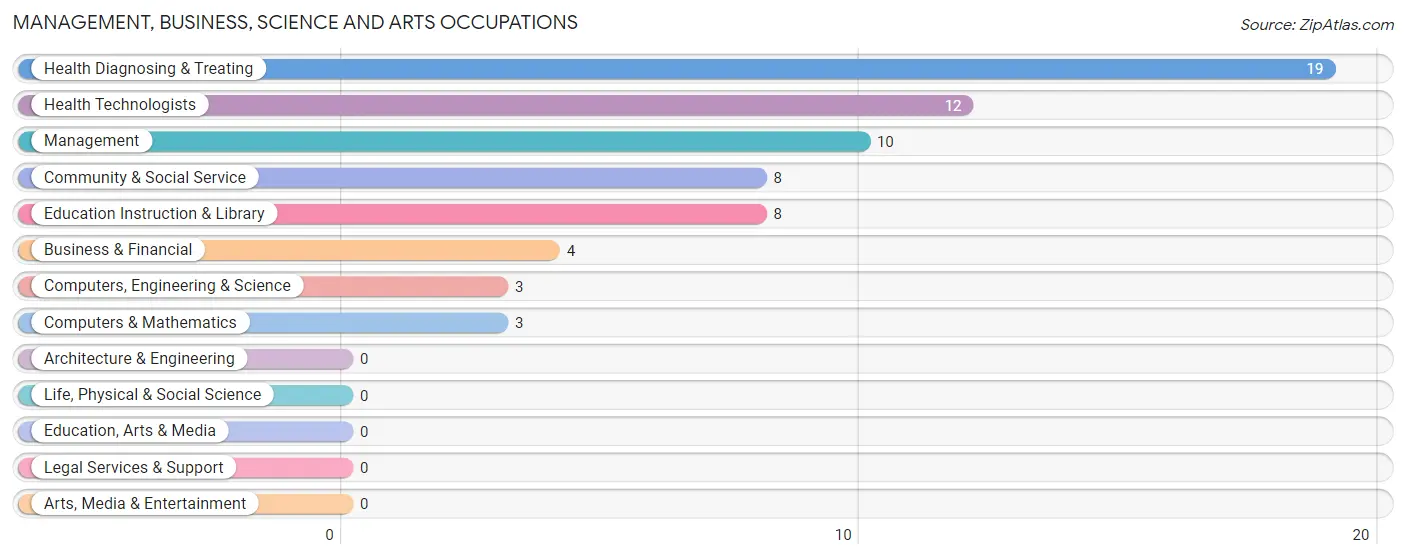
Management, Business, Science and Arts Occupations
The most common Management, Business, Science and Arts occupations in Okay are Health Diagnosing & Treating (19 | 10.4%), Health Technologists (12 | 6.6%), Management (10 | 5.5%), Community & Social Service (8 | 4.4%), and Education Instruction & Library (8 | 4.4%).
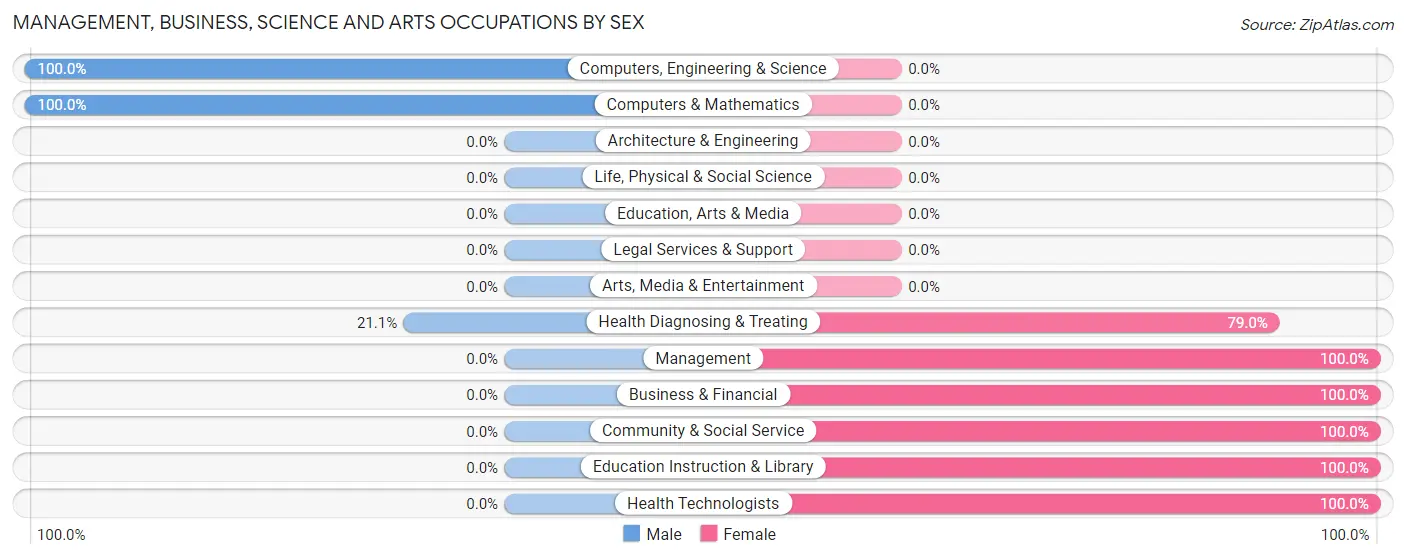
Management, Business, Science and Arts Occupations by Sex
Within the Management, Business, Science and Arts occupations in Okay, the most male-oriented occupations are Computers, Engineering & Science (100.0%), Computers & Mathematics (100.0%), and Health Diagnosing & Treating (21.0%), while the most female-oriented occupations are Management (100.0%), Business & Financial (100.0%), and Community & Social Service (100.0%).
| Occupation | Male | Female |
| Management | 0 (0.0%) | 10 (100.0%) |
| Business & Financial | 0 (0.0%) | 4 (100.0%) |
| Computers, Engineering & Science | 3 (100.0%) | 0 (0.0%) |
| Computers & Mathematics | 3 (100.0%) | 0 (0.0%) |
| Architecture & Engineering | 0 (0.0%) | 0 (0.0%) |
| Life, Physical & Social Science | 0 (0.0%) | 0 (0.0%) |
| Community & Social Service | 0 (0.0%) | 8 (100.0%) |
| Education, Arts & Media | 0 (0.0%) | 0 (0.0%) |
| Legal Services & Support | 0 (0.0%) | 0 (0.0%) |
| Education Instruction & Library | 0 (0.0%) | 8 (100.0%) |
| Arts, Media & Entertainment | 0 (0.0%) | 0 (0.0%) |
| Health Diagnosing & Treating | 4 (21.0%) | 15 (78.9%) |
| Health Technologists | 0 (0.0%) | 12 (100.0%) |
| Total (Category) | 7 (15.9%) | 37 (84.1%) |
| Total (Overall) | 79 (43.4%) | 103 (56.6%) |
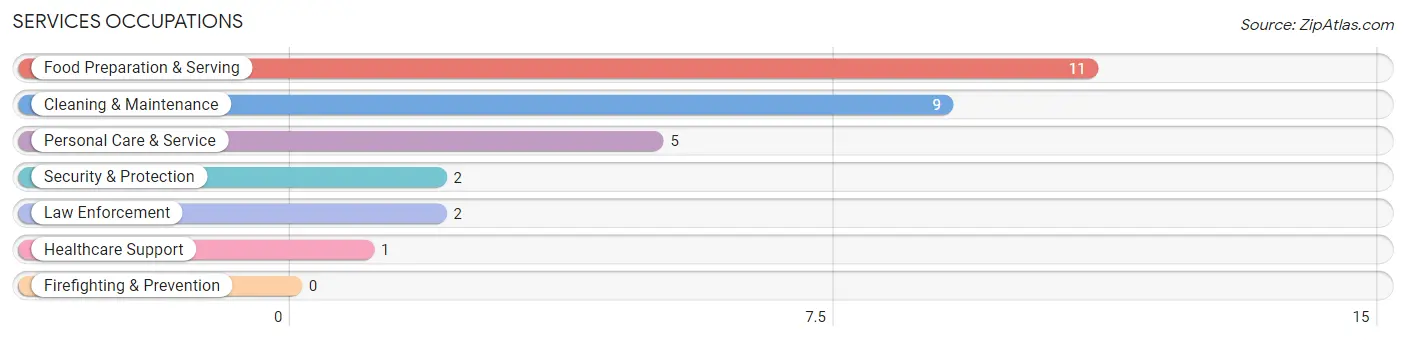
Services Occupations
The most common Services occupations in Okay are Food Preparation & Serving (11 | 6.0%), Cleaning & Maintenance (9 | 5.0%), Personal Care & Service (5 | 2.8%), Security & Protection (2 | 1.1%), and Law Enforcement (2 | 1.1%).
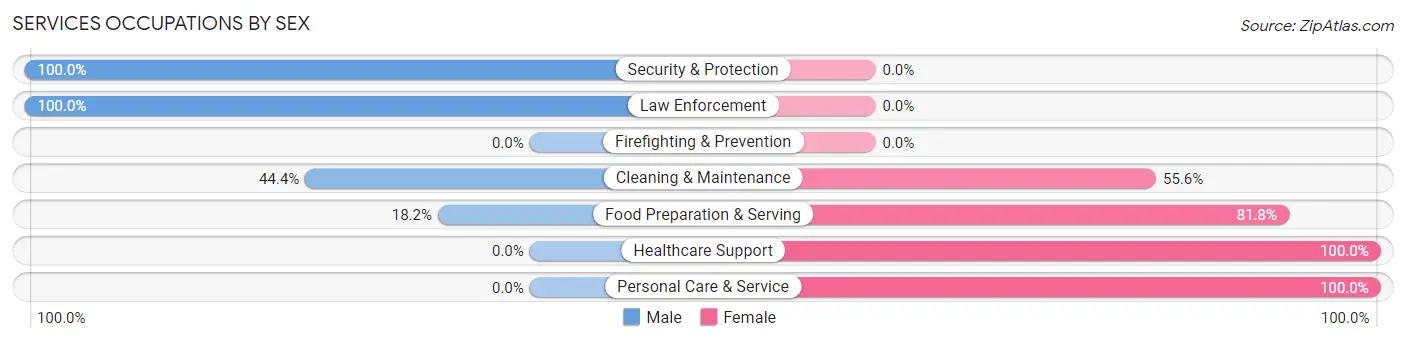
Services Occupations by Sex
Within the Services occupations in Okay, the most male-oriented occupations are Security & Protection (100.0%), Law Enforcement (100.0%), and Cleaning & Maintenance (44.4%), while the most female-oriented occupations are Healthcare Support (100.0%), Personal Care & Service (100.0%), and Food Preparation & Serving (81.8%).
| Occupation | Male | Female |
| Healthcare Support | 0 (0.0%) | 1 (100.0%) |
| Security & Protection | 2 (100.0%) | 0 (0.0%) |
| Firefighting & Prevention | 0 (0.0%) | 0 (0.0%) |
| Law Enforcement | 2 (100.0%) | 0 (0.0%) |
| Food Preparation & Serving | 2 (18.2%) | 9 (81.8%) |
| Cleaning & Maintenance | 4 (44.4%) | 5 (55.6%) |
| Personal Care & Service | 0 (0.0%) | 5 (100.0%) |
| Total (Category) | 8 (28.6%) | 20 (71.4%) |
| Total (Overall) | 79 (43.4%) | 103 (56.6%) |
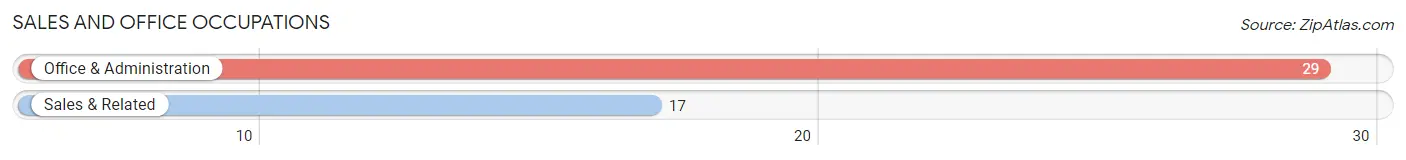
Sales and Office Occupations
The most common Sales and Office occupations in Okay are Office & Administration (29 | 15.9%), and Sales & Related (17 | 9.3%).
Sales and Office Occupations by Sex
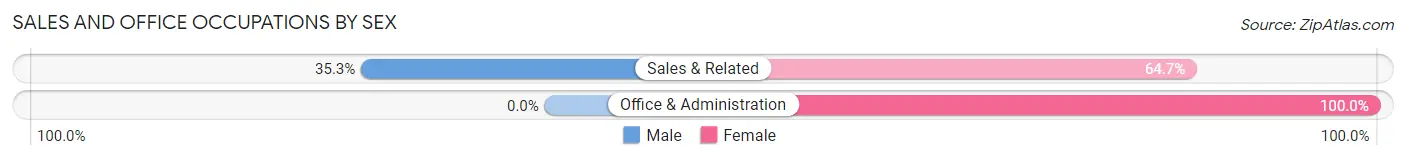
| Occupation | Male | Female |
| Sales & Related | 6 (35.3%) | 11 (64.7%) |
| Office & Administration | 0 (0.0%) | 29 (100.0%) |
| Total (Category) | 6 (13.0%) | 40 (87.0%) |
| Total (Overall) | 79 (43.4%) | 103 (56.6%) |
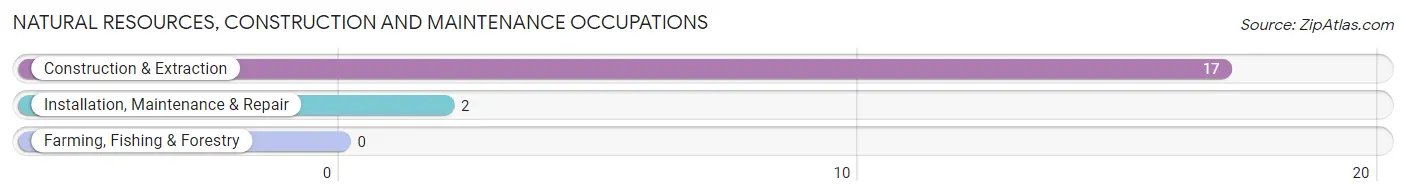
Natural Resources, Construction and Maintenance Occupations
The most common Natural Resources, Construction and Maintenance occupations in Okay are Construction & Extraction (17 | 9.3%), and Installation, Maintenance & Repair (2 | 1.1%).
Natural Resources, Construction and Maintenance Occupations by Sex
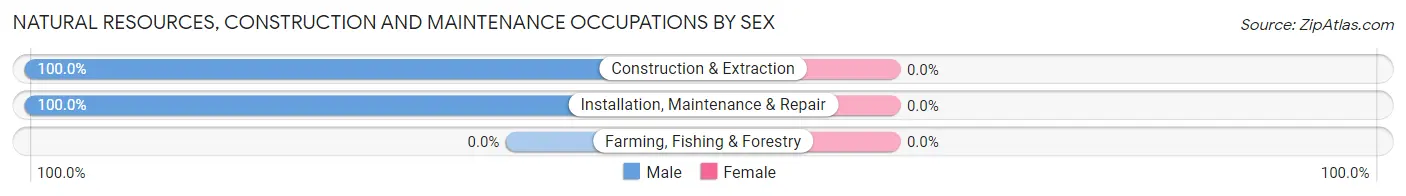
| Occupation | Male | Female |
| Farming, Fishing & Forestry | 0 (0.0%) | 0 (0.0%) |
| Construction & Extraction | 17 (100.0%) | 0 (0.0%) |
| Installation, Maintenance & Repair | 2 (100.0%) | 0 (0.0%) |
| Total (Category) | 19 (100.0%) | 0 (0.0%) |
| Total (Overall) | 79 (43.4%) | 103 (56.6%) |
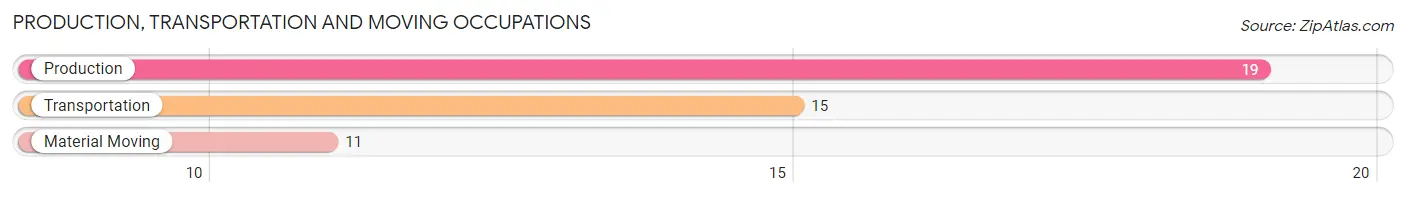
Production, Transportation and Moving Occupations
The most common Production, Transportation and Moving occupations in Okay are Production (19 | 10.4%), Transportation (15 | 8.2%), and Material Moving (11 | 6.0%).
Production, Transportation and Moving Occupations by Sex
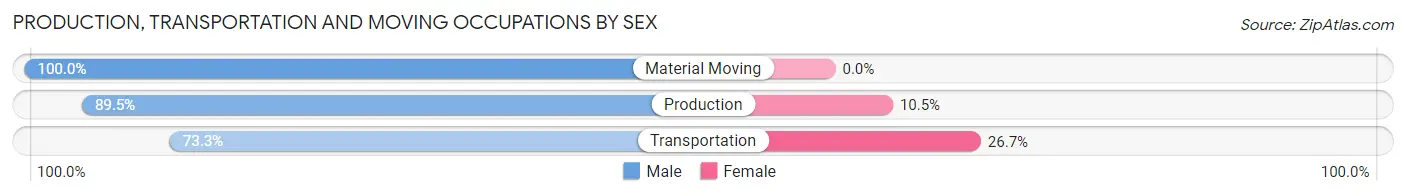
| Occupation | Male | Female |
| Production | 17 (89.5%) | 2 (10.5%) |
| Transportation | 11 (73.3%) | 4 (26.7%) |
| Material Moving | 11 (100.0%) | 0 (0.0%) |
| Total (Category) | 39 (86.7%) | 6 (13.3%) |
| Total (Overall) | 79 (43.4%) | 103 (56.6%) |
Employment Industries by Sex in Okay
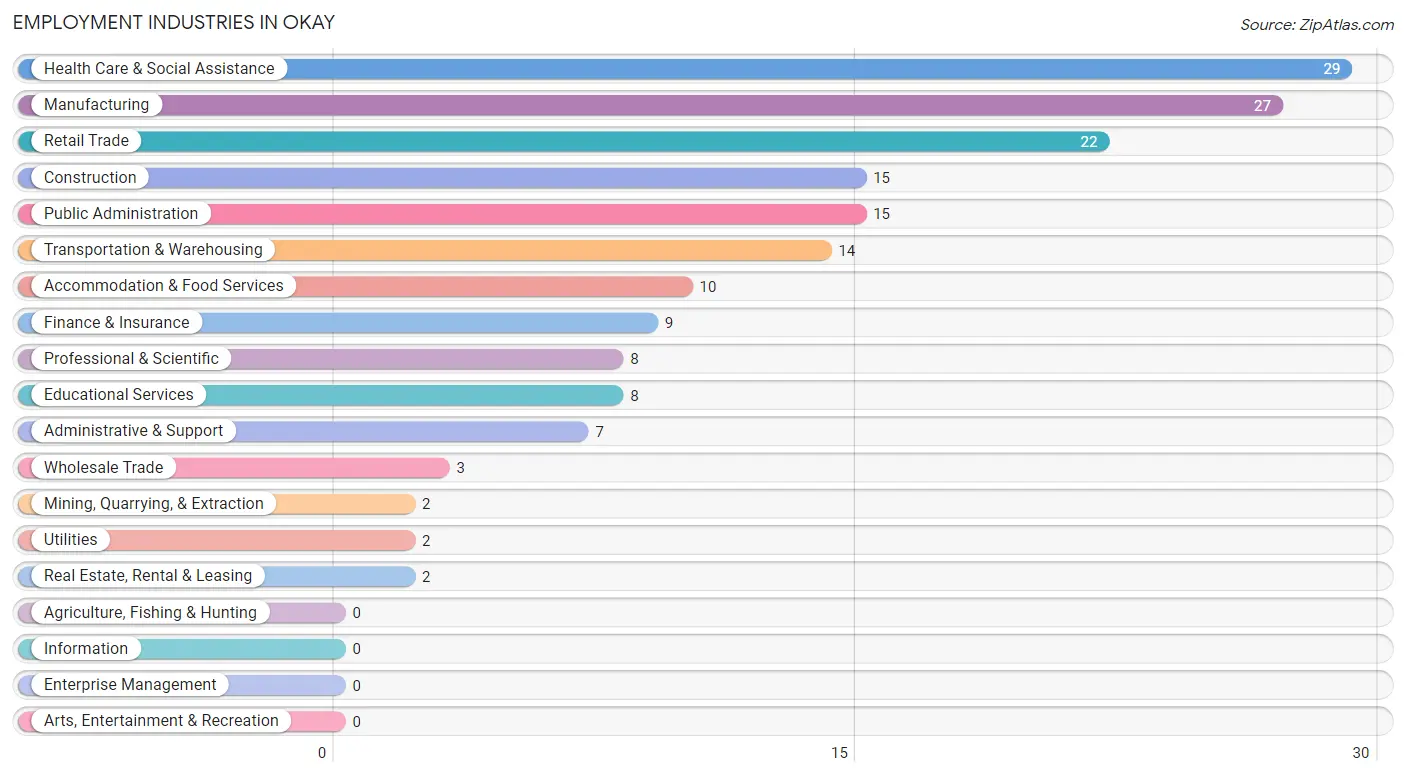
Employment Industries in Okay
The major employment industries in Okay include Health Care & Social Assistance (29 | 15.9%), Manufacturing (27 | 14.8%), Retail Trade (22 | 12.1%), Construction (15 | 8.2%), and Public Administration (15 | 8.2%).
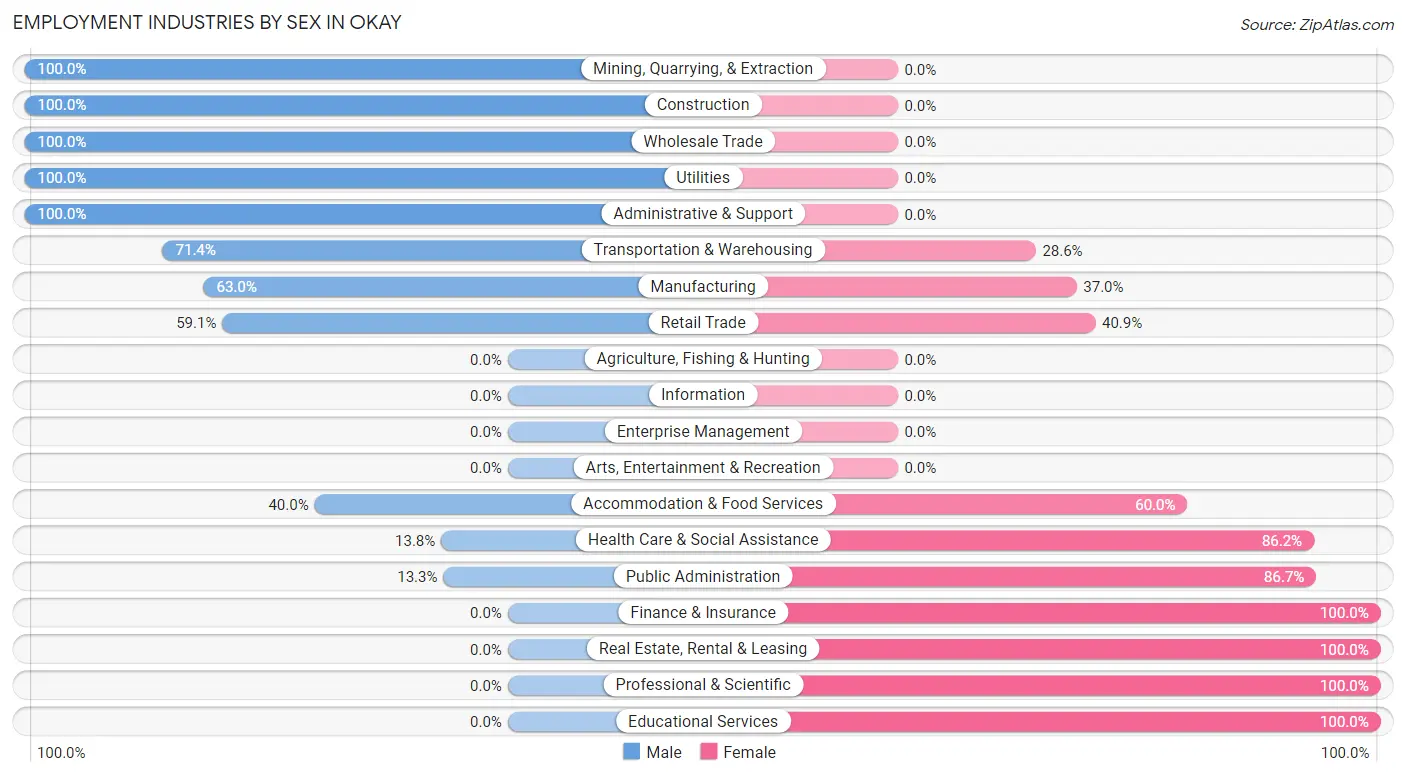
Employment Industries by Sex in Okay
The Okay industries that see more men than women are Mining, Quarrying, & Extraction (100.0%), Construction (100.0%), and Wholesale Trade (100.0%), whereas the industries that tend to have a higher number of women are Finance & Insurance (100.0%), Real Estate, Rental & Leasing (100.0%), and Professional & Scientific (100.0%).
| Industry | Male | Female |
| Agriculture, Fishing & Hunting | 0 (0.0%) | 0 (0.0%) |
| Mining, Quarrying, & Extraction | 2 (100.0%) | 0 (0.0%) |
| Construction | 15 (100.0%) | 0 (0.0%) |
| Manufacturing | 17 (63.0%) | 10 (37.0%) |
| Wholesale Trade | 3 (100.0%) | 0 (0.0%) |
| Retail Trade | 13 (59.1%) | 9 (40.9%) |
| Transportation & Warehousing | 10 (71.4%) | 4 (28.6%) |
| Utilities | 2 (100.0%) | 0 (0.0%) |
| Information | 0 (0.0%) | 0 (0.0%) |
| Finance & Insurance | 0 (0.0%) | 9 (100.0%) |
| Real Estate, Rental & Leasing | 0 (0.0%) | 2 (100.0%) |
| Professional & Scientific | 0 (0.0%) | 8 (100.0%) |
| Enterprise Management | 0 (0.0%) | 0 (0.0%) |
| Administrative & Support | 7 (100.0%) | 0 (0.0%) |
| Educational Services | 0 (0.0%) | 8 (100.0%) |
| Health Care & Social Assistance | 4 (13.8%) | 25 (86.2%) |
| Arts, Entertainment & Recreation | 0 (0.0%) | 0 (0.0%) |
| Accommodation & Food Services | 4 (40.0%) | 6 (60.0%) |
| Public Administration | 2 (13.3%) | 13 (86.7%) |
| Total | 79 (43.4%) | 103 (56.6%) |
Education in Okay
School Enrollment in Okay
The most common levels of schooling among the 81 students in Okay are middle school (22 | 27.2%), high school (21 | 25.9%), and elementary school (20 | 24.7%).
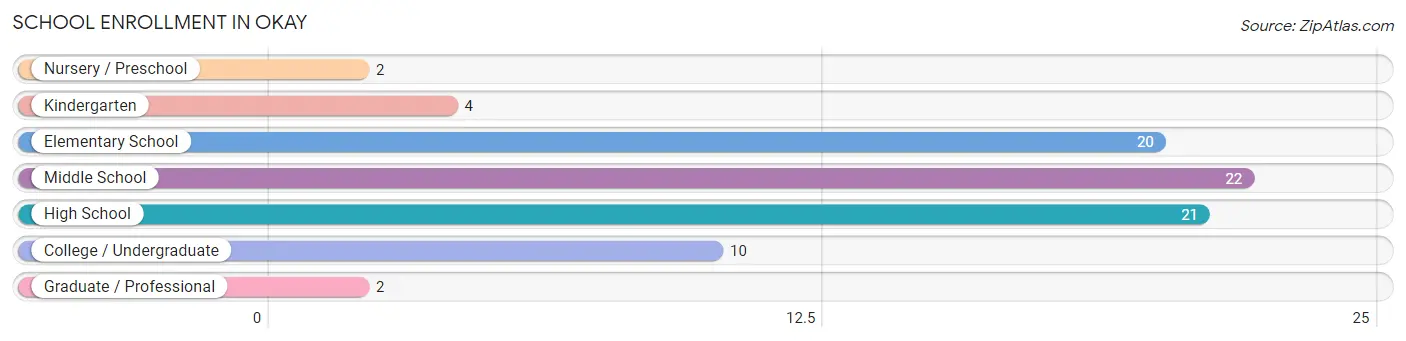
| School Level | # Students | % Students |
| Nursery / Preschool | 2 | 2.5% |
| Kindergarten | 4 | 4.9% |
| Elementary School | 20 | 24.7% |
| Middle School | 22 | 27.2% |
| High School | 21 | 25.9% |
| College / Undergraduate | 10 | 12.3% |
| Graduate / Professional | 2 | 2.5% |
| Total | 81 | 100.0% |
School Enrollment by Age by Funding Source in Okay
Out of a total of 81 students who are enrolled in schools in Okay, 8 (9.9%) attend a private institution, while the remaining 73 (90.1%) are enrolled in public schools. The age group of 20 to 24 year olds has the highest likelihood of being enrolled in private schools, with 2 (100.0% in the age bracket) enrolled. Conversely, the age group of 5 to 9 year old has the lowest likelihood of being enrolled in a private school, with 24 (100.0% in the age bracket) attending a public institution.
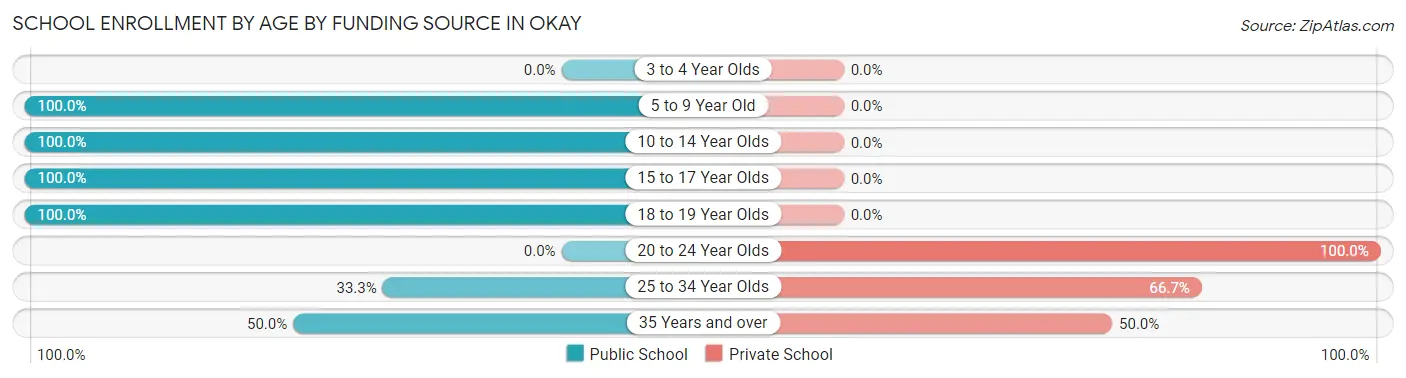
| Age Bracket | Public School | Private School |
| 3 to 4 Year Olds | 0 (0.0%) | 0 (0.0%) |
| 5 to 9 Year Old | 24 (100.0%) | 0 (0.0%) |
| 10 to 14 Year Olds | 27 (100.0%) | 0 (0.0%) |
| 15 to 17 Year Olds | 6 (100.0%) | 0 (0.0%) |
| 18 to 19 Year Olds | 12 (100.0%) | 0 (0.0%) |
| 20 to 24 Year Olds | 0 (0.0%) | 2 (100.0%) |
| 25 to 34 Year Olds | 2 (33.3%) | 4 (66.7%) |
| 35 Years and over | 2 (50.0%) | 2 (50.0%) |
| Total | 73 (90.1%) | 8 (9.9%) |
Educational Attainment by Field of Study in Okay
Social sciences (7 | 26.9%), computers & mathematics (6 | 23.1%), arts & humanities (5 | 19.2%), science & technology (4 | 15.4%), and business (2 | 7.7%) are the most common fields of study among 26 individuals in Okay who have obtained a bachelor's degree or higher.
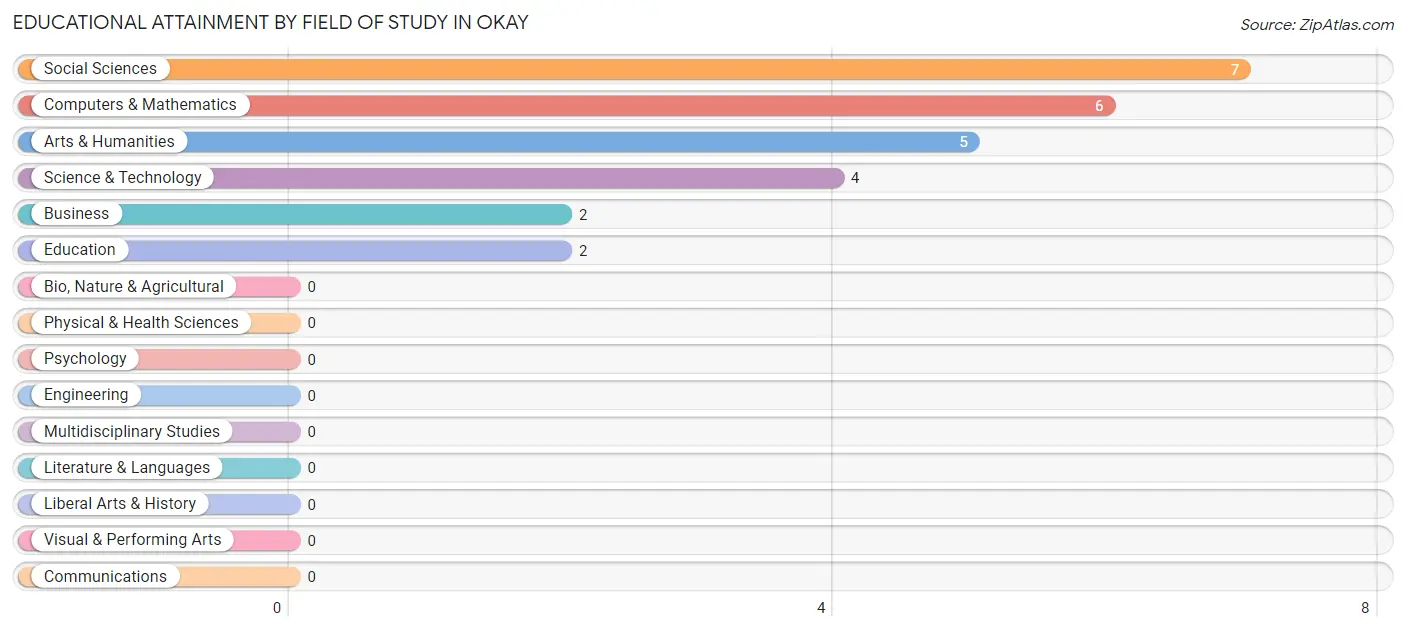
| Field of Study | # Graduates | % Graduates |
| Computers & Mathematics | 6 | 23.1% |
| Bio, Nature & Agricultural | 0 | 0.0% |
| Physical & Health Sciences | 0 | 0.0% |
| Psychology | 0 | 0.0% |
| Social Sciences | 7 | 26.9% |
| Engineering | 0 | 0.0% |
| Multidisciplinary Studies | 0 | 0.0% |
| Science & Technology | 4 | 15.4% |
| Business | 2 | 7.7% |
| Education | 2 | 7.7% |
| Literature & Languages | 0 | 0.0% |
| Liberal Arts & History | 0 | 0.0% |
| Visual & Performing Arts | 0 | 0.0% |
| Communications | 0 | 0.0% |
| Arts & Humanities | 5 | 19.2% |
| Total | 26 | 100.0% |
Transportation & Commute in Okay
Vehicle Availability by Sex in Okay
The most prevalent vehicle ownership categories in Okay are males with 2 vehicles (26, accounting for 37.7%) and females with 2 vehicles (45, making up 26.8%).
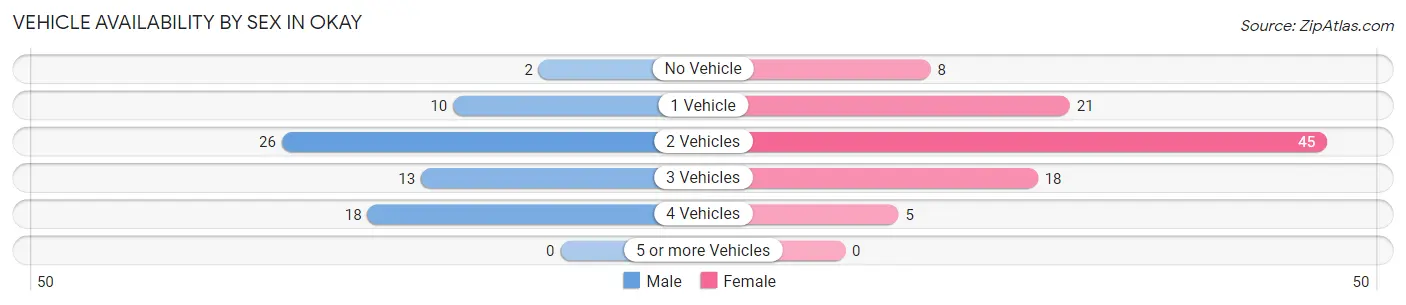
| Vehicles Available | Male | Female |
| No Vehicle | 2 (2.9%) | 8 (8.3%) |
| 1 Vehicle | 10 (14.5%) | 21 (21.6%) |
| 2 Vehicles | 26 (37.7%) | 45 (46.4%) |
| 3 Vehicles | 13 (18.8%) | 18 (18.6%) |
| 4 Vehicles | 18 (26.1%) | 5 (5.1%) |
| 5 or more Vehicles | 0 (0.0%) | 0 (0.0%) |
| Total | 69 (100.0%) | 97 (100.0%) |
Commute Time in Okay
The most frequently occuring commute durations in Okay are 15 to 19 minutes (56 commuters, 33.7%), 20 to 24 minutes (21 commuters, 12.7%), and 60 to 89 minutes (18 commuters, 10.8%).
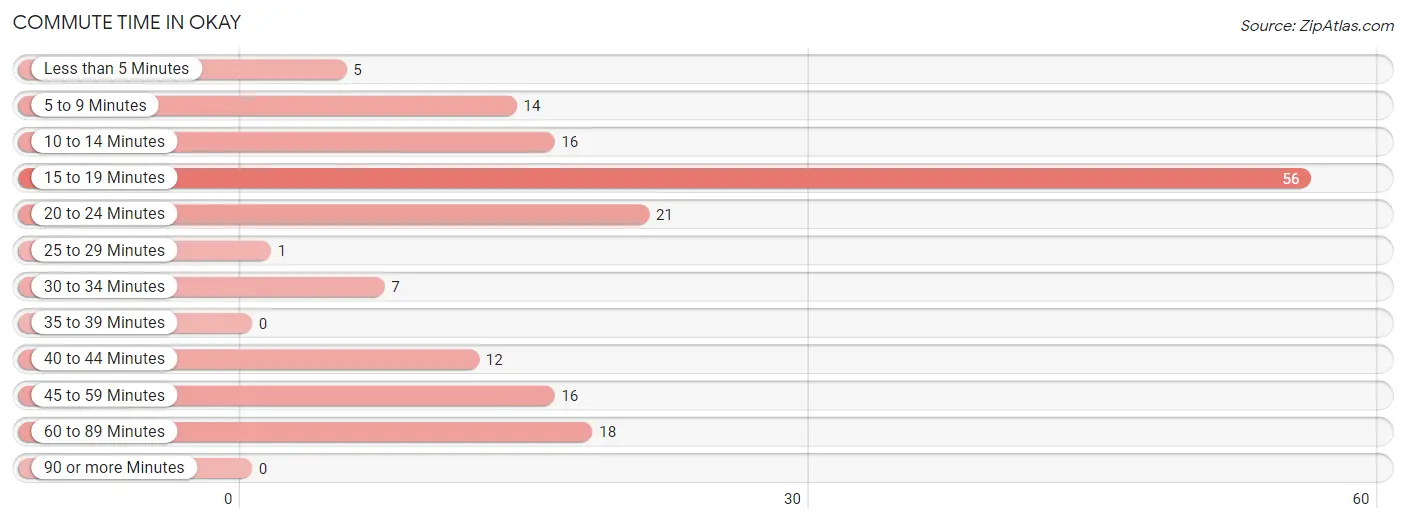
| Commute Time | # Commuters | % Commuters |
| Less than 5 Minutes | 5 | 3.0% |
| 5 to 9 Minutes | 14 | 8.4% |
| 10 to 14 Minutes | 16 | 9.6% |
| 15 to 19 Minutes | 56 | 33.7% |
| 20 to 24 Minutes | 21 | 12.7% |
| 25 to 29 Minutes | 1 | 0.6% |
| 30 to 34 Minutes | 7 | 4.2% |
| 35 to 39 Minutes | 0 | 0.0% |
| 40 to 44 Minutes | 12 | 7.2% |
| 45 to 59 Minutes | 16 | 9.6% |
| 60 to 89 Minutes | 18 | 10.8% |
| 90 or more Minutes | 0 | 0.0% |
Commute Time by Sex in Okay
The most common commute times in Okay are 15 to 19 minutes (26 commuters, 37.7%) for males and 15 to 19 minutes (30 commuters, 30.9%) for females.
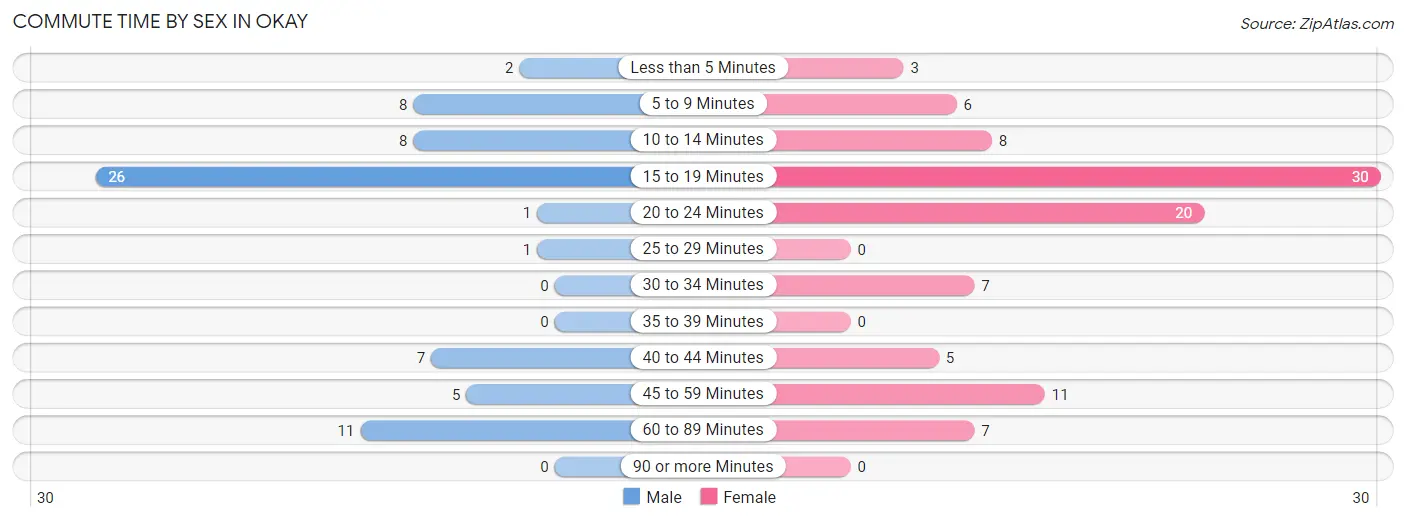
| Commute Time | Male | Female |
| Less than 5 Minutes | 2 (2.9%) | 3 (3.1%) |
| 5 to 9 Minutes | 8 (11.6%) | 6 (6.2%) |
| 10 to 14 Minutes | 8 (11.6%) | 8 (8.3%) |
| 15 to 19 Minutes | 26 (37.7%) | 30 (30.9%) |
| 20 to 24 Minutes | 1 (1.5%) | 20 (20.6%) |
| 25 to 29 Minutes | 1 (1.5%) | 0 (0.0%) |
| 30 to 34 Minutes | 0 (0.0%) | 7 (7.2%) |
| 35 to 39 Minutes | 0 (0.0%) | 0 (0.0%) |
| 40 to 44 Minutes | 7 (10.1%) | 5 (5.1%) |
| 45 to 59 Minutes | 5 (7.2%) | 11 (11.3%) |
| 60 to 89 Minutes | 11 (15.9%) | 7 (7.2%) |
| 90 or more Minutes | 0 (0.0%) | 0 (0.0%) |
Time of Departure to Work by Sex in Okay
The most frequent times of departure to work in Okay are 5:30 AM to 5:59 AM (13, 18.8%) for males and 7:00 AM to 7:29 AM (24, 24.7%) for females.
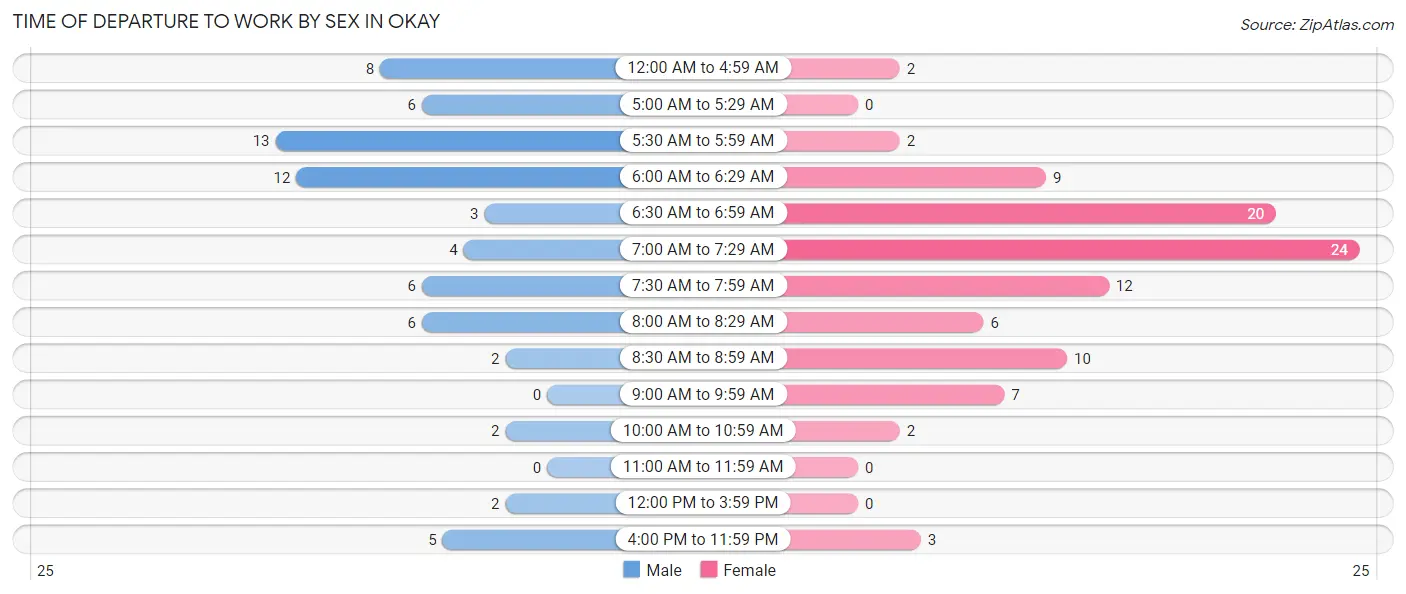
| Time of Departure | Male | Female |
| 12:00 AM to 4:59 AM | 8 (11.6%) | 2 (2.1%) |
| 5:00 AM to 5:29 AM | 6 (8.7%) | 0 (0.0%) |
| 5:30 AM to 5:59 AM | 13 (18.8%) | 2 (2.1%) |
| 6:00 AM to 6:29 AM | 12 (17.4%) | 9 (9.3%) |
| 6:30 AM to 6:59 AM | 3 (4.3%) | 20 (20.6%) |
| 7:00 AM to 7:29 AM | 4 (5.8%) | 24 (24.7%) |
| 7:30 AM to 7:59 AM | 6 (8.7%) | 12 (12.4%) |
| 8:00 AM to 8:29 AM | 6 (8.7%) | 6 (6.2%) |
| 8:30 AM to 8:59 AM | 2 (2.9%) | 10 (10.3%) |
| 9:00 AM to 9:59 AM | 0 (0.0%) | 7 (7.2%) |
| 10:00 AM to 10:59 AM | 2 (2.9%) | 2 (2.1%) |
| 11:00 AM to 11:59 AM | 0 (0.0%) | 0 (0.0%) |
| 12:00 PM to 3:59 PM | 2 (2.9%) | 0 (0.0%) |
| 4:00 PM to 11:59 PM | 5 (7.2%) | 3 (3.1%) |
| Total | 69 (100.0%) | 97 (100.0%) |
Housing Occupancy in Okay
Occupancy by Ownership in Okay
Of the total 167 dwellings in Okay, owner-occupied units account for 129 (77.2%), while renter-occupied units make up 38 (22.8%).
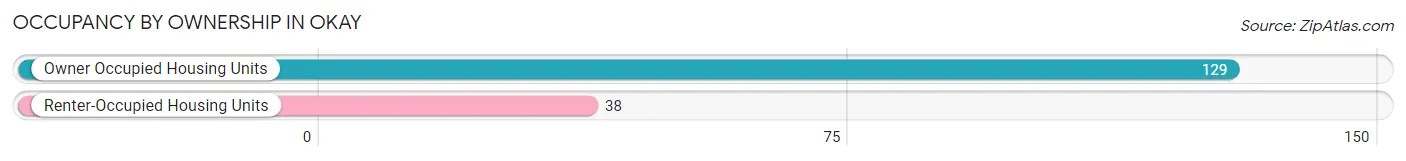
| Occupancy | # Housing Units | % Housing Units |
| Owner Occupied Housing Units | 129 | 77.2% |
| Renter-Occupied Housing Units | 38 | 22.8% |
| Total Occupied Housing Units | 167 | 100.0% |
Occupancy by Household Size in Okay
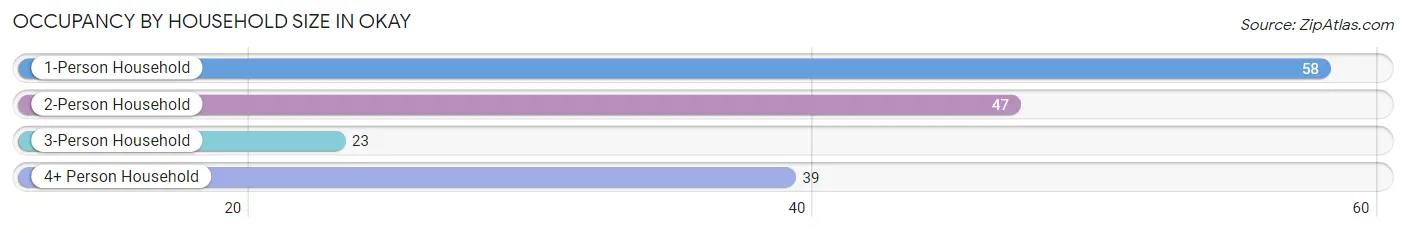
| Household Size | # Housing Units | % Housing Units |
| 1-Person Household | 58 | 34.7% |
| 2-Person Household | 47 | 28.1% |
| 3-Person Household | 23 | 13.8% |
| 4+ Person Household | 39 | 23.4% |
| Total Housing Units | 167 | 100.0% |
Occupancy by Ownership by Household Size in Okay
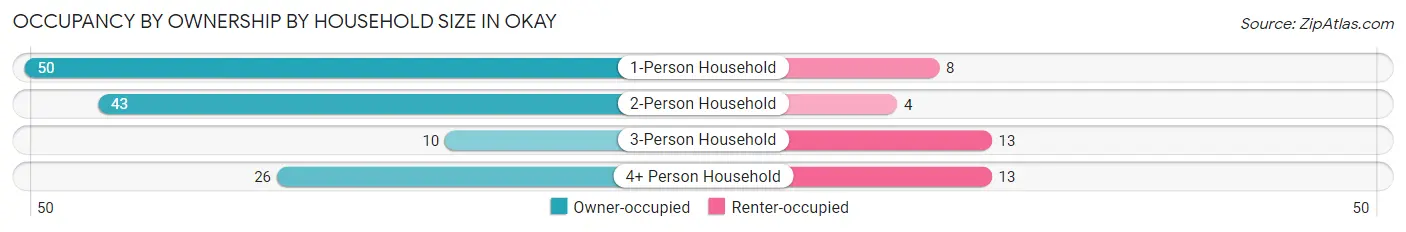
| Household Size | Owner-occupied | Renter-occupied |
| 1-Person Household | 50 (86.2%) | 8 (13.8%) |
| 2-Person Household | 43 (91.5%) | 4 (8.5%) |
| 3-Person Household | 10 (43.5%) | 13 (56.5%) |
| 4+ Person Household | 26 (66.7%) | 13 (33.3%) |
| Total Housing Units | 129 (77.2%) | 38 (22.8%) |
Occupancy by Educational Attainment in Okay
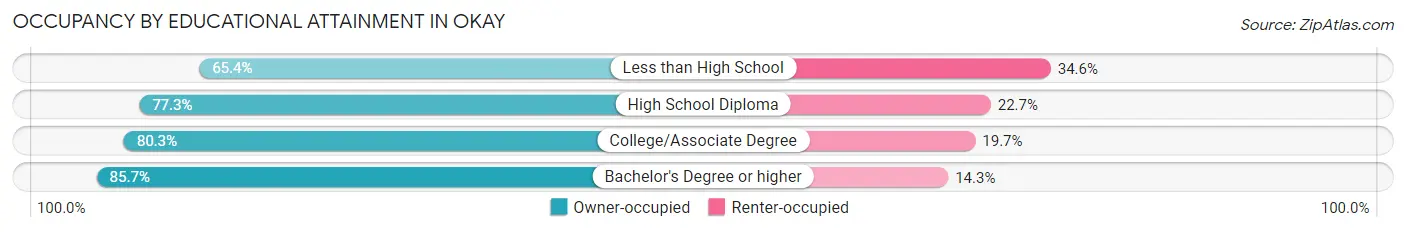
| Household Size | Owner-occupied | Renter-occupied |
| Less than High School | 17 (65.4%) | 9 (34.6%) |
| High School Diploma | 51 (77.3%) | 15 (22.7%) |
| College/Associate Degree | 49 (80.3%) | 12 (19.7%) |
| Bachelor's Degree or higher | 12 (85.7%) | 2 (14.3%) |
Occupancy by Age of Householder in Okay
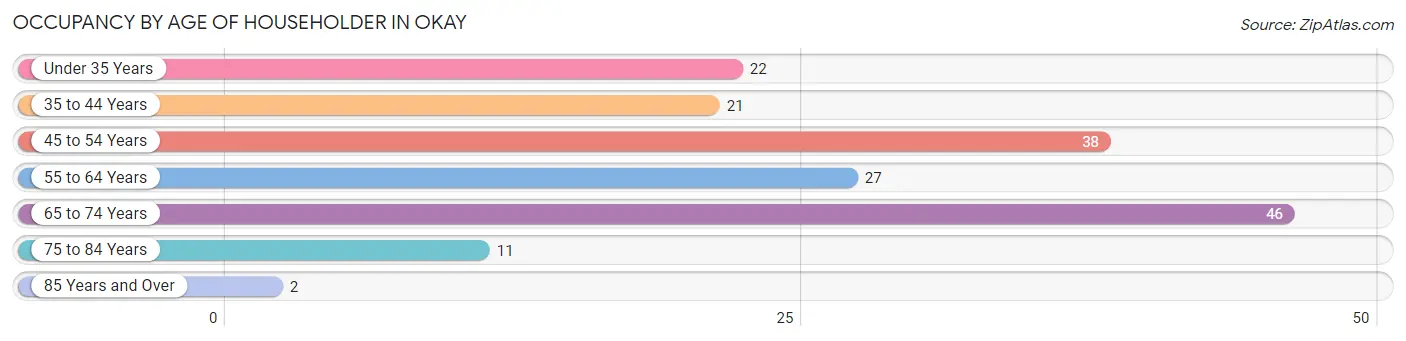
| Age Bracket | # Households | % Households |
| Under 35 Years | 22 | 13.2% |
| 35 to 44 Years | 21 | 12.6% |
| 45 to 54 Years | 38 | 22.8% |
| 55 to 64 Years | 27 | 16.2% |
| 65 to 74 Years | 46 | 27.5% |
| 75 to 84 Years | 11 | 6.6% |
| 85 Years and Over | 2 | 1.2% |
| Total | 167 | 100.0% |
Housing Finances in Okay
Median Income by Occupancy in Okay
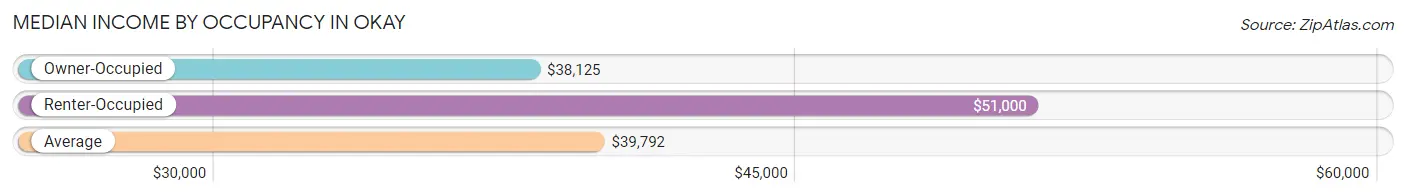
| Occupancy Type | # Households | Median Income |
| Owner-Occupied | 129 (77.2%) | $38,125 |
| Renter-Occupied | 38 (22.8%) | $51,000 |
| Average | 167 (100.0%) | $39,792 |
Occupancy by Householder Income Bracket in Okay
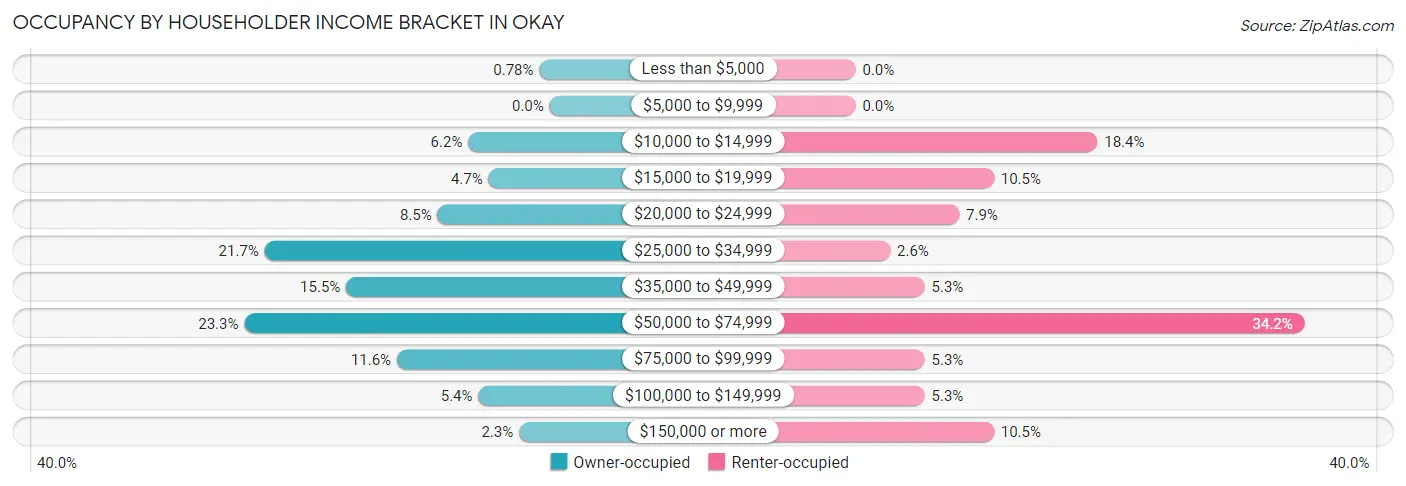
| Income Bracket | Owner-occupied | Renter-occupied |
| Less than $5,000 | 1 (0.8%) | 0 (0.0%) |
| $5,000 to $9,999 | 0 (0.0%) | 0 (0.0%) |
| $10,000 to $14,999 | 8 (6.2%) | 7 (18.4%) |
| $15,000 to $19,999 | 6 (4.6%) | 4 (10.5%) |
| $20,000 to $24,999 | 11 (8.5%) | 3 (7.9%) |
| $25,000 to $34,999 | 28 (21.7%) | 1 (2.6%) |
| $35,000 to $49,999 | 20 (15.5%) | 2 (5.3%) |
| $50,000 to $74,999 | 30 (23.3%) | 13 (34.2%) |
| $75,000 to $99,999 | 15 (11.6%) | 2 (5.3%) |
| $100,000 to $149,999 | 7 (5.4%) | 2 (5.3%) |
| $150,000 or more | 3 (2.3%) | 4 (10.5%) |
| Total | 129 (100.0%) | 38 (100.0%) |
Monthly Housing Cost Tiers in Okay
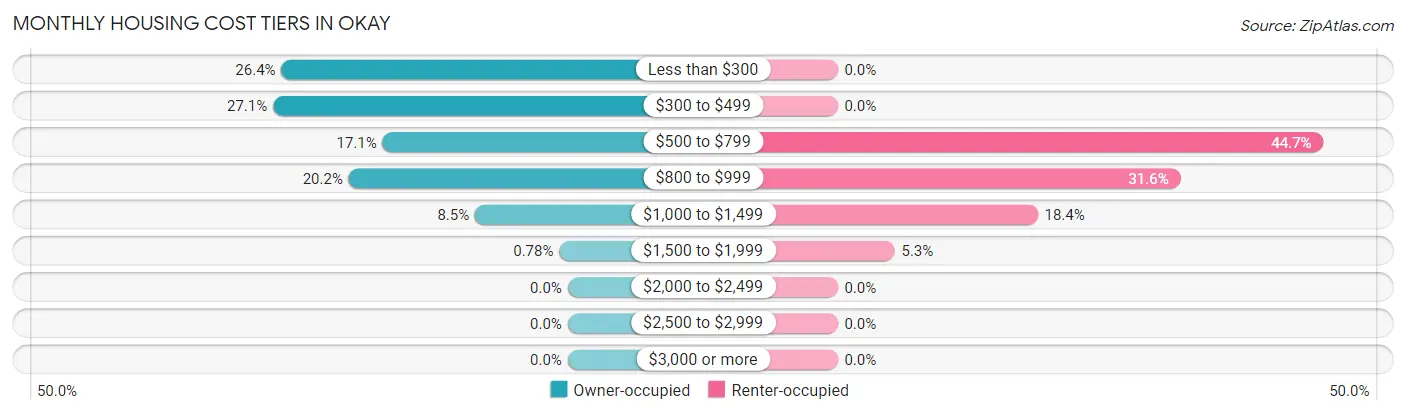
| Monthly Cost | Owner-occupied | Renter-occupied |
| Less than $300 | 34 (26.4%) | 0 (0.0%) |
| $300 to $499 | 35 (27.1%) | 0 (0.0%) |
| $500 to $799 | 22 (17.1%) | 17 (44.7%) |
| $800 to $999 | 26 (20.2%) | 12 (31.6%) |
| $1,000 to $1,499 | 11 (8.5%) | 7 (18.4%) |
| $1,500 to $1,999 | 1 (0.8%) | 2 (5.3%) |
| $2,000 to $2,499 | 0 (0.0%) | 0 (0.0%) |
| $2,500 to $2,999 | 0 (0.0%) | 0 (0.0%) |
| $3,000 or more | 0 (0.0%) | 0 (0.0%) |
| Total | 129 (100.0%) | 38 (100.0%) |
Physical Housing Characteristics in Okay
Housing Structures in Okay
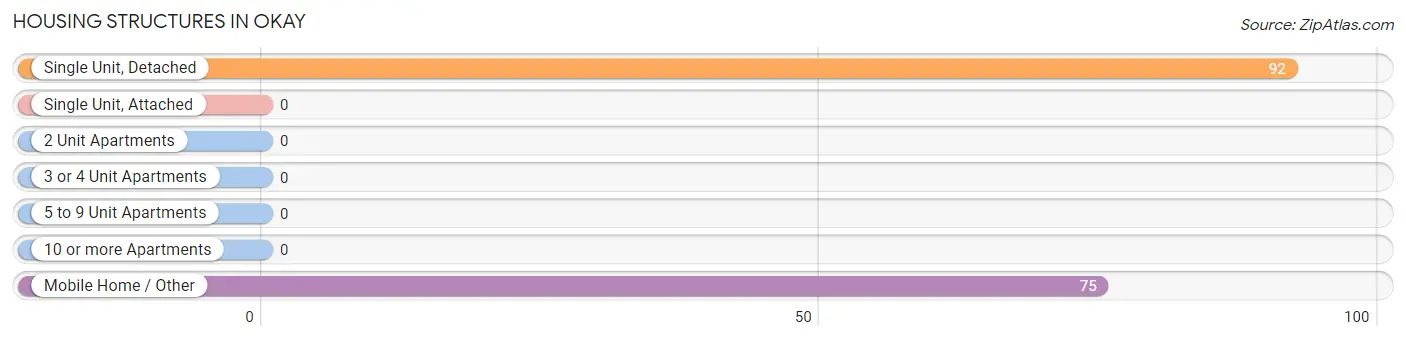
| Structure Type | # Housing Units | % Housing Units |
| Single Unit, Detached | 92 | 55.1% |
| Single Unit, Attached | 0 | 0.0% |
| 2 Unit Apartments | 0 | 0.0% |
| 3 or 4 Unit Apartments | 0 | 0.0% |
| 5 to 9 Unit Apartments | 0 | 0.0% |
| 10 or more Apartments | 0 | 0.0% |
| Mobile Home / Other | 75 | 44.9% |
| Total | 167 | 100.0% |
Housing Structures by Occupancy in Okay
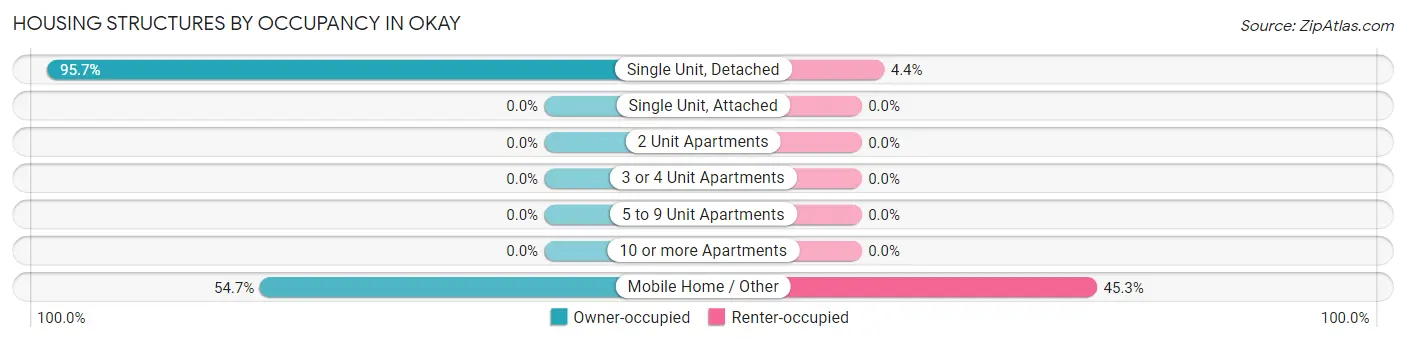
| Structure Type | Owner-occupied | Renter-occupied |
| Single Unit, Detached | 88 (95.7%) | 4 (4.3%) |
| Single Unit, Attached | 0 (0.0%) | 0 (0.0%) |
| 2 Unit Apartments | 0 (0.0%) | 0 (0.0%) |
| 3 or 4 Unit Apartments | 0 (0.0%) | 0 (0.0%) |
| 5 to 9 Unit Apartments | 0 (0.0%) | 0 (0.0%) |
| 10 or more Apartments | 0 (0.0%) | 0 (0.0%) |
| Mobile Home / Other | 41 (54.7%) | 34 (45.3%) |
| Total | 129 (77.2%) | 38 (22.8%) |
Housing Structures by Number of Rooms in Okay
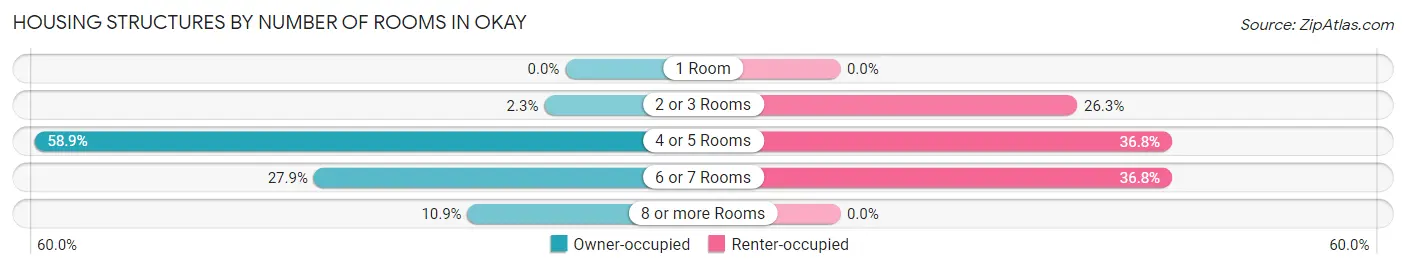
| Number of Rooms | Owner-occupied | Renter-occupied |
| 1 Room | 0 (0.0%) | 0 (0.0%) |
| 2 or 3 Rooms | 3 (2.3%) | 10 (26.3%) |
| 4 or 5 Rooms | 76 (58.9%) | 14 (36.8%) |
| 6 or 7 Rooms | 36 (27.9%) | 14 (36.8%) |
| 8 or more Rooms | 14 (10.8%) | 0 (0.0%) |
| Total | 129 (100.0%) | 38 (100.0%) |
Housing Structure by Heating Type in Okay
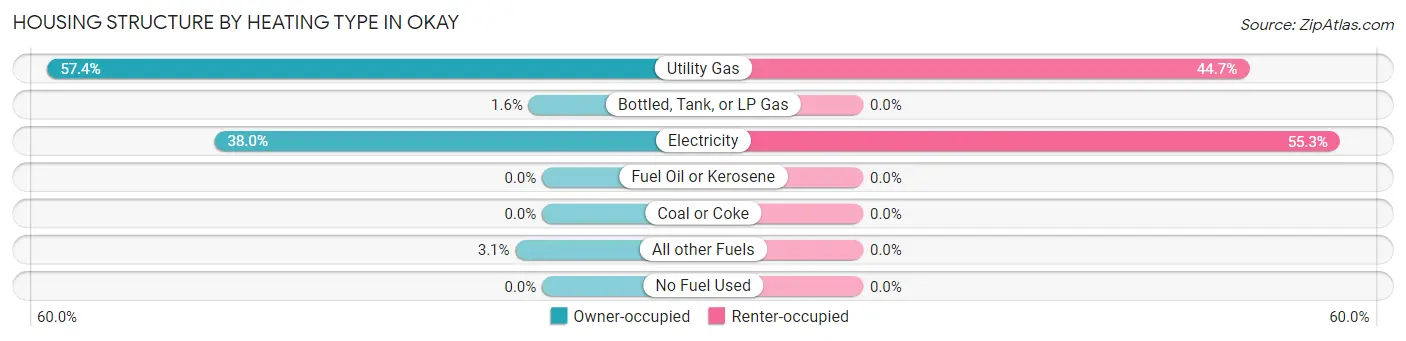
| Heating Type | Owner-occupied | Renter-occupied |
| Utility Gas | 74 (57.4%) | 17 (44.7%) |
| Bottled, Tank, or LP Gas | 2 (1.5%) | 0 (0.0%) |
| Electricity | 49 (38.0%) | 21 (55.3%) |
| Fuel Oil or Kerosene | 0 (0.0%) | 0 (0.0%) |
| Coal or Coke | 0 (0.0%) | 0 (0.0%) |
| All other Fuels | 4 (3.1%) | 0 (0.0%) |
| No Fuel Used | 0 (0.0%) | 0 (0.0%) |
| Total | 129 (100.0%) | 38 (100.0%) |
Household Vehicle Usage in Okay
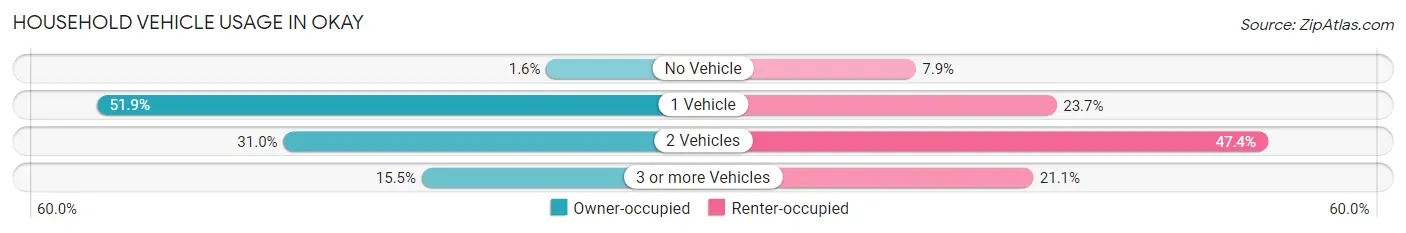
| Vehicles per Household | Owner-occupied | Renter-occupied |
| No Vehicle | 2 (1.5%) | 3 (7.9%) |
| 1 Vehicle | 67 (51.9%) | 9 (23.7%) |
| 2 Vehicles | 40 (31.0%) | 18 (47.4%) |
| 3 or more Vehicles | 20 (15.5%) | 8 (21.0%) |
| Total | 129 (100.0%) | 38 (100.0%) |
Real Estate & Mortgages in Okay
Real Estate and Mortgage Overview in Okay
| Characteristic | Without Mortgage | With Mortgage |
| Housing Units | 72 | 57 |
| Median Property Value | $48,800 | $82,900 |
| Median Household Income | $37,500 | $3 |
| Monthly Housing Costs | $333 | $0 |
| Real Estate Taxes | $256 | $5 |
Property Value by Mortgage Status in Okay
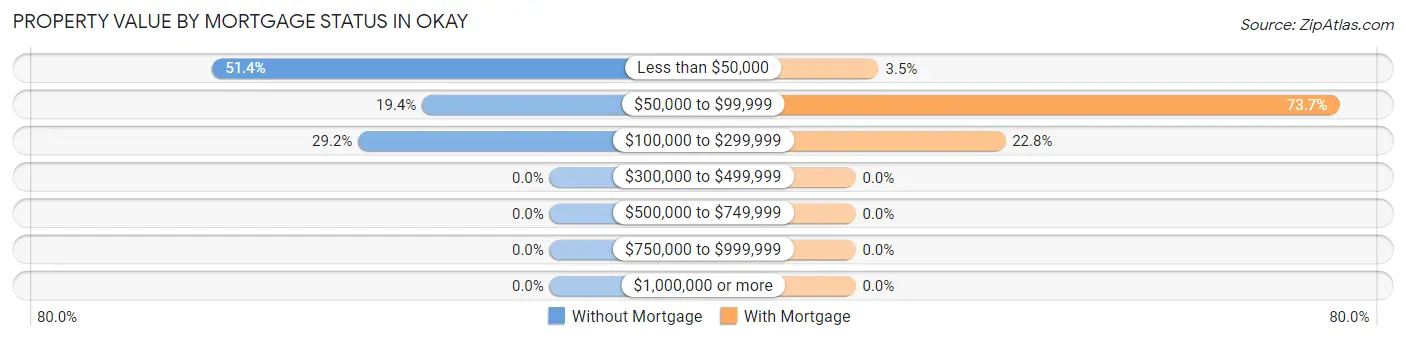
| Property Value | Without Mortgage | With Mortgage |
| Less than $50,000 | 37 (51.4%) | 2 (3.5%) |
| $50,000 to $99,999 | 14 (19.4%) | 42 (73.7%) |
| $100,000 to $299,999 | 21 (29.2%) | 13 (22.8%) |
| $300,000 to $499,999 | 0 (0.0%) | 0 (0.0%) |
| $500,000 to $749,999 | 0 (0.0%) | 0 (0.0%) |
| $750,000 to $999,999 | 0 (0.0%) | 0 (0.0%) |
| $1,000,000 or more | 0 (0.0%) | 0 (0.0%) |
| Total | 72 (100.0%) | 57 (100.0%) |
Household Income by Mortgage Status in Okay
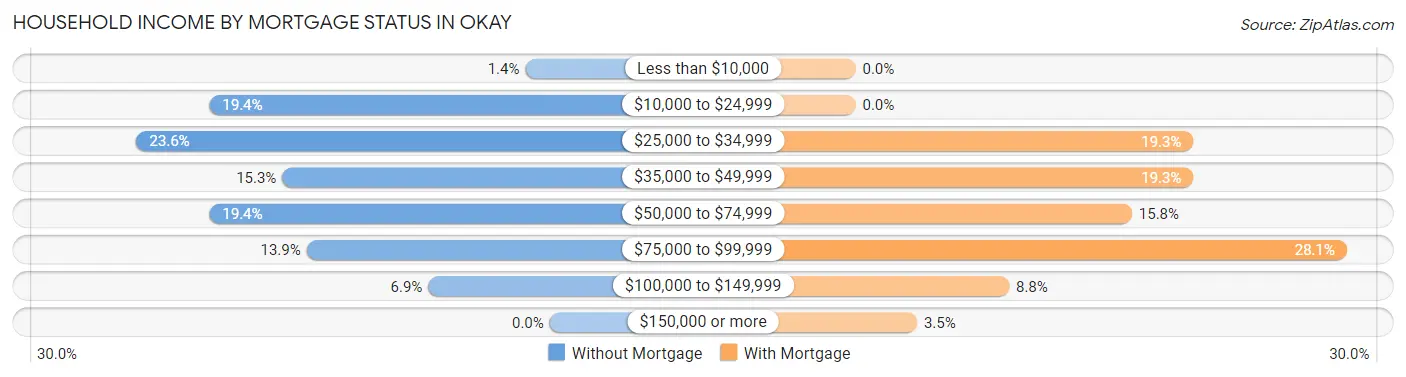
| Household Income | Without Mortgage | With Mortgage |
| Less than $10,000 | 1 (1.4%) | 0 (0.0%) |
| $10,000 to $24,999 | 14 (19.4%) | 0 (0.0%) |
| $25,000 to $34,999 | 17 (23.6%) | 11 (19.3%) |
| $35,000 to $49,999 | 11 (15.3%) | 11 (19.3%) |
| $50,000 to $74,999 | 14 (19.4%) | 9 (15.8%) |
| $75,000 to $99,999 | 10 (13.9%) | 16 (28.1%) |
| $100,000 to $149,999 | 5 (6.9%) | 5 (8.8%) |
| $150,000 or more | 0 (0.0%) | 2 (3.5%) |
| Total | 72 (100.0%) | 57 (100.0%) |
Property Value to Household Income Ratio in Okay
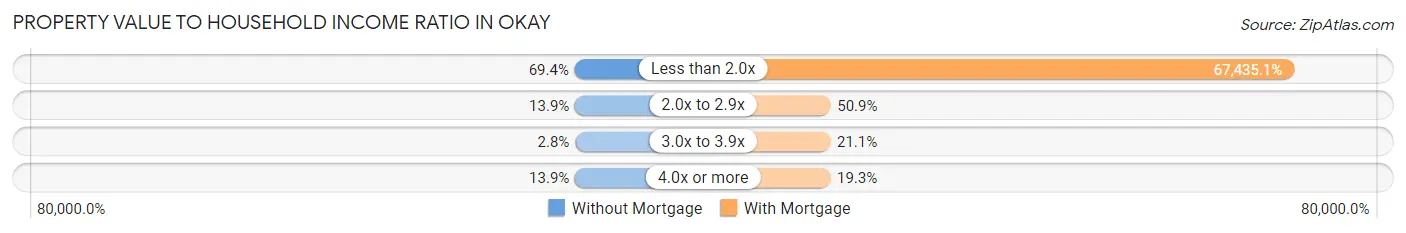
| Value-to-Income Ratio | Without Mortgage | With Mortgage |
| Less than 2.0x | 50 (69.4%) | 38,438 (67,435.1%) |
| 2.0x to 2.9x | 10 (13.9%) | 29 (50.9%) |
| 3.0x to 3.9x | 2 (2.8%) | 12 (21.0%) |
| 4.0x or more | 10 (13.9%) | 11 (19.3%) |
| Total | 72 (100.0%) | 57 (100.0%) |
Real Estate Taxes by Mortgage Status in Okay
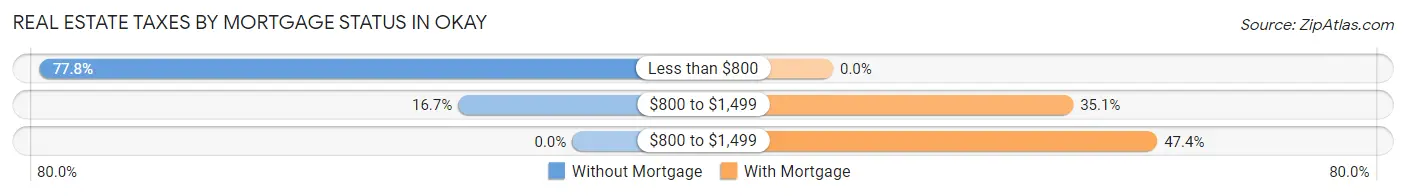
| Property Taxes | Without Mortgage | With Mortgage |
| Less than $800 | 56 (77.8%) | 0 (0.0%) |
| $800 to $1,499 | 12 (16.7%) | 20 (35.1%) |
| $800 to $1,499 | 0 (0.0%) | 27 (47.4%) |
| Total | 72 (100.0%) | 57 (100.0%) |
Health & Disability in Okay
Health Insurance Coverage by Age in Okay
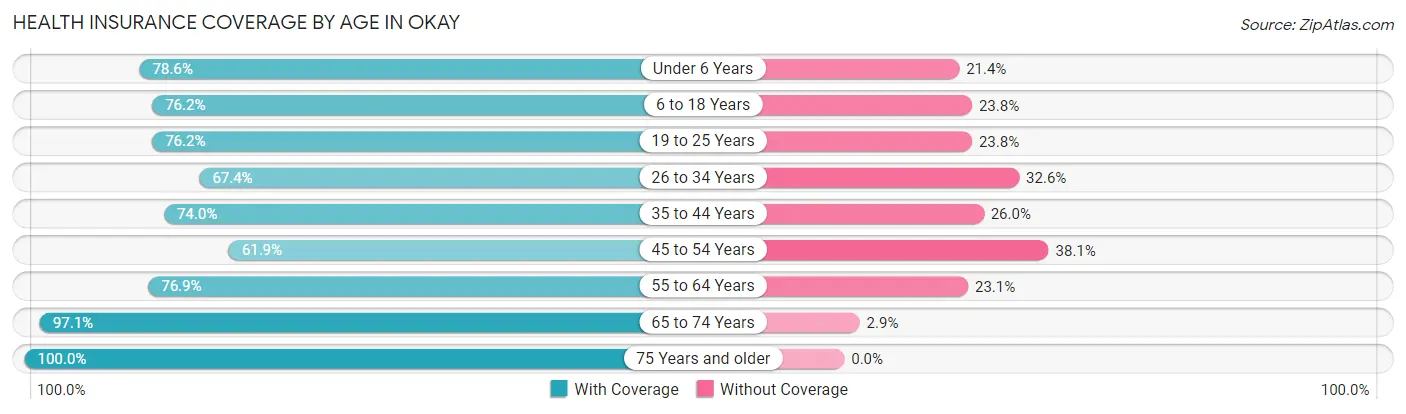
| Age Bracket | With Coverage | Without Coverage |
| Under 6 Years | 22 (78.6%) | 6 (21.4%) |
| 6 to 18 Years | 48 (76.2%) | 15 (23.8%) |
| 19 to 25 Years | 32 (76.2%) | 10 (23.8%) |
| 26 to 34 Years | 31 (67.4%) | 15 (32.6%) |
| 35 to 44 Years | 37 (74.0%) | 13 (26.0%) |
| 45 to 54 Years | 39 (61.9%) | 24 (38.1%) |
| 55 to 64 Years | 40 (76.9%) | 12 (23.1%) |
| 65 to 74 Years | 68 (97.1%) | 2 (2.9%) |
| 75 Years and older | 18 (100.0%) | 0 (0.0%) |
| Total | 335 (77.5%) | 97 (22.5%) |
Health Insurance Coverage by Citizenship Status in Okay
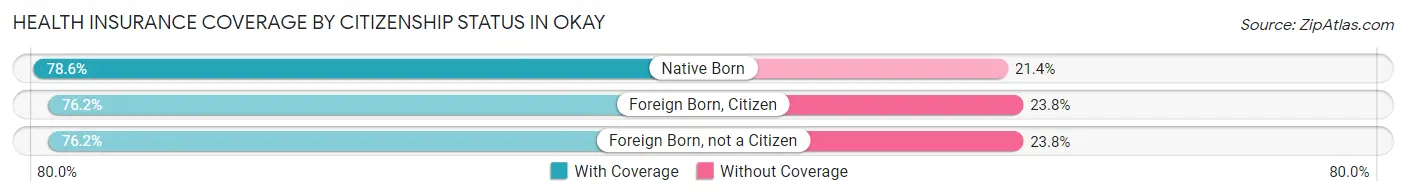
| Citizenship Status | With Coverage | Without Coverage |
| Native Born | 22 (78.6%) | 6 (21.4%) |
| Foreign Born, Citizen | 48 (76.2%) | 15 (23.8%) |
| Foreign Born, not a Citizen | 32 (76.2%) | 10 (23.8%) |
Health Insurance Coverage by Household Income in Okay
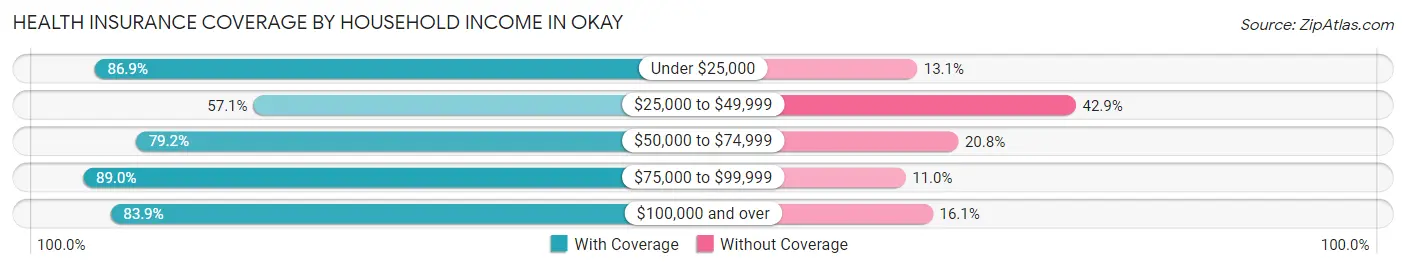
| Household Income | With Coverage | Without Coverage |
| Under $25,000 | 53 (86.9%) | 8 (13.1%) |
| $25,000 to $49,999 | 56 (57.1%) | 42 (42.9%) |
| $50,000 to $74,999 | 114 (79.2%) | 30 (20.8%) |
| $75,000 to $99,999 | 65 (89.0%) | 8 (11.0%) |
| $100,000 and over | 47 (83.9%) | 9 (16.1%) |
Public vs Private Health Insurance Coverage by Age in Okay
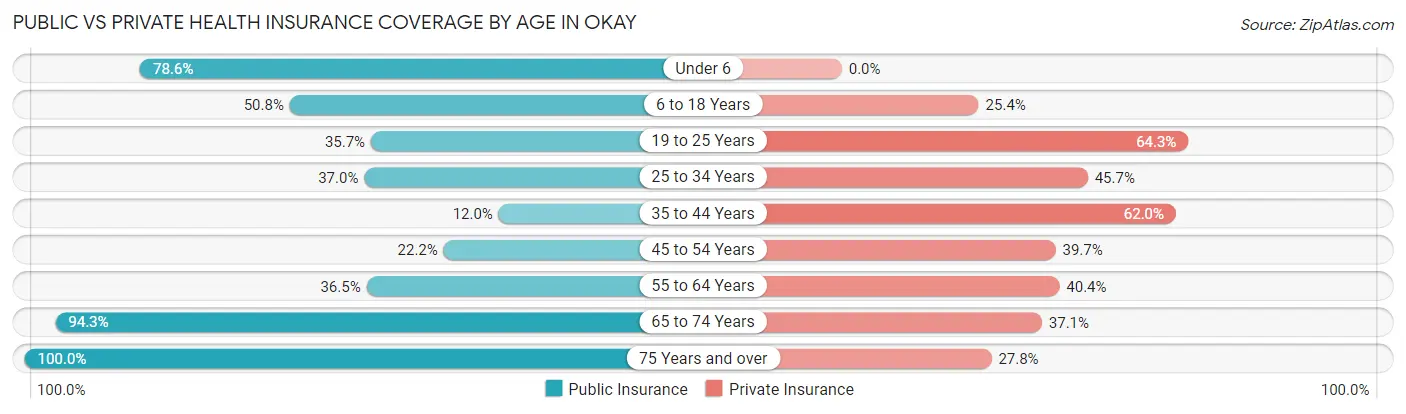
| Age Bracket | Public Insurance | Private Insurance |
| Under 6 | 22 (78.6%) | 0 (0.0%) |
| 6 to 18 Years | 32 (50.8%) | 16 (25.4%) |
| 19 to 25 Years | 15 (35.7%) | 27 (64.3%) |
| 25 to 34 Years | 17 (37.0%) | 21 (45.7%) |
| 35 to 44 Years | 6 (12.0%) | 31 (62.0%) |
| 45 to 54 Years | 14 (22.2%) | 25 (39.7%) |
| 55 to 64 Years | 19 (36.5%) | 21 (40.4%) |
| 65 to 74 Years | 66 (94.3%) | 26 (37.1%) |
| 75 Years and over | 18 (100.0%) | 5 (27.8%) |
| Total | 209 (48.4%) | 172 (39.8%) |
Disability Status by Sex by Age in Okay
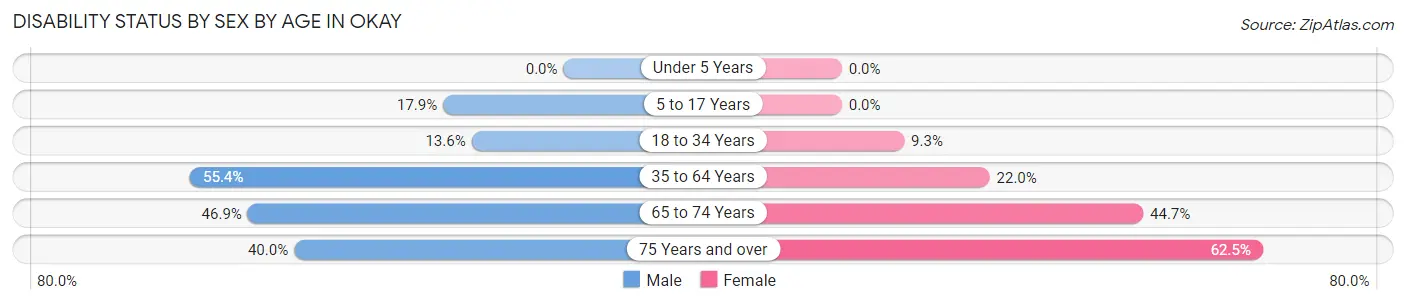
| Age Bracket | Male | Female |
| Under 5 Years | 0 (0.0%) | 0 (0.0%) |
| 5 to 17 Years | 5 (17.9%) | 0 (0.0%) |
| 18 to 34 Years | 6 (13.6%) | 5 (9.3%) |
| 35 to 64 Years | 46 (55.4%) | 18 (22.0%) |
| 65 to 74 Years | 15 (46.9%) | 17 (44.7%) |
| 75 Years and over | 4 (40.0%) | 5 (62.5%) |
Disability Class by Sex by Age in Okay
Disability Class: Hearing Difficulty
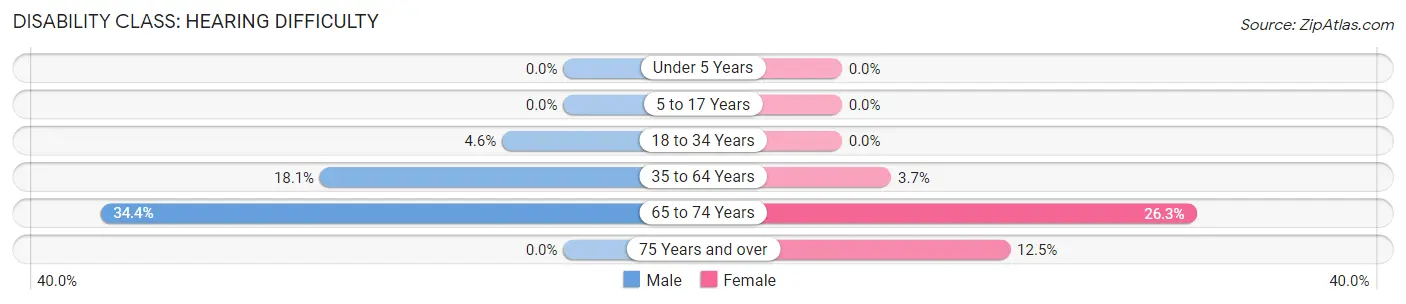
| Age Bracket | Male | Female |
| Under 5 Years | 0 (0.0%) | 0 (0.0%) |
| 5 to 17 Years | 0 (0.0%) | 0 (0.0%) |
| 18 to 34 Years | 2 (4.5%) | 0 (0.0%) |
| 35 to 64 Years | 15 (18.1%) | 3 (3.7%) |
| 65 to 74 Years | 11 (34.4%) | 10 (26.3%) |
| 75 Years and over | 0 (0.0%) | 1 (12.5%) |
Disability Class: Vision Difficulty
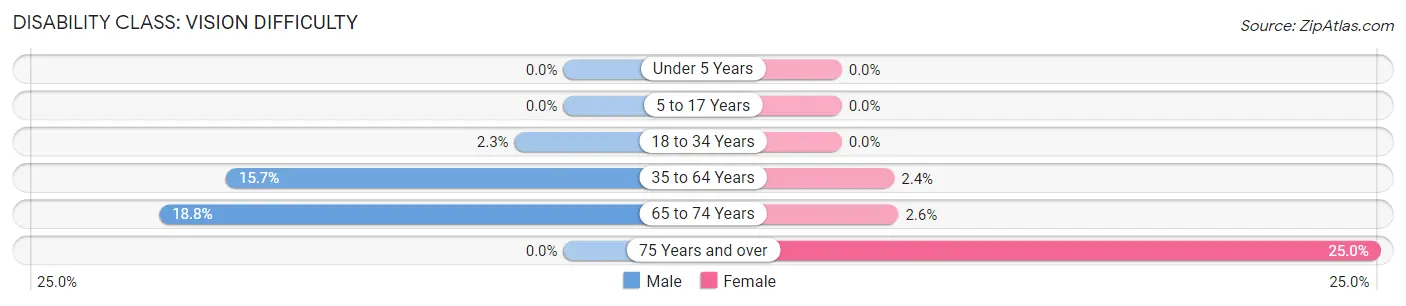
| Age Bracket | Male | Female |
| Under 5 Years | 0 (0.0%) | 0 (0.0%) |
| 5 to 17 Years | 0 (0.0%) | 0 (0.0%) |
| 18 to 34 Years | 1 (2.3%) | 0 (0.0%) |
| 35 to 64 Years | 13 (15.7%) | 2 (2.4%) |
| 65 to 74 Years | 6 (18.8%) | 1 (2.6%) |
| 75 Years and over | 0 (0.0%) | 2 (25.0%) |
Disability Class: Cognitive Difficulty
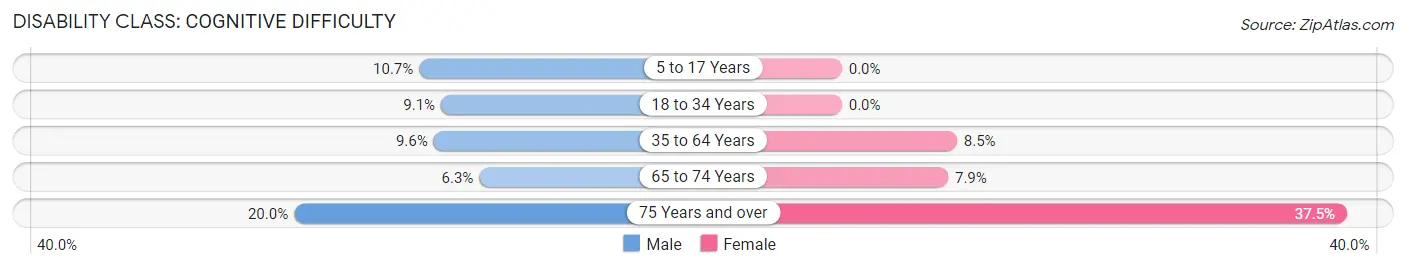
| Age Bracket | Male | Female |
| 5 to 17 Years | 3 (10.7%) | 0 (0.0%) |
| 18 to 34 Years | 4 (9.1%) | 0 (0.0%) |
| 35 to 64 Years | 8 (9.6%) | 7 (8.5%) |
| 65 to 74 Years | 2 (6.2%) | 3 (7.9%) |
| 75 Years and over | 2 (20.0%) | 3 (37.5%) |
Disability Class: Ambulatory Difficulty
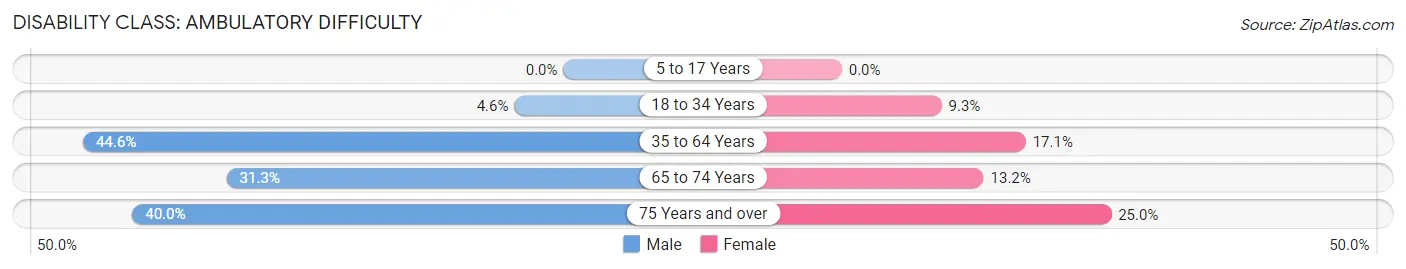
| Age Bracket | Male | Female |
| 5 to 17 Years | 0 (0.0%) | 0 (0.0%) |
| 18 to 34 Years | 2 (4.5%) | 5 (9.3%) |
| 35 to 64 Years | 37 (44.6%) | 14 (17.1%) |
| 65 to 74 Years | 10 (31.2%) | 5 (13.2%) |
| 75 Years and over | 4 (40.0%) | 2 (25.0%) |
Disability Class: Self-Care Difficulty
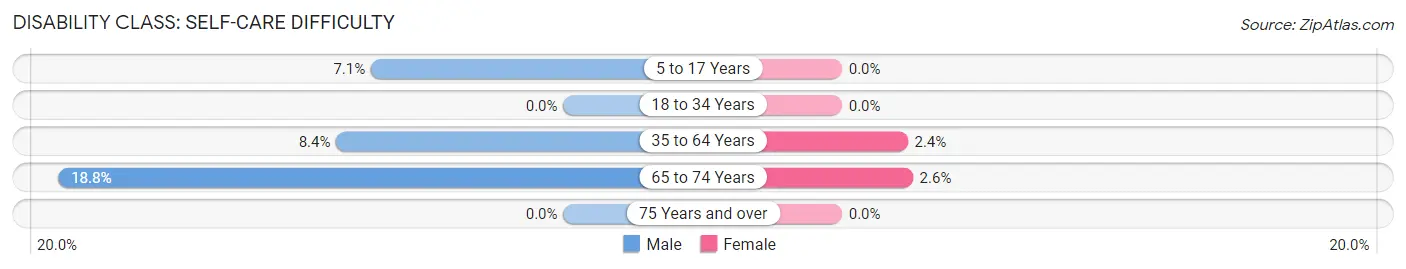
| Age Bracket | Male | Female |
| 5 to 17 Years | 2 (7.1%) | 0 (0.0%) |
| 18 to 34 Years | 0 (0.0%) | 0 (0.0%) |
| 35 to 64 Years | 7 (8.4%) | 2 (2.4%) |
| 65 to 74 Years | 6 (18.8%) | 1 (2.6%) |
| 75 Years and over | 0 (0.0%) | 0 (0.0%) |
Technology Access in Okay
Computing Device Access in Okay
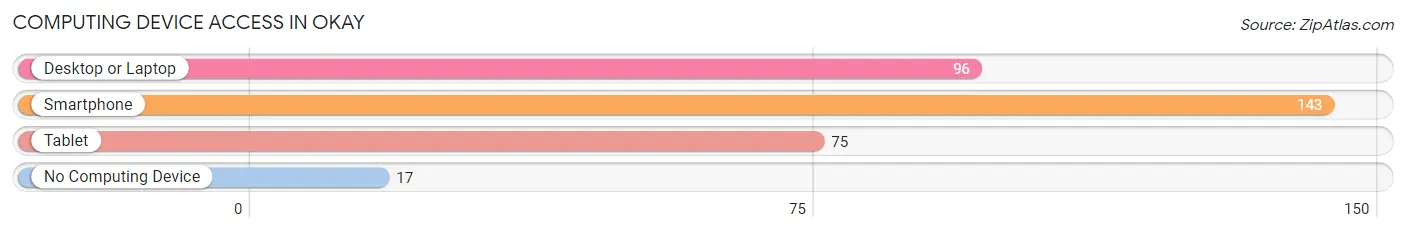
| Device Type | # Households | % Households |
| Desktop or Laptop | 96 | 57.5% |
| Smartphone | 143 | 85.6% |
| Tablet | 75 | 44.9% |
| No Computing Device | 17 | 10.2% |
| Total | 167 | 100.0% |
Internet Access in Okay
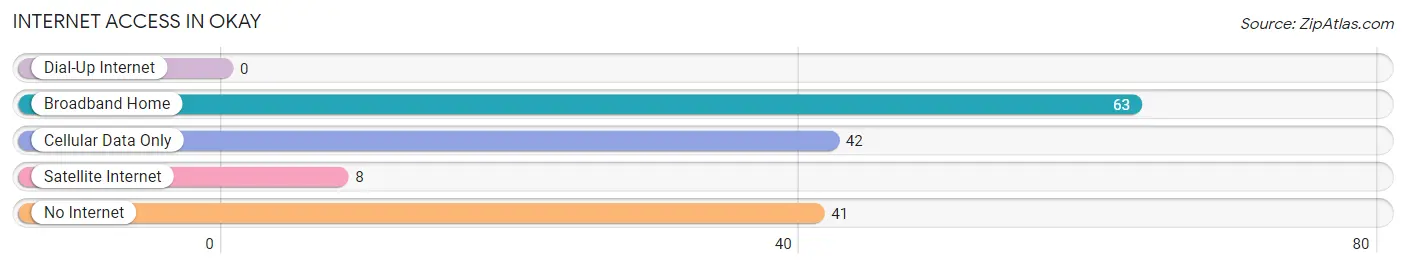
| Internet Type | # Households | % Households |
| Dial-Up Internet | 0 | 0.0% |
| Broadband Home | 63 | 37.7% |
| Cellular Data Only | 42 | 25.2% |
| Satellite Internet | 8 | 4.8% |
| No Internet | 41 | 24.5% |
| Total | 167 | 100.0% |
Okay Summary
History
The history of the United States is a long and complex one, stretching back to the earliest days of the nation’s founding. The United States was founded in 1776, when the Declaration of Independence was signed. This document declared the United States to be a sovereign nation, free from the rule of Great Britain. The Revolutionary War followed, and the United States won its independence in 1783.
The early years of the United States were marked by a period of rapid growth and expansion. The nation grew from 13 original colonies to 50 states by the end of the 19th century. During this time, the United States also fought a number of wars, including the War of 1812, the Mexican-American War, and the Spanish-American War.
The 20th century saw the United States become a major world power. The nation fought in both World War I and World War II, and emerged from the latter as one of the most powerful countries in the world. The Cold War followed, and the United States and the Soviet Union engaged in a decades-long struggle for global dominance.
The end of the Cold War marked a new era for the United States. The nation became increasingly involved in international affairs, and the economy boomed. The United States also experienced a number of social and cultural changes, including the civil rights movement and the rise of the internet.
Geography
The United States is located in North America, and is bordered by Canada to the north and Mexico to the south. The United States is the third-largest country in the world, with an area of 3.8 million square miles.
The United States is divided into 50 states, each with its own government and laws. The states are further divided into counties, cities, and towns. The United States also has several territories, including Puerto Rico, Guam, and the U.S. Virgin Islands.
The United States is home to a wide variety of landscapes, from the towering Rocky Mountains to the flat plains of the Midwest. The country also has a number of major rivers, including the Mississippi, the Missouri, and the Columbia.
Economy
The United States has the world’s largest economy, with a GDP of over $20 trillion. The economy is driven by a variety of industries, including manufacturing, finance, technology, and agriculture.
The United States is a major exporter of goods and services, and is home to some of the world’s largest companies, including Apple, Microsoft, and Walmart. The country is also a major importer, and is home to a large number of foreign-owned companies.
The United States has a highly developed financial system, and is home to some of the world’s largest banks. The country also has a large stock market, and is home to some of the world’s most valuable companies.
Demographics
The United States is home to over 330 million people, making it the third-most populous country in the world. The population is highly diverse, with people from all over the world.
The largest ethnic group in the United States is white, making up around 60% of the population. The second-largest group is Hispanic or Latino, making up around 18% of the population. African Americans make up around 13% of the population, and Asian Americans make up around 6%.
The United States is also home to a large number of immigrants, with around 13% of the population being foreign-born. The largest immigrant groups are from Mexico, India, and China.
The United States is a highly urbanized country, with around 82% of the population living in cities and towns. The largest cities in the United States are New York City, Los Angeles, Chicago, and Houston.
Common Questions
What is Per Capita Income in Okay?
Per Capita income in Okay is $25,980.
What is the Median Family Income in Okay?
Median Family Income in Okay is $61,786.
What is the Median Household income in Okay?
Median Household Income in Okay is $39,792.
What is Income or Wage Gap in Okay?
Income or Wage Gap in Okay is 20.8%.
Women in Okay earn 79.2 cents for every dollar earned by a man.
What is Inequality or Gini Index in Okay?
Inequality or Gini Index in Okay is 0.41.
What is the Total Population of Okay?
Total Population of Okay is 432.
What is the Total Male Population of Okay?
Total Male Population of Okay is 211.
What is the Total Female Population of Okay?
Total Female Population of Okay is 221.
What is the Ratio of Males per 100 Females in Okay?
There are 95.48 Males per 100 Females in Okay.
What is the Ratio of Females per 100 Males in Okay?
There are 104.74 Females per 100 Males in Okay.
What is the Median Population Age in Okay?
Median Population Age in Okay is 43.2 Years.
What is the Average Family Size in Okay
Average Family Size in Okay is 3.4 People.
What is the Average Household Size in Okay
Average Household Size in Okay is 2.6 People.
How Large is the Labor Force in Okay?
There are 199 People in the Labor Forcein in Okay.
What is the Percentage of People in the Labor Force in Okay?
56.4% of People are in the Labor Force in Okay.
What is the Unemployment Rate in Okay?
Unemployment Rate in Okay is 8.5%.