Wetumka, OK Map & Demographics
Wetumka Map
Wetumka Overview
$17,117
PER CAPITA INCOME
$43,333
AVG FAMILY INCOME
$29,231
AVG HOUSEHOLD INCOME
19.1%
WAGE / INCOME GAP [ % ]
80.9¢/ $1
WAGE / INCOME GAP [ $ ]
$8,496
FAMILY INCOME DEFICIT
0.41
INEQUALITY / GINI INDEX
1,498
TOTAL POPULATION
743
MALE POPULATION
755
FEMALE POPULATION
98.41
MALES / 100 FEMALES
101.62
FEMALES / 100 MALES
44.2
MEDIAN AGE
4.6
AVG FAMILY SIZE
3.0
AVG HOUSEHOLD SIZE
501
LABOR FORCE [ PEOPLE ]
39.5%
PERCENT IN LABOR FORCE
5.6%
UNEMPLOYMENT RATE
Wetumka Zip Codes
Wetumka Area Codes
Income in Wetumka
Income Overview in Wetumka
Per Capita Income in Wetumka is $17,117, while median incomes of families and households are $43,333 and $29,231 respectively.
| Characteristic | Number | Measure |
| Per Capita Income | 1,498 | $17,117 |
| Median Family Income | 230 | $43,333 |
| Mean Family Income | 230 | $53,807 |
| Median Household Income | 468 | $29,231 |
| Mean Household Income | 468 | $41,033 |
| Income Deficit | 230 | $8,496 |
| Wage / Income Gap (%) | 1,498 | 19.05% |
| Wage / Income Gap ($) | 1,498 | 80.95¢ per $1 |
| Gini / Inequality Index | 1,498 | 0.41 |
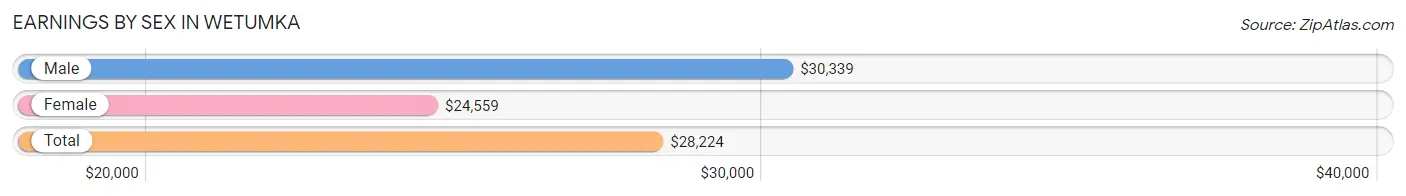
Earnings by Sex in Wetumka
Average Earnings in Wetumka are $28,224, $30,339 for men and $24,559 for women, a difference of 19.1%.
| Sex | Number | Average Earnings |
| Male | 350 (58.9%) | $30,339 |
| Female | 244 (41.1%) | $24,559 |
| Total | 594 (100.0%) | $28,224 |
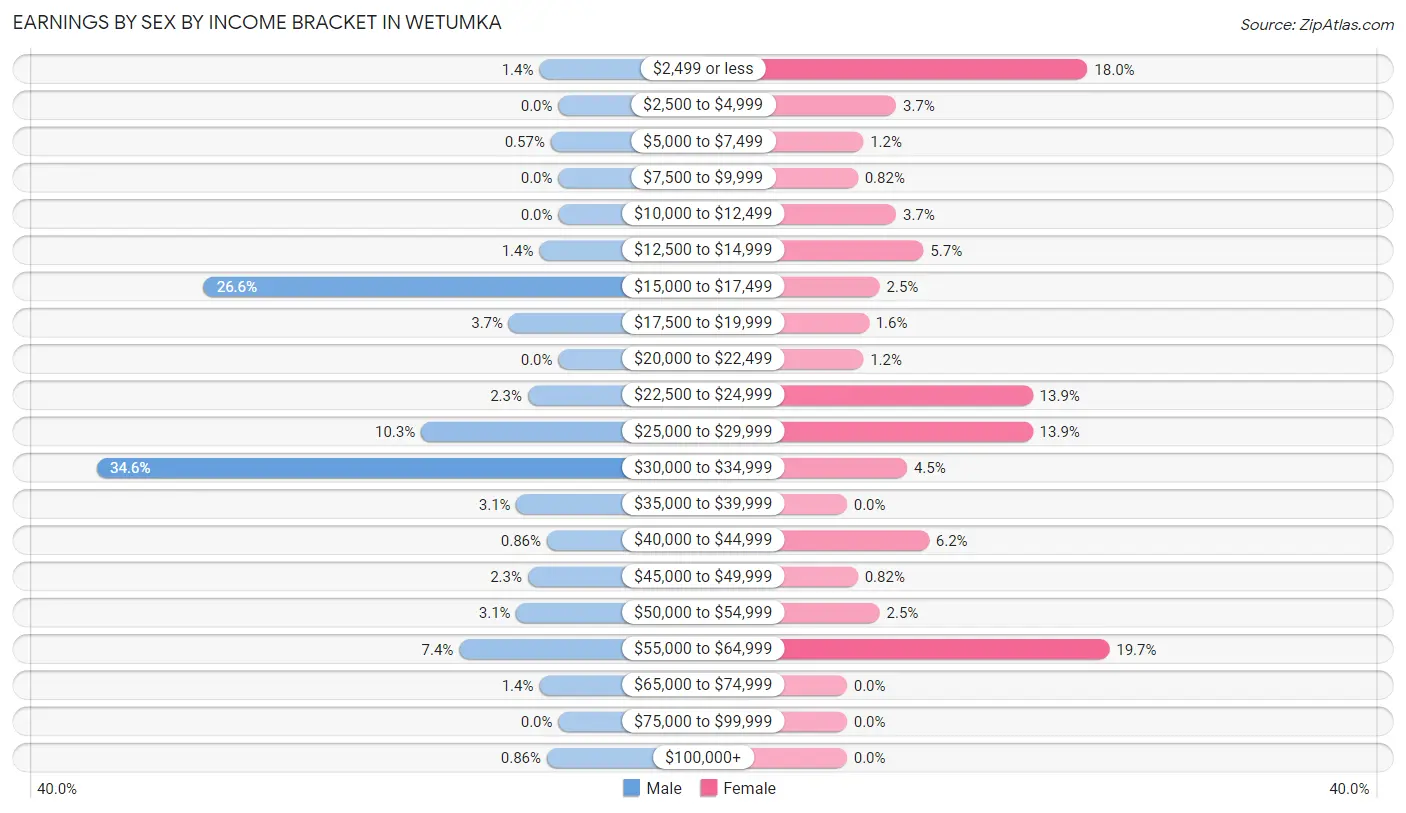
Earnings by Sex by Income Bracket in Wetumka
The most common earnings brackets in Wetumka are $30,000 to $34,999 for men (121 | 34.6%) and $55,000 to $64,999 for women (48 | 19.7%).
| Income | Male | Female |
| $2,499 or less | 5 (1.4%) | 44 (18.0%) |
| $2,500 to $4,999 | 0 (0.0%) | 9 (3.7%) |
| $5,000 to $7,499 | 2 (0.6%) | 3 (1.2%) |
| $7,500 to $9,999 | 0 (0.0%) | 2 (0.8%) |
| $10,000 to $12,499 | 0 (0.0%) | 9 (3.7%) |
| $12,500 to $14,999 | 5 (1.4%) | 14 (5.7%) |
| $15,000 to $17,499 | 93 (26.6%) | 6 (2.5%) |
| $17,500 to $19,999 | 13 (3.7%) | 4 (1.6%) |
| $20,000 to $22,499 | 0 (0.0%) | 3 (1.2%) |
| $22,500 to $24,999 | 8 (2.3%) | 34 (13.9%) |
| $25,000 to $29,999 | 36 (10.3%) | 34 (13.9%) |
| $30,000 to $34,999 | 121 (34.6%) | 11 (4.5%) |
| $35,000 to $39,999 | 11 (3.1%) | 0 (0.0%) |
| $40,000 to $44,999 | 3 (0.9%) | 15 (6.1%) |
| $45,000 to $49,999 | 8 (2.3%) | 2 (0.8%) |
| $50,000 to $54,999 | 11 (3.1%) | 6 (2.5%) |
| $55,000 to $64,999 | 26 (7.4%) | 48 (19.7%) |
| $65,000 to $74,999 | 5 (1.4%) | 0 (0.0%) |
| $75,000 to $99,999 | 0 (0.0%) | 0 (0.0%) |
| $100,000+ | 3 (0.9%) | 0 (0.0%) |
| Total | 350 (100.0%) | 244 (100.0%) |
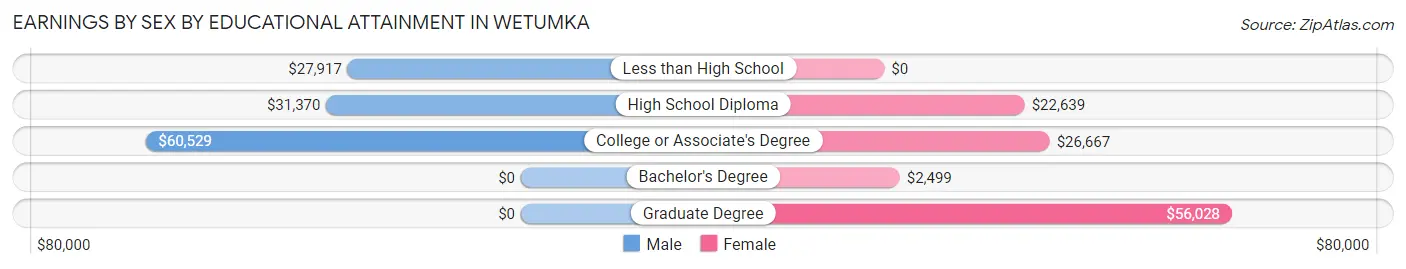
Earnings by Sex by Educational Attainment in Wetumka
Average earnings in Wetumka are $31,654 for men and $24,632 for women, a difference of 22.2%. Men with an educational attainment of college or associate's degree enjoy the highest average annual earnings of $60,529, while those with less than high school education earn the least with $27,917. Women with an educational attainment of graduate degree earn the most with the average annual earnings of $56,028, while those with bachelor's degree education have the smallest earnings of $2,499.
| Educational Attainment | Male Income | Female Income |
| Less than High School | $27,917 | $0 |
| High School Diploma | $31,370 | $22,639 |
| College or Associate's Degree | $60,529 | $26,667 |
| Bachelor's Degree | - | - |
| Graduate Degree | - | - |
| Total | $31,654 | $24,632 |
Family Income in Wetumka
Family Income Brackets in Wetumka
According to the Wetumka family income data, there are 43 families falling into the $50,000 to $74,999 income range, which is the most common income bracket and makes up 18.7% of all families.
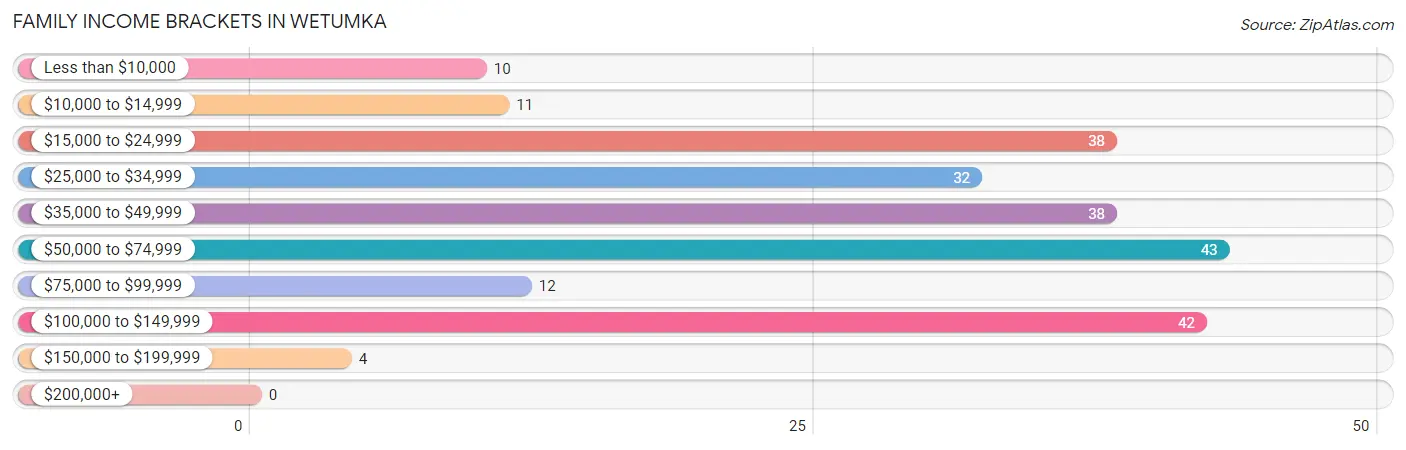
| Income Bracket | # Families | % Families |
| Less than $10,000 | 10 | 4.3% |
| $10,000 to $14,999 | 11 | 4.8% |
| $15,000 to $24,999 | 38 | 16.5% |
| $25,000 to $34,999 | 32 | 13.9% |
| $35,000 to $49,999 | 38 | 16.5% |
| $50,000 to $74,999 | 43 | 18.7% |
| $75,000 to $99,999 | 12 | 5.2% |
| $100,000 to $149,999 | 42 | 18.3% |
| $150,000 to $199,999 | 4 | 1.7% |
| $200,000+ | 0 | 0.0% |
Family Income by Famaliy Size in Wetumka
4-person families (21 | 9.1%) account for the highest median family income in Wetumka with $59,688 per family, while 2-person families (134 | 58.3%) have the highest median income of $17,708 per family member.
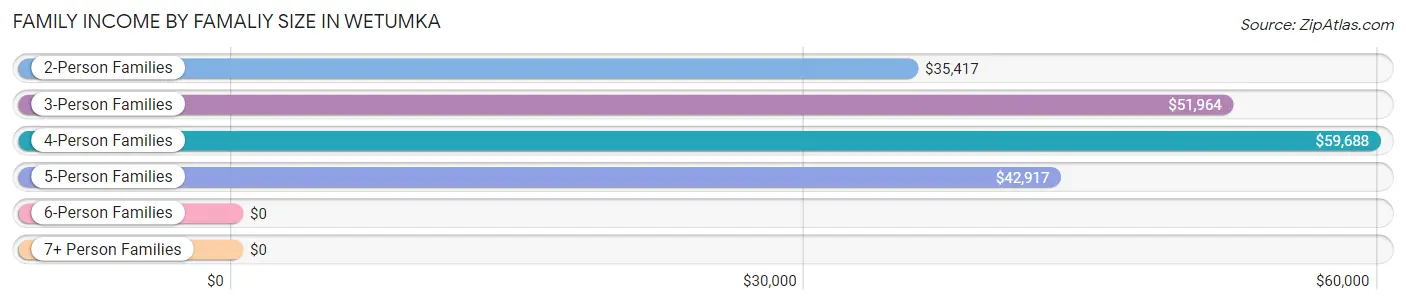
| Income Bracket | # Families | Median Income |
| 2-Person Families | 134 (58.3%) | $35,417 |
| 3-Person Families | 31 (13.5%) | $51,964 |
| 4-Person Families | 21 (9.1%) | $59,688 |
| 5-Person Families | 11 (4.8%) | $42,917 |
| 6-Person Families | 29 (12.6%) | $0 |
| 7+ Person Families | 4 (1.7%) | $0 |
| Total | 230 (100.0%) | $43,333 |
Family Income by Number of Earners in Wetumka
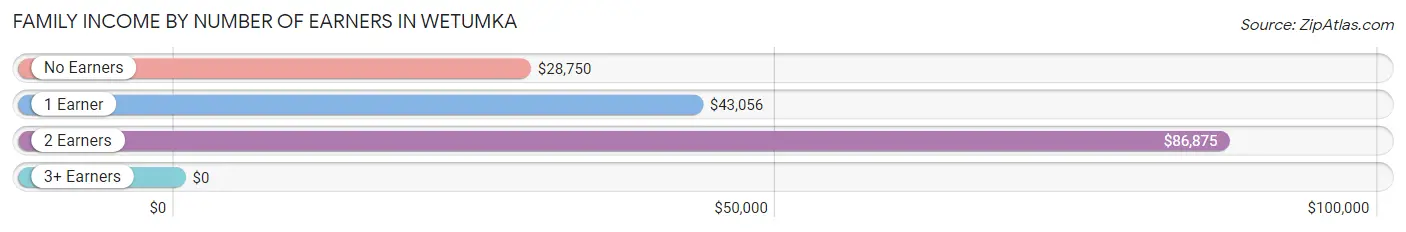
| Number of Earners | # Families | Median Income |
| No Earners | 61 (26.5%) | $28,750 |
| 1 Earner | 106 (46.1%) | $43,056 |
| 2 Earners | 31 (13.5%) | $86,875 |
| 3+ Earners | 32 (13.9%) | $0 |
| Total | 230 (100.0%) | $43,333 |
Household Income in Wetumka
Household Income Brackets in Wetumka
With 98 households falling in the category, the $25,000 to $34,999 income range is the most frequent in Wetumka, accounting for 20.9% of all households.
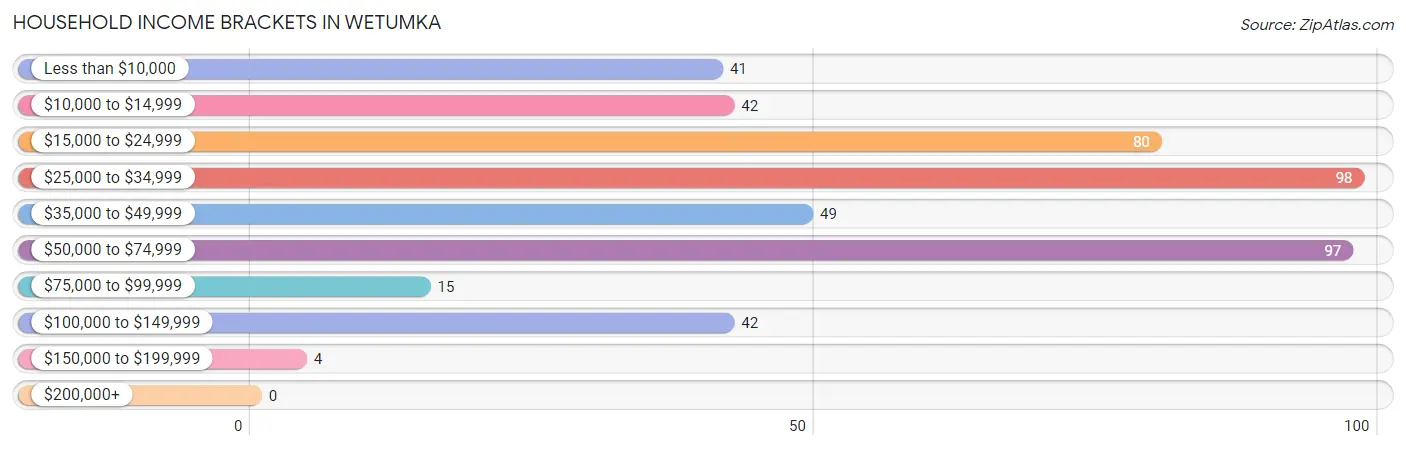
| Income Bracket | # Households | % Households |
| Less than $10,000 | 41 | 8.8% |
| $10,000 to $14,999 | 42 | 9.0% |
| $15,000 to $24,999 | 80 | 17.1% |
| $25,000 to $34,999 | 98 | 20.9% |
| $35,000 to $49,999 | 49 | 10.5% |
| $50,000 to $74,999 | 97 | 20.7% |
| $75,000 to $99,999 | 15 | 3.2% |
| $100,000 to $149,999 | 42 | 9.0% |
| $150,000 to $199,999 | 4 | 0.9% |
| $200,000+ | 0 | 0.0% |
Household Income by Householder Age in Wetumka
The median household income in Wetumka is $29,231, with the highest median household income of $39,375 found in the 25 to 44 years age bracket for the primary householder. A total of 84 households (17.9%) fall into this category. Meanwhile, the 15 to 24 years age bracket for the primary householder has the lowest median household income of $0, with 11 households (2.4%) in this group.
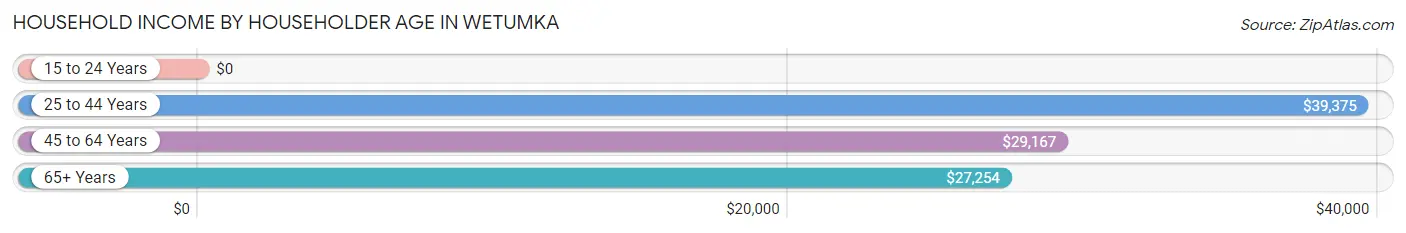
| Income Bracket | # Households | Median Income |
| 15 to 24 Years | 11 (2.4%) | $0 |
| 25 to 44 Years | 84 (17.9%) | $39,375 |
| 45 to 64 Years | 168 (35.9%) | $29,167 |
| 65+ Years | 205 (43.8%) | $27,254 |
| Total | 468 (100.0%) | $29,231 |
Poverty in Wetumka
Income Below Poverty by Sex and Age in Wetumka
With 24.5% poverty level for males and 39.5% for females among the residents of Wetumka, under 5 year old males and 6 to 11 year old females are the most vulnerable to poverty, with 12 males (100.0%) and 16 females (100.0%) in their respective age groups living below the poverty level.
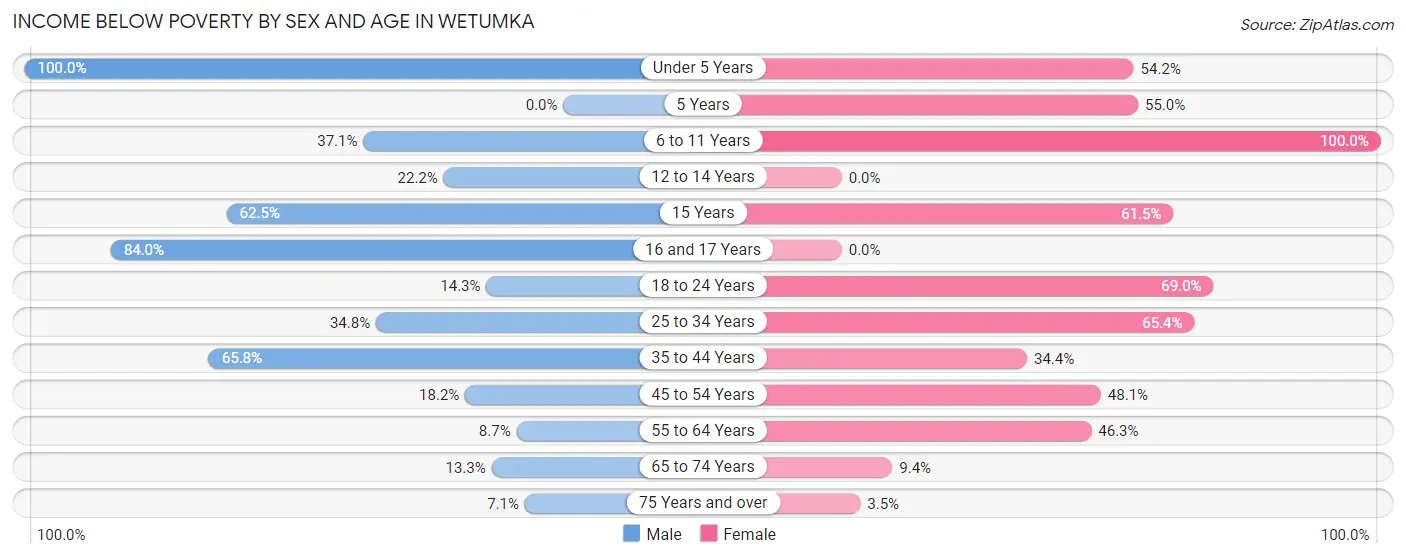
| Age Bracket | Male | Female |
| Under 5 Years | 12 (100.0%) | 26 (54.2%) |
| 5 Years | 0 (0.0%) | 11 (55.0%) |
| 6 to 11 Years | 13 (37.1%) | 16 (100.0%) |
| 12 to 14 Years | 4 (22.2%) | 0 (0.0%) |
| 15 Years | 5 (62.5%) | 16 (61.5%) |
| 16 and 17 Years | 21 (84.0%) | 0 (0.0%) |
| 18 to 24 Years | 21 (14.3%) | 20 (69.0%) |
| 25 to 34 Years | 24 (34.8%) | 70 (65.4%) |
| 35 to 44 Years | 25 (65.8%) | 33 (34.4%) |
| 45 to 54 Years | 37 (18.2%) | 38 (48.1%) |
| 55 to 64 Years | 6 (8.7%) | 44 (46.3%) |
| 65 to 74 Years | 6 (13.3%) | 9 (9.4%) |
| 75 Years and over | 4 (7.1%) | 3 (3.5%) |
| Total | 178 (24.5%) | 286 (39.5%) |
Income Above Poverty by Sex and Age in Wetumka
According to the poverty statistics in Wetumka, males aged 75 years and over and females aged 12 to 14 years are the age groups that are most secure financially, with 92.9% of males and 100.0% of females in these age groups living above the poverty line.
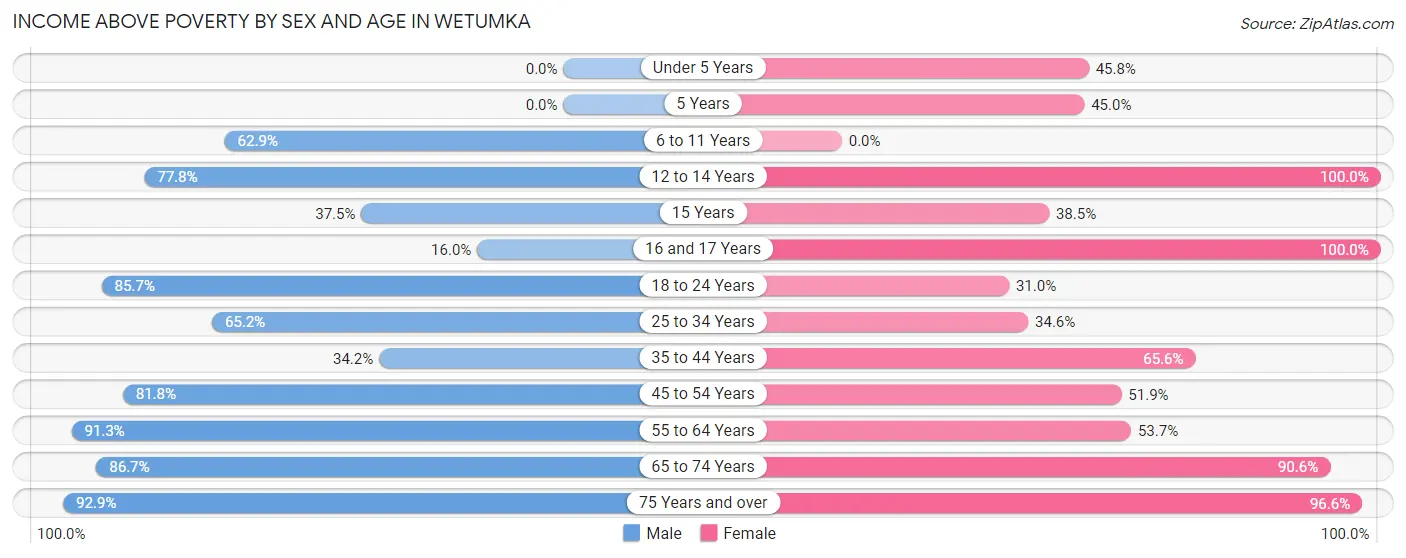
| Age Bracket | Male | Female |
| Under 5 Years | 0 (0.0%) | 22 (45.8%) |
| 5 Years | 0 (0.0%) | 9 (45.0%) |
| 6 to 11 Years | 22 (62.9%) | 0 (0.0%) |
| 12 to 14 Years | 14 (77.8%) | 20 (100.0%) |
| 15 Years | 3 (37.5%) | 10 (38.5%) |
| 16 and 17 Years | 4 (16.0%) | 6 (100.0%) |
| 18 to 24 Years | 126 (85.7%) | 9 (31.0%) |
| 25 to 34 Years | 45 (65.2%) | 37 (34.6%) |
| 35 to 44 Years | 13 (34.2%) | 63 (65.6%) |
| 45 to 54 Years | 166 (81.8%) | 41 (51.9%) |
| 55 to 64 Years | 63 (91.3%) | 51 (53.7%) |
| 65 to 74 Years | 39 (86.7%) | 87 (90.6%) |
| 75 Years and over | 52 (92.9%) | 84 (96.6%) |
| Total | 547 (75.4%) | 439 (60.6%) |
Income Below Poverty Among Married-Couple Families in Wetumka
The poverty statistics for married-couple families in Wetumka show that 12.7% or 16 of the total 126 families live below the poverty line. Families with 3 or 4 children have the highest poverty rate of 100.0%, comprising of 2 families. On the other hand, families with no children have the lowest poverty rate of 9.3%, which includes 7 families.
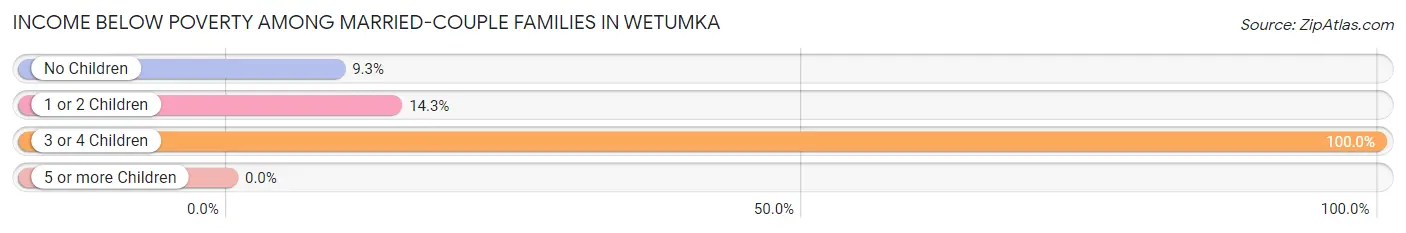
| Children | Above Poverty | Below Poverty |
| No Children | 68 (90.7%) | 7 (9.3%) |
| 1 or 2 Children | 42 (85.7%) | 7 (14.3%) |
| 3 or 4 Children | 0 (0.0%) | 2 (100.0%) |
| 5 or more Children | 0 (0.0%) | 0 (0.0%) |
| Total | 110 (87.3%) | 16 (12.7%) |
Income Below Poverty Among Single-Parent Households in Wetumka
According to the poverty data in Wetumka, 20.5% or 8 single-father households and 46.2% or 30 single-mother households are living below the poverty line. Among single-father households, those with 5 or more children have the highest poverty rate, with 3 households (100.0%) experiencing poverty. Likewise, among single-mother households, those with 1 or 2 children have the highest poverty rate, with 8 households (66.7%) falling below the poverty line.
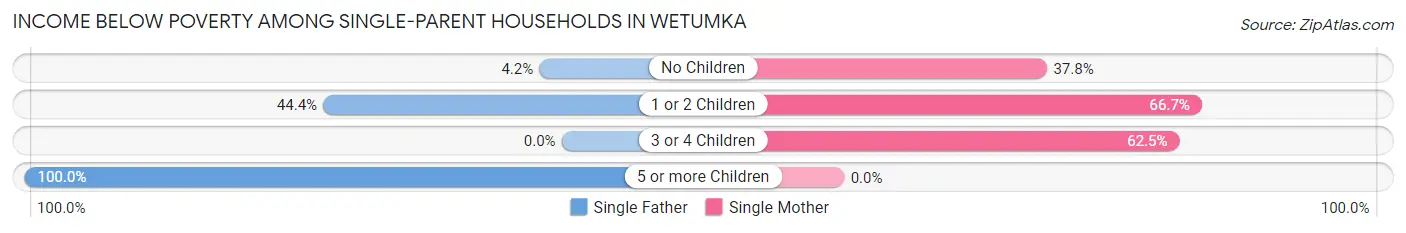
| Children | Single Father | Single Mother |
| No Children | 1 (4.2%) | 17 (37.8%) |
| 1 or 2 Children | 4 (44.4%) | 8 (66.7%) |
| 3 or 4 Children | 0 (0.0%) | 5 (62.5%) |
| 5 or more Children | 3 (100.0%) | 0 (0.0%) |
| Total | 8 (20.5%) | 30 (46.2%) |
Income Below Poverty Among Married-Couple vs Single-Parent Households in Wetumka
The poverty data for Wetumka shows that 16 of the married-couple family households (12.7%) and 38 of the single-parent households (36.5%) are living below the poverty level. Within the married-couple family households, those with 3 or 4 children have the highest poverty rate, with 2 households (100.0%) falling below the poverty line. Among the single-parent households, those with 5 or more children have the highest poverty rate, with 3 household (100.0%) living below poverty.
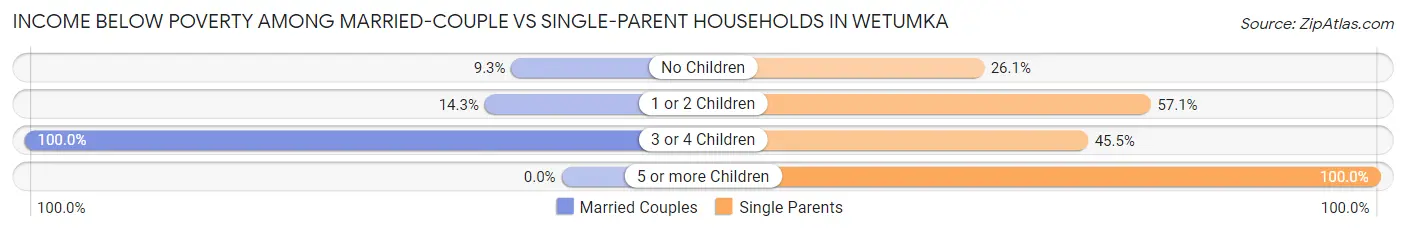
| Children | Married-Couple Families | Single-Parent Households |
| No Children | 7 (9.3%) | 18 (26.1%) |
| 1 or 2 Children | 7 (14.3%) | 12 (57.1%) |
| 3 or 4 Children | 2 (100.0%) | 5 (45.5%) |
| 5 or more Children | 0 (0.0%) | 3 (100.0%) |
| Total | 16 (12.7%) | 38 (36.5%) |
Race in Wetumka
The most populous races in Wetumka are Native / Alaskan (569 | 38.0%), White / Caucasian (548 | 36.6%), and Some other Race (242 | 16.2%).
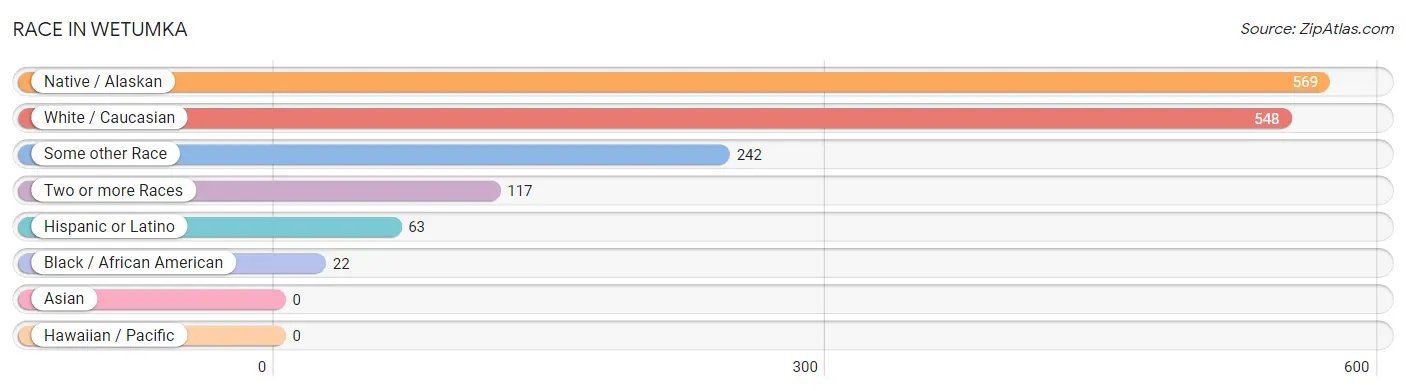
| Race | # Population | % Population |
| Asian | 0 | 0.0% |
| Black / African American | 22 | 1.5% |
| Hawaiian / Pacific | 0 | 0.0% |
| Hispanic or Latino | 63 | 4.2% |
| Native / Alaskan | 569 | 38.0% |
| White / Caucasian | 548 | 36.6% |
| Two or more Races | 117 | 7.8% |
| Some other Race | 242 | 16.2% |
| Total | 1,498 | 100.0% |
Ancestry in Wetumka
The most populous ancestries reported in Wetumka are Creek (573 | 38.3%), American (325 | 21.7%), Irish (256 | 17.1%), English (190 | 12.7%), and German (153 | 10.2%), together accounting for 99.9% of all Wetumka residents.
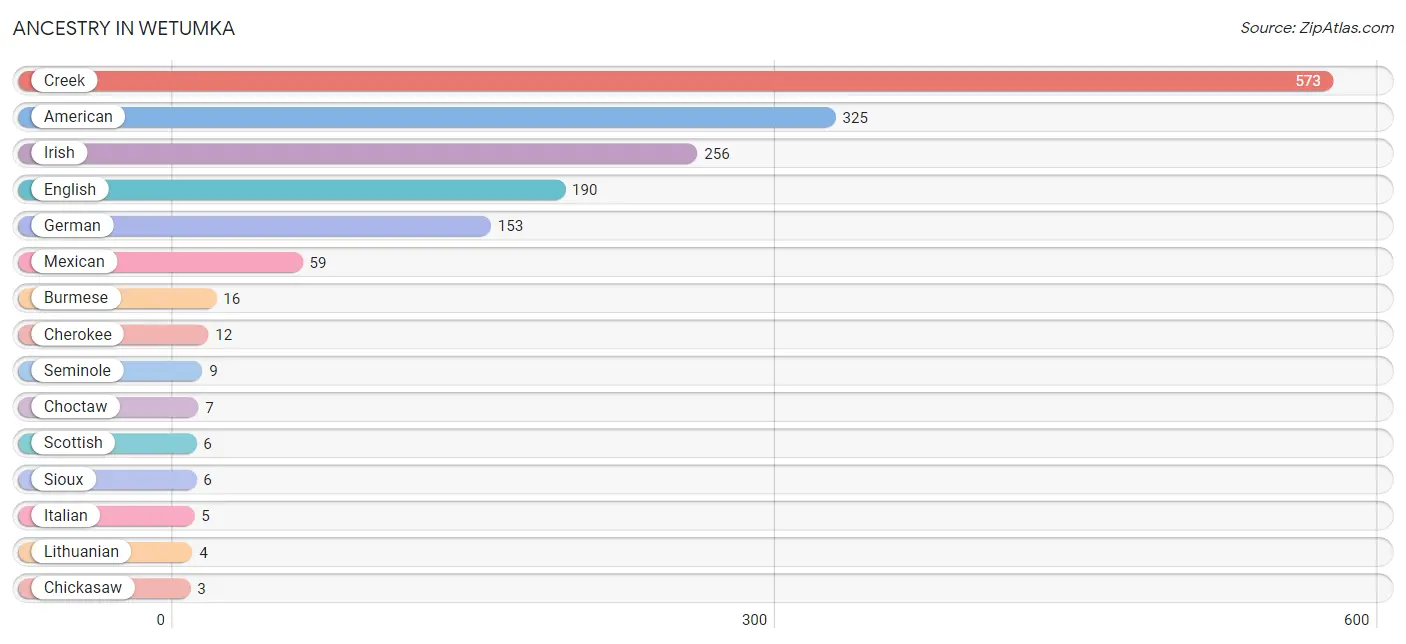
| Ancestry | # Population | % Population |
| American | 325 | 21.7% |
| Burmese | 16 | 1.1% |
| Cherokee | 12 | 0.8% |
| Chickasaw | 3 | 0.2% |
| Choctaw | 7 | 0.5% |
| Creek | 573 | 38.3% |
| Eastern European | 2 | 0.1% |
| English | 190 | 12.7% |
| German | 153 | 10.2% |
| Irish | 256 | 17.1% |
| Italian | 5 | 0.3% |
| Lithuanian | 4 | 0.3% |
| Mexican | 59 | 3.9% |
| Navajo | 2 | 0.1% |
| Polish | 1 | 0.1% |
| Portuguese | 2 | 0.1% |
| Scottish | 6 | 0.4% |
| Seminole | 9 | 0.6% |
| Sioux | 6 | 0.4% |
| Spanish | 2 | 0.1% | View All 20 Rows |
Immigrants in Wetumka

| Immigration Origin | # Population | % Population | View All 0 Rows |
Sex and Age in Wetumka
Sex and Age in Wetumka
The most populous age groups in Wetumka are 15 to 19 Years (154 | 20.7%) for men and 40 to 44 Years (79 | 10.5%) for women.
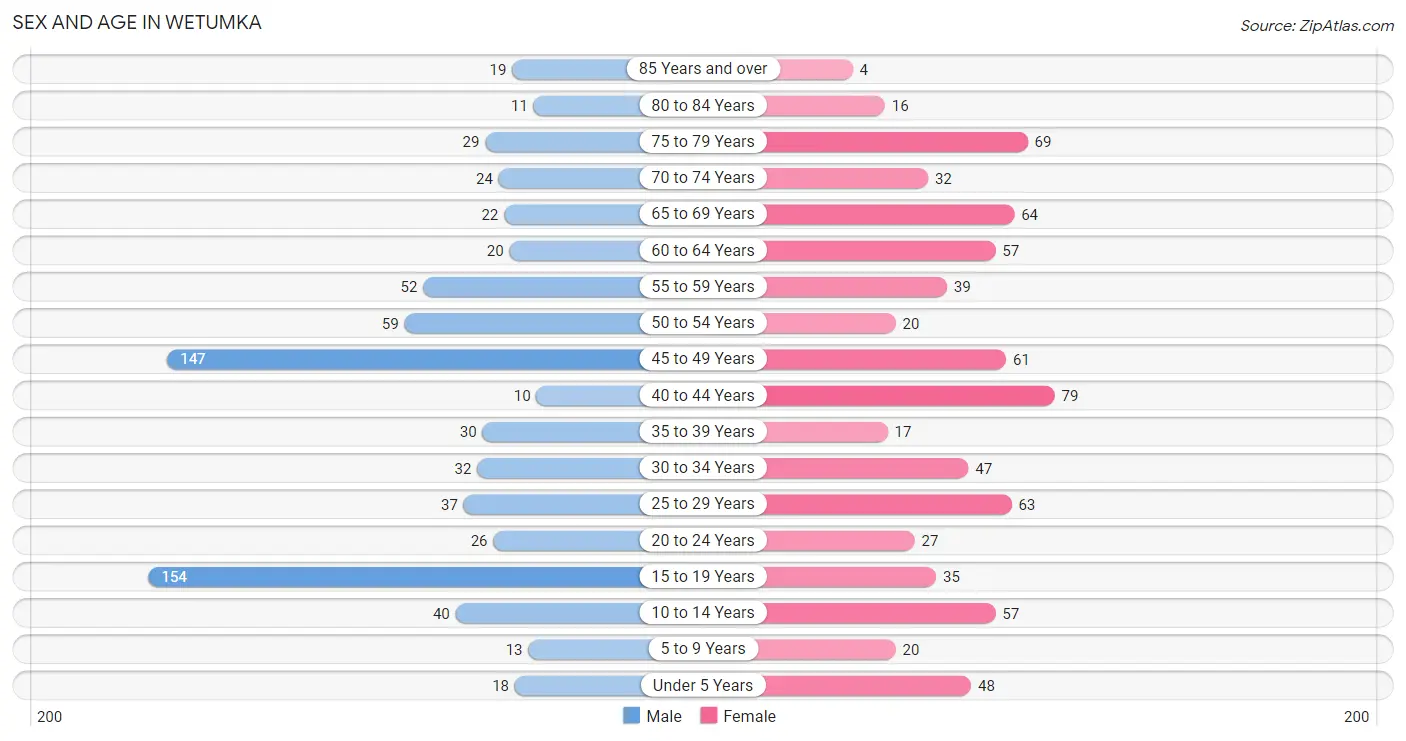
| Age Bracket | Male | Female |
| Under 5 Years | 18 (2.4%) | 48 (6.4%) |
| 5 to 9 Years | 13 (1.8%) | 20 (2.6%) |
| 10 to 14 Years | 40 (5.4%) | 57 (7.5%) |
| 15 to 19 Years | 154 (20.7%) | 35 (4.6%) |
| 20 to 24 Years | 26 (3.5%) | 27 (3.6%) |
| 25 to 29 Years | 37 (5.0%) | 63 (8.3%) |
| 30 to 34 Years | 32 (4.3%) | 47 (6.2%) |
| 35 to 39 Years | 30 (4.0%) | 17 (2.2%) |
| 40 to 44 Years | 10 (1.3%) | 79 (10.5%) |
| 45 to 49 Years | 147 (19.8%) | 61 (8.1%) |
| 50 to 54 Years | 59 (7.9%) | 20 (2.6%) |
| 55 to 59 Years | 52 (7.0%) | 39 (5.2%) |
| 60 to 64 Years | 20 (2.7%) | 57 (7.5%) |
| 65 to 69 Years | 22 (3.0%) | 64 (8.5%) |
| 70 to 74 Years | 24 (3.2%) | 32 (4.2%) |
| 75 to 79 Years | 29 (3.9%) | 69 (9.1%) |
| 80 to 84 Years | 11 (1.5%) | 16 (2.1%) |
| 85 Years and over | 19 (2.6%) | 4 (0.5%) |
| Total | 743 (100.0%) | 755 (100.0%) |
Families and Households in Wetumka
Median Family Size in Wetumka
The median family size in Wetumka is 4.63 persons per family, with single male/father families (39 | 17.0%) accounting for the largest median family size of 6.62 persons per family. On the other hand, single female/mother families (65 | 28.3%) represent the smallest median family size with 3.68 persons per family.
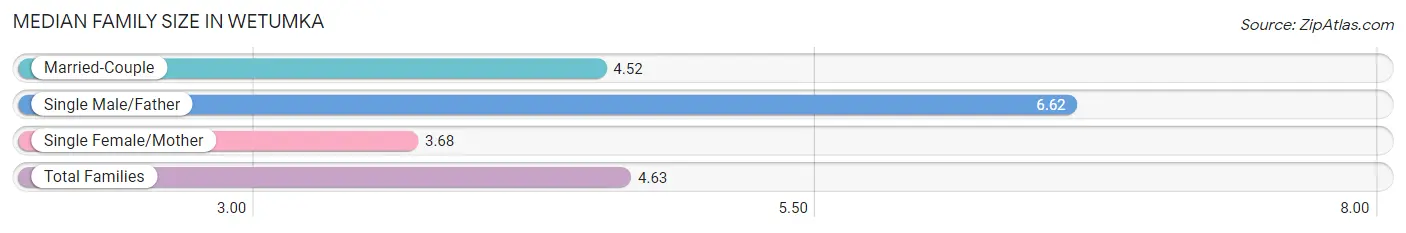
| Family Type | # Families | Family Size |
| Married-Couple | 126 (54.8%) | 4.52 |
| Single Male/Father | 39 (17.0%) | 6.62 |
| Single Female/Mother | 65 (28.3%) | 3.68 |
| Total Families | 230 (100.0%) | 4.63 |
Median Household Size in Wetumka
The median household size in Wetumka is 2.96 persons per household, with single male/father households (39 | 8.3%) accounting for the largest median household size of 6.69 persons per household. non-family households (238 | 50.8%) represent the smallest median household size with 1.11 persons per household.

| Household Type | # Households | Household Size |
| Married-Couple | 126 (26.9%) | 4.86 |
| Single Male/Father | 39 (8.3%) | 6.69 |
| Single Female/Mother | 65 (13.9%) | 3.82 |
| Non-family | 238 (50.8%) | 1.11 |
| Total Households | 468 (100.0%) | 2.96 |
Household Size by Marriage Status in Wetumka
Out of a total of 468 households in Wetumka, 230 (49.1%) are family households, while 238 (50.8%) are nonfamily households. The most numerous type of family households are 2-person households, comprising 124, and the most common type of nonfamily households are 1-person households, comprising 224.
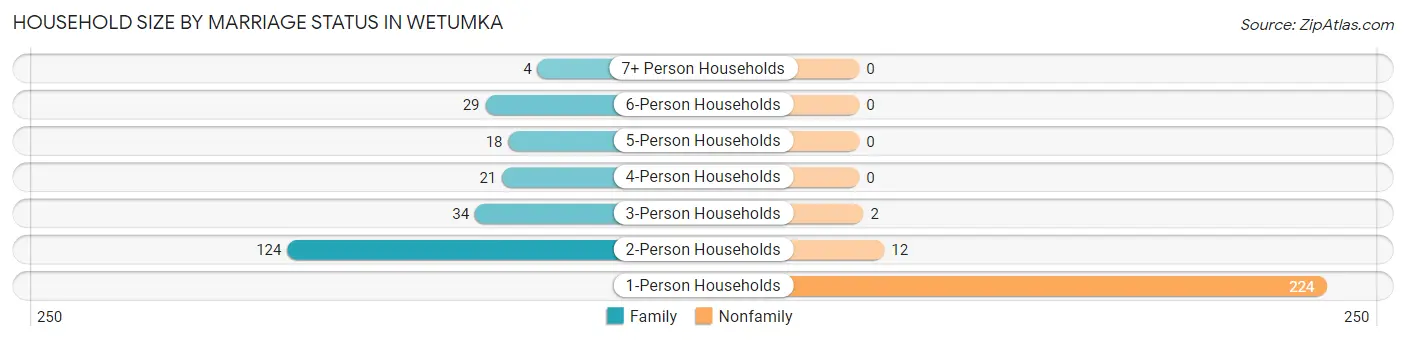
| Household Size | Family Households | Nonfamily Households |
| 1-Person Households | - | 224 (47.9%) |
| 2-Person Households | 124 (26.5%) | 12 (2.6%) |
| 3-Person Households | 34 (7.3%) | 2 (0.4%) |
| 4-Person Households | 21 (4.5%) | 0 (0.0%) |
| 5-Person Households | 18 (3.8%) | 0 (0.0%) |
| 6-Person Households | 29 (6.2%) | 0 (0.0%) |
| 7+ Person Households | 4 (0.9%) | 0 (0.0%) |
| Total | 230 (49.1%) | 238 (50.8%) |
Female Fertility in Wetumka
Fertility by Age in Wetumka
Average fertility rate in Wetumka is 140.0 births per 1,000 women. Women in the age bracket of 20 to 34 years have the highest fertility rate with 314.0 births per 1,000 women. Women in the age bracket of 20 to 34 years acount for 91.5% of all women with births.
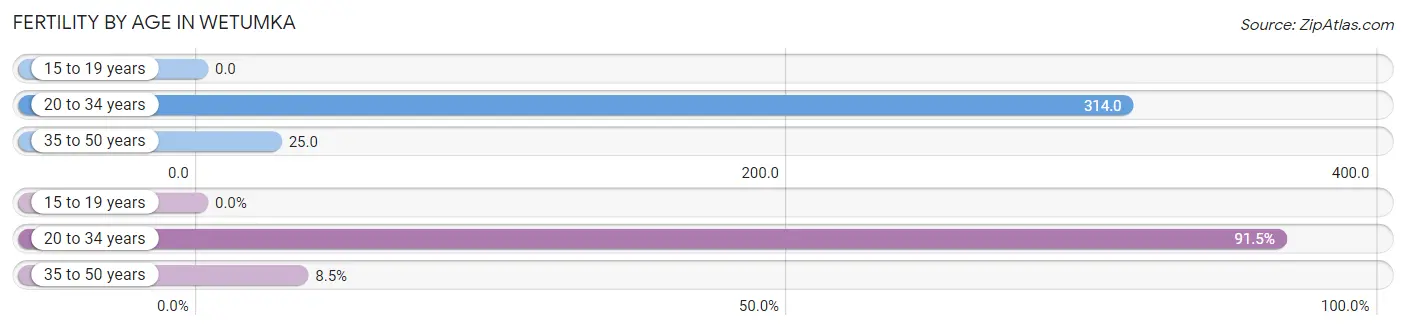
| Age Bracket | Women with Births | Births / 1,000 Women |
| 15 to 19 years | 0 (0.0%) | 0.0 |
| 20 to 34 years | 43 (91.5%) | 314.0 |
| 35 to 50 years | 4 (8.5%) | 25.0 |
| Total | 47 (100.0%) | 140.0 |
Fertility by Age by Marriage Status in Wetumka
17.0% of women with births (47) in Wetumka are married. The highest percentage of unmarried women with births falls into 20 to 34 years age bracket with 90.7% of them unmarried at the time of birth, while the lowest percentage of unmarried women with births belong to 35 to 50 years age bracket with 0.0% of them unmarried.
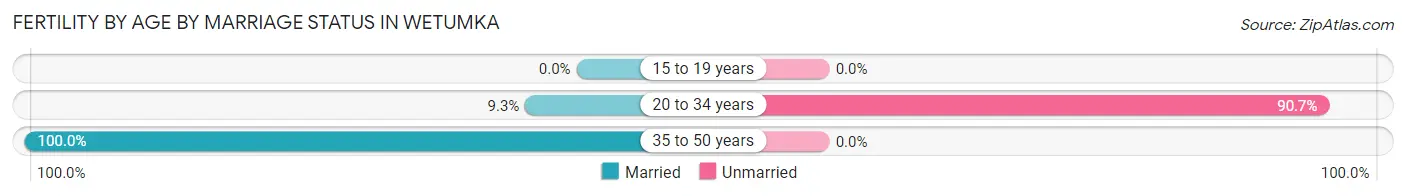
| Age Bracket | Married | Unmarried |
| 15 to 19 years | 0 (0.0%) | 0 (0.0%) |
| 20 to 34 years | 4 (9.3%) | 39 (90.7%) |
| 35 to 50 years | 4 (100.0%) | 0 (0.0%) |
| Total | 8 (17.0%) | 39 (83.0%) |
Fertility by Education in Wetumka
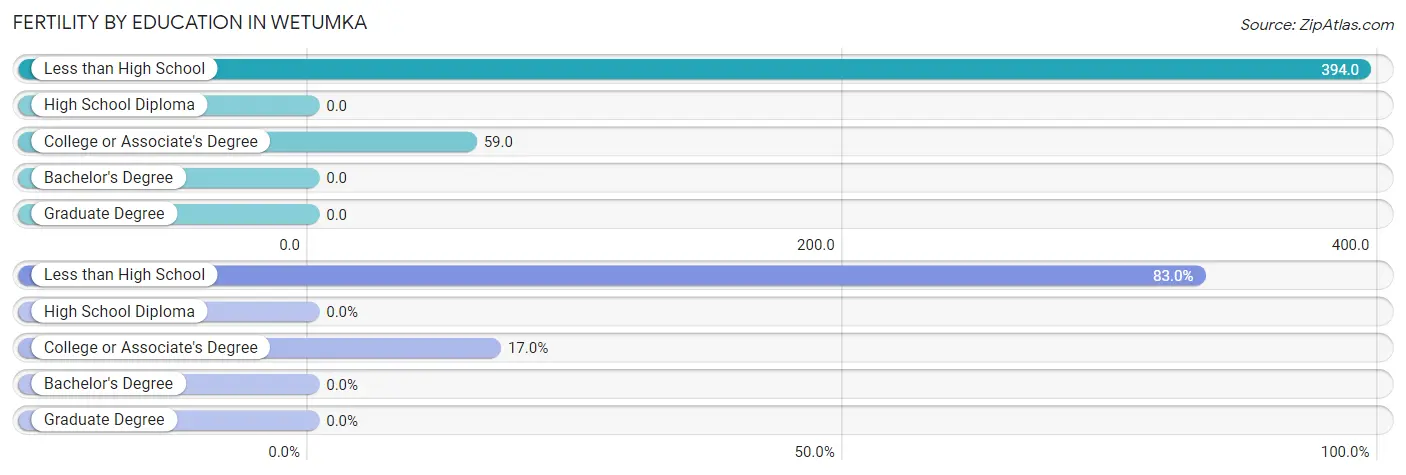
| Educational Attainment | Women with Births | Births / 1,000 Women |
| Less than High School | 39 (83.0%) | 394.0 |
| High School Diploma | 0 (0.0%) | 0.0 |
| College or Associate's Degree | 8 (17.0%) | 59.0 |
| Bachelor's Degree | 0 (0.0%) | 0.0 |
| Graduate Degree | 0 (0.0%) | 0.0 |
| Total | 47 (100.0%) | 140.0 |
Fertility by Education by Marriage Status in Wetumka
83.0% of women with births in Wetumka are unmarried. Women with the educational attainment of college or associate's degree are most likely to be married with 100.0% of them married at childbirth, while women with the educational attainment of less than high school are least likely to be married with 100.0% of them unmarried at childbirth.
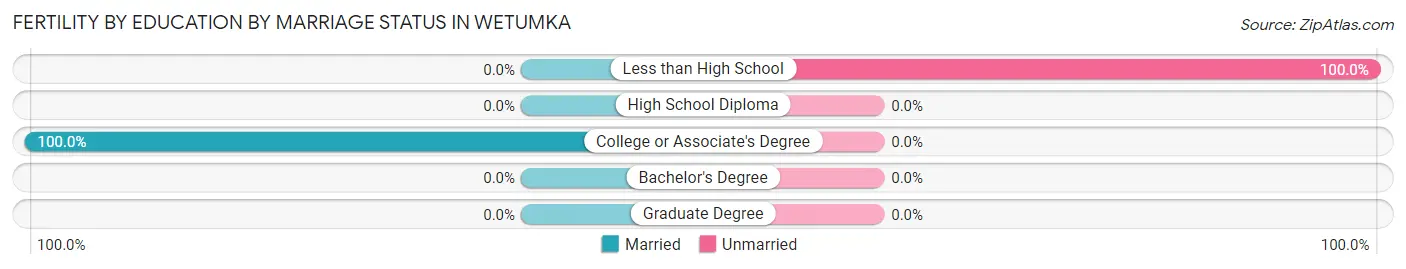
| Educational Attainment | Married | Unmarried |
| Less than High School | 0 (0.0%) | 39 (100.0%) |
| High School Diploma | 0 (0.0%) | 0 (0.0%) |
| College or Associate's Degree | 8 (100.0%) | 0 (0.0%) |
| Bachelor's Degree | 0 (0.0%) | 0 (0.0%) |
| Graduate Degree | 0 (0.0%) | 0 (0.0%) |
| Total | 8 (17.0%) | 39 (83.0%) |
Employment Characteristics in Wetumka
Employment by Class of Employer in Wetumka
Among the 473 employed individuals in Wetumka, private company employees (311 | 65.7%), federal government employees (51 | 10.8%), and not-for-profit organizations (49 | 10.4%) make up the most common classes of employment.
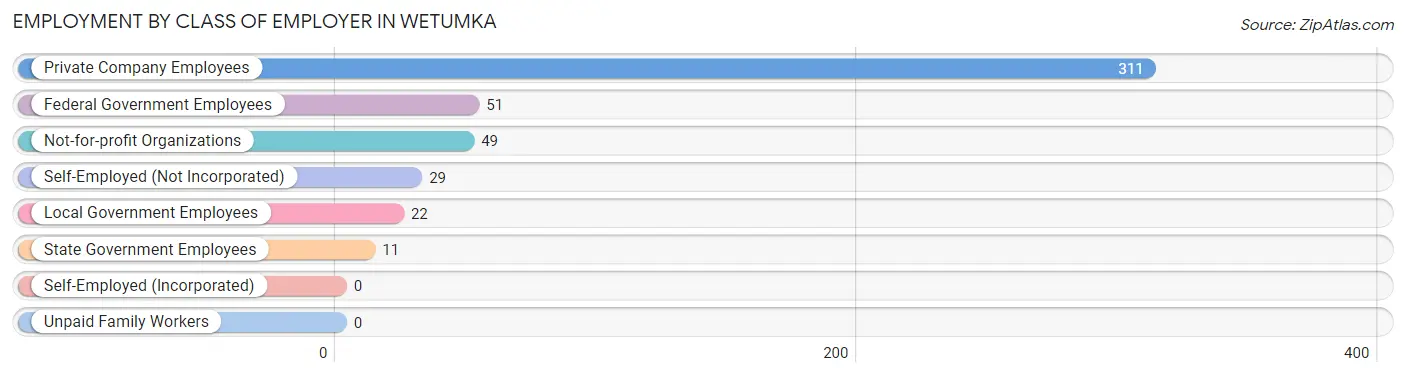
| Employer Class | # Employees | % Employees |
| Private Company Employees | 311 | 65.7% |
| Self-Employed (Incorporated) | 0 | 0.0% |
| Self-Employed (Not Incorporated) | 29 | 6.1% |
| Not-for-profit Organizations | 49 | 10.4% |
| Local Government Employees | 22 | 4.6% |
| State Government Employees | 11 | 2.3% |
| Federal Government Employees | 51 | 10.8% |
| Unpaid Family Workers | 0 | 0.0% |
| Total | 473 | 100.0% |
Employment Status by Age in Wetumka
According to the labor force statistics for Wetumka, out of the total population over 16 years of age (1,268), 39.5% or 501 individuals are in the labor force, with 5.6% or 28 of them unemployed. The age group with the highest labor force participation rate is 30 to 34 years, with 92.4% or 73 individuals in the labor force. Within the labor force, the 20 to 24 years age range has the highest percentage of unemployed individuals, with 27.8% or 5 of them being unemployed.
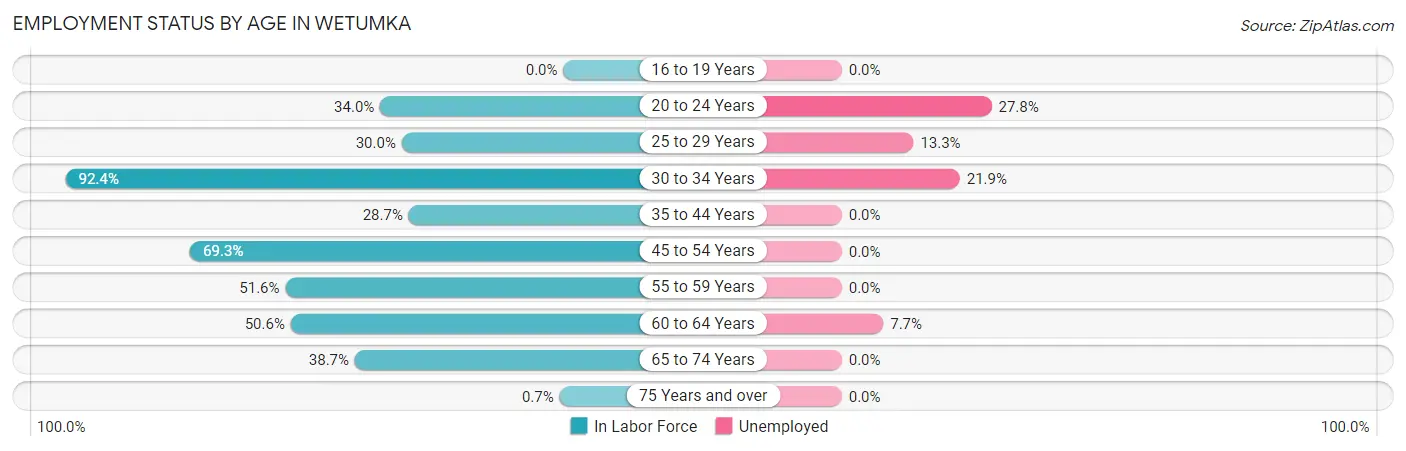
| Age Bracket | In Labor Force | Unemployed |
| 16 to 19 Years | 0 (0.0%) | 0 (0.0%) |
| 20 to 24 Years | 18 (34.0%) | 5 (27.8%) |
| 25 to 29 Years | 30 (30.0%) | 4 (13.3%) |
| 30 to 34 Years | 73 (92.4%) | 16 (21.9%) |
| 35 to 44 Years | 39 (28.7%) | 0 (0.0%) |
| 45 to 54 Years | 199 (69.3%) | 0 (0.0%) |
| 55 to 59 Years | 47 (51.6%) | 0 (0.0%) |
| 60 to 64 Years | 39 (50.6%) | 3 (7.7%) |
| 65 to 74 Years | 55 (38.7%) | 0 (0.0%) |
| 75 Years and over | 1 (0.7%) | 0 (0.0%) |
| Total | 501 (39.5%) | 28 (5.6%) |
Employment Status by Educational Attainment in Wetumka
According to labor force statistics for Wetumka, 55.5% of individuals (427) out of the total population between 25 and 64 years of age (770) are in the labor force, with 5.4% or 23 of them being unemployed. The group with the highest labor force participation rate are those with the educational attainment of bachelor's degree or higher, with 76.6% or 36 individuals in the labor force. Within the labor force, individuals with high school diploma education have the highest percentage of unemployment, with 9.7% or 23 of them being unemployed.
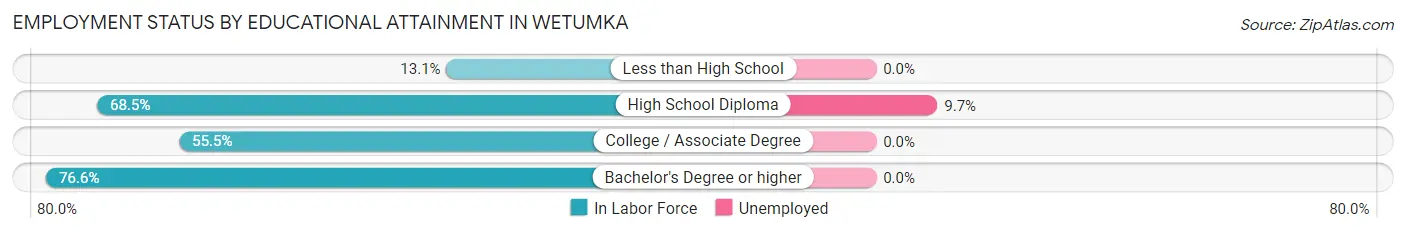
| Educational Attainment | In Labor Force | Unemployed |
| Less than High School | 17 (13.1%) | 0 (0.0%) |
| High School Diploma | 237 (68.5%) | 34 (9.7%) |
| College / Associate Degree | 137 (55.5%) | 0 (0.0%) |
| Bachelor's Degree or higher | 36 (76.6%) | 0 (0.0%) |
| Total | 427 (55.5%) | 42 (5.4%) |
Employment Occupations by Sex in Wetumka
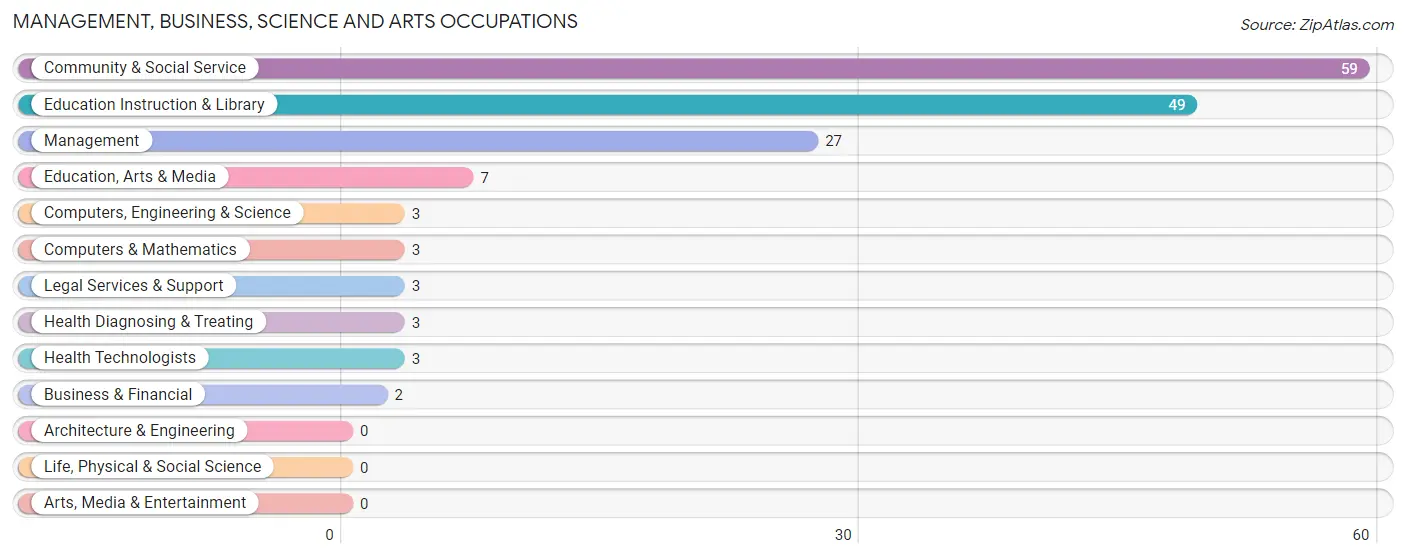
Management, Business, Science and Arts Occupations
The most common Management, Business, Science and Arts occupations in Wetumka are Community & Social Service (59 | 12.5%), Education Instruction & Library (49 | 10.4%), Management (27 | 5.7%), Education, Arts & Media (7 | 1.5%), and Computers, Engineering & Science (3 | 0.6%).
Management, Business, Science and Arts Occupations by Sex
Within the Management, Business, Science and Arts occupations in Wetumka, the most male-oriented occupations are Business & Financial (100.0%), Computers, Engineering & Science (100.0%), and Computers & Mathematics (100.0%), while the most female-oriented occupations are Legal Services & Support (100.0%), Education Instruction & Library (100.0%), and Health Diagnosing & Treating (100.0%).
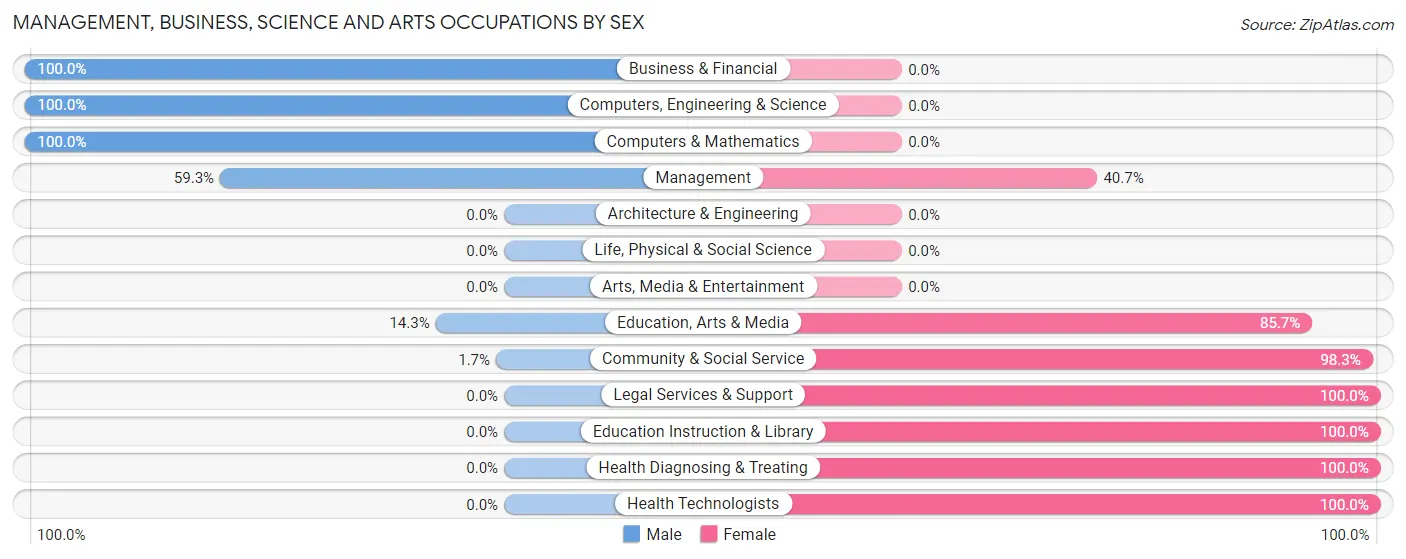
| Occupation | Male | Female |
| Management | 16 (59.3%) | 11 (40.7%) |
| Business & Financial | 2 (100.0%) | 0 (0.0%) |
| Computers, Engineering & Science | 3 (100.0%) | 0 (0.0%) |
| Computers & Mathematics | 3 (100.0%) | 0 (0.0%) |
| Architecture & Engineering | 0 (0.0%) | 0 (0.0%) |
| Life, Physical & Social Science | 0 (0.0%) | 0 (0.0%) |
| Community & Social Service | 1 (1.7%) | 58 (98.3%) |
| Education, Arts & Media | 1 (14.3%) | 6 (85.7%) |
| Legal Services & Support | 0 (0.0%) | 3 (100.0%) |
| Education Instruction & Library | 0 (0.0%) | 49 (100.0%) |
| Arts, Media & Entertainment | 0 (0.0%) | 0 (0.0%) |
| Health Diagnosing & Treating | 0 (0.0%) | 3 (100.0%) |
| Health Technologists | 0 (0.0%) | 3 (100.0%) |
| Total (Category) | 22 (23.4%) | 72 (76.6%) |
| Total (Overall) | 249 (52.6%) | 224 (47.4%) |
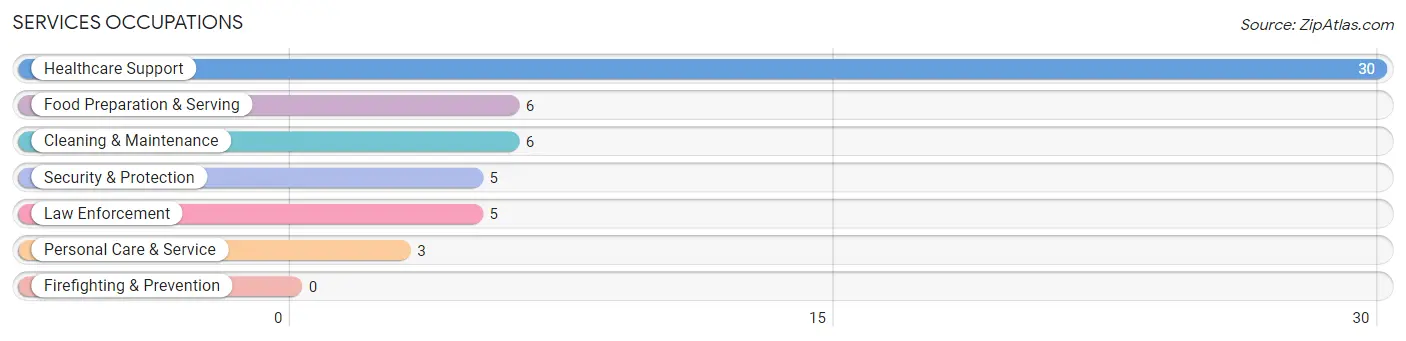
Services Occupations
The most common Services occupations in Wetumka are Healthcare Support (30 | 6.3%), Food Preparation & Serving (6 | 1.3%), Cleaning & Maintenance (6 | 1.3%), Security & Protection (5 | 1.1%), and Law Enforcement (5 | 1.1%).
Services Occupations by Sex
Within the Services occupations in Wetumka, the most male-oriented occupations are Security & Protection (100.0%), Law Enforcement (100.0%), and Cleaning & Maintenance (33.3%), while the most female-oriented occupations are Food Preparation & Serving (100.0%), Personal Care & Service (100.0%), and Healthcare Support (90.0%).
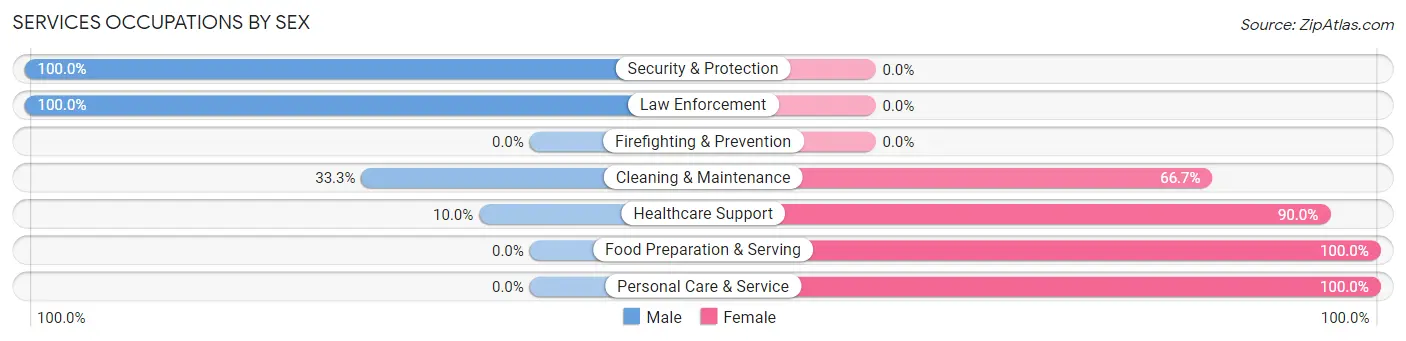
| Occupation | Male | Female |
| Healthcare Support | 3 (10.0%) | 27 (90.0%) |
| Security & Protection | 5 (100.0%) | 0 (0.0%) |
| Firefighting & Prevention | 0 (0.0%) | 0 (0.0%) |
| Law Enforcement | 5 (100.0%) | 0 (0.0%) |
| Food Preparation & Serving | 0 (0.0%) | 6 (100.0%) |
| Cleaning & Maintenance | 2 (33.3%) | 4 (66.7%) |
| Personal Care & Service | 0 (0.0%) | 3 (100.0%) |
| Total (Category) | 10 (20.0%) | 40 (80.0%) |
| Total (Overall) | 249 (52.6%) | 224 (47.4%) |
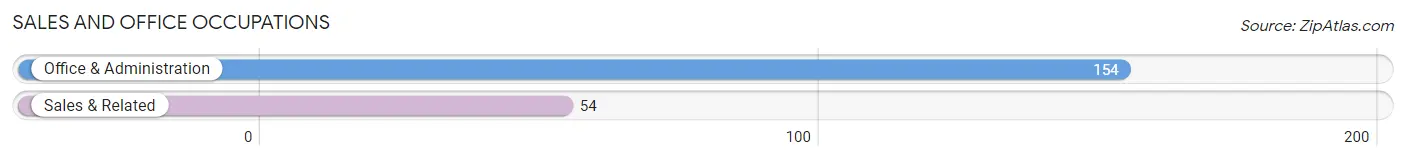
Sales and Office Occupations
The most common Sales and Office occupations in Wetumka are Office & Administration (154 | 32.6%), and Sales & Related (54 | 11.4%).
Sales and Office Occupations by Sex
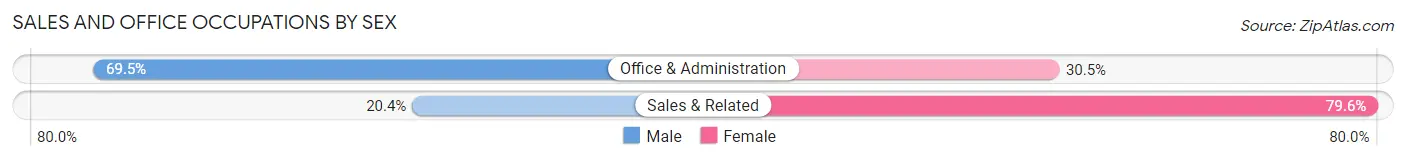
| Occupation | Male | Female |
| Sales & Related | 11 (20.4%) | 43 (79.6%) |
| Office & Administration | 107 (69.5%) | 47 (30.5%) |
| Total (Category) | 118 (56.7%) | 90 (43.3%) |
| Total (Overall) | 249 (52.6%) | 224 (47.4%) |
Natural Resources, Construction and Maintenance Occupations
The most common Natural Resources, Construction and Maintenance occupations in Wetumka are Construction & Extraction (32 | 6.8%), Installation, Maintenance & Repair (15 | 3.2%), and Farming, Fishing & Forestry (12 | 2.5%).
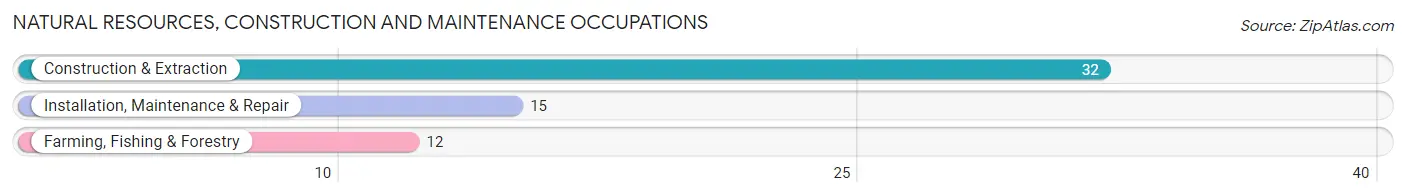
Natural Resources, Construction and Maintenance Occupations by Sex
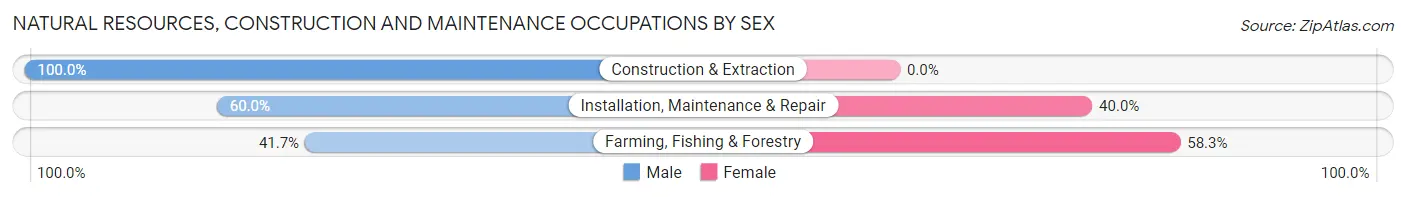
| Occupation | Male | Female |
| Farming, Fishing & Forestry | 5 (41.7%) | 7 (58.3%) |
| Construction & Extraction | 32 (100.0%) | 0 (0.0%) |
| Installation, Maintenance & Repair | 9 (60.0%) | 6 (40.0%) |
| Total (Category) | 46 (78.0%) | 13 (22.0%) |
| Total (Overall) | 249 (52.6%) | 224 (47.4%) |
Production, Transportation and Moving Occupations
The most common Production, Transportation and Moving occupations in Wetumka are Transportation (41 | 8.7%), Material Moving (20 | 4.2%), and Production (1 | 0.2%).
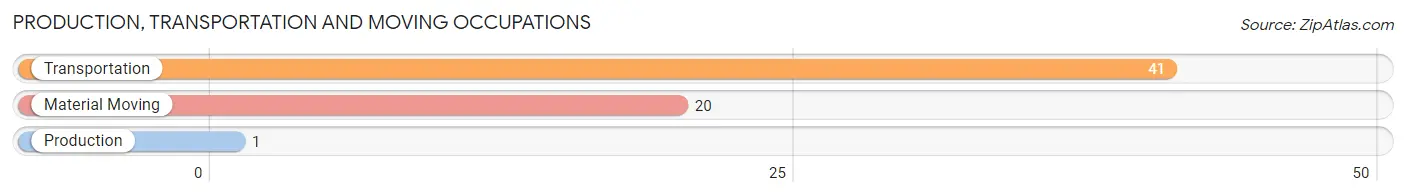
Production, Transportation and Moving Occupations by Sex
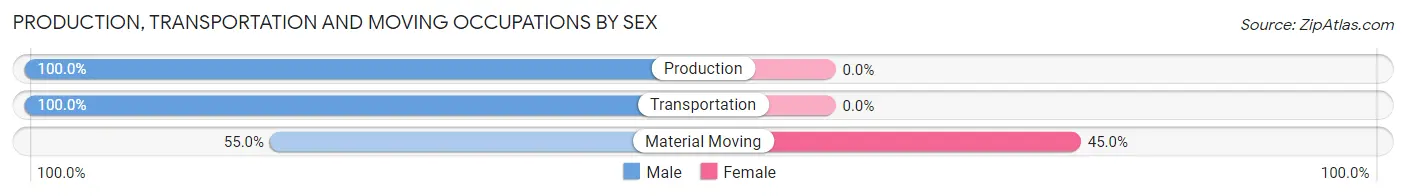
| Occupation | Male | Female |
| Production | 1 (100.0%) | 0 (0.0%) |
| Transportation | 41 (100.0%) | 0 (0.0%) |
| Material Moving | 11 (55.0%) | 9 (45.0%) |
| Total (Category) | 53 (85.5%) | 9 (14.5%) |
| Total (Overall) | 249 (52.6%) | 224 (47.4%) |
Employment Industries by Sex in Wetumka
Employment Industries in Wetumka
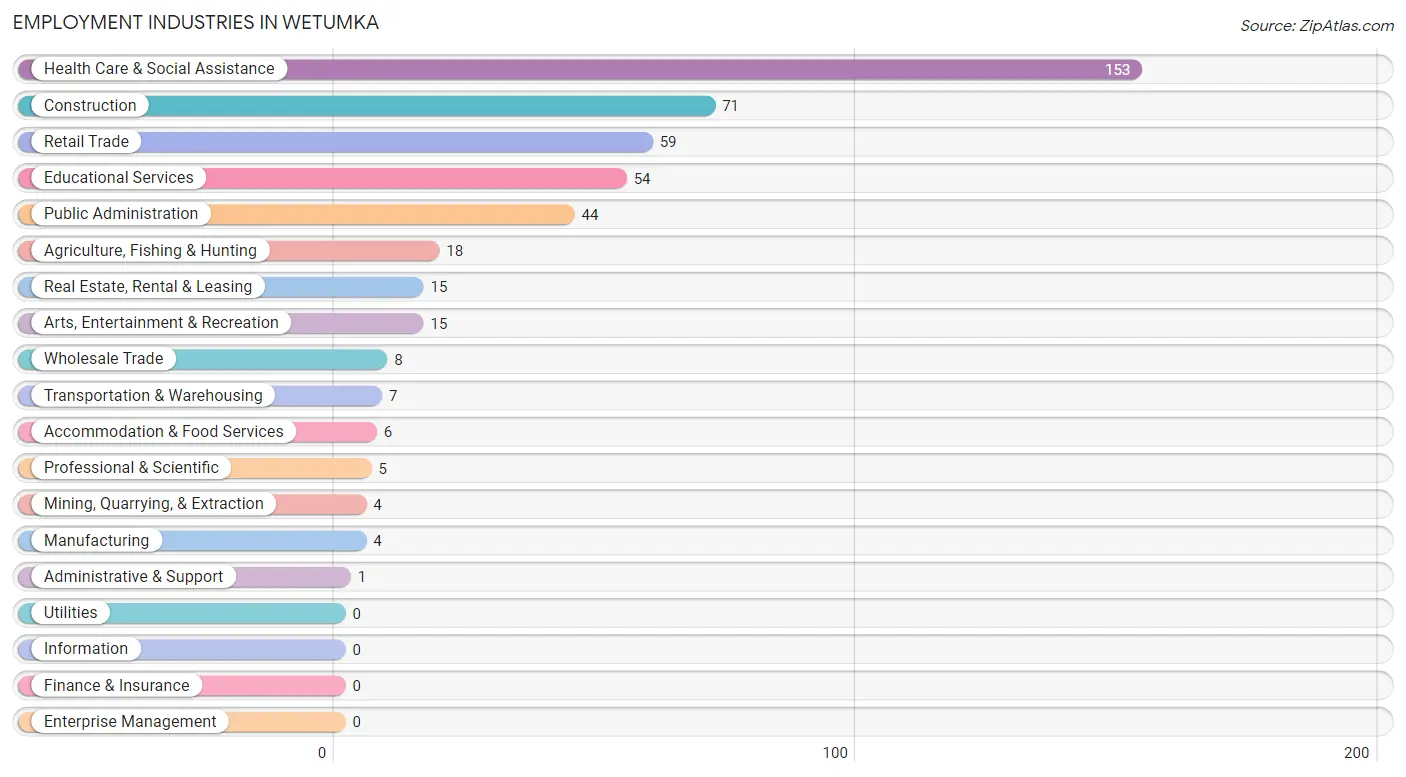
The major employment industries in Wetumka include Health Care & Social Assistance (153 | 32.4%), Construction (71 | 15.0%), Retail Trade (59 | 12.5%), Educational Services (54 | 11.4%), and Public Administration (44 | 9.3%).
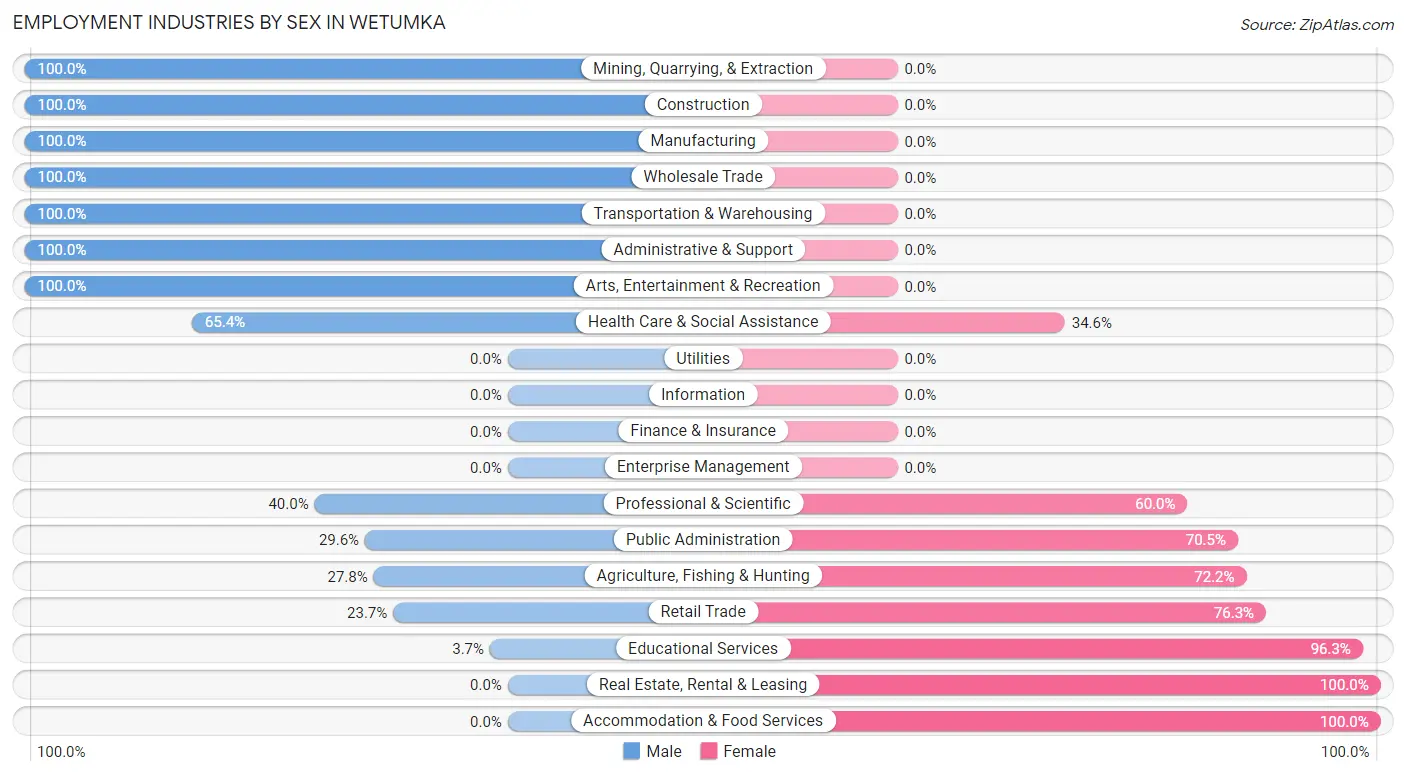
Employment Industries by Sex in Wetumka
The Wetumka industries that see more men than women are Mining, Quarrying, & Extraction (100.0%), Construction (100.0%), and Manufacturing (100.0%), whereas the industries that tend to have a higher number of women are Real Estate, Rental & Leasing (100.0%), Accommodation & Food Services (100.0%), and Educational Services (96.3%).
| Industry | Male | Female |
| Agriculture, Fishing & Hunting | 5 (27.8%) | 13 (72.2%) |
| Mining, Quarrying, & Extraction | 4 (100.0%) | 0 (0.0%) |
| Construction | 71 (100.0%) | 0 (0.0%) |
| Manufacturing | 4 (100.0%) | 0 (0.0%) |
| Wholesale Trade | 8 (100.0%) | 0 (0.0%) |
| Retail Trade | 14 (23.7%) | 45 (76.3%) |
| Transportation & Warehousing | 7 (100.0%) | 0 (0.0%) |
| Utilities | 0 (0.0%) | 0 (0.0%) |
| Information | 0 (0.0%) | 0 (0.0%) |
| Finance & Insurance | 0 (0.0%) | 0 (0.0%) |
| Real Estate, Rental & Leasing | 0 (0.0%) | 15 (100.0%) |
| Professional & Scientific | 2 (40.0%) | 3 (60.0%) |
| Enterprise Management | 0 (0.0%) | 0 (0.0%) |
| Administrative & Support | 1 (100.0%) | 0 (0.0%) |
| Educational Services | 2 (3.7%) | 52 (96.3%) |
| Health Care & Social Assistance | 100 (65.4%) | 53 (34.6%) |
| Arts, Entertainment & Recreation | 15 (100.0%) | 0 (0.0%) |
| Accommodation & Food Services | 0 (0.0%) | 6 (100.0%) |
| Public Administration | 13 (29.5%) | 31 (70.5%) |
| Total | 249 (52.6%) | 224 (47.4%) |
Education in Wetumka
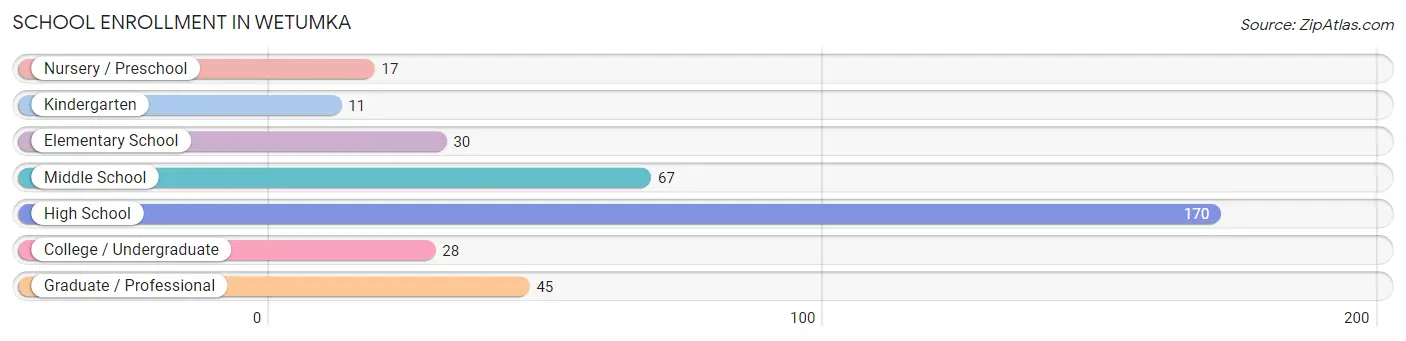
School Enrollment in Wetumka
The most common levels of schooling among the 368 students in Wetumka are high school (170 | 46.2%), middle school (67 | 18.2%), and graduate / professional (45 | 12.2%).
| School Level | # Students | % Students |
| Nursery / Preschool | 17 | 4.6% |
| Kindergarten | 11 | 3.0% |
| Elementary School | 30 | 8.2% |
| Middle School | 67 | 18.2% |
| High School | 170 | 46.2% |
| College / Undergraduate | 28 | 7.6% |
| Graduate / Professional | 45 | 12.2% |
| Total | 368 | 100.0% |
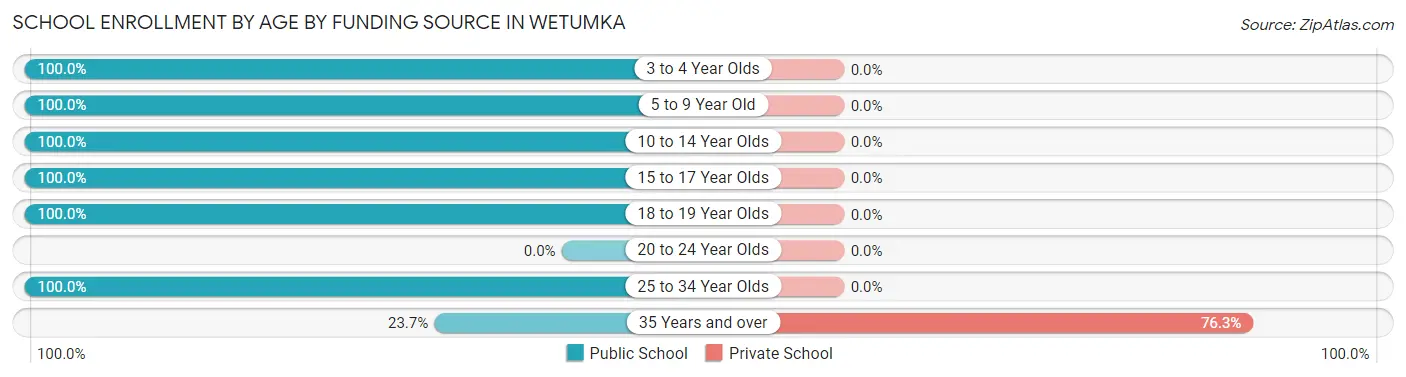
School Enrollment by Age by Funding Source in Wetumka
Out of a total of 368 students who are enrolled in schools in Wetumka, 45 (12.2%) attend a private institution, while the remaining 323 (87.8%) are enrolled in public schools. The age group of 35 years and over has the highest likelihood of being enrolled in private schools, with 45 (76.3% in the age bracket) enrolled. Conversely, the age group of 3 to 4 year olds has the lowest likelihood of being enrolled in a private school, with 8 (100.0% in the age bracket) attending a public institution.
| Age Bracket | Public School | Private School |
| 3 to 4 Year Olds | 8 (100.0%) | 0 (0.0%) |
| 5 to 9 Year Old | 33 (100.0%) | 0 (0.0%) |
| 10 to 14 Year Olds | 91 (100.0%) | 0 (0.0%) |
| 15 to 17 Year Olds | 59 (100.0%) | 0 (0.0%) |
| 18 to 19 Year Olds | 111 (100.0%) | 0 (0.0%) |
| 20 to 24 Year Olds | 0 (0.0%) | 0 (0.0%) |
| 25 to 34 Year Olds | 7 (100.0%) | 0 (0.0%) |
| 35 Years and over | 14 (23.7%) | 45 (76.3%) |
| Total | 323 (87.8%) | 45 (12.2%) |
Educational Attainment by Field of Study in Wetumka
Education (52 | 44.8%), business (25 | 21.5%), communications (11 | 9.5%), bio, nature & agricultural (10 | 8.6%), and psychology (6 | 5.2%) are the most common fields of study among 116 individuals in Wetumka who have obtained a bachelor's degree or higher.
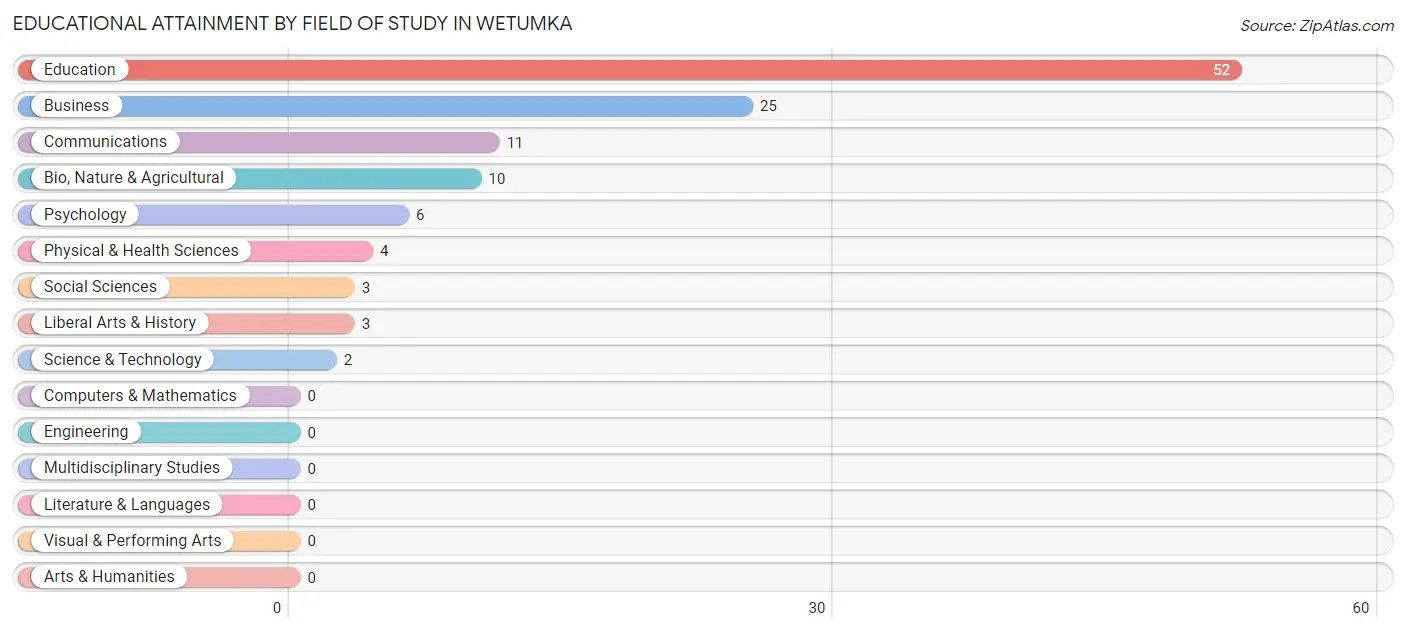
| Field of Study | # Graduates | % Graduates |
| Computers & Mathematics | 0 | 0.0% |
| Bio, Nature & Agricultural | 10 | 8.6% |
| Physical & Health Sciences | 4 | 3.5% |
| Psychology | 6 | 5.2% |
| Social Sciences | 3 | 2.6% |
| Engineering | 0 | 0.0% |
| Multidisciplinary Studies | 0 | 0.0% |
| Science & Technology | 2 | 1.7% |
| Business | 25 | 21.5% |
| Education | 52 | 44.8% |
| Literature & Languages | 0 | 0.0% |
| Liberal Arts & History | 3 | 2.6% |
| Visual & Performing Arts | 0 | 0.0% |
| Communications | 11 | 9.5% |
| Arts & Humanities | 0 | 0.0% |
| Total | 116 | 100.0% |
Transportation & Commute in Wetumka
Vehicle Availability by Sex in Wetumka
The most prevalent vehicle ownership categories in Wetumka are males with 2 vehicles (141, accounting for 56.6%) and females with 2 vehicles (9, making up 62.9%).
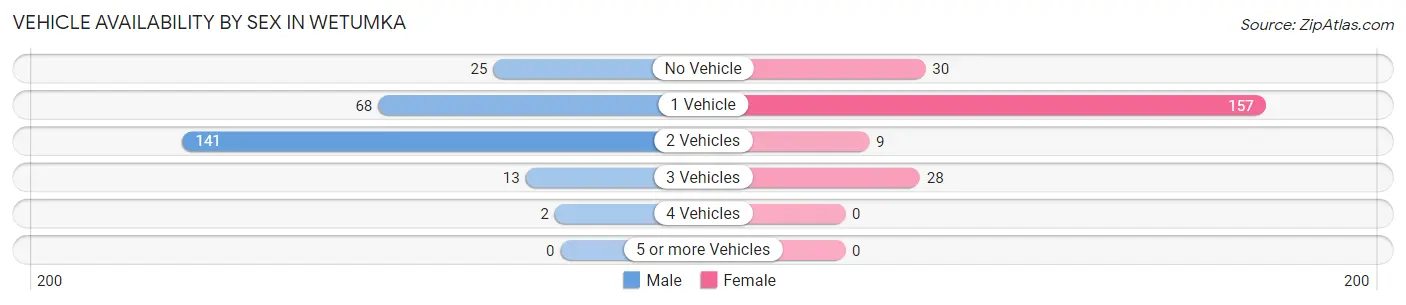
| Vehicles Available | Male | Female |
| No Vehicle | 25 (10.0%) | 30 (13.4%) |
| 1 Vehicle | 68 (27.3%) | 157 (70.1%) |
| 2 Vehicles | 141 (56.6%) | 9 (4.0%) |
| 3 Vehicles | 13 (5.2%) | 28 (12.5%) |
| 4 Vehicles | 2 (0.8%) | 0 (0.0%) |
| 5 or more Vehicles | 0 (0.0%) | 0 (0.0%) |
| Total | 249 (100.0%) | 224 (100.0%) |
Commute Time in Wetumka
The most frequently occuring commute durations in Wetumka are 30 to 34 minutes (155 commuters, 34.4%), 45 to 59 minutes (62 commuters, 13.8%), and 20 to 24 minutes (51 commuters, 11.3%).
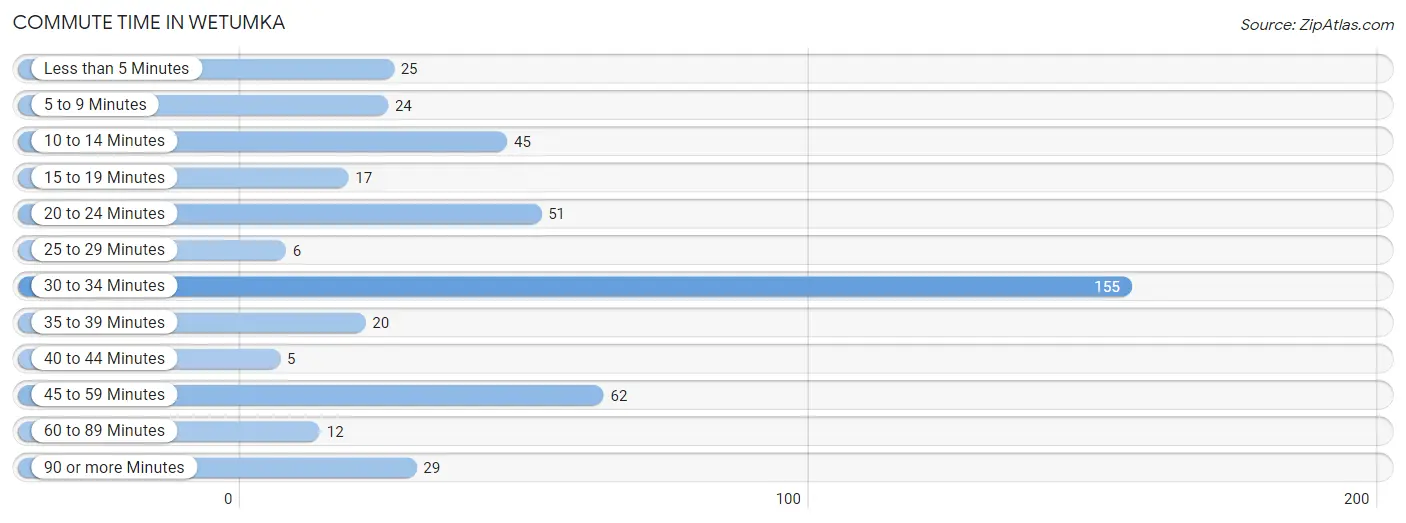
| Commute Time | # Commuters | % Commuters |
| Less than 5 Minutes | 25 | 5.5% |
| 5 to 9 Minutes | 24 | 5.3% |
| 10 to 14 Minutes | 45 | 10.0% |
| 15 to 19 Minutes | 17 | 3.8% |
| 20 to 24 Minutes | 51 | 11.3% |
| 25 to 29 Minutes | 6 | 1.3% |
| 30 to 34 Minutes | 155 | 34.4% |
| 35 to 39 Minutes | 20 | 4.4% |
| 40 to 44 Minutes | 5 | 1.1% |
| 45 to 59 Minutes | 62 | 13.8% |
| 60 to 89 Minutes | 12 | 2.7% |
| 90 or more Minutes | 29 | 6.4% |
Commute Time by Sex in Wetumka
The most common commute times in Wetumka are 30 to 34 minutes (124 commuters, 52.1%) for males and 45 to 59 minutes (54 commuters, 25.4%) for females.
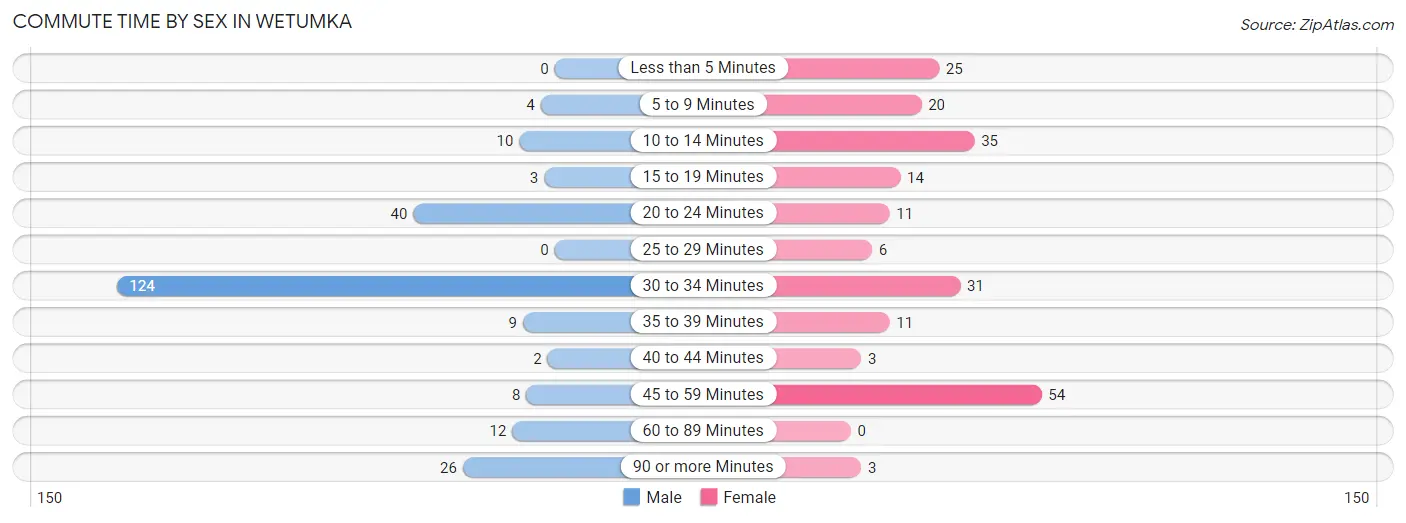
| Commute Time | Male | Female |
| Less than 5 Minutes | 0 (0.0%) | 25 (11.7%) |
| 5 to 9 Minutes | 4 (1.7%) | 20 (9.4%) |
| 10 to 14 Minutes | 10 (4.2%) | 35 (16.4%) |
| 15 to 19 Minutes | 3 (1.3%) | 14 (6.6%) |
| 20 to 24 Minutes | 40 (16.8%) | 11 (5.2%) |
| 25 to 29 Minutes | 0 (0.0%) | 6 (2.8%) |
| 30 to 34 Minutes | 124 (52.1%) | 31 (14.5%) |
| 35 to 39 Minutes | 9 (3.8%) | 11 (5.2%) |
| 40 to 44 Minutes | 2 (0.8%) | 3 (1.4%) |
| 45 to 59 Minutes | 8 (3.4%) | 54 (25.4%) |
| 60 to 89 Minutes | 12 (5.0%) | 0 (0.0%) |
| 90 or more Minutes | 26 (10.9%) | 3 (1.4%) |
Time of Departure to Work by Sex in Wetumka
The most frequent times of departure to work in Wetumka are 4:00 PM to 11:59 PM (122, 51.3%) for males and 7:00 AM to 7:29 AM (70, 32.9%) for females.
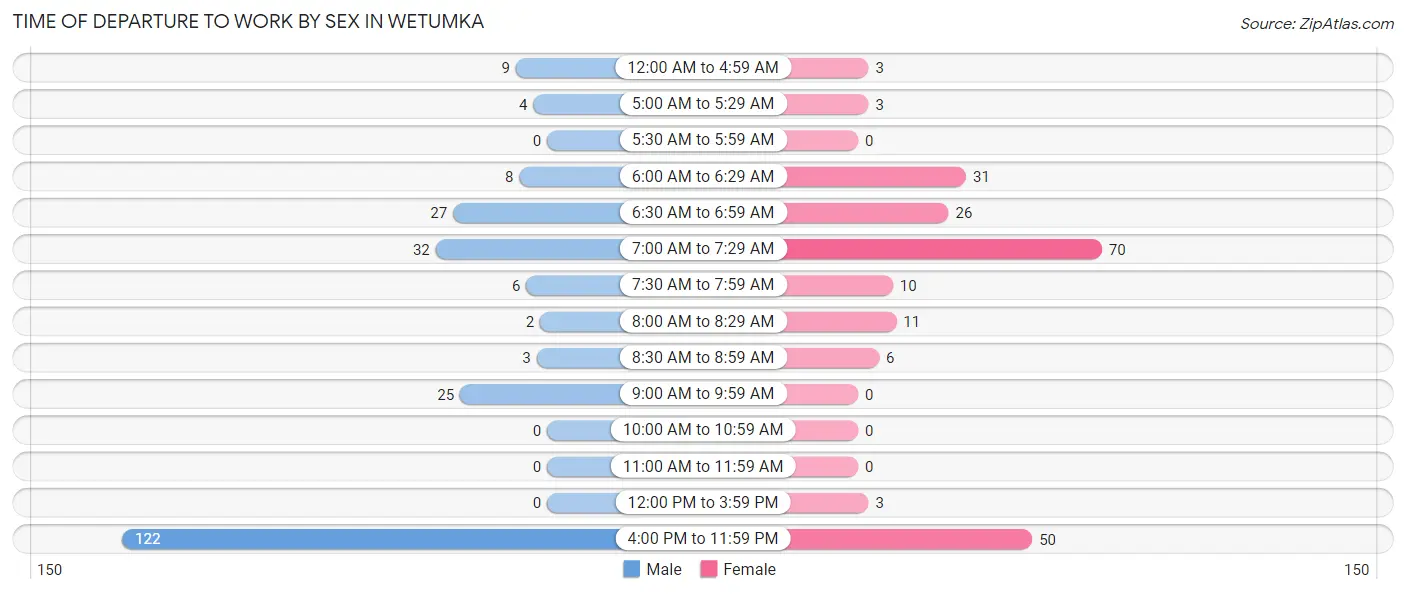
| Time of Departure | Male | Female |
| 12:00 AM to 4:59 AM | 9 (3.8%) | 3 (1.4%) |
| 5:00 AM to 5:29 AM | 4 (1.7%) | 3 (1.4%) |
| 5:30 AM to 5:59 AM | 0 (0.0%) | 0 (0.0%) |
| 6:00 AM to 6:29 AM | 8 (3.4%) | 31 (14.5%) |
| 6:30 AM to 6:59 AM | 27 (11.3%) | 26 (12.2%) |
| 7:00 AM to 7:29 AM | 32 (13.5%) | 70 (32.9%) |
| 7:30 AM to 7:59 AM | 6 (2.5%) | 10 (4.7%) |
| 8:00 AM to 8:29 AM | 2 (0.8%) | 11 (5.2%) |
| 8:30 AM to 8:59 AM | 3 (1.3%) | 6 (2.8%) |
| 9:00 AM to 9:59 AM | 25 (10.5%) | 0 (0.0%) |
| 10:00 AM to 10:59 AM | 0 (0.0%) | 0 (0.0%) |
| 11:00 AM to 11:59 AM | 0 (0.0%) | 0 (0.0%) |
| 12:00 PM to 3:59 PM | 0 (0.0%) | 3 (1.4%) |
| 4:00 PM to 11:59 PM | 122 (51.3%) | 50 (23.5%) |
| Total | 238 (100.0%) | 213 (100.0%) |
Housing Occupancy in Wetumka
Occupancy by Ownership in Wetumka
Of the total 468 dwellings in Wetumka, owner-occupied units account for 289 (61.8%), while renter-occupied units make up 179 (38.3%).
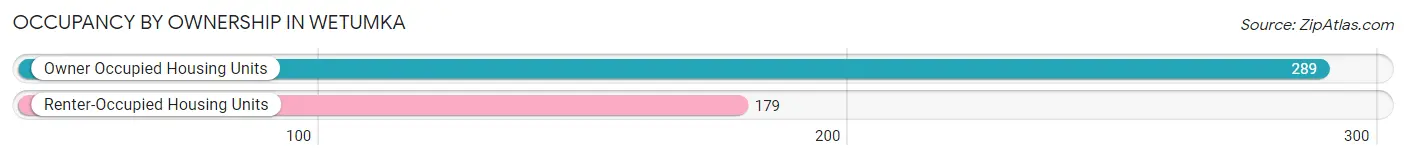
| Occupancy | # Housing Units | % Housing Units |
| Owner Occupied Housing Units | 289 | 61.8% |
| Renter-Occupied Housing Units | 179 | 38.3% |
| Total Occupied Housing Units | 468 | 100.0% |
Occupancy by Household Size in Wetumka
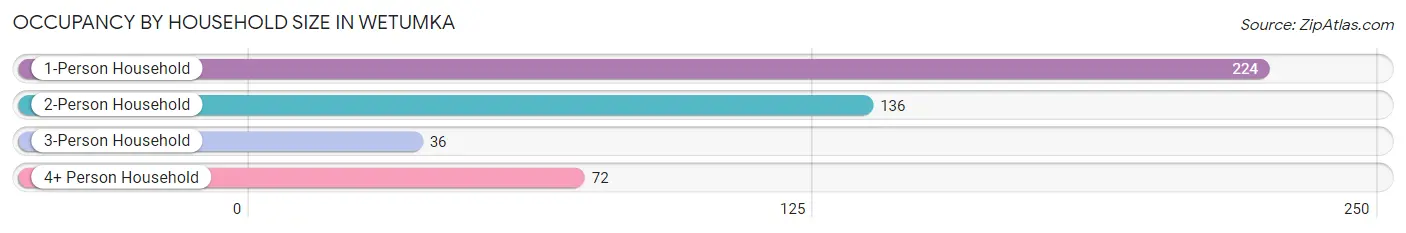
| Household Size | # Housing Units | % Housing Units |
| 1-Person Household | 224 | 47.9% |
| 2-Person Household | 136 | 29.1% |
| 3-Person Household | 36 | 7.7% |
| 4+ Person Household | 72 | 15.4% |
| Total Housing Units | 468 | 100.0% |
Occupancy by Ownership by Household Size in Wetumka
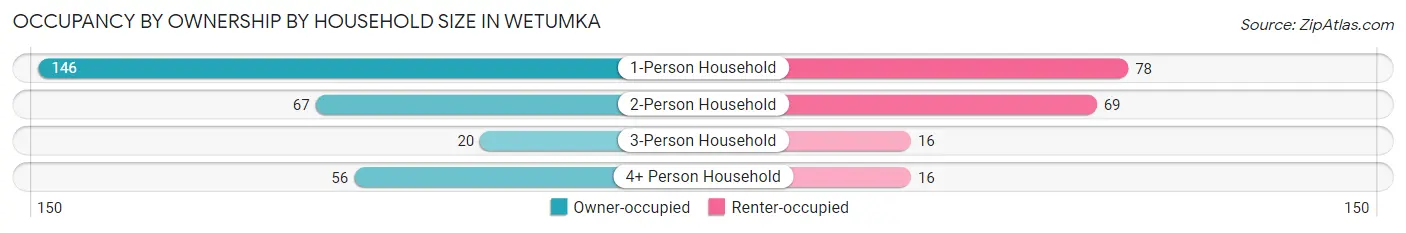
| Household Size | Owner-occupied | Renter-occupied |
| 1-Person Household | 146 (65.2%) | 78 (34.8%) |
| 2-Person Household | 67 (49.3%) | 69 (50.7%) |
| 3-Person Household | 20 (55.6%) | 16 (44.4%) |
| 4+ Person Household | 56 (77.8%) | 16 (22.2%) |
| Total Housing Units | 289 (61.8%) | 179 (38.3%) |
Occupancy by Educational Attainment in Wetumka
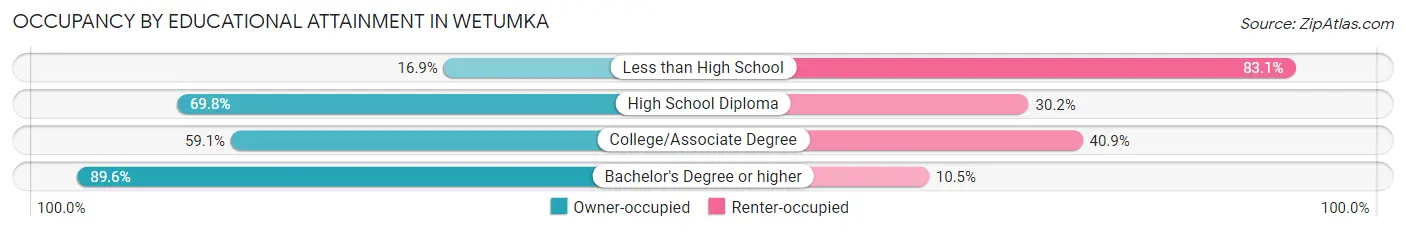
| Household Size | Owner-occupied | Renter-occupied |
| Less than High School | 11 (16.9%) | 54 (83.1%) |
| High School Diploma | 127 (69.8%) | 55 (30.2%) |
| College/Associate Degree | 91 (59.1%) | 63 (40.9%) |
| Bachelor's Degree or higher | 60 (89.5%) | 7 (10.4%) |
Occupancy by Age of Householder in Wetumka
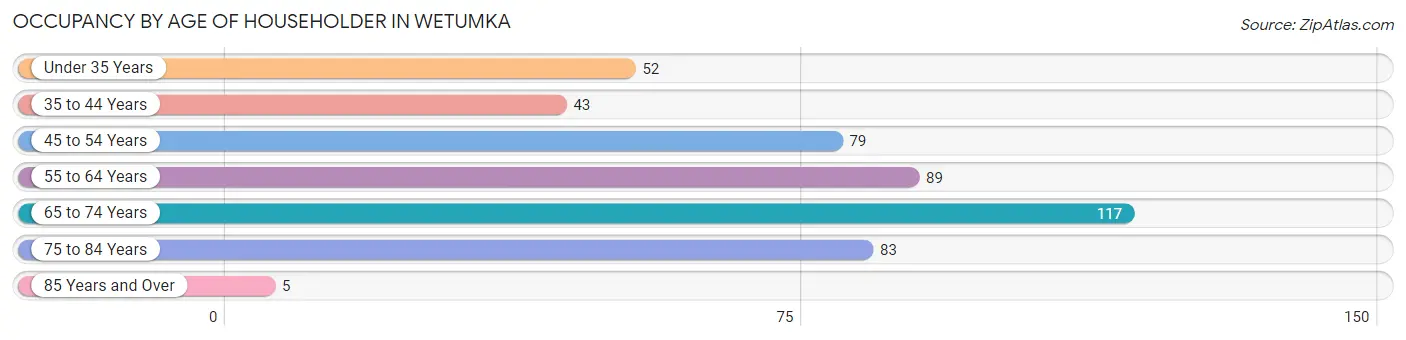
| Age Bracket | # Households | % Households |
| Under 35 Years | 52 | 11.1% |
| 35 to 44 Years | 43 | 9.2% |
| 45 to 54 Years | 79 | 16.9% |
| 55 to 64 Years | 89 | 19.0% |
| 65 to 74 Years | 117 | 25.0% |
| 75 to 84 Years | 83 | 17.7% |
| 85 Years and Over | 5 | 1.1% |
| Total | 468 | 100.0% |
Housing Finances in Wetumka
Median Income by Occupancy in Wetumka
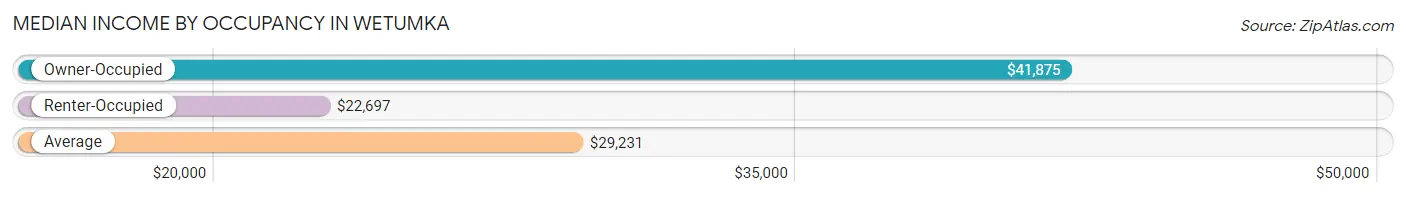
| Occupancy Type | # Households | Median Income |
| Owner-Occupied | 289 (61.8%) | $41,875 |
| Renter-Occupied | 179 (38.3%) | $22,697 |
| Average | 468 (100.0%) | $29,231 |
Occupancy by Householder Income Bracket in Wetumka
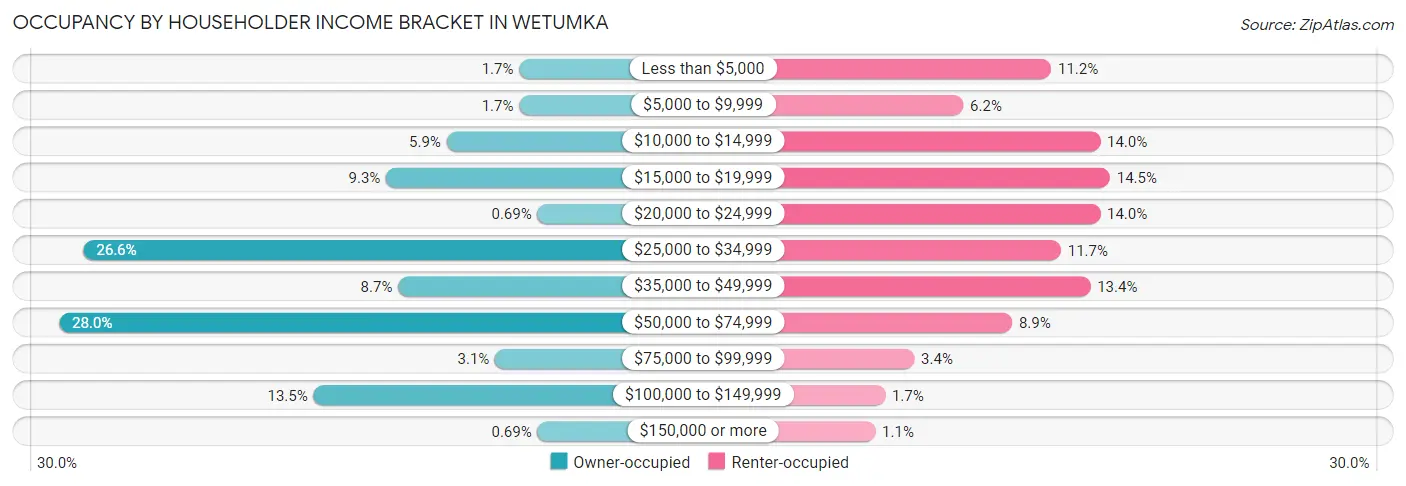
| Income Bracket | Owner-occupied | Renter-occupied |
| Less than $5,000 | 5 (1.7%) | 20 (11.2%) |
| $5,000 to $9,999 | 5 (1.7%) | 11 (6.1%) |
| $10,000 to $14,999 | 17 (5.9%) | 25 (14.0%) |
| $15,000 to $19,999 | 27 (9.3%) | 26 (14.5%) |
| $20,000 to $24,999 | 2 (0.7%) | 25 (14.0%) |
| $25,000 to $34,999 | 77 (26.6%) | 21 (11.7%) |
| $35,000 to $49,999 | 25 (8.6%) | 24 (13.4%) |
| $50,000 to $74,999 | 81 (28.0%) | 16 (8.9%) |
| $75,000 to $99,999 | 9 (3.1%) | 6 (3.4%) |
| $100,000 to $149,999 | 39 (13.5%) | 3 (1.7%) |
| $150,000 or more | 2 (0.7%) | 2 (1.1%) |
| Total | 289 (100.0%) | 179 (100.0%) |
Monthly Housing Cost Tiers in Wetumka
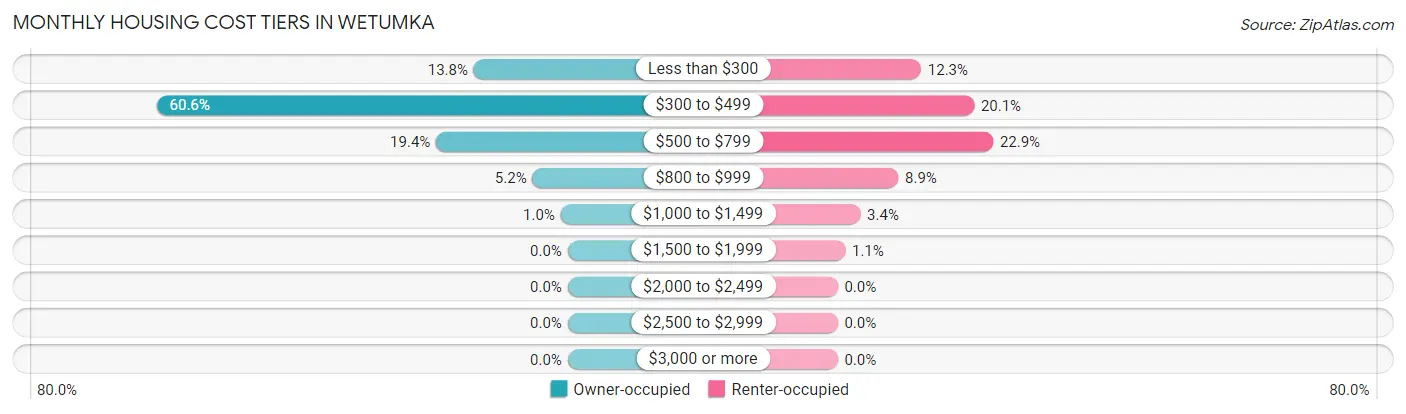
| Monthly Cost | Owner-occupied | Renter-occupied |
| Less than $300 | 40 (13.8%) | 22 (12.3%) |
| $300 to $499 | 175 (60.6%) | 36 (20.1%) |
| $500 to $799 | 56 (19.4%) | 41 (22.9%) |
| $800 to $999 | 15 (5.2%) | 16 (8.9%) |
| $1,000 to $1,499 | 3 (1.0%) | 6 (3.4%) |
| $1,500 to $1,999 | 0 (0.0%) | 2 (1.1%) |
| $2,000 to $2,499 | 0 (0.0%) | 0 (0.0%) |
| $2,500 to $2,999 | 0 (0.0%) | 0 (0.0%) |
| $3,000 or more | 0 (0.0%) | 0 (0.0%) |
| Total | 289 (100.0%) | 179 (100.0%) |
Physical Housing Characteristics in Wetumka
Housing Structures in Wetumka
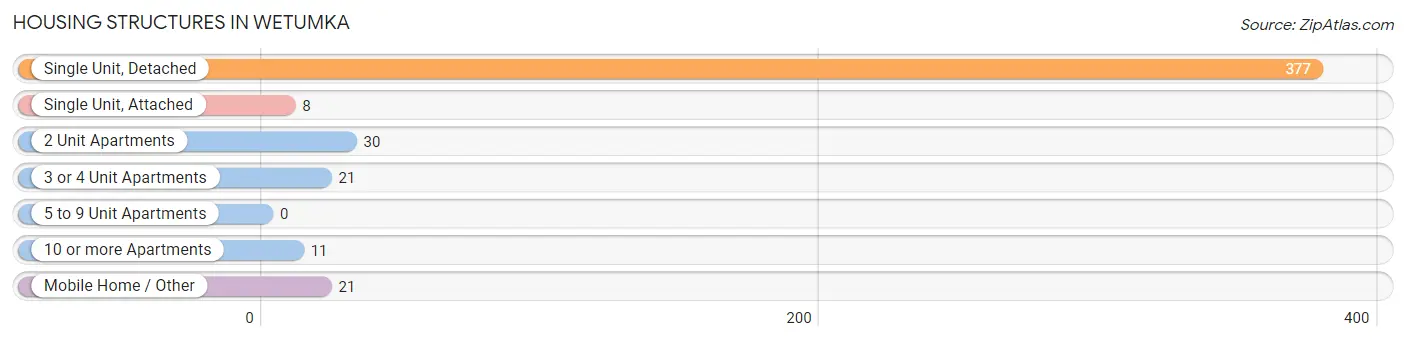
| Structure Type | # Housing Units | % Housing Units |
| Single Unit, Detached | 377 | 80.6% |
| Single Unit, Attached | 8 | 1.7% |
| 2 Unit Apartments | 30 | 6.4% |
| 3 or 4 Unit Apartments | 21 | 4.5% |
| 5 to 9 Unit Apartments | 0 | 0.0% |
| 10 or more Apartments | 11 | 2.4% |
| Mobile Home / Other | 21 | 4.5% |
| Total | 468 | 100.0% |
Housing Structures by Occupancy in Wetumka
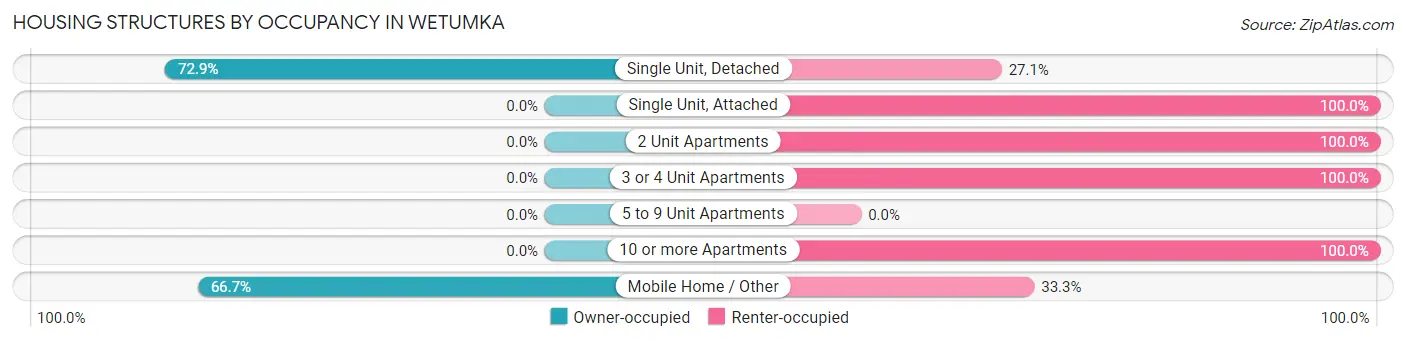
| Structure Type | Owner-occupied | Renter-occupied |
| Single Unit, Detached | 275 (72.9%) | 102 (27.1%) |
| Single Unit, Attached | 0 (0.0%) | 8 (100.0%) |
| 2 Unit Apartments | 0 (0.0%) | 30 (100.0%) |
| 3 or 4 Unit Apartments | 0 (0.0%) | 21 (100.0%) |
| 5 to 9 Unit Apartments | 0 (0.0%) | 0 (0.0%) |
| 10 or more Apartments | 0 (0.0%) | 11 (100.0%) |
| Mobile Home / Other | 14 (66.7%) | 7 (33.3%) |
| Total | 289 (61.8%) | 179 (38.3%) |
Housing Structures by Number of Rooms in Wetumka
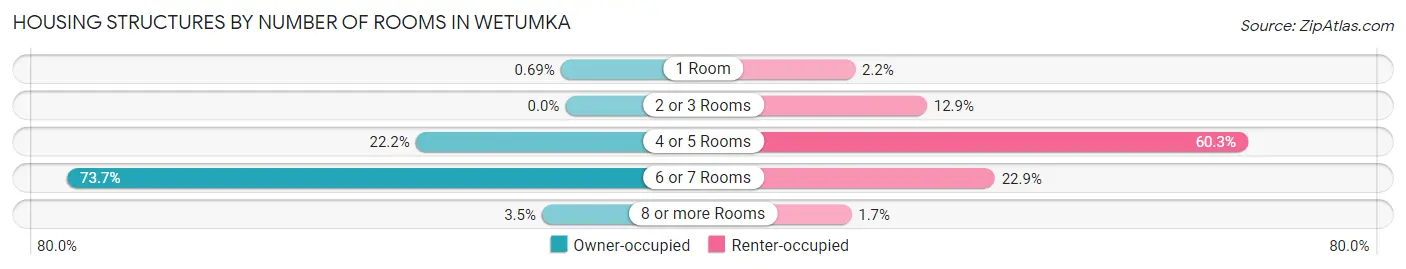
| Number of Rooms | Owner-occupied | Renter-occupied |
| 1 Room | 2 (0.7%) | 4 (2.2%) |
| 2 or 3 Rooms | 0 (0.0%) | 23 (12.9%) |
| 4 or 5 Rooms | 64 (22.2%) | 108 (60.3%) |
| 6 or 7 Rooms | 213 (73.7%) | 41 (22.9%) |
| 8 or more Rooms | 10 (3.5%) | 3 (1.7%) |
| Total | 289 (100.0%) | 179 (100.0%) |
Housing Structure by Heating Type in Wetumka
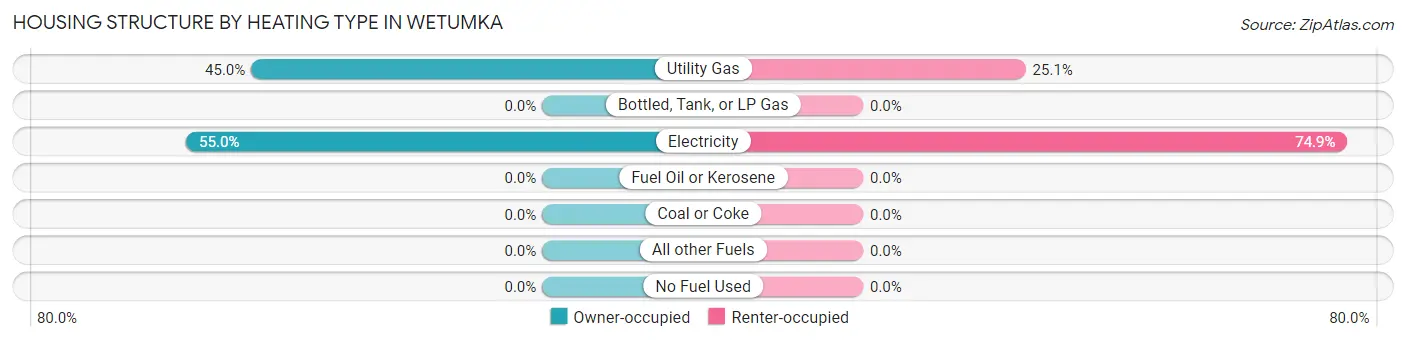
| Heating Type | Owner-occupied | Renter-occupied |
| Utility Gas | 130 (45.0%) | 45 (25.1%) |
| Bottled, Tank, or LP Gas | 0 (0.0%) | 0 (0.0%) |
| Electricity | 159 (55.0%) | 134 (74.9%) |
| Fuel Oil or Kerosene | 0 (0.0%) | 0 (0.0%) |
| Coal or Coke | 0 (0.0%) | 0 (0.0%) |
| All other Fuels | 0 (0.0%) | 0 (0.0%) |
| No Fuel Used | 0 (0.0%) | 0 (0.0%) |
| Total | 289 (100.0%) | 179 (100.0%) |
Household Vehicle Usage in Wetumka
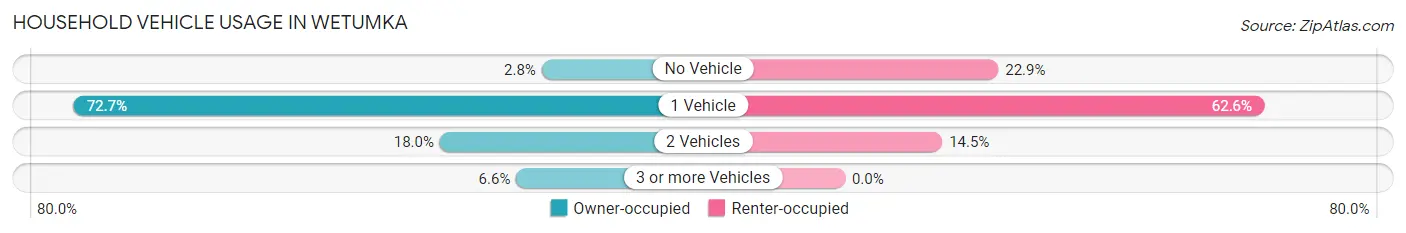
| Vehicles per Household | Owner-occupied | Renter-occupied |
| No Vehicle | 8 (2.8%) | 41 (22.9%) |
| 1 Vehicle | 210 (72.7%) | 112 (62.6%) |
| 2 Vehicles | 52 (18.0%) | 26 (14.5%) |
| 3 or more Vehicles | 19 (6.6%) | 0 (0.0%) |
| Total | 289 (100.0%) | 179 (100.0%) |
Real Estate & Mortgages in Wetumka
Real Estate and Mortgage Overview in Wetumka
| Characteristic | Without Mortgage | With Mortgage |
| Housing Units | 260 | 29 |
| Median Property Value | $63,900 | $69,500 |
| Median Household Income | $40,000 | $0 |
| Monthly Housing Costs | $394 | $0 |
| Real Estate Taxes | $448 | $11 |
Property Value by Mortgage Status in Wetumka
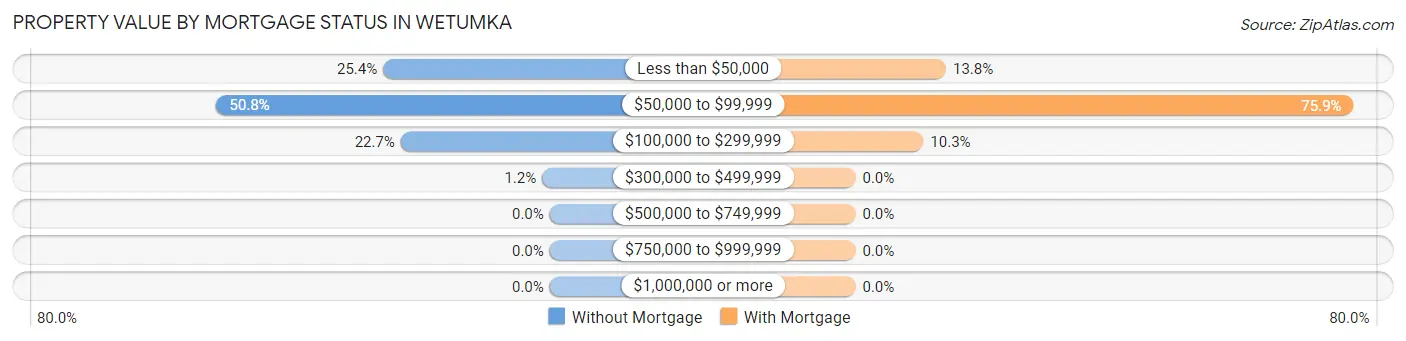
| Property Value | Without Mortgage | With Mortgage |
| Less than $50,000 | 66 (25.4%) | 4 (13.8%) |
| $50,000 to $99,999 | 132 (50.8%) | 22 (75.9%) |
| $100,000 to $299,999 | 59 (22.7%) | 3 (10.3%) |
| $300,000 to $499,999 | 3 (1.1%) | 0 (0.0%) |
| $500,000 to $749,999 | 0 (0.0%) | 0 (0.0%) |
| $750,000 to $999,999 | 0 (0.0%) | 0 (0.0%) |
| $1,000,000 or more | 0 (0.0%) | 0 (0.0%) |
| Total | 260 (100.0%) | 29 (100.0%) |
Household Income by Mortgage Status in Wetumka
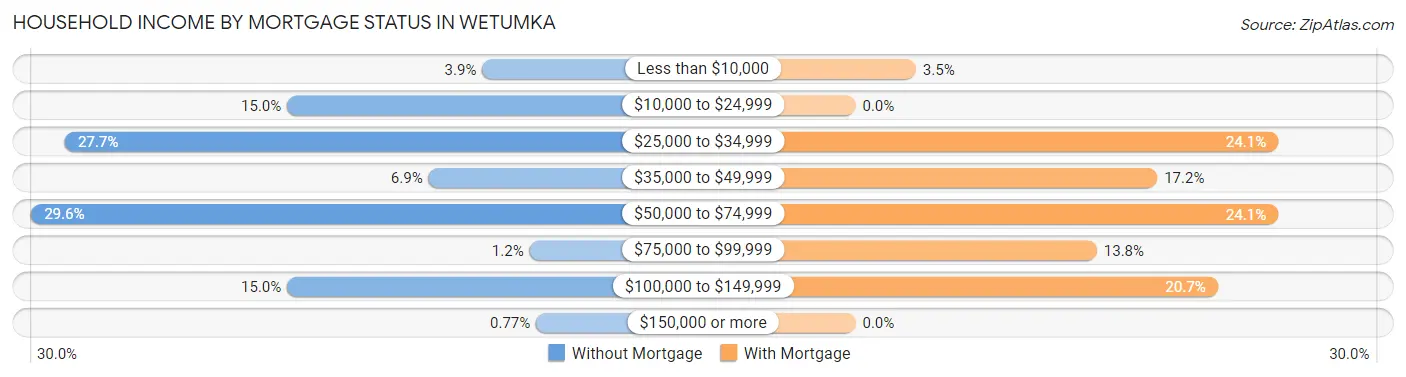
| Household Income | Without Mortgage | With Mortgage |
| Less than $10,000 | 10 (3.8%) | 1 (3.5%) |
| $10,000 to $24,999 | 39 (15.0%) | 0 (0.0%) |
| $25,000 to $34,999 | 72 (27.7%) | 7 (24.1%) |
| $35,000 to $49,999 | 18 (6.9%) | 5 (17.2%) |
| $50,000 to $74,999 | 77 (29.6%) | 7 (24.1%) |
| $75,000 to $99,999 | 3 (1.1%) | 4 (13.8%) |
| $100,000 to $149,999 | 39 (15.0%) | 6 (20.7%) |
| $150,000 or more | 2 (0.8%) | 0 (0.0%) |
| Total | 260 (100.0%) | 29 (100.0%) |
Property Value to Household Income Ratio in Wetumka
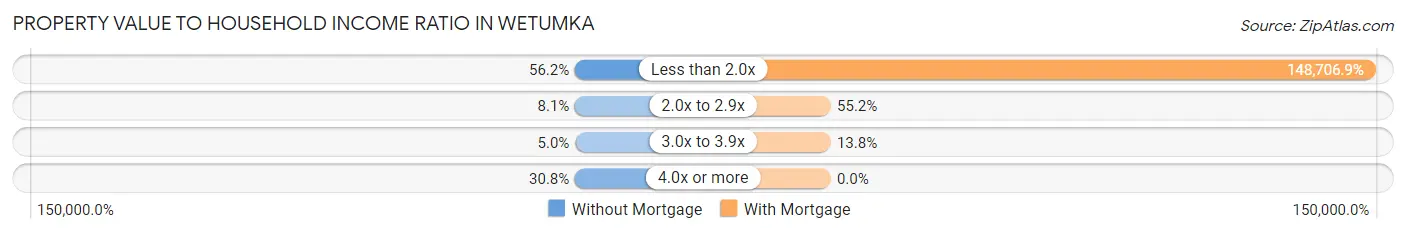
| Value-to-Income Ratio | Without Mortgage | With Mortgage |
| Less than 2.0x | 146 (56.1%) | 43,125 (148,706.9%) |
| 2.0x to 2.9x | 21 (8.1%) | 16 (55.2%) |
| 3.0x to 3.9x | 13 (5.0%) | 4 (13.8%) |
| 4.0x or more | 80 (30.8%) | 0 (0.0%) |
| Total | 260 (100.0%) | 29 (100.0%) |
Real Estate Taxes by Mortgage Status in Wetumka
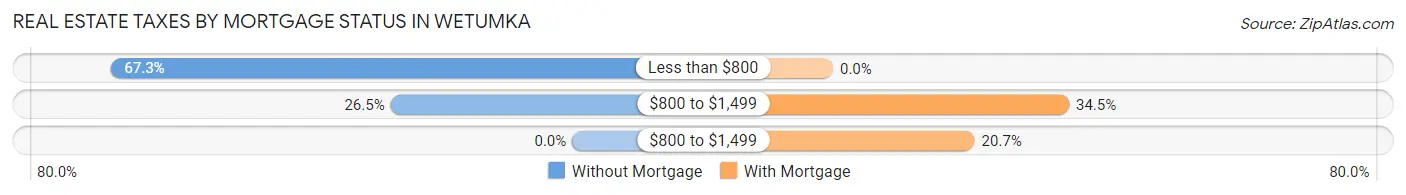
| Property Taxes | Without Mortgage | With Mortgage |
| Less than $800 | 175 (67.3%) | 0 (0.0%) |
| $800 to $1,499 | 69 (26.5%) | 10 (34.5%) |
| $800 to $1,499 | 0 (0.0%) | 6 (20.7%) |
| Total | 260 (100.0%) | 29 (100.0%) |
Health & Disability in Wetumka
Health Insurance Coverage by Age in Wetumka
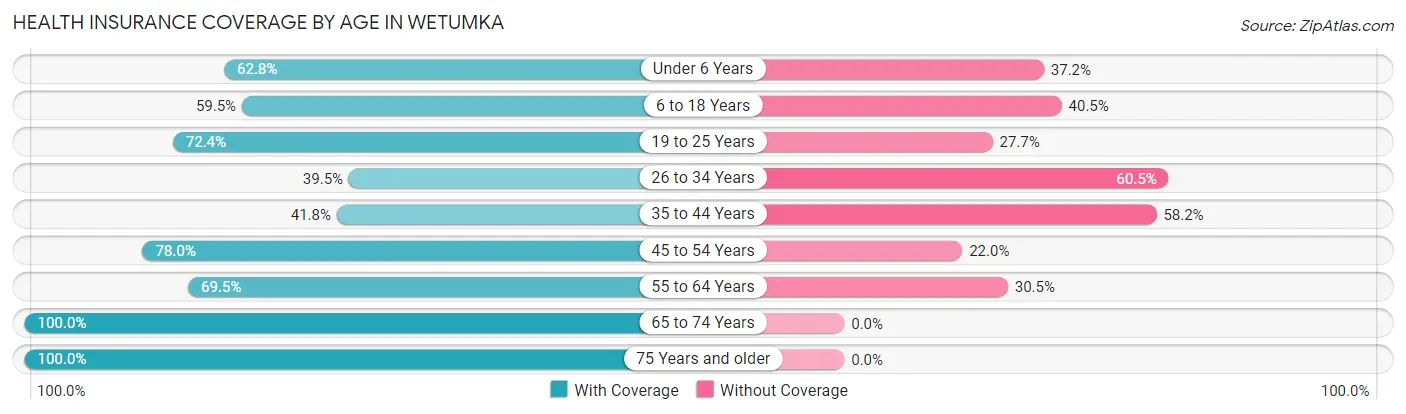
| Age Bracket | With Coverage | Without Coverage |
| Under 6 Years | 54 (62.8%) | 32 (37.2%) |
| 6 to 18 Years | 113 (59.5%) | 77 (40.5%) |
| 19 to 25 Years | 123 (72.4%) | 47 (27.7%) |
| 26 to 34 Years | 66 (39.5%) | 101 (60.5%) |
| 35 to 44 Years | 56 (41.8%) | 78 (58.2%) |
| 45 to 54 Years | 220 (78.0%) | 62 (22.0%) |
| 55 to 64 Years | 114 (69.5%) | 50 (30.5%) |
| 65 to 74 Years | 141 (100.0%) | 0 (0.0%) |
| 75 Years and older | 143 (100.0%) | 0 (0.0%) |
| Total | 1,030 (69.7%) | 447 (30.3%) |
Health Insurance Coverage by Citizenship Status in Wetumka
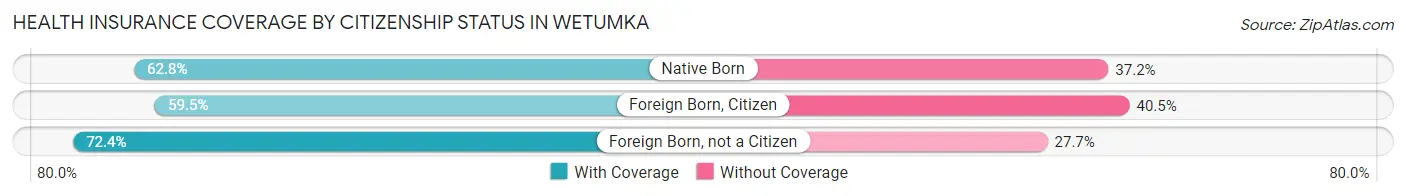
| Citizenship Status | With Coverage | Without Coverage |
| Native Born | 54 (62.8%) | 32 (37.2%) |
| Foreign Born, Citizen | 113 (59.5%) | 77 (40.5%) |
| Foreign Born, not a Citizen | 123 (72.4%) | 47 (27.7%) |
Health Insurance Coverage by Household Income in Wetumka
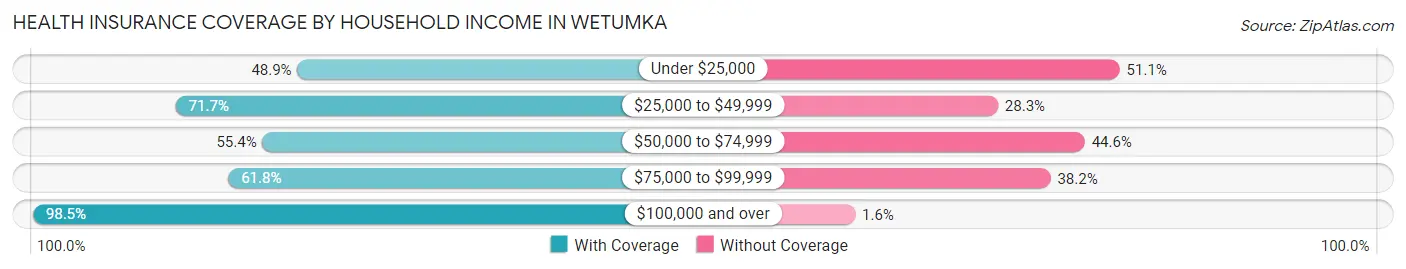
| Household Income | With Coverage | Without Coverage |
| Under $25,000 | 197 (48.9%) | 206 (51.1%) |
| $25,000 to $49,999 | 233 (71.7%) | 92 (28.3%) |
| $50,000 to $74,999 | 143 (55.4%) | 115 (44.6%) |
| $75,000 to $99,999 | 47 (61.8%) | 29 (38.2%) |
| $100,000 and over | 318 (98.5%) | 5 (1.5%) |
Public vs Private Health Insurance Coverage by Age in Wetumka
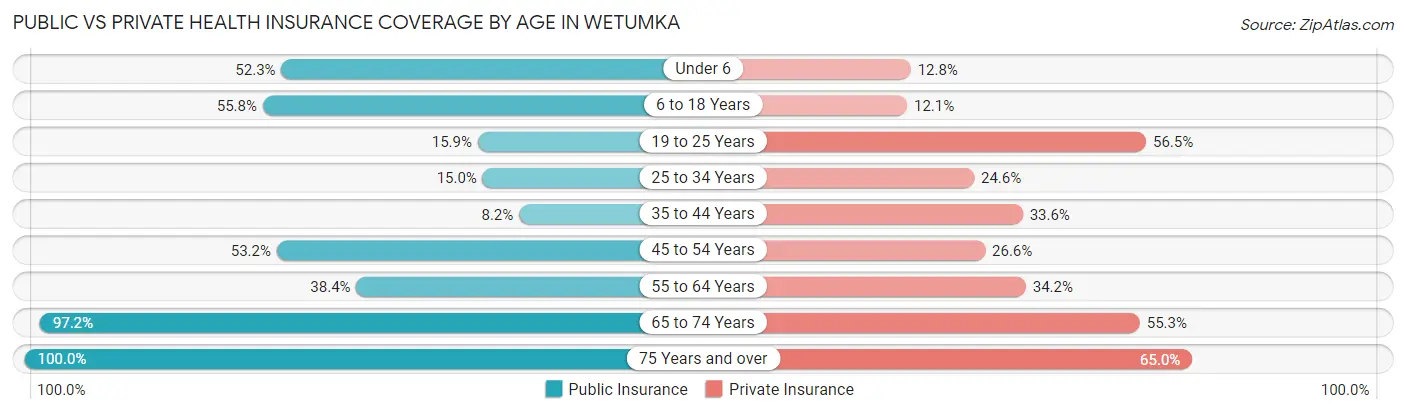
| Age Bracket | Public Insurance | Private Insurance |
| Under 6 | 45 (52.3%) | 11 (12.8%) |
| 6 to 18 Years | 106 (55.8%) | 23 (12.1%) |
| 19 to 25 Years | 27 (15.9%) | 96 (56.5%) |
| 25 to 34 Years | 25 (15.0%) | 41 (24.5%) |
| 35 to 44 Years | 11 (8.2%) | 45 (33.6%) |
| 45 to 54 Years | 150 (53.2%) | 75 (26.6%) |
| 55 to 64 Years | 63 (38.4%) | 56 (34.2%) |
| 65 to 74 Years | 137 (97.2%) | 78 (55.3%) |
| 75 Years and over | 143 (100.0%) | 93 (65.0%) |
| Total | 707 (47.9%) | 518 (35.1%) |
Disability Status by Sex by Age in Wetumka
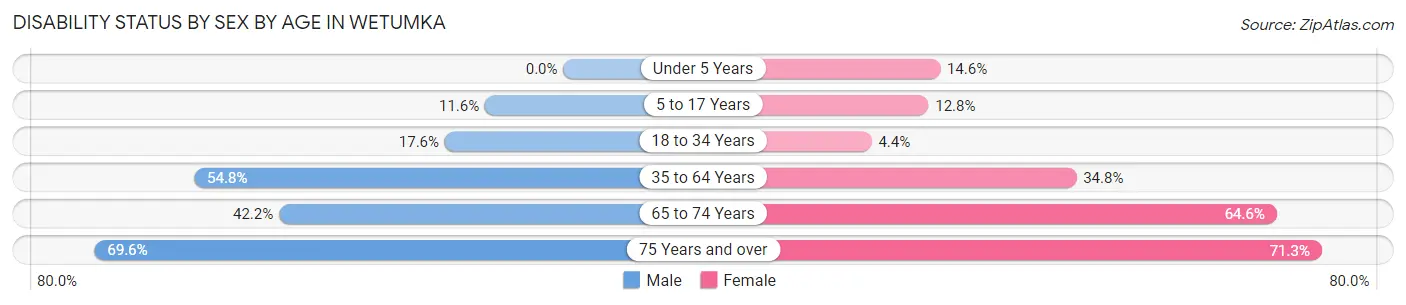
| Age Bracket | Male | Female |
| Under 5 Years | 0 (0.0%) | 7 (14.6%) |
| 5 to 17 Years | 10 (11.6%) | 14 (12.8%) |
| 18 to 34 Years | 38 (17.6%) | 6 (4.4%) |
| 35 to 64 Years | 170 (54.8%) | 94 (34.8%) |
| 65 to 74 Years | 19 (42.2%) | 62 (64.6%) |
| 75 Years and over | 39 (69.6%) | 62 (71.3%) |
Disability Class by Sex by Age in Wetumka
Disability Class: Hearing Difficulty
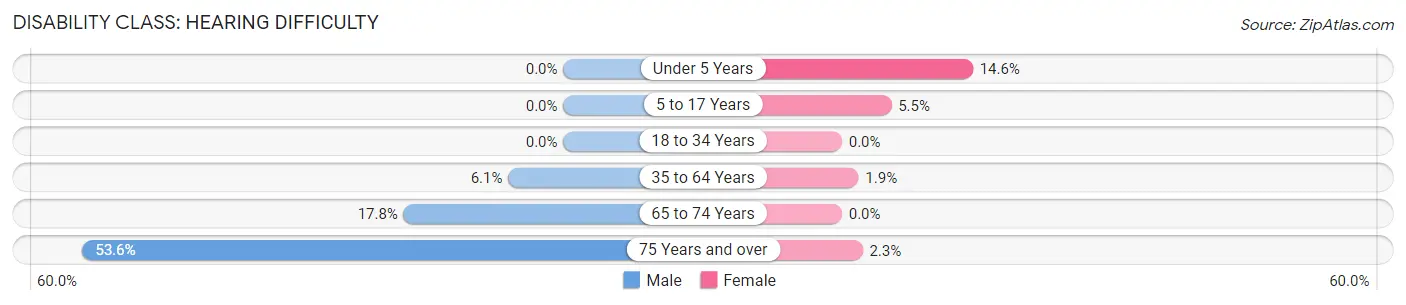
| Age Bracket | Male | Female |
| Under 5 Years | 0 (0.0%) | 7 (14.6%) |
| 5 to 17 Years | 0 (0.0%) | 6 (5.5%) |
| 18 to 34 Years | 0 (0.0%) | 0 (0.0%) |
| 35 to 64 Years | 19 (6.1%) | 5 (1.8%) |
| 65 to 74 Years | 8 (17.8%) | 0 (0.0%) |
| 75 Years and over | 30 (53.6%) | 2 (2.3%) |
Disability Class: Vision Difficulty
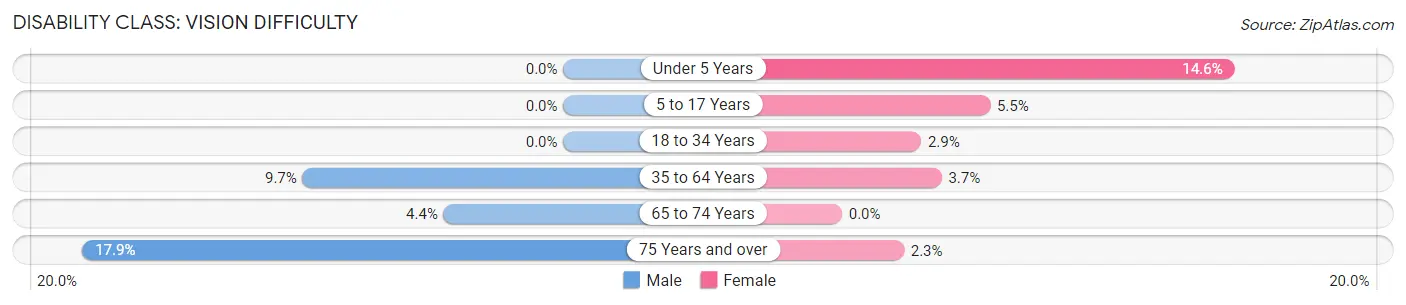
| Age Bracket | Male | Female |
| Under 5 Years | 0 (0.0%) | 7 (14.6%) |
| 5 to 17 Years | 0 (0.0%) | 6 (5.5%) |
| 18 to 34 Years | 0 (0.0%) | 4 (2.9%) |
| 35 to 64 Years | 30 (9.7%) | 10 (3.7%) |
| 65 to 74 Years | 2 (4.4%) | 0 (0.0%) |
| 75 Years and over | 10 (17.9%) | 2 (2.3%) |
Disability Class: Cognitive Difficulty
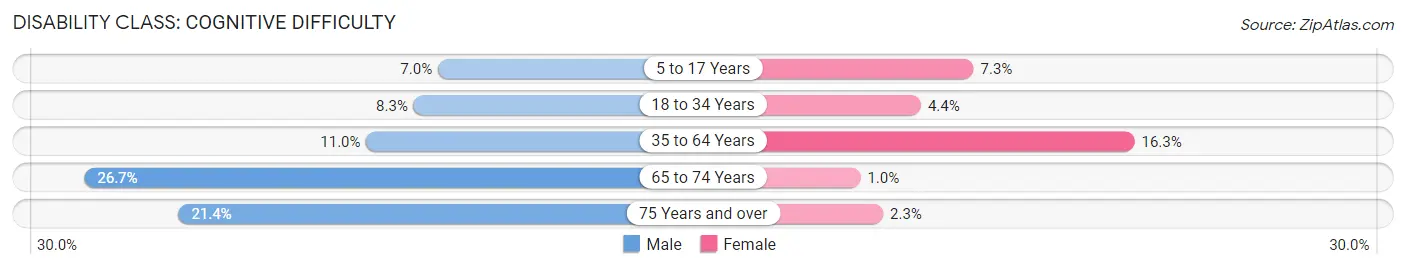
| Age Bracket | Male | Female |
| 5 to 17 Years | 6 (7.0%) | 8 (7.3%) |
| 18 to 34 Years | 18 (8.3%) | 6 (4.4%) |
| 35 to 64 Years | 34 (11.0%) | 44 (16.3%) |
| 65 to 74 Years | 12 (26.7%) | 1 (1.0%) |
| 75 Years and over | 12 (21.4%) | 2 (2.3%) |
Disability Class: Ambulatory Difficulty
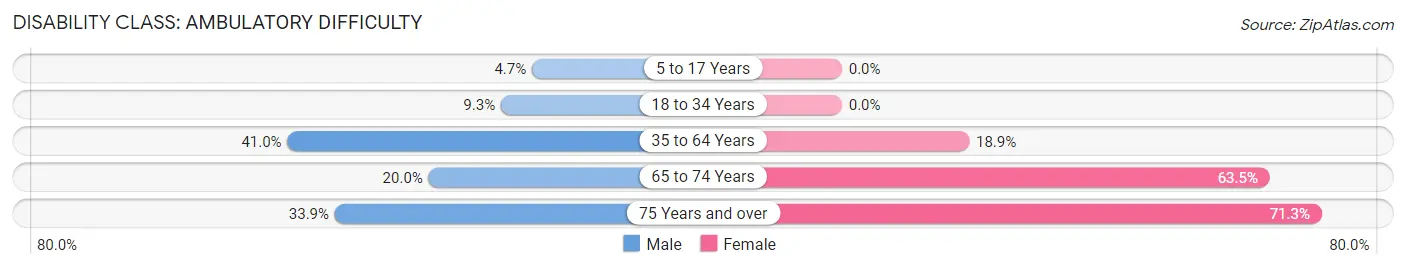
| Age Bracket | Male | Female |
| 5 to 17 Years | 4 (4.6%) | 0 (0.0%) |
| 18 to 34 Years | 20 (9.3%) | 0 (0.0%) |
| 35 to 64 Years | 127 (41.0%) | 51 (18.9%) |
| 65 to 74 Years | 9 (20.0%) | 61 (63.5%) |
| 75 Years and over | 19 (33.9%) | 62 (71.3%) |
Disability Class: Self-Care Difficulty
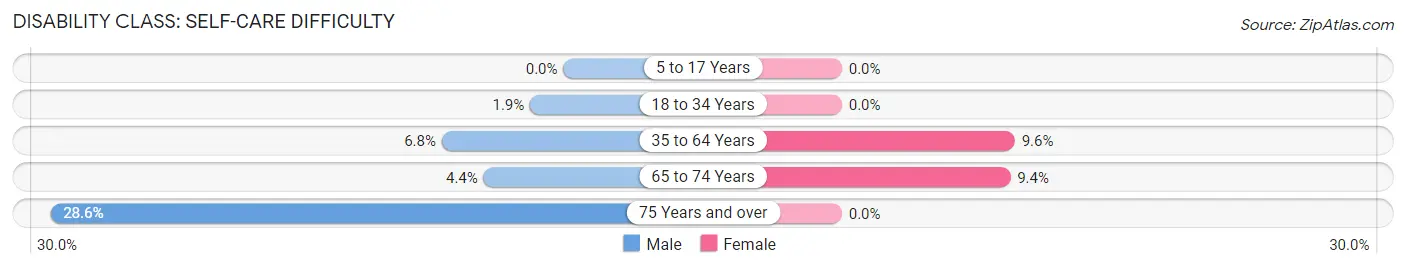
| Age Bracket | Male | Female |
| 5 to 17 Years | 0 (0.0%) | 0 (0.0%) |
| 18 to 34 Years | 4 (1.8%) | 0 (0.0%) |
| 35 to 64 Years | 21 (6.8%) | 26 (9.6%) |
| 65 to 74 Years | 2 (4.4%) | 9 (9.4%) |
| 75 Years and over | 16 (28.6%) | 0 (0.0%) |
Technology Access in Wetumka
Computing Device Access in Wetumka
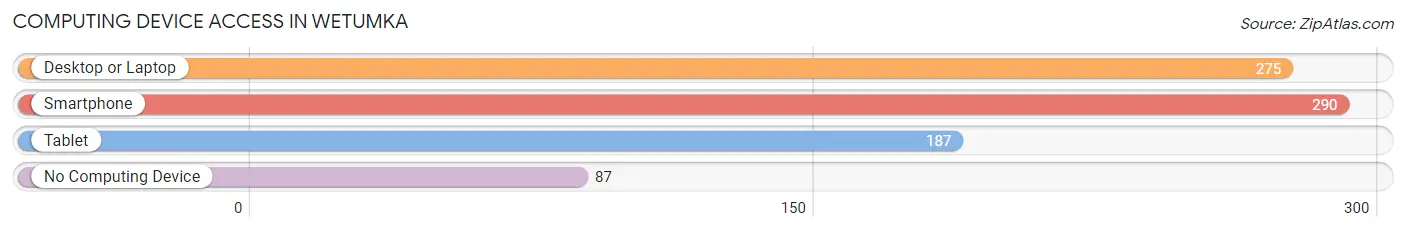
| Device Type | # Households | % Households |
| Desktop or Laptop | 275 | 58.8% |
| Smartphone | 290 | 62.0% |
| Tablet | 187 | 40.0% |
| No Computing Device | 87 | 18.6% |
| Total | 468 | 100.0% |
Internet Access in Wetumka
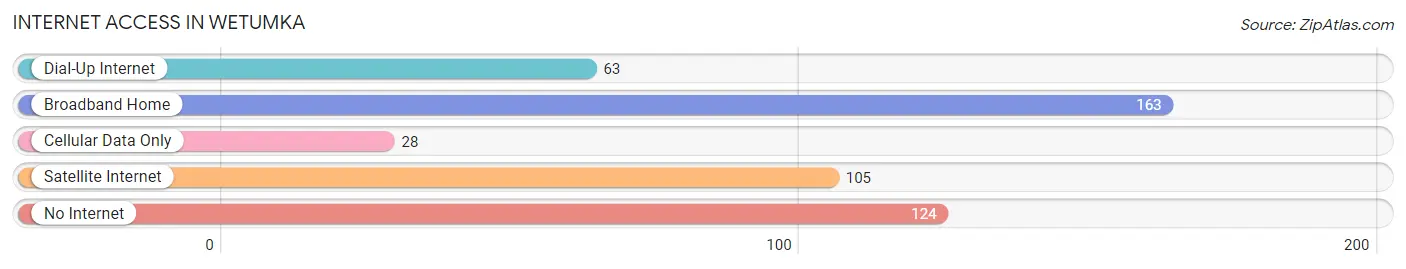
| Internet Type | # Households | % Households |
| Dial-Up Internet | 63 | 13.5% |
| Broadband Home | 163 | 34.8% |
| Cellular Data Only | 28 | 6.0% |
| Satellite Internet | 105 | 22.4% |
| No Internet | 124 | 26.5% |
| Total | 468 | 100.0% |
Wetumka Summary
Wetumka is a small town located in Hughes County, Oklahoma. It is situated on the banks of the North Canadian River, approximately 40 miles southeast of Oklahoma City. The town was founded in 1891 and was named after the Wetumka Indian tribe, which had inhabited the area for centuries. As of the 2010 census, the population of Wetumka was 1,693.
Geography
Wetumka is located at 35°25'25" North, 96°25'25" West (35.423, -96.423). It is situated on the banks of the North Canadian River, approximately 40 miles southeast of Oklahoma City. The town has a total area of 1.2 square miles, all of which is land.
Climate
Wetumka has a humid subtropical climate, with hot summers and mild winters. The average annual temperature is 64°F, with an average high of 90°F in the summer and an average low of 37°F in the winter. The average annual precipitation is 37.5 inches, with an average of 4.5 inches of snowfall per year.
Demographics
As of the 2010 census, the population of Wetumka was 1,693. The racial makeup of the town was 79.2% White, 15.2% Native American, 0.7% African American, 0.2% Asian, 0.1% Pacific Islander, and 4.7% from other races. Hispanic or Latino of any race were 2.2% of the population.
Economy
The economy of Wetumka is largely based on agriculture. The town is home to several farms, which produce a variety of crops, including cotton, corn, soybeans, and wheat. The town is also home to several small businesses, including a grocery store, a hardware store, and a few restaurants.
Education
Wetumka is served by the Wetumka Public Schools district, which includes Wetumka Elementary School, Wetumka Middle School, and Wetumka High School. The town is also home to a branch of the Eastern Oklahoma State College.
Transportation
Wetumka is served by US Highway 75, which runs through the town. The nearest airport is the Oklahoma City International Airport, located approximately 40 miles north of Wetumka.
Culture
Wetumka is home to several annual events, including the Wetumka Watermelon Festival, which is held every summer. The town is also home to the Wetumka Indian Museum, which showcases the history and culture of the Wetumka Indian tribe.
Common Questions
What is Per Capita Income in Wetumka?
Per Capita income in Wetumka is $17,117.
What is the Median Family Income in Wetumka?
Median Family Income in Wetumka is $43,333.
What is the Median Household income in Wetumka?
Median Household Income in Wetumka is $29,231.
What is Income or Wage Gap in Wetumka?
Income or Wage Gap in Wetumka is 19.1%.
Women in Wetumka earn 80.9 cents for every dollar earned by a man.
What is Family Income Deficit in Wetumka?
Family Income Deficit in Wetumka is $8,496.
Families that are below poverty line in Wetumka earn $8,496 less on average than the poverty threshold level.
What is Inequality or Gini Index in Wetumka?
Inequality or Gini Index in Wetumka is 0.41.
What is the Total Population of Wetumka?
Total Population of Wetumka is 1,498.
What is the Total Male Population of Wetumka?
Total Male Population of Wetumka is 743.
What is the Total Female Population of Wetumka?
Total Female Population of Wetumka is 755.
What is the Ratio of Males per 100 Females in Wetumka?
There are 98.41 Males per 100 Females in Wetumka.
What is the Ratio of Females per 100 Males in Wetumka?
There are 101.62 Females per 100 Males in Wetumka.
What is the Median Population Age in Wetumka?
Median Population Age in Wetumka is 44.2 Years.
What is the Average Family Size in Wetumka
Average Family Size in Wetumka is 4.6 People.
What is the Average Household Size in Wetumka
Average Household Size in Wetumka is 3.0 People.
How Large is the Labor Force in Wetumka?
There are 501 People in the Labor Forcein in Wetumka.
What is the Percentage of People in the Labor Force in Wetumka?
39.5% of People are in the Labor Force in Wetumka.
What is the Unemployment Rate in Wetumka?
Unemployment Rate in Wetumka is 5.6%.