Sawyer, OK Map & Demographics
Sawyer Map
Sawyer Overview
$30,943
PER CAPITA INCOME
$75,000
AVG FAMILY INCOME
$63,750
AVG HOUSEHOLD INCOME
41.8%
WAGE / INCOME GAP [ % ]
58.2¢/ $1
WAGE / INCOME GAP [ $ ]
0.49
INEQUALITY / GINI INDEX
421
TOTAL POPULATION
186
MALE POPULATION
235
FEMALE POPULATION
79.15
MALES / 100 FEMALES
126.34
FEMALES / 100 MALES
46.7
MEDIAN AGE
4.8
AVG FAMILY SIZE
3.6
AVG HOUSEHOLD SIZE
147
LABOR FORCE [ PEOPLE ]
41.6%
PERCENT IN LABOR FORCE
4.8%
UNEMPLOYMENT RATE
Sawyer Zip Codes
Sawyer Area Codes
Income in Sawyer
Income Overview in Sawyer
Per Capita Income in Sawyer is $30,943, while median incomes of families and households are $75,000 and $63,750 respectively.
| Characteristic | Number | Measure |
| Per Capita Income | 421 | $30,943 |
| Median Family Income | 76 | $75,000 |
| Mean Family Income | 76 | $93,447 |
| Median Household Income | 117 | $63,750 |
| Mean Household Income | 117 | $81,412 |
| Income Deficit | 76 | $0 |
| Wage / Income Gap (%) | 421 | 41.83% |
| Wage / Income Gap ($) | 421 | 58.17¢ per $1 |
| Gini / Inequality Index | 421 | 0.49 |
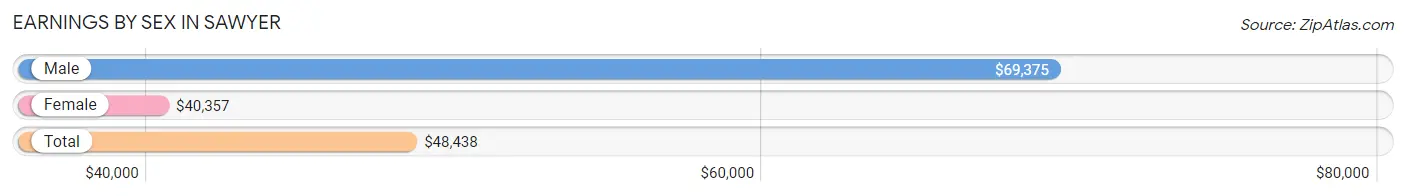
Earnings by Sex in Sawyer
Average Earnings in Sawyer are $48,438, $69,375 for men and $40,357 for women, a difference of 41.8%.
| Sex | Number | Average Earnings |
| Male | 89 (59.7%) | $69,375 |
| Female | 60 (40.3%) | $40,357 |
| Total | 149 (100.0%) | $48,438 |
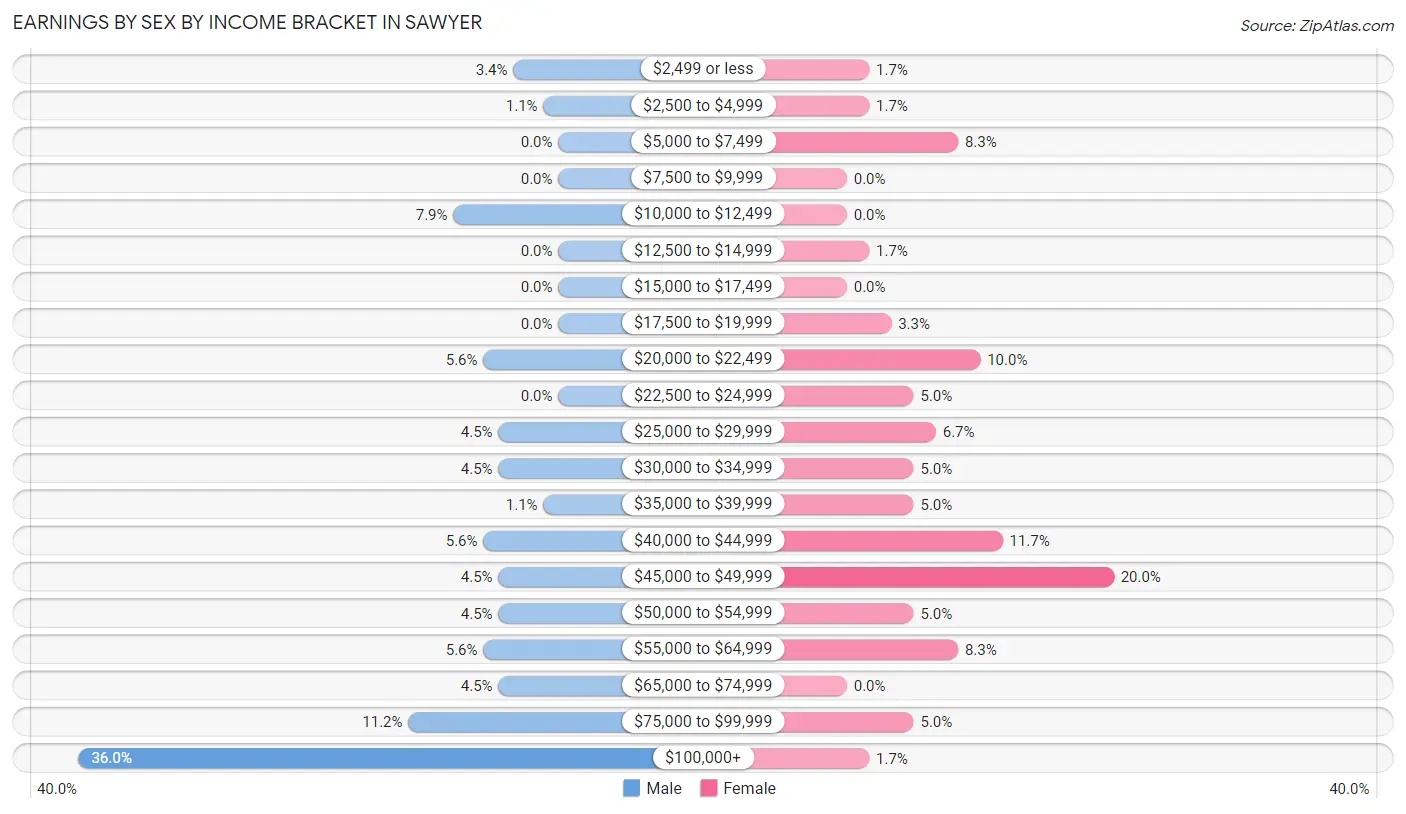
Earnings by Sex by Income Bracket in Sawyer
The most common earnings brackets in Sawyer are $100,000+ for men (32 | 36.0%) and $45,000 to $49,999 for women (12 | 20.0%).
| Income | Male | Female |
| $2,499 or less | 3 (3.4%) | 1 (1.7%) |
| $2,500 to $4,999 | 1 (1.1%) | 1 (1.7%) |
| $5,000 to $7,499 | 0 (0.0%) | 5 (8.3%) |
| $7,500 to $9,999 | 0 (0.0%) | 0 (0.0%) |
| $10,000 to $12,499 | 7 (7.9%) | 0 (0.0%) |
| $12,500 to $14,999 | 0 (0.0%) | 1 (1.7%) |
| $15,000 to $17,499 | 0 (0.0%) | 0 (0.0%) |
| $17,500 to $19,999 | 0 (0.0%) | 2 (3.3%) |
| $20,000 to $22,499 | 5 (5.6%) | 6 (10.0%) |
| $22,500 to $24,999 | 0 (0.0%) | 3 (5.0%) |
| $25,000 to $29,999 | 4 (4.5%) | 4 (6.7%) |
| $30,000 to $34,999 | 4 (4.5%) | 3 (5.0%) |
| $35,000 to $39,999 | 1 (1.1%) | 3 (5.0%) |
| $40,000 to $44,999 | 5 (5.6%) | 7 (11.7%) |
| $45,000 to $49,999 | 4 (4.5%) | 12 (20.0%) |
| $50,000 to $54,999 | 4 (4.5%) | 3 (5.0%) |
| $55,000 to $64,999 | 5 (5.6%) | 5 (8.3%) |
| $65,000 to $74,999 | 4 (4.5%) | 0 (0.0%) |
| $75,000 to $99,999 | 10 (11.2%) | 3 (5.0%) |
| $100,000+ | 32 (36.0%) | 1 (1.7%) |
| Total | 89 (100.0%) | 60 (100.0%) |
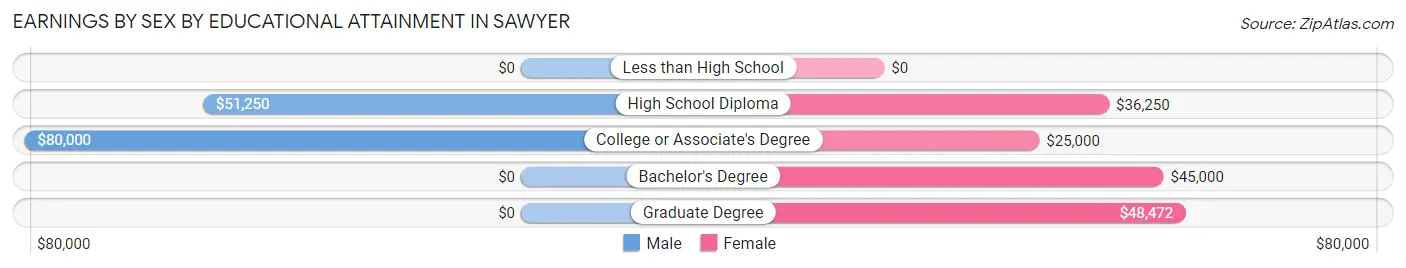
Earnings by Sex by Educational Attainment in Sawyer
Average earnings in Sawyer are $61,667 for men and $41,786 for women, a difference of 32.2%. Men with an educational attainment of college or associate's degree enjoy the highest average annual earnings of $80,000, while those with high school diploma education earn the least with $51,250. Women with an educational attainment of graduate degree earn the most with the average annual earnings of $48,472, while those with college or associate's degree education have the smallest earnings of $25,000.
| Educational Attainment | Male Income | Female Income |
| Less than High School | - | - |
| High School Diploma | $51,250 | $36,250 |
| College or Associate's Degree | $80,000 | $25,000 |
| Bachelor's Degree | - | - |
| Graduate Degree | - | - |
| Total | $61,667 | $41,786 |
Family Income in Sawyer
Family Income Brackets in Sawyer
According to the Sawyer family income data, there are 15 families falling into the $75,000 to $99,999 income range, which is the most common income bracket and makes up 19.7% of all families. Conversely, the less than $10,000 income bracket is the least frequent group with only 2 families (2.6%) belonging to this category.
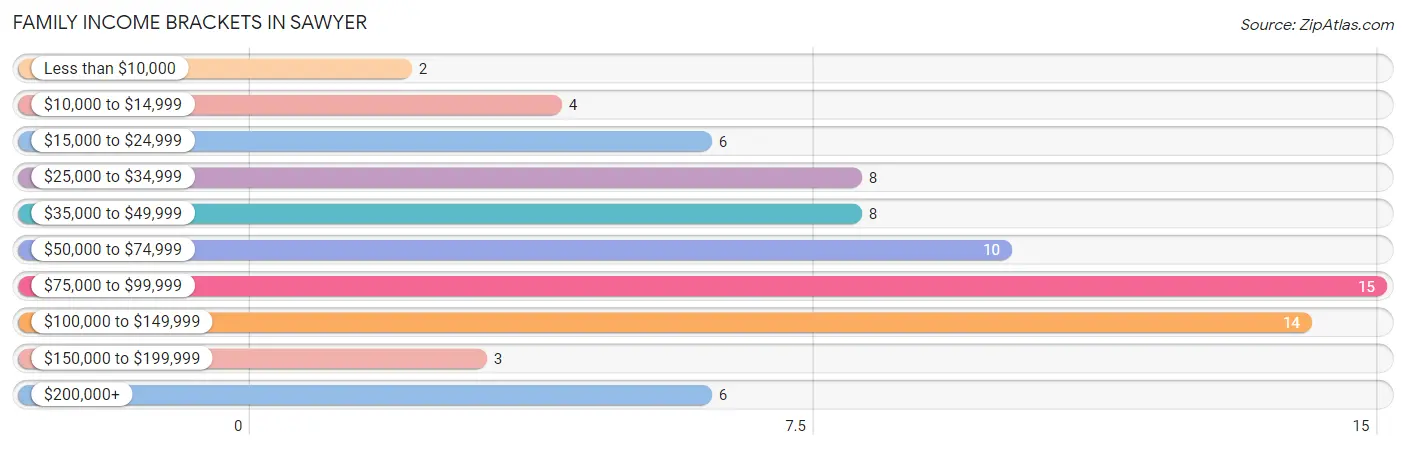
| Income Bracket | # Families | % Families |
| Less than $10,000 | 2 | 2.6% |
| $10,000 to $14,999 | 4 | 5.3% |
| $15,000 to $24,999 | 6 | 7.9% |
| $25,000 to $34,999 | 8 | 10.5% |
| $35,000 to $49,999 | 8 | 10.5% |
| $50,000 to $74,999 | 10 | 13.2% |
| $75,000 to $99,999 | 15 | 19.7% |
| $100,000 to $149,999 | 14 | 18.4% |
| $150,000 to $199,999 | 3 | 3.9% |
| $200,000+ | 6 | 7.9% |
Family Income by Famaliy Size in Sawyer
4-person families (11 | 14.5%) account for the highest median family income in Sawyer with $85,625 per family, while 2-person families (42 | 55.3%) have the highest median income of $33,334 per family member.
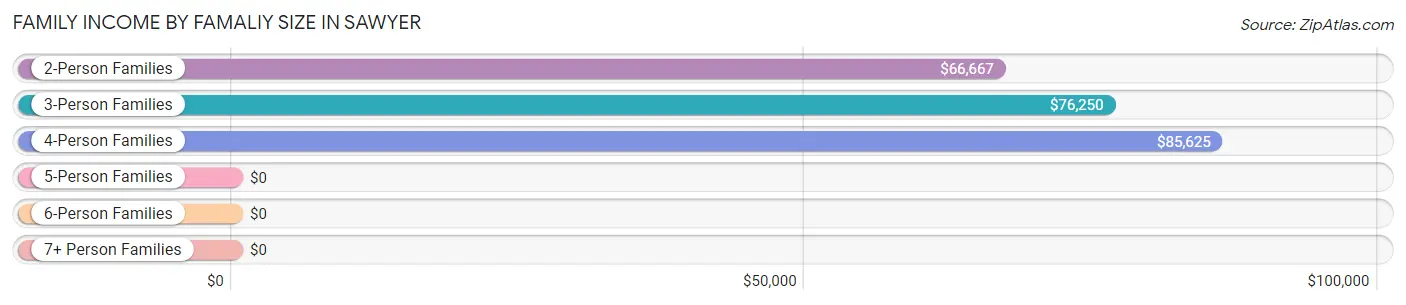
| Income Bracket | # Families | Median Income |
| 2-Person Families | 42 (55.3%) | $66,667 |
| 3-Person Families | 9 (11.8%) | $76,250 |
| 4-Person Families | 11 (14.5%) | $85,625 |
| 5-Person Families | 10 (13.2%) | $0 |
| 6-Person Families | 1 (1.3%) | $0 |
| 7+ Person Families | 3 (4.0%) | $0 |
| Total | 76 (100.0%) | $75,000 |
Family Income by Number of Earners in Sawyer
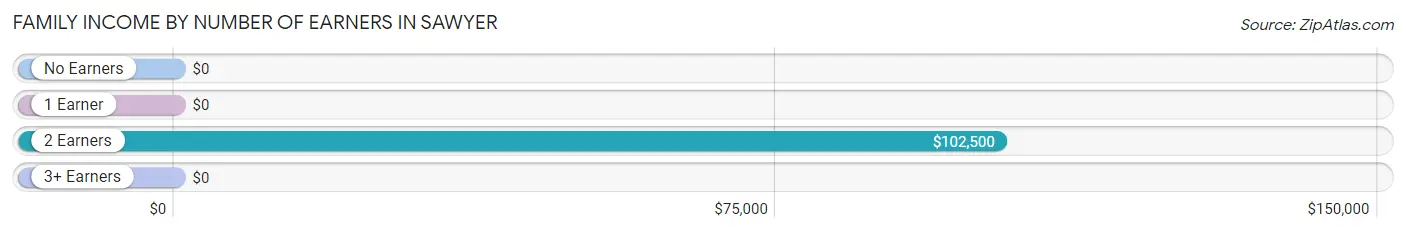
| Number of Earners | # Families | Median Income |
| No Earners | 18 (23.7%) | $0 |
| 1 Earner | 27 (35.5%) | $0 |
| 2 Earners | 26 (34.2%) | $102,500 |
| 3+ Earners | 5 (6.6%) | $0 |
| Total | 76 (100.0%) | $75,000 |
Household Income in Sawyer
Household Income Brackets in Sawyer
With 19 households falling in the category, the $100,000 to $149,999 income range is the most frequent in Sawyer, accounting for 16.2% of all households. In contrast, only 6 households (5.1%) fall into the less than $10,000 income bracket, making it the least populous group.
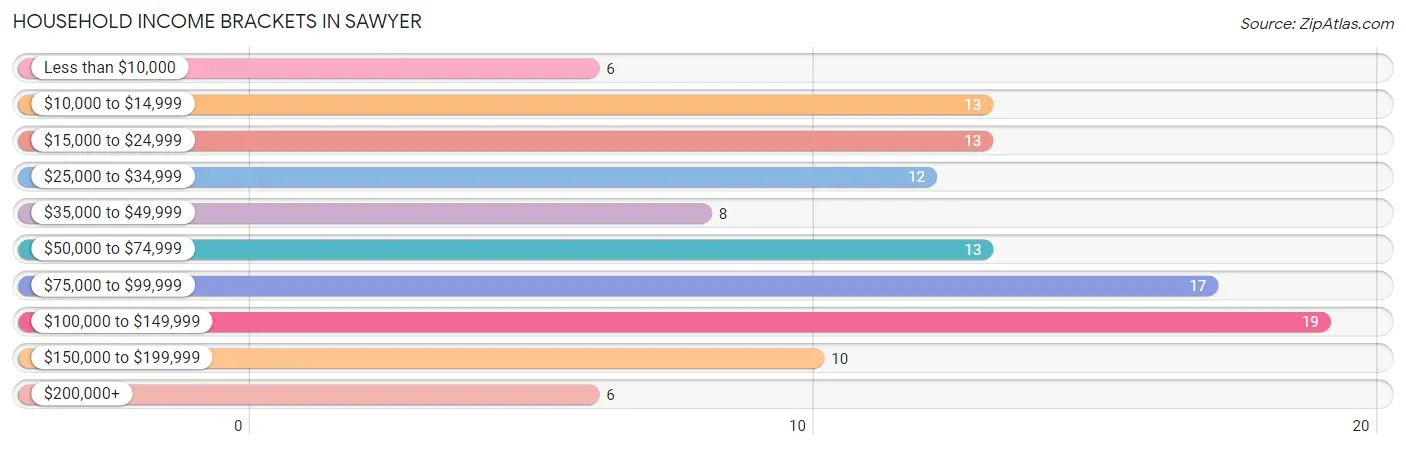
| Income Bracket | # Households | % Households |
| Less than $10,000 | 6 | 5.1% |
| $10,000 to $14,999 | 13 | 11.1% |
| $15,000 to $24,999 | 13 | 11.1% |
| $25,000 to $34,999 | 12 | 10.3% |
| $35,000 to $49,999 | 8 | 6.8% |
| $50,000 to $74,999 | 13 | 11.1% |
| $75,000 to $99,999 | 17 | 14.5% |
| $100,000 to $149,999 | 19 | 16.2% |
| $150,000 to $199,999 | 10 | 8.5% |
| $200,000+ | 6 | 5.1% |
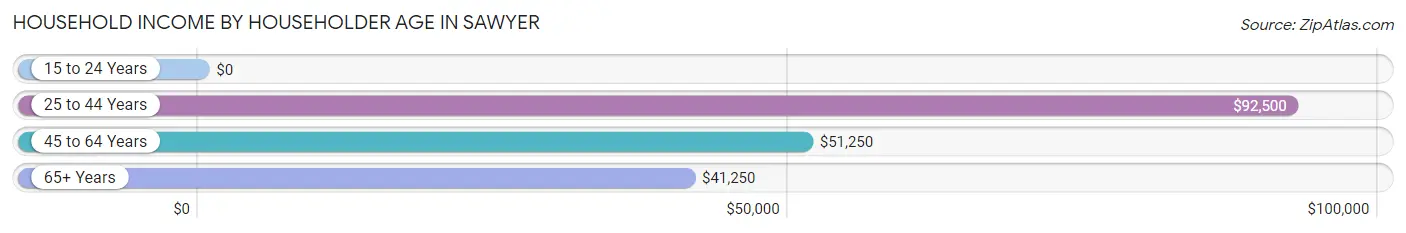
Household Income by Householder Age in Sawyer
The median household income in Sawyer is $63,750, with the highest median household income of $92,500 found in the 25 to 44 years age bracket for the primary householder. A total of 20 households (17.1%) fall into this category. Meanwhile, the 15 to 24 years age bracket for the primary householder has the lowest median household income of $0, with 8 households (6.8%) in this group.
| Income Bracket | # Households | Median Income |
| 15 to 24 Years | 8 (6.8%) | $0 |
| 25 to 44 Years | 20 (17.1%) | $92,500 |
| 45 to 64 Years | 59 (50.4%) | $51,250 |
| 65+ Years | 30 (25.6%) | $41,250 |
| Total | 117 (100.0%) | $63,750 |
Poverty in Sawyer
Income Below Poverty by Sex and Age in Sawyer
With 13.4% poverty level for males and 12.0% for females among the residents of Sawyer, 18 to 24 year old males and 65 to 74 year old females are the most vulnerable to poverty, with 6 males (42.9%) and 5 females (45.5%) in their respective age groups living below the poverty level.
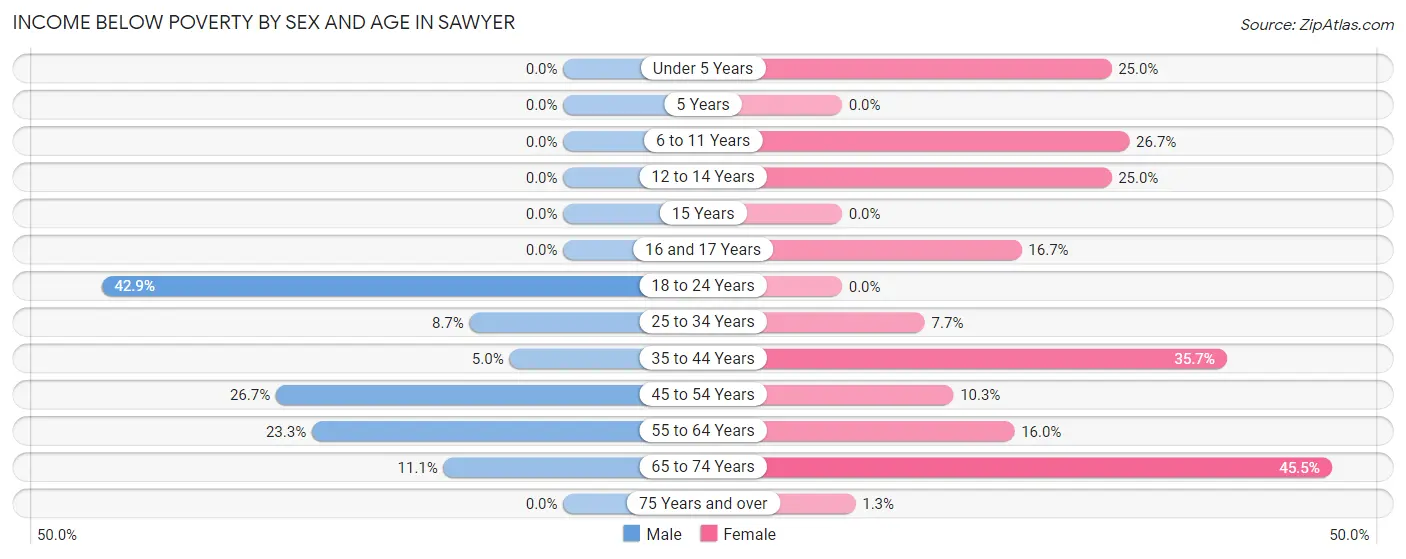
| Age Bracket | Male | Female |
| Under 5 Years | 0 (0.0%) | 2 (25.0%) |
| 5 Years | 0 (0.0%) | 0 (0.0%) |
| 6 to 11 Years | 0 (0.0%) | 4 (26.7%) |
| 12 to 14 Years | 0 (0.0%) | 2 (25.0%) |
| 15 Years | 0 (0.0%) | 0 (0.0%) |
| 16 and 17 Years | 0 (0.0%) | 1 (16.7%) |
| 18 to 24 Years | 6 (42.9%) | 0 (0.0%) |
| 25 to 34 Years | 2 (8.7%) | 1 (7.7%) |
| 35 to 44 Years | 1 (5.0%) | 5 (35.7%) |
| 45 to 54 Years | 8 (26.7%) | 3 (10.3%) |
| 55 to 64 Years | 7 (23.3%) | 4 (16.0%) |
| 65 to 74 Years | 1 (11.1%) | 5 (45.5%) |
| 75 Years and over | 0 (0.0%) | 1 (1.3%) |
| Total | 25 (13.4%) | 28 (12.0%) |
Income Above Poverty by Sex and Age in Sawyer
According to the poverty statistics in Sawyer, males aged under 5 years and females aged 15 years are the age groups that are most secure financially, with 100.0% of males and 100.0% of females in these age groups living above the poverty line.
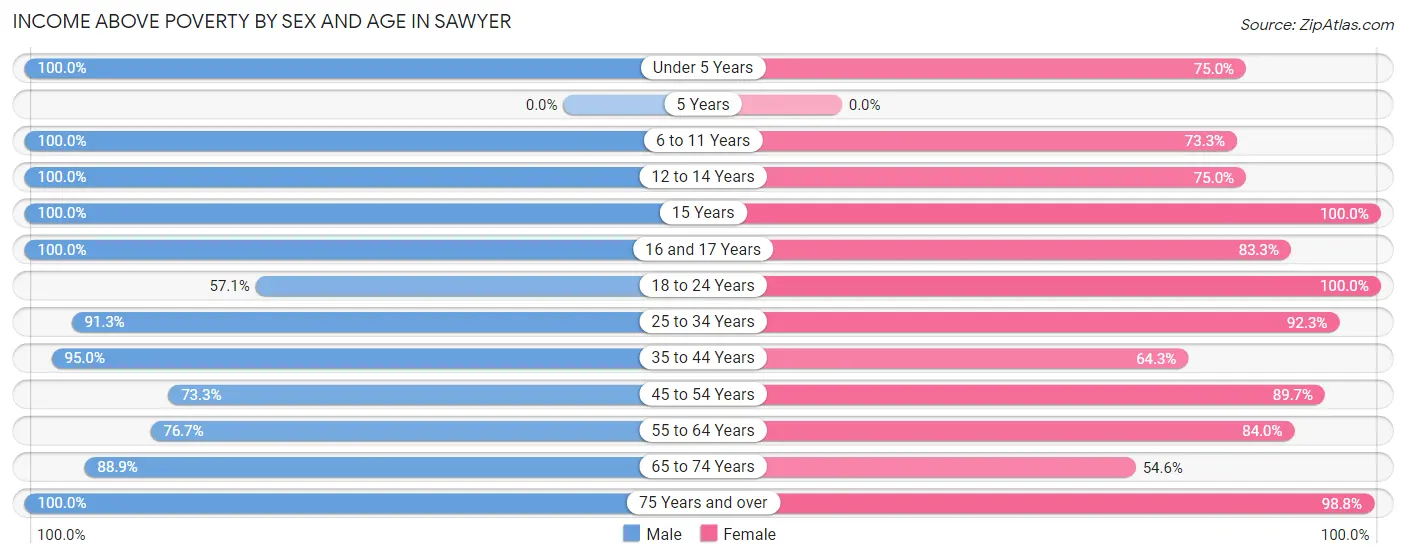
| Age Bracket | Male | Female |
| Under 5 Years | 13 (100.0%) | 6 (75.0%) |
| 5 Years | 0 (0.0%) | 0 (0.0%) |
| 6 to 11 Years | 13 (100.0%) | 11 (73.3%) |
| 12 to 14 Years | 4 (100.0%) | 6 (75.0%) |
| 15 Years | 1 (100.0%) | 4 (100.0%) |
| 16 and 17 Years | 15 (100.0%) | 5 (83.3%) |
| 18 to 24 Years | 8 (57.1%) | 20 (100.0%) |
| 25 to 34 Years | 21 (91.3%) | 12 (92.3%) |
| 35 to 44 Years | 19 (95.0%) | 9 (64.3%) |
| 45 to 54 Years | 22 (73.3%) | 26 (89.7%) |
| 55 to 64 Years | 23 (76.7%) | 21 (84.0%) |
| 65 to 74 Years | 8 (88.9%) | 6 (54.5%) |
| 75 Years and over | 14 (100.0%) | 79 (98.8%) |
| Total | 161 (86.6%) | 205 (88.0%) |
Income Below Poverty Among Married-Couple Families in Sawyer
The poverty statistics for married-couple families in Sawyer show that 13.1% or 8 of the total 61 families live below the poverty line. Families with 3 or 4 children have the highest poverty rate of 50.0%, comprising of 2 families. On the other hand, families with 5 or more children have the lowest poverty rate of 0.0%, which includes 0 families.
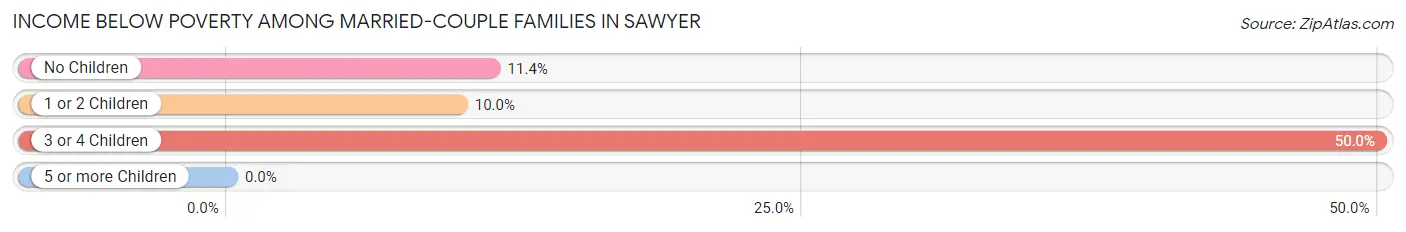
| Children | Above Poverty | Below Poverty |
| No Children | 31 (88.6%) | 4 (11.4%) |
| 1 or 2 Children | 18 (90.0%) | 2 (10.0%) |
| 3 or 4 Children | 2 (50.0%) | 2 (50.0%) |
| 5 or more Children | 2 (100.0%) | 0 (0.0%) |
| Total | 53 (86.9%) | 8 (13.1%) |
Income Below Poverty Among Single-Parent Households in Sawyer
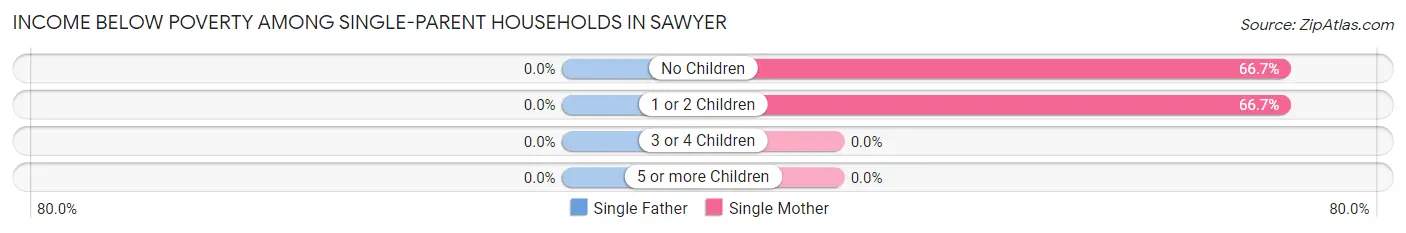
| Children | Single Father | Single Mother |
| No Children | 0 (0.0%) | 2 (66.7%) |
| 1 or 2 Children | 0 (0.0%) | 2 (66.7%) |
| 3 or 4 Children | 0 (0.0%) | 0 (0.0%) |
| 5 or more Children | 0 (0.0%) | 0 (0.0%) |
| Total | 0 (0.0%) | 4 (50.0%) |
Income Below Poverty Among Married-Couple vs Single-Parent Households in Sawyer
The poverty data for Sawyer shows that 8 of the married-couple family households (13.1%) and 4 of the single-parent households (26.7%) are living below the poverty level. Within the married-couple family households, those with 3 or 4 children have the highest poverty rate, with 2 households (50.0%) falling below the poverty line. Among the single-parent households, those with 1 or 2 children have the highest poverty rate, with 2 household (33.3%) living below poverty.
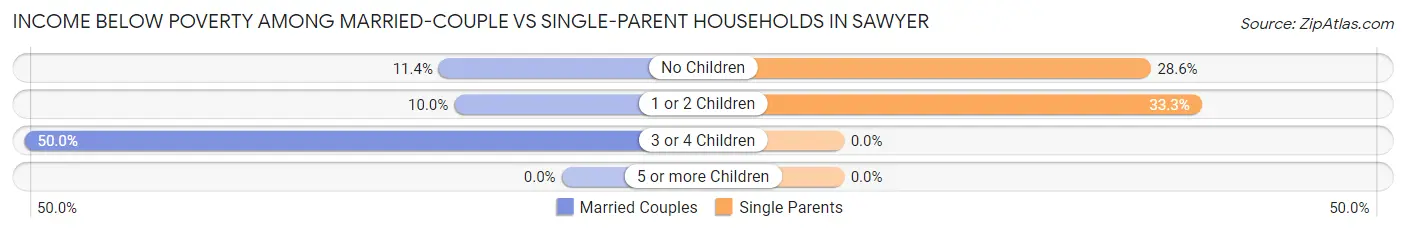
| Children | Married-Couple Families | Single-Parent Households |
| No Children | 4 (11.4%) | 2 (28.6%) |
| 1 or 2 Children | 2 (10.0%) | 2 (33.3%) |
| 3 or 4 Children | 2 (50.0%) | 0 (0.0%) |
| 5 or more Children | 0 (0.0%) | 0 (0.0%) |
| Total | 8 (13.1%) | 4 (26.7%) |
Race in Sawyer
The most populous races in Sawyer are White / Caucasian (274 | 65.1%), Native / Alaskan (91 | 21.6%), and Two or more Races (33 | 7.8%).
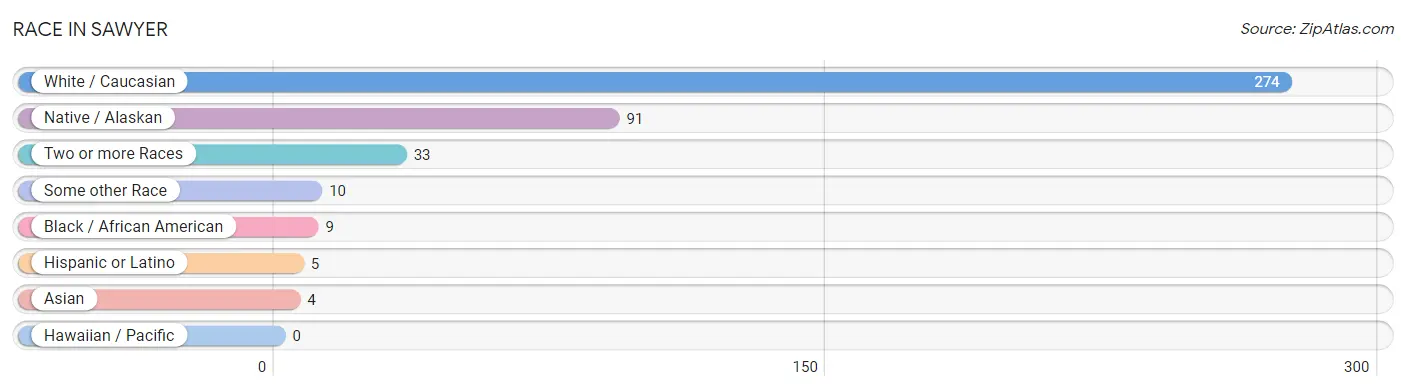
| Race | # Population | % Population |
| Asian | 4 | 0.9% |
| Black / African American | 9 | 2.1% |
| Hawaiian / Pacific | 0 | 0.0% |
| Hispanic or Latino | 5 | 1.2% |
| Native / Alaskan | 91 | 21.6% |
| White / Caucasian | 274 | 65.1% |
| Two or more Races | 33 | 7.8% |
| Some other Race | 10 | 2.4% |
| Total | 421 | 100.0% |
Ancestry in Sawyer
The most populous ancestries reported in Sawyer are Choctaw (95 | 22.6%), American (88 | 20.9%), Irish (40 | 9.5%), German (35 | 8.3%), and English (22 | 5.2%), together accounting for 66.5% of all Sawyer residents.
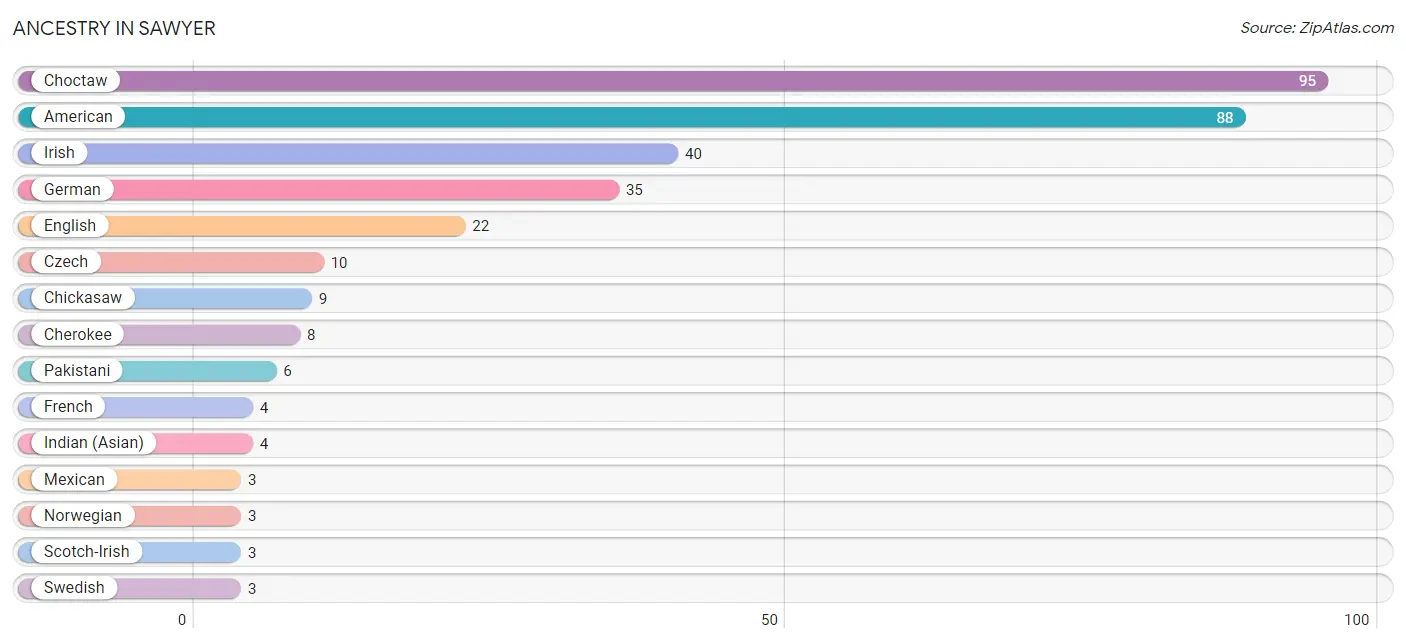
| Ancestry | # Population | % Population |
| American | 88 | 20.9% |
| Central American | 2 | 0.5% |
| Cherokee | 8 | 1.9% |
| Chickasaw | 9 | 2.1% |
| Choctaw | 95 | 22.6% |
| Czech | 10 | 2.4% |
| Dutch | 1 | 0.2% |
| English | 22 | 5.2% |
| French | 4 | 0.9% |
| German | 35 | 8.3% |
| Honduran | 2 | 0.5% |
| Indian (Asian) | 4 | 0.9% |
| Irish | 40 | 9.5% |
| Italian | 2 | 0.5% |
| Mexican | 3 | 0.7% |
| Norwegian | 3 | 0.7% |
| Pakistani | 6 | 1.4% |
| Scandinavian | 1 | 0.2% |
| Scotch-Irish | 3 | 0.7% |
| Scottish | 1 | 0.2% |
| Swedish | 3 | 0.7% | View All 21 Rows |
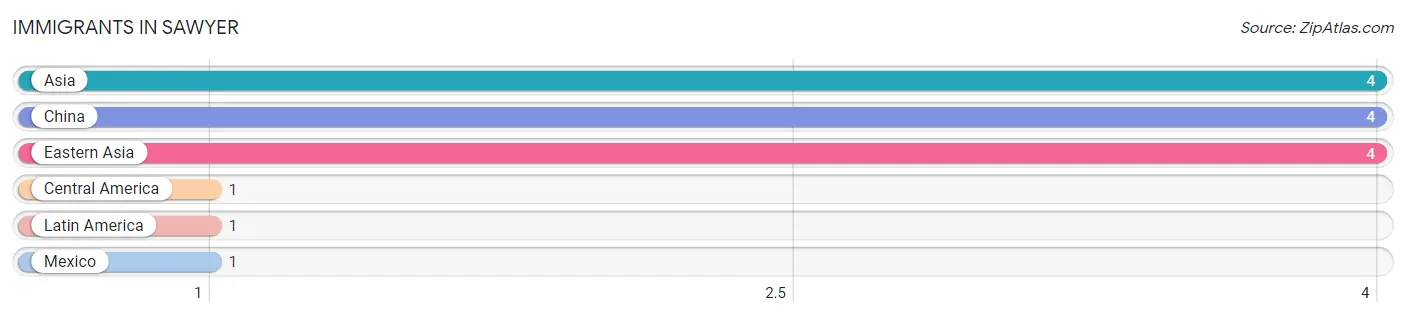
Immigrants in Sawyer
The most numerous immigrant groups reported in Sawyer came from Asia (4 | 0.9%), China (4 | 0.9%), Eastern Asia (4 | 0.9%), Central America (1 | 0.2%), and Latin America (1 | 0.2%), together accounting for 3.3% of all Sawyer residents.
| Immigration Origin | # Population | % Population |
| Asia | 4 | 0.9% |
| Central America | 1 | 0.2% |
| China | 4 | 0.9% |
| Eastern Asia | 4 | 0.9% |
| Latin America | 1 | 0.2% |
| Mexico | 1 | 0.2% | View All 6 Rows |
Sex and Age in Sawyer
Sex and Age in Sawyer
The most populous age groups in Sawyer are 15 to 19 Years (21 | 11.3%) for men and 75 to 79 Years (76 | 32.3%) for women.
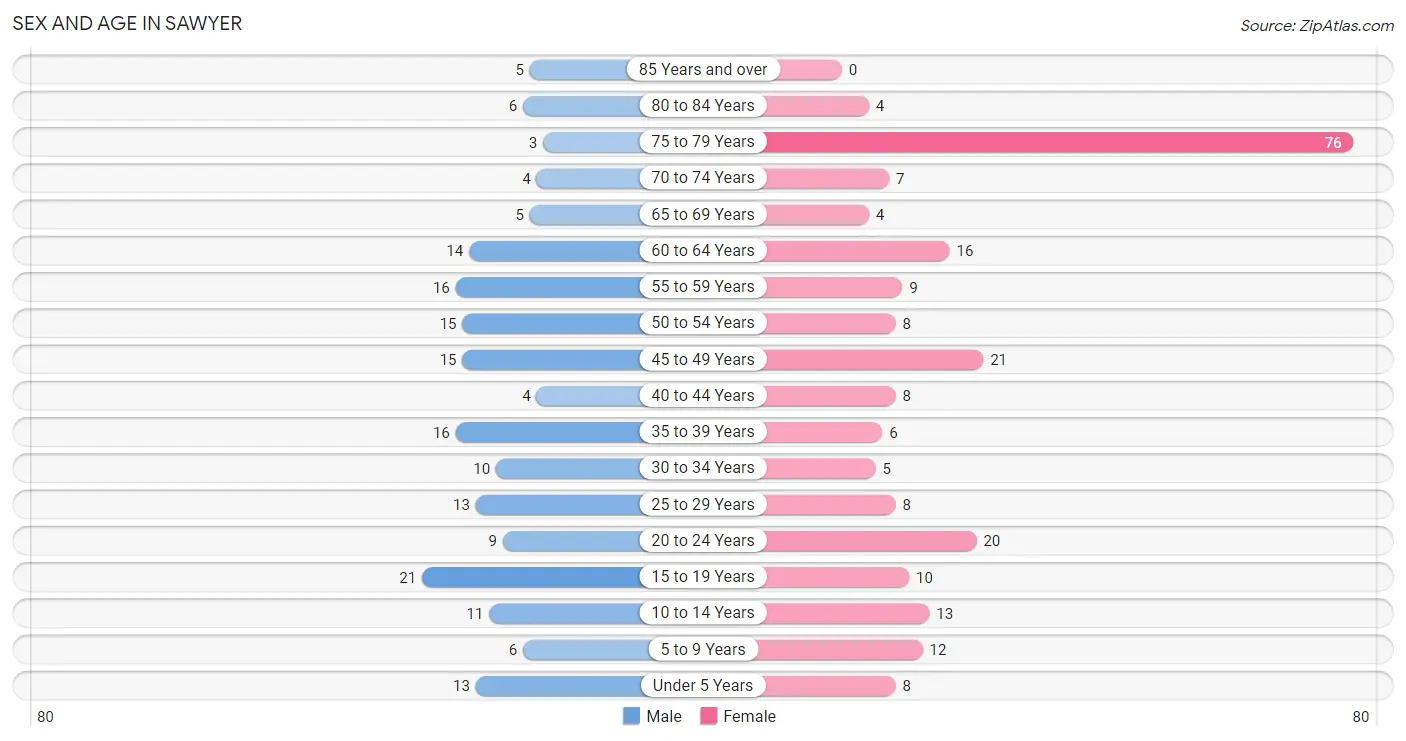
| Age Bracket | Male | Female |
| Under 5 Years | 13 (7.0%) | 8 (3.4%) |
| 5 to 9 Years | 6 (3.2%) | 12 (5.1%) |
| 10 to 14 Years | 11 (5.9%) | 13 (5.5%) |
| 15 to 19 Years | 21 (11.3%) | 10 (4.3%) |
| 20 to 24 Years | 9 (4.8%) | 20 (8.5%) |
| 25 to 29 Years | 13 (7.0%) | 8 (3.4%) |
| 30 to 34 Years | 10 (5.4%) | 5 (2.1%) |
| 35 to 39 Years | 16 (8.6%) | 6 (2.5%) |
| 40 to 44 Years | 4 (2.1%) | 8 (3.4%) |
| 45 to 49 Years | 15 (8.1%) | 21 (8.9%) |
| 50 to 54 Years | 15 (8.1%) | 8 (3.4%) |
| 55 to 59 Years | 16 (8.6%) | 9 (3.8%) |
| 60 to 64 Years | 14 (7.5%) | 16 (6.8%) |
| 65 to 69 Years | 5 (2.7%) | 4 (1.7%) |
| 70 to 74 Years | 4 (2.1%) | 7 (3.0%) |
| 75 to 79 Years | 3 (1.6%) | 76 (32.3%) |
| 80 to 84 Years | 6 (3.2%) | 4 (1.7%) |
| 85 Years and over | 5 (2.7%) | 0 (0.0%) |
| Total | 186 (100.0%) | 235 (100.0%) |
Families and Households in Sawyer
Median Family Size in Sawyer
The median family size in Sawyer is 4.78 persons per family, with married-couple families (61 | 80.3%) accounting for the largest median family size of 5.26 persons per family. On the other hand, single female/mother families (8 | 10.5%) represent the smallest median family size with 2.50 persons per family.
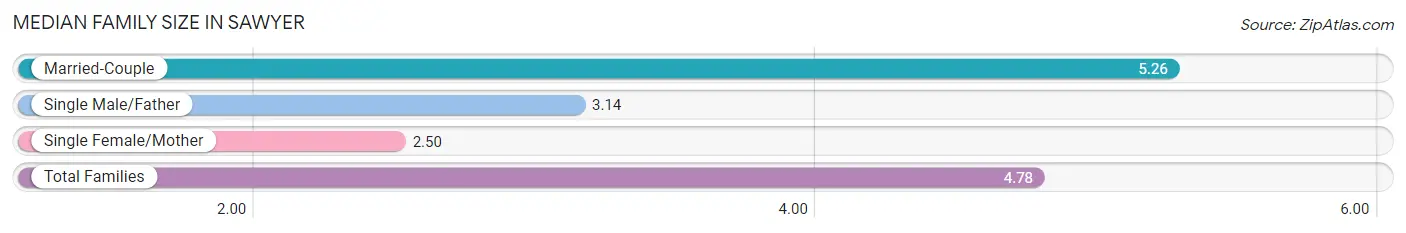
| Family Type | # Families | Family Size |
| Married-Couple | 61 (80.3%) | 5.26 |
| Single Male/Father | 7 (9.2%) | 3.14 |
| Single Female/Mother | 8 (10.5%) | 2.50 |
| Total Families | 76 (100.0%) | 4.78 |
Median Household Size in Sawyer
The median household size in Sawyer is 3.60 persons per household, with married-couple households (61 | 52.1%) accounting for the largest median household size of 5.26 persons per household. non-family households (41 | 35.0%) represent the smallest median household size with 1.32 persons per household.
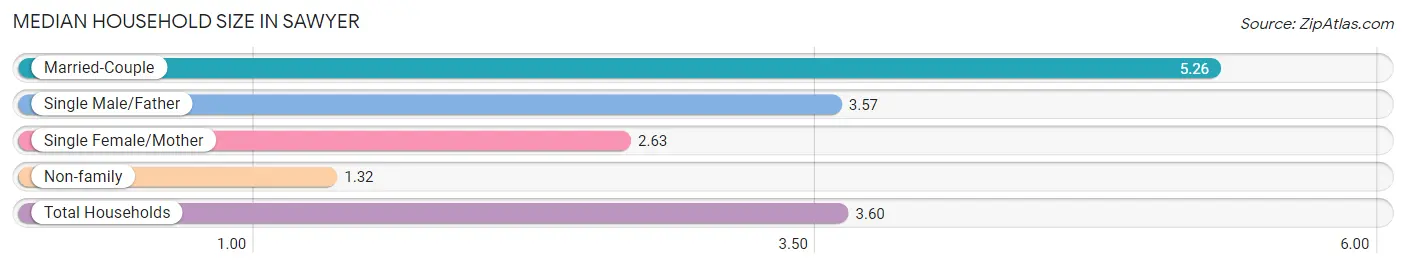
| Household Type | # Households | Household Size |
| Married-Couple | 61 (52.1%) | 5.26 |
| Single Male/Father | 7 (6.0%) | 3.57 |
| Single Female/Mother | 8 (6.8%) | 2.63 |
| Non-family | 41 (35.0%) | 1.32 |
| Total Households | 117 (100.0%) | 3.60 |
Household Size by Marriage Status in Sawyer
Out of a total of 117 households in Sawyer, 76 (65.0%) are family households, while 41 (35.0%) are nonfamily households. The most numerous type of family households are 2-person households, comprising 41, and the most common type of nonfamily households are 1-person households, comprising 29.
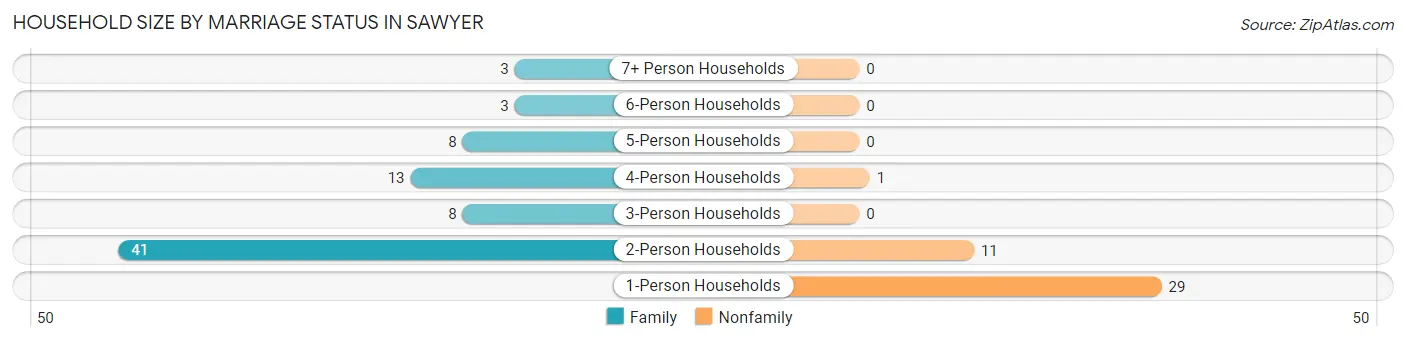
| Household Size | Family Households | Nonfamily Households |
| 1-Person Households | - | 29 (24.8%) |
| 2-Person Households | 41 (35.0%) | 11 (9.4%) |
| 3-Person Households | 8 (6.8%) | 0 (0.0%) |
| 4-Person Households | 13 (11.1%) | 1 (0.9%) |
| 5-Person Households | 8 (6.8%) | 0 (0.0%) |
| 6-Person Households | 3 (2.6%) | 0 (0.0%) |
| 7+ Person Households | 3 (2.6%) | 0 (0.0%) |
| Total | 76 (65.0%) | 41 (35.0%) |
Female Fertility in Sawyer
Fertility by Age in Sawyer
Average fertility rate in Sawyer is 210.0 births per 1,000 women. Women in the age bracket of 20 to 34 years have the highest fertility rate with 455.0 births per 1,000 women. Women in the age bracket of 20 to 34 years acount for 88.2% of all women with births.
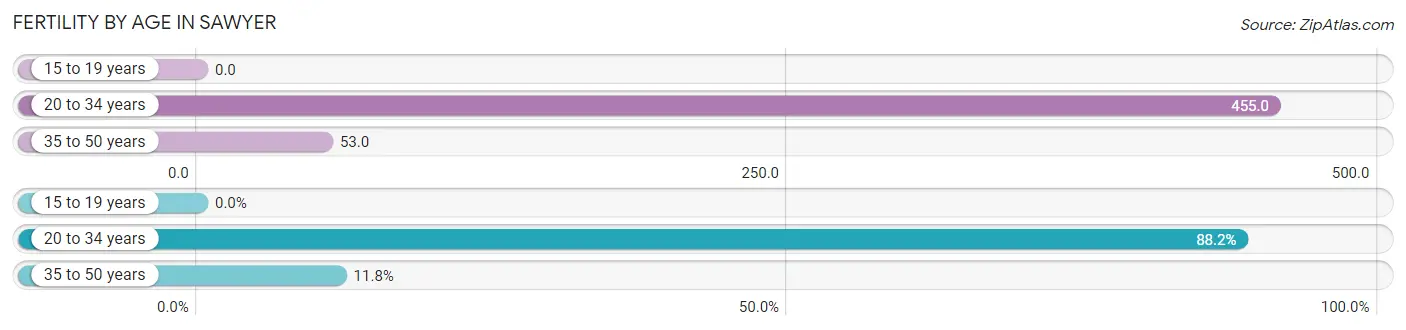
| Age Bracket | Women with Births | Births / 1,000 Women |
| 15 to 19 years | 0 (0.0%) | 0.0 |
| 20 to 34 years | 15 (88.2%) | 455.0 |
| 35 to 50 years | 2 (11.8%) | 53.0 |
| Total | 17 (100.0%) | 210.0 |
Fertility by Age by Marriage Status in Sawyer
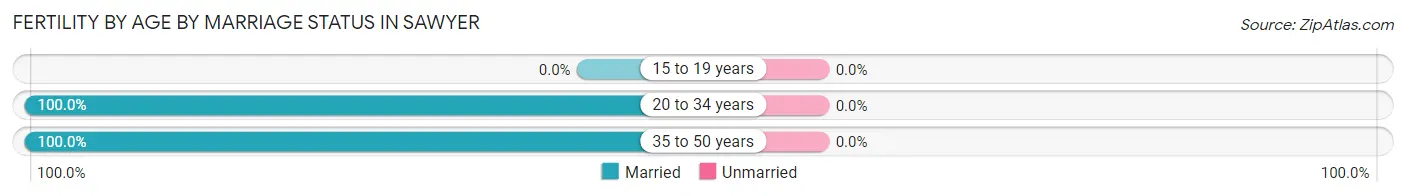
| Age Bracket | Married | Unmarried |
| 15 to 19 years | 0 (0.0%) | 0 (0.0%) |
| 20 to 34 years | 15 (100.0%) | 0 (0.0%) |
| 35 to 50 years | 2 (100.0%) | 0 (0.0%) |
| Total | 17 (100.0%) | 0 (0.0%) |
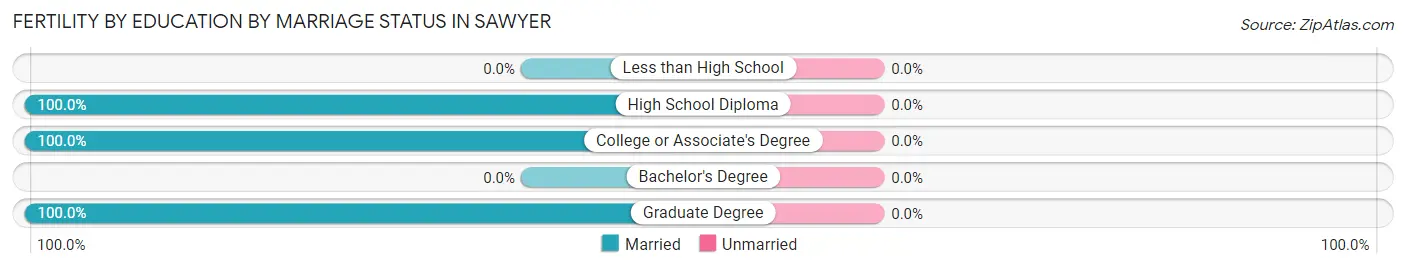
Fertility by Education in Sawyer
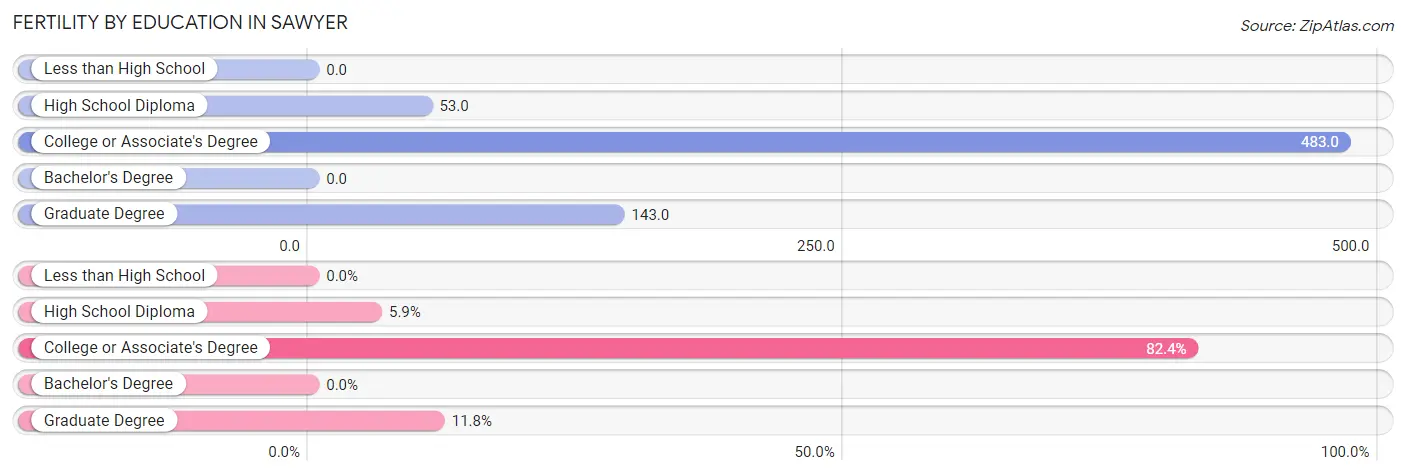
| Educational Attainment | Women with Births | Births / 1,000 Women |
| Less than High School | 0 (0.0%) | 0.0 |
| High School Diploma | 1 (5.9%) | 53.0 |
| College or Associate's Degree | 14 (82.4%) | 483.0 |
| Bachelor's Degree | 0 (0.0%) | 0.0 |
| Graduate Degree | 2 (11.8%) | 143.0 |
| Total | 17 (100.0%) | 210.0 |
Fertility by Education by Marriage Status in Sawyer
| Educational Attainment | Married | Unmarried |
| Less than High School | 0 (0.0%) | 0 (0.0%) |
| High School Diploma | 1 (100.0%) | 0 (0.0%) |
| College or Associate's Degree | 14 (100.0%) | 0 (0.0%) |
| Bachelor's Degree | 0 (0.0%) | 0 (0.0%) |
| Graduate Degree | 2 (100.0%) | 0 (0.0%) |
| Total | 17 (100.0%) | 0 (0.0%) |
Employment Characteristics in Sawyer
Employment by Class of Employer in Sawyer
Among the 135 employed individuals in Sawyer, private company employees (85 | 63.0%), local government employees (27 | 20.0%), and self-employed (not incorporated) (8 | 5.9%) make up the most common classes of employment.
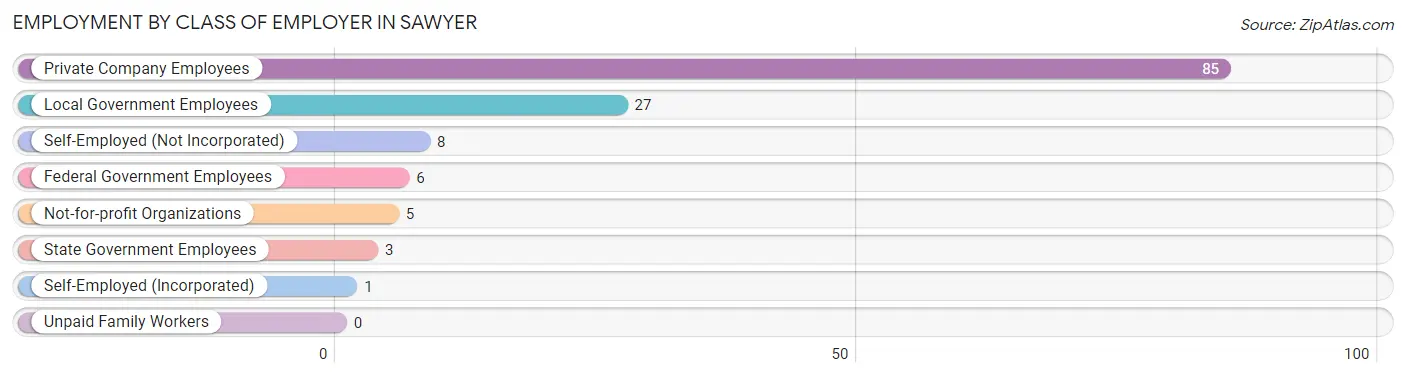
| Employer Class | # Employees | % Employees |
| Private Company Employees | 85 | 63.0% |
| Self-Employed (Incorporated) | 1 | 0.7% |
| Self-Employed (Not Incorporated) | 8 | 5.9% |
| Not-for-profit Organizations | 5 | 3.7% |
| Local Government Employees | 27 | 20.0% |
| State Government Employees | 3 | 2.2% |
| Federal Government Employees | 6 | 4.4% |
| Unpaid Family Workers | 0 | 0.0% |
| Total | 135 | 100.0% |
Employment Status by Age in Sawyer
According to the labor force statistics for Sawyer, out of the total population over 16 years of age (353), 41.6% or 147 individuals are in the labor force, with 4.8% or 7 of them unemployed. The age group with the highest labor force participation rate is 30 to 34 years, with 80.0% or 12 individuals in the labor force. Within the labor force, the 16 to 19 years age range has the highest percentage of unemployed individuals, with 62.5% or 5 of them being unemployed.
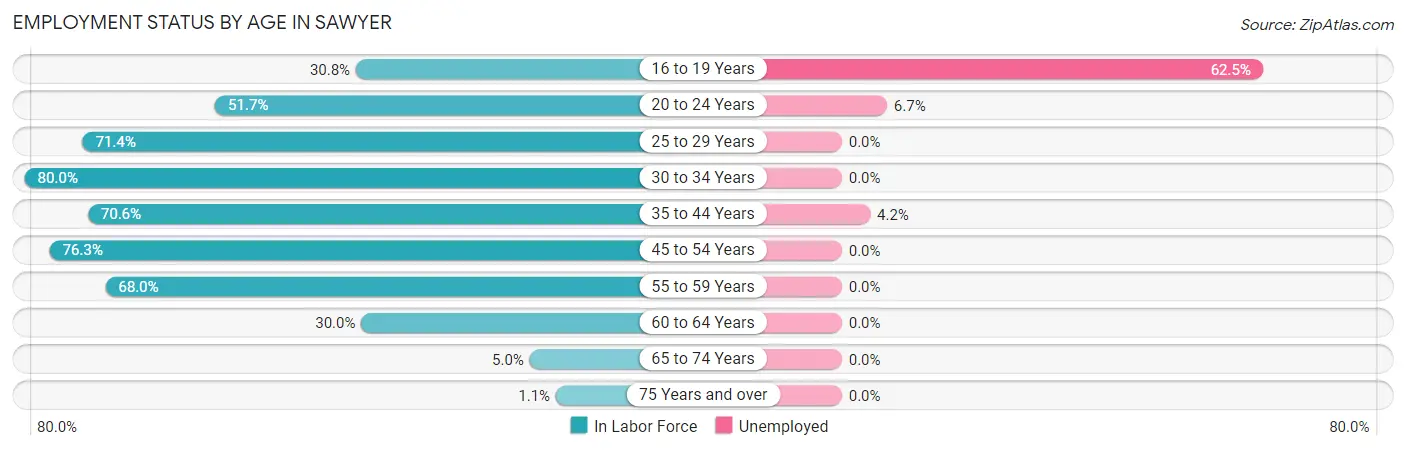
| Age Bracket | In Labor Force | Unemployed |
| 16 to 19 Years | 8 (30.8%) | 5 (62.5%) |
| 20 to 24 Years | 15 (51.7%) | 1 (6.7%) |
| 25 to 29 Years | 15 (71.4%) | 0 (0.0%) |
| 30 to 34 Years | 12 (80.0%) | 0 (0.0%) |
| 35 to 44 Years | 24 (70.6%) | 1 (4.2%) |
| 45 to 54 Years | 45 (76.3%) | 0 (0.0%) |
| 55 to 59 Years | 17 (68.0%) | 0 (0.0%) |
| 60 to 64 Years | 9 (30.0%) | 0 (0.0%) |
| 65 to 74 Years | 1 (5.0%) | 0 (0.0%) |
| 75 Years and over | 1 (1.1%) | 0 (0.0%) |
| Total | 147 (41.6%) | 7 (4.8%) |
Employment Status by Educational Attainment in Sawyer
According to labor force statistics for Sawyer, 66.3% of individuals (122) out of the total population between 25 and 64 years of age (184) are in the labor force, with 0.8% or 1 of them being unemployed. The group with the highest labor force participation rate are those with the educational attainment of college / associate degree, with 79.6% or 43 individuals in the labor force. Within the labor force, individuals with college / associate degree education have the highest percentage of unemployment, with 2.3% or 1 of them being unemployed.
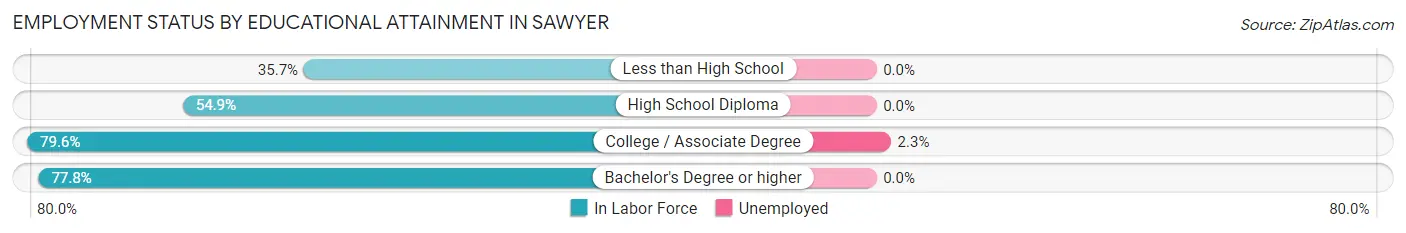
| Educational Attainment | In Labor Force | Unemployed |
| Less than High School | 5 (35.7%) | 0 (0.0%) |
| High School Diploma | 39 (54.9%) | 0 (0.0%) |
| College / Associate Degree | 43 (79.6%) | 1 (2.3%) |
| Bachelor's Degree or higher | 35 (77.8%) | 0 (0.0%) |
| Total | 122 (66.3%) | 1 (0.8%) |
Employment Occupations by Sex in Sawyer
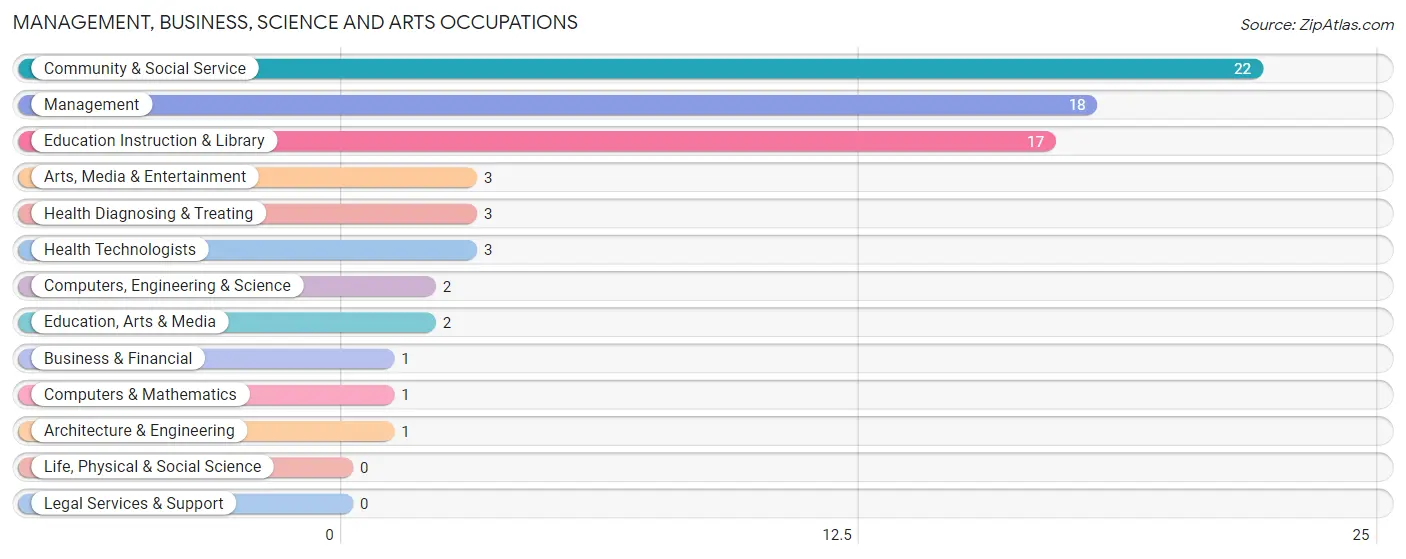
Management, Business, Science and Arts Occupations
The most common Management, Business, Science and Arts occupations in Sawyer are Community & Social Service (22 | 15.7%), Management (18 | 12.9%), Education Instruction & Library (17 | 12.1%), Arts, Media & Entertainment (3 | 2.1%), and Health Diagnosing & Treating (3 | 2.1%).
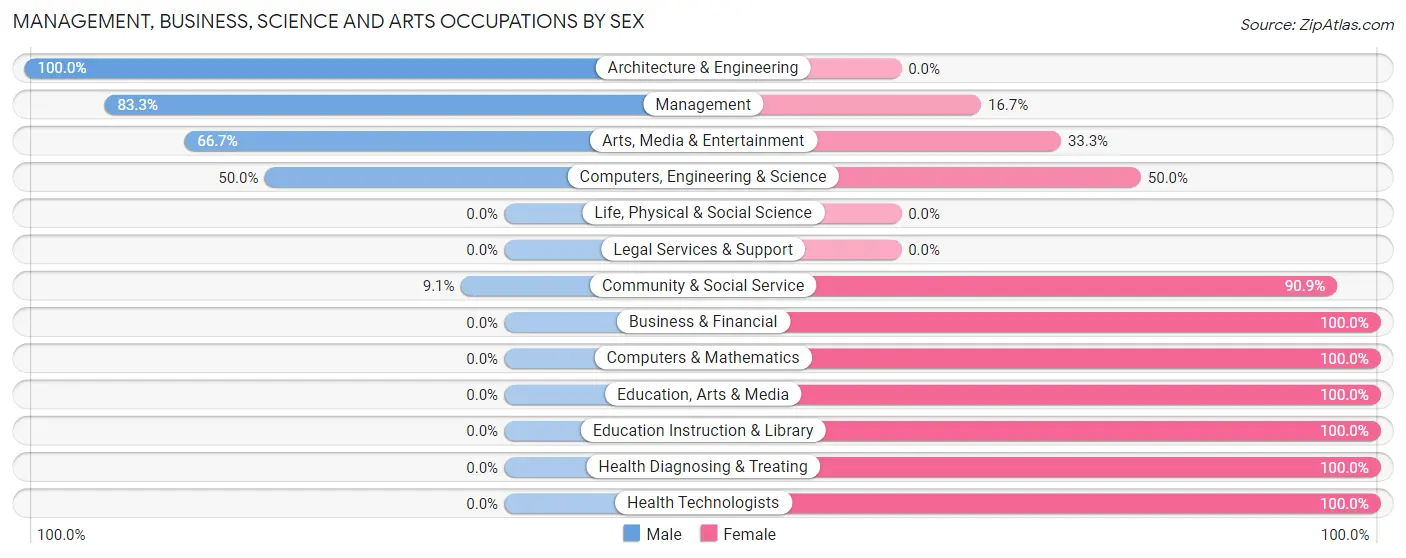
Management, Business, Science and Arts Occupations by Sex
Within the Management, Business, Science and Arts occupations in Sawyer, the most male-oriented occupations are Architecture & Engineering (100.0%), Management (83.3%), and Arts, Media & Entertainment (66.7%), while the most female-oriented occupations are Business & Financial (100.0%), Computers & Mathematics (100.0%), and Education, Arts & Media (100.0%).
| Occupation | Male | Female |
| Management | 15 (83.3%) | 3 (16.7%) |
| Business & Financial | 0 (0.0%) | 1 (100.0%) |
| Computers, Engineering & Science | 1 (50.0%) | 1 (50.0%) |
| Computers & Mathematics | 0 (0.0%) | 1 (100.0%) |
| Architecture & Engineering | 1 (100.0%) | 0 (0.0%) |
| Life, Physical & Social Science | 0 (0.0%) | 0 (0.0%) |
| Community & Social Service | 2 (9.1%) | 20 (90.9%) |
| Education, Arts & Media | 0 (0.0%) | 2 (100.0%) |
| Legal Services & Support | 0 (0.0%) | 0 (0.0%) |
| Education Instruction & Library | 0 (0.0%) | 17 (100.0%) |
| Arts, Media & Entertainment | 2 (66.7%) | 1 (33.3%) |
| Health Diagnosing & Treating | 0 (0.0%) | 3 (100.0%) |
| Health Technologists | 0 (0.0%) | 3 (100.0%) |
| Total (Category) | 18 (39.1%) | 28 (60.9%) |
| Total (Overall) | 83 (59.3%) | 57 (40.7%) |
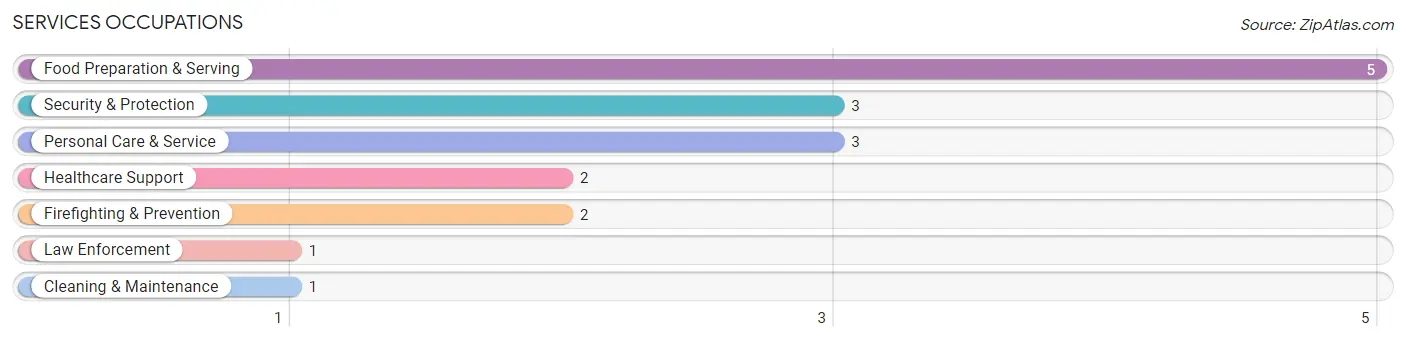
Services Occupations
The most common Services occupations in Sawyer are Food Preparation & Serving (5 | 3.6%), Security & Protection (3 | 2.1%), Personal Care & Service (3 | 2.1%), Healthcare Support (2 | 1.4%), and Firefighting & Prevention (2 | 1.4%).
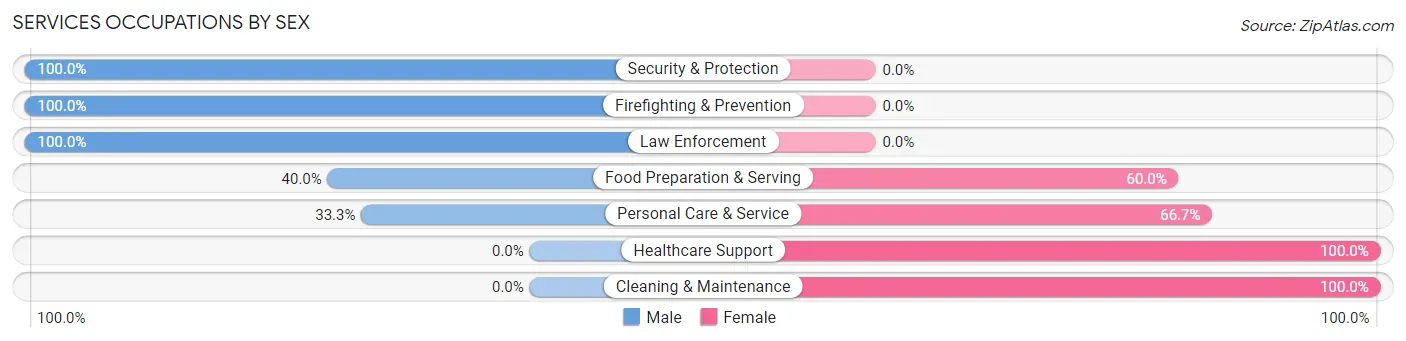
Services Occupations by Sex
Within the Services occupations in Sawyer, the most male-oriented occupations are Security & Protection (100.0%), Firefighting & Prevention (100.0%), and Law Enforcement (100.0%), while the most female-oriented occupations are Healthcare Support (100.0%), Cleaning & Maintenance (100.0%), and Personal Care & Service (66.7%).
| Occupation | Male | Female |
| Healthcare Support | 0 (0.0%) | 2 (100.0%) |
| Security & Protection | 3 (100.0%) | 0 (0.0%) |
| Firefighting & Prevention | 2 (100.0%) | 0 (0.0%) |
| Law Enforcement | 1 (100.0%) | 0 (0.0%) |
| Food Preparation & Serving | 2 (40.0%) | 3 (60.0%) |
| Cleaning & Maintenance | 0 (0.0%) | 1 (100.0%) |
| Personal Care & Service | 1 (33.3%) | 2 (66.7%) |
| Total (Category) | 6 (42.9%) | 8 (57.1%) |
| Total (Overall) | 83 (59.3%) | 57 (40.7%) |
Sales and Office Occupations
The most common Sales and Office occupations in Sawyer are Office & Administration (12 | 8.6%), and Sales & Related (9 | 6.4%).
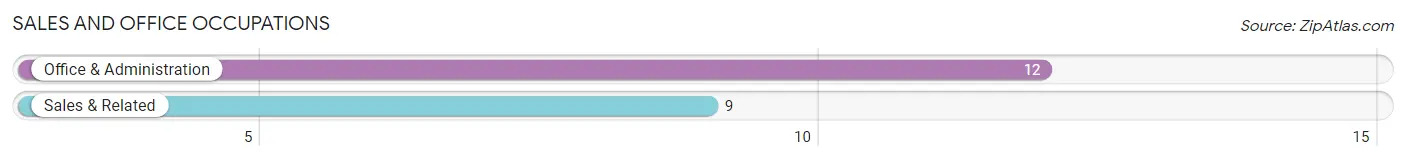
Sales and Office Occupations by Sex
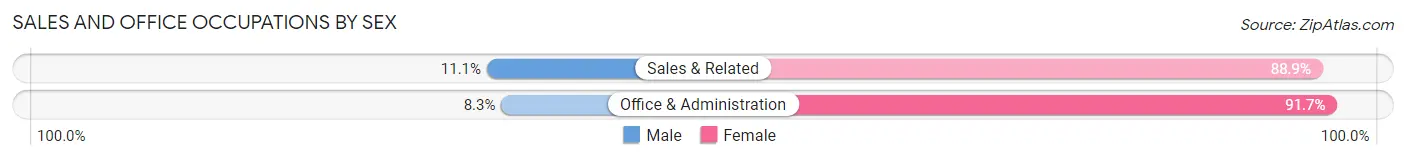
| Occupation | Male | Female |
| Sales & Related | 1 (11.1%) | 8 (88.9%) |
| Office & Administration | 1 (8.3%) | 11 (91.7%) |
| Total (Category) | 2 (9.5%) | 19 (90.5%) |
| Total (Overall) | 83 (59.3%) | 57 (40.7%) |
Natural Resources, Construction and Maintenance Occupations
The most common Natural Resources, Construction and Maintenance occupations in Sawyer are Construction & Extraction (16 | 11.4%), Installation, Maintenance & Repair (6 | 4.3%), and Farming, Fishing & Forestry (3 | 2.1%).
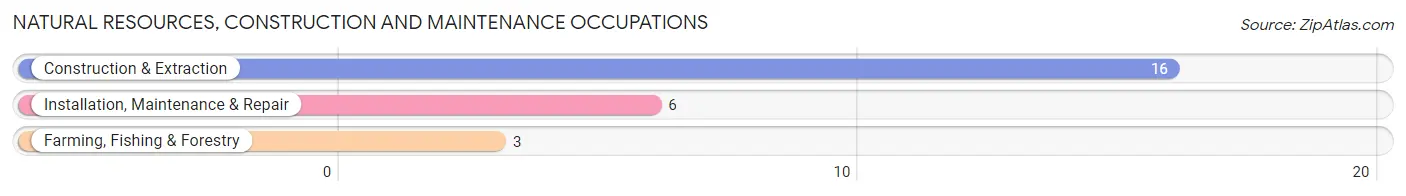
Natural Resources, Construction and Maintenance Occupations by Sex
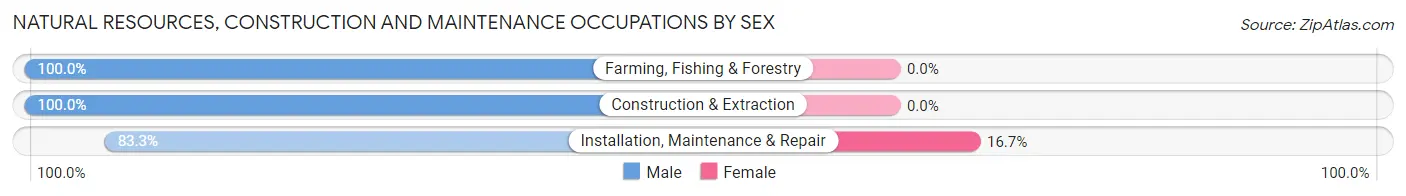
| Occupation | Male | Female |
| Farming, Fishing & Forestry | 3 (100.0%) | 0 (0.0%) |
| Construction & Extraction | 16 (100.0%) | 0 (0.0%) |
| Installation, Maintenance & Repair | 5 (83.3%) | 1 (16.7%) |
| Total (Category) | 24 (96.0%) | 1 (4.0%) |
| Total (Overall) | 83 (59.3%) | 57 (40.7%) |
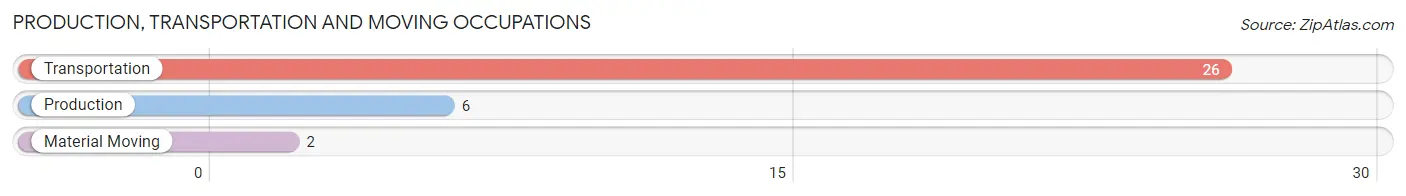
Production, Transportation and Moving Occupations
The most common Production, Transportation and Moving occupations in Sawyer are Transportation (26 | 18.6%), Production (6 | 4.3%), and Material Moving (2 | 1.4%).
Production, Transportation and Moving Occupations by Sex
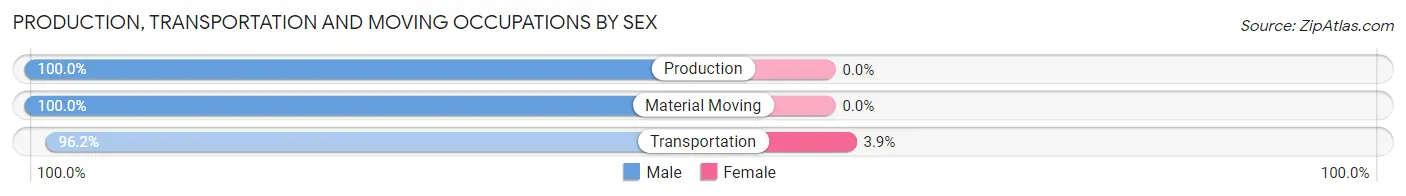
| Occupation | Male | Female |
| Production | 6 (100.0%) | 0 (0.0%) |
| Transportation | 25 (96.2%) | 1 (3.8%) |
| Material Moving | 2 (100.0%) | 0 (0.0%) |
| Total (Category) | 33 (97.1%) | 1 (2.9%) |
| Total (Overall) | 83 (59.3%) | 57 (40.7%) |
Employment Industries by Sex in Sawyer
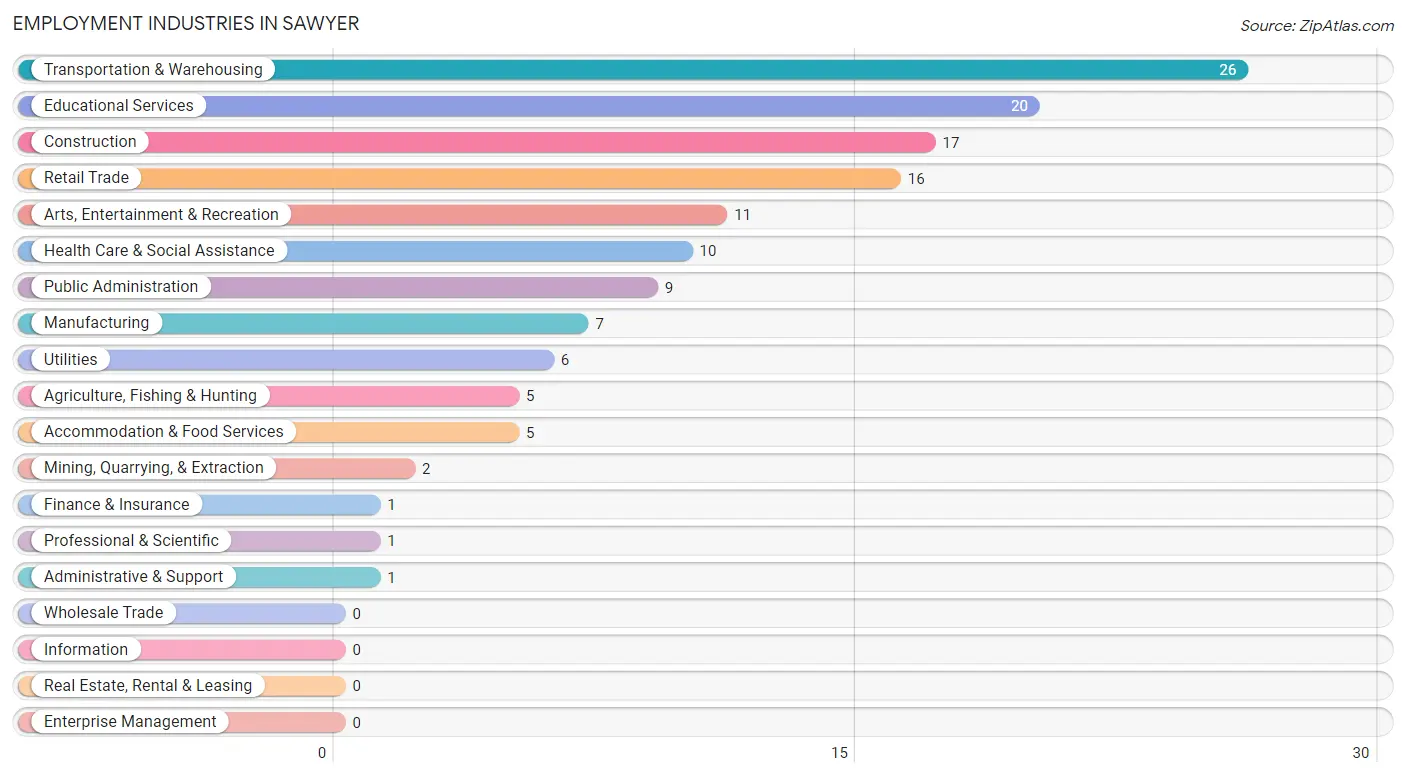
Employment Industries in Sawyer
The major employment industries in Sawyer include Transportation & Warehousing (26 | 18.6%), Educational Services (20 | 14.3%), Construction (17 | 12.1%), Retail Trade (16 | 11.4%), and Arts, Entertainment & Recreation (11 | 7.9%).
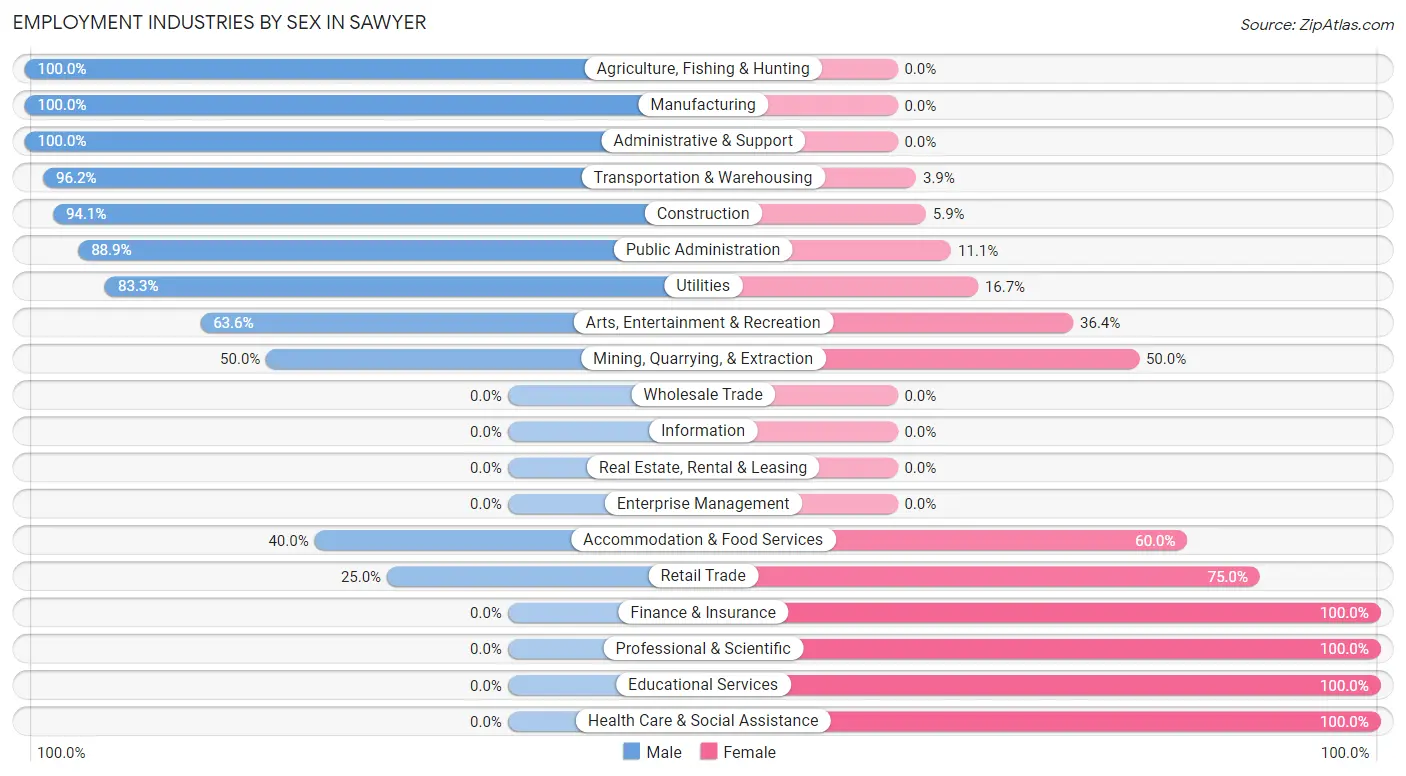
Employment Industries by Sex in Sawyer
The Sawyer industries that see more men than women are Agriculture, Fishing & Hunting (100.0%), Manufacturing (100.0%), and Administrative & Support (100.0%), whereas the industries that tend to have a higher number of women are Finance & Insurance (100.0%), Professional & Scientific (100.0%), and Educational Services (100.0%).
| Industry | Male | Female |
| Agriculture, Fishing & Hunting | 5 (100.0%) | 0 (0.0%) |
| Mining, Quarrying, & Extraction | 1 (50.0%) | 1 (50.0%) |
| Construction | 16 (94.1%) | 1 (5.9%) |
| Manufacturing | 7 (100.0%) | 0 (0.0%) |
| Wholesale Trade | 0 (0.0%) | 0 (0.0%) |
| Retail Trade | 4 (25.0%) | 12 (75.0%) |
| Transportation & Warehousing | 25 (96.2%) | 1 (3.8%) |
| Utilities | 5 (83.3%) | 1 (16.7%) |
| Information | 0 (0.0%) | 0 (0.0%) |
| Finance & Insurance | 0 (0.0%) | 1 (100.0%) |
| Real Estate, Rental & Leasing | 0 (0.0%) | 0 (0.0%) |
| Professional & Scientific | 0 (0.0%) | 1 (100.0%) |
| Enterprise Management | 0 (0.0%) | 0 (0.0%) |
| Administrative & Support | 1 (100.0%) | 0 (0.0%) |
| Educational Services | 0 (0.0%) | 20 (100.0%) |
| Health Care & Social Assistance | 0 (0.0%) | 10 (100.0%) |
| Arts, Entertainment & Recreation | 7 (63.6%) | 4 (36.4%) |
| Accommodation & Food Services | 2 (40.0%) | 3 (60.0%) |
| Public Administration | 8 (88.9%) | 1 (11.1%) |
| Total | 83 (59.3%) | 57 (40.7%) |
Education in Sawyer
School Enrollment in Sawyer
The most common levels of schooling among the 91 students in Sawyer are high school (30 | 33.0%), middle school (22 | 24.2%), and elementary school (18 | 19.8%).
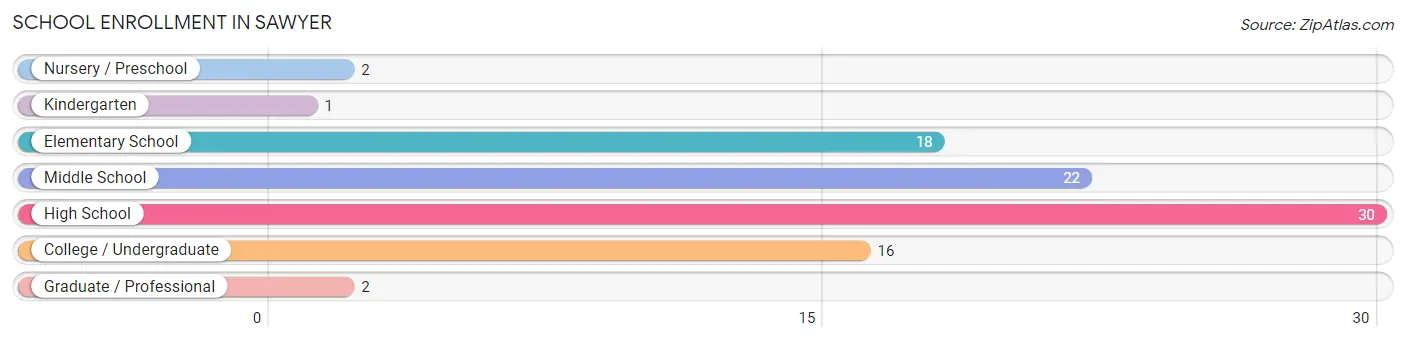
| School Level | # Students | % Students |
| Nursery / Preschool | 2 | 2.2% |
| Kindergarten | 1 | 1.1% |
| Elementary School | 18 | 19.8% |
| Middle School | 22 | 24.2% |
| High School | 30 | 33.0% |
| College / Undergraduate | 16 | 17.6% |
| Graduate / Professional | 2 | 2.2% |
| Total | 91 | 100.0% |
School Enrollment by Age by Funding Source in Sawyer
Out of a total of 91 students who are enrolled in schools in Sawyer, 6 (6.6%) attend a private institution, while the remaining 85 (93.4%) are enrolled in public schools. The age group of 5 to 9 year old has the highest likelihood of being enrolled in private schools, with 4 (22.2% in the age bracket) enrolled. Conversely, the age group of 3 to 4 year olds has the lowest likelihood of being enrolled in a private school, with 2 (100.0% in the age bracket) attending a public institution.
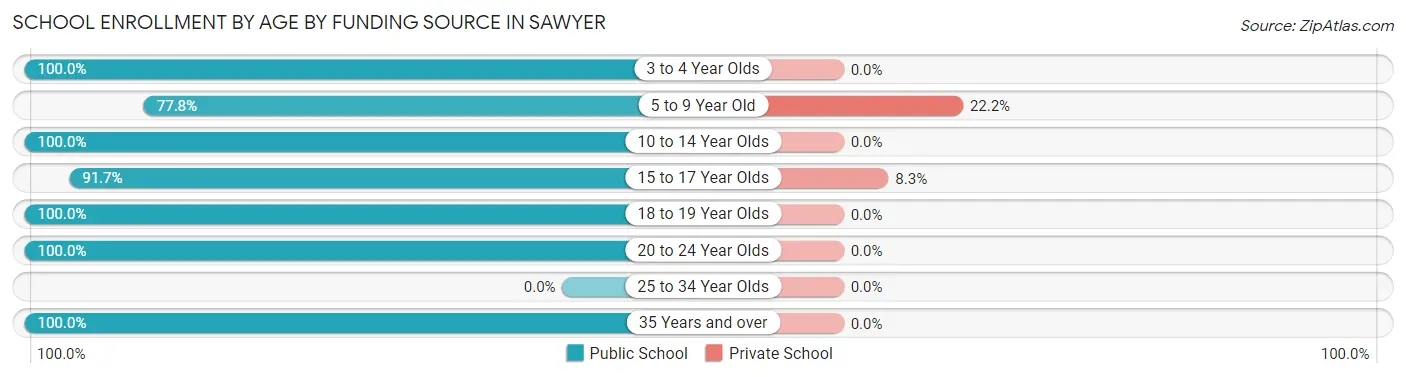
| Age Bracket | Public School | Private School |
| 3 to 4 Year Olds | 2 (100.0%) | 0 (0.0%) |
| 5 to 9 Year Old | 14 (77.8%) | 4 (22.2%) |
| 10 to 14 Year Olds | 24 (100.0%) | 0 (0.0%) |
| 15 to 17 Year Olds | 22 (91.7%) | 2 (8.3%) |
| 18 to 19 Year Olds | 5 (100.0%) | 0 (0.0%) |
| 20 to 24 Year Olds | 14 (100.0%) | 0 (0.0%) |
| 25 to 34 Year Olds | 0 (0.0%) | 0 (0.0%) |
| 35 Years and over | 4 (100.0%) | 0 (0.0%) |
| Total | 85 (93.4%) | 6 (6.6%) |
Educational Attainment by Field of Study in Sawyer
Education (22 | 45.8%), business (11 | 22.9%), arts & humanities (5 | 10.4%), social sciences (3 | 6.2%), and engineering (3 | 6.2%) are the most common fields of study among 48 individuals in Sawyer who have obtained a bachelor's degree or higher.
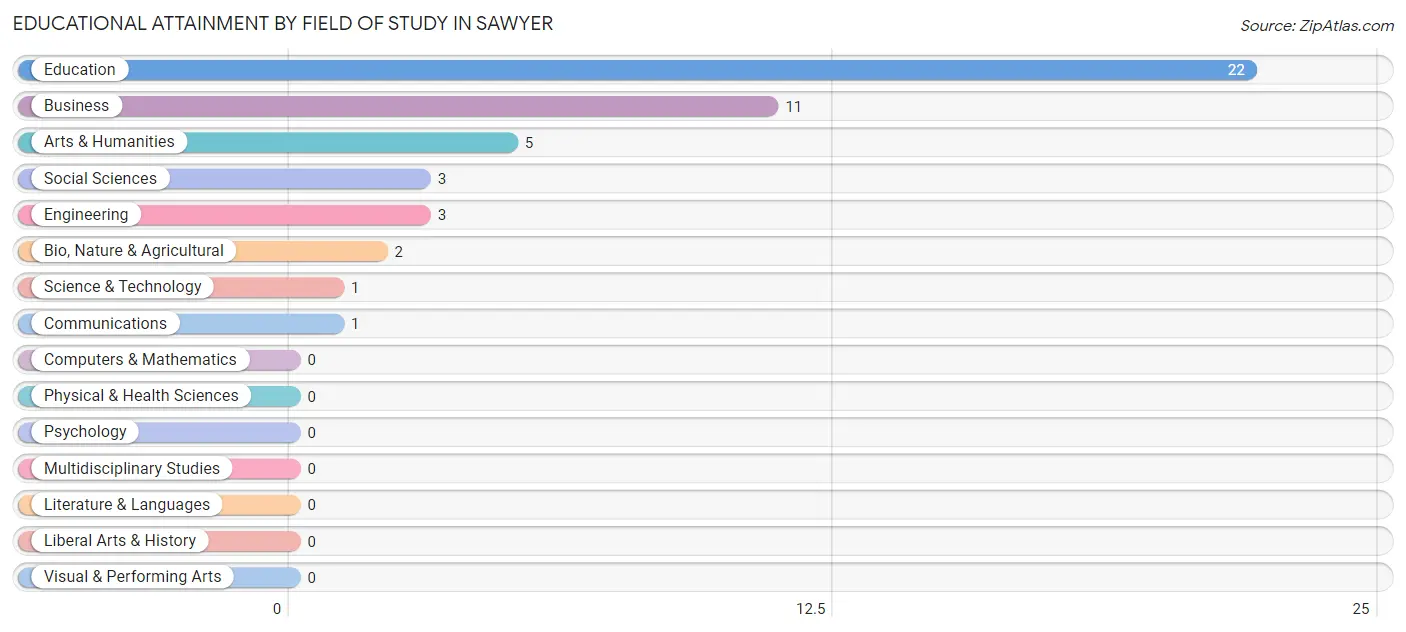
| Field of Study | # Graduates | % Graduates |
| Computers & Mathematics | 0 | 0.0% |
| Bio, Nature & Agricultural | 2 | 4.2% |
| Physical & Health Sciences | 0 | 0.0% |
| Psychology | 0 | 0.0% |
| Social Sciences | 3 | 6.2% |
| Engineering | 3 | 6.2% |
| Multidisciplinary Studies | 0 | 0.0% |
| Science & Technology | 1 | 2.1% |
| Business | 11 | 22.9% |
| Education | 22 | 45.8% |
| Literature & Languages | 0 | 0.0% |
| Liberal Arts & History | 0 | 0.0% |
| Visual & Performing Arts | 0 | 0.0% |
| Communications | 1 | 2.1% |
| Arts & Humanities | 5 | 10.4% |
| Total | 48 | 100.0% |
Transportation & Commute in Sawyer
Vehicle Availability by Sex in Sawyer
The most prevalent vehicle ownership categories in Sawyer are males with 4 vehicles (28, accounting for 34.2%) and females with 4 vehicles (16, making up 52.8%).
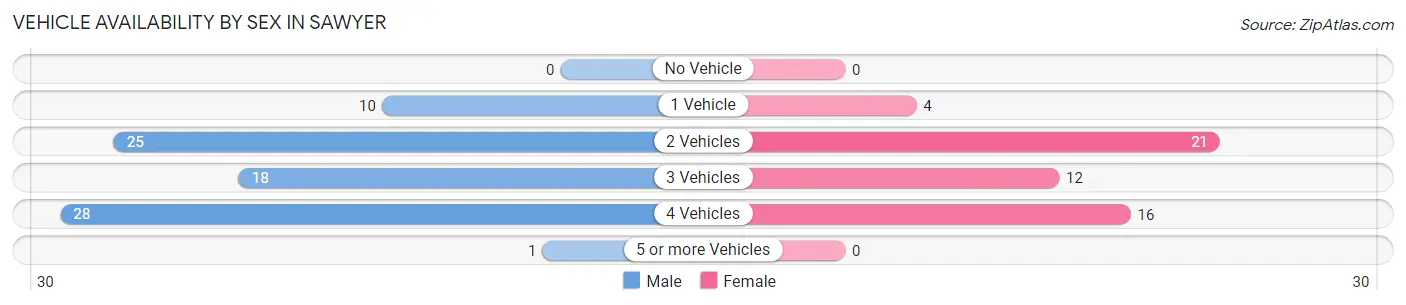
| Vehicles Available | Male | Female |
| No Vehicle | 0 (0.0%) | 0 (0.0%) |
| 1 Vehicle | 10 (12.2%) | 4 (7.5%) |
| 2 Vehicles | 25 (30.5%) | 21 (39.6%) |
| 3 Vehicles | 18 (22.0%) | 12 (22.6%) |
| 4 Vehicles | 28 (34.2%) | 16 (30.2%) |
| 5 or more Vehicles | 1 (1.2%) | 0 (0.0%) |
| Total | 82 (100.0%) | 53 (100.0%) |
Commute Time in Sawyer
The most frequently occuring commute durations in Sawyer are 15 to 19 minutes (28 commuters, 22.2%), 90 or more minutes (26 commuters, 20.6%), and 10 to 14 minutes (19 commuters, 15.1%).
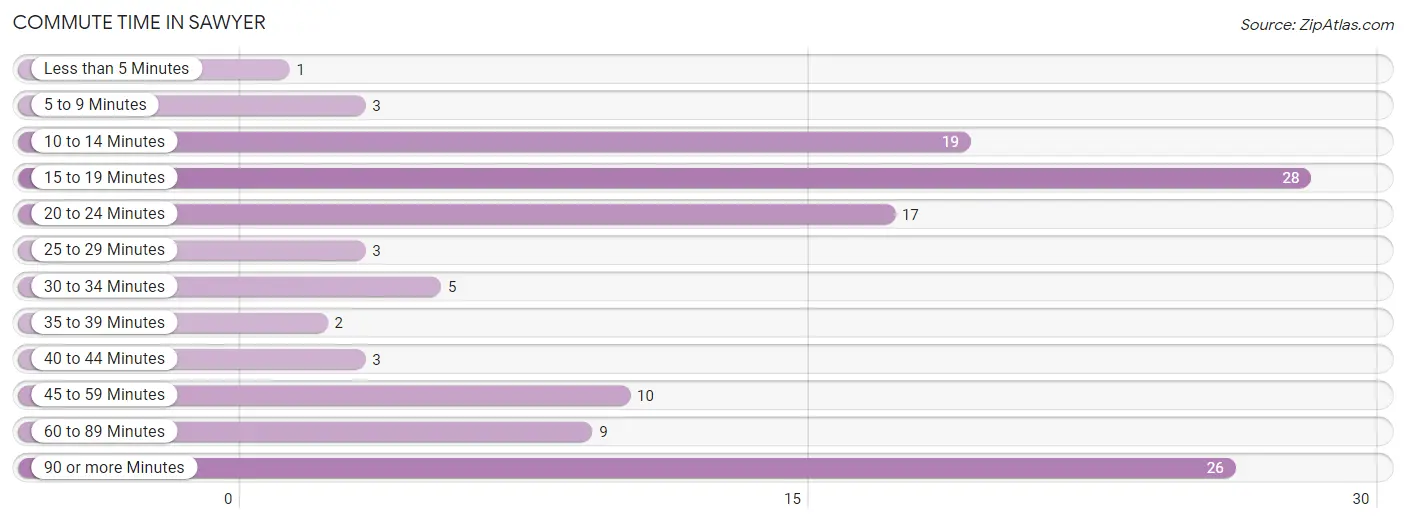
| Commute Time | # Commuters | % Commuters |
| Less than 5 Minutes | 1 | 0.8% |
| 5 to 9 Minutes | 3 | 2.4% |
| 10 to 14 Minutes | 19 | 15.1% |
| 15 to 19 Minutes | 28 | 22.2% |
| 20 to 24 Minutes | 17 | 13.5% |
| 25 to 29 Minutes | 3 | 2.4% |
| 30 to 34 Minutes | 5 | 4.0% |
| 35 to 39 Minutes | 2 | 1.6% |
| 40 to 44 Minutes | 3 | 2.4% |
| 45 to 59 Minutes | 10 | 7.9% |
| 60 to 89 Minutes | 9 | 7.1% |
| 90 or more Minutes | 26 | 20.6% |
Commute Time by Sex in Sawyer
The most common commute times in Sawyer are 90 or more minutes (26 commuters, 35.1%) for males and 15 to 19 minutes (25 commuters, 48.1%) for females.
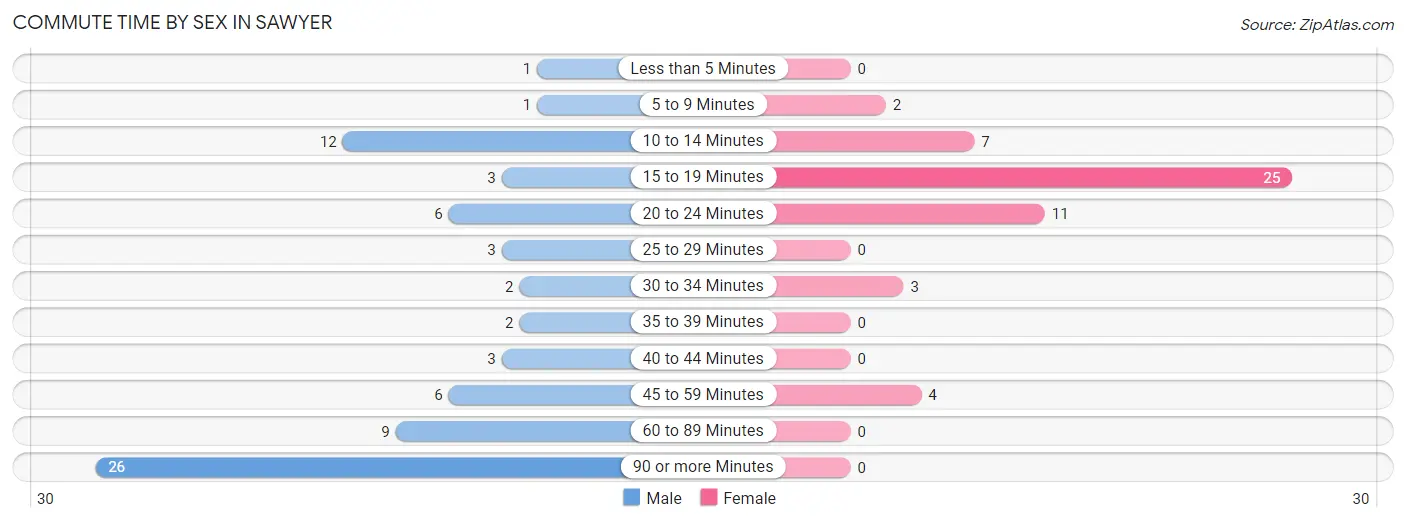
| Commute Time | Male | Female |
| Less than 5 Minutes | 1 (1.3%) | 0 (0.0%) |
| 5 to 9 Minutes | 1 (1.3%) | 2 (3.8%) |
| 10 to 14 Minutes | 12 (16.2%) | 7 (13.5%) |
| 15 to 19 Minutes | 3 (4.1%) | 25 (48.1%) |
| 20 to 24 Minutes | 6 (8.1%) | 11 (21.1%) |
| 25 to 29 Minutes | 3 (4.1%) | 0 (0.0%) |
| 30 to 34 Minutes | 2 (2.7%) | 3 (5.8%) |
| 35 to 39 Minutes | 2 (2.7%) | 0 (0.0%) |
| 40 to 44 Minutes | 3 (4.1%) | 0 (0.0%) |
| 45 to 59 Minutes | 6 (8.1%) | 4 (7.7%) |
| 60 to 89 Minutes | 9 (12.2%) | 0 (0.0%) |
| 90 or more Minutes | 26 (35.1%) | 0 (0.0%) |
Time of Departure to Work by Sex in Sawyer
The most frequent times of departure to work in Sawyer are 5:00 AM to 5:29 AM (19, 25.7%) for males and 6:30 AM to 6:59 AM (12, 23.1%) for females.
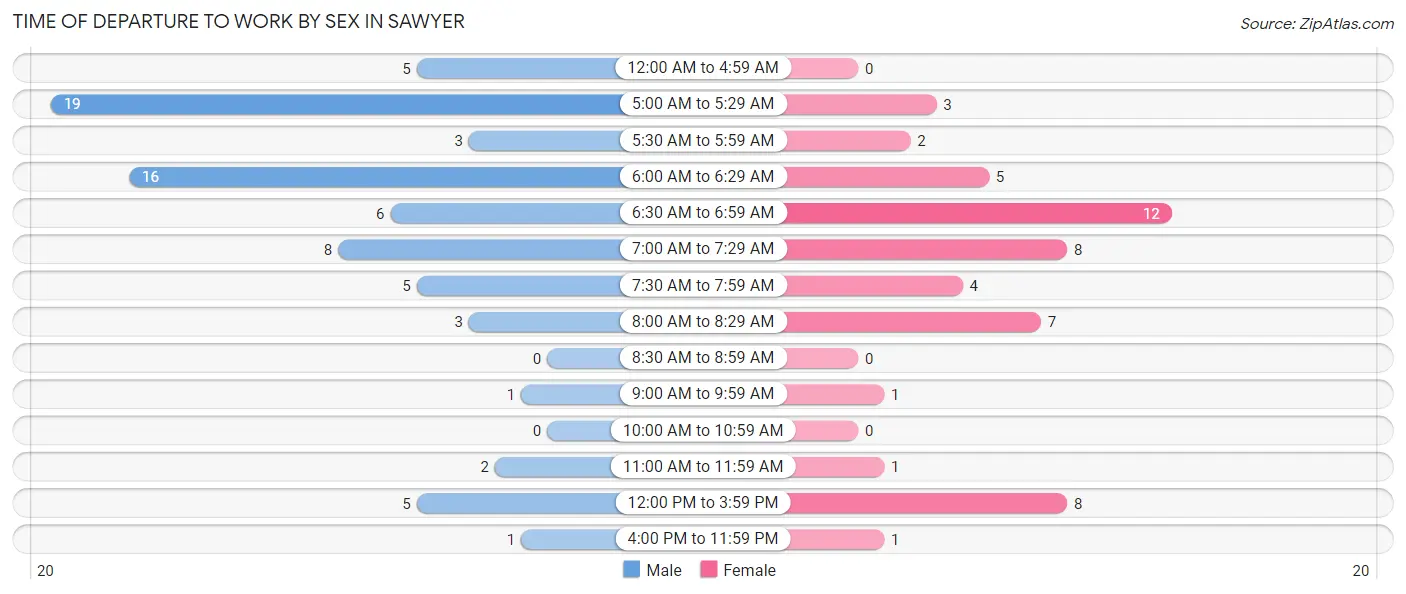
| Time of Departure | Male | Female |
| 12:00 AM to 4:59 AM | 5 (6.8%) | 0 (0.0%) |
| 5:00 AM to 5:29 AM | 19 (25.7%) | 3 (5.8%) |
| 5:30 AM to 5:59 AM | 3 (4.1%) | 2 (3.8%) |
| 6:00 AM to 6:29 AM | 16 (21.6%) | 5 (9.6%) |
| 6:30 AM to 6:59 AM | 6 (8.1%) | 12 (23.1%) |
| 7:00 AM to 7:29 AM | 8 (10.8%) | 8 (15.4%) |
| 7:30 AM to 7:59 AM | 5 (6.8%) | 4 (7.7%) |
| 8:00 AM to 8:29 AM | 3 (4.1%) | 7 (13.5%) |
| 8:30 AM to 8:59 AM | 0 (0.0%) | 0 (0.0%) |
| 9:00 AM to 9:59 AM | 1 (1.3%) | 1 (1.9%) |
| 10:00 AM to 10:59 AM | 0 (0.0%) | 0 (0.0%) |
| 11:00 AM to 11:59 AM | 2 (2.7%) | 1 (1.9%) |
| 12:00 PM to 3:59 PM | 5 (6.8%) | 8 (15.4%) |
| 4:00 PM to 11:59 PM | 1 (1.3%) | 1 (1.9%) |
| Total | 74 (100.0%) | 52 (100.0%) |
Housing Occupancy in Sawyer
Occupancy by Ownership in Sawyer
Of the total 117 dwellings in Sawyer, owner-occupied units account for 89 (76.1%), while renter-occupied units make up 28 (23.9%).
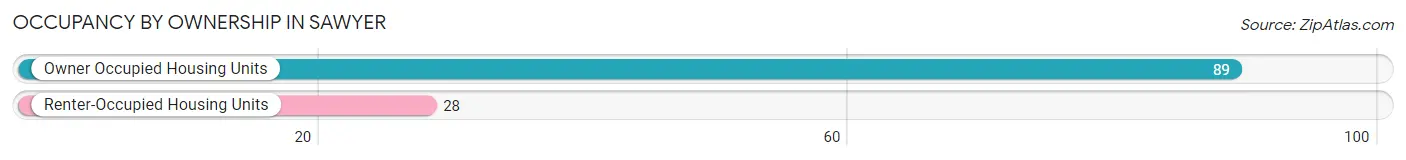
| Occupancy | # Housing Units | % Housing Units |
| Owner Occupied Housing Units | 89 | 76.1% |
| Renter-Occupied Housing Units | 28 | 23.9% |
| Total Occupied Housing Units | 117 | 100.0% |
Occupancy by Household Size in Sawyer
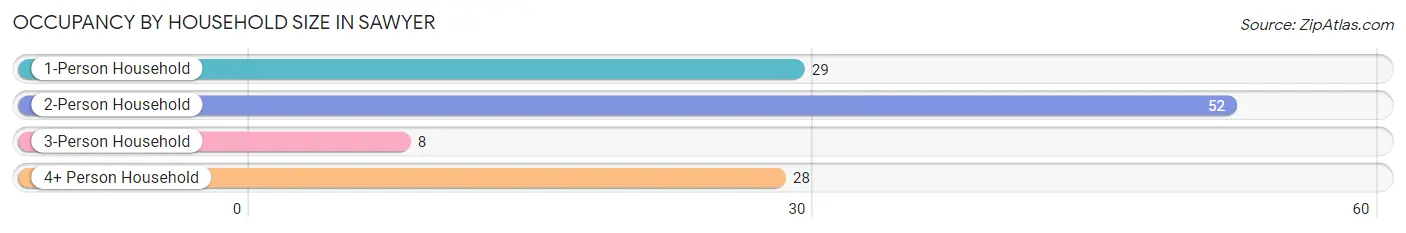
| Household Size | # Housing Units | % Housing Units |
| 1-Person Household | 29 | 24.8% |
| 2-Person Household | 52 | 44.4% |
| 3-Person Household | 8 | 6.8% |
| 4+ Person Household | 28 | 23.9% |
| Total Housing Units | 117 | 100.0% |
Occupancy by Ownership by Household Size in Sawyer
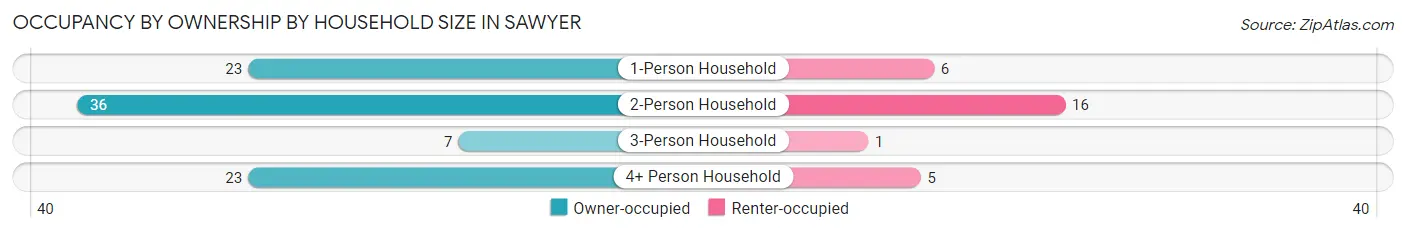
| Household Size | Owner-occupied | Renter-occupied |
| 1-Person Household | 23 (79.3%) | 6 (20.7%) |
| 2-Person Household | 36 (69.2%) | 16 (30.8%) |
| 3-Person Household | 7 (87.5%) | 1 (12.5%) |
| 4+ Person Household | 23 (82.1%) | 5 (17.9%) |
| Total Housing Units | 89 (76.1%) | 28 (23.9%) |
Occupancy by Educational Attainment in Sawyer
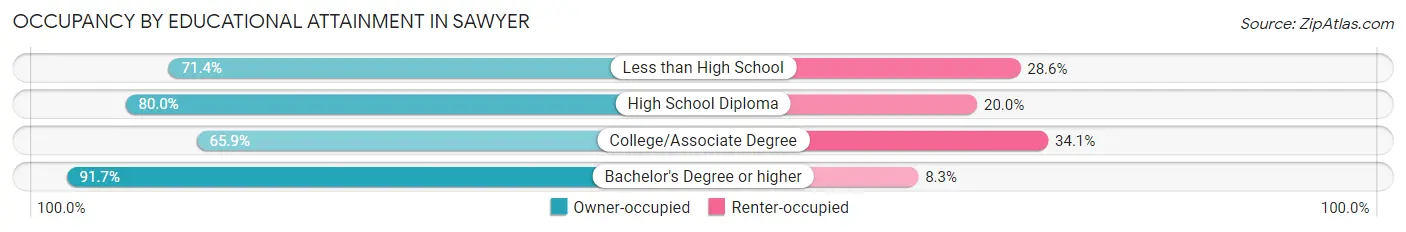
| Household Size | Owner-occupied | Renter-occupied |
| Less than High School | 10 (71.4%) | 4 (28.6%) |
| High School Diploma | 28 (80.0%) | 7 (20.0%) |
| College/Associate Degree | 29 (65.9%) | 15 (34.1%) |
| Bachelor's Degree or higher | 22 (91.7%) | 2 (8.3%) |
Occupancy by Age of Householder in Sawyer
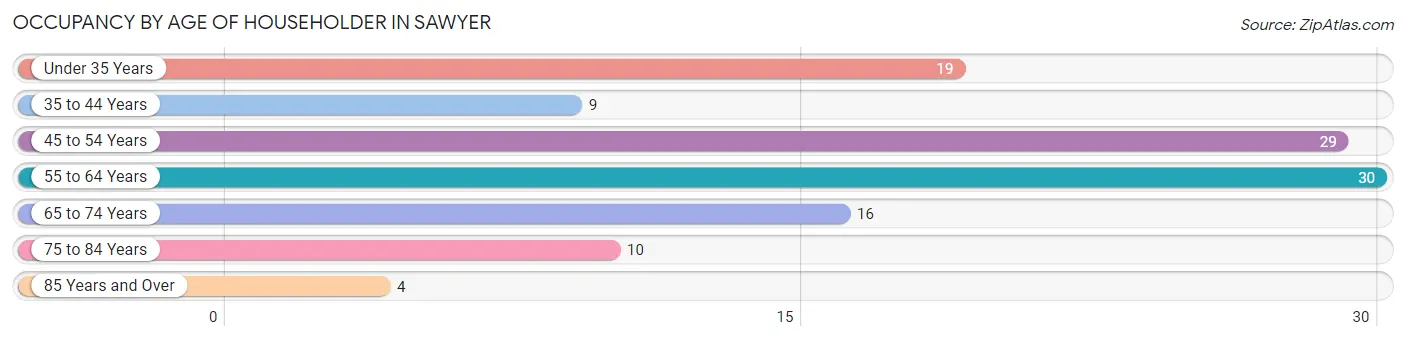
| Age Bracket | # Households | % Households |
| Under 35 Years | 19 | 16.2% |
| 35 to 44 Years | 9 | 7.7% |
| 45 to 54 Years | 29 | 24.8% |
| 55 to 64 Years | 30 | 25.6% |
| 65 to 74 Years | 16 | 13.7% |
| 75 to 84 Years | 10 | 8.6% |
| 85 Years and Over | 4 | 3.4% |
| Total | 117 | 100.0% |
Housing Finances in Sawyer
Median Income by Occupancy in Sawyer
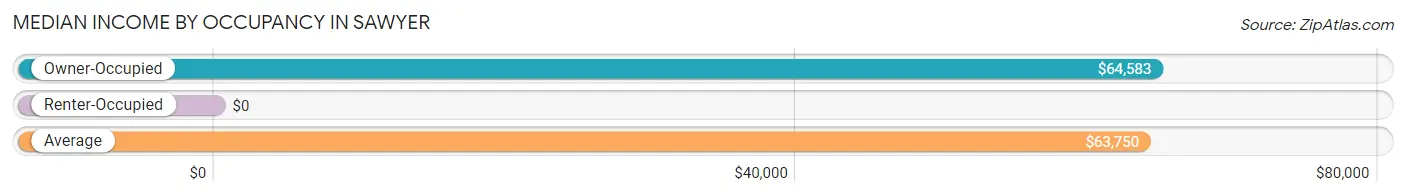
| Occupancy Type | # Households | Median Income |
| Owner-Occupied | 89 (76.1%) | $64,583 |
| Renter-Occupied | 28 (23.9%) | $0 |
| Average | 117 (100.0%) | $63,750 |
Occupancy by Householder Income Bracket in Sawyer
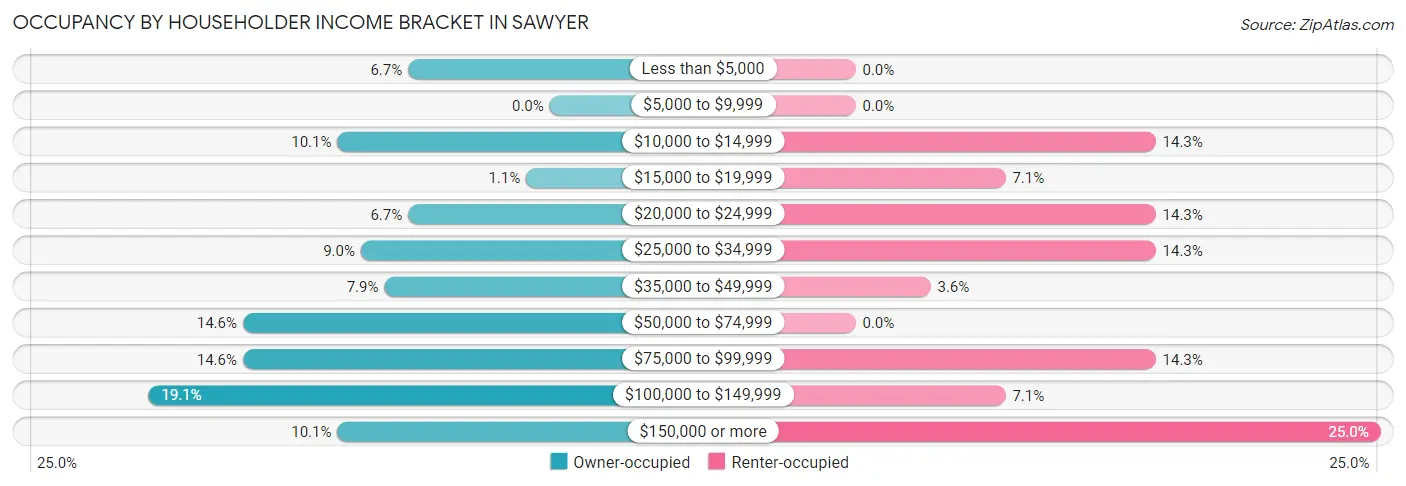
| Income Bracket | Owner-occupied | Renter-occupied |
| Less than $5,000 | 6 (6.7%) | 0 (0.0%) |
| $5,000 to $9,999 | 0 (0.0%) | 0 (0.0%) |
| $10,000 to $14,999 | 9 (10.1%) | 4 (14.3%) |
| $15,000 to $19,999 | 1 (1.1%) | 2 (7.1%) |
| $20,000 to $24,999 | 6 (6.7%) | 4 (14.3%) |
| $25,000 to $34,999 | 8 (9.0%) | 4 (14.3%) |
| $35,000 to $49,999 | 7 (7.9%) | 1 (3.6%) |
| $50,000 to $74,999 | 13 (14.6%) | 0 (0.0%) |
| $75,000 to $99,999 | 13 (14.6%) | 4 (14.3%) |
| $100,000 to $149,999 | 17 (19.1%) | 2 (7.1%) |
| $150,000 or more | 9 (10.1%) | 7 (25.0%) |
| Total | 89 (100.0%) | 28 (100.0%) |
Monthly Housing Cost Tiers in Sawyer
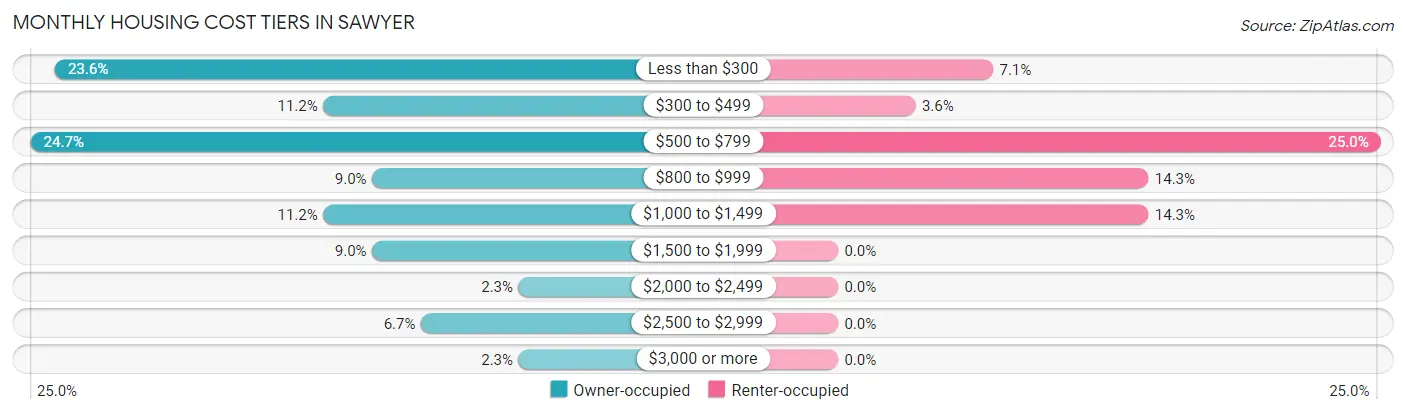
| Monthly Cost | Owner-occupied | Renter-occupied |
| Less than $300 | 21 (23.6%) | 2 (7.1%) |
| $300 to $499 | 10 (11.2%) | 1 (3.6%) |
| $500 to $799 | 22 (24.7%) | 7 (25.0%) |
| $800 to $999 | 8 (9.0%) | 4 (14.3%) |
| $1,000 to $1,499 | 10 (11.2%) | 4 (14.3%) |
| $1,500 to $1,999 | 8 (9.0%) | 0 (0.0%) |
| $2,000 to $2,499 | 2 (2.2%) | 0 (0.0%) |
| $2,500 to $2,999 | 6 (6.7%) | 0 (0.0%) |
| $3,000 or more | 2 (2.2%) | 0 (0.0%) |
| Total | 89 (100.0%) | 28 (100.0%) |
Physical Housing Characteristics in Sawyer
Housing Structures in Sawyer
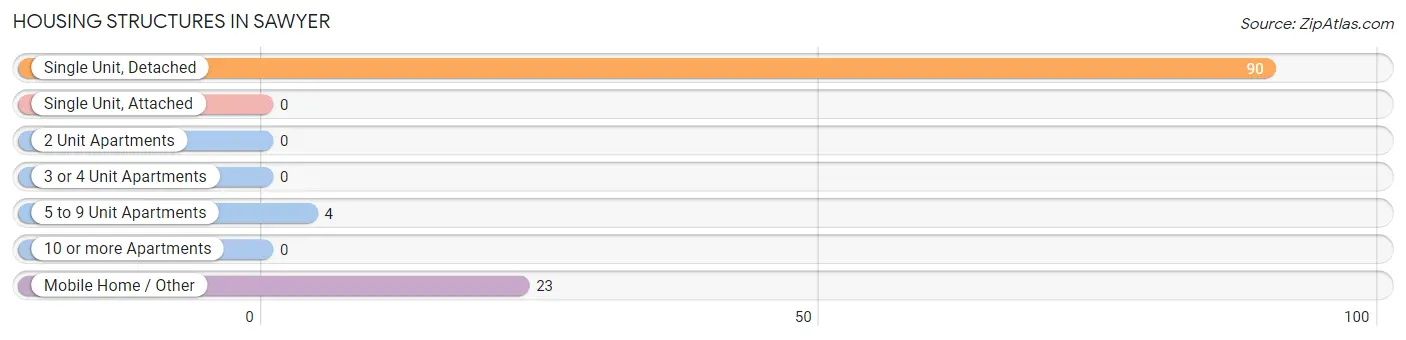
| Structure Type | # Housing Units | % Housing Units |
| Single Unit, Detached | 90 | 76.9% |
| Single Unit, Attached | 0 | 0.0% |
| 2 Unit Apartments | 0 | 0.0% |
| 3 or 4 Unit Apartments | 0 | 0.0% |
| 5 to 9 Unit Apartments | 4 | 3.4% |
| 10 or more Apartments | 0 | 0.0% |
| Mobile Home / Other | 23 | 19.7% |
| Total | 117 | 100.0% |
Housing Structures by Occupancy in Sawyer
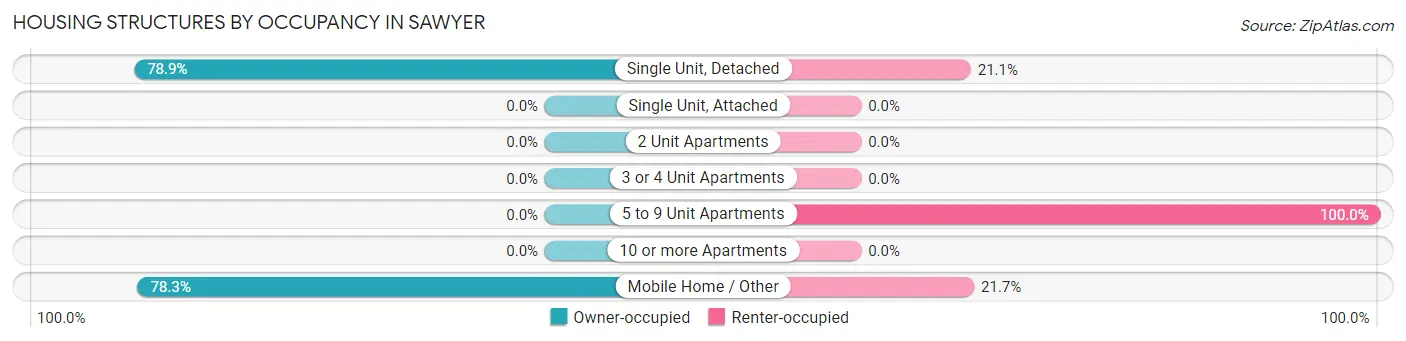
| Structure Type | Owner-occupied | Renter-occupied |
| Single Unit, Detached | 71 (78.9%) | 19 (21.1%) |
| Single Unit, Attached | 0 (0.0%) | 0 (0.0%) |
| 2 Unit Apartments | 0 (0.0%) | 0 (0.0%) |
| 3 or 4 Unit Apartments | 0 (0.0%) | 0 (0.0%) |
| 5 to 9 Unit Apartments | 0 (0.0%) | 4 (100.0%) |
| 10 or more Apartments | 0 (0.0%) | 0 (0.0%) |
| Mobile Home / Other | 18 (78.3%) | 5 (21.7%) |
| Total | 89 (76.1%) | 28 (23.9%) |
Housing Structures by Number of Rooms in Sawyer
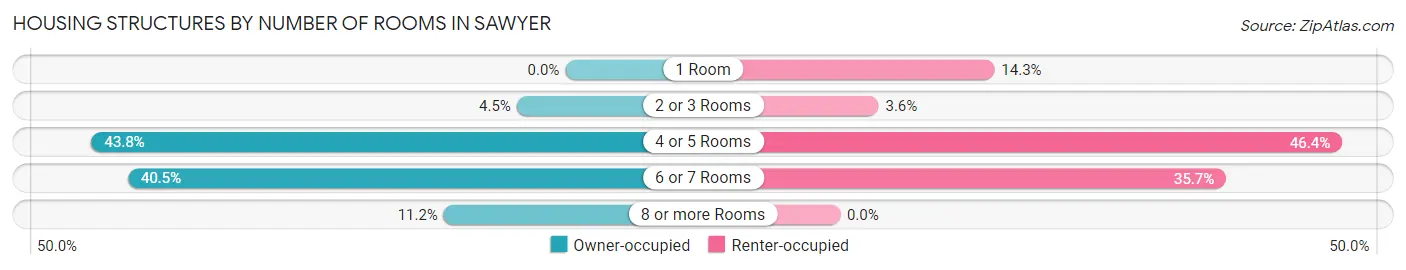
| Number of Rooms | Owner-occupied | Renter-occupied |
| 1 Room | 0 (0.0%) | 4 (14.3%) |
| 2 or 3 Rooms | 4 (4.5%) | 1 (3.6%) |
| 4 or 5 Rooms | 39 (43.8%) | 13 (46.4%) |
| 6 or 7 Rooms | 36 (40.5%) | 10 (35.7%) |
| 8 or more Rooms | 10 (11.2%) | 0 (0.0%) |
| Total | 89 (100.0%) | 28 (100.0%) |
Housing Structure by Heating Type in Sawyer
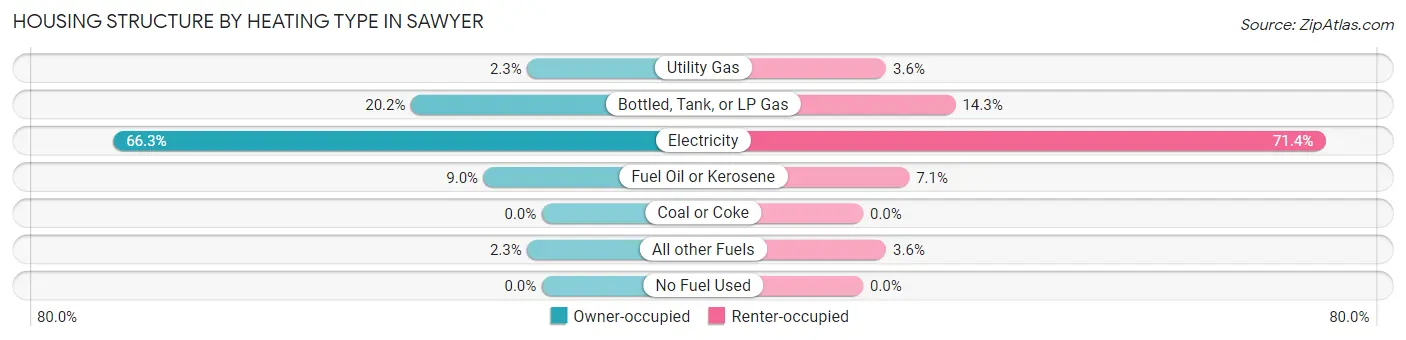
| Heating Type | Owner-occupied | Renter-occupied |
| Utility Gas | 2 (2.2%) | 1 (3.6%) |
| Bottled, Tank, or LP Gas | 18 (20.2%) | 4 (14.3%) |
| Electricity | 59 (66.3%) | 20 (71.4%) |
| Fuel Oil or Kerosene | 8 (9.0%) | 2 (7.1%) |
| Coal or Coke | 0 (0.0%) | 0 (0.0%) |
| All other Fuels | 2 (2.2%) | 1 (3.6%) |
| No Fuel Used | 0 (0.0%) | 0 (0.0%) |
| Total | 89 (100.0%) | 28 (100.0%) |
Household Vehicle Usage in Sawyer
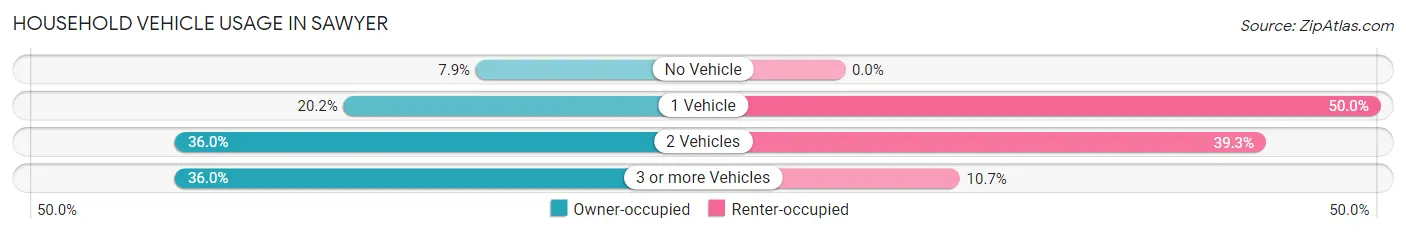
| Vehicles per Household | Owner-occupied | Renter-occupied |
| No Vehicle | 7 (7.9%) | 0 (0.0%) |
| 1 Vehicle | 18 (20.2%) | 14 (50.0%) |
| 2 Vehicles | 32 (36.0%) | 11 (39.3%) |
| 3 or more Vehicles | 32 (36.0%) | 3 (10.7%) |
| Total | 89 (100.0%) | 28 (100.0%) |
Real Estate & Mortgages in Sawyer
Real Estate and Mortgage Overview in Sawyer
| Characteristic | Without Mortgage | With Mortgage |
| Housing Units | 47 | 42 |
| Median Property Value | - | - |
| Median Household Income | $48,125 | $8 |
| Monthly Housing Costs | $369 | $2 |
| Real Estate Taxes | $386 | $5 |
Property Value by Mortgage Status in Sawyer
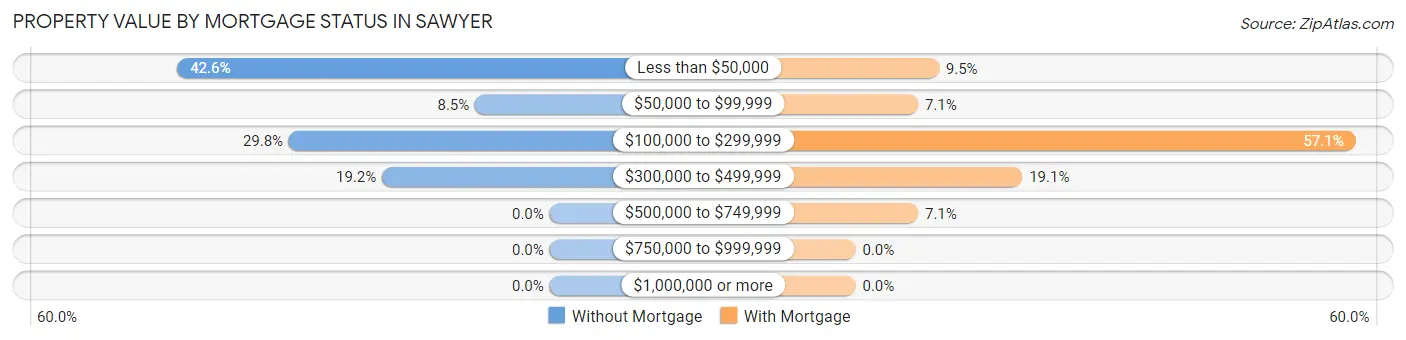
| Property Value | Without Mortgage | With Mortgage |
| Less than $50,000 | 20 (42.5%) | 4 (9.5%) |
| $50,000 to $99,999 | 4 (8.5%) | 3 (7.1%) |
| $100,000 to $299,999 | 14 (29.8%) | 24 (57.1%) |
| $300,000 to $499,999 | 9 (19.2%) | 8 (19.1%) |
| $500,000 to $749,999 | 0 (0.0%) | 3 (7.1%) |
| $750,000 to $999,999 | 0 (0.0%) | 0 (0.0%) |
| $1,000,000 or more | 0 (0.0%) | 0 (0.0%) |
| Total | 47 (100.0%) | 42 (100.0%) |
Household Income by Mortgage Status in Sawyer
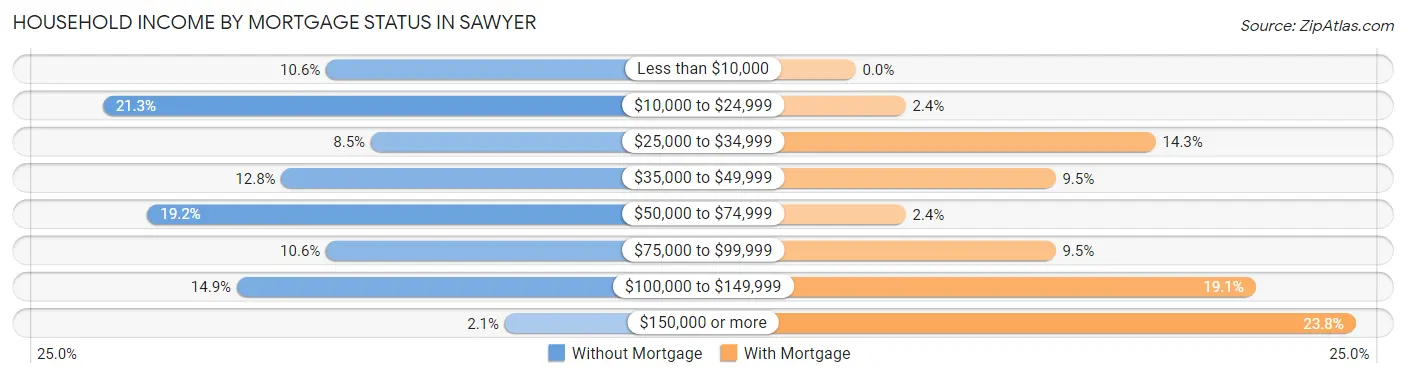
| Household Income | Without Mortgage | With Mortgage |
| Less than $10,000 | 5 (10.6%) | 0 (0.0%) |
| $10,000 to $24,999 | 10 (21.3%) | 1 (2.4%) |
| $25,000 to $34,999 | 4 (8.5%) | 6 (14.3%) |
| $35,000 to $49,999 | 6 (12.8%) | 4 (9.5%) |
| $50,000 to $74,999 | 9 (19.2%) | 1 (2.4%) |
| $75,000 to $99,999 | 5 (10.6%) | 4 (9.5%) |
| $100,000 to $149,999 | 7 (14.9%) | 8 (19.1%) |
| $150,000 or more | 1 (2.1%) | 10 (23.8%) |
| Total | 47 (100.0%) | 42 (100.0%) |
Property Value to Household Income Ratio in Sawyer
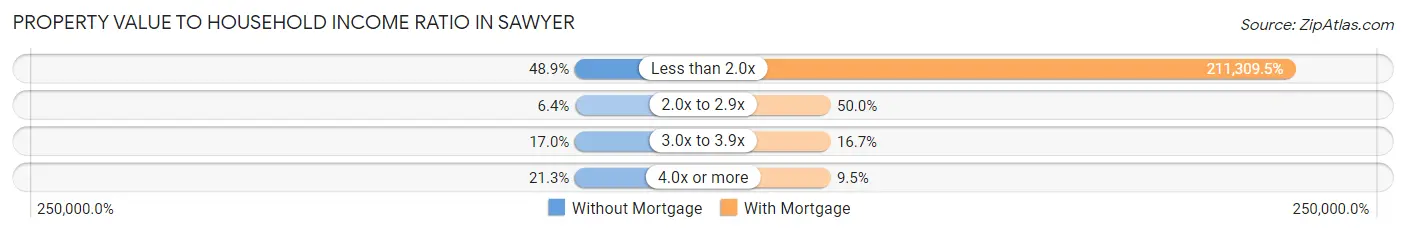
| Value-to-Income Ratio | Without Mortgage | With Mortgage |
| Less than 2.0x | 23 (48.9%) | 88,750 (211,309.5%) |
| 2.0x to 2.9x | 3 (6.4%) | 21 (50.0%) |
| 3.0x to 3.9x | 8 (17.0%) | 7 (16.7%) |
| 4.0x or more | 10 (21.3%) | 4 (9.5%) |
| Total | 47 (100.0%) | 42 (100.0%) |
Real Estate Taxes by Mortgage Status in Sawyer
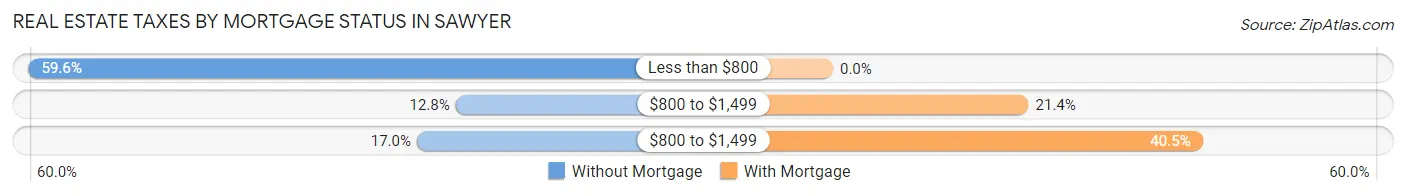
| Property Taxes | Without Mortgage | With Mortgage |
| Less than $800 | 28 (59.6%) | 0 (0.0%) |
| $800 to $1,499 | 6 (12.8%) | 9 (21.4%) |
| $800 to $1,499 | 8 (17.0%) | 17 (40.5%) |
| Total | 47 (100.0%) | 42 (100.0%) |
Health & Disability in Sawyer
Health Insurance Coverage by Age in Sawyer
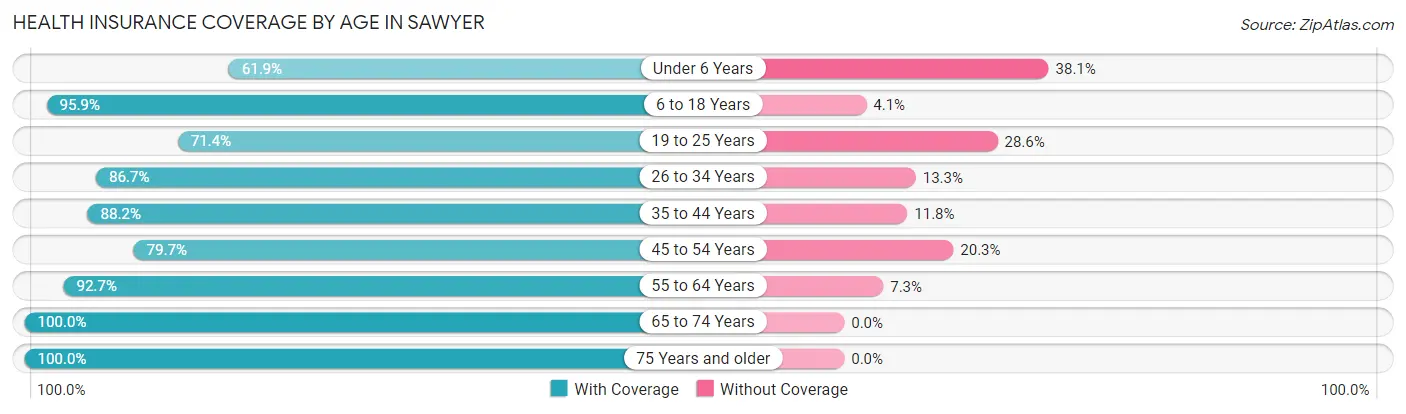
| Age Bracket | With Coverage | Without Coverage |
| Under 6 Years | 13 (61.9%) | 8 (38.1%) |
| 6 to 18 Years | 70 (95.9%) | 3 (4.1%) |
| 19 to 25 Years | 25 (71.4%) | 10 (28.6%) |
| 26 to 34 Years | 26 (86.7%) | 4 (13.3%) |
| 35 to 44 Years | 30 (88.2%) | 4 (11.8%) |
| 45 to 54 Years | 47 (79.7%) | 12 (20.3%) |
| 55 to 64 Years | 51 (92.7%) | 4 (7.3%) |
| 65 to 74 Years | 20 (100.0%) | 0 (0.0%) |
| 75 Years and older | 94 (100.0%) | 0 (0.0%) |
| Total | 376 (89.3%) | 45 (10.7%) |
Health Insurance Coverage by Citizenship Status in Sawyer
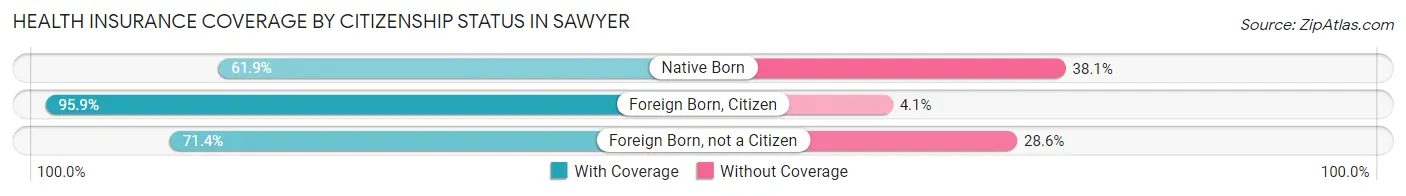
| Citizenship Status | With Coverage | Without Coverage |
| Native Born | 13 (61.9%) | 8 (38.1%) |
| Foreign Born, Citizen | 70 (95.9%) | 3 (4.1%) |
| Foreign Born, not a Citizen | 25 (71.4%) | 10 (28.6%) |
Health Insurance Coverage by Household Income in Sawyer
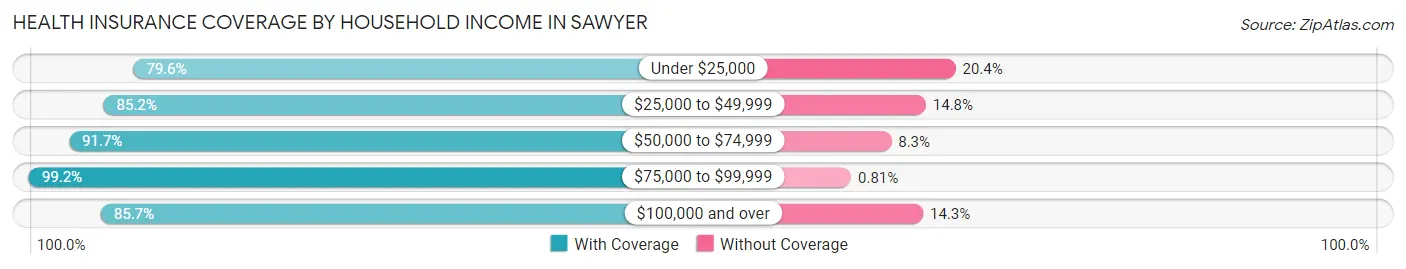
| Household Income | With Coverage | Without Coverage |
| Under $25,000 | 43 (79.6%) | 11 (20.4%) |
| $25,000 to $49,999 | 46 (85.2%) | 8 (14.8%) |
| $50,000 to $74,999 | 33 (91.7%) | 3 (8.3%) |
| $75,000 to $99,999 | 122 (99.2%) | 1 (0.8%) |
| $100,000 and over | 132 (85.7%) | 22 (14.3%) |
Public vs Private Health Insurance Coverage by Age in Sawyer
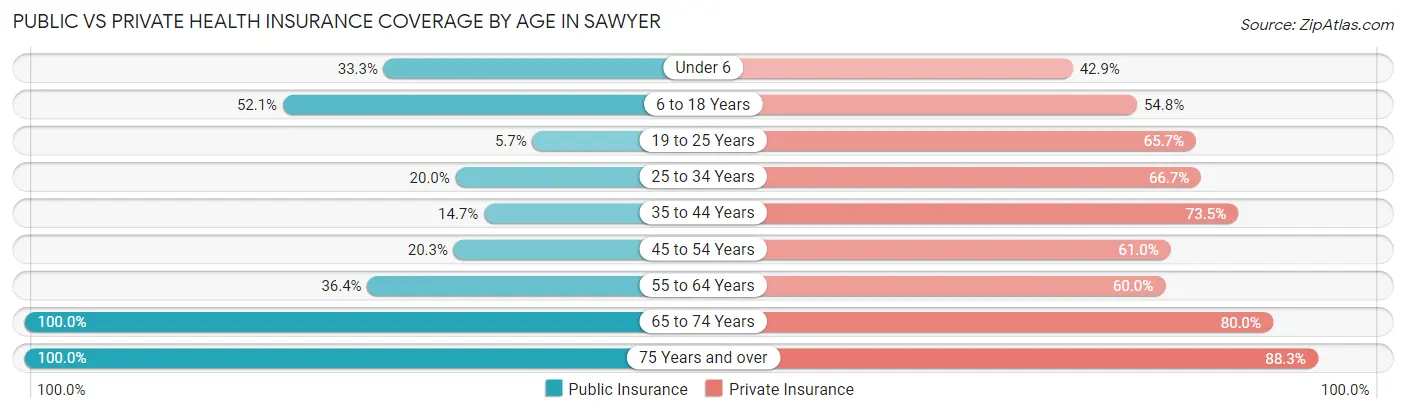
| Age Bracket | Public Insurance | Private Insurance |
| Under 6 | 7 (33.3%) | 9 (42.9%) |
| 6 to 18 Years | 38 (52.0%) | 40 (54.8%) |
| 19 to 25 Years | 2 (5.7%) | 23 (65.7%) |
| 25 to 34 Years | 6 (20.0%) | 20 (66.7%) |
| 35 to 44 Years | 5 (14.7%) | 25 (73.5%) |
| 45 to 54 Years | 12 (20.3%) | 36 (61.0%) |
| 55 to 64 Years | 20 (36.4%) | 33 (60.0%) |
| 65 to 74 Years | 20 (100.0%) | 16 (80.0%) |
| 75 Years and over | 94 (100.0%) | 83 (88.3%) |
| Total | 204 (48.5%) | 285 (67.7%) |
Disability Status by Sex by Age in Sawyer
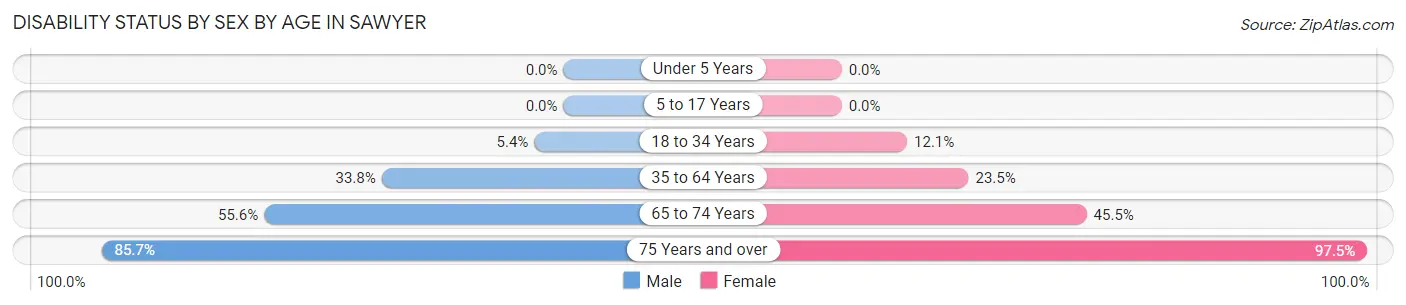
| Age Bracket | Male | Female |
| Under 5 Years | 0 (0.0%) | 0 (0.0%) |
| 5 to 17 Years | 0 (0.0%) | 0 (0.0%) |
| 18 to 34 Years | 2 (5.4%) | 4 (12.1%) |
| 35 to 64 Years | 27 (33.8%) | 16 (23.5%) |
| 65 to 74 Years | 5 (55.6%) | 5 (45.5%) |
| 75 Years and over | 12 (85.7%) | 78 (97.5%) |
Disability Class by Sex by Age in Sawyer
Disability Class: Hearing Difficulty
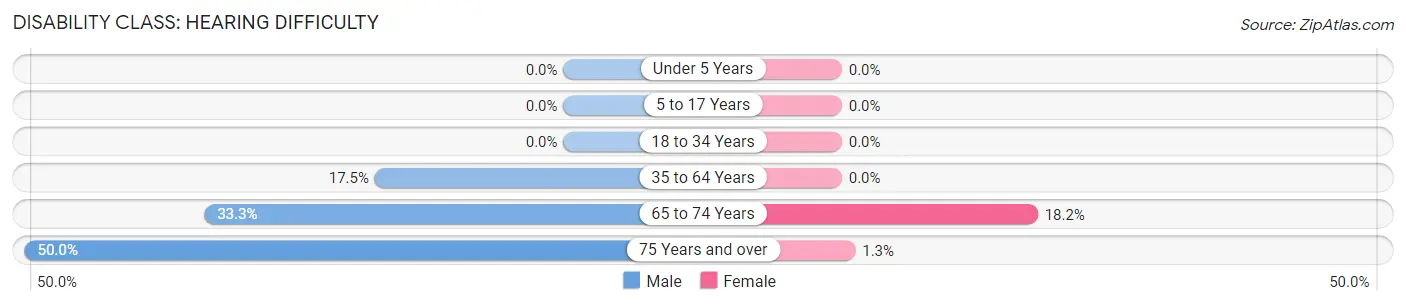
| Age Bracket | Male | Female |
| Under 5 Years | 0 (0.0%) | 0 (0.0%) |
| 5 to 17 Years | 0 (0.0%) | 0 (0.0%) |
| 18 to 34 Years | 0 (0.0%) | 0 (0.0%) |
| 35 to 64 Years | 14 (17.5%) | 0 (0.0%) |
| 65 to 74 Years | 3 (33.3%) | 2 (18.2%) |
| 75 Years and over | 7 (50.0%) | 1 (1.3%) |
Disability Class: Vision Difficulty
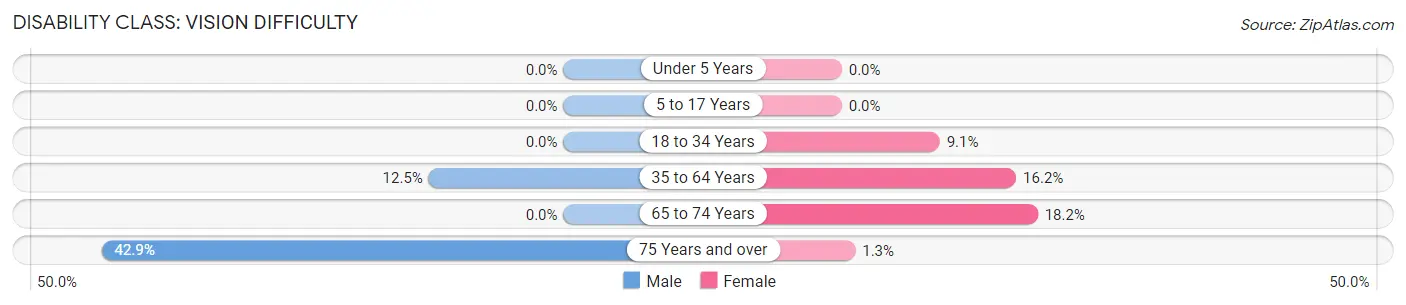
| Age Bracket | Male | Female |
| Under 5 Years | 0 (0.0%) | 0 (0.0%) |
| 5 to 17 Years | 0 (0.0%) | 0 (0.0%) |
| 18 to 34 Years | 0 (0.0%) | 3 (9.1%) |
| 35 to 64 Years | 10 (12.5%) | 11 (16.2%) |
| 65 to 74 Years | 0 (0.0%) | 2 (18.2%) |
| 75 Years and over | 6 (42.9%) | 1 (1.3%) |
Disability Class: Cognitive Difficulty
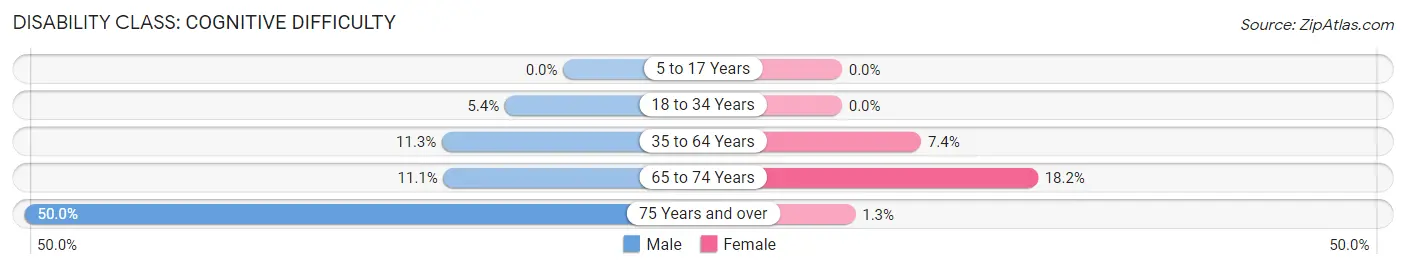
| Age Bracket | Male | Female |
| 5 to 17 Years | 0 (0.0%) | 0 (0.0%) |
| 18 to 34 Years | 2 (5.4%) | 0 (0.0%) |
| 35 to 64 Years | 9 (11.3%) | 5 (7.3%) |
| 65 to 74 Years | 1 (11.1%) | 2 (18.2%) |
| 75 Years and over | 7 (50.0%) | 1 (1.3%) |
Disability Class: Ambulatory Difficulty
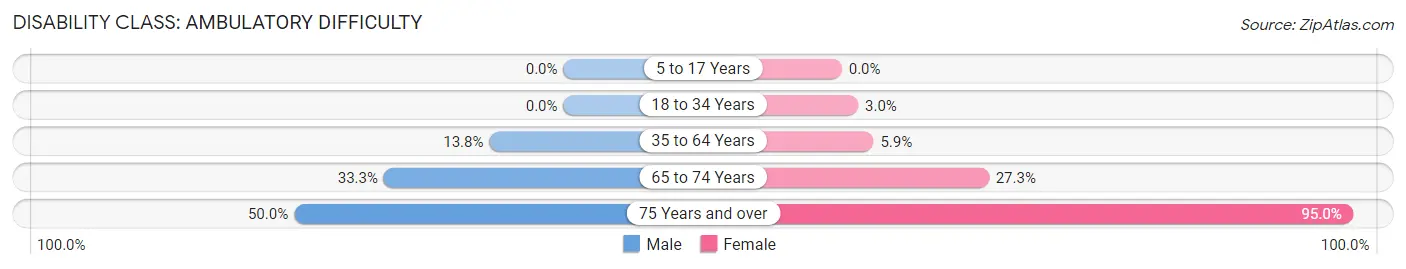
| Age Bracket | Male | Female |
| 5 to 17 Years | 0 (0.0%) | 0 (0.0%) |
| 18 to 34 Years | 0 (0.0%) | 1 (3.0%) |
| 35 to 64 Years | 11 (13.8%) | 4 (5.9%) |
| 65 to 74 Years | 3 (33.3%) | 3 (27.3%) |
| 75 Years and over | 7 (50.0%) | 76 (95.0%) |
Disability Class: Self-Care Difficulty
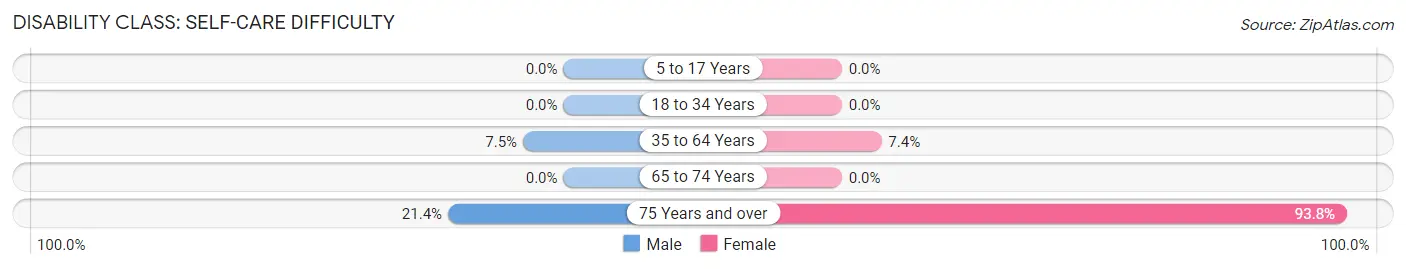
| Age Bracket | Male | Female |
| 5 to 17 Years | 0 (0.0%) | 0 (0.0%) |
| 18 to 34 Years | 0 (0.0%) | 0 (0.0%) |
| 35 to 64 Years | 6 (7.5%) | 5 (7.3%) |
| 65 to 74 Years | 0 (0.0%) | 0 (0.0%) |
| 75 Years and over | 3 (21.4%) | 75 (93.8%) |
Technology Access in Sawyer
Computing Device Access in Sawyer
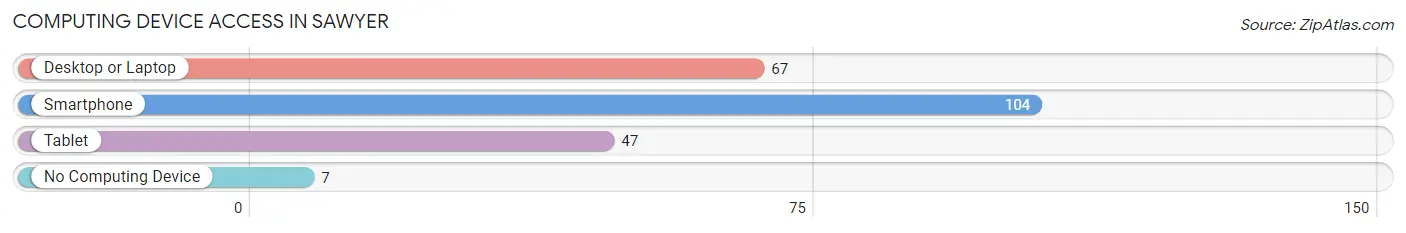
| Device Type | # Households | % Households |
| Desktop or Laptop | 67 | 57.3% |
| Smartphone | 104 | 88.9% |
| Tablet | 47 | 40.2% |
| No Computing Device | 7 | 6.0% |
| Total | 117 | 100.0% |
Internet Access in Sawyer
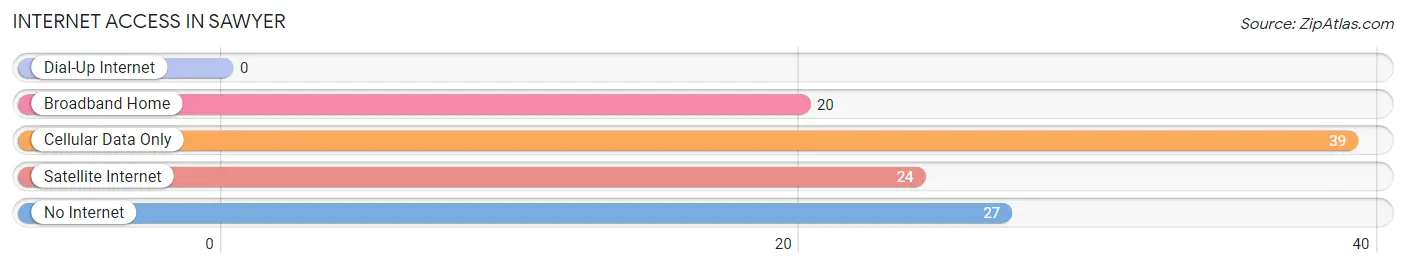
| Internet Type | # Households | % Households |
| Dial-Up Internet | 0 | 0.0% |
| Broadband Home | 20 | 17.1% |
| Cellular Data Only | 39 | 33.3% |
| Satellite Internet | 24 | 20.5% |
| No Internet | 27 | 23.1% |
| Total | 117 | 100.0% |
Sawyer Summary
Sawyer is a small town located in Oklahoma, United States. It is situated in the southeastern part of the state, in the county of Pawnee. The town has a population of approximately 1,000 people, and is located about 30 miles south of Tulsa.
History
Sawyer was founded in 1891 by a group of settlers from Arkansas. The town was named after a local rancher, William Sawyer, who owned a large amount of land in the area. The town was originally a farming community, and the main crops grown were cotton, corn, and wheat. In the early 1900s, the town began to grow and develop, and by the 1920s, it had become a thriving community.
In the 1930s, the Great Depression hit the town hard, and many of the businesses and farms in the area closed down. However, the town was able to survive, and by the 1940s, it had begun to recover. During World War II, the town was home to a large military base, which provided jobs and economic stability to the area.
In the 1950s, the town began to grow again, and many new businesses opened up. The town also became a popular tourist destination, as it was close to Tulsa and other nearby cities. In the 1960s, the town experienced a population boom, and by the 1970s, it had become a thriving community once again.
Geography
Sawyer is located in the southeastern part of Oklahoma, in the county of Pawnee. The town is situated on the banks of the Arkansas River, and is surrounded by rolling hills and farmland. The town is located about 30 miles south of Tulsa, and is close to the cities of Bartlesville and Muskogee.
The climate in Sawyer is generally mild, with hot summers and cold winters. The average temperature in the summer is around 80 degrees Fahrenheit, and in the winter it is around 40 degrees Fahrenheit. The town receives an average of 40 inches of rain per year, and the area is prone to severe thunderstorms and tornadoes.
Economy
The economy of Sawyer is largely based on agriculture and tourism. The town is home to several farms, which produce a variety of crops, including cotton, corn, and wheat. The town is also home to several tourist attractions, such as the Arkansas River Museum and the Pawnee Bill Wild West Show.
In addition to agriculture and tourism, Sawyer is also home to several small businesses, including restaurants, retail stores, and service providers. The town is also home to a few manufacturing companies, which produce a variety of products, including furniture and clothing.
Demographics
As of the 2010 census, the population of Sawyer was 1,000 people. The town is predominantly white, with a small percentage of African Americans, Hispanics, and Native Americans. The median household income in the town is $35,000, and the median age is 37 years old. The town has a high rate of poverty, with nearly 20% of the population living below the poverty line.
Common Questions
What is Per Capita Income in Sawyer?
Per Capita income in Sawyer is $30,943.
What is the Median Family Income in Sawyer?
Median Family Income in Sawyer is $75,000.
What is the Median Household income in Sawyer?
Median Household Income in Sawyer is $63,750.
What is Income or Wage Gap in Sawyer?
Income or Wage Gap in Sawyer is 41.8%.
Women in Sawyer earn 58.2 cents for every dollar earned by a man.
What is Inequality or Gini Index in Sawyer?
Inequality or Gini Index in Sawyer is 0.49.
What is the Total Population of Sawyer?
Total Population of Sawyer is 421.
What is the Total Male Population of Sawyer?
Total Male Population of Sawyer is 186.
What is the Total Female Population of Sawyer?
Total Female Population of Sawyer is 235.
What is the Ratio of Males per 100 Females in Sawyer?
There are 79.15 Males per 100 Females in Sawyer.
What is the Ratio of Females per 100 Males in Sawyer?
There are 126.34 Females per 100 Males in Sawyer.
What is the Median Population Age in Sawyer?
Median Population Age in Sawyer is 46.7 Years.
What is the Average Family Size in Sawyer
Average Family Size in Sawyer is 4.8 People.
What is the Average Household Size in Sawyer
Average Household Size in Sawyer is 3.6 People.
How Large is the Labor Force in Sawyer?
There are 147 People in the Labor Forcein in Sawyer.
What is the Percentage of People in the Labor Force in Sawyer?
41.6% of People are in the Labor Force in Sawyer.
What is the Unemployment Rate in Sawyer?
Unemployment Rate in Sawyer is 4.8%.