Mounds, OK Map & Demographics
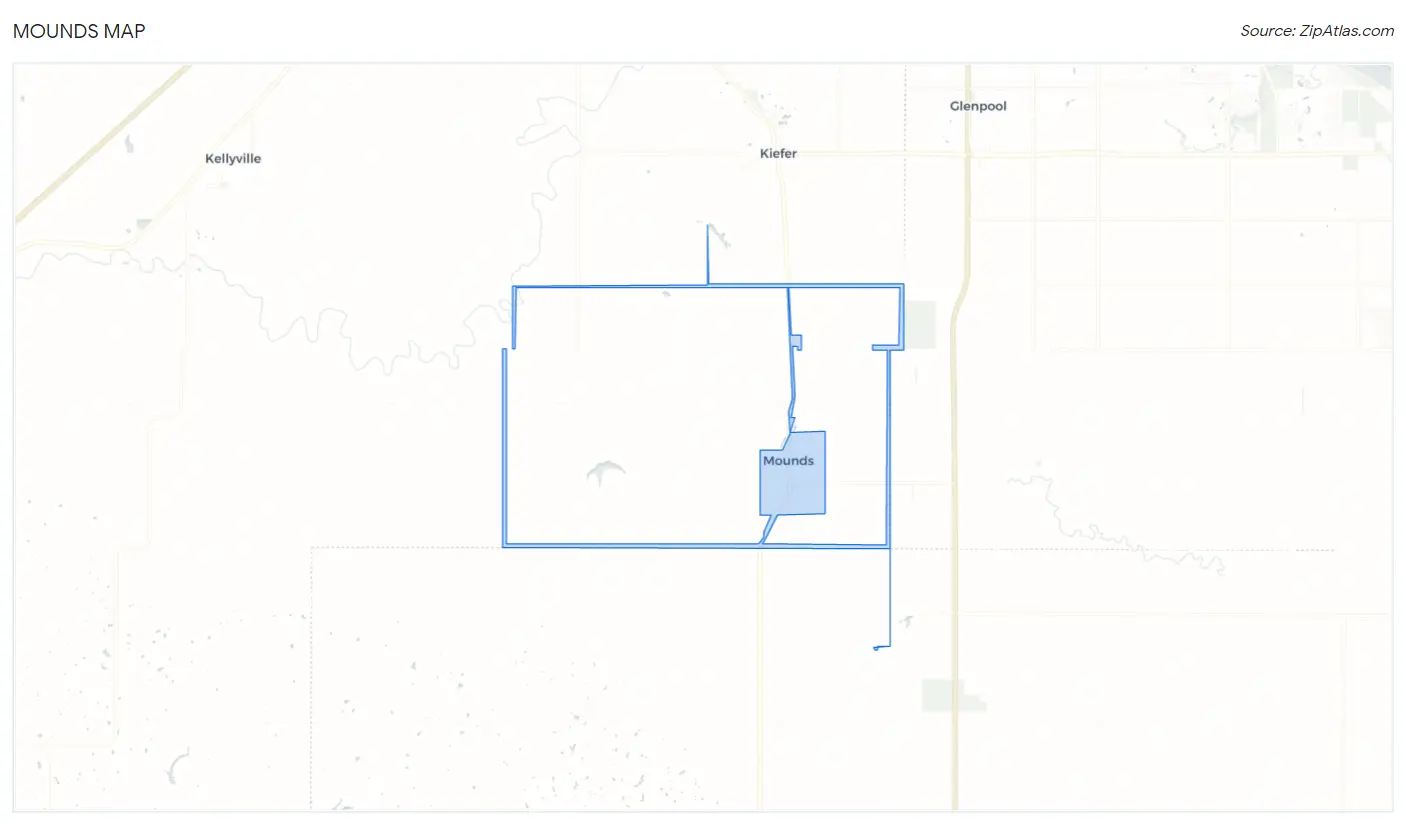
Mounds Map
Mounds Overview
$23,820
PER CAPITA INCOME
$49,236
AVG FAMILY INCOME
$42,014
AVG HOUSEHOLD INCOME
40.6%
WAGE / INCOME GAP [ % ]
59.4¢/ $1
WAGE / INCOME GAP [ $ ]
0.49
INEQUALITY / GINI INDEX
1,099
TOTAL POPULATION
529
MALE POPULATION
570
FEMALE POPULATION
92.81
MALES / 100 FEMALES
107.75
FEMALES / 100 MALES
31.9
MEDIAN AGE
3.2
AVG FAMILY SIZE
2.7
AVG HOUSEHOLD SIZE
435
LABOR FORCE [ PEOPLE ]
52.1%
PERCENT IN LABOR FORCE
2.6%
UNEMPLOYMENT RATE
Mounds Zip Codes
Mounds Area Codes
Income in Mounds
Income Overview in Mounds
Per Capita Income in Mounds is $23,820, while median incomes of families and households are $49,236 and $42,014 respectively.
| Characteristic | Number | Measure |
| Per Capita Income | 1,099 | $23,820 |
| Median Family Income | 285 | $49,236 |
| Mean Family Income | 285 | $68,717 |
| Median Household Income | 405 | $42,014 |
| Mean Household Income | 405 | $62,954 |
| Income Deficit | 285 | $0 |
| Wage / Income Gap (%) | 1,099 | 40.56% |
| Wage / Income Gap ($) | 1,099 | 59.44¢ per $1 |
| Gini / Inequality Index | 1,099 | 0.49 |
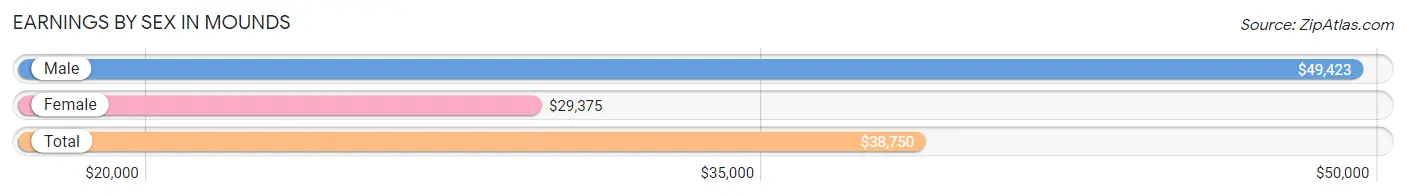
Earnings by Sex in Mounds
Average Earnings in Mounds are $38,750, $49,423 for men and $29,375 for women, a difference of 40.6%.
| Sex | Number | Average Earnings |
| Male | 216 (48.5%) | $49,423 |
| Female | 229 (51.5%) | $29,375 |
| Total | 445 (100.0%) | $38,750 |
Earnings by Sex by Income Bracket in Mounds
The most common earnings brackets in Mounds are $100,000+ for men (38 | 17.6%) and $25,000 to $29,999 for women (36 | 15.7%).
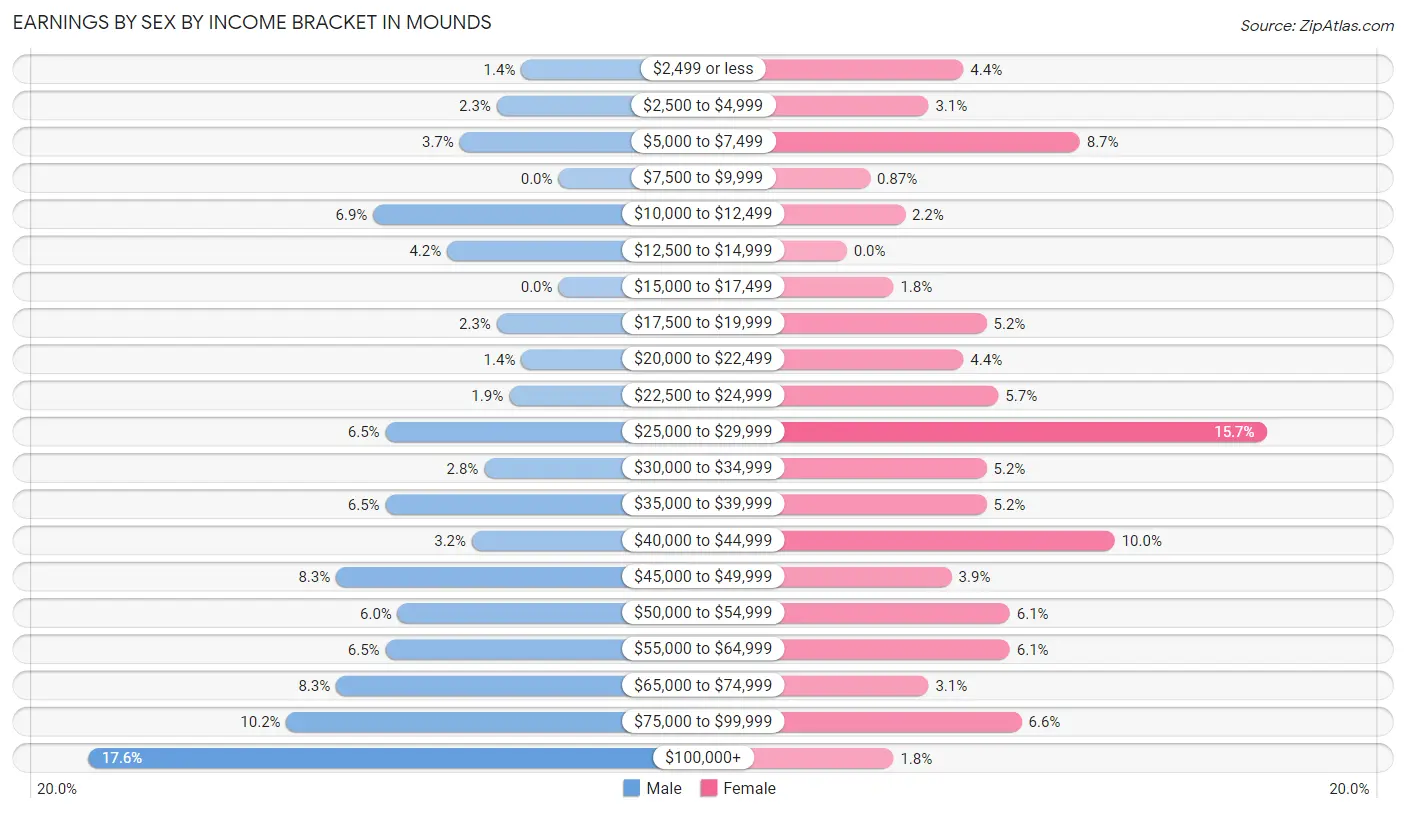
| Income | Male | Female |
| $2,499 or less | 3 (1.4%) | 10 (4.4%) |
| $2,500 to $4,999 | 5 (2.3%) | 7 (3.1%) |
| $5,000 to $7,499 | 8 (3.7%) | 20 (8.7%) |
| $7,500 to $9,999 | 0 (0.0%) | 2 (0.9%) |
| $10,000 to $12,499 | 15 (6.9%) | 5 (2.2%) |
| $12,500 to $14,999 | 9 (4.2%) | 0 (0.0%) |
| $15,000 to $17,499 | 0 (0.0%) | 4 (1.8%) |
| $17,500 to $19,999 | 5 (2.3%) | 12 (5.2%) |
| $20,000 to $22,499 | 3 (1.4%) | 10 (4.4%) |
| $22,500 to $24,999 | 4 (1.8%) | 13 (5.7%) |
| $25,000 to $29,999 | 14 (6.5%) | 36 (15.7%) |
| $30,000 to $34,999 | 6 (2.8%) | 12 (5.2%) |
| $35,000 to $39,999 | 14 (6.5%) | 12 (5.2%) |
| $40,000 to $44,999 | 7 (3.2%) | 23 (10.0%) |
| $45,000 to $49,999 | 18 (8.3%) | 9 (3.9%) |
| $50,000 to $54,999 | 13 (6.0%) | 14 (6.1%) |
| $55,000 to $64,999 | 14 (6.5%) | 14 (6.1%) |
| $65,000 to $74,999 | 18 (8.3%) | 7 (3.1%) |
| $75,000 to $99,999 | 22 (10.2%) | 15 (6.6%) |
| $100,000+ | 38 (17.6%) | 4 (1.8%) |
| Total | 216 (100.0%) | 229 (100.0%) |
Earnings by Sex by Educational Attainment in Mounds
Average earnings in Mounds are $58,750 for men and $33,750 for women, a difference of 42.5%. Men with an educational attainment of college or associate's degree enjoy the highest average annual earnings of $77,813, while those with high school diploma education earn the least with $48,542. Women with an educational attainment of graduate degree earn the most with the average annual earnings of $65,833, while those with high school diploma education have the smallest earnings of $28,125.
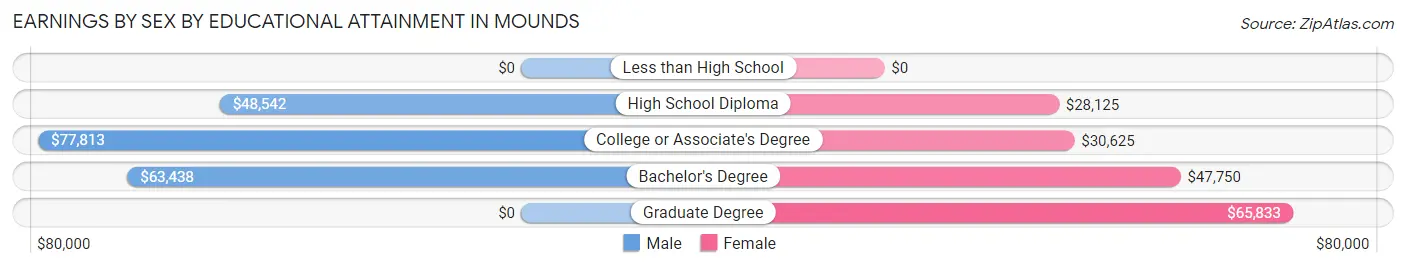
| Educational Attainment | Male Income | Female Income |
| Less than High School | - | - |
| High School Diploma | $48,542 | $28,125 |
| College or Associate's Degree | $77,813 | $30,625 |
| Bachelor's Degree | $63,438 | $47,750 |
| Graduate Degree | - | - |
| Total | $58,750 | $33,750 |
Family Income in Mounds
Family Income Brackets in Mounds
According to the Mounds family income data, there are 64 families falling into the $35,000 to $49,999 income range, which is the most common income bracket and makes up 22.5% of all families. Conversely, the $10,000 to $14,999 income bracket is the least frequent group with only 4 families (1.4%) belonging to this category.
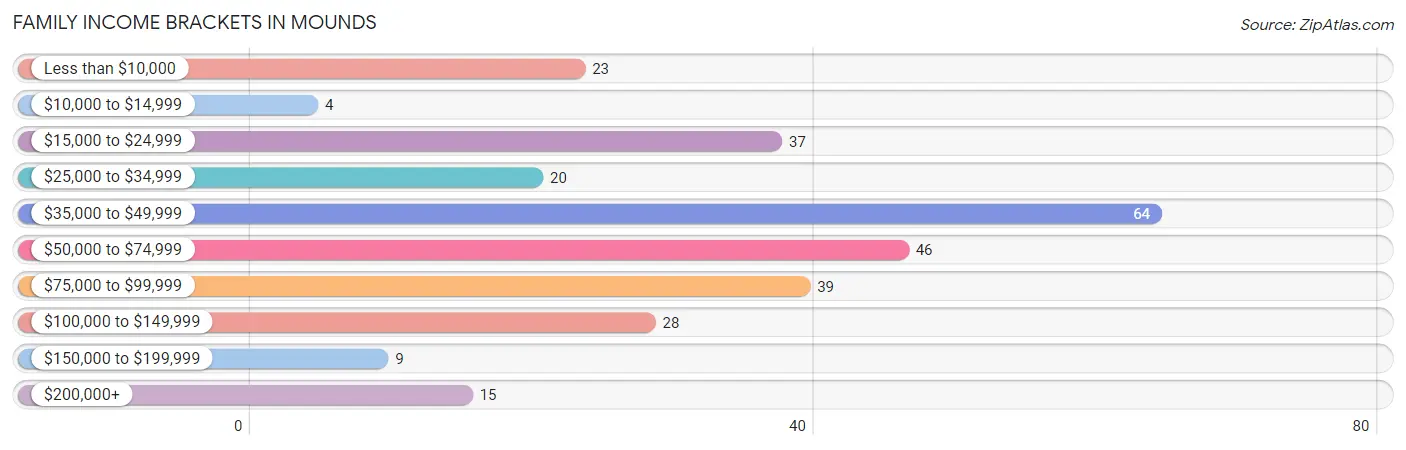
| Income Bracket | # Families | % Families |
| Less than $10,000 | 23 | 8.1% |
| $10,000 to $14,999 | 4 | 1.4% |
| $15,000 to $24,999 | 37 | 13.0% |
| $25,000 to $34,999 | 20 | 7.0% |
| $35,000 to $49,999 | 64 | 22.5% |
| $50,000 to $74,999 | 46 | 16.1% |
| $75,000 to $99,999 | 39 | 13.7% |
| $100,000 to $149,999 | 28 | 9.8% |
| $150,000 to $199,999 | 9 | 3.2% |
| $200,000+ | 15 | 5.3% |
Family Income by Famaliy Size in Mounds
4-person families (43 | 15.1%) account for the highest median family income in Mounds with $81,250 per family, while 4-person families (43 | 15.1%) have the highest median income of $20,312 per family member.
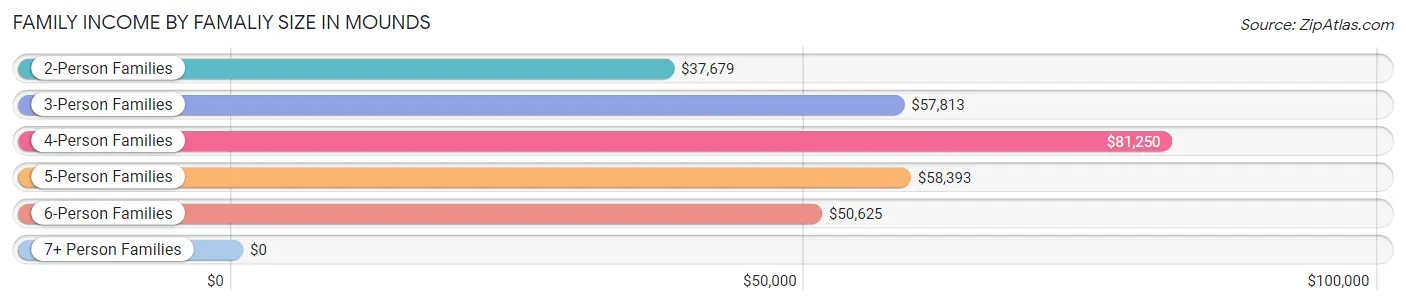
| Income Bracket | # Families | Median Income |
| 2-Person Families | 117 (41.0%) | $37,679 |
| 3-Person Families | 75 (26.3%) | $57,813 |
| 4-Person Families | 43 (15.1%) | $81,250 |
| 5-Person Families | 35 (12.3%) | $58,393 |
| 6-Person Families | 10 (3.5%) | $50,625 |
| 7+ Person Families | 5 (1.8%) | $0 |
| Total | 285 (100.0%) | $49,236 |
Family Income by Number of Earners in Mounds
The median family income in Mounds is $49,236, with families comprising 3+ earners (17) having the highest median family income of $137,813, while families with no earners (56) have the lowest median family income of $33,750, accounting for 6.0% and 19.7% of families, respectively.
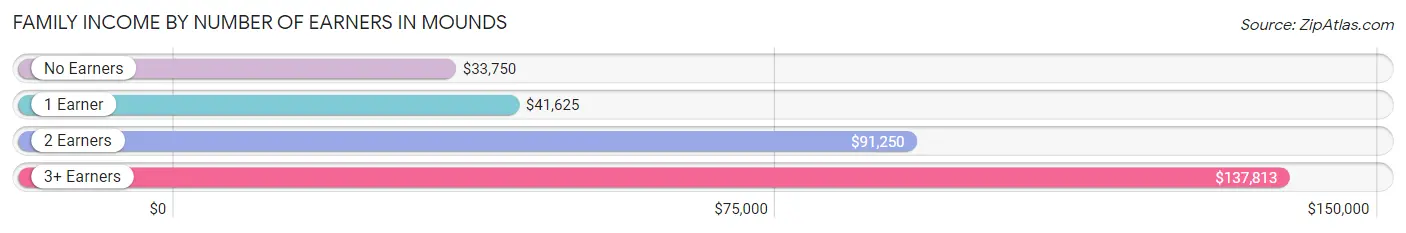
| Number of Earners | # Families | Median Income |
| No Earners | 56 (19.7%) | $33,750 |
| 1 Earner | 139 (48.8%) | $41,625 |
| 2 Earners | 73 (25.6%) | $91,250 |
| 3+ Earners | 17 (6.0%) | $137,813 |
| Total | 285 (100.0%) | $49,236 |
Household Income in Mounds
Household Income Brackets in Mounds
With 71 households falling in the category, the $35,000 to $49,999 income range is the most frequent in Mounds, accounting for 17.5% of all households. In contrast, only 15 households (3.7%) fall into the $200,000+ income bracket, making it the least populous group.
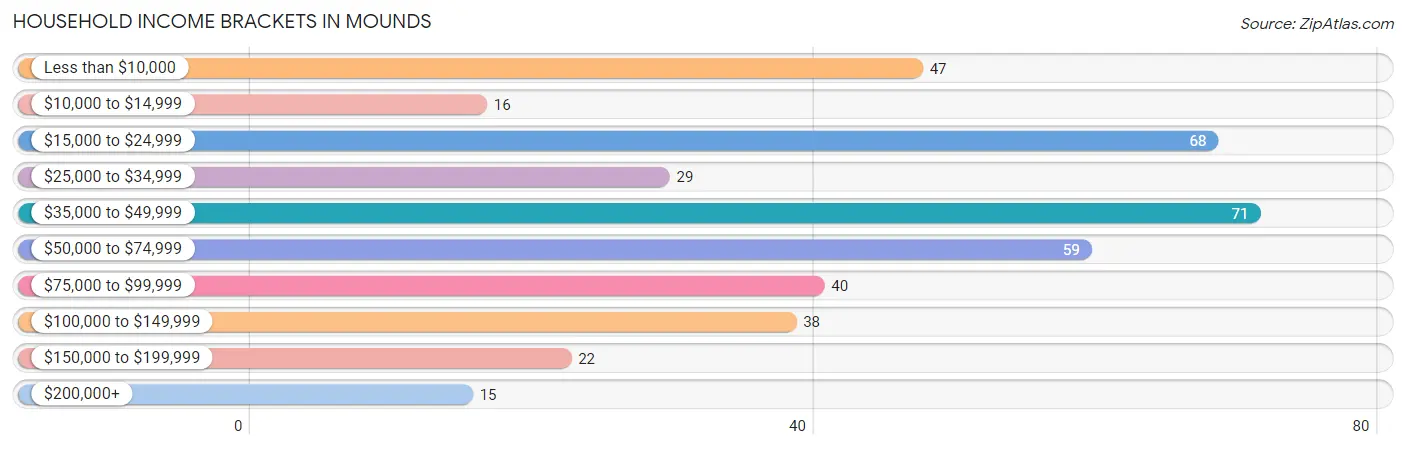
| Income Bracket | # Households | % Households |
| Less than $10,000 | 47 | 11.6% |
| $10,000 to $14,999 | 16 | 4.0% |
| $15,000 to $24,999 | 68 | 16.8% |
| $25,000 to $34,999 | 29 | 7.2% |
| $35,000 to $49,999 | 71 | 17.5% |
| $50,000 to $74,999 | 59 | 14.6% |
| $75,000 to $99,999 | 40 | 9.9% |
| $100,000 to $149,999 | 38 | 9.4% |
| $150,000 to $199,999 | 22 | 5.4% |
| $200,000+ | 15 | 3.7% |
Household Income by Householder Age in Mounds
The median household income in Mounds is $42,014, with the highest median household income of $59,063 found in the 45 to 64 years age bracket for the primary householder. A total of 151 households (37.3%) fall into this category. Meanwhile, the 65+ years age bracket for the primary householder has the lowest median household income of $23,750, with 102 households (25.2%) in this group.
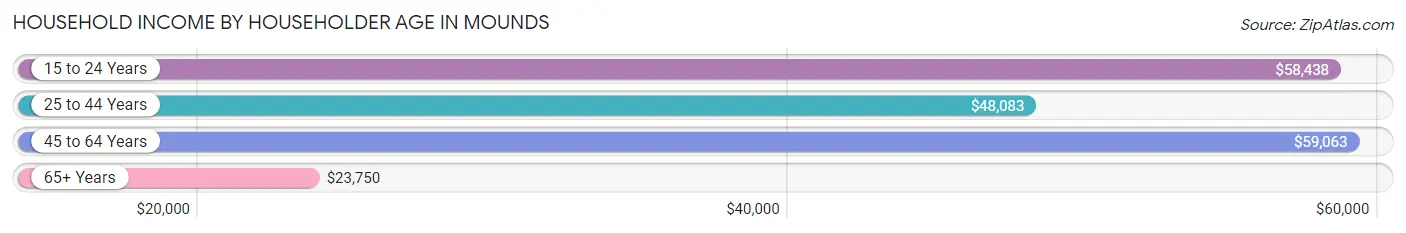
| Income Bracket | # Households | Median Income |
| 15 to 24 Years | 31 (7.6%) | $58,438 |
| 25 to 44 Years | 121 (29.9%) | $48,083 |
| 45 to 64 Years | 151 (37.3%) | $59,063 |
| 65+ Years | 102 (25.2%) | $23,750 |
| Total | 405 (100.0%) | $42,014 |
Poverty in Mounds
Income Below Poverty by Sex and Age in Mounds
With 13.0% poverty level for males and 15.8% for females among the residents of Mounds, 35 to 44 year old males and under 5 year old females are the most vulnerable to poverty, with 15 males (26.8%) and 12 females (36.4%) in their respective age groups living below the poverty level.
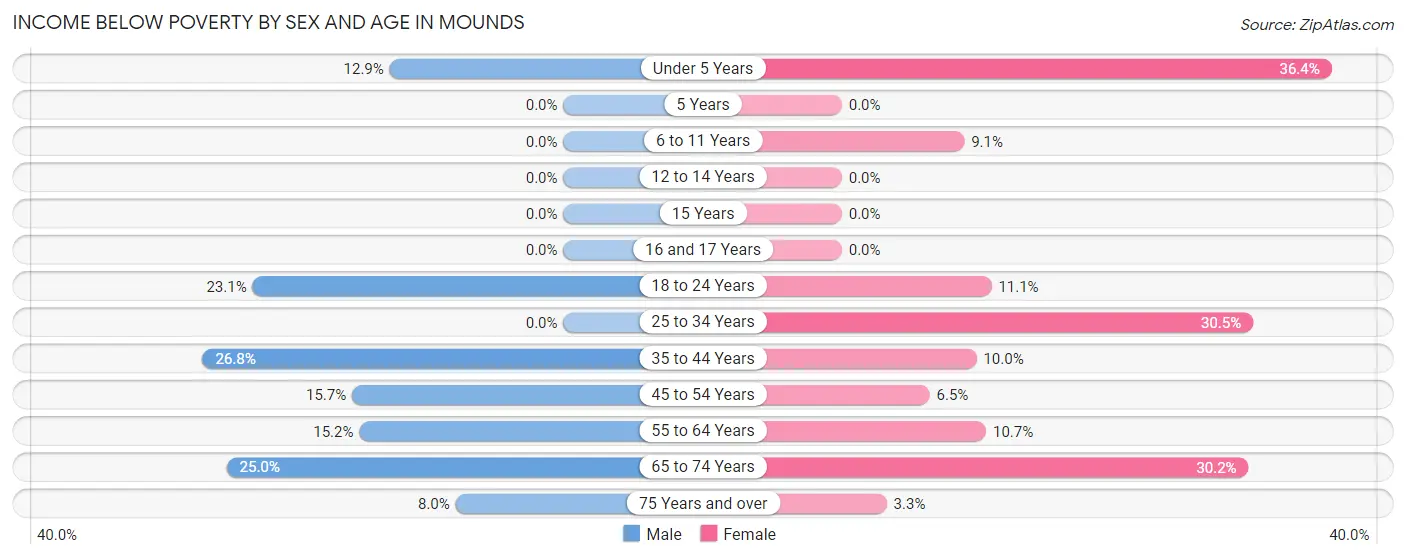
| Age Bracket | Male | Female |
| Under 5 Years | 8 (12.9%) | 12 (36.4%) |
| 5 Years | 0 (0.0%) | 0 (0.0%) |
| 6 to 11 Years | 0 (0.0%) | 4 (9.1%) |
| 12 to 14 Years | 0 (0.0%) | 0 (0.0%) |
| 15 Years | 0 (0.0%) | 0 (0.0%) |
| 16 and 17 Years | 0 (0.0%) | 0 (0.0%) |
| 18 to 24 Years | 12 (23.1%) | 7 (11.1%) |
| 25 to 34 Years | 0 (0.0%) | 29 (30.5%) |
| 35 to 44 Years | 15 (26.8%) | 8 (10.0%) |
| 45 to 54 Years | 8 (15.7%) | 3 (6.5%) |
| 55 to 64 Years | 10 (15.1%) | 9 (10.7%) |
| 65 to 74 Years | 13 (25.0%) | 16 (30.2%) |
| 75 Years and over | 2 (8.0%) | 1 (3.3%) |
| Total | 68 (13.0%) | 89 (15.8%) |
Income Above Poverty by Sex and Age in Mounds
According to the poverty statistics in Mounds, males aged 5 years and females aged 5 years are the age groups that are most secure financially, with 100.0% of males and 100.0% of females in these age groups living above the poverty line.
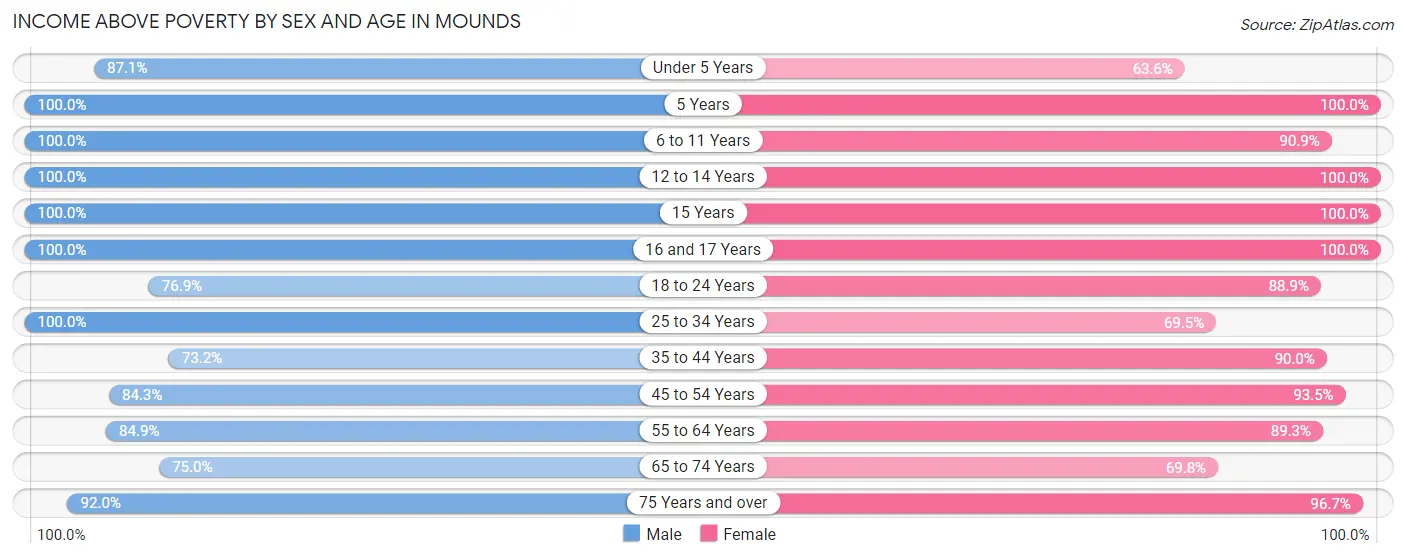
| Age Bracket | Male | Female |
| Under 5 Years | 54 (87.1%) | 21 (63.6%) |
| 5 Years | 4 (100.0%) | 3 (100.0%) |
| 6 to 11 Years | 57 (100.0%) | 40 (90.9%) |
| 12 to 14 Years | 13 (100.0%) | 20 (100.0%) |
| 15 Years | 9 (100.0%) | 6 (100.0%) |
| 16 and 17 Years | 15 (100.0%) | 5 (100.0%) |
| 18 to 24 Years | 40 (76.9%) | 56 (88.9%) |
| 25 to 34 Years | 62 (100.0%) | 66 (69.5%) |
| 35 to 44 Years | 41 (73.2%) | 72 (90.0%) |
| 45 to 54 Years | 43 (84.3%) | 43 (93.5%) |
| 55 to 64 Years | 56 (84.9%) | 75 (89.3%) |
| 65 to 74 Years | 39 (75.0%) | 37 (69.8%) |
| 75 Years and over | 23 (92.0%) | 29 (96.7%) |
| Total | 456 (87.0%) | 473 (84.2%) |
Income Below Poverty Among Married-Couple Families in Mounds
The poverty statistics for married-couple families in Mounds show that 7.6% or 14 of the total 183 families live below the poverty line. Families with 1 or 2 children have the highest poverty rate of 11.1%, comprising of 8 families. On the other hand, families with 3 or 4 children have the lowest poverty rate of 0.0%, which includes 0 families.
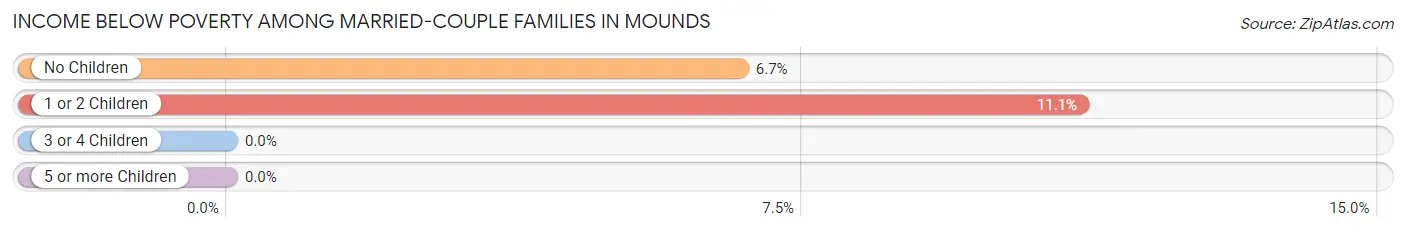
| Children | Above Poverty | Below Poverty |
| No Children | 84 (93.3%) | 6 (6.7%) |
| 1 or 2 Children | 64 (88.9%) | 8 (11.1%) |
| 3 or 4 Children | 21 (100.0%) | 0 (0.0%) |
| 5 or more Children | 0 (0.0%) | 0 (0.0%) |
| Total | 169 (92.3%) | 14 (7.6%) |
Income Below Poverty Among Single-Parent Households in Mounds
According to the poverty data in Mounds, 38.5% or 10 single-father households and 30.3% or 23 single-mother households are living below the poverty line. Among single-father households, those with no children have the highest poverty rate, with 10 households (71.4%) experiencing poverty. Likewise, among single-mother households, those with 1 or 2 children have the highest poverty rate, with 19 households (36.5%) falling below the poverty line.
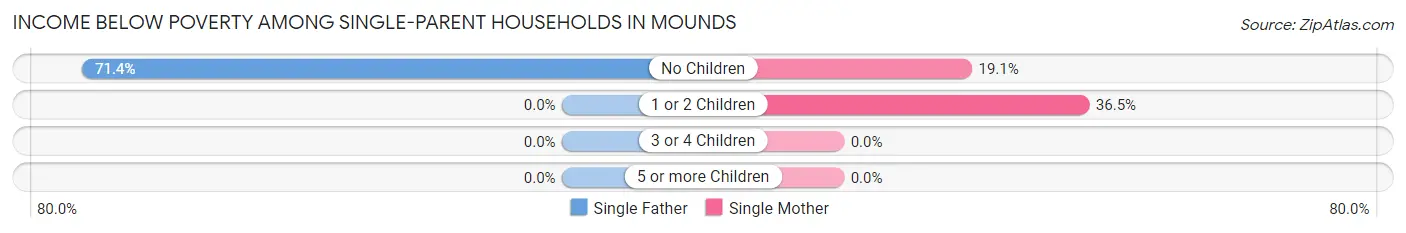
| Children | Single Father | Single Mother |
| No Children | 10 (71.4%) | 4 (19.1%) |
| 1 or 2 Children | 0 (0.0%) | 19 (36.5%) |
| 3 or 4 Children | 0 (0.0%) | 0 (0.0%) |
| 5 or more Children | 0 (0.0%) | 0 (0.0%) |
| Total | 10 (38.5%) | 23 (30.3%) |
Income Below Poverty Among Married-Couple vs Single-Parent Households in Mounds
The poverty data for Mounds shows that 14 of the married-couple family households (7.6%) and 33 of the single-parent households (32.4%) are living below the poverty level. Within the married-couple family households, those with 1 or 2 children have the highest poverty rate, with 8 households (11.1%) falling below the poverty line. Among the single-parent households, those with no children have the highest poverty rate, with 14 household (40.0%) living below poverty.
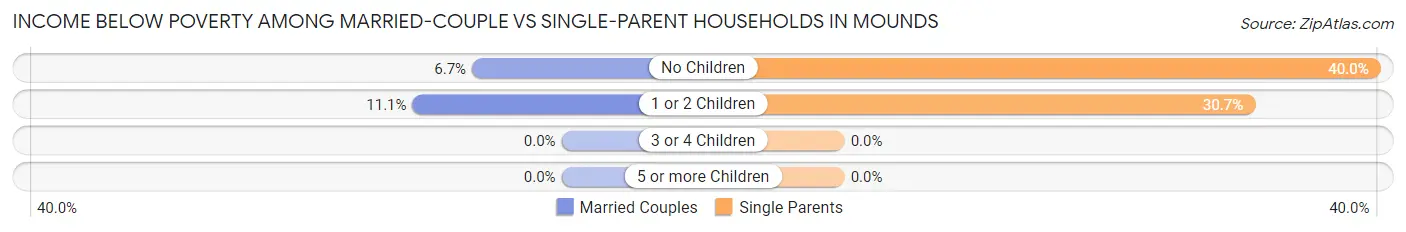
| Children | Married-Couple Families | Single-Parent Households |
| No Children | 6 (6.7%) | 14 (40.0%) |
| 1 or 2 Children | 8 (11.1%) | 19 (30.6%) |
| 3 or 4 Children | 0 (0.0%) | 0 (0.0%) |
| 5 or more Children | 0 (0.0%) | 0 (0.0%) |
| Total | 14 (7.6%) | 33 (32.4%) |
Race in Mounds
The most populous races in Mounds are White / Caucasian (835 | 76.0%), Native / Alaskan (131 | 11.9%), and Two or more Races (110 | 10.0%).
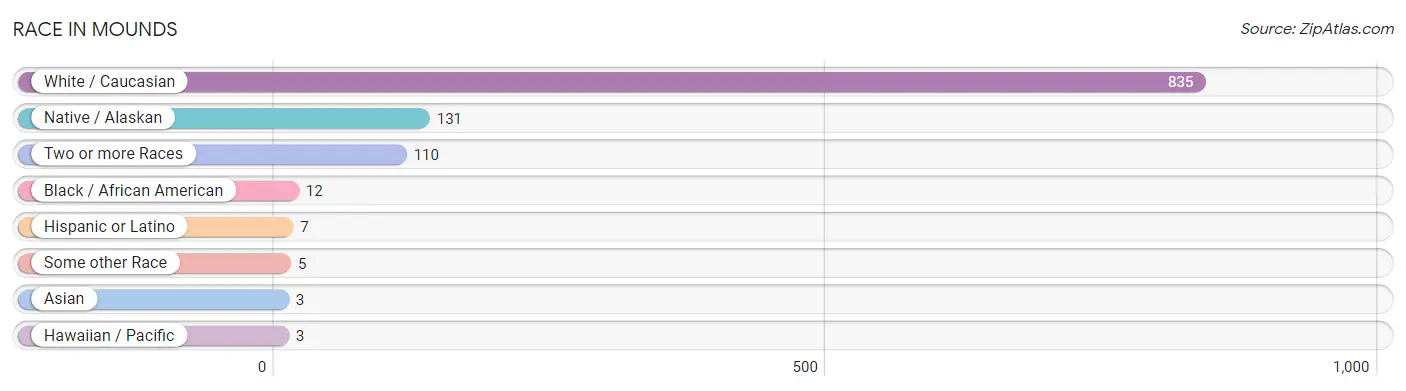
| Race | # Population | % Population |
| Asian | 3 | 0.3% |
| Black / African American | 12 | 1.1% |
| Hawaiian / Pacific | 3 | 0.3% |
| Hispanic or Latino | 7 | 0.6% |
| Native / Alaskan | 131 | 11.9% |
| White / Caucasian | 835 | 76.0% |
| Two or more Races | 110 | 10.0% |
| Some other Race | 5 | 0.4% |
| Total | 1,099 | 100.0% |
Ancestry in Mounds
The most populous ancestries reported in Mounds are Irish (120 | 10.9%), Creek (103 | 9.4%), German (98 | 8.9%), Cherokee (81 | 7.4%), and American (79 | 7.2%), together accounting for 43.8% of all Mounds residents.
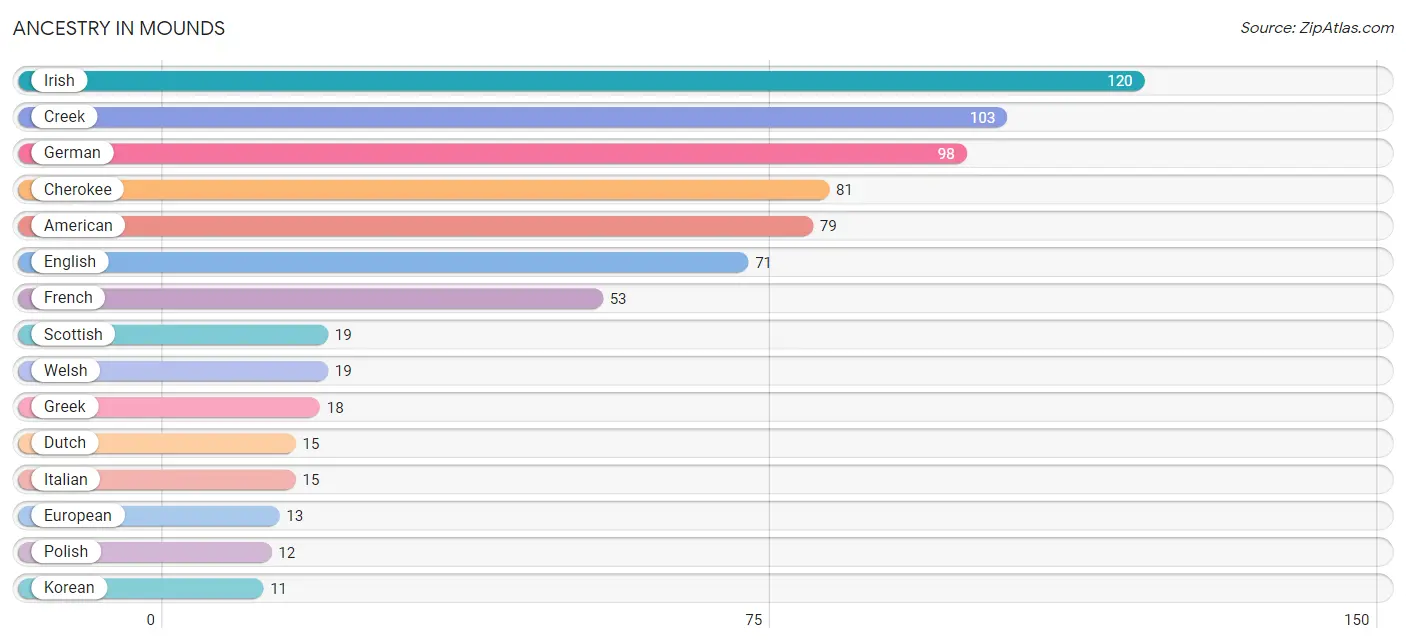
| Ancestry | # Population | % Population |
| American | 79 | 7.2% |
| Cherokee | 81 | 7.4% |
| Choctaw | 3 | 0.3% |
| Creek | 103 | 9.4% |
| Dutch | 15 | 1.4% |
| English | 71 | 6.5% |
| European | 13 | 1.2% |
| French | 53 | 4.8% |
| French Canadian | 5 | 0.4% |
| German | 98 | 8.9% |
| Greek | 18 | 1.6% |
| Guamanian / Chamorro | 8 | 0.7% |
| Irish | 120 | 10.9% |
| Italian | 15 | 1.4% |
| Korean | 11 | 1.0% |
| Mexican | 2 | 0.2% |
| Nigerian | 2 | 0.2% |
| Norwegian | 6 | 0.5% |
| Polish | 12 | 1.1% |
| Portuguese | 7 | 0.6% |
| Potawatomi | 10 | 0.9% |
| Scottish | 19 | 1.7% |
| Sioux | 1 | 0.1% |
| Spaniard | 2 | 0.2% |
| Subsaharan African | 2 | 0.2% |
| Swedish | 2 | 0.2% |
| Welsh | 19 | 1.7% |
| Yugoslavian | 1 | 0.1% | View All 28 Rows |
Immigrants in Mounds
The most numerous immigrant groups reported in Mounds came from Asia (3 | 0.3%), Philippines (3 | 0.3%), South Eastern Asia (3 | 0.3%), Central America (2 | 0.2%), and Latin America (2 | 0.2%), together accounting for 1.2% of all Mounds residents.
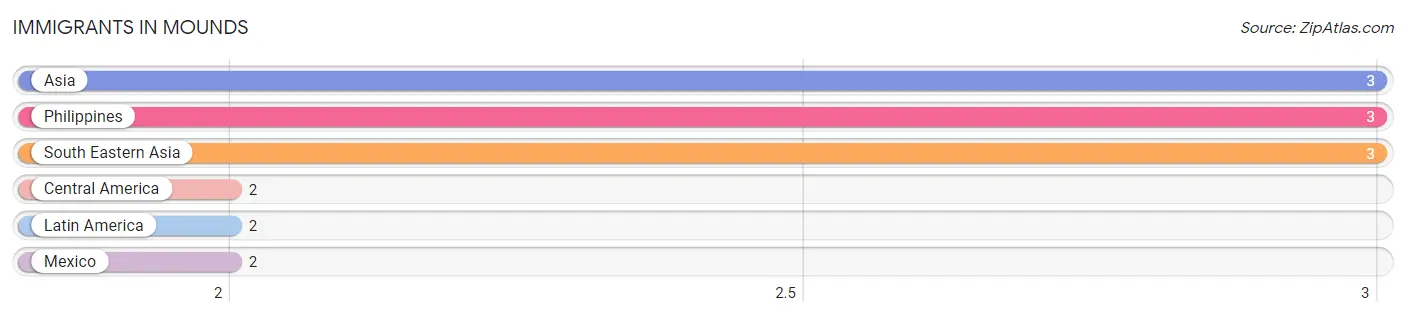
| Immigration Origin | # Population | % Population |
| Asia | 3 | 0.3% |
| Central America | 2 | 0.2% |
| Latin America | 2 | 0.2% |
| Mexico | 2 | 0.2% |
| Philippines | 3 | 0.3% |
| South Eastern Asia | 3 | 0.3% | View All 6 Rows |
Sex and Age in Mounds
Sex and Age in Mounds
The most populous age groups in Mounds are Under 5 Years (64 | 12.1%) for men and 25 to 29 Years (79 | 13.9%) for women.
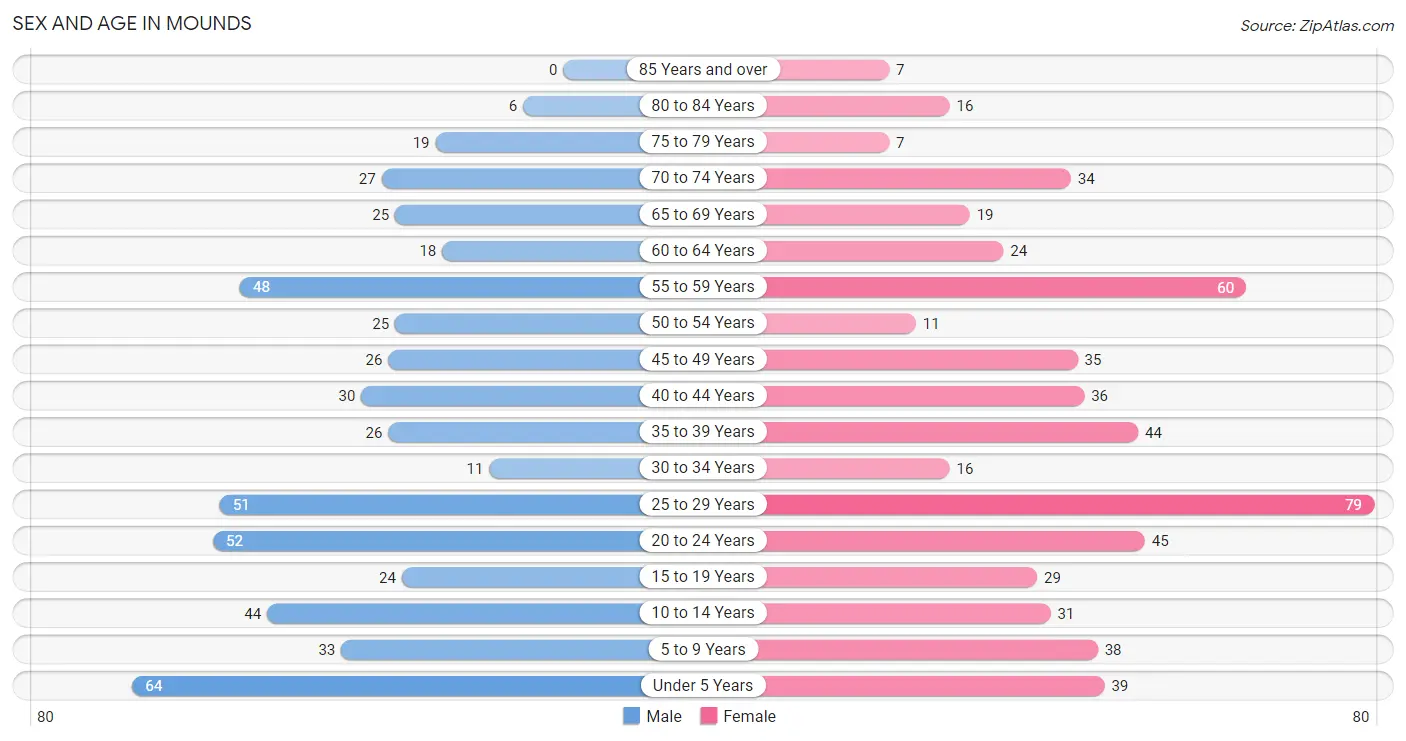
| Age Bracket | Male | Female |
| Under 5 Years | 64 (12.1%) | 39 (6.8%) |
| 5 to 9 Years | 33 (6.2%) | 38 (6.7%) |
| 10 to 14 Years | 44 (8.3%) | 31 (5.4%) |
| 15 to 19 Years | 24 (4.5%) | 29 (5.1%) |
| 20 to 24 Years | 52 (9.8%) | 45 (7.9%) |
| 25 to 29 Years | 51 (9.6%) | 79 (13.9%) |
| 30 to 34 Years | 11 (2.1%) | 16 (2.8%) |
| 35 to 39 Years | 26 (4.9%) | 44 (7.7%) |
| 40 to 44 Years | 30 (5.7%) | 36 (6.3%) |
| 45 to 49 Years | 26 (4.9%) | 35 (6.1%) |
| 50 to 54 Years | 25 (4.7%) | 11 (1.9%) |
| 55 to 59 Years | 48 (9.1%) | 60 (10.5%) |
| 60 to 64 Years | 18 (3.4%) | 24 (4.2%) |
| 65 to 69 Years | 25 (4.7%) | 19 (3.3%) |
| 70 to 74 Years | 27 (5.1%) | 34 (6.0%) |
| 75 to 79 Years | 19 (3.6%) | 7 (1.2%) |
| 80 to 84 Years | 6 (1.1%) | 16 (2.8%) |
| 85 Years and over | 0 (0.0%) | 7 (1.2%) |
| Total | 529 (100.0%) | 570 (100.0%) |
Families and Households in Mounds
Median Family Size in Mounds
The median family size in Mounds is 3.22 persons per family, with married-couple families (183 | 64.2%) accounting for the largest median family size of 3.44 persons per family. On the other hand, single female/mother families (76 | 26.7%) represent the smallest median family size with 2.76 persons per family.
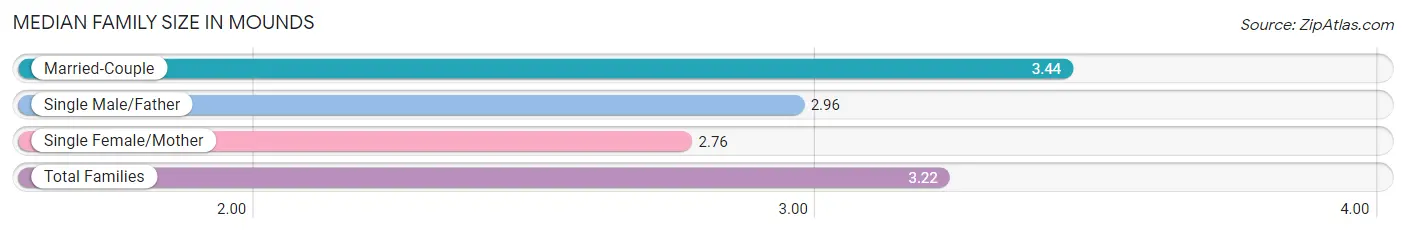
| Family Type | # Families | Family Size |
| Married-Couple | 183 (64.2%) | 3.44 |
| Single Male/Father | 26 (9.1%) | 2.96 |
| Single Female/Mother | 76 (26.7%) | 2.76 |
| Total Families | 285 (100.0%) | 3.22 |
Median Household Size in Mounds
The median household size in Mounds is 2.71 persons per household, with married-couple households (183 | 45.2%) accounting for the largest median household size of 3.49 persons per household. non-family households (120 | 29.6%) represent the smallest median household size with 1.20 persons per household.
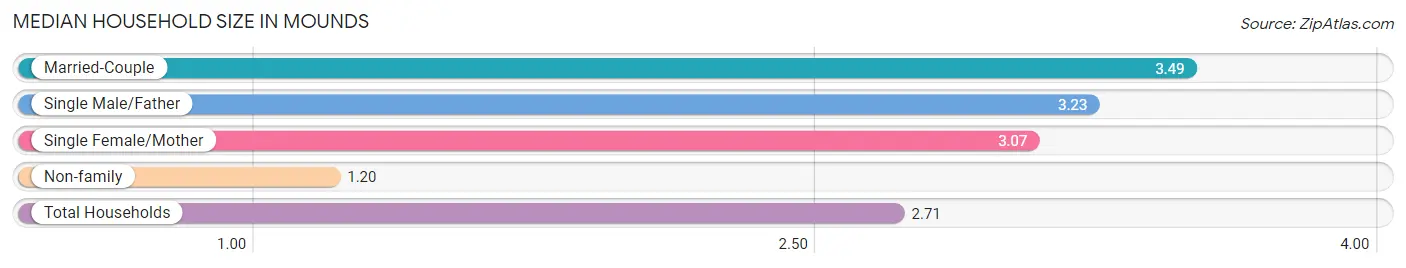
| Household Type | # Households | Household Size |
| Married-Couple | 183 (45.2%) | 3.49 |
| Single Male/Father | 26 (6.4%) | 3.23 |
| Single Female/Mother | 76 (18.8%) | 3.07 |
| Non-family | 120 (29.6%) | 1.20 |
| Total Households | 405 (100.0%) | 2.71 |
Household Size by Marriage Status in Mounds
Out of a total of 405 households in Mounds, 285 (70.4%) are family households, while 120 (29.6%) are nonfamily households. The most numerous type of family households are 2-person households, comprising 102, and the most common type of nonfamily households are 1-person households, comprising 100.
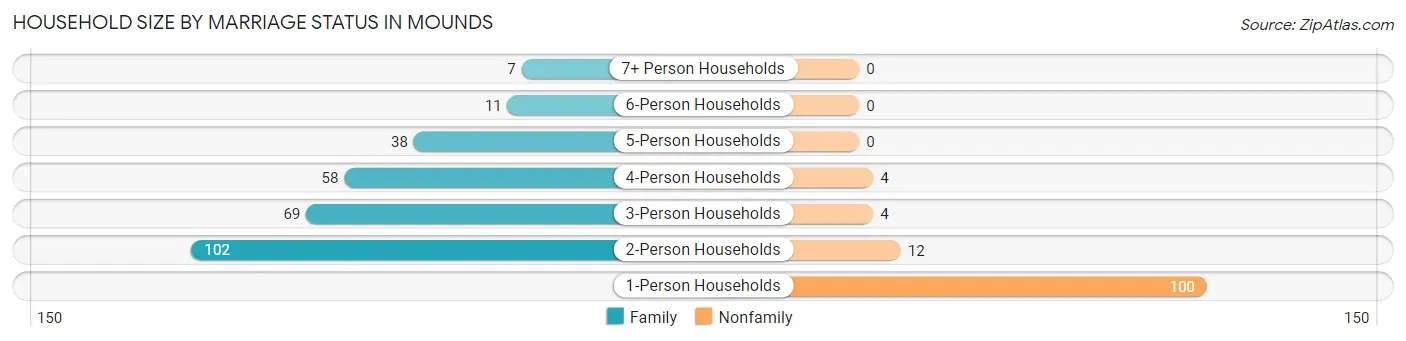
| Household Size | Family Households | Nonfamily Households |
| 1-Person Households | - | 100 (24.7%) |
| 2-Person Households | 102 (25.2%) | 12 (3.0%) |
| 3-Person Households | 69 (17.0%) | 4 (1.0%) |
| 4-Person Households | 58 (14.3%) | 4 (1.0%) |
| 5-Person Households | 38 (9.4%) | 0 (0.0%) |
| 6-Person Households | 11 (2.7%) | 0 (0.0%) |
| 7+ Person Households | 7 (1.7%) | 0 (0.0%) |
| Total | 285 (70.4%) | 120 (29.6%) |
Female Fertility in Mounds
Fertility by Age in Mounds
Average fertility rate in Mounds is 60.0 births per 1,000 women. Women in the age bracket of 20 to 34 years have the highest fertility rate with 121.0 births per 1,000 women. Women in the age bracket of 20 to 34 years acount for 100.0% of all women with births.
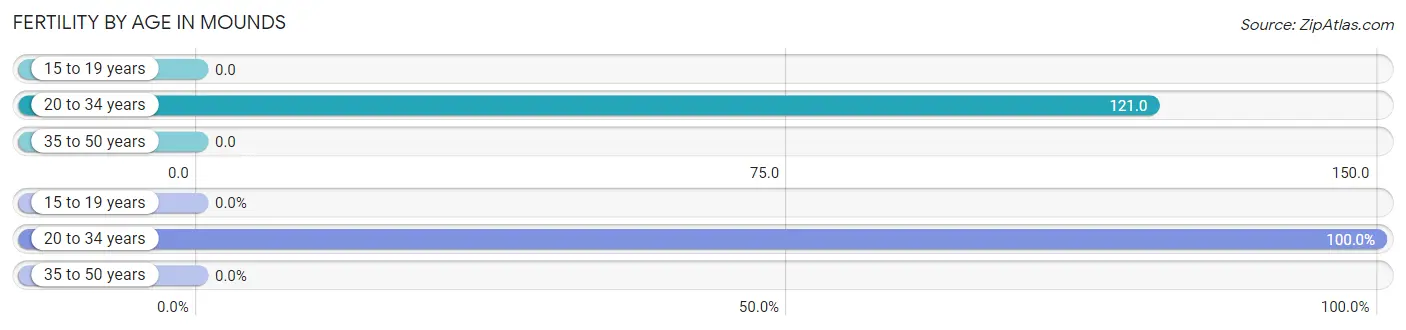
| Age Bracket | Women with Births | Births / 1,000 Women |
| 15 to 19 years | 0 (0.0%) | 0.0 |
| 20 to 34 years | 17 (100.0%) | 121.0 |
| 35 to 50 years | 0 (0.0%) | 0.0 |
| Total | 17 (100.0%) | 60.0 |
Fertility by Age by Marriage Status in Mounds
70.6% of women with births (17) in Mounds are married. The highest percentage of unmarried women with births falls into 20 to 34 years age bracket with 29.4% of them unmarried at the time of birth, while the lowest percentage of unmarried women with births belong to 20 to 34 years age bracket with 29.4% of them unmarried.
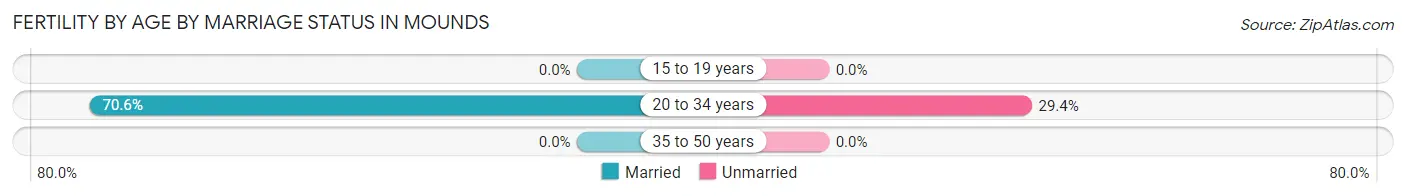
| Age Bracket | Married | Unmarried |
| 15 to 19 years | 0 (0.0%) | 0 (0.0%) |
| 20 to 34 years | 12 (70.6%) | 5 (29.4%) |
| 35 to 50 years | 0 (0.0%) | 0 (0.0%) |
| Total | 12 (70.6%) | 5 (29.4%) |
Fertility by Education in Mounds
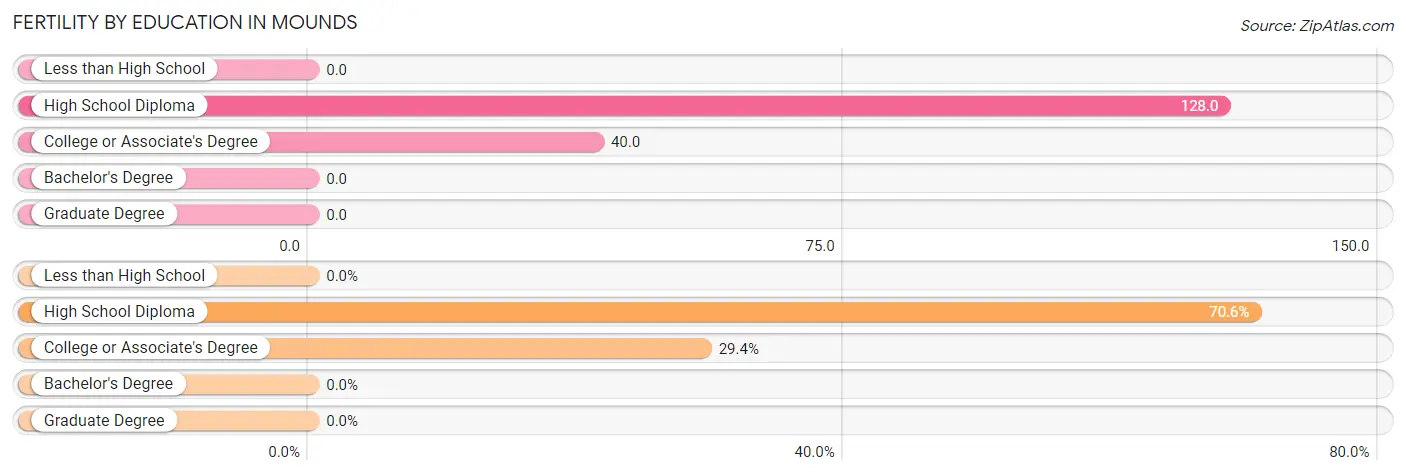
| Educational Attainment | Women with Births | Births / 1,000 Women |
| Less than High School | 0 (0.0%) | 0.0 |
| High School Diploma | 12 (70.6%) | 128.0 |
| College or Associate's Degree | 5 (29.4%) | 40.0 |
| Bachelor's Degree | 0 (0.0%) | 0.0 |
| Graduate Degree | 0 (0.0%) | 0.0 |
| Total | 17 (100.0%) | 60.0 |
Fertility by Education by Marriage Status in Mounds
29.4% of women with births in Mounds are unmarried. Women with the educational attainment of college or associate's degree are most likely to be married with 100.0% of them married at childbirth, while women with the educational attainment of high school diploma are least likely to be married with 41.7% of them unmarried at childbirth.
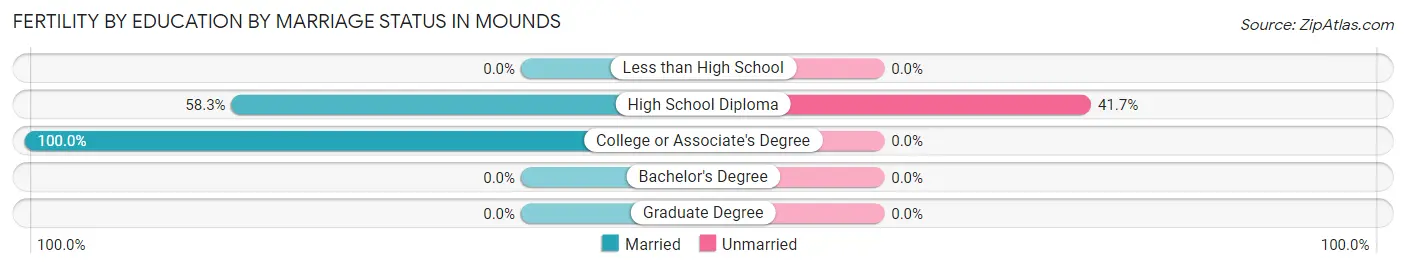
| Educational Attainment | Married | Unmarried |
| Less than High School | 0 (0.0%) | 0 (0.0%) |
| High School Diploma | 7 (58.3%) | 5 (41.7%) |
| College or Associate's Degree | 5 (100.0%) | 0 (0.0%) |
| Bachelor's Degree | 0 (0.0%) | 0 (0.0%) |
| Graduate Degree | 0 (0.0%) | 0 (0.0%) |
| Total | 12 (70.6%) | 5 (29.4%) |
Employment Characteristics in Mounds
Employment by Class of Employer in Mounds
Among the 422 employed individuals in Mounds, private company employees (281 | 66.6%), local government employees (45 | 10.7%), and not-for-profit organizations (29 | 6.9%) make up the most common classes of employment.
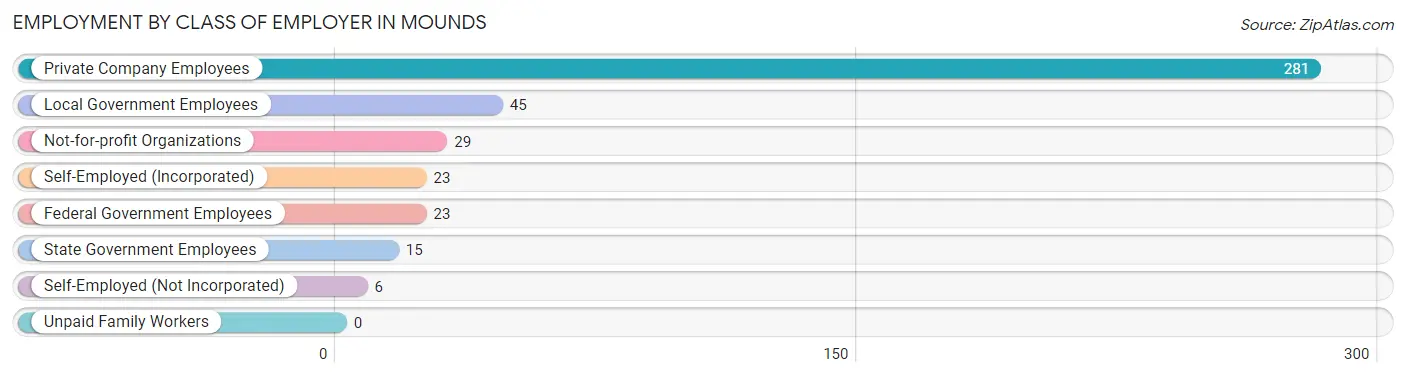
| Employer Class | # Employees | % Employees |
| Private Company Employees | 281 | 66.6% |
| Self-Employed (Incorporated) | 23 | 5.4% |
| Self-Employed (Not Incorporated) | 6 | 1.4% |
| Not-for-profit Organizations | 29 | 6.9% |
| Local Government Employees | 45 | 10.7% |
| State Government Employees | 15 | 3.5% |
| Federal Government Employees | 23 | 5.4% |
| Unpaid Family Workers | 0 | 0.0% |
| Total | 422 | 100.0% |
Employment Status by Age in Mounds
According to the labor force statistics for Mounds, out of the total population over 16 years of age (835), 52.1% or 435 individuals are in the labor force, with 2.6% or 11 of them unemployed. The age group with the highest labor force participation rate is 30 to 34 years, with 85.2% or 23 individuals in the labor force. Within the labor force, the 35 to 44 years age range has the highest percentage of unemployed individuals, with 6.9% or 7 of them being unemployed.
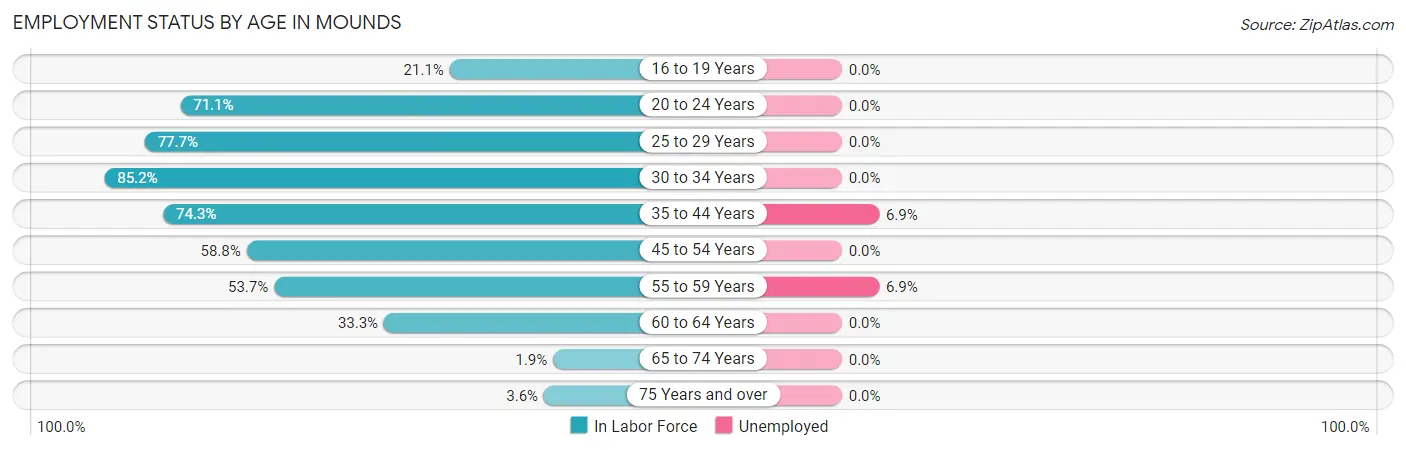
| Age Bracket | In Labor Force | Unemployed |
| 16 to 19 Years | 8 (21.1%) | 0 (0.0%) |
| 20 to 24 Years | 69 (71.1%) | 0 (0.0%) |
| 25 to 29 Years | 101 (77.7%) | 0 (0.0%) |
| 30 to 34 Years | 23 (85.2%) | 0 (0.0%) |
| 35 to 44 Years | 101 (74.3%) | 7 (6.9%) |
| 45 to 54 Years | 57 (58.8%) | 0 (0.0%) |
| 55 to 59 Years | 58 (53.7%) | 4 (6.9%) |
| 60 to 64 Years | 14 (33.3%) | 0 (0.0%) |
| 65 to 74 Years | 2 (1.9%) | 0 (0.0%) |
| 75 Years and over | 2 (3.6%) | 0 (0.0%) |
| Total | 435 (52.1%) | 11 (2.6%) |
Employment Status by Educational Attainment in Mounds
According to labor force statistics for Mounds, 65.6% of individuals (354) out of the total population between 25 and 64 years of age (540) are in the labor force, with 3.1% or 11 of them being unemployed. The group with the highest labor force participation rate are those with the educational attainment of bachelor's degree or higher, with 81.7% or 67 individuals in the labor force. Within the labor force, individuals with college / associate degree education have the highest percentage of unemployment, with 4.2% or 7 of them being unemployed.
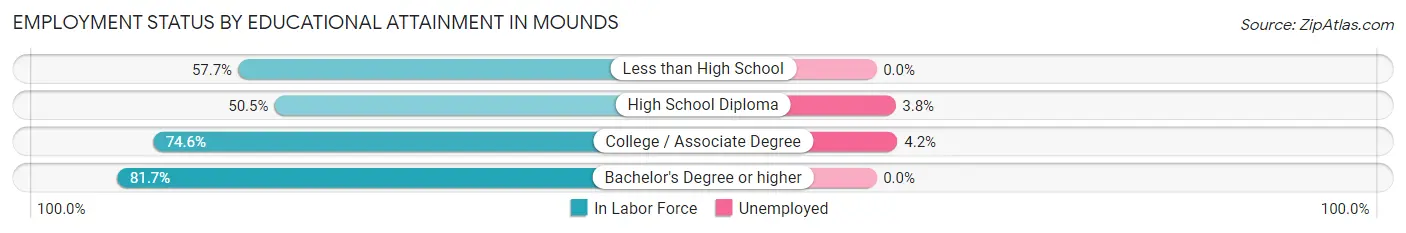
| Educational Attainment | In Labor Force | Unemployed |
| Less than High School | 15 (57.7%) | 0 (0.0%) |
| High School Diploma | 105 (50.5%) | 8 (3.8%) |
| College / Associate Degree | 167 (74.6%) | 9 (4.2%) |
| Bachelor's Degree or higher | 67 (81.7%) | 0 (0.0%) |
| Total | 354 (65.6%) | 17 (3.1%) |
Employment Occupations by Sex in Mounds
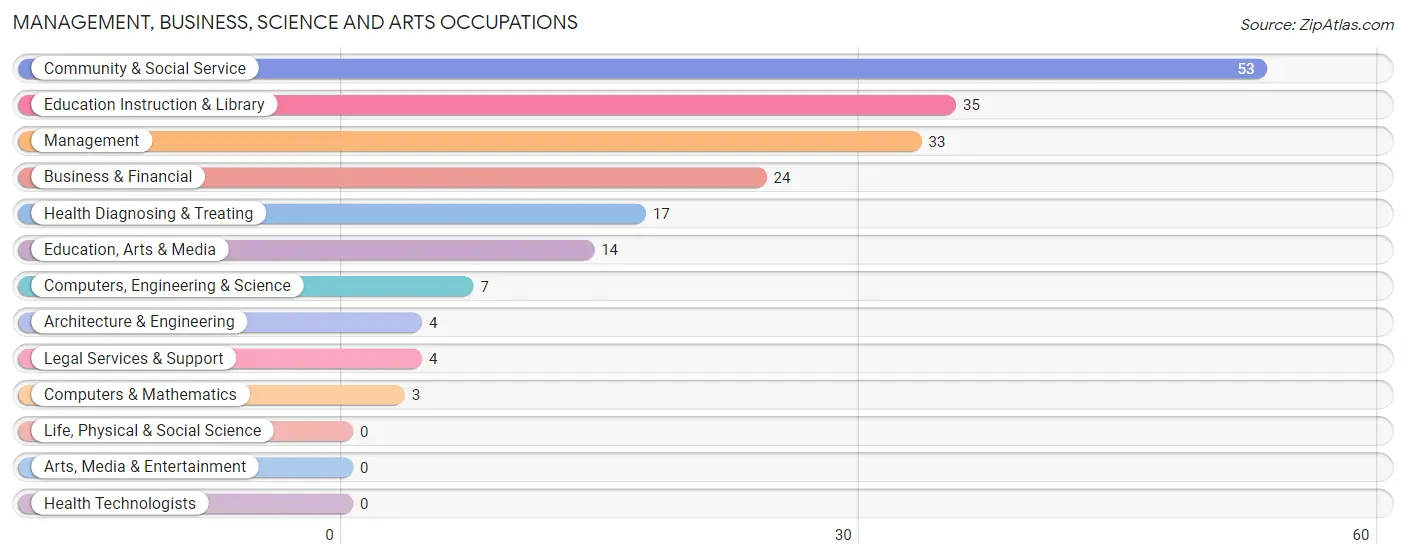
Management, Business, Science and Arts Occupations
The most common Management, Business, Science and Arts occupations in Mounds are Community & Social Service (53 | 12.6%), Education Instruction & Library (35 | 8.3%), Management (33 | 7.9%), Business & Financial (24 | 5.7%), and Health Diagnosing & Treating (17 | 4.1%).
Management, Business, Science and Arts Occupations by Sex
Within the Management, Business, Science and Arts occupations in Mounds, the most male-oriented occupations are Education, Arts & Media (100.0%), Business & Financial (66.7%), and Management (33.3%), while the most female-oriented occupations are Computers, Engineering & Science (100.0%), Computers & Mathematics (100.0%), and Architecture & Engineering (100.0%).
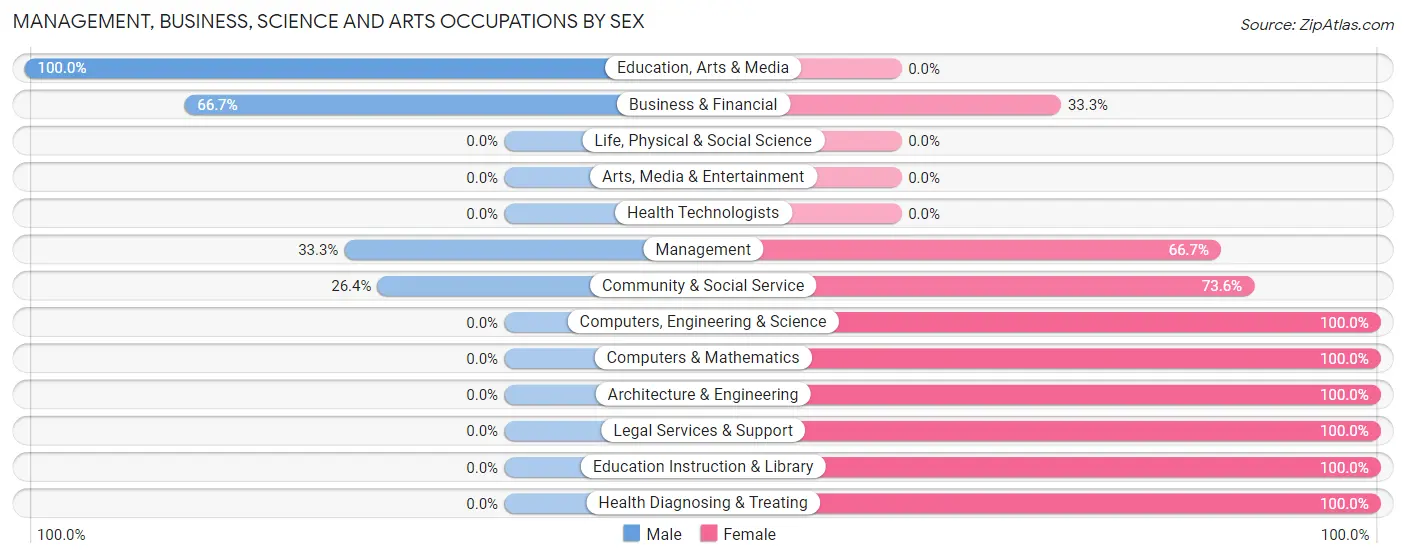
| Occupation | Male | Female |
| Management | 11 (33.3%) | 22 (66.7%) |
| Business & Financial | 16 (66.7%) | 8 (33.3%) |
| Computers, Engineering & Science | 0 (0.0%) | 7 (100.0%) |
| Computers & Mathematics | 0 (0.0%) | 3 (100.0%) |
| Architecture & Engineering | 0 (0.0%) | 4 (100.0%) |
| Life, Physical & Social Science | 0 (0.0%) | 0 (0.0%) |
| Community & Social Service | 14 (26.4%) | 39 (73.6%) |
| Education, Arts & Media | 14 (100.0%) | 0 (0.0%) |
| Legal Services & Support | 0 (0.0%) | 4 (100.0%) |
| Education Instruction & Library | 0 (0.0%) | 35 (100.0%) |
| Arts, Media & Entertainment | 0 (0.0%) | 0 (0.0%) |
| Health Diagnosing & Treating | 0 (0.0%) | 17 (100.0%) |
| Health Technologists | 0 (0.0%) | 0 (0.0%) |
| Total (Category) | 41 (30.6%) | 93 (69.4%) |
| Total (Overall) | 205 (48.8%) | 215 (51.2%) |
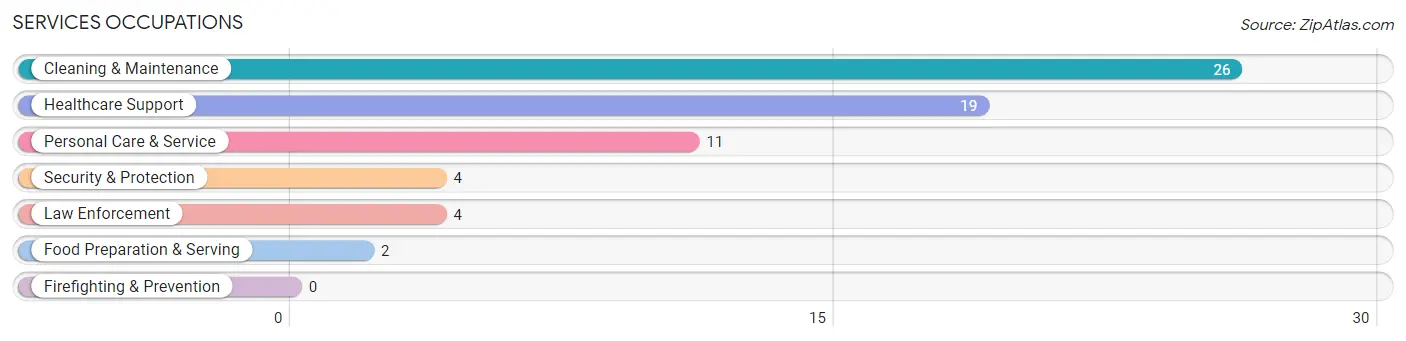
Services Occupations
The most common Services occupations in Mounds are Cleaning & Maintenance (26 | 6.2%), Healthcare Support (19 | 4.5%), Personal Care & Service (11 | 2.6%), Security & Protection (4 | 0.9%), and Law Enforcement (4 | 0.9%).
Services Occupations by Sex
Within the Services occupations in Mounds, the most male-oriented occupations are Security & Protection (100.0%), Law Enforcement (100.0%), and Personal Care & Service (63.6%), while the most female-oriented occupations are Food Preparation & Serving (100.0%), Cleaning & Maintenance (84.6%), and Healthcare Support (78.9%).
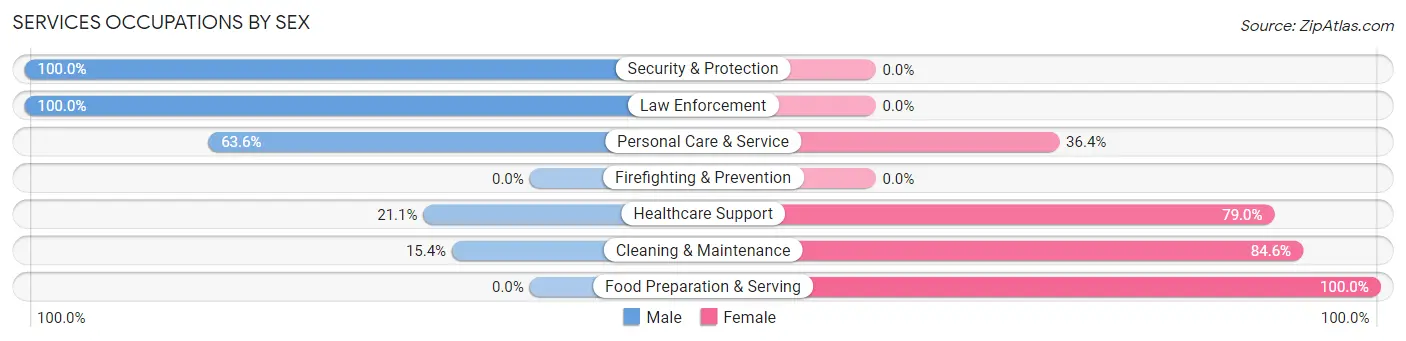
| Occupation | Male | Female |
| Healthcare Support | 4 (21.0%) | 15 (78.9%) |
| Security & Protection | 4 (100.0%) | 0 (0.0%) |
| Firefighting & Prevention | 0 (0.0%) | 0 (0.0%) |
| Law Enforcement | 4 (100.0%) | 0 (0.0%) |
| Food Preparation & Serving | 0 (0.0%) | 2 (100.0%) |
| Cleaning & Maintenance | 4 (15.4%) | 22 (84.6%) |
| Personal Care & Service | 7 (63.6%) | 4 (36.4%) |
| Total (Category) | 19 (30.6%) | 43 (69.4%) |
| Total (Overall) | 205 (48.8%) | 215 (51.2%) |
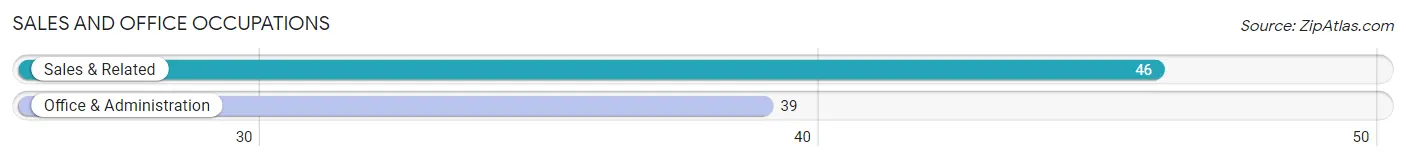
Sales and Office Occupations
The most common Sales and Office occupations in Mounds are Sales & Related (46 | 11.0%), and Office & Administration (39 | 9.3%).
Sales and Office Occupations by Sex
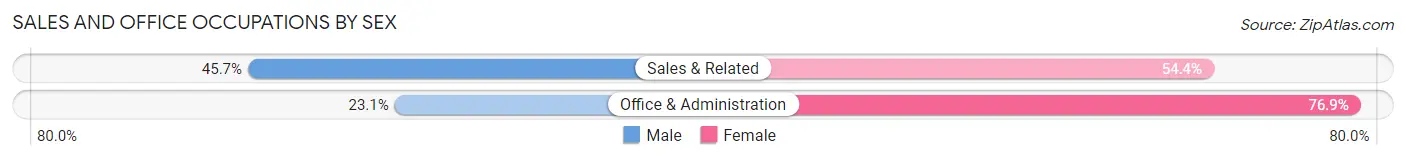
| Occupation | Male | Female |
| Sales & Related | 21 (45.7%) | 25 (54.3%) |
| Office & Administration | 9 (23.1%) | 30 (76.9%) |
| Total (Category) | 30 (35.3%) | 55 (64.7%) |
| Total (Overall) | 205 (48.8%) | 215 (51.2%) |
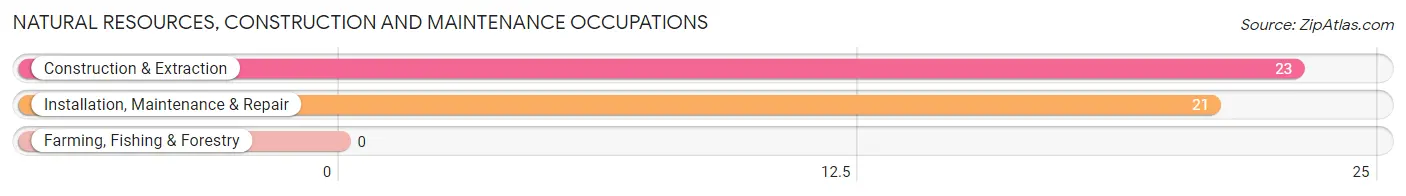
Natural Resources, Construction and Maintenance Occupations
The most common Natural Resources, Construction and Maintenance occupations in Mounds are Construction & Extraction (23 | 5.5%), and Installation, Maintenance & Repair (21 | 5.0%).
Natural Resources, Construction and Maintenance Occupations by Sex
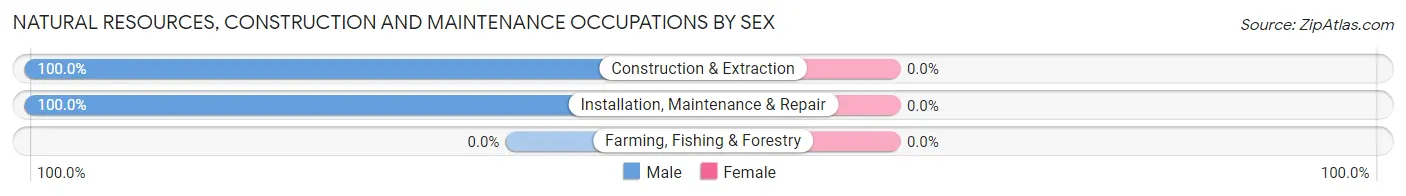
| Occupation | Male | Female |
| Farming, Fishing & Forestry | 0 (0.0%) | 0 (0.0%) |
| Construction & Extraction | 23 (100.0%) | 0 (0.0%) |
| Installation, Maintenance & Repair | 21 (100.0%) | 0 (0.0%) |
| Total (Category) | 44 (100.0%) | 0 (0.0%) |
| Total (Overall) | 205 (48.8%) | 215 (51.2%) |
Production, Transportation and Moving Occupations
The most common Production, Transportation and Moving occupations in Mounds are Production (55 | 13.1%), Transportation (31 | 7.4%), and Material Moving (9 | 2.1%).
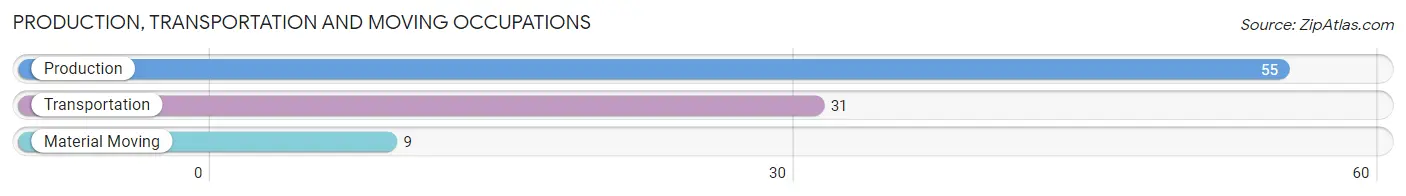
Production, Transportation and Moving Occupations by Sex
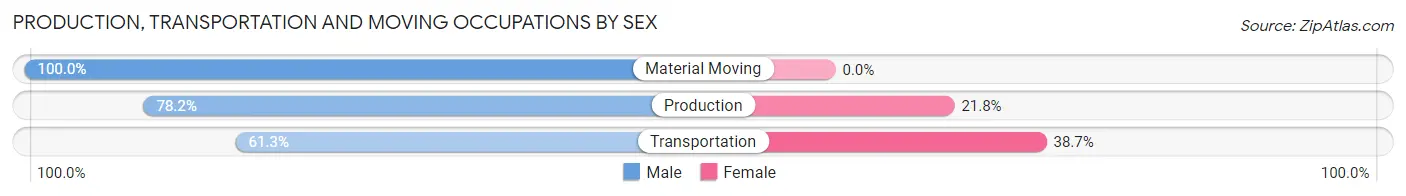
| Occupation | Male | Female |
| Production | 43 (78.2%) | 12 (21.8%) |
| Transportation | 19 (61.3%) | 12 (38.7%) |
| Material Moving | 9 (100.0%) | 0 (0.0%) |
| Total (Category) | 71 (74.7%) | 24 (25.3%) |
| Total (Overall) | 205 (48.8%) | 215 (51.2%) |
Employment Industries by Sex in Mounds
Employment Industries in Mounds
The major employment industries in Mounds include Manufacturing (62 | 14.8%), Educational Services (60 | 14.3%), Retail Trade (58 | 13.8%), Health Care & Social Assistance (56 | 13.3%), and Construction (43 | 10.2%).
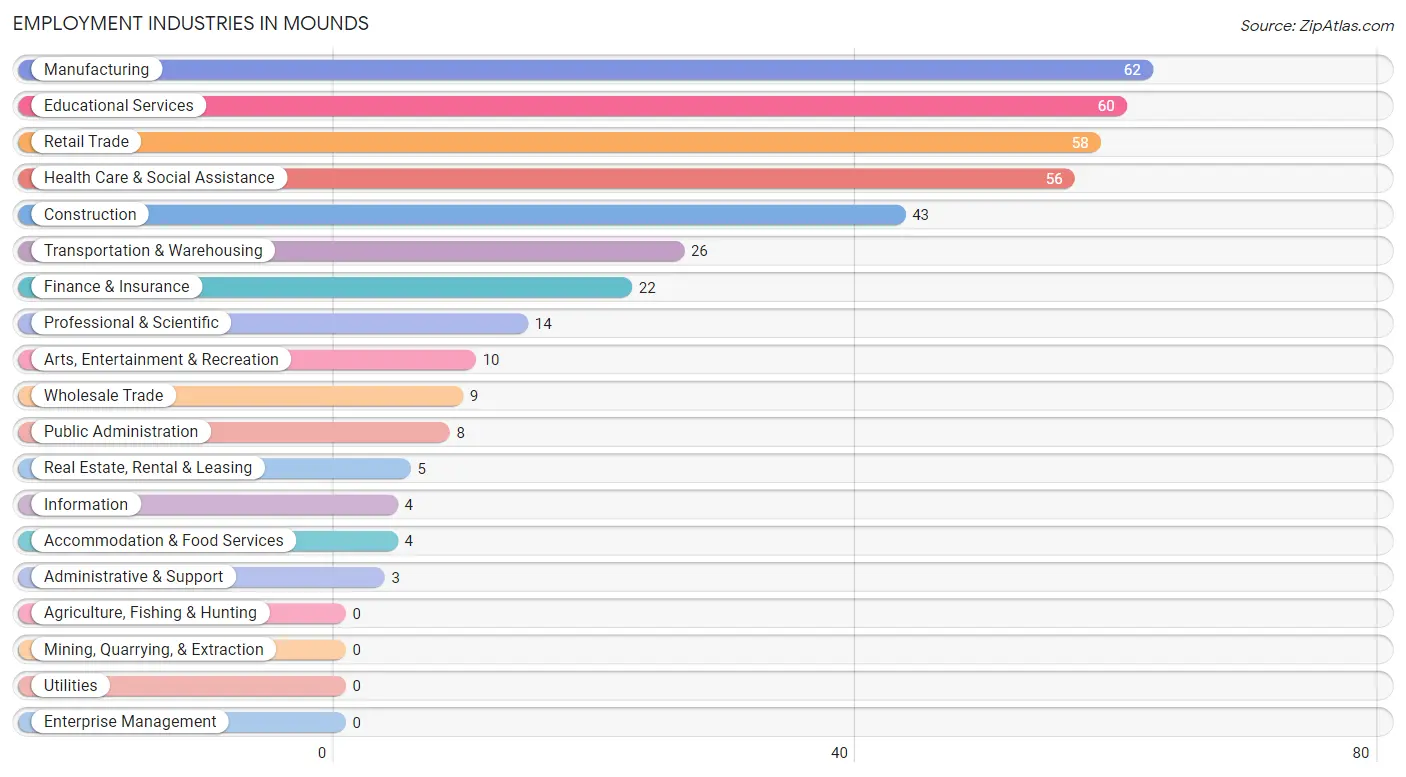
Employment Industries by Sex in Mounds
The Mounds industries that see more men than women are Wholesale Trade (100.0%), Accommodation & Food Services (100.0%), and Construction (86.1%), whereas the industries that tend to have a higher number of women are Information (100.0%), Administrative & Support (100.0%), and Arts, Entertainment & Recreation (100.0%).
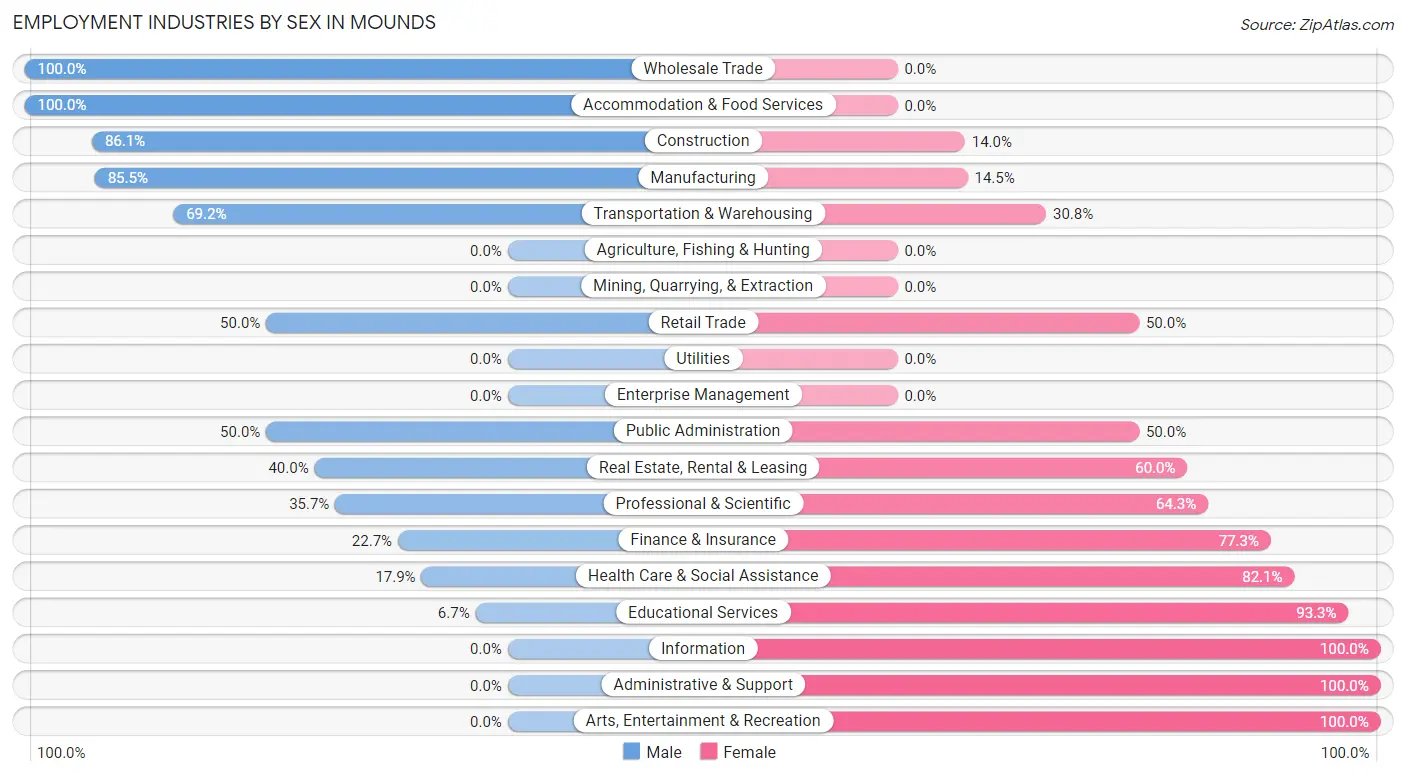
| Industry | Male | Female |
| Agriculture, Fishing & Hunting | 0 (0.0%) | 0 (0.0%) |
| Mining, Quarrying, & Extraction | 0 (0.0%) | 0 (0.0%) |
| Construction | 37 (86.1%) | 6 (14.0%) |
| Manufacturing | 53 (85.5%) | 9 (14.5%) |
| Wholesale Trade | 9 (100.0%) | 0 (0.0%) |
| Retail Trade | 29 (50.0%) | 29 (50.0%) |
| Transportation & Warehousing | 18 (69.2%) | 8 (30.8%) |
| Utilities | 0 (0.0%) | 0 (0.0%) |
| Information | 0 (0.0%) | 4 (100.0%) |
| Finance & Insurance | 5 (22.7%) | 17 (77.3%) |
| Real Estate, Rental & Leasing | 2 (40.0%) | 3 (60.0%) |
| Professional & Scientific | 5 (35.7%) | 9 (64.3%) |
| Enterprise Management | 0 (0.0%) | 0 (0.0%) |
| Administrative & Support | 0 (0.0%) | 3 (100.0%) |
| Educational Services | 4 (6.7%) | 56 (93.3%) |
| Health Care & Social Assistance | 10 (17.9%) | 46 (82.1%) |
| Arts, Entertainment & Recreation | 0 (0.0%) | 10 (100.0%) |
| Accommodation & Food Services | 4 (100.0%) | 0 (0.0%) |
| Public Administration | 4 (50.0%) | 4 (50.0%) |
| Total | 205 (48.8%) | 215 (51.2%) |
Education in Mounds
School Enrollment in Mounds
The most common levels of schooling among the 248 students in Mounds are elementary school (62 | 25.0%), middle school (57 | 23.0%), and high school (52 | 21.0%).
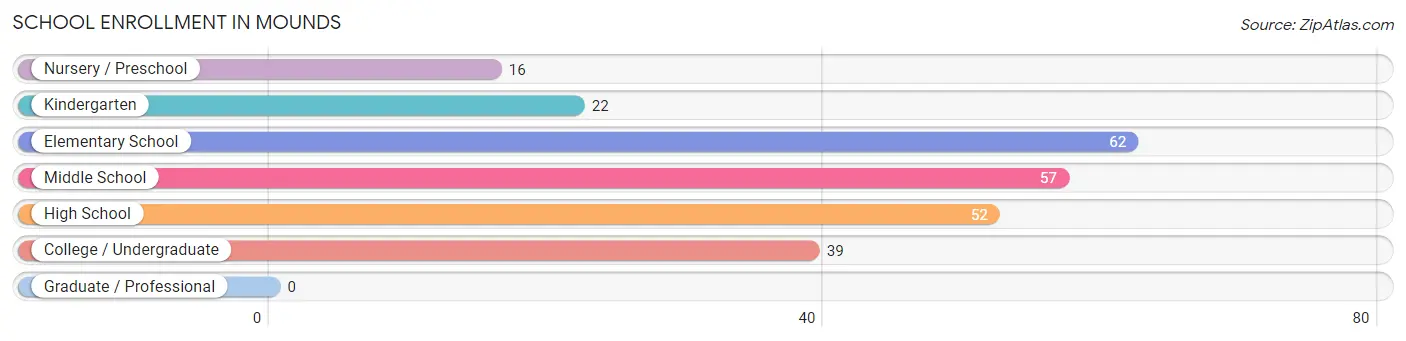
| School Level | # Students | % Students |
| Nursery / Preschool | 16 | 6.5% |
| Kindergarten | 22 | 8.9% |
| Elementary School | 62 | 25.0% |
| Middle School | 57 | 23.0% |
| High School | 52 | 21.0% |
| College / Undergraduate | 39 | 15.7% |
| Graduate / Professional | 0 | 0.0% |
| Total | 248 | 100.0% |
School Enrollment by Age by Funding Source in Mounds
Out of a total of 248 students who are enrolled in schools in Mounds, 24 (9.7%) attend a private institution, while the remaining 224 (90.3%) are enrolled in public schools. The age group of 3 to 4 year olds has the highest likelihood of being enrolled in private schools, with 8 (40.0% in the age bracket) enrolled. Conversely, the age group of 10 to 14 year olds has the lowest likelihood of being enrolled in a private school, with 75 (100.0% in the age bracket) attending a public institution.
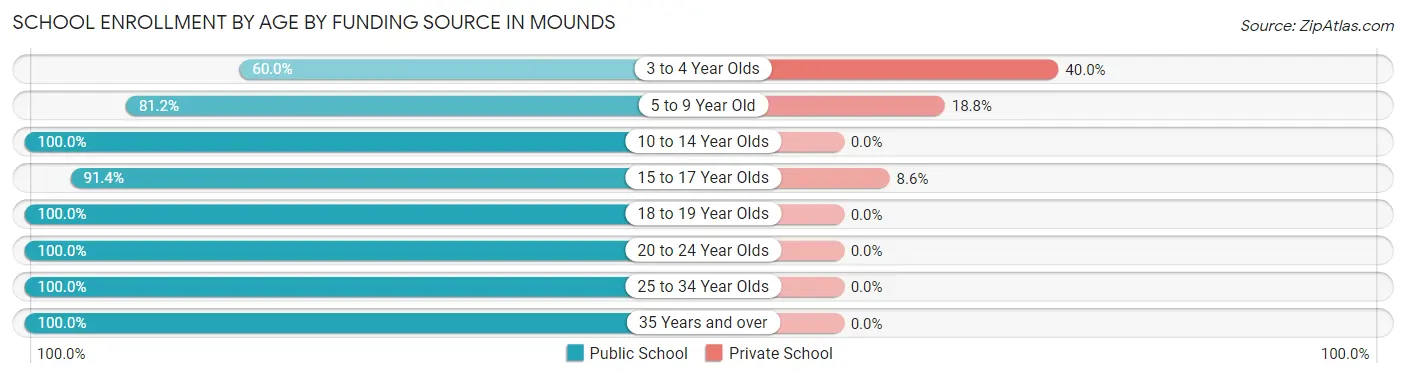
| Age Bracket | Public School | Private School |
| 3 to 4 Year Olds | 12 (60.0%) | 8 (40.0%) |
| 5 to 9 Year Old | 56 (81.2%) | 13 (18.8%) |
| 10 to 14 Year Olds | 75 (100.0%) | 0 (0.0%) |
| 15 to 17 Year Olds | 32 (91.4%) | 3 (8.6%) |
| 18 to 19 Year Olds | 15 (100.0%) | 0 (0.0%) |
| 20 to 24 Year Olds | 9 (100.0%) | 0 (0.0%) |
| 25 to 34 Year Olds | 17 (100.0%) | 0 (0.0%) |
| 35 Years and over | 8 (100.0%) | 0 (0.0%) |
| Total | 224 (90.3%) | 24 (9.7%) |
Educational Attainment by Field of Study in Mounds
Education (24 | 24.5%), arts & humanities (17 | 17.3%), business (16 | 16.3%), science & technology (13 | 13.3%), and bio, nature & agricultural (7 | 7.1%) are the most common fields of study among 98 individuals in Mounds who have obtained a bachelor's degree or higher.
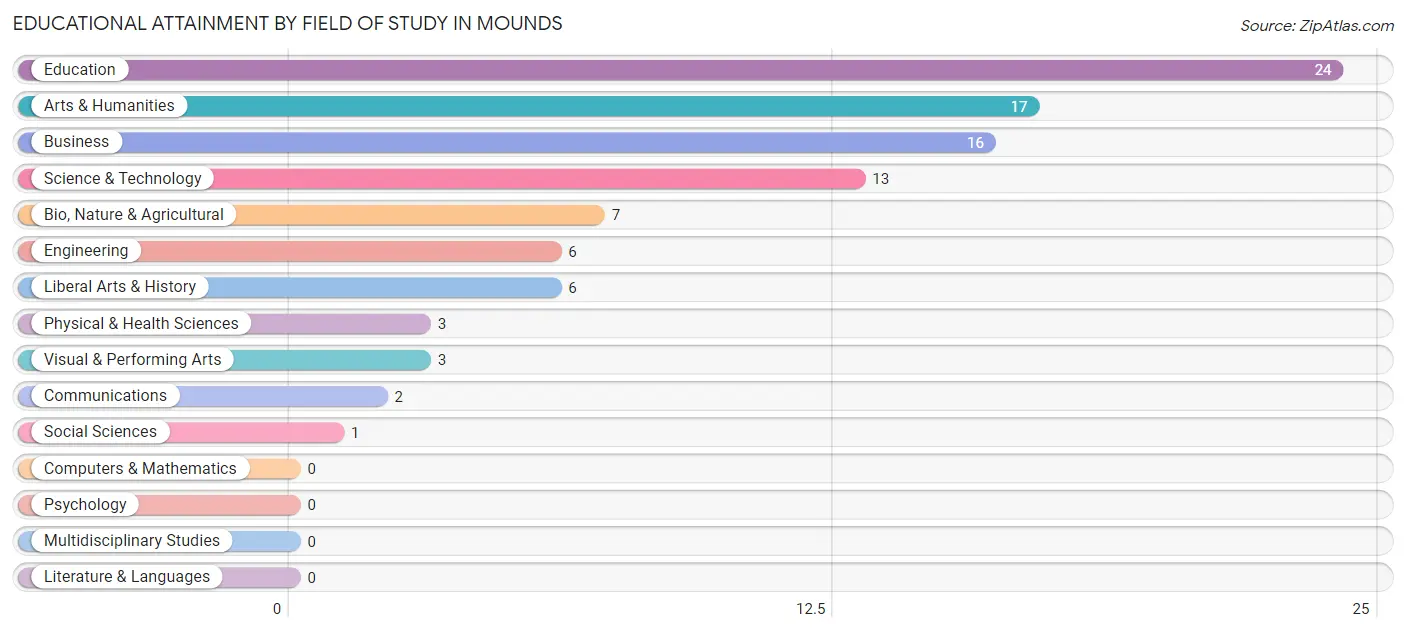
| Field of Study | # Graduates | % Graduates |
| Computers & Mathematics | 0 | 0.0% |
| Bio, Nature & Agricultural | 7 | 7.1% |
| Physical & Health Sciences | 3 | 3.1% |
| Psychology | 0 | 0.0% |
| Social Sciences | 1 | 1.0% |
| Engineering | 6 | 6.1% |
| Multidisciplinary Studies | 0 | 0.0% |
| Science & Technology | 13 | 13.3% |
| Business | 16 | 16.3% |
| Education | 24 | 24.5% |
| Literature & Languages | 0 | 0.0% |
| Liberal Arts & History | 6 | 6.1% |
| Visual & Performing Arts | 3 | 3.1% |
| Communications | 2 | 2.0% |
| Arts & Humanities | 17 | 17.3% |
| Total | 98 | 100.0% |
Transportation & Commute in Mounds
Vehicle Availability by Sex in Mounds
The most prevalent vehicle ownership categories in Mounds are males with 2 vehicles (85, accounting for 41.5%) and females with 2 vehicles (93, making up 39.2%).
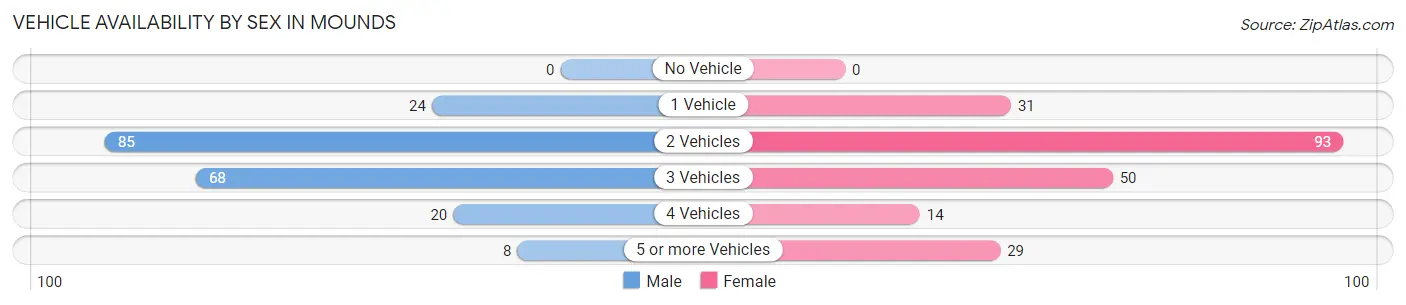
| Vehicles Available | Male | Female |
| No Vehicle | 0 (0.0%) | 0 (0.0%) |
| 1 Vehicle | 24 (11.7%) | 31 (14.3%) |
| 2 Vehicles | 85 (41.5%) | 93 (42.9%) |
| 3 Vehicles | 68 (33.2%) | 50 (23.0%) |
| 4 Vehicles | 20 (9.8%) | 14 (6.5%) |
| 5 or more Vehicles | 8 (3.9%) | 29 (13.4%) |
| Total | 205 (100.0%) | 217 (100.0%) |
Commute Time in Mounds
The most frequently occuring commute durations in Mounds are 30 to 34 minutes (99 commuters, 24.8%), 20 to 24 minutes (70 commuters, 17.5%), and 5 to 9 minutes (41 commuters, 10.3%).
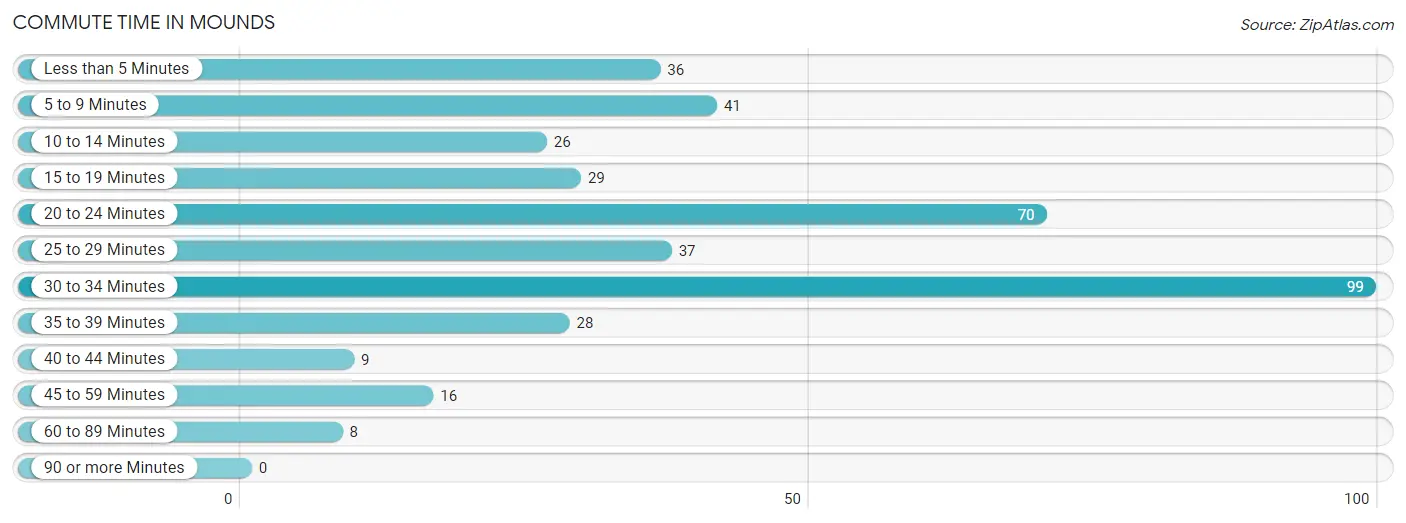
| Commute Time | # Commuters | % Commuters |
| Less than 5 Minutes | 36 | 9.0% |
| 5 to 9 Minutes | 41 | 10.3% |
| 10 to 14 Minutes | 26 | 6.5% |
| 15 to 19 Minutes | 29 | 7.3% |
| 20 to 24 Minutes | 70 | 17.5% |
| 25 to 29 Minutes | 37 | 9.3% |
| 30 to 34 Minutes | 99 | 24.8% |
| 35 to 39 Minutes | 28 | 7.0% |
| 40 to 44 Minutes | 9 | 2.3% |
| 45 to 59 Minutes | 16 | 4.0% |
| 60 to 89 Minutes | 8 | 2.0% |
| 90 or more Minutes | 0 | 0.0% |
Commute Time by Sex in Mounds
The most common commute times in Mounds are 30 to 34 minutes (71 commuters, 36.6%) for males and 20 to 24 minutes (32 commuters, 15.6%) for females.
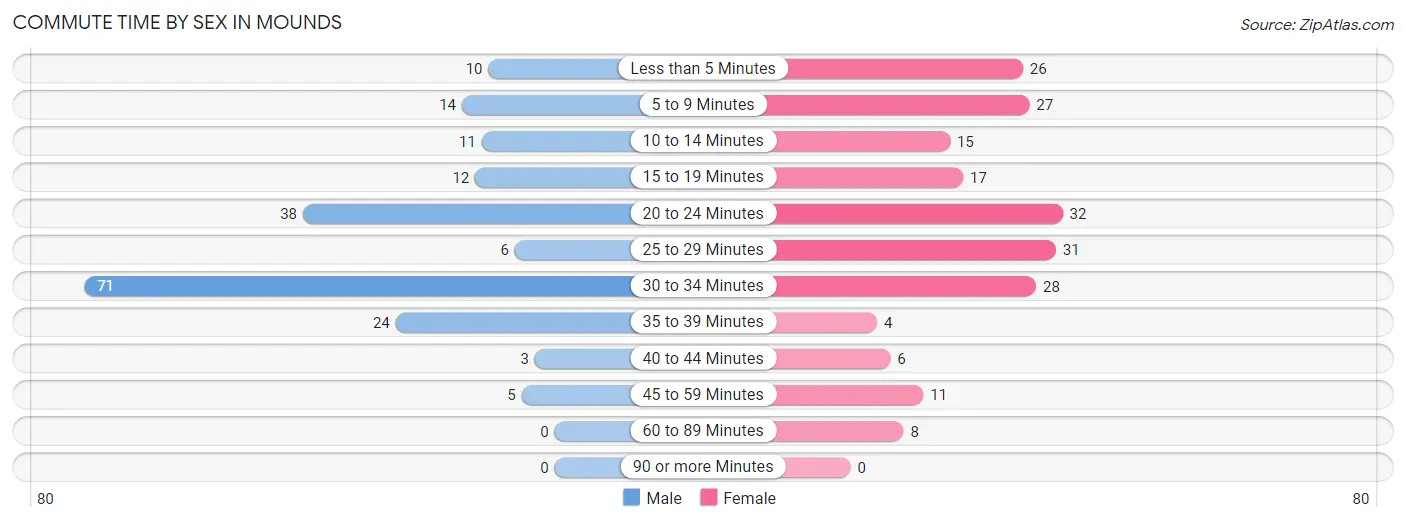
| Commute Time | Male | Female |
| Less than 5 Minutes | 10 (5.1%) | 26 (12.7%) |
| 5 to 9 Minutes | 14 (7.2%) | 27 (13.2%) |
| 10 to 14 Minutes | 11 (5.7%) | 15 (7.3%) |
| 15 to 19 Minutes | 12 (6.2%) | 17 (8.3%) |
| 20 to 24 Minutes | 38 (19.6%) | 32 (15.6%) |
| 25 to 29 Minutes | 6 (3.1%) | 31 (15.1%) |
| 30 to 34 Minutes | 71 (36.6%) | 28 (13.7%) |
| 35 to 39 Minutes | 24 (12.4%) | 4 (1.9%) |
| 40 to 44 Minutes | 3 (1.5%) | 6 (2.9%) |
| 45 to 59 Minutes | 5 (2.6%) | 11 (5.4%) |
| 60 to 89 Minutes | 0 (0.0%) | 8 (3.9%) |
| 90 or more Minutes | 0 (0.0%) | 0 (0.0%) |
Time of Departure to Work by Sex in Mounds
The most frequent times of departure to work in Mounds are 12:00 PM to 3:59 PM (32, 16.5%) for males and 7:30 AM to 7:59 AM (56, 27.3%) for females.
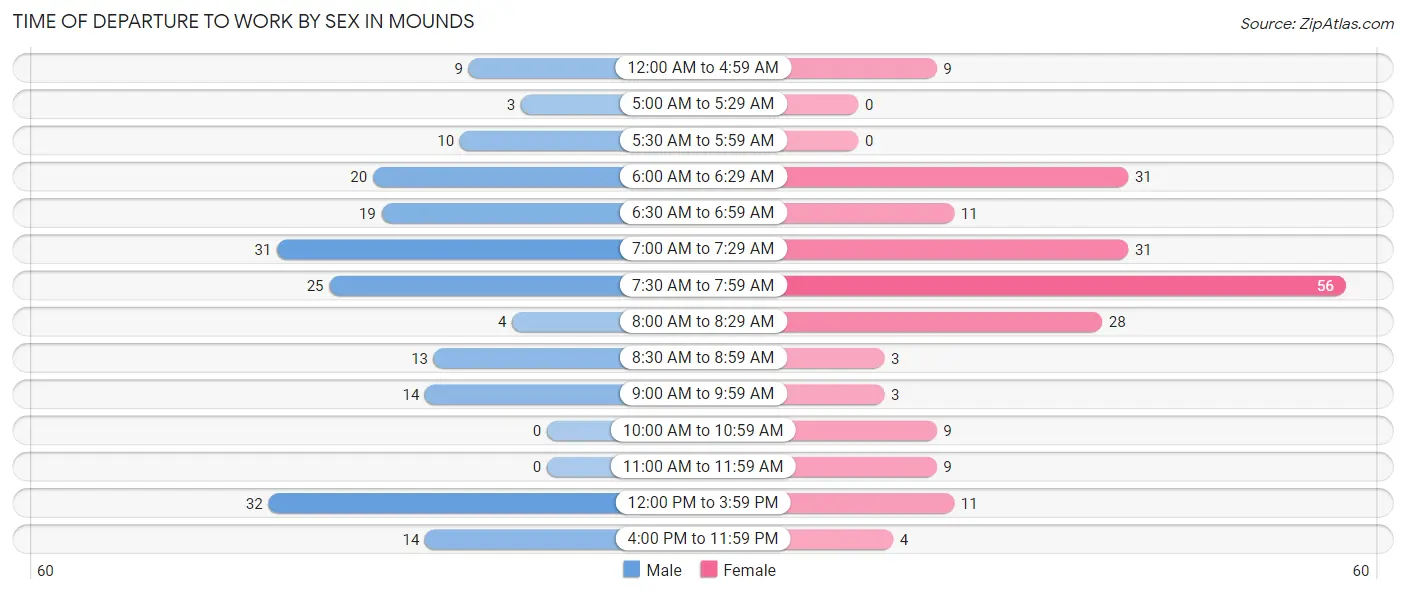
| Time of Departure | Male | Female |
| 12:00 AM to 4:59 AM | 9 (4.6%) | 9 (4.4%) |
| 5:00 AM to 5:29 AM | 3 (1.5%) | 0 (0.0%) |
| 5:30 AM to 5:59 AM | 10 (5.1%) | 0 (0.0%) |
| 6:00 AM to 6:29 AM | 20 (10.3%) | 31 (15.1%) |
| 6:30 AM to 6:59 AM | 19 (9.8%) | 11 (5.4%) |
| 7:00 AM to 7:29 AM | 31 (16.0%) | 31 (15.1%) |
| 7:30 AM to 7:59 AM | 25 (12.9%) | 56 (27.3%) |
| 8:00 AM to 8:29 AM | 4 (2.1%) | 28 (13.7%) |
| 8:30 AM to 8:59 AM | 13 (6.7%) | 3 (1.5%) |
| 9:00 AM to 9:59 AM | 14 (7.2%) | 3 (1.5%) |
| 10:00 AM to 10:59 AM | 0 (0.0%) | 9 (4.4%) |
| 11:00 AM to 11:59 AM | 0 (0.0%) | 9 (4.4%) |
| 12:00 PM to 3:59 PM | 32 (16.5%) | 11 (5.4%) |
| 4:00 PM to 11:59 PM | 14 (7.2%) | 4 (1.9%) |
| Total | 194 (100.0%) | 205 (100.0%) |
Housing Occupancy in Mounds
Occupancy by Ownership in Mounds
Of the total 405 dwellings in Mounds, owner-occupied units account for 228 (56.3%), while renter-occupied units make up 177 (43.7%).
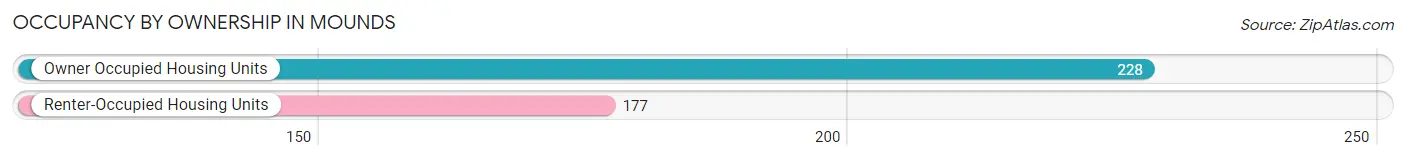
| Occupancy | # Housing Units | % Housing Units |
| Owner Occupied Housing Units | 228 | 56.3% |
| Renter-Occupied Housing Units | 177 | 43.7% |
| Total Occupied Housing Units | 405 | 100.0% |
Occupancy by Household Size in Mounds
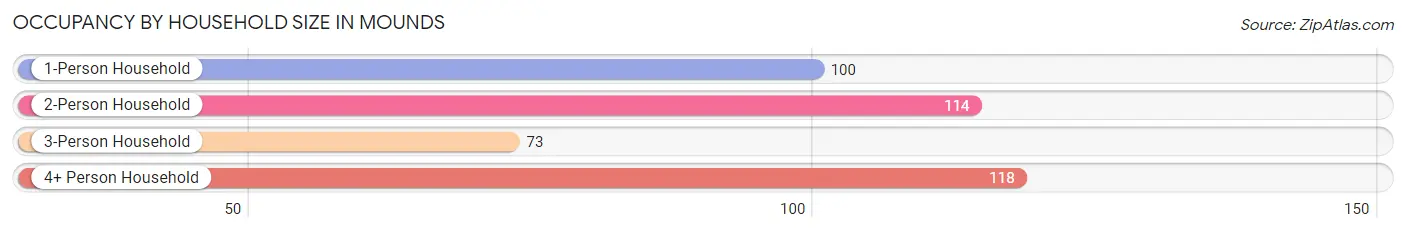
| Household Size | # Housing Units | % Housing Units |
| 1-Person Household | 100 | 24.7% |
| 2-Person Household | 114 | 28.1% |
| 3-Person Household | 73 | 18.0% |
| 4+ Person Household | 118 | 29.1% |
| Total Housing Units | 405 | 100.0% |
Occupancy by Ownership by Household Size in Mounds
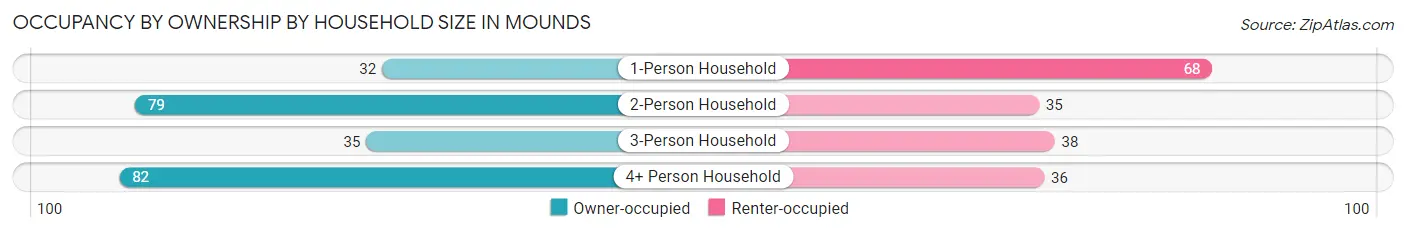
| Household Size | Owner-occupied | Renter-occupied |
| 1-Person Household | 32 (32.0%) | 68 (68.0%) |
| 2-Person Household | 79 (69.3%) | 35 (30.7%) |
| 3-Person Household | 35 (47.9%) | 38 (52.0%) |
| 4+ Person Household | 82 (69.5%) | 36 (30.5%) |
| Total Housing Units | 228 (56.3%) | 177 (43.7%) |
Occupancy by Educational Attainment in Mounds
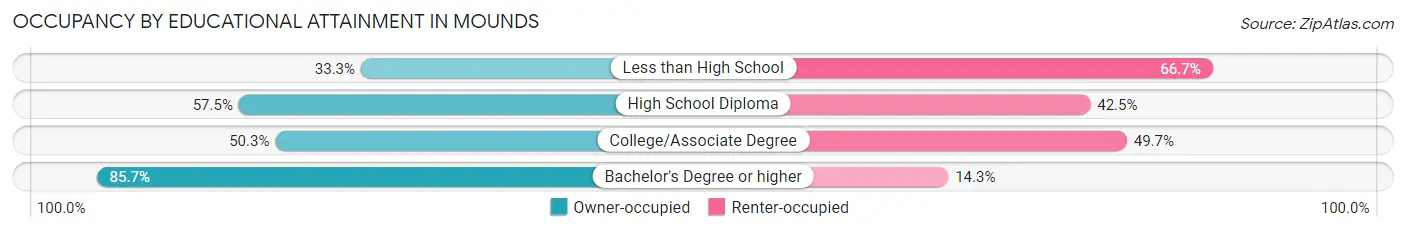
| Household Size | Owner-occupied | Renter-occupied |
| Less than High School | 7 (33.3%) | 14 (66.7%) |
| High School Diploma | 103 (57.5%) | 76 (42.5%) |
| College/Associate Degree | 82 (50.3%) | 81 (49.7%) |
| Bachelor's Degree or higher | 36 (85.7%) | 6 (14.3%) |
Occupancy by Age of Householder in Mounds
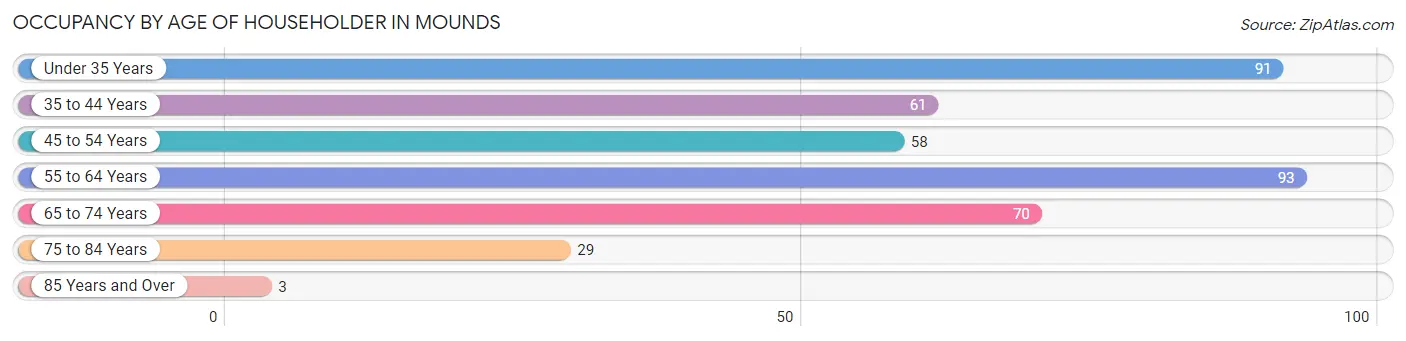
| Age Bracket | # Households | % Households |
| Under 35 Years | 91 | 22.5% |
| 35 to 44 Years | 61 | 15.1% |
| 45 to 54 Years | 58 | 14.3% |
| 55 to 64 Years | 93 | 23.0% |
| 65 to 74 Years | 70 | 17.3% |
| 75 to 84 Years | 29 | 7.2% |
| 85 Years and Over | 3 | 0.7% |
| Total | 405 | 100.0% |
Housing Finances in Mounds
Median Income by Occupancy in Mounds
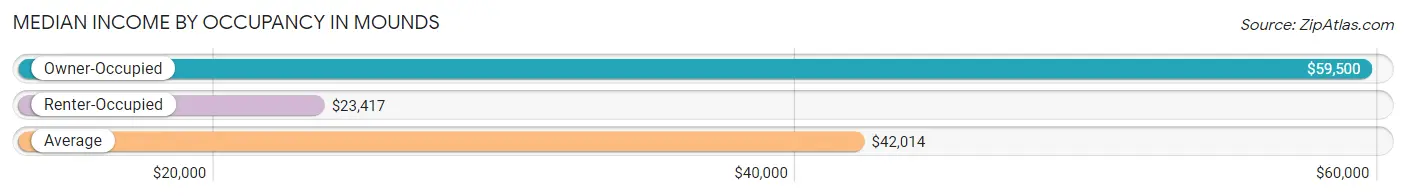
| Occupancy Type | # Households | Median Income |
| Owner-Occupied | 228 (56.3%) | $59,500 |
| Renter-Occupied | 177 (43.7%) | $23,417 |
| Average | 405 (100.0%) | $42,014 |
Occupancy by Householder Income Bracket in Mounds
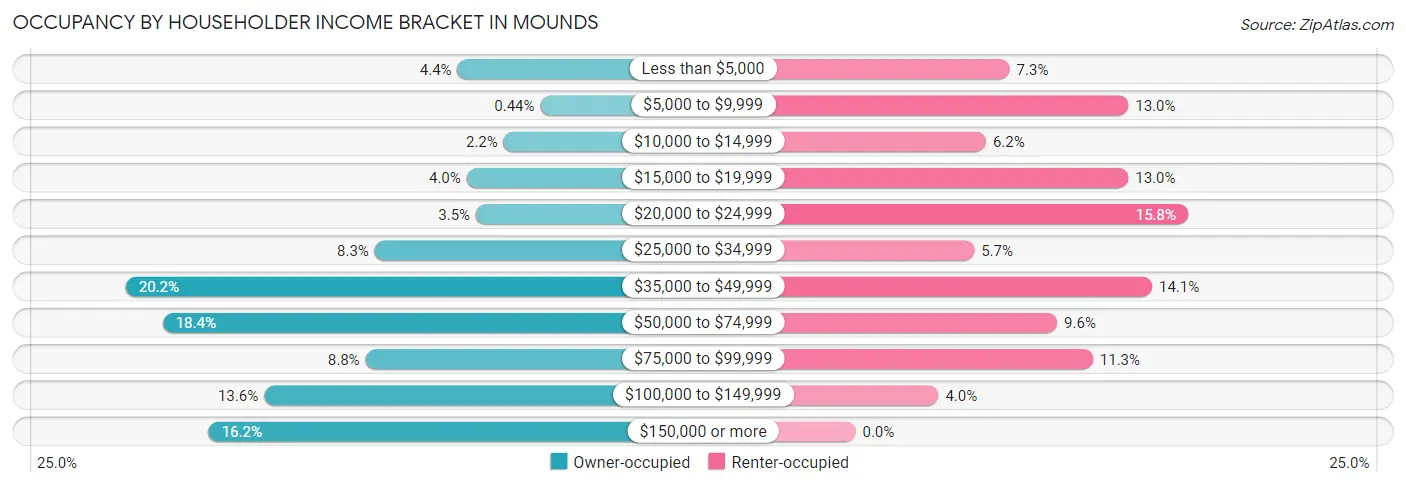
| Income Bracket | Owner-occupied | Renter-occupied |
| Less than $5,000 | 10 (4.4%) | 13 (7.3%) |
| $5,000 to $9,999 | 1 (0.4%) | 23 (13.0%) |
| $10,000 to $14,999 | 5 (2.2%) | 11 (6.2%) |
| $15,000 to $19,999 | 9 (4.0%) | 23 (13.0%) |
| $20,000 to $24,999 | 8 (3.5%) | 28 (15.8%) |
| $25,000 to $34,999 | 19 (8.3%) | 10 (5.7%) |
| $35,000 to $49,999 | 46 (20.2%) | 25 (14.1%) |
| $50,000 to $74,999 | 42 (18.4%) | 17 (9.6%) |
| $75,000 to $99,999 | 20 (8.8%) | 20 (11.3%) |
| $100,000 to $149,999 | 31 (13.6%) | 7 (4.0%) |
| $150,000 or more | 37 (16.2%) | 0 (0.0%) |
| Total | 228 (100.0%) | 177 (100.0%) |
Monthly Housing Cost Tiers in Mounds
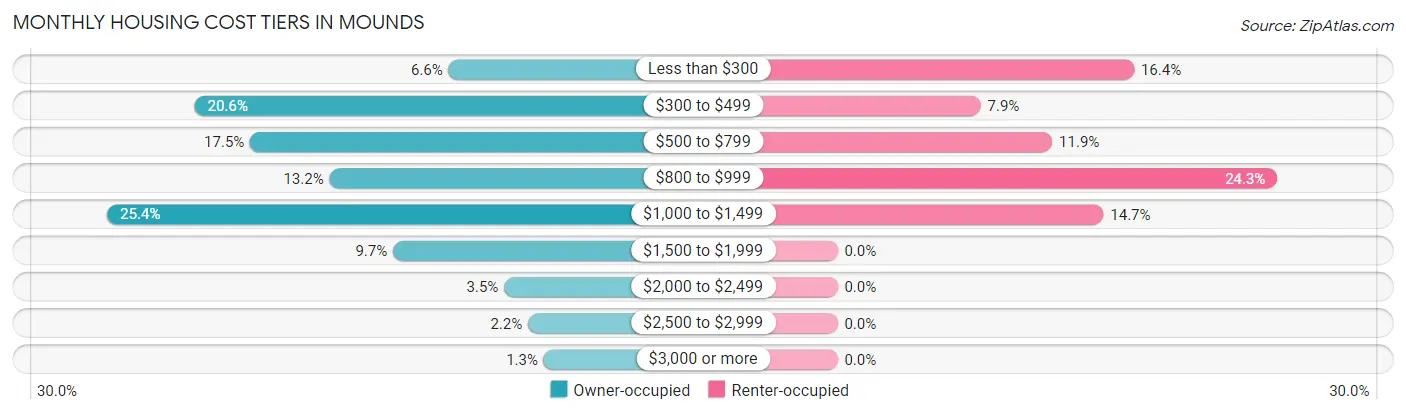
| Monthly Cost | Owner-occupied | Renter-occupied |
| Less than $300 | 15 (6.6%) | 29 (16.4%) |
| $300 to $499 | 47 (20.6%) | 14 (7.9%) |
| $500 to $799 | 40 (17.5%) | 21 (11.9%) |
| $800 to $999 | 30 (13.2%) | 43 (24.3%) |
| $1,000 to $1,499 | 58 (25.4%) | 26 (14.7%) |
| $1,500 to $1,999 | 22 (9.7%) | 0 (0.0%) |
| $2,000 to $2,499 | 8 (3.5%) | 0 (0.0%) |
| $2,500 to $2,999 | 5 (2.2%) | 0 (0.0%) |
| $3,000 or more | 3 (1.3%) | 0 (0.0%) |
| Total | 228 (100.0%) | 177 (100.0%) |
Physical Housing Characteristics in Mounds
Housing Structures in Mounds
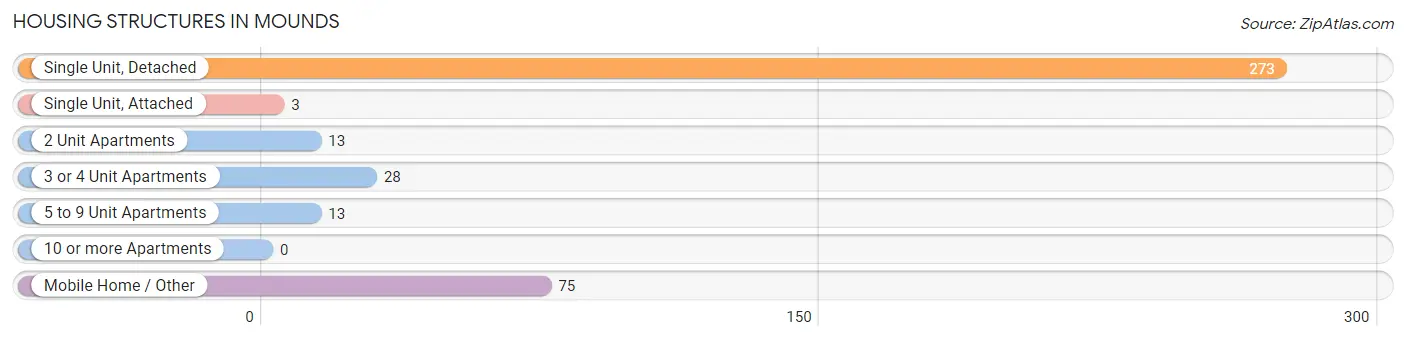
| Structure Type | # Housing Units | % Housing Units |
| Single Unit, Detached | 273 | 67.4% |
| Single Unit, Attached | 3 | 0.7% |
| 2 Unit Apartments | 13 | 3.2% |
| 3 or 4 Unit Apartments | 28 | 6.9% |
| 5 to 9 Unit Apartments | 13 | 3.2% |
| 10 or more Apartments | 0 | 0.0% |
| Mobile Home / Other | 75 | 18.5% |
| Total | 405 | 100.0% |
Housing Structures by Occupancy in Mounds
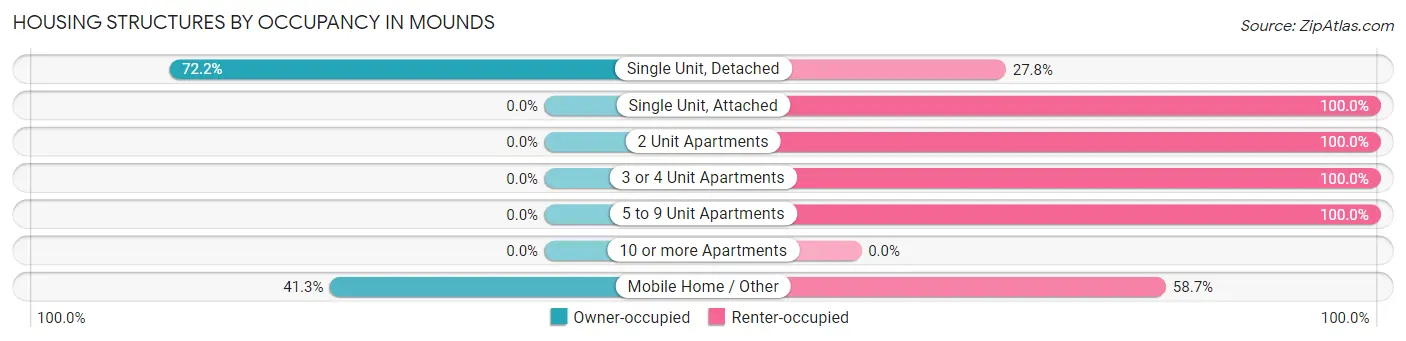
| Structure Type | Owner-occupied | Renter-occupied |
| Single Unit, Detached | 197 (72.2%) | 76 (27.8%) |
| Single Unit, Attached | 0 (0.0%) | 3 (100.0%) |
| 2 Unit Apartments | 0 (0.0%) | 13 (100.0%) |
| 3 or 4 Unit Apartments | 0 (0.0%) | 28 (100.0%) |
| 5 to 9 Unit Apartments | 0 (0.0%) | 13 (100.0%) |
| 10 or more Apartments | 0 (0.0%) | 0 (0.0%) |
| Mobile Home / Other | 31 (41.3%) | 44 (58.7%) |
| Total | 228 (56.3%) | 177 (43.7%) |
Housing Structures by Number of Rooms in Mounds
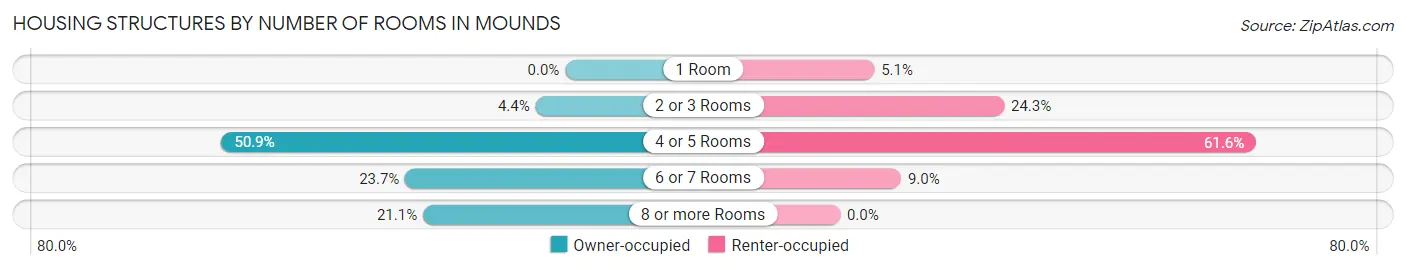
| Number of Rooms | Owner-occupied | Renter-occupied |
| 1 Room | 0 (0.0%) | 9 (5.1%) |
| 2 or 3 Rooms | 10 (4.4%) | 43 (24.3%) |
| 4 or 5 Rooms | 116 (50.9%) | 109 (61.6%) |
| 6 or 7 Rooms | 54 (23.7%) | 16 (9.0%) |
| 8 or more Rooms | 48 (21.0%) | 0 (0.0%) |
| Total | 228 (100.0%) | 177 (100.0%) |
Housing Structure by Heating Type in Mounds
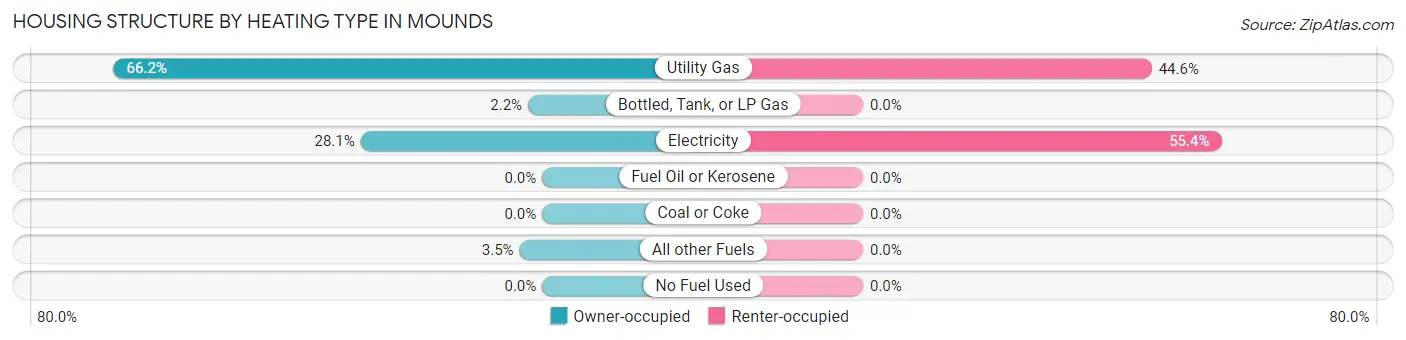
| Heating Type | Owner-occupied | Renter-occupied |
| Utility Gas | 151 (66.2%) | 79 (44.6%) |
| Bottled, Tank, or LP Gas | 5 (2.2%) | 0 (0.0%) |
| Electricity | 64 (28.1%) | 98 (55.4%) |
| Fuel Oil or Kerosene | 0 (0.0%) | 0 (0.0%) |
| Coal or Coke | 0 (0.0%) | 0 (0.0%) |
| All other Fuels | 8 (3.5%) | 0 (0.0%) |
| No Fuel Used | 0 (0.0%) | 0 (0.0%) |
| Total | 228 (100.0%) | 177 (100.0%) |
Household Vehicle Usage in Mounds
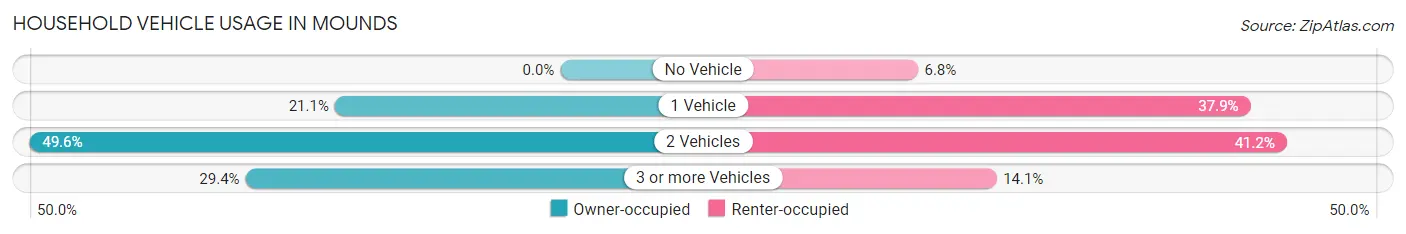
| Vehicles per Household | Owner-occupied | Renter-occupied |
| No Vehicle | 0 (0.0%) | 12 (6.8%) |
| 1 Vehicle | 48 (21.0%) | 67 (37.9%) |
| 2 Vehicles | 113 (49.6%) | 73 (41.2%) |
| 3 or more Vehicles | 67 (29.4%) | 25 (14.1%) |
| Total | 228 (100.0%) | 177 (100.0%) |
Real Estate & Mortgages in Mounds
Real Estate and Mortgage Overview in Mounds
| Characteristic | Without Mortgage | With Mortgage |
| Housing Units | 101 | 127 |
| Median Property Value | $140,600 | $172,800 |
| Median Household Income | $49,750 | $23 |
| Monthly Housing Costs | $428 | $3 |
| Real Estate Taxes | $806 | $12 |
Property Value by Mortgage Status in Mounds
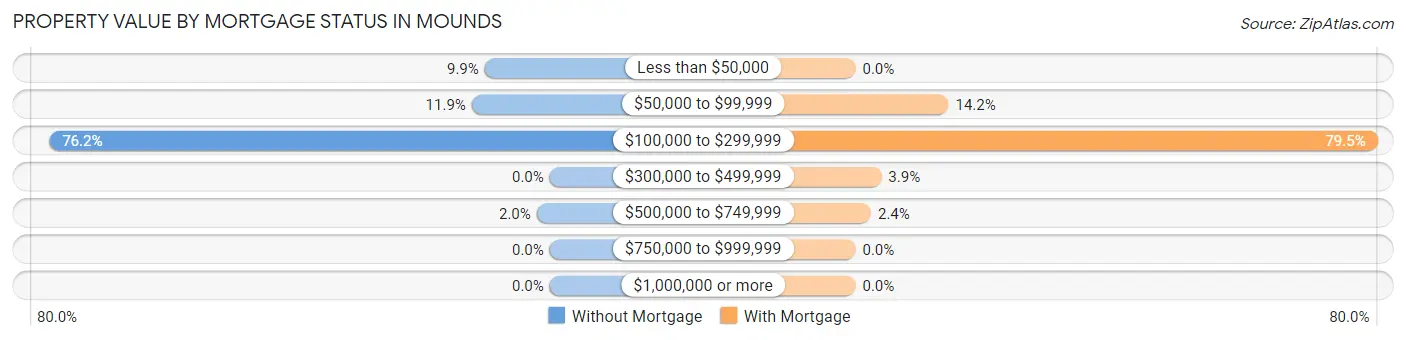
| Property Value | Without Mortgage | With Mortgage |
| Less than $50,000 | 10 (9.9%) | 0 (0.0%) |
| $50,000 to $99,999 | 12 (11.9%) | 18 (14.2%) |
| $100,000 to $299,999 | 77 (76.2%) | 101 (79.5%) |
| $300,000 to $499,999 | 0 (0.0%) | 5 (3.9%) |
| $500,000 to $749,999 | 2 (2.0%) | 3 (2.4%) |
| $750,000 to $999,999 | 0 (0.0%) | 0 (0.0%) |
| $1,000,000 or more | 0 (0.0%) | 0 (0.0%) |
| Total | 101 (100.0%) | 127 (100.0%) |
Household Income by Mortgage Status in Mounds
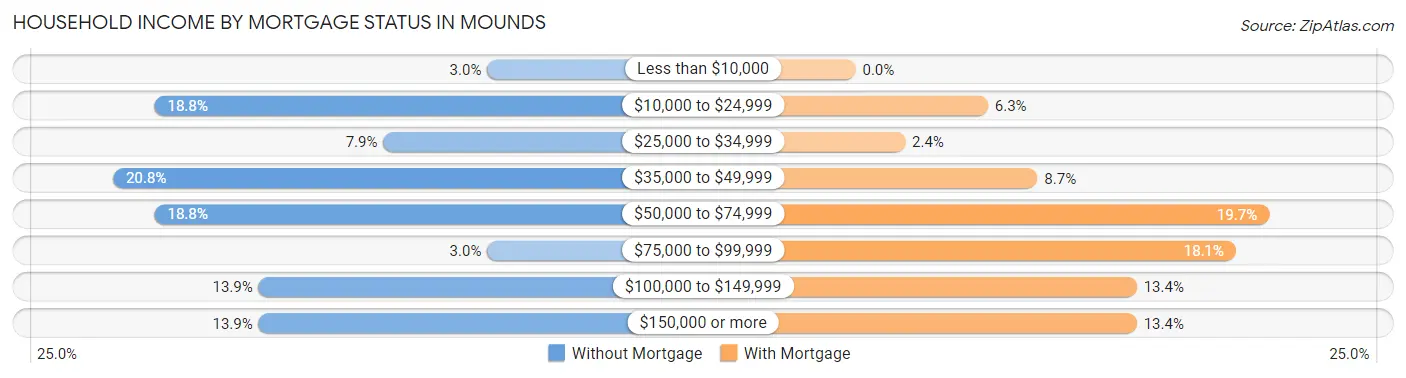
| Household Income | Without Mortgage | With Mortgage |
| Less than $10,000 | 3 (3.0%) | 0 (0.0%) |
| $10,000 to $24,999 | 19 (18.8%) | 8 (6.3%) |
| $25,000 to $34,999 | 8 (7.9%) | 3 (2.4%) |
| $35,000 to $49,999 | 21 (20.8%) | 11 (8.7%) |
| $50,000 to $74,999 | 19 (18.8%) | 25 (19.7%) |
| $75,000 to $99,999 | 3 (3.0%) | 23 (18.1%) |
| $100,000 to $149,999 | 14 (13.9%) | 17 (13.4%) |
| $150,000 or more | 14 (13.9%) | 17 (13.4%) |
| Total | 101 (100.0%) | 127 (100.0%) |
Property Value to Household Income Ratio in Mounds
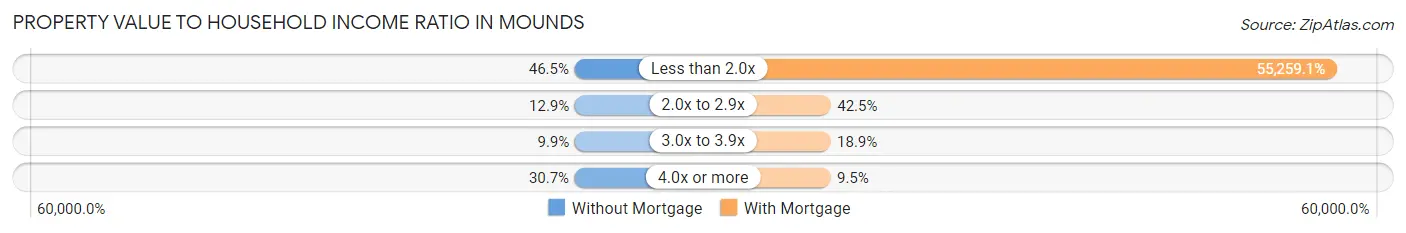
| Value-to-Income Ratio | Without Mortgage | With Mortgage |
| Less than 2.0x | 47 (46.5%) | 70,179 (55,259.1%) |
| 2.0x to 2.9x | 13 (12.9%) | 54 (42.5%) |
| 3.0x to 3.9x | 10 (9.9%) | 24 (18.9%) |
| 4.0x or more | 31 (30.7%) | 12 (9.5%) |
| Total | 101 (100.0%) | 127 (100.0%) |
Real Estate Taxes by Mortgage Status in Mounds
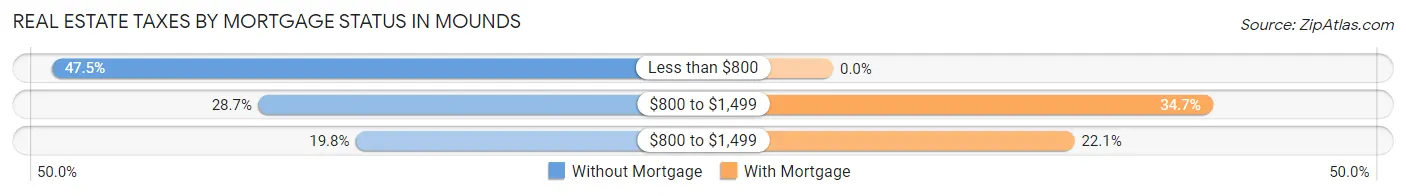
| Property Taxes | Without Mortgage | With Mortgage |
| Less than $800 | 48 (47.5%) | 0 (0.0%) |
| $800 to $1,499 | 29 (28.7%) | 44 (34.6%) |
| $800 to $1,499 | 20 (19.8%) | 28 (22.1%) |
| Total | 101 (100.0%) | 127 (100.0%) |
Health & Disability in Mounds
Health Insurance Coverage by Age in Mounds
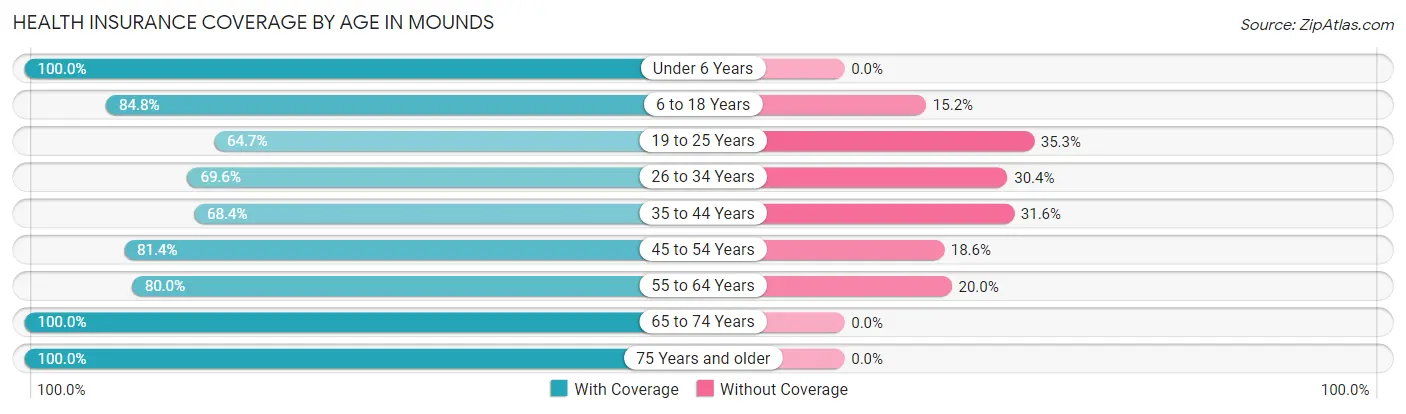
| Age Bracket | With Coverage | Without Coverage |
| Under 6 Years | 110 (100.0%) | 0 (0.0%) |
| 6 to 18 Years | 156 (84.8%) | 28 (15.2%) |
| 19 to 25 Years | 86 (64.7%) | 47 (35.3%) |
| 26 to 34 Years | 87 (69.6%) | 38 (30.4%) |
| 35 to 44 Years | 93 (68.4%) | 43 (31.6%) |
| 45 to 54 Years | 79 (81.4%) | 18 (18.6%) |
| 55 to 64 Years | 120 (80.0%) | 30 (20.0%) |
| 65 to 74 Years | 105 (100.0%) | 0 (0.0%) |
| 75 Years and older | 55 (100.0%) | 0 (0.0%) |
| Total | 891 (81.4%) | 204 (18.6%) |
Health Insurance Coverage by Citizenship Status in Mounds
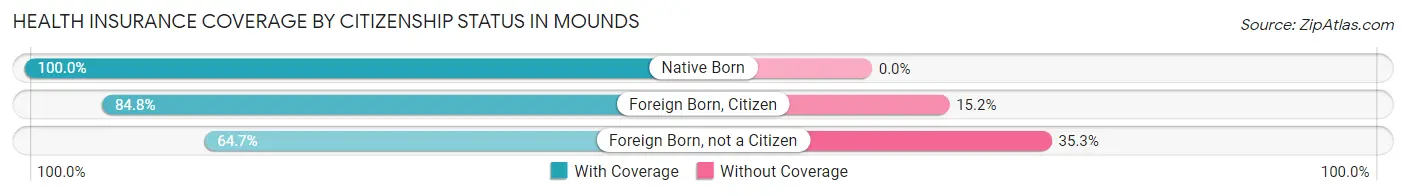
| Citizenship Status | With Coverage | Without Coverage |
| Native Born | 110 (100.0%) | 0 (0.0%) |
| Foreign Born, Citizen | 156 (84.8%) | 28 (15.2%) |
| Foreign Born, not a Citizen | 86 (64.7%) | 47 (35.3%) |
Health Insurance Coverage by Household Income in Mounds
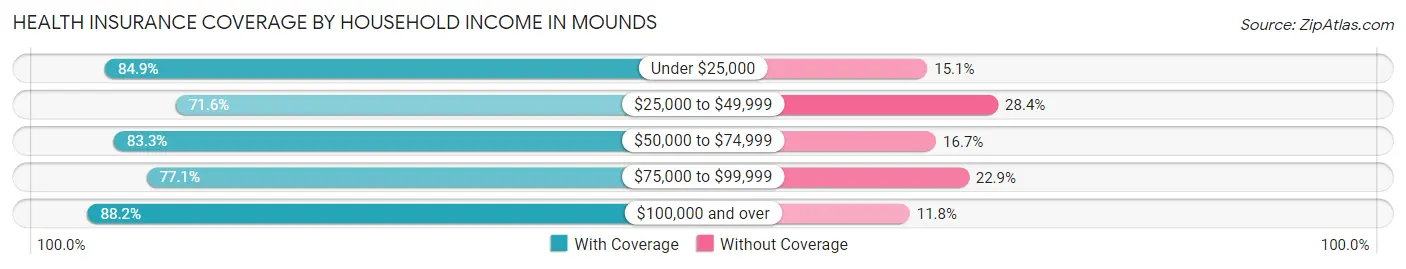
| Household Income | With Coverage | Without Coverage |
| Under $25,000 | 180 (84.9%) | 32 (15.1%) |
| $25,000 to $49,999 | 197 (71.6%) | 78 (28.4%) |
| $50,000 to $74,999 | 179 (83.3%) | 36 (16.7%) |
| $75,000 to $99,999 | 81 (77.1%) | 24 (22.9%) |
| $100,000 and over | 254 (88.2%) | 34 (11.8%) |
Public vs Private Health Insurance Coverage by Age in Mounds
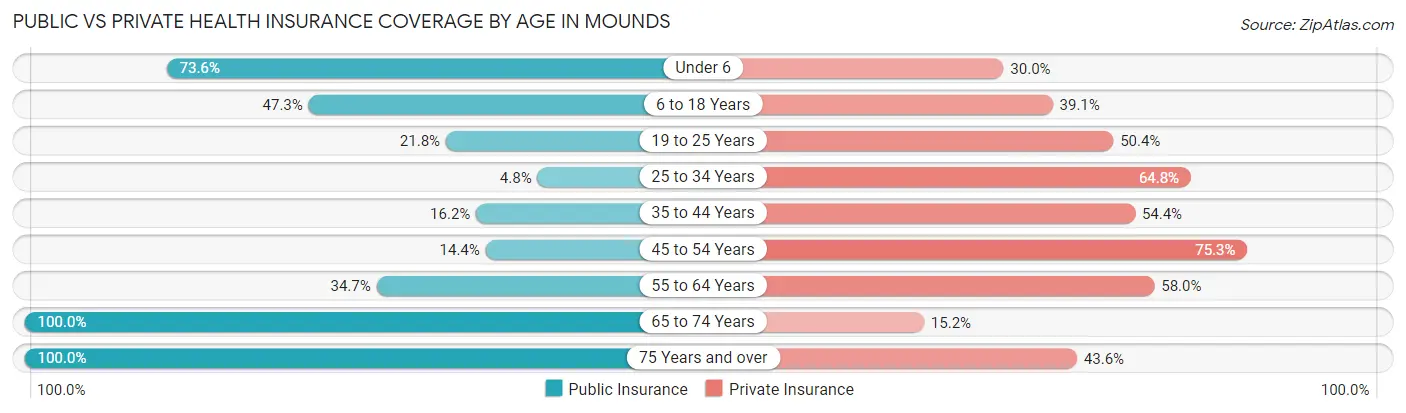
| Age Bracket | Public Insurance | Private Insurance |
| Under 6 | 81 (73.6%) | 33 (30.0%) |
| 6 to 18 Years | 87 (47.3%) | 72 (39.1%) |
| 19 to 25 Years | 29 (21.8%) | 67 (50.4%) |
| 25 to 34 Years | 6 (4.8%) | 81 (64.8%) |
| 35 to 44 Years | 22 (16.2%) | 74 (54.4%) |
| 45 to 54 Years | 14 (14.4%) | 73 (75.3%) |
| 55 to 64 Years | 52 (34.7%) | 87 (58.0%) |
| 65 to 74 Years | 105 (100.0%) | 16 (15.2%) |
| 75 Years and over | 55 (100.0%) | 24 (43.6%) |
| Total | 451 (41.2%) | 527 (48.1%) |
Disability Status by Sex by Age in Mounds
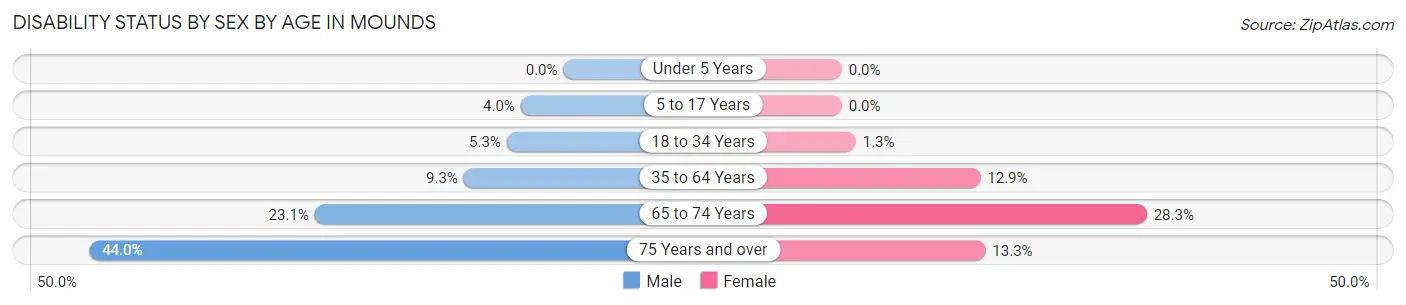
| Age Bracket | Male | Female |
| Under 5 Years | 0 (0.0%) | 0 (0.0%) |
| 5 to 17 Years | 4 (4.0%) | 0 (0.0%) |
| 18 to 34 Years | 6 (5.3%) | 2 (1.3%) |
| 35 to 64 Years | 16 (9.2%) | 27 (12.9%) |
| 65 to 74 Years | 12 (23.1%) | 15 (28.3%) |
| 75 Years and over | 11 (44.0%) | 4 (13.3%) |
Disability Class by Sex by Age in Mounds
Disability Class: Hearing Difficulty
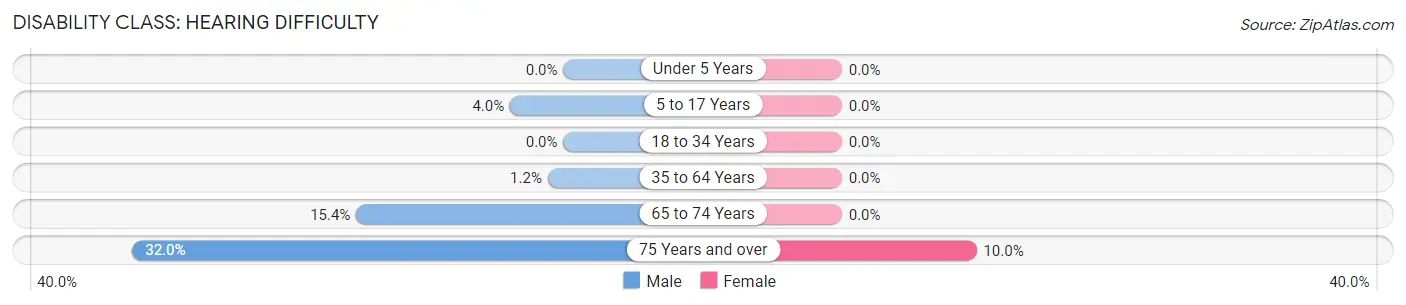
| Age Bracket | Male | Female |
| Under 5 Years | 0 (0.0%) | 0 (0.0%) |
| 5 to 17 Years | 4 (4.0%) | 0 (0.0%) |
| 18 to 34 Years | 0 (0.0%) | 0 (0.0%) |
| 35 to 64 Years | 2 (1.2%) | 0 (0.0%) |
| 65 to 74 Years | 8 (15.4%) | 0 (0.0%) |
| 75 Years and over | 8 (32.0%) | 3 (10.0%) |
Disability Class: Vision Difficulty
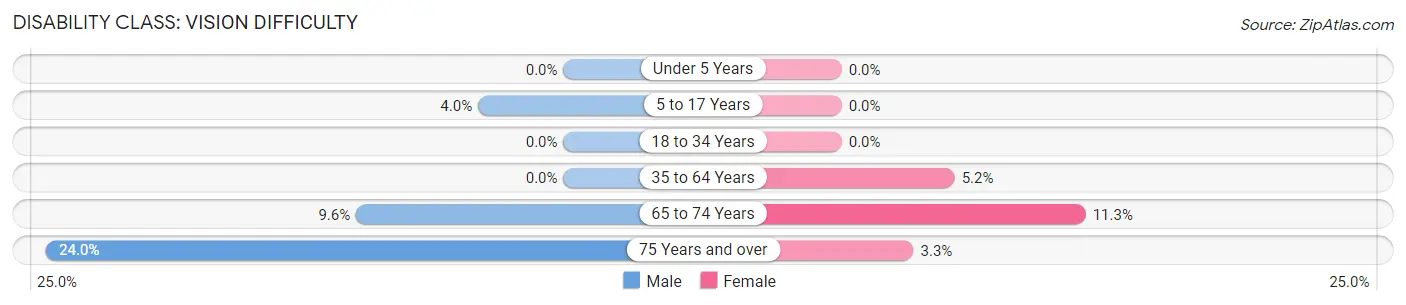
| Age Bracket | Male | Female |
| Under 5 Years | 0 (0.0%) | 0 (0.0%) |
| 5 to 17 Years | 4 (4.0%) | 0 (0.0%) |
| 18 to 34 Years | 0 (0.0%) | 0 (0.0%) |
| 35 to 64 Years | 0 (0.0%) | 11 (5.2%) |
| 65 to 74 Years | 5 (9.6%) | 6 (11.3%) |
| 75 Years and over | 6 (24.0%) | 1 (3.3%) |
Disability Class: Cognitive Difficulty
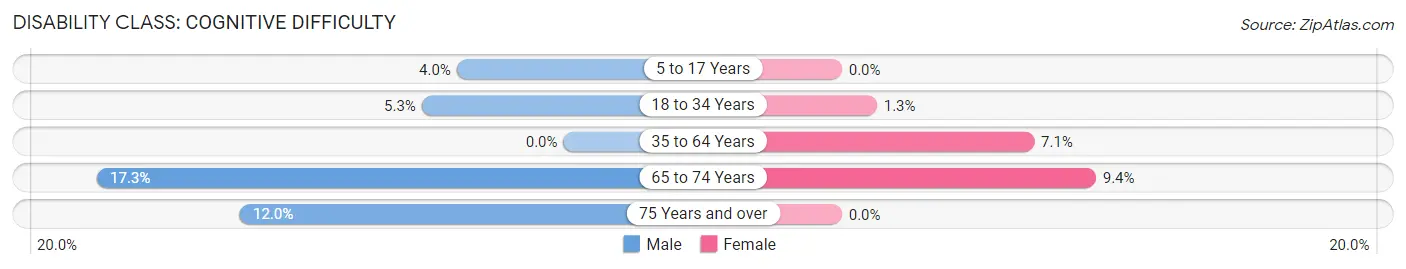
| Age Bracket | Male | Female |
| 5 to 17 Years | 4 (4.0%) | 0 (0.0%) |
| 18 to 34 Years | 6 (5.3%) | 2 (1.3%) |
| 35 to 64 Years | 0 (0.0%) | 15 (7.1%) |
| 65 to 74 Years | 9 (17.3%) | 5 (9.4%) |
| 75 Years and over | 3 (12.0%) | 0 (0.0%) |
Disability Class: Ambulatory Difficulty
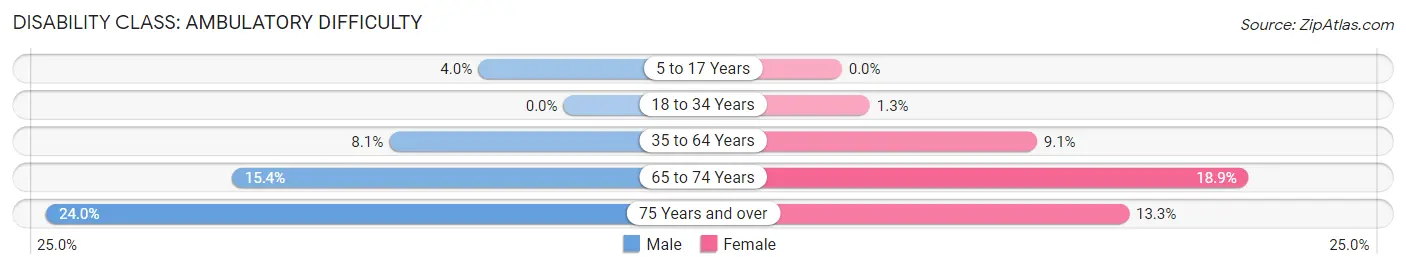
| Age Bracket | Male | Female |
| 5 to 17 Years | 4 (4.0%) | 0 (0.0%) |
| 18 to 34 Years | 0 (0.0%) | 2 (1.3%) |
| 35 to 64 Years | 14 (8.1%) | 19 (9.0%) |
| 65 to 74 Years | 8 (15.4%) | 10 (18.9%) |
| 75 Years and over | 6 (24.0%) | 4 (13.3%) |
Disability Class: Self-Care Difficulty
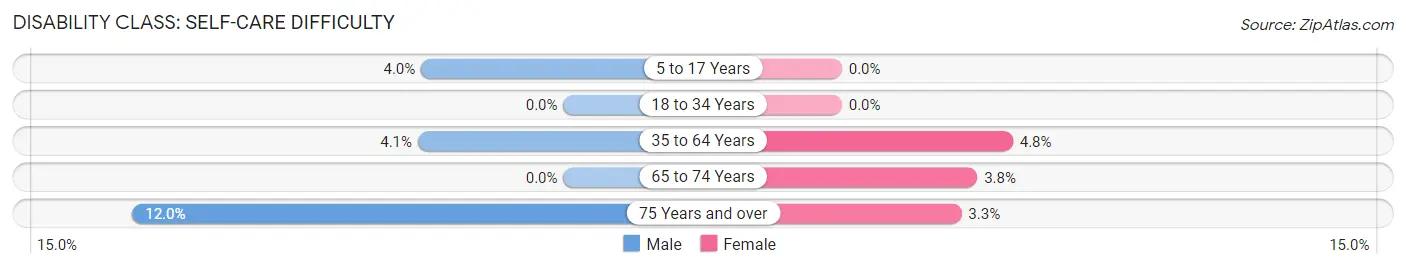
| Age Bracket | Male | Female |
| 5 to 17 Years | 4 (4.0%) | 0 (0.0%) |
| 18 to 34 Years | 0 (0.0%) | 0 (0.0%) |
| 35 to 64 Years | 7 (4.1%) | 10 (4.8%) |
| 65 to 74 Years | 0 (0.0%) | 2 (3.8%) |
| 75 Years and over | 3 (12.0%) | 1 (3.3%) |
Technology Access in Mounds
Computing Device Access in Mounds
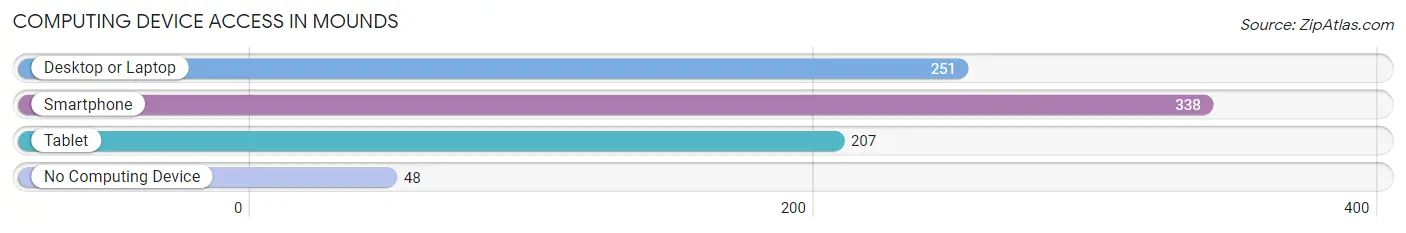
| Device Type | # Households | % Households |
| Desktop or Laptop | 251 | 62.0% |
| Smartphone | 338 | 83.5% |
| Tablet | 207 | 51.1% |
| No Computing Device | 48 | 11.8% |
| Total | 405 | 100.0% |
Internet Access in Mounds
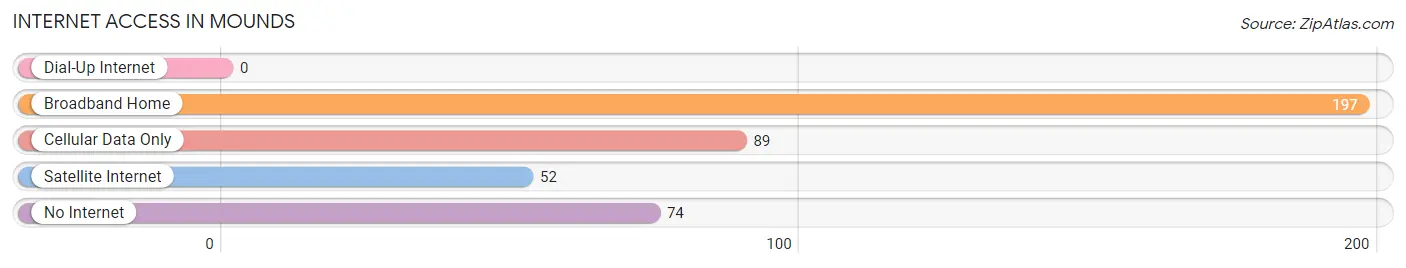
| Internet Type | # Households | % Households |
| Dial-Up Internet | 0 | 0.0% |
| Broadband Home | 197 | 48.6% |
| Cellular Data Only | 89 | 22.0% |
| Satellite Internet | 52 | 12.8% |
| No Internet | 74 | 18.3% |
| Total | 405 | 100.0% |
Mounds Summary
Mounds, Oklahoma is a small town located in Creek County, Oklahoma. It is situated on the banks of the Arkansas River, about 20 miles southeast of Tulsa. The town was founded in 1891 and was named after the nearby mounds, which were created by Native Americans hundreds of years ago.
Geography
Mounds is located in the Arkansas River Valley, which is part of the Ozark Plateau. The town is situated on the banks of the Arkansas River, which is the main source of water for the area. The town is surrounded by rolling hills and wooded areas, and is home to a variety of wildlife. The climate in Mounds is generally mild, with hot summers and cold winters.
Economy
Mounds is a small, rural town with a population of just over 1,000 people. The town’s economy is largely based on agriculture, with many of the residents working in the farming and ranching industries. The town also has a few small businesses, including a grocery store, a hardware store, and a few restaurants.
Demographics
As of the 2010 census, the population of Mounds was 1,072. The racial makeup of the town was 95.3% White, 0.7% African American, 0.3% Native American, 0.2% Asian, 0.1% Pacific Islander, and 3.4% from other races. The median household income was $31,250, and the median family income was $37,500.
History
Mounds was founded in 1891 by a group of settlers from Arkansas. The town was named after the nearby mounds, which were created by Native Americans hundreds of years ago. The town grew slowly over the years, and by the early 1900s, it had become a thriving agricultural community.
In the 1920s, the town was hit hard by the Great Depression, and many of the residents were forced to leave in search of work. However, the town was able to recover, and by the 1950s, it had become a popular tourist destination. Today, Mounds is a small, rural town with a population of just over 1,000 people.
Conclusion
Mounds, Oklahoma is a small, rural town located in Creek County, Oklahoma. It is situated on the banks of the Arkansas River, about 20 miles southeast of Tulsa. The town was founded in 1891 and was named after the nearby mounds, which were created by Native Americans hundreds of years ago. The town’s economy is largely based on agriculture, with many of the residents working in the farming and ranching industries. As of the 2010 census, the population of Mounds was 1,072. The town has a rich history and is a popular tourist destination.
Common Questions
What is Per Capita Income in Mounds?
Per Capita income in Mounds is $23,820.
What is the Median Family Income in Mounds?
Median Family Income in Mounds is $49,236.
What is the Median Household income in Mounds?
Median Household Income in Mounds is $42,014.
What is Income or Wage Gap in Mounds?
Income or Wage Gap in Mounds is 40.6%.
Women in Mounds earn 59.4 cents for every dollar earned by a man.
What is Inequality or Gini Index in Mounds?
Inequality or Gini Index in Mounds is 0.49.
What is the Total Population of Mounds?
Total Population of Mounds is 1,099.
What is the Total Male Population of Mounds?
Total Male Population of Mounds is 529.
What is the Total Female Population of Mounds?
Total Female Population of Mounds is 570.
What is the Ratio of Males per 100 Females in Mounds?
There are 92.81 Males per 100 Females in Mounds.
What is the Ratio of Females per 100 Males in Mounds?
There are 107.75 Females per 100 Males in Mounds.
What is the Median Population Age in Mounds?
Median Population Age in Mounds is 31.9 Years.
What is the Average Family Size in Mounds
Average Family Size in Mounds is 3.2 People.
What is the Average Household Size in Mounds
Average Household Size in Mounds is 2.7 People.
How Large is the Labor Force in Mounds?
There are 435 People in the Labor Forcein in Mounds.
What is the Percentage of People in the Labor Force in Mounds?
52.1% of People are in the Labor Force in Mounds.
What is the Unemployment Rate in Mounds?
Unemployment Rate in Mounds is 2.6%.