Coweta, OK Map & Demographics
Coweta Map
Coweta Overview
$28,435
PER CAPITA INCOME
$76,831
AVG FAMILY INCOME
$57,166
AVG HOUSEHOLD INCOME
24.2%
WAGE / INCOME GAP [ % ]
75.8¢/ $1
WAGE / INCOME GAP [ $ ]
0.38
INEQUALITY / GINI INDEX
9,903
TOTAL POPULATION
5,097
MALE POPULATION
4,806
FEMALE POPULATION
106.05
MALES / 100 FEMALES
94.29
FEMALES / 100 MALES
34.5
MEDIAN AGE
3.3
AVG FAMILY SIZE
2.7
AVG HOUSEHOLD SIZE
4,834
LABOR FORCE [ PEOPLE ]
65.6%
PERCENT IN LABOR FORCE
5.3%
UNEMPLOYMENT RATE
Coweta Zip Codes
Coweta Area Codes
Income in Coweta
Income Overview in Coweta
Per Capita Income in Coweta is $28,435, while median incomes of families and households are $76,831 and $57,166 respectively.
| Characteristic | Number | Measure |
| Per Capita Income | 9,903 | $28,435 |
| Median Family Income | 2,405 | $76,831 |
| Mean Family Income | 2,405 | $87,271 |
| Median Household Income | 3,683 | $57,166 |
| Mean Household Income | 3,683 | $72,138 |
| Income Deficit | 2,405 | $0 |
| Wage / Income Gap (%) | 9,903 | 24.16% |
| Wage / Income Gap ($) | 9,903 | 75.84¢ per $1 |
| Gini / Inequality Index | 9,903 | 0.38 |
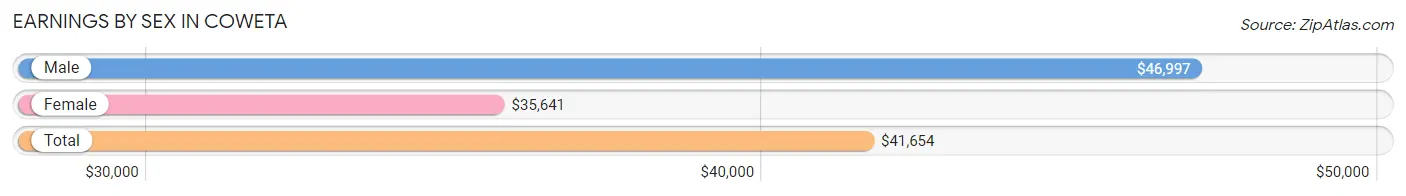
Earnings by Sex in Coweta
Average Earnings in Coweta are $41,654, $46,997 for men and $35,641 for women, a difference of 24.2%.
| Sex | Number | Average Earnings |
| Male | 2,710 (54.8%) | $46,997 |
| Female | 2,237 (45.2%) | $35,641 |
| Total | 4,947 (100.0%) | $41,654 |
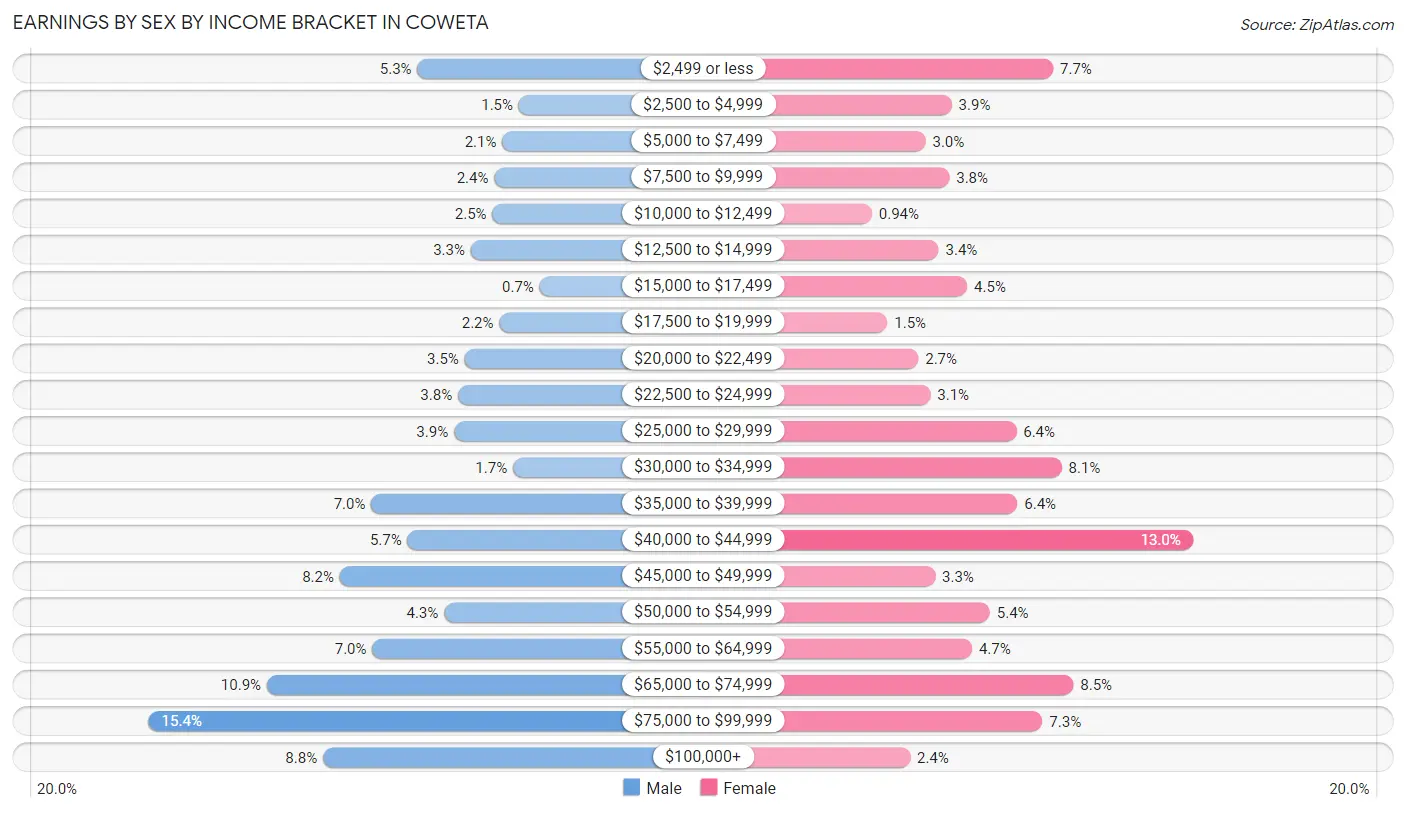
Earnings by Sex by Income Bracket in Coweta
The most common earnings brackets in Coweta are $75,000 to $99,999 for men (416 | 15.3%) and $40,000 to $44,999 for women (290 | 13.0%).
| Income | Male | Female |
| $2,499 or less | 143 (5.3%) | 173 (7.7%) |
| $2,500 to $4,999 | 40 (1.5%) | 88 (3.9%) |
| $5,000 to $7,499 | 57 (2.1%) | 66 (2.9%) |
| $7,500 to $9,999 | 65 (2.4%) | 86 (3.8%) |
| $10,000 to $12,499 | 67 (2.5%) | 21 (0.9%) |
| $12,500 to $14,999 | 89 (3.3%) | 77 (3.4%) |
| $15,000 to $17,499 | 19 (0.7%) | 101 (4.5%) |
| $17,500 to $19,999 | 60 (2.2%) | 34 (1.5%) |
| $20,000 to $22,499 | 95 (3.5%) | 60 (2.7%) |
| $22,500 to $24,999 | 102 (3.8%) | 70 (3.1%) |
| $25,000 to $29,999 | 106 (3.9%) | 142 (6.4%) |
| $30,000 to $34,999 | 46 (1.7%) | 180 (8.1%) |
| $35,000 to $39,999 | 190 (7.0%) | 143 (6.4%) |
| $40,000 to $44,999 | 153 (5.7%) | 290 (13.0%) |
| $45,000 to $49,999 | 222 (8.2%) | 74 (3.3%) |
| $50,000 to $54,999 | 116 (4.3%) | 120 (5.4%) |
| $55,000 to $64,999 | 189 (7.0%) | 105 (4.7%) |
| $65,000 to $74,999 | 296 (10.9%) | 190 (8.5%) |
| $75,000 to $99,999 | 416 (15.3%) | 164 (7.3%) |
| $100,000+ | 239 (8.8%) | 53 (2.4%) |
| Total | 2,710 (100.0%) | 2,237 (100.0%) |
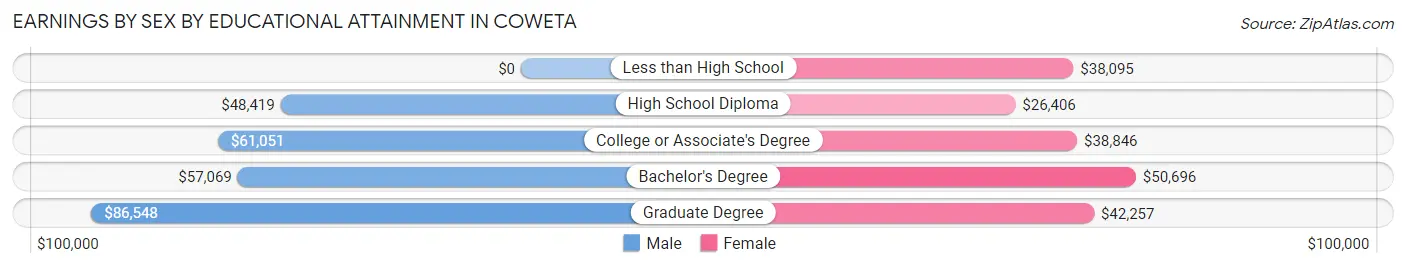
Earnings by Sex by Educational Attainment in Coweta
Average earnings in Coweta are $54,688 for men and $39,089 for women, a difference of 28.5%. Men with an educational attainment of graduate degree enjoy the highest average annual earnings of $86,548, while those with high school diploma education earn the least with $48,419. Women with an educational attainment of bachelor's degree earn the most with the average annual earnings of $50,696, while those with high school diploma education have the smallest earnings of $26,406.
| Educational Attainment | Male Income | Female Income |
| Less than High School | - | - |
| High School Diploma | $48,419 | $26,406 |
| College or Associate's Degree | $61,051 | $38,846 |
| Bachelor's Degree | $57,069 | $50,696 |
| Graduate Degree | $86,548 | $42,257 |
| Total | $54,688 | $39,089 |
Family Income in Coweta
Family Income Brackets in Coweta
According to the Coweta family income data, there are 563 families falling into the $50,000 to $74,999 income range, which is the most common income bracket and makes up 23.4% of all families. Conversely, the $10,000 to $14,999 income bracket is the least frequent group with only 17 families (0.7%) belonging to this category.
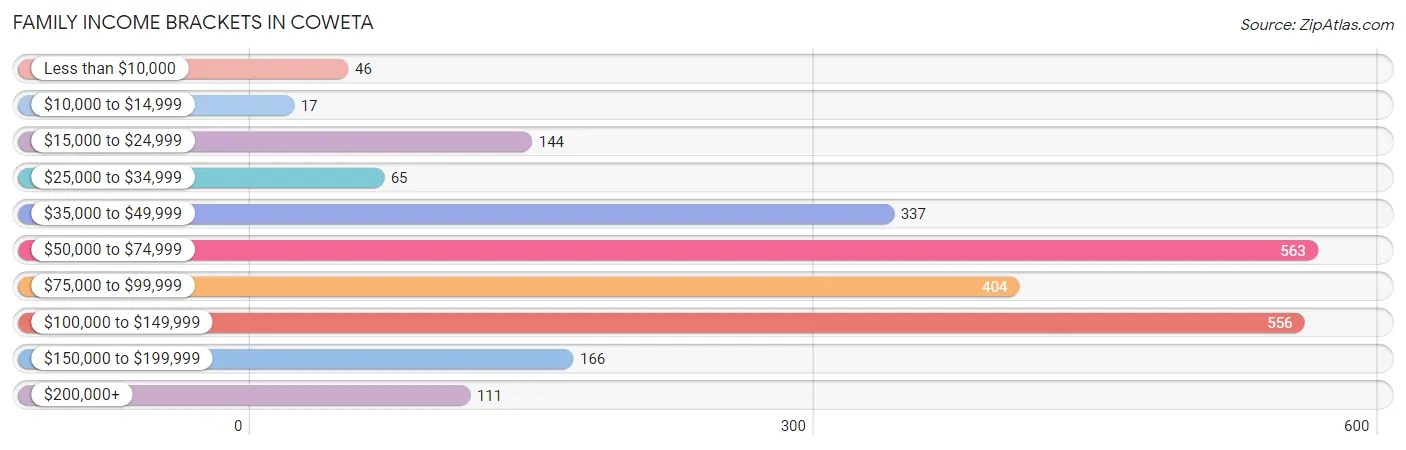
| Income Bracket | # Families | % Families |
| Less than $10,000 | 46 | 1.9% |
| $10,000 to $14,999 | 17 | 0.7% |
| $15,000 to $24,999 | 144 | 6.0% |
| $25,000 to $34,999 | 65 | 2.7% |
| $35,000 to $49,999 | 337 | 14.0% |
| $50,000 to $74,999 | 563 | 23.4% |
| $75,000 to $99,999 | 404 | 16.8% |
| $100,000 to $149,999 | 556 | 23.1% |
| $150,000 to $199,999 | 166 | 6.9% |
| $200,000+ | 111 | 4.6% |
Family Income by Famaliy Size in Coweta
7+ person families (61 | 2.5%) account for the highest median family income in Coweta with $126,042 per family, while 2-person families (1,032 | 42.9%) have the highest median income of $33,892 per family member.
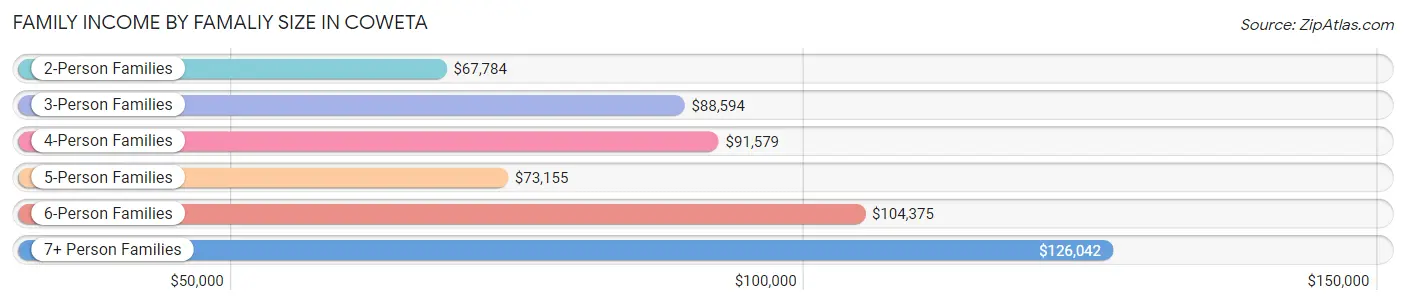
| Income Bracket | # Families | Median Income |
| 2-Person Families | 1,032 (42.9%) | $67,784 |
| 3-Person Families | 499 (20.7%) | $88,594 |
| 4-Person Families | 452 (18.8%) | $91,579 |
| 5-Person Families | 199 (8.3%) | $73,155 |
| 6-Person Families | 162 (6.7%) | $104,375 |
| 7+ Person Families | 61 (2.5%) | $126,042 |
| Total | 2,405 (100.0%) | $76,831 |
Family Income by Number of Earners in Coweta
The median family income in Coweta is $76,831, with families comprising 3+ earners (246) having the highest median family income of $145,500, while families with no earners (304) have the lowest median family income of $39,118, accounting for 10.2% and 12.6% of families, respectively.
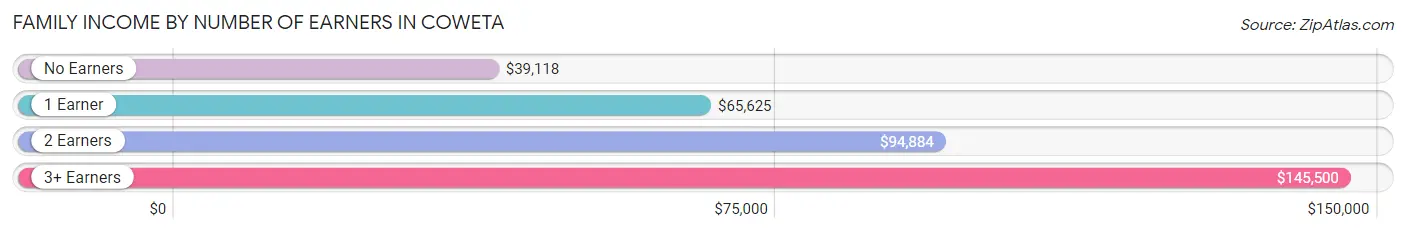
| Number of Earners | # Families | Median Income |
| No Earners | 304 (12.6%) | $39,118 |
| 1 Earner | 897 (37.3%) | $65,625 |
| 2 Earners | 958 (39.8%) | $94,884 |
| 3+ Earners | 246 (10.2%) | $145,500 |
| Total | 2,405 (100.0%) | $76,831 |
Household Income in Coweta
Household Income Brackets in Coweta
With 784 households falling in the category, the $50,000 to $74,999 income range is the most frequent in Coweta, accounting for 21.3% of all households. In contrast, only 110 households (3.0%) fall into the $200,000+ income bracket, making it the least populous group.
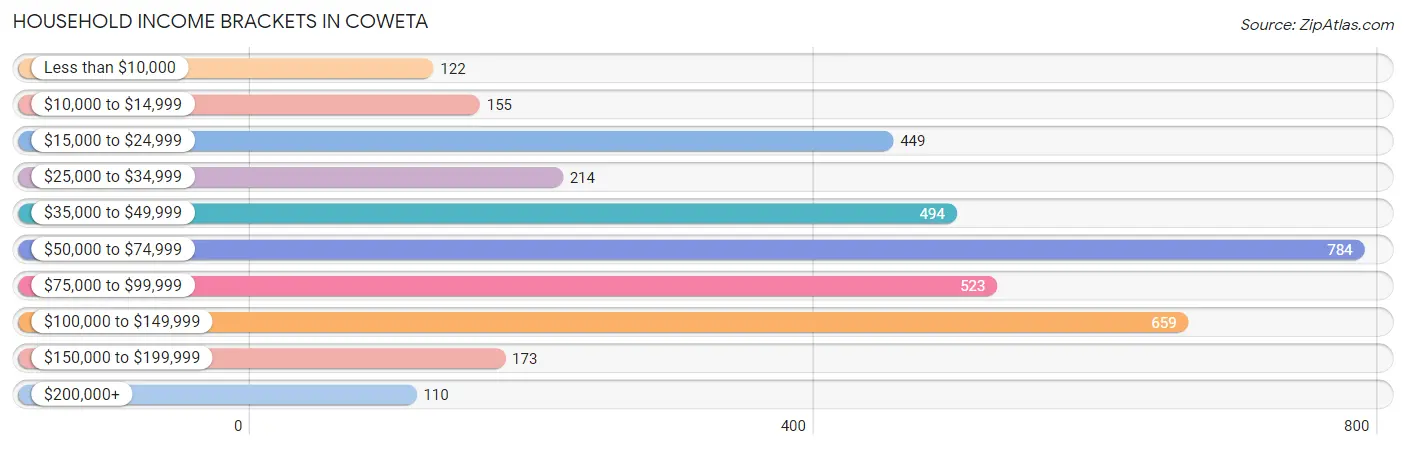
| Income Bracket | # Households | % Households |
| Less than $10,000 | 122 | 3.3% |
| $10,000 to $14,999 | 155 | 4.2% |
| $15,000 to $24,999 | 449 | 12.2% |
| $25,000 to $34,999 | 214 | 5.8% |
| $35,000 to $49,999 | 494 | 13.4% |
| $50,000 to $74,999 | 784 | 21.3% |
| $75,000 to $99,999 | 523 | 14.2% |
| $100,000 to $149,999 | 659 | 17.9% |
| $150,000 to $199,999 | 173 | 4.7% |
| $200,000+ | 110 | 3.0% |
Household Income by Householder Age in Coweta
The median household income in Coweta is $57,166, with the highest median household income of $79,417 found in the 45 to 64 years age bracket for the primary householder. A total of 1,183 households (32.1%) fall into this category. Meanwhile, the 65+ years age bracket for the primary householder has the lowest median household income of $36,852, with 958 households (26.0%) in this group.
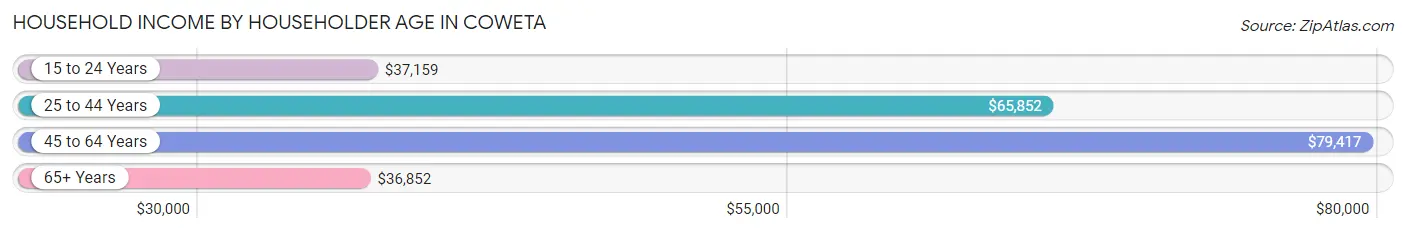
| Income Bracket | # Households | Median Income |
| 15 to 24 Years | 172 (4.7%) | $37,159 |
| 25 to 44 Years | 1,370 (37.2%) | $65,852 |
| 45 to 64 Years | 1,183 (32.1%) | $79,417 |
| 65+ Years | 958 (26.0%) | $36,852 |
| Total | 3,683 (100.0%) | $57,166 |
Poverty in Coweta
Income Below Poverty by Sex and Age in Coweta
With 10.3% poverty level for males and 12.9% for females among the residents of Coweta, 5 year old males and 12 to 14 year old females are the most vulnerable to poverty, with 19 males (35.2%) and 46 females (22.4%) in their respective age groups living below the poverty level.
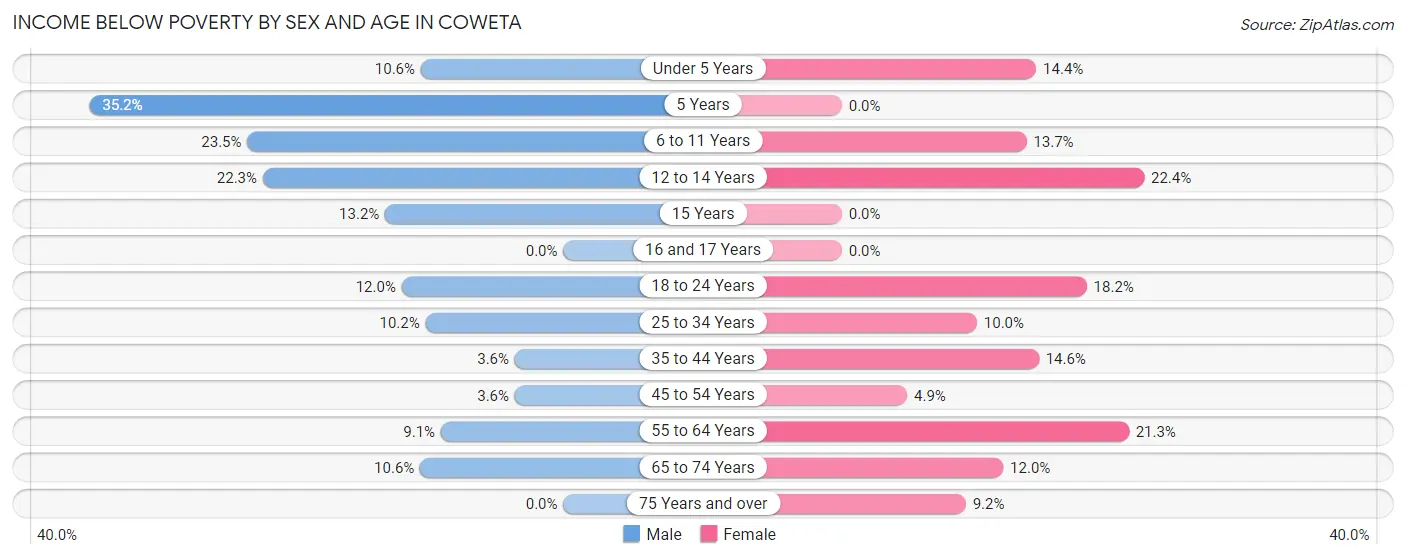
| Age Bracket | Male | Female |
| Under 5 Years | 40 (10.6%) | 42 (14.4%) |
| 5 Years | 19 (35.2%) | 0 (0.0%) |
| 6 to 11 Years | 126 (23.5%) | 51 (13.7%) |
| 12 to 14 Years | 54 (22.3%) | 46 (22.4%) |
| 15 Years | 25 (13.2%) | 0 (0.0%) |
| 16 and 17 Years | 0 (0.0%) | 0 (0.0%) |
| 18 to 24 Years | 51 (12.0%) | 70 (18.2%) |
| 25 to 34 Years | 79 (10.2%) | 72 (10.0%) |
| 35 to 44 Years | 21 (3.6%) | 118 (14.6%) |
| 45 to 54 Years | 24 (3.6%) | 24 (4.9%) |
| 55 to 64 Years | 33 (9.1%) | 105 (21.3%) |
| 65 to 74 Years | 47 (10.6%) | 43 (12.0%) |
| 75 Years and over | 0 (0.0%) | 32 (9.2%) |
| Total | 519 (10.3%) | 603 (12.9%) |
Income Above Poverty by Sex and Age in Coweta
According to the poverty statistics in Coweta, males aged 16 and 17 years and females aged 5 years are the age groups that are most secure financially, with 100.0% of males and 100.0% of females in these age groups living above the poverty line.
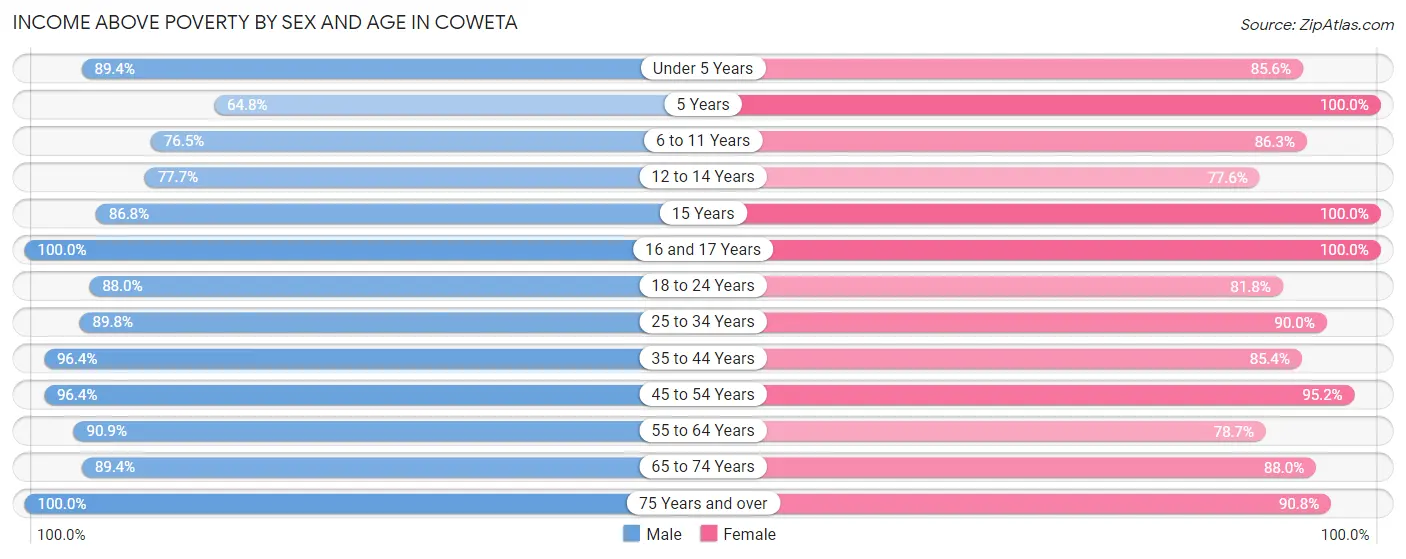
| Age Bracket | Male | Female |
| Under 5 Years | 338 (89.4%) | 249 (85.6%) |
| 5 Years | 35 (64.8%) | 94 (100.0%) |
| 6 to 11 Years | 411 (76.5%) | 321 (86.3%) |
| 12 to 14 Years | 188 (77.7%) | 159 (77.6%) |
| 15 Years | 164 (86.8%) | 66 (100.0%) |
| 16 and 17 Years | 171 (100.0%) | 49 (100.0%) |
| 18 to 24 Years | 374 (88.0%) | 315 (81.8%) |
| 25 to 34 Years | 693 (89.8%) | 646 (90.0%) |
| 35 to 44 Years | 562 (96.4%) | 689 (85.4%) |
| 45 to 54 Years | 643 (96.4%) | 471 (95.2%) |
| 55 to 64 Years | 330 (90.9%) | 388 (78.7%) |
| 65 to 74 Years | 395 (89.4%) | 316 (88.0%) |
| 75 Years and over | 227 (100.0%) | 316 (90.8%) |
| Total | 4,531 (89.7%) | 4,079 (87.1%) |
Income Below Poverty Among Married-Couple Families in Coweta
The poverty statistics for married-couple families in Coweta show that 4.2% or 74 of the total 1,749 families live below the poverty line. Families with 5 or more children have the highest poverty rate of 52.2%, comprising of 12 families. On the other hand, families with 1 or 2 children have the lowest poverty rate of 2.9%, which includes 20 families.
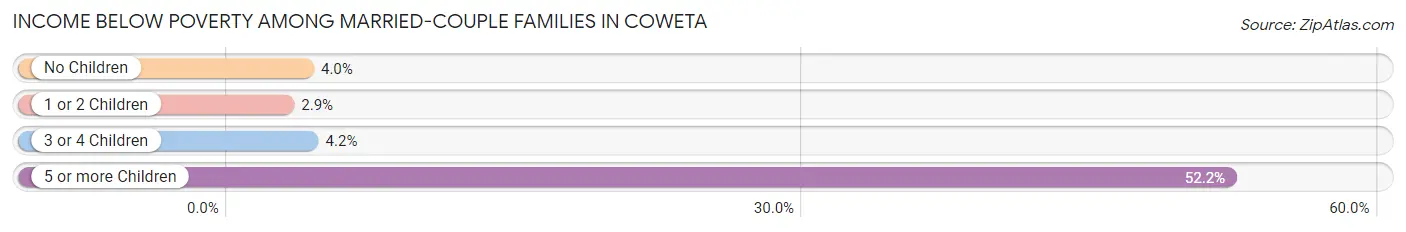
| Children | Above Poverty | Below Poverty |
| No Children | 799 (96.0%) | 33 (4.0%) |
| 1 or 2 Children | 660 (97.1%) | 20 (2.9%) |
| 3 or 4 Children | 205 (95.8%) | 9 (4.2%) |
| 5 or more Children | 11 (47.8%) | 12 (52.2%) |
| Total | 1,675 (95.8%) | 74 (4.2%) |
Income Below Poverty Among Single-Parent Households in Coweta
According to the poverty data in Coweta, 7.0% or 15 single-father households and 18.5% or 82 single-mother households are living below the poverty line. Among single-father households, those with 3 or 4 children have the highest poverty rate, with 15 households (39.5%) experiencing poverty. Likewise, among single-mother households, those with 3 or 4 children have the highest poverty rate, with 31 households (39.2%) falling below the poverty line.
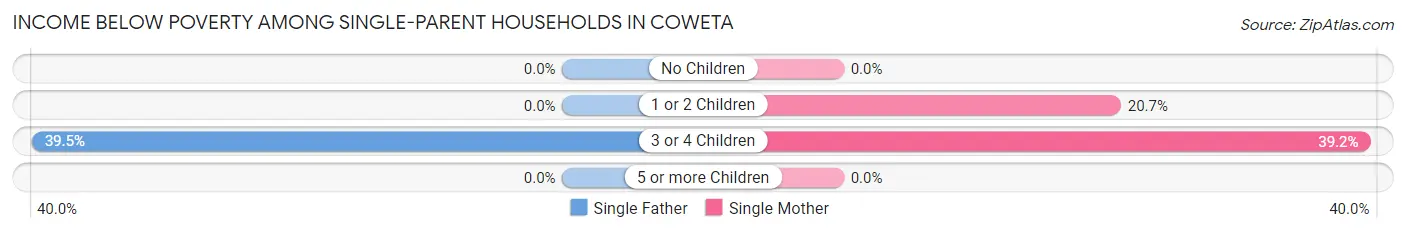
| Children | Single Father | Single Mother |
| No Children | 0 (0.0%) | 0 (0.0%) |
| 1 or 2 Children | 0 (0.0%) | 51 (20.6%) |
| 3 or 4 Children | 15 (39.5%) | 31 (39.2%) |
| 5 or more Children | 0 (0.0%) | 0 (0.0%) |
| Total | 15 (7.0%) | 82 (18.5%) |
Income Below Poverty Among Married-Couple vs Single-Parent Households in Coweta
The poverty data for Coweta shows that 74 of the married-couple family households (4.2%) and 97 of the single-parent households (14.8%) are living below the poverty level. Within the married-couple family households, those with 5 or more children have the highest poverty rate, with 12 households (52.2%) falling below the poverty line. Among the single-parent households, those with 3 or 4 children have the highest poverty rate, with 46 household (39.3%) living below poverty.
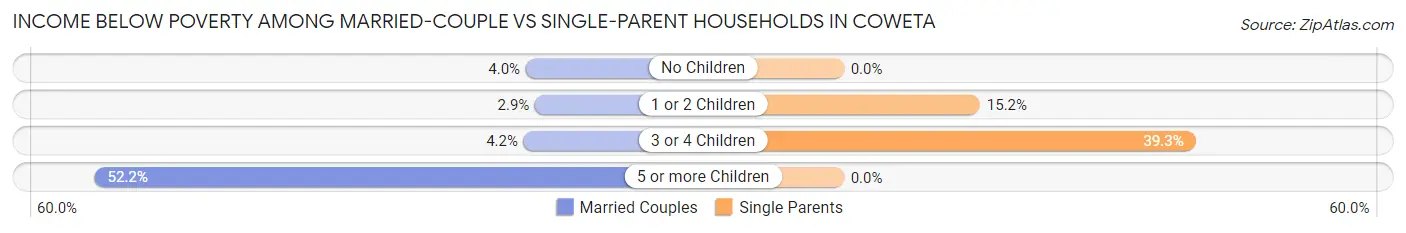
| Children | Married-Couple Families | Single-Parent Households |
| No Children | 33 (4.0%) | 0 (0.0%) |
| 1 or 2 Children | 20 (2.9%) | 51 (15.2%) |
| 3 or 4 Children | 9 (4.2%) | 46 (39.3%) |
| 5 or more Children | 12 (52.2%) | 0 (0.0%) |
| Total | 74 (4.2%) | 97 (14.8%) |
Race in Coweta
The most populous races in Coweta are White / Caucasian (7,341 | 74.1%), Two or more Races (1,104 | 11.2%), and Native / Alaskan (750 | 7.6%).
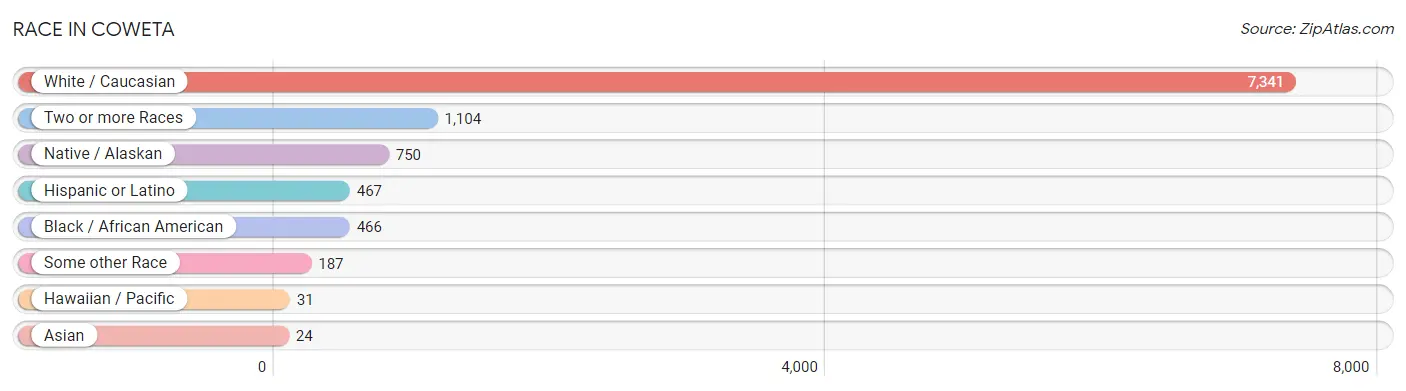
| Race | # Population | % Population |
| Asian | 24 | 0.2% |
| Black / African American | 466 | 4.7% |
| Hawaiian / Pacific | 31 | 0.3% |
| Hispanic or Latino | 467 | 4.7% |
| Native / Alaskan | 750 | 7.6% |
| White / Caucasian | 7,341 | 74.1% |
| Two or more Races | 1,104 | 11.2% |
| Some other Race | 187 | 1.9% |
| Total | 9,903 | 100.0% |
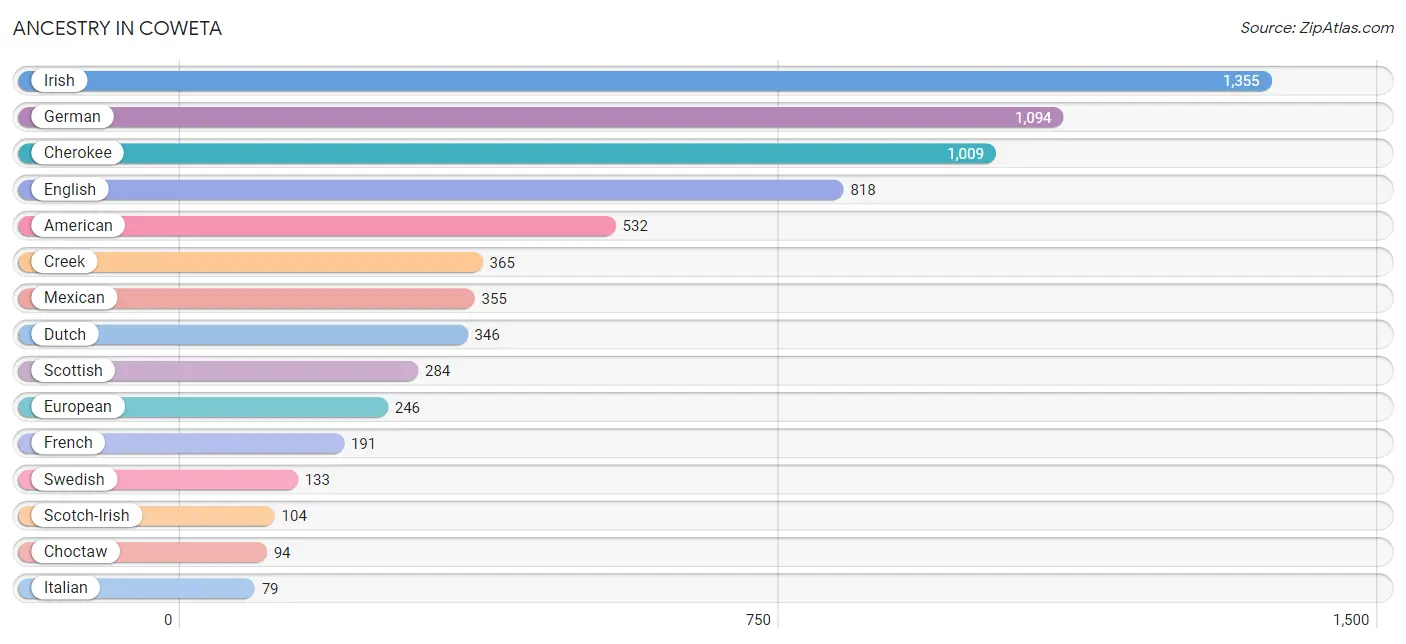
Ancestry in Coweta
The most populous ancestries reported in Coweta are Irish (1,355 | 13.7%), German (1,094 | 11.1%), Cherokee (1,009 | 10.2%), English (818 | 8.3%), and American (532 | 5.4%), together accounting for 48.6% of all Coweta residents.
| Ancestry | # Population | % Population |
| Alaska Native | 11 | 0.1% |
| American | 532 | 5.4% |
| Arab | 27 | 0.3% |
| Argentinean | 12 | 0.1% |
| Bhutanese | 15 | 0.2% |
| Brazilian | 13 | 0.1% |
| British | 32 | 0.3% |
| Cajun | 19 | 0.2% |
| Canadian | 77 | 0.8% |
| Cherokee | 1,009 | 10.2% |
| Chickasaw | 33 | 0.3% |
| Chippewa | 13 | 0.1% |
| Choctaw | 94 | 0.9% |
| Colombian | 11 | 0.1% |
| Creek | 365 | 3.7% |
| Czech | 13 | 0.1% |
| Danish | 11 | 0.1% |
| Dutch | 346 | 3.5% |
| Dutch West Indian | 20 | 0.2% |
| Eastern European | 43 | 0.4% |
| English | 818 | 8.3% |
| European | 246 | 2.5% |
| French | 191 | 1.9% |
| German | 1,094 | 11.1% |
| Greek | 23 | 0.2% |
| Indian (Asian) | 7 | 0.1% |
| Iranian | 14 | 0.1% |
| Irish | 1,355 | 13.7% |
| Italian | 79 | 0.8% |
| Lebanese | 27 | 0.3% |
| Mexican | 355 | 3.6% |
| Native Hawaiian | 31 | 0.3% |
| Nigerian | 16 | 0.2% |
| Norwegian | 64 | 0.6% |
| Pakistani | 11 | 0.1% |
| Polish | 29 | 0.3% |
| Portuguese | 39 | 0.4% |
| Potawatomi | 8 | 0.1% |
| Romanian | 1 | 0.0% |
| Russian | 37 | 0.4% |
| Scandinavian | 29 | 0.3% |
| Scotch-Irish | 104 | 1.1% |
| Scottish | 284 | 2.9% |
| Seminole | 1 | 0.0% |
| Shoshone | 55 | 0.6% |
| South American | 23 | 0.2% |
| Spaniard | 20 | 0.2% |
| Spanish | 54 | 0.5% |
| Subsaharan African | 16 | 0.2% |
| Swedish | 133 | 1.3% |
| Swiss | 11 | 0.1% |
| Thai | 14 | 0.1% |
| Welsh | 15 | 0.2% | View All 53 Rows |
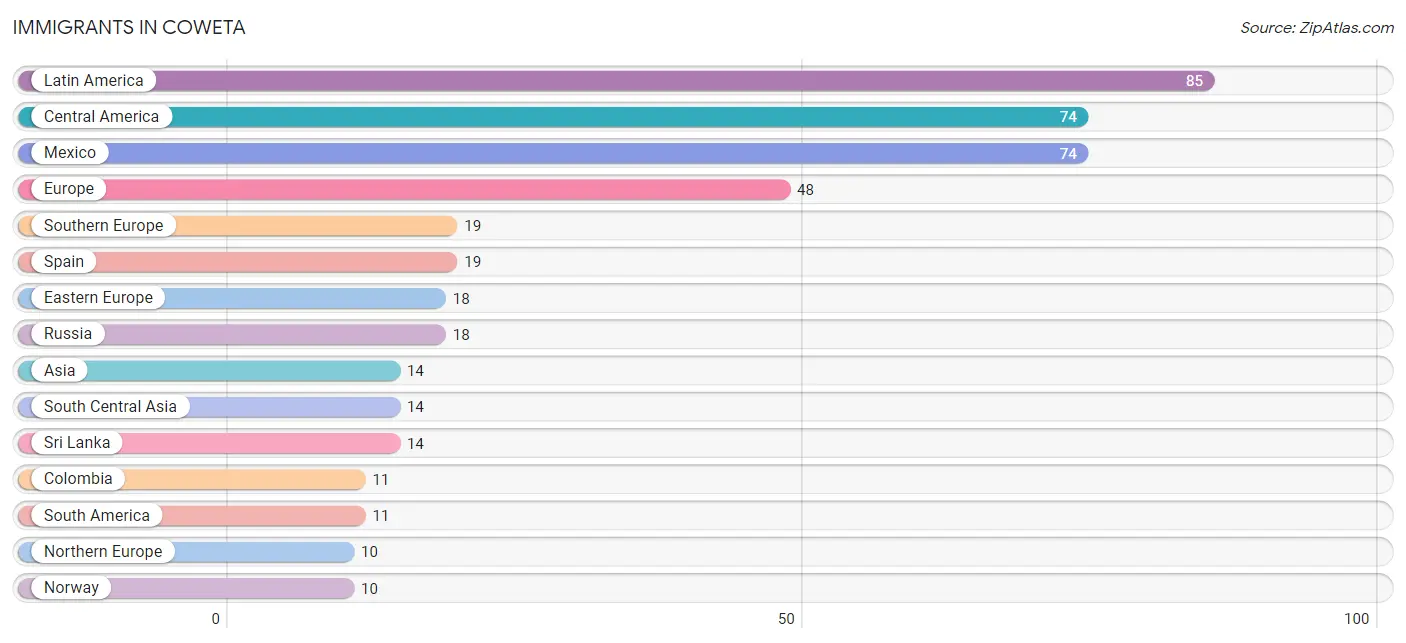
Immigrants in Coweta
The most numerous immigrant groups reported in Coweta came from Latin America (85 | 0.9%), Central America (74 | 0.7%), Mexico (74 | 0.7%), Europe (48 | 0.5%), and Southern Europe (19 | 0.2%), together accounting for 3.0% of all Coweta residents.
| Immigration Origin | # Population | % Population |
| Africa | 9 | 0.1% |
| Asia | 14 | 0.1% |
| Central America | 74 | 0.7% |
| Colombia | 11 | 0.1% |
| Eastern Europe | 18 | 0.2% |
| Europe | 48 | 0.5% |
| Germany | 1 | 0.0% |
| Latin America | 85 | 0.9% |
| Mexico | 74 | 0.7% |
| Nigeria | 9 | 0.1% |
| Northern Europe | 10 | 0.1% |
| Norway | 10 | 0.1% |
| Russia | 18 | 0.2% |
| South America | 11 | 0.1% |
| South Central Asia | 14 | 0.1% |
| Southern Europe | 19 | 0.2% |
| Spain | 19 | 0.2% |
| Sri Lanka | 14 | 0.1% |
| Western Africa | 9 | 0.1% |
| Western Europe | 1 | 0.0% | View All 20 Rows |
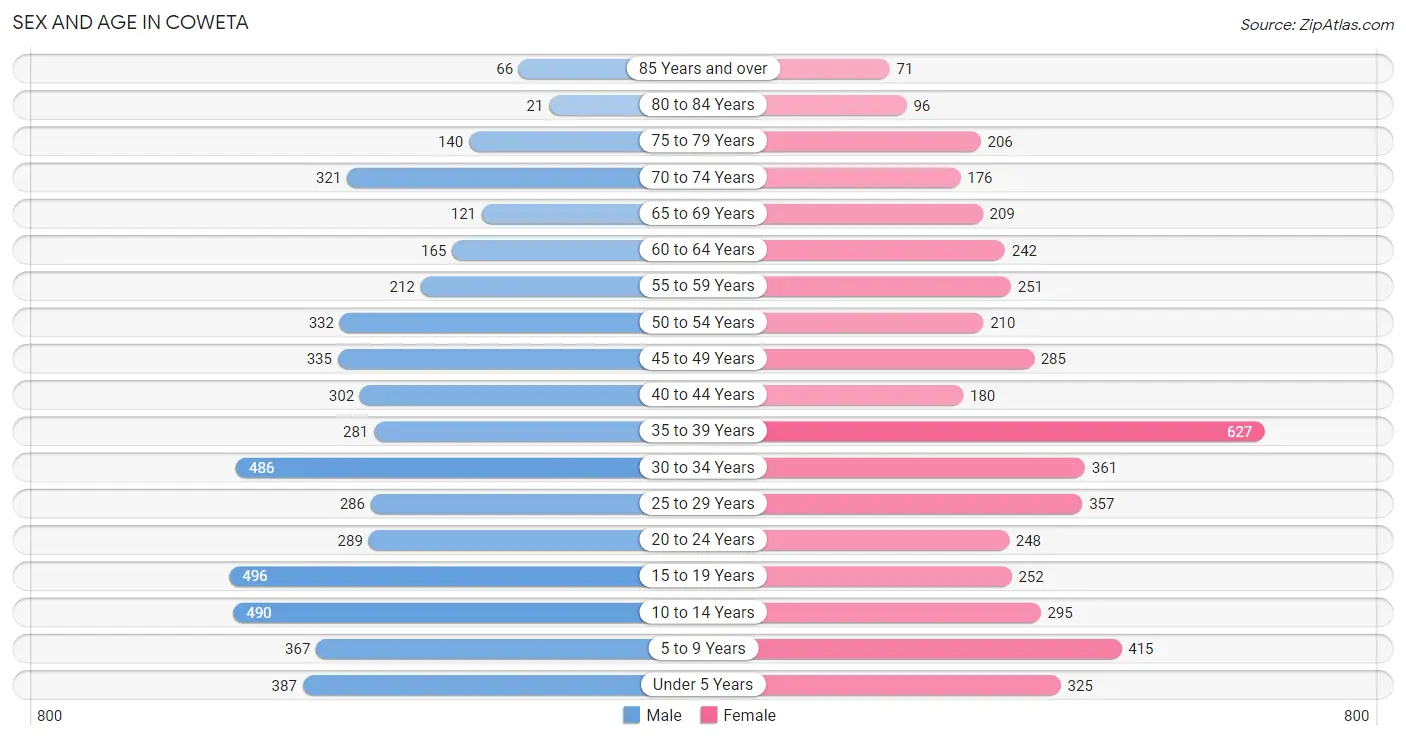
Sex and Age in Coweta
Sex and Age in Coweta
The most populous age groups in Coweta are 15 to 19 Years (496 | 9.7%) for men and 35 to 39 Years (627 | 13.1%) for women.
| Age Bracket | Male | Female |
| Under 5 Years | 387 (7.6%) | 325 (6.8%) |
| 5 to 9 Years | 367 (7.2%) | 415 (8.6%) |
| 10 to 14 Years | 490 (9.6%) | 295 (6.1%) |
| 15 to 19 Years | 496 (9.7%) | 252 (5.2%) |
| 20 to 24 Years | 289 (5.7%) | 248 (5.2%) |
| 25 to 29 Years | 286 (5.6%) | 357 (7.4%) |
| 30 to 34 Years | 486 (9.5%) | 361 (7.5%) |
| 35 to 39 Years | 281 (5.5%) | 627 (13.1%) |
| 40 to 44 Years | 302 (5.9%) | 180 (3.7%) |
| 45 to 49 Years | 335 (6.6%) | 285 (5.9%) |
| 50 to 54 Years | 332 (6.5%) | 210 (4.4%) |
| 55 to 59 Years | 212 (4.2%) | 251 (5.2%) |
| 60 to 64 Years | 165 (3.2%) | 242 (5.0%) |
| 65 to 69 Years | 121 (2.4%) | 209 (4.3%) |
| 70 to 74 Years | 321 (6.3%) | 176 (3.7%) |
| 75 to 79 Years | 140 (2.8%) | 206 (4.3%) |
| 80 to 84 Years | 21 (0.4%) | 96 (2.0%) |
| 85 Years and over | 66 (1.3%) | 71 (1.5%) |
| Total | 5,097 (100.0%) | 4,806 (100.0%) |
Families and Households in Coweta
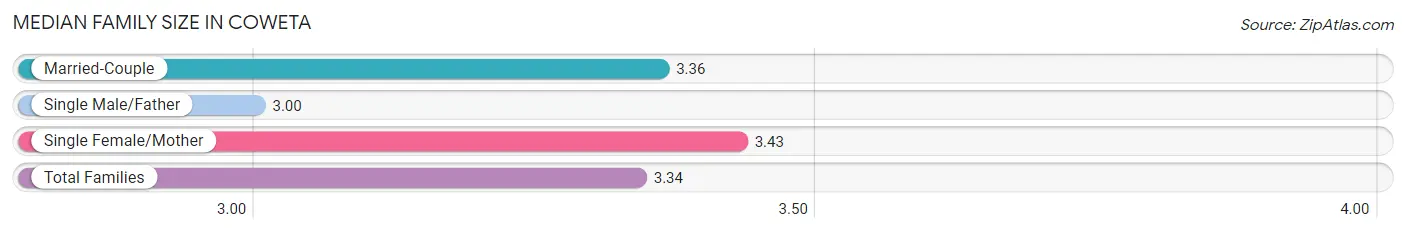
Median Family Size in Coweta
The median family size in Coweta is 3.34 persons per family, with single female/mother families (443 | 18.4%) accounting for the largest median family size of 3.43 persons per family. On the other hand, single male/father families (213 | 8.9%) represent the smallest median family size with 3.00 persons per family.
| Family Type | # Families | Family Size |
| Married-Couple | 1,749 (72.7%) | 3.36 |
| Single Male/Father | 213 (8.9%) | 3.00 |
| Single Female/Mother | 443 (18.4%) | 3.43 |
| Total Families | 2,405 (100.0%) | 3.34 |
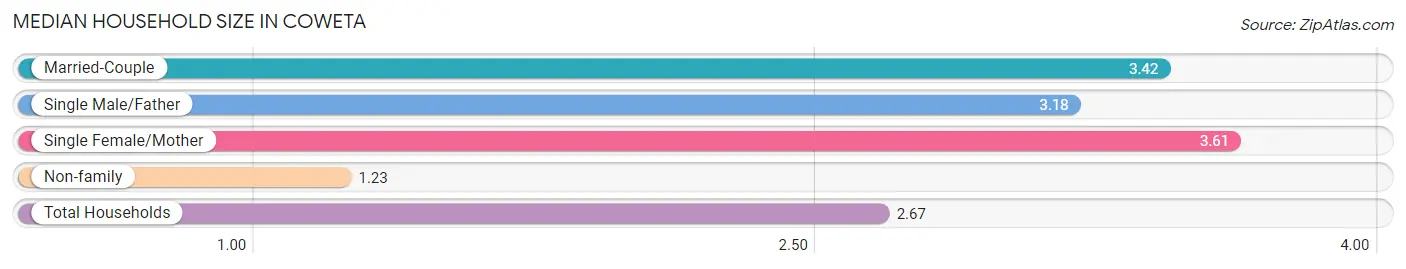
Median Household Size in Coweta
The median household size in Coweta is 2.67 persons per household, with single female/mother households (443 | 12.0%) accounting for the largest median household size of 3.61 persons per household. non-family households (1,278 | 34.7%) represent the smallest median household size with 1.23 persons per household.
| Household Type | # Households | Household Size |
| Married-Couple | 1,749 (47.5%) | 3.42 |
| Single Male/Father | 213 (5.8%) | 3.18 |
| Single Female/Mother | 443 (12.0%) | 3.61 |
| Non-family | 1,278 (34.7%) | 1.23 |
| Total Households | 3,683 (100.0%) | 2.67 |
Household Size by Marriage Status in Coweta
Out of a total of 3,683 households in Coweta, 2,405 (65.3%) are family households, while 1,278 (34.7%) are nonfamily households. The most numerous type of family households are 2-person households, comprising 955, and the most common type of nonfamily households are 1-person households, comprising 1,094.
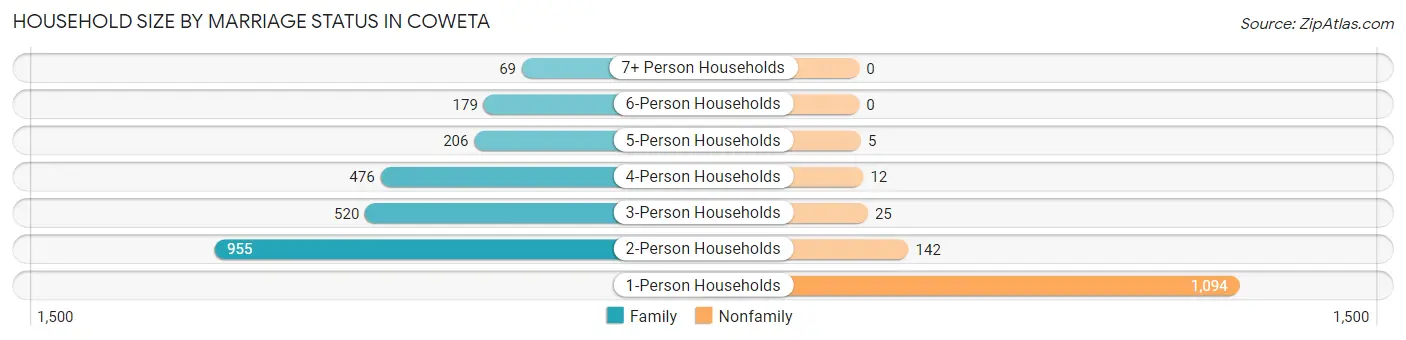
| Household Size | Family Households | Nonfamily Households |
| 1-Person Households | - | 1,094 (29.7%) |
| 2-Person Households | 955 (25.9%) | 142 (3.9%) |
| 3-Person Households | 520 (14.1%) | 25 (0.7%) |
| 4-Person Households | 476 (12.9%) | 12 (0.3%) |
| 5-Person Households | 206 (5.6%) | 5 (0.1%) |
| 6-Person Households | 179 (4.9%) | 0 (0.0%) |
| 7+ Person Households | 69 (1.9%) | 0 (0.0%) |
| Total | 2,405 (65.3%) | 1,278 (34.7%) |
Female Fertility in Coweta
Fertility by Age in Coweta
Average fertility rate in Coweta is 81.0 births per 1,000 women. Women in the age bracket of 35 to 50 years have the highest fertility rate with 93.0 births per 1,000 women. Women in the age bracket of 35 to 50 years acount for 55.3% of all women with births.
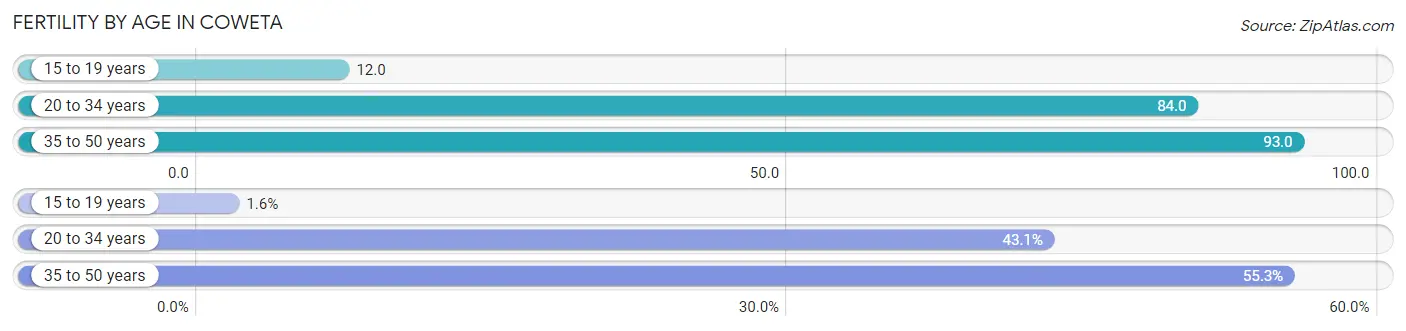
| Age Bracket | Women with Births | Births / 1,000 Women |
| 15 to 19 years | 3 (1.6%) | 12.0 |
| 20 to 34 years | 81 (43.1%) | 84.0 |
| 35 to 50 years | 104 (55.3%) | 93.0 |
| Total | 188 (100.0%) | 81.0 |
Fertility by Age by Marriage Status in Coweta
90.4% of women with births (188) in Coweta are married. The highest percentage of unmarried women with births falls into 35 to 50 years age bracket with 10.6% of them unmarried at the time of birth, while the lowest percentage of unmarried women with births belong to 15 to 19 years age bracket with 0.0% of them unmarried.
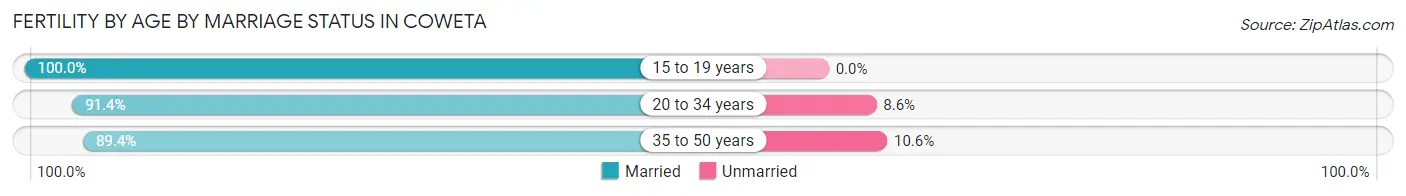
| Age Bracket | Married | Unmarried |
| 15 to 19 years | 3 (100.0%) | 0 (0.0%) |
| 20 to 34 years | 74 (91.4%) | 7 (8.6%) |
| 35 to 50 years | 93 (89.4%) | 11 (10.6%) |
| Total | 170 (90.4%) | 18 (9.6%) |
Fertility by Education in Coweta
Average fertility rate in Coweta is 81.0 births per 1,000 women. Women with the education attainment of graduate degree have the highest fertility rate of 419.0 births per 1,000 women, while women with the education attainment of less than high school have the lowest fertility at 13.0 births per 1,000 women. Women with the education attainment of graduate degree represent 38.3% of all women with births.
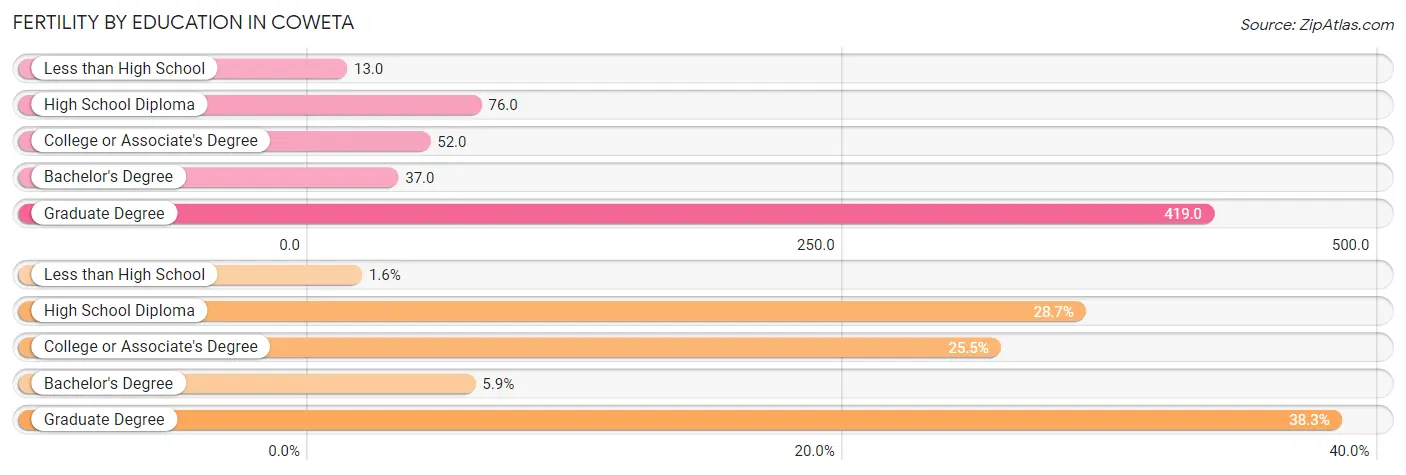
| Educational Attainment | Women with Births | Births / 1,000 Women |
| Less than High School | 3 (1.6%) | 13.0 |
| High School Diploma | 54 (28.7%) | 76.0 |
| College or Associate's Degree | 48 (25.5%) | 52.0 |
| Bachelor's Degree | 11 (5.9%) | 37.0 |
| Graduate Degree | 72 (38.3%) | 419.0 |
| Total | 188 (100.0%) | 81.0 |
Fertility by Education by Marriage Status in Coweta
9.6% of women with births in Coweta are unmarried. Women with the educational attainment of less than high school are most likely to be married with 100.0% of them married at childbirth, while women with the educational attainment of bachelor's degree are least likely to be married with 100.0% of them unmarried at childbirth.
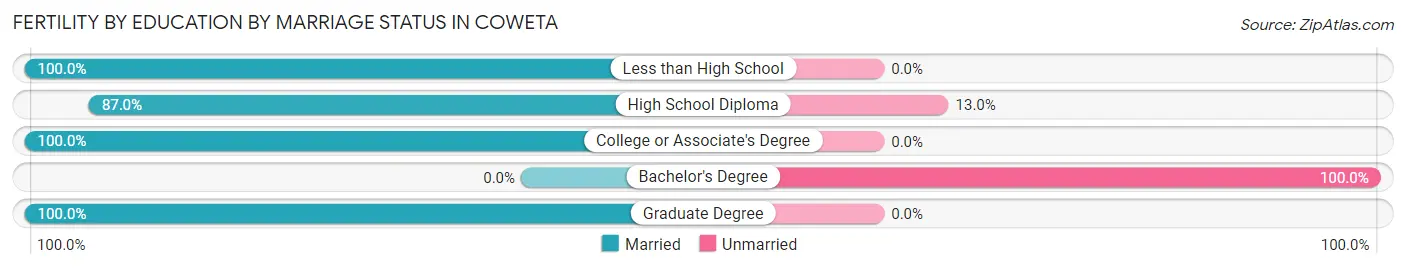
| Educational Attainment | Married | Unmarried |
| Less than High School | 3 (100.0%) | 0 (0.0%) |
| High School Diploma | 47 (87.0%) | 7 (13.0%) |
| College or Associate's Degree | 48 (100.0%) | 0 (0.0%) |
| Bachelor's Degree | 0 (0.0%) | 11 (100.0%) |
| Graduate Degree | 72 (100.0%) | 0 (0.0%) |
| Total | 170 (90.4%) | 18 (9.6%) |
Employment Characteristics in Coweta
Employment by Class of Employer in Coweta
Among the 4,456 employed individuals in Coweta, private company employees (3,208 | 72.0%), local government employees (268 | 6.0%), and state government employees (232 | 5.2%) make up the most common classes of employment.
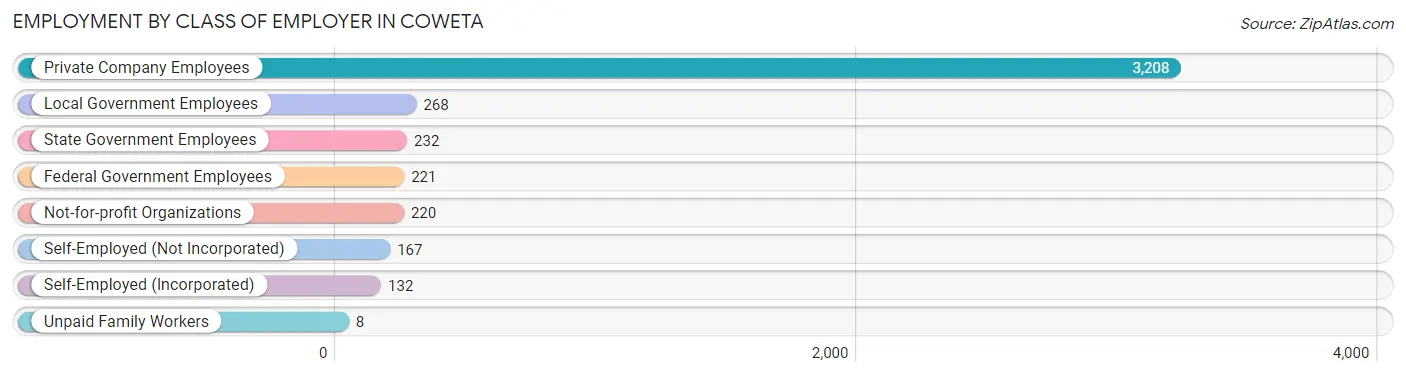
| Employer Class | # Employees | % Employees |
| Private Company Employees | 3,208 | 72.0% |
| Self-Employed (Incorporated) | 132 | 3.0% |
| Self-Employed (Not Incorporated) | 167 | 3.7% |
| Not-for-profit Organizations | 220 | 4.9% |
| Local Government Employees | 268 | 6.0% |
| State Government Employees | 232 | 5.2% |
| Federal Government Employees | 221 | 5.0% |
| Unpaid Family Workers | 8 | 0.2% |
| Total | 4,456 | 100.0% |
Employment Status by Age in Coweta
According to the labor force statistics for Coweta, out of the total population over 16 years of age (7,369), 65.6% or 4,834 individuals are in the labor force, with 5.3% or 256 of them unemployed. The age group with the highest labor force participation rate is 25 to 29 years, with 85.2% or 548 individuals in the labor force. Within the labor force, the 25 to 29 years age range has the highest percentage of unemployed individuals, with 21.0% or 115 of them being unemployed.
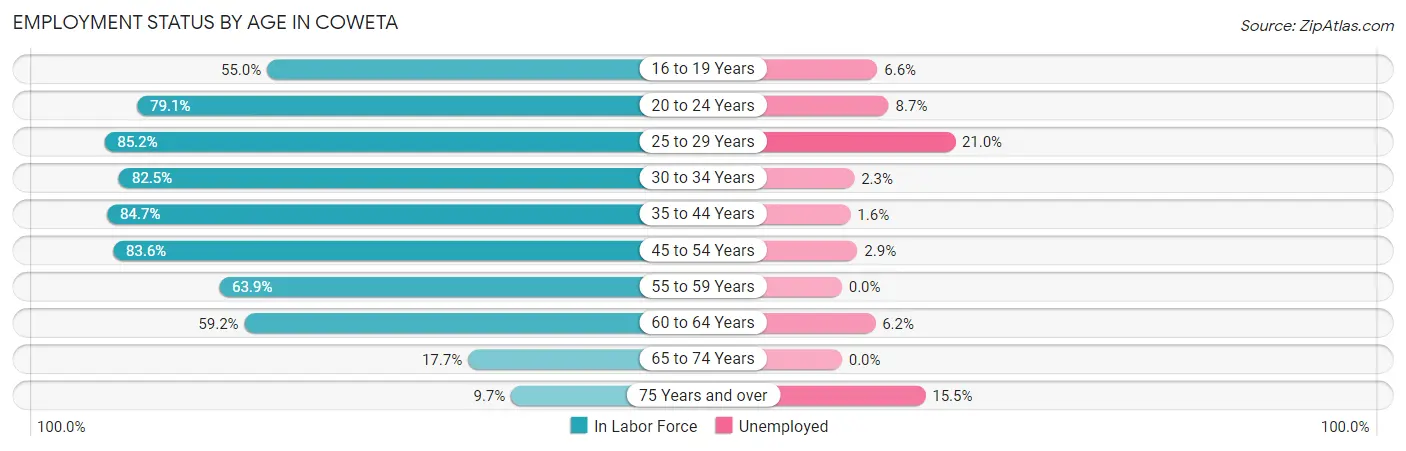
| Age Bracket | In Labor Force | Unemployed |
| 16 to 19 Years | 271 (55.0%) | 18 (6.6%) |
| 20 to 24 Years | 425 (79.1%) | 37 (8.7%) |
| 25 to 29 Years | 548 (85.2%) | 115 (21.0%) |
| 30 to 34 Years | 699 (82.5%) | 16 (2.3%) |
| 35 to 44 Years | 1,177 (84.7%) | 19 (1.6%) |
| 45 to 54 Years | 971 (83.6%) | 28 (2.9%) |
| 55 to 59 Years | 296 (63.9%) | 0 (0.0%) |
| 60 to 64 Years | 241 (59.2%) | 15 (6.2%) |
| 65 to 74 Years | 146 (17.7%) | 0 (0.0%) |
| 75 Years and over | 58 (9.7%) | 9 (15.5%) |
| Total | 4,834 (65.6%) | 256 (5.3%) |
Employment Status by Educational Attainment in Coweta
According to labor force statistics for Coweta, 80.0% of individuals (3,930) out of the total population between 25 and 64 years of age (4,912) are in the labor force, with 4.9% or 193 of them being unemployed. The group with the highest labor force participation rate are those with the educational attainment of bachelor's degree or higher, with 94.7% or 1,117 individuals in the labor force. Within the labor force, individuals with less than high school education have the highest percentage of unemployment, with 37.2% or 68 of them being unemployed.
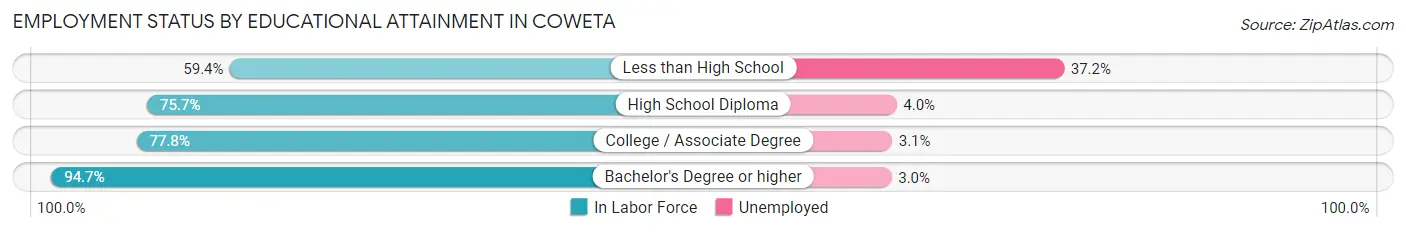
| Educational Attainment | In Labor Force | Unemployed |
| Less than High School | 183 (59.4%) | 115 (37.2%) |
| High School Diploma | 1,155 (75.7%) | 61 (4.0%) |
| College / Associate Degree | 1,477 (77.8%) | 59 (3.1%) |
| Bachelor's Degree or higher | 1,117 (94.7%) | 35 (3.0%) |
| Total | 3,930 (80.0%) | 241 (4.9%) |
Employment Occupations by Sex in Coweta
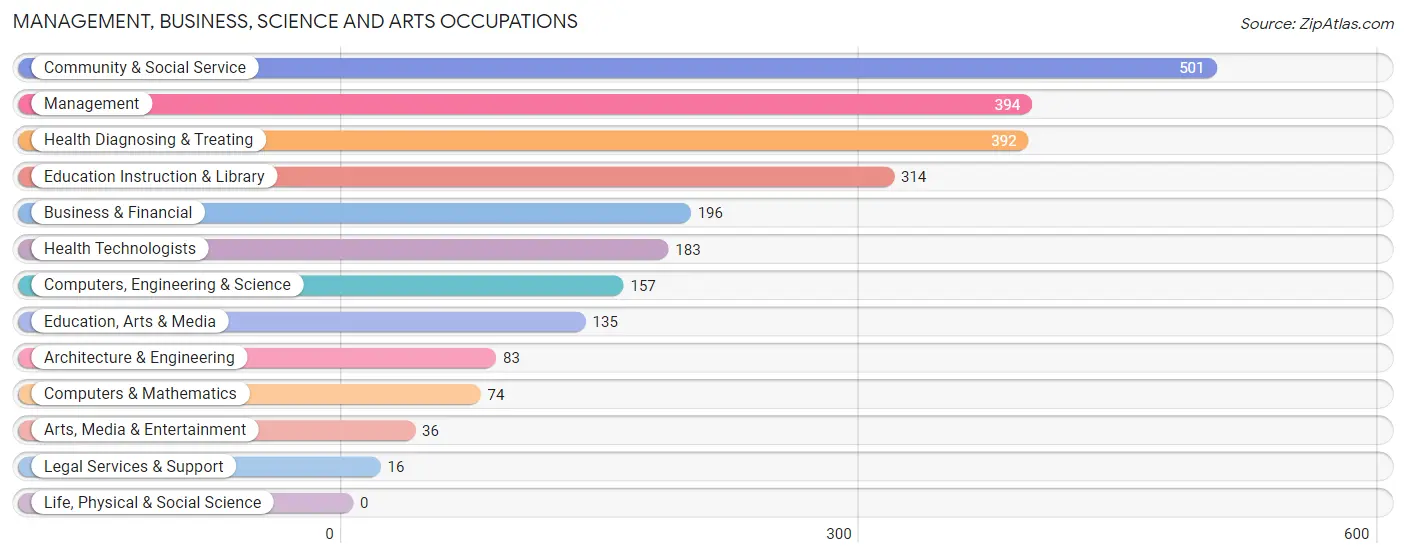
Management, Business, Science and Arts Occupations
The most common Management, Business, Science and Arts occupations in Coweta are Community & Social Service (501 | 11.0%), Management (394 | 8.6%), Health Diagnosing & Treating (392 | 8.6%), Education Instruction & Library (314 | 6.9%), and Business & Financial (196 | 4.3%).
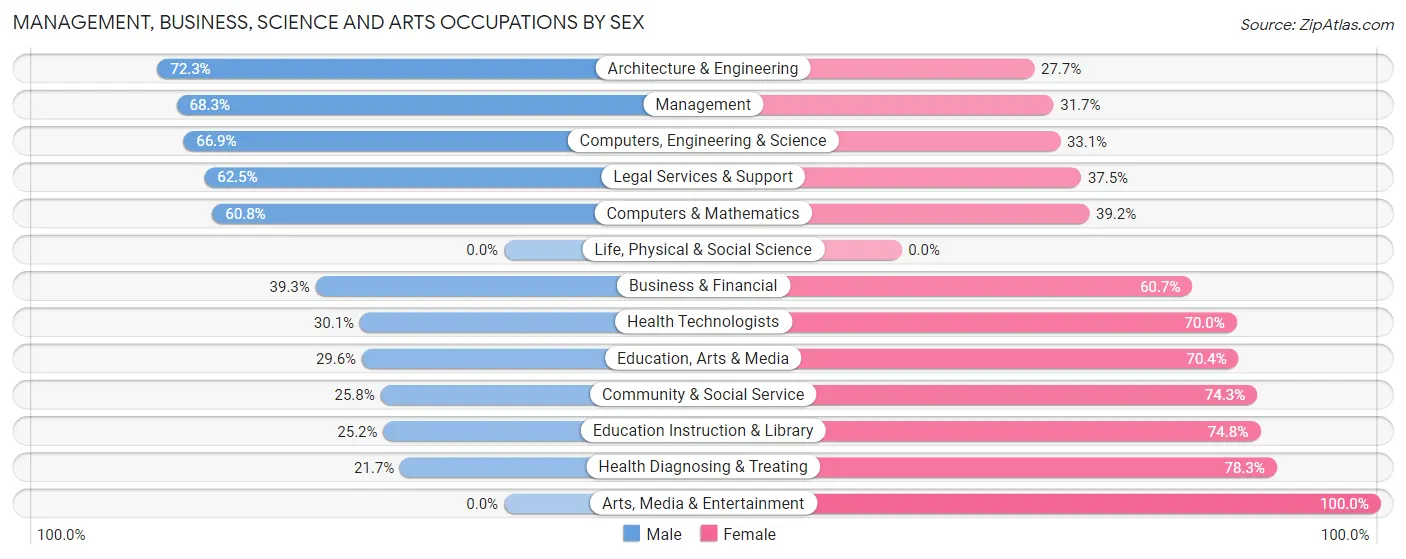
Management, Business, Science and Arts Occupations by Sex
Within the Management, Business, Science and Arts occupations in Coweta, the most male-oriented occupations are Architecture & Engineering (72.3%), Management (68.3%), and Computers, Engineering & Science (66.9%), while the most female-oriented occupations are Arts, Media & Entertainment (100.0%), Health Diagnosing & Treating (78.3%), and Education Instruction & Library (74.8%).
| Occupation | Male | Female |
| Management | 269 (68.3%) | 125 (31.7%) |
| Business & Financial | 77 (39.3%) | 119 (60.7%) |
| Computers, Engineering & Science | 105 (66.9%) | 52 (33.1%) |
| Computers & Mathematics | 45 (60.8%) | 29 (39.2%) |
| Architecture & Engineering | 60 (72.3%) | 23 (27.7%) |
| Life, Physical & Social Science | 0 (0.0%) | 0 (0.0%) |
| Community & Social Service | 129 (25.8%) | 372 (74.3%) |
| Education, Arts & Media | 40 (29.6%) | 95 (70.4%) |
| Legal Services & Support | 10 (62.5%) | 6 (37.5%) |
| Education Instruction & Library | 79 (25.2%) | 235 (74.8%) |
| Arts, Media & Entertainment | 0 (0.0%) | 36 (100.0%) |
| Health Diagnosing & Treating | 85 (21.7%) | 307 (78.3%) |
| Health Technologists | 55 (30.0%) | 128 (70.0%) |
| Total (Category) | 665 (40.6%) | 975 (59.5%) |
| Total (Overall) | 2,512 (55.1%) | 2,050 (44.9%) |
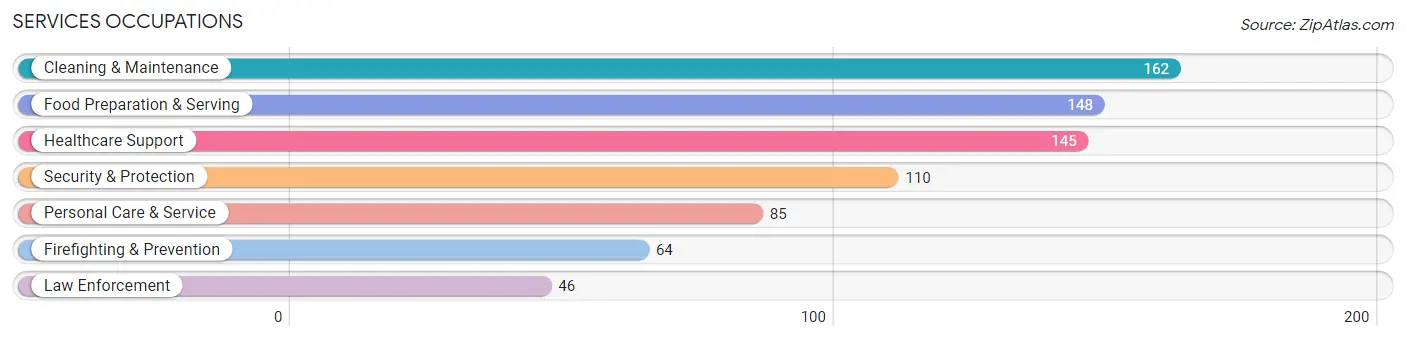
Services Occupations
The most common Services occupations in Coweta are Cleaning & Maintenance (162 | 3.5%), Food Preparation & Serving (148 | 3.2%), Healthcare Support (145 | 3.2%), Security & Protection (110 | 2.4%), and Personal Care & Service (85 | 1.9%).
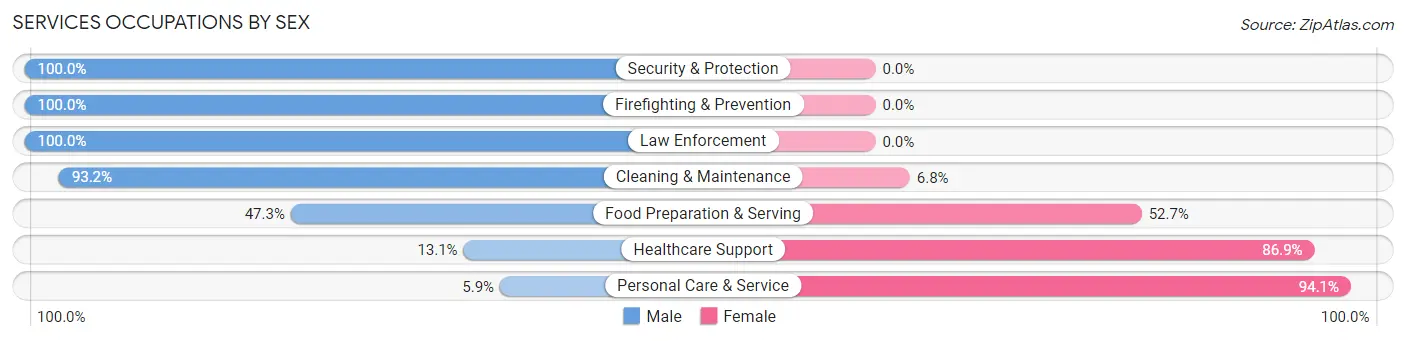
Services Occupations by Sex
Within the Services occupations in Coweta, the most male-oriented occupations are Security & Protection (100.0%), Firefighting & Prevention (100.0%), and Law Enforcement (100.0%), while the most female-oriented occupations are Personal Care & Service (94.1%), Healthcare Support (86.9%), and Food Preparation & Serving (52.7%).
| Occupation | Male | Female |
| Healthcare Support | 19 (13.1%) | 126 (86.9%) |
| Security & Protection | 110 (100.0%) | 0 (0.0%) |
| Firefighting & Prevention | 64 (100.0%) | 0 (0.0%) |
| Law Enforcement | 46 (100.0%) | 0 (0.0%) |
| Food Preparation & Serving | 70 (47.3%) | 78 (52.7%) |
| Cleaning & Maintenance | 151 (93.2%) | 11 (6.8%) |
| Personal Care & Service | 5 (5.9%) | 80 (94.1%) |
| Total (Category) | 355 (54.6%) | 295 (45.4%) |
| Total (Overall) | 2,512 (55.1%) | 2,050 (44.9%) |
Sales and Office Occupations
The most common Sales and Office occupations in Coweta are Office & Administration (559 | 12.2%), and Sales & Related (434 | 9.5%).

Sales and Office Occupations by Sex
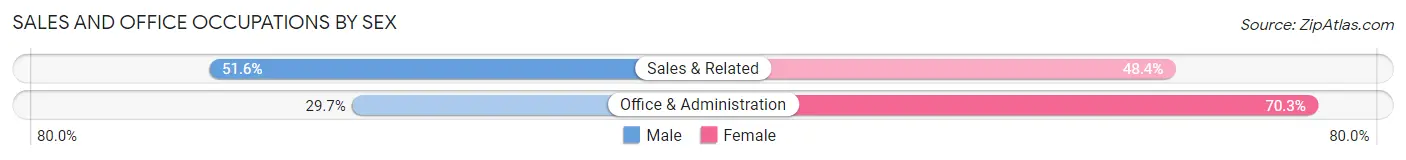
| Occupation | Male | Female |
| Sales & Related | 224 (51.6%) | 210 (48.4%) |
| Office & Administration | 166 (29.7%) | 393 (70.3%) |
| Total (Category) | 390 (39.3%) | 603 (60.7%) |
| Total (Overall) | 2,512 (55.1%) | 2,050 (44.9%) |
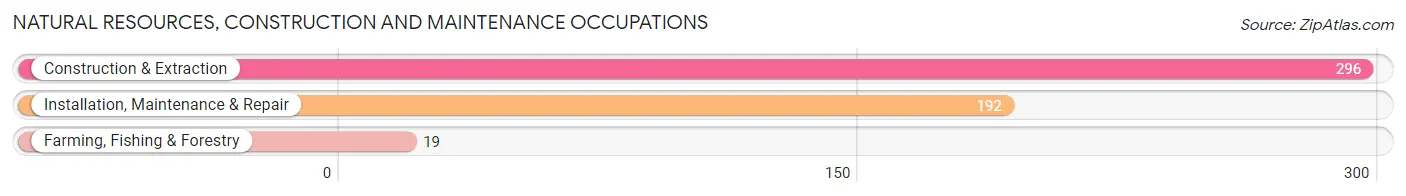
Natural Resources, Construction and Maintenance Occupations
The most common Natural Resources, Construction and Maintenance occupations in Coweta are Construction & Extraction (296 | 6.5%), Installation, Maintenance & Repair (192 | 4.2%), and Farming, Fishing & Forestry (19 | 0.4%).
Natural Resources, Construction and Maintenance Occupations by Sex
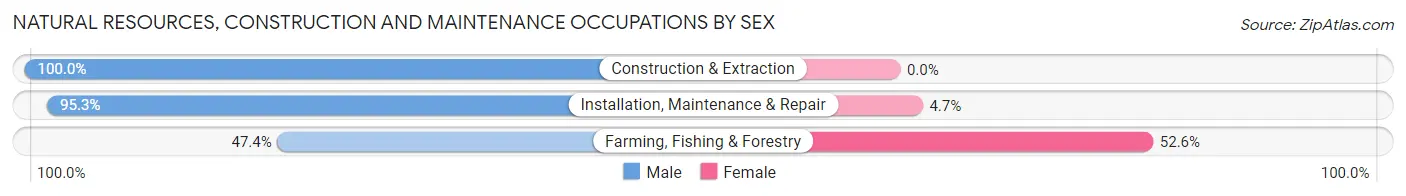
| Occupation | Male | Female |
| Farming, Fishing & Forestry | 9 (47.4%) | 10 (52.6%) |
| Construction & Extraction | 296 (100.0%) | 0 (0.0%) |
| Installation, Maintenance & Repair | 183 (95.3%) | 9 (4.7%) |
| Total (Category) | 488 (96.3%) | 19 (3.7%) |
| Total (Overall) | 2,512 (55.1%) | 2,050 (44.9%) |
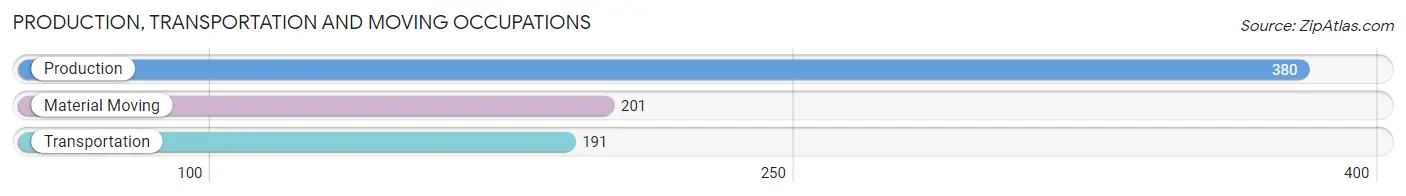
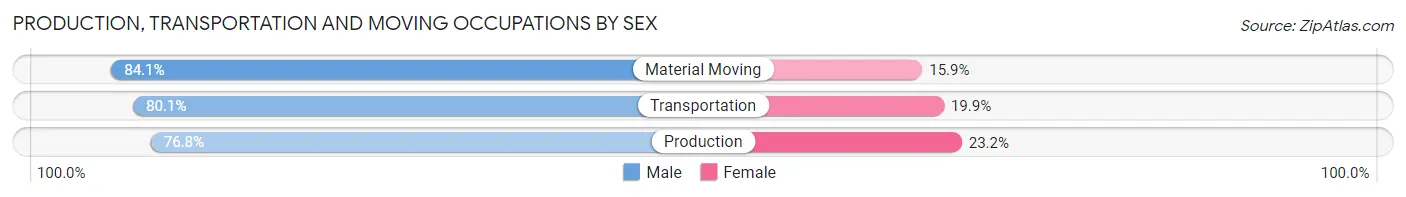
Production, Transportation and Moving Occupations
The most common Production, Transportation and Moving occupations in Coweta are Production (380 | 8.3%), Material Moving (201 | 4.4%), and Transportation (191 | 4.2%).
Production, Transportation and Moving Occupations by Sex
| Occupation | Male | Female |
| Production | 292 (76.8%) | 88 (23.2%) |
| Transportation | 153 (80.1%) | 38 (19.9%) |
| Material Moving | 169 (84.1%) | 32 (15.9%) |
| Total (Category) | 614 (79.5%) | 158 (20.5%) |
| Total (Overall) | 2,512 (55.1%) | 2,050 (44.9%) |
Employment Industries by Sex in Coweta
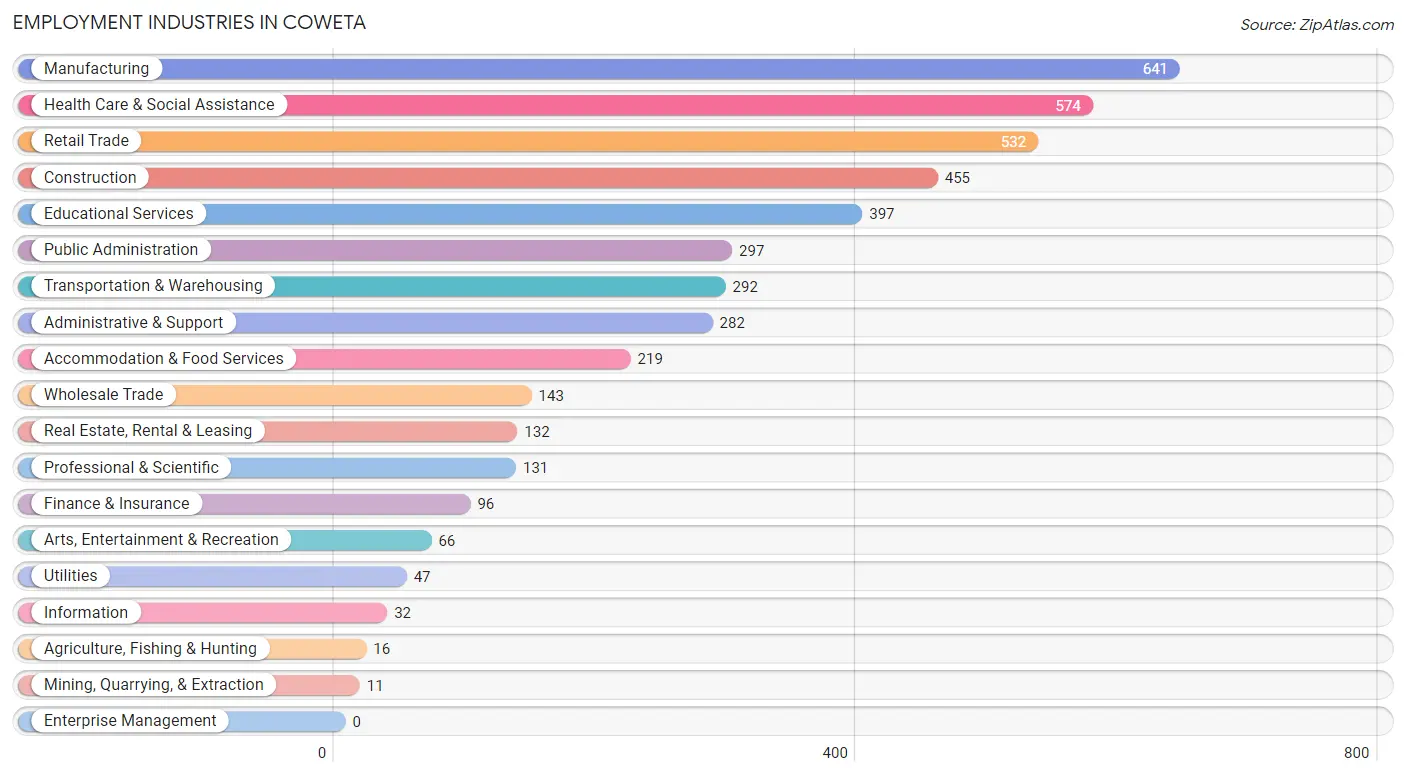
Employment Industries in Coweta
The major employment industries in Coweta include Manufacturing (641 | 14.1%), Health Care & Social Assistance (574 | 12.6%), Retail Trade (532 | 11.7%), Construction (455 | 10.0%), and Educational Services (397 | 8.7%).
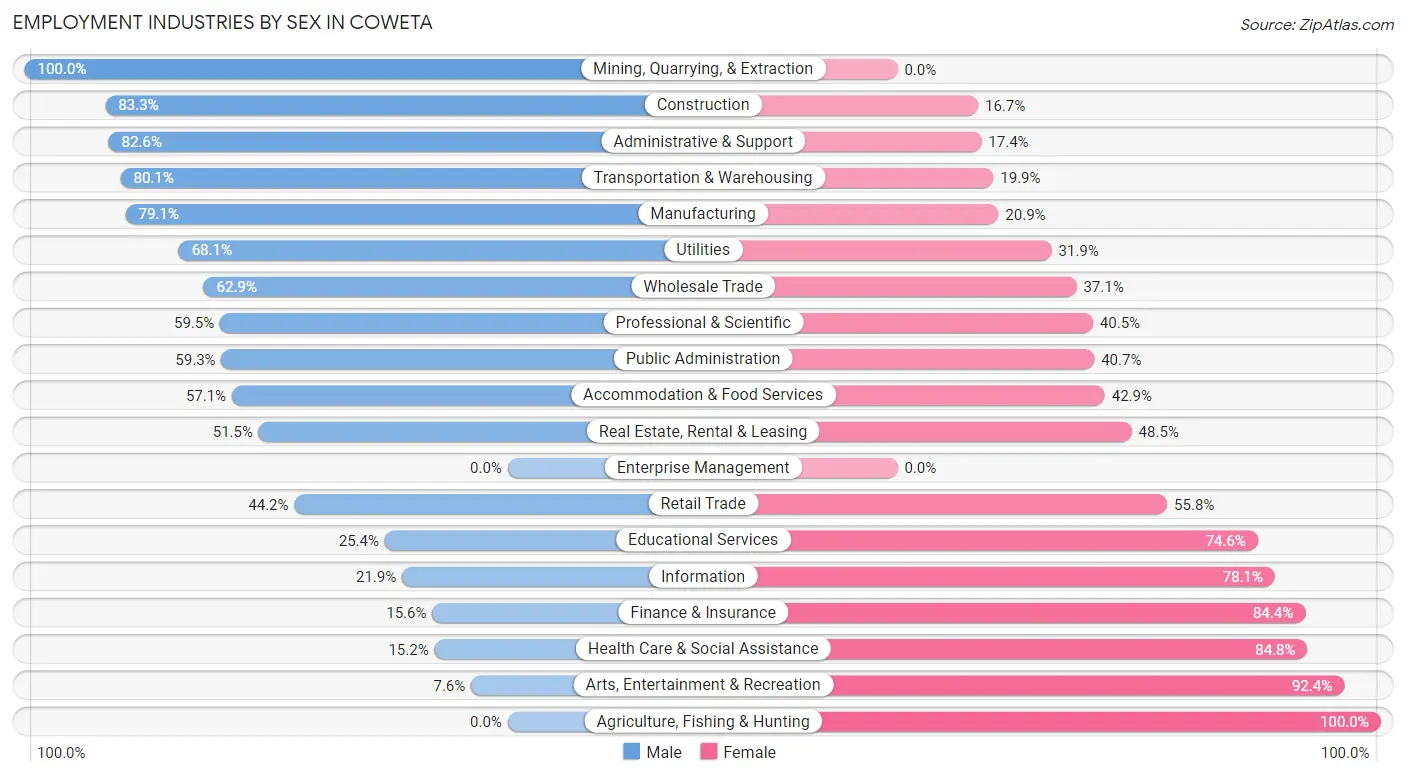
Employment Industries by Sex in Coweta
The Coweta industries that see more men than women are Mining, Quarrying, & Extraction (100.0%), Construction (83.3%), and Administrative & Support (82.6%), whereas the industries that tend to have a higher number of women are Agriculture, Fishing & Hunting (100.0%), Arts, Entertainment & Recreation (92.4%), and Health Care & Social Assistance (84.8%).
| Industry | Male | Female |
| Agriculture, Fishing & Hunting | 0 (0.0%) | 16 (100.0%) |
| Mining, Quarrying, & Extraction | 11 (100.0%) | 0 (0.0%) |
| Construction | 379 (83.3%) | 76 (16.7%) |
| Manufacturing | 507 (79.1%) | 134 (20.9%) |
| Wholesale Trade | 90 (62.9%) | 53 (37.1%) |
| Retail Trade | 235 (44.2%) | 297 (55.8%) |
| Transportation & Warehousing | 234 (80.1%) | 58 (19.9%) |
| Utilities | 32 (68.1%) | 15 (31.9%) |
| Information | 7 (21.9%) | 25 (78.1%) |
| Finance & Insurance | 15 (15.6%) | 81 (84.4%) |
| Real Estate, Rental & Leasing | 68 (51.5%) | 64 (48.5%) |
| Professional & Scientific | 78 (59.5%) | 53 (40.5%) |
| Enterprise Management | 0 (0.0%) | 0 (0.0%) |
| Administrative & Support | 233 (82.6%) | 49 (17.4%) |
| Educational Services | 101 (25.4%) | 296 (74.6%) |
| Health Care & Social Assistance | 87 (15.2%) | 487 (84.8%) |
| Arts, Entertainment & Recreation | 5 (7.6%) | 61 (92.4%) |
| Accommodation & Food Services | 125 (57.1%) | 94 (42.9%) |
| Public Administration | 176 (59.3%) | 121 (40.7%) |
| Total | 2,512 (55.1%) | 2,050 (44.9%) |
Education in Coweta
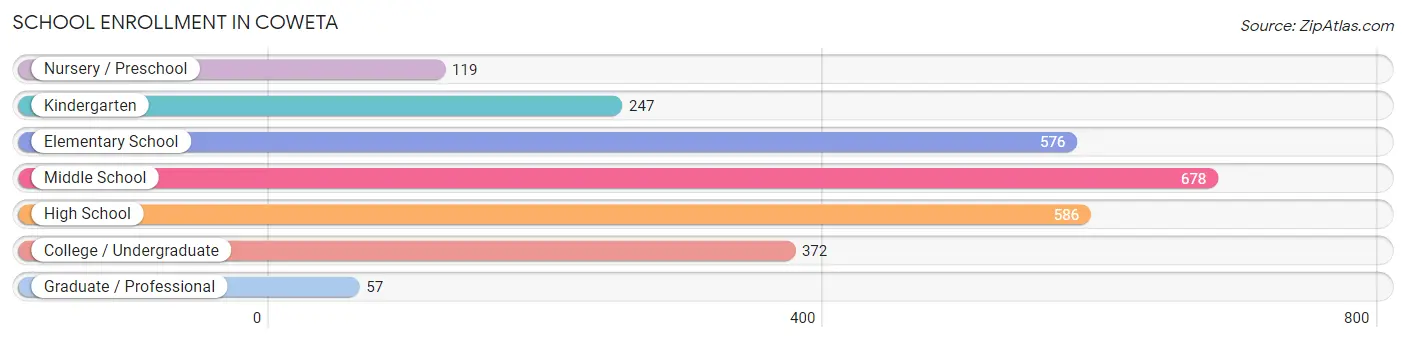
School Enrollment in Coweta
The most common levels of schooling among the 2,635 students in Coweta are middle school (678 | 25.7%), high school (586 | 22.2%), and elementary school (576 | 21.9%).
| School Level | # Students | % Students |
| Nursery / Preschool | 119 | 4.5% |
| Kindergarten | 247 | 9.4% |
| Elementary School | 576 | 21.9% |
| Middle School | 678 | 25.7% |
| High School | 586 | 22.2% |
| College / Undergraduate | 372 | 14.1% |
| Graduate / Professional | 57 | 2.2% |
| Total | 2,635 | 100.0% |
School Enrollment by Age by Funding Source in Coweta
Out of a total of 2,635 students who are enrolled in schools in Coweta, 232 (8.8%) attend a private institution, while the remaining 2,403 (91.2%) are enrolled in public schools. The age group of 20 to 24 year olds has the highest likelihood of being enrolled in private schools, with 46 (27.2% in the age bracket) enrolled. Conversely, the age group of 25 to 34 year olds has the lowest likelihood of being enrolled in a private school, with 129 (100.0% in the age bracket) attending a public institution.
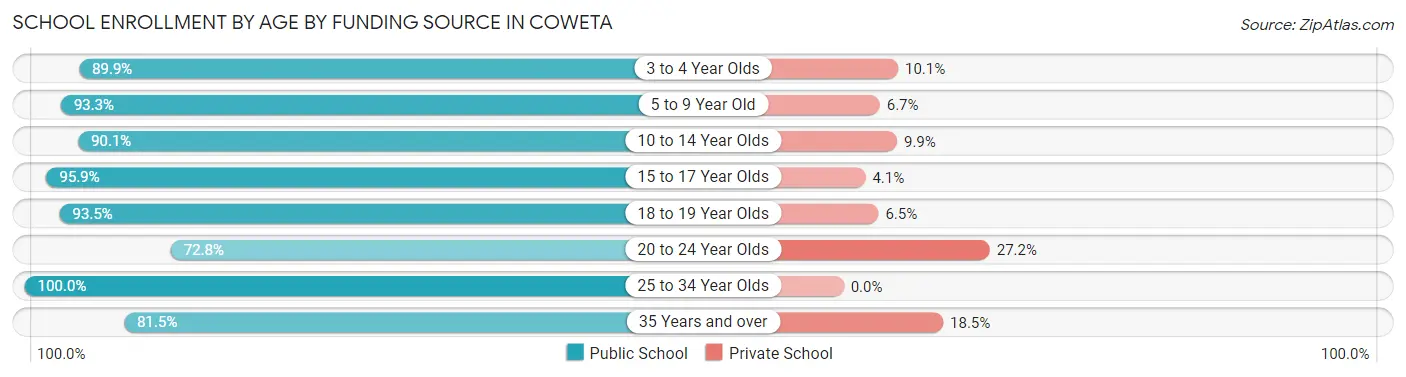
| Age Bracket | Public School | Private School |
| 3 to 4 Year Olds | 71 (89.9%) | 8 (10.1%) |
| 5 to 9 Year Old | 693 (93.3%) | 50 (6.7%) |
| 10 to 14 Year Olds | 707 (90.1%) | 78 (9.9%) |
| 15 to 17 Year Olds | 449 (95.9%) | 19 (4.1%) |
| 18 to 19 Year Olds | 144 (93.5%) | 10 (6.5%) |
| 20 to 24 Year Olds | 123 (72.8%) | 46 (27.2%) |
| 25 to 34 Year Olds | 129 (100.0%) | 0 (0.0%) |
| 35 Years and over | 88 (81.5%) | 20 (18.5%) |
| Total | 2,403 (91.2%) | 232 (8.8%) |
Educational Attainment by Field of Study in Coweta
Business (419 | 28.2%), arts & humanities (200 | 13.5%), education (192 | 12.9%), psychology (114 | 7.7%), and science & technology (112 | 7.5%) are the most common fields of study among 1,484 individuals in Coweta who have obtained a bachelor's degree or higher.
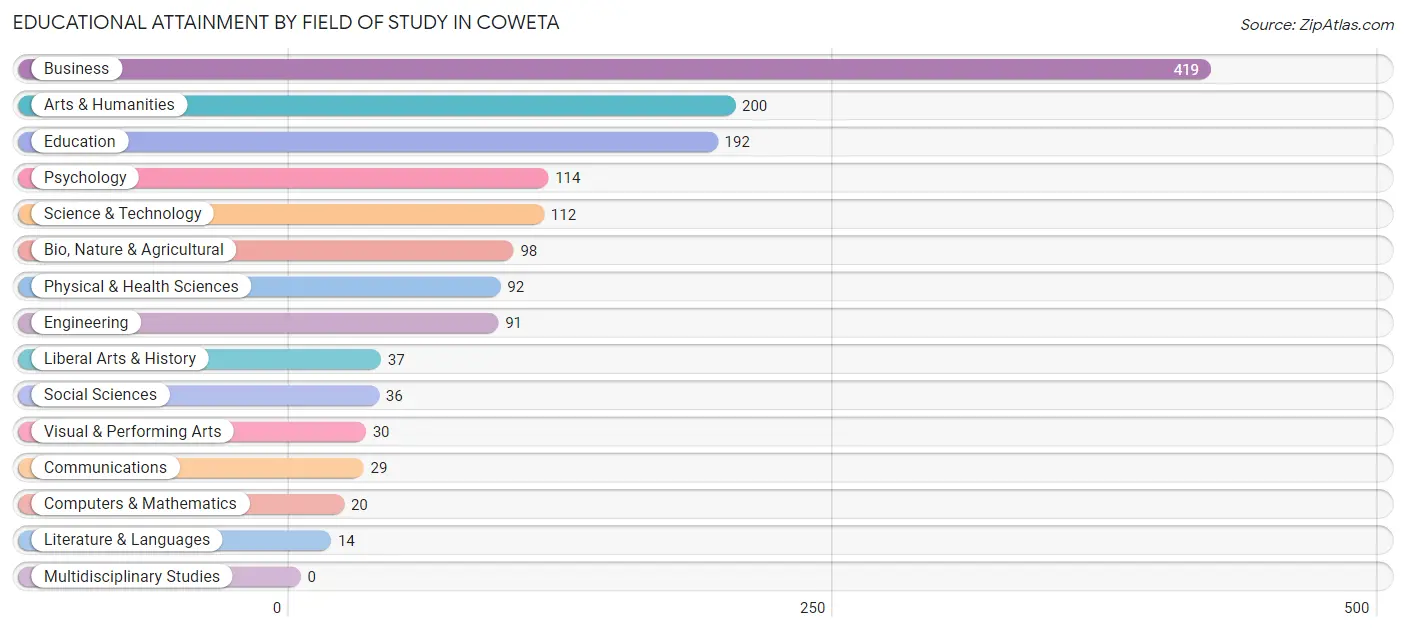
| Field of Study | # Graduates | % Graduates |
| Computers & Mathematics | 20 | 1.3% |
| Bio, Nature & Agricultural | 98 | 6.6% |
| Physical & Health Sciences | 92 | 6.2% |
| Psychology | 114 | 7.7% |
| Social Sciences | 36 | 2.4% |
| Engineering | 91 | 6.1% |
| Multidisciplinary Studies | 0 | 0.0% |
| Science & Technology | 112 | 7.5% |
| Business | 419 | 28.2% |
| Education | 192 | 12.9% |
| Literature & Languages | 14 | 0.9% |
| Liberal Arts & History | 37 | 2.5% |
| Visual & Performing Arts | 30 | 2.0% |
| Communications | 29 | 1.9% |
| Arts & Humanities | 200 | 13.5% |
| Total | 1,484 | 100.0% |
Transportation & Commute in Coweta
Vehicle Availability by Sex in Coweta
The most prevalent vehicle ownership categories in Coweta are males with 2 vehicles (1,066, accounting for 43.4%) and females with 2 vehicles (646, making up 53.4%).
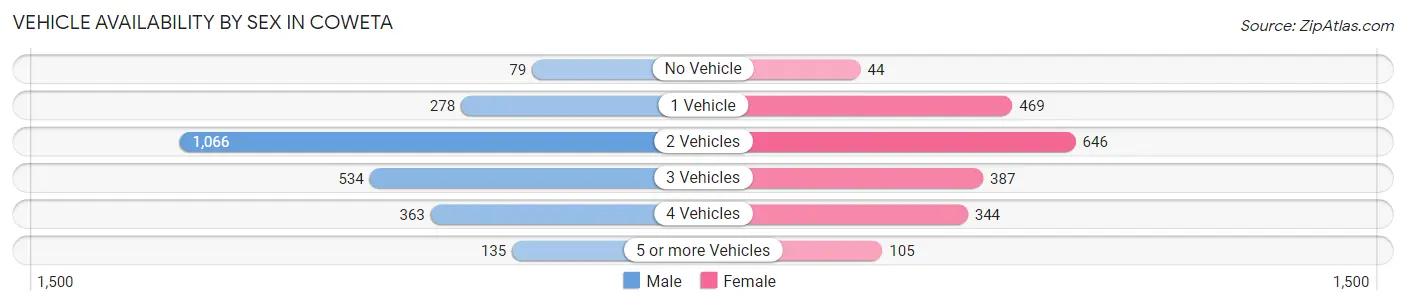
| Vehicles Available | Male | Female |
| No Vehicle | 79 (3.2%) | 44 (2.2%) |
| 1 Vehicle | 278 (11.3%) | 469 (23.5%) |
| 2 Vehicles | 1,066 (43.4%) | 646 (32.4%) |
| 3 Vehicles | 534 (21.7%) | 387 (19.4%) |
| 4 Vehicles | 363 (14.8%) | 344 (17.2%) |
| 5 or more Vehicles | 135 (5.5%) | 105 (5.3%) |
| Total | 2,455 (100.0%) | 1,995 (100.0%) |
Commute Time in Coweta
The most frequently occuring commute durations in Coweta are 30 to 34 minutes (1,089 commuters, 26.1%), 25 to 29 minutes (516 commuters, 12.4%), and 45 to 59 minutes (451 commuters, 10.8%).
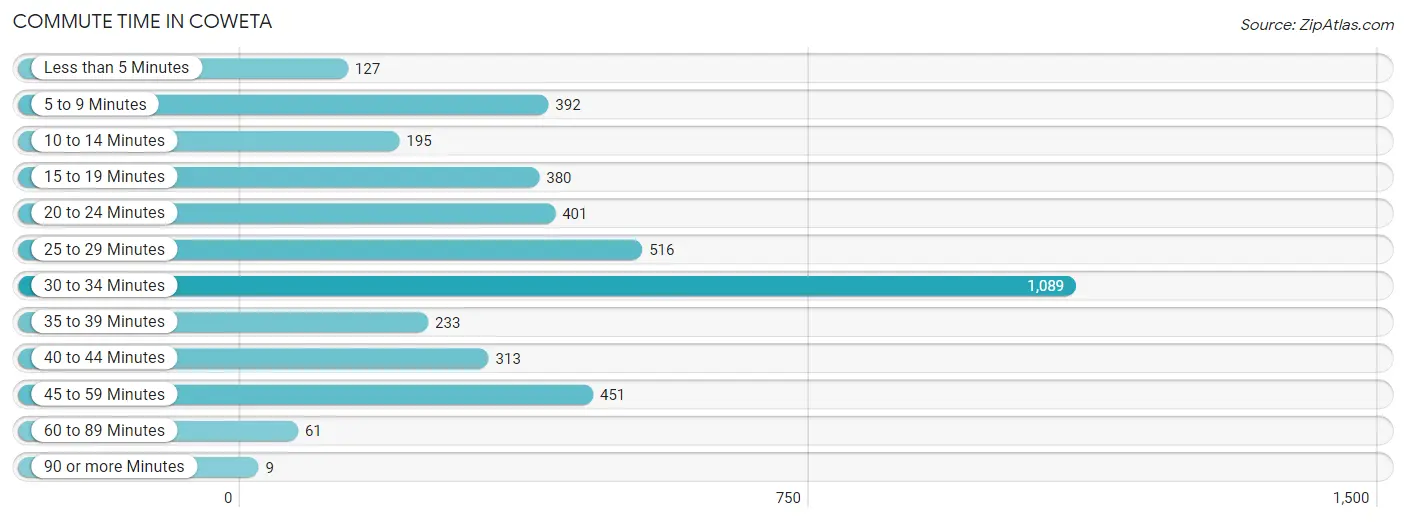
| Commute Time | # Commuters | % Commuters |
| Less than 5 Minutes | 127 | 3.0% |
| 5 to 9 Minutes | 392 | 9.4% |
| 10 to 14 Minutes | 195 | 4.7% |
| 15 to 19 Minutes | 380 | 9.1% |
| 20 to 24 Minutes | 401 | 9.6% |
| 25 to 29 Minutes | 516 | 12.4% |
| 30 to 34 Minutes | 1,089 | 26.1% |
| 35 to 39 Minutes | 233 | 5.6% |
| 40 to 44 Minutes | 313 | 7.5% |
| 45 to 59 Minutes | 451 | 10.8% |
| 60 to 89 Minutes | 61 | 1.5% |
| 90 or more Minutes | 9 | 0.2% |
Commute Time by Sex in Coweta
The most common commute times in Coweta are 30 to 34 minutes (530 commuters, 23.0%) for males and 30 to 34 minutes (559 commuters, 30.1%) for females.
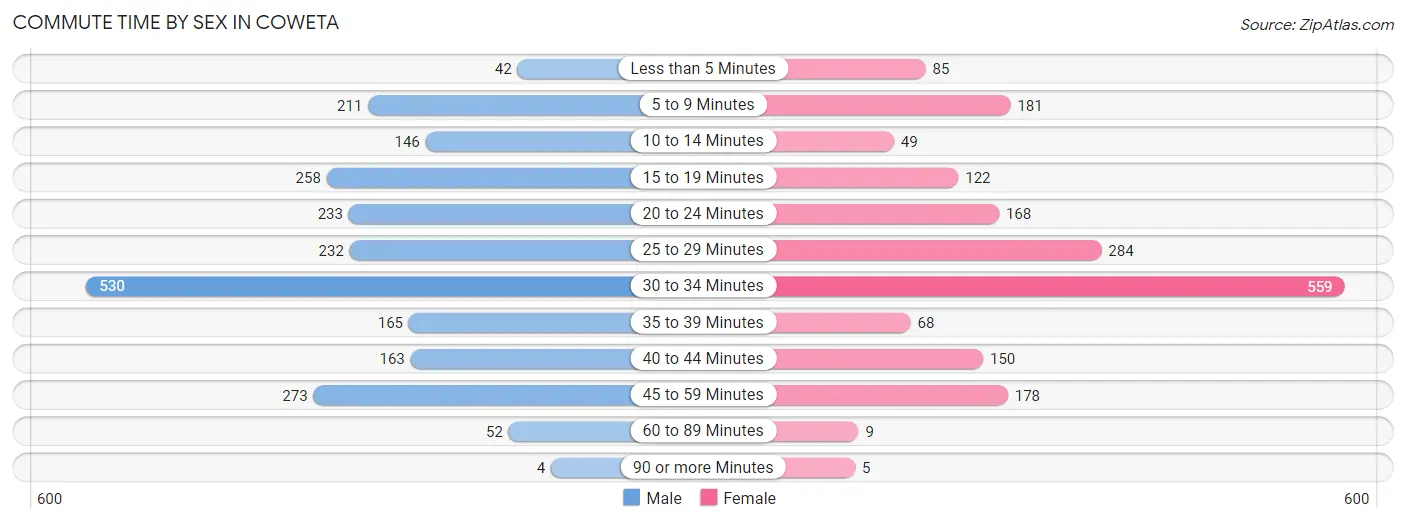
| Commute Time | Male | Female |
| Less than 5 Minutes | 42 (1.8%) | 85 (4.6%) |
| 5 to 9 Minutes | 211 (9.1%) | 181 (9.7%) |
| 10 to 14 Minutes | 146 (6.3%) | 49 (2.6%) |
| 15 to 19 Minutes | 258 (11.2%) | 122 (6.6%) |
| 20 to 24 Minutes | 233 (10.1%) | 168 (9.0%) |
| 25 to 29 Minutes | 232 (10.1%) | 284 (15.3%) |
| 30 to 34 Minutes | 530 (23.0%) | 559 (30.1%) |
| 35 to 39 Minutes | 165 (7.1%) | 68 (3.7%) |
| 40 to 44 Minutes | 163 (7.1%) | 150 (8.1%) |
| 45 to 59 Minutes | 273 (11.8%) | 178 (9.6%) |
| 60 to 89 Minutes | 52 (2.2%) | 9 (0.5%) |
| 90 or more Minutes | 4 (0.2%) | 5 (0.3%) |
Time of Departure to Work by Sex in Coweta
The most frequent times of departure to work in Coweta are 7:00 AM to 7:29 AM (445, 19.3%) for males and 7:00 AM to 7:29 AM (322, 17.3%) for females.
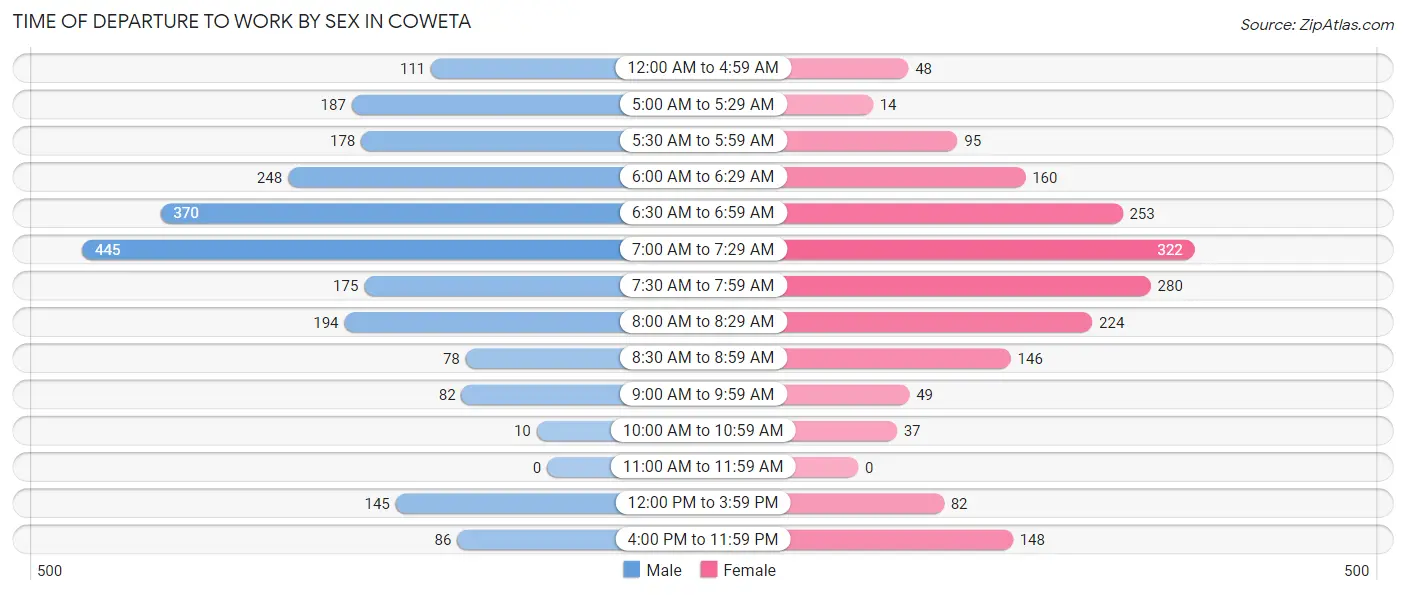
| Time of Departure | Male | Female |
| 12:00 AM to 4:59 AM | 111 (4.8%) | 48 (2.6%) |
| 5:00 AM to 5:29 AM | 187 (8.1%) | 14 (0.7%) |
| 5:30 AM to 5:59 AM | 178 (7.7%) | 95 (5.1%) |
| 6:00 AM to 6:29 AM | 248 (10.7%) | 160 (8.6%) |
| 6:30 AM to 6:59 AM | 370 (16.0%) | 253 (13.6%) |
| 7:00 AM to 7:29 AM | 445 (19.3%) | 322 (17.3%) |
| 7:30 AM to 7:59 AM | 175 (7.6%) | 280 (15.1%) |
| 8:00 AM to 8:29 AM | 194 (8.4%) | 224 (12.1%) |
| 8:30 AM to 8:59 AM | 78 (3.4%) | 146 (7.9%) |
| 9:00 AM to 9:59 AM | 82 (3.5%) | 49 (2.6%) |
| 10:00 AM to 10:59 AM | 10 (0.4%) | 37 (2.0%) |
| 11:00 AM to 11:59 AM | 0 (0.0%) | 0 (0.0%) |
| 12:00 PM to 3:59 PM | 145 (6.3%) | 82 (4.4%) |
| 4:00 PM to 11:59 PM | 86 (3.7%) | 148 (8.0%) |
| Total | 2,309 (100.0%) | 1,858 (100.0%) |
Housing Occupancy in Coweta
Occupancy by Ownership in Coweta
Of the total 3,683 dwellings in Coweta, owner-occupied units account for 2,582 (70.1%), while renter-occupied units make up 1,101 (29.9%).
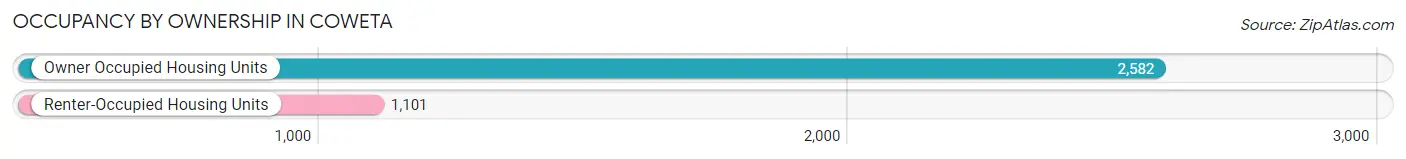
| Occupancy | # Housing Units | % Housing Units |
| Owner Occupied Housing Units | 2,582 | 70.1% |
| Renter-Occupied Housing Units | 1,101 | 29.9% |
| Total Occupied Housing Units | 3,683 | 100.0% |
Occupancy by Household Size in Coweta
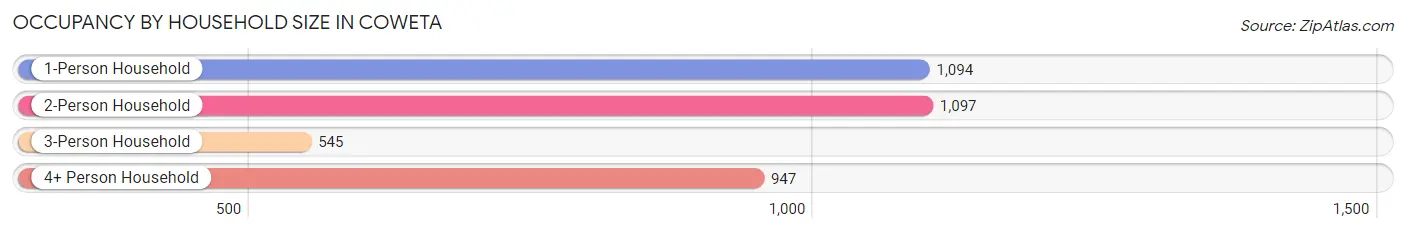
| Household Size | # Housing Units | % Housing Units |
| 1-Person Household | 1,094 | 29.7% |
| 2-Person Household | 1,097 | 29.8% |
| 3-Person Household | 545 | 14.8% |
| 4+ Person Household | 947 | 25.7% |
| Total Housing Units | 3,683 | 100.0% |
Occupancy by Ownership by Household Size in Coweta
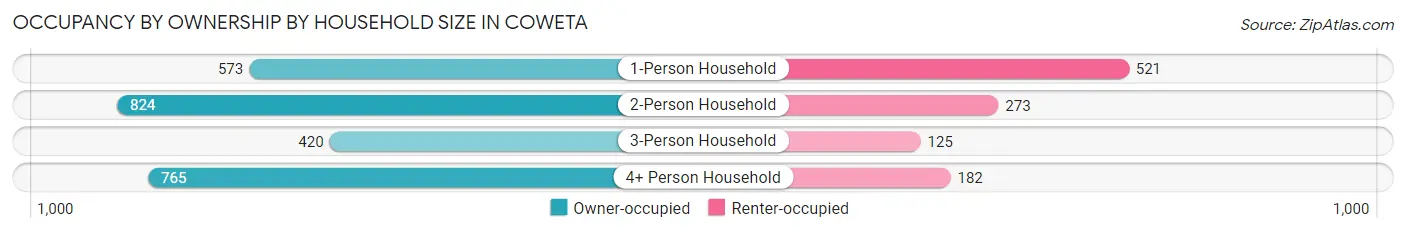
| Household Size | Owner-occupied | Renter-occupied |
| 1-Person Household | 573 (52.4%) | 521 (47.6%) |
| 2-Person Household | 824 (75.1%) | 273 (24.9%) |
| 3-Person Household | 420 (77.1%) | 125 (22.9%) |
| 4+ Person Household | 765 (80.8%) | 182 (19.2%) |
| Total Housing Units | 2,582 (70.1%) | 1,101 (29.9%) |
Occupancy by Educational Attainment in Coweta
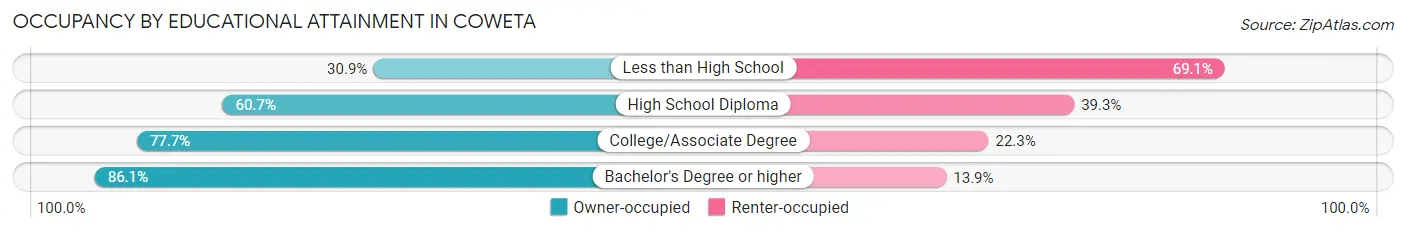
| Household Size | Owner-occupied | Renter-occupied |
| Less than High School | 97 (30.9%) | 217 (69.1%) |
| High School Diploma | 735 (60.7%) | 475 (39.3%) |
| College/Associate Degree | 1,008 (77.7%) | 289 (22.3%) |
| Bachelor's Degree or higher | 742 (86.1%) | 120 (13.9%) |
Occupancy by Age of Householder in Coweta
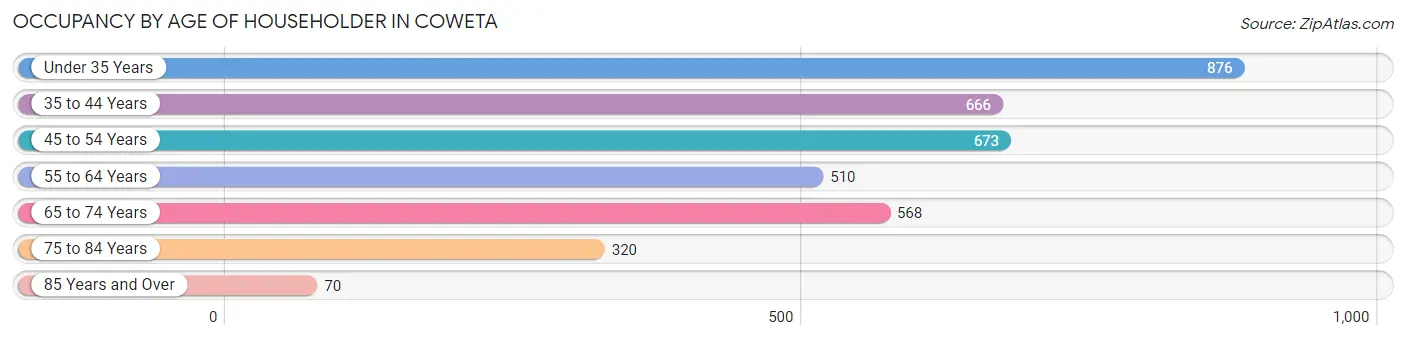
| Age Bracket | # Households | % Households |
| Under 35 Years | 876 | 23.8% |
| 35 to 44 Years | 666 | 18.1% |
| 45 to 54 Years | 673 | 18.3% |
| 55 to 64 Years | 510 | 13.9% |
| 65 to 74 Years | 568 | 15.4% |
| 75 to 84 Years | 320 | 8.7% |
| 85 Years and Over | 70 | 1.9% |
| Total | 3,683 | 100.0% |
Housing Finances in Coweta
Median Income by Occupancy in Coweta
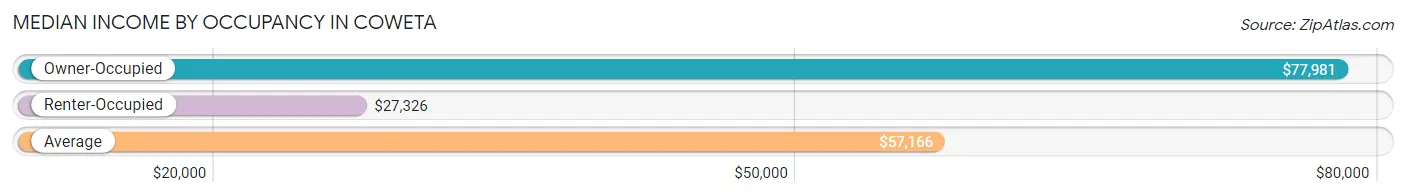
| Occupancy Type | # Households | Median Income |
| Owner-Occupied | 2,582 (70.1%) | $77,981 |
| Renter-Occupied | 1,101 (29.9%) | $27,326 |
| Average | 3,683 (100.0%) | $57,166 |
Occupancy by Householder Income Bracket in Coweta
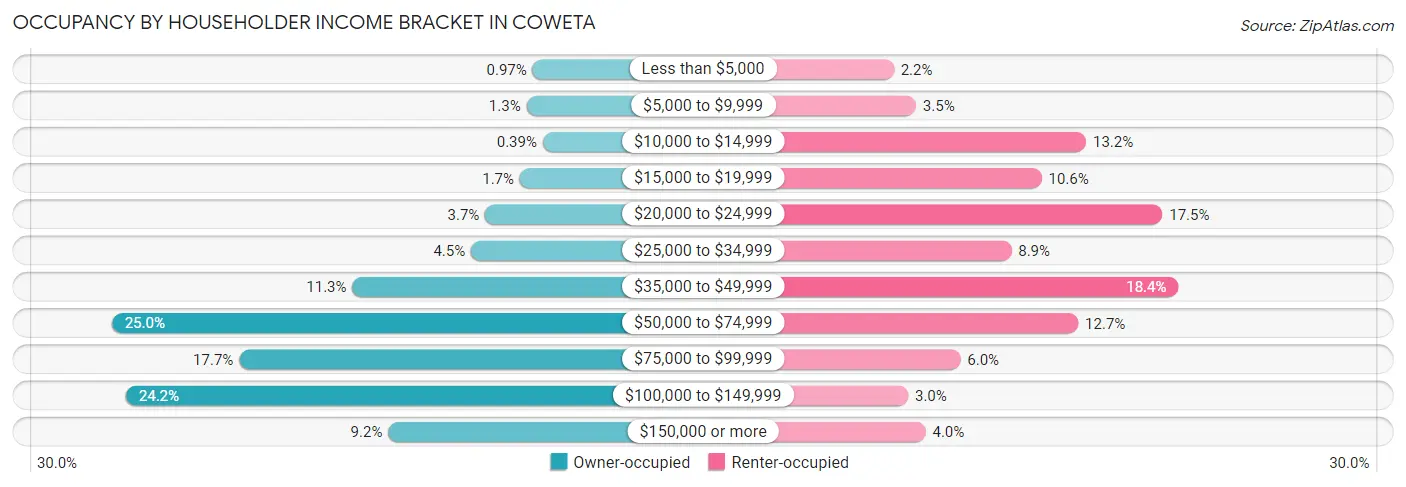
| Income Bracket | Owner-occupied | Renter-occupied |
| Less than $5,000 | 25 (1.0%) | 24 (2.2%) |
| $5,000 to $9,999 | 34 (1.3%) | 38 (3.5%) |
| $10,000 to $14,999 | 10 (0.4%) | 145 (13.2%) |
| $15,000 to $19,999 | 44 (1.7%) | 117 (10.6%) |
| $20,000 to $24,999 | 95 (3.7%) | 193 (17.5%) |
| $25,000 to $34,999 | 116 (4.5%) | 98 (8.9%) |
| $35,000 to $49,999 | 291 (11.3%) | 203 (18.4%) |
| $50,000 to $74,999 | 646 (25.0%) | 140 (12.7%) |
| $75,000 to $99,999 | 458 (17.7%) | 66 (6.0%) |
| $100,000 to $149,999 | 625 (24.2%) | 33 (3.0%) |
| $150,000 or more | 238 (9.2%) | 44 (4.0%) |
| Total | 2,582 (100.0%) | 1,101 (100.0%) |
Monthly Housing Cost Tiers in Coweta
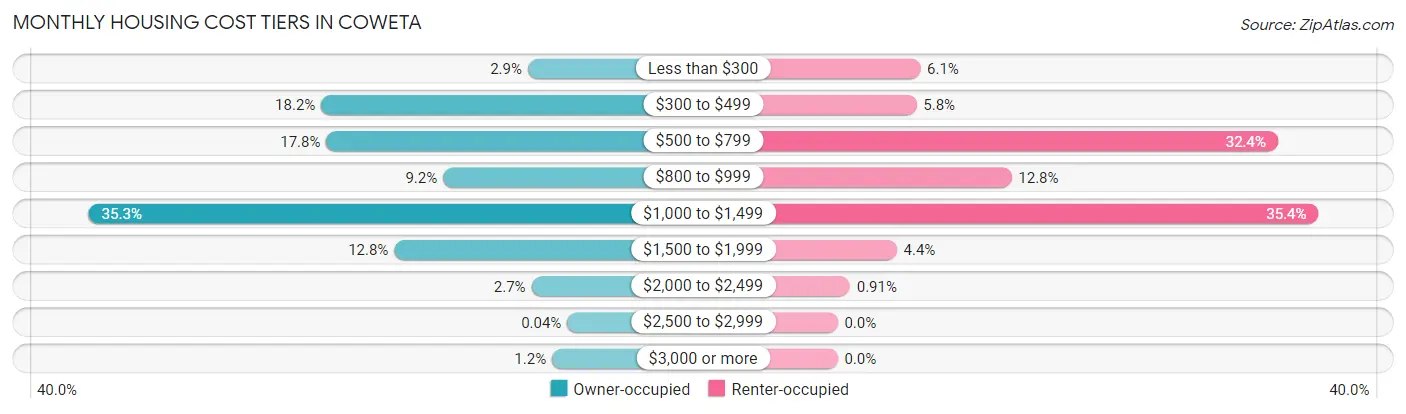
| Monthly Cost | Owner-occupied | Renter-occupied |
| Less than $300 | 76 (2.9%) | 67 (6.1%) |
| $300 to $499 | 469 (18.2%) | 64 (5.8%) |
| $500 to $799 | 459 (17.8%) | 357 (32.4%) |
| $800 to $999 | 237 (9.2%) | 141 (12.8%) |
| $1,000 to $1,499 | 911 (35.3%) | 390 (35.4%) |
| $1,500 to $1,999 | 330 (12.8%) | 48 (4.4%) |
| $2,000 to $2,499 | 69 (2.7%) | 10 (0.9%) |
| $2,500 to $2,999 | 1 (0.0%) | 0 (0.0%) |
| $3,000 or more | 30 (1.2%) | 0 (0.0%) |
| Total | 2,582 (100.0%) | 1,101 (100.0%) |
Physical Housing Characteristics in Coweta
Housing Structures in Coweta
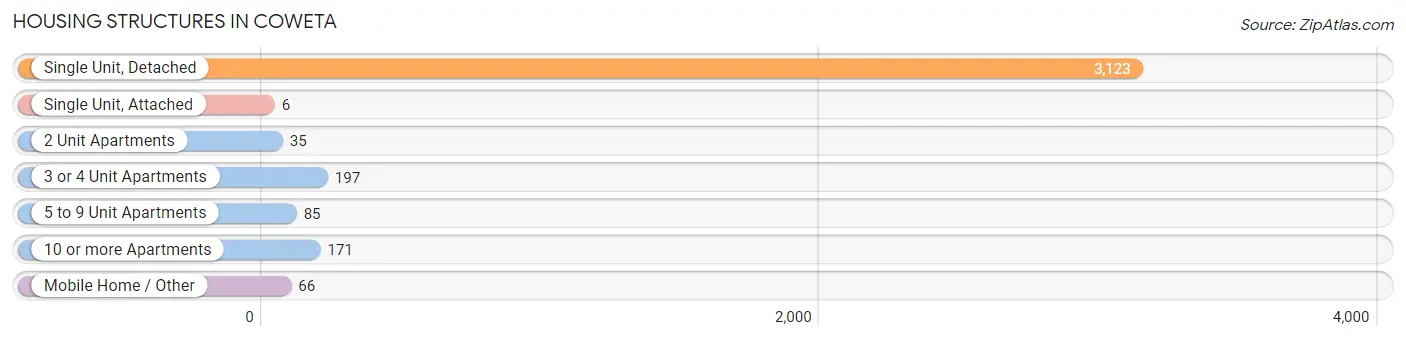
| Structure Type | # Housing Units | % Housing Units |
| Single Unit, Detached | 3,123 | 84.8% |
| Single Unit, Attached | 6 | 0.2% |
| 2 Unit Apartments | 35 | 0.9% |
| 3 or 4 Unit Apartments | 197 | 5.3% |
| 5 to 9 Unit Apartments | 85 | 2.3% |
| 10 or more Apartments | 171 | 4.6% |
| Mobile Home / Other | 66 | 1.8% |
| Total | 3,683 | 100.0% |
Housing Structures by Occupancy in Coweta
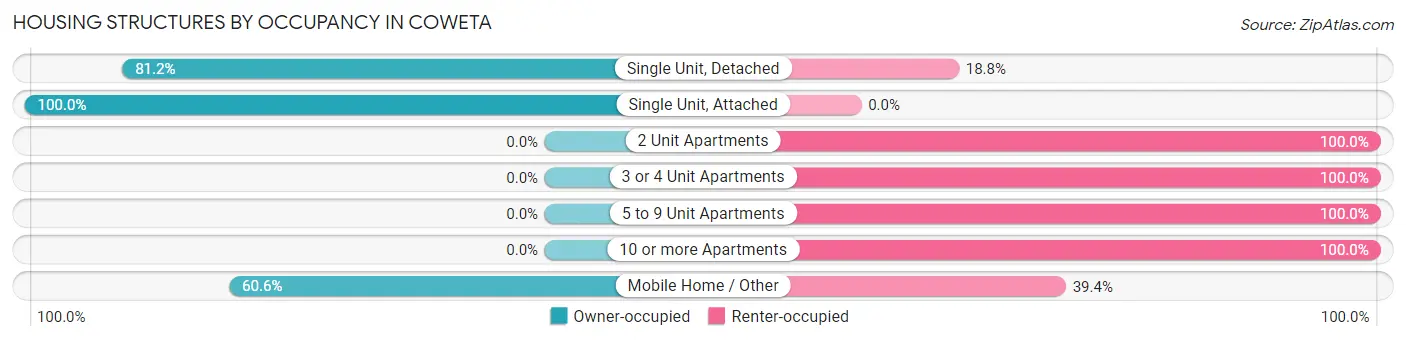
| Structure Type | Owner-occupied | Renter-occupied |
| Single Unit, Detached | 2,536 (81.2%) | 587 (18.8%) |
| Single Unit, Attached | 6 (100.0%) | 0 (0.0%) |
| 2 Unit Apartments | 0 (0.0%) | 35 (100.0%) |
| 3 or 4 Unit Apartments | 0 (0.0%) | 197 (100.0%) |
| 5 to 9 Unit Apartments | 0 (0.0%) | 85 (100.0%) |
| 10 or more Apartments | 0 (0.0%) | 171 (100.0%) |
| Mobile Home / Other | 40 (60.6%) | 26 (39.4%) |
| Total | 2,582 (70.1%) | 1,101 (29.9%) |
Housing Structures by Number of Rooms in Coweta
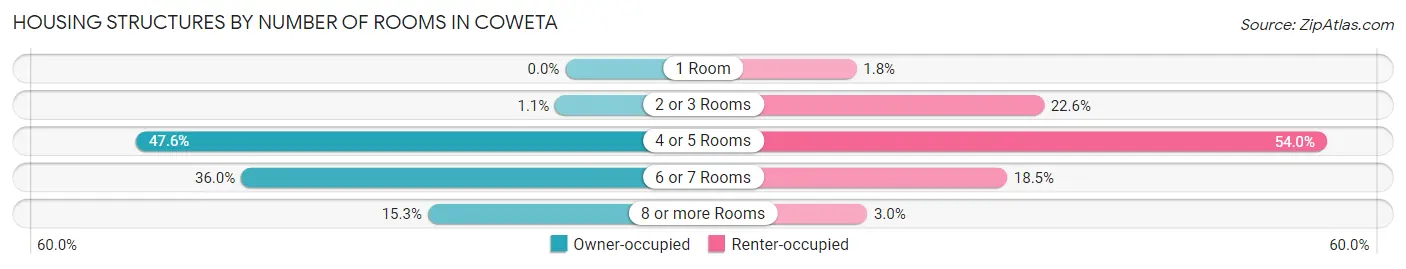
| Number of Rooms | Owner-occupied | Renter-occupied |
| 1 Room | 0 (0.0%) | 20 (1.8%) |
| 2 or 3 Rooms | 29 (1.1%) | 249 (22.6%) |
| 4 or 5 Rooms | 1,230 (47.6%) | 595 (54.0%) |
| 6 or 7 Rooms | 929 (36.0%) | 204 (18.5%) |
| 8 or more Rooms | 394 (15.3%) | 33 (3.0%) |
| Total | 2,582 (100.0%) | 1,101 (100.0%) |
Housing Structure by Heating Type in Coweta
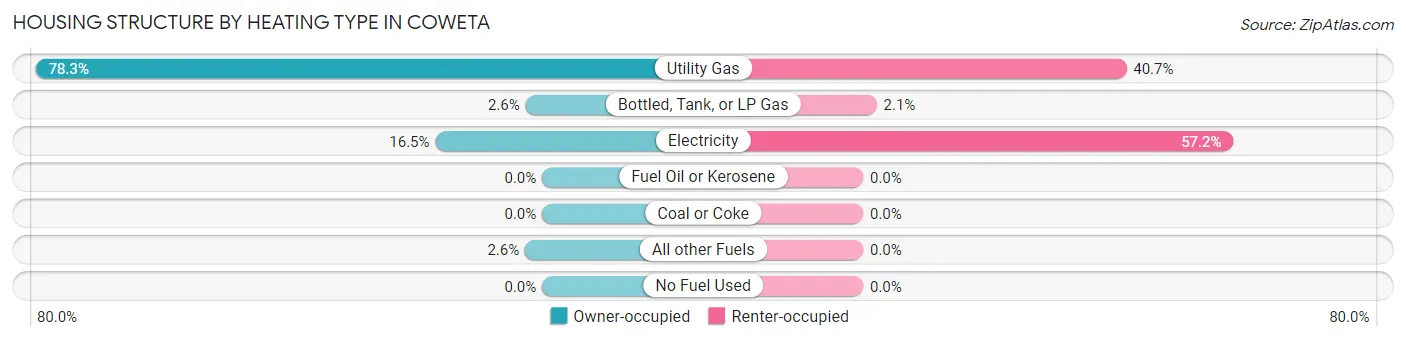
| Heating Type | Owner-occupied | Renter-occupied |
| Utility Gas | 2,022 (78.3%) | 448 (40.7%) |
| Bottled, Tank, or LP Gas | 66 (2.6%) | 23 (2.1%) |
| Electricity | 426 (16.5%) | 630 (57.2%) |
| Fuel Oil or Kerosene | 0 (0.0%) | 0 (0.0%) |
| Coal or Coke | 0 (0.0%) | 0 (0.0%) |
| All other Fuels | 68 (2.6%) | 0 (0.0%) |
| No Fuel Used | 0 (0.0%) | 0 (0.0%) |
| Total | 2,582 (100.0%) | 1,101 (100.0%) |
Household Vehicle Usage in Coweta
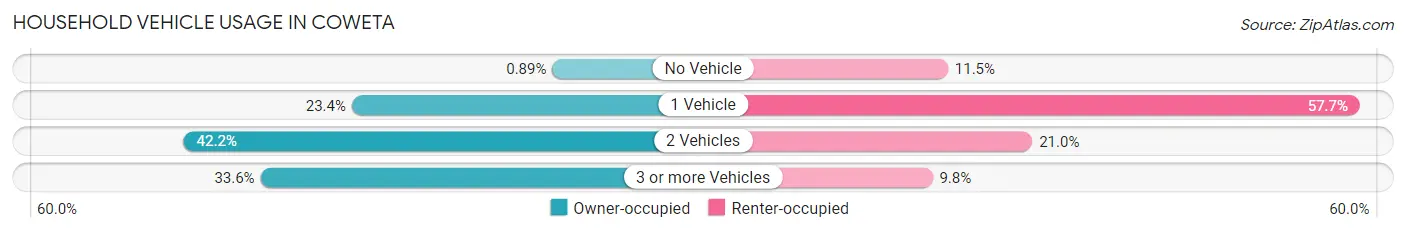
| Vehicles per Household | Owner-occupied | Renter-occupied |
| No Vehicle | 23 (0.9%) | 127 (11.5%) |
| 1 Vehicle | 603 (23.4%) | 635 (57.7%) |
| 2 Vehicles | 1,089 (42.2%) | 231 (21.0%) |
| 3 or more Vehicles | 867 (33.6%) | 108 (9.8%) |
| Total | 2,582 (100.0%) | 1,101 (100.0%) |
Real Estate & Mortgages in Coweta
Real Estate and Mortgage Overview in Coweta
| Characteristic | Without Mortgage | With Mortgage |
| Housing Units | 842 | 1,740 |
| Median Property Value | $155,400 | $169,500 |
| Median Household Income | $52,416 | $203 |
| Monthly Housing Costs | $458 | $30 |
| Real Estate Taxes | $1,224 | $82 |
Property Value by Mortgage Status in Coweta
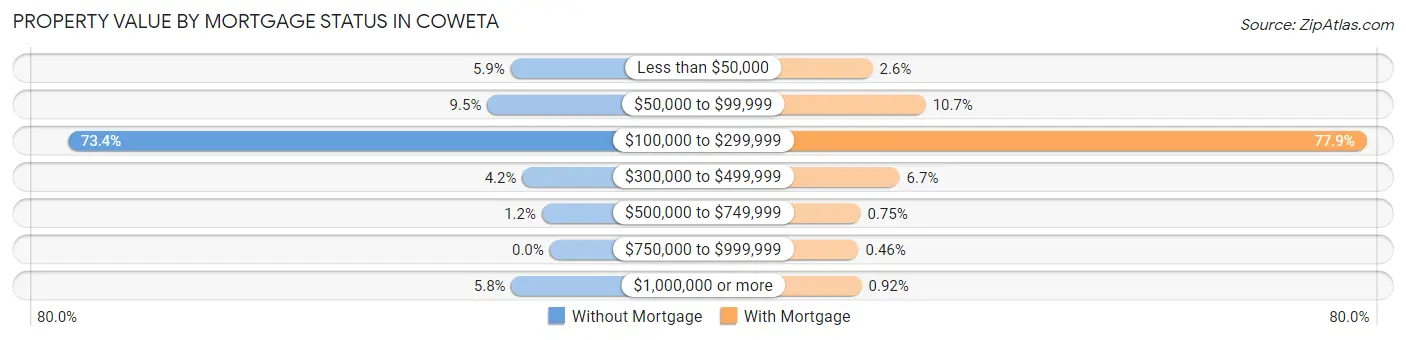
| Property Value | Without Mortgage | With Mortgage |
| Less than $50,000 | 50 (5.9%) | 45 (2.6%) |
| $50,000 to $99,999 | 80 (9.5%) | 186 (10.7%) |
| $100,000 to $299,999 | 618 (73.4%) | 1,355 (77.9%) |
| $300,000 to $499,999 | 35 (4.2%) | 117 (6.7%) |
| $500,000 to $749,999 | 10 (1.2%) | 13 (0.7%) |
| $750,000 to $999,999 | 0 (0.0%) | 8 (0.5%) |
| $1,000,000 or more | 49 (5.8%) | 16 (0.9%) |
| Total | 842 (100.0%) | 1,740 (100.0%) |
Household Income by Mortgage Status in Coweta
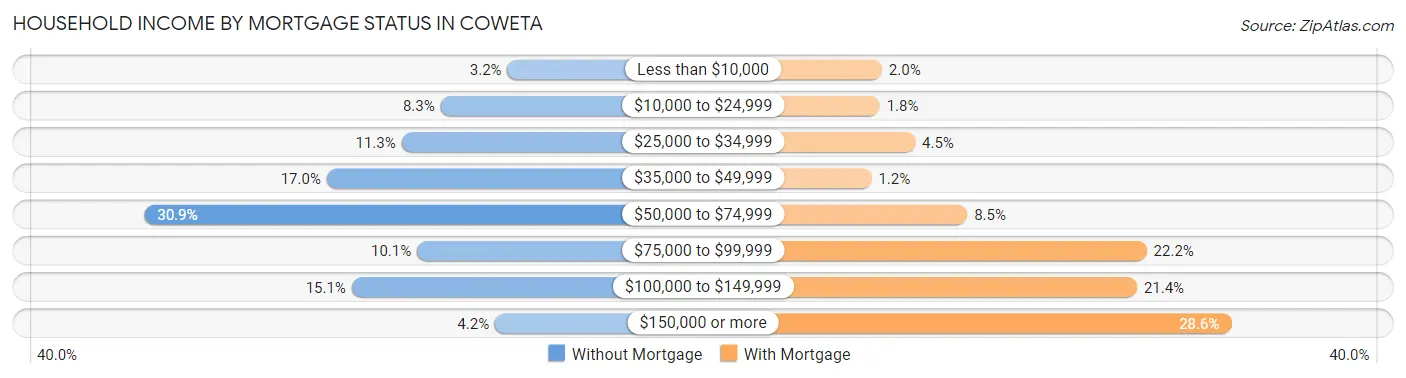
| Household Income | Without Mortgage | With Mortgage |
| Less than $10,000 | 27 (3.2%) | 35 (2.0%) |
| $10,000 to $24,999 | 70 (8.3%) | 32 (1.8%) |
| $25,000 to $34,999 | 95 (11.3%) | 79 (4.5%) |
| $35,000 to $49,999 | 143 (17.0%) | 21 (1.2%) |
| $50,000 to $74,999 | 260 (30.9%) | 148 (8.5%) |
| $75,000 to $99,999 | 85 (10.1%) | 386 (22.2%) |
| $100,000 to $149,999 | 127 (15.1%) | 373 (21.4%) |
| $150,000 or more | 35 (4.2%) | 498 (28.6%) |
| Total | 842 (100.0%) | 1,740 (100.0%) |
Property Value to Household Income Ratio in Coweta
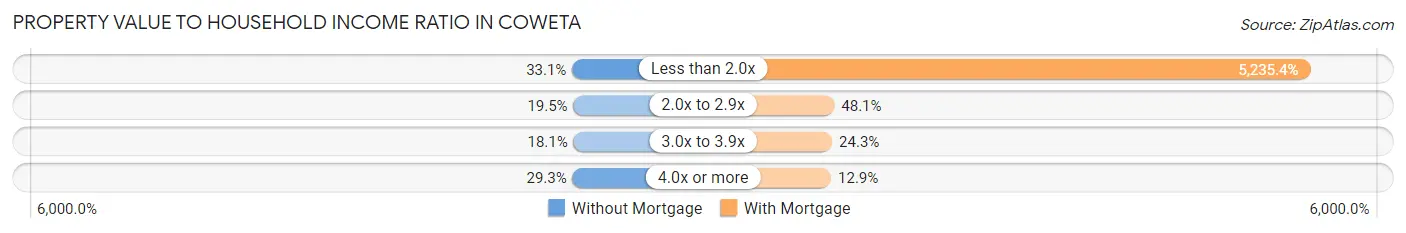
| Value-to-Income Ratio | Without Mortgage | With Mortgage |
| Less than 2.0x | 279 (33.1%) | 91,096 (5,235.4%) |
| 2.0x to 2.9x | 164 (19.5%) | 837 (48.1%) |
| 3.0x to 3.9x | 152 (18.0%) | 423 (24.3%) |
| 4.0x or more | 247 (29.3%) | 225 (12.9%) |
| Total | 842 (100.0%) | 1,740 (100.0%) |
Real Estate Taxes by Mortgage Status in Coweta
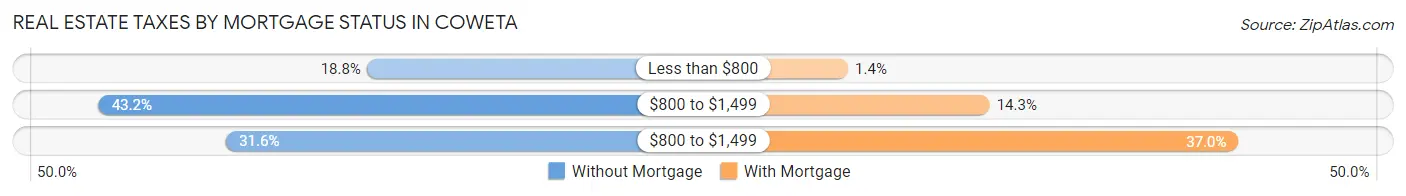
| Property Taxes | Without Mortgage | With Mortgage |
| Less than $800 | 158 (18.8%) | 24 (1.4%) |
| $800 to $1,499 | 364 (43.2%) | 249 (14.3%) |
| $800 to $1,499 | 266 (31.6%) | 644 (37.0%) |
| Total | 842 (100.0%) | 1,740 (100.0%) |
Health & Disability in Coweta
Health Insurance Coverage by Age in Coweta
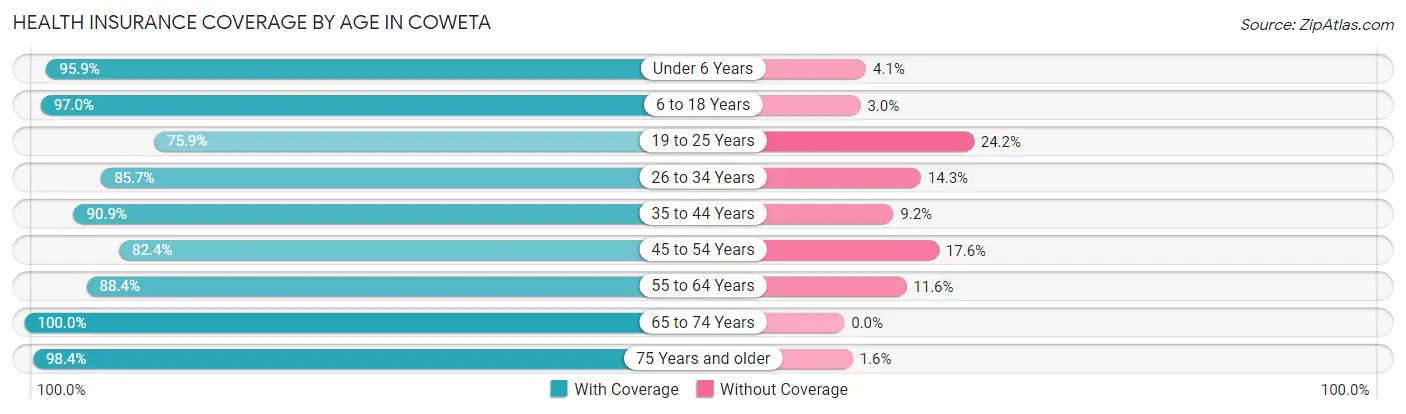
| Age Bracket | With Coverage | Without Coverage |
| Under 6 Years | 825 (95.9%) | 35 (4.1%) |
| 6 to 18 Years | 2,028 (97.0%) | 63 (3.0%) |
| 19 to 25 Years | 581 (75.8%) | 185 (24.1%) |
| 26 to 34 Years | 1,146 (85.7%) | 191 (14.3%) |
| 35 to 44 Years | 1,251 (90.8%) | 126 (9.1%) |
| 45 to 54 Years | 957 (82.4%) | 205 (17.6%) |
| 55 to 64 Years | 757 (88.4%) | 99 (11.6%) |
| 65 to 74 Years | 801 (100.0%) | 0 (0.0%) |
| 75 Years and older | 566 (98.4%) | 9 (1.6%) |
| Total | 8,912 (90.7%) | 913 (9.3%) |
Health Insurance Coverage by Citizenship Status in Coweta
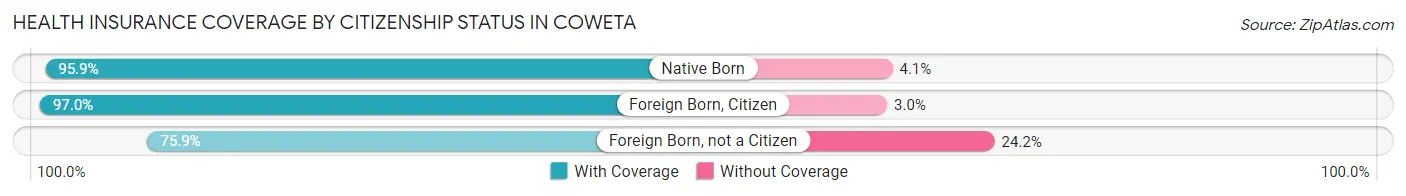
| Citizenship Status | With Coverage | Without Coverage |
| Native Born | 825 (95.9%) | 35 (4.1%) |
| Foreign Born, Citizen | 2,028 (97.0%) | 63 (3.0%) |
| Foreign Born, not a Citizen | 581 (75.8%) | 185 (24.1%) |
Health Insurance Coverage by Household Income in Coweta
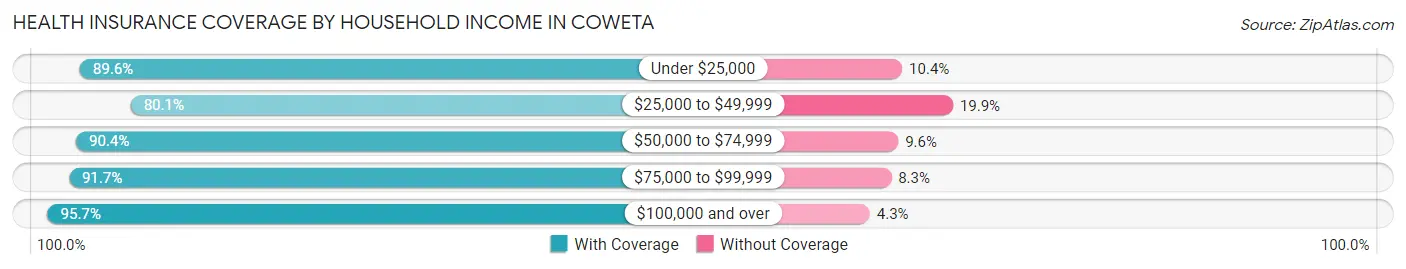
| Household Income | With Coverage | Without Coverage |
| Under $25,000 | 1,003 (89.6%) | 116 (10.4%) |
| $25,000 to $49,999 | 1,273 (80.1%) | 316 (19.9%) |
| $50,000 to $74,999 | 1,932 (90.4%) | 206 (9.6%) |
| $75,000 to $99,999 | 1,377 (91.7%) | 125 (8.3%) |
| $100,000 and over | 3,321 (95.7%) | 150 (4.3%) |
Public vs Private Health Insurance Coverage by Age in Coweta
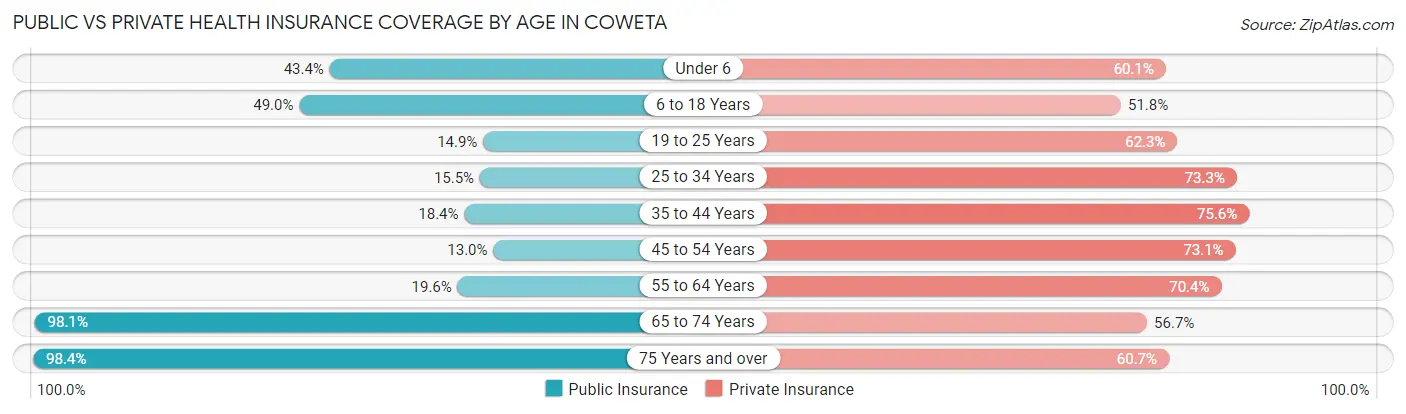
| Age Bracket | Public Insurance | Private Insurance |
| Under 6 | 373 (43.4%) | 517 (60.1%) |
| 6 to 18 Years | 1,025 (49.0%) | 1,084 (51.8%) |
| 19 to 25 Years | 114 (14.9%) | 477 (62.3%) |
| 25 to 34 Years | 207 (15.5%) | 980 (73.3%) |
| 35 to 44 Years | 253 (18.4%) | 1,041 (75.6%) |
| 45 to 54 Years | 151 (13.0%) | 849 (73.1%) |
| 55 to 64 Years | 168 (19.6%) | 603 (70.4%) |
| 65 to 74 Years | 786 (98.1%) | 454 (56.7%) |
| 75 Years and over | 566 (98.4%) | 349 (60.7%) |
| Total | 3,643 (37.1%) | 6,354 (64.7%) |
Disability Status by Sex by Age in Coweta
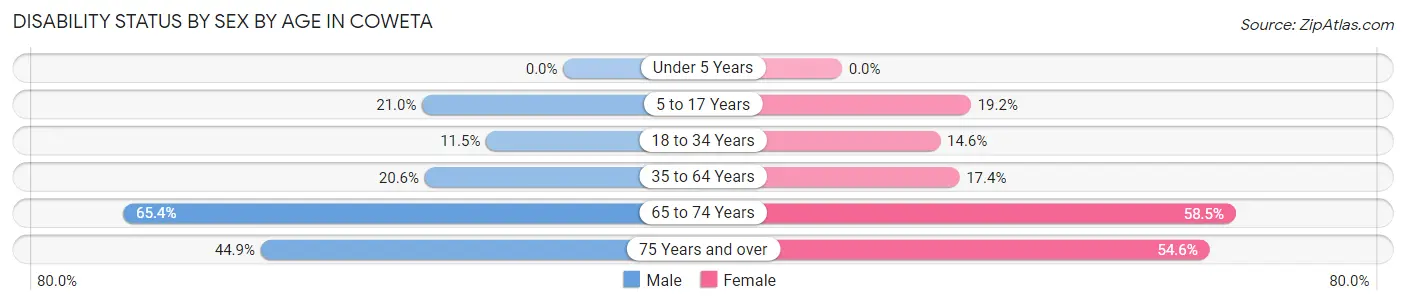
| Age Bracket | Male | Female |
| Under 5 Years | 0 (0.0%) | 0 (0.0%) |
| 5 to 17 Years | 255 (20.9%) | 158 (19.2%) |
| 18 to 34 Years | 137 (11.5%) | 161 (14.6%) |
| 35 to 64 Years | 329 (20.6%) | 313 (17.4%) |
| 65 to 74 Years | 289 (65.4%) | 210 (58.5%) |
| 75 Years and over | 102 (44.9%) | 190 (54.6%) |
Disability Class by Sex by Age in Coweta
Disability Class: Hearing Difficulty
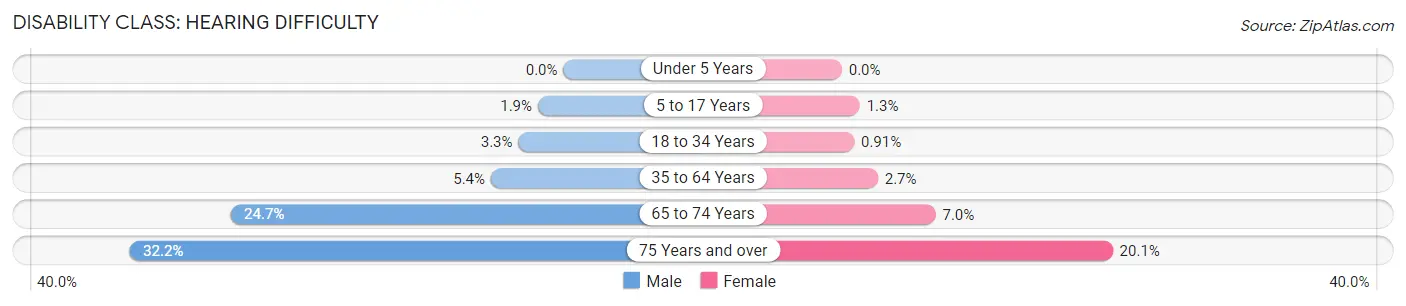
| Age Bracket | Male | Female |
| Under 5 Years | 0 (0.0%) | 0 (0.0%) |
| 5 to 17 Years | 23 (1.9%) | 11 (1.3%) |
| 18 to 34 Years | 40 (3.3%) | 10 (0.9%) |
| 35 to 64 Years | 86 (5.4%) | 48 (2.7%) |
| 65 to 74 Years | 109 (24.7%) | 25 (7.0%) |
| 75 Years and over | 73 (32.2%) | 70 (20.1%) |
Disability Class: Vision Difficulty
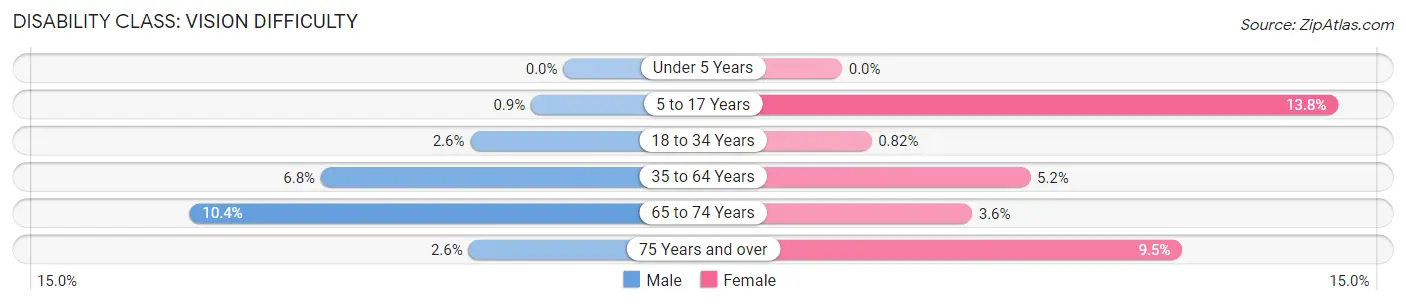
| Age Bracket | Male | Female |
| Under 5 Years | 0 (0.0%) | 0 (0.0%) |
| 5 to 17 Years | 11 (0.9%) | 114 (13.8%) |
| 18 to 34 Years | 31 (2.6%) | 9 (0.8%) |
| 35 to 64 Years | 108 (6.8%) | 94 (5.2%) |
| 65 to 74 Years | 46 (10.4%) | 13 (3.6%) |
| 75 Years and over | 6 (2.6%) | 33 (9.5%) |
Disability Class: Cognitive Difficulty
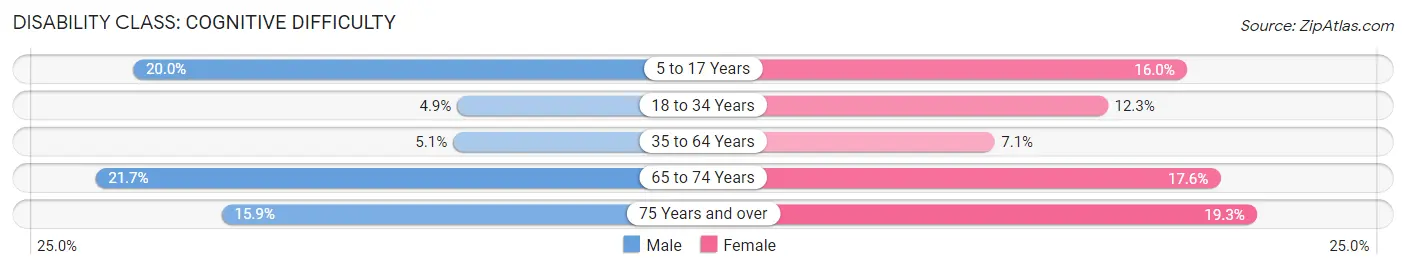
| Age Bracket | Male | Female |
| 5 to 17 Years | 243 (20.0%) | 132 (16.0%) |
| 18 to 34 Years | 59 (4.9%) | 136 (12.3%) |
| 35 to 64 Years | 82 (5.1%) | 127 (7.1%) |
| 65 to 74 Years | 96 (21.7%) | 63 (17.5%) |
| 75 Years and over | 36 (15.9%) | 67 (19.3%) |
Disability Class: Ambulatory Difficulty
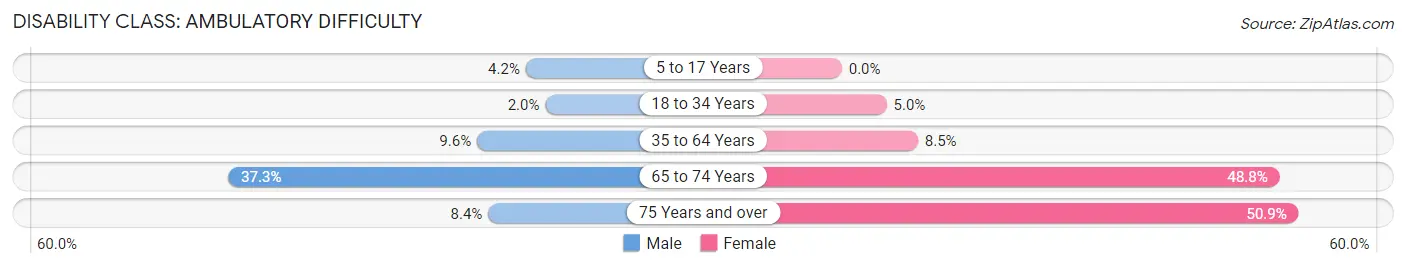
| Age Bracket | Male | Female |
| 5 to 17 Years | 51 (4.2%) | 0 (0.0%) |
| 18 to 34 Years | 24 (2.0%) | 55 (5.0%) |
| 35 to 64 Years | 154 (9.6%) | 152 (8.5%) |
| 65 to 74 Years | 165 (37.3%) | 175 (48.7%) |
| 75 Years and over | 19 (8.4%) | 177 (50.9%) |
Disability Class: Self-Care Difficulty
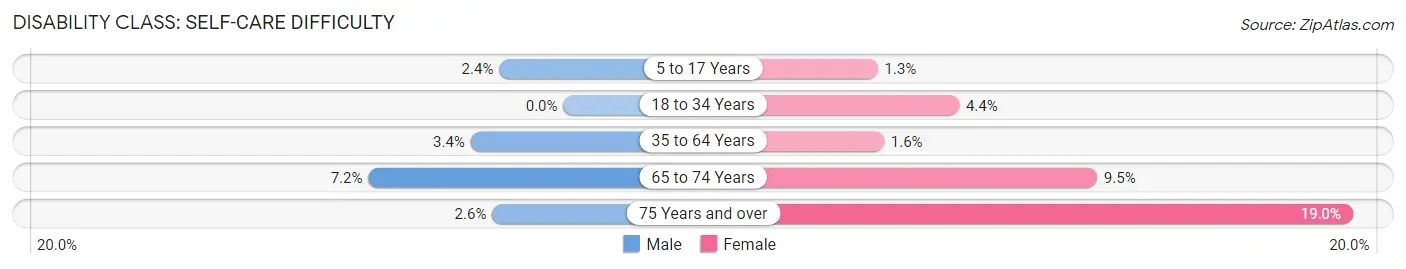
| Age Bracket | Male | Female |
| 5 to 17 Years | 29 (2.4%) | 11 (1.3%) |
| 18 to 34 Years | 0 (0.0%) | 48 (4.3%) |
| 35 to 64 Years | 55 (3.4%) | 28 (1.6%) |
| 65 to 74 Years | 32 (7.2%) | 34 (9.5%) |
| 75 Years and over | 6 (2.6%) | 66 (19.0%) |
Technology Access in Coweta
Computing Device Access in Coweta
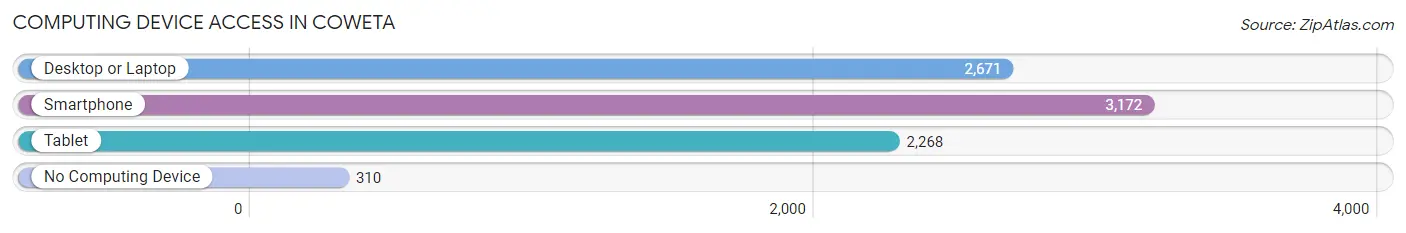
| Device Type | # Households | % Households |
| Desktop or Laptop | 2,671 | 72.5% |
| Smartphone | 3,172 | 86.1% |
| Tablet | 2,268 | 61.6% |
| No Computing Device | 310 | 8.4% |
| Total | 3,683 | 100.0% |
Internet Access in Coweta
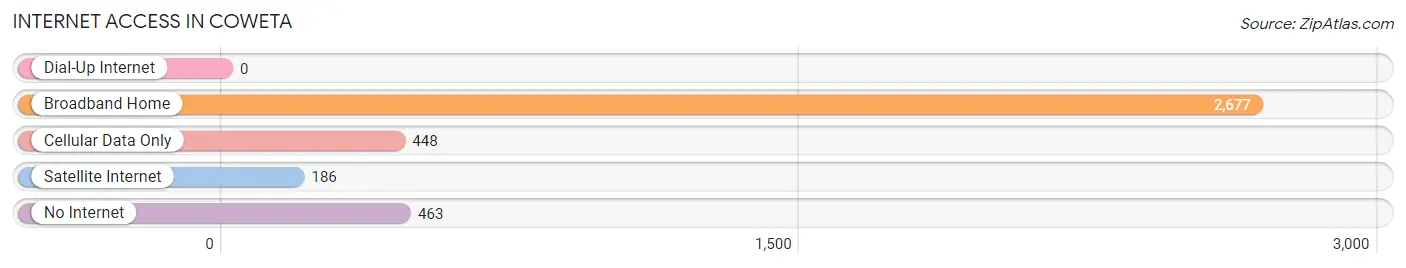
| Internet Type | # Households | % Households |
| Dial-Up Internet | 0 | 0.0% |
| Broadband Home | 2,677 | 72.7% |
| Cellular Data Only | 448 | 12.2% |
| Satellite Internet | 186 | 5.1% |
| No Internet | 463 | 12.6% |
| Total | 3,683 | 100.0% |
Coweta Summary
Coweta is a city located in Wagoner County, Oklahoma, United States. It is located approximately 20 miles southeast of Tulsa and is part of the Tulsa Metropolitan Statistical Area. As of the 2010 census, the population of Coweta was 9,943.
History
Coweta was founded in 1872 by the Creek Nation, who had been forced to relocate to Indian Territory from their ancestral lands in Georgia and Alabama. The town was named after the Coweta Creek, which was named after the Coweta tribe of the Creek Nation. The town was originally located in the Cooweescoowee District of the Creek Nation, and was the site of the first Creek National Council House.
In 1891, the St. Louis and San Francisco Railway (Frisco) built a line through Coweta, connecting it to Tulsa and other towns in the area. This allowed for the growth of the town, and by 1900, Coweta had a population of 1,000.
In 1907, the town was incorporated and the first mayor was elected. The town continued to grow, and by the 1920s, Coweta had a population of 2,000.
Geography
Coweta is located at 35°55'25" North, 95°37'45" West (35.923750, -95.629167). According to the United States Census Bureau, the city has a total area of 8.3 square miles, all of it land.
Economy
The economy of Coweta is largely based on agriculture and manufacturing. The city is home to several large manufacturing plants, including a Tyson Foods poultry processing plant, a John Deere tractor plant, and a Coca-Cola bottling plant.
Agriculture is also an important part of the local economy. The area is home to several large farms, and the city is the site of the annual Wagoner County Fair.
Demographics
As of the 2010 census, there were 9,943 people, 3,717 households, and 2,717 families residing in the city. The population density was 1,196.3 people per square mile. The racial makeup of the city was 79.2% White, 4.2% African American, 8.7% Native American, 0.7% Asian, 0.1% Pacific Islander, 4.2% from other races, and 3.0% from two or more races. Hispanic or Latino of any race were 8.7% of the population.
The median income for a household in the city was $41,944, and the median income for a family was $50,944. The per capita income for the city was $19,944. About 11.2% of families and 14.2% of the population were below the poverty line, including 19.2% of those under age 18 and 8.2% of those age 65 or over.
Common Questions
What is Per Capita Income in Coweta?
Per Capita income in Coweta is $28,435.
What is the Median Family Income in Coweta?
Median Family Income in Coweta is $76,831.
What is the Median Household income in Coweta?
Median Household Income in Coweta is $57,166.
What is Income or Wage Gap in Coweta?
Income or Wage Gap in Coweta is 24.2%.
Women in Coweta earn 75.8 cents for every dollar earned by a man.
What is Inequality or Gini Index in Coweta?
Inequality or Gini Index in Coweta is 0.38.
What is the Total Population of Coweta?
Total Population of Coweta is 9,903.
What is the Total Male Population of Coweta?
Total Male Population of Coweta is 5,097.
What is the Total Female Population of Coweta?
Total Female Population of Coweta is 4,806.
What is the Ratio of Males per 100 Females in Coweta?
There are 106.05 Males per 100 Females in Coweta.
What is the Ratio of Females per 100 Males in Coweta?
There are 94.29 Females per 100 Males in Coweta.
What is the Median Population Age in Coweta?
Median Population Age in Coweta is 34.5 Years.
What is the Average Family Size in Coweta
Average Family Size in Coweta is 3.3 People.
What is the Average Household Size in Coweta
Average Household Size in Coweta is 2.7 People.
How Large is the Labor Force in Coweta?
There are 4,834 People in the Labor Forcein in Coweta.
What is the Percentage of People in the Labor Force in Coweta?
65.6% of People are in the Labor Force in Coweta.
What is the Unemployment Rate in Coweta?
Unemployment Rate in Coweta is 5.3%.