Mannsville, OK Map & Demographics
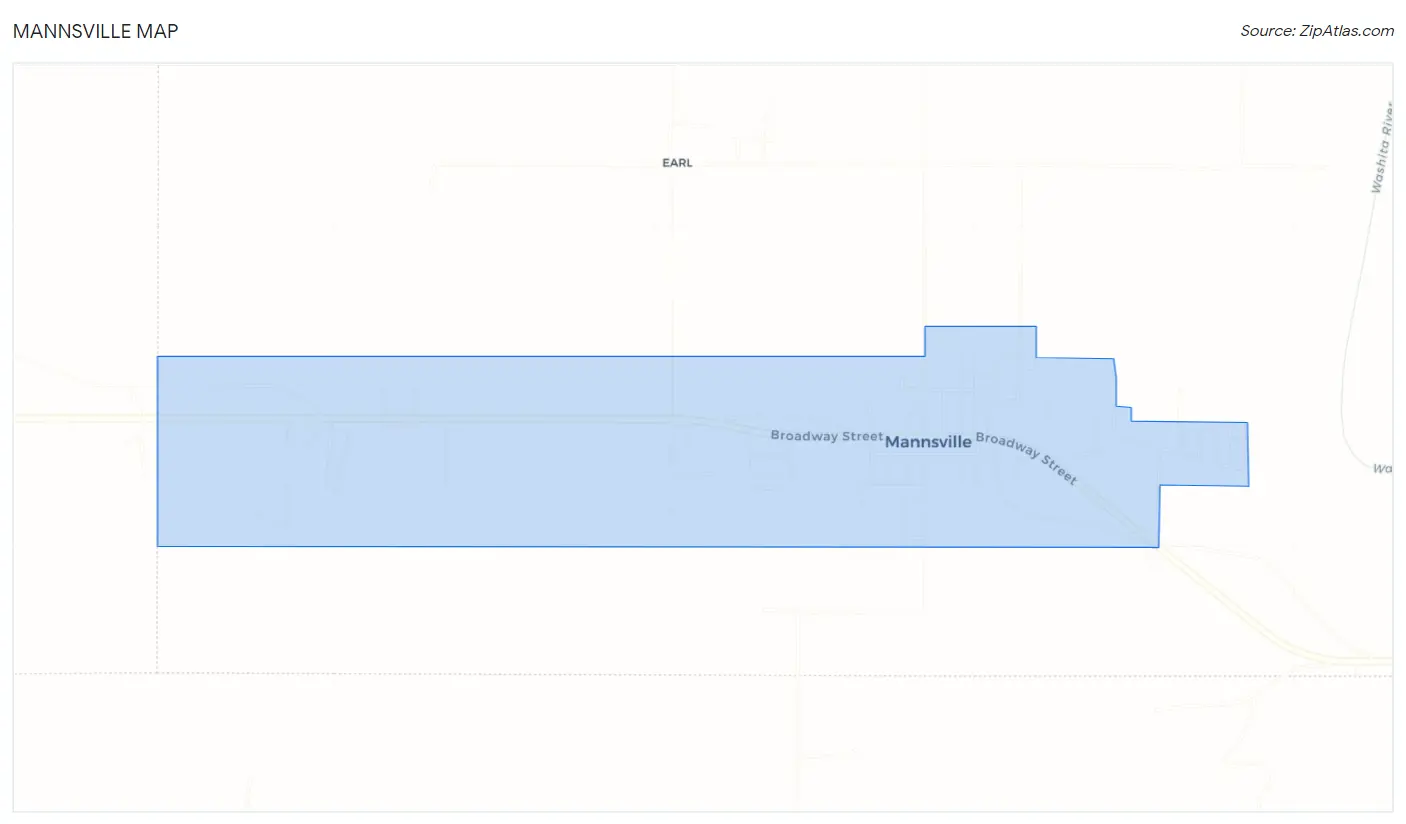
Mannsville Map
Mannsville Overview
$20,215
PER CAPITA INCOME
$55,104
AVG FAMILY INCOME
$45,000
AVG HOUSEHOLD INCOME
38.6%
WAGE / INCOME GAP [ % ]
61.4¢/ $1
WAGE / INCOME GAP [ $ ]
0.36
INEQUALITY / GINI INDEX
966
TOTAL POPULATION
480
MALE POPULATION
486
FEMALE POPULATION
98.77
MALES / 100 FEMALES
101.25
FEMALES / 100 MALES
35.3
MEDIAN AGE
3.4
AVG FAMILY SIZE
2.6
AVG HOUSEHOLD SIZE
395
LABOR FORCE [ PEOPLE ]
54.1%
PERCENT IN LABOR FORCE
4.6%
UNEMPLOYMENT RATE
Mannsville Zip Codes
Mannsville Area Codes
Income in Mannsville
Income Overview in Mannsville
Per Capita Income in Mannsville is $20,215, while median incomes of families and households are $55,104 and $45,000 respectively.
| Characteristic | Number | Measure |
| Per Capita Income | 966 | $20,215 |
| Median Family Income | 223 | $55,104 |
| Mean Family Income | 223 | $60,155 |
| Median Household Income | 376 | $45,000 |
| Mean Household Income | 376 | $49,919 |
| Income Deficit | 223 | $0 |
| Wage / Income Gap (%) | 966 | 38.59% |
| Wage / Income Gap ($) | 966 | 61.41¢ per $1 |
| Gini / Inequality Index | 966 | 0.36 |
Earnings by Sex in Mannsville
Average Earnings in Mannsville are $28,702, $36,964 for men and $22,700 for women, a difference of 38.6%.
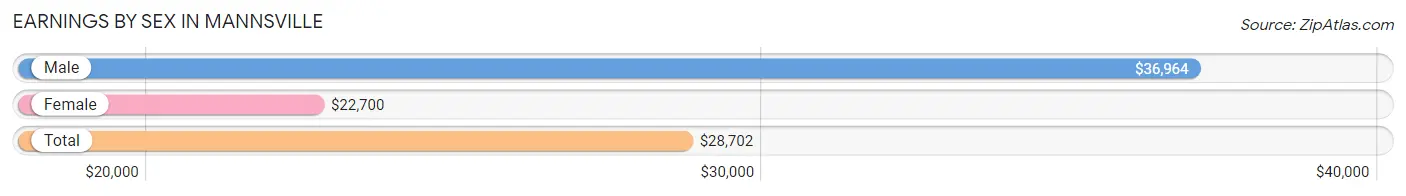
| Sex | Number | Average Earnings |
| Male | 209 (51.9%) | $36,964 |
| Female | 194 (48.1%) | $22,700 |
| Total | 403 (100.0%) | $28,702 |
Earnings by Sex by Income Bracket in Mannsville
The most common earnings brackets in Mannsville are $55,000 to $64,999 for men (38 | 18.2%) and $12,500 to $14,999 for women (38 | 19.6%).
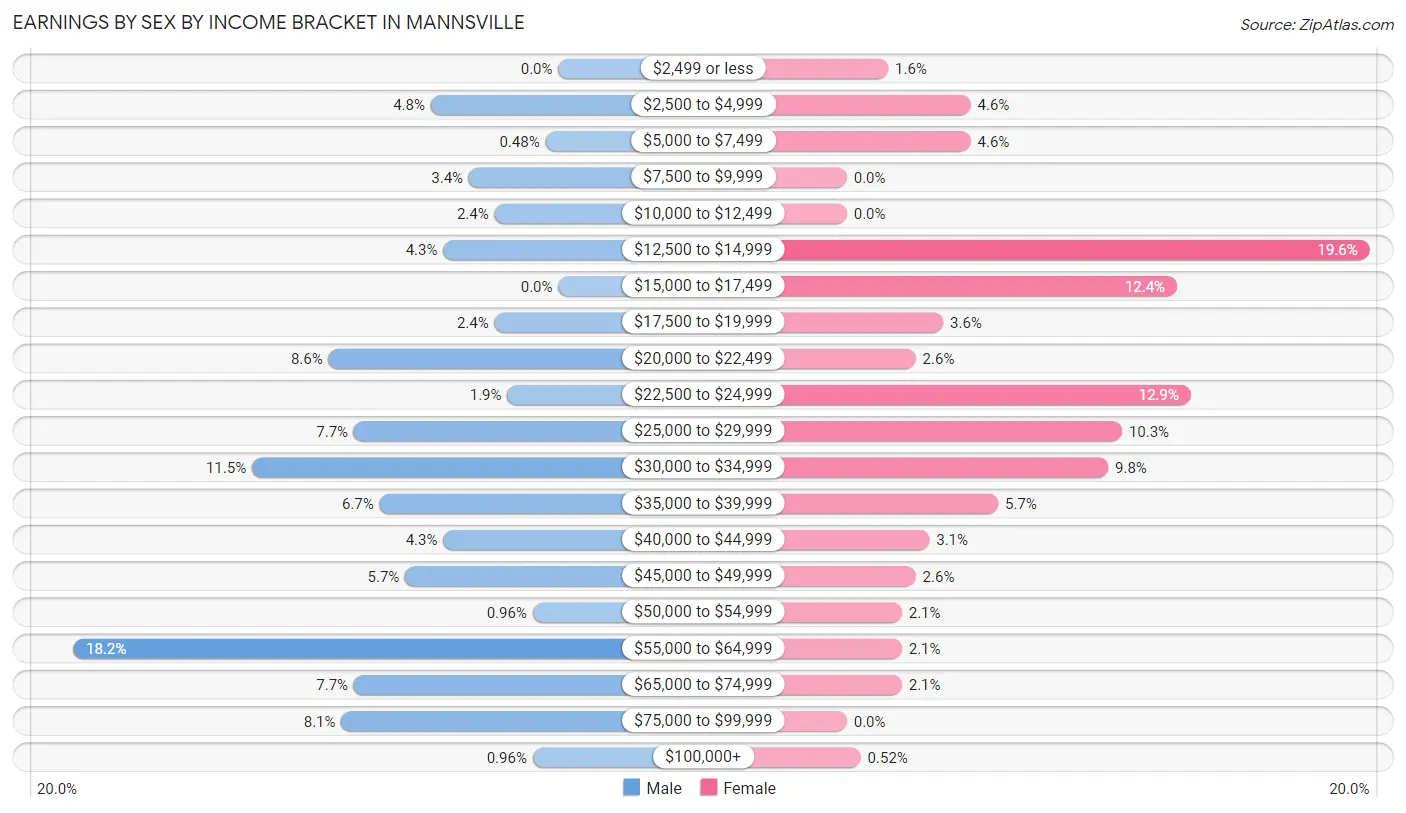
| Income | Male | Female |
| $2,499 or less | 0 (0.0%) | 3 (1.5%) |
| $2,500 to $4,999 | 10 (4.8%) | 9 (4.6%) |
| $5,000 to $7,499 | 1 (0.5%) | 9 (4.6%) |
| $7,500 to $9,999 | 7 (3.4%) | 0 (0.0%) |
| $10,000 to $12,499 | 5 (2.4%) | 0 (0.0%) |
| $12,500 to $14,999 | 9 (4.3%) | 38 (19.6%) |
| $15,000 to $17,499 | 0 (0.0%) | 24 (12.4%) |
| $17,500 to $19,999 | 5 (2.4%) | 7 (3.6%) |
| $20,000 to $22,499 | 18 (8.6%) | 5 (2.6%) |
| $22,500 to $24,999 | 4 (1.9%) | 25 (12.9%) |
| $25,000 to $29,999 | 16 (7.7%) | 20 (10.3%) |
| $30,000 to $34,999 | 24 (11.5%) | 19 (9.8%) |
| $35,000 to $39,999 | 14 (6.7%) | 11 (5.7%) |
| $40,000 to $44,999 | 9 (4.3%) | 6 (3.1%) |
| $45,000 to $49,999 | 12 (5.7%) | 5 (2.6%) |
| $50,000 to $54,999 | 2 (1.0%) | 4 (2.1%) |
| $55,000 to $64,999 | 38 (18.2%) | 4 (2.1%) |
| $65,000 to $74,999 | 16 (7.7%) | 4 (2.1%) |
| $75,000 to $99,999 | 17 (8.1%) | 0 (0.0%) |
| $100,000+ | 2 (1.0%) | 1 (0.5%) |
| Total | 209 (100.0%) | 194 (100.0%) |
Earnings by Sex by Educational Attainment in Mannsville
Average earnings in Mannsville are $37,679 for men and $24,600 for women, a difference of 34.7%. Men with an educational attainment of high school diploma enjoy the highest average annual earnings of $55,764, while those with less than high school education earn the least with $23,750. Women with an educational attainment of bachelor's degree earn the most with the average annual earnings of $47,500, while those with high school diploma education have the smallest earnings of $23,261.
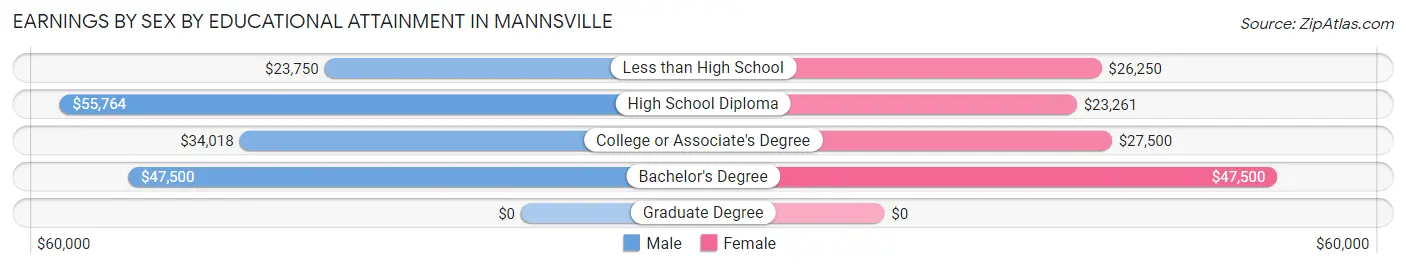
| Educational Attainment | Male Income | Female Income |
| Less than High School | $23,750 | $26,250 |
| High School Diploma | $55,764 | $23,261 |
| College or Associate's Degree | $34,018 | $27,500 |
| Bachelor's Degree | $47,500 | $47,500 |
| Graduate Degree | - | - |
| Total | $37,679 | $24,600 |
Family Income in Mannsville
Family Income Brackets in Mannsville
According to the Mannsville family income data, there are 61 families falling into the $50,000 to $74,999 income range, which is the most common income bracket and makes up 27.4% of all families.
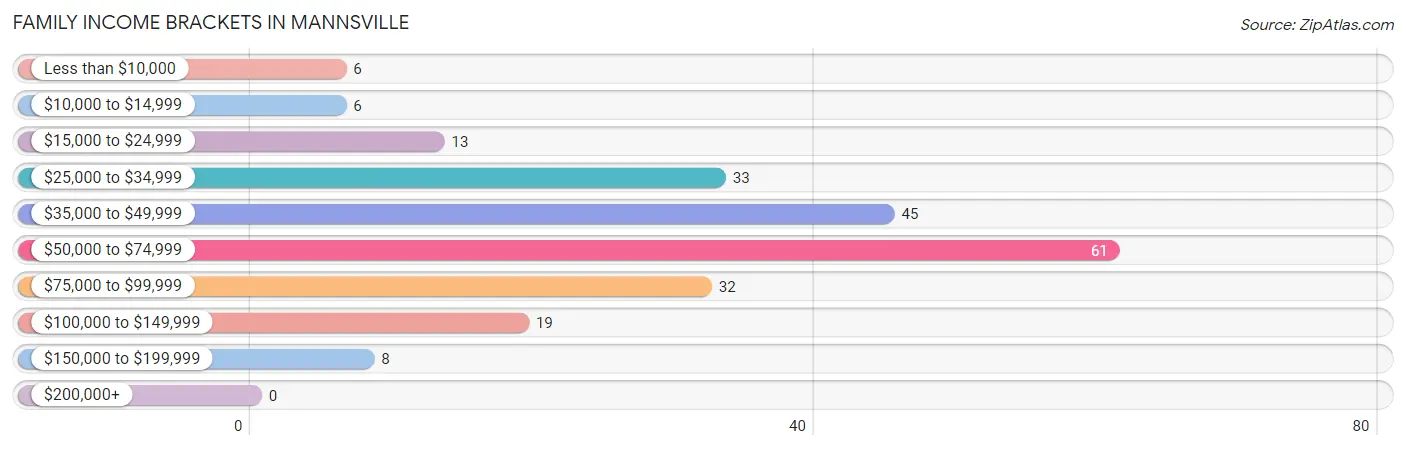
| Income Bracket | # Families | % Families |
| Less than $10,000 | 6 | 2.7% |
| $10,000 to $14,999 | 6 | 2.7% |
| $15,000 to $24,999 | 13 | 5.8% |
| $25,000 to $34,999 | 33 | 14.8% |
| $35,000 to $49,999 | 45 | 20.2% |
| $50,000 to $74,999 | 61 | 27.4% |
| $75,000 to $99,999 | 32 | 14.3% |
| $100,000 to $149,999 | 19 | 8.5% |
| $150,000 to $199,999 | 8 | 3.6% |
| $200,000+ | 0 | 0.0% |
Family Income by Famaliy Size in Mannsville
7+ person families (13 | 5.8%) account for the highest median family income in Mannsville with $79,063 per family, while 2-person families (72 | 32.3%) have the highest median income of $28,542 per family member.
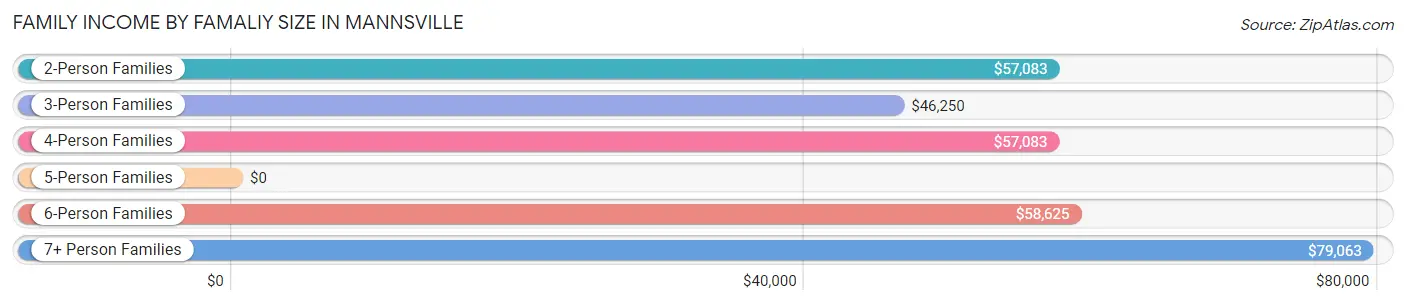
| Income Bracket | # Families | Median Income |
| 2-Person Families | 72 (32.3%) | $57,083 |
| 3-Person Families | 57 (25.6%) | $46,250 |
| 4-Person Families | 45 (20.2%) | $57,083 |
| 5-Person Families | 19 (8.5%) | $0 |
| 6-Person Families | 17 (7.6%) | $58,625 |
| 7+ Person Families | 13 (5.8%) | $79,063 |
| Total | 223 (100.0%) | $55,104 |
Family Income by Number of Earners in Mannsville
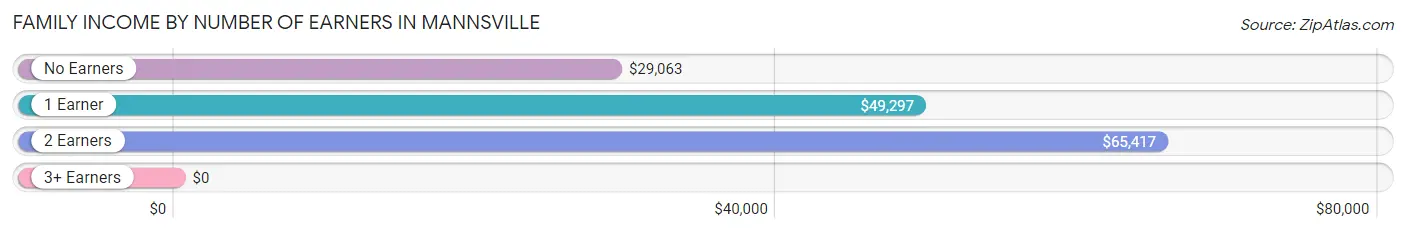
| Number of Earners | # Families | Median Income |
| No Earners | 45 (20.2%) | $29,063 |
| 1 Earner | 79 (35.4%) | $49,297 |
| 2 Earners | 91 (40.8%) | $65,417 |
| 3+ Earners | 8 (3.6%) | $0 |
| Total | 223 (100.0%) | $55,104 |
Household Income in Mannsville
Household Income Brackets in Mannsville
With 89 households falling in the category, the $50,000 to $74,999 income range is the most frequent in Mannsville, accounting for 23.7% of all households.
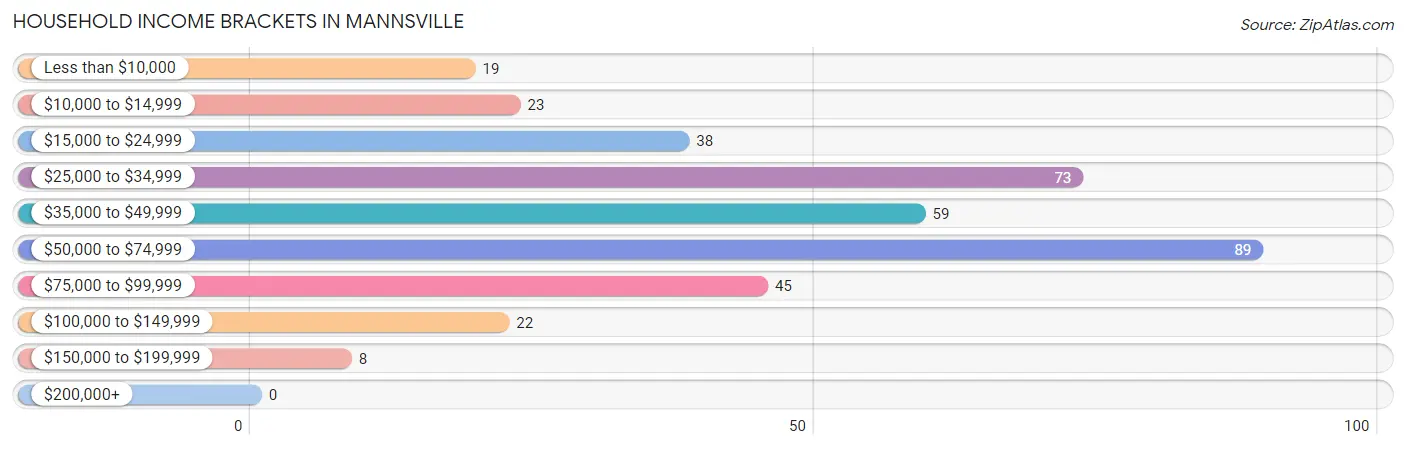
| Income Bracket | # Households | % Households |
| Less than $10,000 | 19 | 5.1% |
| $10,000 to $14,999 | 23 | 6.1% |
| $15,000 to $24,999 | 38 | 10.1% |
| $25,000 to $34,999 | 73 | 19.4% |
| $35,000 to $49,999 | 59 | 15.7% |
| $50,000 to $74,999 | 89 | 23.7% |
| $75,000 to $99,999 | 45 | 12.0% |
| $100,000 to $149,999 | 22 | 5.9% |
| $150,000 to $199,999 | 8 | 2.1% |
| $200,000+ | 0 | 0.0% |
Household Income by Householder Age in Mannsville
The median household income in Mannsville is $45,000, with the highest median household income of $51,000 found in the 25 to 44 years age bracket for the primary householder. A total of 120 households (31.9%) fall into this category. Meanwhile, the 65+ years age bracket for the primary householder has the lowest median household income of $0, with 120 households (31.9%) in this group.
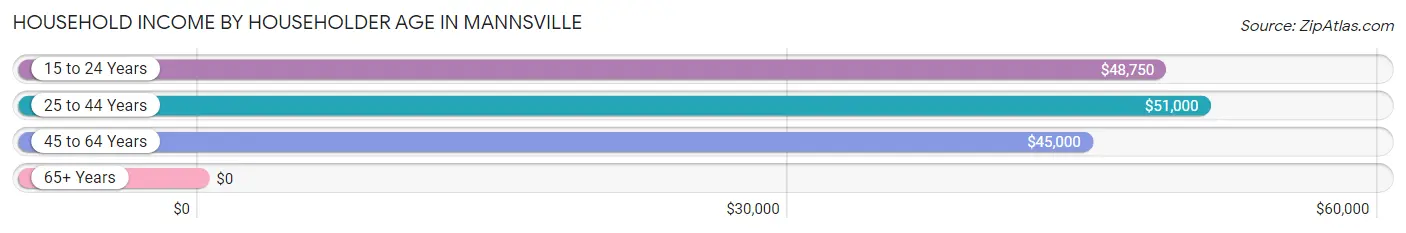
| Income Bracket | # Households | Median Income |
| 15 to 24 Years | 6 (1.6%) | $48,750 |
| 25 to 44 Years | 120 (31.9%) | $51,000 |
| 45 to 64 Years | 130 (34.6%) | $45,000 |
| 65+ Years | 120 (31.9%) | $0 |
| Total | 376 (100.0%) | $45,000 |
Poverty in Mannsville
Income Below Poverty by Sex and Age in Mannsville
With 12.7% poverty level for males and 18.2% for females among the residents of Mannsville, 5 year old males and 55 to 64 year old females are the most vulnerable to poverty, with 4 males (50.0%) and 15 females (42.9%) in their respective age groups living below the poverty level.
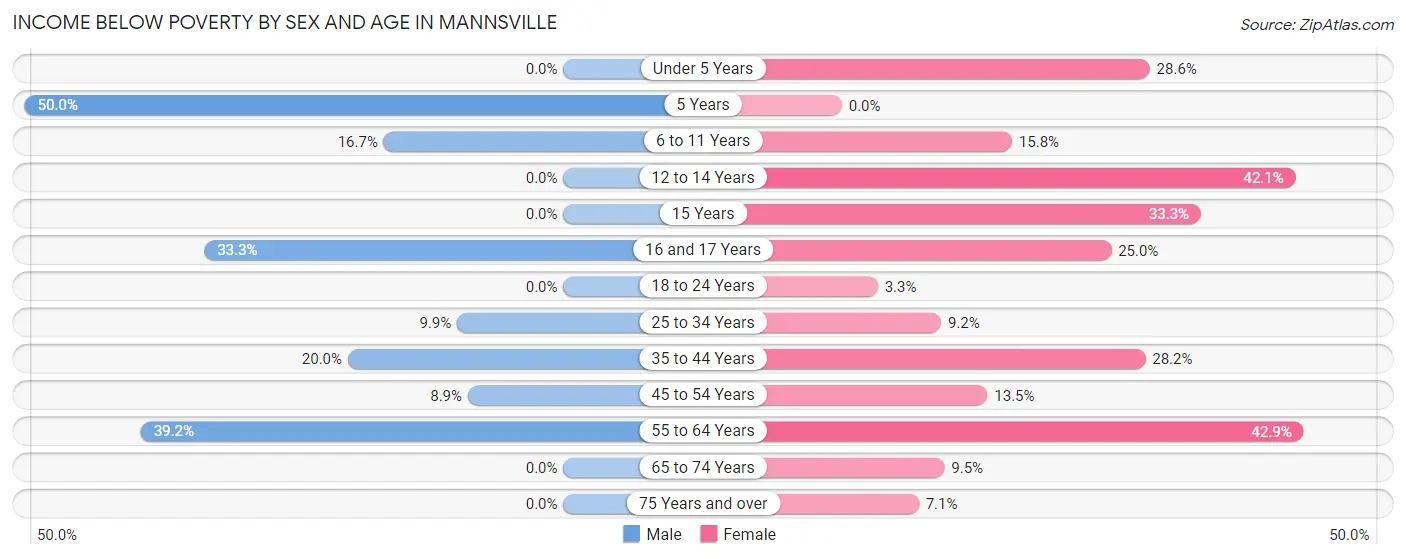
| Age Bracket | Male | Female |
| Under 5 Years | 0 (0.0%) | 12 (28.6%) |
| 5 Years | 4 (50.0%) | 0 (0.0%) |
| 6 to 11 Years | 8 (16.7%) | 9 (15.8%) |
| 12 to 14 Years | 0 (0.0%) | 8 (42.1%) |
| 15 Years | 0 (0.0%) | 1 (33.3%) |
| 16 and 17 Years | 3 (33.3%) | 3 (25.0%) |
| 18 to 24 Years | 0 (0.0%) | 2 (3.3%) |
| 25 to 34 Years | 7 (9.9%) | 7 (9.2%) |
| 35 to 44 Years | 12 (20.0%) | 20 (28.2%) |
| 45 to 54 Years | 7 (8.9%) | 5 (13.5%) |
| 55 to 64 Years | 20 (39.2%) | 15 (42.9%) |
| 65 to 74 Years | 0 (0.0%) | 4 (9.5%) |
| 75 Years and over | 0 (0.0%) | 2 (7.1%) |
| Total | 61 (12.7%) | 88 (18.2%) |
Income Above Poverty by Sex and Age in Mannsville
According to the poverty statistics in Mannsville, males aged under 5 years and females aged 5 years are the age groups that are most secure financially, with 100.0% of males and 100.0% of females in these age groups living above the poverty line.
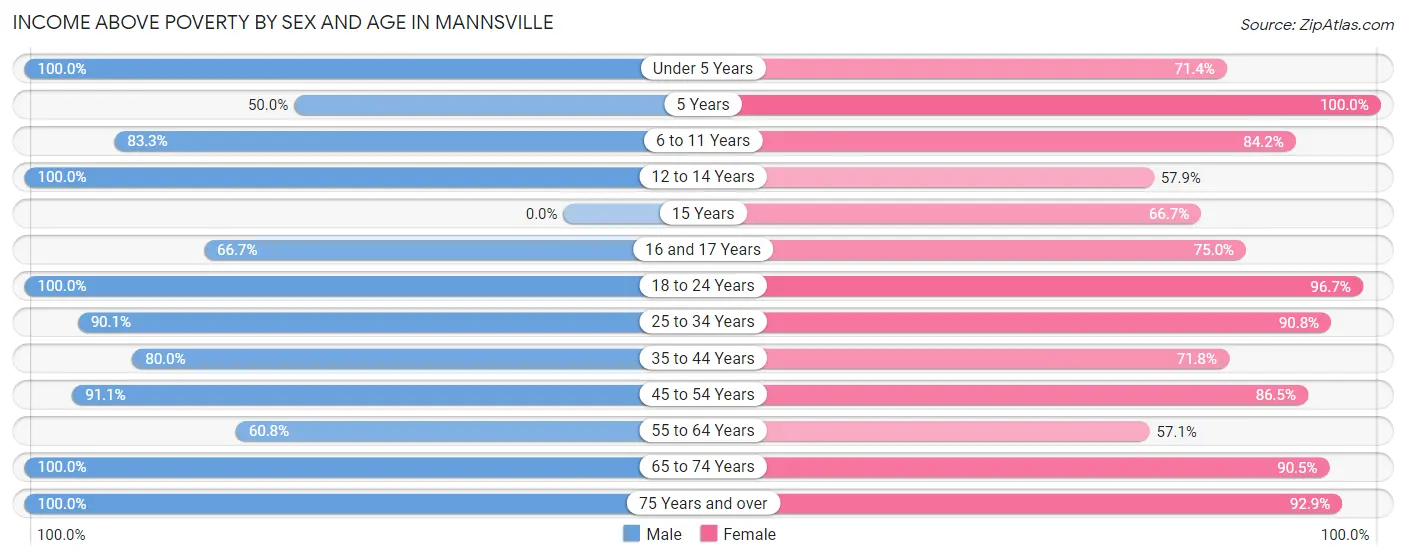
| Age Bracket | Male | Female |
| Under 5 Years | 31 (100.0%) | 30 (71.4%) |
| 5 Years | 4 (50.0%) | 2 (100.0%) |
| 6 to 11 Years | 40 (83.3%) | 48 (84.2%) |
| 12 to 14 Years | 23 (100.0%) | 11 (57.9%) |
| 15 Years | 0 (0.0%) | 2 (66.7%) |
| 16 and 17 Years | 6 (66.7%) | 9 (75.0%) |
| 18 to 24 Years | 15 (100.0%) | 58 (96.7%) |
| 25 to 34 Years | 64 (90.1%) | 69 (90.8%) |
| 35 to 44 Years | 48 (80.0%) | 51 (71.8%) |
| 45 to 54 Years | 72 (91.1%) | 32 (86.5%) |
| 55 to 64 Years | 31 (60.8%) | 20 (57.1%) |
| 65 to 74 Years | 35 (100.0%) | 38 (90.5%) |
| 75 Years and over | 49 (100.0%) | 26 (92.9%) |
| Total | 418 (87.3%) | 396 (81.8%) |
Income Below Poverty Among Married-Couple Families in Mannsville
The poverty statistics for married-couple families in Mannsville show that 7.9% or 12 of the total 152 families live below the poverty line. Families with 5 or more children have the highest poverty rate of 25.0%, comprising of 3 families. On the other hand, families with no children have the lowest poverty rate of 5.4%, which includes 3 families.
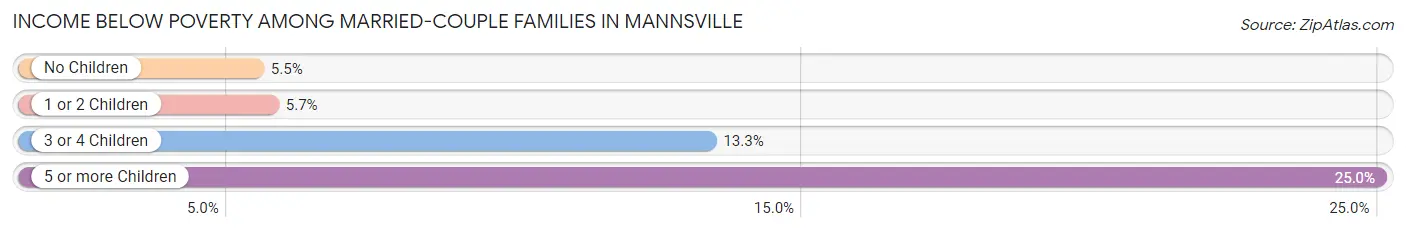
| Children | Above Poverty | Below Poverty |
| No Children | 52 (94.6%) | 3 (5.4%) |
| 1 or 2 Children | 66 (94.3%) | 4 (5.7%) |
| 3 or 4 Children | 13 (86.7%) | 2 (13.3%) |
| 5 or more Children | 9 (75.0%) | 3 (25.0%) |
| Total | 140 (92.1%) | 12 (7.9%) |
Income Below Poverty Among Single-Parent Households in Mannsville
According to the poverty data in Mannsville, 22.0% or 9 single-father households and 16.7% or 5 single-mother households are living below the poverty line. Among single-father households, those with 3 or 4 children have the highest poverty rate, with 4 households (100.0%) experiencing poverty. Likewise, among single-mother households, those with 1 or 2 children have the highest poverty rate, with 5 households (35.7%) falling below the poverty line.
| Children | Single Father | Single Mother |
| No Children | 0 (0.0%) | 0 (0.0%) |
| 1 or 2 Children | 5 (23.8%) | 5 (35.7%) |
| 3 or 4 Children | 4 (100.0%) | 0 (0.0%) |
| 5 or more Children | 0 (0.0%) | 0 (0.0%) |
| Total | 9 (22.0%) | 5 (16.7%) |
Income Below Poverty Among Married-Couple vs Single-Parent Households in Mannsville
The poverty data for Mannsville shows that 12 of the married-couple family households (7.9%) and 14 of the single-parent households (19.7%) are living below the poverty level. Within the married-couple family households, those with 5 or more children have the highest poverty rate, with 3 households (25.0%) falling below the poverty line. Among the single-parent households, those with 3 or 4 children have the highest poverty rate, with 4 household (100.0%) living below poverty.
| Children | Married-Couple Families | Single-Parent Households |
| No Children | 3 (5.4%) | 0 (0.0%) |
| 1 or 2 Children | 4 (5.7%) | 10 (28.6%) |
| 3 or 4 Children | 2 (13.3%) | 4 (100.0%) |
| 5 or more Children | 3 (25.0%) | 0 (0.0%) |
| Total | 12 (7.9%) | 14 (19.7%) |
Race in Mannsville
The most populous races in Mannsville are White / Caucasian (623 | 64.5%), Two or more Races (241 | 24.9%), and Hispanic or Latino (153 | 15.8%).
| Race | # Population | % Population |
| Asian | 0 | 0.0% |
| Black / African American | 0 | 0.0% |
| Hawaiian / Pacific | 3 | 0.3% |
| Hispanic or Latino | 153 | 15.8% |
| Native / Alaskan | 68 | 7.0% |
| White / Caucasian | 623 | 64.5% |
| Two or more Races | 241 | 24.9% |
| Some other Race | 31 | 3.2% |
| Total | 966 | 100.0% |
Ancestry in Mannsville
The most populous ancestries reported in Mannsville are Mexican (145 | 15.0%), Irish (129 | 13.4%), German (109 | 11.3%), Choctaw (90 | 9.3%), and Chickasaw (88 | 9.1%), together accounting for 58.1% of all Mannsville residents.
| Ancestry | # Population | % Population |
| American | 18 | 1.9% |
| Central American | 8 | 0.8% |
| Cherokee | 27 | 2.8% |
| Chickasaw | 88 | 9.1% |
| Choctaw | 90 | 9.3% |
| Comanche | 12 | 1.2% |
| Creek | 4 | 0.4% |
| Czech | 2 | 0.2% |
| Dutch | 19 | 2.0% |
| Dutch West Indian | 18 | 1.9% |
| English | 56 | 5.8% |
| French | 22 | 2.3% |
| German | 109 | 11.3% |
| Irish | 129 | 13.4% |
| Italian | 3 | 0.3% |
| Mexican | 145 | 15.0% |
| Native Hawaiian | 3 | 0.3% |
| Norwegian | 13 | 1.3% |
| Polish | 6 | 0.6% |
| Potawatomi | 2 | 0.2% |
| Salvadoran | 8 | 0.8% |
| Scandinavian | 1 | 0.1% |
| Scottish | 41 | 4.2% |
| Seminole | 13 | 1.3% |
| Swedish | 6 | 0.6% |
| Welsh | 3 | 0.3% | View All 26 Rows |
Immigrants in Mannsville
The most numerous immigrant groups reported in Mannsville came from Central America (26 | 2.7%), Latin America (26 | 2.7%), Mexico (22 | 2.3%), El Salvador (4 | 0.4%), and Asia (3 | 0.3%), together accounting for 8.4% of all Mannsville residents.
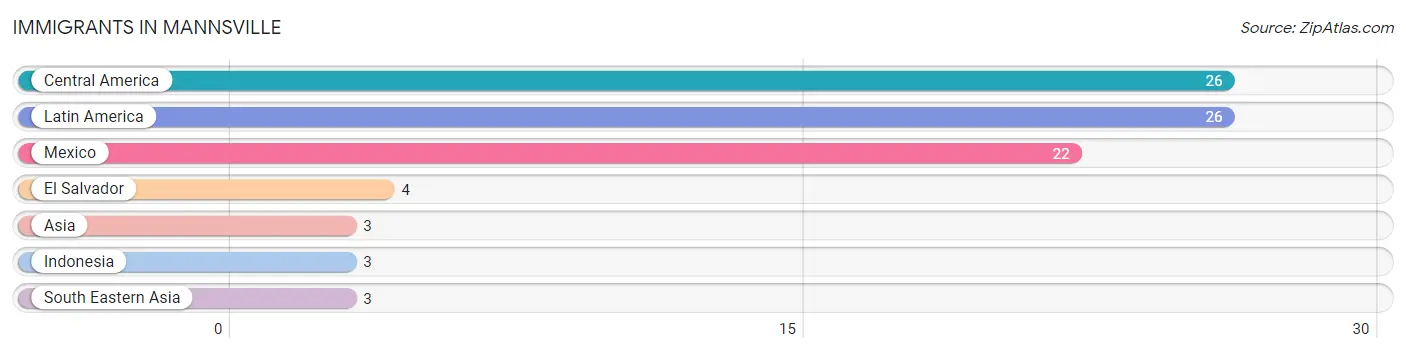
| Immigration Origin | # Population | % Population |
| Asia | 3 | 0.3% |
| Central America | 26 | 2.7% |
| El Salvador | 4 | 0.4% |
| Indonesia | 3 | 0.3% |
| Latin America | 26 | 2.7% |
| Mexico | 22 | 2.3% |
| South Eastern Asia | 3 | 0.3% | View All 7 Rows |
Sex and Age in Mannsville
Sex and Age in Mannsville
The most populous age groups in Mannsville are 50 to 54 Years (52 | 10.8%) for men and 20 to 24 Years (48 | 9.9%) for women.
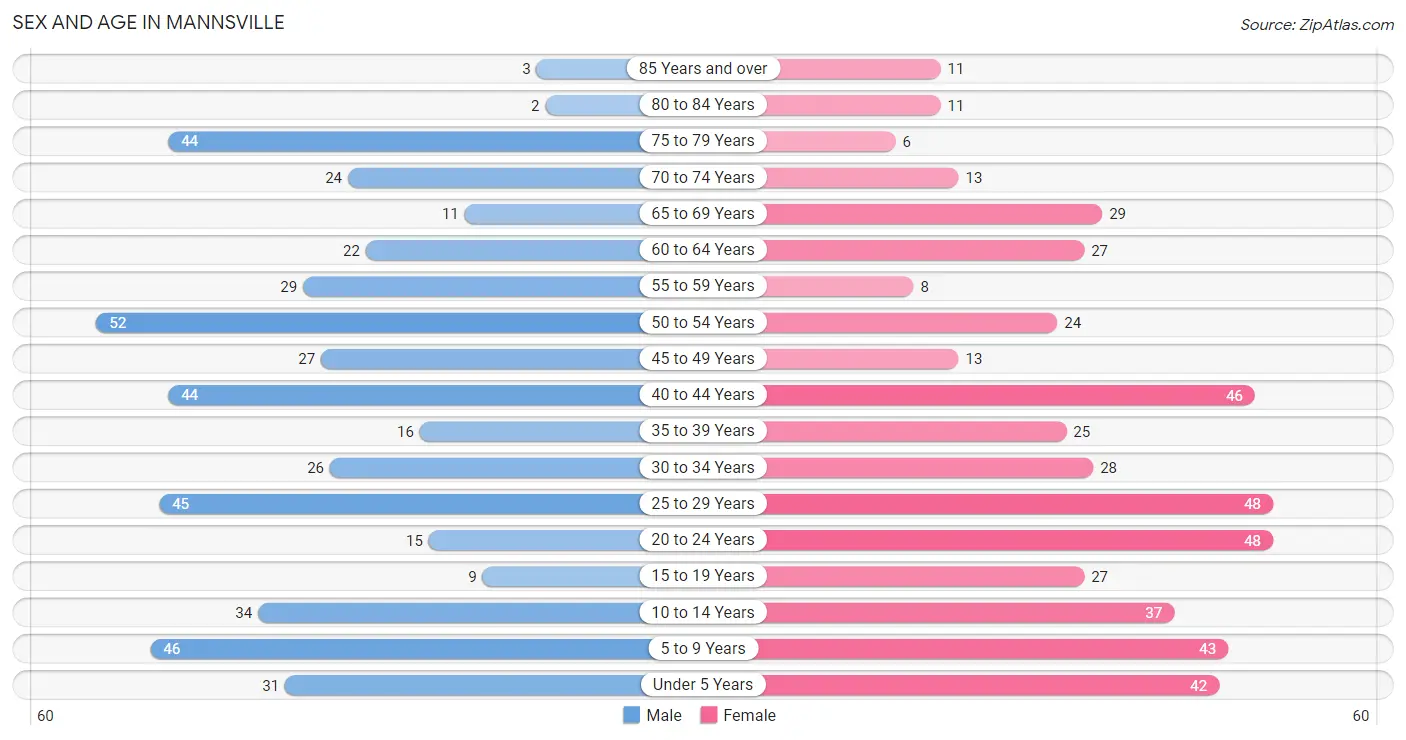
| Age Bracket | Male | Female |
| Under 5 Years | 31 (6.5%) | 42 (8.6%) |
| 5 to 9 Years | 46 (9.6%) | 43 (8.8%) |
| 10 to 14 Years | 34 (7.1%) | 37 (7.6%) |
| 15 to 19 Years | 9 (1.9%) | 27 (5.6%) |
| 20 to 24 Years | 15 (3.1%) | 48 (9.9%) |
| 25 to 29 Years | 45 (9.4%) | 48 (9.9%) |
| 30 to 34 Years | 26 (5.4%) | 28 (5.8%) |
| 35 to 39 Years | 16 (3.3%) | 25 (5.1%) |
| 40 to 44 Years | 44 (9.2%) | 46 (9.5%) |
| 45 to 49 Years | 27 (5.6%) | 13 (2.7%) |
| 50 to 54 Years | 52 (10.8%) | 24 (4.9%) |
| 55 to 59 Years | 29 (6.0%) | 8 (1.7%) |
| 60 to 64 Years | 22 (4.6%) | 27 (5.6%) |
| 65 to 69 Years | 11 (2.3%) | 29 (6.0%) |
| 70 to 74 Years | 24 (5.0%) | 13 (2.7%) |
| 75 to 79 Years | 44 (9.2%) | 6 (1.2%) |
| 80 to 84 Years | 2 (0.4%) | 11 (2.3%) |
| 85 Years and over | 3 (0.6%) | 11 (2.3%) |
| Total | 480 (100.0%) | 486 (100.0%) |
Families and Households in Mannsville
Median Family Size in Mannsville
The median family size in Mannsville is 3.41 persons per family, with single female/mother families (30 | 13.5%) accounting for the largest median family size of 3.77 persons per family. On the other hand, single male/father families (41 | 18.4%) represent the smallest median family size with 3.20 persons per family.
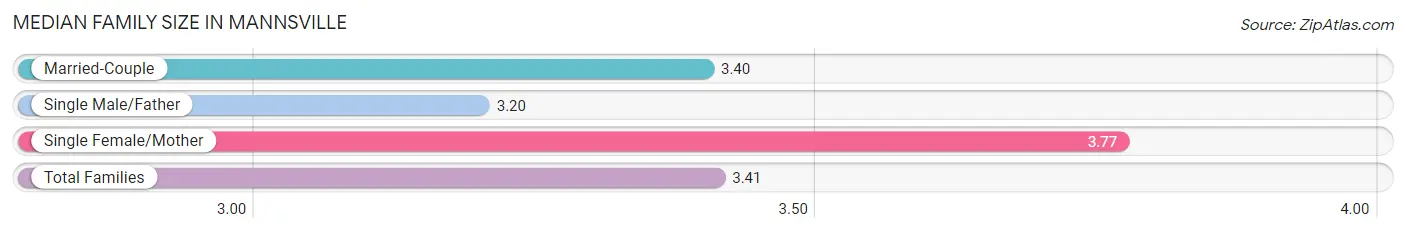
| Family Type | # Families | Family Size |
| Married-Couple | 152 (68.2%) | 3.40 |
| Single Male/Father | 41 (18.4%) | 3.20 |
| Single Female/Mother | 30 (13.5%) | 3.77 |
| Total Families | 223 (100.0%) | 3.41 |
Median Household Size in Mannsville
The median household size in Mannsville is 2.57 persons per household, with single female/mother households (30 | 8.0%) accounting for the largest median household size of 3.87 persons per household. non-family households (153 | 40.7%) represent the smallest median household size with 1.21 persons per household.
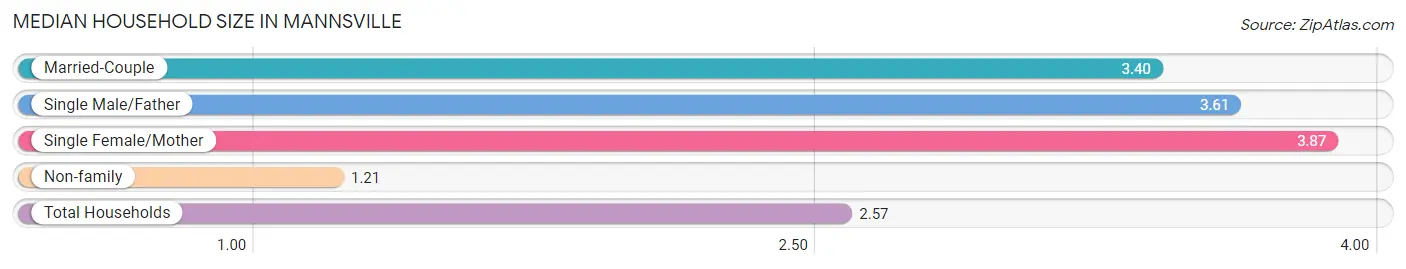
| Household Type | # Households | Household Size |
| Married-Couple | 152 (40.4%) | 3.40 |
| Single Male/Father | 41 (10.9%) | 3.61 |
| Single Female/Mother | 30 (8.0%) | 3.87 |
| Non-family | 153 (40.7%) | 1.21 |
| Total Households | 376 (100.0%) | 2.57 |
Household Size by Marriage Status in Mannsville
Out of a total of 376 households in Mannsville, 223 (59.3%) are family households, while 153 (40.7%) are nonfamily households. The most numerous type of family households are 2-person households, comprising 70, and the most common type of nonfamily households are 1-person households, comprising 125.
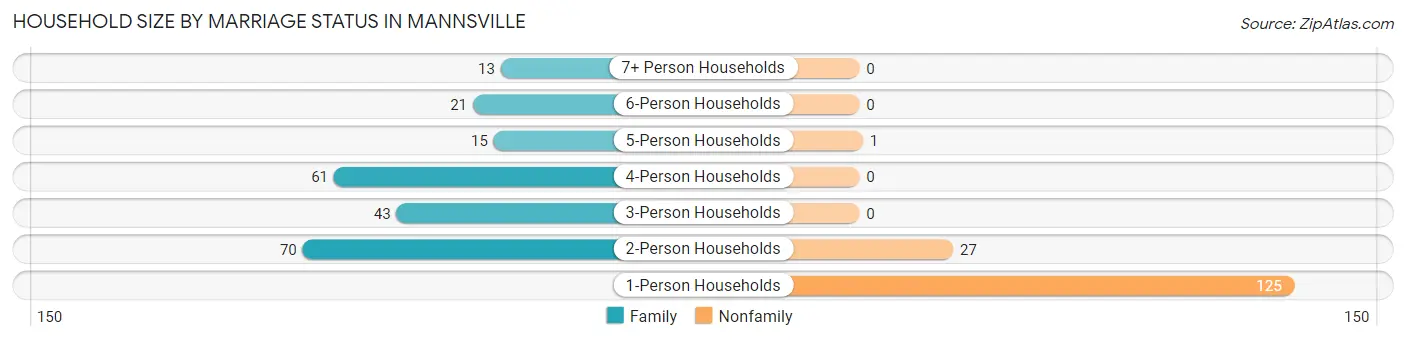
| Household Size | Family Households | Nonfamily Households |
| 1-Person Households | - | 125 (33.2%) |
| 2-Person Households | 70 (18.6%) | 27 (7.2%) |
| 3-Person Households | 43 (11.4%) | 0 (0.0%) |
| 4-Person Households | 61 (16.2%) | 0 (0.0%) |
| 5-Person Households | 15 (4.0%) | 1 (0.3%) |
| 6-Person Households | 21 (5.6%) | 0 (0.0%) |
| 7+ Person Households | 13 (3.5%) | 0 (0.0%) |
| Total | 223 (59.3%) | 153 (40.7%) |
Female Fertility in Mannsville
Fertility by Age in Mannsville
Average fertility rate in Mannsville is 21.0 births per 1,000 women. Women in the age bracket of 35 to 50 years have the highest fertility rate with 54.0 births per 1,000 women. Women in the age bracket of 35 to 50 years acount for 100.0% of all women with births.
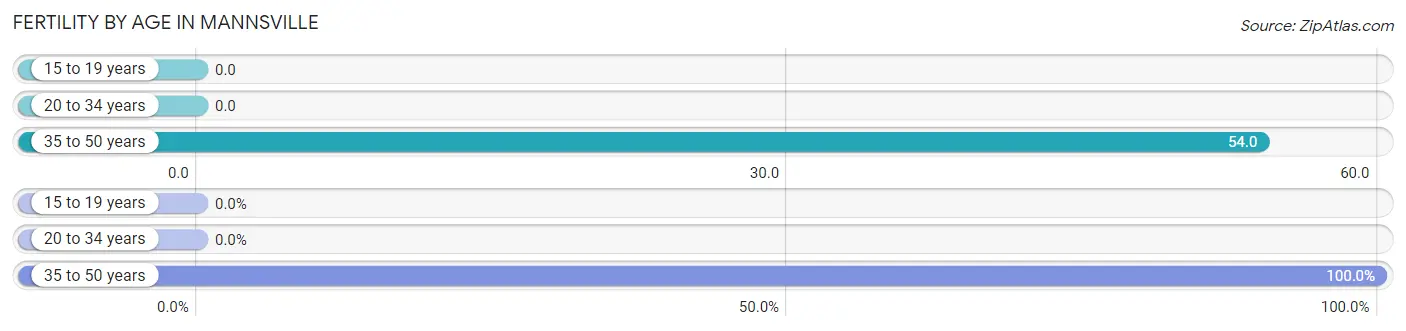
| Age Bracket | Women with Births | Births / 1,000 Women |
| 15 to 19 years | 0 (0.0%) | 0.0 |
| 20 to 34 years | 0 (0.0%) | 0.0 |
| 35 to 50 years | 5 (100.0%) | 54.0 |
| Total | 5 (100.0%) | 21.0 |
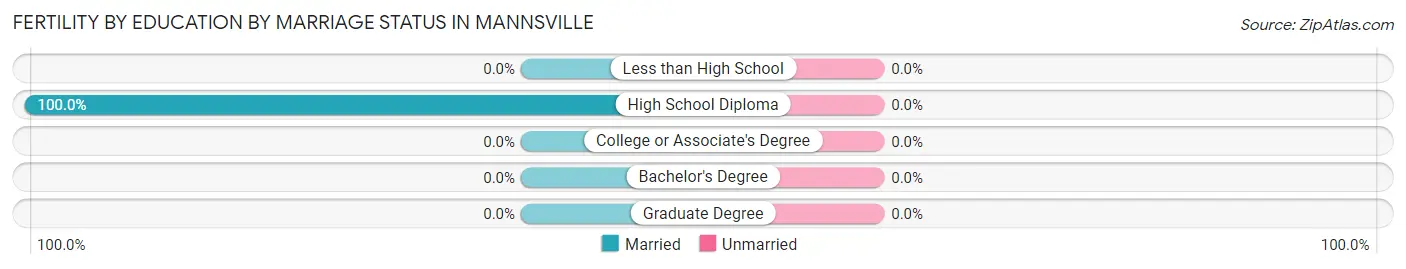
Fertility by Age by Marriage Status in Mannsville
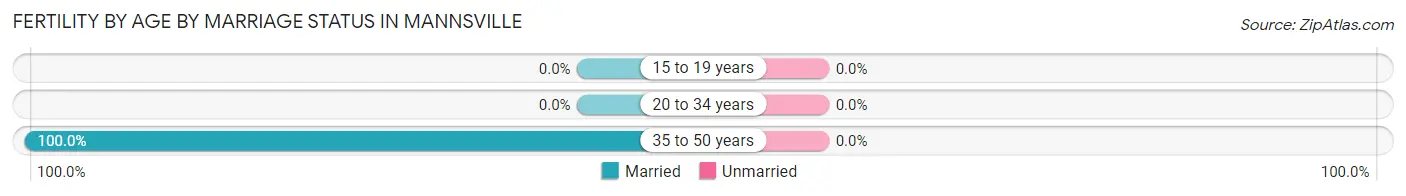
| Age Bracket | Married | Unmarried |
| 15 to 19 years | 0 (0.0%) | 0 (0.0%) |
| 20 to 34 years | 0 (0.0%) | 0 (0.0%) |
| 35 to 50 years | 5 (100.0%) | 0 (0.0%) |
| Total | 5 (100.0%) | 0 (0.0%) |
Fertility by Education in Mannsville
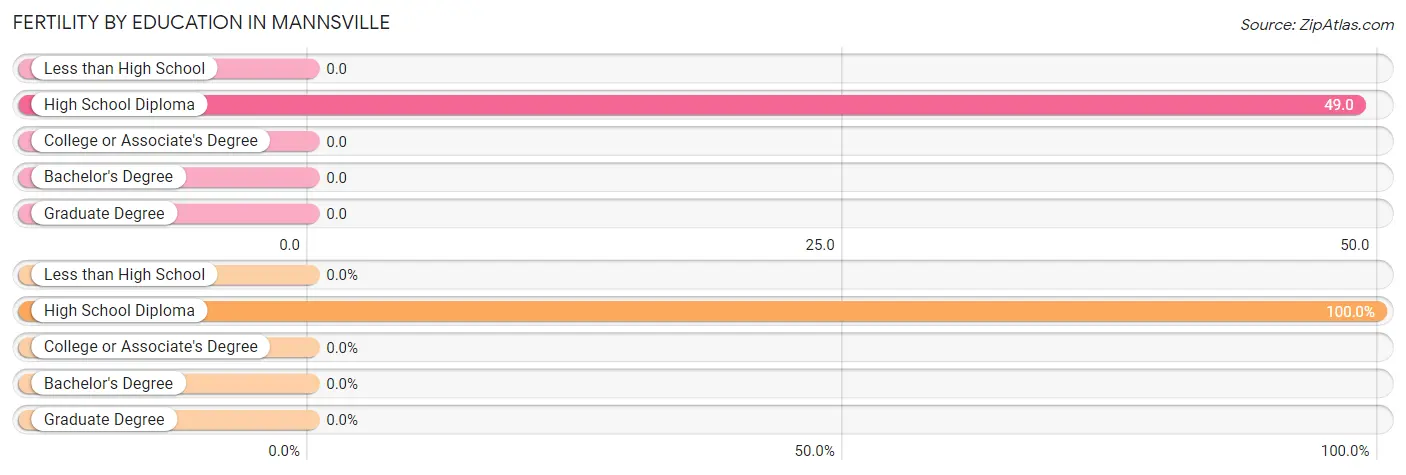
| Educational Attainment | Women with Births | Births / 1,000 Women |
| Less than High School | 0 (0.0%) | 0.0 |
| High School Diploma | 5 (100.0%) | 49.0 |
| College or Associate's Degree | 0 (0.0%) | 0.0 |
| Bachelor's Degree | 0 (0.0%) | 0.0 |
| Graduate Degree | 0 (0.0%) | 0.0 |
| Total | 5 (100.0%) | 21.0 |
Fertility by Education by Marriage Status in Mannsville
| Educational Attainment | Married | Unmarried |
| Less than High School | 0 (0.0%) | 0 (0.0%) |
| High School Diploma | 5 (100.0%) | 0 (0.0%) |
| College or Associate's Degree | 0 (0.0%) | 0 (0.0%) |
| Bachelor's Degree | 0 (0.0%) | 0 (0.0%) |
| Graduate Degree | 0 (0.0%) | 0 (0.0%) |
| Total | 5 (100.0%) | 0 (0.0%) |
Employment Characteristics in Mannsville
Employment by Class of Employer in Mannsville
Among the 373 employed individuals in Mannsville, private company employees (270 | 72.4%), state government employees (26 | 7.0%), and not-for-profit organizations (23 | 6.2%) make up the most common classes of employment.

| Employer Class | # Employees | % Employees |
| Private Company Employees | 270 | 72.4% |
| Self-Employed (Incorporated) | 7 | 1.9% |
| Self-Employed (Not Incorporated) | 12 | 3.2% |
| Not-for-profit Organizations | 23 | 6.2% |
| Local Government Employees | 23 | 6.2% |
| State Government Employees | 26 | 7.0% |
| Federal Government Employees | 9 | 2.4% |
| Unpaid Family Workers | 3 | 0.8% |
| Total | 373 | 100.0% |
Employment Status by Age in Mannsville
According to the labor force statistics for Mannsville, out of the total population over 16 years of age (730), 54.1% or 395 individuals are in the labor force, with 4.6% or 18 of them unemployed. The age group with the highest labor force participation rate is 20 to 24 years, with 90.5% or 57 individuals in the labor force. Within the labor force, the 16 to 19 years age range has the highest percentage of unemployed individuals, with 20.0% or 1 of them being unemployed.
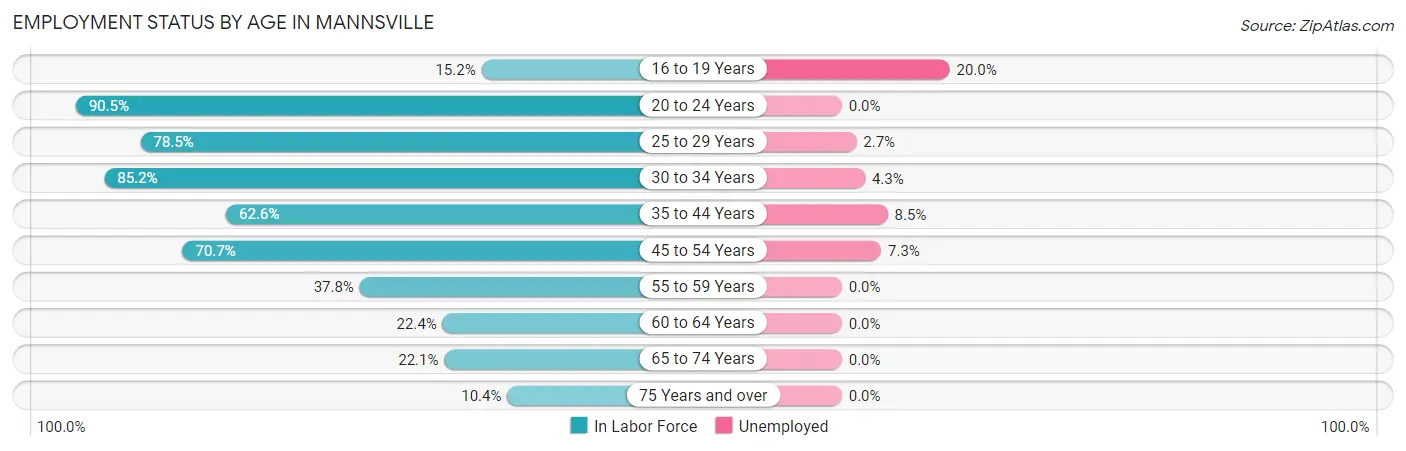
| Age Bracket | In Labor Force | Unemployed |
| 16 to 19 Years | 5 (15.2%) | 1 (20.0%) |
| 20 to 24 Years | 57 (90.5%) | 0 (0.0%) |
| 25 to 29 Years | 73 (78.5%) | 2 (2.7%) |
| 30 to 34 Years | 46 (85.2%) | 2 (4.3%) |
| 35 to 44 Years | 82 (62.6%) | 7 (8.5%) |
| 45 to 54 Years | 82 (70.7%) | 6 (7.3%) |
| 55 to 59 Years | 14 (37.8%) | 0 (0.0%) |
| 60 to 64 Years | 11 (22.4%) | 0 (0.0%) |
| 65 to 74 Years | 17 (22.1%) | 0 (0.0%) |
| 75 Years and over | 8 (10.4%) | 0 (0.0%) |
| Total | 395 (54.1%) | 18 (4.6%) |
Employment Status by Educational Attainment in Mannsville
According to labor force statistics for Mannsville, 64.2% of individuals (308) out of the total population between 25 and 64 years of age (480) are in the labor force, with 5.5% or 17 of them being unemployed. The group with the highest labor force participation rate are those with the educational attainment of bachelor's degree or higher, with 100.0% or 17 individuals in the labor force. Within the labor force, individuals with high school diploma education have the highest percentage of unemployment, with 7.1% or 12 of them being unemployed.
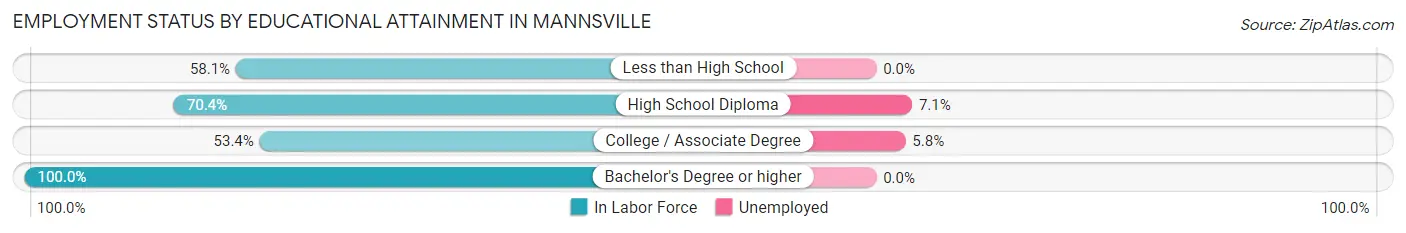
| Educational Attainment | In Labor Force | Unemployed |
| Less than High School | 36 (58.1%) | 0 (0.0%) |
| High School Diploma | 169 (70.4%) | 17 (7.1%) |
| College / Associate Degree | 86 (53.4%) | 9 (5.8%) |
| Bachelor's Degree or higher | 17 (100.0%) | 0 (0.0%) |
| Total | 308 (64.2%) | 26 (5.5%) |
Employment Occupations by Sex in Mannsville
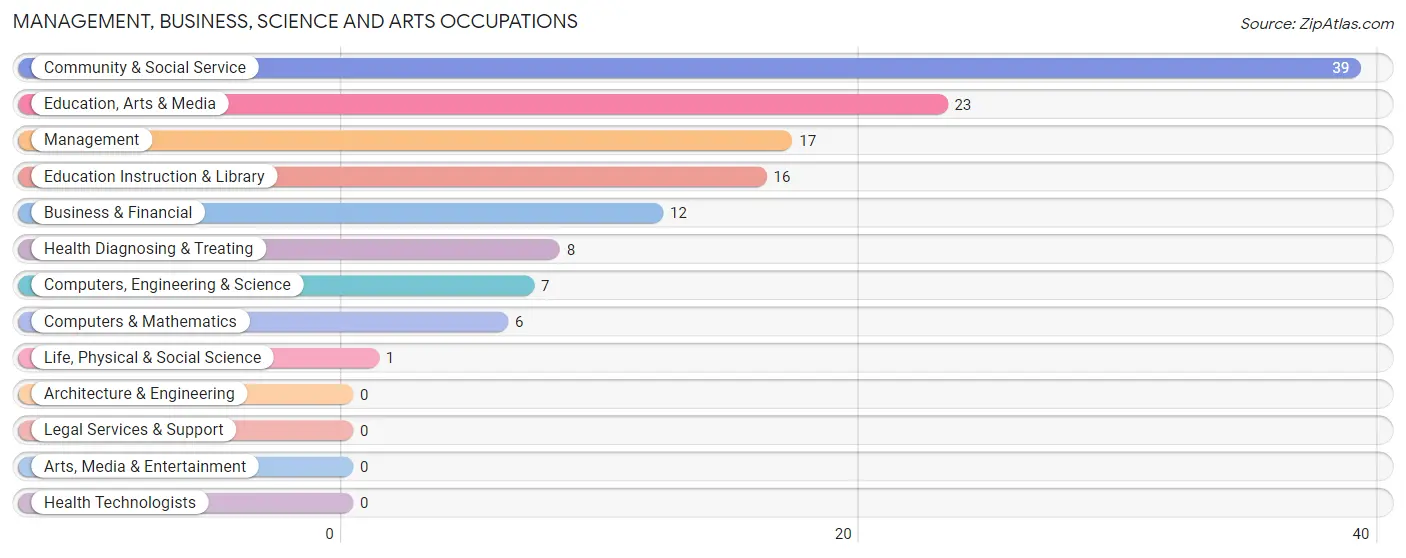
Management, Business, Science and Arts Occupations
The most common Management, Business, Science and Arts occupations in Mannsville are Community & Social Service (39 | 10.3%), Education, Arts & Media (23 | 6.1%), Management (17 | 4.5%), Education Instruction & Library (16 | 4.2%), and Business & Financial (12 | 3.2%).
Management, Business, Science and Arts Occupations by Sex
Within the Management, Business, Science and Arts occupations in Mannsville, the most male-oriented occupations are Computers & Mathematics (100.0%), Computers, Engineering & Science (85.7%), and Business & Financial (83.3%), while the most female-oriented occupations are Life, Physical & Social Science (100.0%), Health Diagnosing & Treating (87.5%), and Education, Arts & Media (82.6%).
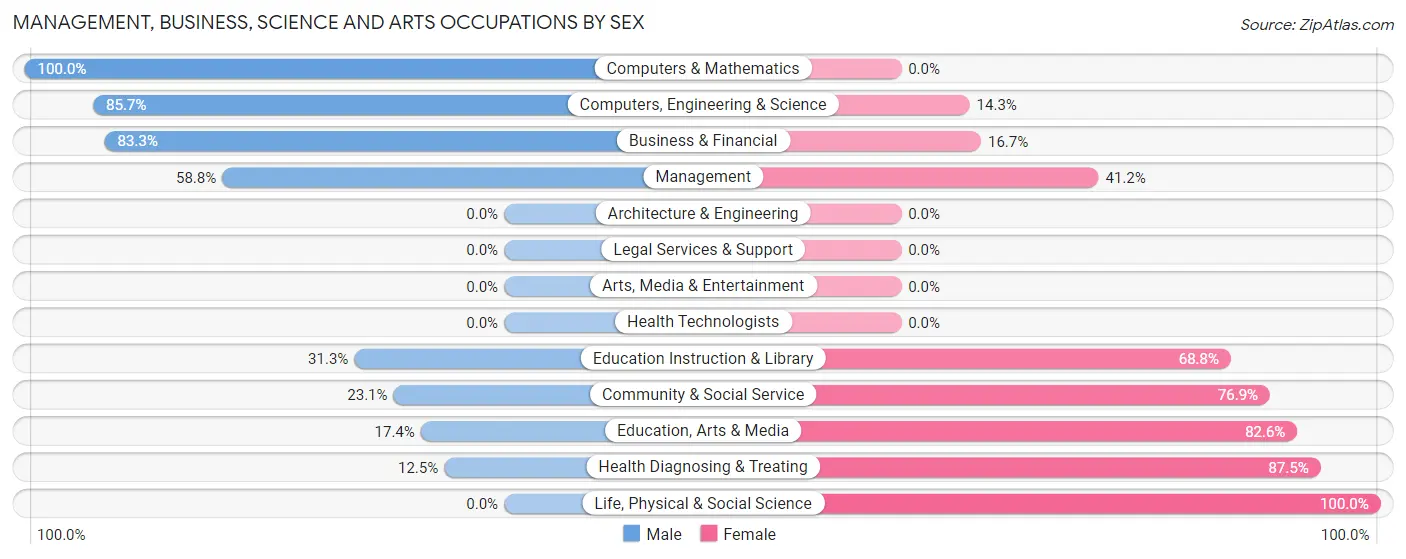
| Occupation | Male | Female |
| Management | 10 (58.8%) | 7 (41.2%) |
| Business & Financial | 10 (83.3%) | 2 (16.7%) |
| Computers, Engineering & Science | 6 (85.7%) | 1 (14.3%) |
| Computers & Mathematics | 6 (100.0%) | 0 (0.0%) |
| Architecture & Engineering | 0 (0.0%) | 0 (0.0%) |
| Life, Physical & Social Science | 0 (0.0%) | 1 (100.0%) |
| Community & Social Service | 9 (23.1%) | 30 (76.9%) |
| Education, Arts & Media | 4 (17.4%) | 19 (82.6%) |
| Legal Services & Support | 0 (0.0%) | 0 (0.0%) |
| Education Instruction & Library | 5 (31.2%) | 11 (68.8%) |
| Arts, Media & Entertainment | 0 (0.0%) | 0 (0.0%) |
| Health Diagnosing & Treating | 1 (12.5%) | 7 (87.5%) |
| Health Technologists | 0 (0.0%) | 0 (0.0%) |
| Total (Category) | 36 (43.4%) | 47 (56.6%) |
| Total (Overall) | 190 (50.4%) | 187 (49.6%) |
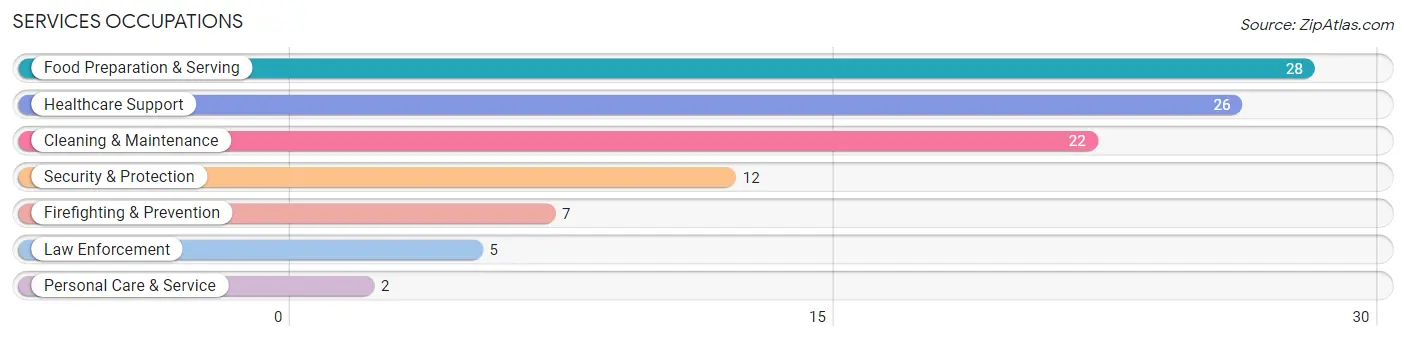
Services Occupations
The most common Services occupations in Mannsville are Food Preparation & Serving (28 | 7.4%), Healthcare Support (26 | 6.9%), Cleaning & Maintenance (22 | 5.8%), Security & Protection (12 | 3.2%), and Firefighting & Prevention (7 | 1.9%).
Services Occupations by Sex
Within the Services occupations in Mannsville, the most male-oriented occupations are Security & Protection (100.0%), Firefighting & Prevention (100.0%), and Law Enforcement (100.0%), while the most female-oriented occupations are Food Preparation & Serving (100.0%), Personal Care & Service (100.0%), and Healthcare Support (84.6%).
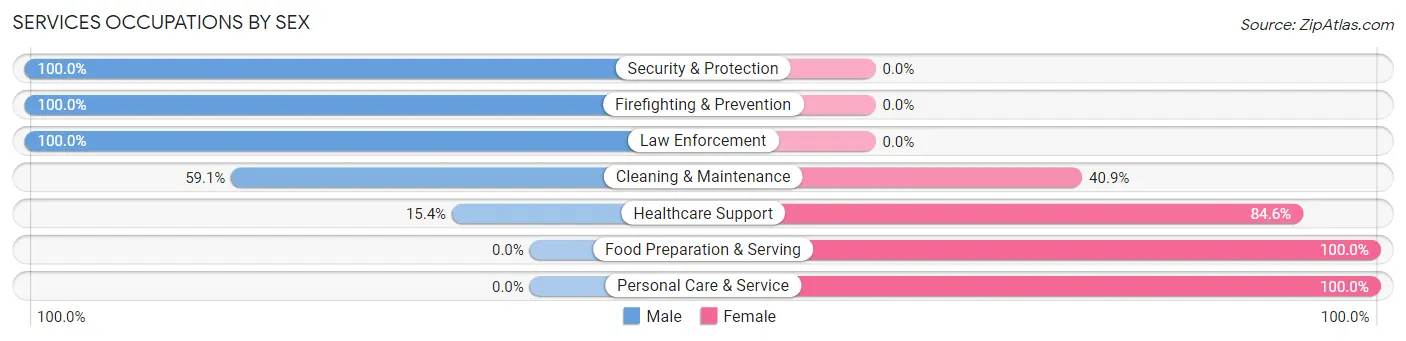
| Occupation | Male | Female |
| Healthcare Support | 4 (15.4%) | 22 (84.6%) |
| Security & Protection | 12 (100.0%) | 0 (0.0%) |
| Firefighting & Prevention | 7 (100.0%) | 0 (0.0%) |
| Law Enforcement | 5 (100.0%) | 0 (0.0%) |
| Food Preparation & Serving | 0 (0.0%) | 28 (100.0%) |
| Cleaning & Maintenance | 13 (59.1%) | 9 (40.9%) |
| Personal Care & Service | 0 (0.0%) | 2 (100.0%) |
| Total (Category) | 29 (32.2%) | 61 (67.8%) |
| Total (Overall) | 190 (50.4%) | 187 (49.6%) |
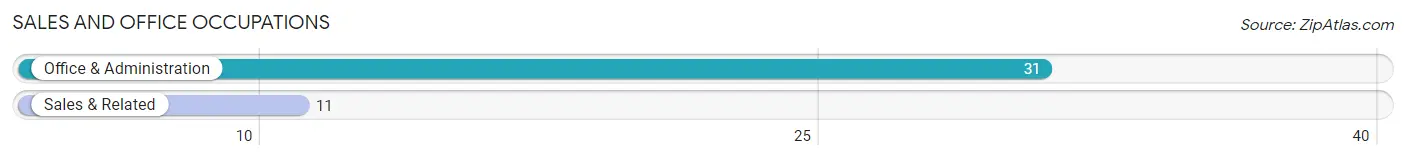
Sales and Office Occupations
The most common Sales and Office occupations in Mannsville are Office & Administration (31 | 8.2%), and Sales & Related (11 | 2.9%).
Sales and Office Occupations by Sex
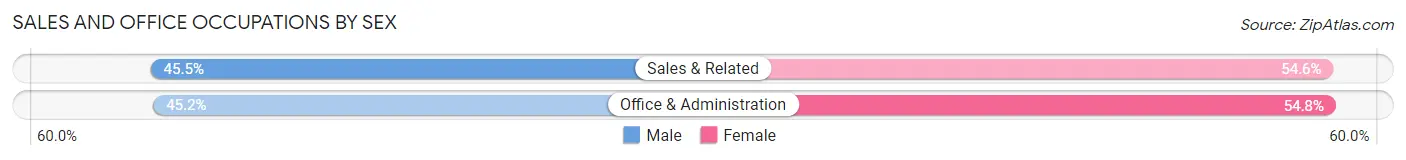
| Occupation | Male | Female |
| Sales & Related | 5 (45.5%) | 6 (54.5%) |
| Office & Administration | 14 (45.2%) | 17 (54.8%) |
| Total (Category) | 19 (45.2%) | 23 (54.8%) |
| Total (Overall) | 190 (50.4%) | 187 (49.6%) |
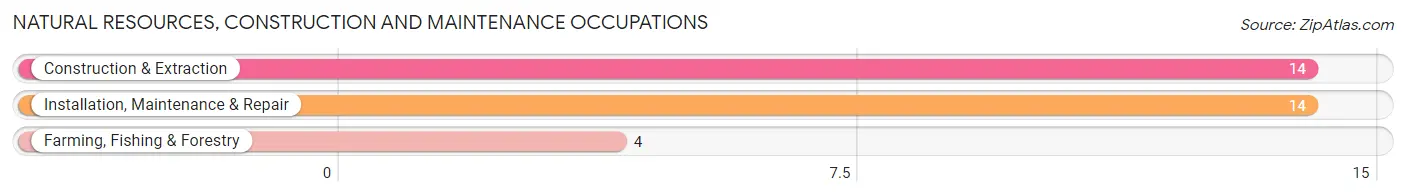
Natural Resources, Construction and Maintenance Occupations
The most common Natural Resources, Construction and Maintenance occupations in Mannsville are Construction & Extraction (14 | 3.7%), Installation, Maintenance & Repair (14 | 3.7%), and Farming, Fishing & Forestry (4 | 1.1%).
Natural Resources, Construction and Maintenance Occupations by Sex
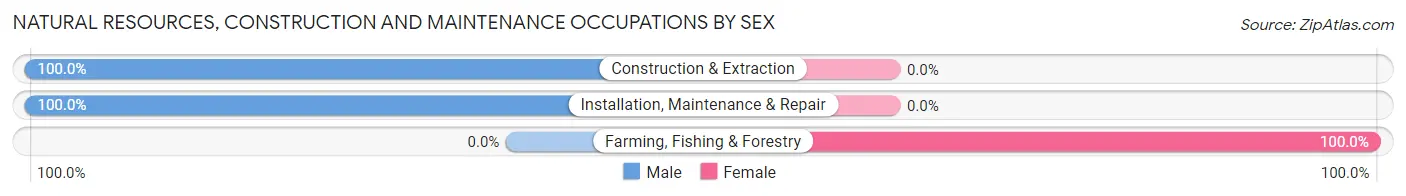
| Occupation | Male | Female |
| Farming, Fishing & Forestry | 0 (0.0%) | 4 (100.0%) |
| Construction & Extraction | 14 (100.0%) | 0 (0.0%) |
| Installation, Maintenance & Repair | 14 (100.0%) | 0 (0.0%) |
| Total (Category) | 28 (87.5%) | 4 (12.5%) |
| Total (Overall) | 190 (50.4%) | 187 (49.6%) |
Production, Transportation and Moving Occupations
The most common Production, Transportation and Moving occupations in Mannsville are Production (64 | 17.0%), Material Moving (57 | 15.1%), and Transportation (9 | 2.4%).
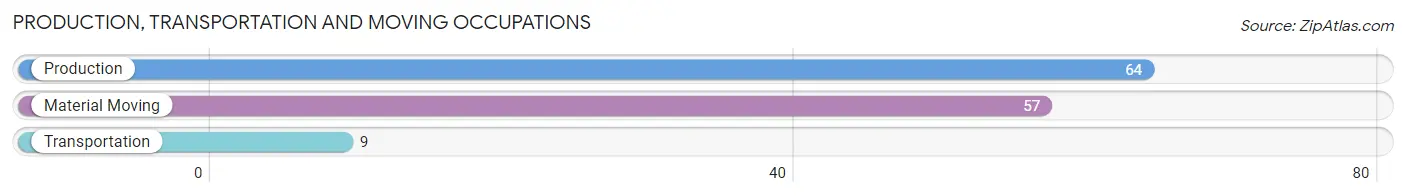
Production, Transportation and Moving Occupations by Sex
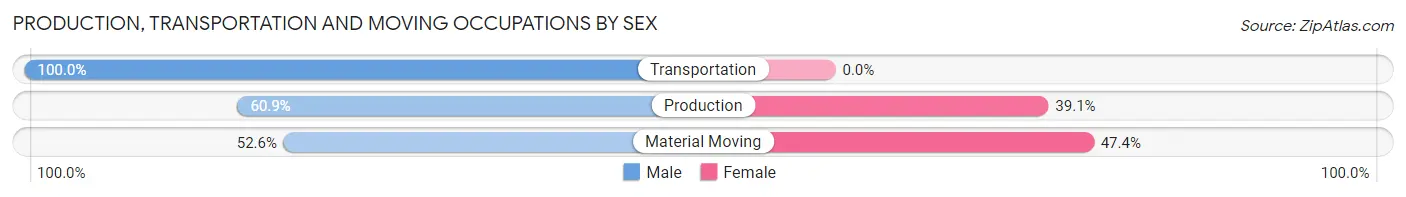
| Occupation | Male | Female |
| Production | 39 (60.9%) | 25 (39.1%) |
| Transportation | 9 (100.0%) | 0 (0.0%) |
| Material Moving | 30 (52.6%) | 27 (47.4%) |
| Total (Category) | 78 (60.0%) | 52 (40.0%) |
| Total (Overall) | 190 (50.4%) | 187 (49.6%) |
Employment Industries by Sex in Mannsville
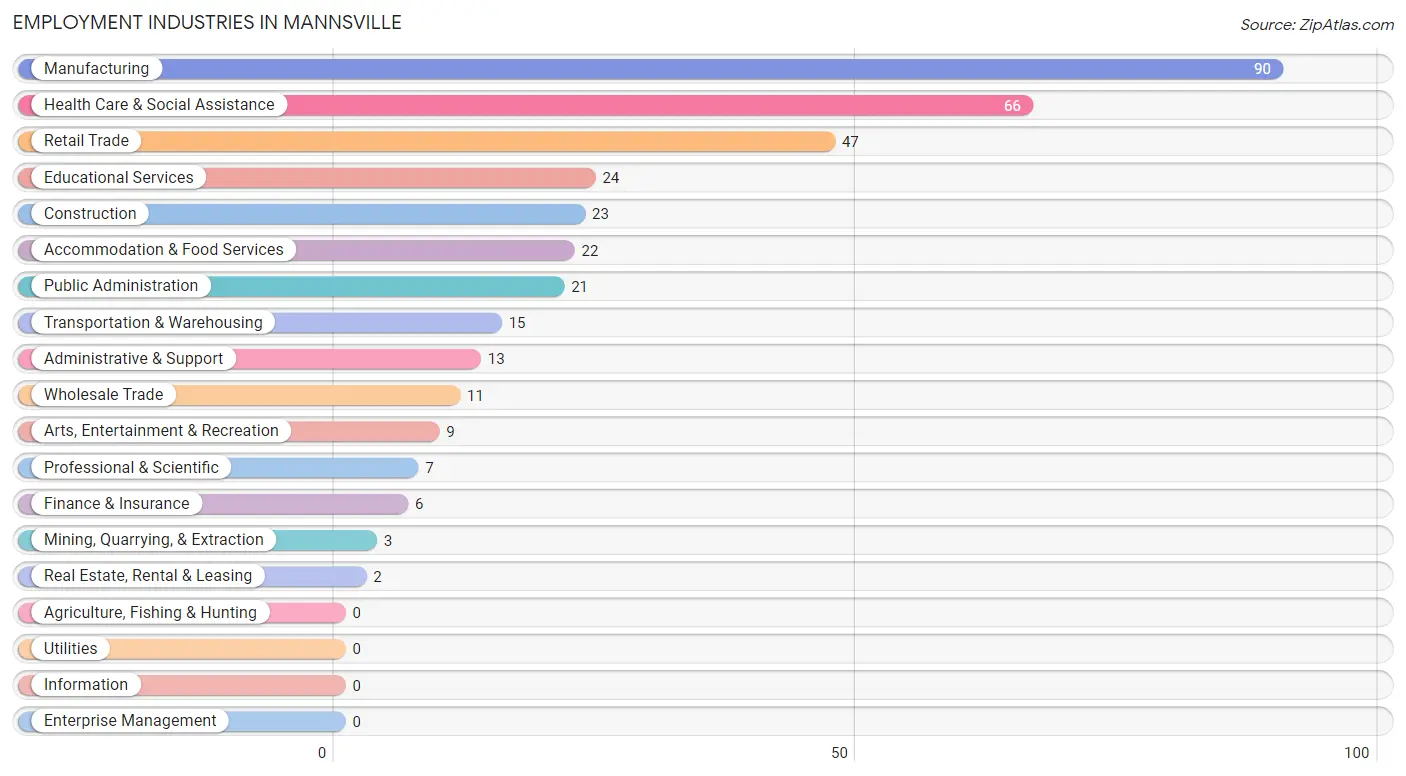
Employment Industries in Mannsville
The major employment industries in Mannsville include Manufacturing (90 | 23.9%), Health Care & Social Assistance (66 | 17.5%), Retail Trade (47 | 12.5%), Educational Services (24 | 6.4%), and Construction (23 | 6.1%).
Employment Industries by Sex in Mannsville
The Mannsville industries that see more men than women are Mining, Quarrying, & Extraction (100.0%), Wholesale Trade (100.0%), and Transportation & Warehousing (100.0%), whereas the industries that tend to have a higher number of women are Finance & Insurance (100.0%), Real Estate, Rental & Leasing (100.0%), and Accommodation & Food Services (100.0%).
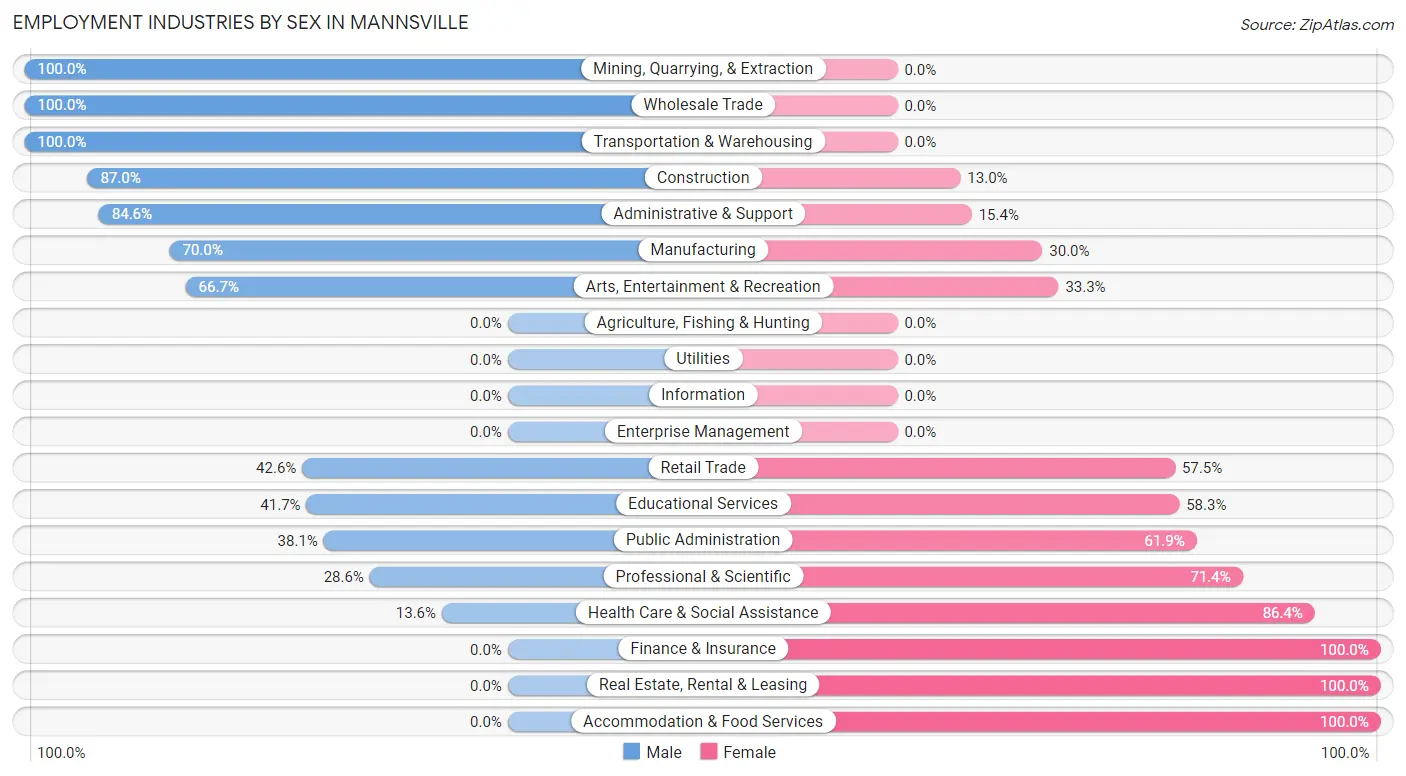
| Industry | Male | Female |
| Agriculture, Fishing & Hunting | 0 (0.0%) | 0 (0.0%) |
| Mining, Quarrying, & Extraction | 3 (100.0%) | 0 (0.0%) |
| Construction | 20 (87.0%) | 3 (13.0%) |
| Manufacturing | 63 (70.0%) | 27 (30.0%) |
| Wholesale Trade | 11 (100.0%) | 0 (0.0%) |
| Retail Trade | 20 (42.5%) | 27 (57.5%) |
| Transportation & Warehousing | 15 (100.0%) | 0 (0.0%) |
| Utilities | 0 (0.0%) | 0 (0.0%) |
| Information | 0 (0.0%) | 0 (0.0%) |
| Finance & Insurance | 0 (0.0%) | 6 (100.0%) |
| Real Estate, Rental & Leasing | 0 (0.0%) | 2 (100.0%) |
| Professional & Scientific | 2 (28.6%) | 5 (71.4%) |
| Enterprise Management | 0 (0.0%) | 0 (0.0%) |
| Administrative & Support | 11 (84.6%) | 2 (15.4%) |
| Educational Services | 10 (41.7%) | 14 (58.3%) |
| Health Care & Social Assistance | 9 (13.6%) | 57 (86.4%) |
| Arts, Entertainment & Recreation | 6 (66.7%) | 3 (33.3%) |
| Accommodation & Food Services | 0 (0.0%) | 22 (100.0%) |
| Public Administration | 8 (38.1%) | 13 (61.9%) |
| Total | 190 (50.4%) | 187 (49.6%) |
Education in Mannsville
School Enrollment in Mannsville
The most common levels of schooling among the 233 students in Mannsville are elementary school (79 | 33.9%), middle school (50 | 21.5%), and high school (37 | 15.9%).
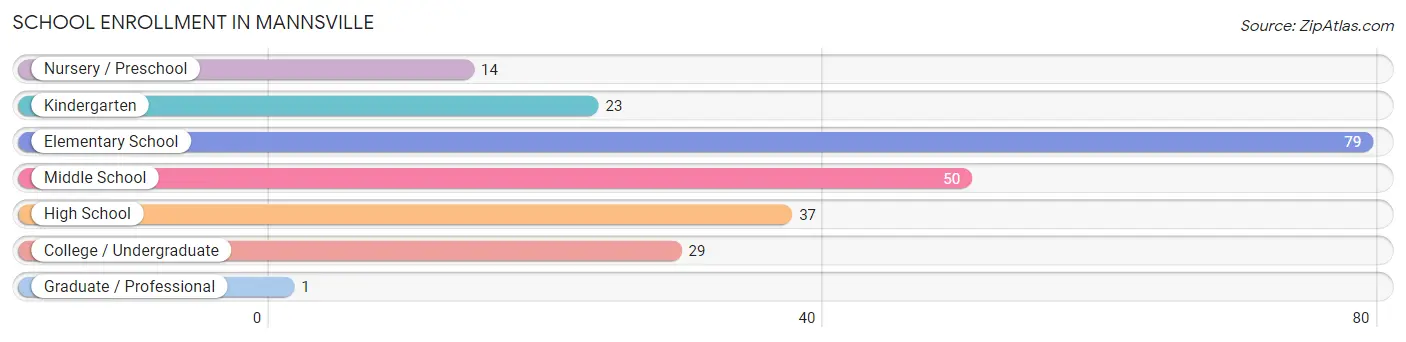
| School Level | # Students | % Students |
| Nursery / Preschool | 14 | 6.0% |
| Kindergarten | 23 | 9.9% |
| Elementary School | 79 | 33.9% |
| Middle School | 50 | 21.5% |
| High School | 37 | 15.9% |
| College / Undergraduate | 29 | 12.4% |
| Graduate / Professional | 1 | 0.4% |
| Total | 233 | 100.0% |
School Enrollment by Age by Funding Source in Mannsville
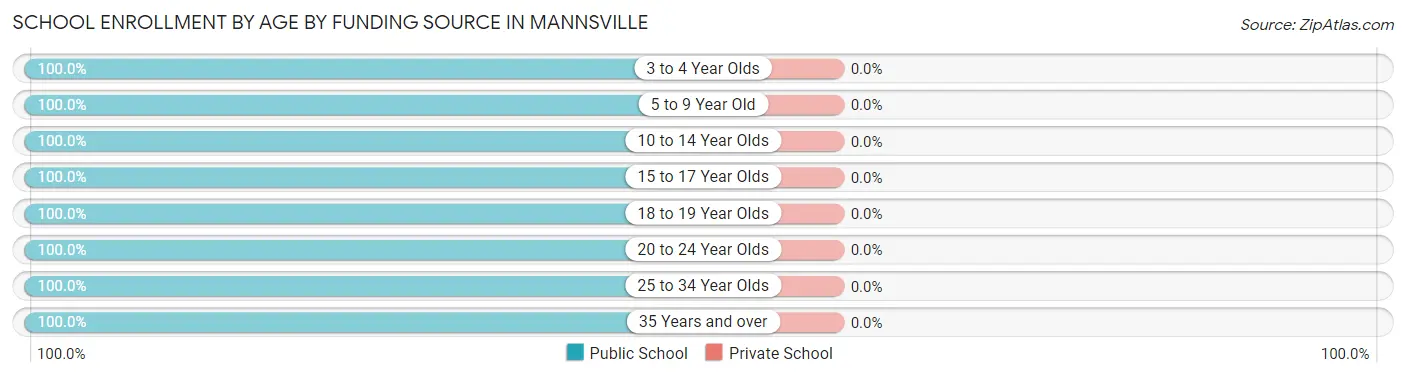
| Age Bracket | Public School | Private School |
| 3 to 4 Year Olds | 17 (100.0%) | 0 (0.0%) |
| 5 to 9 Year Old | 89 (100.0%) | 0 (0.0%) |
| 10 to 14 Year Olds | 71 (100.0%) | 0 (0.0%) |
| 15 to 17 Year Olds | 22 (100.0%) | 0 (0.0%) |
| 18 to 19 Year Olds | 2 (100.0%) | 0 (0.0%) |
| 20 to 24 Year Olds | 24 (100.0%) | 0 (0.0%) |
| 25 to 34 Year Olds | 7 (100.0%) | 0 (0.0%) |
| 35 Years and over | 1 (100.0%) | 0 (0.0%) |
| Total | 233 (100.0%) | 0 (0.0%) |
Educational Attainment by Field of Study in Mannsville
Business (13 | 39.4%), education (6 | 18.2%), bio, nature & agricultural (4 | 12.1%), science & technology (4 | 12.1%), and psychology (3 | 9.1%) are the most common fields of study among 33 individuals in Mannsville who have obtained a bachelor's degree or higher.
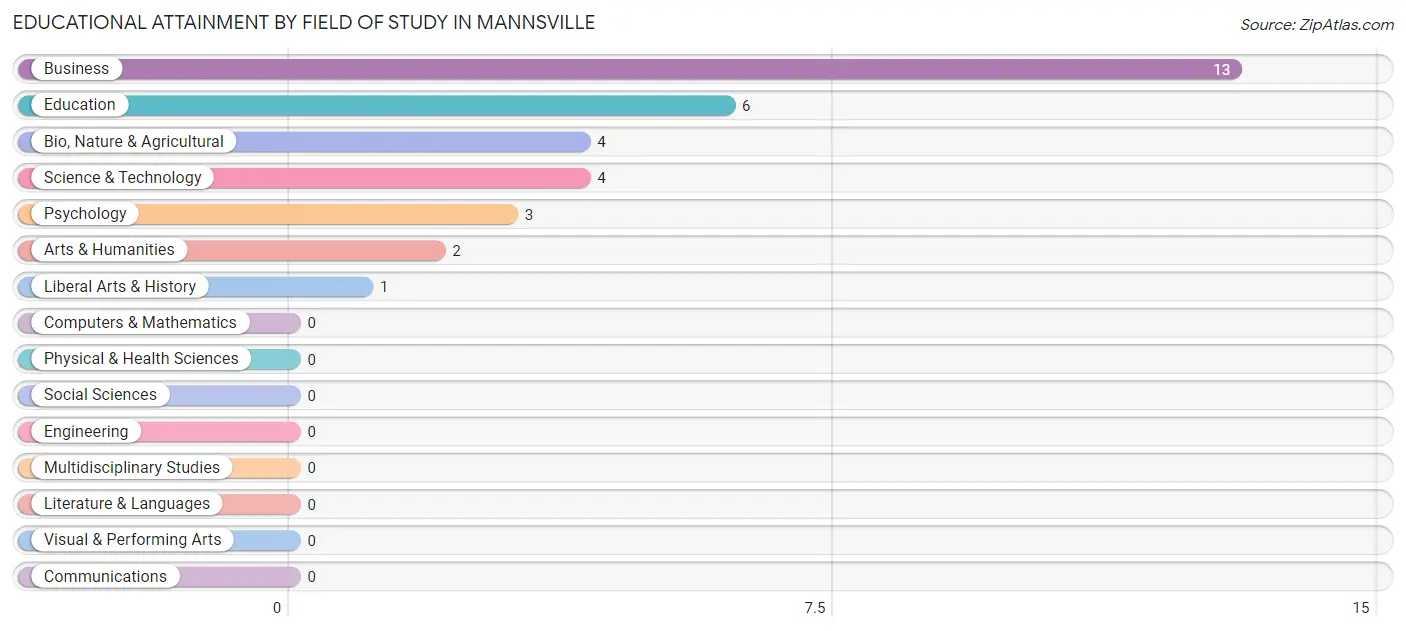
| Field of Study | # Graduates | % Graduates |
| Computers & Mathematics | 0 | 0.0% |
| Bio, Nature & Agricultural | 4 | 12.1% |
| Physical & Health Sciences | 0 | 0.0% |
| Psychology | 3 | 9.1% |
| Social Sciences | 0 | 0.0% |
| Engineering | 0 | 0.0% |
| Multidisciplinary Studies | 0 | 0.0% |
| Science & Technology | 4 | 12.1% |
| Business | 13 | 39.4% |
| Education | 6 | 18.2% |
| Literature & Languages | 0 | 0.0% |
| Liberal Arts & History | 1 | 3.0% |
| Visual & Performing Arts | 0 | 0.0% |
| Communications | 0 | 0.0% |
| Arts & Humanities | 2 | 6.1% |
| Total | 33 | 100.0% |
Transportation & Commute in Mannsville
Vehicle Availability by Sex in Mannsville
The most prevalent vehicle ownership categories in Mannsville are males with 2 vehicles (92, accounting for 48.4%) and females with 2 vehicles (76, making up 50.3%).
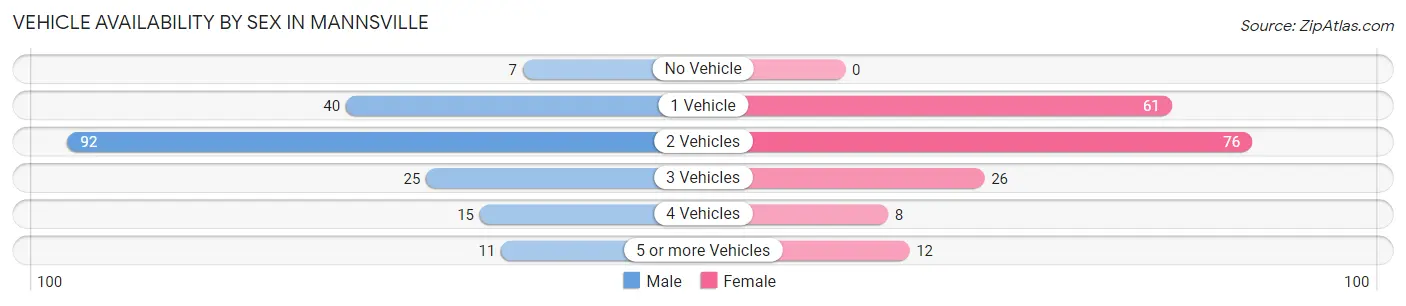
| Vehicles Available | Male | Female |
| No Vehicle | 7 (3.7%) | 0 (0.0%) |
| 1 Vehicle | 40 (21.0%) | 61 (33.3%) |
| 2 Vehicles | 92 (48.4%) | 76 (41.5%) |
| 3 Vehicles | 25 (13.2%) | 26 (14.2%) |
| 4 Vehicles | 15 (7.9%) | 8 (4.4%) |
| 5 or more Vehicles | 11 (5.8%) | 12 (6.6%) |
| Total | 190 (100.0%) | 183 (100.0%) |
Commute Time in Mannsville
The most frequently occuring commute durations in Mannsville are 30 to 34 minutes (96 commuters, 25.7%), 20 to 24 minutes (88 commuters, 23.6%), and 10 to 14 minutes (50 commuters, 13.4%).
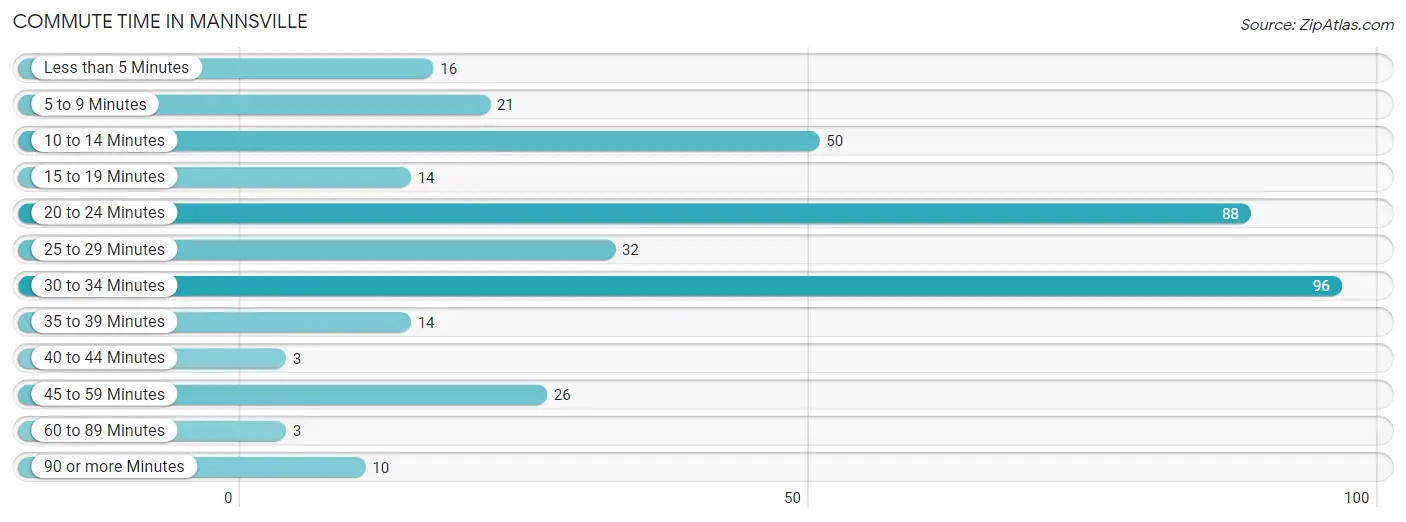
| Commute Time | # Commuters | % Commuters |
| Less than 5 Minutes | 16 | 4.3% |
| 5 to 9 Minutes | 21 | 5.6% |
| 10 to 14 Minutes | 50 | 13.4% |
| 15 to 19 Minutes | 14 | 3.7% |
| 20 to 24 Minutes | 88 | 23.6% |
| 25 to 29 Minutes | 32 | 8.6% |
| 30 to 34 Minutes | 96 | 25.7% |
| 35 to 39 Minutes | 14 | 3.7% |
| 40 to 44 Minutes | 3 | 0.8% |
| 45 to 59 Minutes | 26 | 7.0% |
| 60 to 89 Minutes | 3 | 0.8% |
| 90 or more Minutes | 10 | 2.7% |
Commute Time by Sex in Mannsville
The most common commute times in Mannsville are 30 to 34 minutes (42 commuters, 22.1%) for males and 20 to 24 minutes (54 commuters, 29.5%) for females.
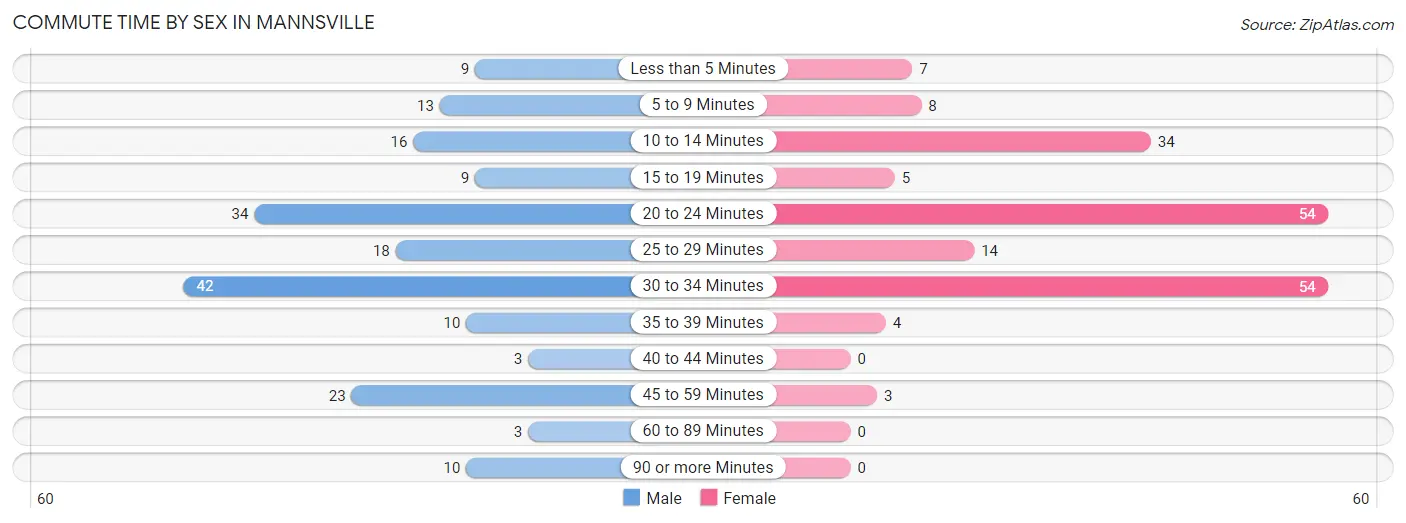
| Commute Time | Male | Female |
| Less than 5 Minutes | 9 (4.7%) | 7 (3.8%) |
| 5 to 9 Minutes | 13 (6.8%) | 8 (4.4%) |
| 10 to 14 Minutes | 16 (8.4%) | 34 (18.6%) |
| 15 to 19 Minutes | 9 (4.7%) | 5 (2.7%) |
| 20 to 24 Minutes | 34 (17.9%) | 54 (29.5%) |
| 25 to 29 Minutes | 18 (9.5%) | 14 (7.6%) |
| 30 to 34 Minutes | 42 (22.1%) | 54 (29.5%) |
| 35 to 39 Minutes | 10 (5.3%) | 4 (2.2%) |
| 40 to 44 Minutes | 3 (1.6%) | 0 (0.0%) |
| 45 to 59 Minutes | 23 (12.1%) | 3 (1.6%) |
| 60 to 89 Minutes | 3 (1.6%) | 0 (0.0%) |
| 90 or more Minutes | 10 (5.3%) | 0 (0.0%) |
Time of Departure to Work by Sex in Mannsville
The most frequent times of departure to work in Mannsville are 6:00 AM to 6:29 AM (48, 25.3%) for males and 6:30 AM to 6:59 AM (37, 20.2%) for females.
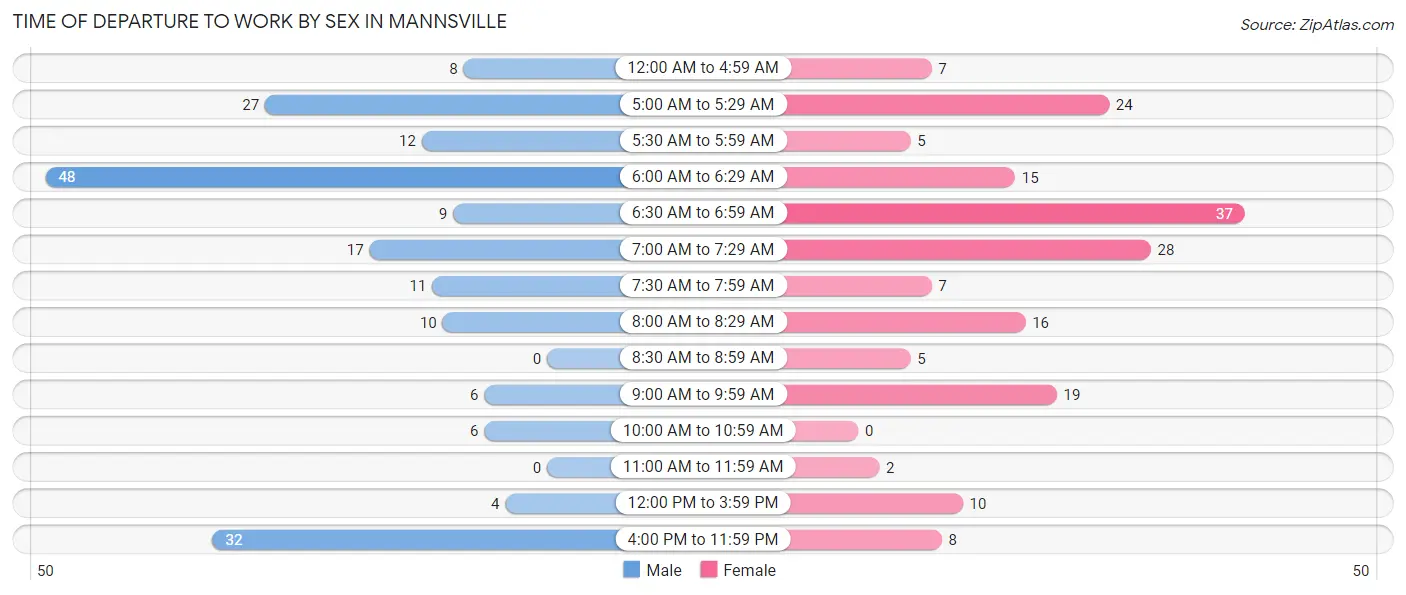
| Time of Departure | Male | Female |
| 12:00 AM to 4:59 AM | 8 (4.2%) | 7 (3.8%) |
| 5:00 AM to 5:29 AM | 27 (14.2%) | 24 (13.1%) |
| 5:30 AM to 5:59 AM | 12 (6.3%) | 5 (2.7%) |
| 6:00 AM to 6:29 AM | 48 (25.3%) | 15 (8.2%) |
| 6:30 AM to 6:59 AM | 9 (4.7%) | 37 (20.2%) |
| 7:00 AM to 7:29 AM | 17 (8.9%) | 28 (15.3%) |
| 7:30 AM to 7:59 AM | 11 (5.8%) | 7 (3.8%) |
| 8:00 AM to 8:29 AM | 10 (5.3%) | 16 (8.7%) |
| 8:30 AM to 8:59 AM | 0 (0.0%) | 5 (2.7%) |
| 9:00 AM to 9:59 AM | 6 (3.2%) | 19 (10.4%) |
| 10:00 AM to 10:59 AM | 6 (3.2%) | 0 (0.0%) |
| 11:00 AM to 11:59 AM | 0 (0.0%) | 2 (1.1%) |
| 12:00 PM to 3:59 PM | 4 (2.1%) | 10 (5.5%) |
| 4:00 PM to 11:59 PM | 32 (16.8%) | 8 (4.4%) |
| Total | 190 (100.0%) | 183 (100.0%) |
Housing Occupancy in Mannsville
Occupancy by Ownership in Mannsville
Of the total 376 dwellings in Mannsville, owner-occupied units account for 284 (75.5%), while renter-occupied units make up 92 (24.5%).
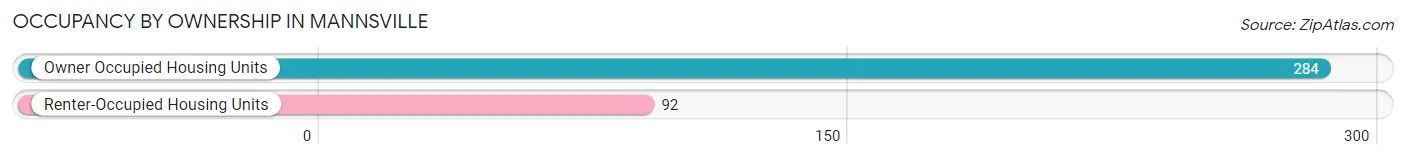
| Occupancy | # Housing Units | % Housing Units |
| Owner Occupied Housing Units | 284 | 75.5% |
| Renter-Occupied Housing Units | 92 | 24.5% |
| Total Occupied Housing Units | 376 | 100.0% |
Occupancy by Household Size in Mannsville
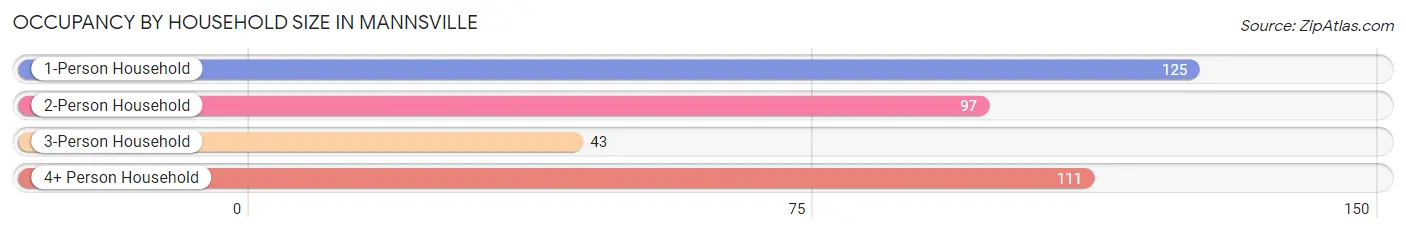
| Household Size | # Housing Units | % Housing Units |
| 1-Person Household | 125 | 33.2% |
| 2-Person Household | 97 | 25.8% |
| 3-Person Household | 43 | 11.4% |
| 4+ Person Household | 111 | 29.5% |
| Total Housing Units | 376 | 100.0% |
Occupancy by Ownership by Household Size in Mannsville
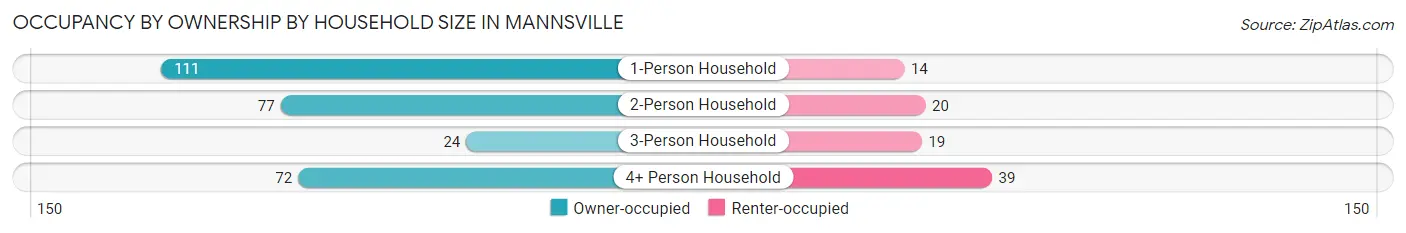
| Household Size | Owner-occupied | Renter-occupied |
| 1-Person Household | 111 (88.8%) | 14 (11.2%) |
| 2-Person Household | 77 (79.4%) | 20 (20.6%) |
| 3-Person Household | 24 (55.8%) | 19 (44.2%) |
| 4+ Person Household | 72 (64.9%) | 39 (35.1%) |
| Total Housing Units | 284 (75.5%) | 92 (24.5%) |
Occupancy by Educational Attainment in Mannsville
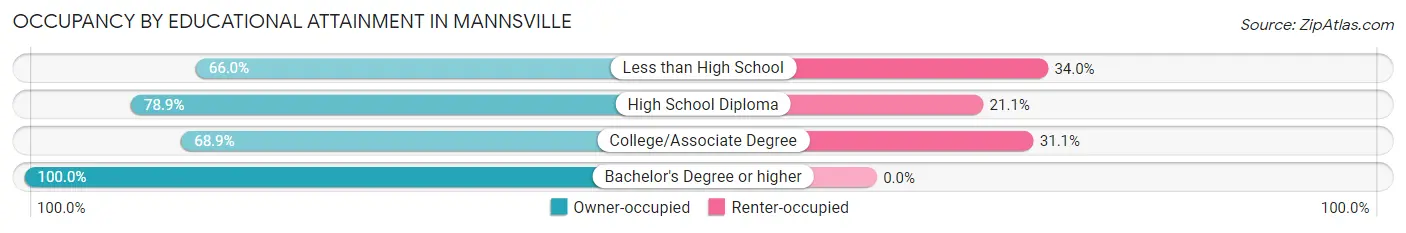
| Household Size | Owner-occupied | Renter-occupied |
| Less than High School | 35 (66.0%) | 18 (34.0%) |
| High School Diploma | 157 (78.9%) | 42 (21.1%) |
| College/Associate Degree | 71 (68.9%) | 32 (31.1%) |
| Bachelor's Degree or higher | 21 (100.0%) | 0 (0.0%) |
Occupancy by Age of Householder in Mannsville
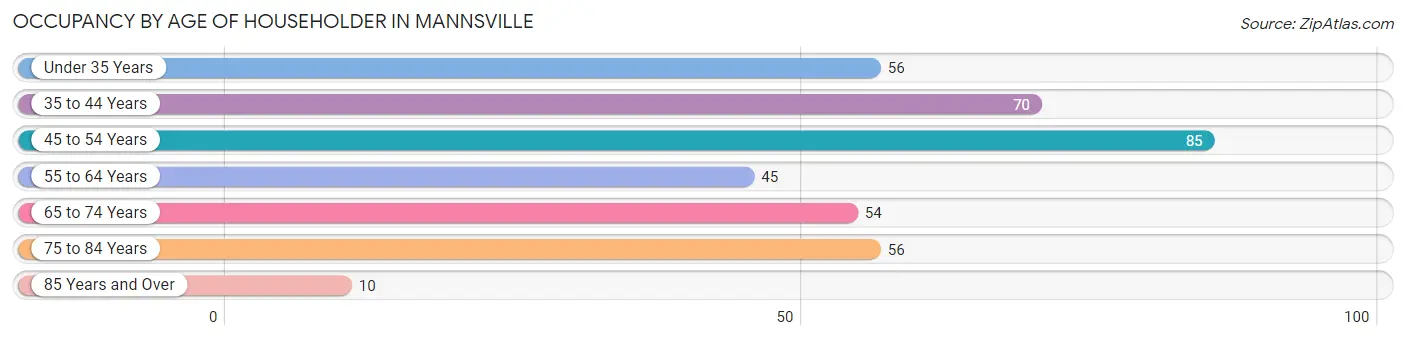
| Age Bracket | # Households | % Households |
| Under 35 Years | 56 | 14.9% |
| 35 to 44 Years | 70 | 18.6% |
| 45 to 54 Years | 85 | 22.6% |
| 55 to 64 Years | 45 | 12.0% |
| 65 to 74 Years | 54 | 14.4% |
| 75 to 84 Years | 56 | 14.9% |
| 85 Years and Over | 10 | 2.7% |
| Total | 376 | 100.0% |
Housing Finances in Mannsville
Median Income by Occupancy in Mannsville
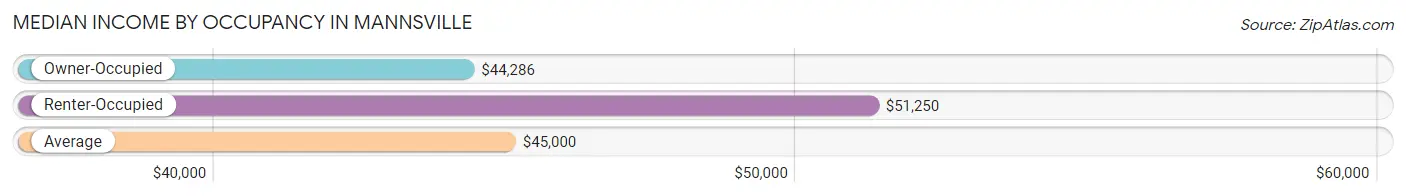
| Occupancy Type | # Households | Median Income |
| Owner-Occupied | 284 (75.5%) | $44,286 |
| Renter-Occupied | 92 (24.5%) | $51,250 |
| Average | 376 (100.0%) | $45,000 |
Occupancy by Householder Income Bracket in Mannsville
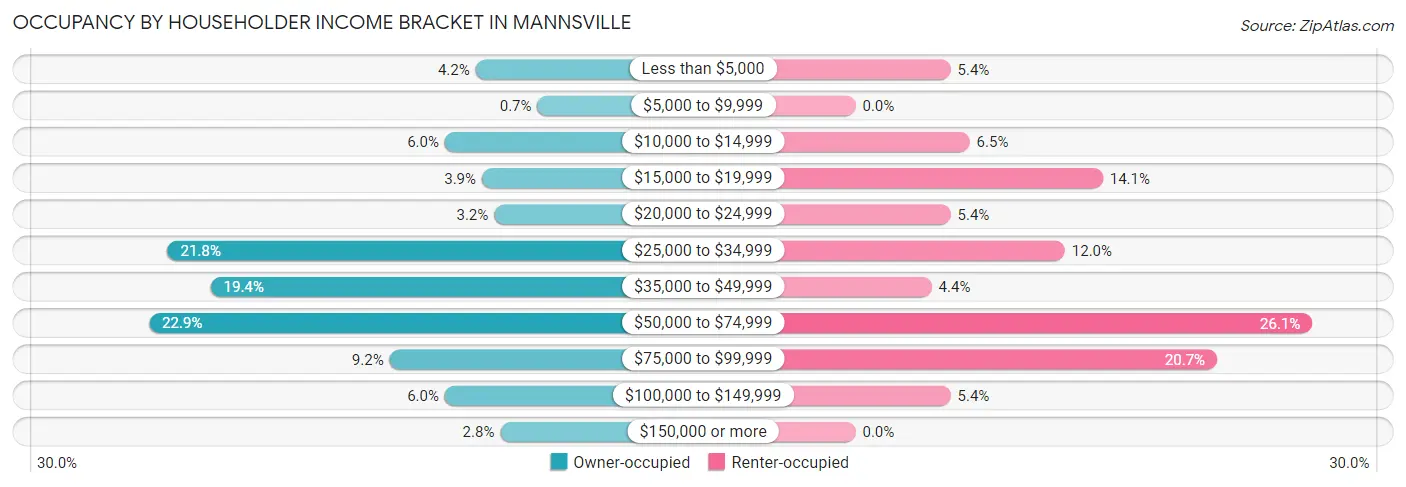
| Income Bracket | Owner-occupied | Renter-occupied |
| Less than $5,000 | 12 (4.2%) | 5 (5.4%) |
| $5,000 to $9,999 | 2 (0.7%) | 0 (0.0%) |
| $10,000 to $14,999 | 17 (6.0%) | 6 (6.5%) |
| $15,000 to $19,999 | 11 (3.9%) | 13 (14.1%) |
| $20,000 to $24,999 | 9 (3.2%) | 5 (5.4%) |
| $25,000 to $34,999 | 62 (21.8%) | 11 (12.0%) |
| $35,000 to $49,999 | 55 (19.4%) | 4 (4.3%) |
| $50,000 to $74,999 | 65 (22.9%) | 24 (26.1%) |
| $75,000 to $99,999 | 26 (9.1%) | 19 (20.6%) |
| $100,000 to $149,999 | 17 (6.0%) | 5 (5.4%) |
| $150,000 or more | 8 (2.8%) | 0 (0.0%) |
| Total | 284 (100.0%) | 92 (100.0%) |
Monthly Housing Cost Tiers in Mannsville
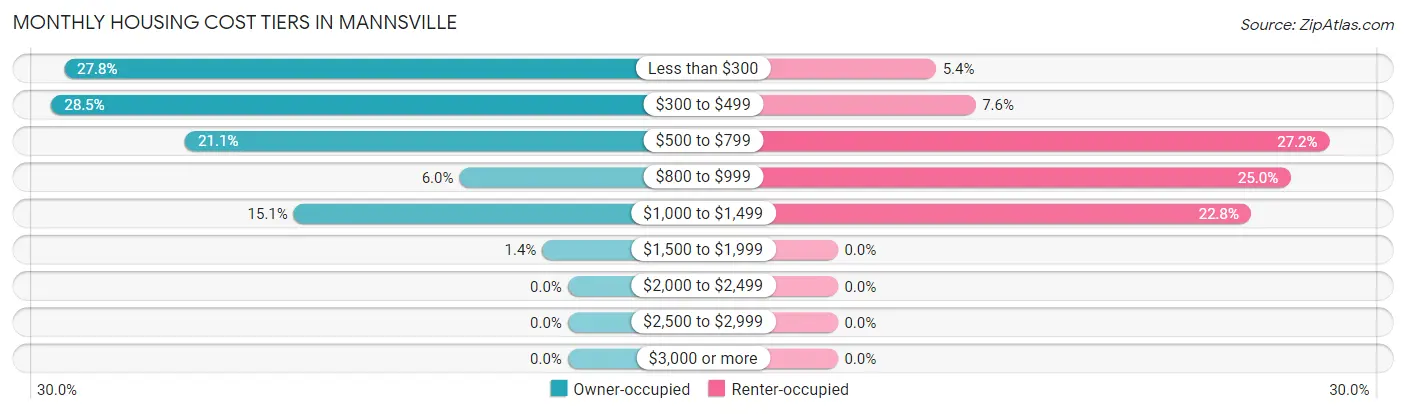
| Monthly Cost | Owner-occupied | Renter-occupied |
| Less than $300 | 79 (27.8%) | 5 (5.4%) |
| $300 to $499 | 81 (28.5%) | 7 (7.6%) |
| $500 to $799 | 60 (21.1%) | 25 (27.2%) |
| $800 to $999 | 17 (6.0%) | 23 (25.0%) |
| $1,000 to $1,499 | 43 (15.1%) | 21 (22.8%) |
| $1,500 to $1,999 | 4 (1.4%) | 0 (0.0%) |
| $2,000 to $2,499 | 0 (0.0%) | 0 (0.0%) |
| $2,500 to $2,999 | 0 (0.0%) | 0 (0.0%) |
| $3,000 or more | 0 (0.0%) | 0 (0.0%) |
| Total | 284 (100.0%) | 92 (100.0%) |
Physical Housing Characteristics in Mannsville
Housing Structures in Mannsville
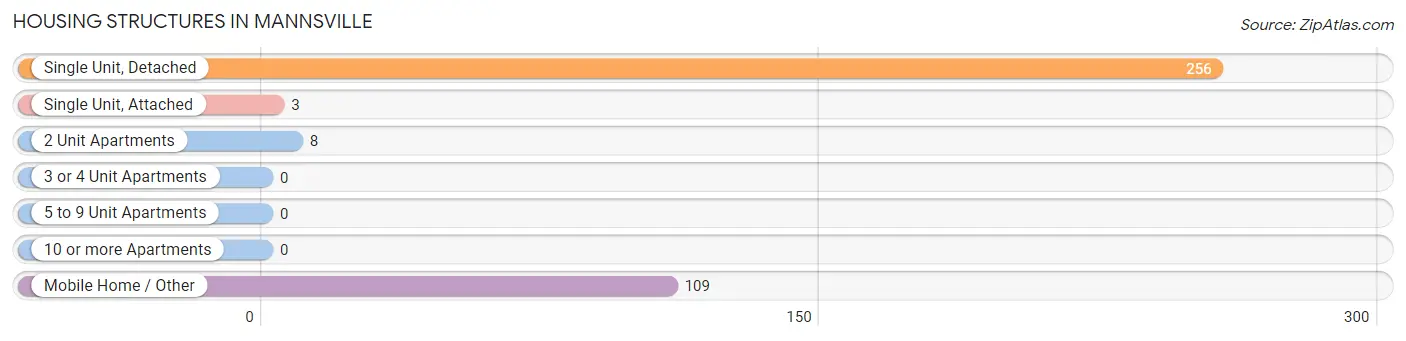
| Structure Type | # Housing Units | % Housing Units |
| Single Unit, Detached | 256 | 68.1% |
| Single Unit, Attached | 3 | 0.8% |
| 2 Unit Apartments | 8 | 2.1% |
| 3 or 4 Unit Apartments | 0 | 0.0% |
| 5 to 9 Unit Apartments | 0 | 0.0% |
| 10 or more Apartments | 0 | 0.0% |
| Mobile Home / Other | 109 | 29.0% |
| Total | 376 | 100.0% |
Housing Structures by Occupancy in Mannsville
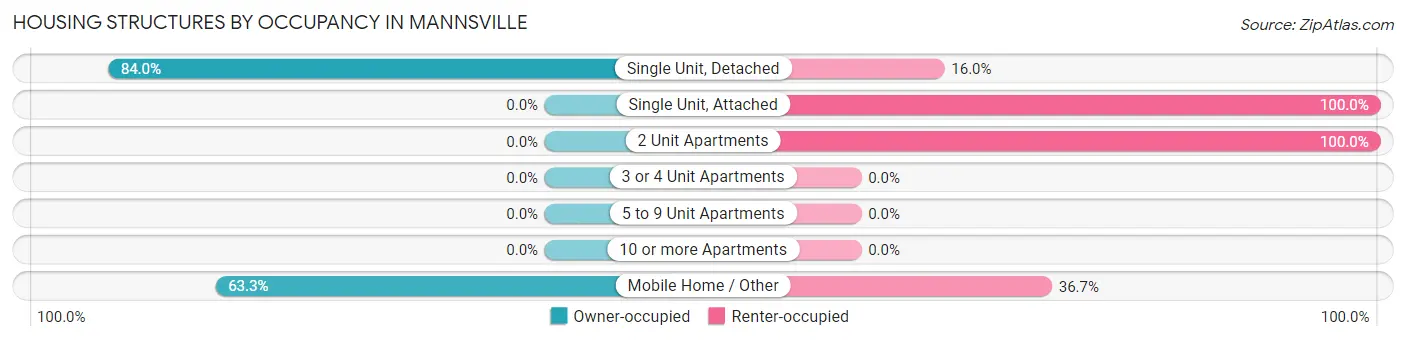
| Structure Type | Owner-occupied | Renter-occupied |
| Single Unit, Detached | 215 (84.0%) | 41 (16.0%) |
| Single Unit, Attached | 0 (0.0%) | 3 (100.0%) |
| 2 Unit Apartments | 0 (0.0%) | 8 (100.0%) |
| 3 or 4 Unit Apartments | 0 (0.0%) | 0 (0.0%) |
| 5 to 9 Unit Apartments | 0 (0.0%) | 0 (0.0%) |
| 10 or more Apartments | 0 (0.0%) | 0 (0.0%) |
| Mobile Home / Other | 69 (63.3%) | 40 (36.7%) |
| Total | 284 (75.5%) | 92 (24.5%) |
Housing Structures by Number of Rooms in Mannsville
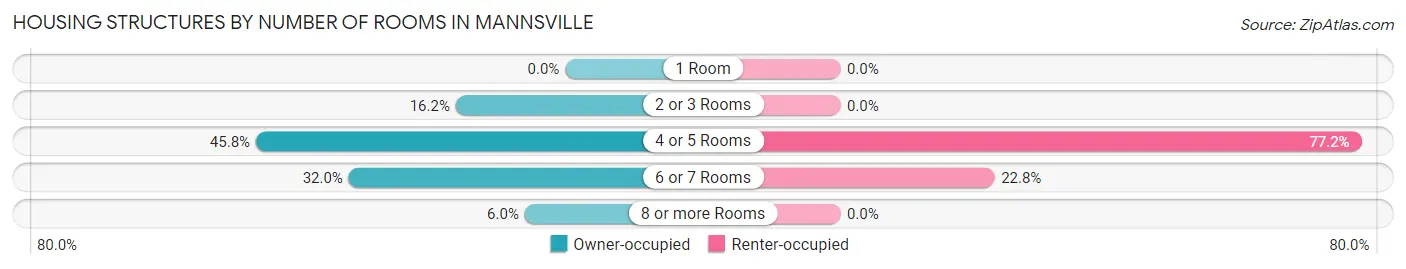
| Number of Rooms | Owner-occupied | Renter-occupied |
| 1 Room | 0 (0.0%) | 0 (0.0%) |
| 2 or 3 Rooms | 46 (16.2%) | 0 (0.0%) |
| 4 or 5 Rooms | 130 (45.8%) | 71 (77.2%) |
| 6 or 7 Rooms | 91 (32.0%) | 21 (22.8%) |
| 8 or more Rooms | 17 (6.0%) | 0 (0.0%) |
| Total | 284 (100.0%) | 92 (100.0%) |
Housing Structure by Heating Type in Mannsville
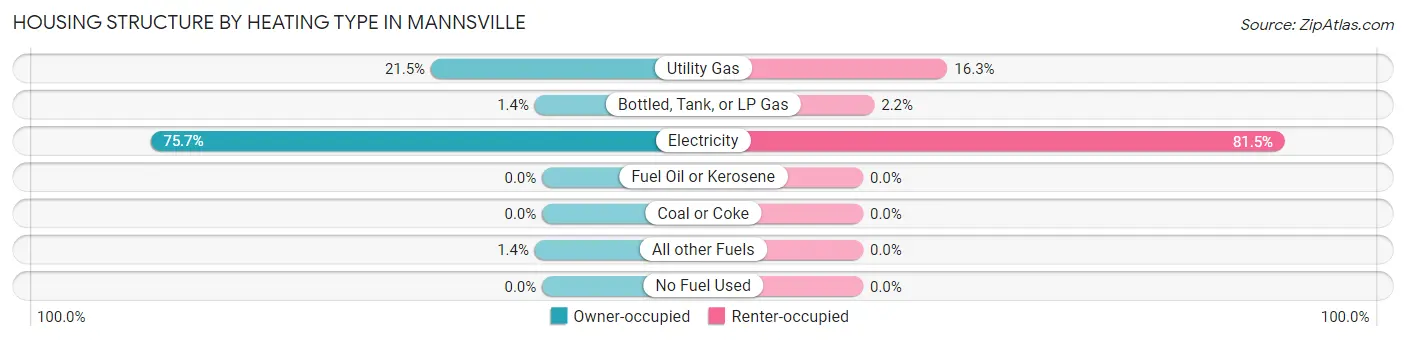
| Heating Type | Owner-occupied | Renter-occupied |
| Utility Gas | 61 (21.5%) | 15 (16.3%) |
| Bottled, Tank, or LP Gas | 4 (1.4%) | 2 (2.2%) |
| Electricity | 215 (75.7%) | 75 (81.5%) |
| Fuel Oil or Kerosene | 0 (0.0%) | 0 (0.0%) |
| Coal or Coke | 0 (0.0%) | 0 (0.0%) |
| All other Fuels | 4 (1.4%) | 0 (0.0%) |
| No Fuel Used | 0 (0.0%) | 0 (0.0%) |
| Total | 284 (100.0%) | 92 (100.0%) |
Household Vehicle Usage in Mannsville
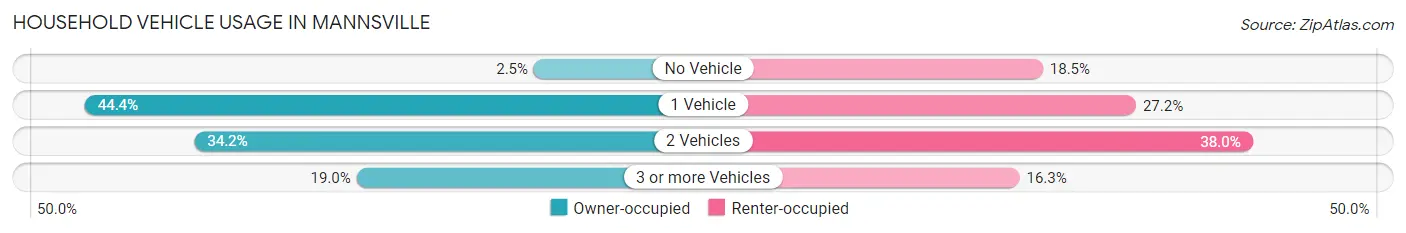
| Vehicles per Household | Owner-occupied | Renter-occupied |
| No Vehicle | 7 (2.5%) | 17 (18.5%) |
| 1 Vehicle | 126 (44.4%) | 25 (27.2%) |
| 2 Vehicles | 97 (34.2%) | 35 (38.0%) |
| 3 or more Vehicles | 54 (19.0%) | 15 (16.3%) |
| Total | 284 (100.0%) | 92 (100.0%) |
Real Estate & Mortgages in Mannsville
Real Estate and Mortgage Overview in Mannsville
| Characteristic | Without Mortgage | With Mortgage |
| Housing Units | 172 | 112 |
| Median Property Value | $94,500 | $83,900 |
| Median Household Income | $31,250 | $6 |
| Monthly Housing Costs | $316 | $0 |
| Real Estate Taxes | $478 | $11 |
Property Value by Mortgage Status in Mannsville
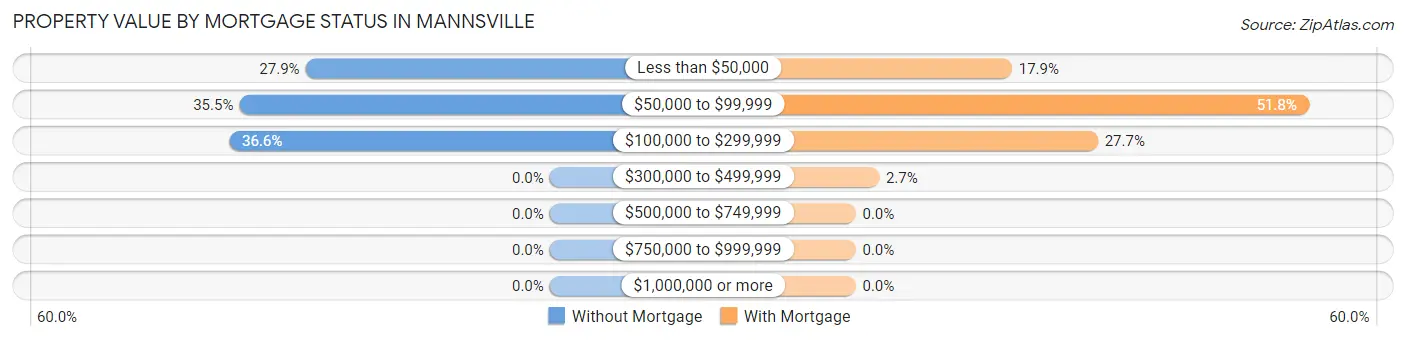
| Property Value | Without Mortgage | With Mortgage |
| Less than $50,000 | 48 (27.9%) | 20 (17.9%) |
| $50,000 to $99,999 | 61 (35.5%) | 58 (51.8%) |
| $100,000 to $299,999 | 63 (36.6%) | 31 (27.7%) |
| $300,000 to $499,999 | 0 (0.0%) | 3 (2.7%) |
| $500,000 to $749,999 | 0 (0.0%) | 0 (0.0%) |
| $750,000 to $999,999 | 0 (0.0%) | 0 (0.0%) |
| $1,000,000 or more | 0 (0.0%) | 0 (0.0%) |
| Total | 172 (100.0%) | 112 (100.0%) |
Household Income by Mortgage Status in Mannsville
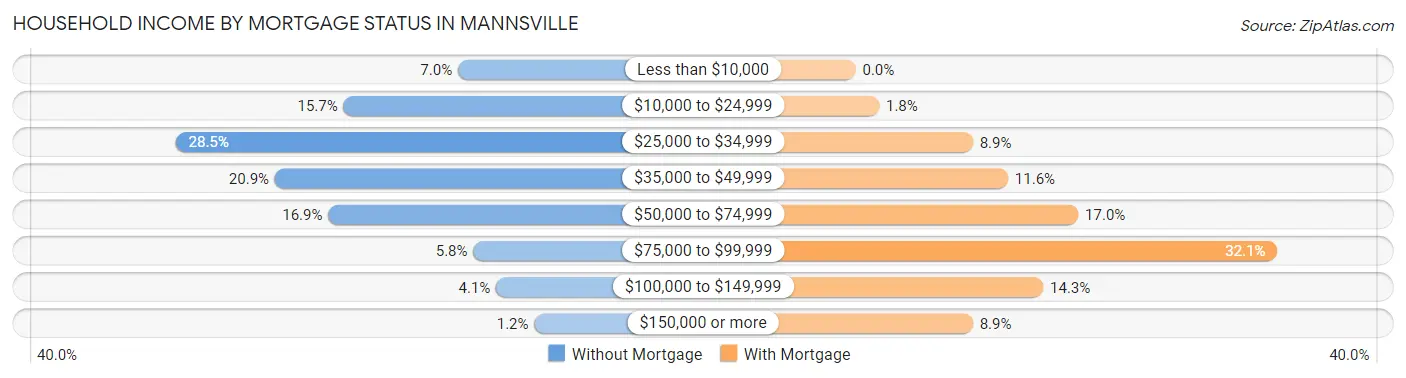
| Household Income | Without Mortgage | With Mortgage |
| Less than $10,000 | 12 (7.0%) | 0 (0.0%) |
| $10,000 to $24,999 | 27 (15.7%) | 2 (1.8%) |
| $25,000 to $34,999 | 49 (28.5%) | 10 (8.9%) |
| $35,000 to $49,999 | 36 (20.9%) | 13 (11.6%) |
| $50,000 to $74,999 | 29 (16.9%) | 19 (17.0%) |
| $75,000 to $99,999 | 10 (5.8%) | 36 (32.1%) |
| $100,000 to $149,999 | 7 (4.1%) | 16 (14.3%) |
| $150,000 or more | 2 (1.2%) | 10 (8.9%) |
| Total | 172 (100.0%) | 112 (100.0%) |
Property Value to Household Income Ratio in Mannsville
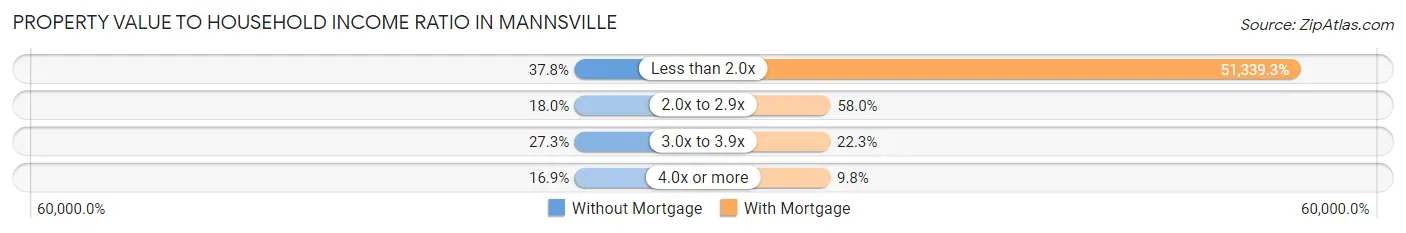
| Value-to-Income Ratio | Without Mortgage | With Mortgage |
| Less than 2.0x | 65 (37.8%) | 57,500 (51,339.3%) |
| 2.0x to 2.9x | 31 (18.0%) | 65 (58.0%) |
| 3.0x to 3.9x | 47 (27.3%) | 25 (22.3%) |
| 4.0x or more | 29 (16.9%) | 11 (9.8%) |
| Total | 172 (100.0%) | 112 (100.0%) |
Real Estate Taxes by Mortgage Status in Mannsville
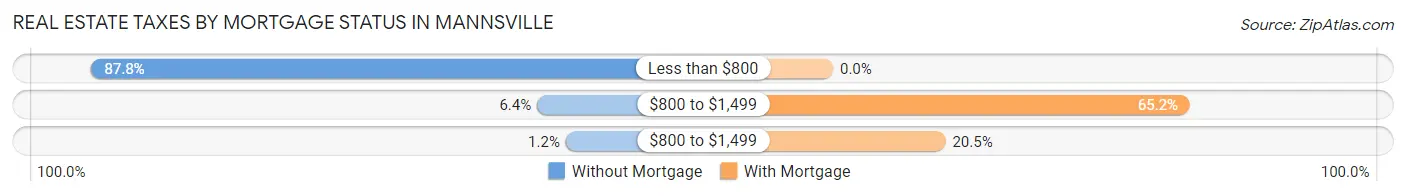
| Property Taxes | Without Mortgage | With Mortgage |
| Less than $800 | 151 (87.8%) | 0 (0.0%) |
| $800 to $1,499 | 11 (6.4%) | 73 (65.2%) |
| $800 to $1,499 | 2 (1.2%) | 23 (20.5%) |
| Total | 172 (100.0%) | 112 (100.0%) |
Health & Disability in Mannsville
Health Insurance Coverage by Age in Mannsville
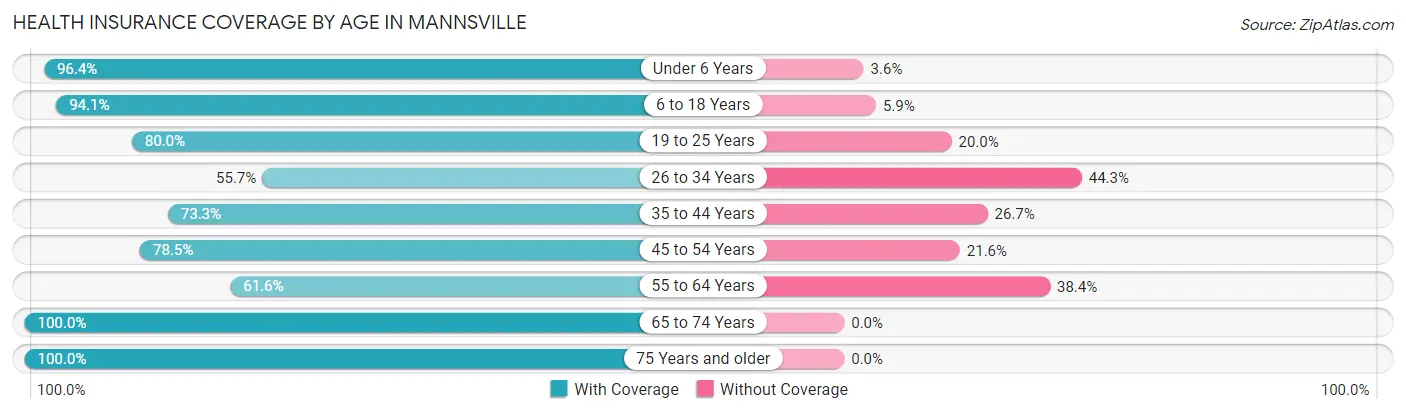
| Age Bracket | With Coverage | Without Coverage |
| Under 6 Years | 80 (96.4%) | 3 (3.6%) |
| 6 to 18 Years | 175 (94.1%) | 11 (5.9%) |
| 19 to 25 Years | 56 (80.0%) | 14 (20.0%) |
| 26 to 34 Years | 78 (55.7%) | 62 (44.3%) |
| 35 to 44 Years | 96 (73.3%) | 35 (26.7%) |
| 45 to 54 Years | 91 (78.4%) | 25 (21.5%) |
| 55 to 64 Years | 53 (61.6%) | 33 (38.4%) |
| 65 to 74 Years | 77 (100.0%) | 0 (0.0%) |
| 75 Years and older | 77 (100.0%) | 0 (0.0%) |
| Total | 783 (81.1%) | 183 (18.9%) |
Health Insurance Coverage by Citizenship Status in Mannsville
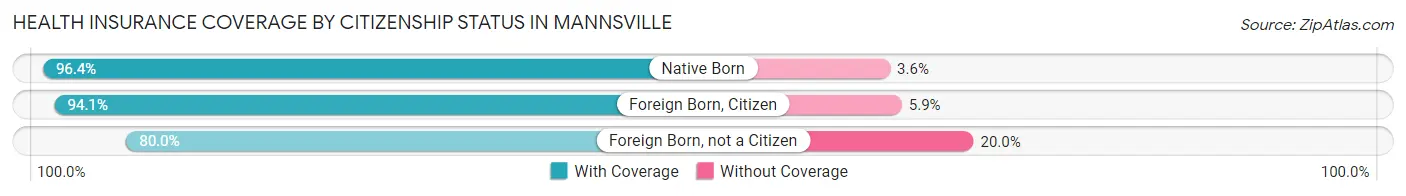
| Citizenship Status | With Coverage | Without Coverage |
| Native Born | 80 (96.4%) | 3 (3.6%) |
| Foreign Born, Citizen | 175 (94.1%) | 11 (5.9%) |
| Foreign Born, not a Citizen | 56 (80.0%) | 14 (20.0%) |
Health Insurance Coverage by Household Income in Mannsville
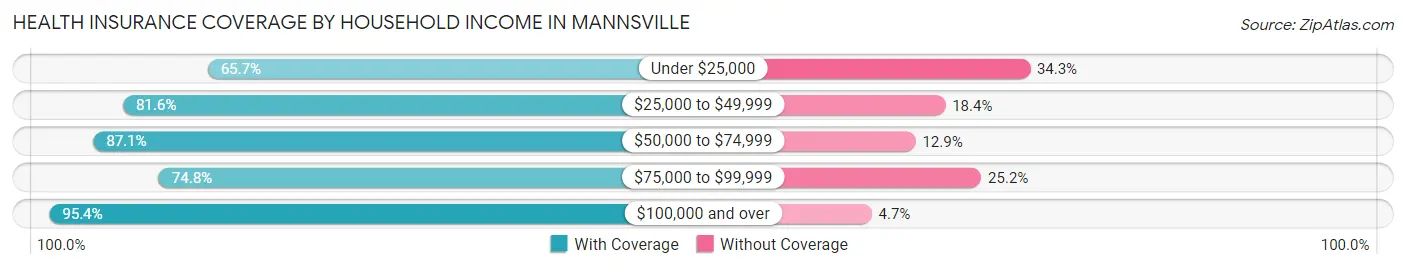
| Household Income | With Coverage | Without Coverage |
| Under $25,000 | 90 (65.7%) | 47 (34.3%) |
| $25,000 to $49,999 | 261 (81.6%) | 59 (18.4%) |
| $50,000 to $74,999 | 237 (87.1%) | 35 (12.9%) |
| $75,000 to $99,999 | 113 (74.8%) | 38 (25.2%) |
| $100,000 and over | 82 (95.4%) | 4 (4.6%) |
Public vs Private Health Insurance Coverage by Age in Mannsville
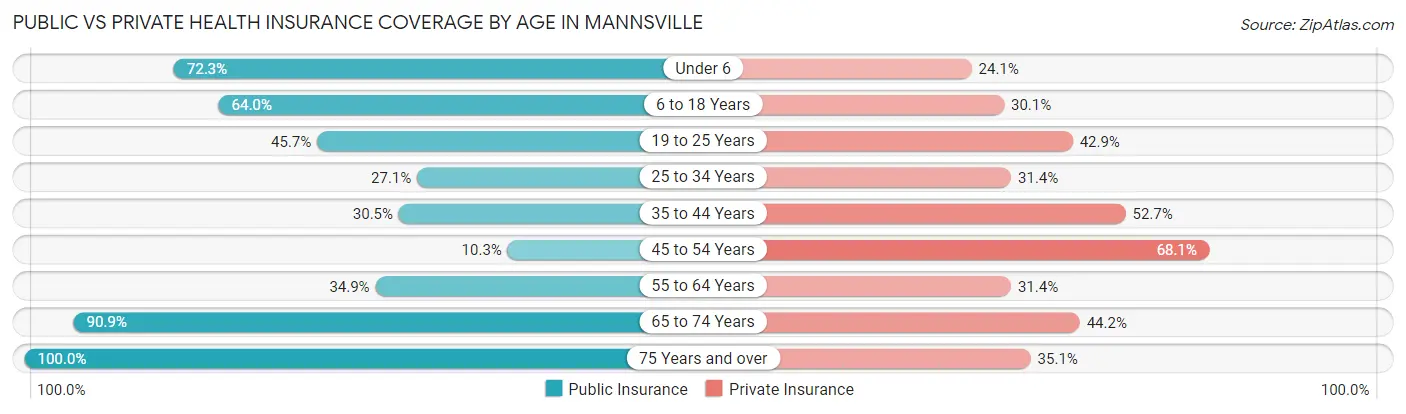
| Age Bracket | Public Insurance | Private Insurance |
| Under 6 | 60 (72.3%) | 20 (24.1%) |
| 6 to 18 Years | 119 (64.0%) | 56 (30.1%) |
| 19 to 25 Years | 32 (45.7%) | 30 (42.9%) |
| 25 to 34 Years | 38 (27.1%) | 44 (31.4%) |
| 35 to 44 Years | 40 (30.5%) | 69 (52.7%) |
| 45 to 54 Years | 12 (10.3%) | 79 (68.1%) |
| 55 to 64 Years | 30 (34.9%) | 27 (31.4%) |
| 65 to 74 Years | 70 (90.9%) | 34 (44.2%) |
| 75 Years and over | 77 (100.0%) | 27 (35.1%) |
| Total | 478 (49.5%) | 386 (40.0%) |
Disability Status by Sex by Age in Mannsville
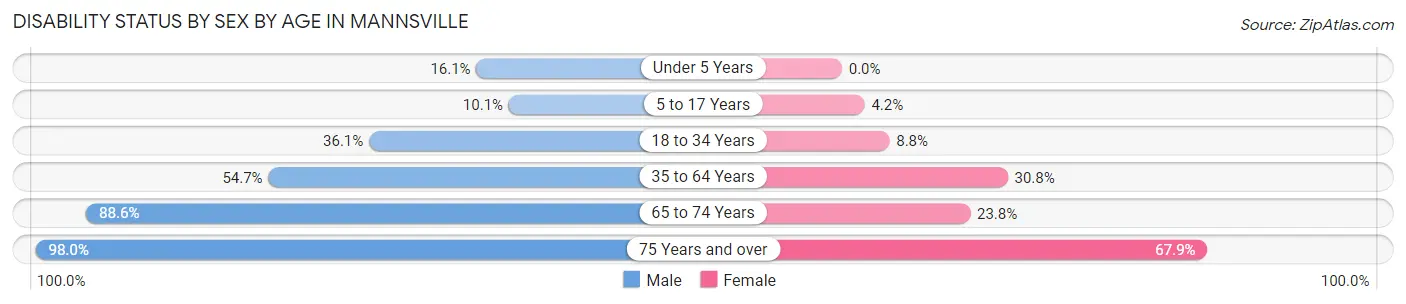
| Age Bracket | Male | Female |
| Under 5 Years | 5 (16.1%) | 0 (0.0%) |
| 5 to 17 Years | 9 (10.1%) | 4 (4.2%) |
| 18 to 34 Years | 31 (36.0%) | 12 (8.8%) |
| 35 to 64 Years | 104 (54.7%) | 44 (30.8%) |
| 65 to 74 Years | 31 (88.6%) | 10 (23.8%) |
| 75 Years and over | 48 (98.0%) | 19 (67.9%) |
Disability Class by Sex by Age in Mannsville
Disability Class: Hearing Difficulty
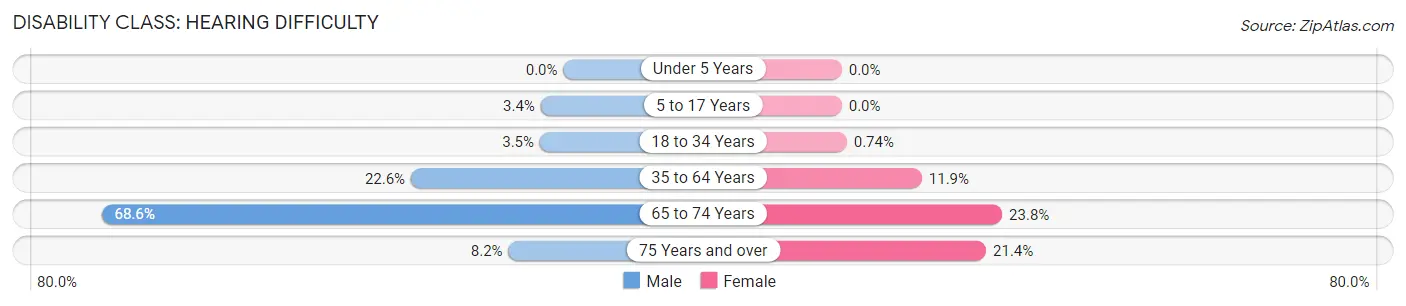
| Age Bracket | Male | Female |
| Under 5 Years | 0 (0.0%) | 0 (0.0%) |
| 5 to 17 Years | 3 (3.4%) | 0 (0.0%) |
| 18 to 34 Years | 3 (3.5%) | 1 (0.7%) |
| 35 to 64 Years | 43 (22.6%) | 17 (11.9%) |
| 65 to 74 Years | 24 (68.6%) | 10 (23.8%) |
| 75 Years and over | 4 (8.2%) | 6 (21.4%) |
Disability Class: Vision Difficulty
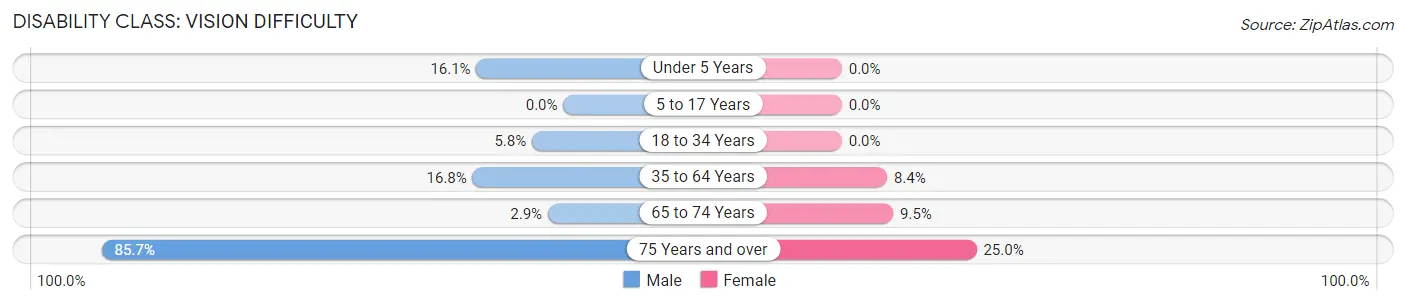
| Age Bracket | Male | Female |
| Under 5 Years | 5 (16.1%) | 0 (0.0%) |
| 5 to 17 Years | 0 (0.0%) | 0 (0.0%) |
| 18 to 34 Years | 5 (5.8%) | 0 (0.0%) |
| 35 to 64 Years | 32 (16.8%) | 12 (8.4%) |
| 65 to 74 Years | 1 (2.9%) | 4 (9.5%) |
| 75 Years and over | 42 (85.7%) | 7 (25.0%) |
Disability Class: Cognitive Difficulty
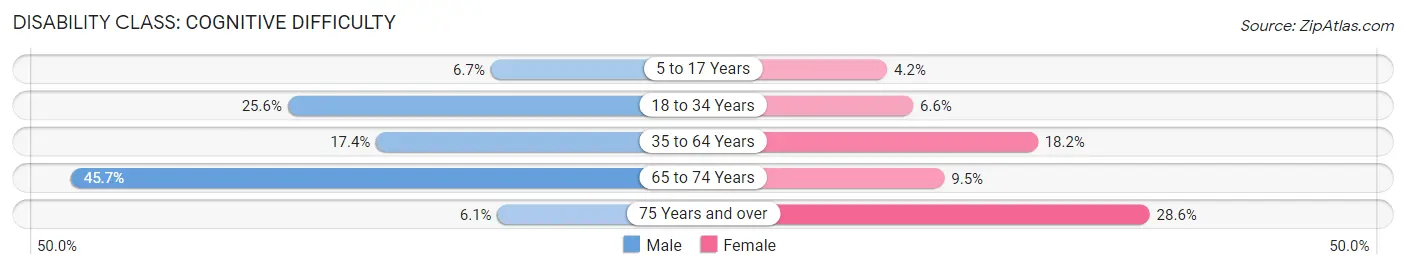
| Age Bracket | Male | Female |
| 5 to 17 Years | 6 (6.7%) | 4 (4.2%) |
| 18 to 34 Years | 22 (25.6%) | 9 (6.6%) |
| 35 to 64 Years | 33 (17.4%) | 26 (18.2%) |
| 65 to 74 Years | 16 (45.7%) | 4 (9.5%) |
| 75 Years and over | 3 (6.1%) | 8 (28.6%) |
Disability Class: Ambulatory Difficulty
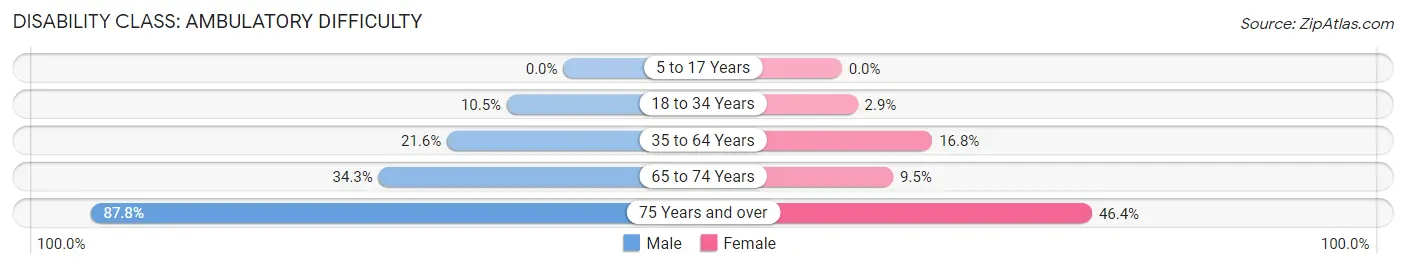
| Age Bracket | Male | Female |
| 5 to 17 Years | 0 (0.0%) | 0 (0.0%) |
| 18 to 34 Years | 9 (10.5%) | 4 (2.9%) |
| 35 to 64 Years | 41 (21.6%) | 24 (16.8%) |
| 65 to 74 Years | 12 (34.3%) | 4 (9.5%) |
| 75 Years and over | 43 (87.8%) | 13 (46.4%) |
Disability Class: Self-Care Difficulty
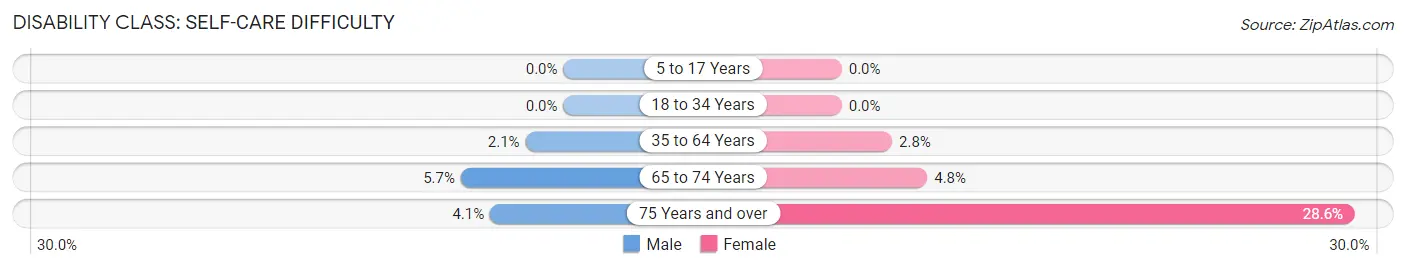
| Age Bracket | Male | Female |
| 5 to 17 Years | 0 (0.0%) | 0 (0.0%) |
| 18 to 34 Years | 0 (0.0%) | 0 (0.0%) |
| 35 to 64 Years | 4 (2.1%) | 4 (2.8%) |
| 65 to 74 Years | 2 (5.7%) | 2 (4.8%) |
| 75 Years and over | 2 (4.1%) | 8 (28.6%) |
Technology Access in Mannsville
Computing Device Access in Mannsville
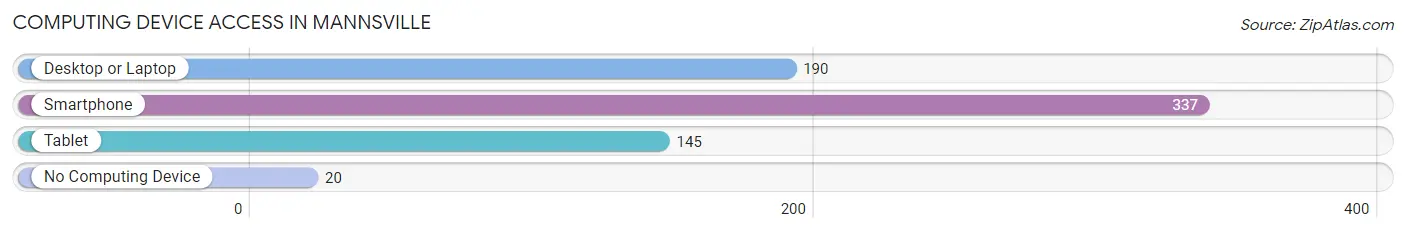
| Device Type | # Households | % Households |
| Desktop or Laptop | 190 | 50.5% |
| Smartphone | 337 | 89.6% |
| Tablet | 145 | 38.6% |
| No Computing Device | 20 | 5.3% |
| Total | 376 | 100.0% |
Internet Access in Mannsville
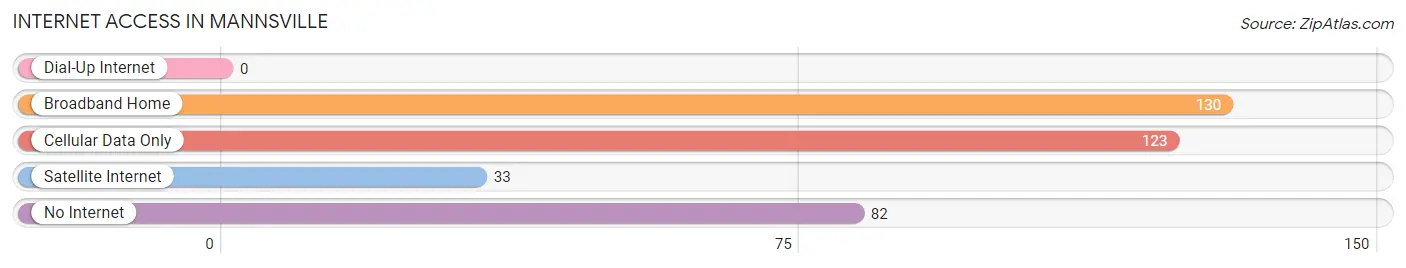
| Internet Type | # Households | % Households |
| Dial-Up Internet | 0 | 0.0% |
| Broadband Home | 130 | 34.6% |
| Cellular Data Only | 123 | 32.7% |
| Satellite Internet | 33 | 8.8% |
| No Internet | 82 | 21.8% |
| Total | 376 | 100.0% |
Mannsville Summary
Mannsville is a small town located in Johnston County, Oklahoma. It is situated in the southeastern part of the state, about 30 miles east of the state capital of Oklahoma City. The town was founded in 1891 and named after its first postmaster, William Mann. The population of Mannsville was estimated to be 545 in 2020.
History
Mannsville was founded in 1891 by William Mann, who was the first postmaster of the town. The town was originally known as Mannsville Station, as it was a stop on the St. Louis and San Francisco Railway. The town was officially incorporated in 1901.
In the early 1900s, Mannsville was a thriving agricultural community. Cotton, corn, and wheat were the main crops grown in the area. The town also had a cotton gin, a grist mill, and a blacksmith shop.
In the 1920s, Mannsville experienced a period of growth and prosperity. The town had a bank, a hotel, a movie theater, and several stores. The town also had a school, which was built in 1921.
Geography
Mannsville is located in the southeastern part of Oklahoma, about 30 miles east of Oklahoma City. The town is situated in the Red River Valley, which is part of the larger Great Plains region. The town is surrounded by rolling hills and is located near the Red River.
The climate in Mannsville is generally mild, with hot summers and cold winters. The average annual temperature is around 60 degrees Fahrenheit. The average annual precipitation is around 40 inches.
Economy
Mannsville’s economy is largely based on agriculture. The town is home to several farms, which produce cotton, corn, wheat, and other crops. The town also has a few small businesses, including a grocery store, a hardware store, and a restaurant.
Demographics
Mannsville’s population was estimated to be 545 in 2020. The town is predominantly white, with about 90% of the population identifying as such. The remaining 10% of the population is made up of African Americans, Native Americans, and other races. The median household income in Mannsville is around $35,000. The town has a poverty rate of about 15%.
Conclusion
Mannsville is a small town located in Johnston County, Oklahoma. It was founded in 1891 and has a population of around 545. The town’s economy is largely based on agriculture, and the town has a few small businesses. The town is predominantly white, with a median household income of around $35,000.
Common Questions
What is Per Capita Income in Mannsville?
Per Capita income in Mannsville is $20,215.
What is the Median Family Income in Mannsville?
Median Family Income in Mannsville is $55,104.
What is the Median Household income in Mannsville?
Median Household Income in Mannsville is $45,000.
What is Income or Wage Gap in Mannsville?
Income or Wage Gap in Mannsville is 38.6%.
Women in Mannsville earn 61.4 cents for every dollar earned by a man.
What is Inequality or Gini Index in Mannsville?
Inequality or Gini Index in Mannsville is 0.36.
What is the Total Population of Mannsville?
Total Population of Mannsville is 966.
What is the Total Male Population of Mannsville?
Total Male Population of Mannsville is 480.
What is the Total Female Population of Mannsville?
Total Female Population of Mannsville is 486.
What is the Ratio of Males per 100 Females in Mannsville?
There are 98.77 Males per 100 Females in Mannsville.
What is the Ratio of Females per 100 Males in Mannsville?
There are 101.25 Females per 100 Males in Mannsville.
What is the Median Population Age in Mannsville?
Median Population Age in Mannsville is 35.3 Years.
What is the Average Family Size in Mannsville
Average Family Size in Mannsville is 3.4 People.
What is the Average Household Size in Mannsville
Average Household Size in Mannsville is 2.6 People.
How Large is the Labor Force in Mannsville?
There are 395 People in the Labor Forcein in Mannsville.
What is the Percentage of People in the Labor Force in Mannsville?
54.1% of People are in the Labor Force in Mannsville.
What is the Unemployment Rate in Mannsville?
Unemployment Rate in Mannsville is 4.6%.