Fort Towson, OK Map & Demographics
Fort Towson Map
Fort Towson Overview
$27,659
PER CAPITA INCOME
$65,625
AVG FAMILY INCOME
$48,250
AVG HOUSEHOLD INCOME
46.7%
WAGE / INCOME GAP [ % ]
53.3¢/ $1
WAGE / INCOME GAP [ $ ]
0.41
INEQUALITY / GINI INDEX
548
TOTAL POPULATION
289
MALE POPULATION
259
FEMALE POPULATION
111.58
MALES / 100 FEMALES
89.62
FEMALES / 100 MALES
53.8
MEDIAN AGE
2.8
AVG FAMILY SIZE
2.4
AVG HOUSEHOLD SIZE
238
LABOR FORCE [ PEOPLE ]
50.6%
PERCENT IN LABOR FORCE
18.5%
UNEMPLOYMENT RATE
Fort Towson Zip Codes
Fort Towson Area Codes
Income in Fort Towson
Income Overview in Fort Towson
Per Capita Income in Fort Towson is $27,659, while median incomes of families and households are $65,625 and $48,250 respectively.
| Characteristic | Number | Measure |
| Per Capita Income | 548 | $27,659 |
| Median Family Income | 149 | $65,625 |
| Mean Family Income | 149 | $80,754 |
| Median Household Income | 233 | $48,250 |
| Mean Household Income | 233 | $62,569 |
| Income Deficit | 149 | $0 |
| Wage / Income Gap (%) | 548 | 46.70% |
| Wage / Income Gap ($) | 548 | 53.30¢ per $1 |
| Gini / Inequality Index | 548 | 0.41 |
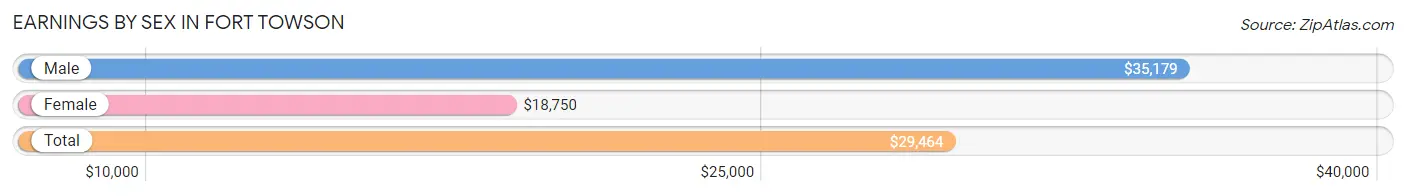
Earnings by Sex in Fort Towson
Average Earnings in Fort Towson are $29,464, $35,179 for men and $18,750 for women, a difference of 46.7%.
| Sex | Number | Average Earnings |
| Male | 145 (61.2%) | $35,179 |
| Female | 92 (38.8%) | $18,750 |
| Total | 237 (100.0%) | $29,464 |
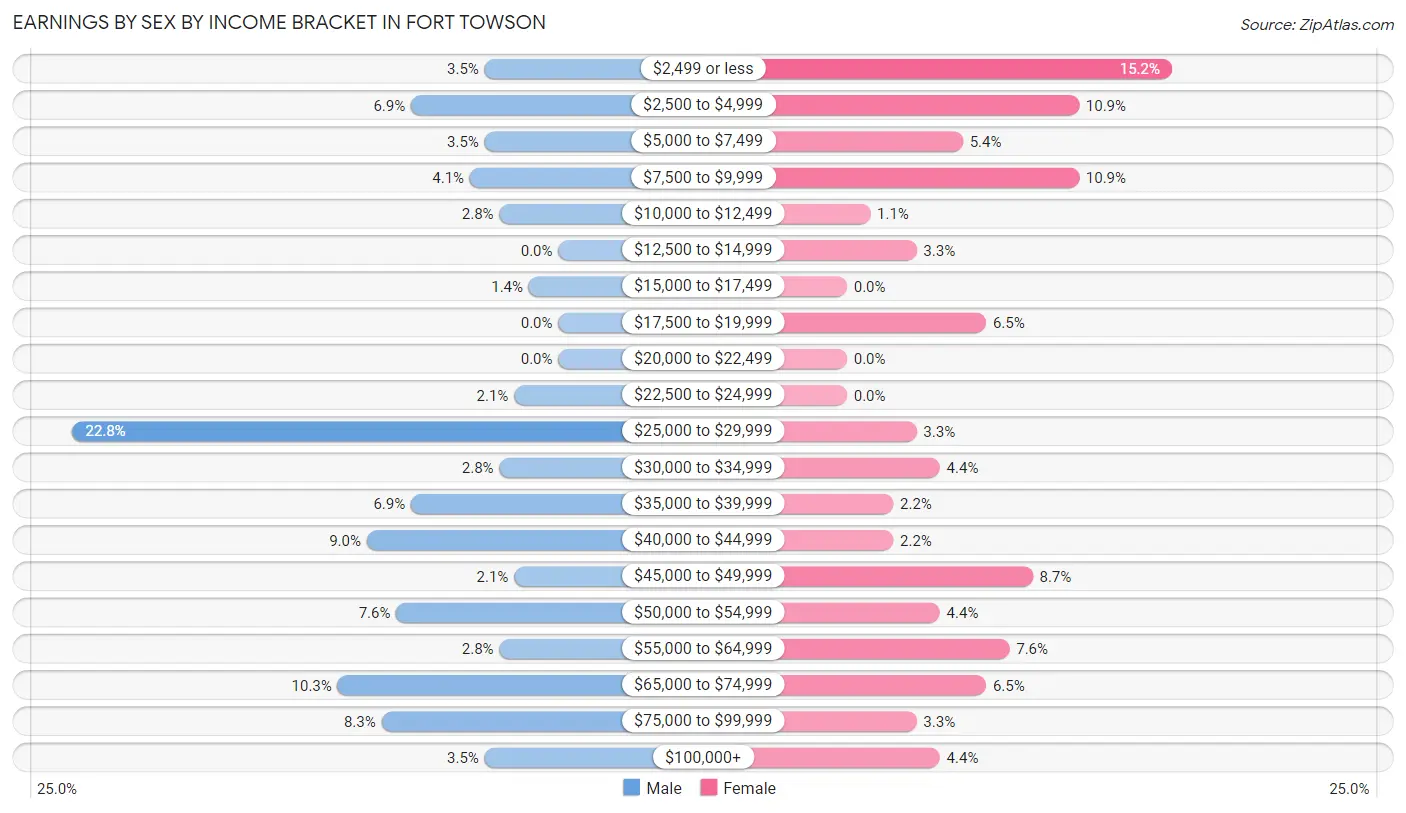
Earnings by Sex by Income Bracket in Fort Towson
The most common earnings brackets in Fort Towson are $25,000 to $29,999 for men (33 | 22.8%) and $2,499 or less for women (14 | 15.2%).
| Income | Male | Female |
| $2,499 or less | 5 (3.5%) | 14 (15.2%) |
| $2,500 to $4,999 | 10 (6.9%) | 10 (10.9%) |
| $5,000 to $7,499 | 5 (3.5%) | 5 (5.4%) |
| $7,500 to $9,999 | 6 (4.1%) | 10 (10.9%) |
| $10,000 to $12,499 | 4 (2.8%) | 1 (1.1%) |
| $12,500 to $14,999 | 0 (0.0%) | 3 (3.3%) |
| $15,000 to $17,499 | 2 (1.4%) | 0 (0.0%) |
| $17,500 to $19,999 | 0 (0.0%) | 6 (6.5%) |
| $20,000 to $22,499 | 0 (0.0%) | 0 (0.0%) |
| $22,500 to $24,999 | 3 (2.1%) | 0 (0.0%) |
| $25,000 to $29,999 | 33 (22.8%) | 3 (3.3%) |
| $30,000 to $34,999 | 4 (2.8%) | 4 (4.3%) |
| $35,000 to $39,999 | 10 (6.9%) | 2 (2.2%) |
| $40,000 to $44,999 | 13 (9.0%) | 2 (2.2%) |
| $45,000 to $49,999 | 3 (2.1%) | 8 (8.7%) |
| $50,000 to $54,999 | 11 (7.6%) | 4 (4.3%) |
| $55,000 to $64,999 | 4 (2.8%) | 7 (7.6%) |
| $65,000 to $74,999 | 15 (10.3%) | 6 (6.5%) |
| $75,000 to $99,999 | 12 (8.3%) | 3 (3.3%) |
| $100,000+ | 5 (3.5%) | 4 (4.3%) |
| Total | 145 (100.0%) | 92 (100.0%) |
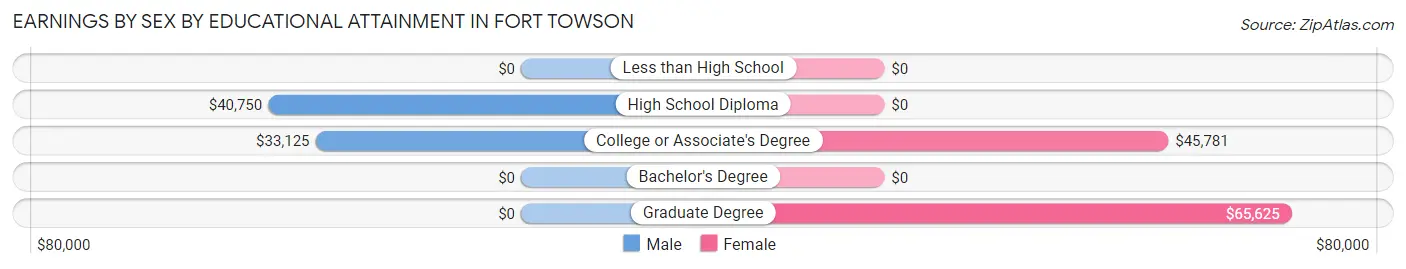
Earnings by Sex by Educational Attainment in Fort Towson
Average earnings in Fort Towson are $37,500 for men and $27,917 for women, a difference of 25.6%. Men with an educational attainment of high school diploma enjoy the highest average annual earnings of $40,750, while those with college or associate's degree education earn the least with $33,125. Women with an educational attainment of graduate degree earn the most with the average annual earnings of $65,625, while those with college or associate's degree education have the smallest earnings of $45,781.
| Educational Attainment | Male Income | Female Income |
| Less than High School | - | - |
| High School Diploma | $40,750 | $0 |
| College or Associate's Degree | $33,125 | $45,781 |
| Bachelor's Degree | - | - |
| Graduate Degree | - | - |
| Total | $37,500 | $27,917 |
Family Income in Fort Towson
Family Income Brackets in Fort Towson
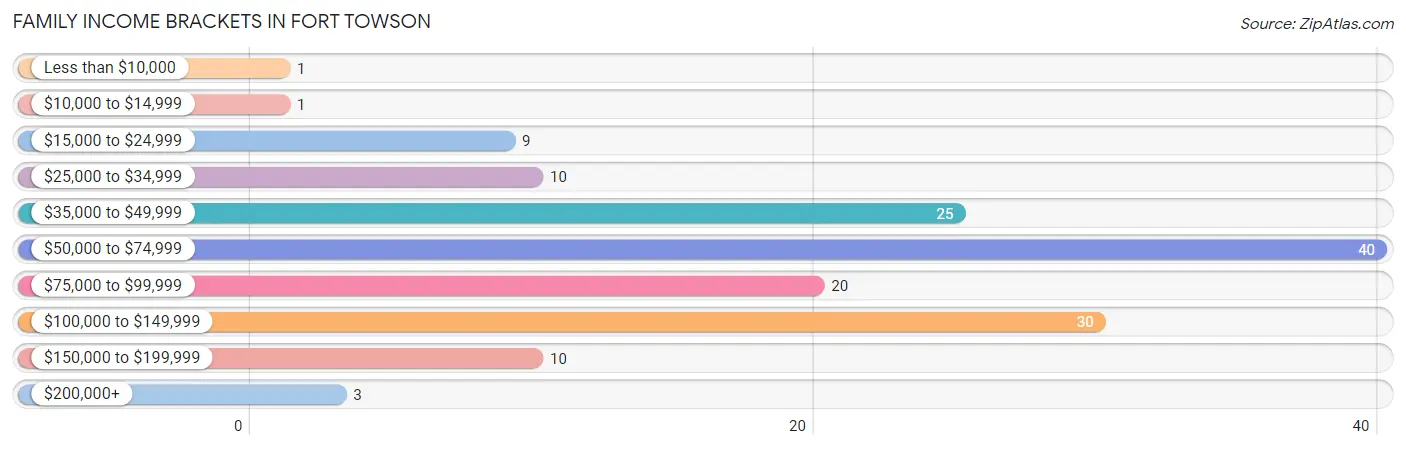
According to the Fort Towson family income data, there are 40 families falling into the $50,000 to $74,999 income range, which is the most common income bracket and makes up 26.9% of all families. Conversely, the less than $10,000 income bracket is the least frequent group with only 1 families (0.7%) belonging to this category.
| Income Bracket | # Families | % Families |
| Less than $10,000 | 1 | 0.7% |
| $10,000 to $14,999 | 1 | 0.7% |
| $15,000 to $24,999 | 9 | 6.0% |
| $25,000 to $34,999 | 10 | 6.7% |
| $35,000 to $49,999 | 25 | 16.8% |
| $50,000 to $74,999 | 40 | 26.8% |
| $75,000 to $99,999 | 20 | 13.4% |
| $100,000 to $149,999 | 30 | 20.1% |
| $150,000 to $199,999 | 10 | 6.7% |
| $200,000+ | 3 | 2.0% |
Family Income by Famaliy Size in Fort Towson
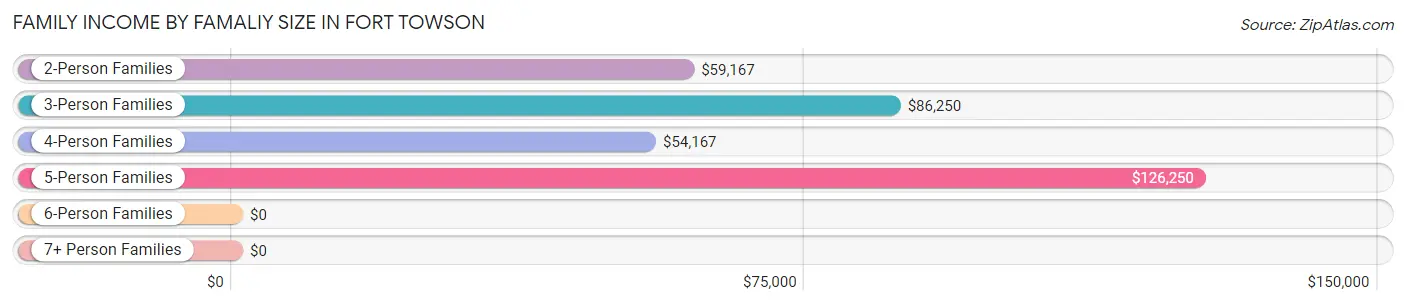
5-person families (7 | 4.7%) account for the highest median family income in Fort Towson with $126,250 per family, while 2-person families (92 | 61.7%) have the highest median income of $29,584 per family member.
| Income Bracket | # Families | Median Income |
| 2-Person Families | 92 (61.7%) | $59,167 |
| 3-Person Families | 32 (21.5%) | $86,250 |
| 4-Person Families | 16 (10.7%) | $54,167 |
| 5-Person Families | 7 (4.7%) | $126,250 |
| 6-Person Families | 2 (1.3%) | $0 |
| 7+ Person Families | 0 (0.0%) | $0 |
| Total | 149 (100.0%) | $65,625 |
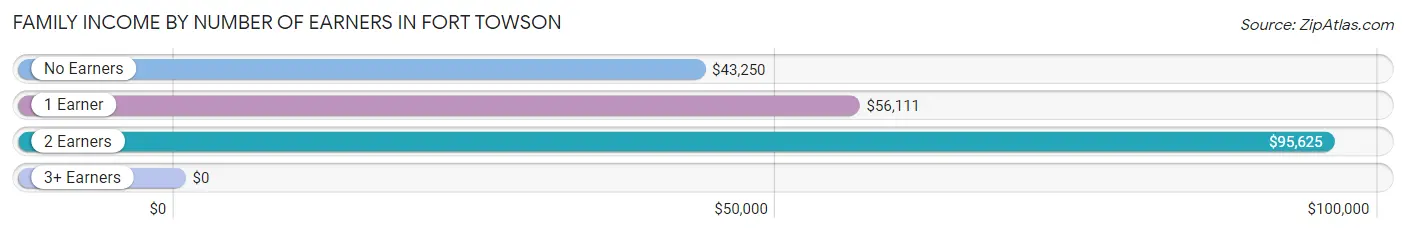
Family Income by Number of Earners in Fort Towson
| Number of Earners | # Families | Median Income |
| No Earners | 39 (26.2%) | $43,250 |
| 1 Earner | 50 (33.6%) | $56,111 |
| 2 Earners | 49 (32.9%) | $95,625 |
| 3+ Earners | 11 (7.4%) | $0 |
| Total | 149 (100.0%) | $65,625 |
Household Income in Fort Towson
Household Income Brackets in Fort Towson
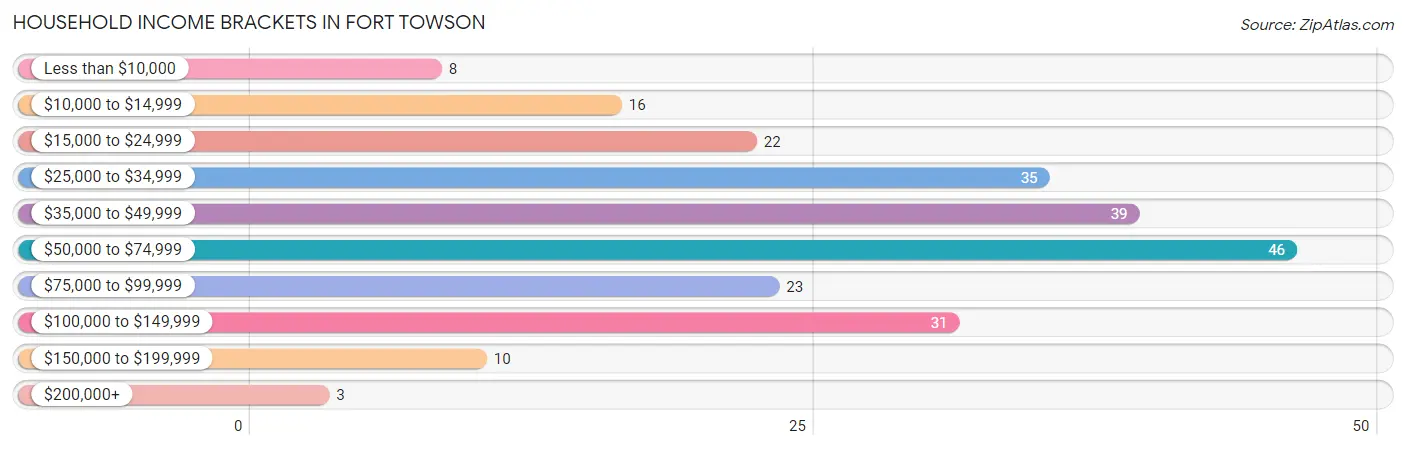
With 46 households falling in the category, the $50,000 to $74,999 income range is the most frequent in Fort Towson, accounting for 19.7% of all households. In contrast, only 3 households (1.3%) fall into the $200,000+ income bracket, making it the least populous group.
| Income Bracket | # Households | % Households |
| Less than $10,000 | 8 | 3.4% |
| $10,000 to $14,999 | 16 | 6.9% |
| $15,000 to $24,999 | 22 | 9.4% |
| $25,000 to $34,999 | 35 | 15.0% |
| $35,000 to $49,999 | 39 | 16.7% |
| $50,000 to $74,999 | 46 | 19.7% |
| $75,000 to $99,999 | 23 | 9.9% |
| $100,000 to $149,999 | 31 | 13.3% |
| $150,000 to $199,999 | 10 | 4.3% |
| $200,000+ | 3 | 1.3% |
Household Income by Householder Age in Fort Towson
The median household income in Fort Towson is $48,250, with the highest median household income of $71,875 found in the 25 to 44 years age bracket for the primary householder. A total of 35 households (15.0%) fall into this category. Meanwhile, the 15 to 24 years age bracket for the primary householder has the lowest median household income of $0, with 1 households (0.4%) in this group.
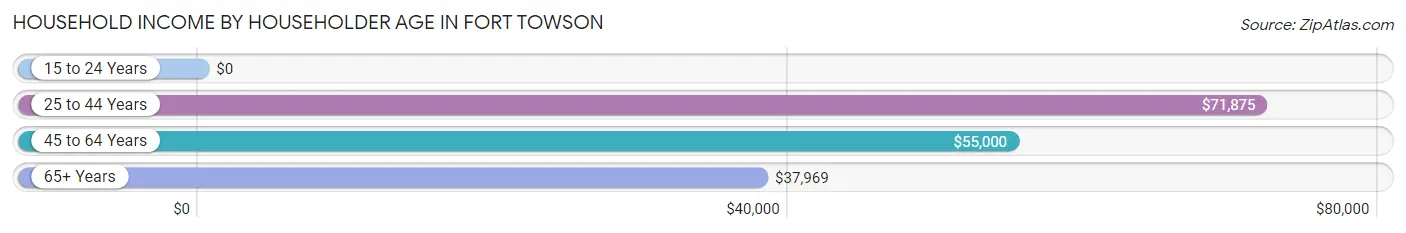
| Income Bracket | # Households | Median Income |
| 15 to 24 Years | 1 (0.4%) | $0 |
| 25 to 44 Years | 35 (15.0%) | $71,875 |
| 45 to 64 Years | 86 (36.9%) | $55,000 |
| 65+ Years | 111 (47.6%) | $37,969 |
| Total | 233 (100.0%) | $48,250 |
Poverty in Fort Towson
Income Below Poverty by Sex and Age in Fort Towson
With 8.6% poverty level for males and 20.5% for females among the residents of Fort Towson, 15 year old males and under 5 year old females are the most vulnerable to poverty, with 1 males (100.0%) and 6 females (66.7%) in their respective age groups living below the poverty level.
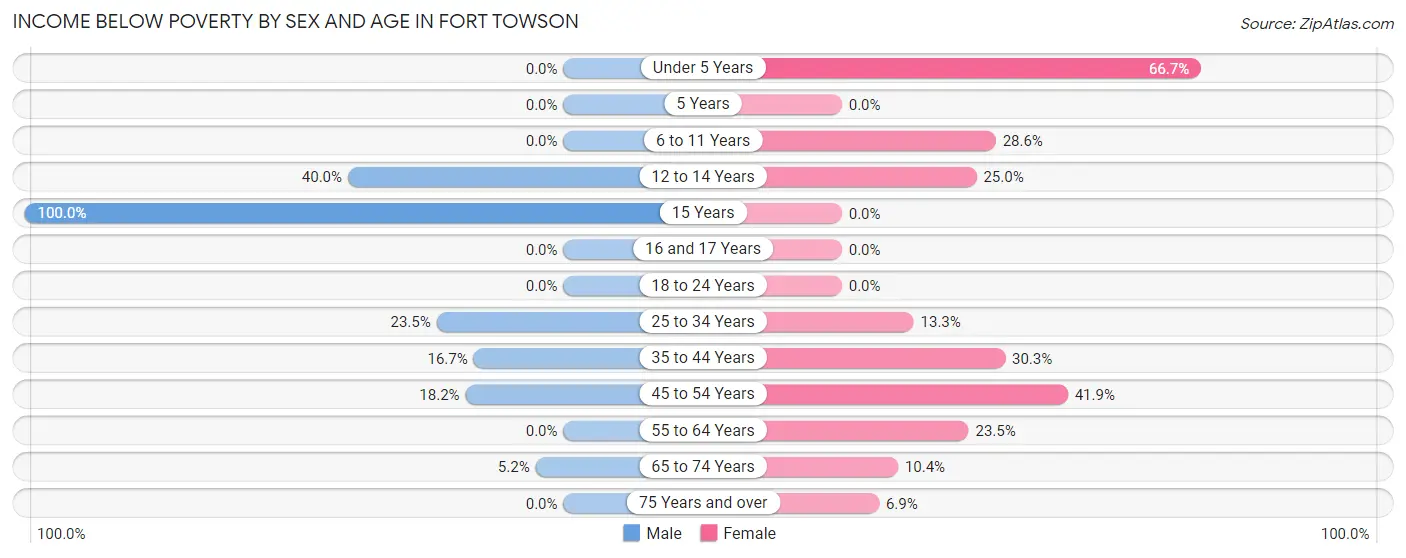
| Age Bracket | Male | Female |
| Under 5 Years | 0 (0.0%) | 6 (66.7%) |
| 5 Years | 0 (0.0%) | 0 (0.0%) |
| 6 to 11 Years | 0 (0.0%) | 4 (28.6%) |
| 12 to 14 Years | 4 (40.0%) | 2 (25.0%) |
| 15 Years | 1 (100.0%) | 0 (0.0%) |
| 16 and 17 Years | 0 (0.0%) | 0 (0.0%) |
| 18 to 24 Years | 0 (0.0%) | 0 (0.0%) |
| 25 to 34 Years | 4 (23.5%) | 2 (13.3%) |
| 35 to 44 Years | 4 (16.7%) | 10 (30.3%) |
| 45 to 54 Years | 8 (18.2%) | 13 (41.9%) |
| 55 to 64 Years | 0 (0.0%) | 8 (23.5%) |
| 65 to 74 Years | 3 (5.2%) | 5 (10.4%) |
| 75 Years and over | 0 (0.0%) | 2 (6.9%) |
| Total | 24 (8.6%) | 52 (20.5%) |
Income Above Poverty by Sex and Age in Fort Towson
According to the poverty statistics in Fort Towson, males aged under 5 years and females aged 15 years are the age groups that are most secure financially, with 100.0% of males and 100.0% of females in these age groups living above the poverty line.
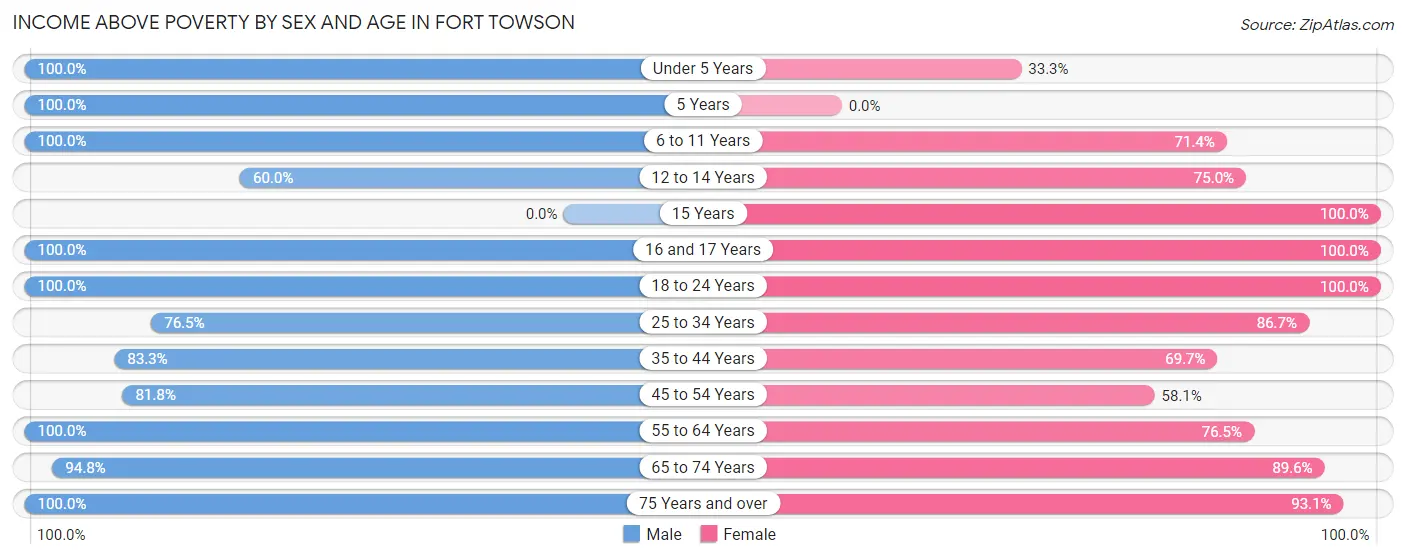
| Age Bracket | Male | Female |
| Under 5 Years | 3 (100.0%) | 3 (33.3%) |
| 5 Years | 2 (100.0%) | 0 (0.0%) |
| 6 to 11 Years | 8 (100.0%) | 10 (71.4%) |
| 12 to 14 Years | 6 (60.0%) | 6 (75.0%) |
| 15 Years | 0 (0.0%) | 8 (100.0%) |
| 16 and 17 Years | 5 (100.0%) | 13 (100.0%) |
| 18 to 24 Years | 11 (100.0%) | 11 (100.0%) |
| 25 to 34 Years | 13 (76.5%) | 13 (86.7%) |
| 35 to 44 Years | 20 (83.3%) | 23 (69.7%) |
| 45 to 54 Years | 36 (81.8%) | 18 (58.1%) |
| 55 to 64 Years | 57 (100.0%) | 26 (76.5%) |
| 65 to 74 Years | 55 (94.8%) | 43 (89.6%) |
| 75 Years and over | 40 (100.0%) | 27 (93.1%) |
| Total | 256 (91.4%) | 201 (79.4%) |
Income Below Poverty Among Married-Couple Families in Fort Towson
The poverty statistics for married-couple families in Fort Towson show that 0.9% or 1 of the total 117 families live below the poverty line. Families with no children have the highest poverty rate of 1.1%, comprising of 1 families. On the other hand, families with 1 or 2 children have the lowest poverty rate of 0.0%, which includes 0 families.
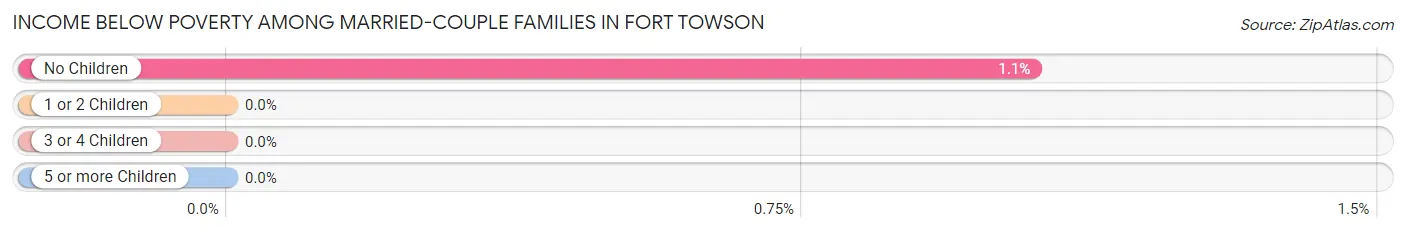
| Children | Above Poverty | Below Poverty |
| No Children | 94 (99.0%) | 1 (1.1%) |
| 1 or 2 Children | 18 (100.0%) | 0 (0.0%) |
| 3 or 4 Children | 4 (100.0%) | 0 (0.0%) |
| 5 or more Children | 0 (0.0%) | 0 (0.0%) |
| Total | 116 (99.2%) | 1 (0.9%) |
Income Below Poverty Among Single-Parent Households in Fort Towson
According to the poverty data in Fort Towson, 20.0% or 3 single-father households and 23.5% or 4 single-mother households are living below the poverty line. Among single-father households, those with 1 or 2 children have the highest poverty rate, with 3 households (60.0%) experiencing poverty. Likewise, among single-mother households, those with 3 or 4 children have the highest poverty rate, with 2 households (100.0%) falling below the poverty line.
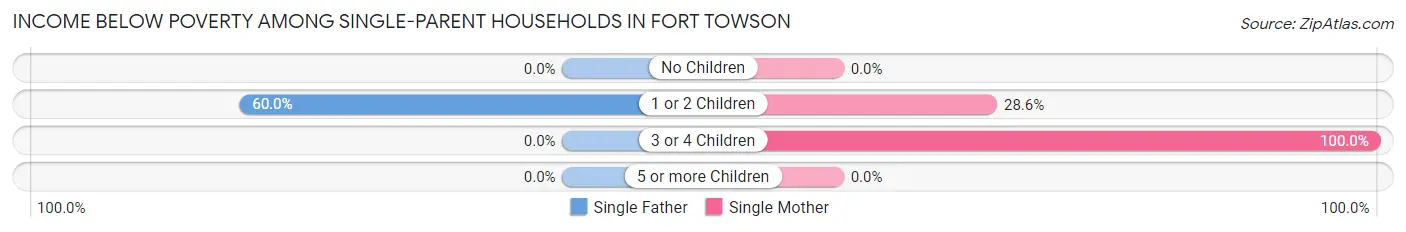
| Children | Single Father | Single Mother |
| No Children | 0 (0.0%) | 0 (0.0%) |
| 1 or 2 Children | 3 (60.0%) | 2 (28.6%) |
| 3 or 4 Children | 0 (0.0%) | 2 (100.0%) |
| 5 or more Children | 0 (0.0%) | 0 (0.0%) |
| Total | 3 (20.0%) | 4 (23.5%) |
Income Below Poverty Among Married-Couple vs Single-Parent Households in Fort Towson
The poverty data for Fort Towson shows that 1 of the married-couple family households (0.9%) and 7 of the single-parent households (21.9%) are living below the poverty level. Within the married-couple family households, those with no children have the highest poverty rate, with 1 households (1.1%) falling below the poverty line. Among the single-parent households, those with 1 or 2 children have the highest poverty rate, with 5 household (41.7%) living below poverty.
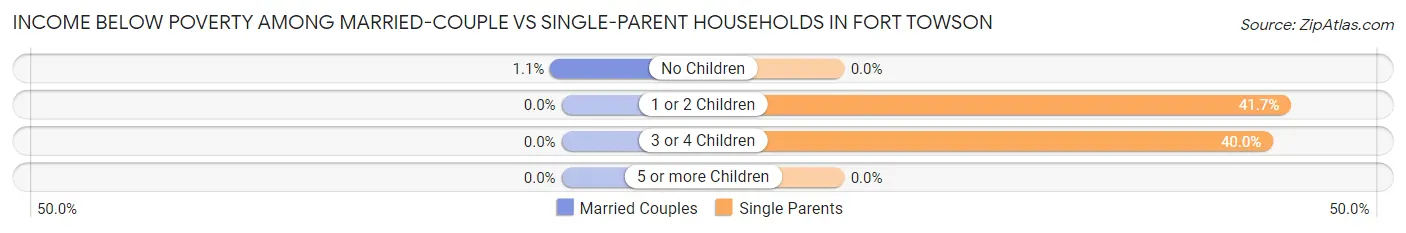
| Children | Married-Couple Families | Single-Parent Households |
| No Children | 1 (1.1%) | 0 (0.0%) |
| 1 or 2 Children | 0 (0.0%) | 5 (41.7%) |
| 3 or 4 Children | 0 (0.0%) | 2 (40.0%) |
| 5 or more Children | 0 (0.0%) | 0 (0.0%) |
| Total | 1 (0.9%) | 7 (21.9%) |
Race in Fort Towson
The most populous races in Fort Towson are White / Caucasian (426 | 77.7%), Two or more Races (76 | 13.9%), and Native / Alaskan (32 | 5.8%).
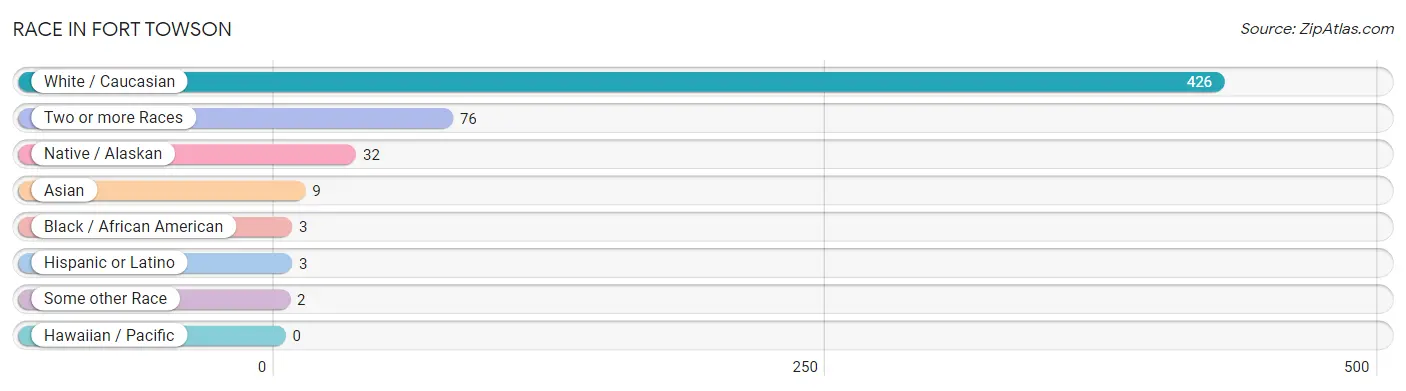
| Race | # Population | % Population |
| Asian | 9 | 1.6% |
| Black / African American | 3 | 0.5% |
| Hawaiian / Pacific | 0 | 0.0% |
| Hispanic or Latino | 3 | 0.5% |
| Native / Alaskan | 32 | 5.8% |
| White / Caucasian | 426 | 77.7% |
| Two or more Races | 76 | 13.9% |
| Some other Race | 2 | 0.4% |
| Total | 548 | 100.0% |
Ancestry in Fort Towson
The most populous ancestries reported in Fort Towson are Choctaw (81 | 14.8%), German (51 | 9.3%), Irish (51 | 9.3%), English (43 | 7.9%), and American (23 | 4.2%), together accounting for 45.5% of all Fort Towson residents.
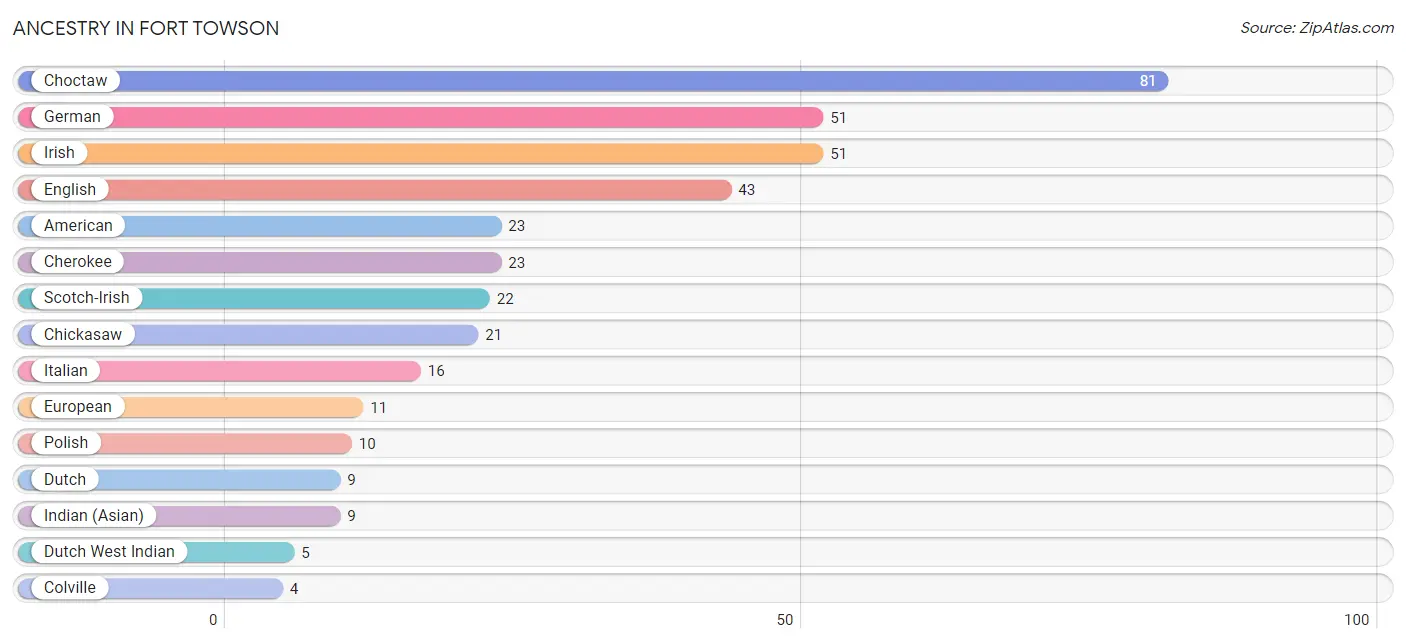
| Ancestry | # Population | % Population |
| American | 23 | 4.2% |
| Apache | 1 | 0.2% |
| British | 2 | 0.4% |
| Cherokee | 23 | 4.2% |
| Chickasaw | 21 | 3.8% |
| Choctaw | 81 | 14.8% |
| Colville | 4 | 0.7% |
| Comanche | 3 | 0.5% |
| Creek | 1 | 0.2% |
| Dutch | 9 | 1.6% |
| Dutch West Indian | 5 | 0.9% |
| Eastern European | 3 | 0.5% |
| English | 43 | 7.9% |
| European | 11 | 2.0% |
| French | 4 | 0.7% |
| German | 51 | 9.3% |
| Indian (Asian) | 9 | 1.6% |
| Irish | 51 | 9.3% |
| Italian | 16 | 2.9% |
| Mexican | 3 | 0.5% |
| Norwegian | 4 | 0.7% |
| Polish | 10 | 1.8% |
| Scotch-Irish | 22 | 4.0% |
| Scottish | 3 | 0.5% |
| Swedish | 4 | 0.7% | View All 25 Rows |
Immigrants in Fort Towson
The most numerous immigrant groups reported in Fort Towson came from Asia (9 | 1.6%), South Eastern Asia (9 | 1.6%), Vietnam (5 | 0.9%), and Laos (4 | 0.7%), together accounting for 4.9% of all Fort Towson residents.
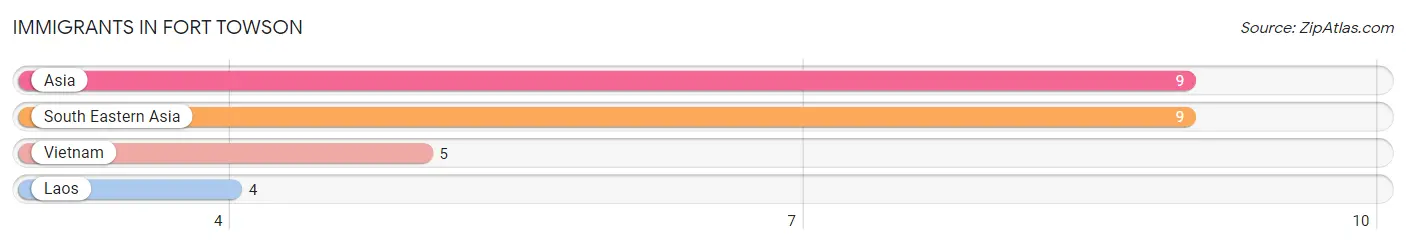
| Immigration Origin | # Population | % Population |
| Asia | 9 | 1.6% |
| Laos | 4 | 0.7% |
| South Eastern Asia | 9 | 1.6% |
| Vietnam | 5 | 0.9% | View All 4 Rows |
Sex and Age in Fort Towson
Sex and Age in Fort Towson
The most populous age groups in Fort Towson are 65 to 69 Years (35 | 12.1%) for men and 65 to 69 Years (24 | 9.3%) for women.
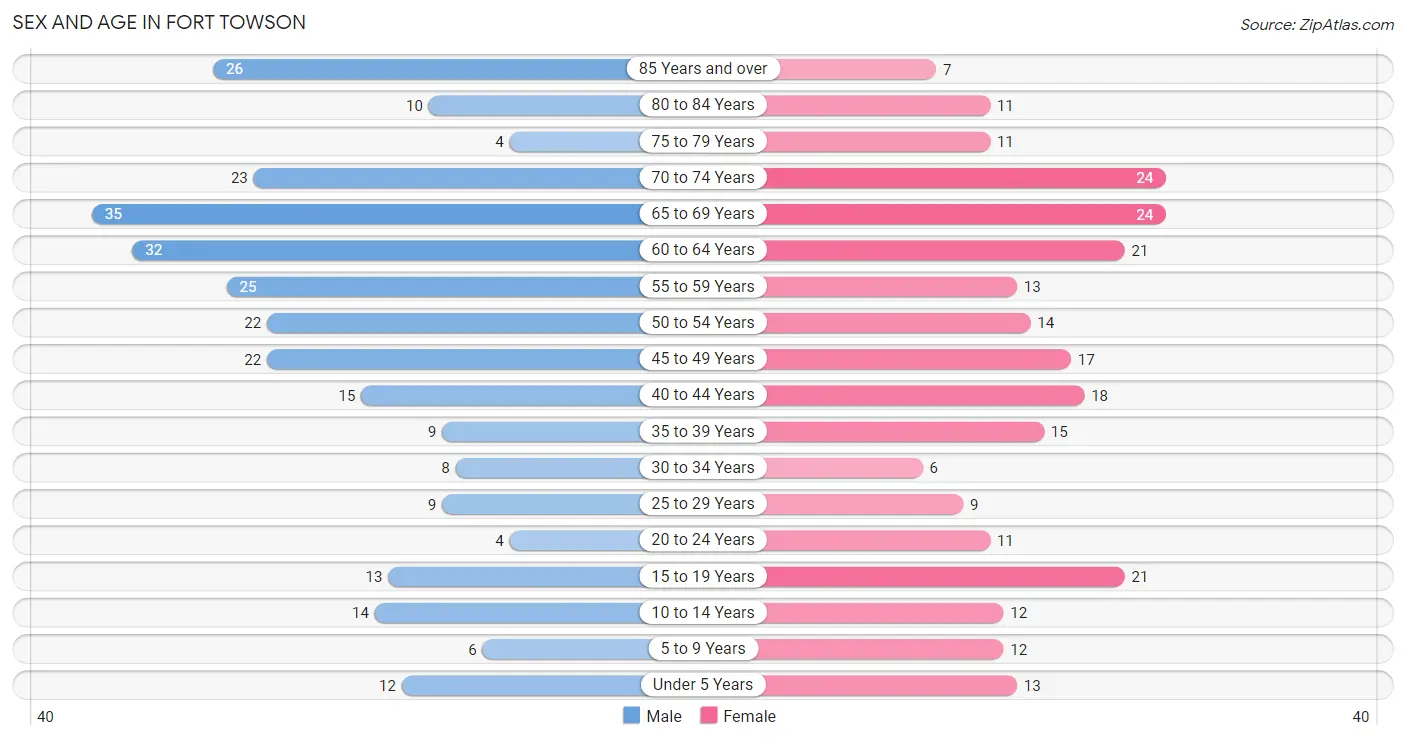
| Age Bracket | Male | Female |
| Under 5 Years | 12 (4.2%) | 13 (5.0%) |
| 5 to 9 Years | 6 (2.1%) | 12 (4.6%) |
| 10 to 14 Years | 14 (4.8%) | 12 (4.6%) |
| 15 to 19 Years | 13 (4.5%) | 21 (8.1%) |
| 20 to 24 Years | 4 (1.4%) | 11 (4.3%) |
| 25 to 29 Years | 9 (3.1%) | 9 (3.5%) |
| 30 to 34 Years | 8 (2.8%) | 6 (2.3%) |
| 35 to 39 Years | 9 (3.1%) | 15 (5.8%) |
| 40 to 44 Years | 15 (5.2%) | 18 (7.0%) |
| 45 to 49 Years | 22 (7.6%) | 17 (6.6%) |
| 50 to 54 Years | 22 (7.6%) | 14 (5.4%) |
| 55 to 59 Years | 25 (8.6%) | 13 (5.0%) |
| 60 to 64 Years | 32 (11.1%) | 21 (8.1%) |
| 65 to 69 Years | 35 (12.1%) | 24 (9.3%) |
| 70 to 74 Years | 23 (8.0%) | 24 (9.3%) |
| 75 to 79 Years | 4 (1.4%) | 11 (4.3%) |
| 80 to 84 Years | 10 (3.5%) | 11 (4.3%) |
| 85 Years and over | 26 (9.0%) | 7 (2.7%) |
| Total | 289 (100.0%) | 259 (100.0%) |
Families and Households in Fort Towson
Median Family Size in Fort Towson
The median family size in Fort Towson is 2.83 persons per family, with single male/father families (15 | 10.1%) accounting for the largest median family size of 4.2 persons per family. On the other hand, single female/mother families (17 | 11.4%) represent the smallest median family size with 2.47 persons per family.
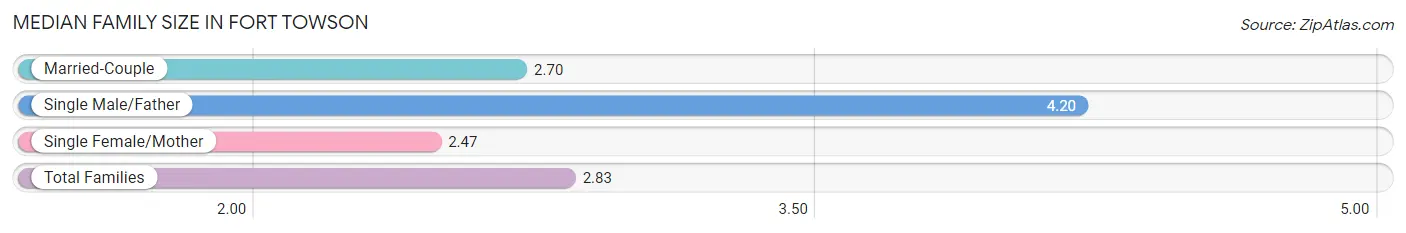
| Family Type | # Families | Family Size |
| Married-Couple | 117 (78.5%) | 2.70 |
| Single Male/Father | 15 (10.1%) | 4.20 |
| Single Female/Mother | 17 (11.4%) | 2.47 |
| Total Families | 149 (100.0%) | 2.83 |
Median Household Size in Fort Towson
The median household size in Fort Towson is 2.35 persons per household, with single male/father households (15 | 6.4%) accounting for the largest median household size of 4.87 persons per household. non-family households (84 | 36.0%) represent the smallest median household size with 1.21 persons per household.
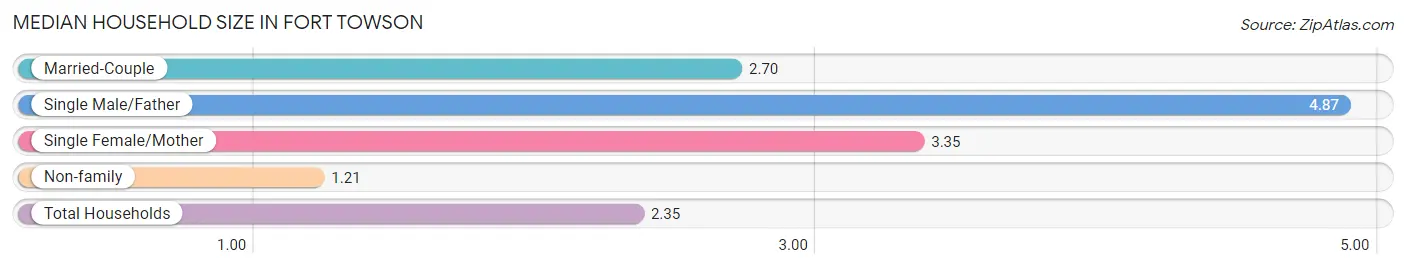
| Household Type | # Households | Household Size |
| Married-Couple | 117 (50.2%) | 2.70 |
| Single Male/Father | 15 (6.4%) | 4.87 |
| Single Female/Mother | 17 (7.3%) | 3.35 |
| Non-family | 84 (36.0%) | 1.21 |
| Total Households | 233 (100.0%) | 2.35 |
Household Size by Marriage Status in Fort Towson
Out of a total of 233 households in Fort Towson, 149 (63.9%) are family households, while 84 (36.0%) are nonfamily households. The most numerous type of family households are 2-person households, comprising 86, and the most common type of nonfamily households are 1-person households, comprising 70.
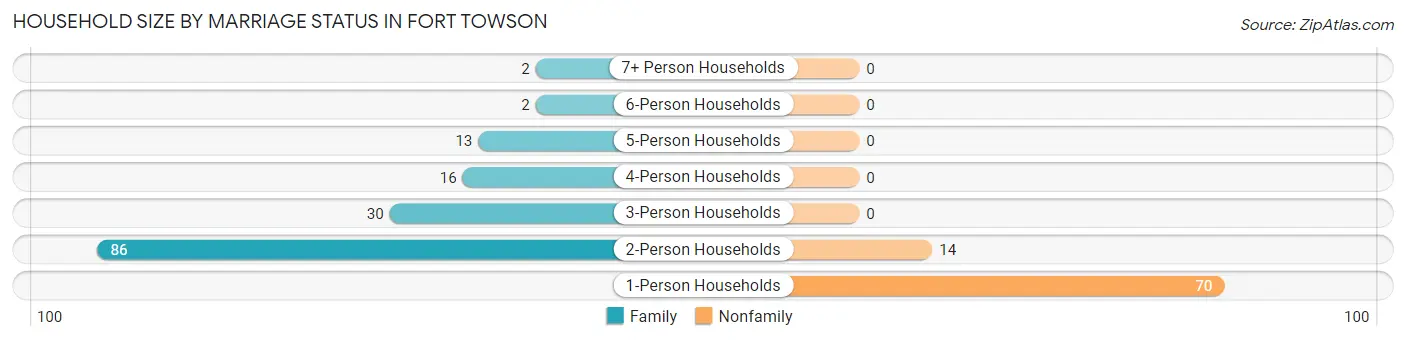
| Household Size | Family Households | Nonfamily Households |
| 1-Person Households | - | 70 (30.0%) |
| 2-Person Households | 86 (36.9%) | 14 (6.0%) |
| 3-Person Households | 30 (12.9%) | 0 (0.0%) |
| 4-Person Households | 16 (6.9%) | 0 (0.0%) |
| 5-Person Households | 13 (5.6%) | 0 (0.0%) |
| 6-Person Households | 2 (0.9%) | 0 (0.0%) |
| 7+ Person Households | 2 (0.9%) | 0 (0.0%) |
| Total | 149 (63.9%) | 84 (36.0%) |
Female Fertility in Fort Towson
Fertility by Age in Fort Towson
Average fertility rate in Fort Towson is 40.0 births per 1,000 women. Women in the age bracket of 20 to 34 years have the highest fertility rate with 154.0 births per 1,000 women. Women in the age bracket of 20 to 34 years acount for 100.0% of all women with births.
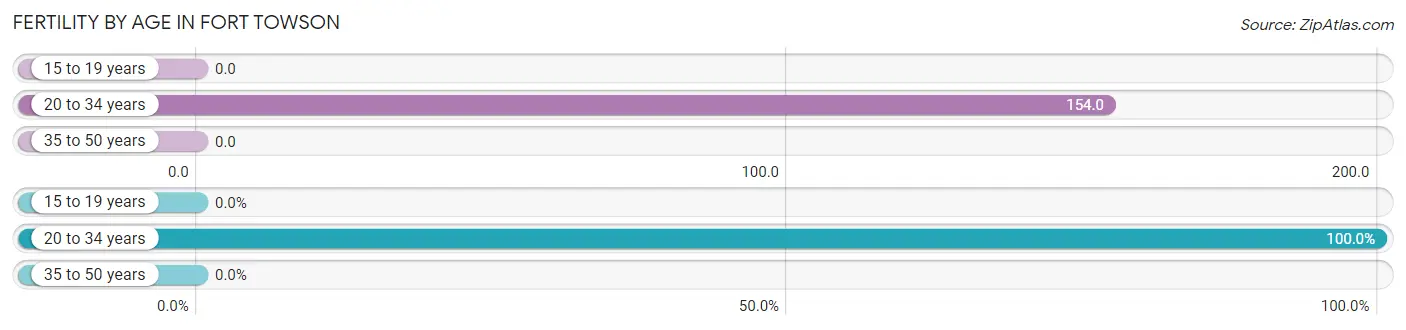
| Age Bracket | Women with Births | Births / 1,000 Women |
| 15 to 19 years | 0 (0.0%) | 0.0 |
| 20 to 34 years | 4 (100.0%) | 154.0 |
| 35 to 50 years | 0 (0.0%) | 0.0 |
| Total | 4 (100.0%) | 40.0 |
Fertility by Age by Marriage Status in Fort Towson
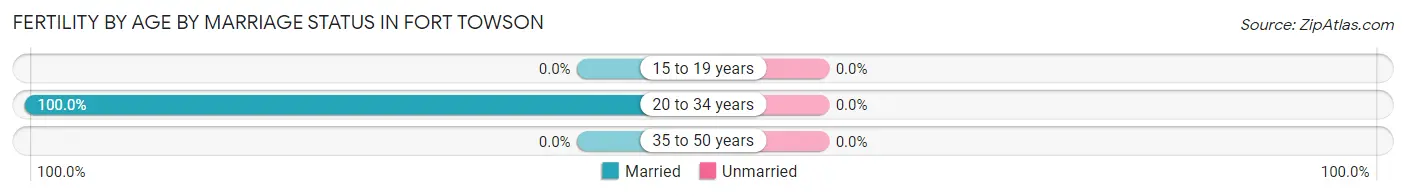
| Age Bracket | Married | Unmarried |
| 15 to 19 years | 0 (0.0%) | 0 (0.0%) |
| 20 to 34 years | 4 (100.0%) | 0 (0.0%) |
| 35 to 50 years | 0 (0.0%) | 0 (0.0%) |
| Total | 4 (100.0%) | 0 (0.0%) |
Fertility by Education in Fort Towson
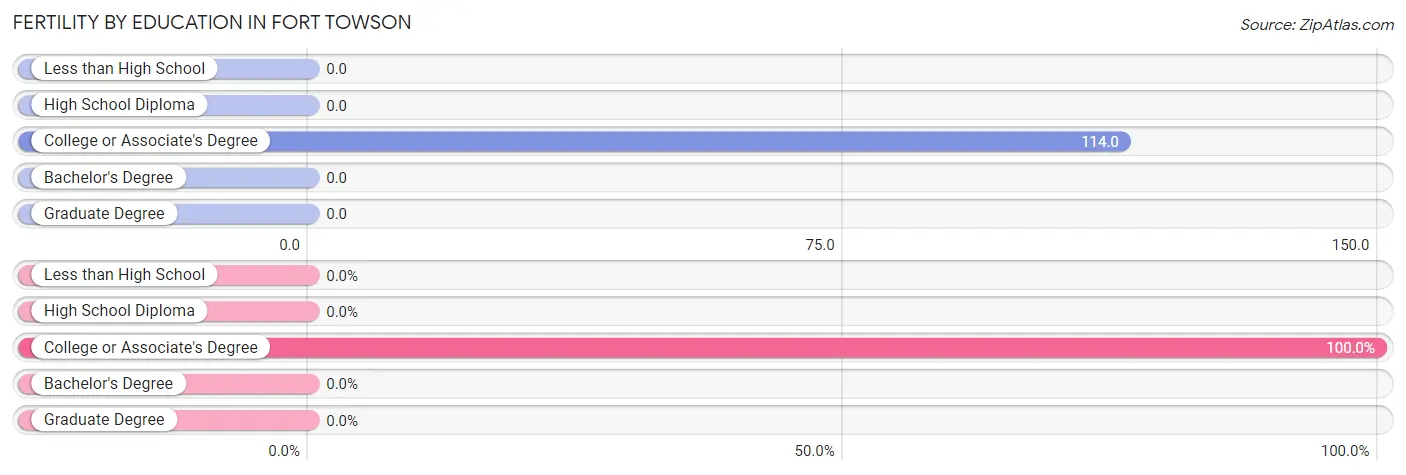
| Educational Attainment | Women with Births | Births / 1,000 Women |
| Less than High School | 0 (0.0%) | 0.0 |
| High School Diploma | 0 (0.0%) | 0.0 |
| College or Associate's Degree | 4 (100.0%) | 114.0 |
| Bachelor's Degree | 0 (0.0%) | 0.0 |
| Graduate Degree | 0 (0.0%) | 0.0 |
| Total | 4 (100.0%) | 40.0 |
Fertility by Education by Marriage Status in Fort Towson
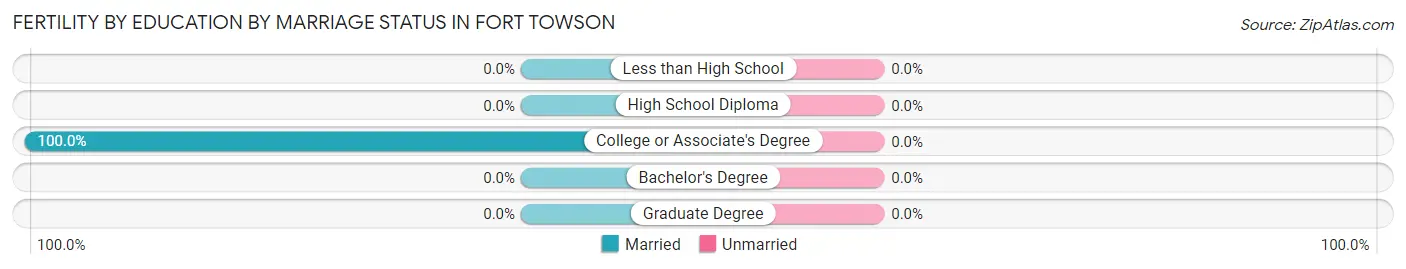
| Educational Attainment | Married | Unmarried |
| Less than High School | 0 (0.0%) | 0 (0.0%) |
| High School Diploma | 0 (0.0%) | 0 (0.0%) |
| College or Associate's Degree | 4 (100.0%) | 0 (0.0%) |
| Bachelor's Degree | 0 (0.0%) | 0 (0.0%) |
| Graduate Degree | 0 (0.0%) | 0 (0.0%) |
| Total | 4 (100.0%) | 0 (0.0%) |
Employment Characteristics in Fort Towson
Employment by Class of Employer in Fort Towson
Among the 191 employed individuals in Fort Towson, private company employees (120 | 62.8%), not-for-profit organizations (19 | 10.0%), and self-employed (not incorporated) (16 | 8.4%) make up the most common classes of employment.
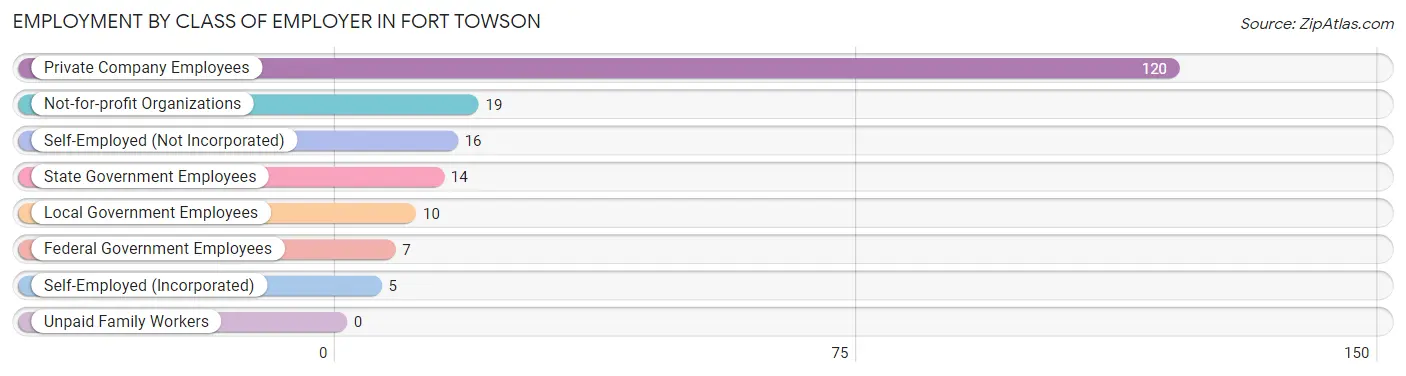
| Employer Class | # Employees | % Employees |
| Private Company Employees | 120 | 62.8% |
| Self-Employed (Incorporated) | 5 | 2.6% |
| Self-Employed (Not Incorporated) | 16 | 8.4% |
| Not-for-profit Organizations | 19 | 10.0% |
| Local Government Employees | 10 | 5.2% |
| State Government Employees | 14 | 7.3% |
| Federal Government Employees | 7 | 3.7% |
| Unpaid Family Workers | 0 | 0.0% |
| Total | 191 | 100.0% |
Employment Status by Age in Fort Towson
According to the labor force statistics for Fort Towson, out of the total population over 16 years of age (470), 50.6% or 238 individuals are in the labor force, with 18.5% or 44 of them unemployed. The age group with the highest labor force participation rate is 25 to 29 years, with 100.0% or 18 individuals in the labor force. Within the labor force, the 20 to 24 years age range has the highest percentage of unemployed individuals, with 87.5% or 7 of them being unemployed.
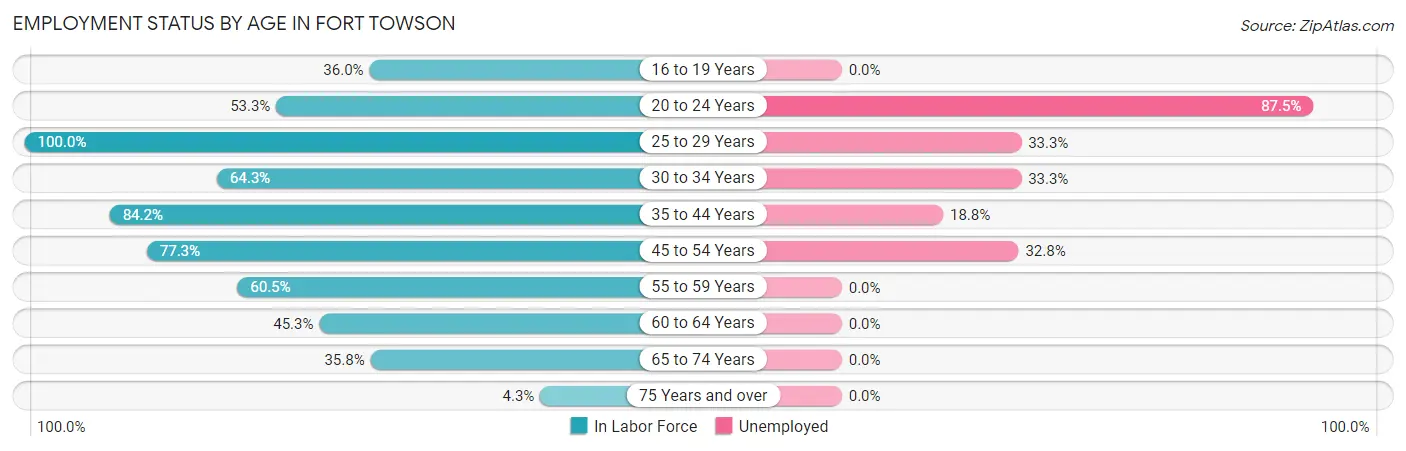
| Age Bracket | In Labor Force | Unemployed |
| 16 to 19 Years | 9 (36.0%) | 0 (0.0%) |
| 20 to 24 Years | 8 (53.3%) | 7 (87.5%) |
| 25 to 29 Years | 18 (100.0%) | 6 (33.3%) |
| 30 to 34 Years | 9 (64.3%) | 3 (33.3%) |
| 35 to 44 Years | 48 (84.2%) | 9 (18.8%) |
| 45 to 54 Years | 58 (77.3%) | 19 (32.8%) |
| 55 to 59 Years | 23 (60.5%) | 0 (0.0%) |
| 60 to 64 Years | 24 (45.3%) | 0 (0.0%) |
| 65 to 74 Years | 38 (35.8%) | 0 (0.0%) |
| 75 Years and over | 3 (4.3%) | 0 (0.0%) |
| Total | 238 (50.6%) | 44 (18.5%) |
Employment Status by Educational Attainment in Fort Towson
According to labor force statistics for Fort Towson, 70.6% of individuals (180) out of the total population between 25 and 64 years of age (255) are in the labor force, with 20.6% or 37 of them being unemployed. The group with the highest labor force participation rate are those with the educational attainment of bachelor's degree or higher, with 93.5% or 29 individuals in the labor force. Within the labor force, individuals with less than high school education have the highest percentage of unemployment, with 76.9% or 10 of them being unemployed.
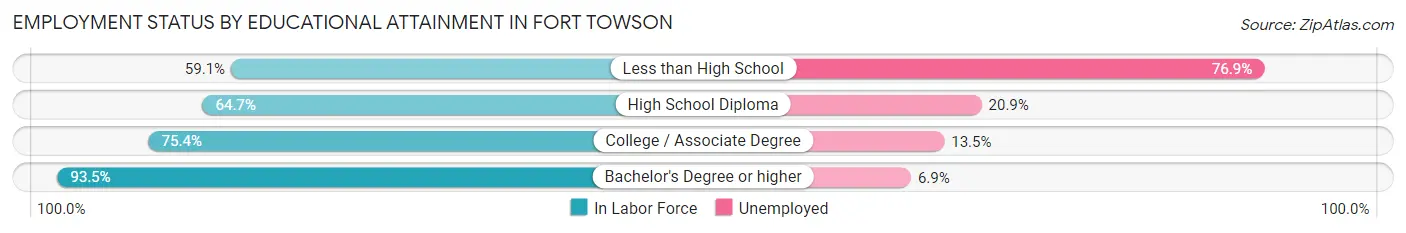
| Educational Attainment | In Labor Force | Unemployed |
| Less than High School | 13 (59.1%) | 17 (76.9%) |
| High School Diploma | 86 (64.7%) | 28 (20.9%) |
| College / Associate Degree | 52 (75.4%) | 9 (13.5%) |
| Bachelor's Degree or higher | 29 (93.5%) | 2 (6.9%) |
| Total | 180 (70.6%) | 53 (20.6%) |
Employment Occupations by Sex in Fort Towson
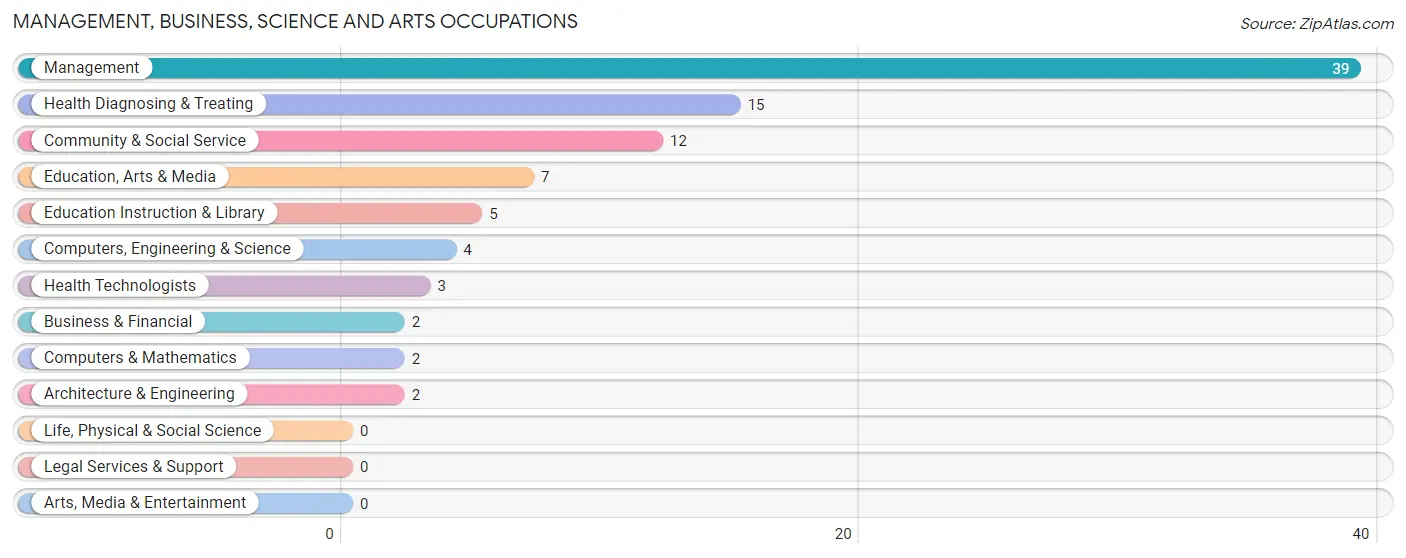
Management, Business, Science and Arts Occupations
The most common Management, Business, Science and Arts occupations in Fort Towson are Management (39 | 20.1%), Health Diagnosing & Treating (15 | 7.7%), Community & Social Service (12 | 6.2%), Education, Arts & Media (7 | 3.6%), and Education Instruction & Library (5 | 2.6%).
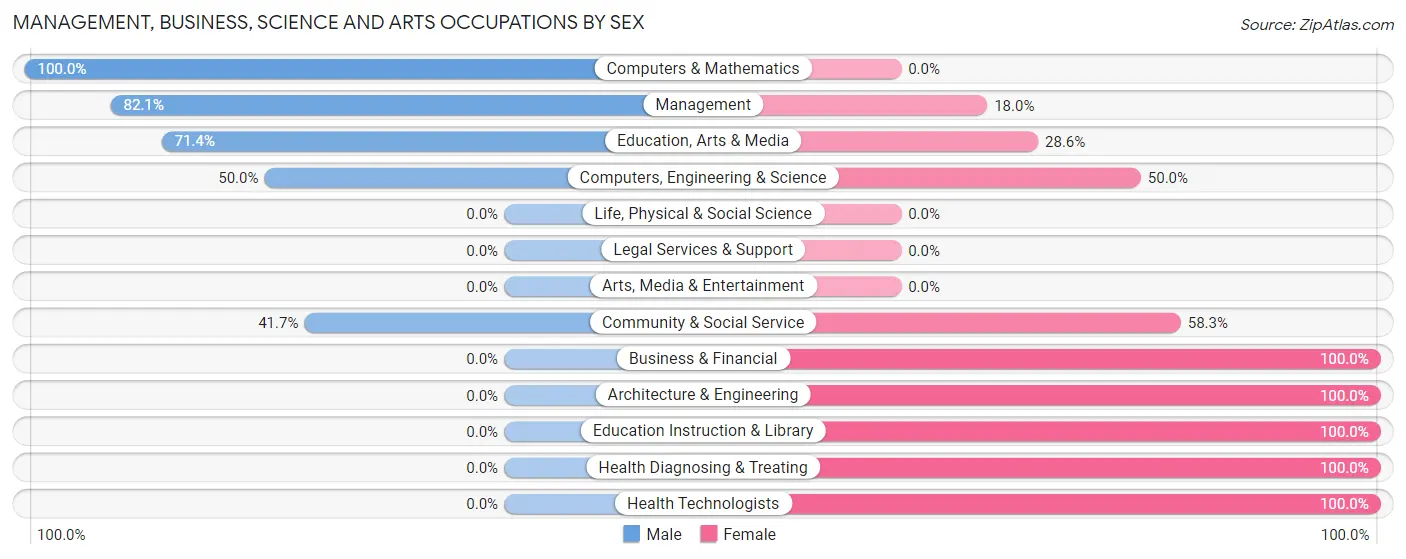
Management, Business, Science and Arts Occupations by Sex
Within the Management, Business, Science and Arts occupations in Fort Towson, the most male-oriented occupations are Computers & Mathematics (100.0%), Management (82.1%), and Education, Arts & Media (71.4%), while the most female-oriented occupations are Business & Financial (100.0%), Architecture & Engineering (100.0%), and Education Instruction & Library (100.0%).
| Occupation | Male | Female |
| Management | 32 (82.1%) | 7 (17.9%) |
| Business & Financial | 0 (0.0%) | 2 (100.0%) |
| Computers, Engineering & Science | 2 (50.0%) | 2 (50.0%) |
| Computers & Mathematics | 2 (100.0%) | 0 (0.0%) |
| Architecture & Engineering | 0 (0.0%) | 2 (100.0%) |
| Life, Physical & Social Science | 0 (0.0%) | 0 (0.0%) |
| Community & Social Service | 5 (41.7%) | 7 (58.3%) |
| Education, Arts & Media | 5 (71.4%) | 2 (28.6%) |
| Legal Services & Support | 0 (0.0%) | 0 (0.0%) |
| Education Instruction & Library | 0 (0.0%) | 5 (100.0%) |
| Arts, Media & Entertainment | 0 (0.0%) | 0 (0.0%) |
| Health Diagnosing & Treating | 0 (0.0%) | 15 (100.0%) |
| Health Technologists | 0 (0.0%) | 3 (100.0%) |
| Total (Category) | 39 (54.2%) | 33 (45.8%) |
| Total (Overall) | 121 (62.4%) | 73 (37.6%) |
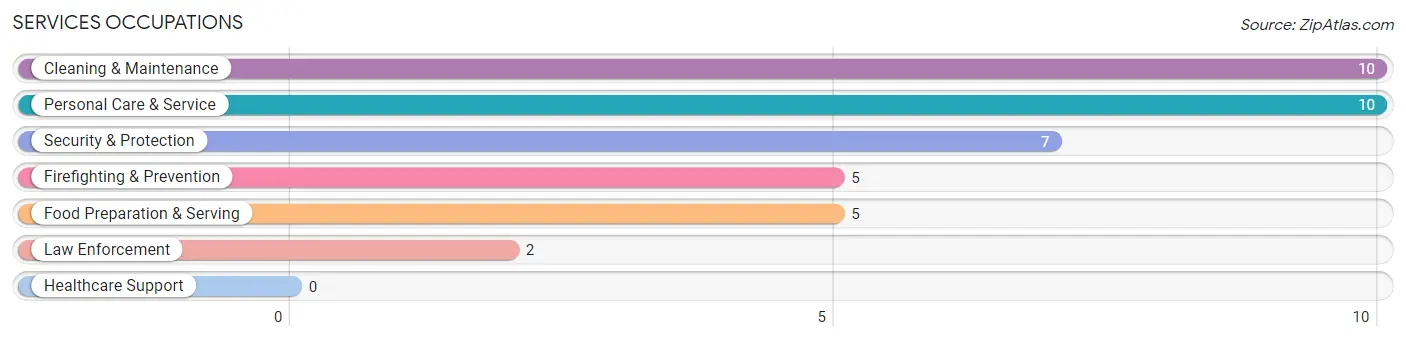
Services Occupations
The most common Services occupations in Fort Towson are Cleaning & Maintenance (10 | 5.1%), Personal Care & Service (10 | 5.1%), Security & Protection (7 | 3.6%), Firefighting & Prevention (5 | 2.6%), and Food Preparation & Serving (5 | 2.6%).
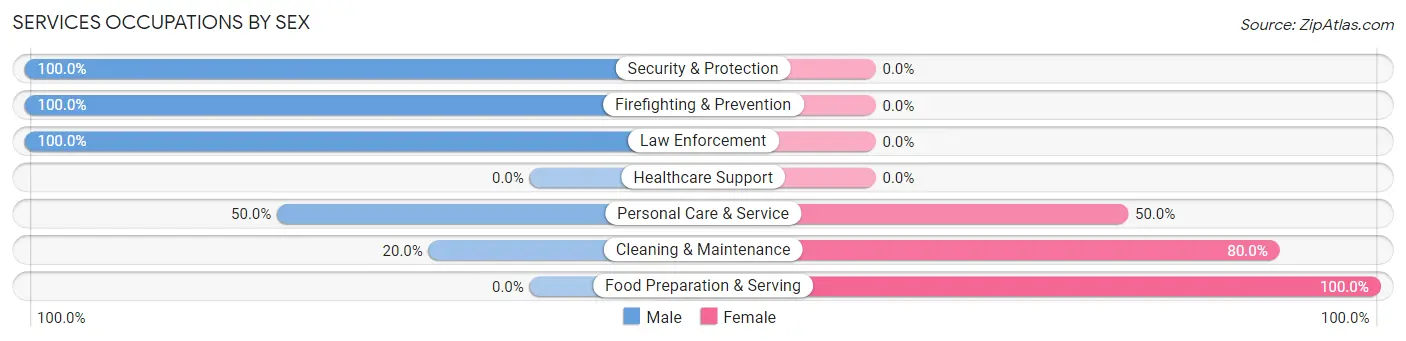
Services Occupations by Sex
Within the Services occupations in Fort Towson, the most male-oriented occupations are Security & Protection (100.0%), Firefighting & Prevention (100.0%), and Law Enforcement (100.0%), while the most female-oriented occupations are Food Preparation & Serving (100.0%), Cleaning & Maintenance (80.0%), and Personal Care & Service (50.0%).
| Occupation | Male | Female |
| Healthcare Support | 0 (0.0%) | 0 (0.0%) |
| Security & Protection | 7 (100.0%) | 0 (0.0%) |
| Firefighting & Prevention | 5 (100.0%) | 0 (0.0%) |
| Law Enforcement | 2 (100.0%) | 0 (0.0%) |
| Food Preparation & Serving | 0 (0.0%) | 5 (100.0%) |
| Cleaning & Maintenance | 2 (20.0%) | 8 (80.0%) |
| Personal Care & Service | 5 (50.0%) | 5 (50.0%) |
| Total (Category) | 14 (43.8%) | 18 (56.2%) |
| Total (Overall) | 121 (62.4%) | 73 (37.6%) |
Sales and Office Occupations
The most common Sales and Office occupations in Fort Towson are Sales & Related (11 | 5.7%), and Office & Administration (10 | 5.1%).
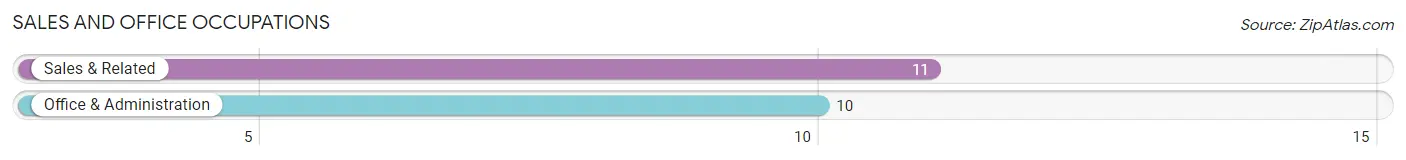
Sales and Office Occupations by Sex
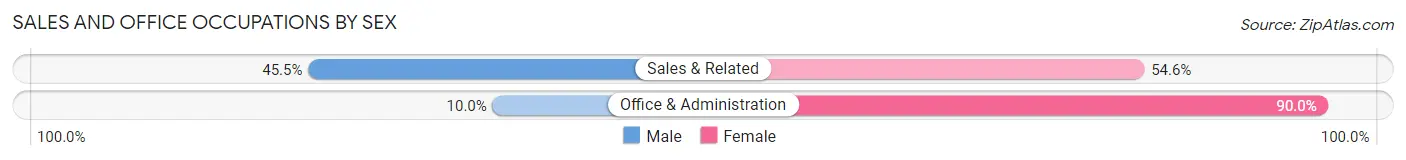
| Occupation | Male | Female |
| Sales & Related | 5 (45.5%) | 6 (54.5%) |
| Office & Administration | 1 (10.0%) | 9 (90.0%) |
| Total (Category) | 6 (28.6%) | 15 (71.4%) |
| Total (Overall) | 121 (62.4%) | 73 (37.6%) |
Natural Resources, Construction and Maintenance Occupations
The most common Natural Resources, Construction and Maintenance occupations in Fort Towson are Construction & Extraction (15 | 7.7%), Farming, Fishing & Forestry (5 | 2.6%), and Installation, Maintenance & Repair (5 | 2.6%).
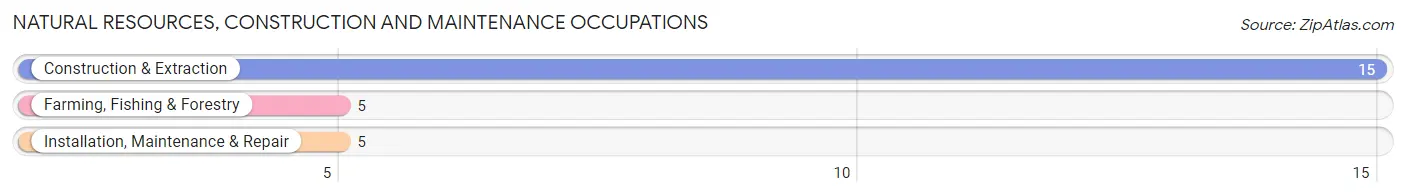
Natural Resources, Construction and Maintenance Occupations by Sex
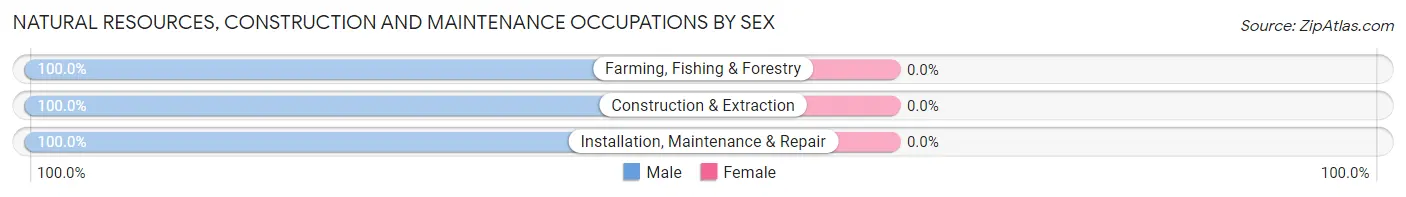
| Occupation | Male | Female |
| Farming, Fishing & Forestry | 5 (100.0%) | 0 (0.0%) |
| Construction & Extraction | 15 (100.0%) | 0 (0.0%) |
| Installation, Maintenance & Repair | 5 (100.0%) | 0 (0.0%) |
| Total (Category) | 25 (100.0%) | 0 (0.0%) |
| Total (Overall) | 121 (62.4%) | 73 (37.6%) |
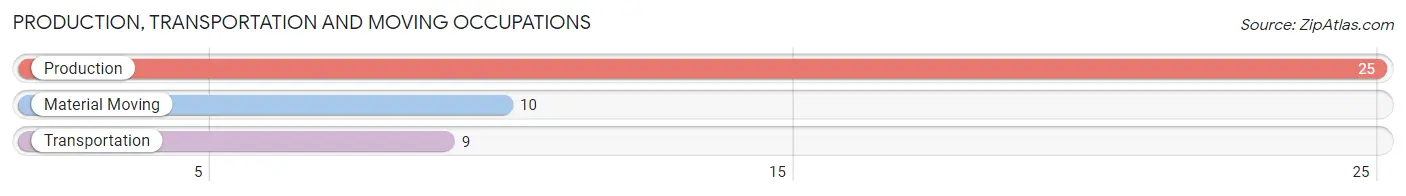
Production, Transportation and Moving Occupations
The most common Production, Transportation and Moving occupations in Fort Towson are Production (25 | 12.9%), Material Moving (10 | 5.1%), and Transportation (9 | 4.6%).
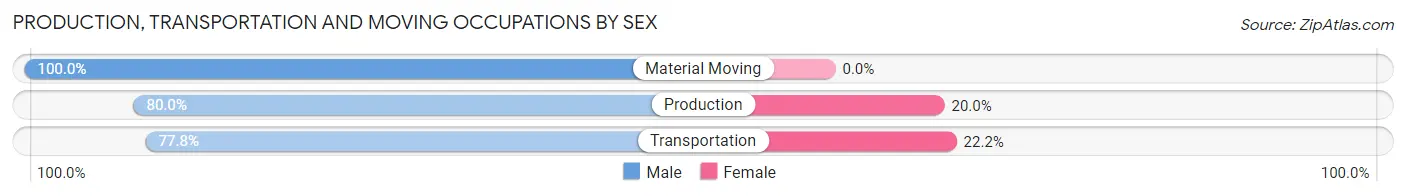
Production, Transportation and Moving Occupations by Sex
| Occupation | Male | Female |
| Production | 20 (80.0%) | 5 (20.0%) |
| Transportation | 7 (77.8%) | 2 (22.2%) |
| Material Moving | 10 (100.0%) | 0 (0.0%) |
| Total (Category) | 37 (84.1%) | 7 (15.9%) |
| Total (Overall) | 121 (62.4%) | 73 (37.6%) |
Employment Industries by Sex in Fort Towson
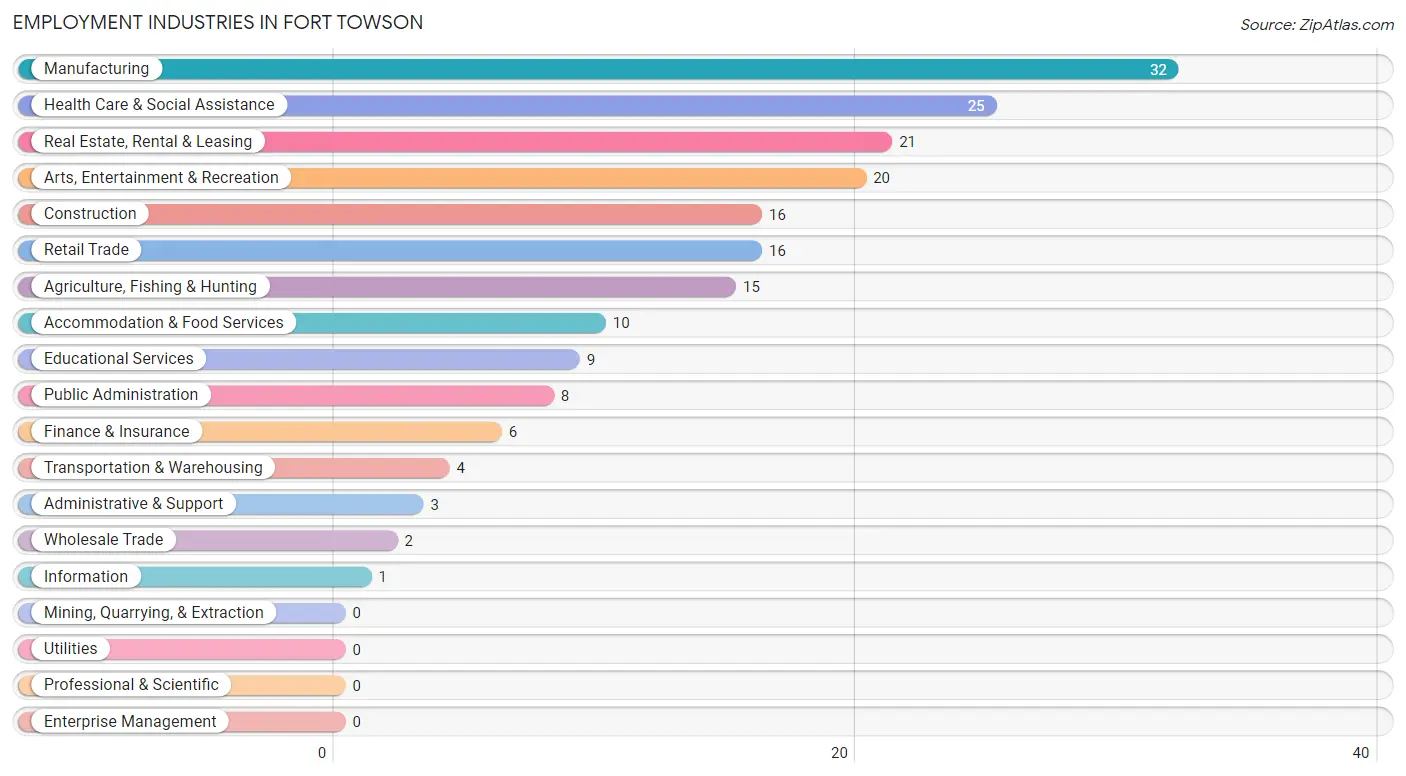
Employment Industries in Fort Towson
The major employment industries in Fort Towson include Manufacturing (32 | 16.5%), Health Care & Social Assistance (25 | 12.9%), Real Estate, Rental & Leasing (21 | 10.8%), Arts, Entertainment & Recreation (20 | 10.3%), and Construction (16 | 8.3%).
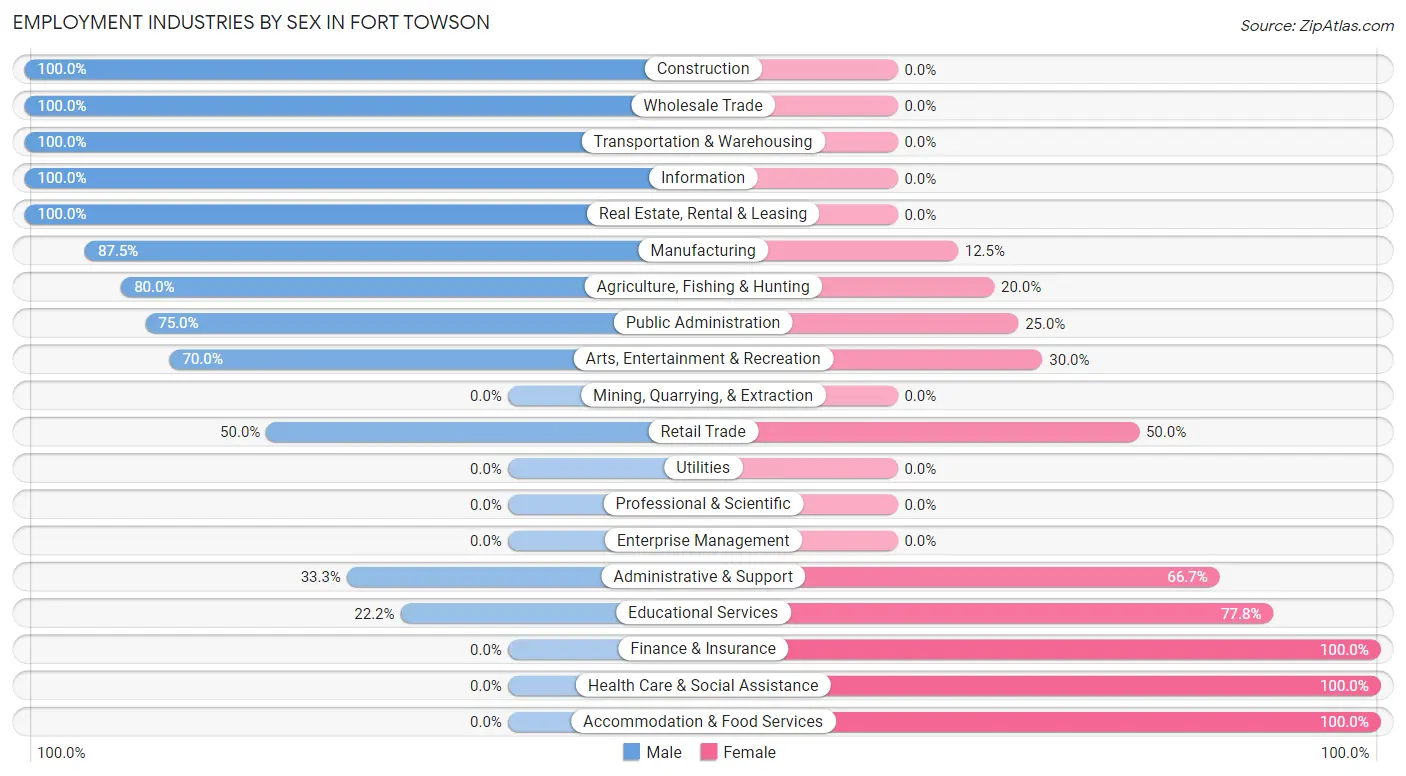
Employment Industries by Sex in Fort Towson
The Fort Towson industries that see more men than women are Construction (100.0%), Wholesale Trade (100.0%), and Transportation & Warehousing (100.0%), whereas the industries that tend to have a higher number of women are Finance & Insurance (100.0%), Health Care & Social Assistance (100.0%), and Accommodation & Food Services (100.0%).
| Industry | Male | Female |
| Agriculture, Fishing & Hunting | 12 (80.0%) | 3 (20.0%) |
| Mining, Quarrying, & Extraction | 0 (0.0%) | 0 (0.0%) |
| Construction | 16 (100.0%) | 0 (0.0%) |
| Manufacturing | 28 (87.5%) | 4 (12.5%) |
| Wholesale Trade | 2 (100.0%) | 0 (0.0%) |
| Retail Trade | 8 (50.0%) | 8 (50.0%) |
| Transportation & Warehousing | 4 (100.0%) | 0 (0.0%) |
| Utilities | 0 (0.0%) | 0 (0.0%) |
| Information | 1 (100.0%) | 0 (0.0%) |
| Finance & Insurance | 0 (0.0%) | 6 (100.0%) |
| Real Estate, Rental & Leasing | 21 (100.0%) | 0 (0.0%) |
| Professional & Scientific | 0 (0.0%) | 0 (0.0%) |
| Enterprise Management | 0 (0.0%) | 0 (0.0%) |
| Administrative & Support | 1 (33.3%) | 2 (66.7%) |
| Educational Services | 2 (22.2%) | 7 (77.8%) |
| Health Care & Social Assistance | 0 (0.0%) | 25 (100.0%) |
| Arts, Entertainment & Recreation | 14 (70.0%) | 6 (30.0%) |
| Accommodation & Food Services | 0 (0.0%) | 10 (100.0%) |
| Public Administration | 6 (75.0%) | 2 (25.0%) |
| Total | 121 (62.4%) | 73 (37.6%) |
Education in Fort Towson
School Enrollment in Fort Towson
The most common levels of schooling among the 84 students in Fort Towson are middle school (27 | 32.1%), high school (21 | 25.0%), and elementary school (16 | 19.1%).
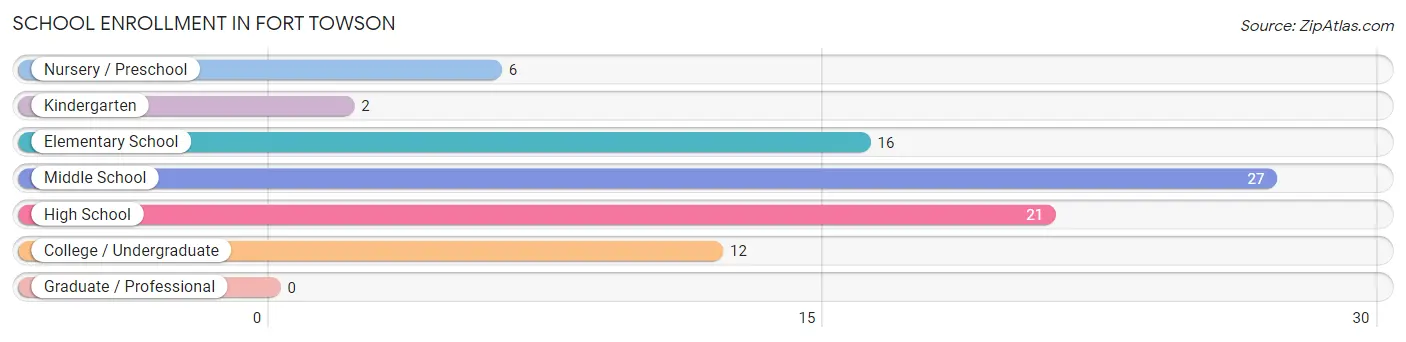
| School Level | # Students | % Students |
| Nursery / Preschool | 6 | 7.1% |
| Kindergarten | 2 | 2.4% |
| Elementary School | 16 | 19.1% |
| Middle School | 27 | 32.1% |
| High School | 21 | 25.0% |
| College / Undergraduate | 12 | 14.3% |
| Graduate / Professional | 0 | 0.0% |
| Total | 84 | 100.0% |
School Enrollment by Age by Funding Source in Fort Towson
Out of a total of 84 students who are enrolled in schools in Fort Towson, 4 (4.8%) attend a private institution, while the remaining 80 (95.2%) are enrolled in public schools. The age group of 15 to 17 year olds has the highest likelihood of being enrolled in private schools, with 4 (15.4% in the age bracket) enrolled. Conversely, the age group of 3 to 4 year olds has the lowest likelihood of being enrolled in a private school, with 6 (100.0% in the age bracket) attending a public institution.
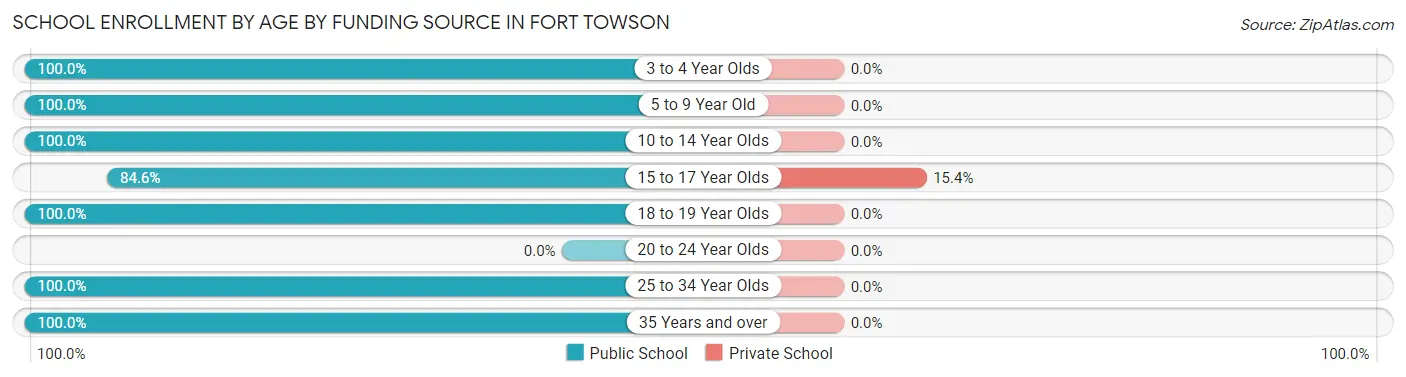
| Age Bracket | Public School | Private School |
| 3 to 4 Year Olds | 6 (100.0%) | 0 (0.0%) |
| 5 to 9 Year Old | 14 (100.0%) | 0 (0.0%) |
| 10 to 14 Year Olds | 26 (100.0%) | 0 (0.0%) |
| 15 to 17 Year Olds | 22 (84.6%) | 4 (15.4%) |
| 18 to 19 Year Olds | 7 (100.0%) | 0 (0.0%) |
| 20 to 24 Year Olds | 0 (0.0%) | 0 (0.0%) |
| 25 to 34 Year Olds | 2 (100.0%) | 0 (0.0%) |
| 35 Years and over | 3 (100.0%) | 0 (0.0%) |
| Total | 80 (95.2%) | 4 (4.8%) |
Educational Attainment by Field of Study in Fort Towson
Education (25 | 33.3%), psychology (18 | 24.0%), science & technology (6 | 8.0%), liberal arts & history (6 | 8.0%), and business (5 | 6.7%) are the most common fields of study among 75 individuals in Fort Towson who have obtained a bachelor's degree or higher.
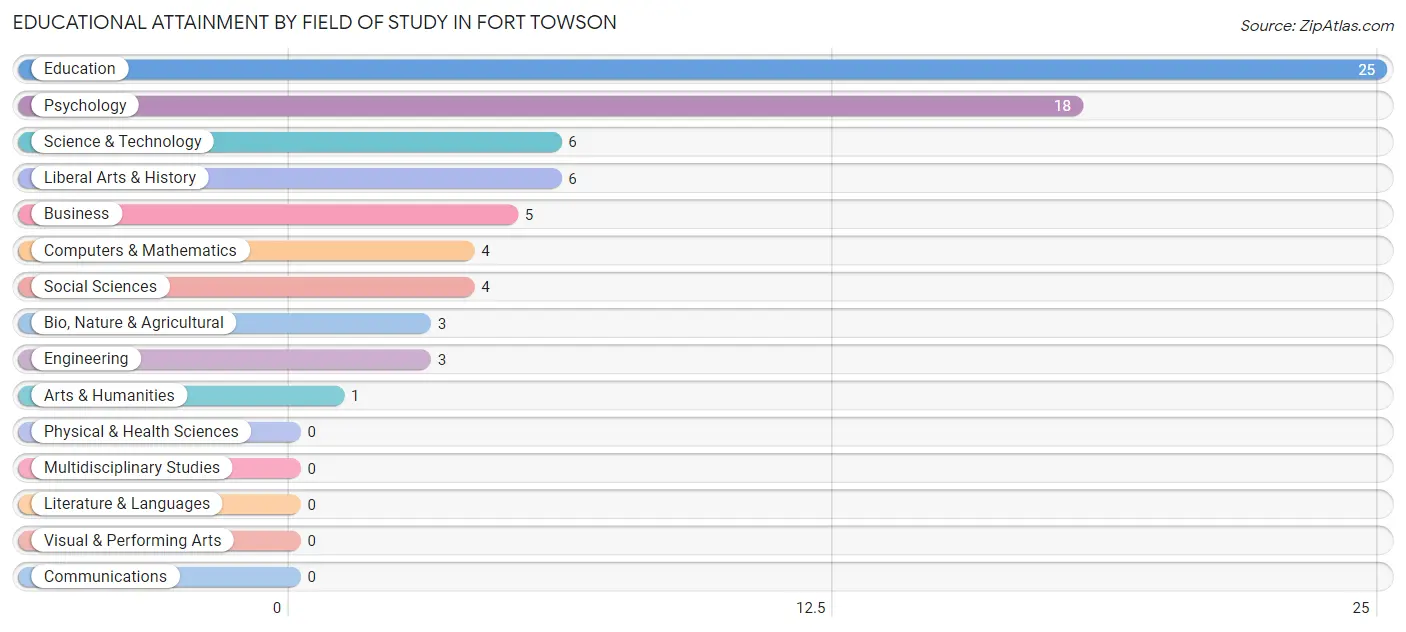
| Field of Study | # Graduates | % Graduates |
| Computers & Mathematics | 4 | 5.3% |
| Bio, Nature & Agricultural | 3 | 4.0% |
| Physical & Health Sciences | 0 | 0.0% |
| Psychology | 18 | 24.0% |
| Social Sciences | 4 | 5.3% |
| Engineering | 3 | 4.0% |
| Multidisciplinary Studies | 0 | 0.0% |
| Science & Technology | 6 | 8.0% |
| Business | 5 | 6.7% |
| Education | 25 | 33.3% |
| Literature & Languages | 0 | 0.0% |
| Liberal Arts & History | 6 | 8.0% |
| Visual & Performing Arts | 0 | 0.0% |
| Communications | 0 | 0.0% |
| Arts & Humanities | 1 | 1.3% |
| Total | 75 | 100.0% |
Transportation & Commute in Fort Towson
Vehicle Availability by Sex in Fort Towson
The most prevalent vehicle ownership categories in Fort Towson are males with 2 vehicles (66, accounting for 55.0%) and females with 2 vehicles (42, making up 93.0%).
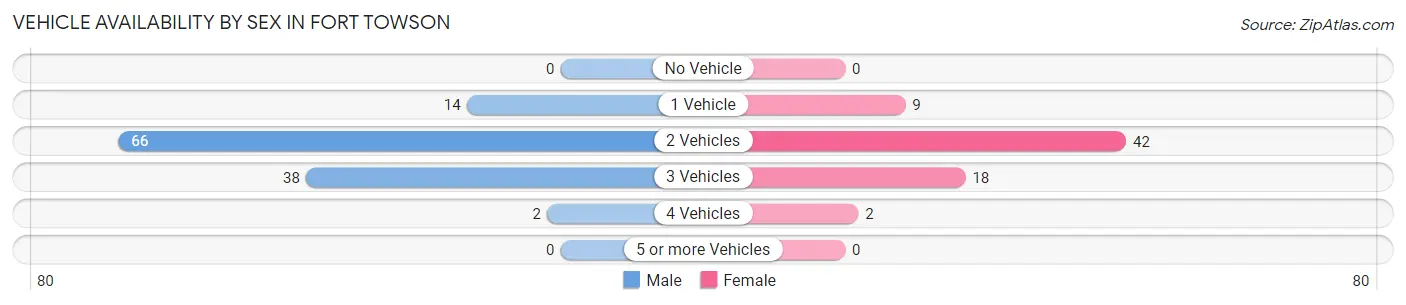
| Vehicles Available | Male | Female |
| No Vehicle | 0 (0.0%) | 0 (0.0%) |
| 1 Vehicle | 14 (11.7%) | 9 (12.7%) |
| 2 Vehicles | 66 (55.0%) | 42 (59.2%) |
| 3 Vehicles | 38 (31.7%) | 18 (25.4%) |
| 4 Vehicles | 2 (1.7%) | 2 (2.8%) |
| 5 or more Vehicles | 0 (0.0%) | 0 (0.0%) |
| Total | 120 (100.0%) | 71 (100.0%) |
Commute Time in Fort Towson
The most frequently occuring commute durations in Fort Towson are 25 to 29 minutes (40 commuters, 21.3%), 20 to 24 minutes (32 commuters, 17.0%), and 30 to 34 minutes (26 commuters, 13.8%).
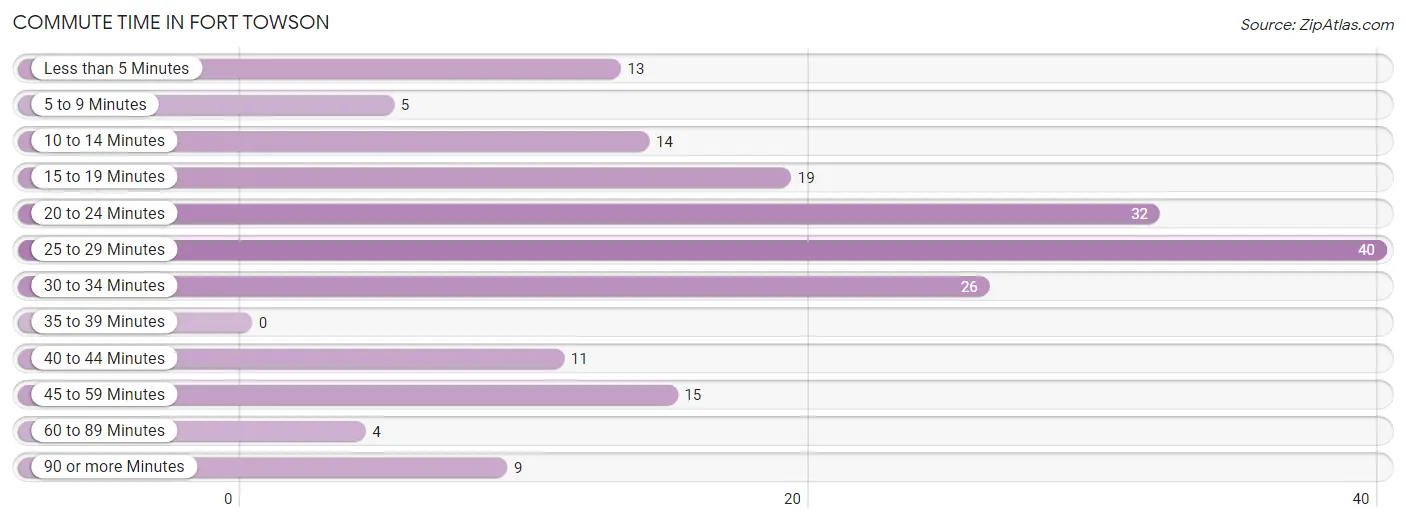
| Commute Time | # Commuters | % Commuters |
| Less than 5 Minutes | 13 | 6.9% |
| 5 to 9 Minutes | 5 | 2.7% |
| 10 to 14 Minutes | 14 | 7.4% |
| 15 to 19 Minutes | 19 | 10.1% |
| 20 to 24 Minutes | 32 | 17.0% |
| 25 to 29 Minutes | 40 | 21.3% |
| 30 to 34 Minutes | 26 | 13.8% |
| 35 to 39 Minutes | 0 | 0.0% |
| 40 to 44 Minutes | 11 | 5.9% |
| 45 to 59 Minutes | 15 | 8.0% |
| 60 to 89 Minutes | 4 | 2.1% |
| 90 or more Minutes | 9 | 4.8% |
Commute Time by Sex in Fort Towson
The most common commute times in Fort Towson are 25 to 29 minutes (38 commuters, 31.7%) for males and 20 to 24 minutes (13 commuters, 19.1%) for females.
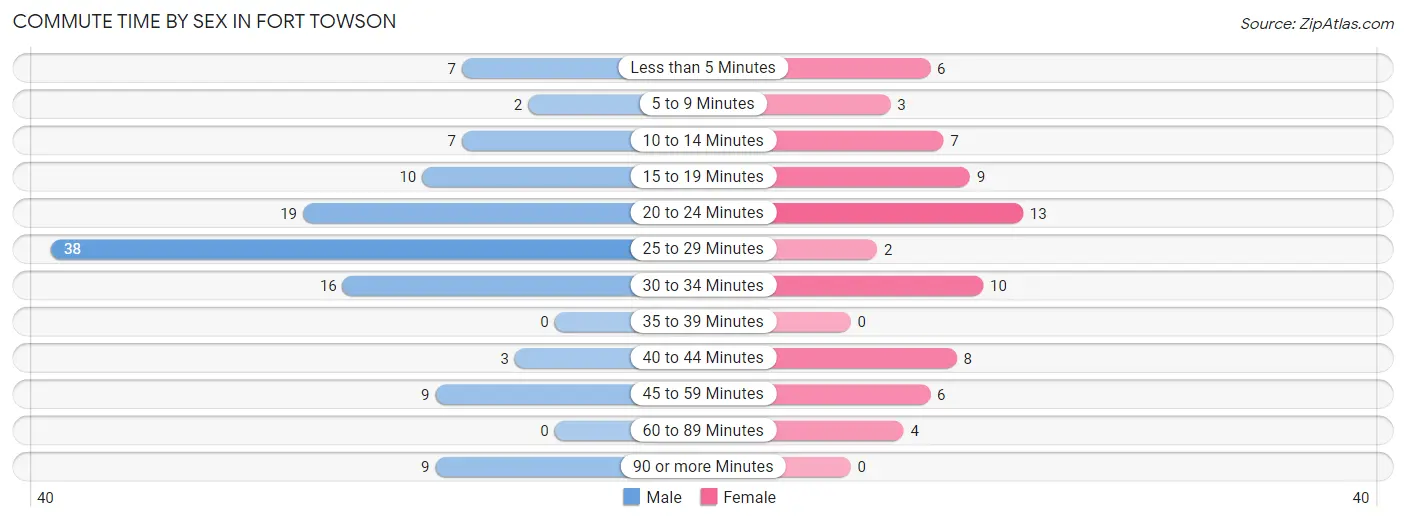
| Commute Time | Male | Female |
| Less than 5 Minutes | 7 (5.8%) | 6 (8.8%) |
| 5 to 9 Minutes | 2 (1.7%) | 3 (4.4%) |
| 10 to 14 Minutes | 7 (5.8%) | 7 (10.3%) |
| 15 to 19 Minutes | 10 (8.3%) | 9 (13.2%) |
| 20 to 24 Minutes | 19 (15.8%) | 13 (19.1%) |
| 25 to 29 Minutes | 38 (31.7%) | 2 (2.9%) |
| 30 to 34 Minutes | 16 (13.3%) | 10 (14.7%) |
| 35 to 39 Minutes | 0 (0.0%) | 0 (0.0%) |
| 40 to 44 Minutes | 3 (2.5%) | 8 (11.8%) |
| 45 to 59 Minutes | 9 (7.5%) | 6 (8.8%) |
| 60 to 89 Minutes | 0 (0.0%) | 4 (5.9%) |
| 90 or more Minutes | 9 (7.5%) | 0 (0.0%) |
Time of Departure to Work by Sex in Fort Towson
The most frequent times of departure to work in Fort Towson are 6:30 AM to 6:59 AM (45, 37.5%) for males and 7:00 AM to 7:29 AM (16, 23.5%) for females.
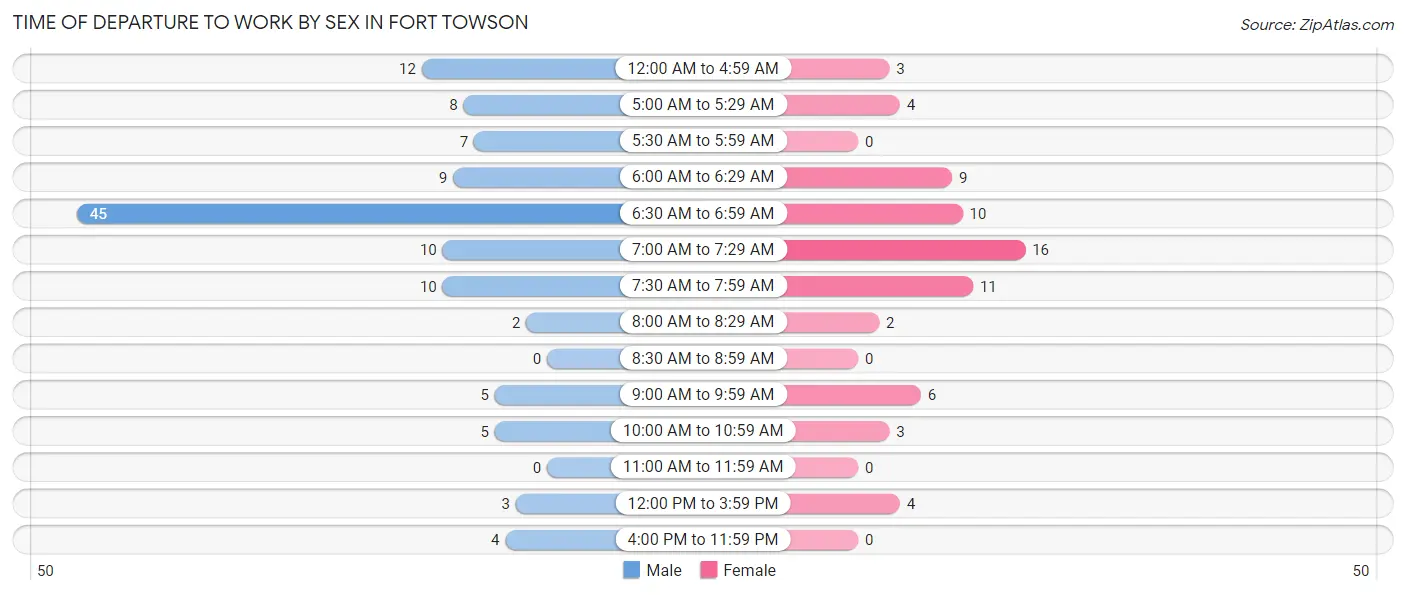
| Time of Departure | Male | Female |
| 12:00 AM to 4:59 AM | 12 (10.0%) | 3 (4.4%) |
| 5:00 AM to 5:29 AM | 8 (6.7%) | 4 (5.9%) |
| 5:30 AM to 5:59 AM | 7 (5.8%) | 0 (0.0%) |
| 6:00 AM to 6:29 AM | 9 (7.5%) | 9 (13.2%) |
| 6:30 AM to 6:59 AM | 45 (37.5%) | 10 (14.7%) |
| 7:00 AM to 7:29 AM | 10 (8.3%) | 16 (23.5%) |
| 7:30 AM to 7:59 AM | 10 (8.3%) | 11 (16.2%) |
| 8:00 AM to 8:29 AM | 2 (1.7%) | 2 (2.9%) |
| 8:30 AM to 8:59 AM | 0 (0.0%) | 0 (0.0%) |
| 9:00 AM to 9:59 AM | 5 (4.2%) | 6 (8.8%) |
| 10:00 AM to 10:59 AM | 5 (4.2%) | 3 (4.4%) |
| 11:00 AM to 11:59 AM | 0 (0.0%) | 0 (0.0%) |
| 12:00 PM to 3:59 PM | 3 (2.5%) | 4 (5.9%) |
| 4:00 PM to 11:59 PM | 4 (3.3%) | 0 (0.0%) |
| Total | 120 (100.0%) | 68 (100.0%) |
Housing Occupancy in Fort Towson
Occupancy by Ownership in Fort Towson
Of the total 233 dwellings in Fort Towson, owner-occupied units account for 172 (73.8%), while renter-occupied units make up 61 (26.2%).
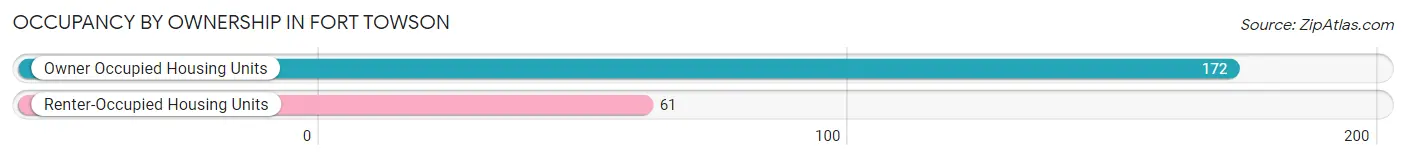
| Occupancy | # Housing Units | % Housing Units |
| Owner Occupied Housing Units | 172 | 73.8% |
| Renter-Occupied Housing Units | 61 | 26.2% |
| Total Occupied Housing Units | 233 | 100.0% |
Occupancy by Household Size in Fort Towson
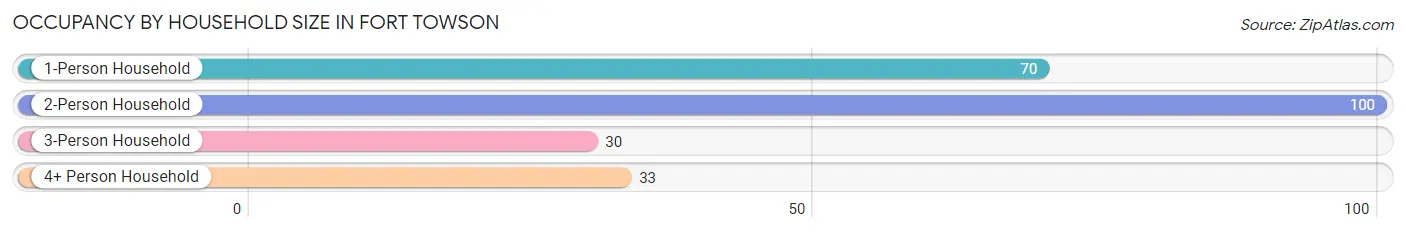
| Household Size | # Housing Units | % Housing Units |
| 1-Person Household | 70 | 30.0% |
| 2-Person Household | 100 | 42.9% |
| 3-Person Household | 30 | 12.9% |
| 4+ Person Household | 33 | 14.2% |
| Total Housing Units | 233 | 100.0% |
Occupancy by Ownership by Household Size in Fort Towson
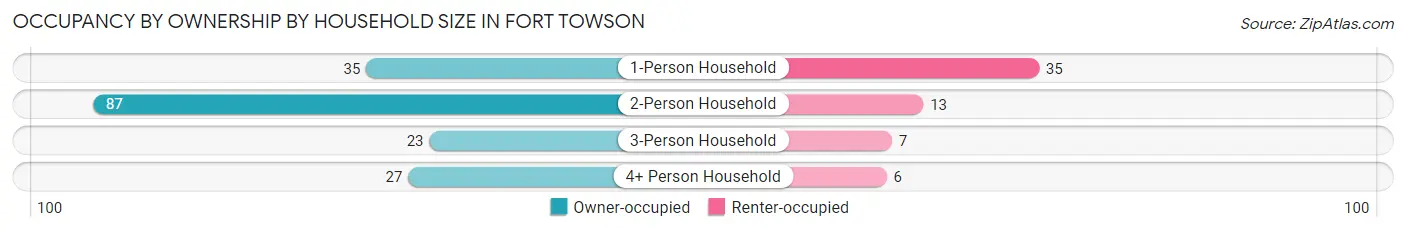
| Household Size | Owner-occupied | Renter-occupied |
| 1-Person Household | 35 (50.0%) | 35 (50.0%) |
| 2-Person Household | 87 (87.0%) | 13 (13.0%) |
| 3-Person Household | 23 (76.7%) | 7 (23.3%) |
| 4+ Person Household | 27 (81.8%) | 6 (18.2%) |
| Total Housing Units | 172 (73.8%) | 61 (26.2%) |
Occupancy by Educational Attainment in Fort Towson
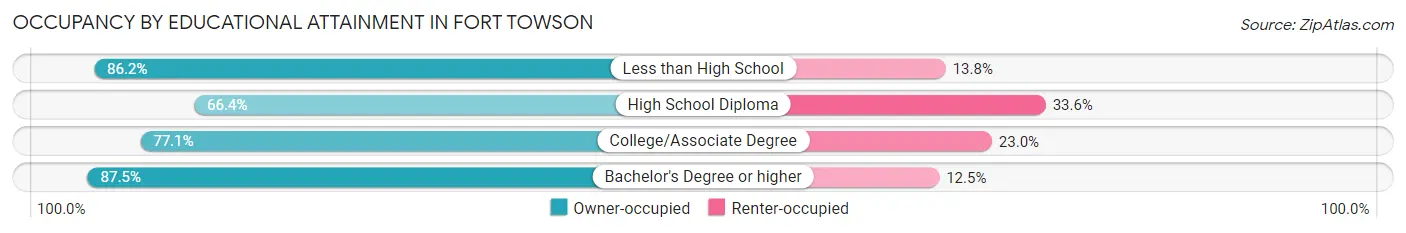
| Household Size | Owner-occupied | Renter-occupied |
| Less than High School | 25 (86.2%) | 4 (13.8%) |
| High School Diploma | 79 (66.4%) | 40 (33.6%) |
| College/Associate Degree | 47 (77.0%) | 14 (23.0%) |
| Bachelor's Degree or higher | 21 (87.5%) | 3 (12.5%) |
Occupancy by Age of Householder in Fort Towson
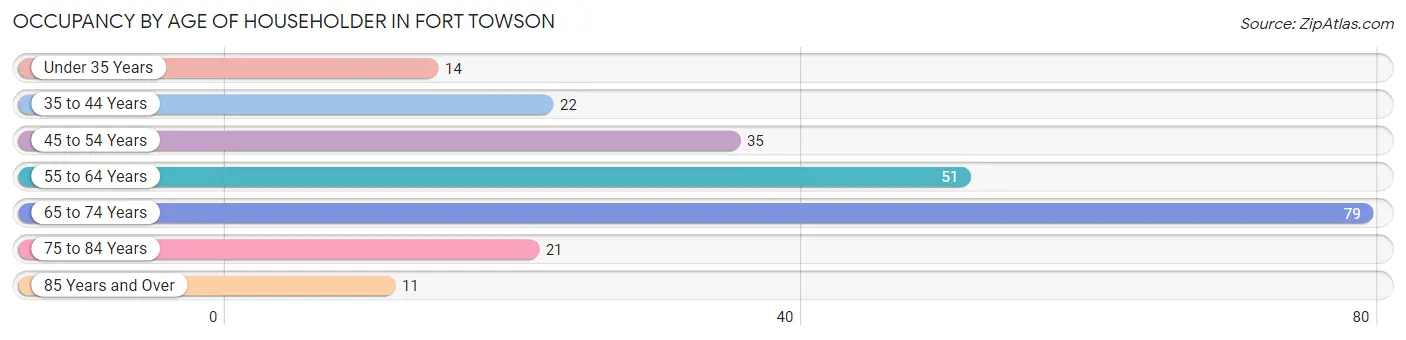
| Age Bracket | # Households | % Households |
| Under 35 Years | 14 | 6.0% |
| 35 to 44 Years | 22 | 9.4% |
| 45 to 54 Years | 35 | 15.0% |
| 55 to 64 Years | 51 | 21.9% |
| 65 to 74 Years | 79 | 33.9% |
| 75 to 84 Years | 21 | 9.0% |
| 85 Years and Over | 11 | 4.7% |
| Total | 233 | 100.0% |
Housing Finances in Fort Towson
Median Income by Occupancy in Fort Towson
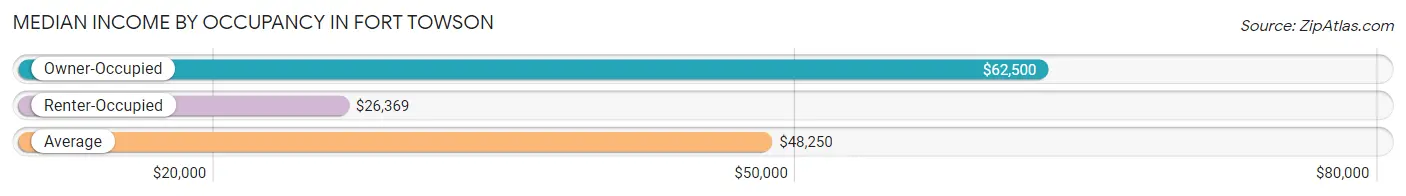
| Occupancy Type | # Households | Median Income |
| Owner-Occupied | 172 (73.8%) | $62,500 |
| Renter-Occupied | 61 (26.2%) | $26,369 |
| Average | 233 (100.0%) | $48,250 |
Occupancy by Householder Income Bracket in Fort Towson
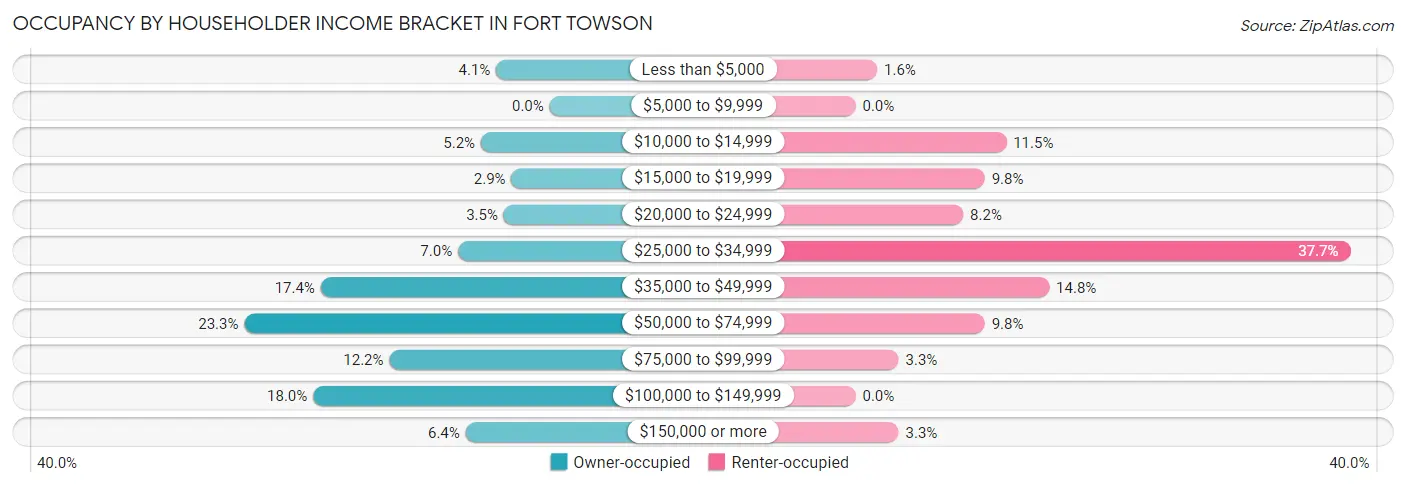
| Income Bracket | Owner-occupied | Renter-occupied |
| Less than $5,000 | 7 (4.1%) | 1 (1.6%) |
| $5,000 to $9,999 | 0 (0.0%) | 0 (0.0%) |
| $10,000 to $14,999 | 9 (5.2%) | 7 (11.5%) |
| $15,000 to $19,999 | 5 (2.9%) | 6 (9.8%) |
| $20,000 to $24,999 | 6 (3.5%) | 5 (8.2%) |
| $25,000 to $34,999 | 12 (7.0%) | 23 (37.7%) |
| $35,000 to $49,999 | 30 (17.4%) | 9 (14.7%) |
| $50,000 to $74,999 | 40 (23.3%) | 6 (9.8%) |
| $75,000 to $99,999 | 21 (12.2%) | 2 (3.3%) |
| $100,000 to $149,999 | 31 (18.0%) | 0 (0.0%) |
| $150,000 or more | 11 (6.4%) | 2 (3.3%) |
| Total | 172 (100.0%) | 61 (100.0%) |
Monthly Housing Cost Tiers in Fort Towson
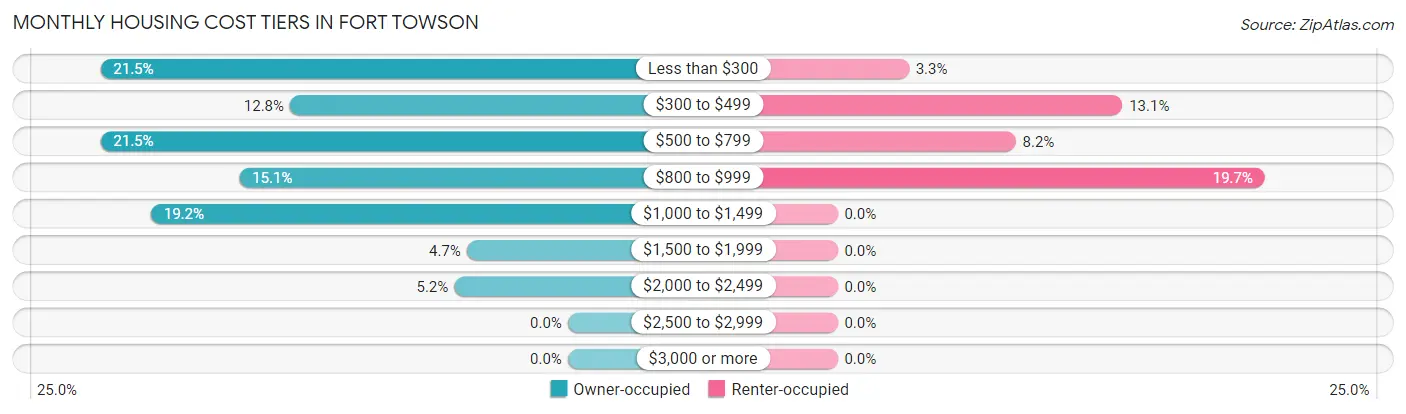
| Monthly Cost | Owner-occupied | Renter-occupied |
| Less than $300 | 37 (21.5%) | 2 (3.3%) |
| $300 to $499 | 22 (12.8%) | 8 (13.1%) |
| $500 to $799 | 37 (21.5%) | 5 (8.2%) |
| $800 to $999 | 26 (15.1%) | 12 (19.7%) |
| $1,000 to $1,499 | 33 (19.2%) | 0 (0.0%) |
| $1,500 to $1,999 | 8 (4.6%) | 0 (0.0%) |
| $2,000 to $2,499 | 9 (5.2%) | 0 (0.0%) |
| $2,500 to $2,999 | 0 (0.0%) | 0 (0.0%) |
| $3,000 or more | 0 (0.0%) | 0 (0.0%) |
| Total | 172 (100.0%) | 61 (100.0%) |
Physical Housing Characteristics in Fort Towson
Housing Structures in Fort Towson
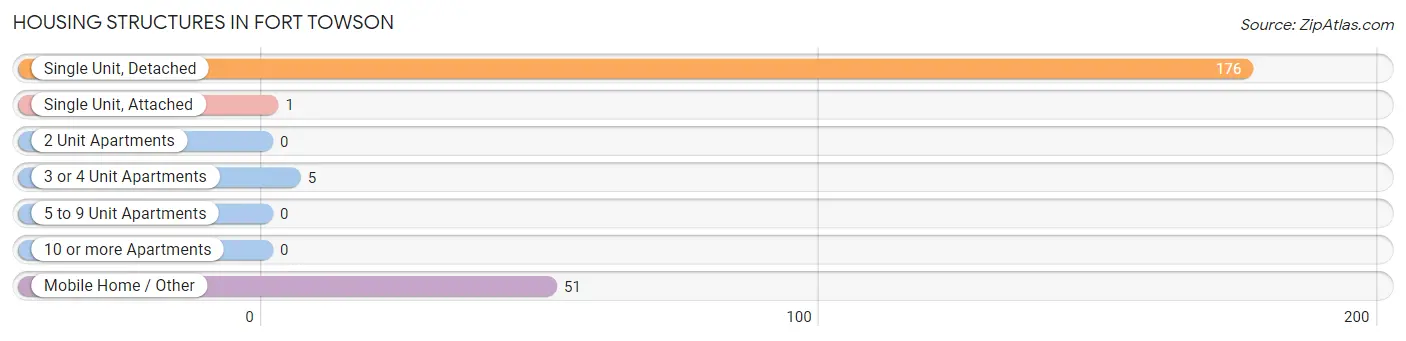
| Structure Type | # Housing Units | % Housing Units |
| Single Unit, Detached | 176 | 75.5% |
| Single Unit, Attached | 1 | 0.4% |
| 2 Unit Apartments | 0 | 0.0% |
| 3 or 4 Unit Apartments | 5 | 2.1% |
| 5 to 9 Unit Apartments | 0 | 0.0% |
| 10 or more Apartments | 0 | 0.0% |
| Mobile Home / Other | 51 | 21.9% |
| Total | 233 | 100.0% |
Housing Structures by Occupancy in Fort Towson
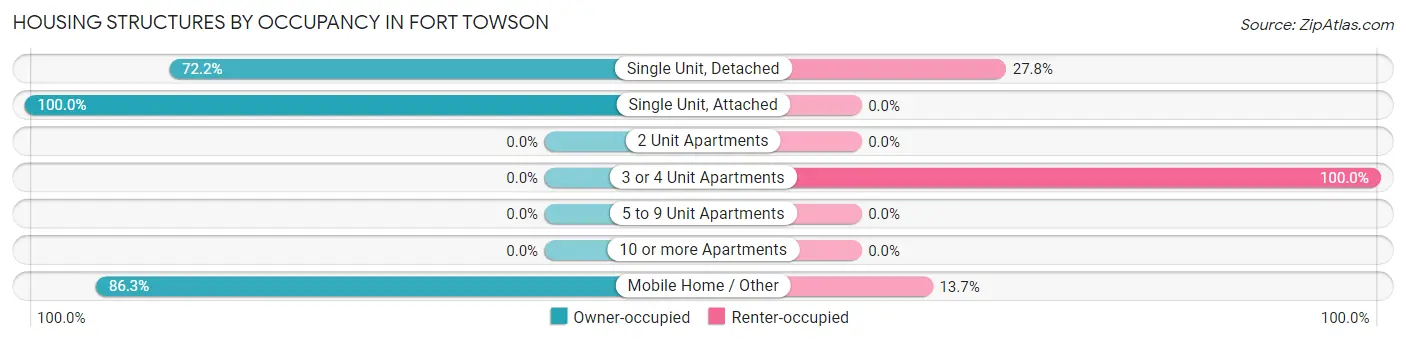
| Structure Type | Owner-occupied | Renter-occupied |
| Single Unit, Detached | 127 (72.2%) | 49 (27.8%) |
| Single Unit, Attached | 1 (100.0%) | 0 (0.0%) |
| 2 Unit Apartments | 0 (0.0%) | 0 (0.0%) |
| 3 or 4 Unit Apartments | 0 (0.0%) | 5 (100.0%) |
| 5 to 9 Unit Apartments | 0 (0.0%) | 0 (0.0%) |
| 10 or more Apartments | 0 (0.0%) | 0 (0.0%) |
| Mobile Home / Other | 44 (86.3%) | 7 (13.7%) |
| Total | 172 (73.8%) | 61 (26.2%) |
Housing Structures by Number of Rooms in Fort Towson
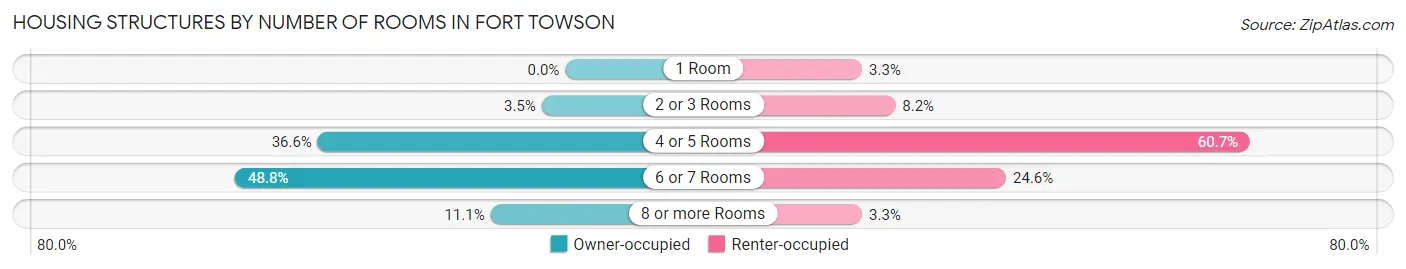
| Number of Rooms | Owner-occupied | Renter-occupied |
| 1 Room | 0 (0.0%) | 2 (3.3%) |
| 2 or 3 Rooms | 6 (3.5%) | 5 (8.2%) |
| 4 or 5 Rooms | 63 (36.6%) | 37 (60.7%) |
| 6 or 7 Rooms | 84 (48.8%) | 15 (24.6%) |
| 8 or more Rooms | 19 (11.1%) | 2 (3.3%) |
| Total | 172 (100.0%) | 61 (100.0%) |
Housing Structure by Heating Type in Fort Towson
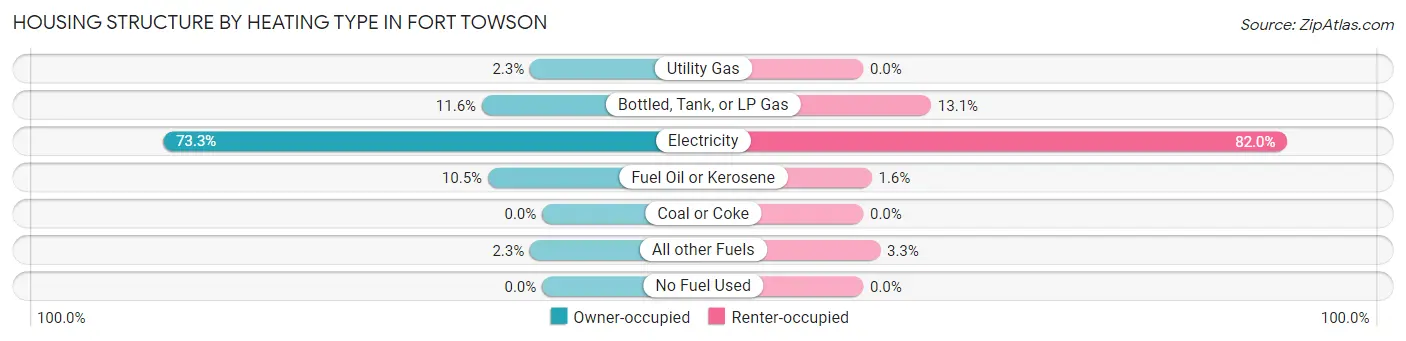
| Heating Type | Owner-occupied | Renter-occupied |
| Utility Gas | 4 (2.3%) | 0 (0.0%) |
| Bottled, Tank, or LP Gas | 20 (11.6%) | 8 (13.1%) |
| Electricity | 126 (73.3%) | 50 (82.0%) |
| Fuel Oil or Kerosene | 18 (10.5%) | 1 (1.6%) |
| Coal or Coke | 0 (0.0%) | 0 (0.0%) |
| All other Fuels | 4 (2.3%) | 2 (3.3%) |
| No Fuel Used | 0 (0.0%) | 0 (0.0%) |
| Total | 172 (100.0%) | 61 (100.0%) |
Household Vehicle Usage in Fort Towson
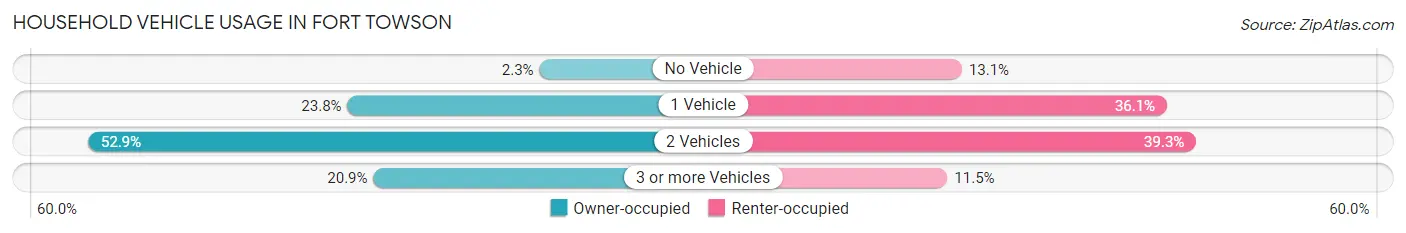
| Vehicles per Household | Owner-occupied | Renter-occupied |
| No Vehicle | 4 (2.3%) | 8 (13.1%) |
| 1 Vehicle | 41 (23.8%) | 22 (36.1%) |
| 2 Vehicles | 91 (52.9%) | 24 (39.3%) |
| 3 or more Vehicles | 36 (20.9%) | 7 (11.5%) |
| Total | 172 (100.0%) | 61 (100.0%) |
Real Estate & Mortgages in Fort Towson
Real Estate and Mortgage Overview in Fort Towson
| Characteristic | Without Mortgage | With Mortgage |
| Housing Units | 101 | 71 |
| Median Property Value | $95,900 | $162,500 |
| Median Household Income | $41,964 | $8 |
| Monthly Housing Costs | $435 | $0 |
| Real Estate Taxes | $338 | $0 |
Property Value by Mortgage Status in Fort Towson
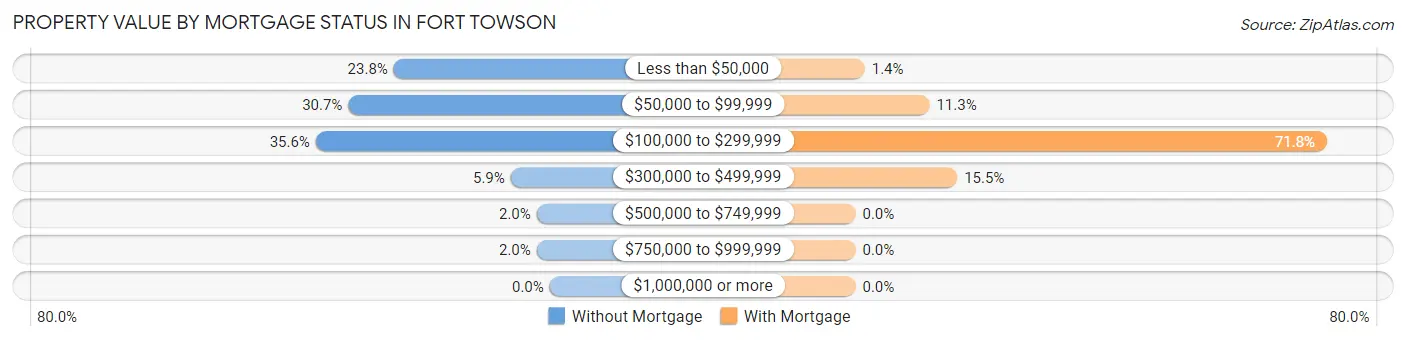
| Property Value | Without Mortgage | With Mortgage |
| Less than $50,000 | 24 (23.8%) | 1 (1.4%) |
| $50,000 to $99,999 | 31 (30.7%) | 8 (11.3%) |
| $100,000 to $299,999 | 36 (35.6%) | 51 (71.8%) |
| $300,000 to $499,999 | 6 (5.9%) | 11 (15.5%) |
| $500,000 to $749,999 | 2 (2.0%) | 0 (0.0%) |
| $750,000 to $999,999 | 2 (2.0%) | 0 (0.0%) |
| $1,000,000 or more | 0 (0.0%) | 0 (0.0%) |
| Total | 101 (100.0%) | 71 (100.0%) |
Household Income by Mortgage Status in Fort Towson
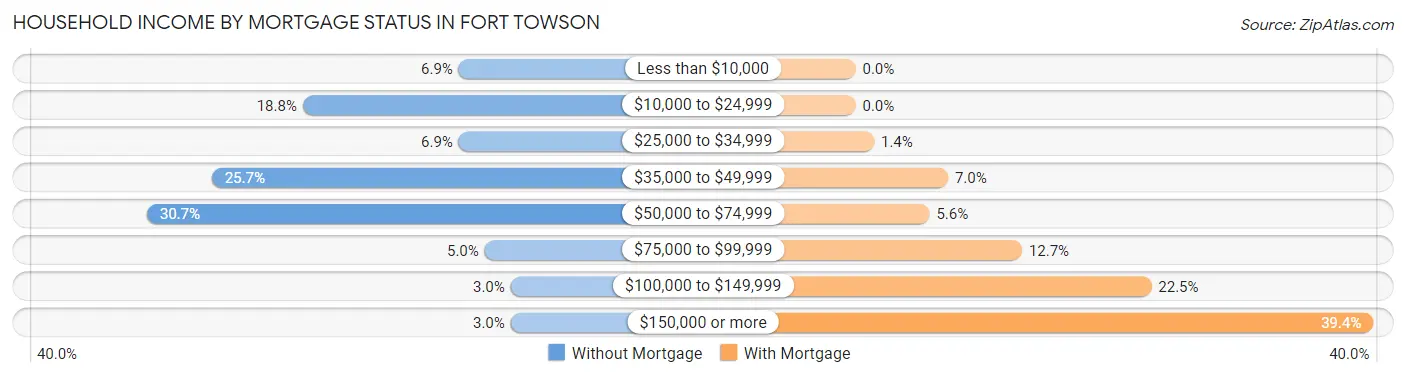
| Household Income | Without Mortgage | With Mortgage |
| Less than $10,000 | 7 (6.9%) | 0 (0.0%) |
| $10,000 to $24,999 | 19 (18.8%) | 0 (0.0%) |
| $25,000 to $34,999 | 7 (6.9%) | 1 (1.4%) |
| $35,000 to $49,999 | 26 (25.7%) | 5 (7.0%) |
| $50,000 to $74,999 | 31 (30.7%) | 4 (5.6%) |
| $75,000 to $99,999 | 5 (5.0%) | 9 (12.7%) |
| $100,000 to $149,999 | 3 (3.0%) | 16 (22.5%) |
| $150,000 or more | 3 (3.0%) | 28 (39.4%) |
| Total | 101 (100.0%) | 71 (100.0%) |
Property Value to Household Income Ratio in Fort Towson
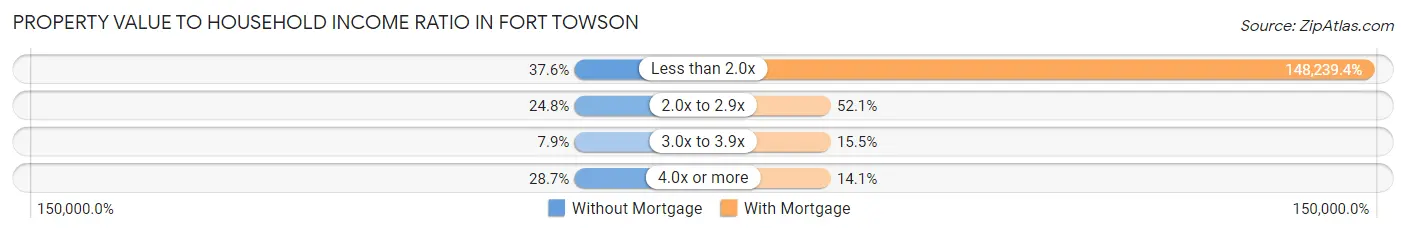
| Value-to-Income Ratio | Without Mortgage | With Mortgage |
| Less than 2.0x | 38 (37.6%) | 105,250 (148,239.4%) |
| 2.0x to 2.9x | 25 (24.7%) | 37 (52.1%) |
| 3.0x to 3.9x | 8 (7.9%) | 11 (15.5%) |
| 4.0x or more | 29 (28.7%) | 10 (14.1%) |
| Total | 101 (100.0%) | 71 (100.0%) |
Real Estate Taxes by Mortgage Status in Fort Towson
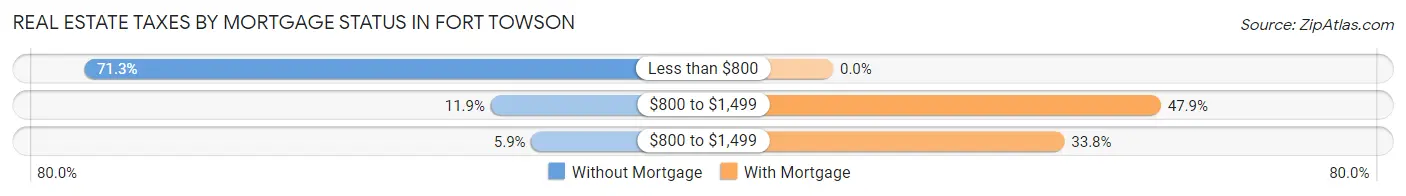
| Property Taxes | Without Mortgage | With Mortgage |
| Less than $800 | 72 (71.3%) | 0 (0.0%) |
| $800 to $1,499 | 12 (11.9%) | 34 (47.9%) |
| $800 to $1,499 | 6 (5.9%) | 24 (33.8%) |
| Total | 101 (100.0%) | 71 (100.0%) |
Health & Disability in Fort Towson
Health Insurance Coverage by Age in Fort Towson
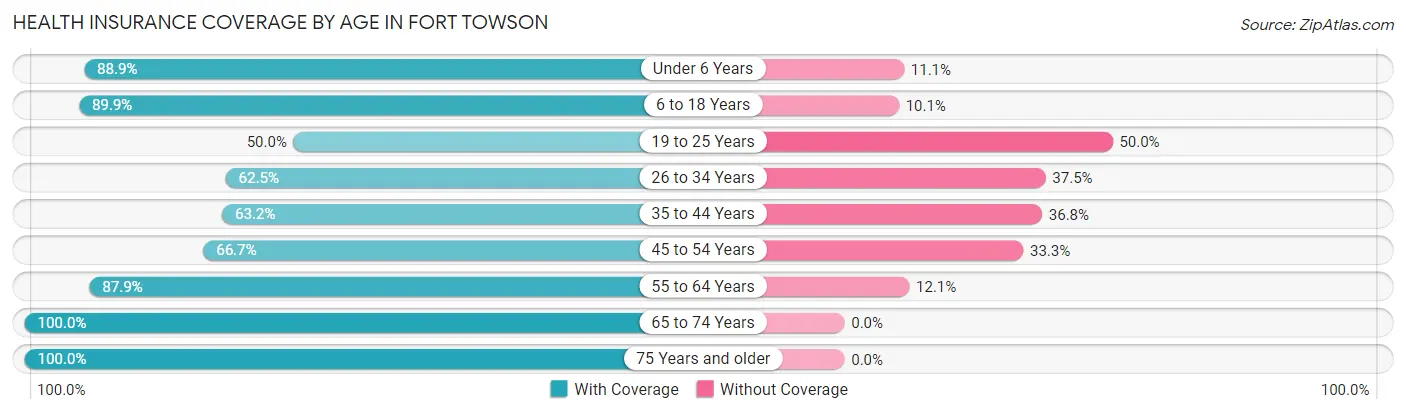
| Age Bracket | With Coverage | Without Coverage |
| Under 6 Years | 24 (88.9%) | 3 (11.1%) |
| 6 to 18 Years | 62 (89.9%) | 7 (10.1%) |
| 19 to 25 Years | 11 (50.0%) | 11 (50.0%) |
| 26 to 34 Years | 20 (62.5%) | 12 (37.5%) |
| 35 to 44 Years | 36 (63.2%) | 21 (36.8%) |
| 45 to 54 Years | 50 (66.7%) | 25 (33.3%) |
| 55 to 64 Years | 80 (87.9%) | 11 (12.1%) |
| 65 to 74 Years | 106 (100.0%) | 0 (0.0%) |
| 75 Years and older | 69 (100.0%) | 0 (0.0%) |
| Total | 458 (83.6%) | 90 (16.4%) |
Health Insurance Coverage by Citizenship Status in Fort Towson
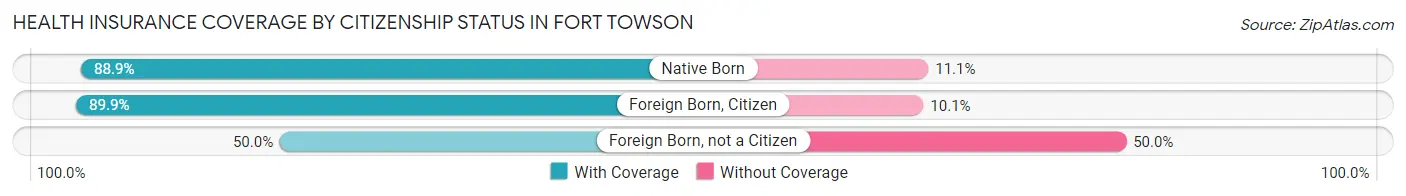
| Citizenship Status | With Coverage | Without Coverage |
| Native Born | 24 (88.9%) | 3 (11.1%) |
| Foreign Born, Citizen | 62 (89.9%) | 7 (10.1%) |
| Foreign Born, not a Citizen | 11 (50.0%) | 11 (50.0%) |
Health Insurance Coverage by Household Income in Fort Towson
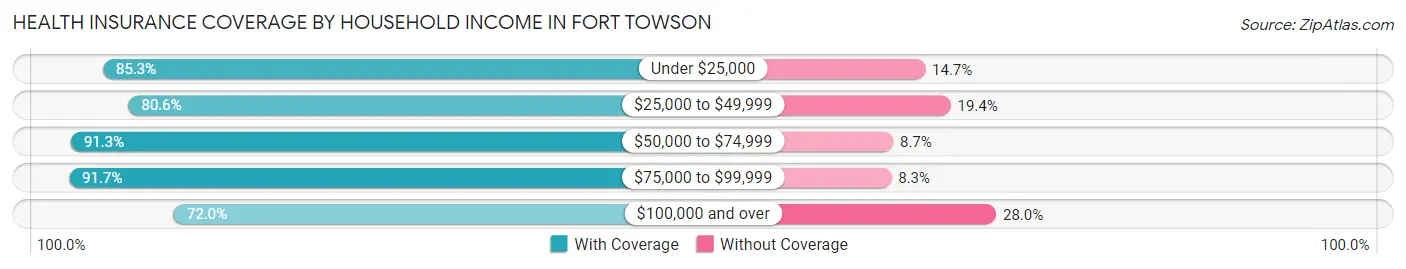
| Household Income | With Coverage | Without Coverage |
| Under $25,000 | 64 (85.3%) | 11 (14.7%) |
| $25,000 to $49,999 | 116 (80.6%) | 28 (19.4%) |
| $50,000 to $74,999 | 116 (91.3%) | 11 (8.7%) |
| $75,000 to $99,999 | 77 (91.7%) | 7 (8.3%) |
| $100,000 and over | 85 (72.0%) | 33 (28.0%) |
Public vs Private Health Insurance Coverage by Age in Fort Towson
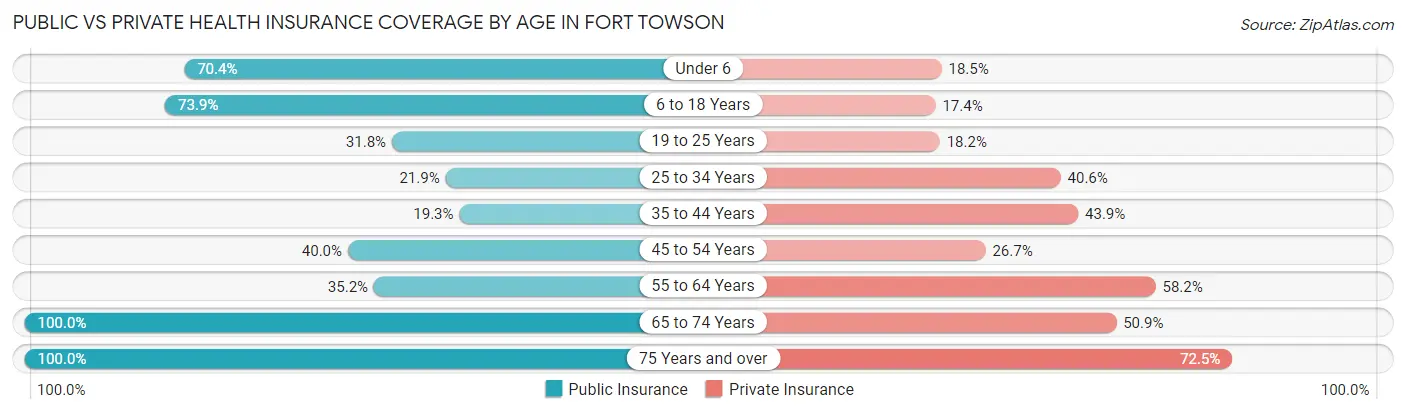
| Age Bracket | Public Insurance | Private Insurance |
| Under 6 | 19 (70.4%) | 5 (18.5%) |
| 6 to 18 Years | 51 (73.9%) | 12 (17.4%) |
| 19 to 25 Years | 7 (31.8%) | 4 (18.2%) |
| 25 to 34 Years | 7 (21.9%) | 13 (40.6%) |
| 35 to 44 Years | 11 (19.3%) | 25 (43.9%) |
| 45 to 54 Years | 30 (40.0%) | 20 (26.7%) |
| 55 to 64 Years | 32 (35.2%) | 53 (58.2%) |
| 65 to 74 Years | 106 (100.0%) | 54 (50.9%) |
| 75 Years and over | 69 (100.0%) | 50 (72.5%) |
| Total | 332 (60.6%) | 236 (43.1%) |
Disability Status by Sex by Age in Fort Towson
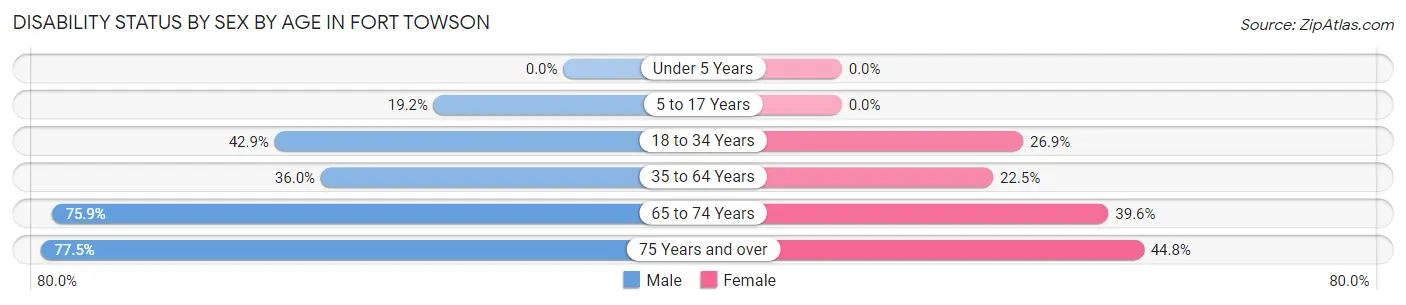
| Age Bracket | Male | Female |
| Under 5 Years | 0 (0.0%) | 0 (0.0%) |
| 5 to 17 Years | 5 (19.2%) | 0 (0.0%) |
| 18 to 34 Years | 12 (42.9%) | 7 (26.9%) |
| 35 to 64 Years | 45 (36.0%) | 22 (22.5%) |
| 65 to 74 Years | 44 (75.9%) | 19 (39.6%) |
| 75 Years and over | 31 (77.5%) | 13 (44.8%) |
Disability Class by Sex by Age in Fort Towson
Disability Class: Hearing Difficulty
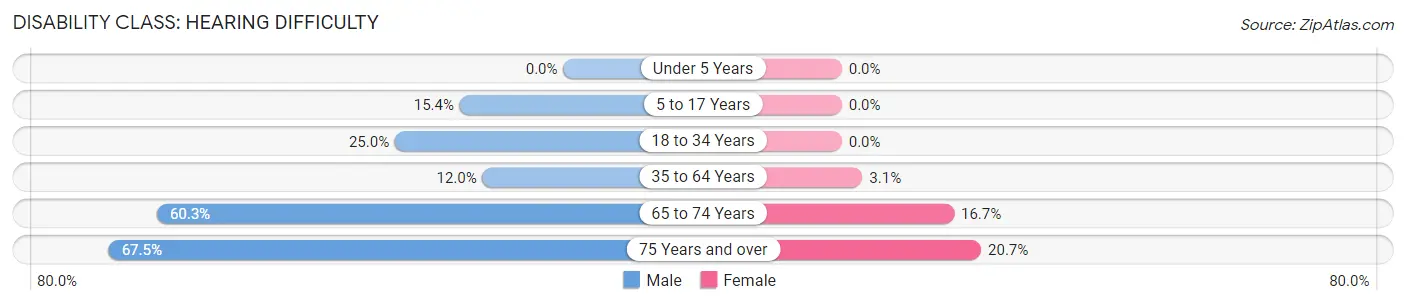
| Age Bracket | Male | Female |
| Under 5 Years | 0 (0.0%) | 0 (0.0%) |
| 5 to 17 Years | 4 (15.4%) | 0 (0.0%) |
| 18 to 34 Years | 7 (25.0%) | 0 (0.0%) |
| 35 to 64 Years | 15 (12.0%) | 3 (3.1%) |
| 65 to 74 Years | 35 (60.3%) | 8 (16.7%) |
| 75 Years and over | 27 (67.5%) | 6 (20.7%) |
Disability Class: Vision Difficulty
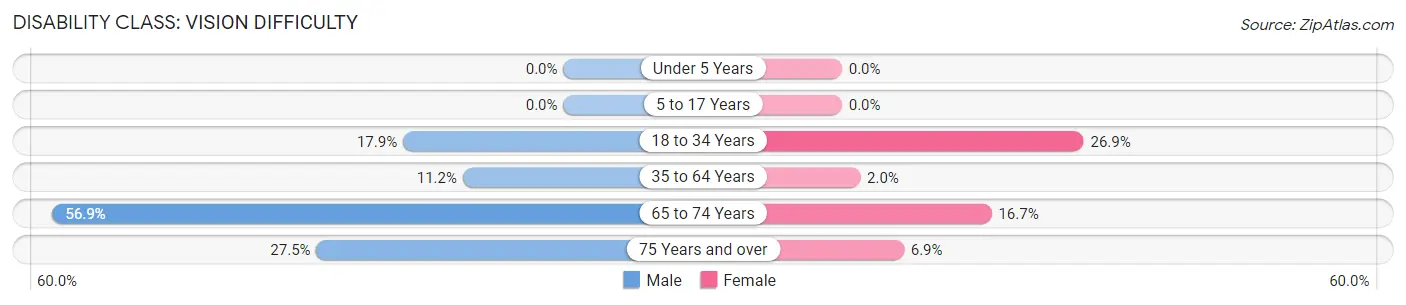
| Age Bracket | Male | Female |
| Under 5 Years | 0 (0.0%) | 0 (0.0%) |
| 5 to 17 Years | 0 (0.0%) | 0 (0.0%) |
| 18 to 34 Years | 5 (17.9%) | 7 (26.9%) |
| 35 to 64 Years | 14 (11.2%) | 2 (2.0%) |
| 65 to 74 Years | 33 (56.9%) | 8 (16.7%) |
| 75 Years and over | 11 (27.5%) | 2 (6.9%) |
Disability Class: Cognitive Difficulty
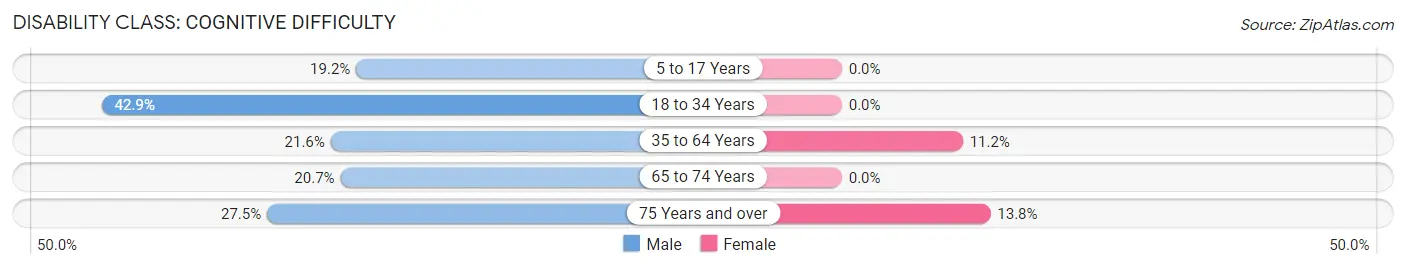
| Age Bracket | Male | Female |
| 5 to 17 Years | 5 (19.2%) | 0 (0.0%) |
| 18 to 34 Years | 12 (42.9%) | 0 (0.0%) |
| 35 to 64 Years | 27 (21.6%) | 11 (11.2%) |
| 65 to 74 Years | 12 (20.7%) | 0 (0.0%) |
| 75 Years and over | 11 (27.5%) | 4 (13.8%) |
Disability Class: Ambulatory Difficulty
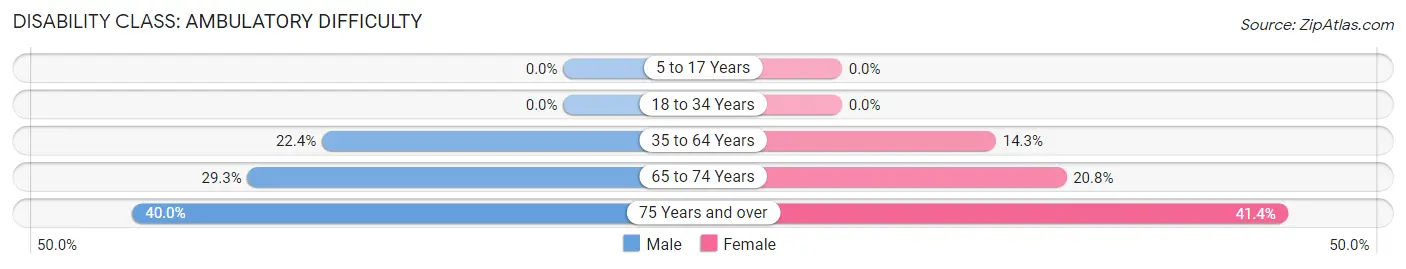
| Age Bracket | Male | Female |
| 5 to 17 Years | 0 (0.0%) | 0 (0.0%) |
| 18 to 34 Years | 0 (0.0%) | 0 (0.0%) |
| 35 to 64 Years | 28 (22.4%) | 14 (14.3%) |
| 65 to 74 Years | 17 (29.3%) | 10 (20.8%) |
| 75 Years and over | 16 (40.0%) | 12 (41.4%) |
Disability Class: Self-Care Difficulty
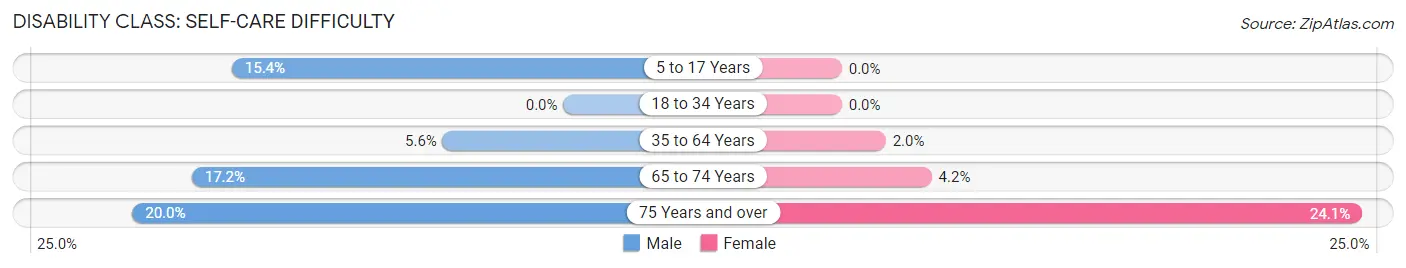
| Age Bracket | Male | Female |
| 5 to 17 Years | 4 (15.4%) | 0 (0.0%) |
| 18 to 34 Years | 0 (0.0%) | 0 (0.0%) |
| 35 to 64 Years | 7 (5.6%) | 2 (2.0%) |
| 65 to 74 Years | 10 (17.2%) | 2 (4.2%) |
| 75 Years and over | 8 (20.0%) | 7 (24.1%) |
Technology Access in Fort Towson
Computing Device Access in Fort Towson
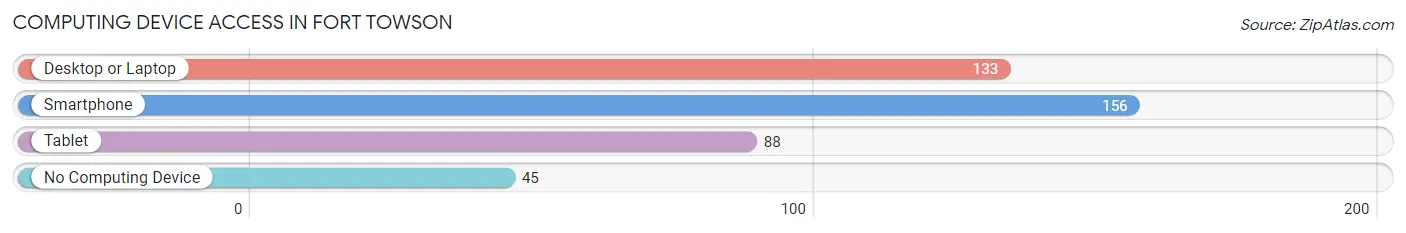
| Device Type | # Households | % Households |
| Desktop or Laptop | 133 | 57.1% |
| Smartphone | 156 | 66.9% |
| Tablet | 88 | 37.8% |
| No Computing Device | 45 | 19.3% |
| Total | 233 | 100.0% |
Internet Access in Fort Towson
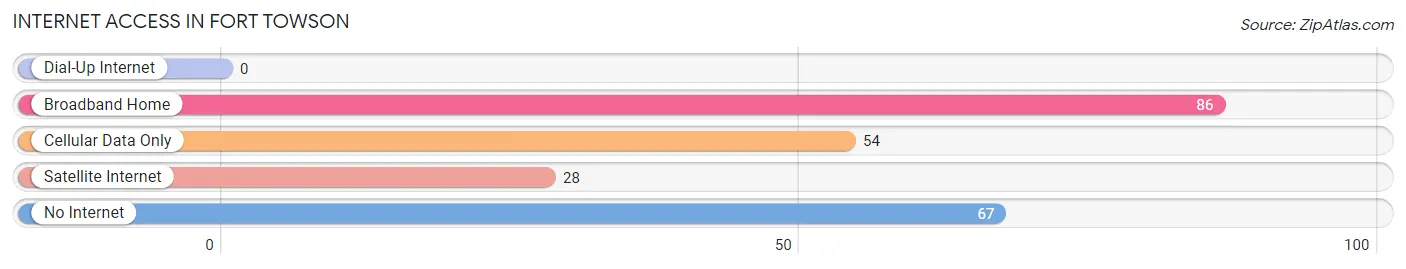
| Internet Type | # Households | % Households |
| Dial-Up Internet | 0 | 0.0% |
| Broadband Home | 86 | 36.9% |
| Cellular Data Only | 54 | 23.2% |
| Satellite Internet | 28 | 12.0% |
| No Internet | 67 | 28.8% |
| Total | 233 | 100.0% |
Fort Towson Summary
History
Fort Towson is a small town located in Choctaw County, Oklahoma. It was established in 1824 as a trading post and military outpost by the United States Army. The town was named after General Nathan Towson, a hero of the War of 1812. The fort was used to protect the Choctaw Nation from hostile Native American tribes and to provide a trading post for settlers.
In 1832, the Choctaw Nation signed the Treaty of Dancing Rabbit Creek, which ceded their lands in Mississippi to the United States. As part of the treaty, the Choctaw were given the right to establish a new homeland in the Indian Territory, which is now Oklahoma. The Choctaw Nation chose Fort Towson as their new capital and the town quickly grew.
In 1838, the Choctaw Nation established a school at Fort Towson. The school was the first of its kind in the Indian Territory and was the first school to teach in the Choctaw language. The school was later renamed the Fort Towson Academy and it is still in operation today.
In 1855, the Choctaw Nation was forced to sign the Treaty of Doaksville, which ceded their lands in the Indian Territory to the United States. As part of the treaty, the Choctaw were given the right to remain in the Indian Territory and to establish a new homeland in Oklahoma. The Choctaw Nation chose Fort Towson as their new capital and the town quickly grew.
In 1861, the Civil War began and Fort Towson was used as a Confederate stronghold. The fort was attacked by Union forces in 1863 and was eventually captured. After the war, the town was rebuilt and the fort was abandoned.
In the late 19th century, Fort Towson became a center for the cattle industry. The town was also home to several cotton plantations. In the early 20th century, the town began to decline as the cattle industry moved west and the cotton industry declined.
Geography
Fort Towson is located in southeastern Oklahoma, in Choctaw County. The town is situated on the banks of the Red River, which forms the border between Oklahoma and Texas. The town is located about 40 miles south of the city of Hugo and about 80 miles east of the city of Oklahoma City.
The town has a total area of 1.2 square miles, all of which is land. The terrain is mostly flat with some rolling hills. The climate is humid subtropical, with hot summers and mild winters.
Economy
The economy of Fort Towson is largely based on agriculture. The town is home to several farms that produce cotton, soybeans, corn, and wheat. The town is also home to several cattle ranches.
The town is also home to several small businesses, including a grocery store, a hardware store, and a few restaurants. The town is also home to a few manufacturing companies, including a furniture factory and a plastics factory.
Demographics
As of the 2010 census, the population of Fort Towson was 1,521. The racial makeup of the town was 79.3% White, 17.2% Native American, 0.7% Asian, 0.2% African American, and 2.6% from other races. Hispanic or Latino of any race were 2.2% of the population.
The median household income in Fort Towson was $30,938, and the median family income was $37,500. The per capita income was $15,945. About 17.2% of families and 20.3% of the population were below the poverty line, including 28.3% of those under age 18 and 11.2% of those age 65 or over.
Common Questions
What is Per Capita Income in Fort Towson?
Per Capita income in Fort Towson is $27,659.
What is the Median Family Income in Fort Towson?
Median Family Income in Fort Towson is $65,625.
What is the Median Household income in Fort Towson?
Median Household Income in Fort Towson is $48,250.
What is Income or Wage Gap in Fort Towson?
Income or Wage Gap in Fort Towson is 46.7%.
Women in Fort Towson earn 53.3 cents for every dollar earned by a man.
What is Inequality or Gini Index in Fort Towson?
Inequality or Gini Index in Fort Towson is 0.41.
What is the Total Population of Fort Towson?
Total Population of Fort Towson is 548.
What is the Total Male Population of Fort Towson?
Total Male Population of Fort Towson is 289.
What is the Total Female Population of Fort Towson?
Total Female Population of Fort Towson is 259.
What is the Ratio of Males per 100 Females in Fort Towson?
There are 111.58 Males per 100 Females in Fort Towson.
What is the Ratio of Females per 100 Males in Fort Towson?
There are 89.62 Females per 100 Males in Fort Towson.
What is the Median Population Age in Fort Towson?
Median Population Age in Fort Towson is 53.8 Years.
What is the Average Family Size in Fort Towson
Average Family Size in Fort Towson is 2.8 People.
What is the Average Household Size in Fort Towson
Average Household Size in Fort Towson is 2.4 People.
How Large is the Labor Force in Fort Towson?
There are 238 People in the Labor Forcein in Fort Towson.
What is the Percentage of People in the Labor Force in Fort Towson?
50.6% of People are in the Labor Force in Fort Towson.
What is the Unemployment Rate in Fort Towson?
Unemployment Rate in Fort Towson is 18.5%.