Stroud, OK Map & Demographics
Stroud Map
Stroud Overview
$27,993
PER CAPITA INCOME
$59,297
AVG FAMILY INCOME
$51,131
AVG HOUSEHOLD INCOME
32.5%
WAGE / INCOME GAP [ % ]
67.5¢/ $1
WAGE / INCOME GAP [ $ ]
$7,369
FAMILY INCOME DEFICIT
0.41
INEQUALITY / GINI INDEX
2,748
TOTAL POPULATION
1,316
MALE POPULATION
1,432
FEMALE POPULATION
91.90
MALES / 100 FEMALES
108.81
FEMALES / 100 MALES
36.3
MEDIAN AGE
3.2
AVG FAMILY SIZE
2.5
AVG HOUSEHOLD SIZE
1,260
LABOR FORCE [ PEOPLE ]
61.0%
PERCENT IN LABOR FORCE
8.3%
UNEMPLOYMENT RATE
Stroud Zip Codes
Stroud Area Codes
Income in Stroud
Income Overview in Stroud
Per Capita Income in Stroud is $27,993, while median incomes of families and households are $59,297 and $51,131 respectively.
| Characteristic | Number | Measure |
| Per Capita Income | 2,748 | $27,993 |
| Median Family Income | 671 | $59,297 |
| Mean Family Income | 671 | $72,090 |
| Median Household Income | 1,057 | $51,131 |
| Mean Household Income | 1,057 | $68,219 |
| Income Deficit | 671 | $7,369 |
| Wage / Income Gap (%) | 2,748 | 32.51% |
| Wage / Income Gap ($) | 2,748 | 67.49¢ per $1 |
| Gini / Inequality Index | 2,748 | 0.41 |
Earnings by Sex in Stroud
Average Earnings in Stroud are $36,250, $42,900 for men and $28,953 for women, a difference of 32.5%.
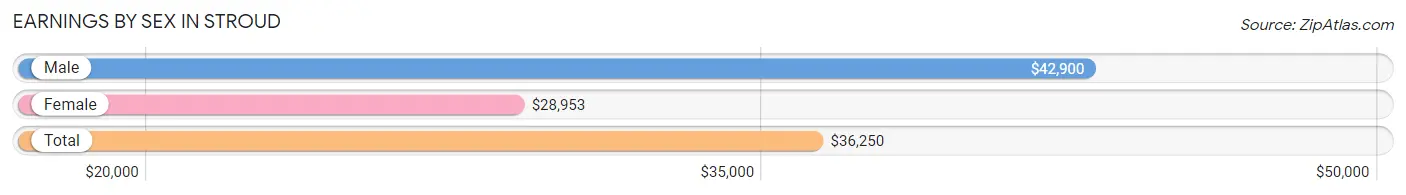
| Sex | Number | Average Earnings |
| Male | 636 (49.5%) | $42,900 |
| Female | 648 (50.5%) | $28,953 |
| Total | 1,284 (100.0%) | $36,250 |
Earnings by Sex by Income Bracket in Stroud
The most common earnings brackets in Stroud are $100,000+ for men (82 | 12.9%) and $22,500 to $24,999 for women (65 | 10.0%).
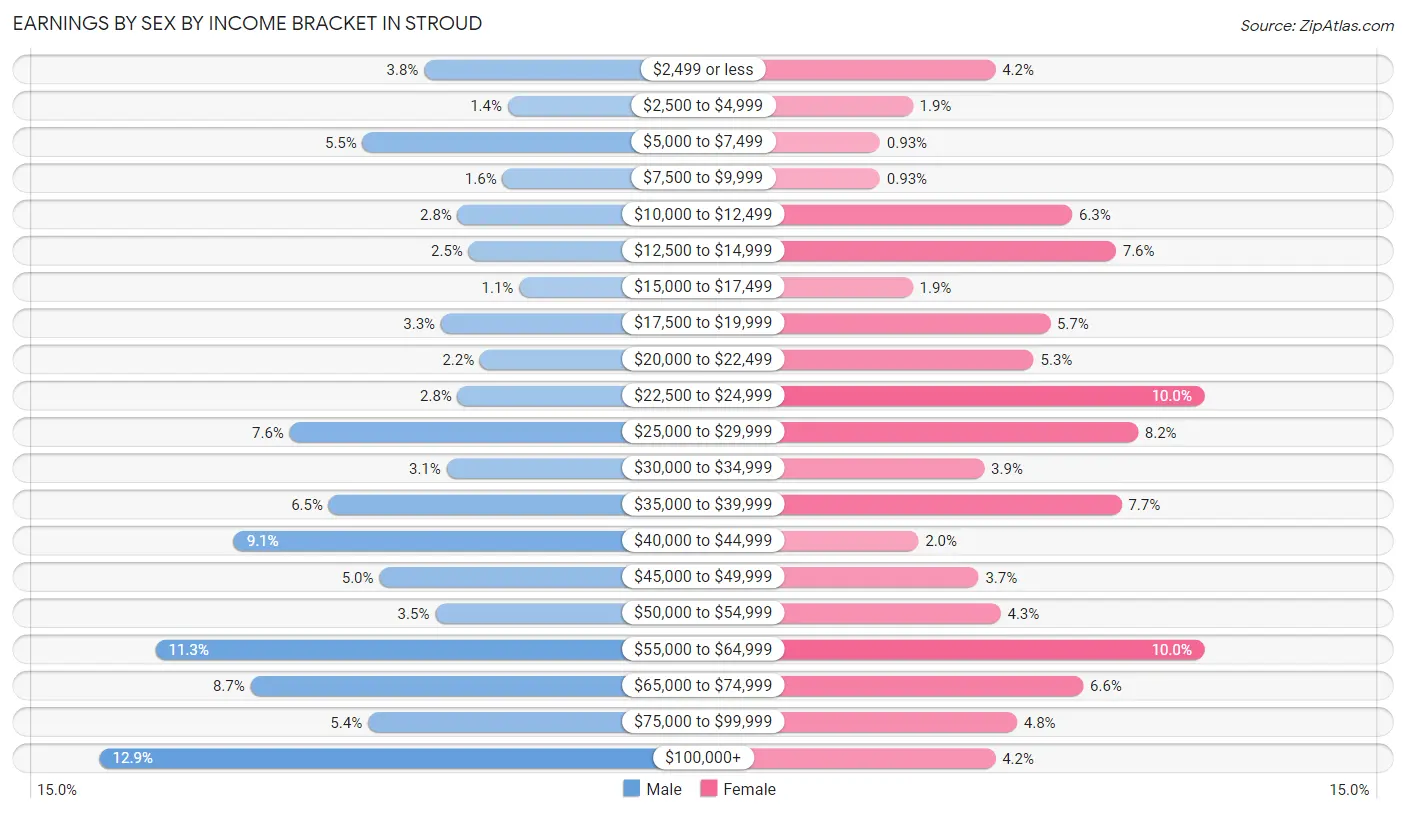
| Income | Male | Female |
| $2,499 or less | 24 (3.8%) | 27 (4.2%) |
| $2,500 to $4,999 | 9 (1.4%) | 12 (1.8%) |
| $5,000 to $7,499 | 35 (5.5%) | 6 (0.9%) |
| $7,500 to $9,999 | 10 (1.6%) | 6 (0.9%) |
| $10,000 to $12,499 | 18 (2.8%) | 41 (6.3%) |
| $12,500 to $14,999 | 16 (2.5%) | 49 (7.6%) |
| $15,000 to $17,499 | 7 (1.1%) | 12 (1.8%) |
| $17,500 to $19,999 | 21 (3.3%) | 37 (5.7%) |
| $20,000 to $22,499 | 14 (2.2%) | 34 (5.2%) |
| $22,500 to $24,999 | 18 (2.8%) | 65 (10.0%) |
| $25,000 to $29,999 | 48 (7.5%) | 53 (8.2%) |
| $30,000 to $34,999 | 20 (3.1%) | 25 (3.9%) |
| $35,000 to $39,999 | 41 (6.5%) | 50 (7.7%) |
| $40,000 to $44,999 | 58 (9.1%) | 13 (2.0%) |
| $45,000 to $49,999 | 32 (5.0%) | 24 (3.7%) |
| $50,000 to $54,999 | 22 (3.5%) | 28 (4.3%) |
| $55,000 to $64,999 | 72 (11.3%) | 65 (10.0%) |
| $65,000 to $74,999 | 55 (8.6%) | 43 (6.6%) |
| $75,000 to $99,999 | 34 (5.3%) | 31 (4.8%) |
| $100,000+ | 82 (12.9%) | 27 (4.2%) |
| Total | 636 (100.0%) | 648 (100.0%) |
Earnings by Sex by Educational Attainment in Stroud
Average earnings in Stroud are $45,962 for men and $34,200 for women, a difference of 25.6%. Men with an educational attainment of bachelor's degree enjoy the highest average annual earnings of $72,857, while those with high school diploma education earn the least with $40,179. Women with an educational attainment of graduate degree earn the most with the average annual earnings of $58,365, while those with less than high school education have the smallest earnings of $23,289.
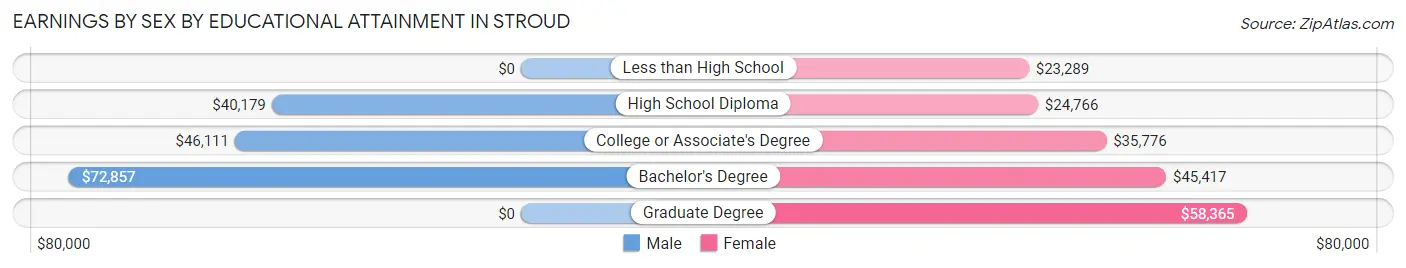
| Educational Attainment | Male Income | Female Income |
| Less than High School | - | - |
| High School Diploma | $40,179 | $24,766 |
| College or Associate's Degree | $46,111 | $35,776 |
| Bachelor's Degree | $72,857 | $45,417 |
| Graduate Degree | - | - |
| Total | $45,962 | $34,200 |
Family Income in Stroud
Family Income Brackets in Stroud
According to the Stroud family income data, there are 132 families falling into the $75,000 to $99,999 income range, which is the most common income bracket and makes up 19.7% of all families. Conversely, the less than $10,000 income bracket is the least frequent group with only 1 families (0.2%) belonging to this category.
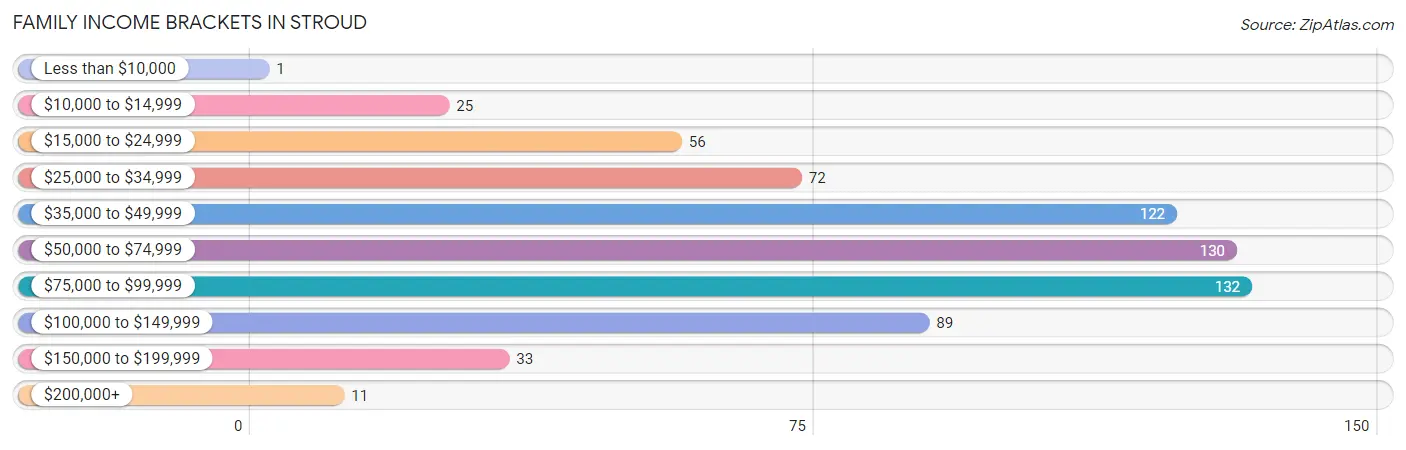
| Income Bracket | # Families | % Families |
| Less than $10,000 | 1 | 0.1% |
| $10,000 to $14,999 | 25 | 3.7% |
| $15,000 to $24,999 | 56 | 8.3% |
| $25,000 to $34,999 | 72 | 10.7% |
| $35,000 to $49,999 | 122 | 18.2% |
| $50,000 to $74,999 | 130 | 19.4% |
| $75,000 to $99,999 | 132 | 19.7% |
| $100,000 to $149,999 | 89 | 13.3% |
| $150,000 to $199,999 | 33 | 4.9% |
| $200,000+ | 11 | 1.6% |
Family Income by Famaliy Size in Stroud
6-person families (27 | 4.0%) account for the highest median family income in Stroud with $88,750 per family, while 2-person families (338 | 50.4%) have the highest median income of $25,084 per family member.
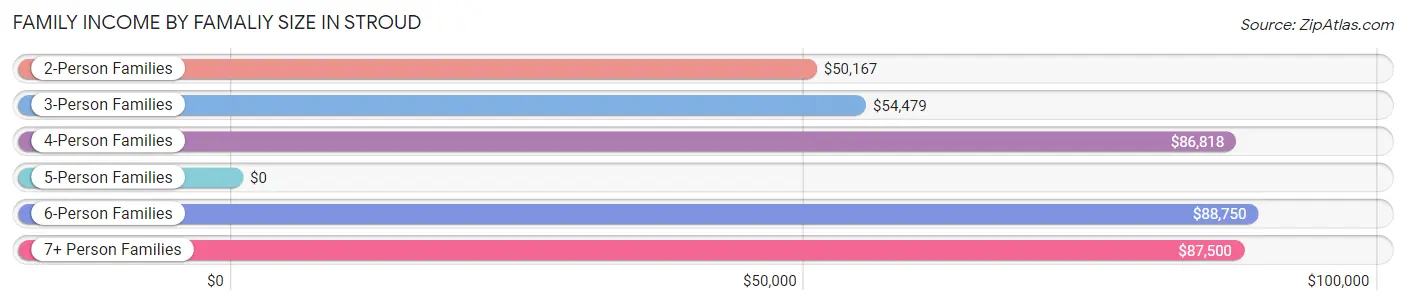
| Income Bracket | # Families | Median Income |
| 2-Person Families | 338 (50.4%) | $50,167 |
| 3-Person Families | 131 (19.5%) | $54,479 |
| 4-Person Families | 118 (17.6%) | $86,818 |
| 5-Person Families | 43 (6.4%) | $0 |
| 6-Person Families | 27 (4.0%) | $88,750 |
| 7+ Person Families | 14 (2.1%) | $87,500 |
| Total | 671 (100.0%) | $59,297 |
Family Income by Number of Earners in Stroud
The median family income in Stroud is $59,297, with families comprising 3+ earners (63) having the highest median family income of $98,250, while families with no earners (98) have the lowest median family income of $33,750, accounting for 9.4% and 14.6% of families, respectively.
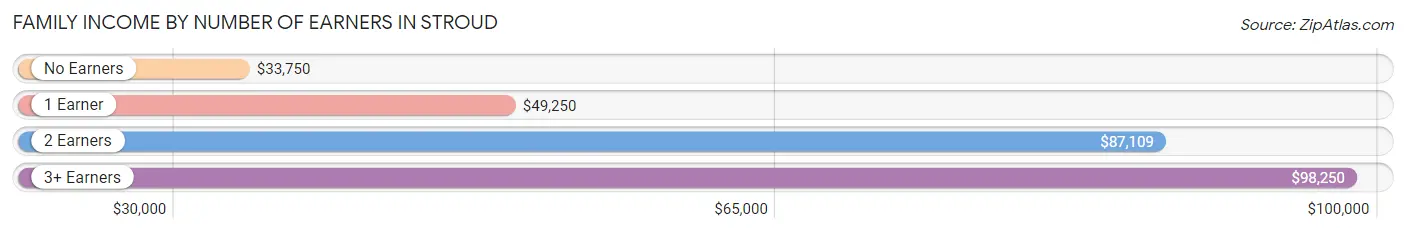
| Number of Earners | # Families | Median Income |
| No Earners | 98 (14.6%) | $33,750 |
| 1 Earner | 303 (45.2%) | $49,250 |
| 2 Earners | 207 (30.8%) | $87,109 |
| 3+ Earners | 63 (9.4%) | $98,250 |
| Total | 671 (100.0%) | $59,297 |
Household Income in Stroud
Household Income Brackets in Stroud
With 189 households falling in the category, the $15,000 to $24,999 income range is the most frequent in Stroud, accounting for 17.9% of all households. In contrast, only 6 households (0.6%) fall into the less than $10,000 income bracket, making it the least populous group.
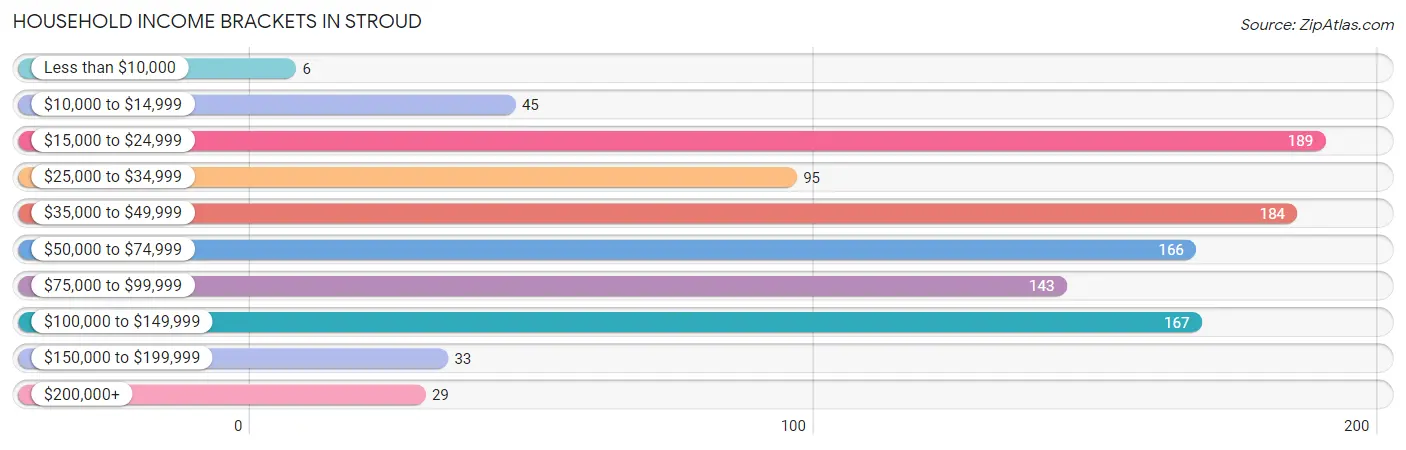
| Income Bracket | # Households | % Households |
| Less than $10,000 | 6 | 0.6% |
| $10,000 to $14,999 | 45 | 4.3% |
| $15,000 to $24,999 | 189 | 17.9% |
| $25,000 to $34,999 | 95 | 9.0% |
| $35,000 to $49,999 | 184 | 17.4% |
| $50,000 to $74,999 | 166 | 15.7% |
| $75,000 to $99,999 | 143 | 13.5% |
| $100,000 to $149,999 | 167 | 15.8% |
| $150,000 to $199,999 | 33 | 3.1% |
| $200,000+ | 29 | 2.7% |
Household Income by Householder Age in Stroud
The median household income in Stroud is $51,131, with the highest median household income of $67,375 found in the 25 to 44 years age bracket for the primary householder. A total of 351 households (33.2%) fall into this category. Meanwhile, the 65+ years age bracket for the primary householder has the lowest median household income of $32,857, with 324 households (30.6%) in this group.
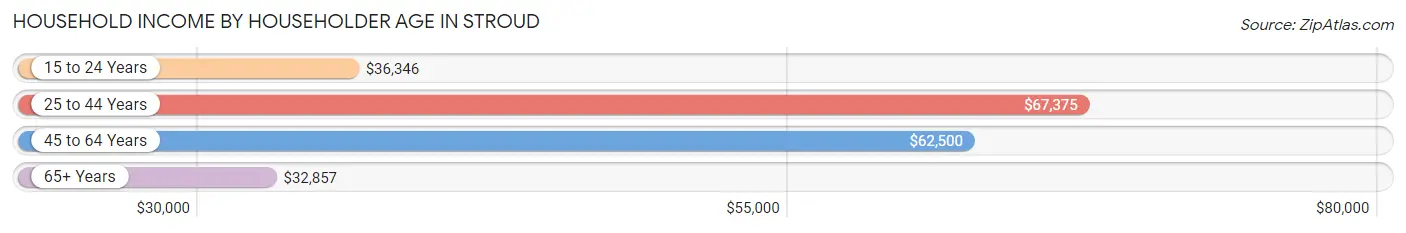
| Income Bracket | # Households | Median Income |
| 15 to 24 Years | 34 (3.2%) | $36,346 |
| 25 to 44 Years | 351 (33.2%) | $67,375 |
| 45 to 64 Years | 348 (32.9%) | $62,500 |
| 65+ Years | 324 (30.6%) | $32,857 |
| Total | 1,057 (100.0%) | $51,131 |
Poverty in Stroud
Income Below Poverty by Sex and Age in Stroud
With 13.9% poverty level for males and 20.0% for females among the residents of Stroud, 5 year old males and 15 year old females are the most vulnerable to poverty, with 5 males (50.0%) and 53 females (84.1%) in their respective age groups living below the poverty level.
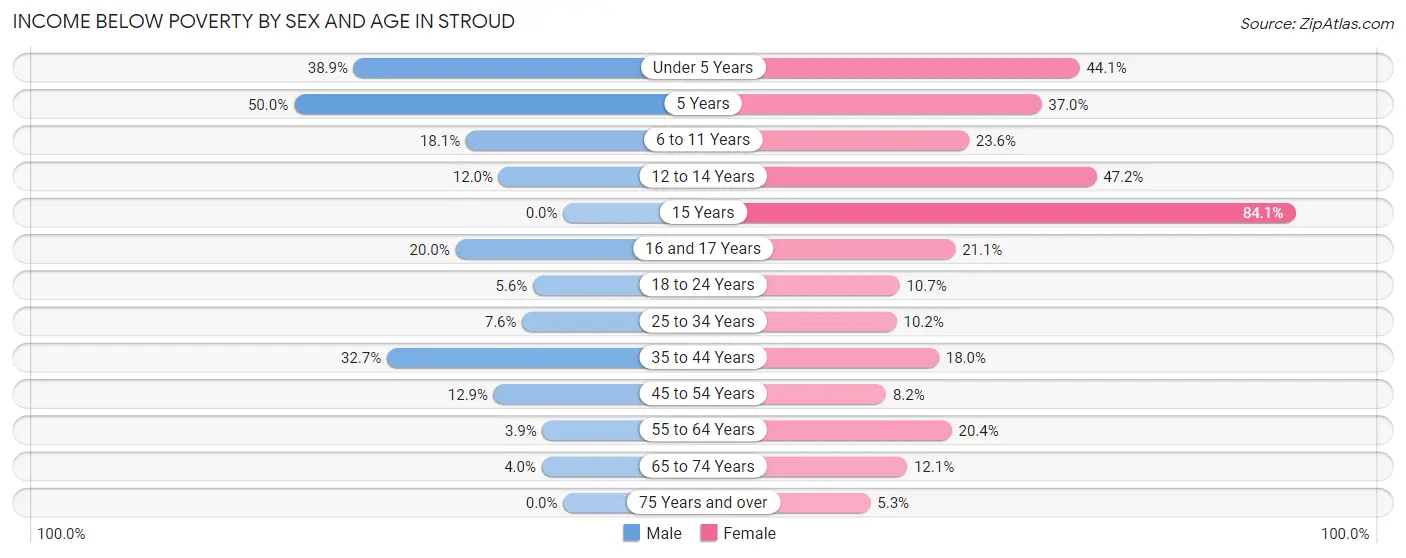
| Age Bracket | Male | Female |
| Under 5 Years | 28 (38.9%) | 30 (44.1%) |
| 5 Years | 5 (50.0%) | 10 (37.0%) |
| 6 to 11 Years | 30 (18.1%) | 25 (23.6%) |
| 12 to 14 Years | 14 (12.0%) | 17 (47.2%) |
| 15 Years | 0 (0.0%) | 53 (84.1%) |
| 16 and 17 Years | 5 (20.0%) | 8 (21.0%) |
| 18 to 24 Years | 5 (5.6%) | 12 (10.7%) |
| 25 to 34 Years | 14 (7.6%) | 19 (10.2%) |
| 35 to 44 Years | 54 (32.7%) | 36 (18.0%) |
| 45 to 54 Years | 16 (12.9%) | 10 (8.2%) |
| 55 to 64 Years | 5 (3.8%) | 33 (20.4%) |
| 65 to 74 Years | 5 (4.0%) | 15 (12.1%) |
| 75 Years and over | 0 (0.0%) | 7 (5.3%) |
| Total | 181 (13.9%) | 275 (20.0%) |
Income Above Poverty by Sex and Age in Stroud
According to the poverty statistics in Stroud, males aged 15 years and females aged 75 years and over are the age groups that are most secure financially, with 100.0% of males and 94.7% of females in these age groups living above the poverty line.
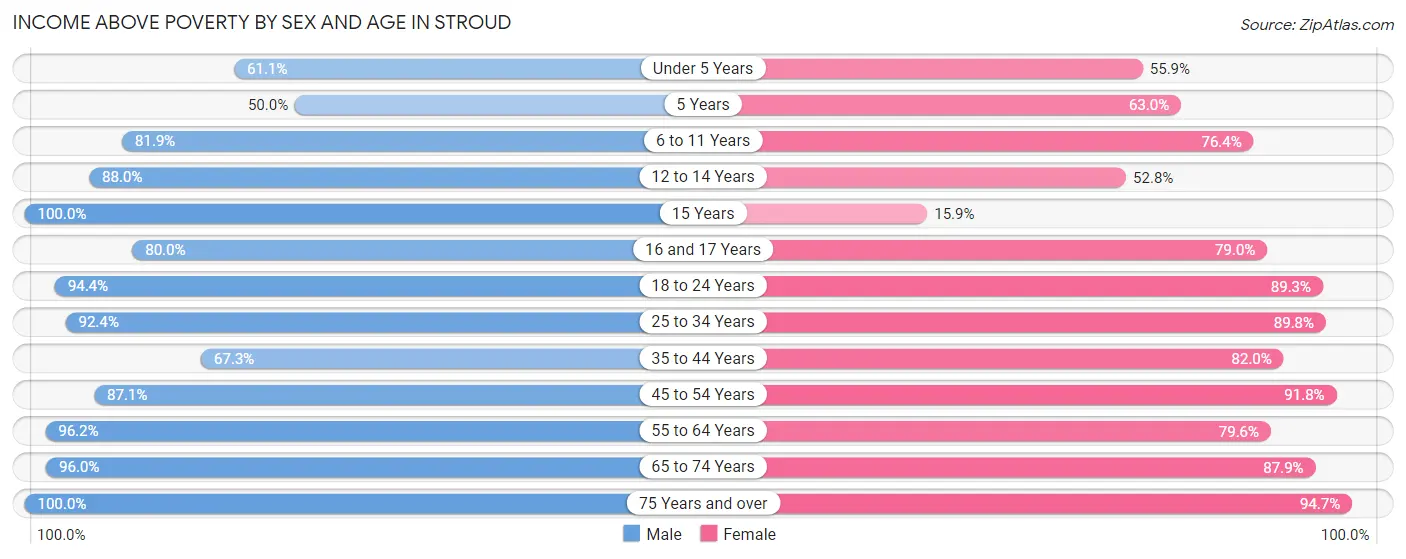
| Age Bracket | Male | Female |
| Under 5 Years | 44 (61.1%) | 38 (55.9%) |
| 5 Years | 5 (50.0%) | 17 (63.0%) |
| 6 to 11 Years | 136 (81.9%) | 81 (76.4%) |
| 12 to 14 Years | 103 (88.0%) | 19 (52.8%) |
| 15 Years | 17 (100.0%) | 10 (15.9%) |
| 16 and 17 Years | 20 (80.0%) | 30 (78.9%) |
| 18 to 24 Years | 84 (94.4%) | 100 (89.3%) |
| 25 to 34 Years | 170 (92.4%) | 168 (89.8%) |
| 35 to 44 Years | 111 (67.3%) | 164 (82.0%) |
| 45 to 54 Years | 108 (87.1%) | 112 (91.8%) |
| 55 to 64 Years | 125 (96.2%) | 129 (79.6%) |
| 65 to 74 Years | 120 (96.0%) | 109 (87.9%) |
| 75 Years and over | 83 (100.0%) | 125 (94.7%) |
| Total | 1,126 (86.2%) | 1,102 (80.0%) |
Income Below Poverty Among Married-Couple Families in Stroud
The poverty statistics for married-couple families in Stroud show that 4.4% or 19 of the total 432 families live below the poverty line. Families with 3 or 4 children have the highest poverty rate of 25.5%, comprising of 13 families. On the other hand, families with no children have the lowest poverty rate of 0.0%, which includes 0 families.
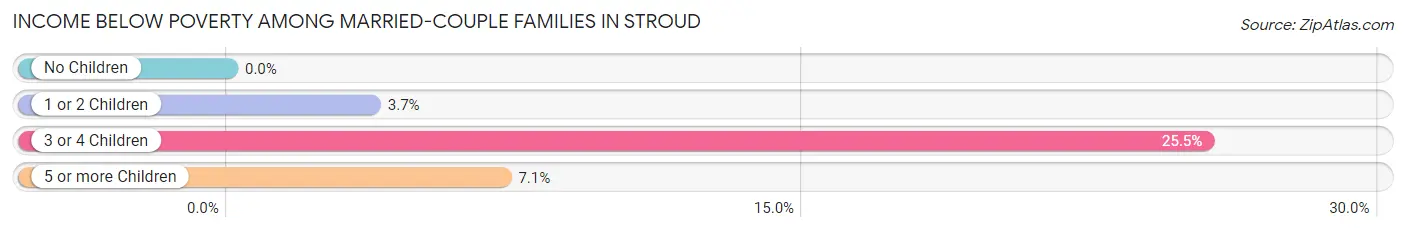
| Children | Above Poverty | Below Poverty |
| No Children | 233 (100.0%) | 0 (0.0%) |
| 1 or 2 Children | 129 (96.3%) | 5 (3.7%) |
| 3 or 4 Children | 38 (74.5%) | 13 (25.5%) |
| 5 or more Children | 13 (92.9%) | 1 (7.1%) |
| Total | 413 (95.6%) | 19 (4.4%) |
Income Below Poverty Among Single-Parent Households in Stroud
According to the poverty data in Stroud, 51.1% or 23 single-father households and 15.5% or 30 single-mother households are living below the poverty line. Among single-father households, those with 3 or 4 children have the highest poverty rate, with 7 households (100.0%) experiencing poverty. Likewise, among single-mother households, those with 3 or 4 children have the highest poverty rate, with 10 households (100.0%) falling below the poverty line.
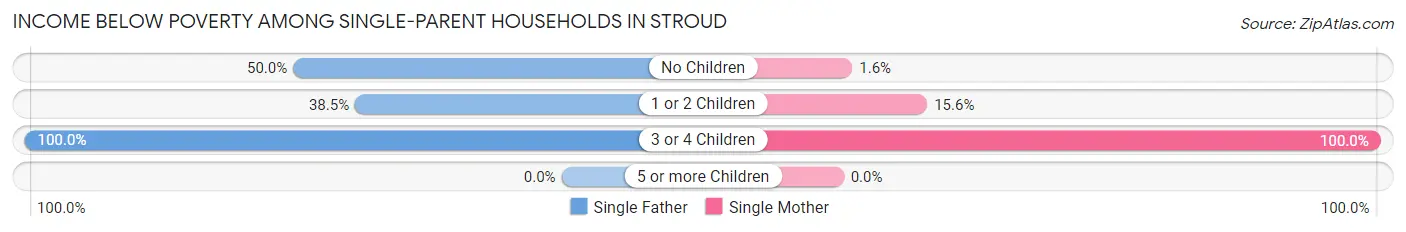
| Children | Single Father | Single Mother |
| No Children | 6 (50.0%) | 1 (1.6%) |
| 1 or 2 Children | 10 (38.5%) | 19 (15.6%) |
| 3 or 4 Children | 7 (100.0%) | 10 (100.0%) |
| 5 or more Children | 0 (0.0%) | 0 (0.0%) |
| Total | 23 (51.1%) | 30 (15.5%) |
Income Below Poverty Among Married-Couple vs Single-Parent Households in Stroud
The poverty data for Stroud shows that 19 of the married-couple family households (4.4%) and 53 of the single-parent households (22.2%) are living below the poverty level. Within the married-couple family households, those with 3 or 4 children have the highest poverty rate, with 13 households (25.5%) falling below the poverty line. Among the single-parent households, those with 3 or 4 children have the highest poverty rate, with 17 household (100.0%) living below poverty.
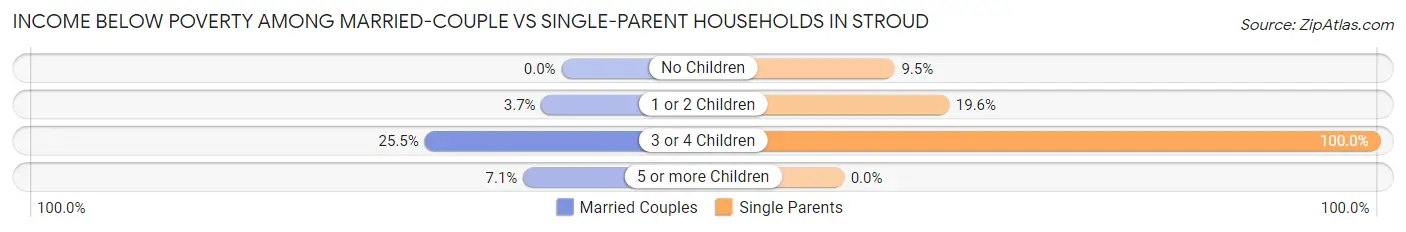
| Children | Married-Couple Families | Single-Parent Households |
| No Children | 0 (0.0%) | 7 (9.5%) |
| 1 or 2 Children | 5 (3.7%) | 29 (19.6%) |
| 3 or 4 Children | 13 (25.5%) | 17 (100.0%) |
| 5 or more Children | 1 (7.1%) | 0 (0.0%) |
| Total | 19 (4.4%) | 53 (22.2%) |
Race in Stroud
The most populous races in Stroud are White / Caucasian (2,250 | 81.9%), Two or more Races (209 | 7.6%), and Native / Alaskan (198 | 7.2%).
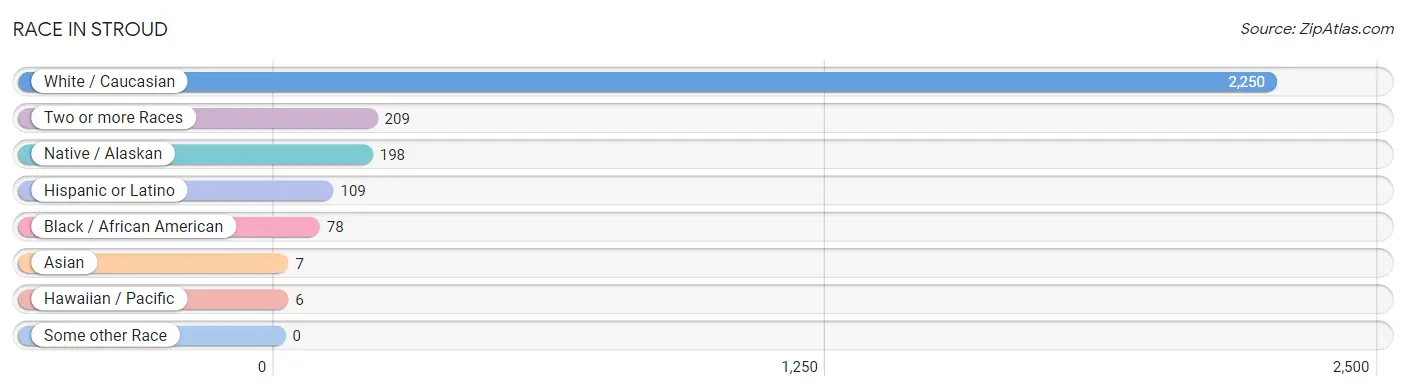
| Race | # Population | % Population |
| Asian | 7 | 0.3% |
| Black / African American | 78 | 2.8% |
| Hawaiian / Pacific | 6 | 0.2% |
| Hispanic or Latino | 109 | 4.0% |
| Native / Alaskan | 198 | 7.2% |
| White / Caucasian | 2,250 | 81.9% |
| Two or more Races | 209 | 7.6% |
| Some other Race | 0 | 0.0% |
| Total | 2,748 | 100.0% |
Ancestry in Stroud
The most populous ancestries reported in Stroud are Irish (412 | 15.0%), German (392 | 14.3%), American (283 | 10.3%), English (224 | 8.2%), and Cherokee (149 | 5.4%), together accounting for 53.1% of all Stroud residents.
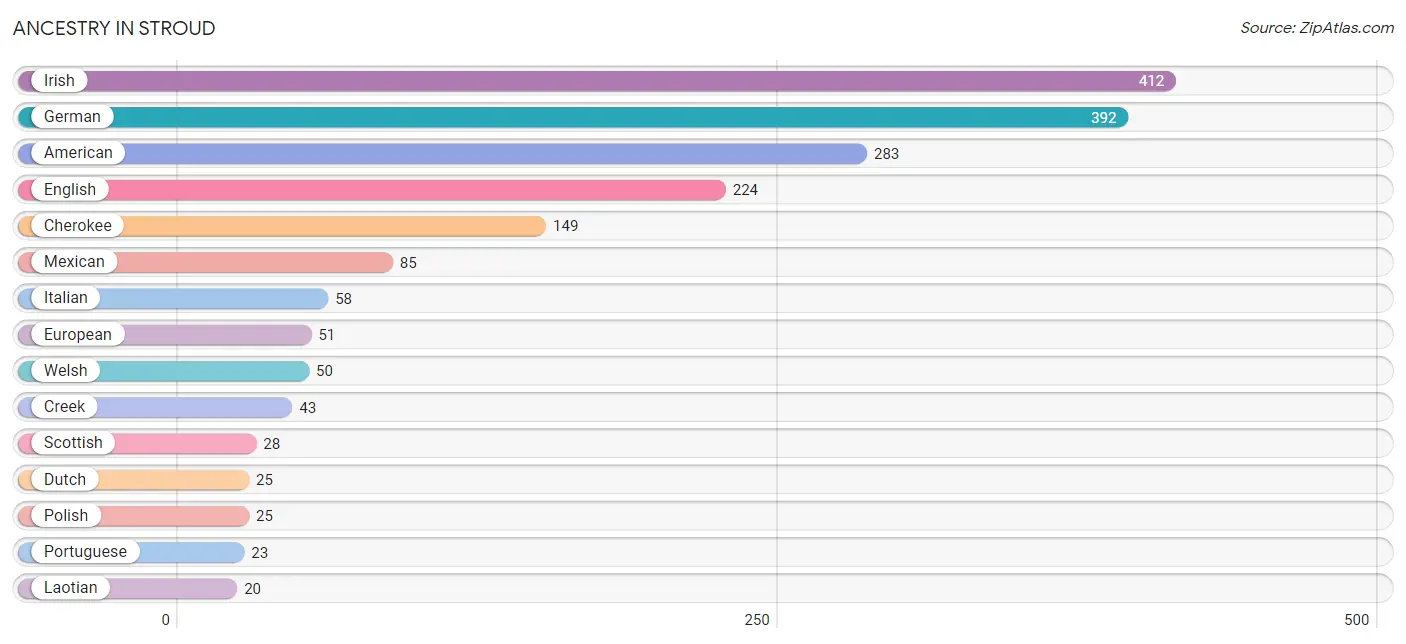
| Ancestry | # Population | % Population |
| American | 283 | 10.3% |
| Austrian | 6 | 0.2% |
| British | 12 | 0.4% |
| Cherokee | 149 | 5.4% |
| Chickasaw | 1 | 0.0% |
| Choctaw | 3 | 0.1% |
| Creek | 43 | 1.6% |
| Czech | 11 | 0.4% |
| Dutch | 25 | 0.9% |
| Dutch West Indian | 13 | 0.5% |
| English | 224 | 8.2% |
| European | 51 | 1.9% |
| French | 9 | 0.3% |
| French Canadian | 17 | 0.6% |
| German | 392 | 14.3% |
| Indian (Asian) | 5 | 0.2% |
| Iranian | 6 | 0.2% |
| Irish | 412 | 15.0% |
| Italian | 58 | 2.1% |
| Kiowa | 3 | 0.1% |
| Korean | 18 | 0.7% |
| Laotian | 20 | 0.7% |
| Mexican | 85 | 3.1% |
| Native Hawaiian | 11 | 0.4% |
| Nigerian | 6 | 0.2% |
| Norwegian | 7 | 0.3% |
| Polish | 25 | 0.9% |
| Portuguese | 23 | 0.8% |
| Romanian | 8 | 0.3% |
| Scotch-Irish | 12 | 0.4% |
| Scottish | 28 | 1.0% |
| Sioux | 5 | 0.2% |
| Spaniard | 6 | 0.2% |
| Spanish | 18 | 0.7% |
| Subsaharan African | 6 | 0.2% |
| Welsh | 50 | 1.8% | View All 36 Rows |
Immigrants in Stroud
The most numerous immigrant groups reported in Stroud came from Europe (10 | 0.4%), Asia (9 | 0.3%), Philippines (9 | 0.3%), South Eastern Asia (9 | 0.3%), and Central America (8 | 0.3%), together accounting for 1.6% of all Stroud residents.
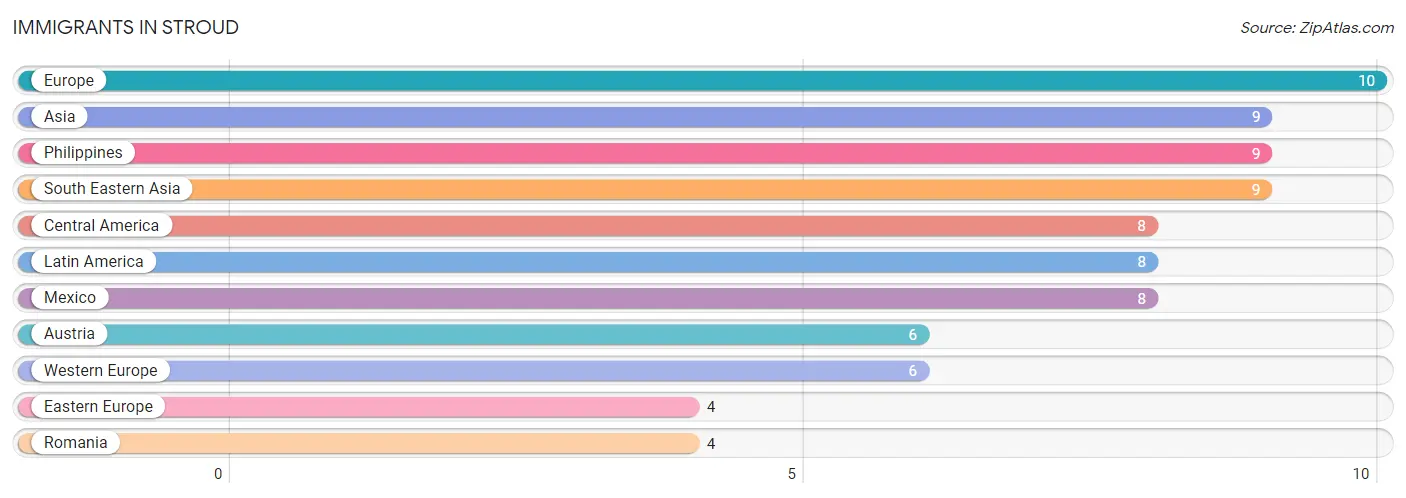
| Immigration Origin | # Population | % Population |
| Asia | 9 | 0.3% |
| Austria | 6 | 0.2% |
| Central America | 8 | 0.3% |
| Eastern Europe | 4 | 0.2% |
| Europe | 10 | 0.4% |
| Latin America | 8 | 0.3% |
| Mexico | 8 | 0.3% |
| Philippines | 9 | 0.3% |
| Romania | 4 | 0.2% |
| South Eastern Asia | 9 | 0.3% |
| Western Europe | 6 | 0.2% | View All 11 Rows |
Sex and Age in Stroud
Sex and Age in Stroud
The most populous age groups in Stroud are 10 to 14 Years (196 | 14.9%) for men and 15 to 19 Years (146 | 10.2%) for women.
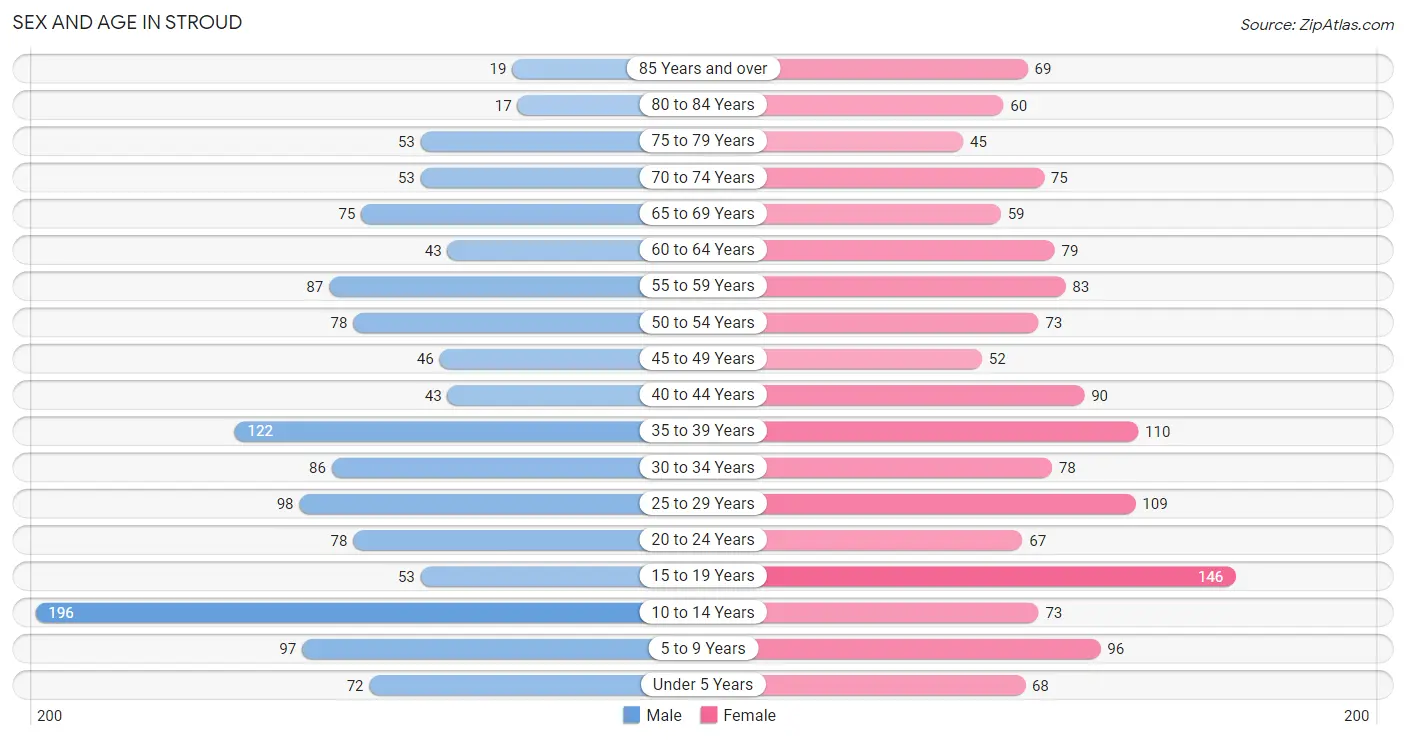
| Age Bracket | Male | Female |
| Under 5 Years | 72 (5.5%) | 68 (4.8%) |
| 5 to 9 Years | 97 (7.4%) | 96 (6.7%) |
| 10 to 14 Years | 196 (14.9%) | 73 (5.1%) |
| 15 to 19 Years | 53 (4.0%) | 146 (10.2%) |
| 20 to 24 Years | 78 (5.9%) | 67 (4.7%) |
| 25 to 29 Years | 98 (7.4%) | 109 (7.6%) |
| 30 to 34 Years | 86 (6.5%) | 78 (5.4%) |
| 35 to 39 Years | 122 (9.3%) | 110 (7.7%) |
| 40 to 44 Years | 43 (3.3%) | 90 (6.3%) |
| 45 to 49 Years | 46 (3.5%) | 52 (3.6%) |
| 50 to 54 Years | 78 (5.9%) | 73 (5.1%) |
| 55 to 59 Years | 87 (6.6%) | 83 (5.8%) |
| 60 to 64 Years | 43 (3.3%) | 79 (5.5%) |
| 65 to 69 Years | 75 (5.7%) | 59 (4.1%) |
| 70 to 74 Years | 53 (4.0%) | 75 (5.2%) |
| 75 to 79 Years | 53 (4.0%) | 45 (3.1%) |
| 80 to 84 Years | 17 (1.3%) | 60 (4.2%) |
| 85 Years and over | 19 (1.4%) | 69 (4.8%) |
| Total | 1,316 (100.0%) | 1,432 (100.0%) |
Families and Households in Stroud
Median Family Size in Stroud
The median family size in Stroud is 3.22 persons per family, with married-couple families (432 | 64.4%) accounting for the largest median family size of 3.47 persons per family. On the other hand, single female/mother families (194 | 28.9%) represent the smallest median family size with 2.73 persons per family.
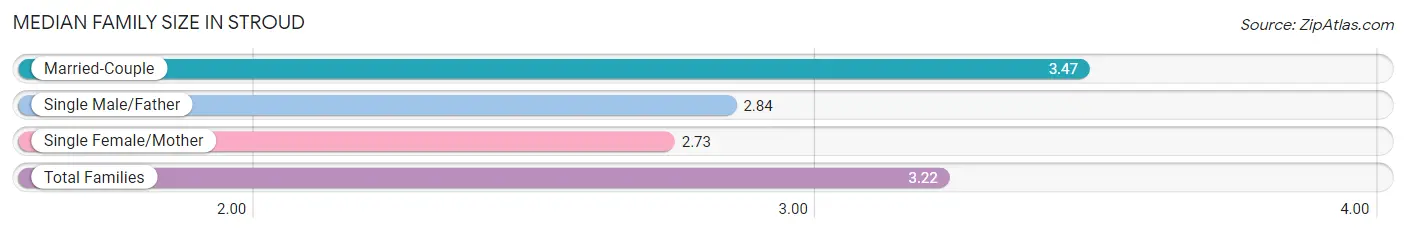
| Family Type | # Families | Family Size |
| Married-Couple | 432 (64.4%) | 3.47 |
| Single Male/Father | 45 (6.7%) | 2.84 |
| Single Female/Mother | 194 (28.9%) | 2.73 |
| Total Families | 671 (100.0%) | 3.22 |
Median Household Size in Stroud
The median household size in Stroud is 2.54 persons per household, with married-couple households (432 | 40.9%) accounting for the largest median household size of 3.47 persons per household. non-family households (386 | 36.5%) represent the smallest median household size with 1.18 persons per household.
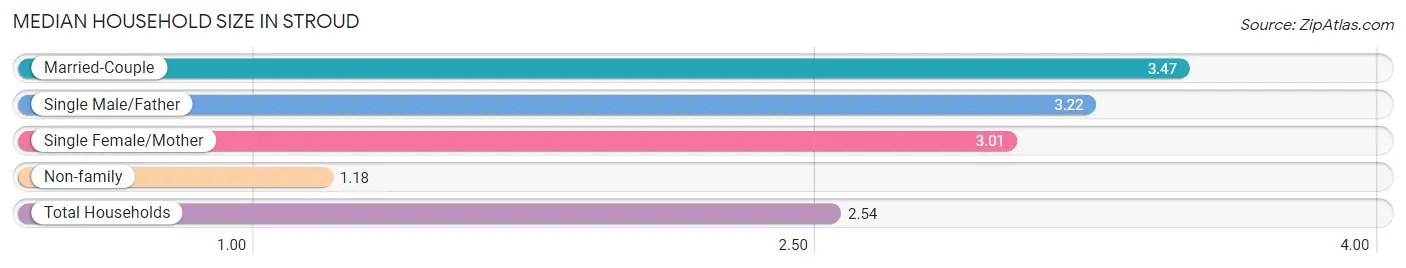
| Household Type | # Households | Household Size |
| Married-Couple | 432 (40.9%) | 3.47 |
| Single Male/Father | 45 (4.3%) | 3.22 |
| Single Female/Mother | 194 (18.3%) | 3.01 |
| Non-family | 386 (36.5%) | 1.18 |
| Total Households | 1,057 (100.0%) | 2.54 |
Household Size by Marriage Status in Stroud
Out of a total of 1,057 households in Stroud, 671 (63.5%) are family households, while 386 (36.5%) are nonfamily households. The most numerous type of family households are 2-person households, comprising 313, and the most common type of nonfamily households are 1-person households, comprising 325.
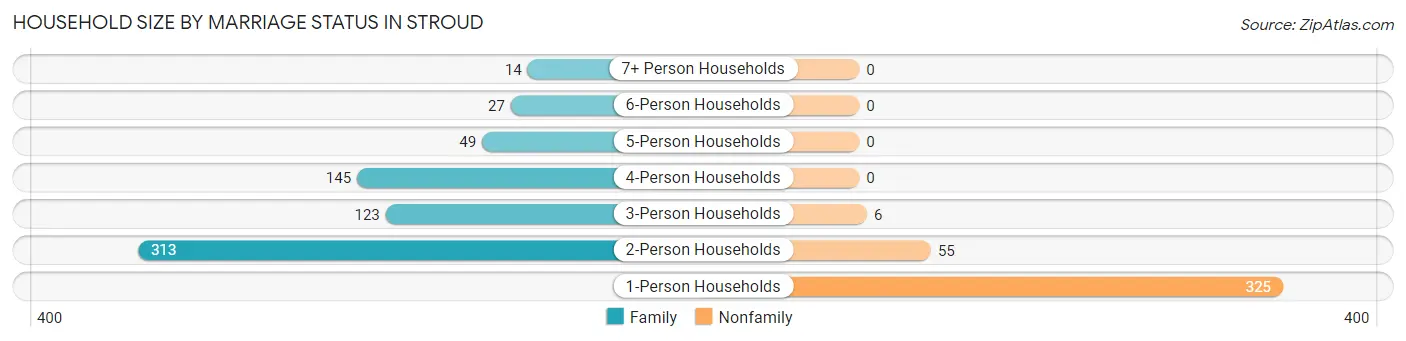
| Household Size | Family Households | Nonfamily Households |
| 1-Person Households | - | 325 (30.7%) |
| 2-Person Households | 313 (29.6%) | 55 (5.2%) |
| 3-Person Households | 123 (11.6%) | 6 (0.6%) |
| 4-Person Households | 145 (13.7%) | 0 (0.0%) |
| 5-Person Households | 49 (4.6%) | 0 (0.0%) |
| 6-Person Households | 27 (2.5%) | 0 (0.0%) |
| 7+ Person Households | 14 (1.3%) | 0 (0.0%) |
| Total | 671 (63.5%) | 386 (36.5%) |
Female Fertility in Stroud
Fertility by Age in Stroud
Average fertility rate in Stroud is 38.0 births per 1,000 women. Women in the age bracket of 20 to 34 years have the highest fertility rate with 55.0 births per 1,000 women. Women in the age bracket of 20 to 34 years acount for 56.0% of all women with births.
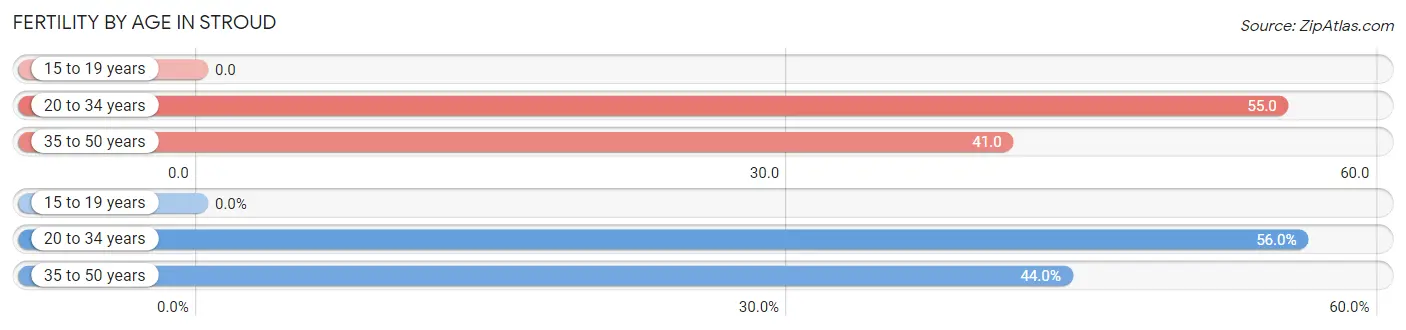
| Age Bracket | Women with Births | Births / 1,000 Women |
| 15 to 19 years | 0 (0.0%) | 0.0 |
| 20 to 34 years | 14 (56.0%) | 55.0 |
| 35 to 50 years | 11 (44.0%) | 41.0 |
| Total | 25 (100.0%) | 38.0 |
Fertility by Age by Marriage Status in Stroud
64.0% of women with births (25) in Stroud are married. The highest percentage of unmarried women with births falls into 20 to 34 years age bracket with 64.3% of them unmarried at the time of birth, while the lowest percentage of unmarried women with births belong to 35 to 50 years age bracket with 0.0% of them unmarried.
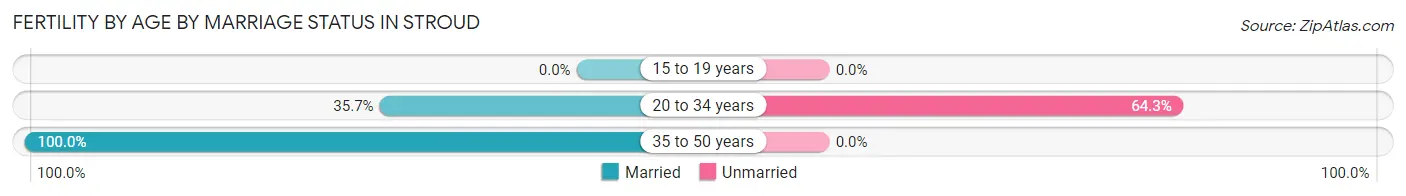
| Age Bracket | Married | Unmarried |
| 15 to 19 years | 0 (0.0%) | 0 (0.0%) |
| 20 to 34 years | 5 (35.7%) | 9 (64.3%) |
| 35 to 50 years | 11 (100.0%) | 0 (0.0%) |
| Total | 16 (64.0%) | 9 (36.0%) |
Fertility by Education in Stroud
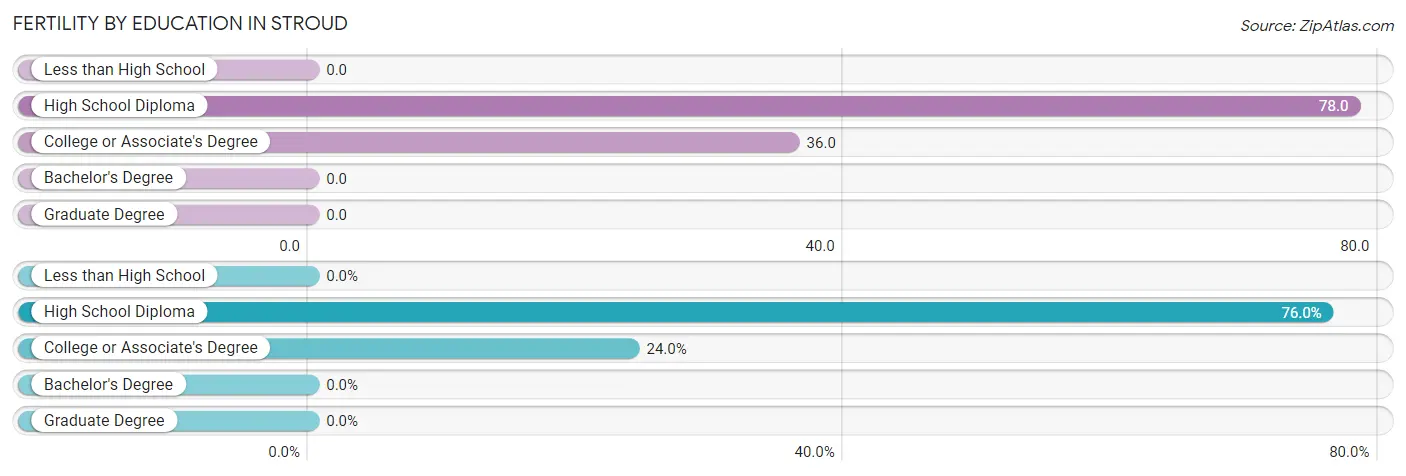
| Educational Attainment | Women with Births | Births / 1,000 Women |
| Less than High School | 0 (0.0%) | 0.0 |
| High School Diploma | 19 (76.0%) | 78.0 |
| College or Associate's Degree | 6 (24.0%) | 36.0 |
| Bachelor's Degree | 0 (0.0%) | 0.0 |
| Graduate Degree | 0 (0.0%) | 0.0 |
| Total | 25 (100.0%) | 38.0 |
Fertility by Education by Marriage Status in Stroud
36.0% of women with births in Stroud are unmarried. Women with the educational attainment of high school diploma are most likely to be married with 84.2% of them married at childbirth, while women with the educational attainment of college or associate's degree are least likely to be married with 100.0% of them unmarried at childbirth.
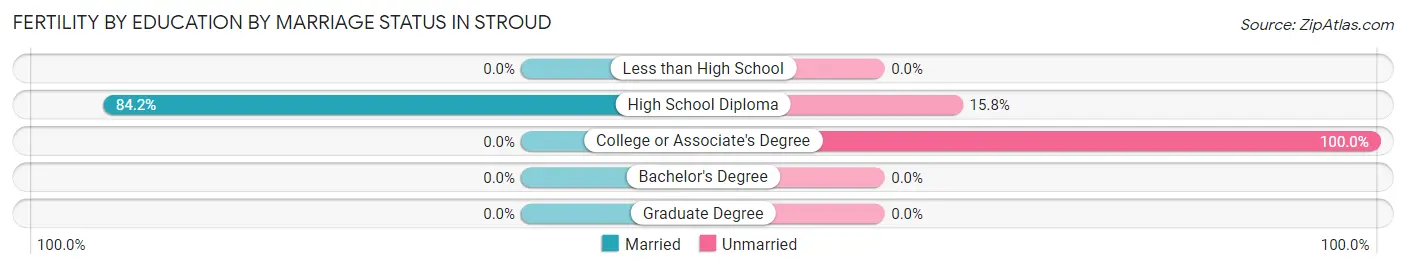
| Educational Attainment | Married | Unmarried |
| Less than High School | 0 (0.0%) | 0 (0.0%) |
| High School Diploma | 16 (84.2%) | 3 (15.8%) |
| College or Associate's Degree | 0 (0.0%) | 6 (100.0%) |
| Bachelor's Degree | 0 (0.0%) | 0 (0.0%) |
| Graduate Degree | 0 (0.0%) | 0 (0.0%) |
| Total | 16 (64.0%) | 9 (36.0%) |
Employment Characteristics in Stroud
Employment by Class of Employer in Stroud
Among the 1,150 employed individuals in Stroud, private company employees (778 | 67.6%), local government employees (123 | 10.7%), and state government employees (73 | 6.4%) make up the most common classes of employment.
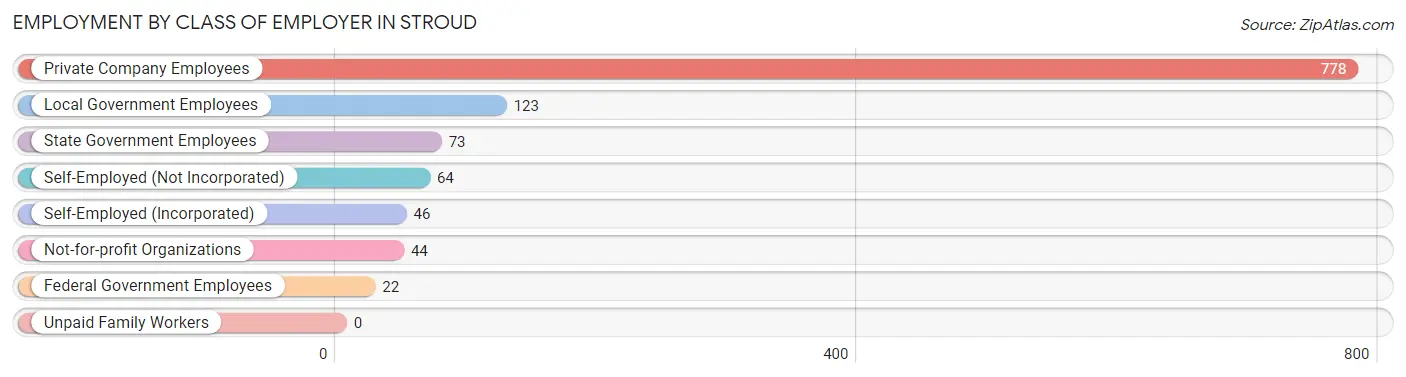
| Employer Class | # Employees | % Employees |
| Private Company Employees | 778 | 67.6% |
| Self-Employed (Incorporated) | 46 | 4.0% |
| Self-Employed (Not Incorporated) | 64 | 5.6% |
| Not-for-profit Organizations | 44 | 3.8% |
| Local Government Employees | 123 | 10.7% |
| State Government Employees | 73 | 6.4% |
| Federal Government Employees | 22 | 1.9% |
| Unpaid Family Workers | 0 | 0.0% |
| Total | 1,150 | 100.0% |
Employment Status by Age in Stroud
According to the labor force statistics for Stroud, out of the total population over 16 years of age (2,066), 61.0% or 1,260 individuals are in the labor force, with 8.3% or 105 of them unemployed. The age group with the highest labor force participation rate is 35 to 44 years, with 89.3% or 326 individuals in the labor force. Within the labor force, the 16 to 19 years age range has the highest percentage of unemployed individuals, with 23.9% or 11 of them being unemployed.
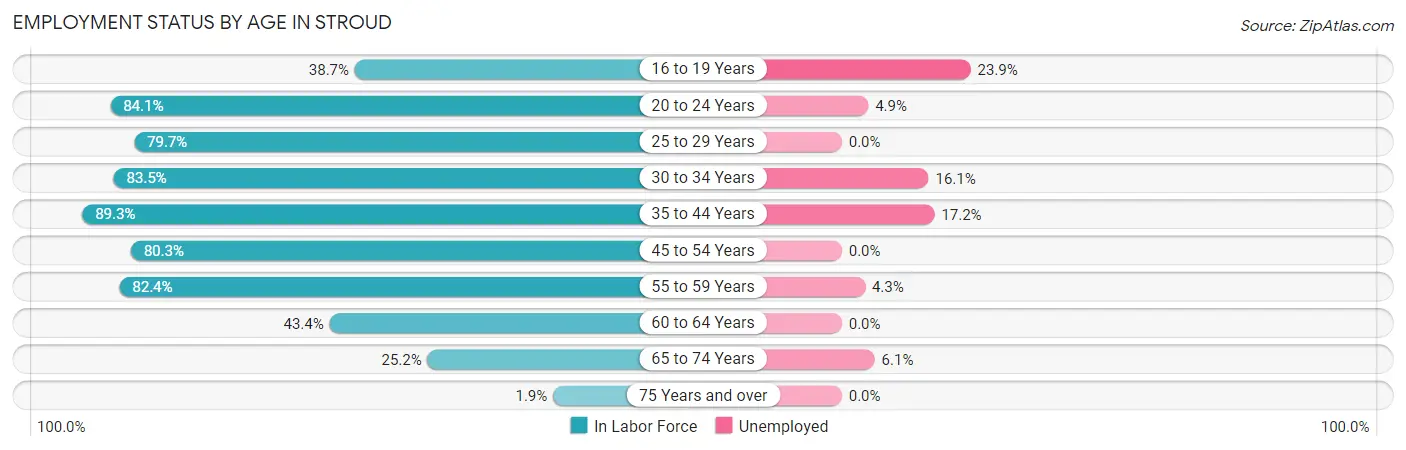
| Age Bracket | In Labor Force | Unemployed |
| 16 to 19 Years | 46 (38.7%) | 11 (23.9%) |
| 20 to 24 Years | 122 (84.1%) | 6 (4.9%) |
| 25 to 29 Years | 165 (79.7%) | 0 (0.0%) |
| 30 to 34 Years | 137 (83.5%) | 22 (16.1%) |
| 35 to 44 Years | 326 (89.3%) | 56 (17.2%) |
| 45 to 54 Years | 200 (80.3%) | 0 (0.0%) |
| 55 to 59 Years | 140 (82.4%) | 6 (4.3%) |
| 60 to 64 Years | 53 (43.4%) | 0 (0.0%) |
| 65 to 74 Years | 66 (25.2%) | 4 (6.1%) |
| 75 Years and over | 5 (1.9%) | 0 (0.0%) |
| Total | 1,260 (61.0%) | 105 (8.3%) |
Employment Status by Educational Attainment in Stroud
According to labor force statistics for Stroud, 80.0% of individuals (1,022) out of the total population between 25 and 64 years of age (1,277) are in the labor force, with 8.2% or 84 of them being unemployed. The group with the highest labor force participation rate are those with the educational attainment of bachelor's degree or higher, with 87.8% or 166 individuals in the labor force. Within the labor force, individuals with less than high school education have the highest percentage of unemployment, with 25.8% or 16 of them being unemployed.
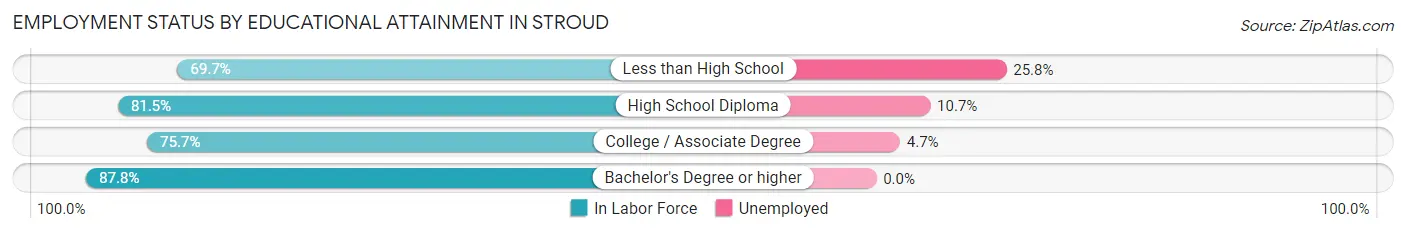
| Educational Attainment | In Labor Force | Unemployed |
| Less than High School | 62 (69.7%) | 23 (25.8%) |
| High School Diploma | 515 (81.5%) | 68 (10.7%) |
| College / Associate Degree | 278 (75.7%) | 17 (4.7%) |
| Bachelor's Degree or higher | 166 (87.8%) | 0 (0.0%) |
| Total | 1,022 (80.0%) | 105 (8.2%) |
Employment Occupations by Sex in Stroud
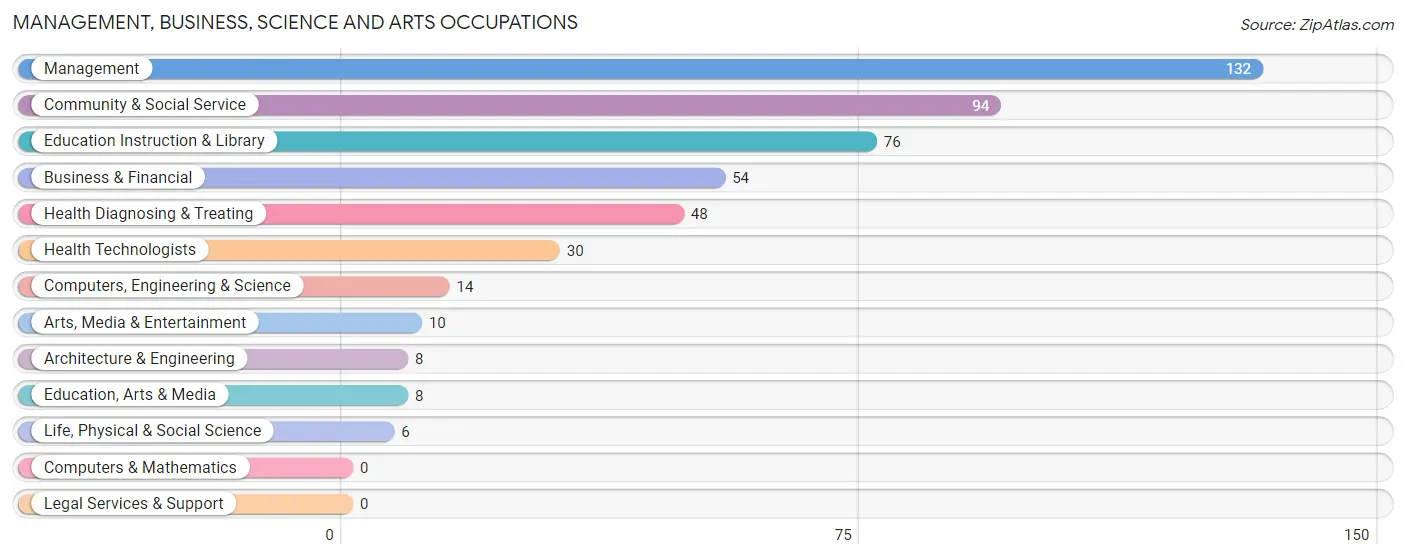
Management, Business, Science and Arts Occupations
The most common Management, Business, Science and Arts occupations in Stroud are Management (132 | 11.4%), Community & Social Service (94 | 8.1%), Education Instruction & Library (76 | 6.6%), Business & Financial (54 | 4.7%), and Health Diagnosing & Treating (48 | 4.2%).
Management, Business, Science and Arts Occupations by Sex
Within the Management, Business, Science and Arts occupations in Stroud, the most male-oriented occupations are Life, Physical & Social Science (100.0%), Education, Arts & Media (75.0%), and Computers, Engineering & Science (64.3%), while the most female-oriented occupations are Health Technologists (100.0%), Health Diagnosing & Treating (79.2%), and Education Instruction & Library (75.0%).
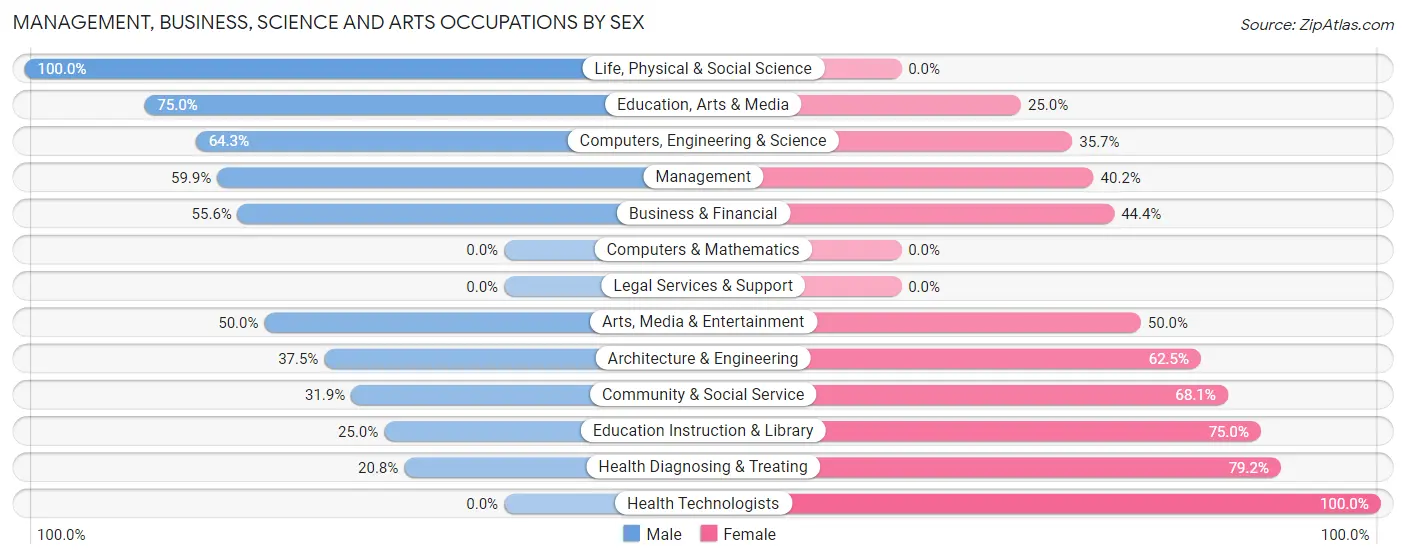
| Occupation | Male | Female |
| Management | 79 (59.9%) | 53 (40.2%) |
| Business & Financial | 30 (55.6%) | 24 (44.4%) |
| Computers, Engineering & Science | 9 (64.3%) | 5 (35.7%) |
| Computers & Mathematics | 0 (0.0%) | 0 (0.0%) |
| Architecture & Engineering | 3 (37.5%) | 5 (62.5%) |
| Life, Physical & Social Science | 6 (100.0%) | 0 (0.0%) |
| Community & Social Service | 30 (31.9%) | 64 (68.1%) |
| Education, Arts & Media | 6 (75.0%) | 2 (25.0%) |
| Legal Services & Support | 0 (0.0%) | 0 (0.0%) |
| Education Instruction & Library | 19 (25.0%) | 57 (75.0%) |
| Arts, Media & Entertainment | 5 (50.0%) | 5 (50.0%) |
| Health Diagnosing & Treating | 10 (20.8%) | 38 (79.2%) |
| Health Technologists | 0 (0.0%) | 30 (100.0%) |
| Total (Category) | 158 (46.2%) | 184 (53.8%) |
| Total (Overall) | 546 (47.3%) | 609 (52.7%) |
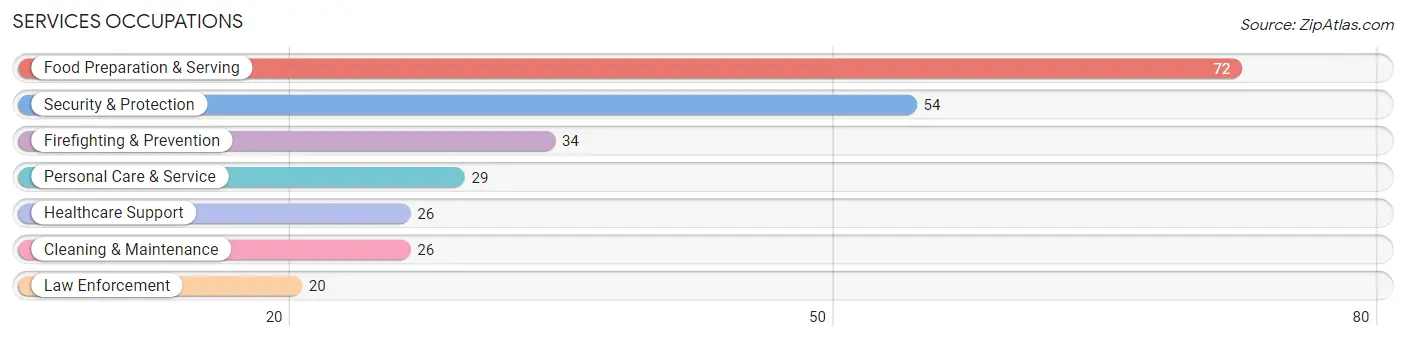
Services Occupations
The most common Services occupations in Stroud are Food Preparation & Serving (72 | 6.2%), Security & Protection (54 | 4.7%), Firefighting & Prevention (34 | 2.9%), Personal Care & Service (29 | 2.5%), and Healthcare Support (26 | 2.2%).
Services Occupations by Sex
Within the Services occupations in Stroud, the most male-oriented occupations are Firefighting & Prevention (100.0%), Security & Protection (94.4%), and Law Enforcement (85.0%), while the most female-oriented occupations are Healthcare Support (100.0%), Personal Care & Service (82.8%), and Food Preparation & Serving (73.6%).
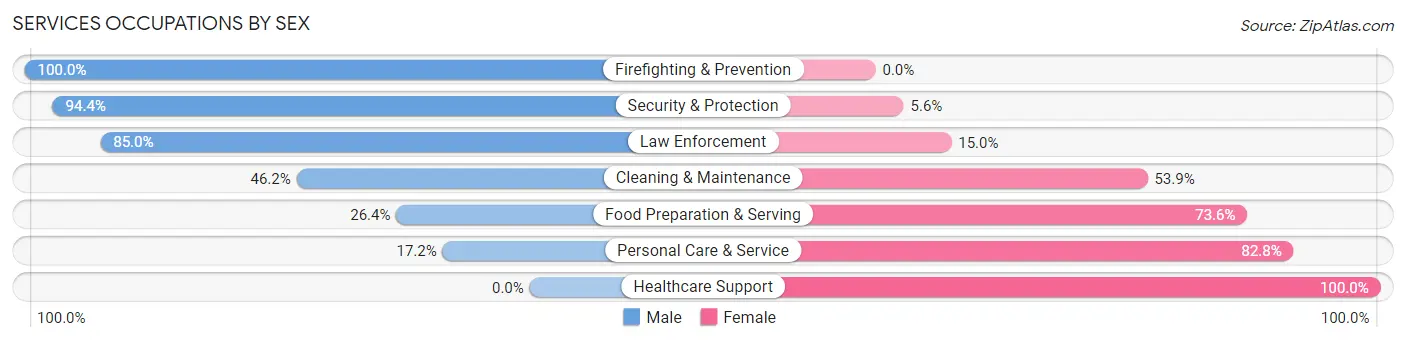
| Occupation | Male | Female |
| Healthcare Support | 0 (0.0%) | 26 (100.0%) |
| Security & Protection | 51 (94.4%) | 3 (5.6%) |
| Firefighting & Prevention | 34 (100.0%) | 0 (0.0%) |
| Law Enforcement | 17 (85.0%) | 3 (15.0%) |
| Food Preparation & Serving | 19 (26.4%) | 53 (73.6%) |
| Cleaning & Maintenance | 12 (46.2%) | 14 (53.8%) |
| Personal Care & Service | 5 (17.2%) | 24 (82.8%) |
| Total (Category) | 87 (42.0%) | 120 (58.0%) |
| Total (Overall) | 546 (47.3%) | 609 (52.7%) |
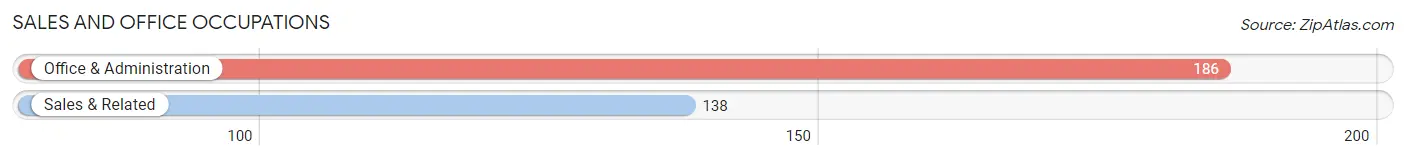
Sales and Office Occupations
The most common Sales and Office occupations in Stroud are Office & Administration (186 | 16.1%), and Sales & Related (138 | 11.9%).
Sales and Office Occupations by Sex
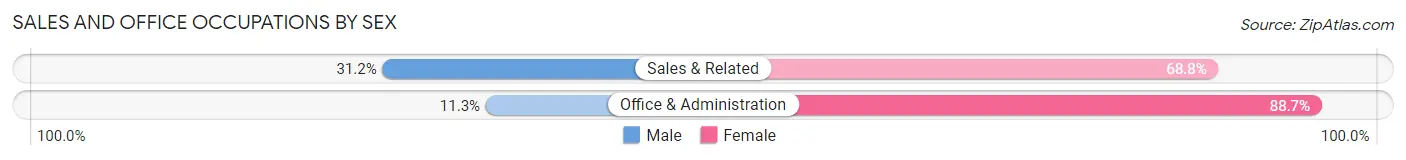
| Occupation | Male | Female |
| Sales & Related | 43 (31.2%) | 95 (68.8%) |
| Office & Administration | 21 (11.3%) | 165 (88.7%) |
| Total (Category) | 64 (19.8%) | 260 (80.2%) |
| Total (Overall) | 546 (47.3%) | 609 (52.7%) |
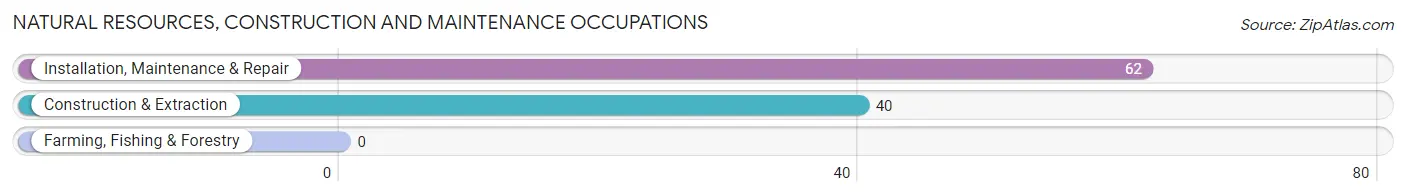
Natural Resources, Construction and Maintenance Occupations
The most common Natural Resources, Construction and Maintenance occupations in Stroud are Installation, Maintenance & Repair (62 | 5.4%), and Construction & Extraction (40 | 3.5%).
Natural Resources, Construction and Maintenance Occupations by Sex
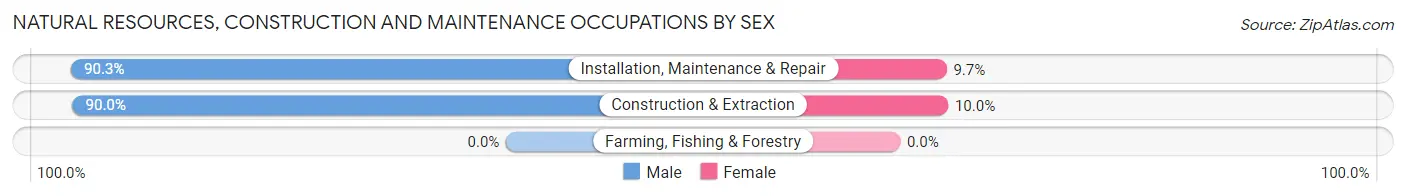
| Occupation | Male | Female |
| Farming, Fishing & Forestry | 0 (0.0%) | 0 (0.0%) |
| Construction & Extraction | 36 (90.0%) | 4 (10.0%) |
| Installation, Maintenance & Repair | 56 (90.3%) | 6 (9.7%) |
| Total (Category) | 92 (90.2%) | 10 (9.8%) |
| Total (Overall) | 546 (47.3%) | 609 (52.7%) |
Production, Transportation and Moving Occupations
The most common Production, Transportation and Moving occupations in Stroud are Transportation (71 | 6.1%), Production (59 | 5.1%), and Material Moving (50 | 4.3%).
Production, Transportation and Moving Occupations by Sex
| Occupation | Male | Female |
| Production | 42 (71.2%) | 17 (28.8%) |
| Transportation | 53 (74.7%) | 18 (25.4%) |
| Material Moving | 50 (100.0%) | 0 (0.0%) |
| Total (Category) | 145 (80.6%) | 35 (19.4%) |
| Total (Overall) | 546 (47.3%) | 609 (52.7%) |
Employment Industries by Sex in Stroud
Employment Industries in Stroud
The major employment industries in Stroud include Health Care & Social Assistance (151 | 13.1%), Retail Trade (141 | 12.2%), Manufacturing (137 | 11.9%), Educational Services (110 | 9.5%), and Accommodation & Food Services (92 | 8.0%).
Employment Industries by Sex in Stroud
The Stroud industries that see more men than women are Agriculture, Fishing & Hunting (100.0%), Information (100.0%), and Administrative & Support (100.0%), whereas the industries that tend to have a higher number of women are Professional & Scientific (100.0%), Educational Services (79.1%), and Health Care & Social Assistance (75.5%).
| Industry | Male | Female |
| Agriculture, Fishing & Hunting | 5 (100.0%) | 0 (0.0%) |
| Mining, Quarrying, & Extraction | 35 (85.4%) | 6 (14.6%) |
| Construction | 70 (81.4%) | 16 (18.6%) |
| Manufacturing | 112 (81.8%) | 25 (18.2%) |
| Wholesale Trade | 5 (26.3%) | 14 (73.7%) |
| Retail Trade | 36 (25.5%) | 105 (74.5%) |
| Transportation & Warehousing | 18 (28.6%) | 45 (71.4%) |
| Utilities | 0 (0.0%) | 0 (0.0%) |
| Information | 12 (100.0%) | 0 (0.0%) |
| Finance & Insurance | 25 (39.1%) | 39 (60.9%) |
| Real Estate, Rental & Leasing | 6 (40.0%) | 9 (60.0%) |
| Professional & Scientific | 0 (0.0%) | 15 (100.0%) |
| Enterprise Management | 0 (0.0%) | 0 (0.0%) |
| Administrative & Support | 43 (100.0%) | 0 (0.0%) |
| Educational Services | 23 (20.9%) | 87 (79.1%) |
| Health Care & Social Assistance | 37 (24.5%) | 114 (75.5%) |
| Arts, Entertainment & Recreation | 16 (69.6%) | 7 (30.4%) |
| Accommodation & Food Services | 38 (41.3%) | 54 (58.7%) |
| Public Administration | 35 (47.3%) | 39 (52.7%) |
| Total | 546 (47.3%) | 609 (52.7%) |
Education in Stroud
School Enrollment in Stroud
The most common levels of schooling among the 709 students in Stroud are middle school (246 | 34.7%), elementary school (182 | 25.7%), and high school (118 | 16.6%).
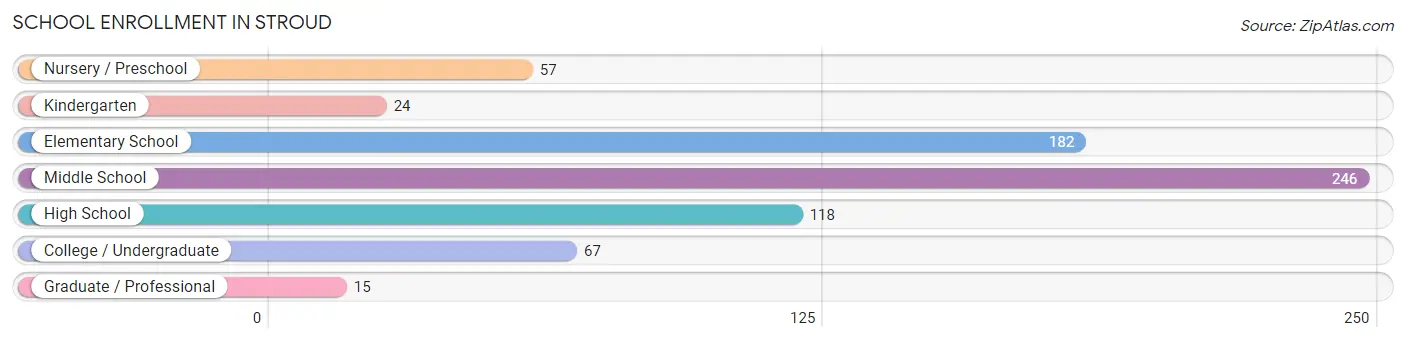
| School Level | # Students | % Students |
| Nursery / Preschool | 57 | 8.0% |
| Kindergarten | 24 | 3.4% |
| Elementary School | 182 | 25.7% |
| Middle School | 246 | 34.7% |
| High School | 118 | 16.6% |
| College / Undergraduate | 67 | 9.5% |
| Graduate / Professional | 15 | 2.1% |
| Total | 709 | 100.0% |
School Enrollment by Age by Funding Source in Stroud
Out of a total of 709 students who are enrolled in schools in Stroud, 51 (7.2%) attend a private institution, while the remaining 658 (92.8%) are enrolled in public schools. The age group of 25 to 34 year olds has the highest likelihood of being enrolled in private schools, with 15 (51.7% in the age bracket) enrolled. Conversely, the age group of 3 to 4 year olds has the lowest likelihood of being enrolled in a private school, with 46 (100.0% in the age bracket) attending a public institution.
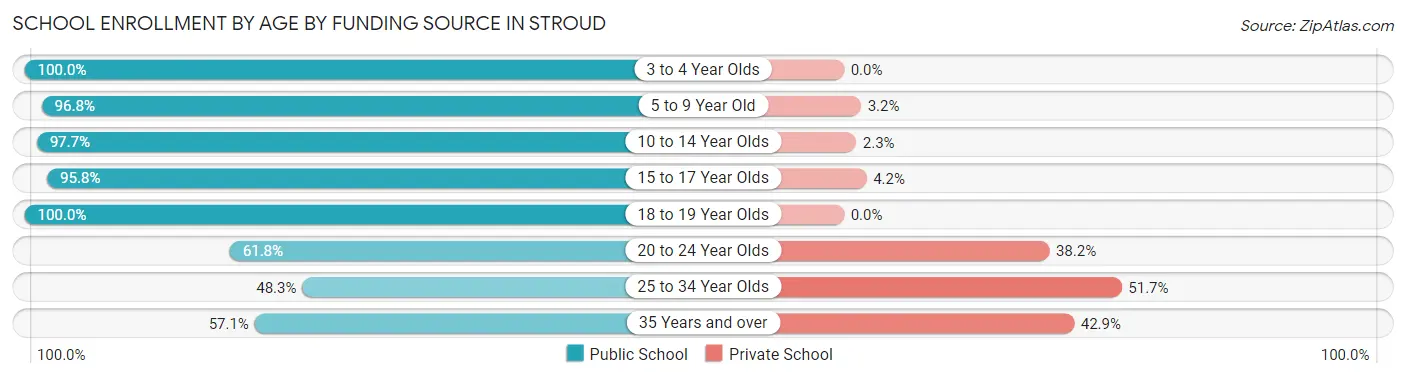
| Age Bracket | Public School | Private School |
| 3 to 4 Year Olds | 46 (100.0%) | 0 (0.0%) |
| 5 to 9 Year Old | 152 (96.8%) | 5 (3.2%) |
| 10 to 14 Year Olds | 258 (97.7%) | 6 (2.3%) |
| 15 to 17 Year Olds | 137 (95.8%) | 6 (4.2%) |
| 18 to 19 Year Olds | 22 (100.0%) | 0 (0.0%) |
| 20 to 24 Year Olds | 21 (61.8%) | 13 (38.2%) |
| 25 to 34 Year Olds | 14 (48.3%) | 15 (51.7%) |
| 35 Years and over | 8 (57.1%) | 6 (42.9%) |
| Total | 658 (92.8%) | 51 (7.2%) |
Educational Attainment by Field of Study in Stroud
Education (85 | 27.6%), business (62 | 20.1%), science & technology (45 | 14.6%), arts & humanities (24 | 7.8%), and social sciences (21 | 6.8%) are the most common fields of study among 308 individuals in Stroud who have obtained a bachelor's degree or higher.
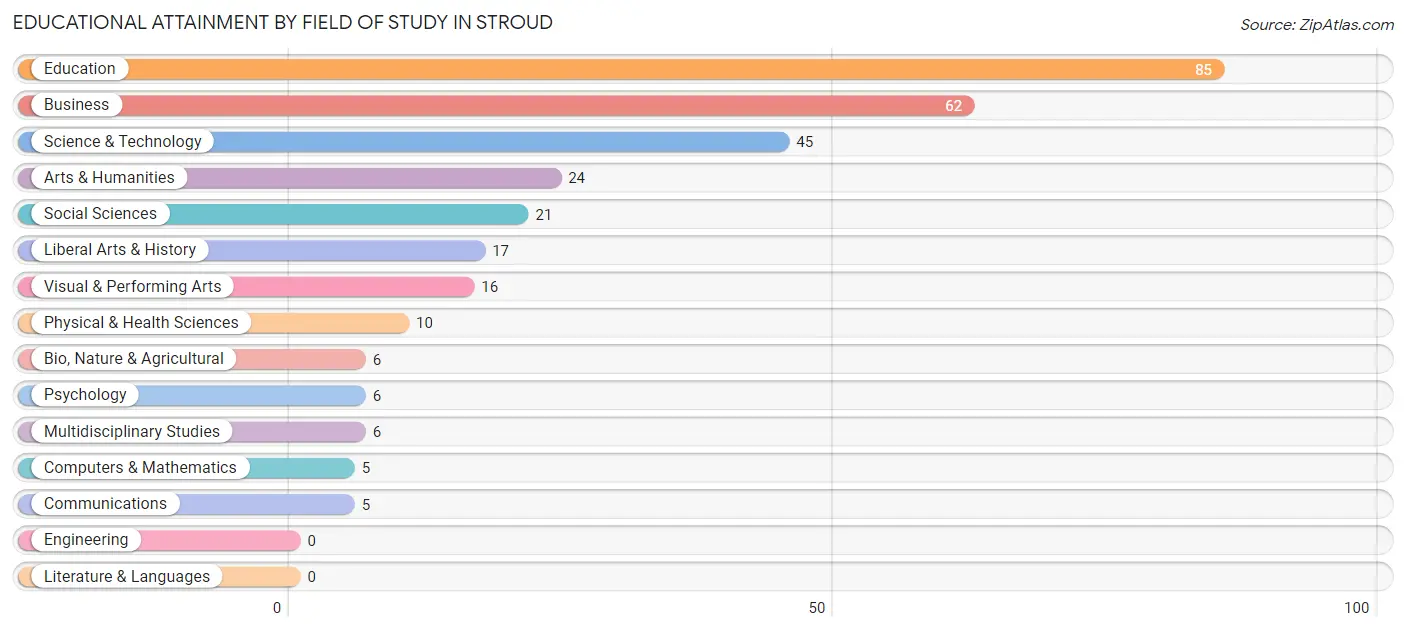
| Field of Study | # Graduates | % Graduates |
| Computers & Mathematics | 5 | 1.6% |
| Bio, Nature & Agricultural | 6 | 1.9% |
| Physical & Health Sciences | 10 | 3.3% |
| Psychology | 6 | 1.9% |
| Social Sciences | 21 | 6.8% |
| Engineering | 0 | 0.0% |
| Multidisciplinary Studies | 6 | 1.9% |
| Science & Technology | 45 | 14.6% |
| Business | 62 | 20.1% |
| Education | 85 | 27.6% |
| Literature & Languages | 0 | 0.0% |
| Liberal Arts & History | 17 | 5.5% |
| Visual & Performing Arts | 16 | 5.2% |
| Communications | 5 | 1.6% |
| Arts & Humanities | 24 | 7.8% |
| Total | 308 | 100.0% |
Transportation & Commute in Stroud
Vehicle Availability by Sex in Stroud
The most prevalent vehicle ownership categories in Stroud are males with 2 vehicles (267, accounting for 49.3%) and females with 2 vehicles (308, making up 43.8%).
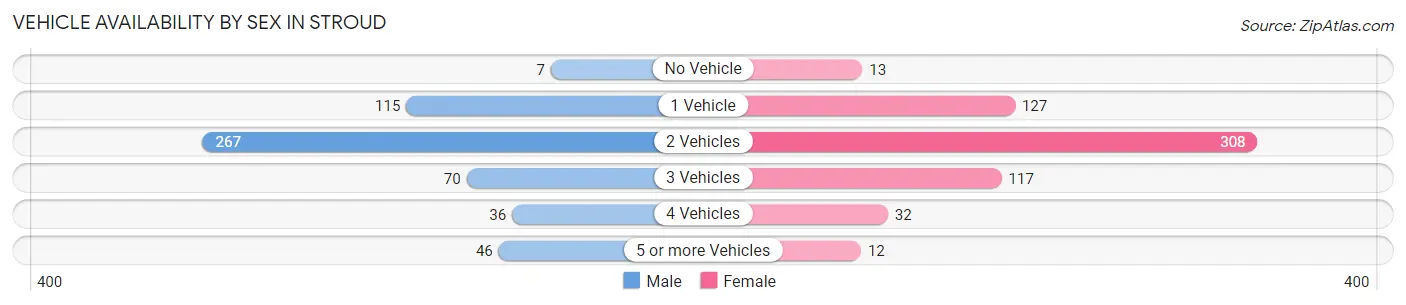
| Vehicles Available | Male | Female |
| No Vehicle | 7 (1.3%) | 13 (2.1%) |
| 1 Vehicle | 115 (21.3%) | 127 (20.8%) |
| 2 Vehicles | 267 (49.3%) | 308 (50.6%) |
| 3 Vehicles | 70 (12.9%) | 117 (19.2%) |
| 4 Vehicles | 36 (6.7%) | 32 (5.2%) |
| 5 or more Vehicles | 46 (8.5%) | 12 (2.0%) |
| Total | 541 (100.0%) | 609 (100.0%) |
Commute Time in Stroud
The most frequently occuring commute durations in Stroud are 5 to 9 minutes (307 commuters, 28.1%), less than 5 minutes (147 commuters, 13.5%), and 60 to 89 minutes (122 commuters, 11.2%).
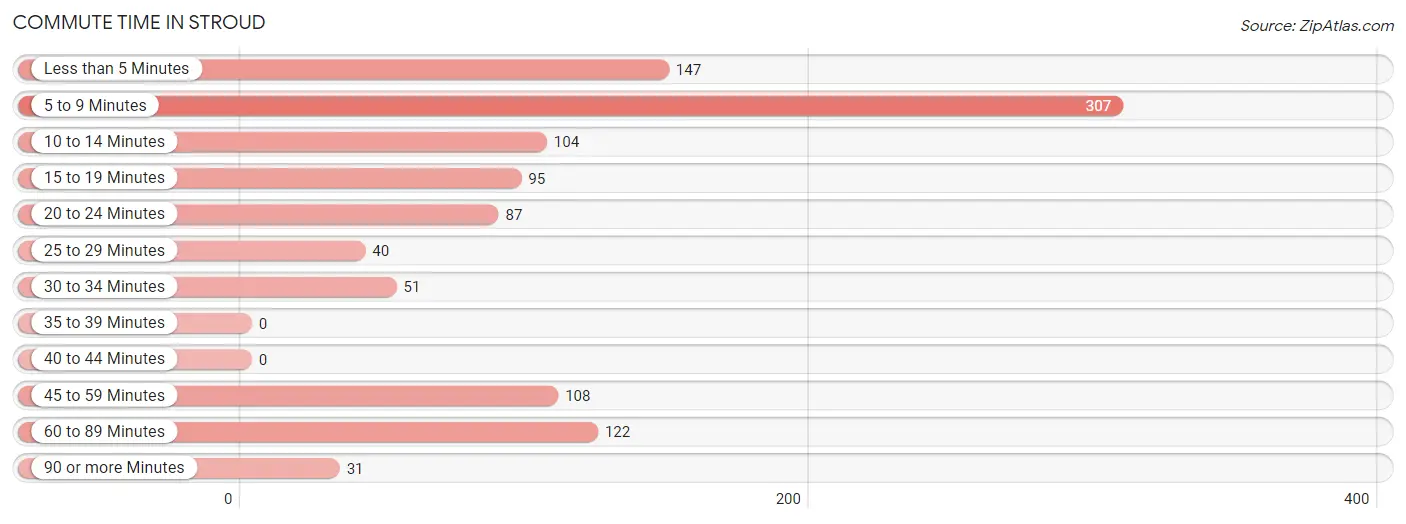
| Commute Time | # Commuters | % Commuters |
| Less than 5 Minutes | 147 | 13.5% |
| 5 to 9 Minutes | 307 | 28.1% |
| 10 to 14 Minutes | 104 | 9.5% |
| 15 to 19 Minutes | 95 | 8.7% |
| 20 to 24 Minutes | 87 | 8.0% |
| 25 to 29 Minutes | 40 | 3.7% |
| 30 to 34 Minutes | 51 | 4.7% |
| 35 to 39 Minutes | 0 | 0.0% |
| 40 to 44 Minutes | 0 | 0.0% |
| 45 to 59 Minutes | 108 | 9.9% |
| 60 to 89 Minutes | 122 | 11.2% |
| 90 or more Minutes | 31 | 2.8% |
Commute Time by Sex in Stroud
The most common commute times in Stroud are 5 to 9 minutes (106 commuters, 20.5%) for males and 5 to 9 minutes (201 commuters, 34.9%) for females.
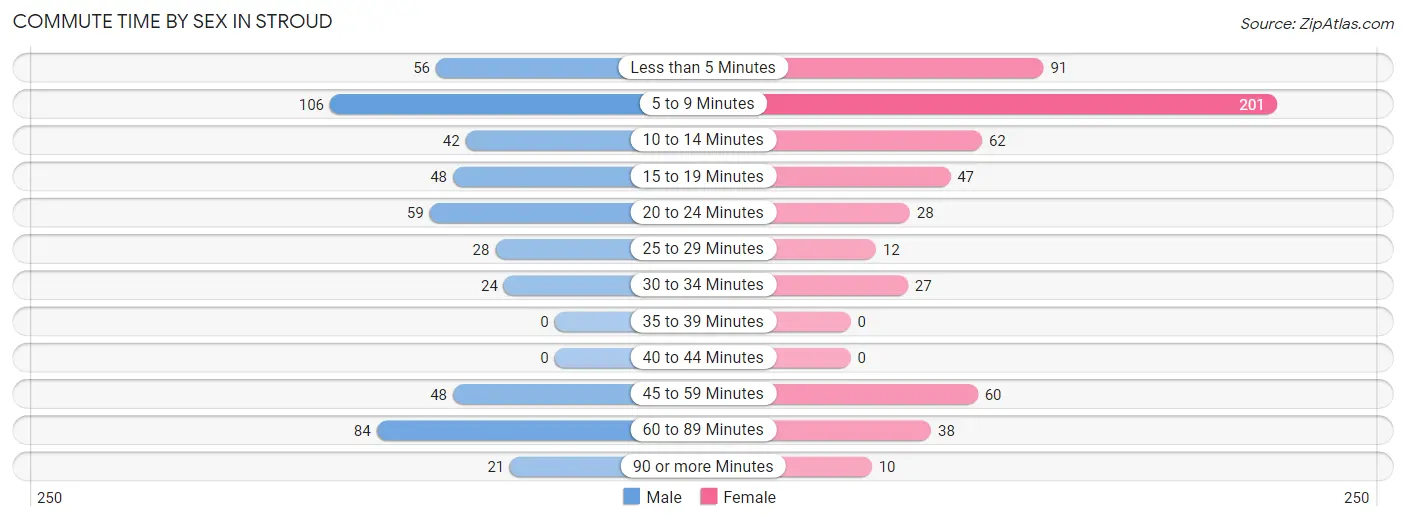
| Commute Time | Male | Female |
| Less than 5 Minutes | 56 (10.8%) | 91 (15.8%) |
| 5 to 9 Minutes | 106 (20.5%) | 201 (34.9%) |
| 10 to 14 Minutes | 42 (8.1%) | 62 (10.8%) |
| 15 to 19 Minutes | 48 (9.3%) | 47 (8.2%) |
| 20 to 24 Minutes | 59 (11.4%) | 28 (4.9%) |
| 25 to 29 Minutes | 28 (5.4%) | 12 (2.1%) |
| 30 to 34 Minutes | 24 (4.6%) | 27 (4.7%) |
| 35 to 39 Minutes | 0 (0.0%) | 0 (0.0%) |
| 40 to 44 Minutes | 0 (0.0%) | 0 (0.0%) |
| 45 to 59 Minutes | 48 (9.3%) | 60 (10.4%) |
| 60 to 89 Minutes | 84 (16.3%) | 38 (6.6%) |
| 90 or more Minutes | 21 (4.1%) | 10 (1.7%) |
Time of Departure to Work by Sex in Stroud
The most frequent times of departure to work in Stroud are 6:30 AM to 6:59 AM (139, 26.9%) for males and 7:30 AM to 7:59 AM (149, 25.9%) for females.
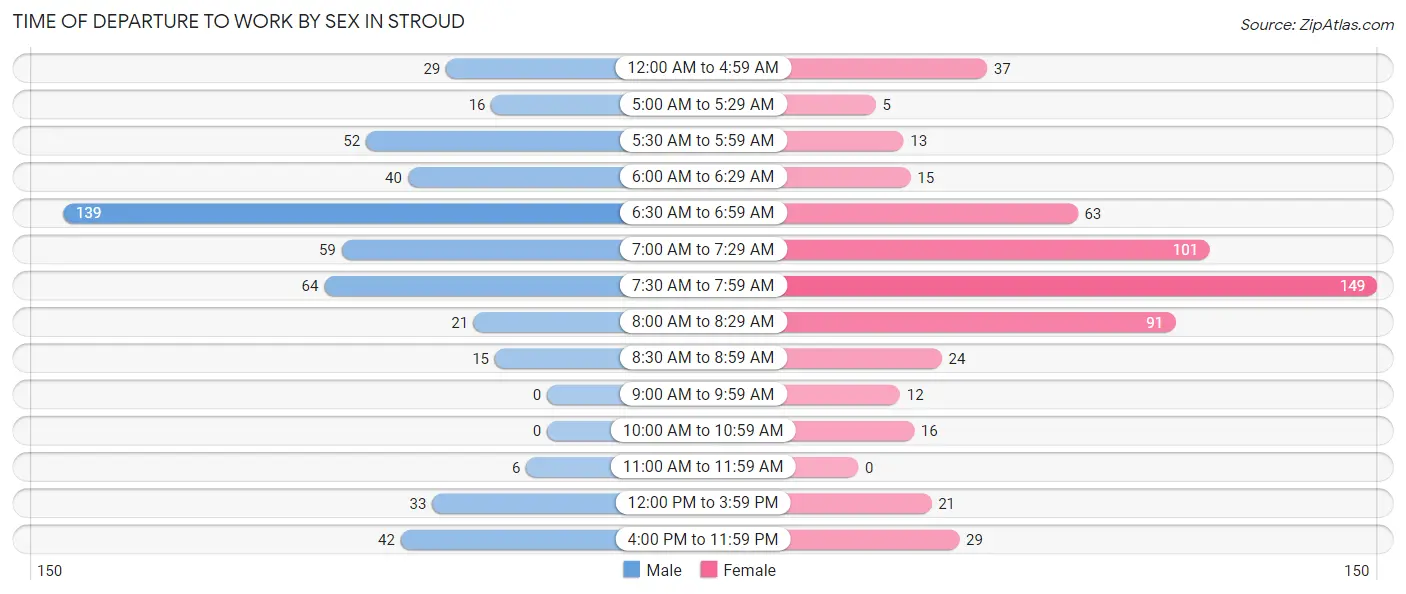
| Time of Departure | Male | Female |
| 12:00 AM to 4:59 AM | 29 (5.6%) | 37 (6.4%) |
| 5:00 AM to 5:29 AM | 16 (3.1%) | 5 (0.9%) |
| 5:30 AM to 5:59 AM | 52 (10.1%) | 13 (2.3%) |
| 6:00 AM to 6:29 AM | 40 (7.7%) | 15 (2.6%) |
| 6:30 AM to 6:59 AM | 139 (26.9%) | 63 (10.9%) |
| 7:00 AM to 7:29 AM | 59 (11.4%) | 101 (17.5%) |
| 7:30 AM to 7:59 AM | 64 (12.4%) | 149 (25.9%) |
| 8:00 AM to 8:29 AM | 21 (4.1%) | 91 (15.8%) |
| 8:30 AM to 8:59 AM | 15 (2.9%) | 24 (4.2%) |
| 9:00 AM to 9:59 AM | 0 (0.0%) | 12 (2.1%) |
| 10:00 AM to 10:59 AM | 0 (0.0%) | 16 (2.8%) |
| 11:00 AM to 11:59 AM | 6 (1.2%) | 0 (0.0%) |
| 12:00 PM to 3:59 PM | 33 (6.4%) | 21 (3.6%) |
| 4:00 PM to 11:59 PM | 42 (8.1%) | 29 (5.0%) |
| Total | 516 (100.0%) | 576 (100.0%) |
Housing Occupancy in Stroud
Occupancy by Ownership in Stroud
Of the total 1,057 dwellings in Stroud, owner-occupied units account for 705 (66.7%), while renter-occupied units make up 352 (33.3%).
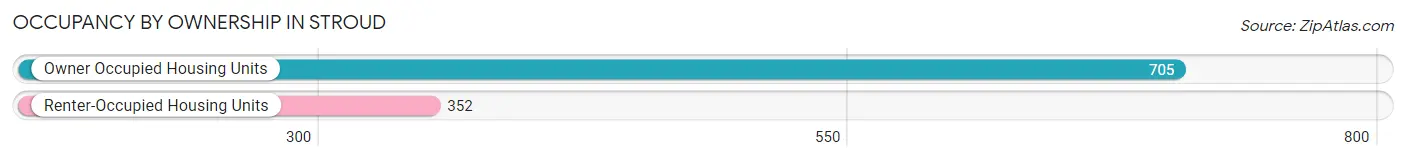
| Occupancy | # Housing Units | % Housing Units |
| Owner Occupied Housing Units | 705 | 66.7% |
| Renter-Occupied Housing Units | 352 | 33.3% |
| Total Occupied Housing Units | 1,057 | 100.0% |
Occupancy by Household Size in Stroud
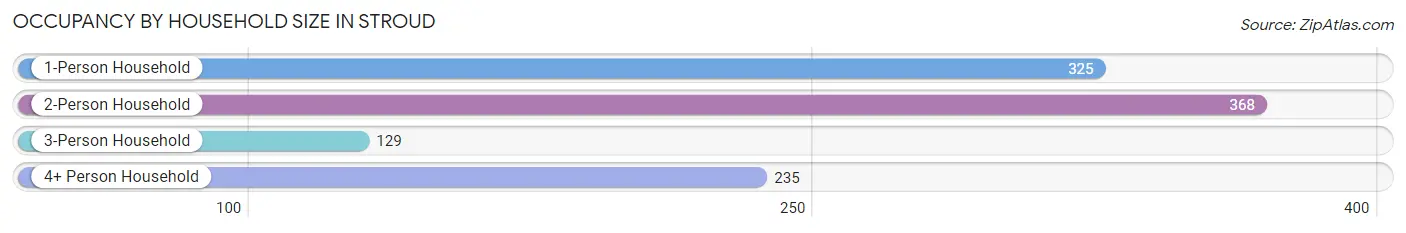
| Household Size | # Housing Units | % Housing Units |
| 1-Person Household | 325 | 30.7% |
| 2-Person Household | 368 | 34.8% |
| 3-Person Household | 129 | 12.2% |
| 4+ Person Household | 235 | 22.2% |
| Total Housing Units | 1,057 | 100.0% |
Occupancy by Ownership by Household Size in Stroud
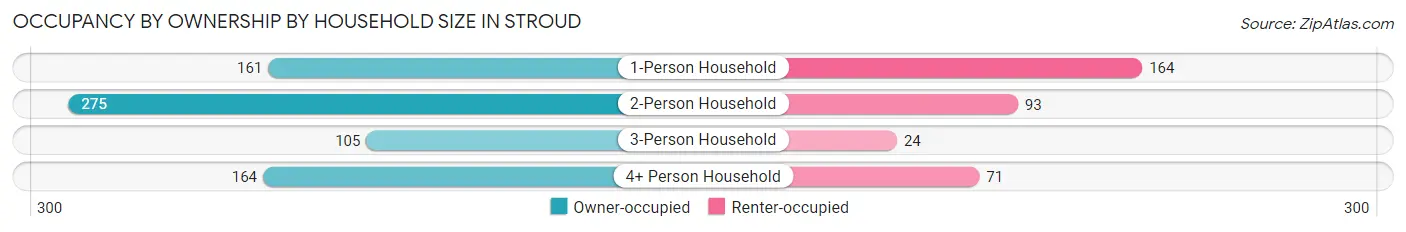
| Household Size | Owner-occupied | Renter-occupied |
| 1-Person Household | 161 (49.5%) | 164 (50.5%) |
| 2-Person Household | 275 (74.7%) | 93 (25.3%) |
| 3-Person Household | 105 (81.4%) | 24 (18.6%) |
| 4+ Person Household | 164 (69.8%) | 71 (30.2%) |
| Total Housing Units | 705 (66.7%) | 352 (33.3%) |
Occupancy by Educational Attainment in Stroud
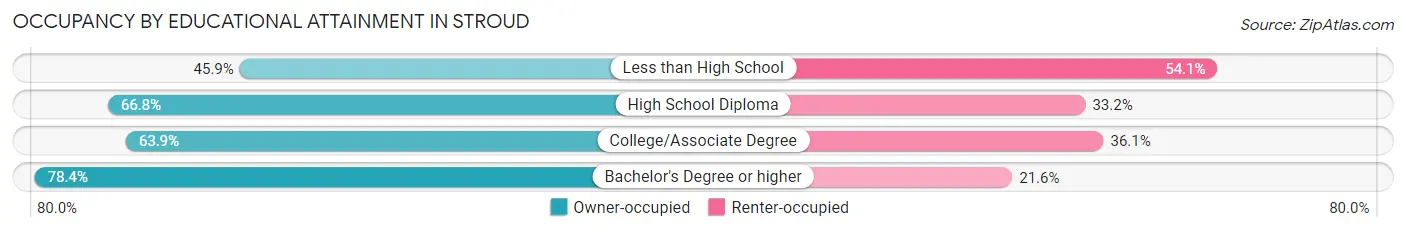
| Household Size | Owner-occupied | Renter-occupied |
| Less than High School | 28 (45.9%) | 33 (54.1%) |
| High School Diploma | 344 (66.8%) | 171 (33.2%) |
| College/Associate Degree | 195 (63.9%) | 110 (36.1%) |
| Bachelor's Degree or higher | 138 (78.4%) | 38 (21.6%) |
Occupancy by Age of Householder in Stroud
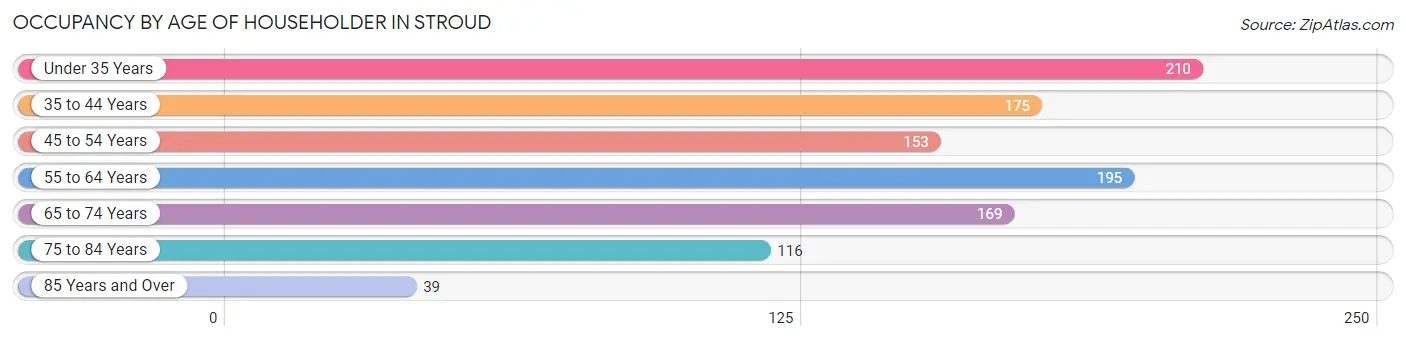
| Age Bracket | # Households | % Households |
| Under 35 Years | 210 | 19.9% |
| 35 to 44 Years | 175 | 16.6% |
| 45 to 54 Years | 153 | 14.5% |
| 55 to 64 Years | 195 | 18.4% |
| 65 to 74 Years | 169 | 16.0% |
| 75 to 84 Years | 116 | 11.0% |
| 85 Years and Over | 39 | 3.7% |
| Total | 1,057 | 100.0% |
Housing Finances in Stroud
Median Income by Occupancy in Stroud
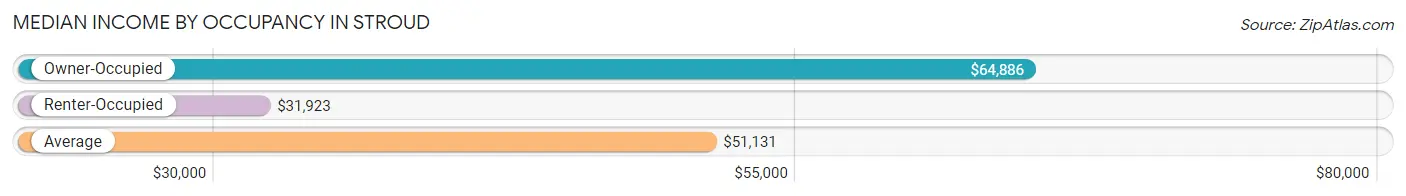
| Occupancy Type | # Households | Median Income |
| Owner-Occupied | 705 (66.7%) | $64,886 |
| Renter-Occupied | 352 (33.3%) | $31,923 |
| Average | 1,057 (100.0%) | $51,131 |
Occupancy by Householder Income Bracket in Stroud
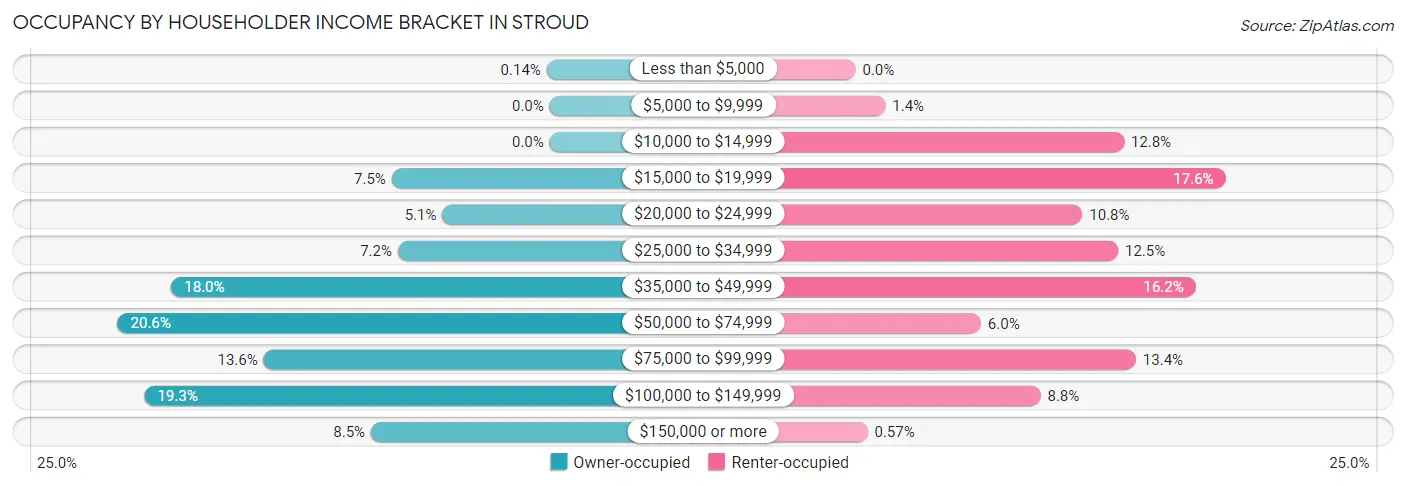
| Income Bracket | Owner-occupied | Renter-occupied |
| Less than $5,000 | 1 (0.1%) | 0 (0.0%) |
| $5,000 to $9,999 | 0 (0.0%) | 5 (1.4%) |
| $10,000 to $14,999 | 0 (0.0%) | 45 (12.8%) |
| $15,000 to $19,999 | 53 (7.5%) | 62 (17.6%) |
| $20,000 to $24,999 | 36 (5.1%) | 38 (10.8%) |
| $25,000 to $34,999 | 51 (7.2%) | 44 (12.5%) |
| $35,000 to $49,999 | 127 (18.0%) | 57 (16.2%) |
| $50,000 to $74,999 | 145 (20.6%) | 21 (6.0%) |
| $75,000 to $99,999 | 96 (13.6%) | 47 (13.4%) |
| $100,000 to $149,999 | 136 (19.3%) | 31 (8.8%) |
| $150,000 or more | 60 (8.5%) | 2 (0.6%) |
| Total | 705 (100.0%) | 352 (100.0%) |
Monthly Housing Cost Tiers in Stroud
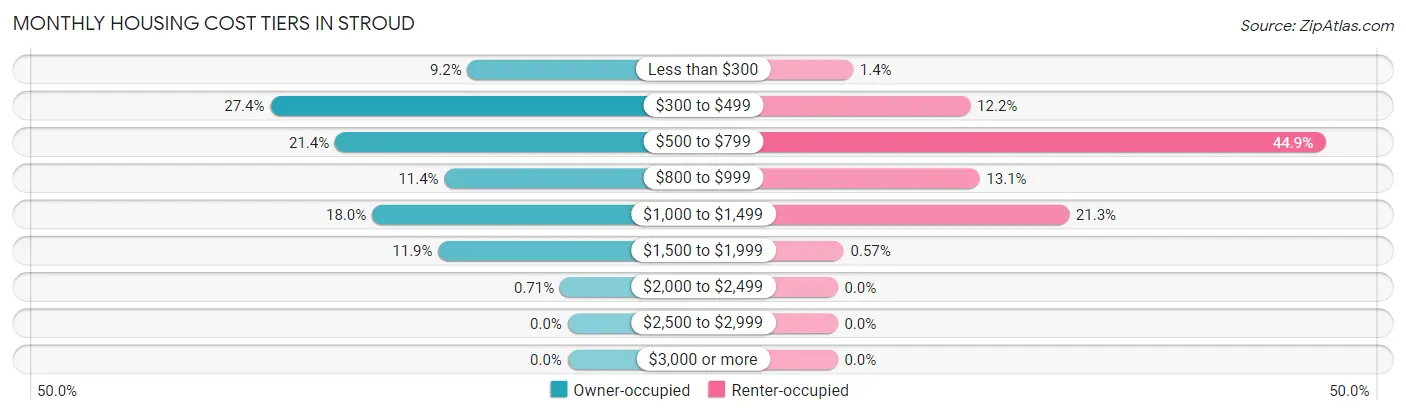
| Monthly Cost | Owner-occupied | Renter-occupied |
| Less than $300 | 65 (9.2%) | 5 (1.4%) |
| $300 to $499 | 193 (27.4%) | 43 (12.2%) |
| $500 to $799 | 151 (21.4%) | 158 (44.9%) |
| $800 to $999 | 80 (11.4%) | 46 (13.1%) |
| $1,000 to $1,499 | 127 (18.0%) | 75 (21.3%) |
| $1,500 to $1,999 | 84 (11.9%) | 2 (0.6%) |
| $2,000 to $2,499 | 5 (0.7%) | 0 (0.0%) |
| $2,500 to $2,999 | 0 (0.0%) | 0 (0.0%) |
| $3,000 or more | 0 (0.0%) | 0 (0.0%) |
| Total | 705 (100.0%) | 352 (100.0%) |
Physical Housing Characteristics in Stroud
Housing Structures in Stroud
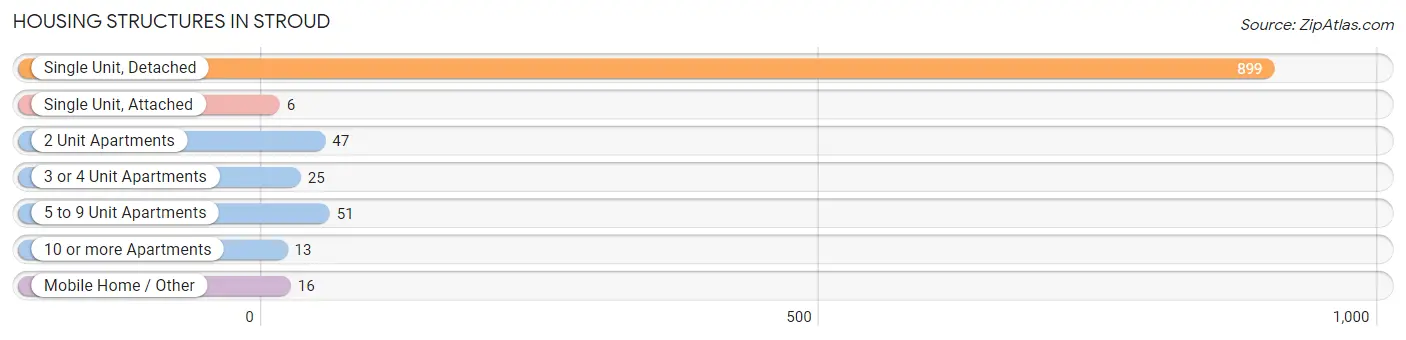
| Structure Type | # Housing Units | % Housing Units |
| Single Unit, Detached | 899 | 85.1% |
| Single Unit, Attached | 6 | 0.6% |
| 2 Unit Apartments | 47 | 4.4% |
| 3 or 4 Unit Apartments | 25 | 2.4% |
| 5 to 9 Unit Apartments | 51 | 4.8% |
| 10 or more Apartments | 13 | 1.2% |
| Mobile Home / Other | 16 | 1.5% |
| Total | 1,057 | 100.0% |
Housing Structures by Occupancy in Stroud
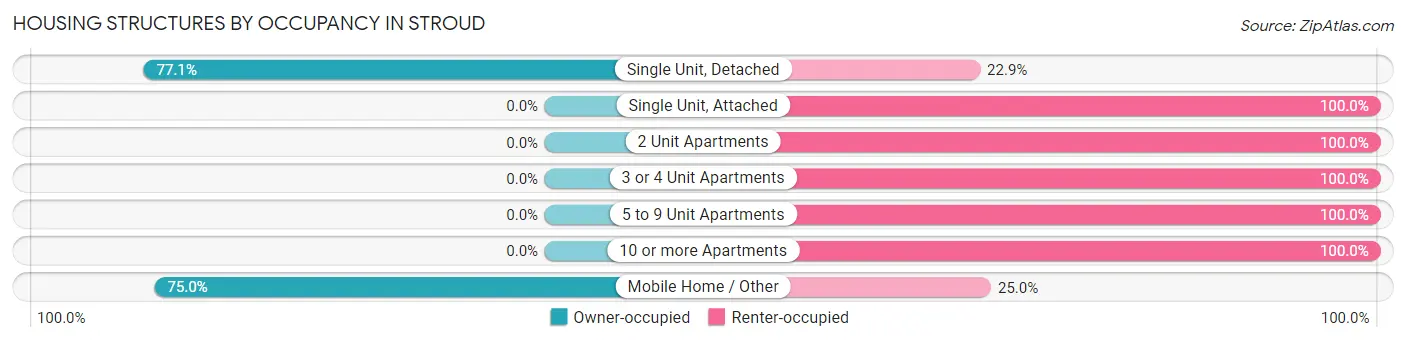
| Structure Type | Owner-occupied | Renter-occupied |
| Single Unit, Detached | 693 (77.1%) | 206 (22.9%) |
| Single Unit, Attached | 0 (0.0%) | 6 (100.0%) |
| 2 Unit Apartments | 0 (0.0%) | 47 (100.0%) |
| 3 or 4 Unit Apartments | 0 (0.0%) | 25 (100.0%) |
| 5 to 9 Unit Apartments | 0 (0.0%) | 51 (100.0%) |
| 10 or more Apartments | 0 (0.0%) | 13 (100.0%) |
| Mobile Home / Other | 12 (75.0%) | 4 (25.0%) |
| Total | 705 (66.7%) | 352 (33.3%) |
Housing Structures by Number of Rooms in Stroud
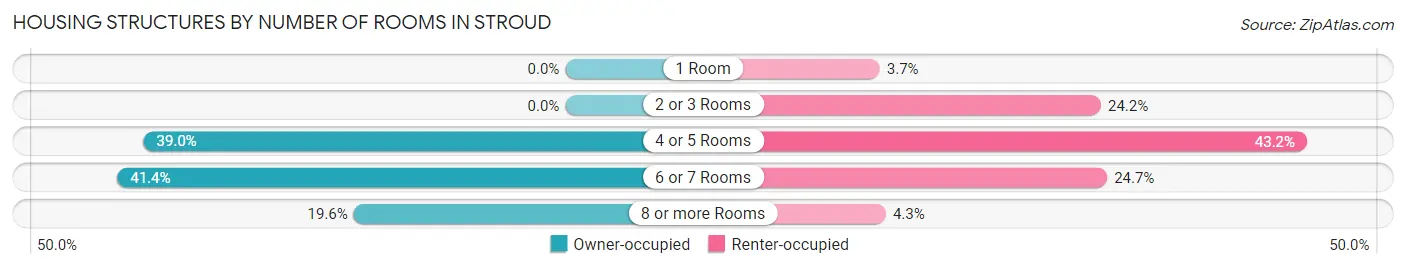
| Number of Rooms | Owner-occupied | Renter-occupied |
| 1 Room | 0 (0.0%) | 13 (3.7%) |
| 2 or 3 Rooms | 0 (0.0%) | 85 (24.1%) |
| 4 or 5 Rooms | 275 (39.0%) | 152 (43.2%) |
| 6 or 7 Rooms | 292 (41.4%) | 87 (24.7%) |
| 8 or more Rooms | 138 (19.6%) | 15 (4.3%) |
| Total | 705 (100.0%) | 352 (100.0%) |
Housing Structure by Heating Type in Stroud
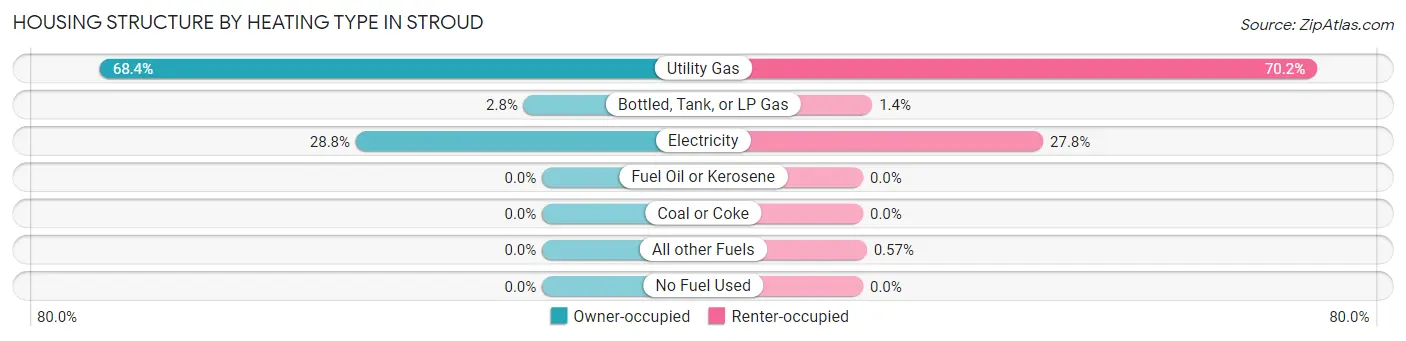
| Heating Type | Owner-occupied | Renter-occupied |
| Utility Gas | 482 (68.4%) | 247 (70.2%) |
| Bottled, Tank, or LP Gas | 20 (2.8%) | 5 (1.4%) |
| Electricity | 203 (28.8%) | 98 (27.8%) |
| Fuel Oil or Kerosene | 0 (0.0%) | 0 (0.0%) |
| Coal or Coke | 0 (0.0%) | 0 (0.0%) |
| All other Fuels | 0 (0.0%) | 2 (0.6%) |
| No Fuel Used | 0 (0.0%) | 0 (0.0%) |
| Total | 705 (100.0%) | 352 (100.0%) |
Household Vehicle Usage in Stroud
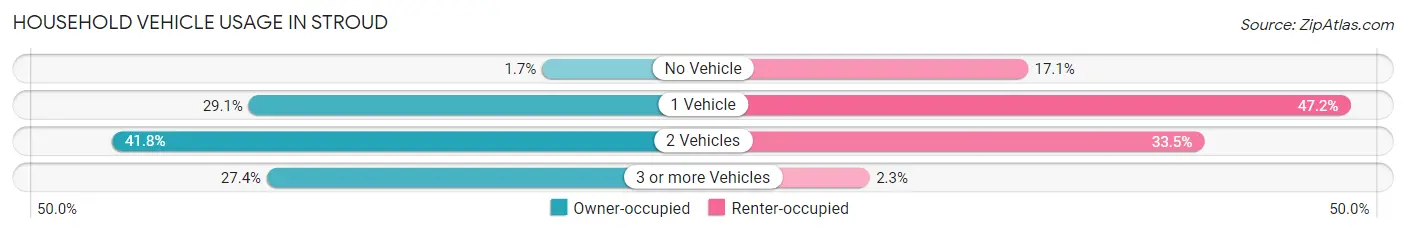
| Vehicles per Household | Owner-occupied | Renter-occupied |
| No Vehicle | 12 (1.7%) | 60 (17.1%) |
| 1 Vehicle | 205 (29.1%) | 166 (47.2%) |
| 2 Vehicles | 295 (41.8%) | 118 (33.5%) |
| 3 or more Vehicles | 193 (27.4%) | 8 (2.3%) |
| Total | 705 (100.0%) | 352 (100.0%) |
Real Estate & Mortgages in Stroud
Real Estate and Mortgage Overview in Stroud
| Characteristic | Without Mortgage | With Mortgage |
| Housing Units | 338 | 367 |
| Median Property Value | $90,700 | $118,500 |
| Median Household Income | $53,750 | $27 |
| Monthly Housing Costs | $399 | $0 |
| Real Estate Taxes | $509 | $51 |
Property Value by Mortgage Status in Stroud
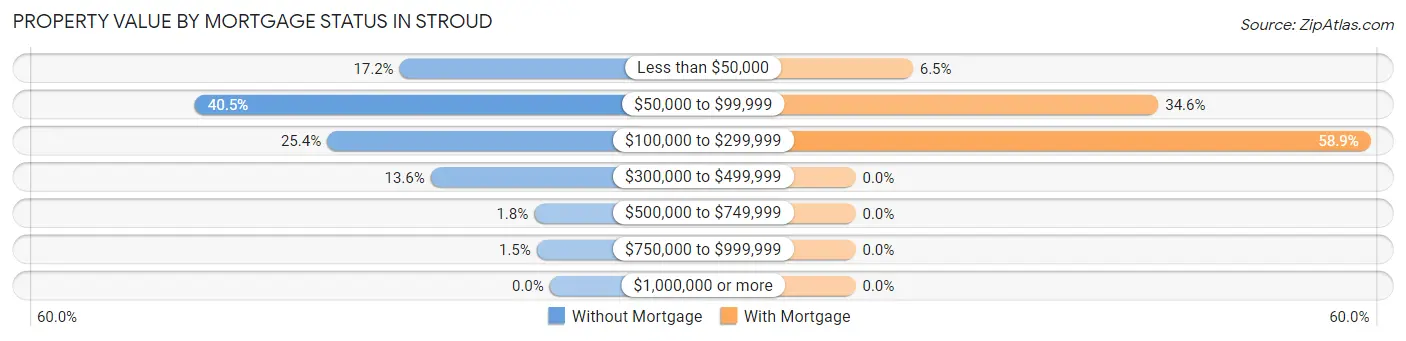
| Property Value | Without Mortgage | With Mortgage |
| Less than $50,000 | 58 (17.2%) | 24 (6.5%) |
| $50,000 to $99,999 | 137 (40.5%) | 127 (34.6%) |
| $100,000 to $299,999 | 86 (25.4%) | 216 (58.9%) |
| $300,000 to $499,999 | 46 (13.6%) | 0 (0.0%) |
| $500,000 to $749,999 | 6 (1.8%) | 0 (0.0%) |
| $750,000 to $999,999 | 5 (1.5%) | 0 (0.0%) |
| $1,000,000 or more | 0 (0.0%) | 0 (0.0%) |
| Total | 338 (100.0%) | 367 (100.0%) |
Household Income by Mortgage Status in Stroud
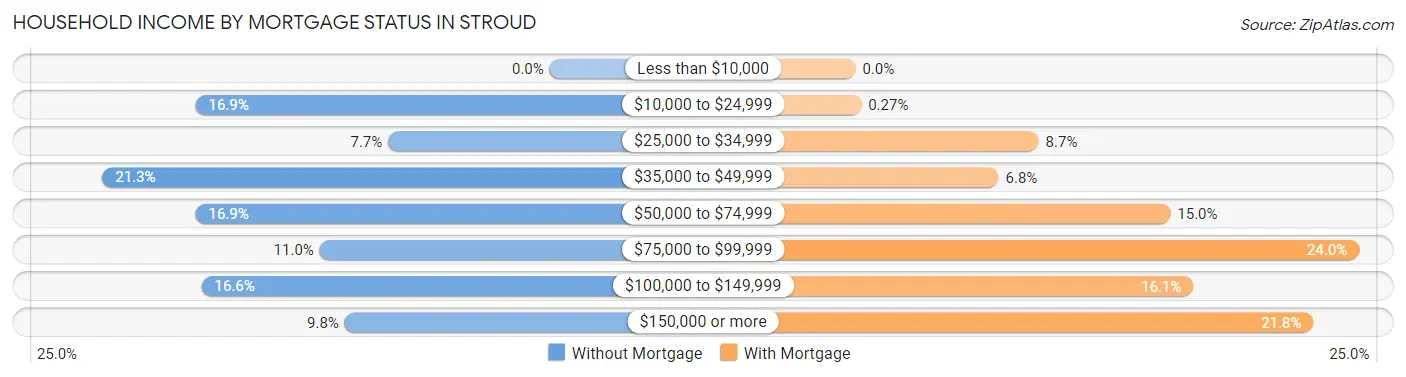
| Household Income | Without Mortgage | With Mortgage |
| Less than $10,000 | 0 (0.0%) | 0 (0.0%) |
| $10,000 to $24,999 | 57 (16.9%) | 1 (0.3%) |
| $25,000 to $34,999 | 26 (7.7%) | 32 (8.7%) |
| $35,000 to $49,999 | 72 (21.3%) | 25 (6.8%) |
| $50,000 to $74,999 | 57 (16.9%) | 55 (15.0%) |
| $75,000 to $99,999 | 37 (11.0%) | 88 (24.0%) |
| $100,000 to $149,999 | 56 (16.6%) | 59 (16.1%) |
| $150,000 or more | 33 (9.8%) | 80 (21.8%) |
| Total | 338 (100.0%) | 367 (100.0%) |
Property Value to Household Income Ratio in Stroud
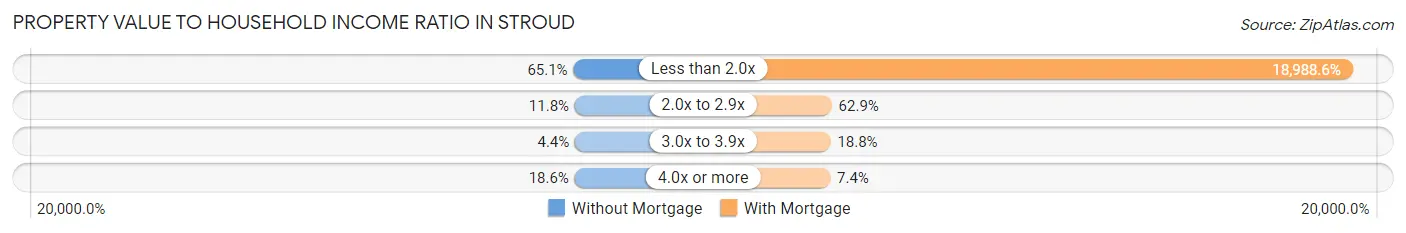
| Value-to-Income Ratio | Without Mortgage | With Mortgage |
| Less than 2.0x | 220 (65.1%) | 69,688 (18,988.6%) |
| 2.0x to 2.9x | 40 (11.8%) | 231 (62.9%) |
| 3.0x to 3.9x | 15 (4.4%) | 69 (18.8%) |
| 4.0x or more | 63 (18.6%) | 27 (7.4%) |
| Total | 338 (100.0%) | 367 (100.0%) |
Real Estate Taxes by Mortgage Status in Stroud
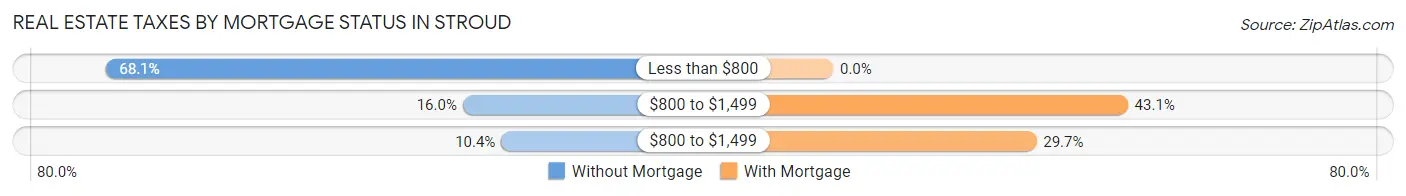
| Property Taxes | Without Mortgage | With Mortgage |
| Less than $800 | 230 (68.0%) | 0 (0.0%) |
| $800 to $1,499 | 54 (16.0%) | 158 (43.0%) |
| $800 to $1,499 | 35 (10.4%) | 109 (29.7%) |
| Total | 338 (100.0%) | 367 (100.0%) |
Health & Disability in Stroud
Health Insurance Coverage by Age in Stroud
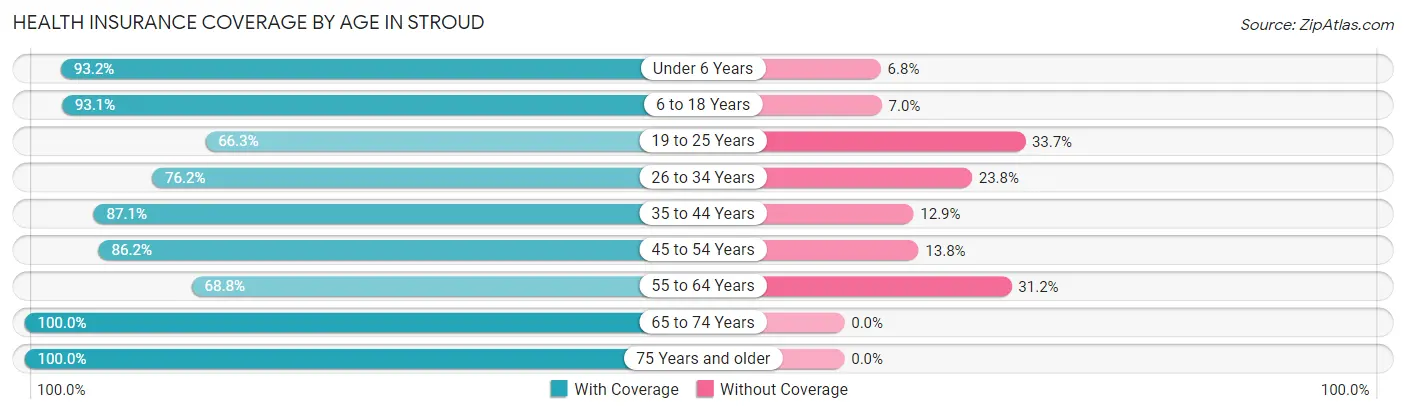
| Age Bracket | With Coverage | Without Coverage |
| Under 6 Years | 165 (93.2%) | 12 (6.8%) |
| 6 to 18 Years | 562 (93.0%) | 42 (7.0%) |
| 19 to 25 Years | 124 (66.3%) | 63 (33.7%) |
| 26 to 34 Years | 266 (76.2%) | 83 (23.8%) |
| 35 to 44 Years | 318 (87.1%) | 47 (12.9%) |
| 45 to 54 Years | 212 (86.2%) | 34 (13.8%) |
| 55 to 64 Years | 201 (68.8%) | 91 (31.2%) |
| 65 to 74 Years | 249 (100.0%) | 0 (0.0%) |
| 75 Years and older | 215 (100.0%) | 0 (0.0%) |
| Total | 2,312 (86.1%) | 372 (13.9%) |
Health Insurance Coverage by Citizenship Status in Stroud
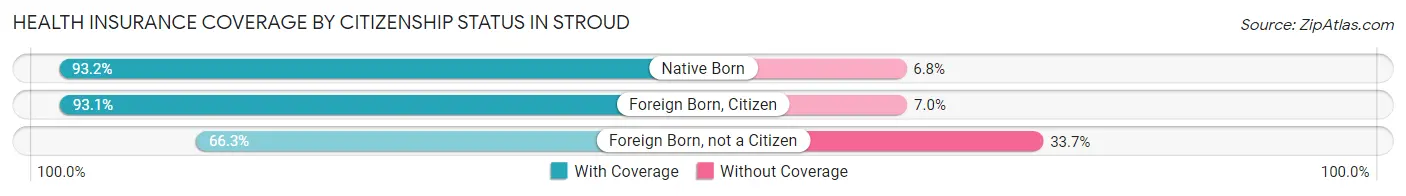
| Citizenship Status | With Coverage | Without Coverage |
| Native Born | 165 (93.2%) | 12 (6.8%) |
| Foreign Born, Citizen | 562 (93.0%) | 42 (7.0%) |
| Foreign Born, not a Citizen | 124 (66.3%) | 63 (33.7%) |
Health Insurance Coverage by Household Income in Stroud
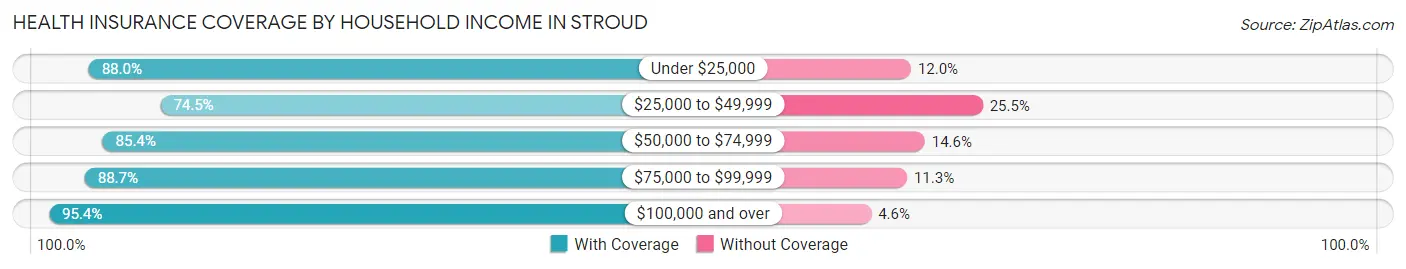
| Household Income | With Coverage | Without Coverage |
| Under $25,000 | 388 (88.0%) | 53 (12.0%) |
| $25,000 to $49,999 | 524 (74.5%) | 179 (25.5%) |
| $50,000 to $74,999 | 333 (85.4%) | 57 (14.6%) |
| $75,000 to $99,999 | 401 (88.7%) | 51 (11.3%) |
| $100,000 and over | 666 (95.4%) | 32 (4.6%) |
Public vs Private Health Insurance Coverage by Age in Stroud
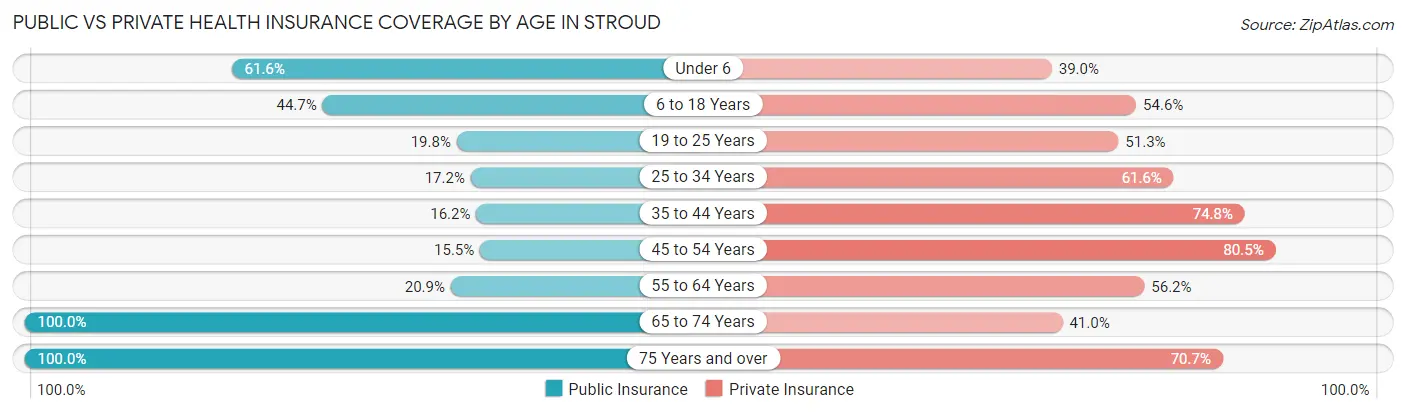
| Age Bracket | Public Insurance | Private Insurance |
| Under 6 | 109 (61.6%) | 69 (39.0%) |
| 6 to 18 Years | 270 (44.7%) | 330 (54.6%) |
| 19 to 25 Years | 37 (19.8%) | 96 (51.3%) |
| 25 to 34 Years | 60 (17.2%) | 215 (61.6%) |
| 35 to 44 Years | 59 (16.2%) | 273 (74.8%) |
| 45 to 54 Years | 38 (15.4%) | 198 (80.5%) |
| 55 to 64 Years | 61 (20.9%) | 164 (56.2%) |
| 65 to 74 Years | 249 (100.0%) | 102 (41.0%) |
| 75 Years and over | 215 (100.0%) | 152 (70.7%) |
| Total | 1,098 (40.9%) | 1,599 (59.6%) |
Disability Status by Sex by Age in Stroud
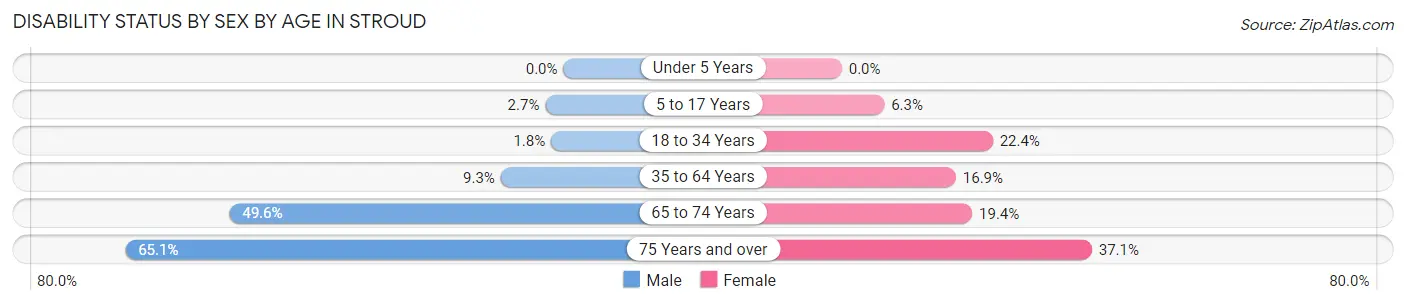
| Age Bracket | Male | Female |
| Under 5 Years | 0 (0.0%) | 0 (0.0%) |
| 5 to 17 Years | 9 (2.7%) | 17 (6.3%) |
| 18 to 34 Years | 5 (1.8%) | 67 (22.4%) |
| 35 to 64 Years | 39 (9.3%) | 82 (16.9%) |
| 65 to 74 Years | 62 (49.6%) | 24 (19.4%) |
| 75 Years and over | 54 (65.1%) | 49 (37.1%) |
Disability Class by Sex by Age in Stroud
Disability Class: Hearing Difficulty
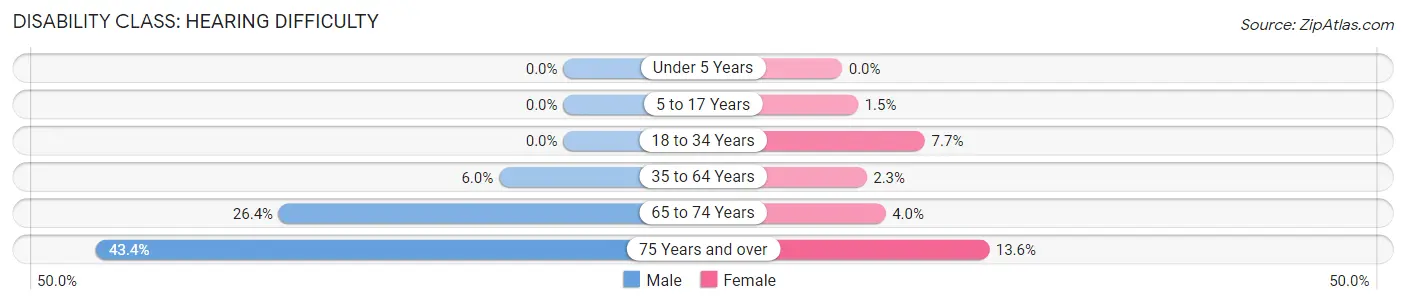
| Age Bracket | Male | Female |
| Under 5 Years | 0 (0.0%) | 0 (0.0%) |
| 5 to 17 Years | 0 (0.0%) | 4 (1.5%) |
| 18 to 34 Years | 0 (0.0%) | 23 (7.7%) |
| 35 to 64 Years | 25 (6.0%) | 11 (2.3%) |
| 65 to 74 Years | 33 (26.4%) | 5 (4.0%) |
| 75 Years and over | 36 (43.4%) | 18 (13.6%) |
Disability Class: Vision Difficulty
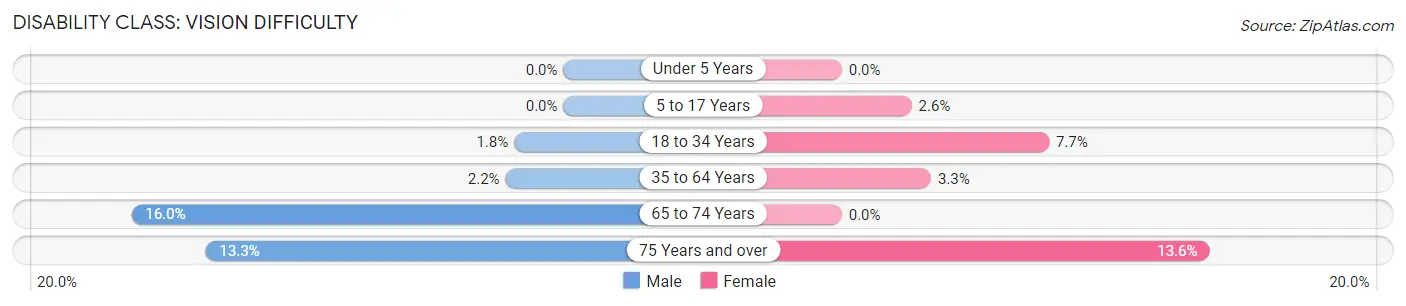
| Age Bracket | Male | Female |
| Under 5 Years | 0 (0.0%) | 0 (0.0%) |
| 5 to 17 Years | 0 (0.0%) | 7 (2.6%) |
| 18 to 34 Years | 5 (1.8%) | 23 (7.7%) |
| 35 to 64 Years | 9 (2.1%) | 16 (3.3%) |
| 65 to 74 Years | 20 (16.0%) | 0 (0.0%) |
| 75 Years and over | 11 (13.3%) | 18 (13.6%) |
Disability Class: Cognitive Difficulty
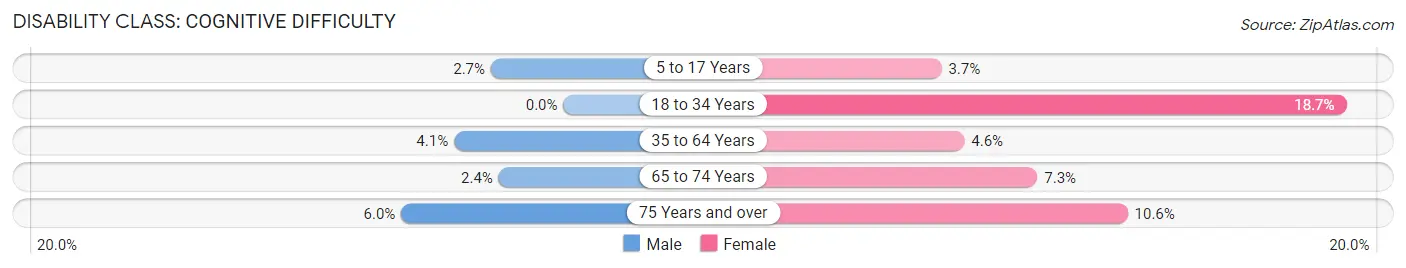
| Age Bracket | Male | Female |
| 5 to 17 Years | 9 (2.7%) | 10 (3.7%) |
| 18 to 34 Years | 0 (0.0%) | 56 (18.7%) |
| 35 to 64 Years | 17 (4.1%) | 22 (4.5%) |
| 65 to 74 Years | 3 (2.4%) | 9 (7.3%) |
| 75 Years and over | 5 (6.0%) | 14 (10.6%) |
Disability Class: Ambulatory Difficulty
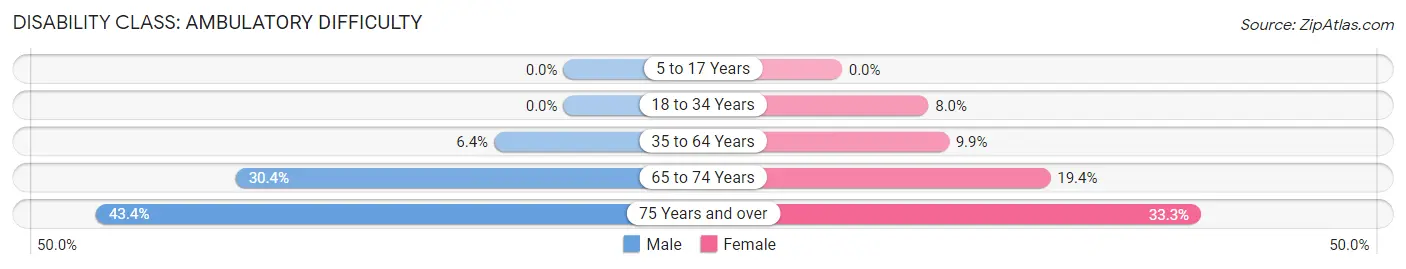
| Age Bracket | Male | Female |
| 5 to 17 Years | 0 (0.0%) | 0 (0.0%) |
| 18 to 34 Years | 0 (0.0%) | 24 (8.0%) |
| 35 to 64 Years | 27 (6.4%) | 48 (9.9%) |
| 65 to 74 Years | 38 (30.4%) | 24 (19.4%) |
| 75 Years and over | 36 (43.4%) | 44 (33.3%) |
Disability Class: Self-Care Difficulty
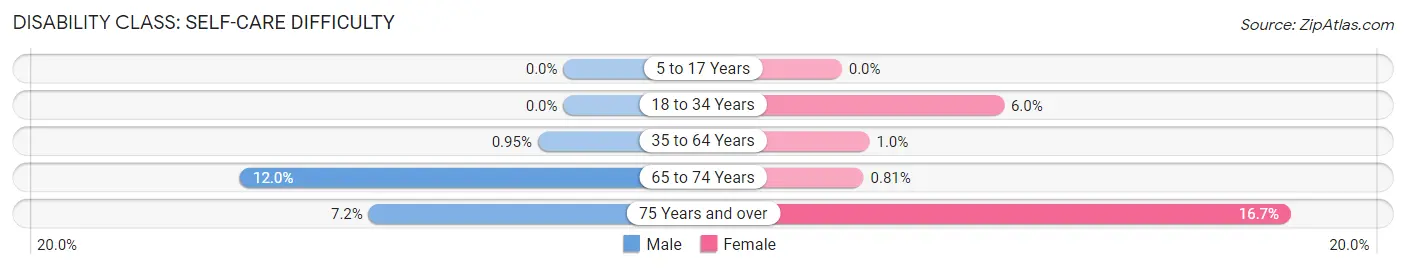
| Age Bracket | Male | Female |
| 5 to 17 Years | 0 (0.0%) | 0 (0.0%) |
| 18 to 34 Years | 0 (0.0%) | 18 (6.0%) |
| 35 to 64 Years | 4 (0.9%) | 5 (1.0%) |
| 65 to 74 Years | 15 (12.0%) | 1 (0.8%) |
| 75 Years and over | 6 (7.2%) | 22 (16.7%) |
Technology Access in Stroud
Computing Device Access in Stroud
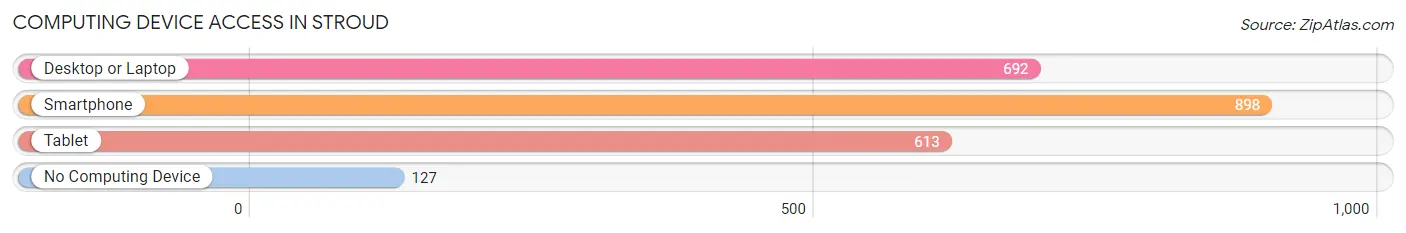
| Device Type | # Households | % Households |
| Desktop or Laptop | 692 | 65.5% |
| Smartphone | 898 | 85.0% |
| Tablet | 613 | 58.0% |
| No Computing Device | 127 | 12.0% |
| Total | 1,057 | 100.0% |
Internet Access in Stroud
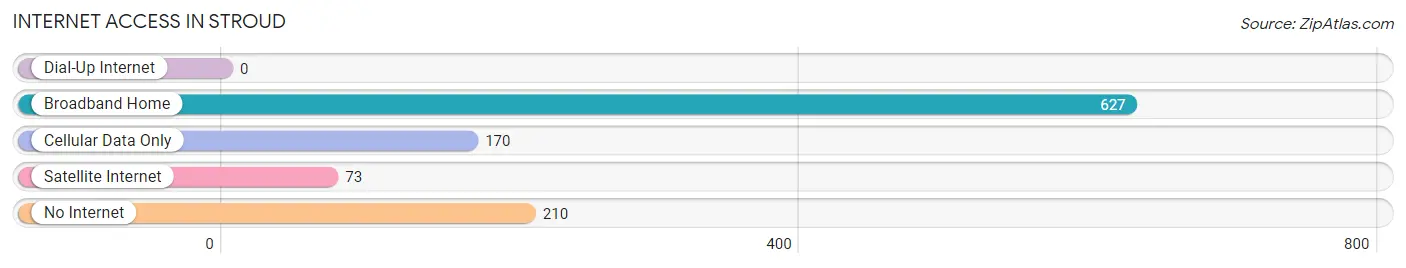
| Internet Type | # Households | % Households |
| Dial-Up Internet | 0 | 0.0% |
| Broadband Home | 627 | 59.3% |
| Cellular Data Only | 170 | 16.1% |
| Satellite Internet | 73 | 6.9% |
| No Internet | 210 | 19.9% |
| Total | 1,057 | 100.0% |
Stroud Summary
Stroud is a small town located in Lincoln County, Oklahoma, United States. It is situated along the banks of the Deep Fork River, approximately 40 miles east of Oklahoma City. The population was 2,685 at the 2010 census, an increase of 8.3 percent from 2,478 at the 2000 census.
History
Stroud was founded in 1891 by the Stroud family, who had moved to the area from Missouri. The town was named after the family, and the post office was established in 1892. The town was incorporated in 1901.
Stroud was a major stop on the St. Louis and San Francisco Railway, which ran through the town from 1901 to 1932. The railroad brought economic growth to the area, and Stroud became a center for the cattle industry. The town also had a large cotton gin, a flour mill, and a brick factory.
Geography
Stroud is located at 35°45'25" North, 96°41'17" West (35.756944, -96.688056). According to the United States Census Bureau, the town has a total area of 2.2 square miles (5.7 km2), all land.
Economy
Stroud's economy is largely based on agriculture. The town is home to several large farms, as well as a number of smaller family-owned farms. The town is also home to several businesses, including a grocery store, a hardware store, a bank, and a few restaurants.
Demographics
As of the census of 2000, there were 2,478 people, 990 households, and 690 families residing in the town. The population density was 1,097.2 people per square mile (423.7/km2). There were 1,093 housing units at an average density of 476.2 per square mile (183.9/km2). The racial makeup of the town was 81.2% White, 0.6% African American, 11.7% Native American, 0.2% Asian, 0.1% Pacific Islander, 0.2% from other races, and 6.0% from two or more races. Hispanic or Latino of any race were 1.7% of the population.
There were 990 households, out of which 33.2% had children under the age of 18 living with them, 54.7% were married couples living together, 11.7% had a female householder with no husband present, and 29.3% were non-families. 25.7% of all households were made up of individuals, and 13.2% had someone living alone who was 65 years of age or older. The average household size was 2.50 and the average family size was 3.00.
In the town, the population was spread out, with 26.2% under the age of 18, 8.2% from 18 to 24, 26.2% from 25 to 44, 22.7% from 45 to 64, and 16.7% who were 65 years of age or older. The median age was 38 years. For every 100 females, there were 91.2 males. For every 100 females age 18 and over, there were 86.7 males.
The median income for a household in the town was $27,917, and the median income for a family was $32,917. Males had a median income of $27,500 versus $20,000 for females. The per capita income for the town was $14,845. About 13.2% of families and 16.2% of the population were below the poverty line, including 22.2% of those under age 18 and 14.2% of those age 65 or over.
Common Questions
What is Per Capita Income in Stroud?
Per Capita income in Stroud is $27,993.
What is the Median Family Income in Stroud?
Median Family Income in Stroud is $59,297.
What is the Median Household income in Stroud?
Median Household Income in Stroud is $51,131.
What is Income or Wage Gap in Stroud?
Income or Wage Gap in Stroud is 32.5%.
Women in Stroud earn 67.5 cents for every dollar earned by a man.
What is Family Income Deficit in Stroud?
Family Income Deficit in Stroud is $7,369.
Families that are below poverty line in Stroud earn $7,369 less on average than the poverty threshold level.
What is Inequality or Gini Index in Stroud?
Inequality or Gini Index in Stroud is 0.41.
What is the Total Population of Stroud?
Total Population of Stroud is 2,748.
What is the Total Male Population of Stroud?
Total Male Population of Stroud is 1,316.
What is the Total Female Population of Stroud?
Total Female Population of Stroud is 1,432.
What is the Ratio of Males per 100 Females in Stroud?
There are 91.90 Males per 100 Females in Stroud.
What is the Ratio of Females per 100 Males in Stroud?
There are 108.81 Females per 100 Males in Stroud.
What is the Median Population Age in Stroud?
Median Population Age in Stroud is 36.3 Years.
What is the Average Family Size in Stroud
Average Family Size in Stroud is 3.2 People.
What is the Average Household Size in Stroud
Average Household Size in Stroud is 2.5 People.
How Large is the Labor Force in Stroud?
There are 1,260 People in the Labor Forcein in Stroud.
What is the Percentage of People in the Labor Force in Stroud?
61.0% of People are in the Labor Force in Stroud.
What is the Unemployment Rate in Stroud?
Unemployment Rate in Stroud is 8.3%.