Zip Codes with the Highest Percentage of Population with a Degree in Education in Kentucky
RELATED REPORTS & OPTIONS
Education
Kentucky
Compare Zip Codes
Map of Zip Codes with the Highest Percentage of Population with a Degree in Education in Kentucky
40.0%
100.0%
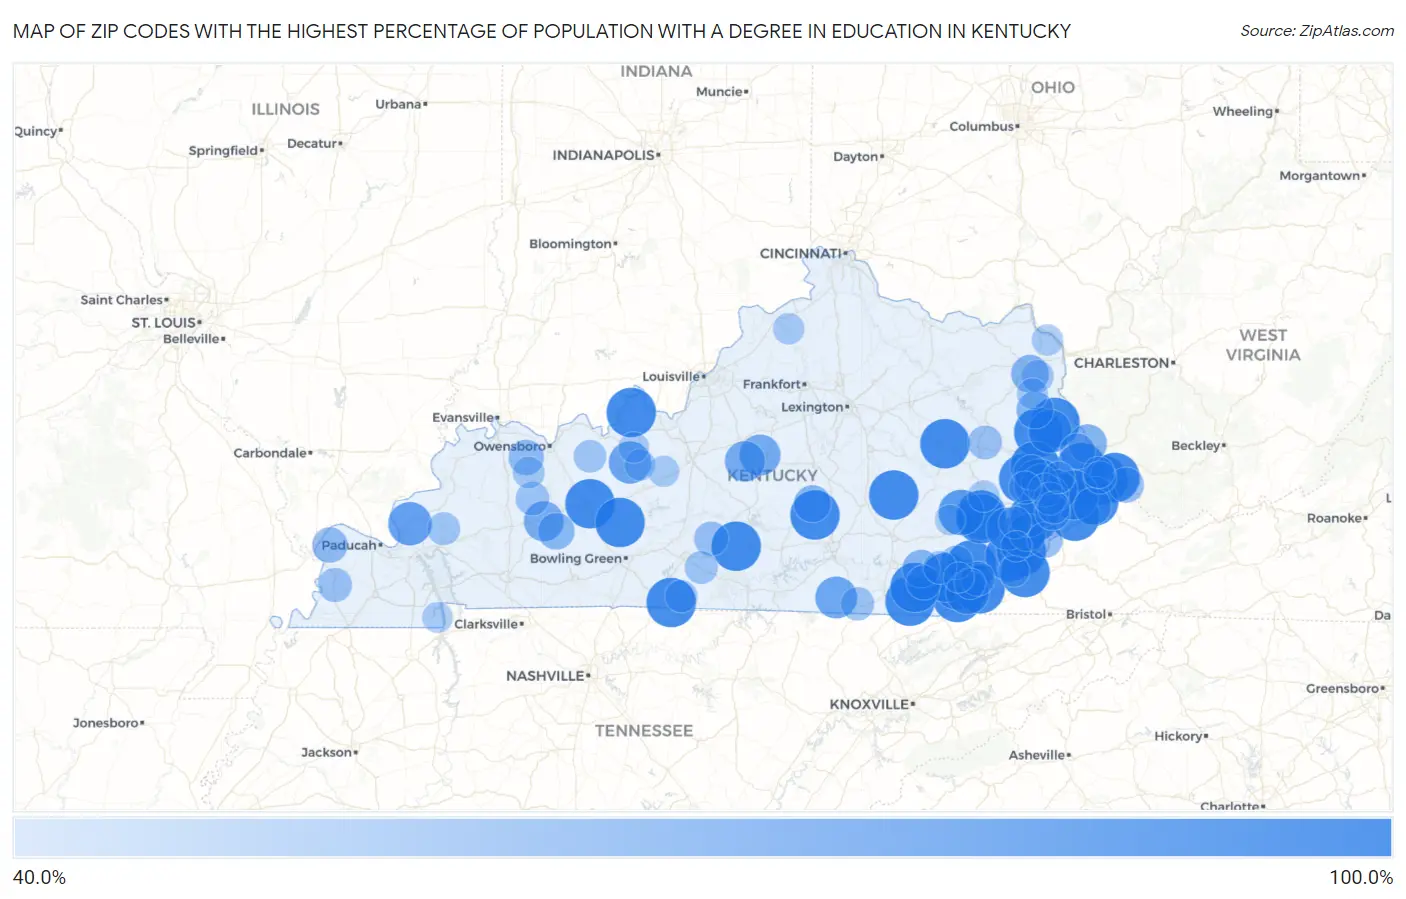
Zip Codes with the Highest Percentage of Population with a Degree in Education in Kentucky
| Zip Code | % Graduates | vs State | vs National | |
| 1. | 41555 | 100.0% | 15.0% (+85.0)#1 | 11.1% (+88.9)#9 |
| 2. | 40819 | 100.0% | 15.0% (+85.0)#2 | 11.1% (+88.9)#18 |
| 3. | 40856 | 100.0% | 15.0% (+85.0)#3 | 11.1% (+88.9)#23 |
| 4. | 42333 | 100.0% | 15.0% (+85.0)#4 | 11.1% (+88.9)#29 |
| 5. | 41264 | 100.0% | 15.0% (+85.0)#5 | 11.1% (+88.9)#32 |
| 6. | 40845 | 100.0% | 15.0% (+85.0)#6 | 11.1% (+88.9)#35 |
| 7. | 41571 | 100.0% | 15.0% (+85.0)#7 | 11.1% (+88.9)#56 |
| 8. | 40902 | 100.0% | 15.0% (+85.0)#8 | 11.1% (+88.9)#59 |
| 9. | 41274 | 100.0% | 15.0% (+85.0)#9 | 11.1% (+88.9)#63 |
| 10. | 41754 | 100.0% | 15.0% (+85.0)#10 | 11.1% (+88.9)#67 |
| 11. | 40840 | 100.0% | 15.0% (+85.0)#11 | 11.1% (+88.9)#69 |
| 12. | 41360 | 100.0% | 15.0% (+85.0)#12 | 11.1% (+88.9)#73 |
| 13. | 40763 | 100.0% | 15.0% (+85.0)#13 | 11.1% (+88.9)#74 |
| 14. | 41632 | 100.0% | 15.0% (+85.0)#14 | 11.1% (+88.9)#75 |
| 15. | 41528 | 100.0% | 15.0% (+85.0)#15 | 11.1% (+88.9)#89 |
| 16. | 42566 | 100.0% | 15.0% (+85.0)#16 | 11.1% (+88.9)#91 |
| 17. | 41607 | 100.0% | 15.0% (+85.0)#17 | 11.1% (+88.9)#92 |
| 18. | 41540 | 100.0% | 15.0% (+85.0)#18 | 11.1% (+88.9)#95 |
| 19. | 41843 | 100.0% | 15.0% (+85.0)#19 | 11.1% (+88.9)#104 |
| 20. | 40830 | 100.0% | 15.0% (+85.0)#20 | 11.1% (+88.9)#119 |
| 21. | 41819 | 100.0% | 15.0% (+85.0)#21 | 11.1% (+88.9)#128 |
| 22. | 40481 | 100.0% | 15.0% (+85.0)#22 | 11.1% (+88.9)#138 |
| 23. | 40161 | 100.0% | 15.0% (+85.0)#23 | 11.1% (+88.9)#161 |
| 24. | 41534 | 100.0% | 15.0% (+85.0)#24 | 11.1% (+88.9)#166 |
| 25. | 40921 | 100.0% | 15.0% (+85.0)#25 | 11.1% (+88.9)#172 |
| 26. | 41833 | 100.0% | 15.0% (+85.0)#26 | 11.1% (+88.9)#184 |
| 27. | 42252 | 100.0% | 15.0% (+85.0)#27 | 11.1% (+88.9)#188 |
| 28. | 42742 | 100.0% | 15.0% (+85.0)#28 | 11.1% (+88.9)#220 |
| 29. | 41778 | 100.0% | 15.0% (+85.0)#29 | 11.1% (+88.9)#226 |
| 30. | 41622 | 100.0% | 15.0% (+85.0)#30 | 11.1% (+88.9)#229 |
| 31. | 42153 | 100.0% | 15.0% (+85.0)#31 | 11.1% (+88.9)#231 |
| 32. | 40843 | 100.0% | 15.0% (+85.0)#32 | 11.1% (+88.9)#248 |
| 33. | 41526 | 100.0% | 15.0% (+85.0)#33 | 11.1% (+88.9)#263 |
| 34. | 41721 | 88.2% | 15.0% (+73.3)#34 | 11.1% (+77.2)#333 |
| 35. | 41832 | 85.1% | 15.0% (+70.1)#35 | 11.1% (+74.0)#361 |
| 36. | 41862 | 82.6% | 15.0% (+67.6)#36 | 11.1% (+71.5)#369 |
| 37. | 42028 | 82.4% | 15.0% (+67.4)#37 | 11.1% (+71.3)#372 |
| 38. | 40863 | 81.8% | 15.0% (+66.9)#38 | 11.1% (+70.8)#376 |
| 39. | 41254 | 81.6% | 15.0% (+66.7)#39 | 11.1% (+70.6)#381 |
| 40. | 41760 | 79.1% | 15.0% (+64.1)#40 | 11.1% (+68.0)#403 |
| 41. | 40178 | 79.0% | 15.0% (+64.0)#41 | 11.1% (+67.9)#404 |
| 42. | 42647 | 77.6% | 15.0% (+62.6)#42 | 11.1% (+66.5)#422 |
| 43. | 40061 | 75.0% | 15.0% (+60.0)#43 | 11.1% (+63.9)#451 |
| 44. | 40049 | 73.0% | 15.0% (+58.0)#44 | 11.1% (+61.9)#478 |
| 45. | 41631 | 72.8% | 15.0% (+57.9)#45 | 11.1% (+61.8)#480 |
| 46. | 42367 | 71.9% | 15.0% (+56.9)#46 | 11.1% (+60.9)#490 |
| 47. | 41231 | 68.8% | 15.0% (+53.9)#47 | 11.1% (+57.8)#526 |
| 48. | 41146 | 65.6% | 15.0% (+50.7)#48 | 11.1% (+54.6)#593 |
| 49. | 40923 | 65.5% | 15.0% (+50.5)#49 | 11.1% (+54.4)#601 |
| 50. | 41513 | 64.7% | 15.0% (+49.7)#50 | 11.1% (+53.6)#615 |
| 51. | 41647 | 64.6% | 15.0% (+49.6)#51 | 11.1% (+53.5)#620 |
| 52. | 41826 | 64.3% | 15.0% (+49.3)#52 | 11.1% (+53.2)#626 |
| 53. | 41124 | 63.9% | 15.0% (+48.9)#53 | 11.1% (+52.8)#645 |
| 54. | 42541 | 63.4% | 15.0% (+48.4)#54 | 11.1% (+52.4)#654 |
| 55. | 42321 | 62.5% | 15.0% (+47.5)#55 | 11.1% (+51.4)#673 |
| 56. | 41645 | 62.4% | 15.0% (+47.5)#56 | 11.1% (+51.4)#680 |
| 57. | 41836 | 62.1% | 15.0% (+47.2)#57 | 11.1% (+51.1)#687 |
| 58. | 41250 | 59.5% | 15.0% (+44.6)#58 | 11.1% (+48.5)#767 |
| 59. | 42356 | 59.3% | 15.0% (+44.3)#59 | 11.1% (+48.2)#771 |
| 60. | 41837 | 59.3% | 15.0% (+44.3)#60 | 11.1% (+48.2)#772 |
| 61. | 42024 | 59.0% | 15.0% (+44.0)#61 | 11.1% (+47.9)#784 |
| 62. | 41667 | 58.8% | 15.0% (+43.9)#62 | 11.1% (+47.8)#789 |
| 63. | 41568 | 58.7% | 15.0% (+43.8)#63 | 11.1% (+47.7)#791 |
| 64. | 41616 | 58.3% | 15.0% (+43.4)#64 | 11.1% (+47.3)#801 |
| 65. | 40903 | 56.4% | 15.0% (+41.4)#65 | 11.1% (+45.4)#871 |
| 66. | 42214 | 55.9% | 15.0% (+40.9)#66 | 11.1% (+44.8)#890 |
| 67. | 40854 | 55.8% | 15.0% (+40.8)#67 | 11.1% (+44.8)#891 |
| 68. | 42021 | 54.9% | 15.0% (+40.0)#68 | 11.1% (+43.9)#923 |
| 69. | 41408 | 54.3% | 15.0% (+39.4)#69 | 11.1% (+43.3)#953 |
| 70. | 42372 | 53.7% | 15.0% (+38.8)#70 | 11.1% (+42.7)#975 |
| 71. | 40913 | 53.5% | 15.0% (+38.5)#71 | 11.1% (+42.4)#991 |
| 72. | 42635 | 53.4% | 15.0% (+38.4)#72 | 11.1% (+42.3)#994 |
| 73. | 41651 | 52.9% | 15.0% (+38.0)#73 | 11.1% (+41.9)#1,013 |
| 74. | 40982 | 52.3% | 15.0% (+37.3)#74 | 11.1% (+41.2)#1,045 |
| 75. | 42411 | 51.7% | 15.0% (+36.8)#75 | 11.1% (+40.7)#1,066 |
| 76. | 42130 | 51.7% | 15.0% (+36.8)#76 | 11.1% (+40.7)#1,067 |
| 77. | 41636 | 51.1% | 15.0% (+36.1)#77 | 11.1% (+40.0)#1,093 |
| 78. | 42368 | 50.9% | 15.0% (+36.0)#78 | 11.1% (+39.9)#1,100 |
| 79. | 42133 | 50.3% | 15.0% (+35.3)#79 | 11.1% (+39.2)#1,132 |
| 80. | 41773 | 50.0% | 15.0% (+35.0)#80 | 11.1% (+38.9)#1,143 |
| 81. | 41640 | 50.0% | 15.0% (+35.0)#81 | 11.1% (+38.9)#1,148 |
| 82. | 41543 | 50.0% | 15.0% (+35.0)#82 | 11.1% (+38.9)#1,163 |
| 83. | 41132 | 50.0% | 15.0% (+35.0)#83 | 11.1% (+38.9)#1,166 |
| 84. | 41650 | 50.0% | 15.0% (+35.0)#84 | 11.1% (+38.9)#1,171 |
| 85. | 41605 | 48.6% | 15.0% (+33.7)#85 | 11.1% (+37.6)#1,297 |
| 86. | 42327 | 48.6% | 15.0% (+33.6)#86 | 11.1% (+37.5)#1,303 |
| 87. | 41348 | 48.0% | 15.0% (+33.0)#87 | 11.1% (+36.9)#1,337 |
| 88. | 41098 | 47.7% | 15.0% (+32.7)#88 | 11.1% (+36.6)#1,355 |
| 89. | 41535 | 47.6% | 15.0% (+32.7)#89 | 11.1% (+36.6)#1,358 |
| 90. | 41139 | 47.2% | 15.0% (+32.3)#90 | 11.1% (+36.2)#1,378 |
| 91. | 40927 | 46.8% | 15.0% (+31.8)#91 | 11.1% (+35.7)#1,407 |
| 92. | 42732 | 46.7% | 15.0% (+31.7)#92 | 11.1% (+35.6)#1,410 |
| 93. | 40145 | 46.7% | 15.0% (+31.7)#93 | 11.1% (+35.6)#1,412 |
| 94. | 41180 | 46.4% | 15.0% (+31.5)#94 | 11.1% (+35.4)#1,435 |
| 95. | 40873 | 45.6% | 15.0% (+30.6)#95 | 11.1% (+34.5)#1,505 |
| 96. | 40144 | 45.6% | 15.0% (+30.6)#96 | 11.1% (+34.5)#1,507 |
| 97. | 41821 | 45.5% | 15.0% (+30.5)#97 | 11.1% (+34.4)#1,521 |
| 98. | 42076 | 45.4% | 15.0% (+30.4)#98 | 11.1% (+34.3)#1,534 |
| 99. | 40972 | 44.6% | 15.0% (+29.6)#99 | 11.1% (+33.5)#1,600 |
| 100. | 40988 | 44.4% | 15.0% (+29.5)#100 | 11.1% (+33.4)#1,613 |
Common Questions
What are the Top 10 Zip Codes with the Highest Percentage of Population with a Degree in Education in Kentucky?
Top 10 Zip Codes with the Highest Percentage of Population with a Degree in Education in Kentucky are:
What zip code has the Highest Percentage of Population with a Degree in Education in Kentucky?
41555 has the Highest Percentage of Population with a Degree in Education in Kentucky with 100.0%.
What is the Percentage of Population with a Degree in Education in the State of Kentucky?
Percentage of Population with a Degree in Education in Kentucky is 15.0%.
What is the Percentage of Population with a Degree in Education in the United States?
Percentage of Population with a Degree in Education in the United States is 11.1%.