Payne Gap, KY Map & Demographics
Payne Gap Map
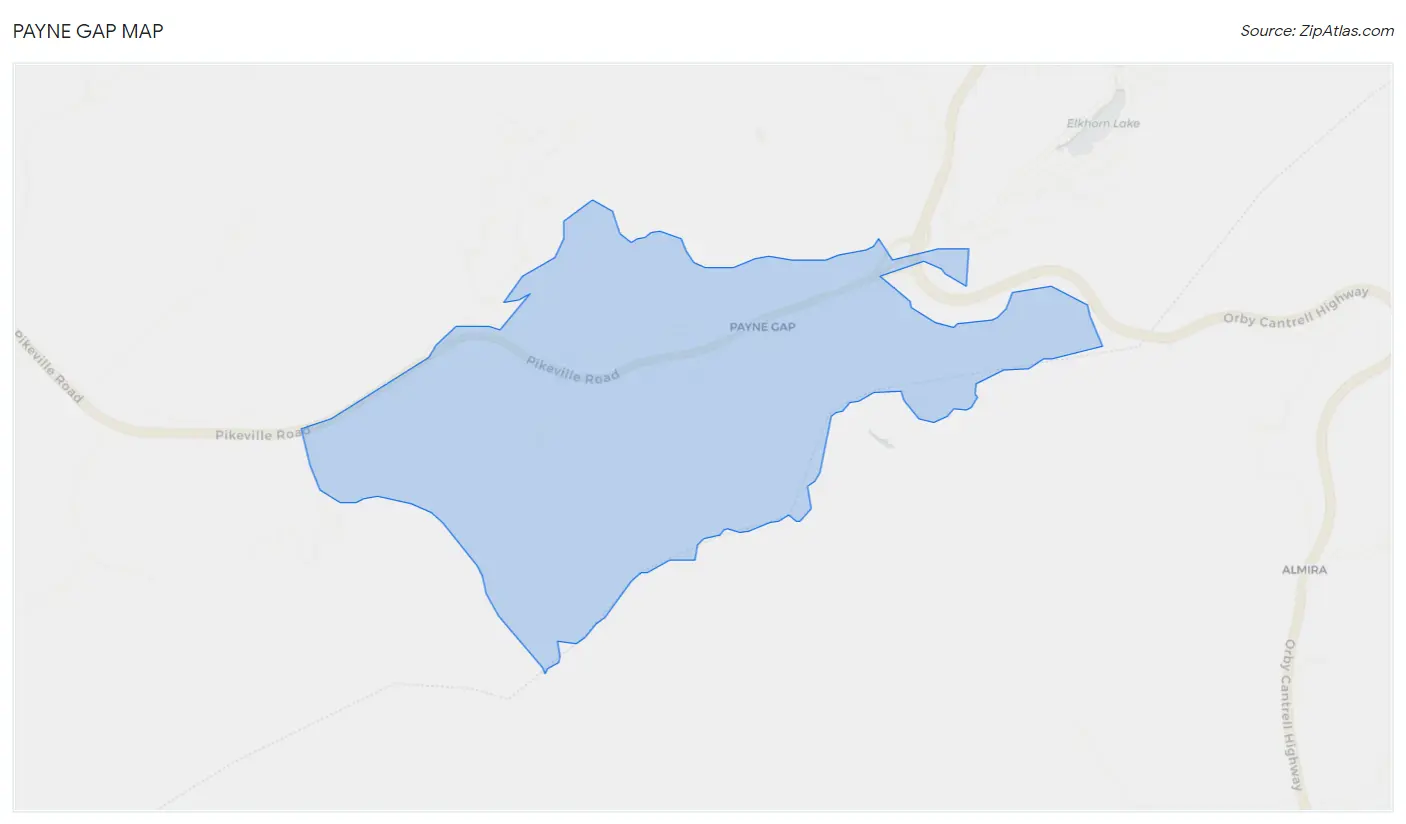
Payne Gap Overview
$23,432
PER CAPITA INCOME
$58,594
AVG FAMILY INCOME
$31,042
AVG HOUSEHOLD INCOME
52.9%
WAGE / INCOME GAP [ % ]
47.1¢/ $1
WAGE / INCOME GAP [ $ ]
0.38
INEQUALITY / GINI INDEX
230
TOTAL POPULATION
132
MALE POPULATION
98
FEMALE POPULATION
134.69
MALES / 100 FEMALES
74.24
FEMALES / 100 MALES
49.8
MEDIAN AGE
2.6
AVG FAMILY SIZE
1.5
AVG HOUSEHOLD SIZE
99
LABOR FORCE [ PEOPLE ]
44.4%
PERCENT IN LABOR FORCE
33.3%
UNEMPLOYMENT RATE
Payne Gap Area Codes
Income in Payne Gap
Income Overview in Payne Gap
Per Capita Income in Payne Gap is $23,432, while median incomes of families and households are $58,594 and $31,042 respectively.
| Characteristic | Number | Measure |
| Per Capita Income | 230 | $23,432 |
| Median Family Income | 50 | $58,594 |
| Mean Family Income | 50 | $50,532 |
| Median Household Income | 149 | $31,042 |
| Mean Household Income | 149 | $36,413 |
| Income Deficit | 50 | $0 |
| Wage / Income Gap (%) | 230 | 52.93% |
| Wage / Income Gap ($) | 230 | 47.07¢ per $1 |
| Gini / Inequality Index | 230 | 0.38 |
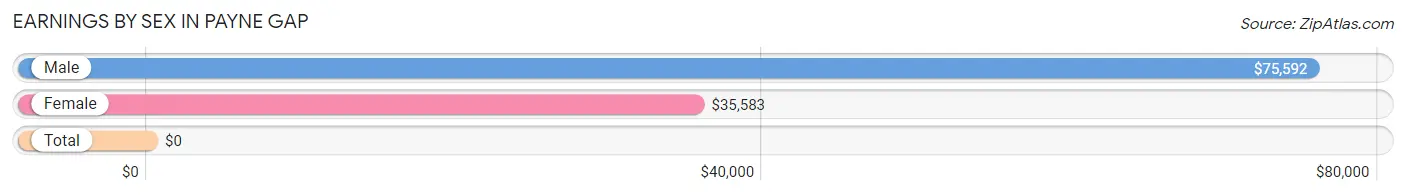
Earnings by Sex in Payne Gap
| Sex | Number | Average Earnings |
| Male | 29 (43.9%) | $75,592 |
| Female | 37 (56.1%) | $35,583 |
| Total | 66 (100.0%) | $0 |
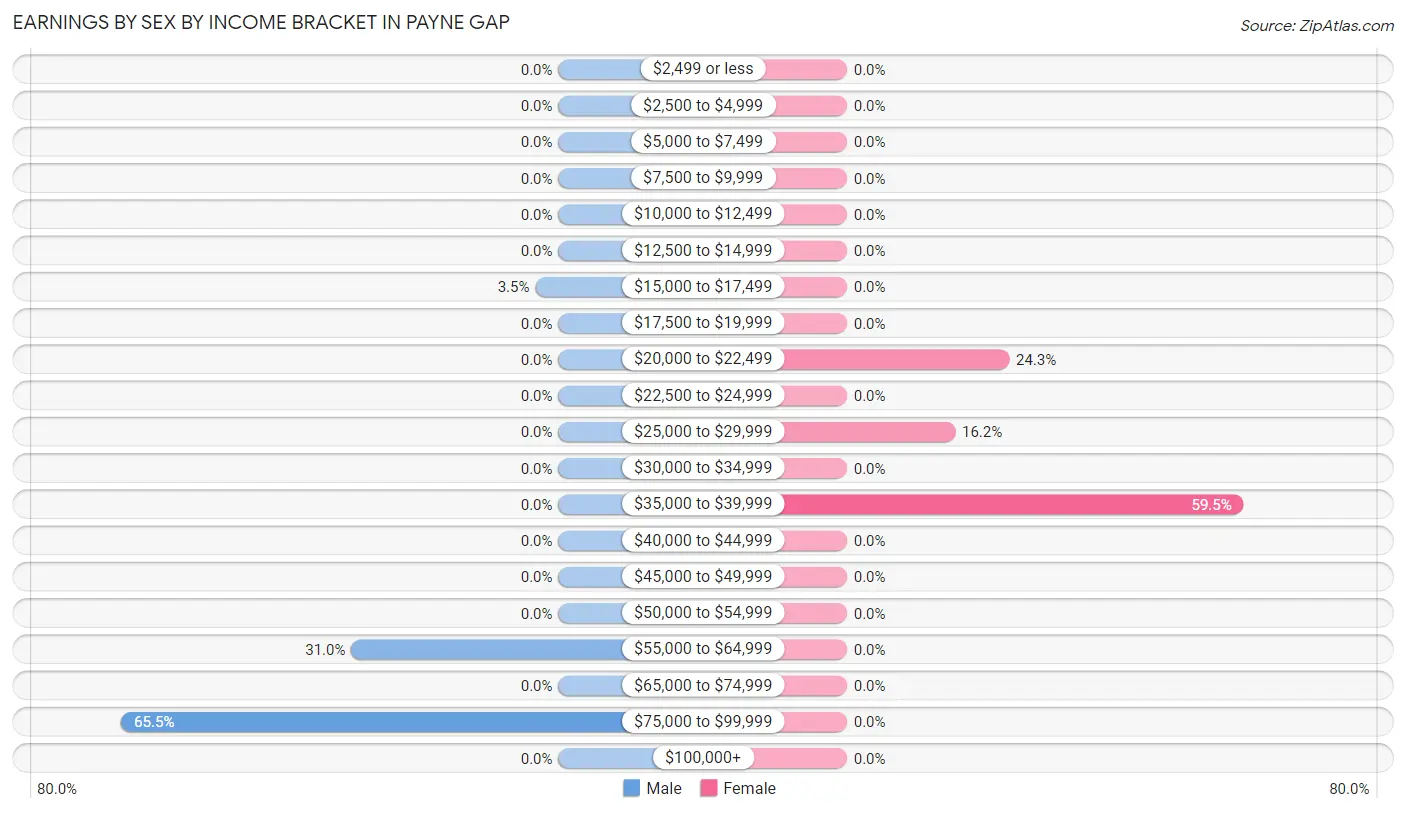
Earnings by Sex by Income Bracket in Payne Gap
The most common earnings brackets in Payne Gap are $75,000 to $99,999 for men (19 | 65.5%) and $35,000 to $39,999 for women (22 | 59.5%).
| Income | Male | Female |
| $2,499 or less | 0 (0.0%) | 0 (0.0%) |
| $2,500 to $4,999 | 0 (0.0%) | 0 (0.0%) |
| $5,000 to $7,499 | 0 (0.0%) | 0 (0.0%) |
| $7,500 to $9,999 | 0 (0.0%) | 0 (0.0%) |
| $10,000 to $12,499 | 0 (0.0%) | 0 (0.0%) |
| $12,500 to $14,999 | 0 (0.0%) | 0 (0.0%) |
| $15,000 to $17,499 | 1 (3.5%) | 0 (0.0%) |
| $17,500 to $19,999 | 0 (0.0%) | 0 (0.0%) |
| $20,000 to $22,499 | 0 (0.0%) | 9 (24.3%) |
| $22,500 to $24,999 | 0 (0.0%) | 0 (0.0%) |
| $25,000 to $29,999 | 0 (0.0%) | 6 (16.2%) |
| $30,000 to $34,999 | 0 (0.0%) | 0 (0.0%) |
| $35,000 to $39,999 | 0 (0.0%) | 22 (59.5%) |
| $40,000 to $44,999 | 0 (0.0%) | 0 (0.0%) |
| $45,000 to $49,999 | 0 (0.0%) | 0 (0.0%) |
| $50,000 to $54,999 | 0 (0.0%) | 0 (0.0%) |
| $55,000 to $64,999 | 9 (31.0%) | 0 (0.0%) |
| $65,000 to $74,999 | 0 (0.0%) | 0 (0.0%) |
| $75,000 to $99,999 | 19 (65.5%) | 0 (0.0%) |
| $100,000+ | 0 (0.0%) | 0 (0.0%) |
| Total | 29 (100.0%) | 37 (100.0%) |
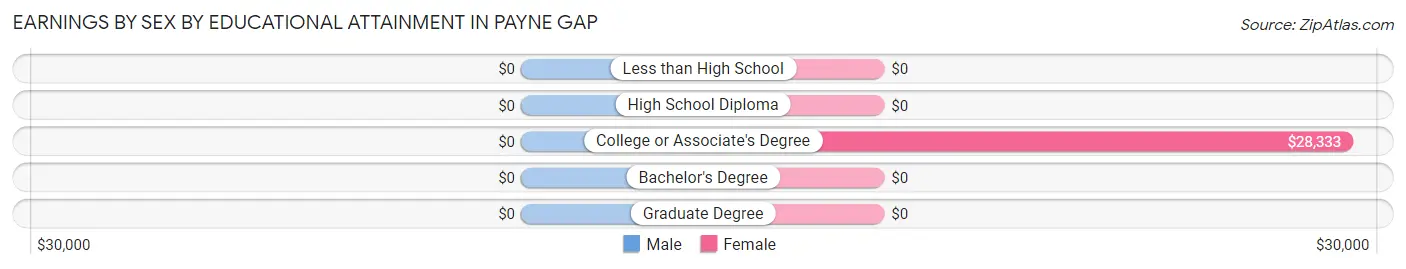
Earnings by Sex by Educational Attainment in Payne Gap
| Educational Attainment | Male Income | Female Income |
| Less than High School | - | - |
| High School Diploma | - | - |
| College or Associate's Degree | - | - |
| Bachelor's Degree | - | - |
| Graduate Degree | - | - |
| Total | $75,592 | $35,583 |
Family Income in Payne Gap
Family Income Brackets in Payne Gap
According to the Payne Gap family income data, there are 25 families falling into the $50,000 to $74,999 income range, which is the most common income bracket and makes up 50.0% of all families.
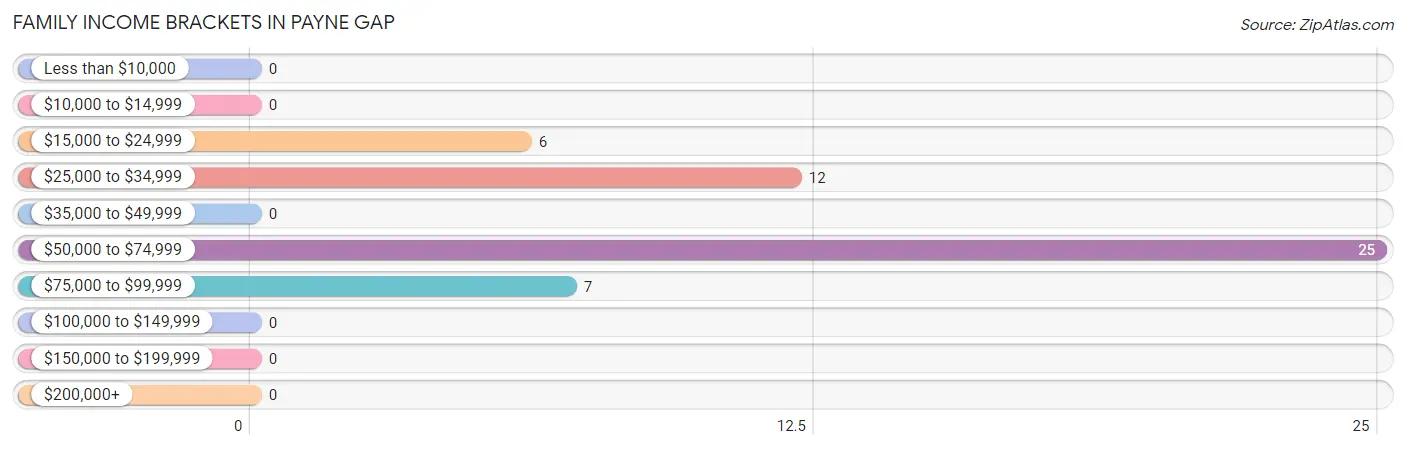
| Income Bracket | # Families | % Families |
| Less than $10,000 | 0 | 0.0% |
| $10,000 to $14,999 | 0 | 0.0% |
| $15,000 to $24,999 | 6 | 12.0% |
| $25,000 to $34,999 | 12 | 24.0% |
| $35,000 to $49,999 | 0 | 0.0% |
| $50,000 to $74,999 | 25 | 50.0% |
| $75,000 to $99,999 | 7 | 14.0% |
| $100,000 to $149,999 | 0 | 0.0% |
| $150,000 to $199,999 | 0 | 0.0% |
| $200,000+ | 0 | 0.0% |
Family Income by Famaliy Size in Payne Gap
3-person families (17 | 34.0%) account for the highest median family income in Payne Gap with $62,083 per family, while 3-person families (17 | 34.0%) have the highest median income of $20,694 per family member.
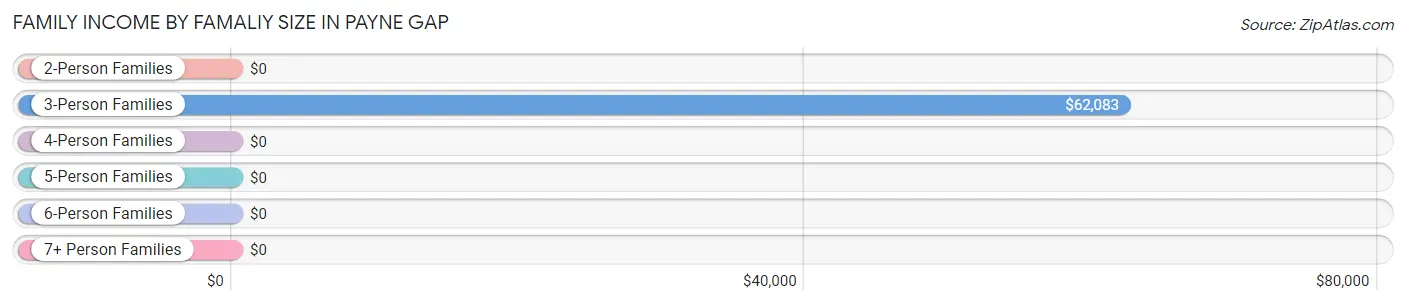
| Income Bracket | # Families | Median Income |
| 2-Person Families | 33 (66.0%) | $0 |
| 3-Person Families | 17 (34.0%) | $62,083 |
| 4-Person Families | 0 (0.0%) | $0 |
| 5-Person Families | 0 (0.0%) | $0 |
| 6-Person Families | 0 (0.0%) | $0 |
| 7+ Person Families | 0 (0.0%) | $0 |
| Total | 50 (100.0%) | $58,594 |
Family Income by Number of Earners in Payne Gap
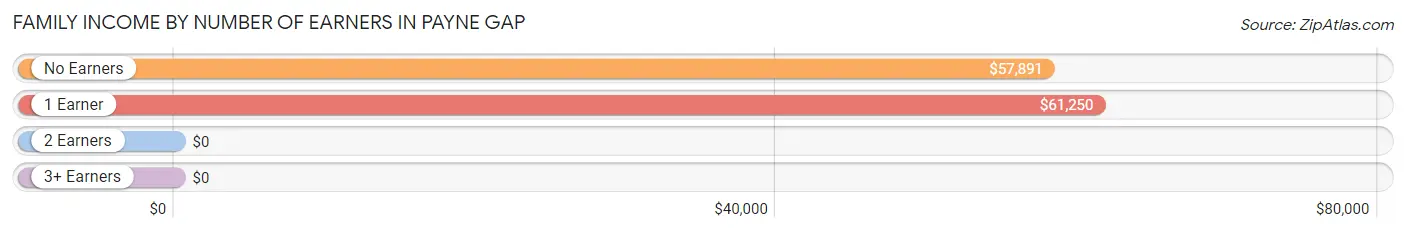
| Number of Earners | # Families | Median Income |
| No Earners | 27 (54.0%) | $57,891 |
| 1 Earner | 23 (46.0%) | $61,250 |
| 2 Earners | 0 (0.0%) | $0 |
| 3+ Earners | 0 (0.0%) | $0 |
| Total | 50 (100.0%) | $58,594 |
Household Income in Payne Gap
Household Income Brackets in Payne Gap
With 50 households falling in the category, the $10,000 to $14,999 income range is the most frequent in Payne Gap, accounting for 33.6% of all households.
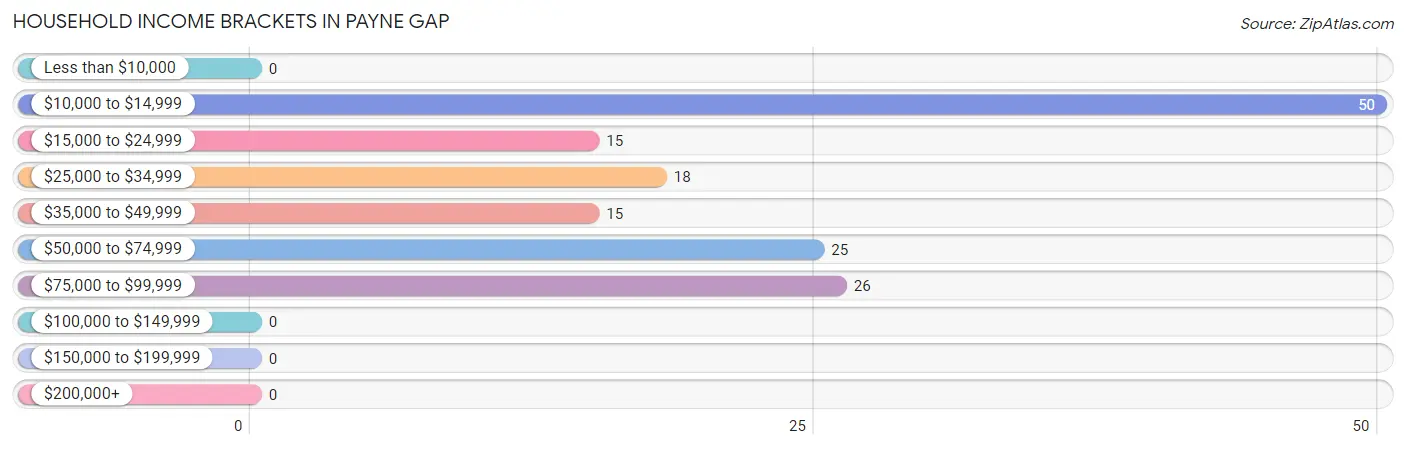
| Income Bracket | # Households | % Households |
| Less than $10,000 | 0 | 0.0% |
| $10,000 to $14,999 | 50 | 33.6% |
| $15,000 to $24,999 | 15 | 10.1% |
| $25,000 to $34,999 | 18 | 12.1% |
| $35,000 to $49,999 | 15 | 10.1% |
| $50,000 to $74,999 | 25 | 16.8% |
| $75,000 to $99,999 | 26 | 17.4% |
| $100,000 to $149,999 | 0 | 0.0% |
| $150,000 to $199,999 | 0 | 0.0% |
| $200,000+ | 0 | 0.0% |
Household Income by Householder Age in Payne Gap
The median household income in Payne Gap is $31,042, with the highest median household income of $60,556 found in the 45 to 64 years age bracket for the primary householder. A total of 66 households (44.3%) fall into this category.
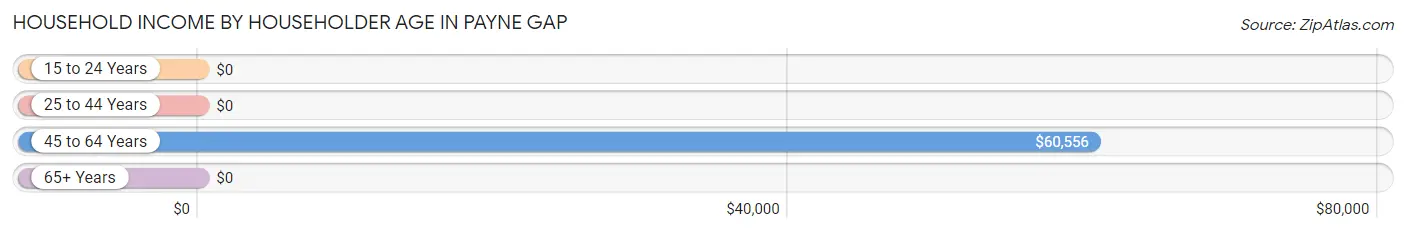
| Income Bracket | # Households | Median Income |
| 15 to 24 Years | 0 (0.0%) | $0 |
| 25 to 44 Years | 50 (33.6%) | $0 |
| 45 to 64 Years | 66 (44.3%) | $60,556 |
| 65+ Years | 33 (22.2%) | $0 |
| Total | 149 (100.0%) | $31,042 |
Poverty in Payne Gap
Income Below Poverty by Sex and Age in Payne Gap
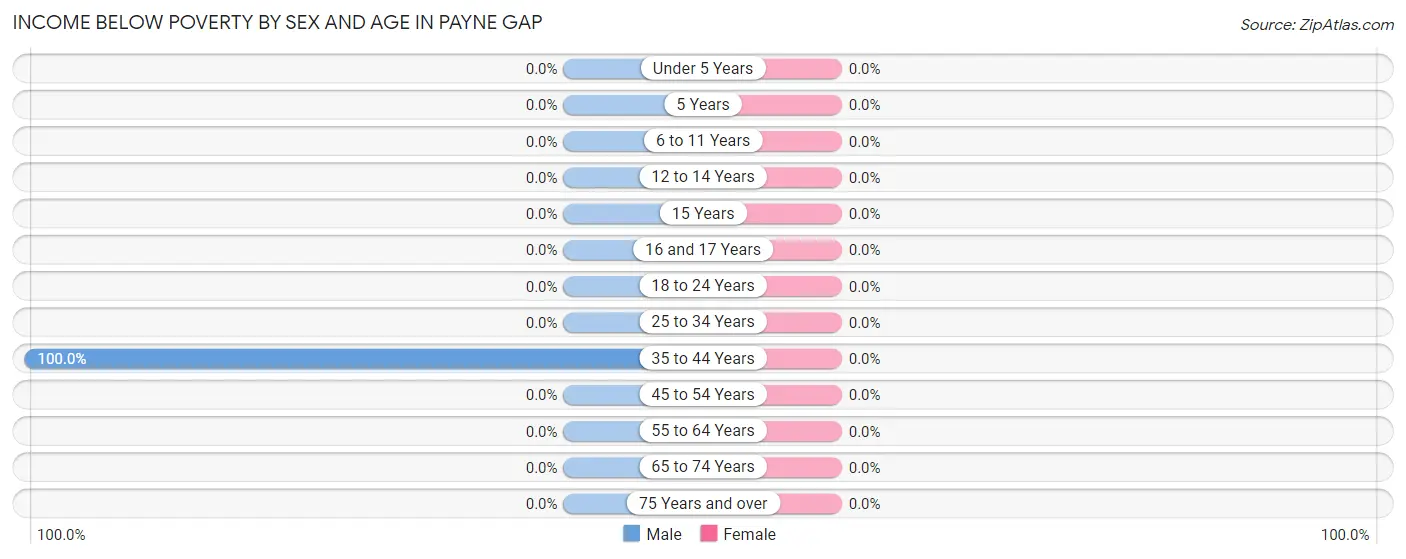
| Age Bracket | Male | Female |
| Under 5 Years | 0 (0.0%) | 0 (0.0%) |
| 5 Years | 0 (0.0%) | 0 (0.0%) |
| 6 to 11 Years | 0 (0.0%) | 0 (0.0%) |
| 12 to 14 Years | 0 (0.0%) | 0 (0.0%) |
| 15 Years | 0 (0.0%) | 0 (0.0%) |
| 16 and 17 Years | 0 (0.0%) | 0 (0.0%) |
| 18 to 24 Years | 0 (0.0%) | 0 (0.0%) |
| 25 to 34 Years | 0 (0.0%) | 0 (0.0%) |
| 35 to 44 Years | 50 (100.0%) | 0 (0.0%) |
| 45 to 54 Years | 0 (0.0%) | 0 (0.0%) |
| 55 to 64 Years | 0 (0.0%) | 0 (0.0%) |
| 65 to 74 Years | 0 (0.0%) | 0 (0.0%) |
| 75 Years and over | 0 (0.0%) | 0 (0.0%) |
| Total | 50 (37.9%) | 0 (0.0%) |
Income Above Poverty by Sex and Age in Payne Gap
According to the poverty statistics in Payne Gap, males aged 6 to 11 years and females aged 35 to 44 years are the age groups that are most secure financially, with 100.0% of males and 100.0% of females in these age groups living above the poverty line.
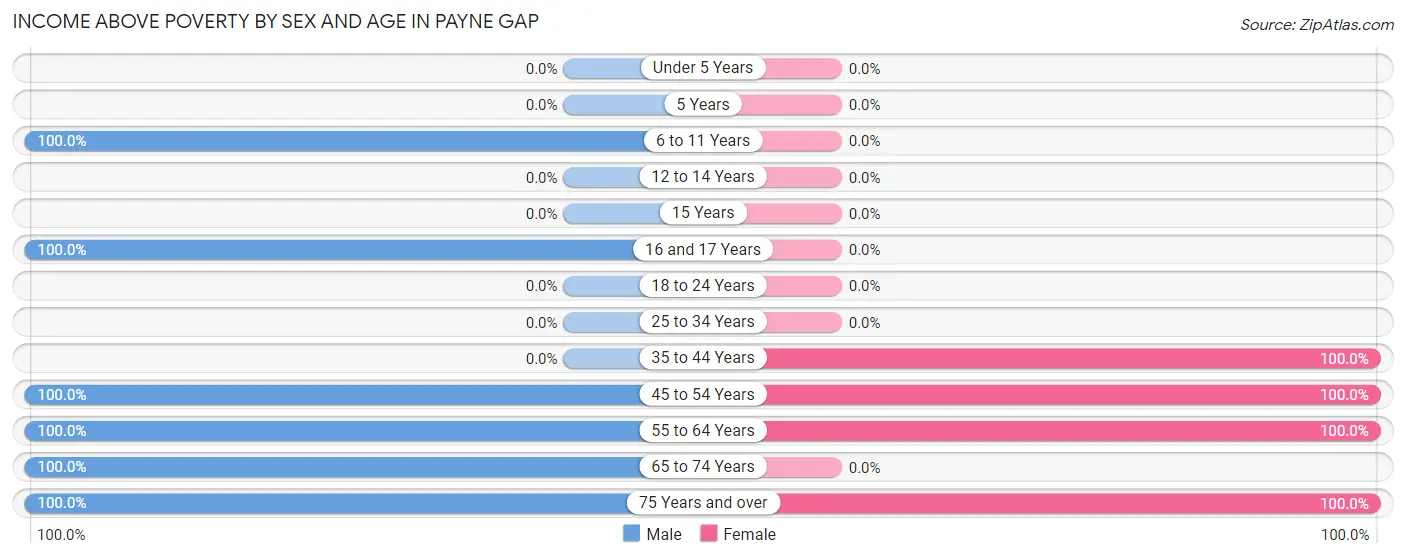
| Age Bracket | Male | Female |
| Under 5 Years | 0 (0.0%) | 0 (0.0%) |
| 5 Years | 0 (0.0%) | 0 (0.0%) |
| 6 to 11 Years | 7 (100.0%) | 0 (0.0%) |
| 12 to 14 Years | 0 (0.0%) | 0 (0.0%) |
| 15 Years | 0 (0.0%) | 0 (0.0%) |
| 16 and 17 Years | 7 (100.0%) | 0 (0.0%) |
| 18 to 24 Years | 0 (0.0%) | 0 (0.0%) |
| 25 to 34 Years | 0 (0.0%) | 0 (0.0%) |
| 35 to 44 Years | 0 (0.0%) | 2 (100.0%) |
| 45 to 54 Years | 16 (100.0%) | 58 (100.0%) |
| 55 to 64 Years | 25 (100.0%) | 28 (100.0%) |
| 65 to 74 Years | 22 (100.0%) | 0 (0.0%) |
| 75 Years and over | 5 (100.0%) | 10 (100.0%) |
| Total | 82 (62.1%) | 98 (100.0%) |
Income Below Poverty Among Married-Couple Families in Payne Gap
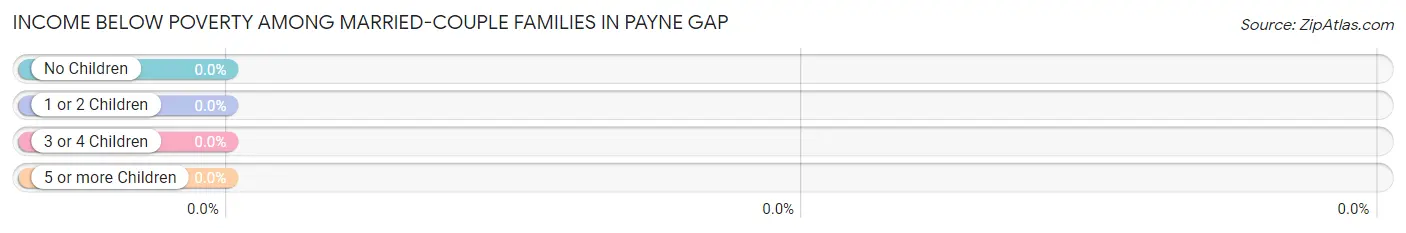
| Children | Above Poverty | Below Poverty |
| No Children | 18 (100.0%) | 0 (0.0%) |
| 1 or 2 Children | 16 (100.0%) | 0 (0.0%) |
| 3 or 4 Children | 0 (0.0%) | 0 (0.0%) |
| 5 or more Children | 0 (0.0%) | 0 (0.0%) |
| Total | 34 (100.0%) | 0 (0.0%) |
Income Below Poverty Among Single-Parent Households in Payne Gap
| Children | Single Father | Single Mother |
| No Children | 0 (0.0%) | 0 (0.0%) |
| 1 or 2 Children | 0 (0.0%) | 0 (0.0%) |
| 3 or 4 Children | 0 (0.0%) | 0 (0.0%) |
| 5 or more Children | 0 (0.0%) | 0 (0.0%) |
| Total | 0 (0.0%) | 0 (0.0%) |
Income Below Poverty Among Married-Couple vs Single-Parent Households in Payne Gap
| Children | Married-Couple Families | Single-Parent Households |
| No Children | 0 (0.0%) | 0 (0.0%) |
| 1 or 2 Children | 0 (0.0%) | 0 (0.0%) |
| 3 or 4 Children | 0 (0.0%) | 0 (0.0%) |
| 5 or more Children | 0 (0.0%) | 0 (0.0%) |
| Total | 0 (0.0%) | 0 (0.0%) |
Race in Payne Gap
The most populous races in Payne Gap are White / Caucasian (180 | 78.3%), and Some other Race (50 | 21.7%).
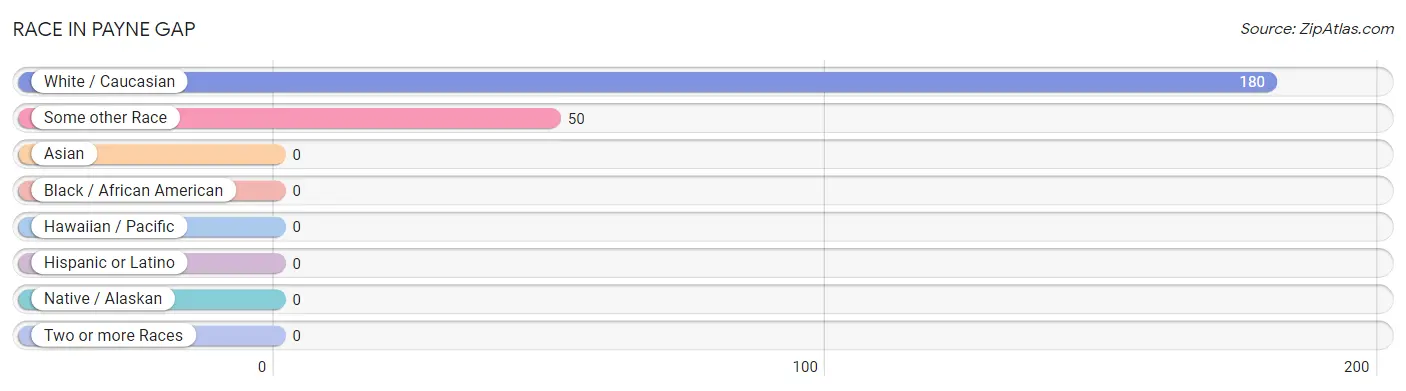
| Race | # Population | % Population |
| Asian | 0 | 0.0% |
| Black / African American | 0 | 0.0% |
| Hawaiian / Pacific | 0 | 0.0% |
| Hispanic or Latino | 0 | 0.0% |
| Native / Alaskan | 0 | 0.0% |
| White / Caucasian | 180 | 78.3% |
| Two or more Races | 0 | 0.0% |
| Some other Race | 50 | 21.7% |
| Total | 230 | 100.0% |
Ancestry in Payne Gap
The most populous ancestries reported in Payne Gap are Irish (75 | 32.6%), German (39 | 17.0%), American (21 | 9.1%), French (16 | 7.0%), and Scottish (16 | 7.0%), together accounting for 72.6% of all Payne Gap residents.
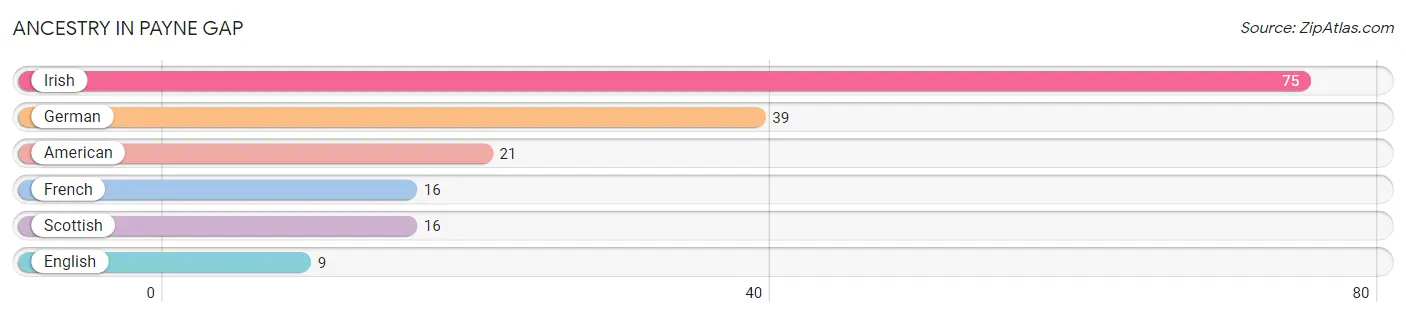
| Ancestry | # Population | % Population |
| American | 21 | 9.1% |
| English | 9 | 3.9% |
| French | 16 | 7.0% |
| German | 39 | 17.0% |
| Irish | 75 | 32.6% |
| Scottish | 16 | 7.0% | View All 6 Rows |
Immigrants in Payne Gap
The most numerous immigrant groups reported in Payne Gap came from Europe (6 | 2.6%), Germany (6 | 2.6%), and Western Europe (6 | 2.6%), together accounting for 7.8% of all Payne Gap residents.
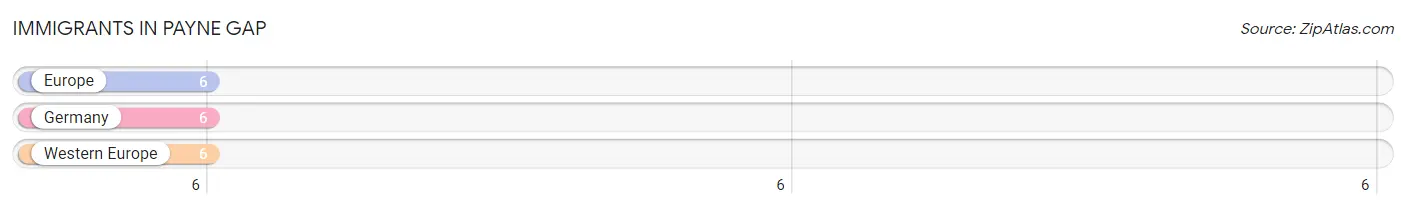
| Immigration Origin | # Population | % Population |
| Europe | 6 | 2.6% |
| Germany | 6 | 2.6% |
| Western Europe | 6 | 2.6% | View All 3 Rows |
Sex and Age in Payne Gap
Sex and Age in Payne Gap
The most populous age groups in Payne Gap are 35 to 39 Years (50 | 37.9%) for men and 45 to 49 Years (51 | 52.0%) for women.
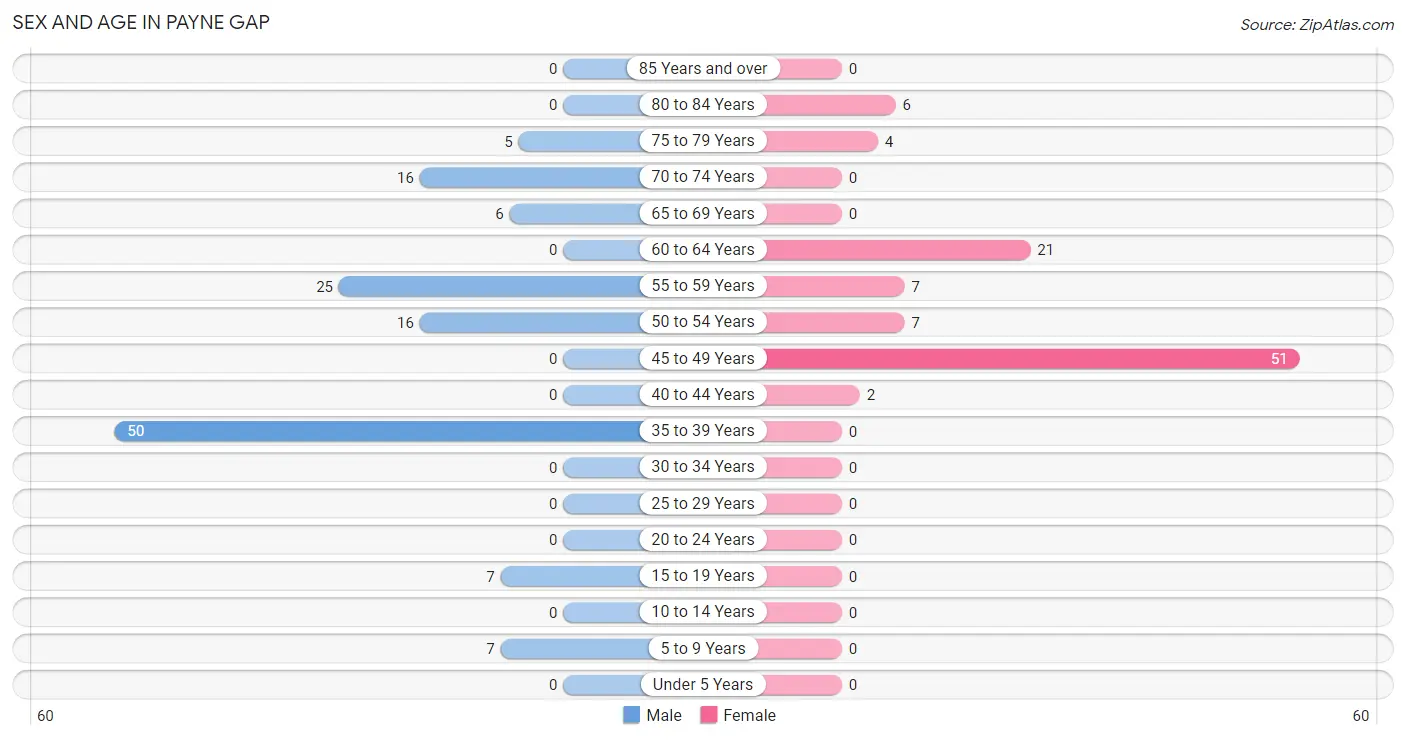
| Age Bracket | Male | Female |
| Under 5 Years | 0 (0.0%) | 0 (0.0%) |
| 5 to 9 Years | 7 (5.3%) | 0 (0.0%) |
| 10 to 14 Years | 0 (0.0%) | 0 (0.0%) |
| 15 to 19 Years | 7 (5.3%) | 0 (0.0%) |
| 20 to 24 Years | 0 (0.0%) | 0 (0.0%) |
| 25 to 29 Years | 0 (0.0%) | 0 (0.0%) |
| 30 to 34 Years | 0 (0.0%) | 0 (0.0%) |
| 35 to 39 Years | 50 (37.9%) | 0 (0.0%) |
| 40 to 44 Years | 0 (0.0%) | 2 (2.0%) |
| 45 to 49 Years | 0 (0.0%) | 51 (52.0%) |
| 50 to 54 Years | 16 (12.1%) | 7 (7.1%) |
| 55 to 59 Years | 25 (18.9%) | 7 (7.1%) |
| 60 to 64 Years | 0 (0.0%) | 21 (21.4%) |
| 65 to 69 Years | 6 (4.5%) | 0 (0.0%) |
| 70 to 74 Years | 16 (12.1%) | 0 (0.0%) |
| 75 to 79 Years | 5 (3.8%) | 4 (4.1%) |
| 80 to 84 Years | 0 (0.0%) | 6 (6.1%) |
| 85 Years and over | 0 (0.0%) | 0 (0.0%) |
| Total | 132 (100.0%) | 98 (100.0%) |
Families and Households in Payne Gap
Median Family Size in Payne Gap
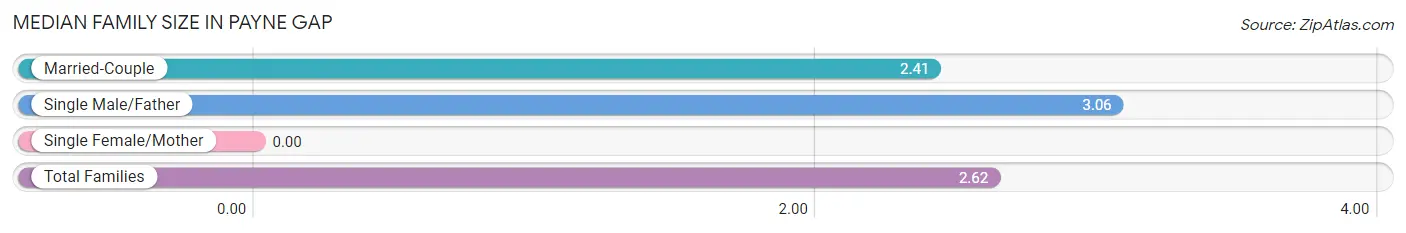
| Family Type | # Families | Family Size |
| Married-Couple | 34 (68.0%) | 2.41 |
| Single Male/Father | 16 (32.0%) | 3.06 |
| Single Female/Mother | 0 (0.0%) | - |
| Total Families | 50 (100.0%) | 2.62 |
Median Household Size in Payne Gap
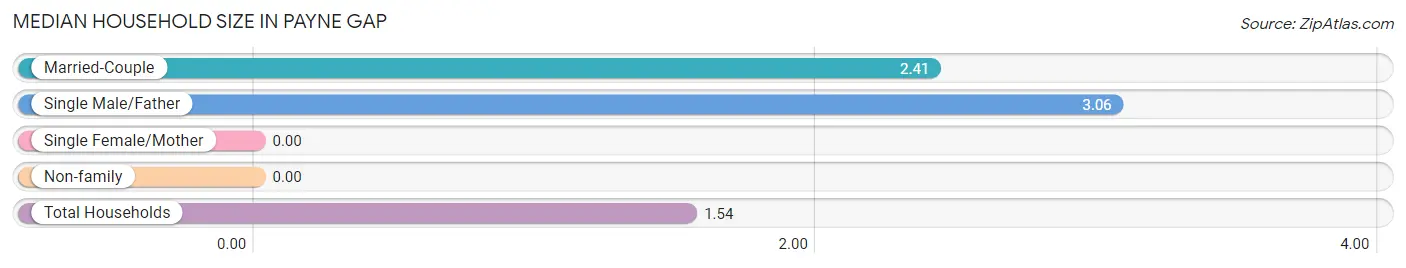
| Household Type | # Households | Household Size |
| Married-Couple | 34 (22.8%) | 2.41 |
| Single Male/Father | 16 (10.7%) | 3.06 |
| Single Female/Mother | 0 (0.0%) | - |
| Non-family | 99 (66.4%) | - |
| Total Households | 149 (100.0%) | 1.54 |
Household Size by Marriage Status in Payne Gap
Out of a total of 149 households in Payne Gap, 50 (33.6%) are family households, while 99 (66.4%) are nonfamily households. The most numerous type of family households are 2-person households, comprising 33, and the most common type of nonfamily households are 1-person households, comprising 99.
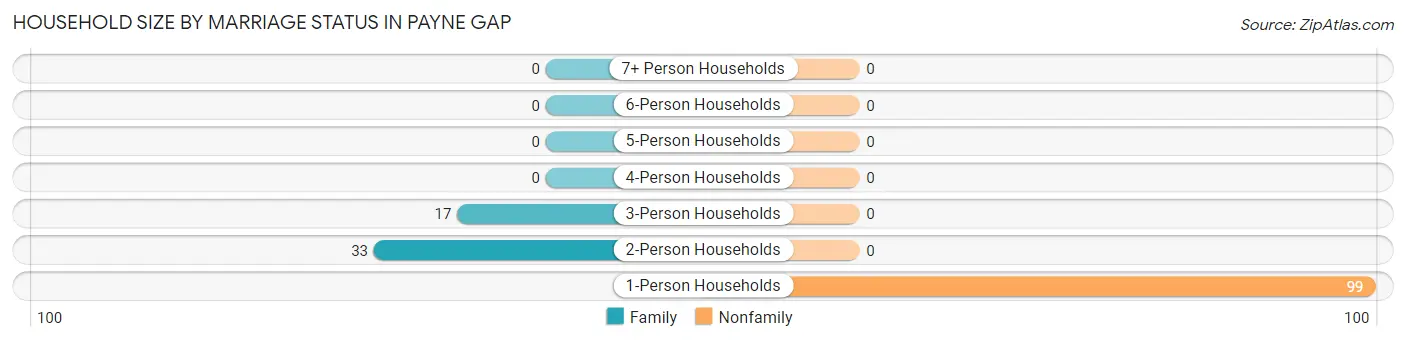
| Household Size | Family Households | Nonfamily Households |
| 1-Person Households | - | 99 (66.4%) |
| 2-Person Households | 33 (22.2%) | 0 (0.0%) |
| 3-Person Households | 17 (11.4%) | 0 (0.0%) |
| 4-Person Households | 0 (0.0%) | 0 (0.0%) |
| 5-Person Households | 0 (0.0%) | 0 (0.0%) |
| 6-Person Households | 0 (0.0%) | 0 (0.0%) |
| 7+ Person Households | 0 (0.0%) | 0 (0.0%) |
| Total | 50 (33.6%) | 99 (66.4%) |
Female Fertility in Payne Gap
Fertility by Age in Payne Gap
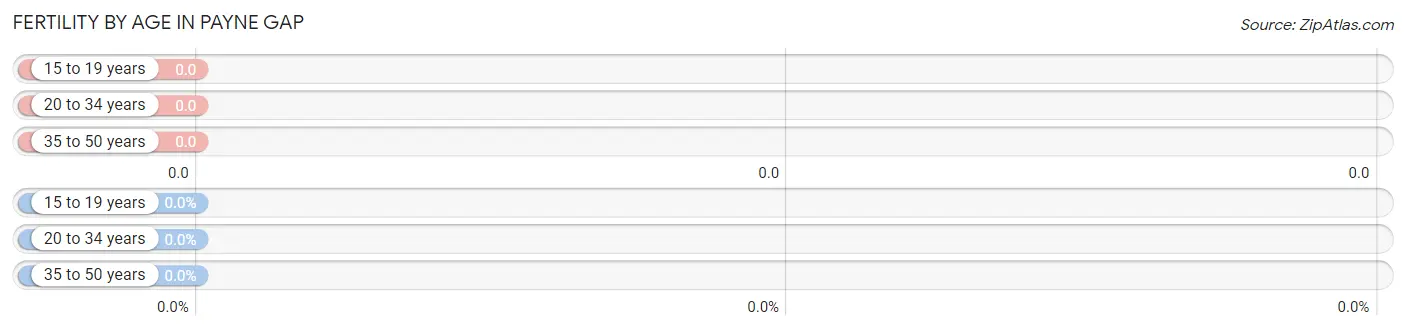
| Age Bracket | Women with Births | Births / 1,000 Women |
| 15 to 19 years | 0 (0.0%) | 0.0 |
| 20 to 34 years | 0 (0.0%) | 0.0 |
| 35 to 50 years | 0 (0.0%) | 0.0 |
| Total | 0 (0.0%) | 0.0 |
Fertility by Age by Marriage Status in Payne Gap
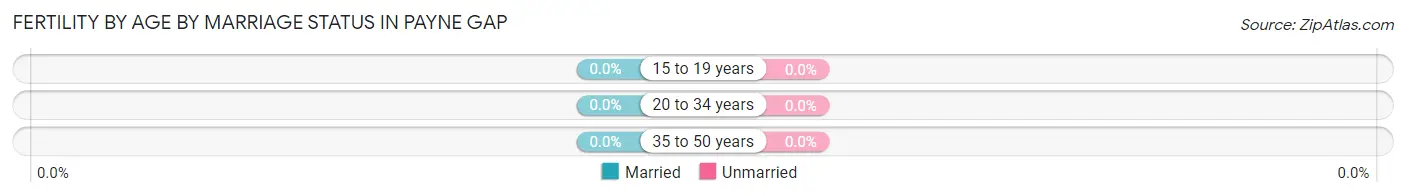
| Age Bracket | Married | Unmarried |
| 15 to 19 years | 0 (0.0%) | 0 (0.0%) |
| 20 to 34 years | 0 (0.0%) | 0 (0.0%) |
| 35 to 50 years | 0 (0.0%) | 0 (0.0%) |
| Total | 0 (0.0%) | 0 (0.0%) |
Fertility by Education in Payne Gap
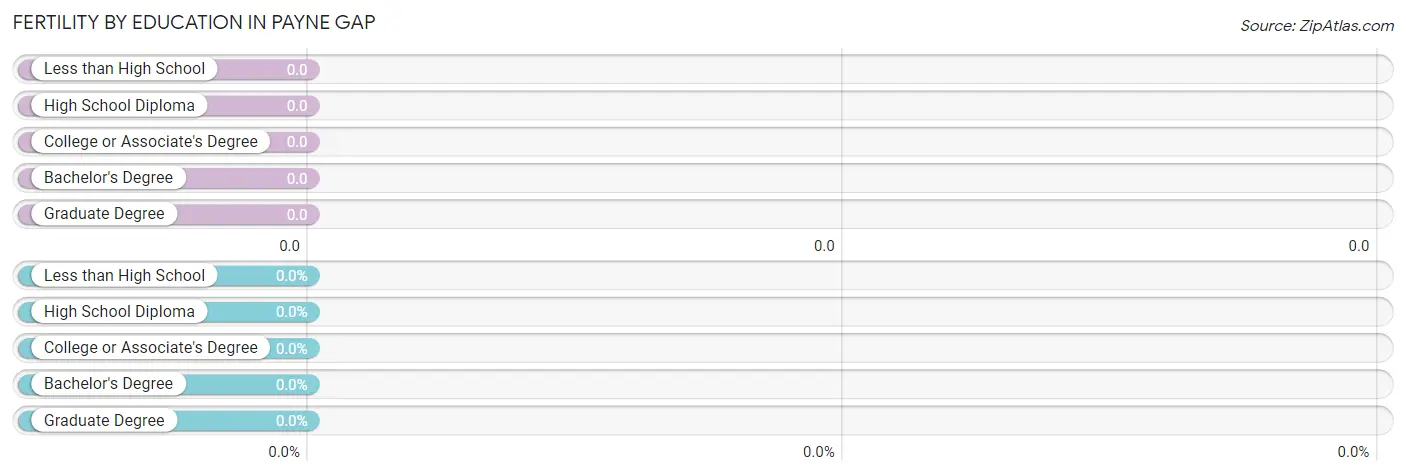
| Educational Attainment | Women with Births | Births / 1,000 Women |
| Less than High School | 0 (0.0%) | 0.0 |
| High School Diploma | 0 (0.0%) | 0.0 |
| College or Associate's Degree | 0 (0.0%) | 0.0 |
| Bachelor's Degree | 0 (0.0%) | 0.0 |
| Graduate Degree | 0 (0.0%) | 0.0 |
| Total | 0 (0.0%) | 0.0 |
Fertility by Education by Marriage Status in Payne Gap
| Educational Attainment | Married | Unmarried |
| Less than High School | 0 (0.0%) | 0 (0.0%) |
| High School Diploma | 0 (0.0%) | 0 (0.0%) |
| College or Associate's Degree | 0 (0.0%) | 0 (0.0%) |
| Bachelor's Degree | 0 (0.0%) | 0 (0.0%) |
| Graduate Degree | 0 (0.0%) | 0 (0.0%) |
| Total | 0 (0.0%) | 0 (0.0%) |
Employment Characteristics in Payne Gap
Employment by Class of Employer in Payne Gap
Among the 66 employed individuals in Payne Gap, not-for-profit organizations (22 | 33.3%), self-employed (not incorporated) (19 | 28.8%), and private company employees (16 | 24.2%) make up the most common classes of employment.
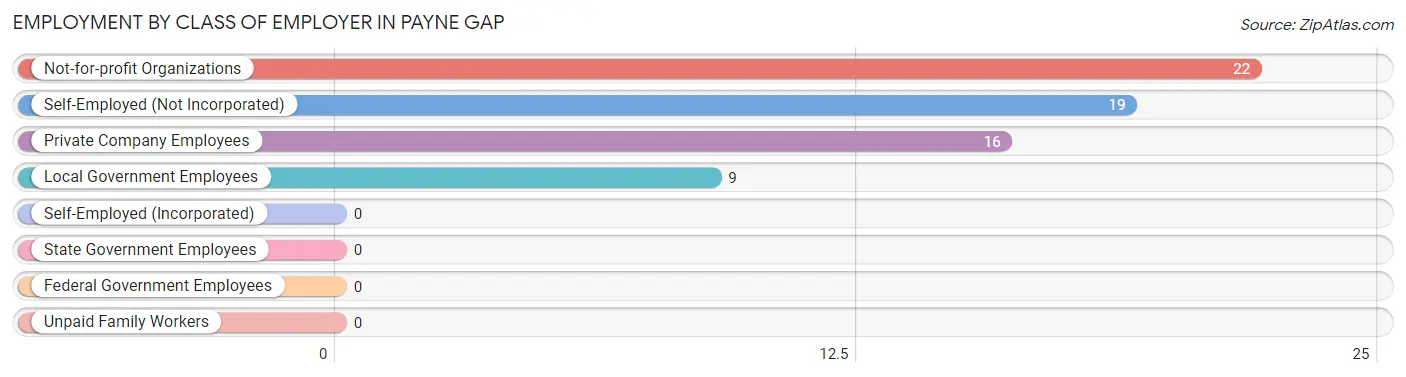
| Employer Class | # Employees | % Employees |
| Private Company Employees | 16 | 24.2% |
| Self-Employed (Incorporated) | 0 | 0.0% |
| Self-Employed (Not Incorporated) | 19 | 28.8% |
| Not-for-profit Organizations | 22 | 33.3% |
| Local Government Employees | 9 | 13.6% |
| State Government Employees | 0 | 0.0% |
| Federal Government Employees | 0 | 0.0% |
| Unpaid Family Workers | 0 | 0.0% |
| Total | 66 | 100.0% |
Employment Status by Age in Payne Gap
According to the labor force statistics for Payne Gap, out of the total population over 16 years of age (223), 44.4% or 99 individuals are in the labor force, with 33.3% or 33 of them unemployed. The age group with the highest labor force participation rate is 55 to 59 years, with 81.3% or 26 individuals in the labor force. Within the labor force, the 45 to 54 years age range has the highest percentage of unemployed individuals, with 56.9% or 33 of them being unemployed.
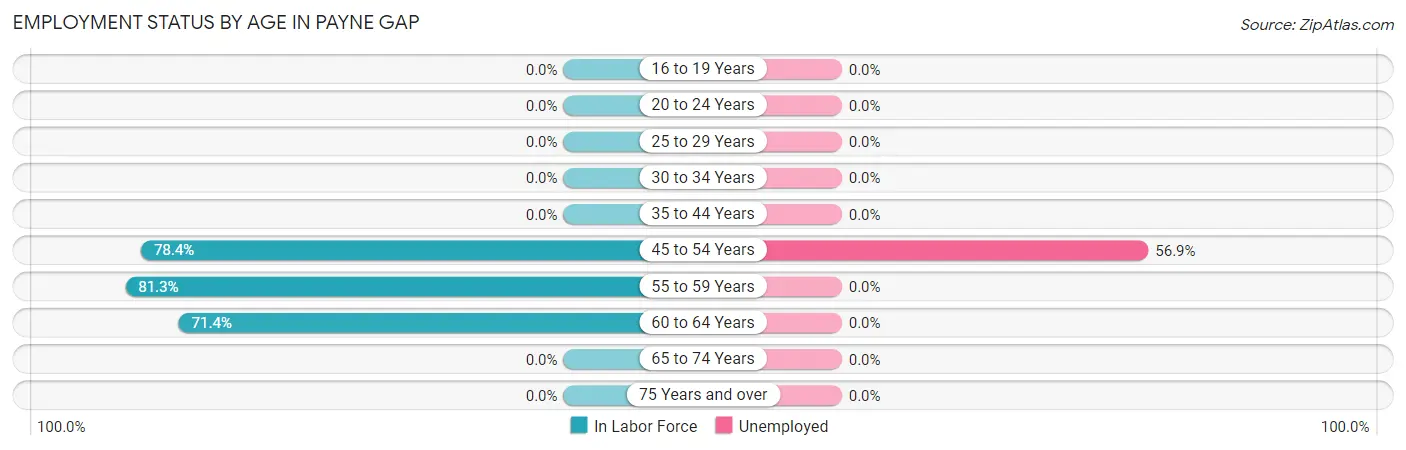
| Age Bracket | In Labor Force | Unemployed |
| 16 to 19 Years | 0 (0.0%) | 0 (0.0%) |
| 20 to 24 Years | 0 (0.0%) | 0 (0.0%) |
| 25 to 29 Years | 0 (0.0%) | 0 (0.0%) |
| 30 to 34 Years | 0 (0.0%) | 0 (0.0%) |
| 35 to 44 Years | 0 (0.0%) | 0 (0.0%) |
| 45 to 54 Years | 58 (78.4%) | 33 (56.9%) |
| 55 to 59 Years | 26 (81.3%) | 0 (0.0%) |
| 60 to 64 Years | 15 (71.4%) | 0 (0.0%) |
| 65 to 74 Years | 0 (0.0%) | 0 (0.0%) |
| 75 Years and over | 0 (0.0%) | 0 (0.0%) |
| Total | 99 (44.4%) | 33 (33.3%) |
Employment Status by Educational Attainment in Payne Gap
According to labor force statistics for Payne Gap, 55.3% of individuals (99) out of the total population between 25 and 64 years of age (179) are in the labor force, with 33.3% or 33 of them being unemployed. The group with the highest labor force participation rate are those with the educational attainment of bachelor's degree or higher, with 100.0% or 9 individuals in the labor force. Within the labor force, individuals with college / associate degree education have the highest percentage of unemployment, with 44.6% or 33 of them being unemployed.
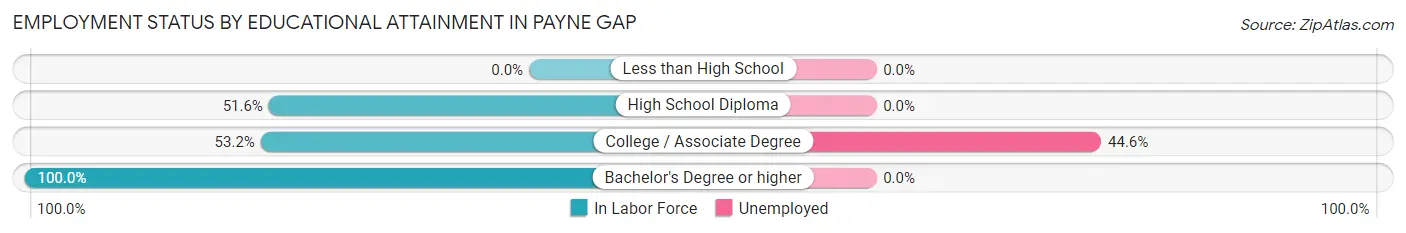
| Educational Attainment | In Labor Force | Unemployed |
| Less than High School | 0 (0.0%) | 0 (0.0%) |
| High School Diploma | 16 (51.6%) | 0 (0.0%) |
| College / Associate Degree | 74 (53.2%) | 62 (44.6%) |
| Bachelor's Degree or higher | 9 (100.0%) | 0 (0.0%) |
| Total | 99 (55.3%) | 60 (33.3%) |
Employment Occupations by Sex in Payne Gap
Management, Business, Science and Arts Occupations
The most common Management, Business, Science and Arts occupations in Payne Gap are Management (20 | 30.3%), Community & Social Service (9 | 13.6%), and Education Instruction & Library (9 | 13.6%).
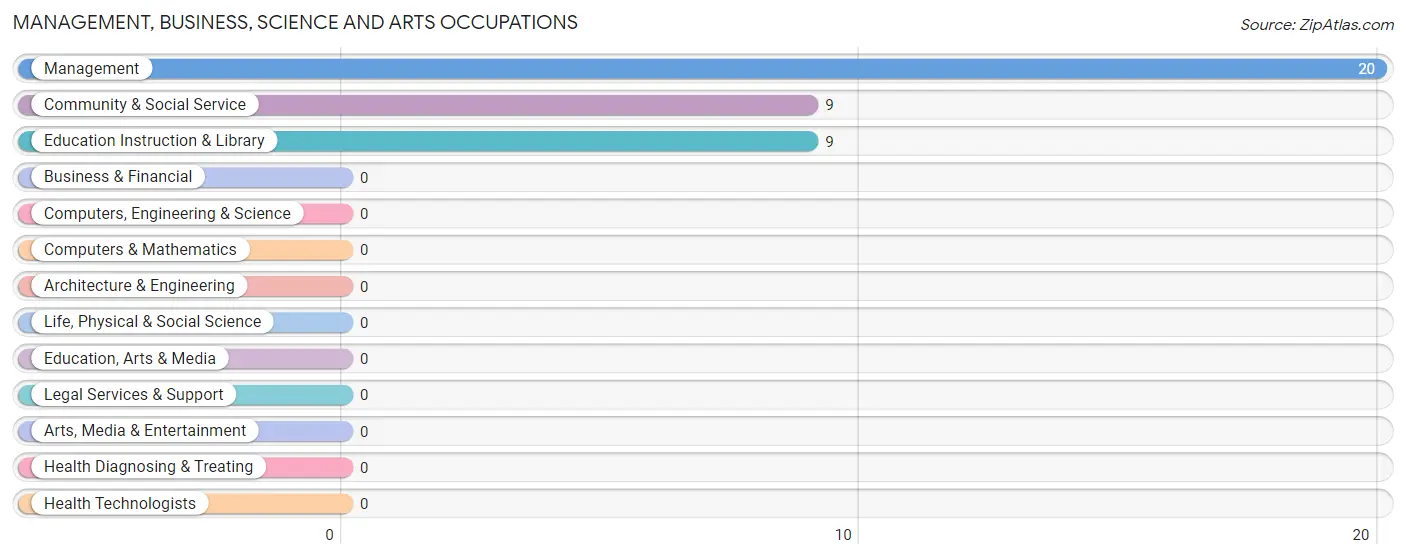
Management, Business, Science and Arts Occupations by Sex
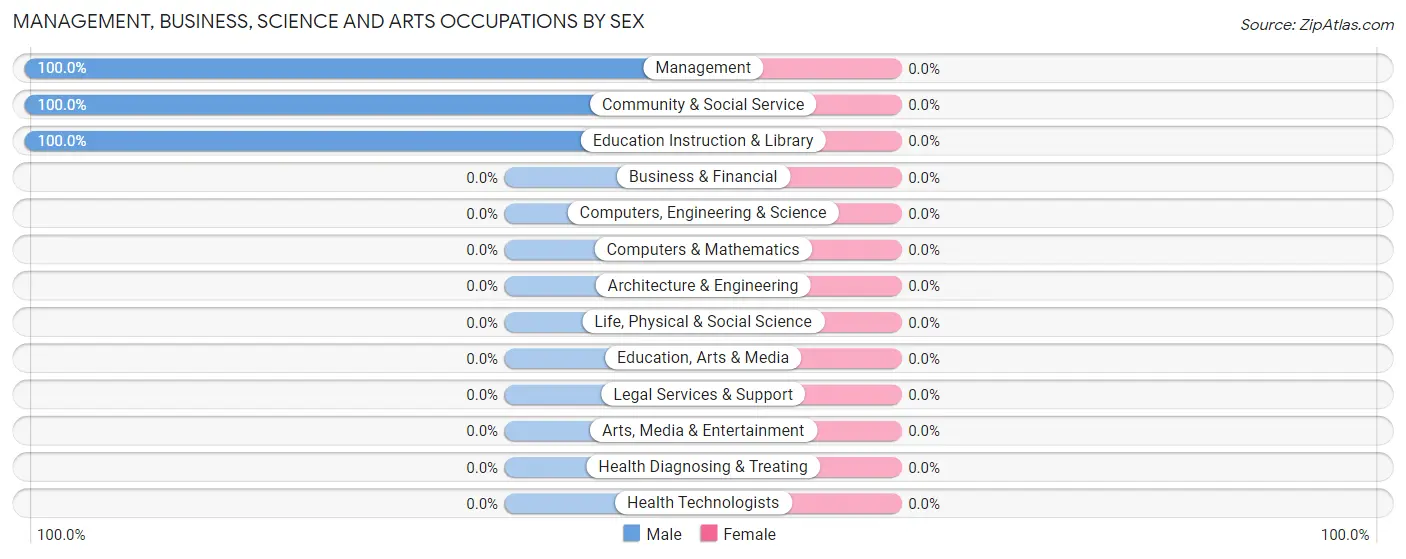
| Occupation | Male | Female |
| Management | 20 (100.0%) | 0 (0.0%) |
| Business & Financial | 0 (0.0%) | 0 (0.0%) |
| Computers, Engineering & Science | 0 (0.0%) | 0 (0.0%) |
| Computers & Mathematics | 0 (0.0%) | 0 (0.0%) |
| Architecture & Engineering | 0 (0.0%) | 0 (0.0%) |
| Life, Physical & Social Science | 0 (0.0%) | 0 (0.0%) |
| Community & Social Service | 9 (100.0%) | 0 (0.0%) |
| Education, Arts & Media | 0 (0.0%) | 0 (0.0%) |
| Legal Services & Support | 0 (0.0%) | 0 (0.0%) |
| Education Instruction & Library | 9 (100.0%) | 0 (0.0%) |
| Arts, Media & Entertainment | 0 (0.0%) | 0 (0.0%) |
| Health Diagnosing & Treating | 0 (0.0%) | 0 (0.0%) |
| Health Technologists | 0 (0.0%) | 0 (0.0%) |
| Total (Category) | 29 (100.0%) | 0 (0.0%) |
| Total (Overall) | 29 (43.9%) | 37 (56.1%) |
Services Occupations
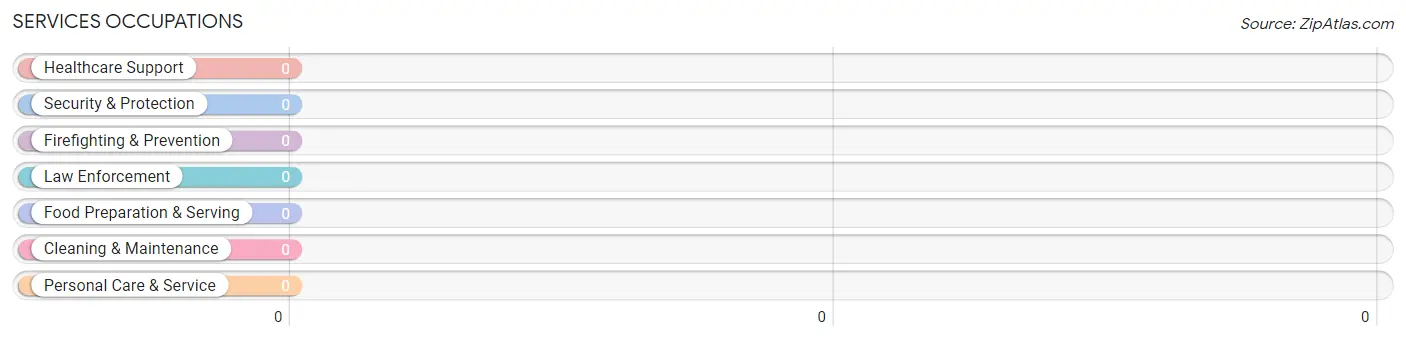
Services Occupations by Sex
| Occupation | Male | Female |
| Healthcare Support | 0 (0.0%) | 0 (0.0%) |
| Security & Protection | 0 (0.0%) | 0 (0.0%) |
| Firefighting & Prevention | 0 (0.0%) | 0 (0.0%) |
| Law Enforcement | 0 (0.0%) | 0 (0.0%) |
| Food Preparation & Serving | 0 (0.0%) | 0 (0.0%) |
| Cleaning & Maintenance | 0 (0.0%) | 0 (0.0%) |
| Personal Care & Service | 0 (0.0%) | 0 (0.0%) |
| Total (Category) | 0 (0.0%) | 0 (0.0%) |
| Total (Overall) | 29 (43.9%) | 37 (56.1%) |
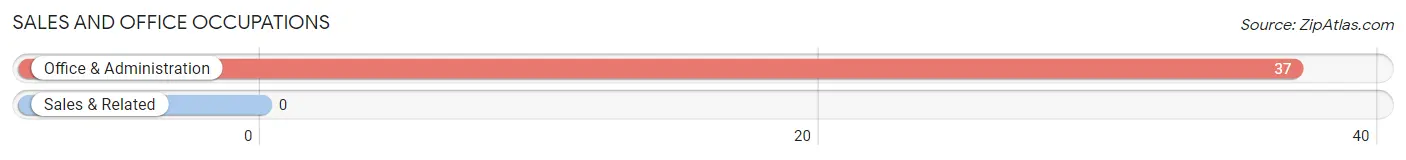
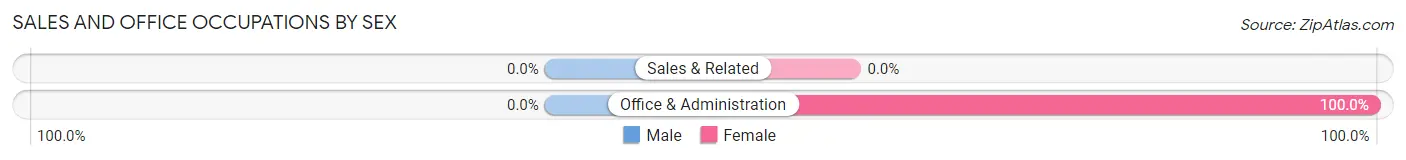
Sales and Office Occupations
The most common Sales and Office occupations in Payne Gap are , and Office & Administration (37 | 56.1%).
Sales and Office Occupations by Sex
| Occupation | Male | Female |
| Sales & Related | 0 (0.0%) | 0 (0.0%) |
| Office & Administration | 0 (0.0%) | 37 (100.0%) |
| Total (Category) | 0 (0.0%) | 37 (100.0%) |
| Total (Overall) | 29 (43.9%) | 37 (56.1%) |
Natural Resources, Construction and Maintenance Occupations
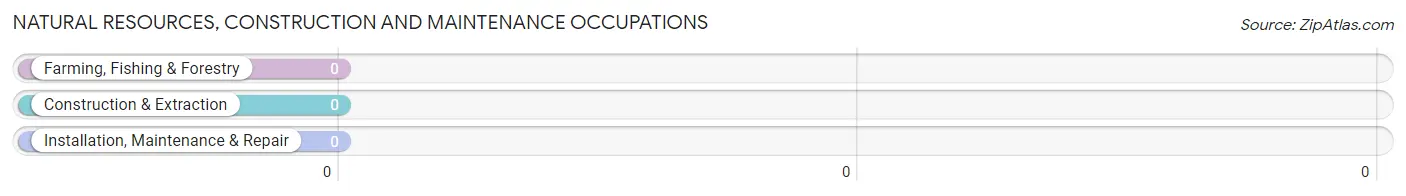
Natural Resources, Construction and Maintenance Occupations by Sex
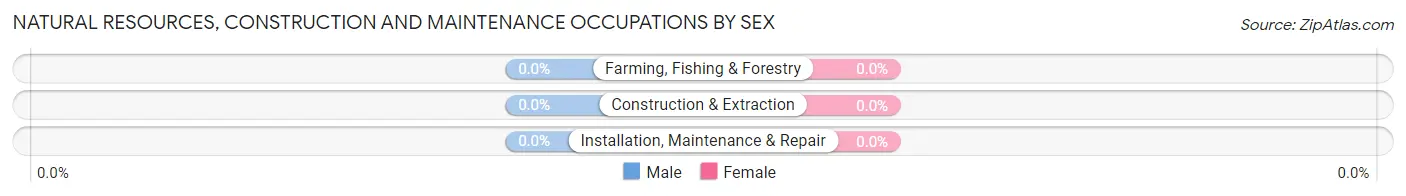
| Occupation | Male | Female |
| Farming, Fishing & Forestry | 0 (0.0%) | 0 (0.0%) |
| Construction & Extraction | 0 (0.0%) | 0 (0.0%) |
| Installation, Maintenance & Repair | 0 (0.0%) | 0 (0.0%) |
| Total (Category) | 0 (0.0%) | 0 (0.0%) |
| Total (Overall) | 29 (43.9%) | 37 (56.1%) |
Production, Transportation and Moving Occupations
Production, Transportation and Moving Occupations by Sex
| Occupation | Male | Female |
| Production | 0 (0.0%) | 0 (0.0%) |
| Transportation | 0 (0.0%) | 0 (0.0%) |
| Material Moving | 0 (0.0%) | 0 (0.0%) |
| Total (Category) | 0 (0.0%) | 0 (0.0%) |
| Total (Overall) | 29 (43.9%) | 37 (56.1%) |
Employment Industries by Sex in Payne Gap
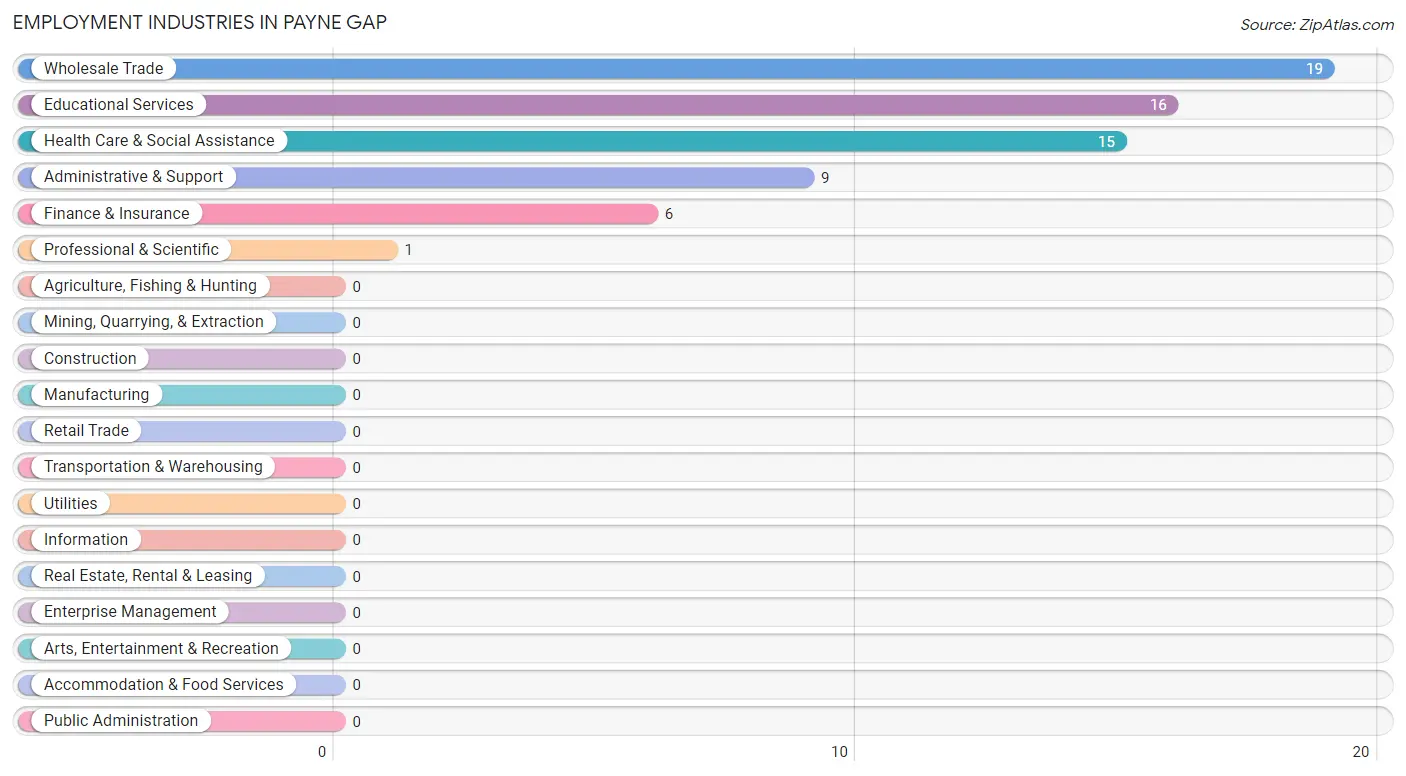
Employment Industries in Payne Gap
The major employment industries in Payne Gap include Wholesale Trade (19 | 28.8%), Educational Services (16 | 24.2%), Health Care & Social Assistance (15 | 22.7%), Administrative & Support (9 | 13.6%), and Finance & Insurance (6 | 9.1%).
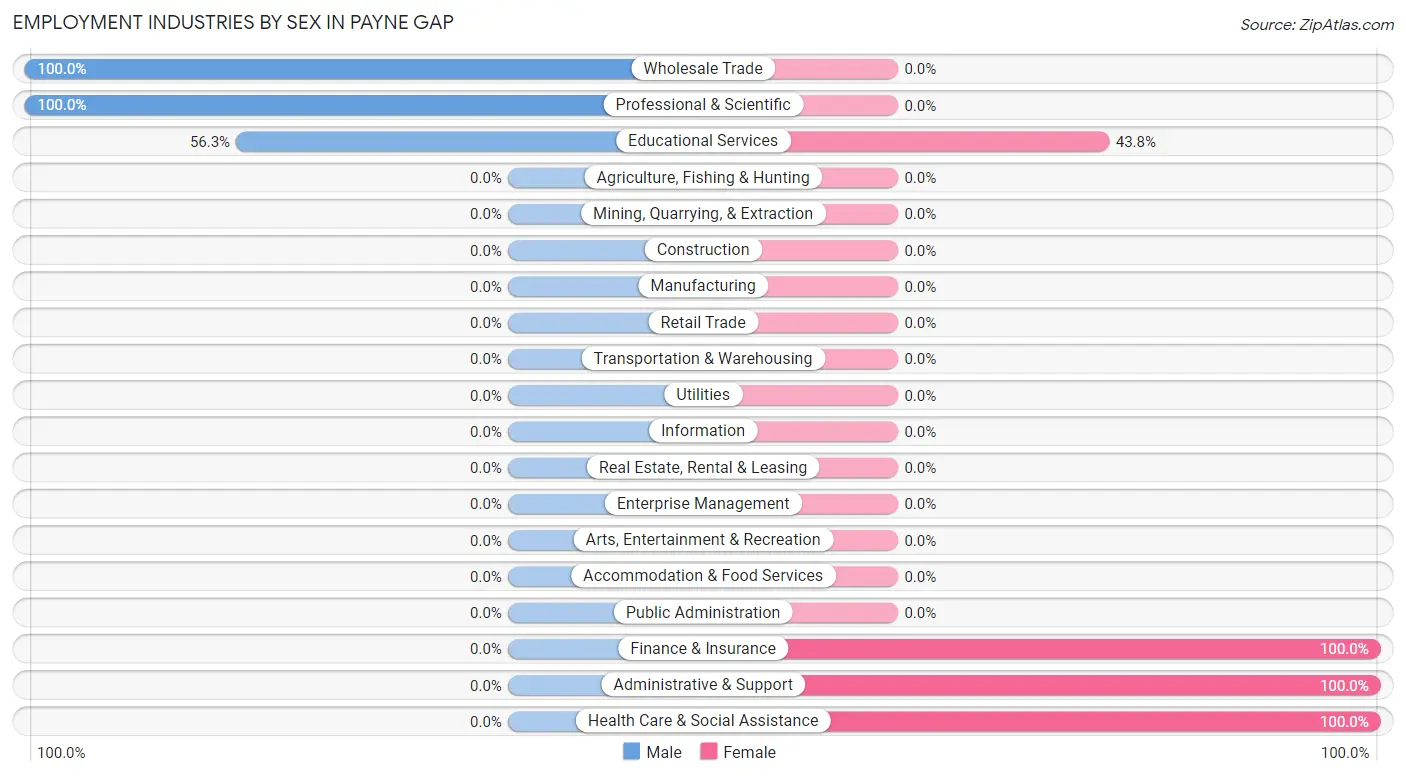
Employment Industries by Sex in Payne Gap
The Payne Gap industries that see more men than women are Wholesale Trade (100.0%), Professional & Scientific (100.0%), and Educational Services (56.2%), whereas the industries that tend to have a higher number of women are Finance & Insurance (100.0%), Administrative & Support (100.0%), and Health Care & Social Assistance (100.0%).
| Industry | Male | Female |
| Agriculture, Fishing & Hunting | 0 (0.0%) | 0 (0.0%) |
| Mining, Quarrying, & Extraction | 0 (0.0%) | 0 (0.0%) |
| Construction | 0 (0.0%) | 0 (0.0%) |
| Manufacturing | 0 (0.0%) | 0 (0.0%) |
| Wholesale Trade | 19 (100.0%) | 0 (0.0%) |
| Retail Trade | 0 (0.0%) | 0 (0.0%) |
| Transportation & Warehousing | 0 (0.0%) | 0 (0.0%) |
| Utilities | 0 (0.0%) | 0 (0.0%) |
| Information | 0 (0.0%) | 0 (0.0%) |
| Finance & Insurance | 0 (0.0%) | 6 (100.0%) |
| Real Estate, Rental & Leasing | 0 (0.0%) | 0 (0.0%) |
| Professional & Scientific | 1 (100.0%) | 0 (0.0%) |
| Enterprise Management | 0 (0.0%) | 0 (0.0%) |
| Administrative & Support | 0 (0.0%) | 9 (100.0%) |
| Educational Services | 9 (56.2%) | 7 (43.8%) |
| Health Care & Social Assistance | 0 (0.0%) | 15 (100.0%) |
| Arts, Entertainment & Recreation | 0 (0.0%) | 0 (0.0%) |
| Accommodation & Food Services | 0 (0.0%) | 0 (0.0%) |
| Public Administration | 0 (0.0%) | 0 (0.0%) |
| Total | 29 (43.9%) | 37 (56.1%) |
Education in Payne Gap
School Enrollment in Payne Gap
The most common levels of schooling among the 14 students in Payne Gap are elementary school (7 | 50.0%), and high school (7 | 50.0%).
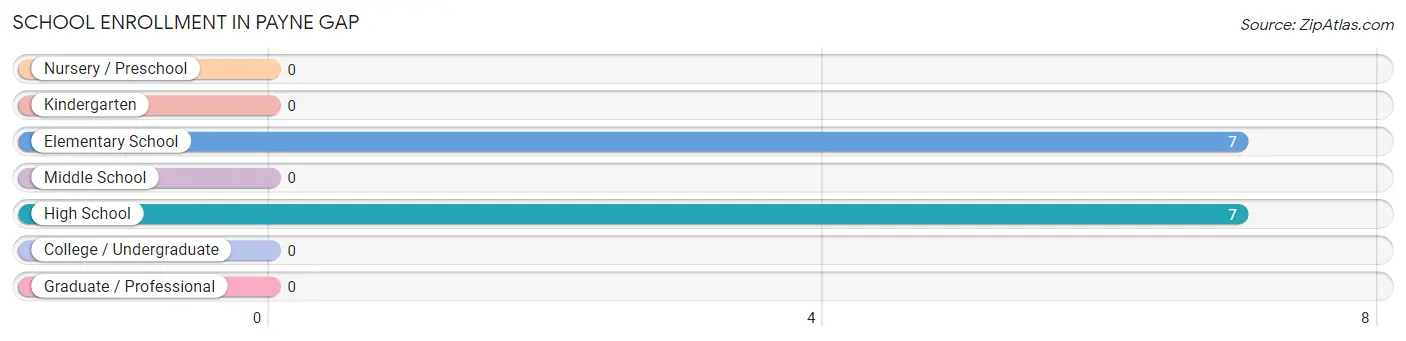
| School Level | # Students | % Students |
| Nursery / Preschool | 0 | 0.0% |
| Kindergarten | 0 | 0.0% |
| Elementary School | 7 | 50.0% |
| Middle School | 0 | 0.0% |
| High School | 7 | 50.0% |
| College / Undergraduate | 0 | 0.0% |
| Graduate / Professional | 0 | 0.0% |
| Total | 14 | 100.0% |
School Enrollment by Age by Funding Source in Payne Gap
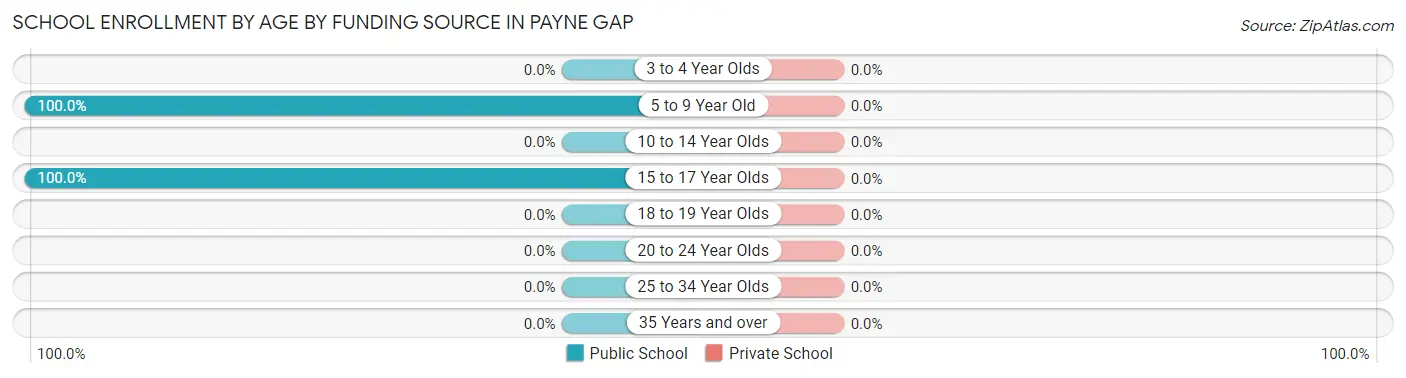
| Age Bracket | Public School | Private School |
| 3 to 4 Year Olds | 0 (0.0%) | 0 (0.0%) |
| 5 to 9 Year Old | 7 (100.0%) | 0 (0.0%) |
| 10 to 14 Year Olds | 0 (0.0%) | 0 (0.0%) |
| 15 to 17 Year Olds | 7 (100.0%) | 0 (0.0%) |
| 18 to 19 Year Olds | 0 (0.0%) | 0 (0.0%) |
| 20 to 24 Year Olds | 0 (0.0%) | 0 (0.0%) |
| 25 to 34 Year Olds | 0 (0.0%) | 0 (0.0%) |
| 35 Years and over | 0 (0.0%) | 0 (0.0%) |
| Total | 14 (100.0%) | 0 (0.0%) |
Educational Attainment by Field of Study in Payne Gap
, and business (9 | 100.0%) are the most common fields of study among 9 individuals in Payne Gap who have obtained a bachelor's degree or higher.
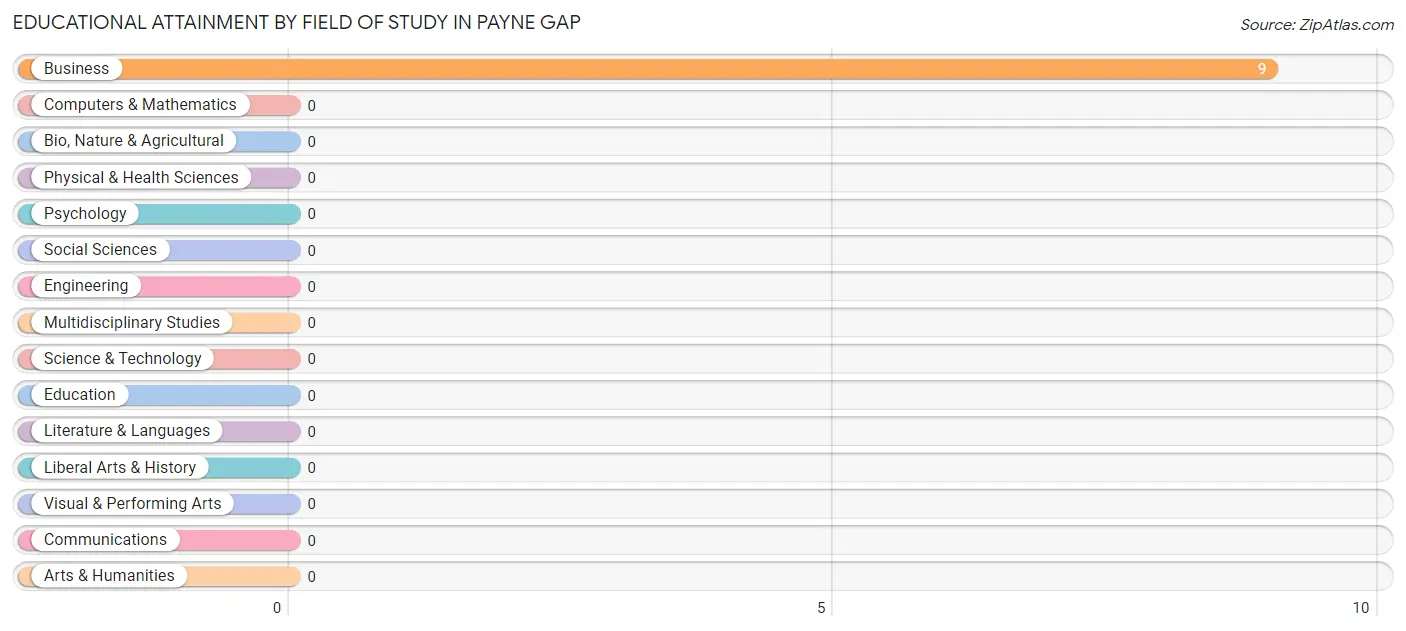
| Field of Study | # Graduates | % Graduates |
| Computers & Mathematics | 0 | 0.0% |
| Bio, Nature & Agricultural | 0 | 0.0% |
| Physical & Health Sciences | 0 | 0.0% |
| Psychology | 0 | 0.0% |
| Social Sciences | 0 | 0.0% |
| Engineering | 0 | 0.0% |
| Multidisciplinary Studies | 0 | 0.0% |
| Science & Technology | 0 | 0.0% |
| Business | 9 | 100.0% |
| Education | 0 | 0.0% |
| Literature & Languages | 0 | 0.0% |
| Liberal Arts & History | 0 | 0.0% |
| Visual & Performing Arts | 0 | 0.0% |
| Communications | 0 | 0.0% |
| Arts & Humanities | 0 | 0.0% |
| Total | 9 | 100.0% |
Transportation & Commute in Payne Gap
Vehicle Availability by Sex in Payne Gap
The most prevalent vehicle ownership categories in Payne Gap are males with 3 vehicles (19, accounting for 65.5%) and females with 3 vehicles (13, making up 51.3%).
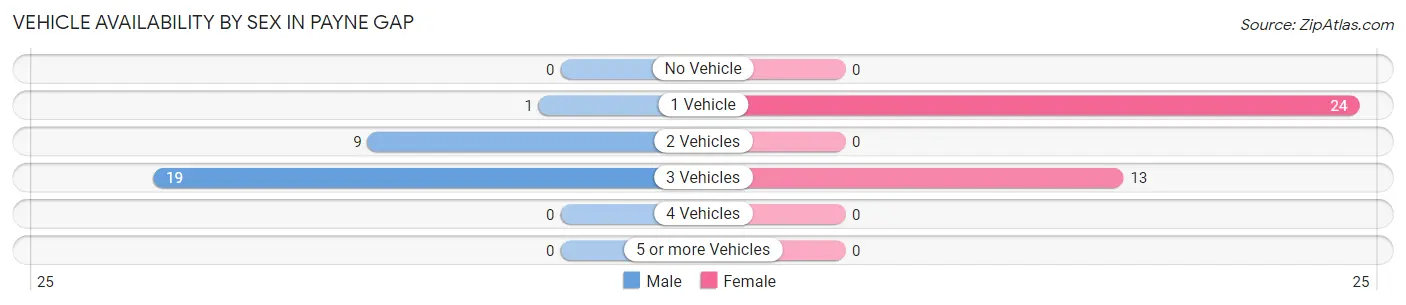
| Vehicles Available | Male | Female |
| No Vehicle | 0 (0.0%) | 0 (0.0%) |
| 1 Vehicle | 1 (3.5%) | 24 (64.9%) |
| 2 Vehicles | 9 (31.0%) | 0 (0.0%) |
| 3 Vehicles | 19 (65.5%) | 13 (35.1%) |
| 4 Vehicles | 0 (0.0%) | 0 (0.0%) |
| 5 or more Vehicles | 0 (0.0%) | 0 (0.0%) |
| Total | 29 (100.0%) | 37 (100.0%) |
Commute Time in Payne Gap
The most frequently occuring commute durations in Payne Gap are 5 to 9 minutes (24 commuters, 36.4%), 25 to 29 minutes (19 commuters, 28.8%), and 60 to 89 minutes (15 commuters, 22.7%).
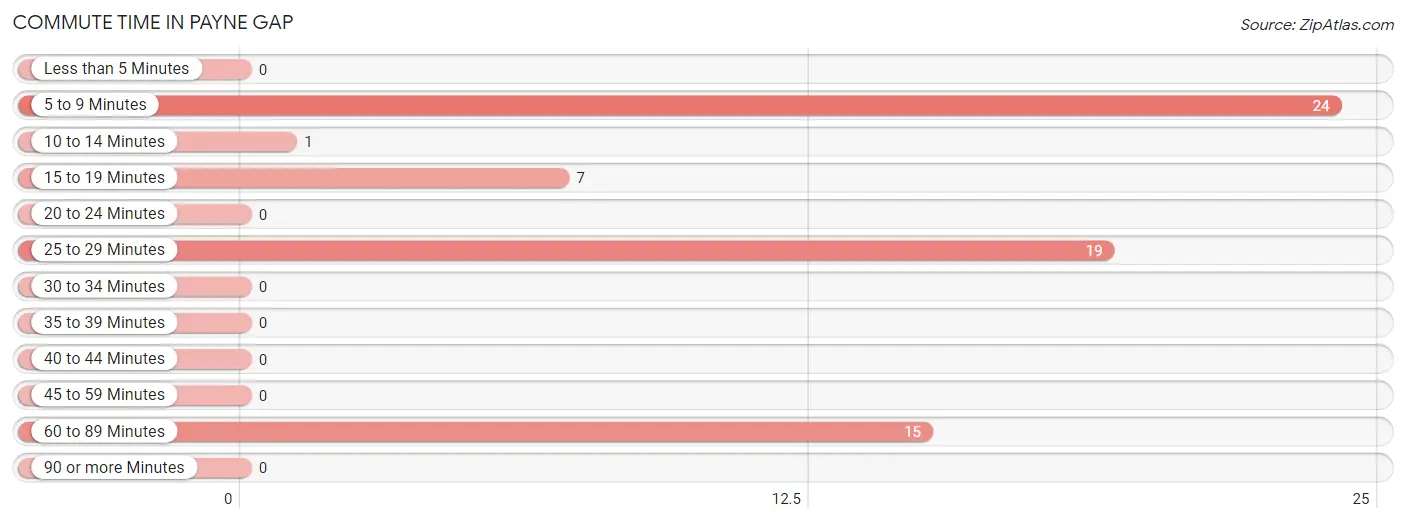
| Commute Time | # Commuters | % Commuters |
| Less than 5 Minutes | 0 | 0.0% |
| 5 to 9 Minutes | 24 | 36.4% |
| 10 to 14 Minutes | 1 | 1.5% |
| 15 to 19 Minutes | 7 | 10.6% |
| 20 to 24 Minutes | 0 | 0.0% |
| 25 to 29 Minutes | 19 | 28.8% |
| 30 to 34 Minutes | 0 | 0.0% |
| 35 to 39 Minutes | 0 | 0.0% |
| 40 to 44 Minutes | 0 | 0.0% |
| 45 to 59 Minutes | 0 | 0.0% |
| 60 to 89 Minutes | 15 | 22.7% |
| 90 or more Minutes | 0 | 0.0% |
Commute Time by Sex in Payne Gap
The most common commute times in Payne Gap are 25 to 29 minutes (19 commuters, 65.5%) for males and 5 to 9 minutes (15 commuters, 40.5%) for females.
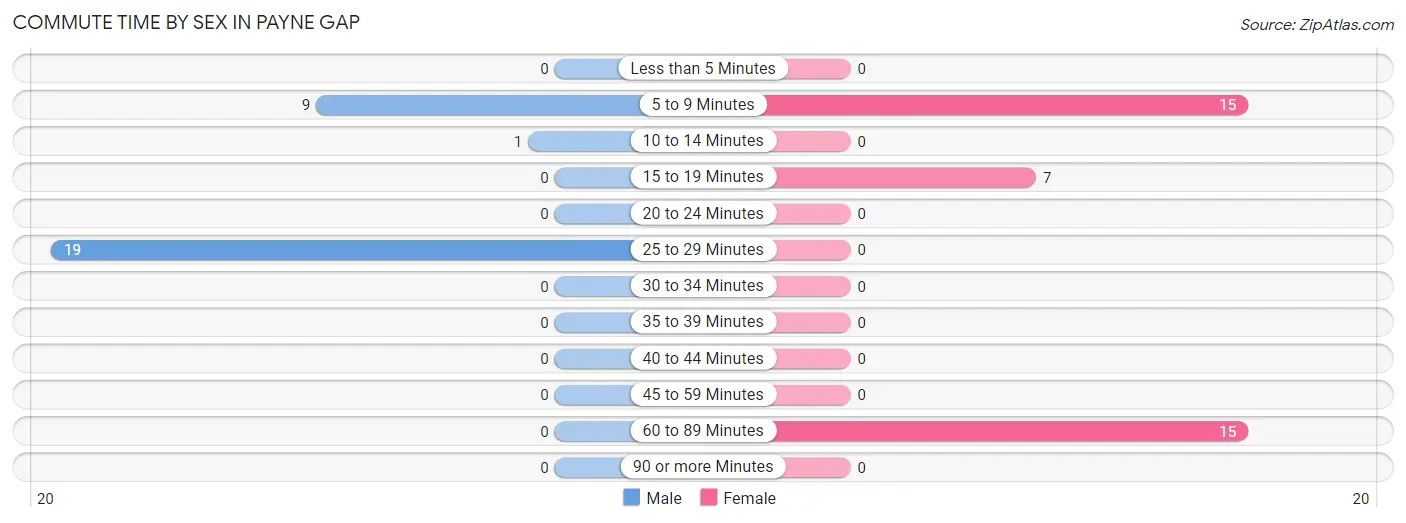
| Commute Time | Male | Female |
| Less than 5 Minutes | 0 (0.0%) | 0 (0.0%) |
| 5 to 9 Minutes | 9 (31.0%) | 15 (40.5%) |
| 10 to 14 Minutes | 1 (3.5%) | 0 (0.0%) |
| 15 to 19 Minutes | 0 (0.0%) | 7 (18.9%) |
| 20 to 24 Minutes | 0 (0.0%) | 0 (0.0%) |
| 25 to 29 Minutes | 19 (65.5%) | 0 (0.0%) |
| 30 to 34 Minutes | 0 (0.0%) | 0 (0.0%) |
| 35 to 39 Minutes | 0 (0.0%) | 0 (0.0%) |
| 40 to 44 Minutes | 0 (0.0%) | 0 (0.0%) |
| 45 to 59 Minutes | 0 (0.0%) | 0 (0.0%) |
| 60 to 89 Minutes | 0 (0.0%) | 15 (40.5%) |
| 90 or more Minutes | 0 (0.0%) | 0 (0.0%) |
Time of Departure to Work by Sex in Payne Gap
The most frequent times of departure to work in Payne Gap are 6:00 AM to 6:29 AM (19, 65.5%) for males and 7:30 AM to 7:59 AM (24, 64.9%) for females.
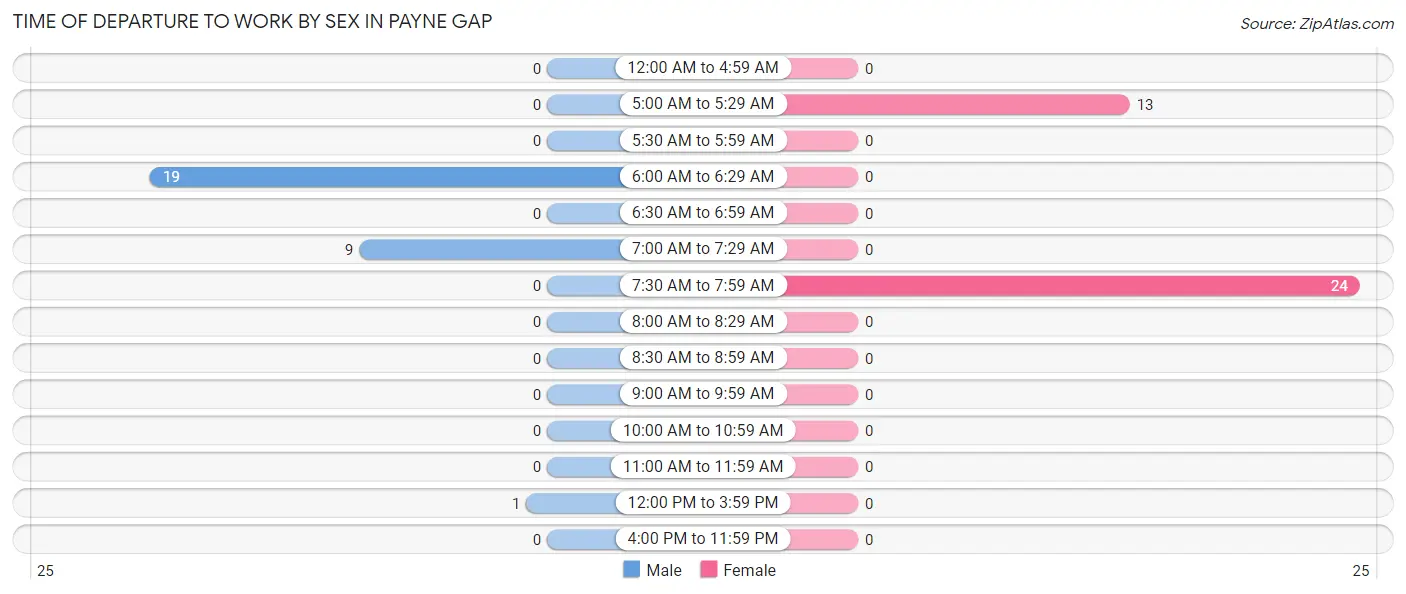
| Time of Departure | Male | Female |
| 12:00 AM to 4:59 AM | 0 (0.0%) | 0 (0.0%) |
| 5:00 AM to 5:29 AM | 0 (0.0%) | 13 (35.1%) |
| 5:30 AM to 5:59 AM | 0 (0.0%) | 0 (0.0%) |
| 6:00 AM to 6:29 AM | 19 (65.5%) | 0 (0.0%) |
| 6:30 AM to 6:59 AM | 0 (0.0%) | 0 (0.0%) |
| 7:00 AM to 7:29 AM | 9 (31.0%) | 0 (0.0%) |
| 7:30 AM to 7:59 AM | 0 (0.0%) | 24 (64.9%) |
| 8:00 AM to 8:29 AM | 0 (0.0%) | 0 (0.0%) |
| 8:30 AM to 8:59 AM | 0 (0.0%) | 0 (0.0%) |
| 9:00 AM to 9:59 AM | 0 (0.0%) | 0 (0.0%) |
| 10:00 AM to 10:59 AM | 0 (0.0%) | 0 (0.0%) |
| 11:00 AM to 11:59 AM | 0 (0.0%) | 0 (0.0%) |
| 12:00 PM to 3:59 PM | 1 (3.5%) | 0 (0.0%) |
| 4:00 PM to 11:59 PM | 0 (0.0%) | 0 (0.0%) |
| Total | 29 (100.0%) | 37 (100.0%) |
Housing Occupancy in Payne Gap
Occupancy by Ownership in Payne Gap
Of the total 149 dwellings in Payne Gap, owner-occupied units account for 134 (89.9%), while renter-occupied units make up 15 (10.1%).
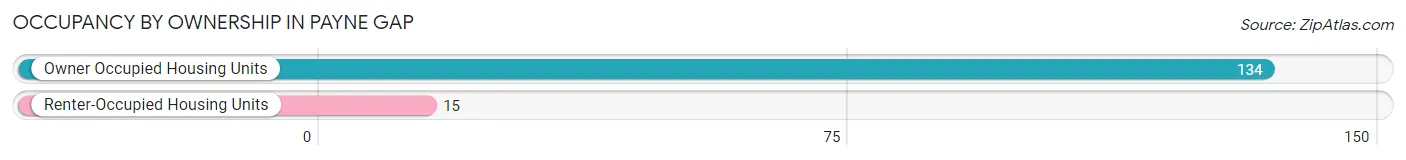
| Occupancy | # Housing Units | % Housing Units |
| Owner Occupied Housing Units | 134 | 89.9% |
| Renter-Occupied Housing Units | 15 | 10.1% |
| Total Occupied Housing Units | 149 | 100.0% |
Occupancy by Household Size in Payne Gap
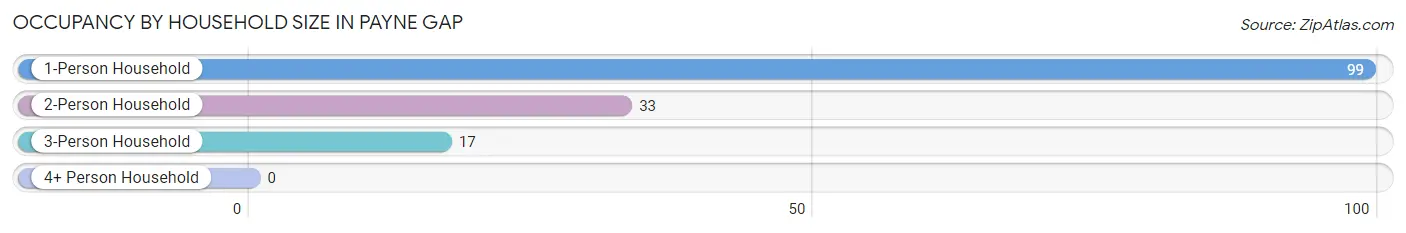
| Household Size | # Housing Units | % Housing Units |
| 1-Person Household | 99 | 66.4% |
| 2-Person Household | 33 | 22.2% |
| 3-Person Household | 17 | 11.4% |
| 4+ Person Household | 0 | 0.0% |
| Total Housing Units | 149 | 100.0% |
Occupancy by Ownership by Household Size in Payne Gap
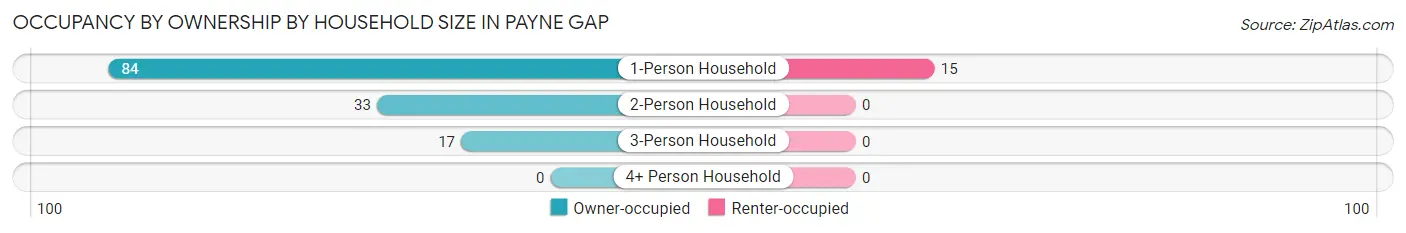
| Household Size | Owner-occupied | Renter-occupied |
| 1-Person Household | 84 (84.9%) | 15 (15.1%) |
| 2-Person Household | 33 (100.0%) | 0 (0.0%) |
| 3-Person Household | 17 (100.0%) | 0 (0.0%) |
| 4+ Person Household | 0 (0.0%) | 0 (0.0%) |
| Total Housing Units | 134 (89.9%) | 15 (10.1%) |
Occupancy by Educational Attainment in Payne Gap
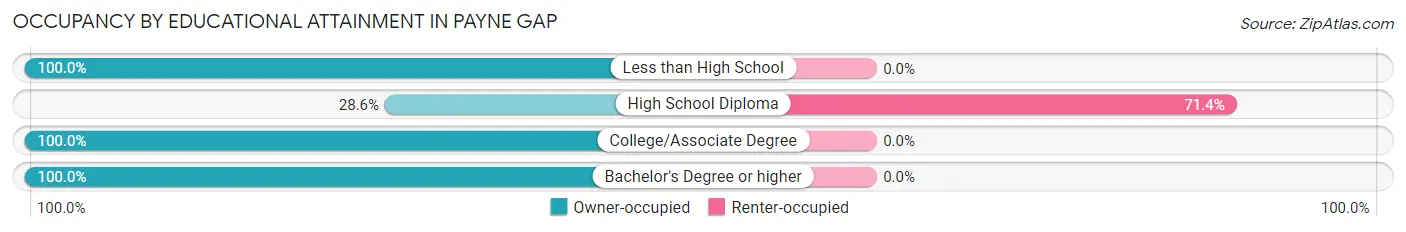
| Household Size | Owner-occupied | Renter-occupied |
| Less than High School | 6 (100.0%) | 0 (0.0%) |
| High School Diploma | 6 (28.6%) | 15 (71.4%) |
| College/Associate Degree | 113 (100.0%) | 0 (0.0%) |
| Bachelor's Degree or higher | 9 (100.0%) | 0 (0.0%) |
Occupancy by Age of Householder in Payne Gap
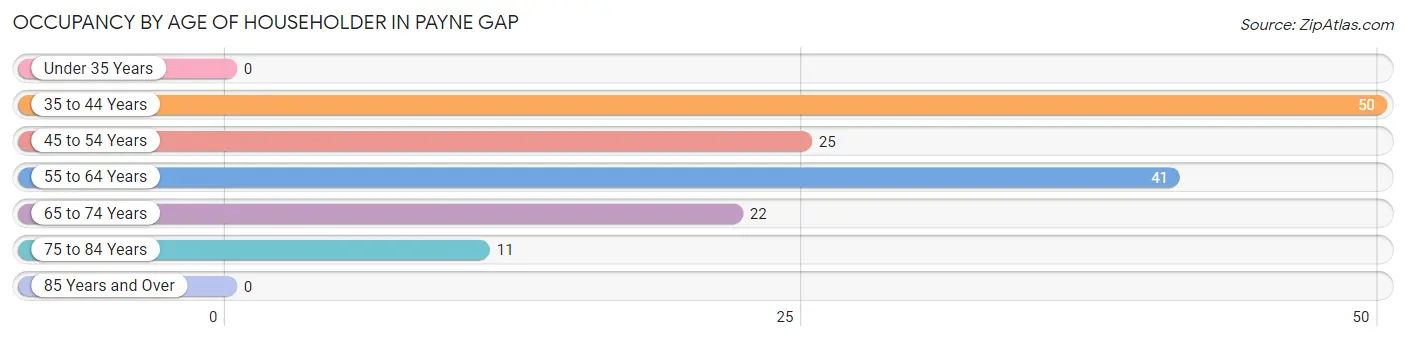
| Age Bracket | # Households | % Households |
| Under 35 Years | 0 | 0.0% |
| 35 to 44 Years | 50 | 33.6% |
| 45 to 54 Years | 25 | 16.8% |
| 55 to 64 Years | 41 | 27.5% |
| 65 to 74 Years | 22 | 14.8% |
| 75 to 84 Years | 11 | 7.4% |
| 85 Years and Over | 0 | 0.0% |
| Total | 149 | 100.0% |
Housing Finances in Payne Gap
Median Income by Occupancy in Payne Gap
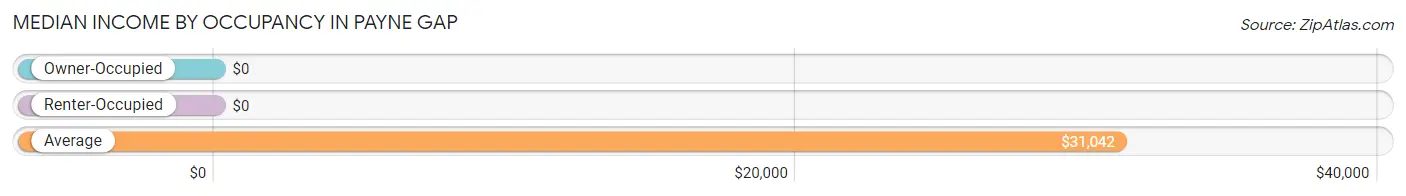
| Occupancy Type | # Households | Median Income |
| Owner-Occupied | 134 (89.9%) | $0 |
| Renter-Occupied | 15 (10.1%) | $0 |
| Average | 149 (100.0%) | $31,042 |
Occupancy by Householder Income Bracket in Payne Gap
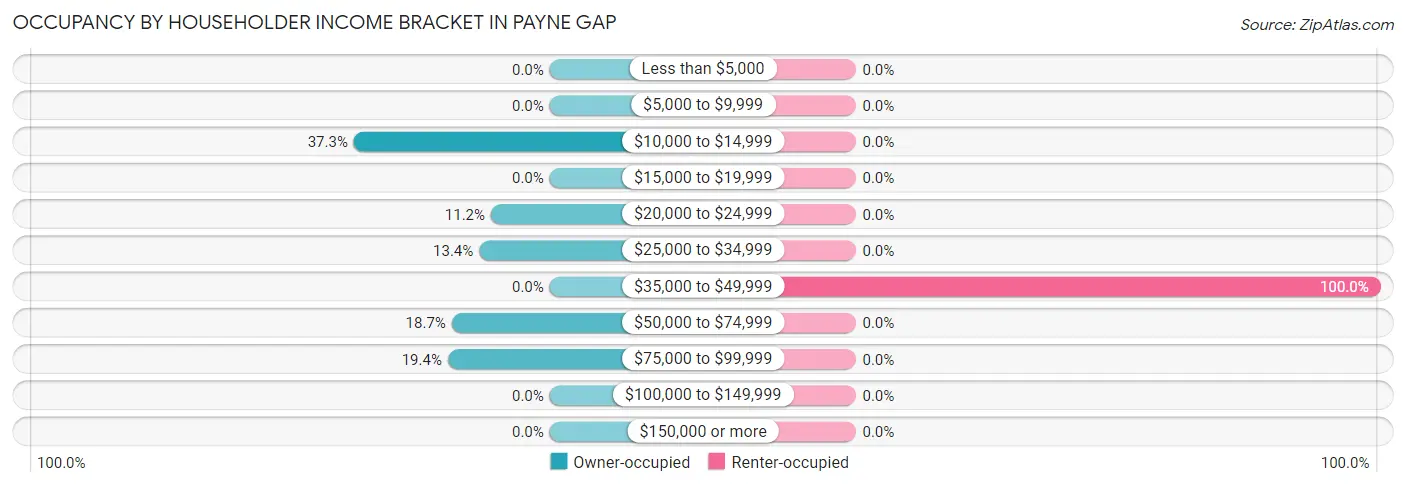
| Income Bracket | Owner-occupied | Renter-occupied |
| Less than $5,000 | 0 (0.0%) | 0 (0.0%) |
| $5,000 to $9,999 | 0 (0.0%) | 0 (0.0%) |
| $10,000 to $14,999 | 50 (37.3%) | 0 (0.0%) |
| $15,000 to $19,999 | 0 (0.0%) | 0 (0.0%) |
| $20,000 to $24,999 | 15 (11.2%) | 0 (0.0%) |
| $25,000 to $34,999 | 18 (13.4%) | 0 (0.0%) |
| $35,000 to $49,999 | 0 (0.0%) | 15 (100.0%) |
| $50,000 to $74,999 | 25 (18.7%) | 0 (0.0%) |
| $75,000 to $99,999 | 26 (19.4%) | 0 (0.0%) |
| $100,000 to $149,999 | 0 (0.0%) | 0 (0.0%) |
| $150,000 or more | 0 (0.0%) | 0 (0.0%) |
| Total | 134 (100.0%) | 15 (100.0%) |
Monthly Housing Cost Tiers in Payne Gap
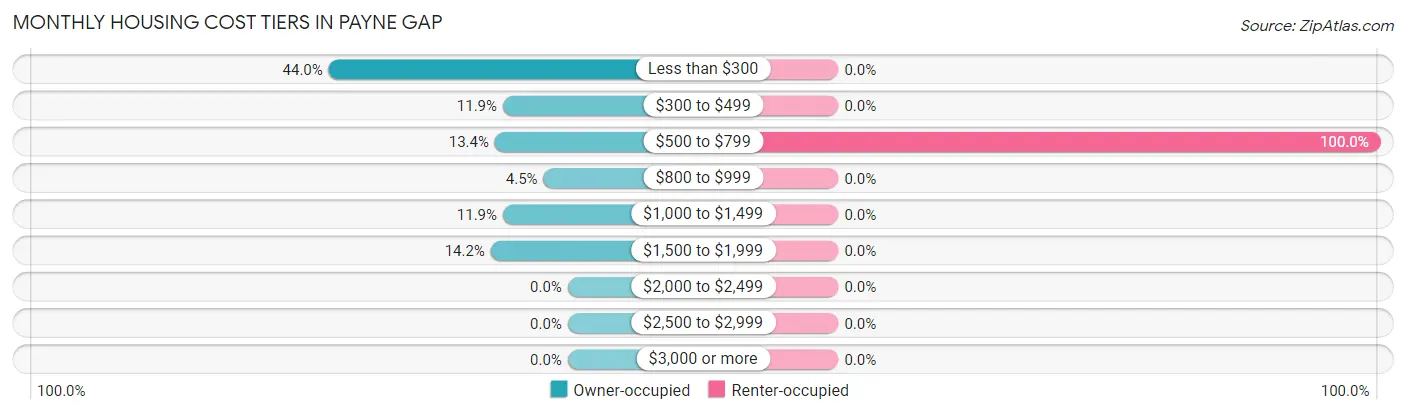
| Monthly Cost | Owner-occupied | Renter-occupied |
| Less than $300 | 59 (44.0%) | 0 (0.0%) |
| $300 to $499 | 16 (11.9%) | 0 (0.0%) |
| $500 to $799 | 18 (13.4%) | 15 (100.0%) |
| $800 to $999 | 6 (4.5%) | 0 (0.0%) |
| $1,000 to $1,499 | 16 (11.9%) | 0 (0.0%) |
| $1,500 to $1,999 | 19 (14.2%) | 0 (0.0%) |
| $2,000 to $2,499 | 0 (0.0%) | 0 (0.0%) |
| $2,500 to $2,999 | 0 (0.0%) | 0 (0.0%) |
| $3,000 or more | 0 (0.0%) | 0 (0.0%) |
| Total | 134 (100.0%) | 15 (100.0%) |
Physical Housing Characteristics in Payne Gap
Housing Structures in Payne Gap
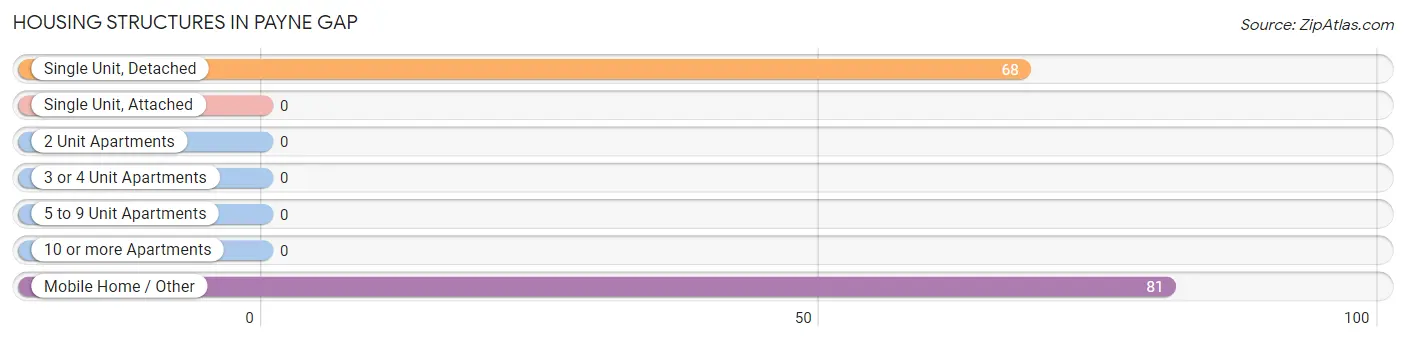
| Structure Type | # Housing Units | % Housing Units |
| Single Unit, Detached | 68 | 45.6% |
| Single Unit, Attached | 0 | 0.0% |
| 2 Unit Apartments | 0 | 0.0% |
| 3 or 4 Unit Apartments | 0 | 0.0% |
| 5 to 9 Unit Apartments | 0 | 0.0% |
| 10 or more Apartments | 0 | 0.0% |
| Mobile Home / Other | 81 | 54.4% |
| Total | 149 | 100.0% |
Housing Structures by Occupancy in Payne Gap
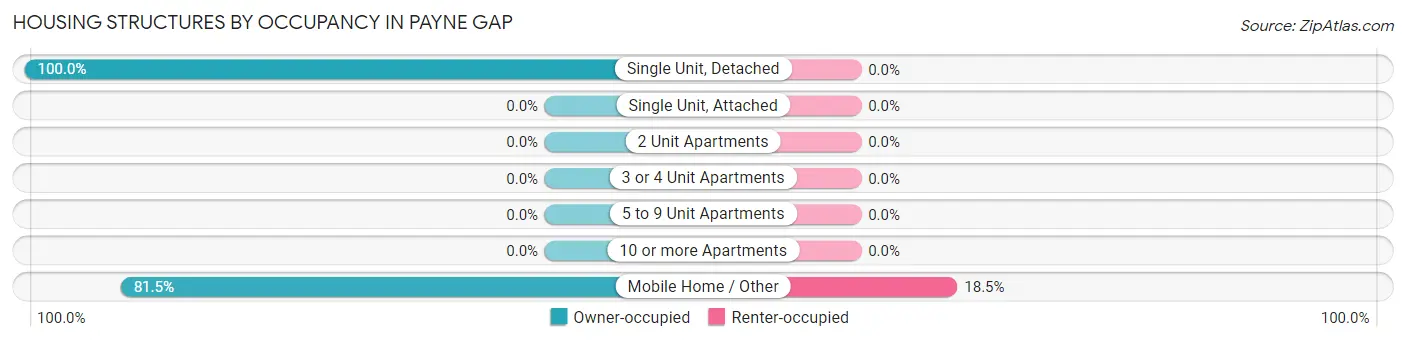
| Structure Type | Owner-occupied | Renter-occupied |
| Single Unit, Detached | 68 (100.0%) | 0 (0.0%) |
| Single Unit, Attached | 0 (0.0%) | 0 (0.0%) |
| 2 Unit Apartments | 0 (0.0%) | 0 (0.0%) |
| 3 or 4 Unit Apartments | 0 (0.0%) | 0 (0.0%) |
| 5 to 9 Unit Apartments | 0 (0.0%) | 0 (0.0%) |
| 10 or more Apartments | 0 (0.0%) | 0 (0.0%) |
| Mobile Home / Other | 66 (81.5%) | 15 (18.5%) |
| Total | 134 (89.9%) | 15 (10.1%) |
Housing Structures by Number of Rooms in Payne Gap
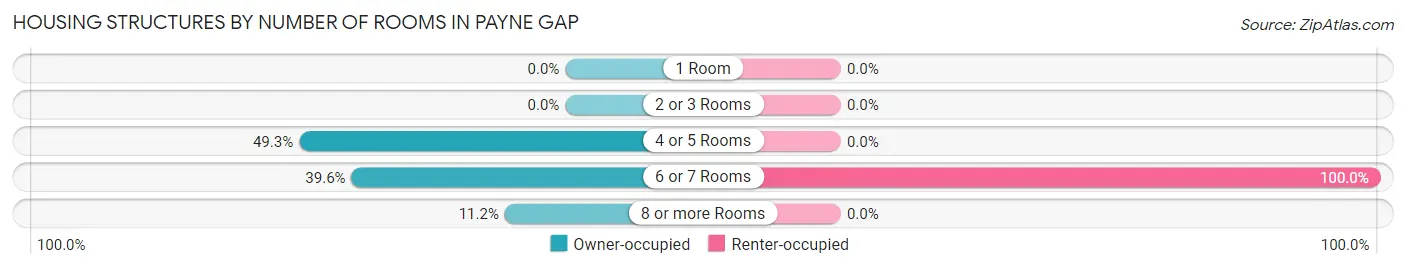
| Number of Rooms | Owner-occupied | Renter-occupied |
| 1 Room | 0 (0.0%) | 0 (0.0%) |
| 2 or 3 Rooms | 0 (0.0%) | 0 (0.0%) |
| 4 or 5 Rooms | 66 (49.2%) | 0 (0.0%) |
| 6 or 7 Rooms | 53 (39.6%) | 15 (100.0%) |
| 8 or more Rooms | 15 (11.2%) | 0 (0.0%) |
| Total | 134 (100.0%) | 15 (100.0%) |
Housing Structure by Heating Type in Payne Gap
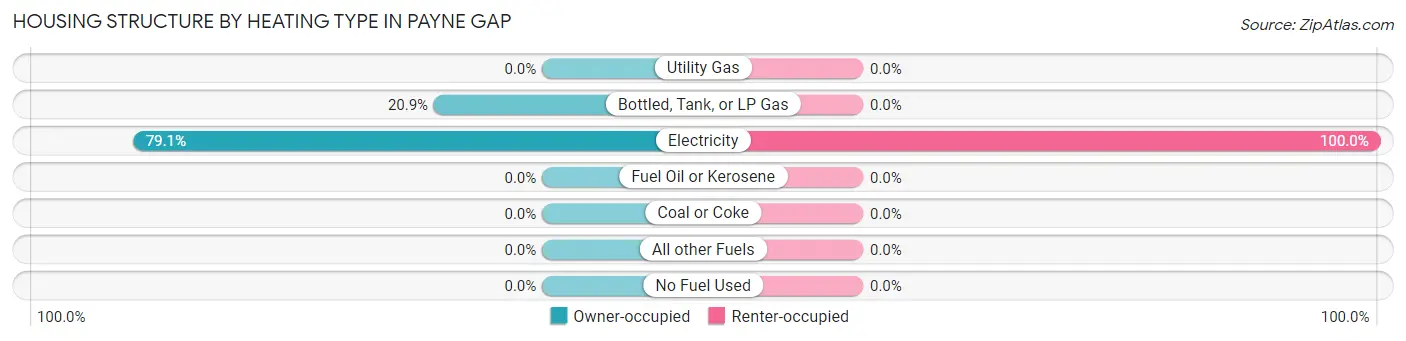
| Heating Type | Owner-occupied | Renter-occupied |
| Utility Gas | 0 (0.0%) | 0 (0.0%) |
| Bottled, Tank, or LP Gas | 28 (20.9%) | 0 (0.0%) |
| Electricity | 106 (79.1%) | 15 (100.0%) |
| Fuel Oil or Kerosene | 0 (0.0%) | 0 (0.0%) |
| Coal or Coke | 0 (0.0%) | 0 (0.0%) |
| All other Fuels | 0 (0.0%) | 0 (0.0%) |
| No Fuel Used | 0 (0.0%) | 0 (0.0%) |
| Total | 134 (100.0%) | 15 (100.0%) |
Household Vehicle Usage in Payne Gap
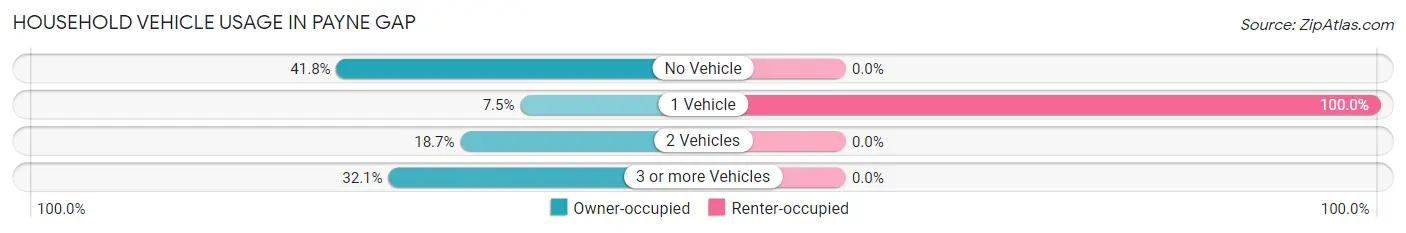
| Vehicles per Household | Owner-occupied | Renter-occupied |
| No Vehicle | 56 (41.8%) | 0 (0.0%) |
| 1 Vehicle | 10 (7.5%) | 15 (100.0%) |
| 2 Vehicles | 25 (18.7%) | 0 (0.0%) |
| 3 or more Vehicles | 43 (32.1%) | 0 (0.0%) |
| Total | 134 (100.0%) | 15 (100.0%) |
Real Estate & Mortgages in Payne Gap
Real Estate and Mortgage Overview in Payne Gap
| Characteristic | Without Mortgage | With Mortgage |
| Housing Units | 86 | 48 |
| Median Property Value | - | - |
| Median Household Income | - | - |
| Monthly Housing Costs | $284 | $0 |
| Real Estate Taxes | $700 | $0 |
Property Value by Mortgage Status in Payne Gap
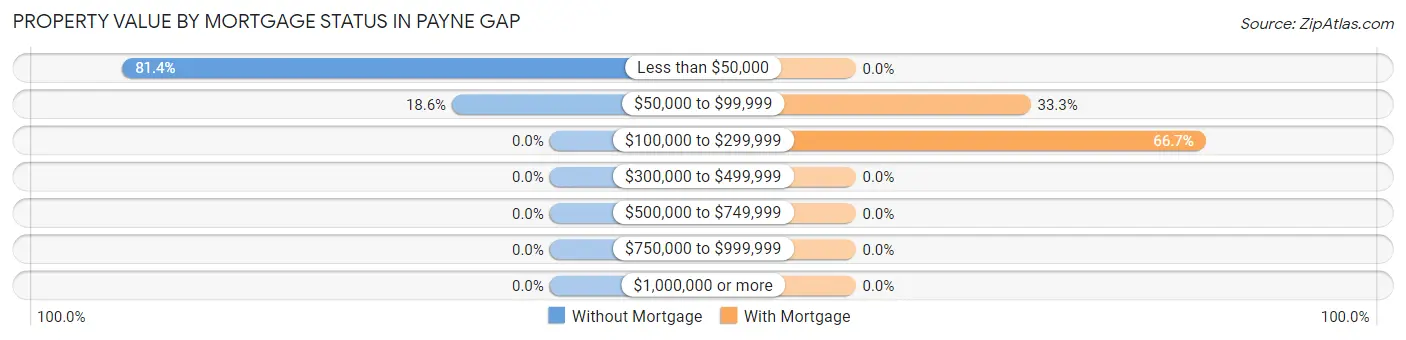
| Property Value | Without Mortgage | With Mortgage |
| Less than $50,000 | 70 (81.4%) | 0 (0.0%) |
| $50,000 to $99,999 | 16 (18.6%) | 16 (33.3%) |
| $100,000 to $299,999 | 0 (0.0%) | 32 (66.7%) |
| $300,000 to $499,999 | 0 (0.0%) | 0 (0.0%) |
| $500,000 to $749,999 | 0 (0.0%) | 0 (0.0%) |
| $750,000 to $999,999 | 0 (0.0%) | 0 (0.0%) |
| $1,000,000 or more | 0 (0.0%) | 0 (0.0%) |
| Total | 86 (100.0%) | 48 (100.0%) |
Household Income by Mortgage Status in Payne Gap
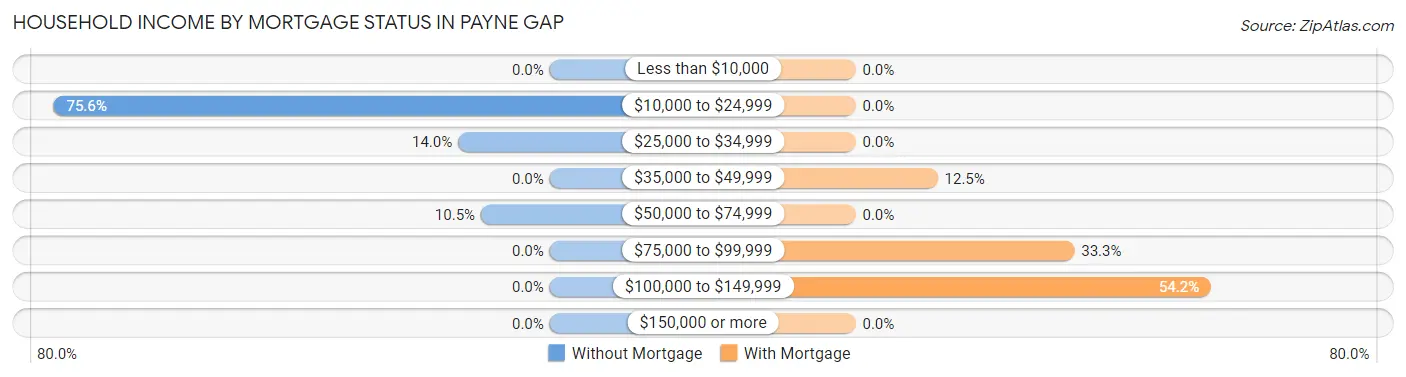
| Household Income | Without Mortgage | With Mortgage |
| Less than $10,000 | 0 (0.0%) | 0 (0.0%) |
| $10,000 to $24,999 | 65 (75.6%) | 0 (0.0%) |
| $25,000 to $34,999 | 12 (14.0%) | 0 (0.0%) |
| $35,000 to $49,999 | 0 (0.0%) | 6 (12.5%) |
| $50,000 to $74,999 | 9 (10.5%) | 0 (0.0%) |
| $75,000 to $99,999 | 0 (0.0%) | 16 (33.3%) |
| $100,000 to $149,999 | 0 (0.0%) | 26 (54.2%) |
| $150,000 or more | 0 (0.0%) | 0 (0.0%) |
| Total | 86 (100.0%) | 48 (100.0%) |
Property Value to Household Income Ratio in Payne Gap
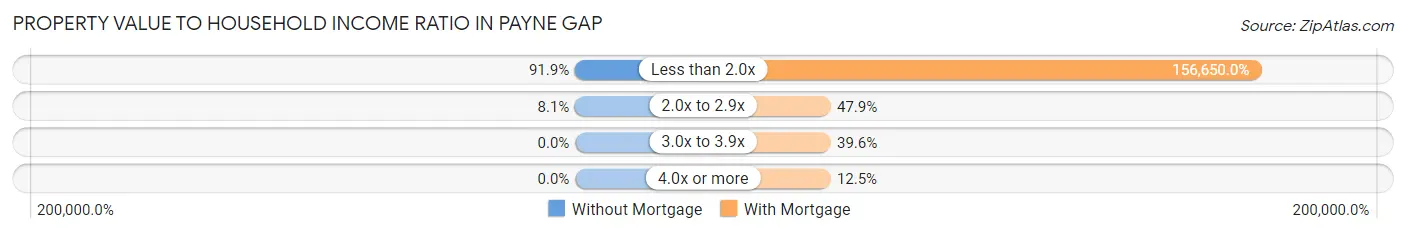
| Value-to-Income Ratio | Without Mortgage | With Mortgage |
| Less than 2.0x | 79 (91.9%) | 75,192 (156,650.0%) |
| 2.0x to 2.9x | 7 (8.1%) | 23 (47.9%) |
| 3.0x to 3.9x | 0 (0.0%) | 19 (39.6%) |
| 4.0x or more | 0 (0.0%) | 6 (12.5%) |
| Total | 86 (100.0%) | 48 (100.0%) |
Real Estate Taxes by Mortgage Status in Payne Gap
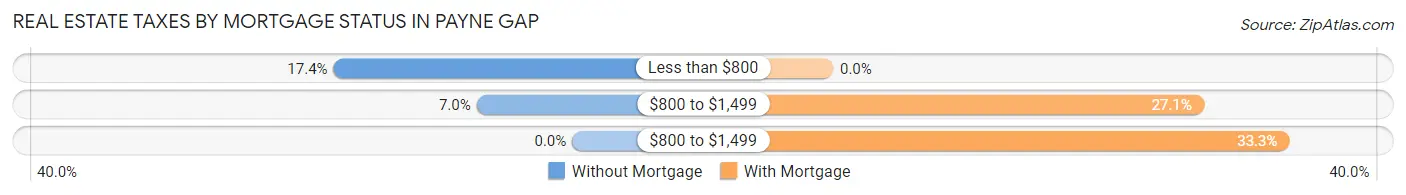
| Property Taxes | Without Mortgage | With Mortgage |
| Less than $800 | 15 (17.4%) | 0 (0.0%) |
| $800 to $1,499 | 6 (7.0%) | 13 (27.1%) |
| $800 to $1,499 | 0 (0.0%) | 16 (33.3%) |
| Total | 86 (100.0%) | 48 (100.0%) |
Health & Disability in Payne Gap
Health Insurance Coverage by Age in Payne Gap
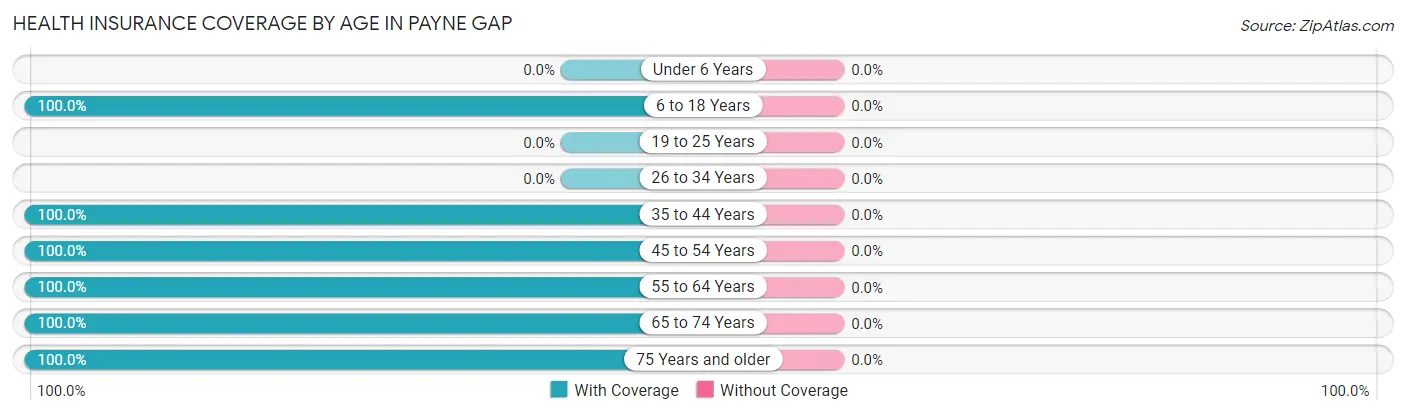
| Age Bracket | With Coverage | Without Coverage |
| Under 6 Years | 0 (0.0%) | 0 (0.0%) |
| 6 to 18 Years | 14 (100.0%) | 0 (0.0%) |
| 19 to 25 Years | 0 (0.0%) | 0 (0.0%) |
| 26 to 34 Years | 0 (0.0%) | 0 (0.0%) |
| 35 to 44 Years | 52 (100.0%) | 0 (0.0%) |
| 45 to 54 Years | 74 (100.0%) | 0 (0.0%) |
| 55 to 64 Years | 53 (100.0%) | 0 (0.0%) |
| 65 to 74 Years | 22 (100.0%) | 0 (0.0%) |
| 75 Years and older | 15 (100.0%) | 0 (0.0%) |
| Total | 230 (100.0%) | 0 (0.0%) |
Health Insurance Coverage by Citizenship Status in Payne Gap
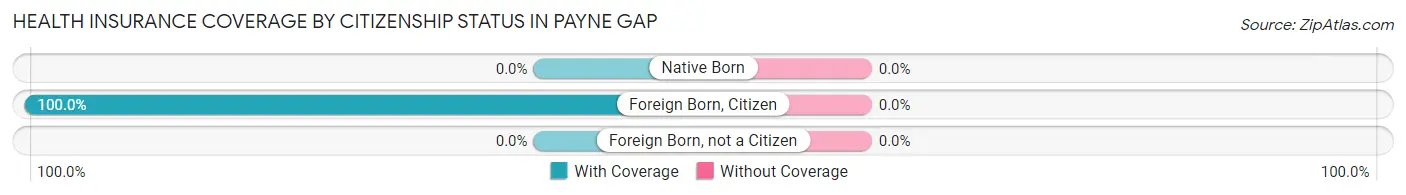
| Citizenship Status | With Coverage | Without Coverage |
| Native Born | 0 (0.0%) | 0 (0.0%) |
| Foreign Born, Citizen | 14 (100.0%) | 0 (0.0%) |
| Foreign Born, not a Citizen | 0 (0.0%) | 0 (0.0%) |
Health Insurance Coverage by Household Income in Payne Gap
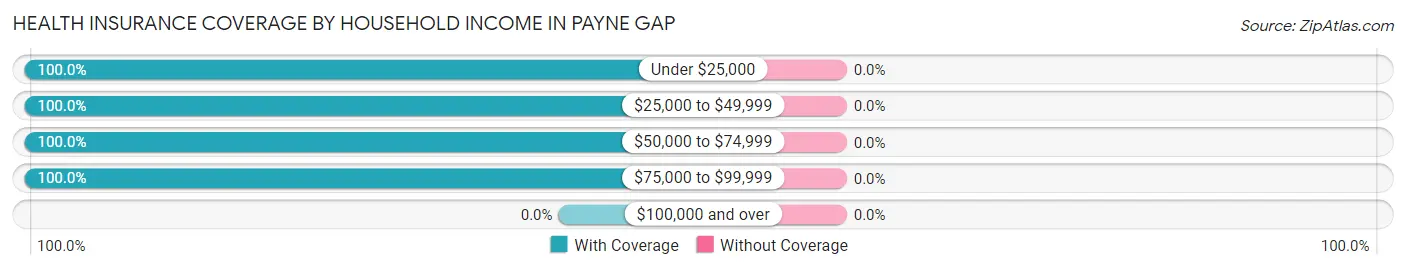
| Household Income | With Coverage | Without Coverage |
| Under $25,000 | 71 (100.0%) | 0 (0.0%) |
| $25,000 to $49,999 | 46 (100.0%) | 0 (0.0%) |
| $50,000 to $74,999 | 74 (100.0%) | 0 (0.0%) |
| $75,000 to $99,999 | 39 (100.0%) | 0 (0.0%) |
| $100,000 and over | 0 (0.0%) | 0 (0.0%) |
Public vs Private Health Insurance Coverage by Age in Payne Gap
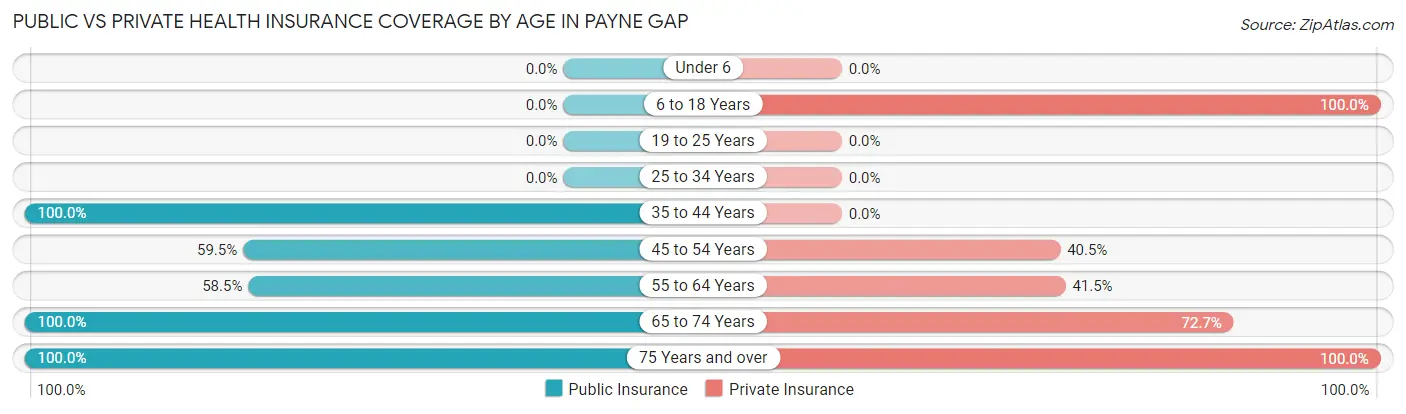
| Age Bracket | Public Insurance | Private Insurance |
| Under 6 | 0 (0.0%) | 0 (0.0%) |
| 6 to 18 Years | 0 (0.0%) | 14 (100.0%) |
| 19 to 25 Years | 0 (0.0%) | 0 (0.0%) |
| 25 to 34 Years | 0 (0.0%) | 0 (0.0%) |
| 35 to 44 Years | 52 (100.0%) | 0 (0.0%) |
| 45 to 54 Years | 44 (59.5%) | 30 (40.5%) |
| 55 to 64 Years | 31 (58.5%) | 22 (41.5%) |
| 65 to 74 Years | 22 (100.0%) | 16 (72.7%) |
| 75 Years and over | 15 (100.0%) | 15 (100.0%) |
| Total | 164 (71.3%) | 97 (42.2%) |
Disability Status by Sex by Age in Payne Gap
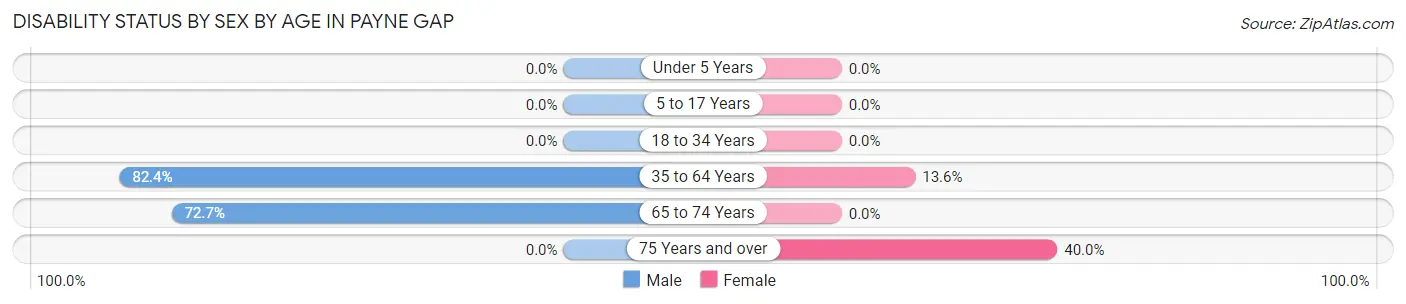
| Age Bracket | Male | Female |
| Under 5 Years | 0 (0.0%) | 0 (0.0%) |
| 5 to 17 Years | 0 (0.0%) | 0 (0.0%) |
| 18 to 34 Years | 0 (0.0%) | 0 (0.0%) |
| 35 to 64 Years | 75 (82.4%) | 12 (13.6%) |
| 65 to 74 Years | 16 (72.7%) | 0 (0.0%) |
| 75 Years and over | 0 (0.0%) | 4 (40.0%) |
Disability Class by Sex by Age in Payne Gap
Disability Class: Hearing Difficulty
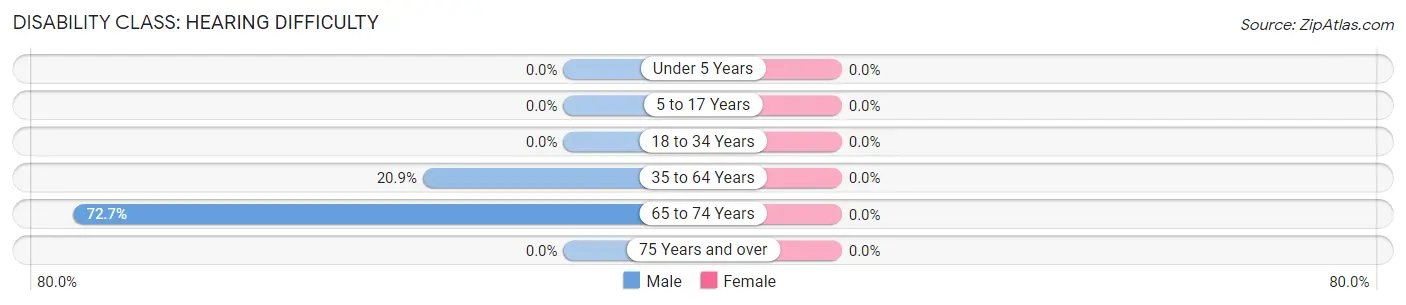
| Age Bracket | Male | Female |
| Under 5 Years | 0 (0.0%) | 0 (0.0%) |
| 5 to 17 Years | 0 (0.0%) | 0 (0.0%) |
| 18 to 34 Years | 0 (0.0%) | 0 (0.0%) |
| 35 to 64 Years | 19 (20.9%) | 0 (0.0%) |
| 65 to 74 Years | 16 (72.7%) | 0 (0.0%) |
| 75 Years and over | 0 (0.0%) | 0 (0.0%) |
Disability Class: Vision Difficulty
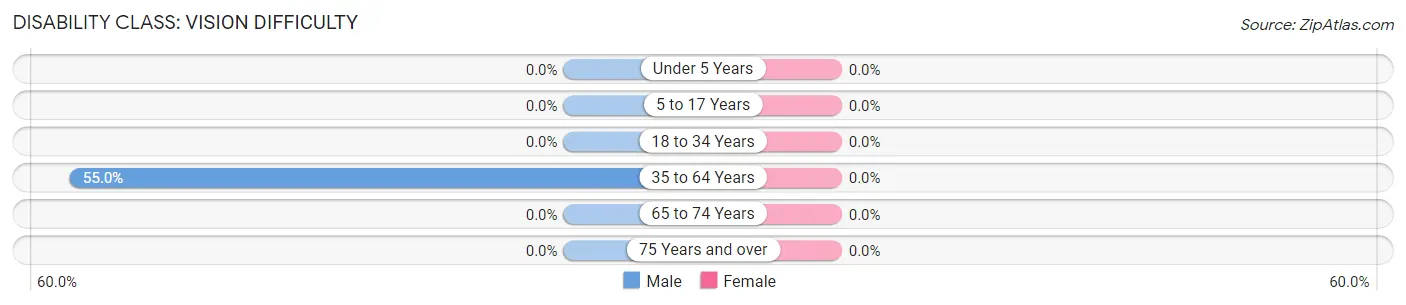
| Age Bracket | Male | Female |
| Under 5 Years | 0 (0.0%) | 0 (0.0%) |
| 5 to 17 Years | 0 (0.0%) | 0 (0.0%) |
| 18 to 34 Years | 0 (0.0%) | 0 (0.0%) |
| 35 to 64 Years | 50 (54.9%) | 0 (0.0%) |
| 65 to 74 Years | 0 (0.0%) | 0 (0.0%) |
| 75 Years and over | 0 (0.0%) | 0 (0.0%) |
Disability Class: Cognitive Difficulty
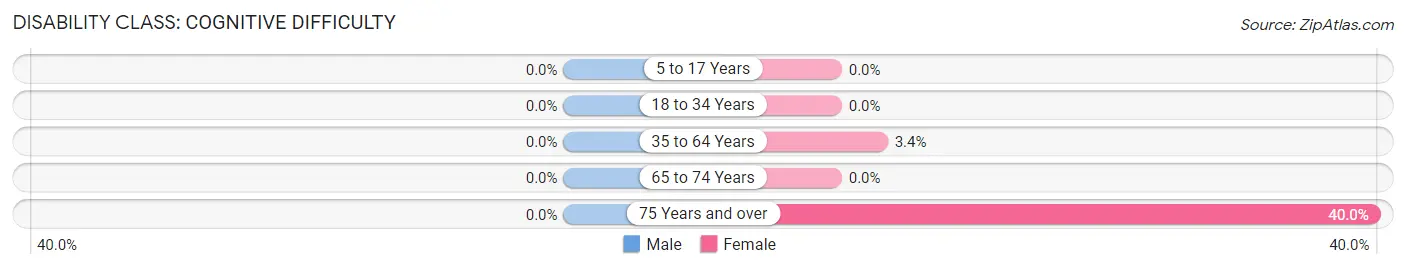
| Age Bracket | Male | Female |
| 5 to 17 Years | 0 (0.0%) | 0 (0.0%) |
| 18 to 34 Years | 0 (0.0%) | 0 (0.0%) |
| 35 to 64 Years | 0 (0.0%) | 3 (3.4%) |
| 65 to 74 Years | 0 (0.0%) | 0 (0.0%) |
| 75 Years and over | 0 (0.0%) | 4 (40.0%) |
Disability Class: Ambulatory Difficulty
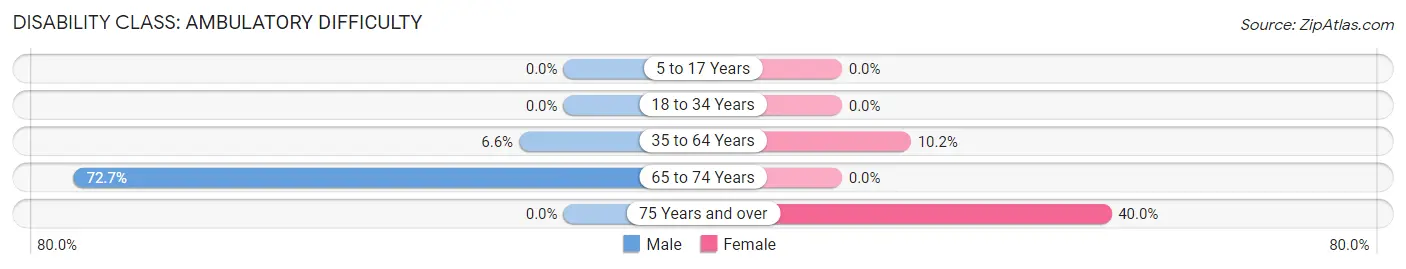
| Age Bracket | Male | Female |
| 5 to 17 Years | 0 (0.0%) | 0 (0.0%) |
| 18 to 34 Years | 0 (0.0%) | 0 (0.0%) |
| 35 to 64 Years | 6 (6.6%) | 9 (10.2%) |
| 65 to 74 Years | 16 (72.7%) | 0 (0.0%) |
| 75 Years and over | 0 (0.0%) | 4 (40.0%) |
Disability Class: Self-Care Difficulty
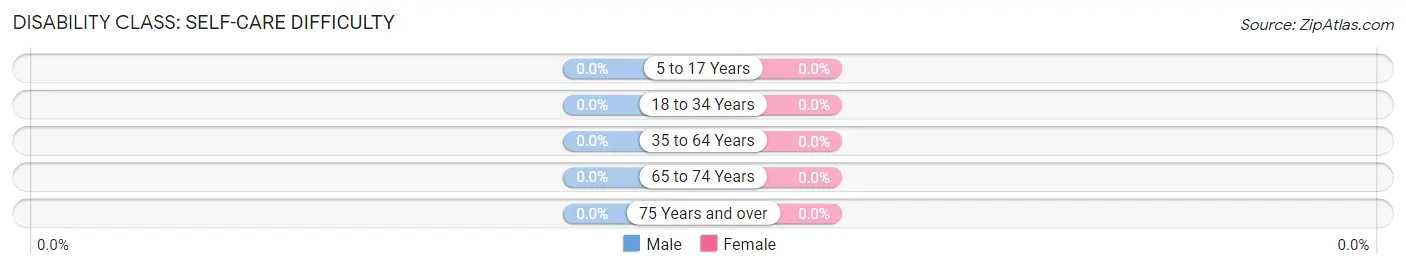
| Age Bracket | Male | Female |
| 5 to 17 Years | 0 (0.0%) | 0 (0.0%) |
| 18 to 34 Years | 0 (0.0%) | 0 (0.0%) |
| 35 to 64 Years | 0 (0.0%) | 0 (0.0%) |
| 65 to 74 Years | 0 (0.0%) | 0 (0.0%) |
| 75 Years and over | 0 (0.0%) | 0 (0.0%) |
Technology Access in Payne Gap
Computing Device Access in Payne Gap
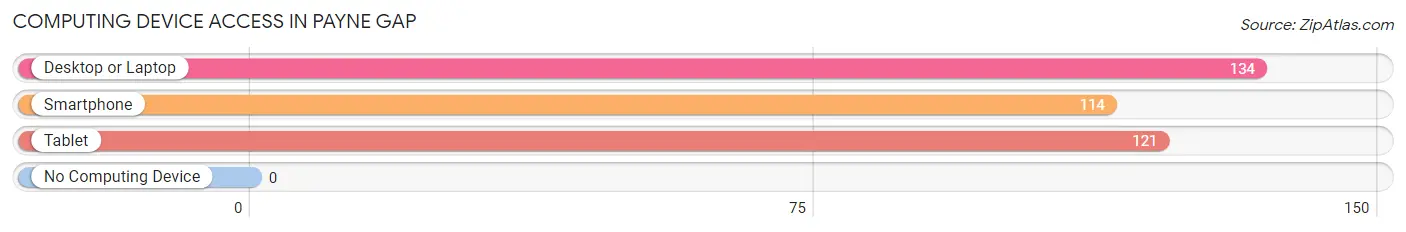
| Device Type | # Households | % Households |
| Desktop or Laptop | 134 | 89.9% |
| Smartphone | 114 | 76.5% |
| Tablet | 121 | 81.2% |
| No Computing Device | 0 | 0.0% |
| Total | 149 | 100.0% |
Internet Access in Payne Gap
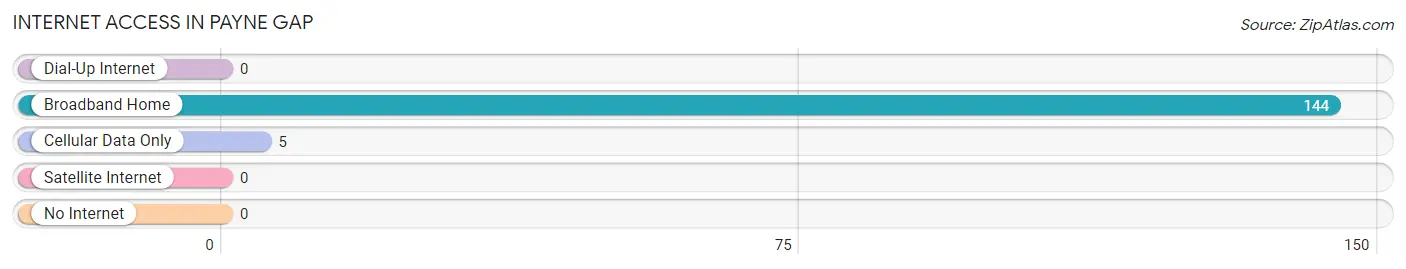
| Internet Type | # Households | % Households |
| Dial-Up Internet | 0 | 0.0% |
| Broadband Home | 144 | 96.6% |
| Cellular Data Only | 5 | 3.4% |
| Satellite Internet | 0 | 0.0% |
| No Internet | 0 | 0.0% |
| Total | 149 | 100.0% |
Payne Gap Summary
Payne Gap is a small unincorporated community located in Letcher County, Kentucky. It is situated in the Appalachian Mountains, near the Virginia border. The community is named after the Payne family, who settled in the area in the late 1800s.
History
Payne Gap was first settled in the late 1800s by the Payne family. The family was originally from Virginia, and they moved to the area in search of better opportunities. The family established a small farm and began to raise livestock. The community grew slowly over the years, and by the early 1900s, it had become a small but thriving community.
The community was largely isolated from the rest of the county until the mid-1900s, when the construction of the Payne Gap Road connected it to the rest of Letcher County. This road allowed for easier access to the county seat of Whitesburg, as well as other nearby towns.
Geography
Payne Gap is located in the Appalachian Mountains, near the Virginia border. The community is situated in a valley, surrounded by hills and mountains. The area is known for its scenic beauty, and it is a popular destination for hikers and outdoor enthusiasts.
The climate in Payne Gap is temperate, with mild winters and warm summers. The average annual temperature is around 50 degrees Fahrenheit. The area receives an average of 40 inches of precipitation per year, with most of it falling in the form of snow during the winter months.
Economy
The economy of Payne Gap is largely based on agriculture and tourism. The area is home to several small farms, which produce a variety of crops, including corn, soybeans, and hay. The area is also known for its apple orchards, which produce a variety of apples, including Granny Smith, Golden Delicious, and Red Delicious.
The area is also a popular destination for outdoor enthusiasts, and it is home to several hiking trails, camping sites, and fishing spots. The nearby town of Whitesburg also offers a variety of shopping and dining options.
Demographics
As of the 2010 census, the population of Payne Gap was 545. The population is largely white (97.3%), with a small minority of African Americans (1.8%) and Hispanics (0.9%). The median household income is $25,000, and the median age is 44.
Payne Gap is a small, rural community with a close-knit population. The area is known for its friendly atmosphere and welcoming attitude towards visitors. The community is also home to several churches, which provide spiritual guidance and support to the residents.
Common Questions
What is Per Capita Income in Payne Gap?
Per Capita income in Payne Gap is $23,432.
What is the Median Family Income in Payne Gap?
Median Family Income in Payne Gap is $58,594.
What is the Median Household income in Payne Gap?
Median Household Income in Payne Gap is $31,042.
What is Income or Wage Gap in Payne Gap?
Income or Wage Gap in Payne Gap is 52.9%.
Women in Payne Gap earn 47.1 cents for every dollar earned by a man.
What is Inequality or Gini Index in Payne Gap?
Inequality or Gini Index in Payne Gap is 0.38.
What is the Total Population of Payne Gap?
Total Population of Payne Gap is 230.
What is the Total Male Population of Payne Gap?
Total Male Population of Payne Gap is 132.
What is the Total Female Population of Payne Gap?
Total Female Population of Payne Gap is 98.
What is the Ratio of Males per 100 Females in Payne Gap?
There are 134.69 Males per 100 Females in Payne Gap.
What is the Ratio of Females per 100 Males in Payne Gap?
There are 74.24 Females per 100 Males in Payne Gap.
What is the Median Population Age in Payne Gap?
Median Population Age in Payne Gap is 49.8 Years.
What is the Average Family Size in Payne Gap
Average Family Size in Payne Gap is 2.6 People.
What is the Average Household Size in Payne Gap
Average Household Size in Payne Gap is 1.5 People.
How Large is the Labor Force in Payne Gap?
There are 99 People in the Labor Forcein in Payne Gap.
What is the Percentage of People in the Labor Force in Payne Gap?
44.4% of People are in the Labor Force in Payne Gap.
What is the Unemployment Rate in Payne Gap?
Unemployment Rate in Payne Gap is 33.3%.