Zip Codes with the Highest Percentage of Population Employed in Finance & Insurance in Louisville, KY
RELATED REPORTS & OPTIONS
Finance & Insurance
Louisville
Compare Zip Codes
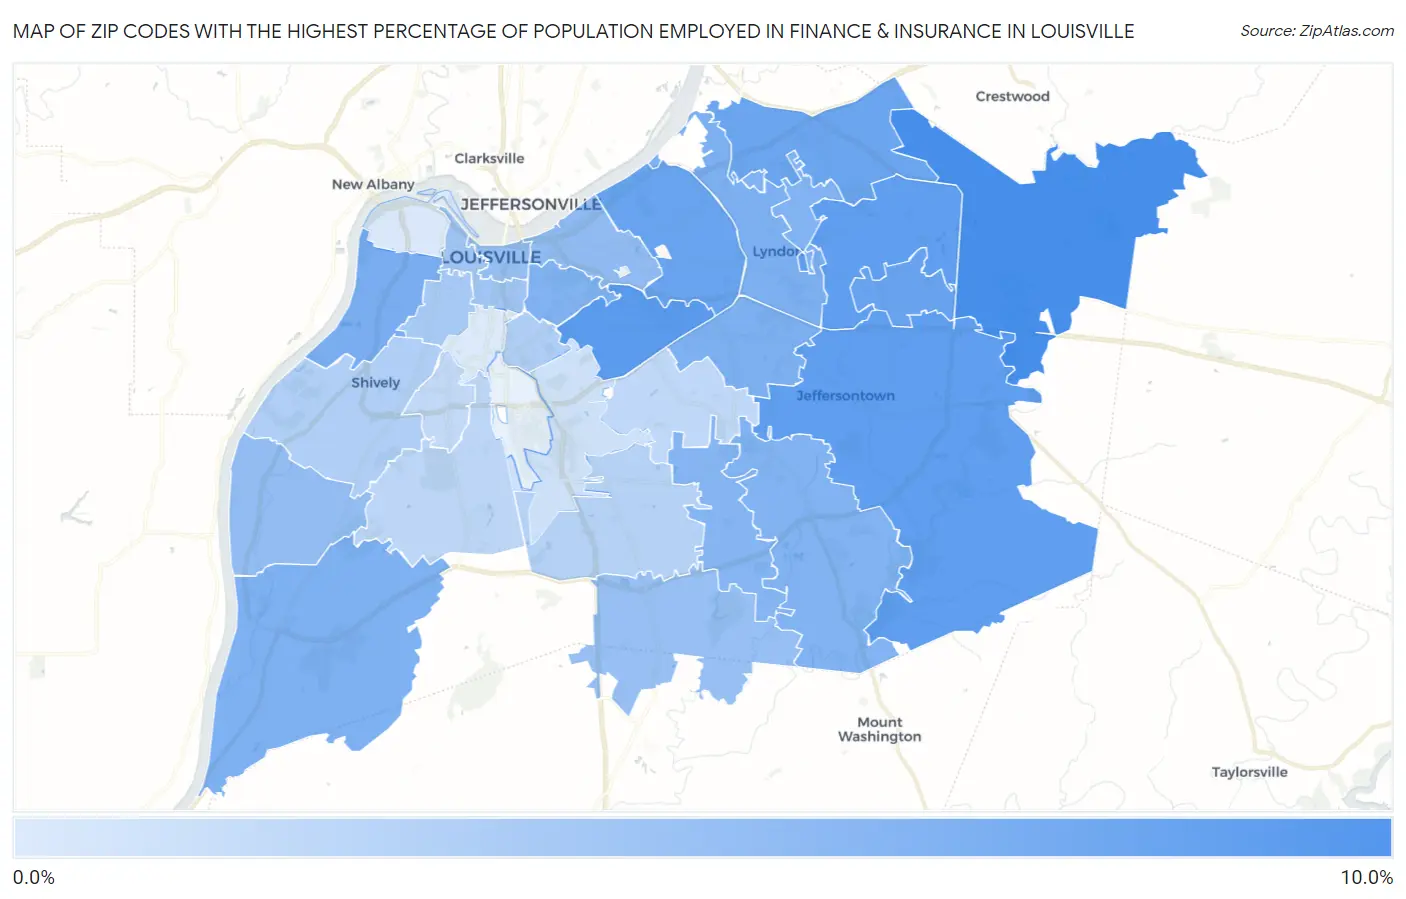
Map of Zip Codes with the Highest Percentage of Population Employed in Finance & Insurance in Louisville
2.0%
9.7%
Zip Codes with the Highest Percentage of Population Employed in Finance & Insurance in Louisville, KY
| Zip Code | % Employed | vs State | vs National | |
| 1. | 40245 | 9.7% | 4.2%(+5.50)#37 | 4.8%(+4.95)#1,860 |
| 2. | 40205 | 8.7% | 4.2%(+4.49)#48 | 4.8%(+3.94)#2,464 |
| 3. | 40299 | 8.4% | 4.2%(+4.15)#52 | 4.8%(+3.60)#2,744 |
| 4. | 40223 | 8.4% | 4.2%(+4.13)#53 | 4.8%(+3.58)#2,758 |
| 5. | 40243 | 8.0% | 4.2%(+3.74)#58 | 4.8%(+3.19)#3,131 |
| 6. | 40207 | 7.9% | 4.2%(+3.67)#61 | 4.8%(+3.12)#3,193 |
| 7. | 40241 | 7.7% | 4.2%(+3.52)#64 | 4.8%(+2.97)#3,351 |
| 8. | 40211 | 7.0% | 4.2%(+2.75)#76 | 4.8%(+2.21)#4,271 |
| 9. | 40220 | 6.9% | 4.2%(+2.70)#79 | 4.8%(+2.15)#4,337 |
| 10. | 40222 | 6.9% | 4.2%(+2.68)#80 | 4.8%(+2.13)#4,372 |
| 11. | 40272 | 6.7% | 4.2%(+2.52)#86 | 4.8%(+1.97)#4,600 |
| 12. | 40204 | 6.7% | 4.2%(+2.46)#89 | 4.8%(+1.91)#4,691 |
| 13. | 40291 | 6.6% | 4.2%(+2.41)#91 | 4.8%(+1.87)#4,769 |
| 14. | 40242 | 6.6% | 4.2%(+2.40)#93 | 4.8%(+1.85)#4,793 |
| 15. | 40228 | 6.5% | 4.2%(+2.24)#97 | 4.8%(+1.69)#5,050 |
| 16. | 40206 | 5.9% | 4.2%(+1.64)#111 | 4.8%(+1.09)#6,161 |
| 17. | 40258 | 5.7% | 4.2%(+1.44)#119 | 4.8%(+0.892)#6,590 |
| 18. | 40202 | 5.5% | 4.2%(+1.28)#123 | 4.8%(+0.733)#6,978 |
| 19. | 40229 | 5.4% | 4.2%(+1.23)#127 | 4.8%(+0.681)#7,115 |
| 20. | 40203 | 4.9% | 4.2%(+0.725)#147 | 4.8%(+0.178)#8,453 |
| 21. | 40210 | 4.6% | 4.2%(+0.381)#158 | 4.8%(-0.166)#9,523 |
| 22. | 40217 | 4.3% | 4.2%(+0.050)#172 | 4.8%(-0.497)#10,647 |
| 23. | 40216 | 4.2% | 4.2%(-0.009)#176 | 4.8%(-0.556)#10,825 |
| 24. | 40219 | 4.0% | 4.2%(-0.232)#192 | 4.8%(-0.779)#11,639 |
| 25. | 40214 | 3.6% | 4.2%(-0.608)#226 | 4.8%(-1.16)#13,119 |
| 26. | 40218 | 3.5% | 4.2%(-0.729)#235 | 4.8%(-1.28)#13,634 |
| 27. | 40215 | 3.4% | 4.2%(-0.842)#247 | 4.8%(-1.39)#14,114 |
| 28. | 40213 | 2.6% | 4.2%(-1.61)#313 | 4.8%(-2.15)#17,609 |
| 29. | 40212 | 2.1% | 4.2%(-2.09)#341 | 4.8%(-2.64)#19,939 |
| 30. | 40208 | 2.0% | 4.2%(-2.26)#360 | 4.8%(-2.81)#20,639 |
1
Common Questions
What are the Top 10 Zip Codes with the Highest Percentage of Population Employed in Finance & Insurance in Louisville, KY?
Top 10 Zip Codes with the Highest Percentage of Population Employed in Finance & Insurance in Louisville, KY are:
What zip code has the Highest Percentage of Population Employed in Finance & Insurance in Louisville, KY?
40245 has the Highest Percentage of Population Employed in Finance & Insurance in Louisville, KY with 9.7%.
What is the Percentage of Population Employed in Finance & Insurance in Louisville, KY?
Percentage of Population Employed in Finance & Insurance in Louisville is 5.8%.
What is the Percentage of Population Employed in Finance & Insurance in Kentucky?
Percentage of Population Employed in Finance & Insurance in Kentucky is 4.2%.
What is the Percentage of Population Employed in Finance & Insurance in the United States?
Percentage of Population Employed in Finance & Insurance in the United States is 4.8%.