Shelbyville, IN Map & Demographics
Shelbyville Map
Shelbyville Overview
$28,715
PER CAPITA INCOME
$69,702
AVG FAMILY INCOME
$55,850
AVG HOUSEHOLD INCOME
33.8%
WAGE / INCOME GAP [ % ]
66.2¢/ $1
WAGE / INCOME GAP [ $ ]
0.42
INEQUALITY / GINI INDEX
19,678
TOTAL POPULATION
9,547
MALE POPULATION
10,131
FEMALE POPULATION
94.24
MALES / 100 FEMALES
106.12
FEMALES / 100 MALES
35.6
MEDIAN AGE
3.0
AVG FAMILY SIZE
2.3
AVG HOUSEHOLD SIZE
9,736
LABOR FORCE [ PEOPLE ]
63.3%
PERCENT IN LABOR FORCE
2.8%
UNEMPLOYMENT RATE
Shelbyville Zip Codes
Shelbyville Area Codes
Income in Shelbyville
Income Overview in Shelbyville
Per Capita Income in Shelbyville is $28,715, while median incomes of families and households are $69,702 and $55,850 respectively.
| Characteristic | Number | Measure |
| Per Capita Income | 19,678 | $28,715 |
| Median Family Income | 4,821 | $69,702 |
| Mean Family Income | 4,821 | $79,866 |
| Median Household Income | 8,258 | $55,850 |
| Mean Household Income | 8,258 | $67,991 |
| Income Deficit | 4,821 | $0 |
| Wage / Income Gap (%) | 19,678 | 33.80% |
| Wage / Income Gap ($) | 19,678 | 66.20¢ per $1 |
| Gini / Inequality Index | 19,678 | 0.42 |
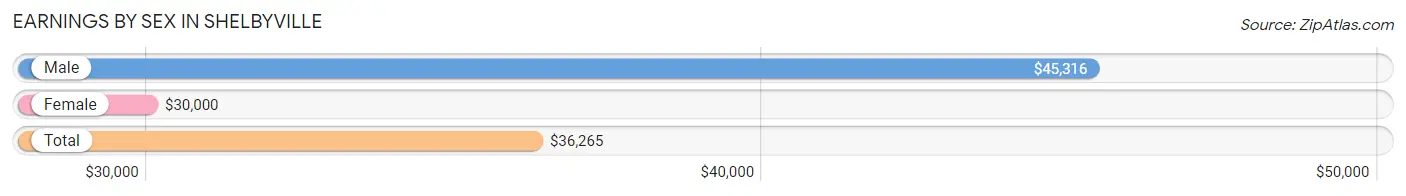
Earnings by Sex in Shelbyville
Average Earnings in Shelbyville are $36,265, $45,316 for men and $30,000 for women, a difference of 33.8%.
| Sex | Number | Average Earnings |
| Male | 5,475 (54.0%) | $45,316 |
| Female | 4,660 (46.0%) | $30,000 |
| Total | 10,135 (100.0%) | $36,265 |
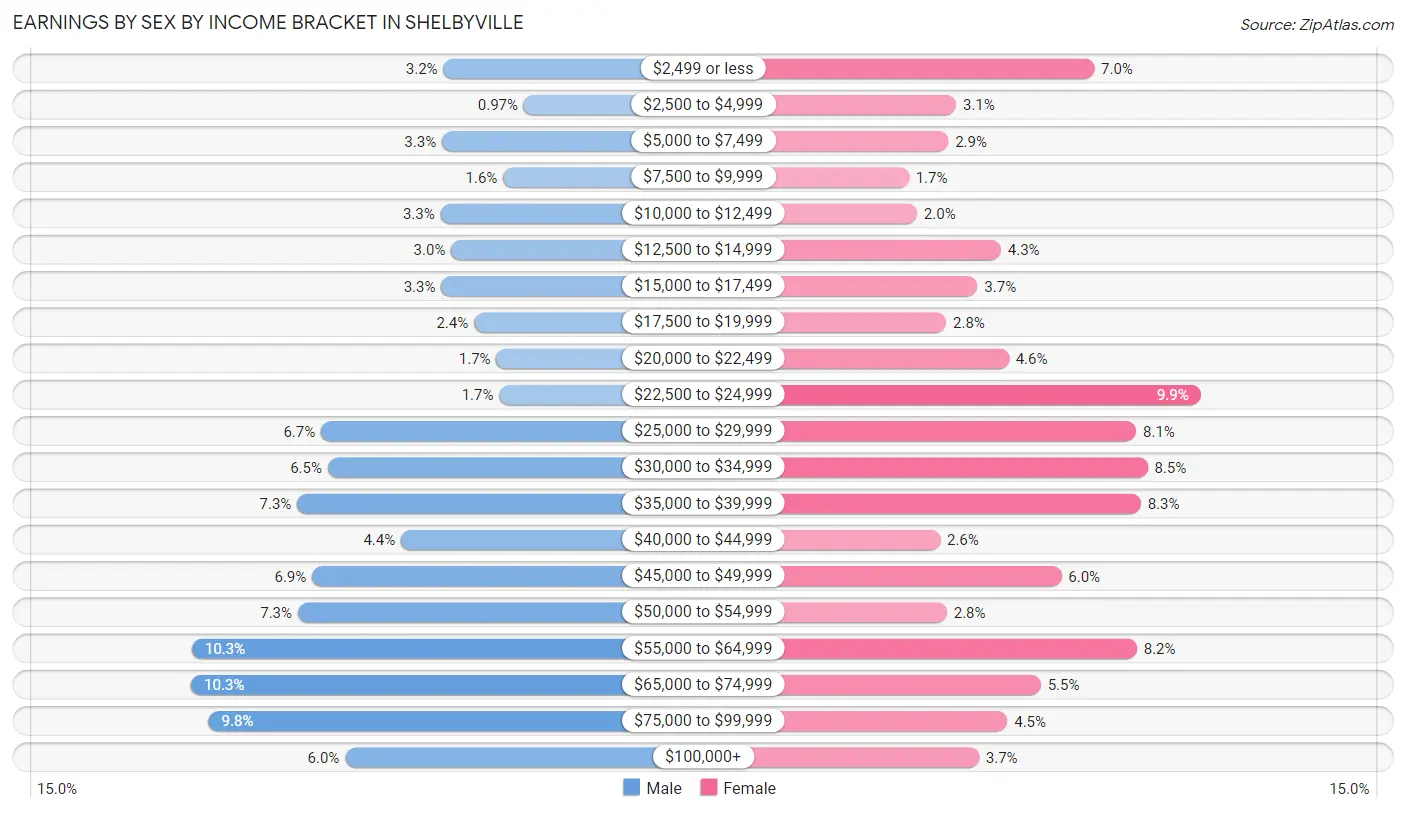
Earnings by Sex by Income Bracket in Shelbyville
The most common earnings brackets in Shelbyville are $65,000 to $74,999 for men (565 | 10.3%) and $22,500 to $24,999 for women (463 | 9.9%).
| Income | Male | Female |
| $2,499 or less | 177 (3.2%) | 324 (7.0%) |
| $2,500 to $4,999 | 53 (1.0%) | 143 (3.1%) |
| $5,000 to $7,499 | 179 (3.3%) | 133 (2.9%) |
| $7,500 to $9,999 | 85 (1.5%) | 81 (1.7%) |
| $10,000 to $12,499 | 181 (3.3%) | 92 (2.0%) |
| $12,500 to $14,999 | 165 (3.0%) | 202 (4.3%) |
| $15,000 to $17,499 | 180 (3.3%) | 171 (3.7%) |
| $17,500 to $19,999 | 130 (2.4%) | 130 (2.8%) |
| $20,000 to $22,499 | 95 (1.7%) | 212 (4.5%) |
| $22,500 to $24,999 | 91 (1.7%) | 463 (9.9%) |
| $25,000 to $29,999 | 365 (6.7%) | 379 (8.1%) |
| $30,000 to $34,999 | 355 (6.5%) | 394 (8.5%) |
| $35,000 to $39,999 | 402 (7.3%) | 385 (8.3%) |
| $40,000 to $44,999 | 242 (4.4%) | 122 (2.6%) |
| $45,000 to $49,999 | 379 (6.9%) | 281 (6.0%) |
| $50,000 to $54,999 | 401 (7.3%) | 131 (2.8%) |
| $55,000 to $64,999 | 564 (10.3%) | 380 (8.2%) |
| $65,000 to $74,999 | 565 (10.3%) | 254 (5.4%) |
| $75,000 to $99,999 | 538 (9.8%) | 210 (4.5%) |
| $100,000+ | 328 (6.0%) | 173 (3.7%) |
| Total | 5,475 (100.0%) | 4,660 (100.0%) |
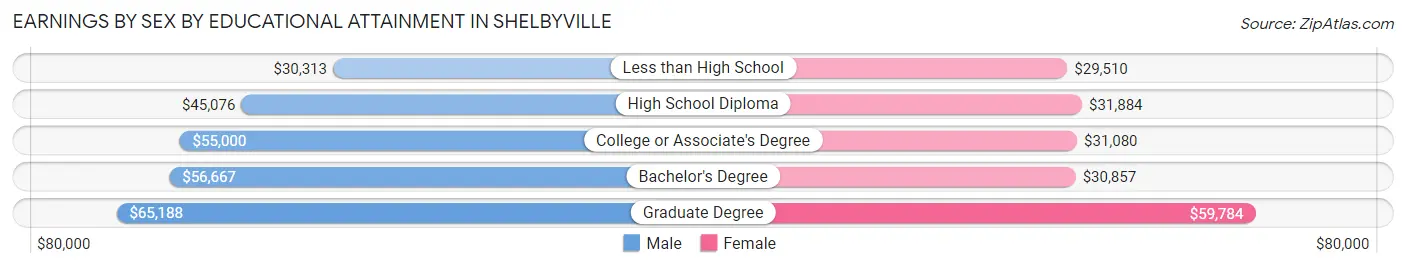
Earnings by Sex by Educational Attainment in Shelbyville
Average earnings in Shelbyville are $47,146 for men and $33,038 for women, a difference of 29.9%. Men with an educational attainment of graduate degree enjoy the highest average annual earnings of $65,188, while those with less than high school education earn the least with $30,313. Women with an educational attainment of graduate degree earn the most with the average annual earnings of $59,784, while those with less than high school education have the smallest earnings of $29,510.
| Educational Attainment | Male Income | Female Income |
| Less than High School | $30,313 | $29,510 |
| High School Diploma | $45,076 | $31,884 |
| College or Associate's Degree | $55,000 | $31,080 |
| Bachelor's Degree | $56,667 | $30,857 |
| Graduate Degree | $65,188 | $59,784 |
| Total | $47,146 | $33,038 |
Family Income in Shelbyville
Family Income Brackets in Shelbyville
According to the Shelbyville family income data, there are 1,215 families falling into the $50,000 to $74,999 income range, which is the most common income bracket and makes up 25.2% of all families. Conversely, the $150,000 to $199,999 income bracket is the least frequent group with only 130 families (2.7%) belonging to this category.
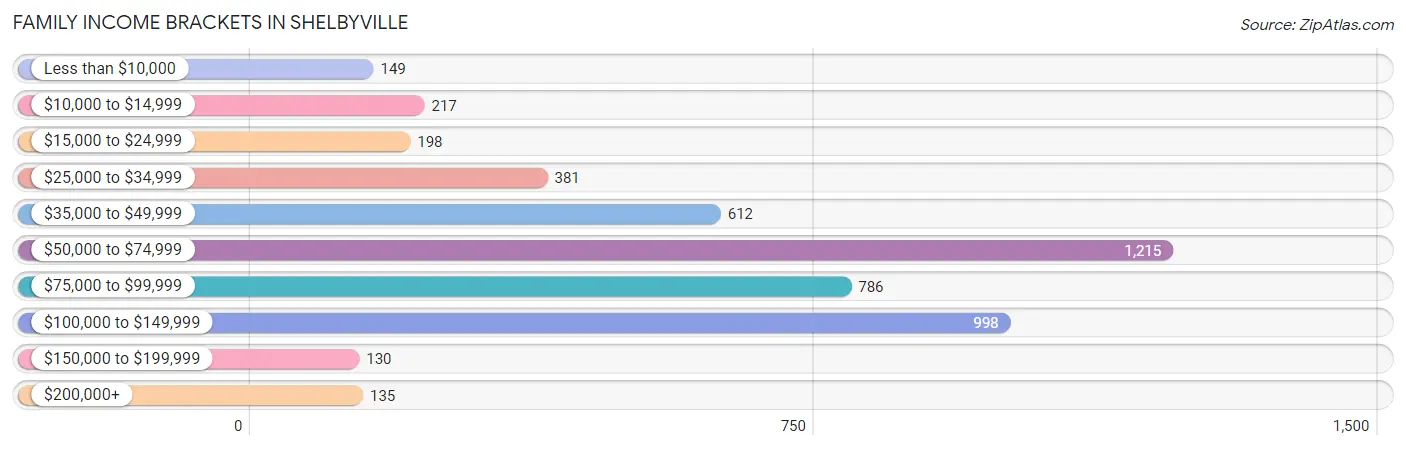
| Income Bracket | # Families | % Families |
| Less than $10,000 | 149 | 3.1% |
| $10,000 to $14,999 | 217 | 4.5% |
| $15,000 to $24,999 | 198 | 4.1% |
| $25,000 to $34,999 | 381 | 7.9% |
| $35,000 to $49,999 | 612 | 12.7% |
| $50,000 to $74,999 | 1,215 | 25.2% |
| $75,000 to $99,999 | 786 | 16.3% |
| $100,000 to $149,999 | 998 | 20.7% |
| $150,000 to $199,999 | 130 | 2.7% |
| $200,000+ | 135 | 2.8% |
Family Income by Famaliy Size in Shelbyville
6-person families (72 | 1.5%) account for the highest median family income in Shelbyville with $83,833 per family, while 2-person families (2,467 | 51.2%) have the highest median income of $34,484 per family member.
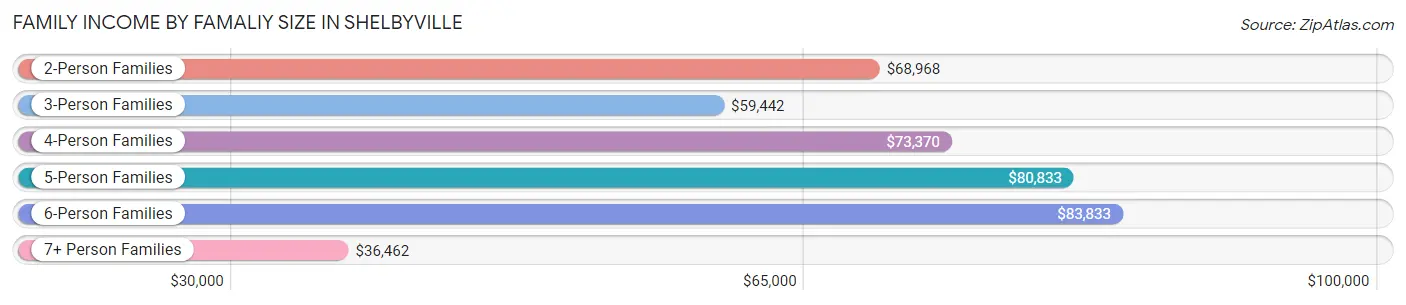
| Income Bracket | # Families | Median Income |
| 2-Person Families | 2,467 (51.2%) | $68,968 |
| 3-Person Families | 891 (18.5%) | $59,442 |
| 4-Person Families | 970 (20.1%) | $73,370 |
| 5-Person Families | 266 (5.5%) | $80,833 |
| 6-Person Families | 72 (1.5%) | $83,833 |
| 7+ Person Families | 155 (3.2%) | $36,462 |
| Total | 4,821 (100.0%) | $69,702 |
Family Income by Number of Earners in Shelbyville
The median family income in Shelbyville is $69,702, with families comprising 3+ earners (357) having the highest median family income of $113,542, while families with no earners (627) have the lowest median family income of $32,471, accounting for 7.4% and 13.0% of families, respectively.
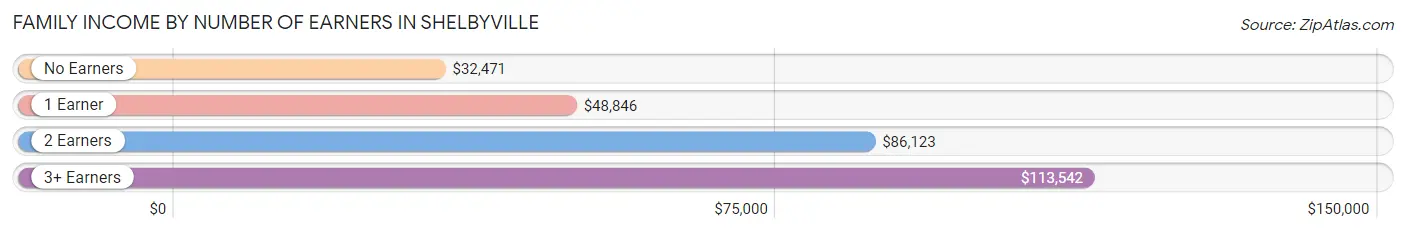
| Number of Earners | # Families | Median Income |
| No Earners | 627 (13.0%) | $32,471 |
| 1 Earner | 1,622 (33.6%) | $48,846 |
| 2 Earners | 2,215 (45.9%) | $86,123 |
| 3+ Earners | 357 (7.4%) | $113,542 |
| Total | 4,821 (100.0%) | $69,702 |
Household Income in Shelbyville
Household Income Brackets in Shelbyville
With 1,866 households falling in the category, the $50,000 to $74,999 income range is the most frequent in Shelbyville, accounting for 22.6% of all households. In contrast, only 239 households (2.9%) fall into the $150,000 to $199,999 income bracket, making it the least populous group.
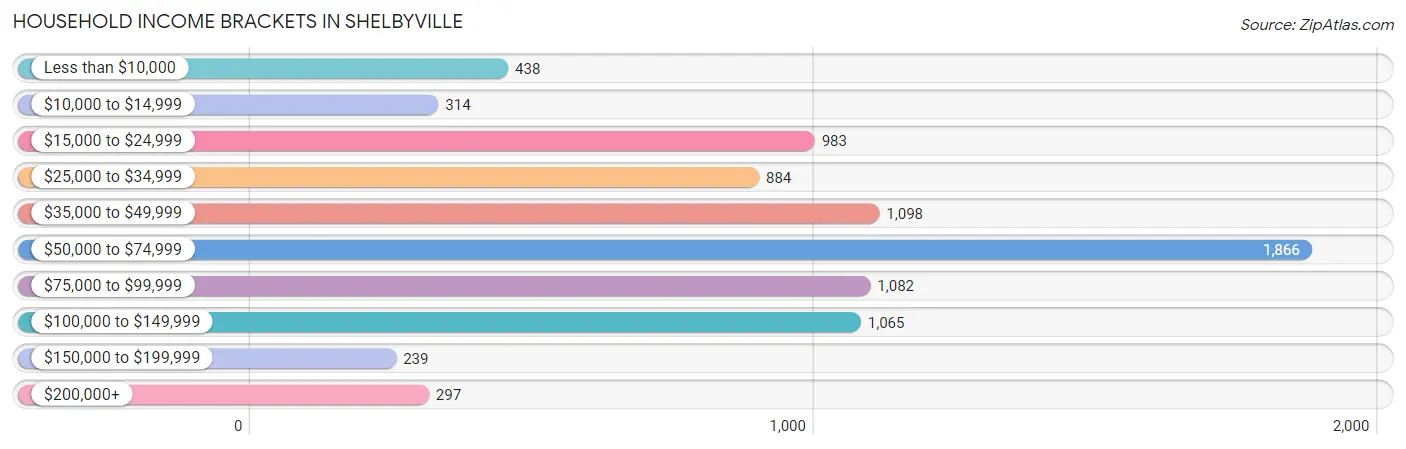
| Income Bracket | # Households | % Households |
| Less than $10,000 | 438 | 5.3% |
| $10,000 to $14,999 | 314 | 3.8% |
| $15,000 to $24,999 | 983 | 11.9% |
| $25,000 to $34,999 | 884 | 10.7% |
| $35,000 to $49,999 | 1,098 | 13.3% |
| $50,000 to $74,999 | 1,866 | 22.6% |
| $75,000 to $99,999 | 1,082 | 13.1% |
| $100,000 to $149,999 | 1,065 | 12.9% |
| $150,000 to $199,999 | 239 | 2.9% |
| $200,000+ | 297 | 3.6% |
Household Income by Householder Age in Shelbyville
The median household income in Shelbyville is $55,850, with the highest median household income of $67,922 found in the 45 to 64 years age bracket for the primary householder. A total of 2,814 households (34.1%) fall into this category. Meanwhile, the 65+ years age bracket for the primary householder has the lowest median household income of $29,375, with 2,127 households (25.8%) in this group.
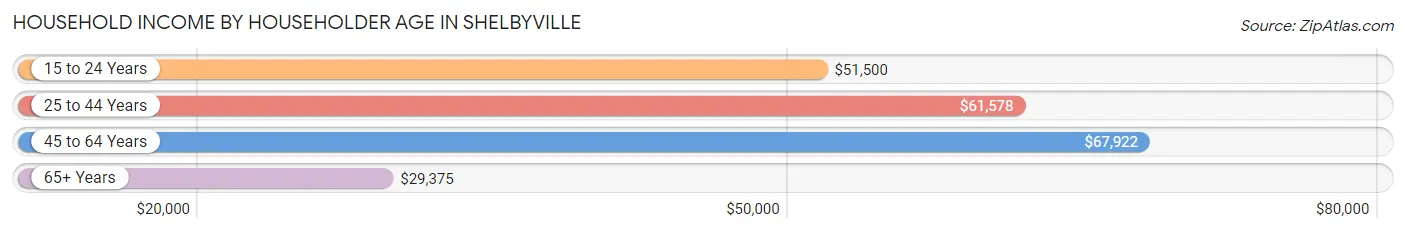
| Income Bracket | # Households | Median Income |
| 15 to 24 Years | 294 (3.6%) | $51,500 |
| 25 to 44 Years | 3,023 (36.6%) | $61,578 |
| 45 to 64 Years | 2,814 (34.1%) | $67,922 |
| 65+ Years | 2,127 (25.8%) | $29,375 |
| Total | 8,258 (100.0%) | $55,850 |
Poverty in Shelbyville
Income Below Poverty by Sex and Age in Shelbyville
With 16.2% poverty level for males and 21.3% for females among the residents of Shelbyville, under 5 year old males and 15 year old females are the most vulnerable to poverty, with 325 males (42.8%) and 108 females (54.5%) in their respective age groups living below the poverty level.
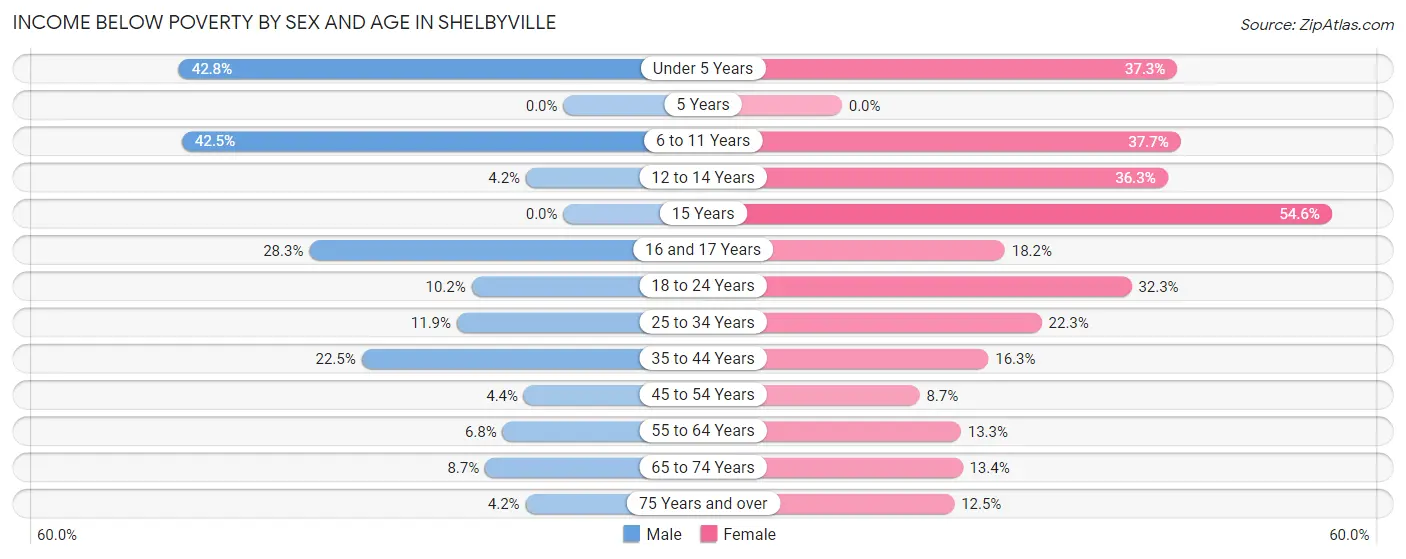
| Age Bracket | Male | Female |
| Under 5 Years | 325 (42.8%) | 301 (37.3%) |
| 5 Years | 0 (0.0%) | 0 (0.0%) |
| 6 to 11 Years | 350 (42.5%) | 301 (37.7%) |
| 12 to 14 Years | 12 (4.2%) | 140 (36.3%) |
| 15 Years | 0 (0.0%) | 108 (54.5%) |
| 16 and 17 Years | 60 (28.3%) | 49 (18.1%) |
| 18 to 24 Years | 66 (10.2%) | 170 (32.3%) |
| 25 to 34 Years | 212 (11.9%) | 354 (22.3%) |
| 35 to 44 Years | 240 (22.5%) | 174 (16.3%) |
| 45 to 54 Years | 44 (4.4%) | 86 (8.6%) |
| 55 to 64 Years | 86 (6.8%) | 179 (13.3%) |
| 65 to 74 Years | 74 (8.7%) | 136 (13.4%) |
| 75 Years and over | 17 (4.2%) | 100 (12.5%) |
| Total | 1,486 (16.2%) | 2,098 (21.3%) |
Income Above Poverty by Sex and Age in Shelbyville
According to the poverty statistics in Shelbyville, males aged 5 years and females aged 5 years are the age groups that are most secure financially, with 100.0% of males and 100.0% of females in these age groups living above the poverty line.
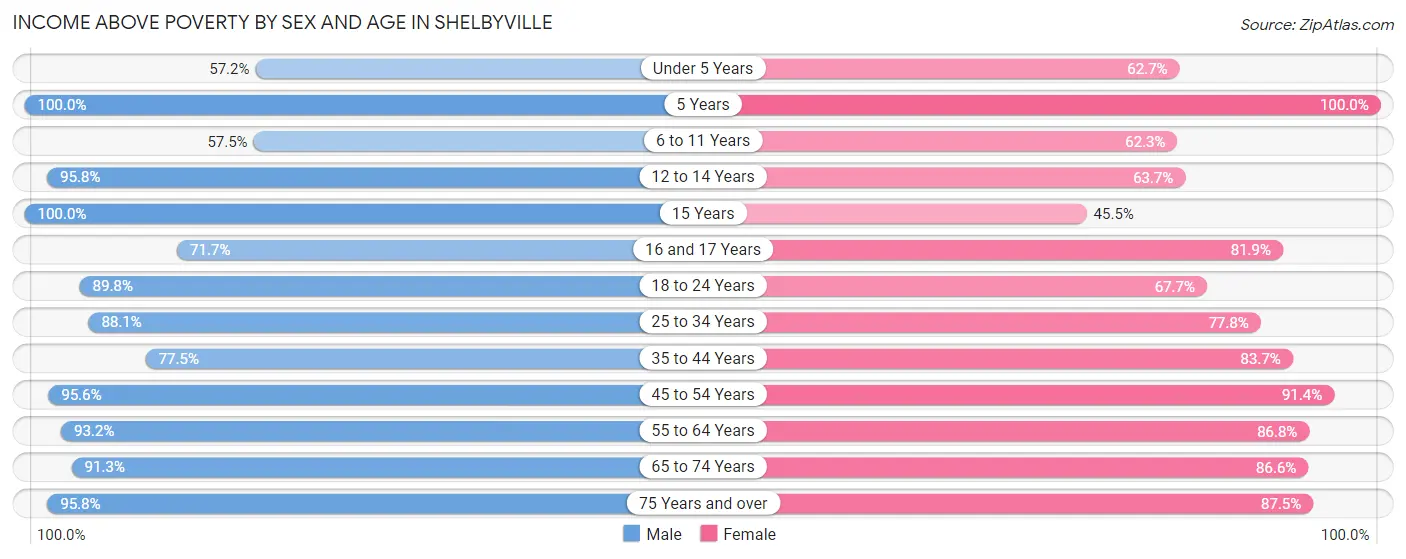
| Age Bracket | Male | Female |
| Under 5 Years | 434 (57.2%) | 505 (62.7%) |
| 5 Years | 24 (100.0%) | 55 (100.0%) |
| 6 to 11 Years | 474 (57.5%) | 497 (62.3%) |
| 12 to 14 Years | 276 (95.8%) | 246 (63.7%) |
| 15 Years | 72 (100.0%) | 90 (45.5%) |
| 16 and 17 Years | 152 (71.7%) | 221 (81.9%) |
| 18 to 24 Years | 580 (89.8%) | 357 (67.7%) |
| 25 to 34 Years | 1,576 (88.1%) | 1,237 (77.7%) |
| 35 to 44 Years | 828 (77.5%) | 892 (83.7%) |
| 45 to 54 Years | 957 (95.6%) | 908 (91.3%) |
| 55 to 64 Years | 1,184 (93.2%) | 1,172 (86.8%) |
| 65 to 74 Years | 775 (91.3%) | 876 (86.6%) |
| 75 Years and over | 386 (95.8%) | 699 (87.5%) |
| Total | 7,718 (83.9%) | 7,755 (78.7%) |
Income Below Poverty Among Married-Couple Families in Shelbyville
The poverty statistics for married-couple families in Shelbyville show that 10.2% or 369 of the total 3,599 families live below the poverty line. Families with 5 or more children have the highest poverty rate of 91.3%, comprising of 136 families. On the other hand, families with no children have the lowest poverty rate of 4.0%, which includes 85 families.
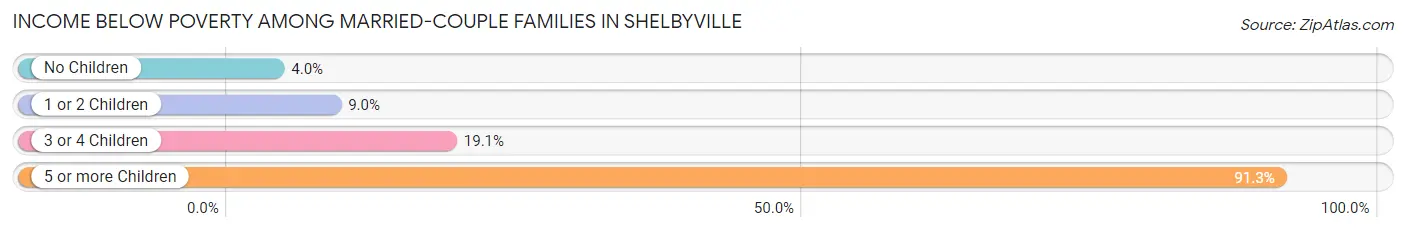
| Children | Above Poverty | Below Poverty |
| No Children | 2,023 (96.0%) | 85 (4.0%) |
| 1 or 2 Children | 973 (91.0%) | 96 (9.0%) |
| 3 or 4 Children | 221 (80.9%) | 52 (19.1%) |
| 5 or more Children | 13 (8.7%) | 136 (91.3%) |
| Total | 3,230 (89.7%) | 369 (10.2%) |
Income Below Poverty Among Single-Parent Households in Shelbyville
According to the poverty data in Shelbyville, 3.5% or 13 single-father households and 37.8% or 321 single-mother households are living below the poverty line. Among single-father households, those with no children have the highest poverty rate, with 13 households (9.7%) experiencing poverty. Likewise, among single-mother households, those with 3 or 4 children have the highest poverty rate, with 107 households (60.1%) falling below the poverty line.
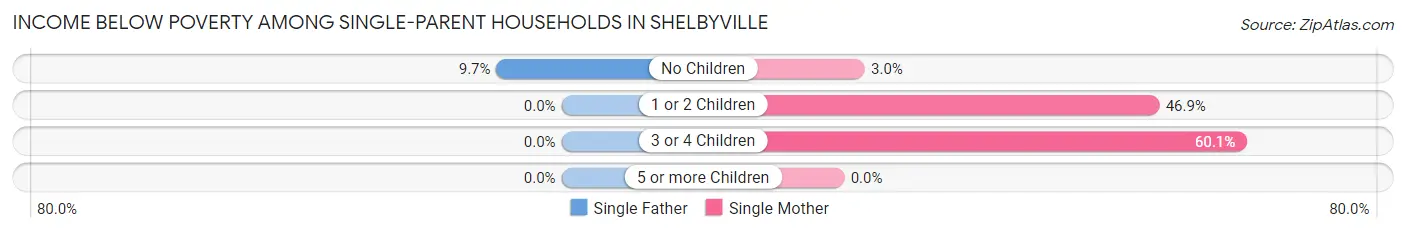
| Children | Single Father | Single Mother |
| No Children | 13 (9.7%) | 7 (3.0%) |
| 1 or 2 Children | 0 (0.0%) | 207 (46.9%) |
| 3 or 4 Children | 0 (0.0%) | 107 (60.1%) |
| 5 or more Children | 0 (0.0%) | 0 (0.0%) |
| Total | 13 (3.5%) | 321 (37.8%) |
Income Below Poverty Among Married-Couple vs Single-Parent Households in Shelbyville
The poverty data for Shelbyville shows that 369 of the married-couple family households (10.2%) and 334 of the single-parent households (27.3%) are living below the poverty level. Within the married-couple family households, those with 5 or more children have the highest poverty rate, with 136 households (91.3%) falling below the poverty line. Among the single-parent households, those with 3 or 4 children have the highest poverty rate, with 107 household (56.6%) living below poverty.
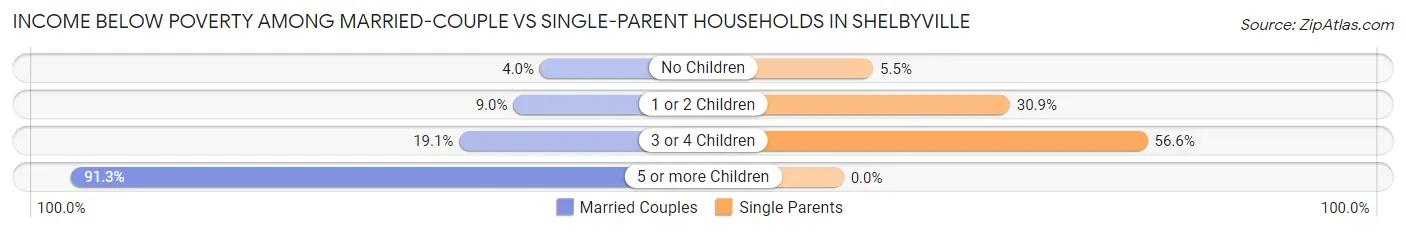
| Children | Married-Couple Families | Single-Parent Households |
| No Children | 85 (4.0%) | 20 (5.5%) |
| 1 or 2 Children | 96 (9.0%) | 207 (30.9%) |
| 3 or 4 Children | 52 (19.1%) | 107 (56.6%) |
| 5 or more Children | 136 (91.3%) | 0 (0.0%) |
| Total | 369 (10.2%) | 334 (27.3%) |
Race in Shelbyville
The most populous races in Shelbyville are White / Caucasian (17,432 | 88.6%), Hispanic or Latino (1,724 | 8.8%), and Some other Race (820 | 4.2%).
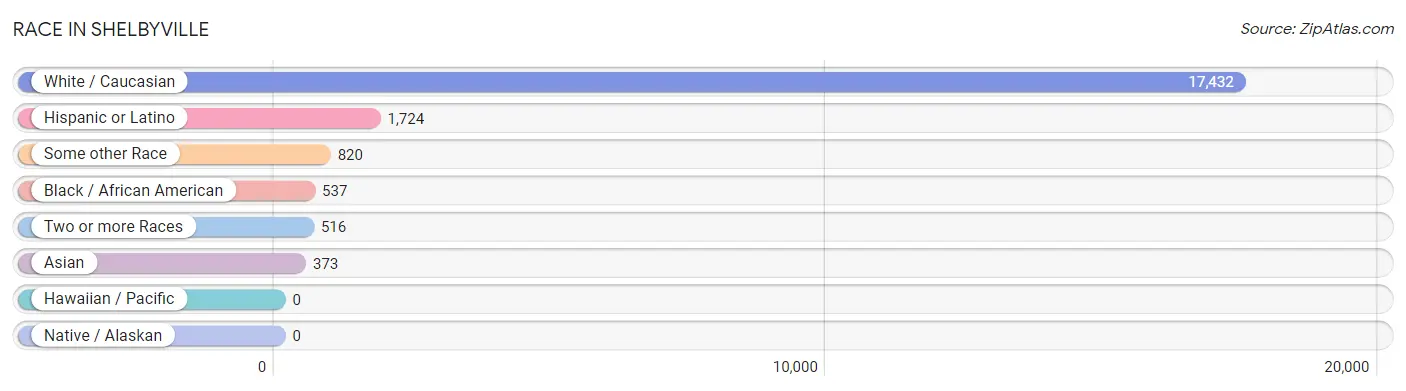
| Race | # Population | % Population |
| Asian | 373 | 1.9% |
| Black / African American | 537 | 2.7% |
| Hawaiian / Pacific | 0 | 0.0% |
| Hispanic or Latino | 1,724 | 8.8% |
| Native / Alaskan | 0 | 0.0% |
| White / Caucasian | 17,432 | 88.6% |
| Two or more Races | 516 | 2.6% |
| Some other Race | 820 | 4.2% |
| Total | 19,678 | 100.0% |
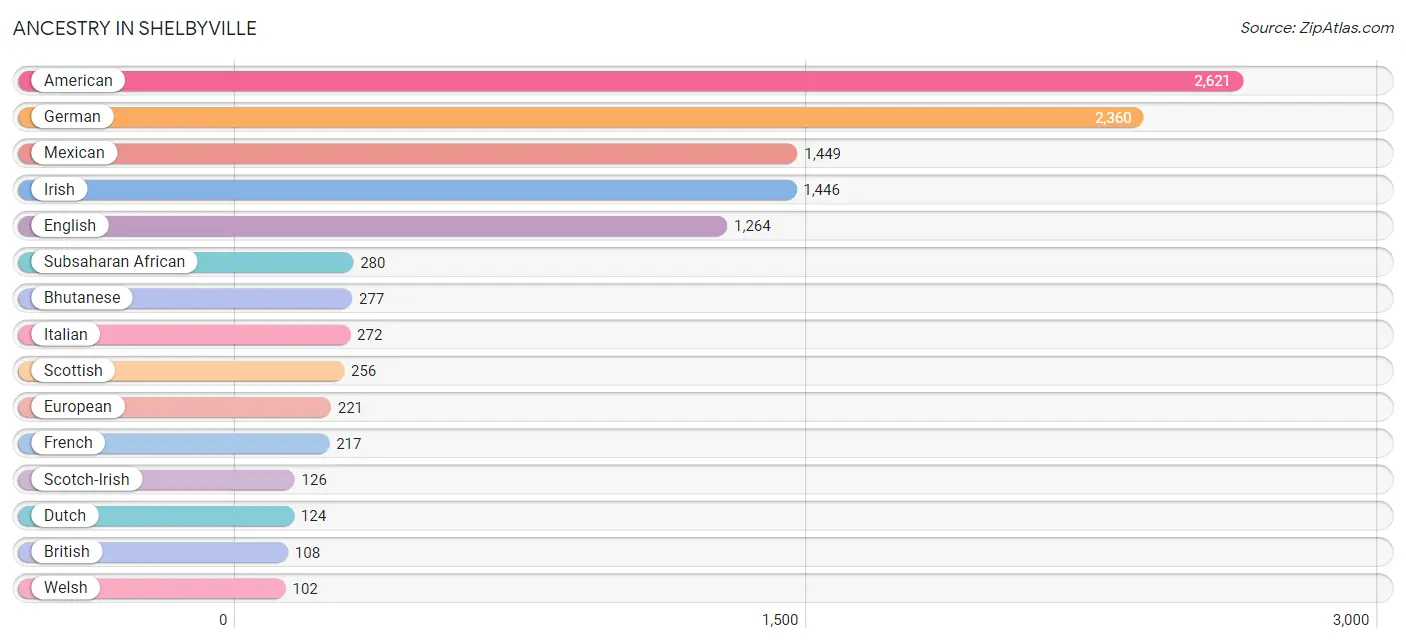
Ancestry in Shelbyville
The most populous ancestries reported in Shelbyville are American (2,621 | 13.3%), German (2,360 | 12.0%), Mexican (1,449 | 7.4%), Irish (1,446 | 7.3%), and English (1,264 | 6.4%), together accounting for 46.4% of all Shelbyville residents.
| Ancestry | # Population | % Population |
| African | 25 | 0.1% |
| American | 2,621 | 13.3% |
| Apache | 14 | 0.1% |
| Australian | 14 | 0.1% |
| Austrian | 10 | 0.1% |
| Bhutanese | 277 | 1.4% |
| British | 108 | 0.5% |
| Burmese | 1 | 0.0% |
| Canadian | 8 | 0.0% |
| Central American | 56 | 0.3% |
| Cherokee | 49 | 0.3% |
| Czech | 20 | 0.1% |
| Dutch | 124 | 0.6% |
| Eastern European | 9 | 0.1% |
| English | 1,264 | 6.4% |
| European | 221 | 1.1% |
| French | 217 | 1.1% |
| German | 2,360 | 12.0% |
| Greek | 57 | 0.3% |
| Guatemalan | 10 | 0.1% |
| Hungarian | 32 | 0.2% |
| Indian (Asian) | 56 | 0.3% |
| Irish | 1,446 | 7.3% |
| Italian | 272 | 1.4% |
| Korean | 62 | 0.3% |
| Mexican | 1,449 | 7.4% |
| Nigerian | 23 | 0.1% |
| Northern European | 31 | 0.2% |
| Panamanian | 46 | 0.2% |
| Pennsylvania German | 35 | 0.2% |
| Peruvian | 84 | 0.4% |
| Polish | 70 | 0.4% |
| Puerto Rican | 62 | 0.3% |
| Romanian | 15 | 0.1% |
| Russian | 11 | 0.1% |
| Scotch-Irish | 126 | 0.6% |
| Scottish | 256 | 1.3% |
| Slovene | 7 | 0.0% |
| South American | 84 | 0.4% |
| Spaniard | 27 | 0.1% |
| Spanish | 4 | 0.0% |
| Subsaharan African | 280 | 1.4% |
| Swedish | 9 | 0.1% |
| Swiss | 30 | 0.2% |
| Welsh | 102 | 0.5% | View All 45 Rows |
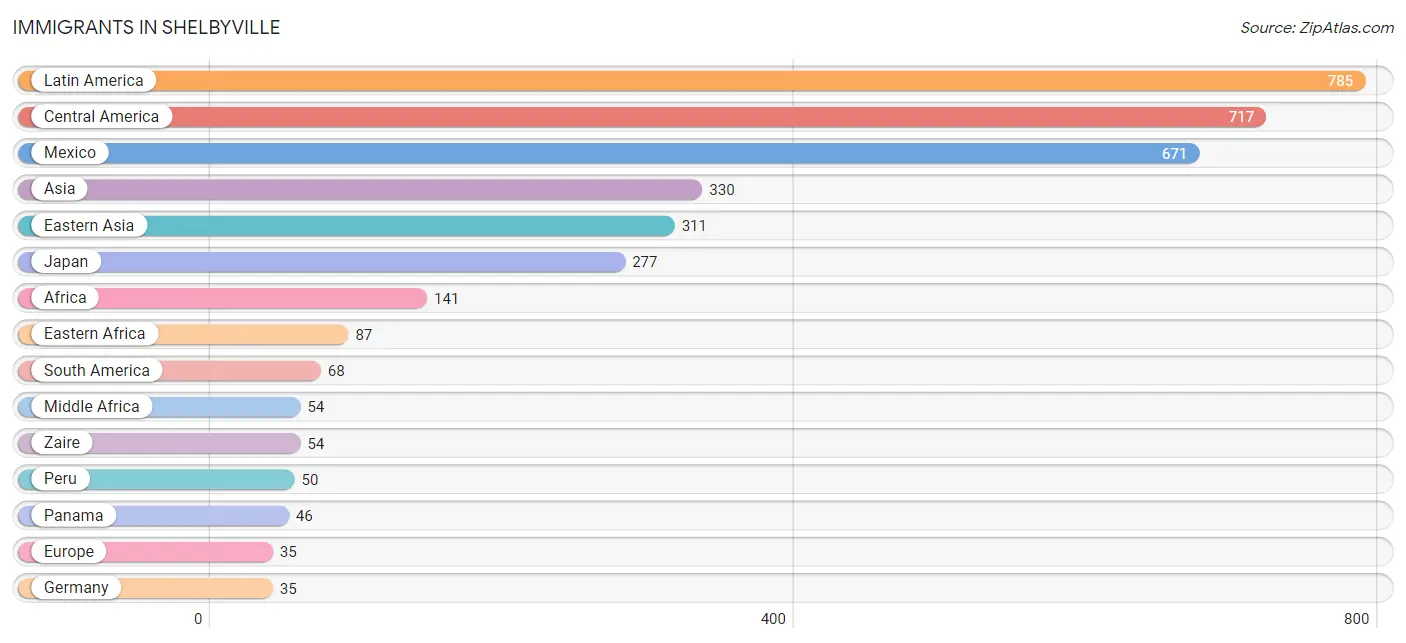
Immigrants in Shelbyville
The most numerous immigrant groups reported in Shelbyville came from Latin America (785 | 4.0%), Central America (717 | 3.6%), Mexico (671 | 3.4%), Asia (330 | 1.7%), and Eastern Asia (311 | 1.6%), together accounting for 14.3% of all Shelbyville residents.
| Immigration Origin | # Population | % Population |
| Africa | 141 | 0.7% |
| Argentina | 18 | 0.1% |
| Asia | 330 | 1.7% |
| Central America | 717 | 3.6% |
| China | 34 | 0.2% |
| Eastern Africa | 87 | 0.4% |
| Eastern Asia | 311 | 1.6% |
| Europe | 35 | 0.2% |
| Germany | 35 | 0.2% |
| Japan | 277 | 1.4% |
| Latin America | 785 | 4.0% |
| Mexico | 671 | 3.4% |
| Middle Africa | 54 | 0.3% |
| Panama | 46 | 0.2% |
| Peru | 50 | 0.3% |
| Philippines | 19 | 0.1% |
| South America | 68 | 0.4% |
| South Eastern Asia | 19 | 0.1% |
| Western Europe | 35 | 0.2% |
| Zaire | 54 | 0.3% | View All 20 Rows |
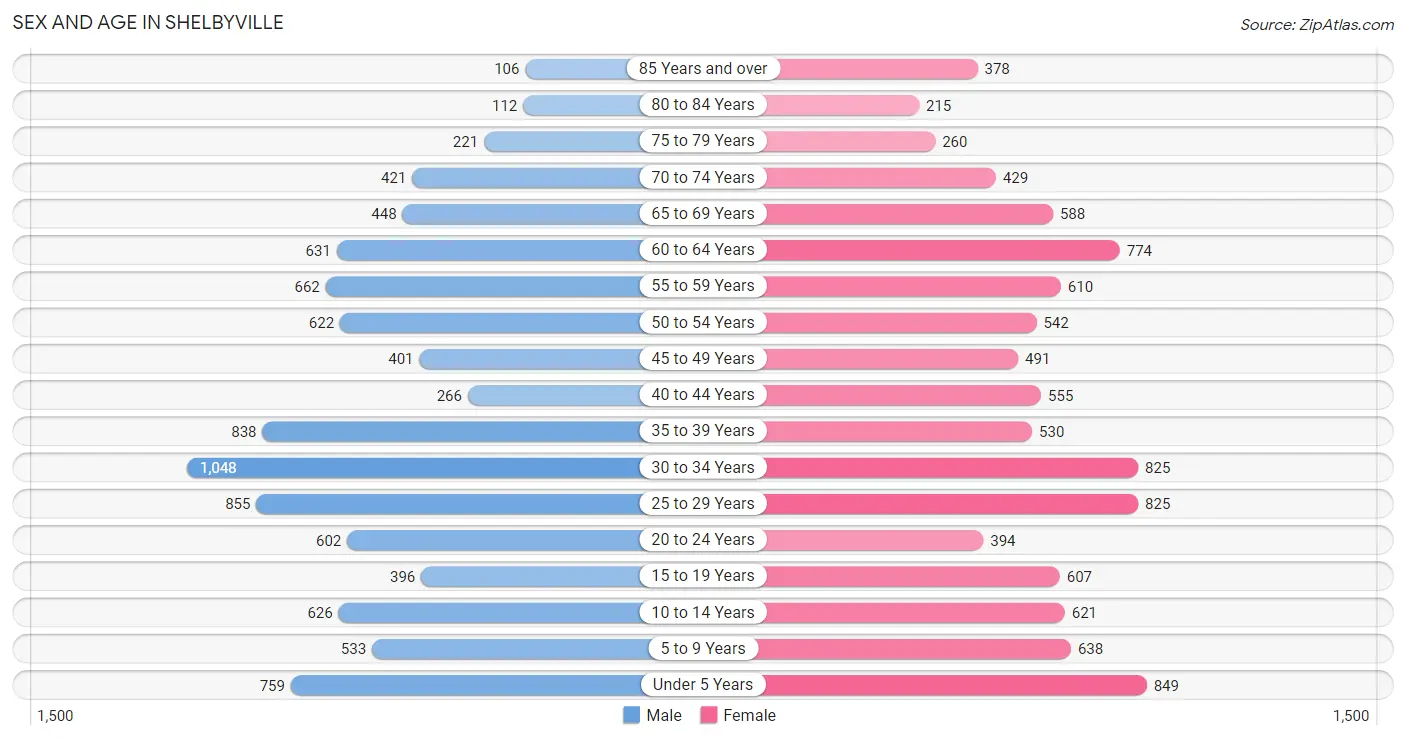
Sex and Age in Shelbyville
Sex and Age in Shelbyville
The most populous age groups in Shelbyville are 30 to 34 Years (1,048 | 11.0%) for men and Under 5 Years (849 | 8.4%) for women.
| Age Bracket | Male | Female |
| Under 5 Years | 759 (8.0%) | 849 (8.4%) |
| 5 to 9 Years | 533 (5.6%) | 638 (6.3%) |
| 10 to 14 Years | 626 (6.6%) | 621 (6.1%) |
| 15 to 19 Years | 396 (4.2%) | 607 (6.0%) |
| 20 to 24 Years | 602 (6.3%) | 394 (3.9%) |
| 25 to 29 Years | 855 (9.0%) | 825 (8.1%) |
| 30 to 34 Years | 1,048 (11.0%) | 825 (8.1%) |
| 35 to 39 Years | 838 (8.8%) | 530 (5.2%) |
| 40 to 44 Years | 266 (2.8%) | 555 (5.5%) |
| 45 to 49 Years | 401 (4.2%) | 491 (4.9%) |
| 50 to 54 Years | 622 (6.5%) | 542 (5.3%) |
| 55 to 59 Years | 662 (6.9%) | 610 (6.0%) |
| 60 to 64 Years | 631 (6.6%) | 774 (7.6%) |
| 65 to 69 Years | 448 (4.7%) | 588 (5.8%) |
| 70 to 74 Years | 421 (4.4%) | 429 (4.2%) |
| 75 to 79 Years | 221 (2.3%) | 260 (2.6%) |
| 80 to 84 Years | 112 (1.2%) | 215 (2.1%) |
| 85 Years and over | 106 (1.1%) | 378 (3.7%) |
| Total | 9,547 (100.0%) | 10,131 (100.0%) |
Families and Households in Shelbyville
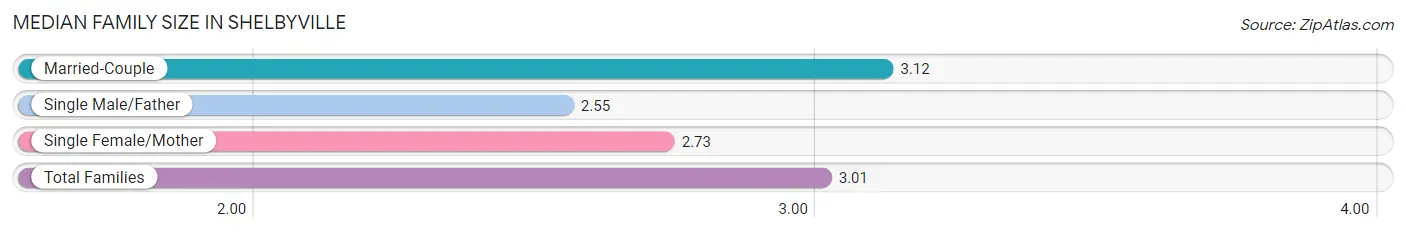
Median Family Size in Shelbyville
The median family size in Shelbyville is 3.01 persons per family, with married-couple families (3,599 | 74.7%) accounting for the largest median family size of 3.12 persons per family. On the other hand, single male/father families (373 | 7.7%) represent the smallest median family size with 2.55 persons per family.
| Family Type | # Families | Family Size |
| Married-Couple | 3,599 (74.7%) | 3.12 |
| Single Male/Father | 373 (7.7%) | 2.55 |
| Single Female/Mother | 849 (17.6%) | 2.73 |
| Total Families | 4,821 (100.0%) | 3.01 |
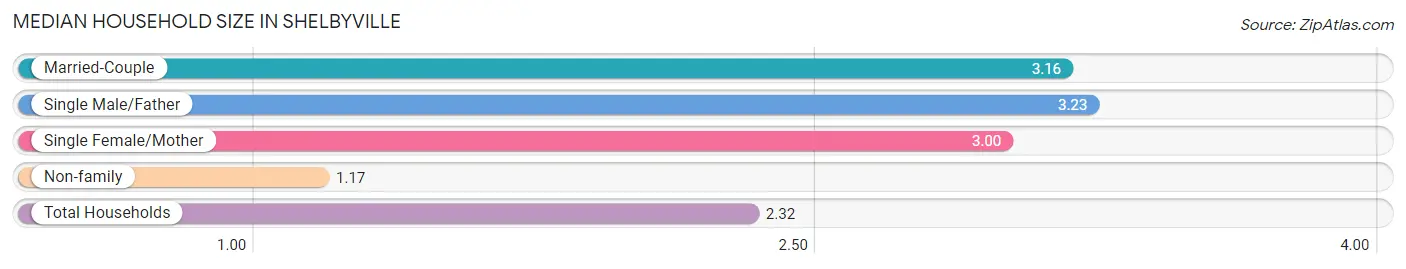
Median Household Size in Shelbyville
The median household size in Shelbyville is 2.32 persons per household, with single male/father households (373 | 4.5%) accounting for the largest median household size of 3.23 persons per household. non-family households (3,437 | 41.6%) represent the smallest median household size with 1.17 persons per household.
| Household Type | # Households | Household Size |
| Married-Couple | 3,599 (43.6%) | 3.16 |
| Single Male/Father | 373 (4.5%) | 3.23 |
| Single Female/Mother | 849 (10.3%) | 3.00 |
| Non-family | 3,437 (41.6%) | 1.17 |
| Total Households | 8,258 (100.0%) | 2.32 |
Household Size by Marriage Status in Shelbyville
Out of a total of 8,258 households in Shelbyville, 4,821 (58.4%) are family households, while 3,437 (41.6%) are nonfamily households. The most numerous type of family households are 2-person households, comprising 2,218, and the most common type of nonfamily households are 1-person households, comprising 2,846.
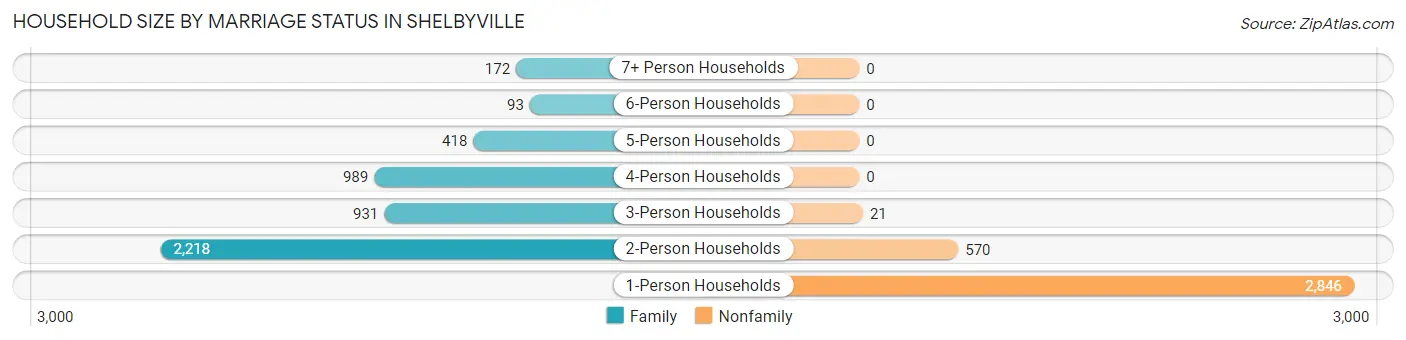
| Household Size | Family Households | Nonfamily Households |
| 1-Person Households | - | 2,846 (34.5%) |
| 2-Person Households | 2,218 (26.9%) | 570 (6.9%) |
| 3-Person Households | 931 (11.3%) | 21 (0.3%) |
| 4-Person Households | 989 (12.0%) | 0 (0.0%) |
| 5-Person Households | 418 (5.1%) | 0 (0.0%) |
| 6-Person Households | 93 (1.1%) | 0 (0.0%) |
| 7+ Person Households | 172 (2.1%) | 0 (0.0%) |
| Total | 4,821 (58.4%) | 3,437 (41.6%) |
Female Fertility in Shelbyville
Fertility by Age in Shelbyville
Average fertility rate in Shelbyville is 94.0 births per 1,000 women. Women in the age bracket of 20 to 34 years have the highest fertility rate with 134.0 births per 1,000 women. Women in the age bracket of 20 to 34 years acount for 67.0% of all women with births.
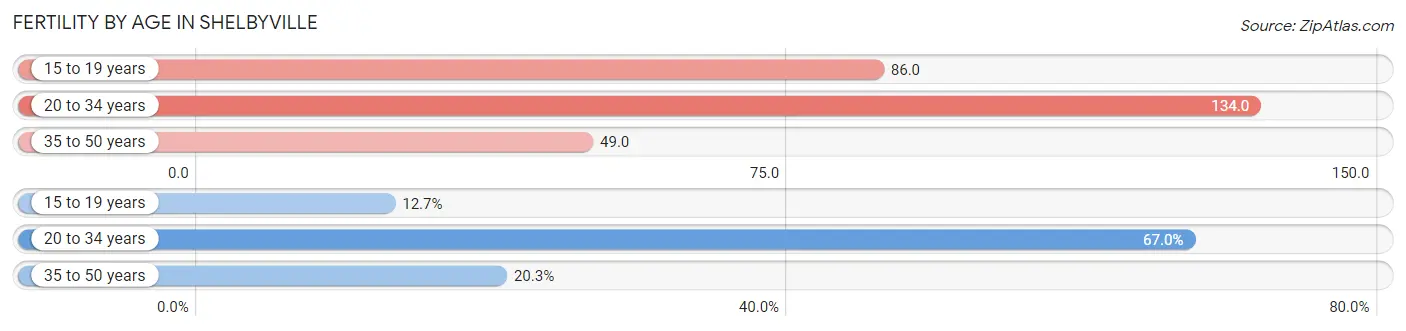
| Age Bracket | Women with Births | Births / 1,000 Women |
| 15 to 19 years | 52 (12.7%) | 86.0 |
| 20 to 34 years | 274 (67.0%) | 134.0 |
| 35 to 50 years | 83 (20.3%) | 49.0 |
| Total | 409 (100.0%) | 94.0 |
Fertility by Age by Marriage Status in Shelbyville
70.7% of women with births (409) in Shelbyville are married. The highest percentage of unmarried women with births falls into 35 to 50 years age bracket with 61.5% of them unmarried at the time of birth, while the lowest percentage of unmarried women with births belong to 15 to 19 years age bracket with 0.0% of them unmarried.
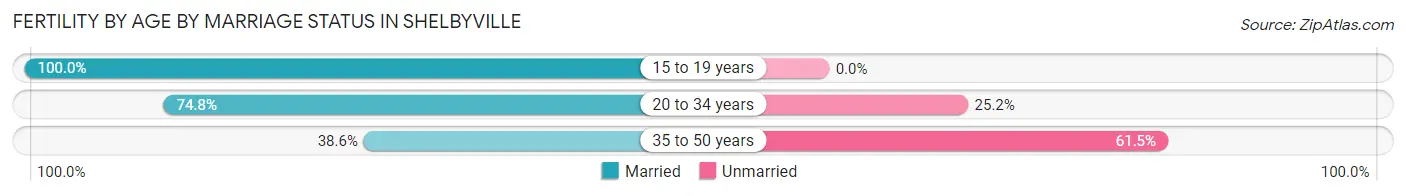
| Age Bracket | Married | Unmarried |
| 15 to 19 years | 52 (100.0%) | 0 (0.0%) |
| 20 to 34 years | 205 (74.8%) | 69 (25.2%) |
| 35 to 50 years | 32 (38.6%) | 51 (61.5%) |
| Total | 289 (70.7%) | 120 (29.3%) |
Fertility by Education in Shelbyville
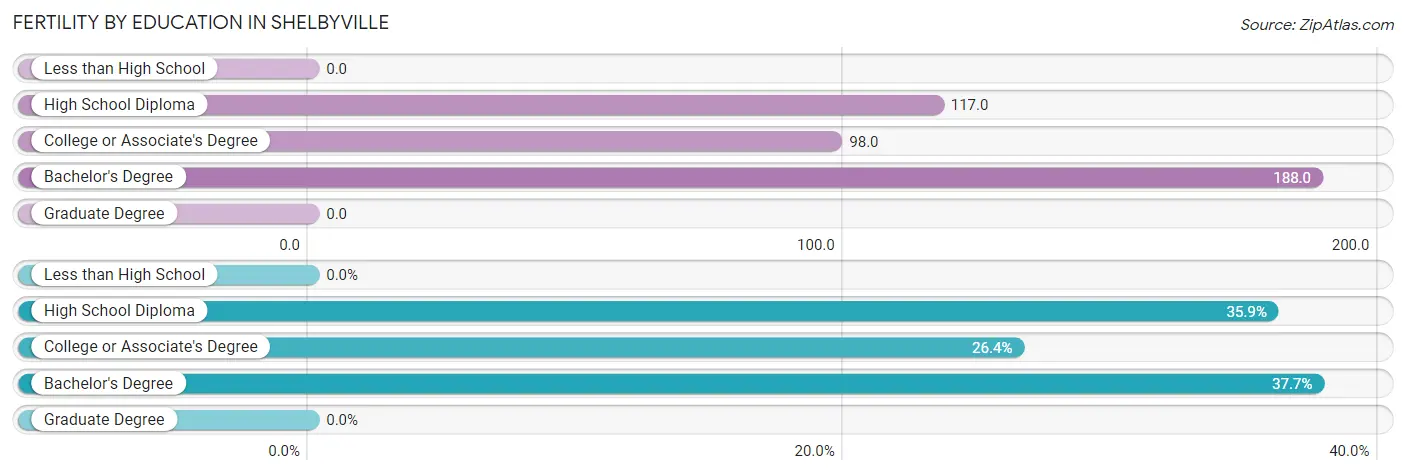
| Educational Attainment | Women with Births | Births / 1,000 Women |
| Less than High School | 0 (0.0%) | 0.0 |
| High School Diploma | 147 (35.9%) | 117.0 |
| College or Associate's Degree | 108 (26.4%) | 98.0 |
| Bachelor's Degree | 154 (37.7%) | 188.0 |
| Graduate Degree | 0 (0.0%) | 0.0 |
| Total | 409 (100.0%) | 94.0 |
Fertility by Education by Marriage Status in Shelbyville
29.3% of women with births in Shelbyville are unmarried. Women with the educational attainment of bachelor's degree are most likely to be married with 87.0% of them married at childbirth, while women with the educational attainment of college or associate's degree are least likely to be married with 55.6% of them unmarried at childbirth.
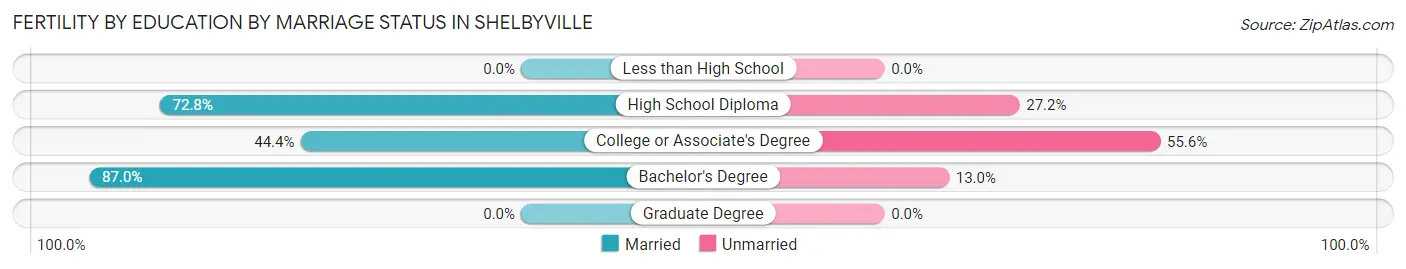
| Educational Attainment | Married | Unmarried |
| Less than High School | 0 (0.0%) | 0 (0.0%) |
| High School Diploma | 107 (72.8%) | 40 (27.2%) |
| College or Associate's Degree | 48 (44.4%) | 60 (55.6%) |
| Bachelor's Degree | 134 (87.0%) | 20 (13.0%) |
| Graduate Degree | 0 (0.0%) | 0 (0.0%) |
| Total | 289 (70.7%) | 120 (29.3%) |
Employment Characteristics in Shelbyville
Employment by Class of Employer in Shelbyville
Among the 9,210 employed individuals in Shelbyville, private company employees (6,749 | 73.3%), not-for-profit organizations (690 | 7.5%), and self-employed (not incorporated) (533 | 5.8%) make up the most common classes of employment.
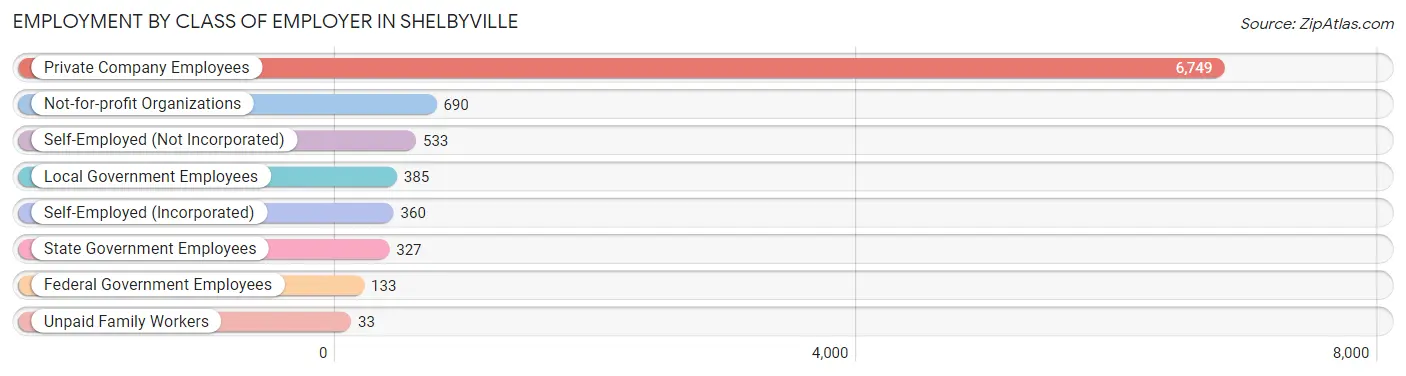
| Employer Class | # Employees | % Employees |
| Private Company Employees | 6,749 | 73.3% |
| Self-Employed (Incorporated) | 360 | 3.9% |
| Self-Employed (Not Incorporated) | 533 | 5.8% |
| Not-for-profit Organizations | 690 | 7.5% |
| Local Government Employees | 385 | 4.2% |
| State Government Employees | 327 | 3.5% |
| Federal Government Employees | 133 | 1.4% |
| Unpaid Family Workers | 33 | 0.4% |
| Total | 9,210 | 100.0% |
Employment Status by Age in Shelbyville
According to the labor force statistics for Shelbyville, out of the total population over 16 years of age (15,381), 63.3% or 9,736 individuals are in the labor force, with 2.8% or 273 of them unemployed. The age group with the highest labor force participation rate is 35 to 44 years, with 85.5% or 1,872 individuals in the labor force. Within the labor force, the 20 to 24 years age range has the highest percentage of unemployed individuals, with 12.0% or 95 of them being unemployed.
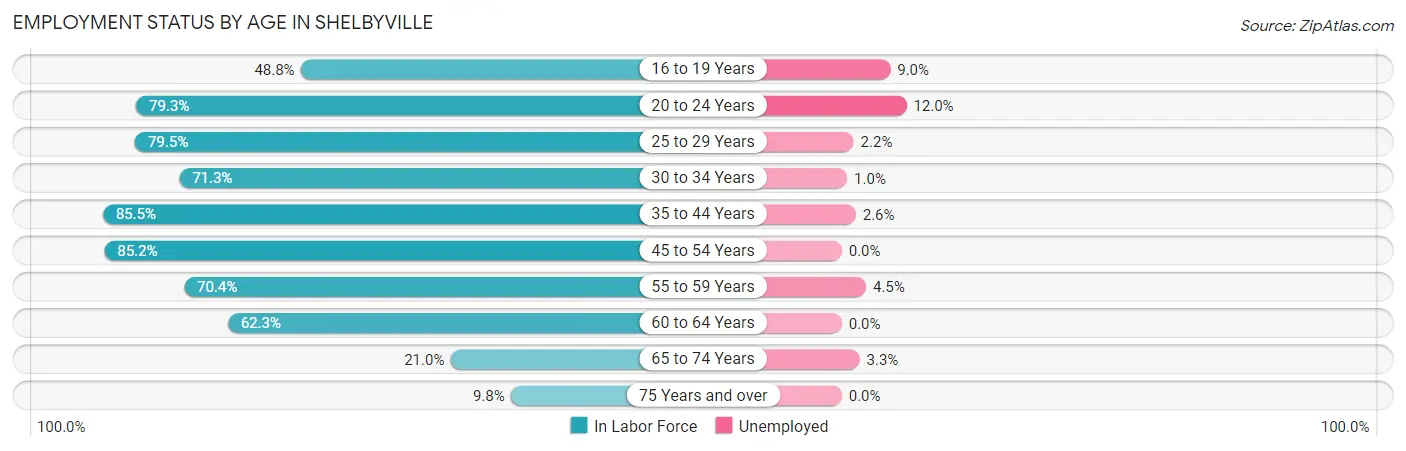
| Age Bracket | In Labor Force | Unemployed |
| 16 to 19 Years | 357 (48.8%) | 32 (9.0%) |
| 20 to 24 Years | 790 (79.3%) | 95 (12.0%) |
| 25 to 29 Years | 1,336 (79.5%) | 29 (2.2%) |
| 30 to 34 Years | 1,335 (71.3%) | 13 (1.0%) |
| 35 to 44 Years | 1,872 (85.5%) | 49 (2.6%) |
| 45 to 54 Years | 1,752 (85.2%) | 0 (0.0%) |
| 55 to 59 Years | 895 (70.4%) | 40 (4.5%) |
| 60 to 64 Years | 875 (62.3%) | 0 (0.0%) |
| 65 to 74 Years | 396 (21.0%) | 13 (3.3%) |
| 75 Years and over | 127 (9.8%) | 0 (0.0%) |
| Total | 9,736 (63.3%) | 273 (2.8%) |
Employment Status by Educational Attainment in Shelbyville
According to labor force statistics for Shelbyville, 77.0% of individuals (8,066) out of the total population between 25 and 64 years of age (10,475) are in the labor force, with 1.7% or 137 of them being unemployed. The group with the highest labor force participation rate are those with the educational attainment of bachelor's degree or higher, with 88.5% or 1,843 individuals in the labor force. Within the labor force, individuals with high school diploma education have the highest percentage of unemployment, with 3.2% or 108 of them being unemployed.
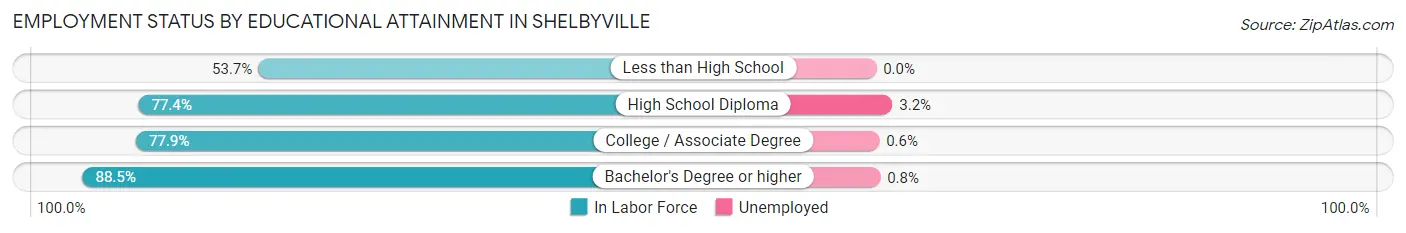
| Educational Attainment | In Labor Force | Unemployed |
| Less than High School | 654 (53.7%) | 0 (0.0%) |
| High School Diploma | 3,375 (77.4%) | 140 (3.2%) |
| College / Associate Degree | 2,194 (77.9%) | 17 (0.6%) |
| Bachelor's Degree or higher | 1,843 (88.5%) | 17 (0.8%) |
| Total | 8,066 (77.0%) | 178 (1.7%) |
Employment Occupations by Sex in Shelbyville
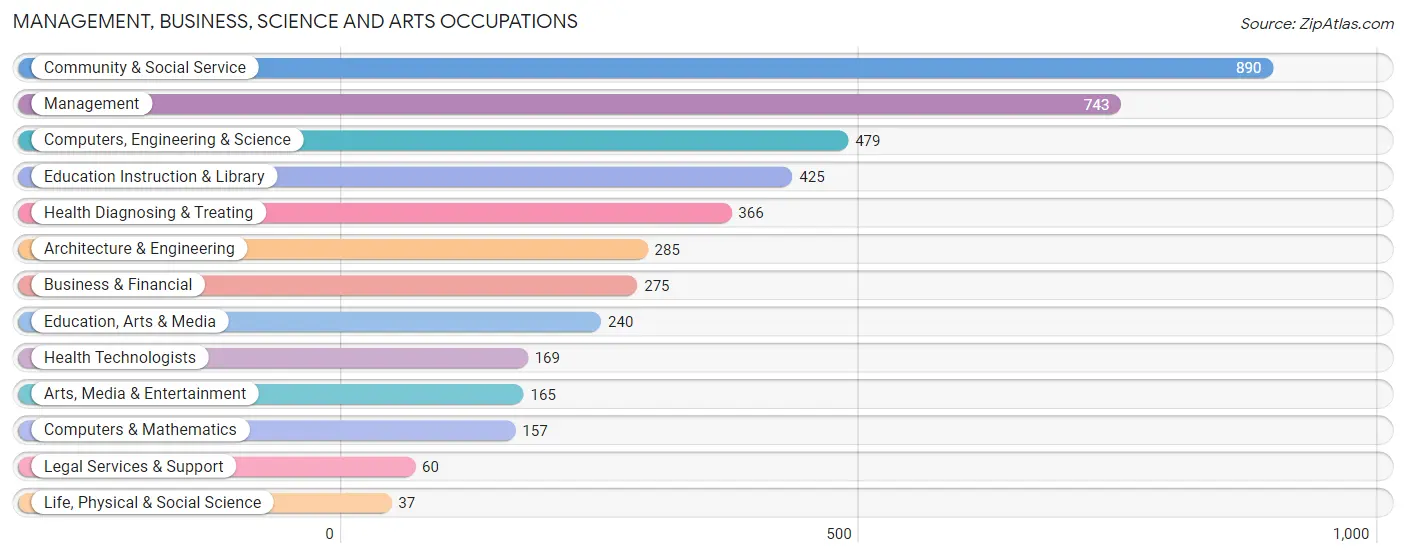
Management, Business, Science and Arts Occupations
The most common Management, Business, Science and Arts occupations in Shelbyville are Community & Social Service (890 | 9.4%), Management (743 | 7.9%), Computers, Engineering & Science (479 | 5.1%), Education Instruction & Library (425 | 4.5%), and Health Diagnosing & Treating (366 | 3.9%).
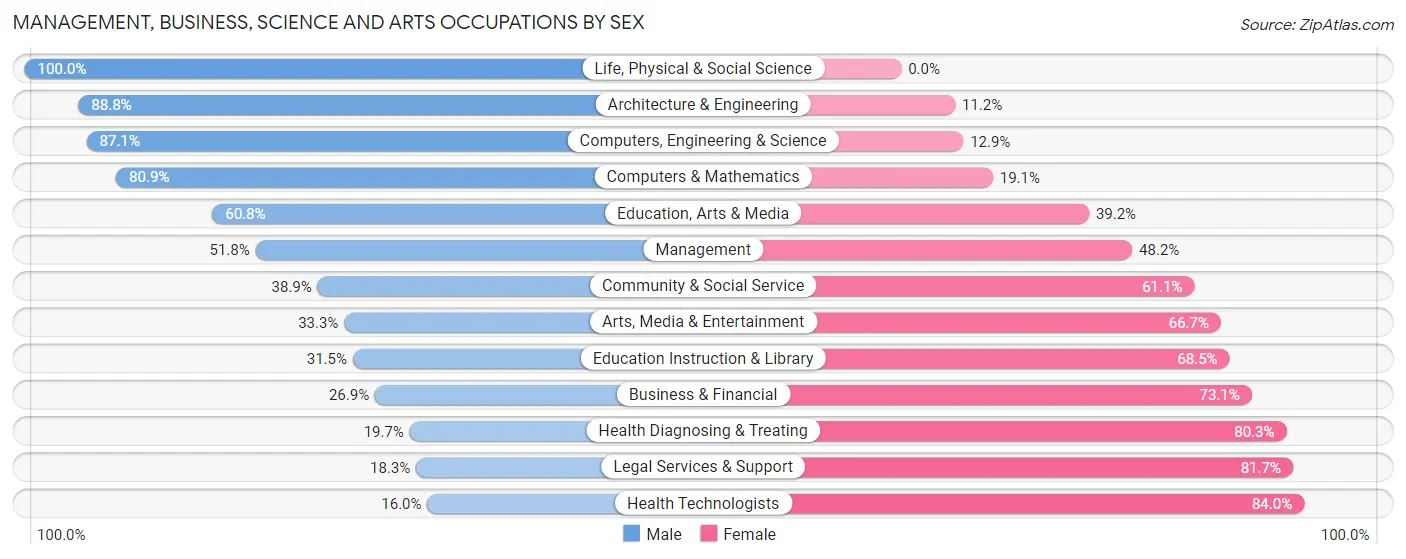
Management, Business, Science and Arts Occupations by Sex
Within the Management, Business, Science and Arts occupations in Shelbyville, the most male-oriented occupations are Life, Physical & Social Science (100.0%), Architecture & Engineering (88.8%), and Computers, Engineering & Science (87.1%), while the most female-oriented occupations are Health Technologists (84.0%), Legal Services & Support (81.7%), and Health Diagnosing & Treating (80.3%).
| Occupation | Male | Female |
| Management | 385 (51.8%) | 358 (48.2%) |
| Business & Financial | 74 (26.9%) | 201 (73.1%) |
| Computers, Engineering & Science | 417 (87.1%) | 62 (12.9%) |
| Computers & Mathematics | 127 (80.9%) | 30 (19.1%) |
| Architecture & Engineering | 253 (88.8%) | 32 (11.2%) |
| Life, Physical & Social Science | 37 (100.0%) | 0 (0.0%) |
| Community & Social Service | 346 (38.9%) | 544 (61.1%) |
| Education, Arts & Media | 146 (60.8%) | 94 (39.2%) |
| Legal Services & Support | 11 (18.3%) | 49 (81.7%) |
| Education Instruction & Library | 134 (31.5%) | 291 (68.5%) |
| Arts, Media & Entertainment | 55 (33.3%) | 110 (66.7%) |
| Health Diagnosing & Treating | 72 (19.7%) | 294 (80.3%) |
| Health Technologists | 27 (16.0%) | 142 (84.0%) |
| Total (Category) | 1,294 (47.0%) | 1,459 (53.0%) |
| Total (Overall) | 5,087 (53.9%) | 4,358 (46.1%) |
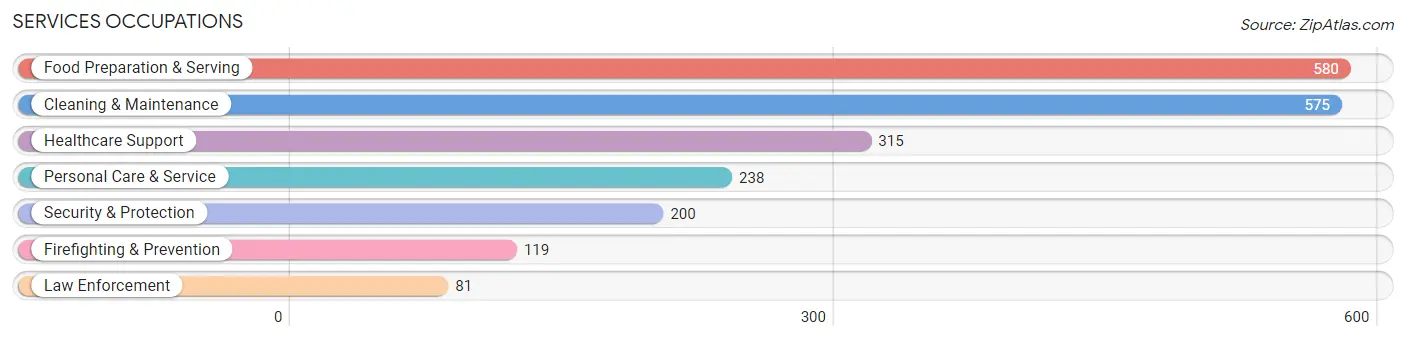
Services Occupations
The most common Services occupations in Shelbyville are Food Preparation & Serving (580 | 6.1%), Cleaning & Maintenance (575 | 6.1%), Healthcare Support (315 | 3.3%), Personal Care & Service (238 | 2.5%), and Security & Protection (200 | 2.1%).
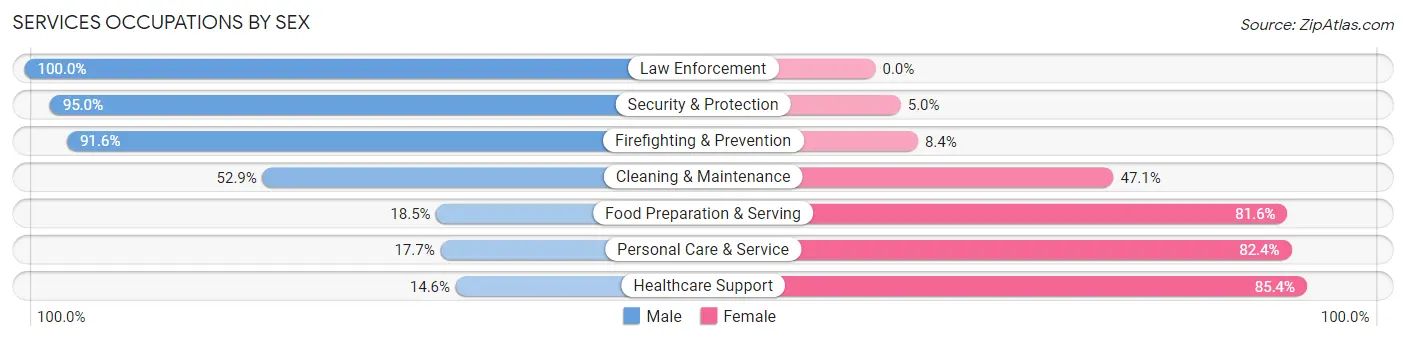
Services Occupations by Sex
Within the Services occupations in Shelbyville, the most male-oriented occupations are Law Enforcement (100.0%), Security & Protection (95.0%), and Firefighting & Prevention (91.6%), while the most female-oriented occupations are Healthcare Support (85.4%), Personal Care & Service (82.4%), and Food Preparation & Serving (81.6%).
| Occupation | Male | Female |
| Healthcare Support | 46 (14.6%) | 269 (85.4%) |
| Security & Protection | 190 (95.0%) | 10 (5.0%) |
| Firefighting & Prevention | 109 (91.6%) | 10 (8.4%) |
| Law Enforcement | 81 (100.0%) | 0 (0.0%) |
| Food Preparation & Serving | 107 (18.4%) | 473 (81.6%) |
| Cleaning & Maintenance | 304 (52.9%) | 271 (47.1%) |
| Personal Care & Service | 42 (17.6%) | 196 (82.4%) |
| Total (Category) | 689 (36.1%) | 1,219 (63.9%) |
| Total (Overall) | 5,087 (53.9%) | 4,358 (46.1%) |
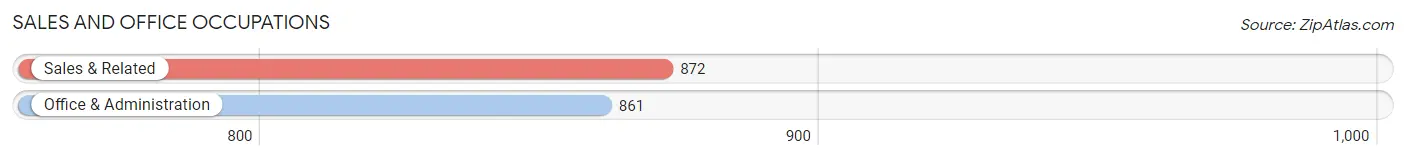
Sales and Office Occupations
The most common Sales and Office occupations in Shelbyville are Sales & Related (872 | 9.2%), and Office & Administration (861 | 9.1%).
Sales and Office Occupations by Sex
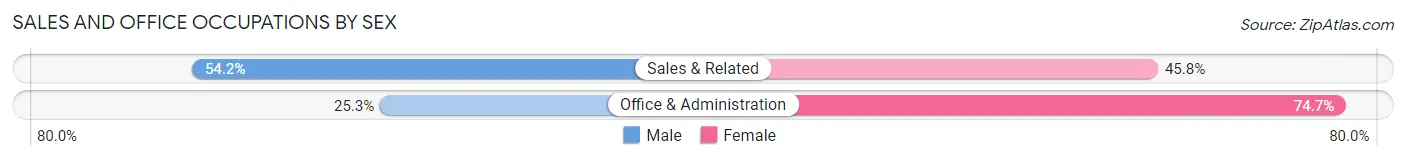
| Occupation | Male | Female |
| Sales & Related | 473 (54.2%) | 399 (45.8%) |
| Office & Administration | 218 (25.3%) | 643 (74.7%) |
| Total (Category) | 691 (39.9%) | 1,042 (60.1%) |
| Total (Overall) | 5,087 (53.9%) | 4,358 (46.1%) |
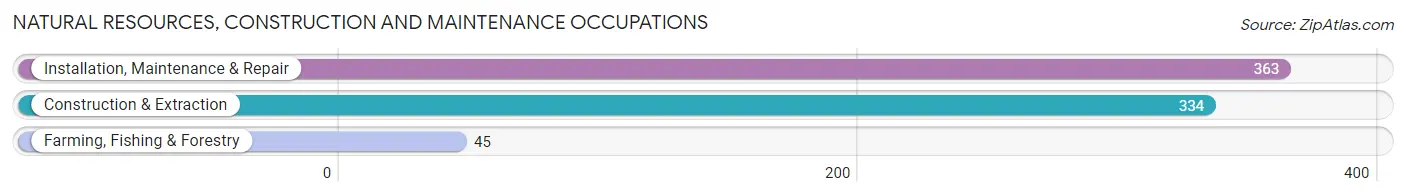
Natural Resources, Construction and Maintenance Occupations
The most common Natural Resources, Construction and Maintenance occupations in Shelbyville are Installation, Maintenance & Repair (363 | 3.8%), Construction & Extraction (334 | 3.5%), and Farming, Fishing & Forestry (45 | 0.5%).
Natural Resources, Construction and Maintenance Occupations by Sex
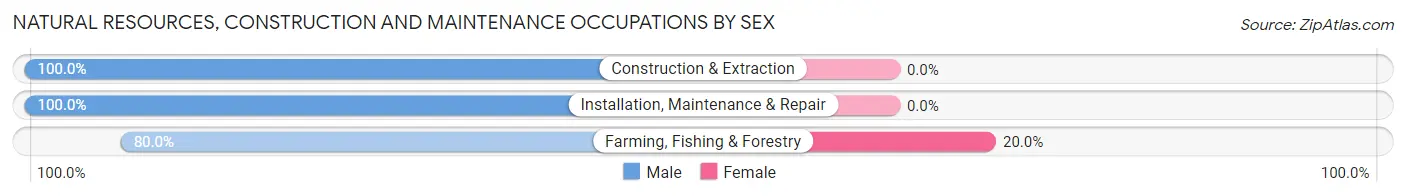
| Occupation | Male | Female |
| Farming, Fishing & Forestry | 36 (80.0%) | 9 (20.0%) |
| Construction & Extraction | 334 (100.0%) | 0 (0.0%) |
| Installation, Maintenance & Repair | 363 (100.0%) | 0 (0.0%) |
| Total (Category) | 733 (98.8%) | 9 (1.2%) |
| Total (Overall) | 5,087 (53.9%) | 4,358 (46.1%) |
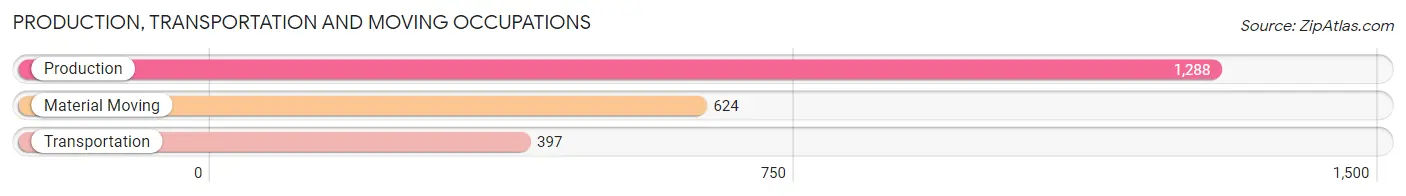
Production, Transportation and Moving Occupations
The most common Production, Transportation and Moving occupations in Shelbyville are Production (1,288 | 13.6%), Material Moving (624 | 6.6%), and Transportation (397 | 4.2%).
Production, Transportation and Moving Occupations by Sex
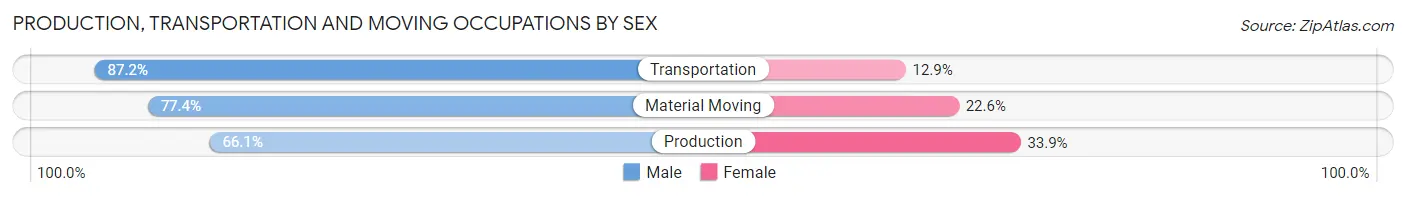
| Occupation | Male | Female |
| Production | 851 (66.1%) | 437 (33.9%) |
| Transportation | 346 (87.2%) | 51 (12.9%) |
| Material Moving | 483 (77.4%) | 141 (22.6%) |
| Total (Category) | 1,680 (72.8%) | 629 (27.2%) |
| Total (Overall) | 5,087 (53.9%) | 4,358 (46.1%) |
Employment Industries by Sex in Shelbyville
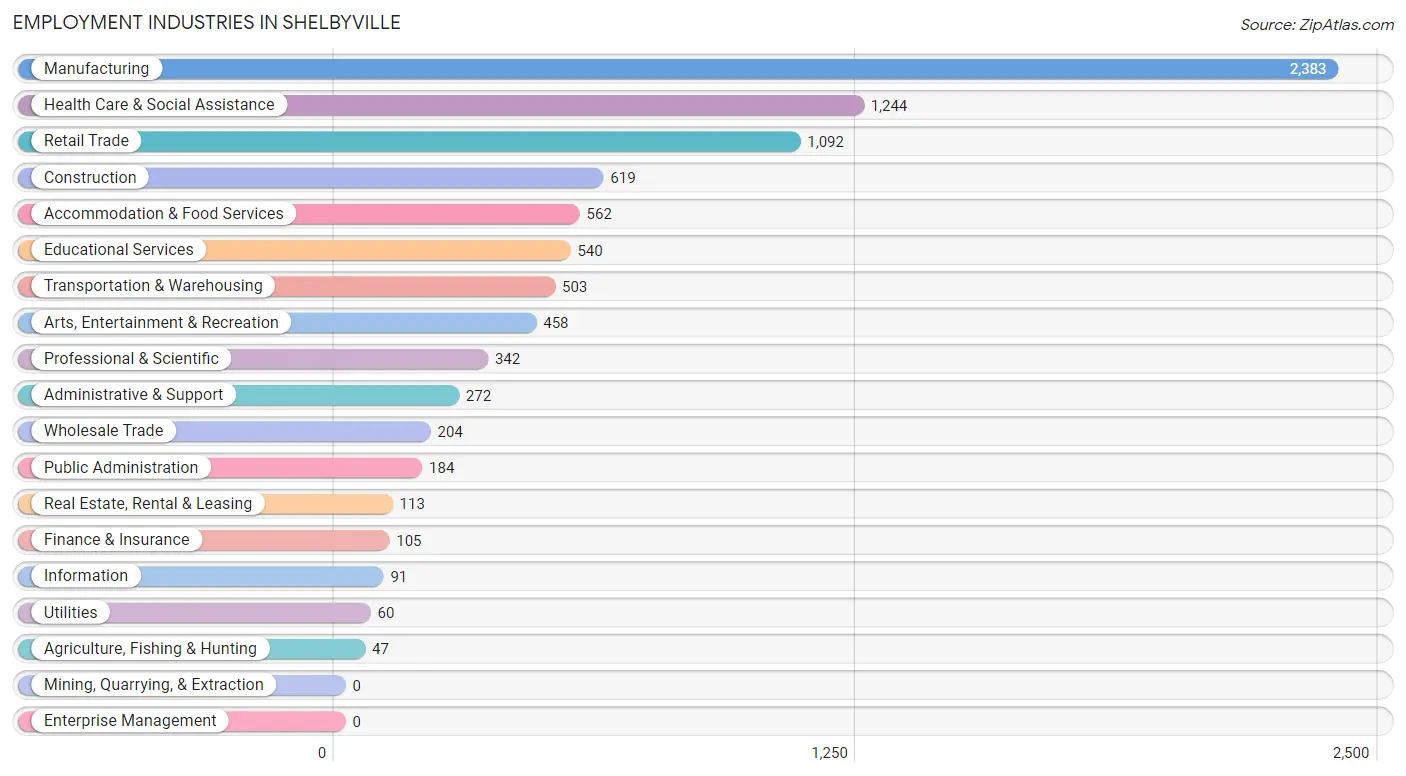
Employment Industries in Shelbyville
The major employment industries in Shelbyville include Manufacturing (2,383 | 25.2%), Health Care & Social Assistance (1,244 | 13.2%), Retail Trade (1,092 | 11.6%), Construction (619 | 6.6%), and Accommodation & Food Services (562 | 5.9%).
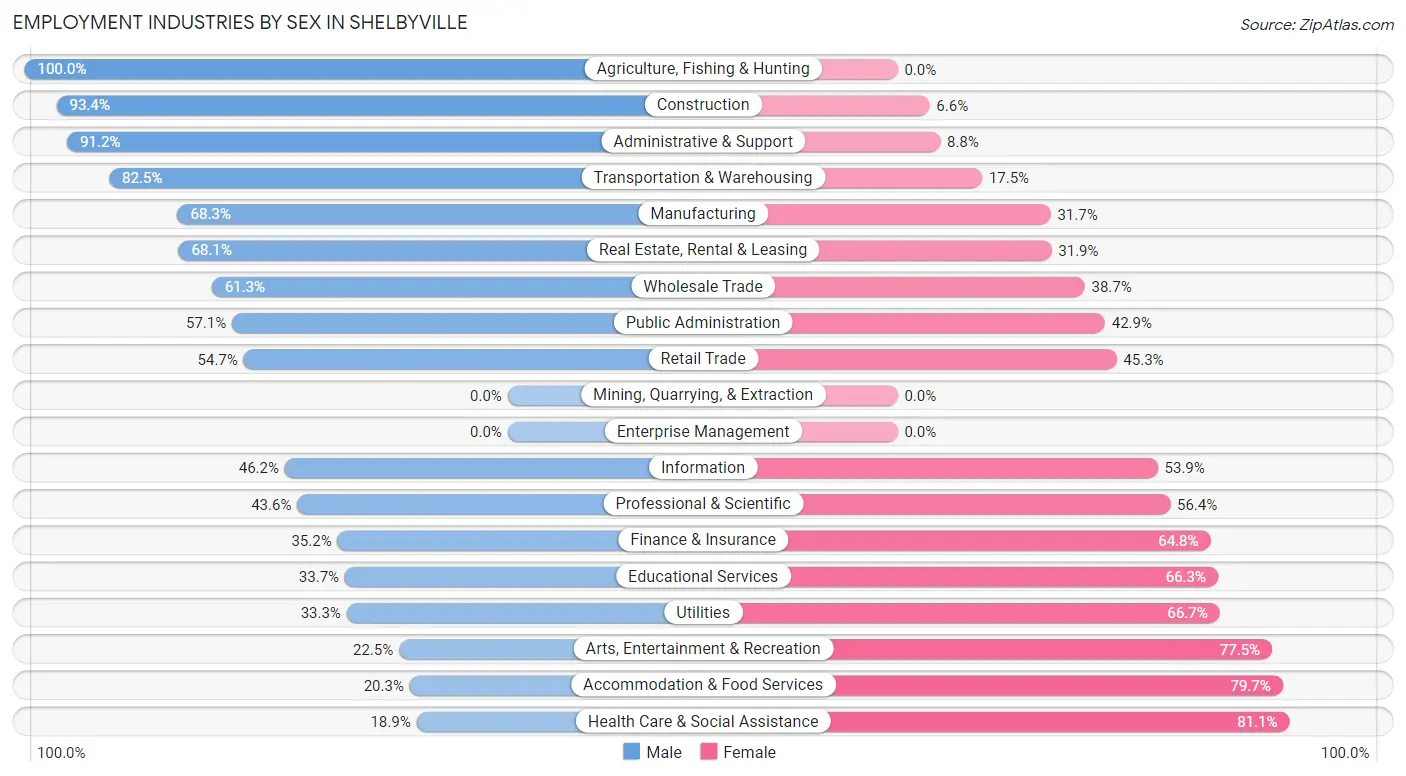
Employment Industries by Sex in Shelbyville
The Shelbyville industries that see more men than women are Agriculture, Fishing & Hunting (100.0%), Construction (93.4%), and Administrative & Support (91.2%), whereas the industries that tend to have a higher number of women are Health Care & Social Assistance (81.1%), Accommodation & Food Services (79.7%), and Arts, Entertainment & Recreation (77.5%).
| Industry | Male | Female |
| Agriculture, Fishing & Hunting | 47 (100.0%) | 0 (0.0%) |
| Mining, Quarrying, & Extraction | 0 (0.0%) | 0 (0.0%) |
| Construction | 578 (93.4%) | 41 (6.6%) |
| Manufacturing | 1,628 (68.3%) | 755 (31.7%) |
| Wholesale Trade | 125 (61.3%) | 79 (38.7%) |
| Retail Trade | 597 (54.7%) | 495 (45.3%) |
| Transportation & Warehousing | 415 (82.5%) | 88 (17.5%) |
| Utilities | 20 (33.3%) | 40 (66.7%) |
| Information | 42 (46.2%) | 49 (53.8%) |
| Finance & Insurance | 37 (35.2%) | 68 (64.8%) |
| Real Estate, Rental & Leasing | 77 (68.1%) | 36 (31.9%) |
| Professional & Scientific | 149 (43.6%) | 193 (56.4%) |
| Enterprise Management | 0 (0.0%) | 0 (0.0%) |
| Administrative & Support | 248 (91.2%) | 24 (8.8%) |
| Educational Services | 182 (33.7%) | 358 (66.3%) |
| Health Care & Social Assistance | 235 (18.9%) | 1,009 (81.1%) |
| Arts, Entertainment & Recreation | 103 (22.5%) | 355 (77.5%) |
| Accommodation & Food Services | 114 (20.3%) | 448 (79.7%) |
| Public Administration | 105 (57.1%) | 79 (42.9%) |
| Total | 5,087 (53.9%) | 4,358 (46.1%) |
Education in Shelbyville
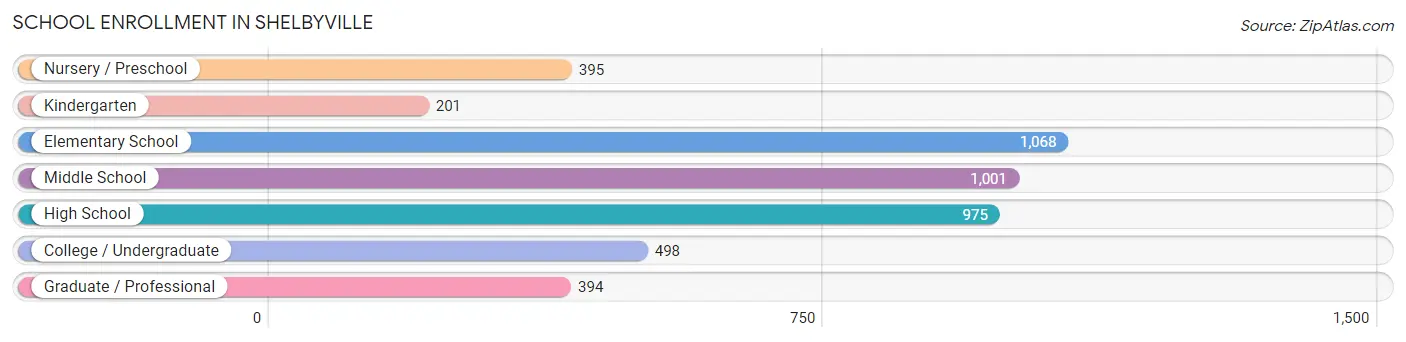
School Enrollment in Shelbyville
The most common levels of schooling among the 4,532 students in Shelbyville are elementary school (1,068 | 23.6%), middle school (1,001 | 22.1%), and high school (975 | 21.5%).
| School Level | # Students | % Students |
| Nursery / Preschool | 395 | 8.7% |
| Kindergarten | 201 | 4.4% |
| Elementary School | 1,068 | 23.6% |
| Middle School | 1,001 | 22.1% |
| High School | 975 | 21.5% |
| College / Undergraduate | 498 | 11.0% |
| Graduate / Professional | 394 | 8.7% |
| Total | 4,532 | 100.0% |
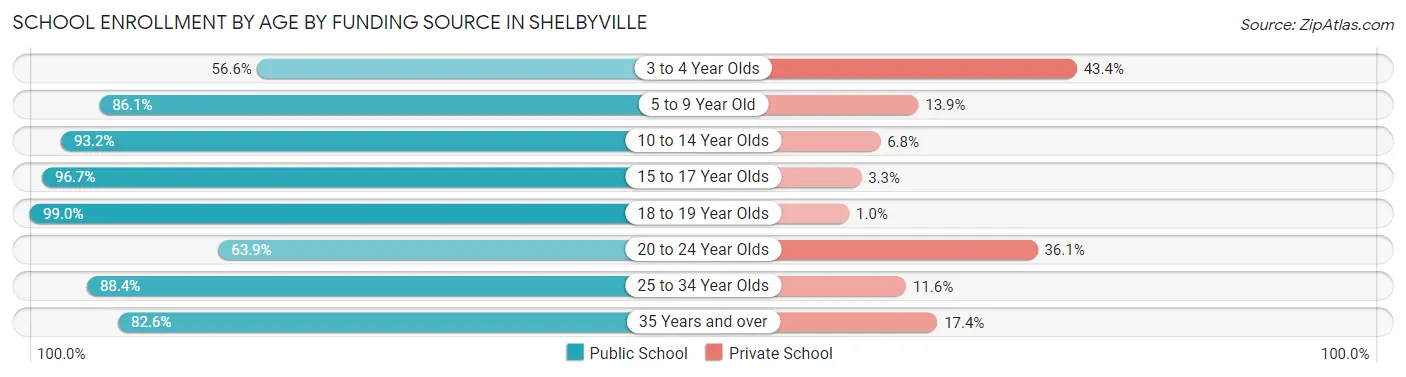
School Enrollment by Age by Funding Source in Shelbyville
Out of a total of 4,532 students who are enrolled in schools in Shelbyville, 612 (13.5%) attend a private institution, while the remaining 3,920 (86.5%) are enrolled in public schools. The age group of 3 to 4 year olds has the highest likelihood of being enrolled in private schools, with 158 (43.4% in the age bracket) enrolled. Conversely, the age group of 18 to 19 year olds has the lowest likelihood of being enrolled in a private school, with 97 (99.0% in the age bracket) attending a public institution.
| Age Bracket | Public School | Private School |
| 3 to 4 Year Olds | 206 (56.6%) | 158 (43.4%) |
| 5 to 9 Year Old | 997 (86.1%) | 161 (13.9%) |
| 10 to 14 Year Olds | 1,151 (93.2%) | 84 (6.8%) |
| 15 to 17 Year Olds | 712 (96.7%) | 24 (3.3%) |
| 18 to 19 Year Olds | 97 (99.0%) | 1 (1.0%) |
| 20 to 24 Year Olds | 154 (63.9%) | 87 (36.1%) |
| 25 to 34 Year Olds | 365 (88.4%) | 48 (11.6%) |
| 35 Years and over | 237 (82.6%) | 50 (17.4%) |
| Total | 3,920 (86.5%) | 612 (13.5%) |
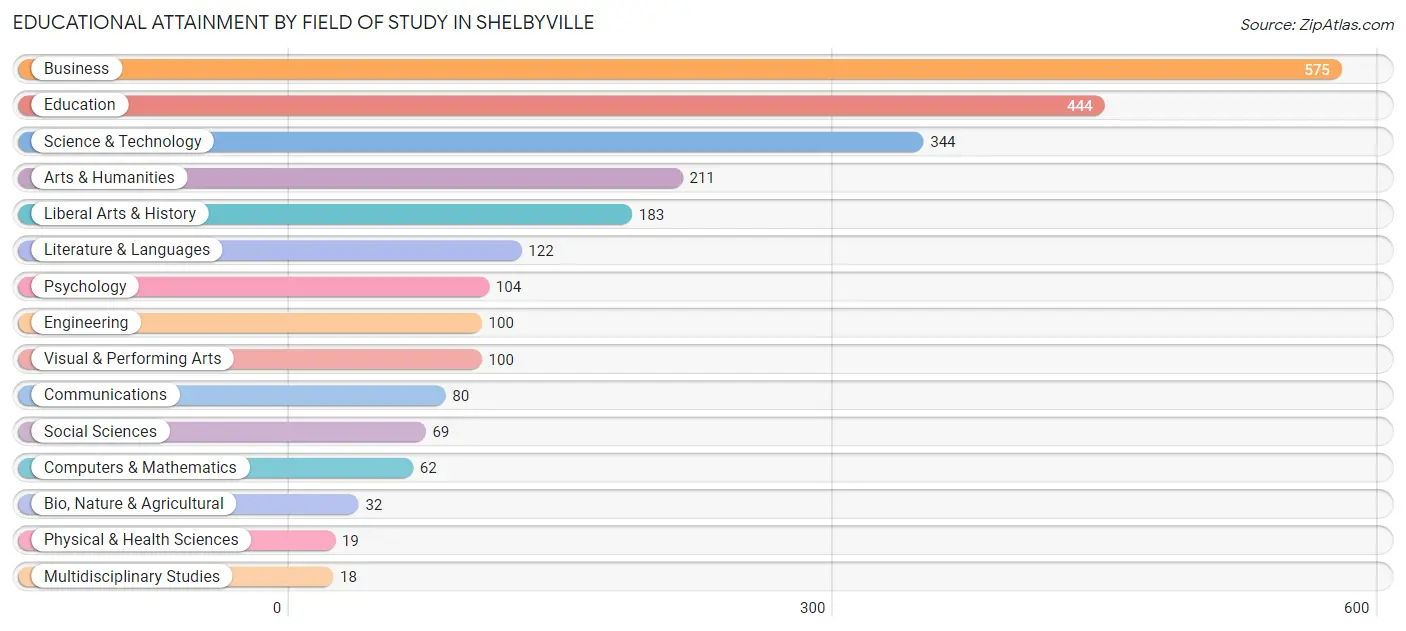
Educational Attainment by Field of Study in Shelbyville
Business (575 | 23.4%), education (444 | 18.0%), science & technology (344 | 14.0%), arts & humanities (211 | 8.6%), and liberal arts & history (183 | 7.4%) are the most common fields of study among 2,463 individuals in Shelbyville who have obtained a bachelor's degree or higher.
| Field of Study | # Graduates | % Graduates |
| Computers & Mathematics | 62 | 2.5% |
| Bio, Nature & Agricultural | 32 | 1.3% |
| Physical & Health Sciences | 19 | 0.8% |
| Psychology | 104 | 4.2% |
| Social Sciences | 69 | 2.8% |
| Engineering | 100 | 4.1% |
| Multidisciplinary Studies | 18 | 0.7% |
| Science & Technology | 344 | 14.0% |
| Business | 575 | 23.4% |
| Education | 444 | 18.0% |
| Literature & Languages | 122 | 5.0% |
| Liberal Arts & History | 183 | 7.4% |
| Visual & Performing Arts | 100 | 4.1% |
| Communications | 80 | 3.3% |
| Arts & Humanities | 211 | 8.6% |
| Total | 2,463 | 100.0% |
Transportation & Commute in Shelbyville
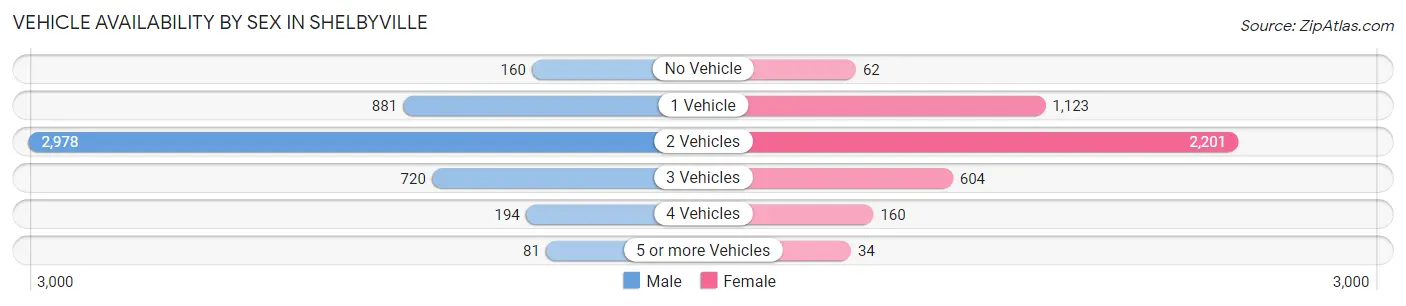
Vehicle Availability by Sex in Shelbyville
The most prevalent vehicle ownership categories in Shelbyville are males with 2 vehicles (2,978, accounting for 59.4%) and females with 2 vehicles (2,201, making up 71.2%).
| Vehicles Available | Male | Female |
| No Vehicle | 160 (3.2%) | 62 (1.5%) |
| 1 Vehicle | 881 (17.6%) | 1,123 (26.8%) |
| 2 Vehicles | 2,978 (59.4%) | 2,201 (52.6%) |
| 3 Vehicles | 720 (14.4%) | 604 (14.4%) |
| 4 Vehicles | 194 (3.9%) | 160 (3.8%) |
| 5 or more Vehicles | 81 (1.6%) | 34 (0.8%) |
| Total | 5,014 (100.0%) | 4,184 (100.0%) |
Commute Time in Shelbyville
The most frequently occuring commute durations in Shelbyville are 5 to 9 minutes (1,734 commuters, 20.3%), 10 to 14 minutes (1,493 commuters, 17.4%), and 15 to 19 minutes (860 commuters, 10.0%).
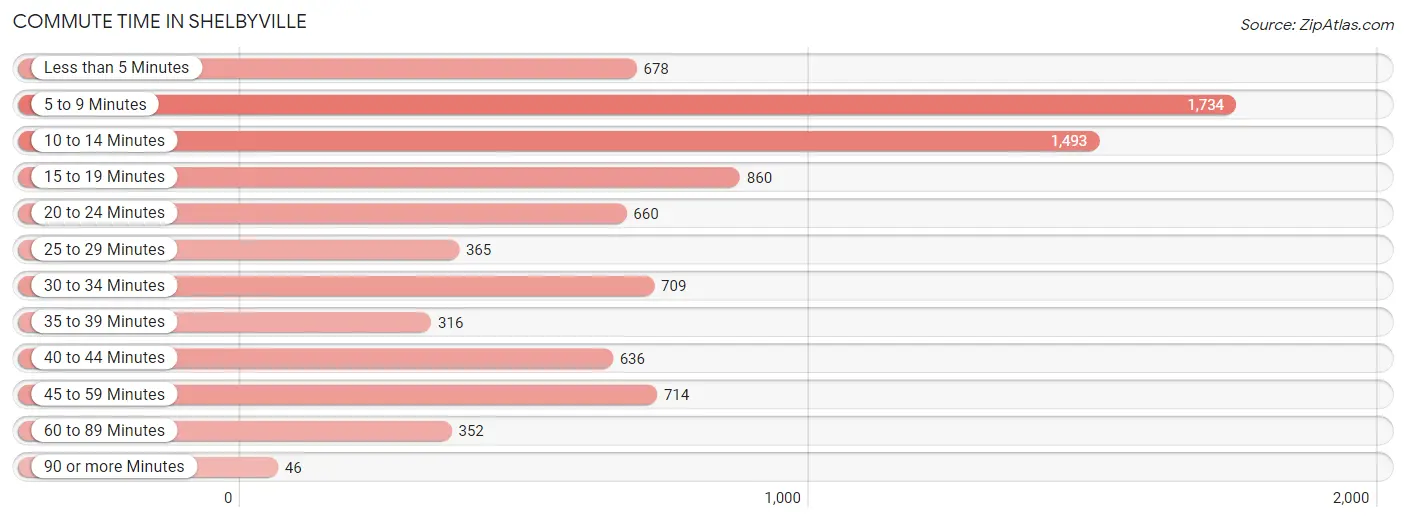
| Commute Time | # Commuters | % Commuters |
| Less than 5 Minutes | 678 | 7.9% |
| 5 to 9 Minutes | 1,734 | 20.3% |
| 10 to 14 Minutes | 1,493 | 17.4% |
| 15 to 19 Minutes | 860 | 10.0% |
| 20 to 24 Minutes | 660 | 7.7% |
| 25 to 29 Minutes | 365 | 4.3% |
| 30 to 34 Minutes | 709 | 8.3% |
| 35 to 39 Minutes | 316 | 3.7% |
| 40 to 44 Minutes | 636 | 7.4% |
| 45 to 59 Minutes | 714 | 8.3% |
| 60 to 89 Minutes | 352 | 4.1% |
| 90 or more Minutes | 46 | 0.5% |
Commute Time by Sex in Shelbyville
The most common commute times in Shelbyville are 10 to 14 minutes (879 commuters, 18.6%) for males and 5 to 9 minutes (860 commuters, 22.4%) for females.
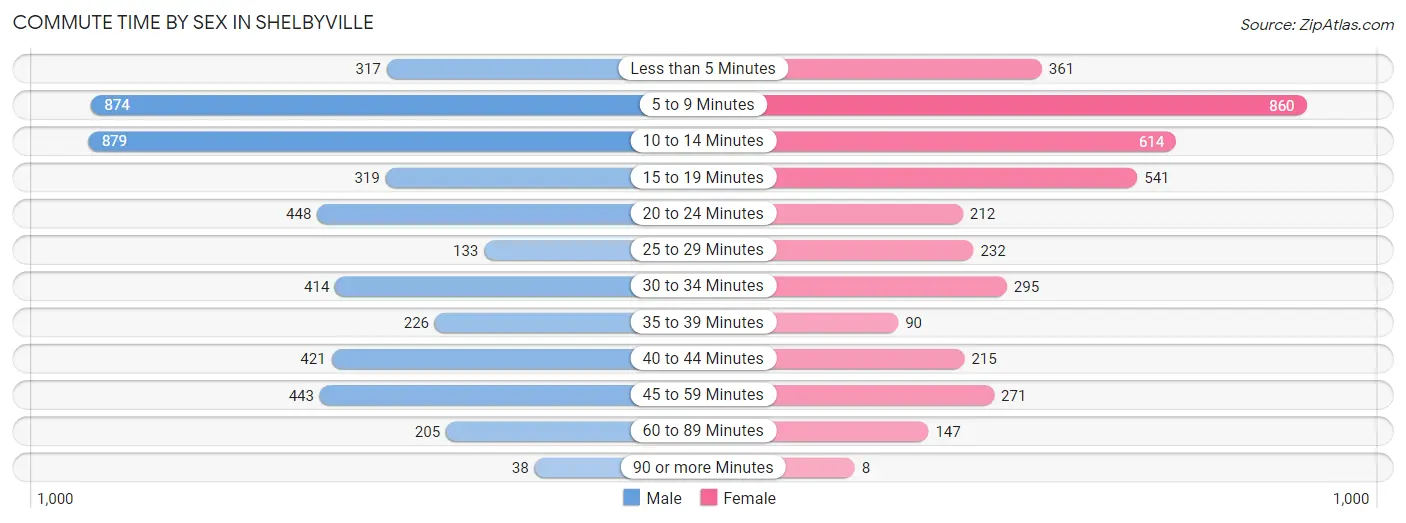
| Commute Time | Male | Female |
| Less than 5 Minutes | 317 (6.7%) | 361 (9.4%) |
| 5 to 9 Minutes | 874 (18.5%) | 860 (22.4%) |
| 10 to 14 Minutes | 879 (18.6%) | 614 (16.0%) |
| 15 to 19 Minutes | 319 (6.8%) | 541 (14.1%) |
| 20 to 24 Minutes | 448 (9.5%) | 212 (5.5%) |
| 25 to 29 Minutes | 133 (2.8%) | 232 (6.0%) |
| 30 to 34 Minutes | 414 (8.8%) | 295 (7.7%) |
| 35 to 39 Minutes | 226 (4.8%) | 90 (2.3%) |
| 40 to 44 Minutes | 421 (8.9%) | 215 (5.6%) |
| 45 to 59 Minutes | 443 (9.4%) | 271 (7.0%) |
| 60 to 89 Minutes | 205 (4.3%) | 147 (3.8%) |
| 90 or more Minutes | 38 (0.8%) | 8 (0.2%) |
Time of Departure to Work by Sex in Shelbyville
The most frequent times of departure to work in Shelbyville are 4:00 PM to 11:59 PM (684, 14.5%) for males and 7:30 AM to 7:59 AM (601, 15.6%) for females.
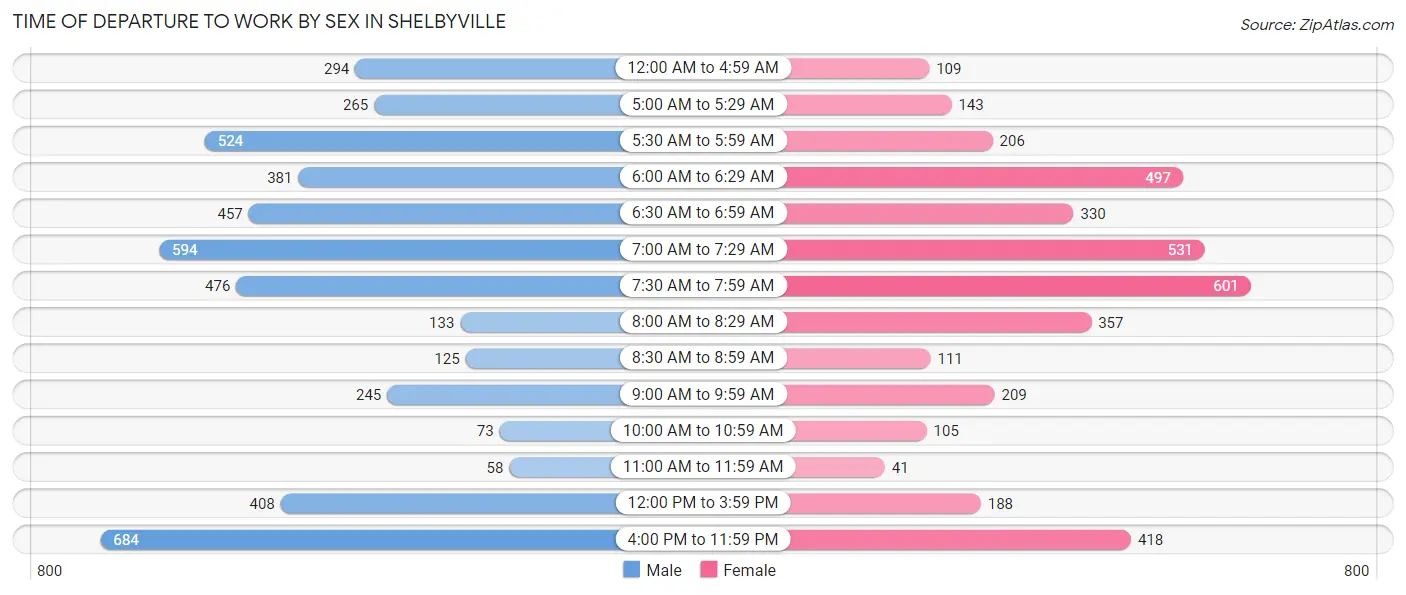
| Time of Departure | Male | Female |
| 12:00 AM to 4:59 AM | 294 (6.2%) | 109 (2.8%) |
| 5:00 AM to 5:29 AM | 265 (5.6%) | 143 (3.7%) |
| 5:30 AM to 5:59 AM | 524 (11.1%) | 206 (5.4%) |
| 6:00 AM to 6:29 AM | 381 (8.1%) | 497 (12.9%) |
| 6:30 AM to 6:59 AM | 457 (9.7%) | 330 (8.6%) |
| 7:00 AM to 7:29 AM | 594 (12.6%) | 531 (13.8%) |
| 7:30 AM to 7:59 AM | 476 (10.1%) | 601 (15.6%) |
| 8:00 AM to 8:29 AM | 133 (2.8%) | 357 (9.3%) |
| 8:30 AM to 8:59 AM | 125 (2.6%) | 111 (2.9%) |
| 9:00 AM to 9:59 AM | 245 (5.2%) | 209 (5.4%) |
| 10:00 AM to 10:59 AM | 73 (1.5%) | 105 (2.7%) |
| 11:00 AM to 11:59 AM | 58 (1.2%) | 41 (1.1%) |
| 12:00 PM to 3:59 PM | 408 (8.6%) | 188 (4.9%) |
| 4:00 PM to 11:59 PM | 684 (14.5%) | 418 (10.9%) |
| Total | 4,717 (100.0%) | 3,846 (100.0%) |
Housing Occupancy in Shelbyville
Occupancy by Ownership in Shelbyville
Of the total 8,258 dwellings in Shelbyville, owner-occupied units account for 4,631 (56.1%), while renter-occupied units make up 3,627 (43.9%).
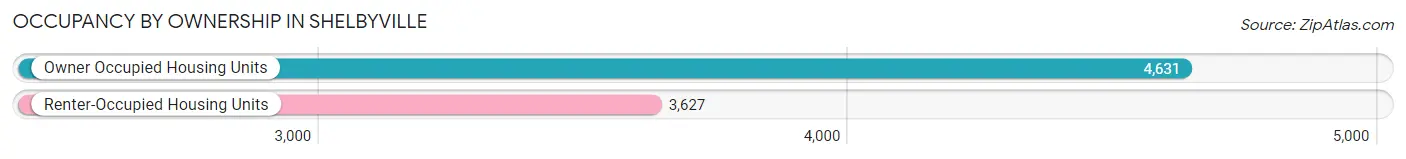
| Occupancy | # Housing Units | % Housing Units |
| Owner Occupied Housing Units | 4,631 | 56.1% |
| Renter-Occupied Housing Units | 3,627 | 43.9% |
| Total Occupied Housing Units | 8,258 | 100.0% |
Occupancy by Household Size in Shelbyville
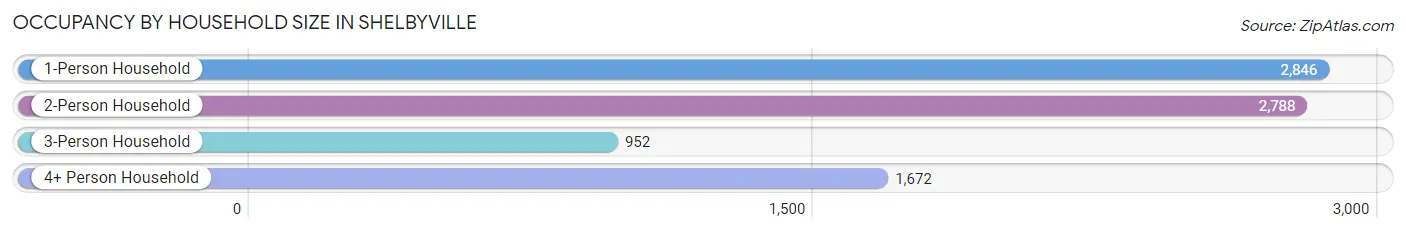
| Household Size | # Housing Units | % Housing Units |
| 1-Person Household | 2,846 | 34.5% |
| 2-Person Household | 2,788 | 33.8% |
| 3-Person Household | 952 | 11.5% |
| 4+ Person Household | 1,672 | 20.3% |
| Total Housing Units | 8,258 | 100.0% |
Occupancy by Ownership by Household Size in Shelbyville
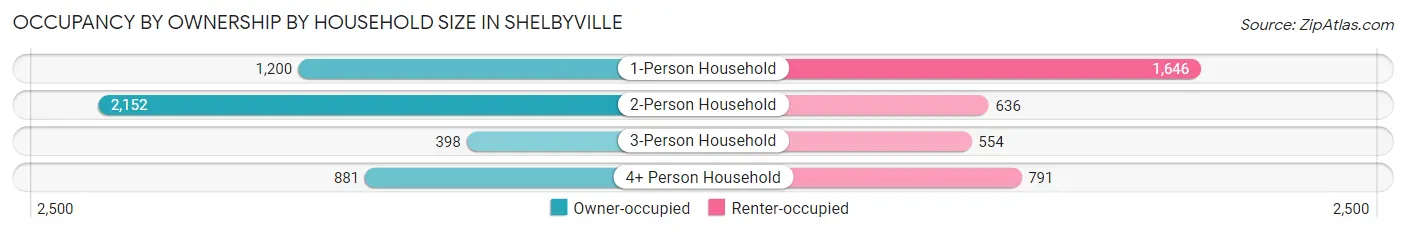
| Household Size | Owner-occupied | Renter-occupied |
| 1-Person Household | 1,200 (42.2%) | 1,646 (57.8%) |
| 2-Person Household | 2,152 (77.2%) | 636 (22.8%) |
| 3-Person Household | 398 (41.8%) | 554 (58.2%) |
| 4+ Person Household | 881 (52.7%) | 791 (47.3%) |
| Total Housing Units | 4,631 (56.1%) | 3,627 (43.9%) |
Occupancy by Educational Attainment in Shelbyville
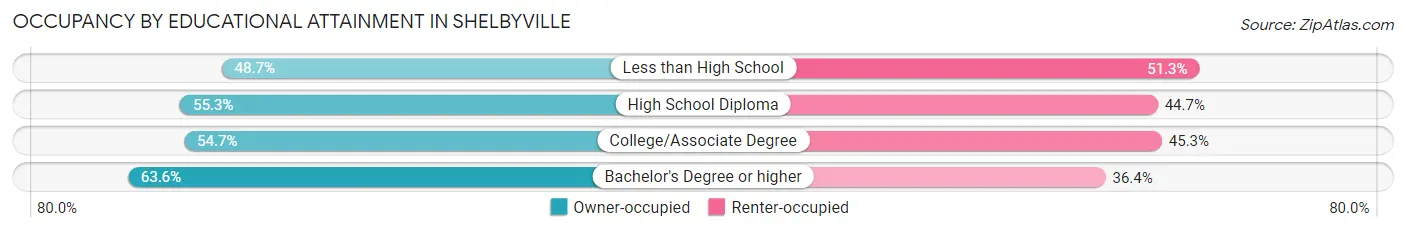
| Household Size | Owner-occupied | Renter-occupied |
| Less than High School | 368 (48.7%) | 387 (51.3%) |
| High School Diploma | 2,176 (55.3%) | 1,756 (44.7%) |
| College/Associate Degree | 1,132 (54.7%) | 938 (45.3%) |
| Bachelor's Degree or higher | 955 (63.6%) | 546 (36.4%) |
Occupancy by Age of Householder in Shelbyville
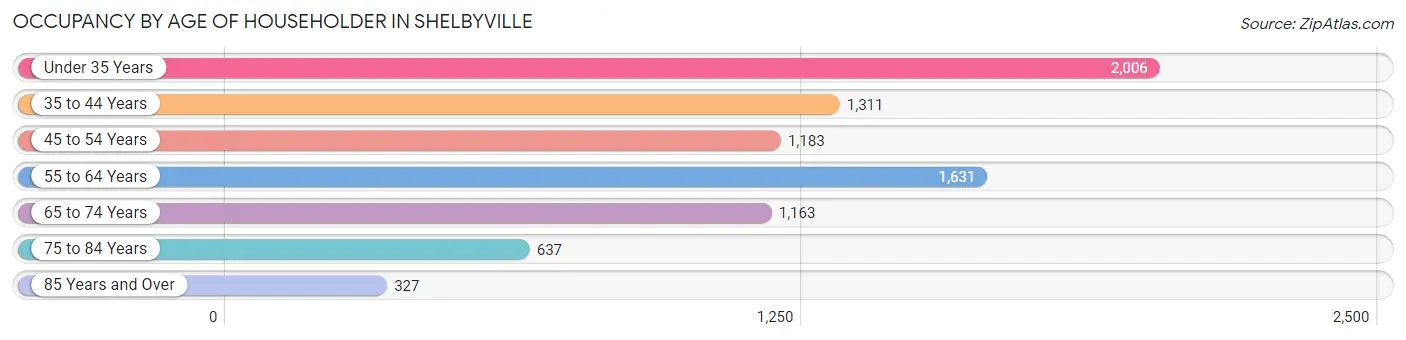
| Age Bracket | # Households | % Households |
| Under 35 Years | 2,006 | 24.3% |
| 35 to 44 Years | 1,311 | 15.9% |
| 45 to 54 Years | 1,183 | 14.3% |
| 55 to 64 Years | 1,631 | 19.8% |
| 65 to 74 Years | 1,163 | 14.1% |
| 75 to 84 Years | 637 | 7.7% |
| 85 Years and Over | 327 | 4.0% |
| Total | 8,258 | 100.0% |
Housing Finances in Shelbyville
Median Income by Occupancy in Shelbyville
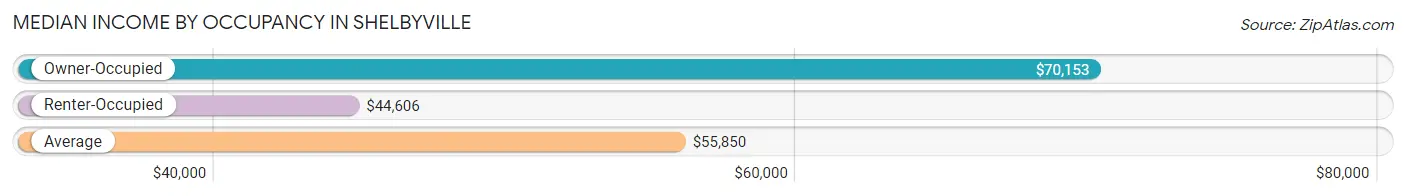
| Occupancy Type | # Households | Median Income |
| Owner-Occupied | 4,631 (56.1%) | $70,153 |
| Renter-Occupied | 3,627 (43.9%) | $44,606 |
| Average | 8,258 (100.0%) | $55,850 |
Occupancy by Householder Income Bracket in Shelbyville
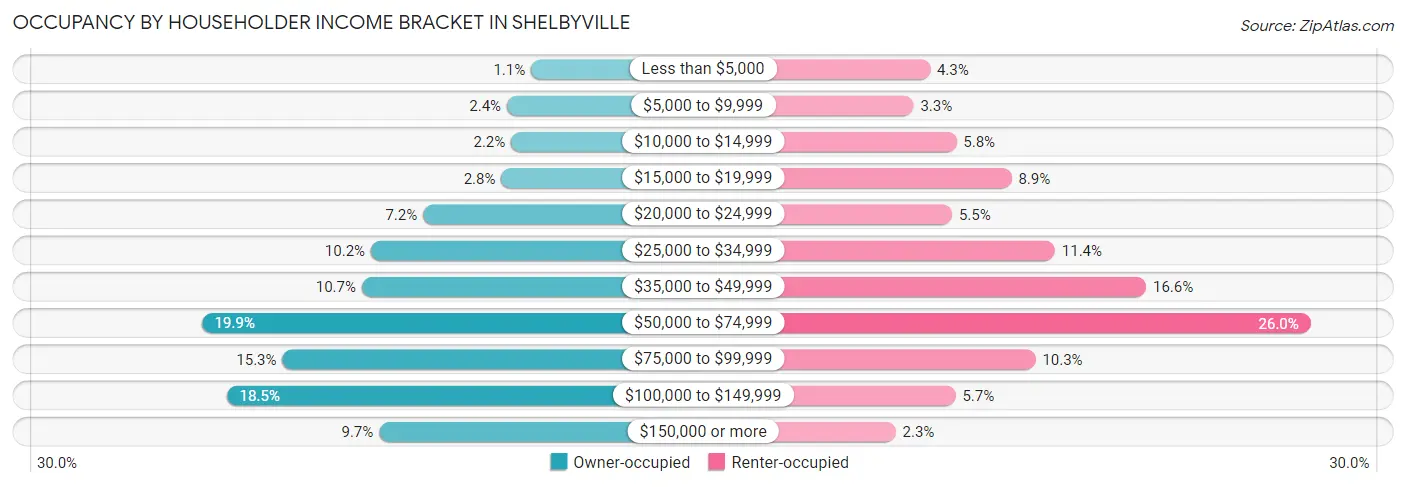
| Income Bracket | Owner-occupied | Renter-occupied |
| Less than $5,000 | 49 (1.1%) | 154 (4.3%) |
| $5,000 to $9,999 | 113 (2.4%) | 120 (3.3%) |
| $10,000 to $14,999 | 102 (2.2%) | 209 (5.8%) |
| $15,000 to $19,999 | 128 (2.8%) | 323 (8.9%) |
| $20,000 to $24,999 | 335 (7.2%) | 200 (5.5%) |
| $25,000 to $34,999 | 473 (10.2%) | 413 (11.4%) |
| $35,000 to $49,999 | 497 (10.7%) | 602 (16.6%) |
| $50,000 to $74,999 | 921 (19.9%) | 943 (26.0%) |
| $75,000 to $99,999 | 707 (15.3%) | 373 (10.3%) |
| $100,000 to $149,999 | 855 (18.5%) | 207 (5.7%) |
| $150,000 or more | 451 (9.7%) | 83 (2.3%) |
| Total | 4,631 (100.0%) | 3,627 (100.0%) |
Monthly Housing Cost Tiers in Shelbyville
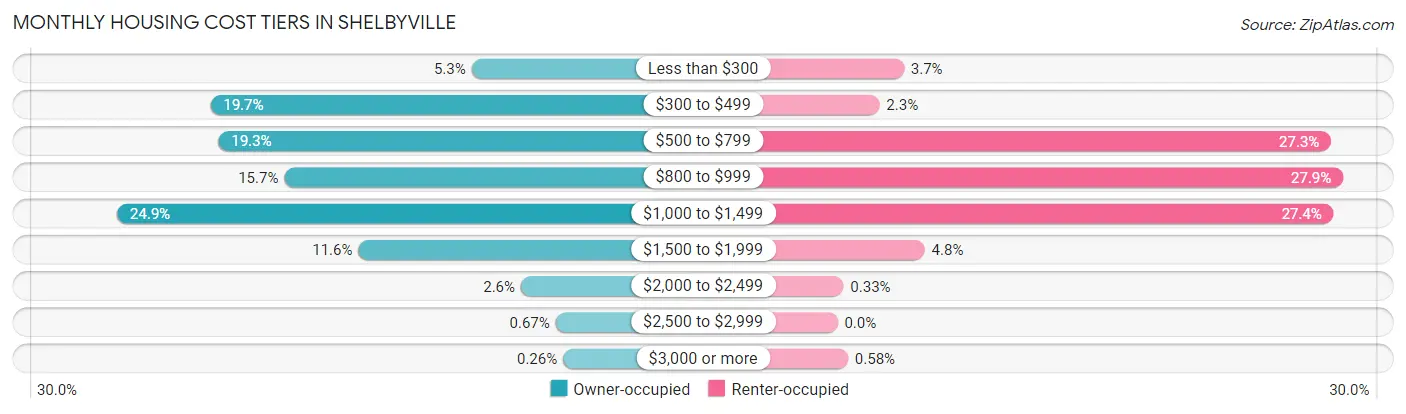
| Monthly Cost | Owner-occupied | Renter-occupied |
| Less than $300 | 246 (5.3%) | 133 (3.7%) |
| $300 to $499 | 914 (19.7%) | 84 (2.3%) |
| $500 to $799 | 894 (19.3%) | 989 (27.3%) |
| $800 to $999 | 725 (15.7%) | 1,013 (27.9%) |
| $1,000 to $1,499 | 1,153 (24.9%) | 994 (27.4%) |
| $1,500 to $1,999 | 536 (11.6%) | 175 (4.8%) |
| $2,000 to $2,499 | 120 (2.6%) | 12 (0.3%) |
| $2,500 to $2,999 | 31 (0.7%) | 0 (0.0%) |
| $3,000 or more | 12 (0.3%) | 21 (0.6%) |
| Total | 4,631 (100.0%) | 3,627 (100.0%) |
Physical Housing Characteristics in Shelbyville
Housing Structures in Shelbyville
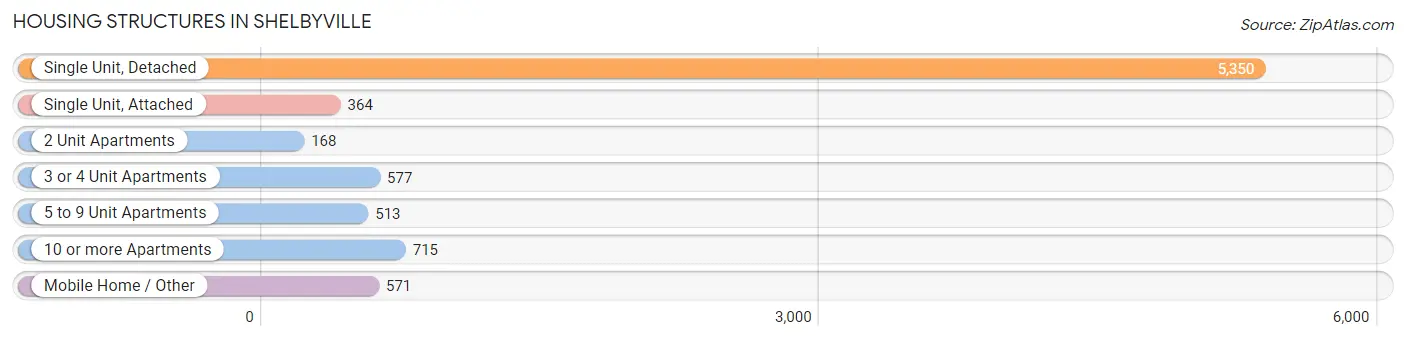
| Structure Type | # Housing Units | % Housing Units |
| Single Unit, Detached | 5,350 | 64.8% |
| Single Unit, Attached | 364 | 4.4% |
| 2 Unit Apartments | 168 | 2.0% |
| 3 or 4 Unit Apartments | 577 | 7.0% |
| 5 to 9 Unit Apartments | 513 | 6.2% |
| 10 or more Apartments | 715 | 8.7% |
| Mobile Home / Other | 571 | 6.9% |
| Total | 8,258 | 100.0% |
Housing Structures by Occupancy in Shelbyville
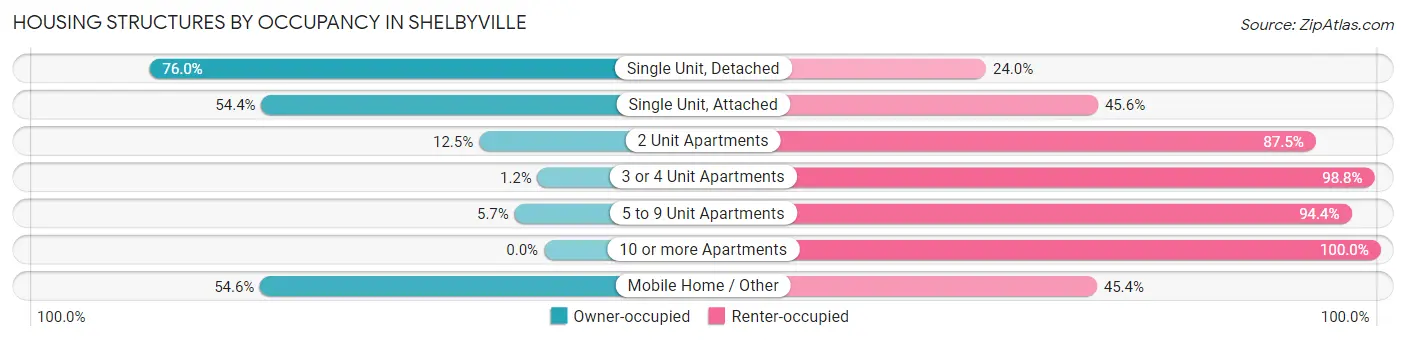
| Structure Type | Owner-occupied | Renter-occupied |
| Single Unit, Detached | 4,064 (76.0%) | 1,286 (24.0%) |
| Single Unit, Attached | 198 (54.4%) | 166 (45.6%) |
| 2 Unit Apartments | 21 (12.5%) | 147 (87.5%) |
| 3 or 4 Unit Apartments | 7 (1.2%) | 570 (98.8%) |
| 5 to 9 Unit Apartments | 29 (5.7%) | 484 (94.4%) |
| 10 or more Apartments | 0 (0.0%) | 715 (100.0%) |
| Mobile Home / Other | 312 (54.6%) | 259 (45.4%) |
| Total | 4,631 (56.1%) | 3,627 (43.9%) |
Housing Structures by Number of Rooms in Shelbyville
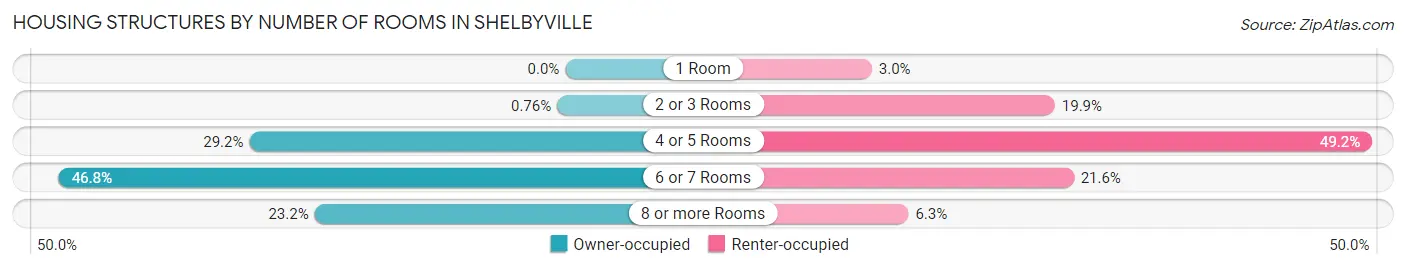
| Number of Rooms | Owner-occupied | Renter-occupied |
| 1 Room | 0 (0.0%) | 107 (2.9%) |
| 2 or 3 Rooms | 35 (0.8%) | 721 (19.9%) |
| 4 or 5 Rooms | 1,353 (29.2%) | 1,785 (49.2%) |
| 6 or 7 Rooms | 2,169 (46.8%) | 784 (21.6%) |
| 8 or more Rooms | 1,074 (23.2%) | 230 (6.3%) |
| Total | 4,631 (100.0%) | 3,627 (100.0%) |
Housing Structure by Heating Type in Shelbyville
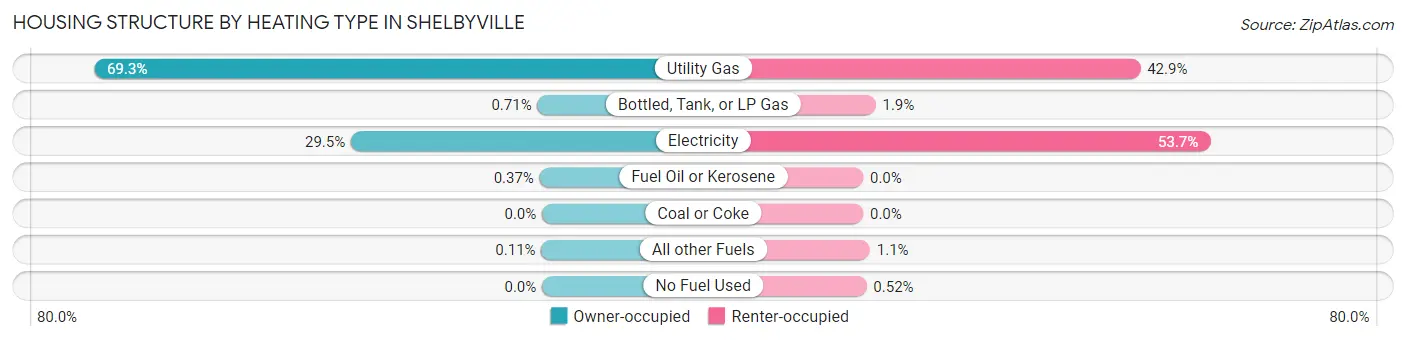
| Heating Type | Owner-occupied | Renter-occupied |
| Utility Gas | 3,208 (69.3%) | 1,554 (42.8%) |
| Bottled, Tank, or LP Gas | 33 (0.7%) | 70 (1.9%) |
| Electricity | 1,368 (29.5%) | 1,946 (53.6%) |
| Fuel Oil or Kerosene | 17 (0.4%) | 0 (0.0%) |
| Coal or Coke | 0 (0.0%) | 0 (0.0%) |
| All other Fuels | 5 (0.1%) | 38 (1.1%) |
| No Fuel Used | 0 (0.0%) | 19 (0.5%) |
| Total | 4,631 (100.0%) | 3,627 (100.0%) |
Household Vehicle Usage in Shelbyville
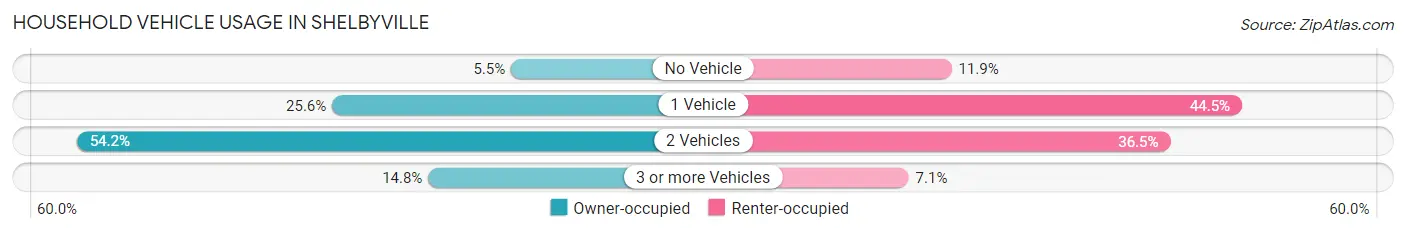
| Vehicles per Household | Owner-occupied | Renter-occupied |
| No Vehicle | 255 (5.5%) | 433 (11.9%) |
| 1 Vehicle | 1,183 (25.6%) | 1,613 (44.5%) |
| 2 Vehicles | 2,508 (54.2%) | 1,322 (36.4%) |
| 3 or more Vehicles | 685 (14.8%) | 259 (7.1%) |
| Total | 4,631 (100.0%) | 3,627 (100.0%) |
Real Estate & Mortgages in Shelbyville
Real Estate and Mortgage Overview in Shelbyville
| Characteristic | Without Mortgage | With Mortgage |
| Housing Units | 1,621 | 3,010 |
| Median Property Value | $132,300 | $136,600 |
| Median Household Income | $47,708 | $370 |
| Monthly Housing Costs | $435 | $12 |
| Real Estate Taxes | $955 | $198 |
Property Value by Mortgage Status in Shelbyville
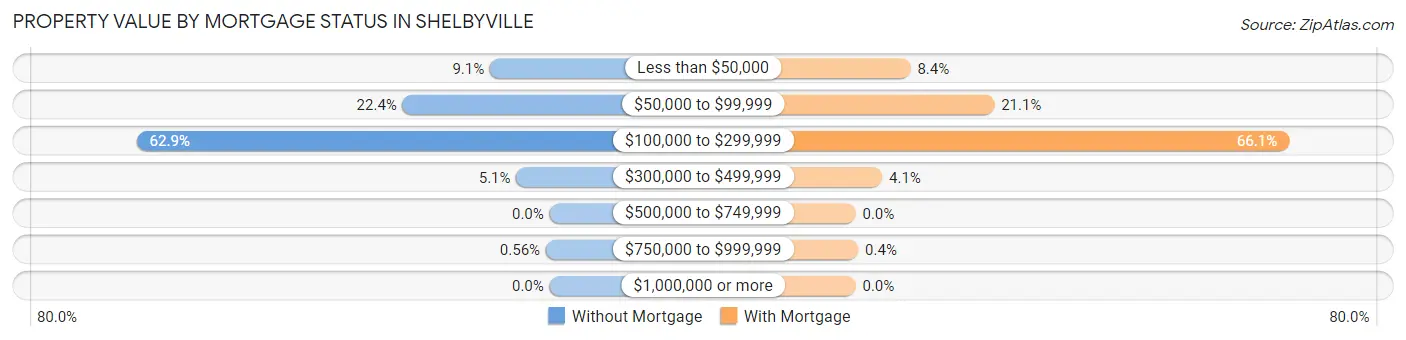
| Property Value | Without Mortgage | With Mortgage |
| Less than $50,000 | 147 (9.1%) | 252 (8.4%) |
| $50,000 to $99,999 | 363 (22.4%) | 636 (21.1%) |
| $100,000 to $299,999 | 1,020 (62.9%) | 1,988 (66.0%) |
| $300,000 to $499,999 | 82 (5.1%) | 122 (4.1%) |
| $500,000 to $749,999 | 0 (0.0%) | 0 (0.0%) |
| $750,000 to $999,999 | 9 (0.6%) | 12 (0.4%) |
| $1,000,000 or more | 0 (0.0%) | 0 (0.0%) |
| Total | 1,621 (100.0%) | 3,010 (100.0%) |
Household Income by Mortgage Status in Shelbyville
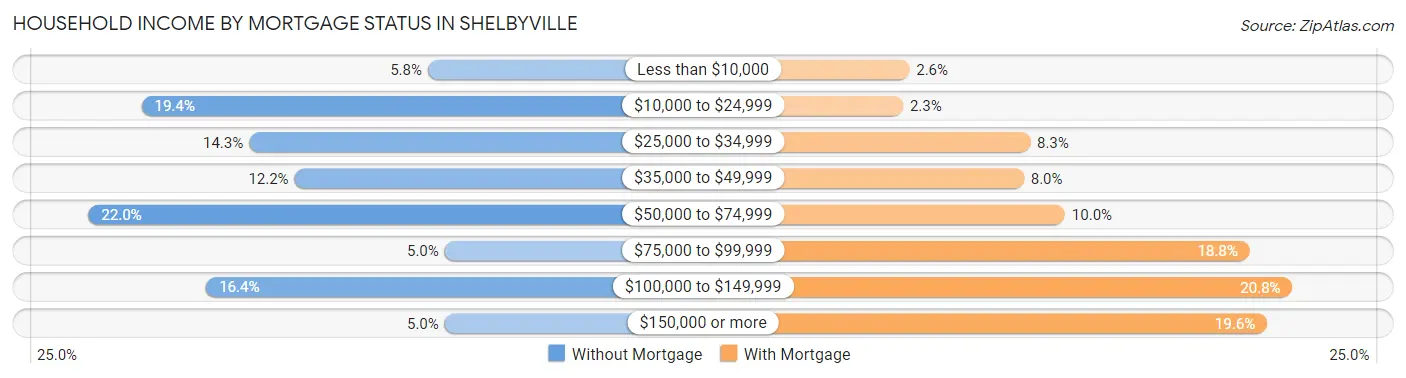
| Household Income | Without Mortgage | With Mortgage |
| Less than $10,000 | 94 (5.8%) | 77 (2.6%) |
| $10,000 to $24,999 | 315 (19.4%) | 68 (2.3%) |
| $25,000 to $34,999 | 232 (14.3%) | 250 (8.3%) |
| $35,000 to $49,999 | 197 (12.1%) | 241 (8.0%) |
| $50,000 to $74,999 | 356 (22.0%) | 300 (10.0%) |
| $75,000 to $99,999 | 81 (5.0%) | 565 (18.8%) |
| $100,000 to $149,999 | 265 (16.4%) | 626 (20.8%) |
| $150,000 or more | 81 (5.0%) | 590 (19.6%) |
| Total | 1,621 (100.0%) | 3,010 (100.0%) |
Property Value to Household Income Ratio in Shelbyville
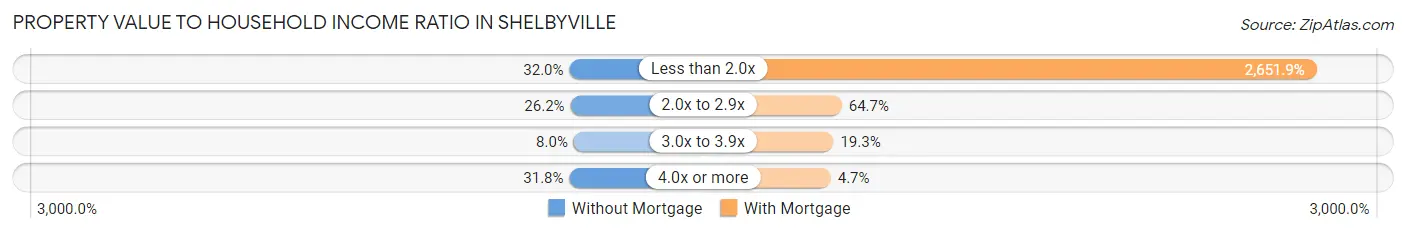
| Value-to-Income Ratio | Without Mortgage | With Mortgage |
| Less than 2.0x | 518 (32.0%) | 79,821 (2,651.9%) |
| 2.0x to 2.9x | 425 (26.2%) | 1,948 (64.7%) |
| 3.0x to 3.9x | 130 (8.0%) | 582 (19.3%) |
| 4.0x or more | 516 (31.8%) | 142 (4.7%) |
| Total | 1,621 (100.0%) | 3,010 (100.0%) |
Real Estate Taxes by Mortgage Status in Shelbyville
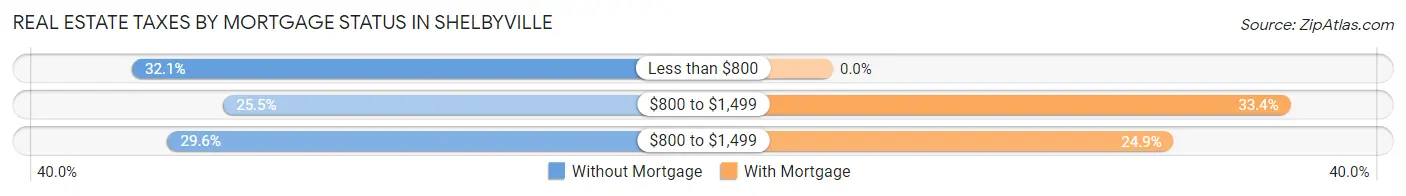
| Property Taxes | Without Mortgage | With Mortgage |
| Less than $800 | 521 (32.1%) | 0 (0.0%) |
| $800 to $1,499 | 413 (25.5%) | 1,006 (33.4%) |
| $800 to $1,499 | 479 (29.5%) | 749 (24.9%) |
| Total | 1,621 (100.0%) | 3,010 (100.0%) |
Health & Disability in Shelbyville
Health Insurance Coverage by Age in Shelbyville
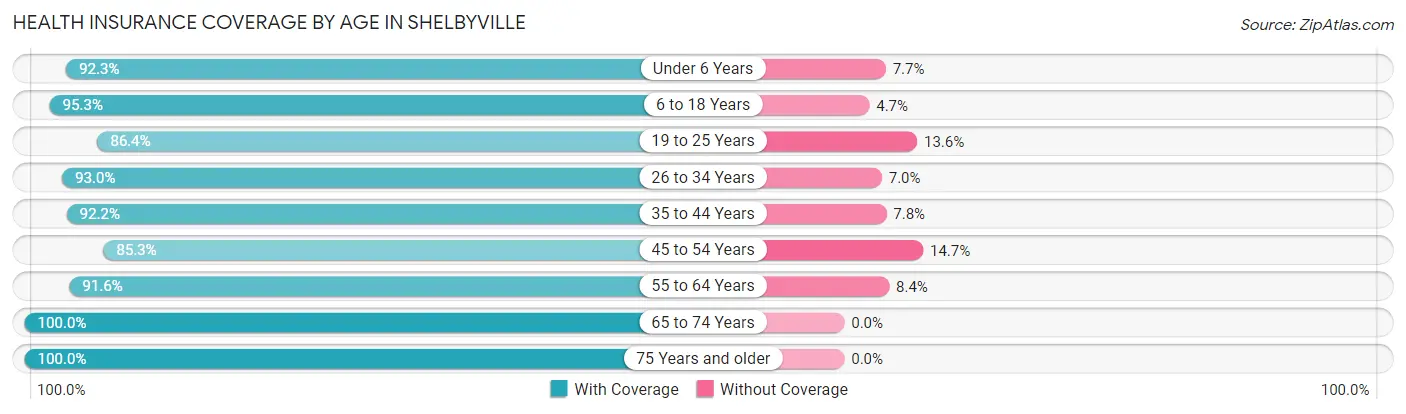
| Age Bracket | With Coverage | Without Coverage |
| Under 6 Years | 1,575 (92.3%) | 132 (7.7%) |
| 6 to 18 Years | 2,984 (95.3%) | 146 (4.7%) |
| 19 to 25 Years | 1,210 (86.4%) | 190 (13.6%) |
| 26 to 34 Years | 2,874 (93.0%) | 216 (7.0%) |
| 35 to 44 Years | 1,952 (92.2%) | 166 (7.8%) |
| 45 to 54 Years | 1,702 (85.3%) | 293 (14.7%) |
| 55 to 64 Years | 2,402 (91.6%) | 219 (8.4%) |
| 65 to 74 Years | 1,861 (100.0%) | 0 (0.0%) |
| 75 Years and older | 1,202 (100.0%) | 0 (0.0%) |
| Total | 17,762 (92.9%) | 1,362 (7.1%) |
Health Insurance Coverage by Citizenship Status in Shelbyville
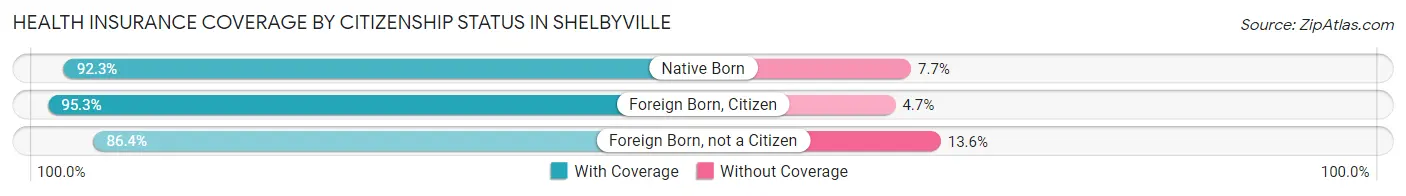
| Citizenship Status | With Coverage | Without Coverage |
| Native Born | 1,575 (92.3%) | 132 (7.7%) |
| Foreign Born, Citizen | 2,984 (95.3%) | 146 (4.7%) |
| Foreign Born, not a Citizen | 1,210 (86.4%) | 190 (13.6%) |
Health Insurance Coverage by Household Income in Shelbyville
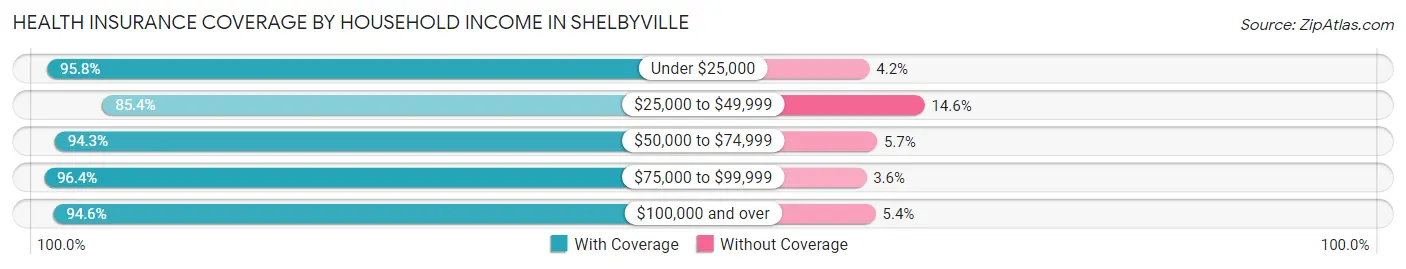
| Household Income | With Coverage | Without Coverage |
| Under $25,000 | 2,533 (95.8%) | 112 (4.2%) |
| $25,000 to $49,999 | 3,768 (85.4%) | 642 (14.6%) |
| $50,000 to $74,999 | 4,004 (94.3%) | 240 (5.7%) |
| $75,000 to $99,999 | 2,924 (96.4%) | 110 (3.6%) |
| $100,000 and over | 4,516 (94.6%) | 258 (5.4%) |
Public vs Private Health Insurance Coverage by Age in Shelbyville
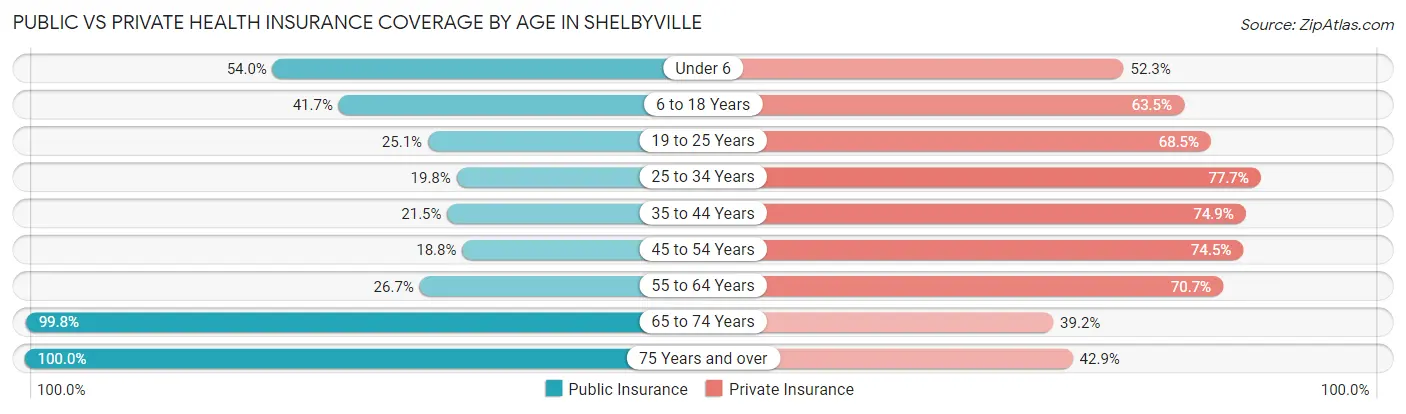
| Age Bracket | Public Insurance | Private Insurance |
| Under 6 | 921 (53.9%) | 893 (52.3%) |
| 6 to 18 Years | 1,305 (41.7%) | 1,987 (63.5%) |
| 19 to 25 Years | 352 (25.1%) | 959 (68.5%) |
| 25 to 34 Years | 612 (19.8%) | 2,402 (77.7%) |
| 35 to 44 Years | 456 (21.5%) | 1,587 (74.9%) |
| 45 to 54 Years | 374 (18.8%) | 1,486 (74.5%) |
| 55 to 64 Years | 699 (26.7%) | 1,854 (70.7%) |
| 65 to 74 Years | 1,857 (99.8%) | 730 (39.2%) |
| 75 Years and over | 1,202 (100.0%) | 515 (42.8%) |
| Total | 7,778 (40.7%) | 12,413 (64.9%) |
Disability Status by Sex by Age in Shelbyville
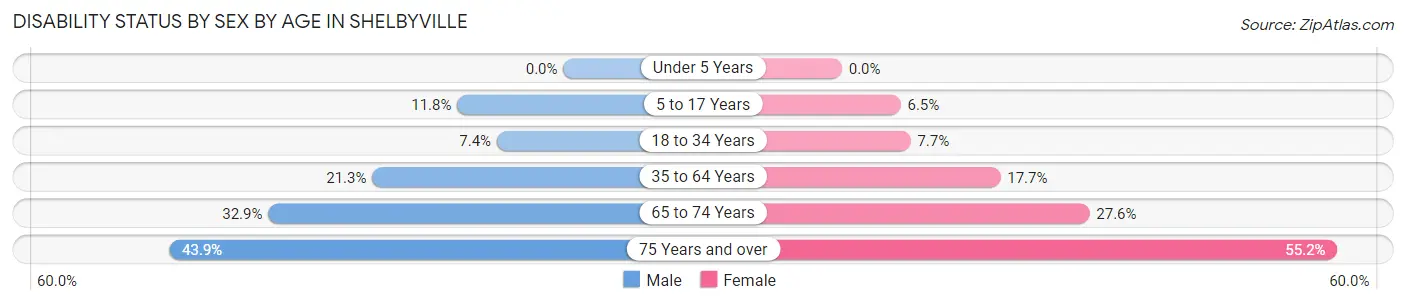
| Age Bracket | Male | Female |
| Under 5 Years | 0 (0.0%) | 0 (0.0%) |
| 5 to 17 Years | 170 (11.8%) | 113 (6.5%) |
| 18 to 34 Years | 180 (7.4%) | 162 (7.6%) |
| 35 to 64 Years | 707 (21.3%) | 602 (17.6%) |
| 65 to 74 Years | 279 (32.9%) | 279 (27.6%) |
| 75 Years and over | 177 (43.9%) | 441 (55.2%) |
Disability Class by Sex by Age in Shelbyville
Disability Class: Hearing Difficulty
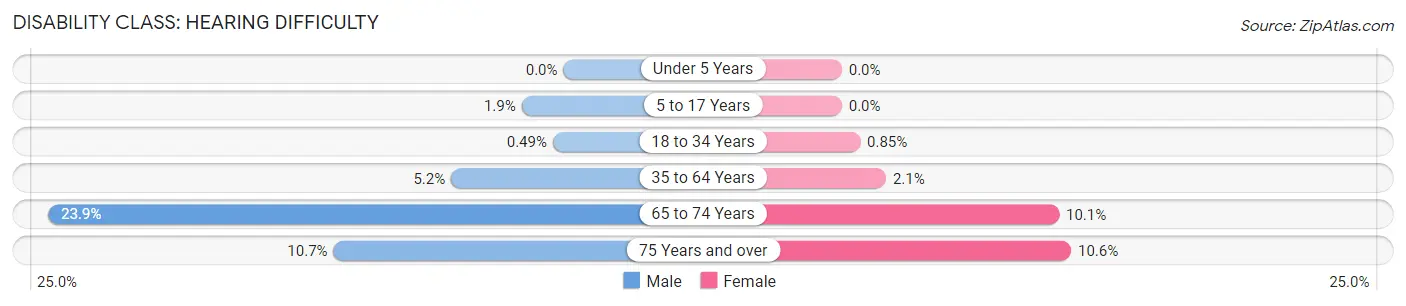
| Age Bracket | Male | Female |
| Under 5 Years | 0 (0.0%) | 0 (0.0%) |
| 5 to 17 Years | 28 (1.9%) | 0 (0.0%) |
| 18 to 34 Years | 12 (0.5%) | 18 (0.9%) |
| 35 to 64 Years | 173 (5.2%) | 70 (2.1%) |
| 65 to 74 Years | 203 (23.9%) | 102 (10.1%) |
| 75 Years and over | 43 (10.7%) | 85 (10.6%) |
Disability Class: Vision Difficulty
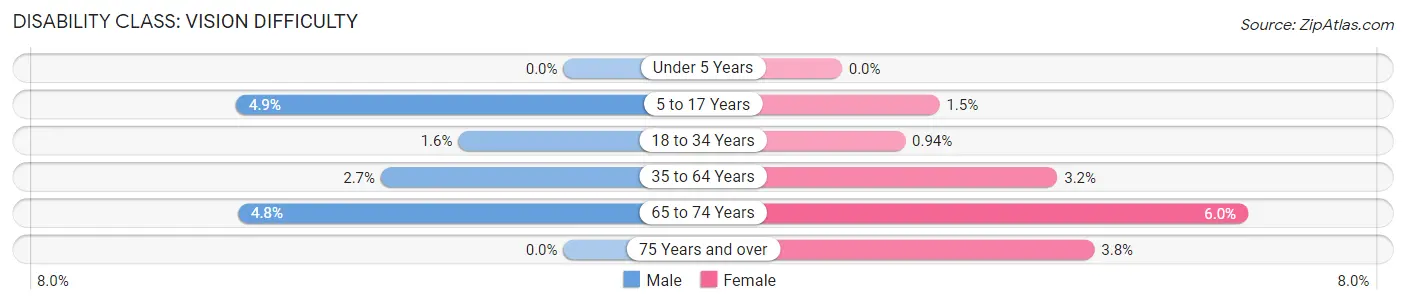
| Age Bracket | Male | Female |
| Under 5 Years | 0 (0.0%) | 0 (0.0%) |
| 5 to 17 Years | 70 (4.9%) | 25 (1.5%) |
| 18 to 34 Years | 38 (1.6%) | 20 (0.9%) |
| 35 to 64 Years | 90 (2.7%) | 109 (3.2%) |
| 65 to 74 Years | 41 (4.8%) | 61 (6.0%) |
| 75 Years and over | 0 (0.0%) | 30 (3.7%) |
Disability Class: Cognitive Difficulty
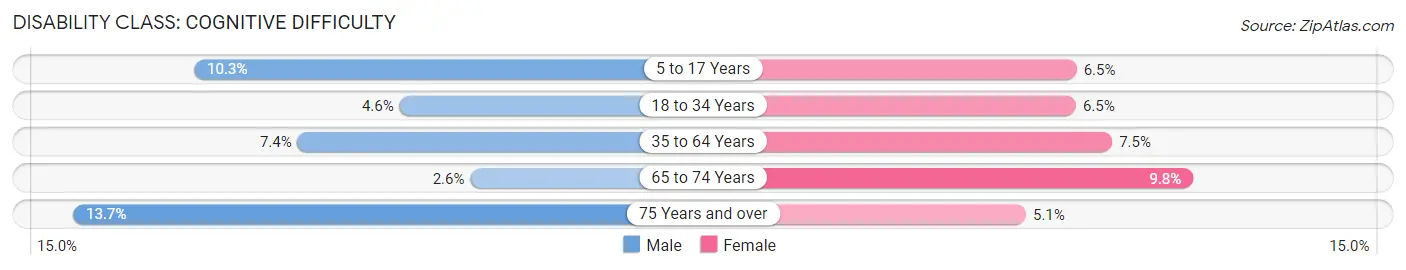
| Age Bracket | Male | Female |
| 5 to 17 Years | 148 (10.3%) | 113 (6.5%) |
| 18 to 34 Years | 111 (4.6%) | 138 (6.5%) |
| 35 to 64 Years | 246 (7.4%) | 257 (7.5%) |
| 65 to 74 Years | 22 (2.6%) | 99 (9.8%) |
| 75 Years and over | 55 (13.7%) | 41 (5.1%) |
Disability Class: Ambulatory Difficulty
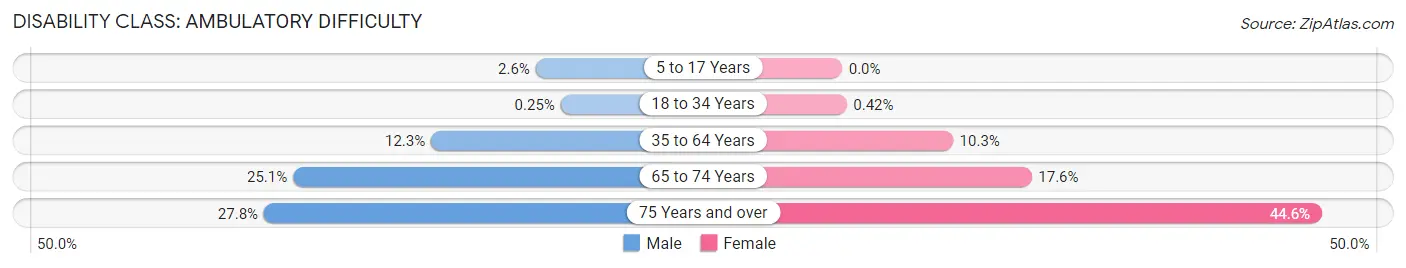
| Age Bracket | Male | Female |
| 5 to 17 Years | 37 (2.6%) | 0 (0.0%) |
| 18 to 34 Years | 6 (0.3%) | 9 (0.4%) |
| 35 to 64 Years | 408 (12.3%) | 351 (10.3%) |
| 65 to 74 Years | 213 (25.1%) | 178 (17.6%) |
| 75 Years and over | 112 (27.8%) | 356 (44.6%) |
Disability Class: Self-Care Difficulty
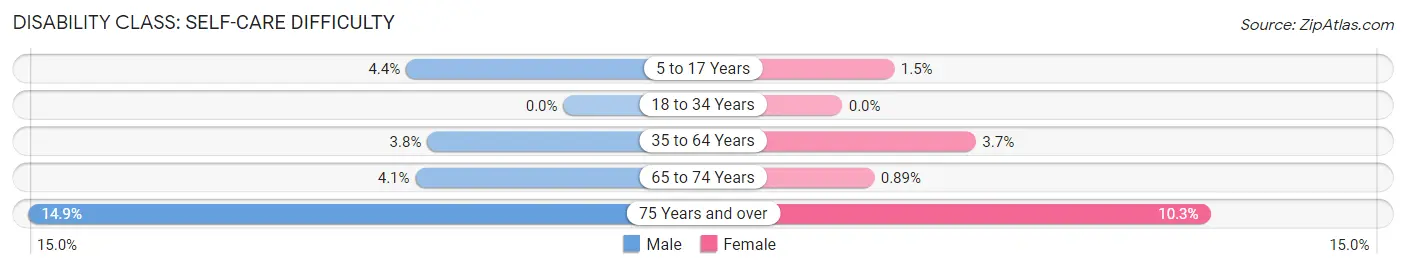
| Age Bracket | Male | Female |
| 5 to 17 Years | 63 (4.4%) | 25 (1.5%) |
| 18 to 34 Years | 0 (0.0%) | 0 (0.0%) |
| 35 to 64 Years | 126 (3.8%) | 127 (3.7%) |
| 65 to 74 Years | 35 (4.1%) | 9 (0.9%) |
| 75 Years and over | 60 (14.9%) | 82 (10.3%) |
Technology Access in Shelbyville
Computing Device Access in Shelbyville
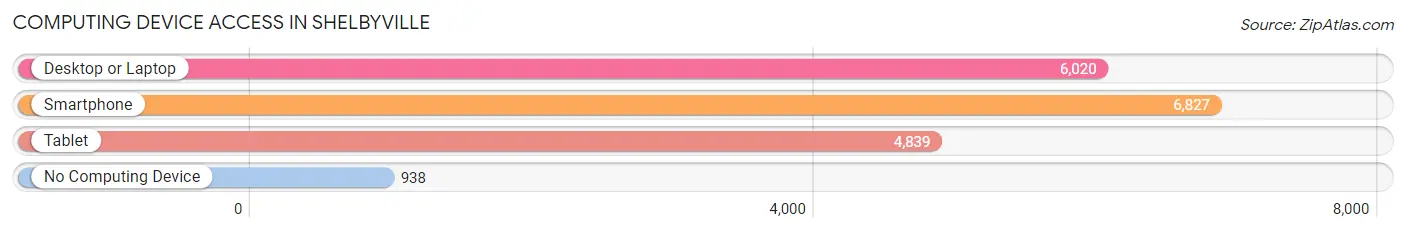
| Device Type | # Households | % Households |
| Desktop or Laptop | 6,020 | 72.9% |
| Smartphone | 6,827 | 82.7% |
| Tablet | 4,839 | 58.6% |
| No Computing Device | 938 | 11.4% |
| Total | 8,258 | 100.0% |
Internet Access in Shelbyville
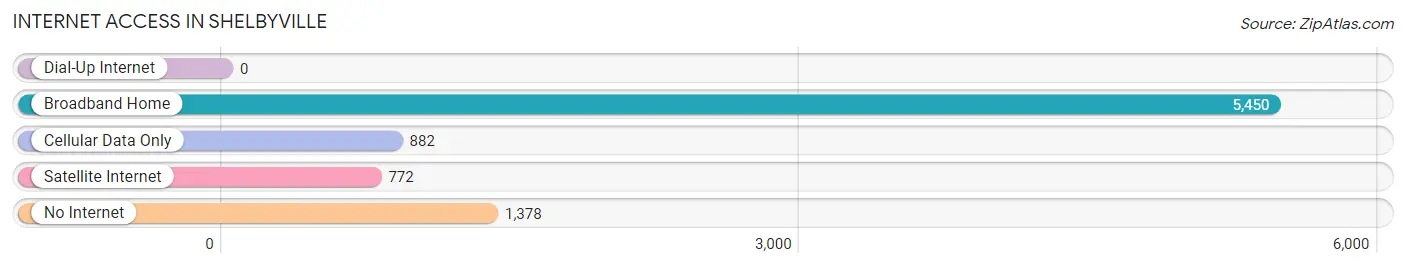
| Internet Type | # Households | % Households |
| Dial-Up Internet | 0 | 0.0% |
| Broadband Home | 5,450 | 66.0% |
| Cellular Data Only | 882 | 10.7% |
| Satellite Internet | 772 | 9.3% |
| No Internet | 1,378 | 16.7% |
| Total | 8,258 | 100.0% |
Shelbyville Summary
Shelbyville, Indiana is a city located in the central part of the state, about 30 miles southeast of Indianapolis. It is the county seat of Shelby County and has a population of 19,191 as of the 2010 census. The city is known for its horse racing industry, as well as its historic downtown area.
History
Shelbyville was founded in 1822 by William B. Shelby, a Revolutionary War veteran. The city was named after him and was originally part of the Delaware New Purchase. The city was incorporated in 1851 and was the county seat of Shelby County.
In the late 19th century, Shelbyville was a major center for the horse racing industry. The city was home to the first racetrack in Indiana, the Shelbyville Fairgrounds, which opened in 1852. The track was a popular destination for horse racing enthusiasts from all over the country. The track closed in the early 20th century, but the city still has a strong connection to the horse racing industry.
Geography
Shelbyville is located in central Indiana, about 30 miles southeast of Indianapolis. The city is situated in the Blue River Valley, which is part of the Central Till Plains region. The city is surrounded by rolling hills and farmland. The city has a total area of 8.3 square miles, all of which is land.
Economy
Shelbyville’s economy is largely based on manufacturing and agriculture. The city is home to several large manufacturing companies, including Cummins, Inc., a diesel engine manufacturer, and the Shelbyville-based automotive parts manufacturer, Remy International. The city is also home to several agricultural businesses, including the Shelby County Pork Producers, which produces pork products for local and national markets.
The city is also home to several retail and service businesses, including several restaurants, hotels, and shops. The city is also home to several medical facilities, including Major Hospital and the Shelbyville Medical Center.
Demographics
As of the 2010 census, Shelbyville had a population of 19,191. The racial makeup of the city was 87.3% White, 8.2% African American, 0.4% Native American, 0.7% Asian, 0.1% Pacific Islander, 1.2% from other races, and 2.1% from two or more races. Hispanic or Latino of any race were 3.2% of the population.
The median income for a household in the city was $41,945, and the median income for a family was $50,945. The per capita income for the city was $20,945. About 11.2% of families and 14.2% of the population were below the poverty line, including 19.2% of those under age 18 and 8.2% of those age 65 or over.
Shelbyville is a diverse city with a rich history and a strong economy. The city is home to several large manufacturing companies, as well as several agricultural businesses. The city is also home to several retail and service businesses, as well as several medical facilities. The city has a population of 19,191, with a median income of $41,945.
Common Questions
What is Per Capita Income in Shelbyville?
Per Capita income in Shelbyville is $28,715.
What is the Median Family Income in Shelbyville?
Median Family Income in Shelbyville is $69,702.
What is the Median Household income in Shelbyville?
Median Household Income in Shelbyville is $55,850.
What is Income or Wage Gap in Shelbyville?
Income or Wage Gap in Shelbyville is 33.8%.
Women in Shelbyville earn 66.2 cents for every dollar earned by a man.
What is Inequality or Gini Index in Shelbyville?
Inequality or Gini Index in Shelbyville is 0.42.
What is the Total Population of Shelbyville?
Total Population of Shelbyville is 19,678.
What is the Total Male Population of Shelbyville?
Total Male Population of Shelbyville is 9,547.
What is the Total Female Population of Shelbyville?
Total Female Population of Shelbyville is 10,131.
What is the Ratio of Males per 100 Females in Shelbyville?
There are 94.24 Males per 100 Females in Shelbyville.
What is the Ratio of Females per 100 Males in Shelbyville?
There are 106.12 Females per 100 Males in Shelbyville.
What is the Median Population Age in Shelbyville?
Median Population Age in Shelbyville is 35.6 Years.
What is the Average Family Size in Shelbyville
Average Family Size in Shelbyville is 3.0 People.
What is the Average Household Size in Shelbyville
Average Household Size in Shelbyville is 2.3 People.
How Large is the Labor Force in Shelbyville?
There are 9,736 People in the Labor Forcein in Shelbyville.
What is the Percentage of People in the Labor Force in Shelbyville?
63.3% of People are in the Labor Force in Shelbyville.
What is the Unemployment Rate in Shelbyville?
Unemployment Rate in Shelbyville is 2.8%.