Vevay, IN Map & Demographics
Vevay Map

Vevay Overview
$26,324
PER CAPITA INCOME
$58,750
AVG FAMILY INCOME
$47,528
AVG HOUSEHOLD INCOME
17.6%
WAGE / INCOME GAP [ % ]
82.4¢/ $1
WAGE / INCOME GAP [ $ ]
$11,406
FAMILY INCOME DEFICIT
0.40
INEQUALITY / GINI INDEX
1,889
TOTAL POPULATION
873
MALE POPULATION
1,016
FEMALE POPULATION
85.93
MALES / 100 FEMALES
116.38
FEMALES / 100 MALES
45.5
MEDIAN AGE
3.0
AVG FAMILY SIZE
2.2
AVG HOUSEHOLD SIZE
844
LABOR FORCE [ PEOPLE ]
54.1%
PERCENT IN LABOR FORCE
3.9%
UNEMPLOYMENT RATE
Vevay Zip Codes
Vevay Area Codes
Income in Vevay
Income Overview in Vevay
Per Capita Income in Vevay is $26,324, while median incomes of families and households are $58,750 and $47,528 respectively.
| Characteristic | Number | Measure |
| Per Capita Income | 1,889 | $26,324 |
| Median Family Income | 439 | $58,750 |
| Mean Family Income | 439 | $68,048 |
| Median Household Income | 807 | $47,528 |
| Mean Household Income | 807 | $56,998 |
| Income Deficit | 439 | $11,406 |
| Wage / Income Gap (%) | 1,889 | 17.59% |
| Wage / Income Gap ($) | 1,889 | 82.41¢ per $1 |
| Gini / Inequality Index | 1,889 | 0.40 |
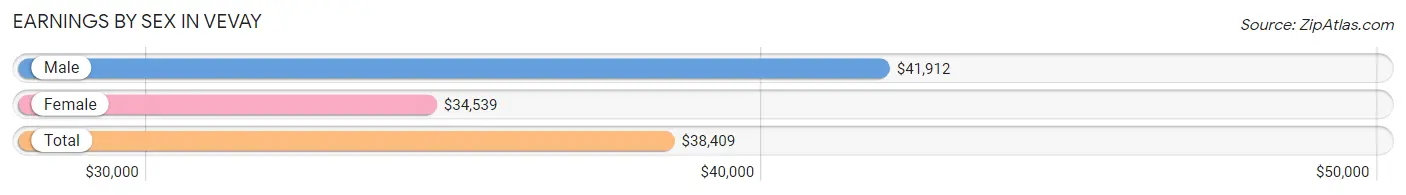
Earnings by Sex in Vevay
Average Earnings in Vevay are $38,409, $41,912 for men and $34,539 for women, a difference of 17.6%.
| Sex | Number | Average Earnings |
| Male | 420 (46.0%) | $41,912 |
| Female | 494 (54.0%) | $34,539 |
| Total | 914 (100.0%) | $38,409 |
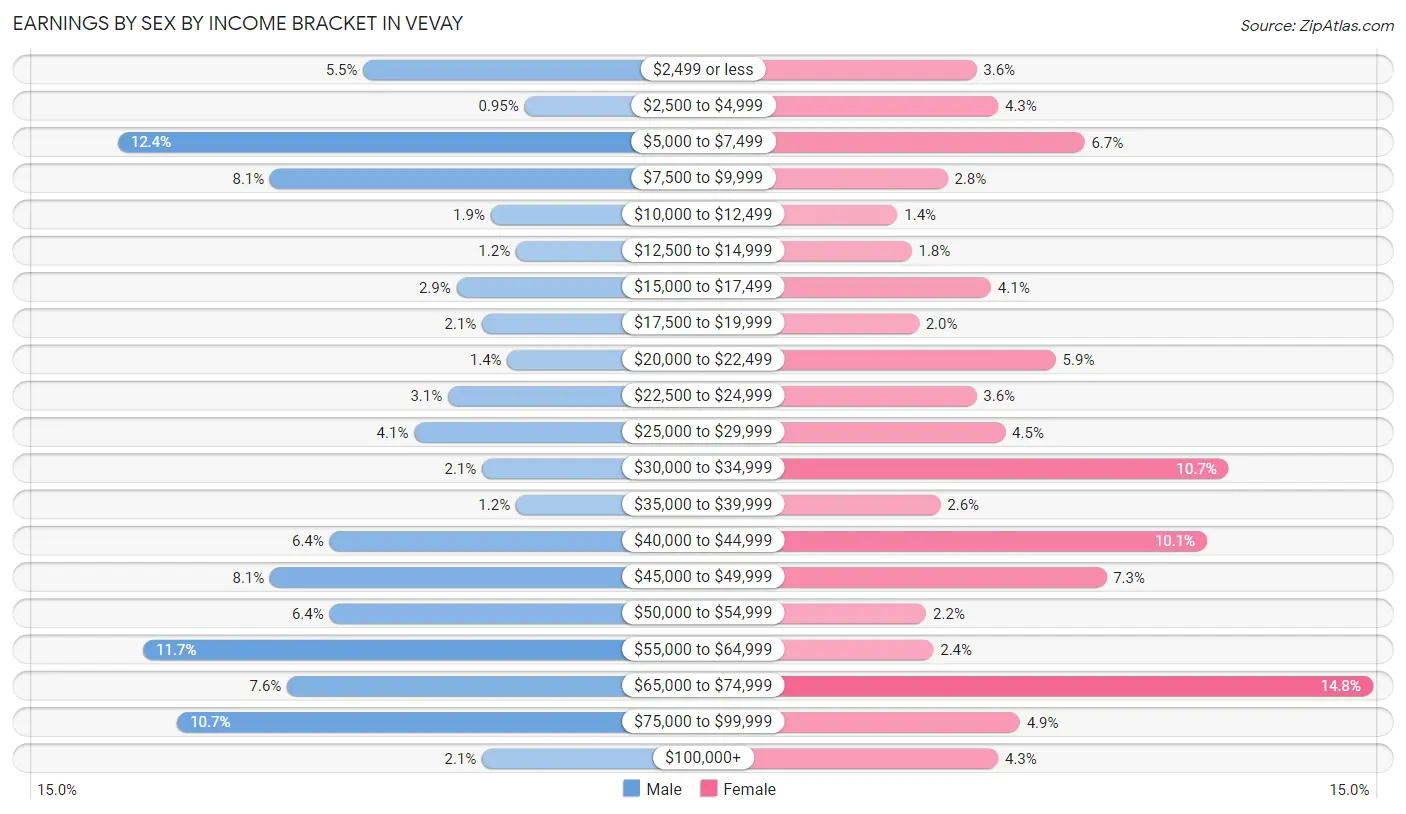
Earnings by Sex by Income Bracket in Vevay
The most common earnings brackets in Vevay are $5,000 to $7,499 for men (52 | 12.4%) and $65,000 to $74,999 for women (73 | 14.8%).
| Income | Male | Female |
| $2,499 or less | 23 (5.5%) | 18 (3.6%) |
| $2,500 to $4,999 | 4 (0.9%) | 21 (4.3%) |
| $5,000 to $7,499 | 52 (12.4%) | 33 (6.7%) |
| $7,500 to $9,999 | 34 (8.1%) | 14 (2.8%) |
| $10,000 to $12,499 | 8 (1.9%) | 7 (1.4%) |
| $12,500 to $14,999 | 5 (1.2%) | 9 (1.8%) |
| $15,000 to $17,499 | 12 (2.9%) | 20 (4.1%) |
| $17,500 to $19,999 | 9 (2.1%) | 10 (2.0%) |
| $20,000 to $22,499 | 6 (1.4%) | 29 (5.9%) |
| $22,500 to $24,999 | 13 (3.1%) | 18 (3.6%) |
| $25,000 to $29,999 | 17 (4.1%) | 22 (4.4%) |
| $30,000 to $34,999 | 9 (2.1%) | 53 (10.7%) |
| $35,000 to $39,999 | 5 (1.2%) | 13 (2.6%) |
| $40,000 to $44,999 | 27 (6.4%) | 50 (10.1%) |
| $45,000 to $49,999 | 34 (8.1%) | 36 (7.3%) |
| $50,000 to $54,999 | 27 (6.4%) | 11 (2.2%) |
| $55,000 to $64,999 | 49 (11.7%) | 12 (2.4%) |
| $65,000 to $74,999 | 32 (7.6%) | 73 (14.8%) |
| $75,000 to $99,999 | 45 (10.7%) | 24 (4.9%) |
| $100,000+ | 9 (2.1%) | 21 (4.3%) |
| Total | 420 (100.0%) | 494 (100.0%) |
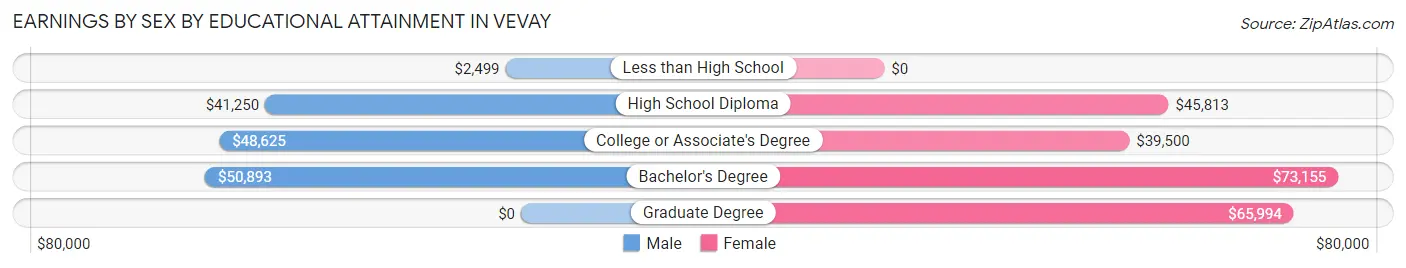
Earnings by Sex by Educational Attainment in Vevay
Average earnings in Vevay are $47,232 for men and $42,419 for women, a difference of 10.2%. Men with an educational attainment of bachelor's degree enjoy the highest average annual earnings of $50,893, while those with less than high school education earn the least with $2,499. Women with an educational attainment of bachelor's degree earn the most with the average annual earnings of $73,155, while those with college or associate's degree education have the smallest earnings of $39,500.
| Educational Attainment | Male Income | Female Income |
| Less than High School | $2,499 | $0 |
| High School Diploma | $41,250 | $45,813 |
| College or Associate's Degree | $48,625 | $39,500 |
| Bachelor's Degree | $50,893 | $73,155 |
| Graduate Degree | - | - |
| Total | $47,232 | $42,419 |
Family Income in Vevay
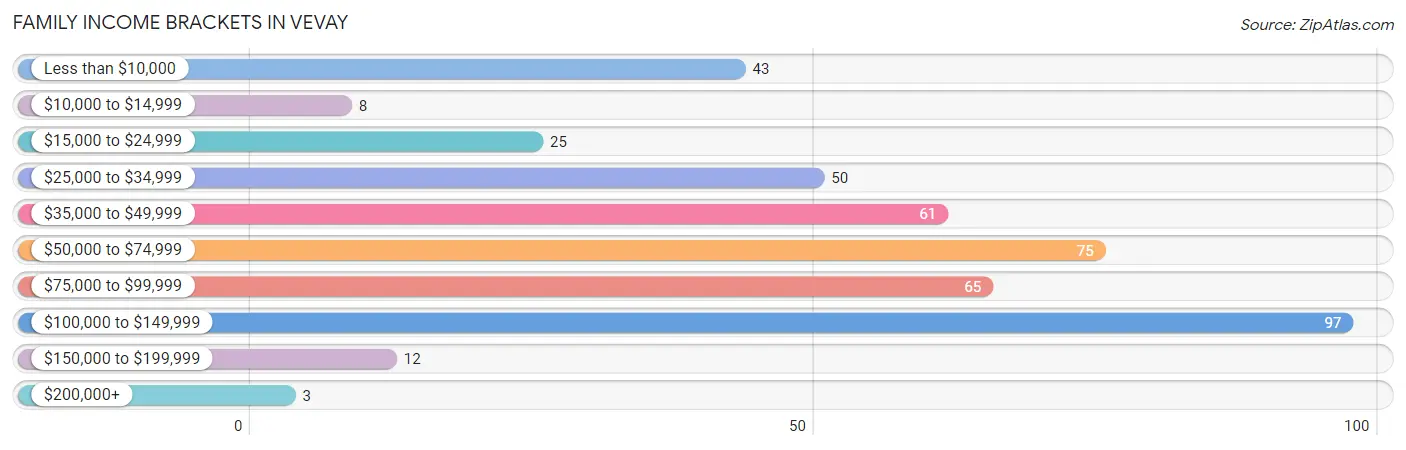
Family Income Brackets in Vevay
According to the Vevay family income data, there are 97 families falling into the $100,000 to $149,999 income range, which is the most common income bracket and makes up 22.1% of all families. Conversely, the $200,000+ income bracket is the least frequent group with only 3 families (0.7%) belonging to this category.
| Income Bracket | # Families | % Families |
| Less than $10,000 | 43 | 9.8% |
| $10,000 to $14,999 | 8 | 1.8% |
| $15,000 to $24,999 | 25 | 5.7% |
| $25,000 to $34,999 | 50 | 11.4% |
| $35,000 to $49,999 | 61 | 13.9% |
| $50,000 to $74,999 | 75 | 17.1% |
| $75,000 to $99,999 | 65 | 14.8% |
| $100,000 to $149,999 | 97 | 22.1% |
| $150,000 to $199,999 | 12 | 2.7% |
| $200,000+ | 3 | 0.7% |
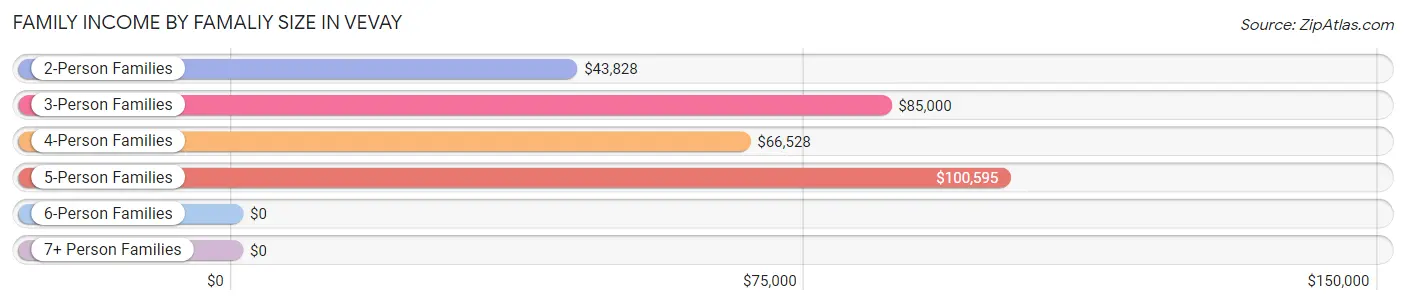
Family Income by Famaliy Size in Vevay
5-person families (32 | 7.3%) account for the highest median family income in Vevay with $100,595 per family, while 3-person families (134 | 30.5%) have the highest median income of $28,333 per family member.
| Income Bracket | # Families | Median Income |
| 2-Person Families | 233 (53.1%) | $43,828 |
| 3-Person Families | 134 (30.5%) | $85,000 |
| 4-Person Families | 35 (8.0%) | $66,528 |
| 5-Person Families | 32 (7.3%) | $100,595 |
| 6-Person Families | 0 (0.0%) | $0 |
| 7+ Person Families | 5 (1.1%) | $0 |
| Total | 439 (100.0%) | $58,750 |
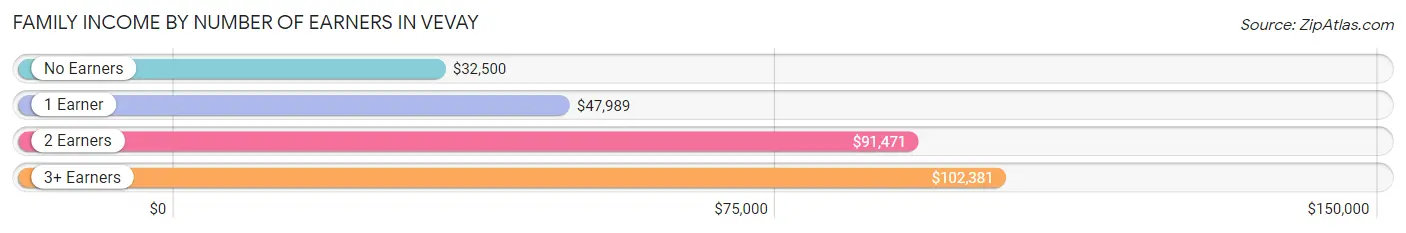
Family Income by Number of Earners in Vevay
The median family income in Vevay is $58,750, with families comprising 3+ earners (68) having the highest median family income of $102,381, while families with no earners (80) have the lowest median family income of $32,500, accounting for 15.5% and 18.2% of families, respectively.
| Number of Earners | # Families | Median Income |
| No Earners | 80 (18.2%) | $32,500 |
| 1 Earner | 193 (44.0%) | $47,989 |
| 2 Earners | 98 (22.3%) | $91,471 |
| 3+ Earners | 68 (15.5%) | $102,381 |
| Total | 439 (100.0%) | $58,750 |
Household Income in Vevay
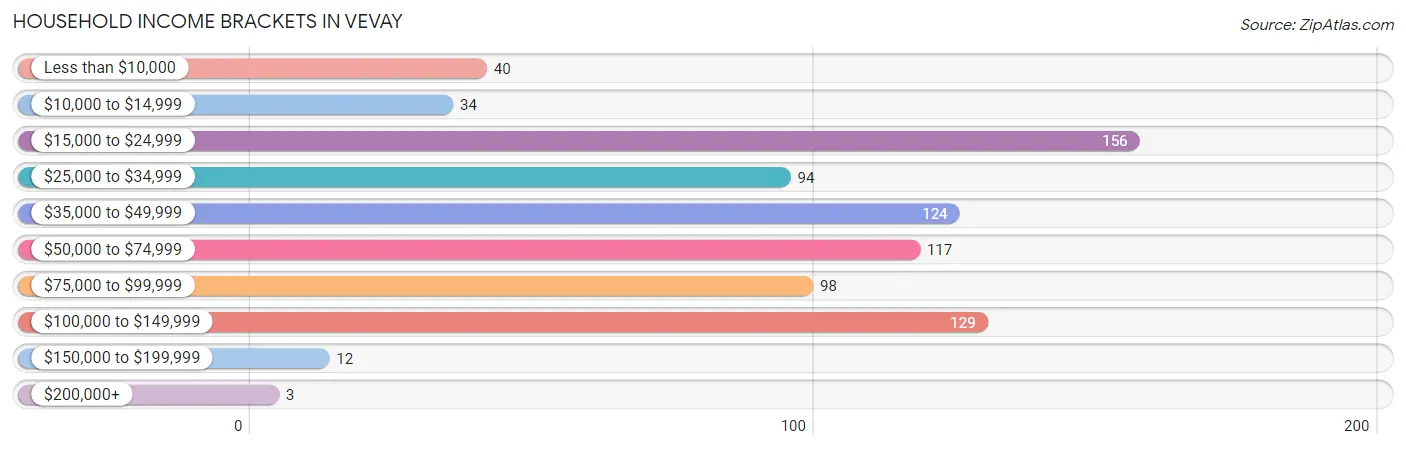
Household Income Brackets in Vevay
With 156 households falling in the category, the $15,000 to $24,999 income range is the most frequent in Vevay, accounting for 19.3% of all households. In contrast, only 3 households (0.4%) fall into the $200,000+ income bracket, making it the least populous group.
| Income Bracket | # Households | % Households |
| Less than $10,000 | 40 | 5.0% |
| $10,000 to $14,999 | 34 | 4.2% |
| $15,000 to $24,999 | 156 | 19.3% |
| $25,000 to $34,999 | 94 | 11.6% |
| $35,000 to $49,999 | 124 | 15.4% |
| $50,000 to $74,999 | 117 | 14.5% |
| $75,000 to $99,999 | 98 | 12.1% |
| $100,000 to $149,999 | 129 | 16.0% |
| $150,000 to $199,999 | 12 | 1.5% |
| $200,000+ | 3 | 0.4% |
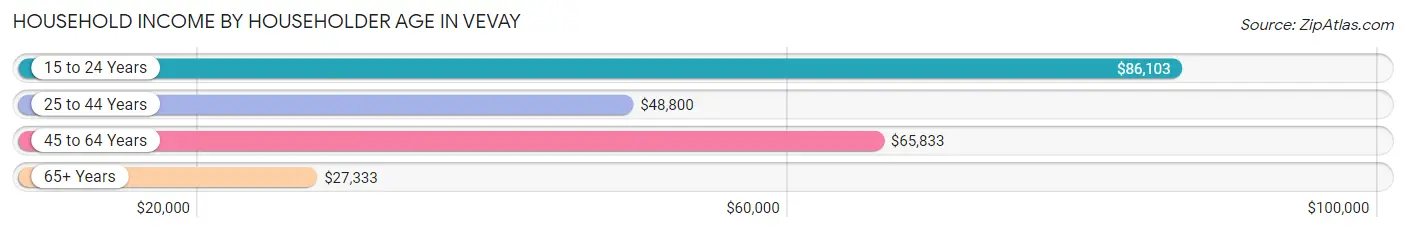
Household Income by Householder Age in Vevay
The median household income in Vevay is $47,528, with the highest median household income of $86,103 found in the 15 to 24 years age bracket for the primary householder. A total of 81 households (10.0%) fall into this category. Meanwhile, the 65+ years age bracket for the primary householder has the lowest median household income of $27,333, with 270 households (33.5%) in this group.
| Income Bracket | # Households | Median Income |
| 15 to 24 Years | 81 (10.0%) | $86,103 |
| 25 to 44 Years | 152 (18.8%) | $48,800 |
| 45 to 64 Years | 304 (37.7%) | $65,833 |
| 65+ Years | 270 (33.5%) | $27,333 |
| Total | 807 (100.0%) | $47,528 |
Poverty in Vevay
Income Below Poverty by Sex and Age in Vevay
With 15.4% poverty level for males and 12.4% for females among the residents of Vevay, 5 year old males and under 5 year old females are the most vulnerable to poverty, with 24 males (100.0%) and 26 females (59.1%) in their respective age groups living below the poverty level.
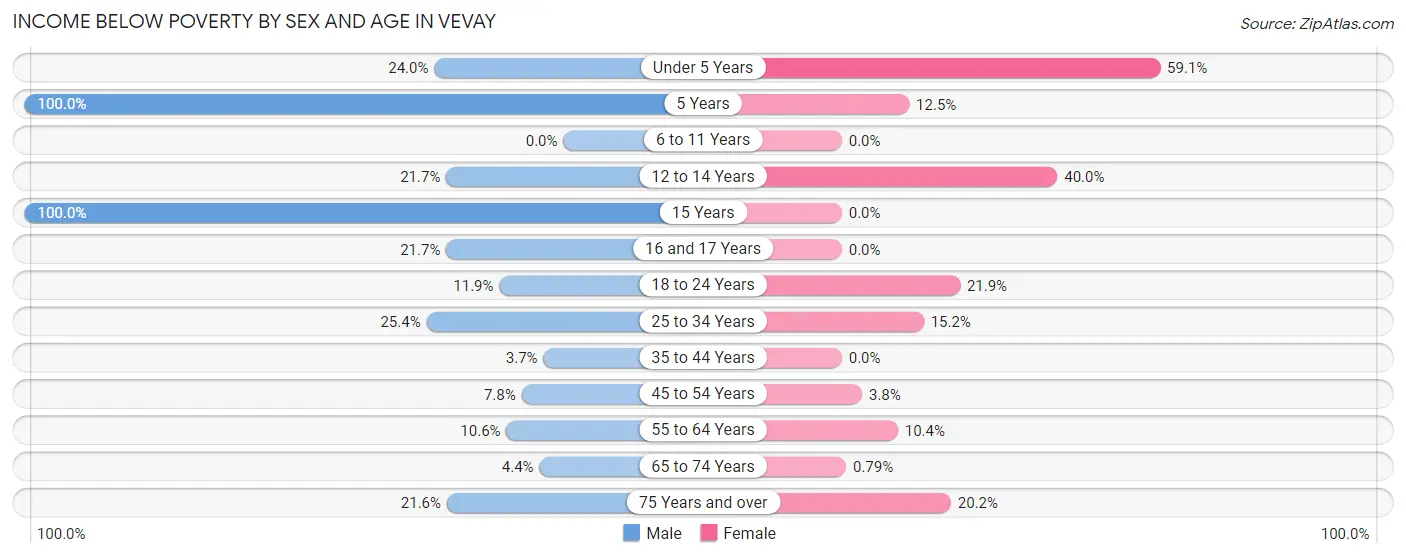
| Age Bracket | Male | Female |
| Under 5 Years | 23 (24.0%) | 26 (59.1%) |
| 5 Years | 24 (100.0%) | 4 (12.5%) |
| 6 to 11 Years | 0 (0.0%) | 0 (0.0%) |
| 12 to 14 Years | 5 (21.7%) | 4 (40.0%) |
| 15 Years | 4 (100.0%) | 0 (0.0%) |
| 16 and 17 Years | 5 (21.7%) | 0 (0.0%) |
| 18 to 24 Years | 12 (11.9%) | 25 (21.9%) |
| 25 to 34 Years | 16 (25.4%) | 19 (15.2%) |
| 35 to 44 Years | 3 (3.7%) | 0 (0.0%) |
| 45 to 54 Years | 9 (7.8%) | 5 (3.8%) |
| 55 to 64 Years | 13 (10.6%) | 18 (10.4%) |
| 65 to 74 Years | 4 (4.4%) | 1 (0.8%) |
| 75 Years and over | 8 (21.6%) | 17 (20.2%) |
| Total | 126 (15.4%) | 119 (12.4%) |
Income Above Poverty by Sex and Age in Vevay
According to the poverty statistics in Vevay, males aged 6 to 11 years and females aged 6 to 11 years are the age groups that are most secure financially, with 100.0% of males and 100.0% of females in these age groups living above the poverty line.
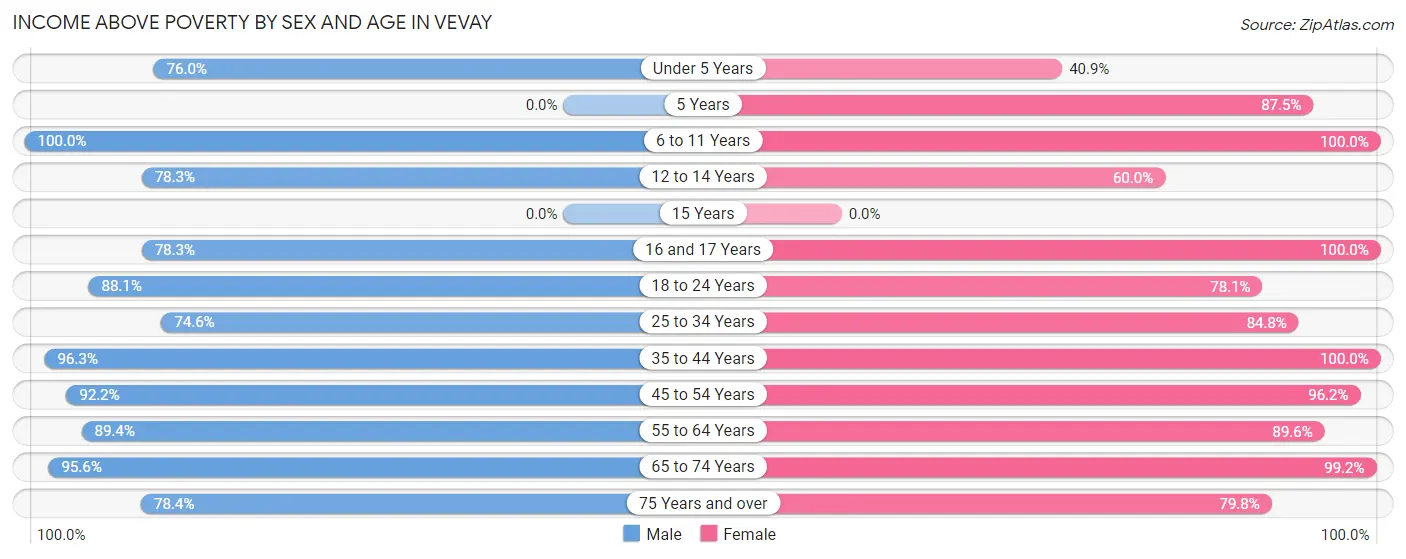
| Age Bracket | Male | Female |
| Under 5 Years | 73 (76.0%) | 18 (40.9%) |
| 5 Years | 0 (0.0%) | 28 (87.5%) |
| 6 to 11 Years | 35 (100.0%) | 52 (100.0%) |
| 12 to 14 Years | 18 (78.3%) | 6 (60.0%) |
| 15 Years | 0 (0.0%) | 0 (0.0%) |
| 16 and 17 Years | 18 (78.3%) | 26 (100.0%) |
| 18 to 24 Years | 89 (88.1%) | 89 (78.1%) |
| 25 to 34 Years | 47 (74.6%) | 106 (84.8%) |
| 35 to 44 Years | 78 (96.3%) | 44 (100.0%) |
| 45 to 54 Years | 107 (92.2%) | 128 (96.2%) |
| 55 to 64 Years | 110 (89.4%) | 155 (89.6%) |
| 65 to 74 Years | 86 (95.6%) | 125 (99.2%) |
| 75 Years and over | 29 (78.4%) | 67 (79.8%) |
| Total | 690 (84.6%) | 844 (87.6%) |
Income Below Poverty Among Married-Couple Families in Vevay
The poverty statistics for married-couple families in Vevay show that 7.3% or 17 of the total 233 families live below the poverty line. Families with 1 or 2 children have the highest poverty rate of 9.8%, comprising of 10 families. On the other hand, families with 3 or 4 children have the lowest poverty rate of 0.0%, which includes 0 families.
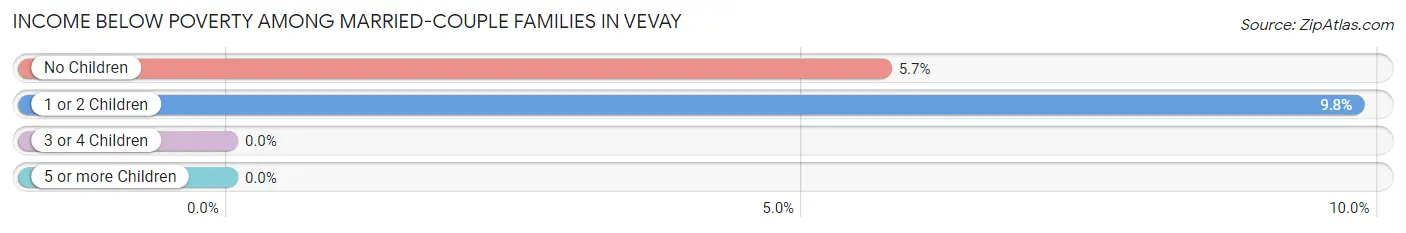
| Children | Above Poverty | Below Poverty |
| No Children | 116 (94.3%) | 7 (5.7%) |
| 1 or 2 Children | 92 (90.2%) | 10 (9.8%) |
| 3 or 4 Children | 8 (100.0%) | 0 (0.0%) |
| 5 or more Children | 0 (0.0%) | 0 (0.0%) |
| Total | 216 (92.7%) | 17 (7.3%) |
Income Below Poverty Among Single-Parent Households in Vevay
According to the poverty data in Vevay, 29.4% or 20 single-father households and 18.1% or 25 single-mother households are living below the poverty line. Among single-father households, those with 1 or 2 children have the highest poverty rate, with 20 households (66.7%) experiencing poverty. Likewise, among single-mother households, those with 1 or 2 children have the highest poverty rate, with 25 households (26.3%) falling below the poverty line.
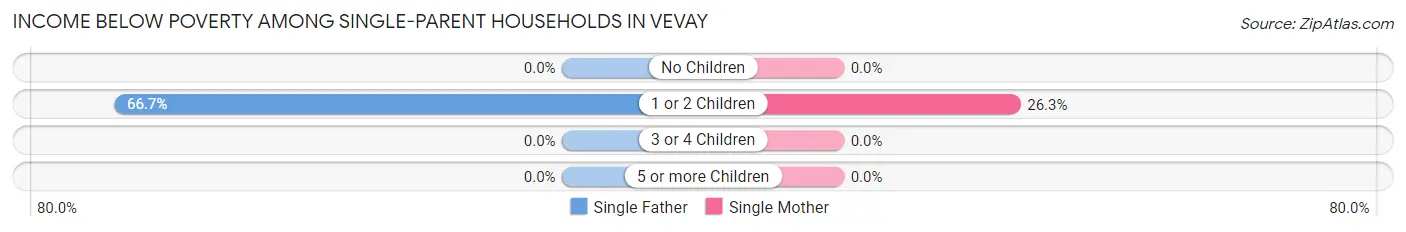
| Children | Single Father | Single Mother |
| No Children | 0 (0.0%) | 0 (0.0%) |
| 1 or 2 Children | 20 (66.7%) | 25 (26.3%) |
| 3 or 4 Children | 0 (0.0%) | 0 (0.0%) |
| 5 or more Children | 0 (0.0%) | 0 (0.0%) |
| Total | 20 (29.4%) | 25 (18.1%) |
Income Below Poverty Among Married-Couple vs Single-Parent Households in Vevay
The poverty data for Vevay shows that 17 of the married-couple family households (7.3%) and 45 of the single-parent households (21.8%) are living below the poverty level. Within the married-couple family households, those with 1 or 2 children have the highest poverty rate, with 10 households (9.8%) falling below the poverty line. Among the single-parent households, those with 1 or 2 children have the highest poverty rate, with 45 household (36.0%) living below poverty.
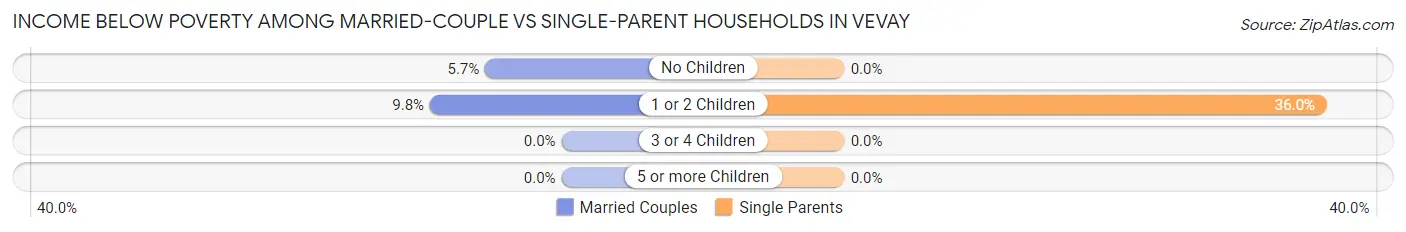
| Children | Married-Couple Families | Single-Parent Households |
| No Children | 7 (5.7%) | 0 (0.0%) |
| 1 or 2 Children | 10 (9.8%) | 45 (36.0%) |
| 3 or 4 Children | 0 (0.0%) | 0 (0.0%) |
| 5 or more Children | 0 (0.0%) | 0 (0.0%) |
| Total | 17 (7.3%) | 45 (21.8%) |
Race in Vevay
The most populous races in Vevay are White / Caucasian (1,815 | 96.1%), Two or more Races (42 | 2.2%), and Black / African American (30 | 1.6%).
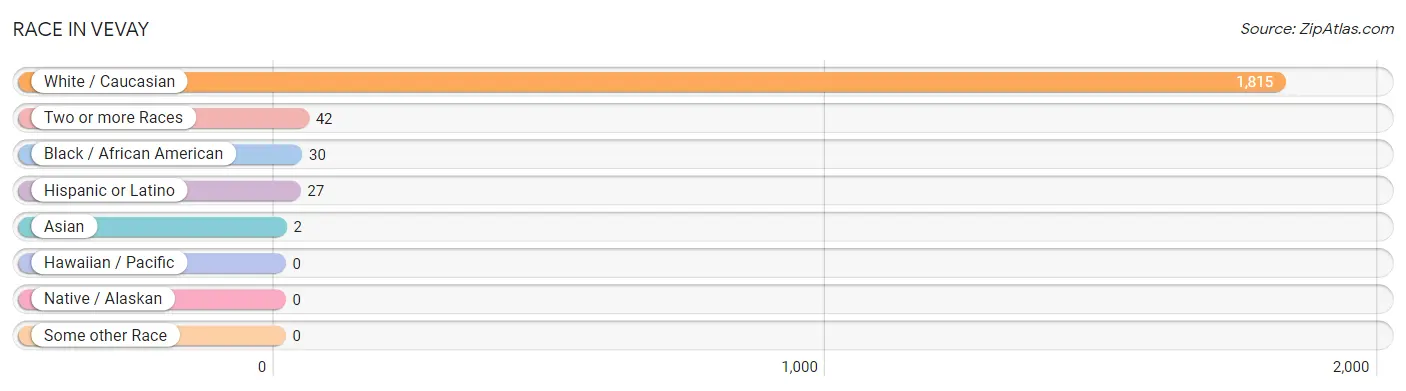
| Race | # Population | % Population |
| Asian | 2 | 0.1% |
| Black / African American | 30 | 1.6% |
| Hawaiian / Pacific | 0 | 0.0% |
| Hispanic or Latino | 27 | 1.4% |
| Native / Alaskan | 0 | 0.0% |
| White / Caucasian | 1,815 | 96.1% |
| Two or more Races | 42 | 2.2% |
| Some other Race | 0 | 0.0% |
| Total | 1,889 | 100.0% |
Ancestry in Vevay
The most populous ancestries reported in Vevay are German (420 | 22.2%), Irish (276 | 14.6%), English (223 | 11.8%), American (113 | 6.0%), and European (103 | 5.4%), together accounting for 60.1% of all Vevay residents.
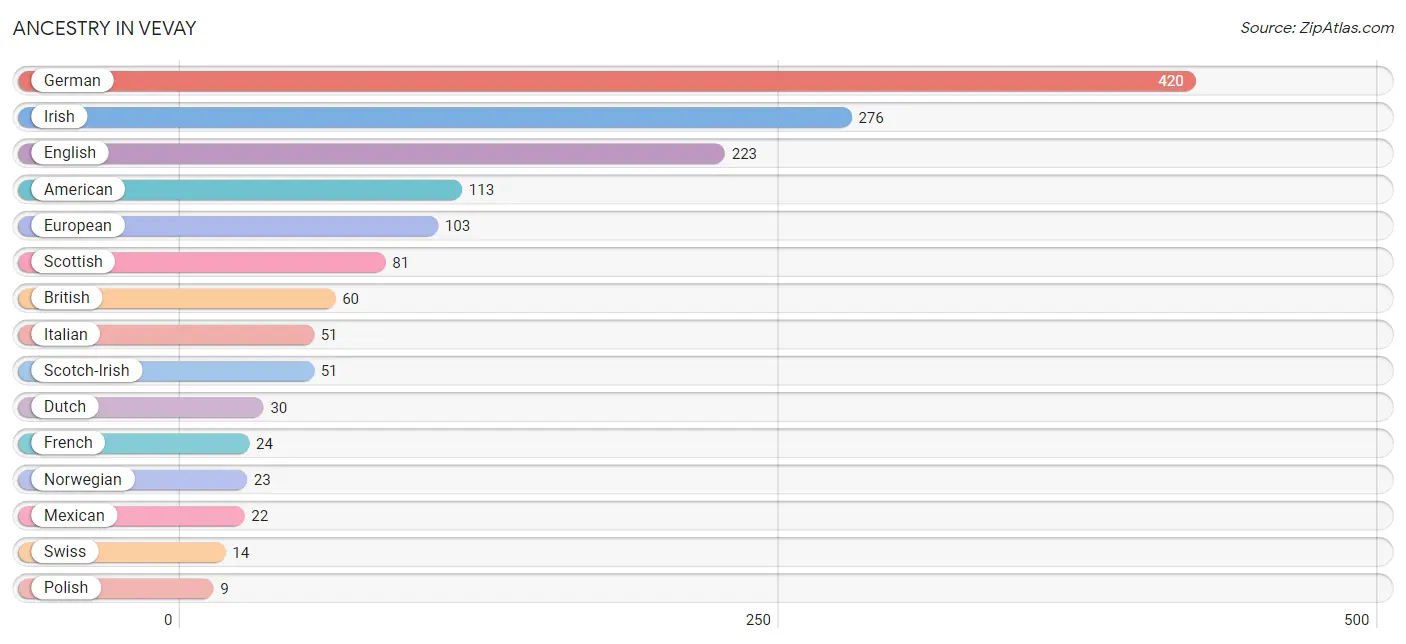
| Ancestry | # Population | % Population |
| American | 113 | 6.0% |
| Bhutanese | 2 | 0.1% |
| British | 60 | 3.2% |
| Celtic | 1 | 0.1% |
| Cherokee | 8 | 0.4% |
| Dutch | 30 | 1.6% |
| English | 223 | 11.8% |
| European | 103 | 5.4% |
| French | 24 | 1.3% |
| French Canadian | 3 | 0.2% |
| German | 420 | 22.2% |
| Hungarian | 6 | 0.3% |
| Irish | 276 | 14.6% |
| Italian | 51 | 2.7% |
| Mexican | 22 | 1.2% |
| Norwegian | 23 | 1.2% |
| Polish | 9 | 0.5% |
| Scotch-Irish | 51 | 2.7% |
| Scottish | 81 | 4.3% |
| Spaniard | 5 | 0.3% |
| Swedish | 3 | 0.2% |
| Swiss | 14 | 0.7% |
| Welsh | 3 | 0.2% | View All 23 Rows |
Immigrants in Vevay
The most numerous immigrant groups reported in Vevay came from Asia (2 | 0.1%), Eastern Asia (2 | 0.1%), and Japan (2 | 0.1%), together accounting for 0.3% of all Vevay residents.
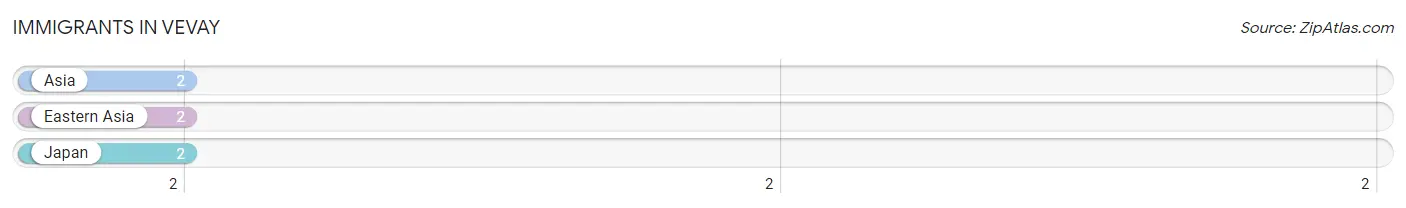
| Immigration Origin | # Population | % Population |
| Asia | 2 | 0.1% |
| Eastern Asia | 2 | 0.1% |
| Japan | 2 | 0.1% | View All 3 Rows |
Sex and Age in Vevay
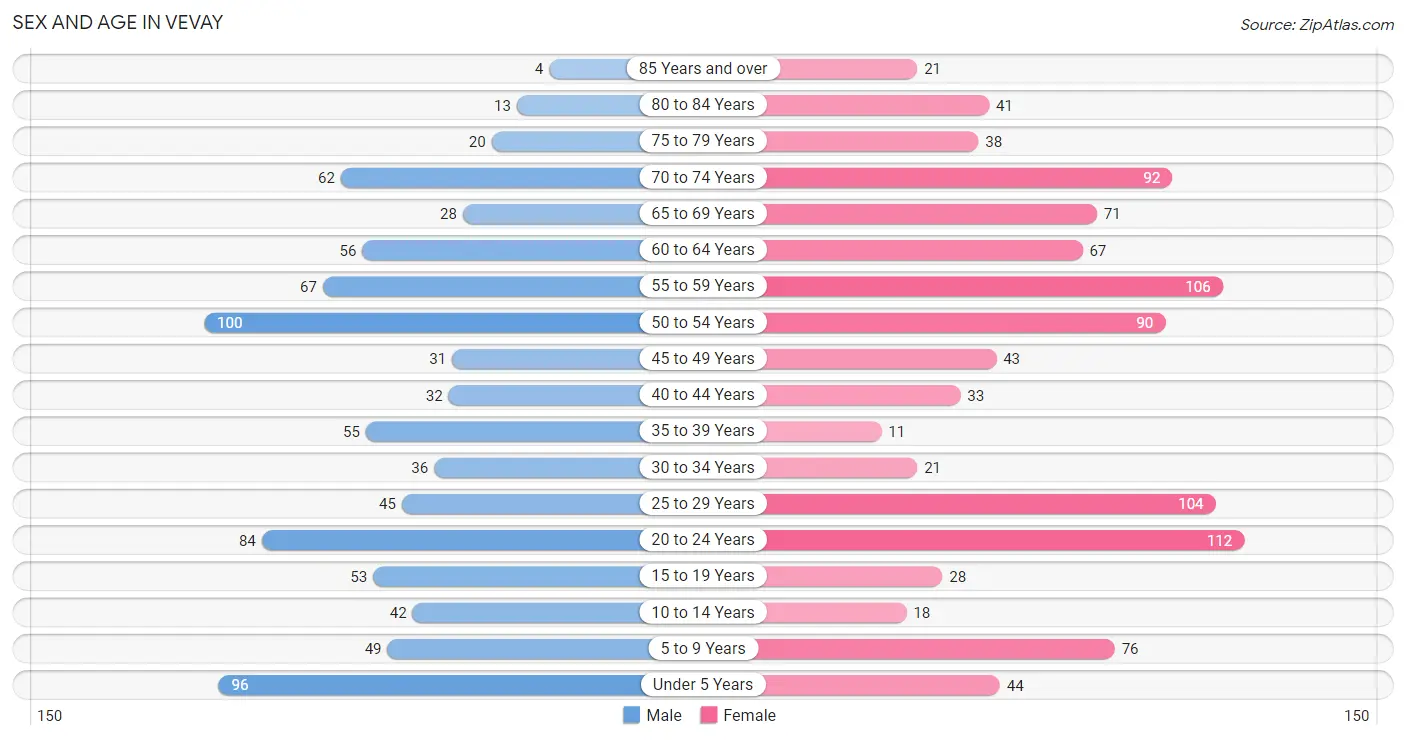
Sex and Age in Vevay
The most populous age groups in Vevay are 50 to 54 Years (100 | 11.5%) for men and 20 to 24 Years (112 | 11.0%) for women.
| Age Bracket | Male | Female |
| Under 5 Years | 96 (11.0%) | 44 (4.3%) |
| 5 to 9 Years | 49 (5.6%) | 76 (7.5%) |
| 10 to 14 Years | 42 (4.8%) | 18 (1.8%) |
| 15 to 19 Years | 53 (6.1%) | 28 (2.8%) |
| 20 to 24 Years | 84 (9.6%) | 112 (11.0%) |
| 25 to 29 Years | 45 (5.1%) | 104 (10.2%) |
| 30 to 34 Years | 36 (4.1%) | 21 (2.1%) |
| 35 to 39 Years | 55 (6.3%) | 11 (1.1%) |
| 40 to 44 Years | 32 (3.7%) | 33 (3.3%) |
| 45 to 49 Years | 31 (3.5%) | 43 (4.2%) |
| 50 to 54 Years | 100 (11.5%) | 90 (8.9%) |
| 55 to 59 Years | 67 (7.7%) | 106 (10.4%) |
| 60 to 64 Years | 56 (6.4%) | 67 (6.6%) |
| 65 to 69 Years | 28 (3.2%) | 71 (7.0%) |
| 70 to 74 Years | 62 (7.1%) | 92 (9.1%) |
| 75 to 79 Years | 20 (2.3%) | 38 (3.7%) |
| 80 to 84 Years | 13 (1.5%) | 41 (4.0%) |
| 85 Years and over | 4 (0.5%) | 21 (2.1%) |
| Total | 873 (100.0%) | 1,016 (100.0%) |
Families and Households in Vevay
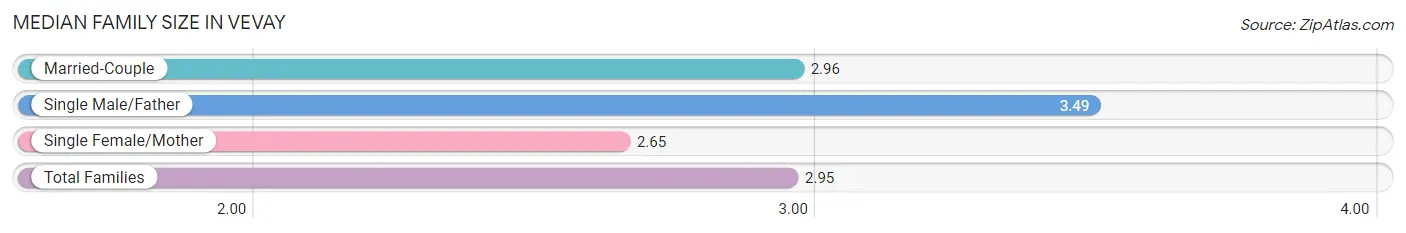
Median Family Size in Vevay
The median family size in Vevay is 2.95 persons per family, with single male/father families (68 | 15.5%) accounting for the largest median family size of 3.49 persons per family. On the other hand, single female/mother families (138 | 31.4%) represent the smallest median family size with 2.65 persons per family.
| Family Type | # Families | Family Size |
| Married-Couple | 233 (53.1%) | 2.96 |
| Single Male/Father | 68 (15.5%) | 3.49 |
| Single Female/Mother | 138 (31.4%) | 2.65 |
| Total Families | 439 (100.0%) | 2.95 |
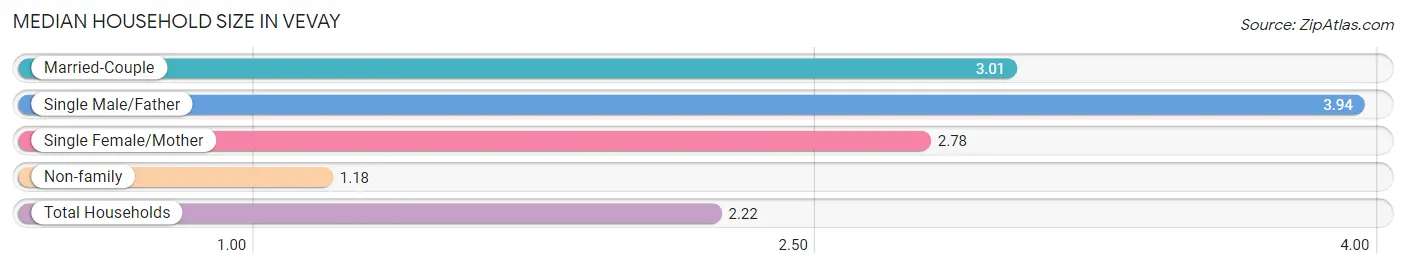
Median Household Size in Vevay
The median household size in Vevay is 2.22 persons per household, with single male/father households (68 | 8.4%) accounting for the largest median household size of 3.94 persons per household. non-family households (368 | 45.6%) represent the smallest median household size with 1.18 persons per household.
| Household Type | # Households | Household Size |
| Married-Couple | 233 (28.9%) | 3.01 |
| Single Male/Father | 68 (8.4%) | 3.94 |
| Single Female/Mother | 138 (17.1%) | 2.78 |
| Non-family | 368 (45.6%) | 1.18 |
| Total Households | 807 (100.0%) | 2.22 |
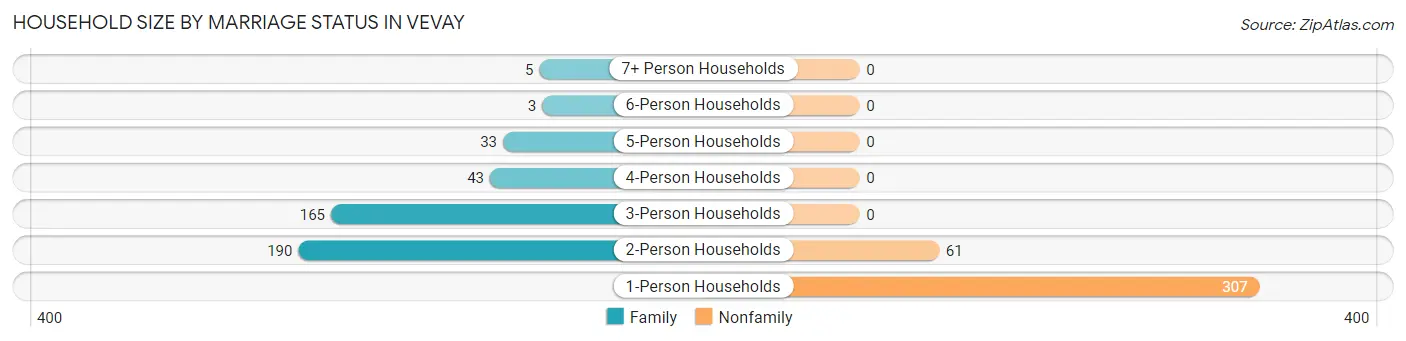
Household Size by Marriage Status in Vevay
Out of a total of 807 households in Vevay, 439 (54.4%) are family households, while 368 (45.6%) are nonfamily households. The most numerous type of family households are 2-person households, comprising 190, and the most common type of nonfamily households are 1-person households, comprising 307.
| Household Size | Family Households | Nonfamily Households |
| 1-Person Households | - | 307 (38.0%) |
| 2-Person Households | 190 (23.5%) | 61 (7.6%) |
| 3-Person Households | 165 (20.4%) | 0 (0.0%) |
| 4-Person Households | 43 (5.3%) | 0 (0.0%) |
| 5-Person Households | 33 (4.1%) | 0 (0.0%) |
| 6-Person Households | 3 (0.4%) | 0 (0.0%) |
| 7+ Person Households | 5 (0.6%) | 0 (0.0%) |
| Total | 439 (54.4%) | 368 (45.6%) |
Female Fertility in Vevay
Fertility by Age in Vevay
Average fertility rate in Vevay is 173.0 births per 1,000 women. Women in the age bracket of 20 to 34 years have the highest fertility rate with 262.0 births per 1,000 women. Women in the age bracket of 20 to 34 years acount for 100.0% of all women with births.
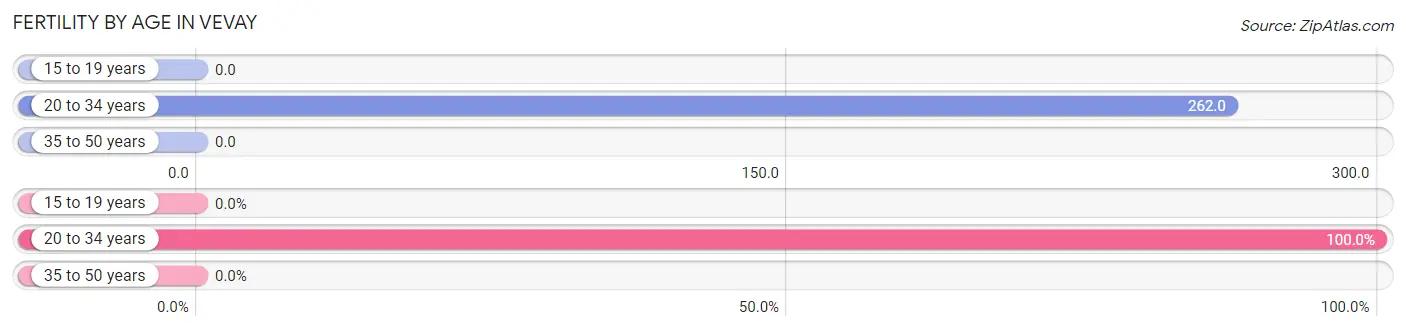
| Age Bracket | Women with Births | Births / 1,000 Women |
| 15 to 19 years | 0 (0.0%) | 0.0 |
| 20 to 34 years | 62 (100.0%) | 262.0 |
| 35 to 50 years | 0 (0.0%) | 0.0 |
| Total | 62 (100.0%) | 173.0 |
Fertility by Age by Marriage Status in Vevay
51.6% of women with births (62) in Vevay are married. The highest percentage of unmarried women with births falls into 20 to 34 years age bracket with 48.4% of them unmarried at the time of birth, while the lowest percentage of unmarried women with births belong to 20 to 34 years age bracket with 48.4% of them unmarried.
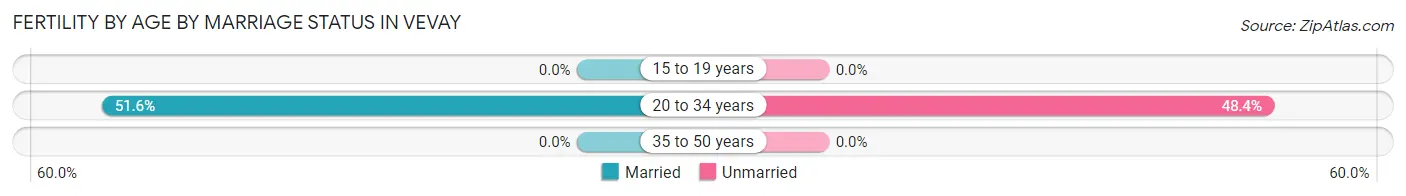
| Age Bracket | Married | Unmarried |
| 15 to 19 years | 0 (0.0%) | 0 (0.0%) |
| 20 to 34 years | 32 (51.6%) | 30 (48.4%) |
| 35 to 50 years | 0 (0.0%) | 0 (0.0%) |
| Total | 32 (51.6%) | 30 (48.4%) |
Fertility by Education in Vevay
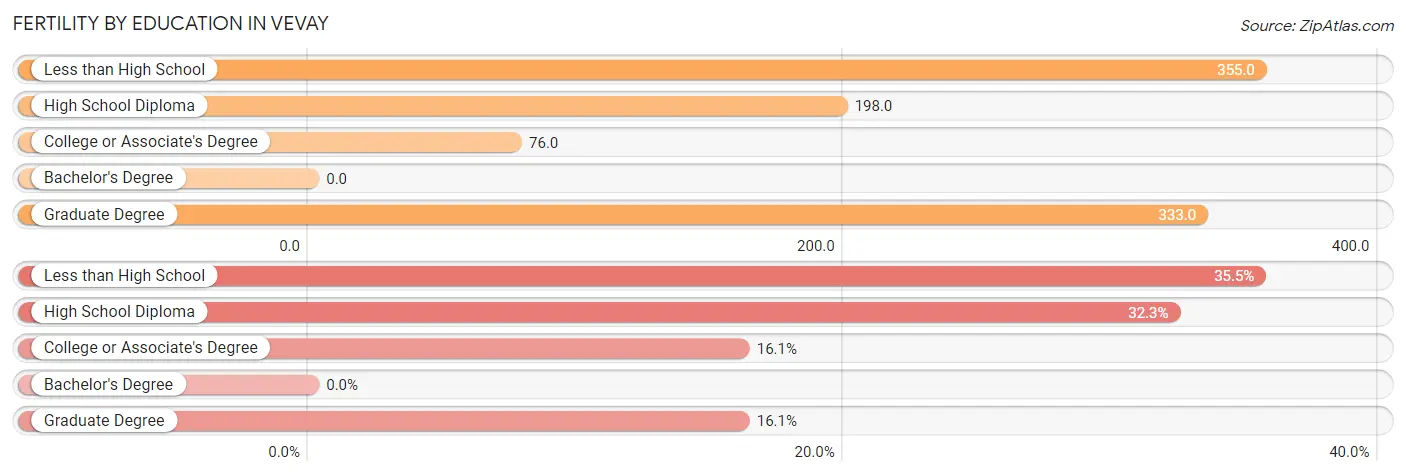
| Educational Attainment | Women with Births | Births / 1,000 Women |
| Less than High School | 22 (35.5%) | 355.0 |
| High School Diploma | 20 (32.3%) | 198.0 |
| College or Associate's Degree | 10 (16.1%) | 76.0 |
| Bachelor's Degree | 0 (0.0%) | 0.0 |
| Graduate Degree | 10 (16.1%) | 333.0 |
| Total | 62 (100.0%) | 173.0 |
Fertility by Education by Marriage Status in Vevay
48.4% of women with births in Vevay are unmarried. Women with the educational attainment of less than high school are most likely to be married with 100.0% of them married at childbirth, while women with the educational attainment of high school diploma are least likely to be married with 100.0% of them unmarried at childbirth.
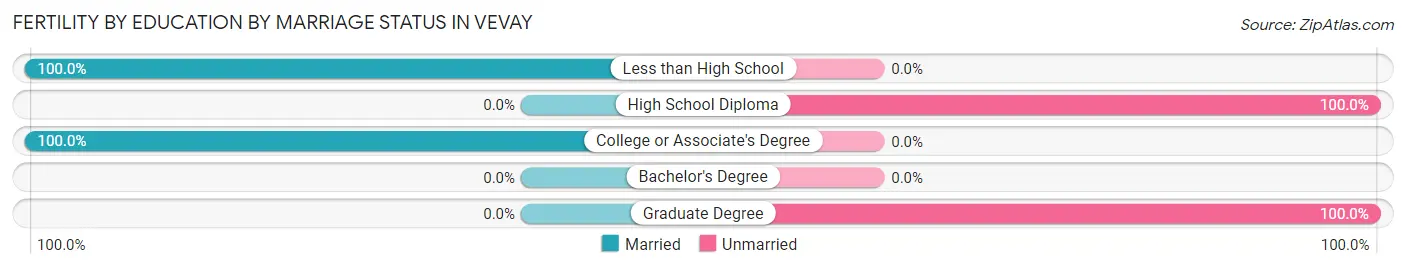
| Educational Attainment | Married | Unmarried |
| Less than High School | 22 (100.0%) | 0 (0.0%) |
| High School Diploma | 0 (0.0%) | 20 (100.0%) |
| College or Associate's Degree | 10 (100.0%) | 0 (0.0%) |
| Bachelor's Degree | 0 (0.0%) | 0 (0.0%) |
| Graduate Degree | 0 (0.0%) | 10 (100.0%) |
| Total | 32 (51.6%) | 30 (48.4%) |
Employment Characteristics in Vevay
Employment by Class of Employer in Vevay
Among the 807 employed individuals in Vevay, private company employees (577 | 71.5%), local government employees (86 | 10.7%), and self-employed (not incorporated) (67 | 8.3%) make up the most common classes of employment.
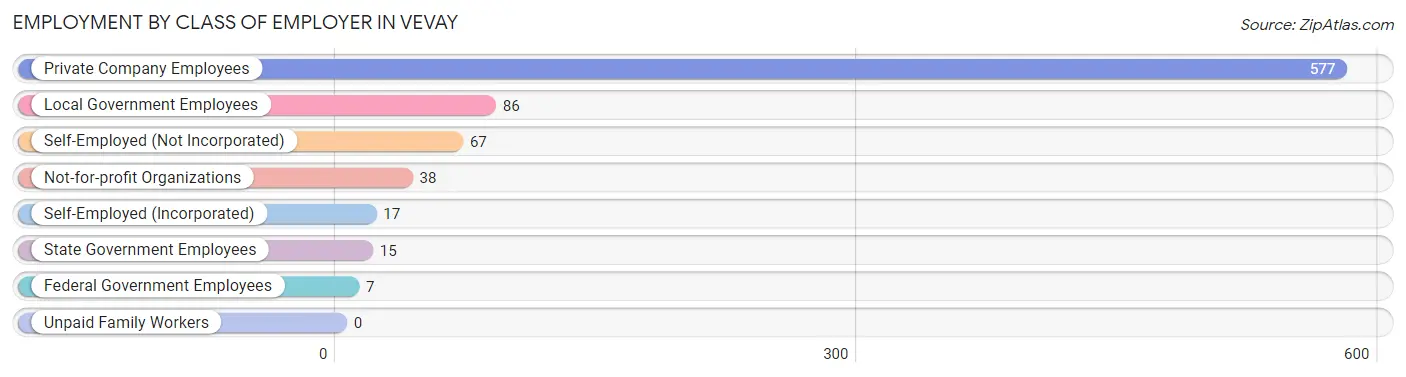
| Employer Class | # Employees | % Employees |
| Private Company Employees | 577 | 71.5% |
| Self-Employed (Incorporated) | 17 | 2.1% |
| Self-Employed (Not Incorporated) | 67 | 8.3% |
| Not-for-profit Organizations | 38 | 4.7% |
| Local Government Employees | 86 | 10.7% |
| State Government Employees | 15 | 1.9% |
| Federal Government Employees | 7 | 0.9% |
| Unpaid Family Workers | 0 | 0.0% |
| Total | 807 | 100.0% |
Employment Status by Age in Vevay
According to the labor force statistics for Vevay, out of the total population over 16 years of age (1,560), 54.1% or 844 individuals are in the labor force, with 3.9% or 33 of them unemployed. The age group with the highest labor force participation rate is 30 to 34 years, with 91.2% or 52 individuals in the labor force. Within the labor force, the 25 to 29 years age range has the highest percentage of unemployed individuals, with 19.2% or 20 of them being unemployed.
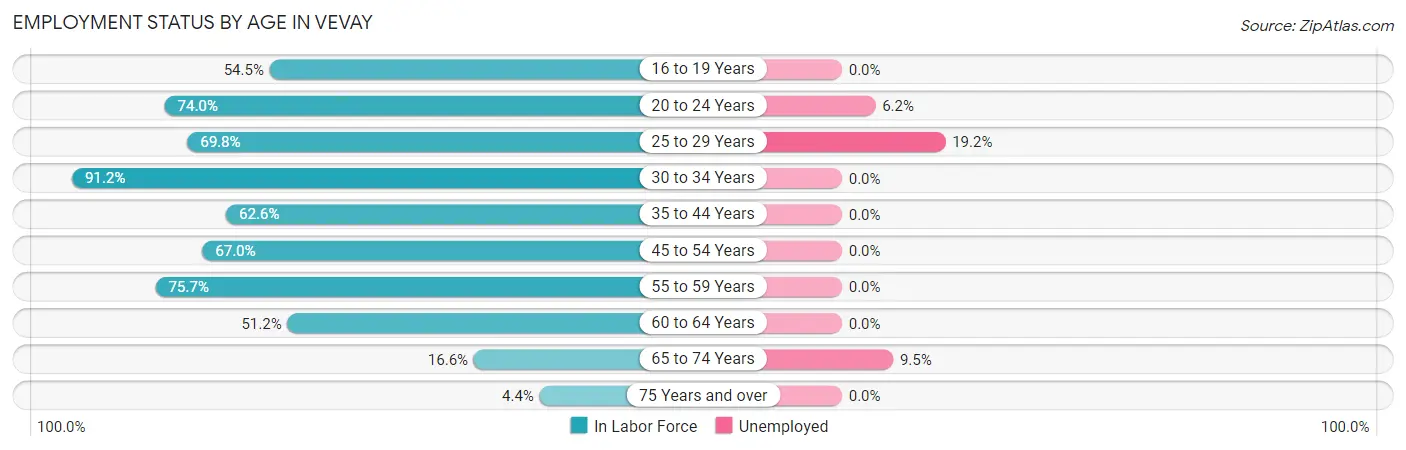
| Age Bracket | In Labor Force | Unemployed |
| 16 to 19 Years | 42 (54.5%) | 0 (0.0%) |
| 20 to 24 Years | 145 (74.0%) | 9 (6.2%) |
| 25 to 29 Years | 104 (69.8%) | 20 (19.2%) |
| 30 to 34 Years | 52 (91.2%) | 0 (0.0%) |
| 35 to 44 Years | 82 (62.6%) | 0 (0.0%) |
| 45 to 54 Years | 177 (67.0%) | 0 (0.0%) |
| 55 to 59 Years | 131 (75.7%) | 0 (0.0%) |
| 60 to 64 Years | 63 (51.2%) | 0 (0.0%) |
| 65 to 74 Years | 42 (16.6%) | 4 (9.5%) |
| 75 Years and over | 6 (4.4%) | 0 (0.0%) |
| Total | 844 (54.1%) | 33 (3.9%) |
Employment Status by Educational Attainment in Vevay
According to labor force statistics for Vevay, 67.9% of individuals (609) out of the total population between 25 and 64 years of age (897) are in the labor force, with 3.3% or 20 of them being unemployed. The group with the highest labor force participation rate are those with the educational attainment of high school diploma, with 81.0% or 235 individuals in the labor force. Within the labor force, individuals with high school diploma education have the highest percentage of unemployment, with 8.5% or 20 of them being unemployed.
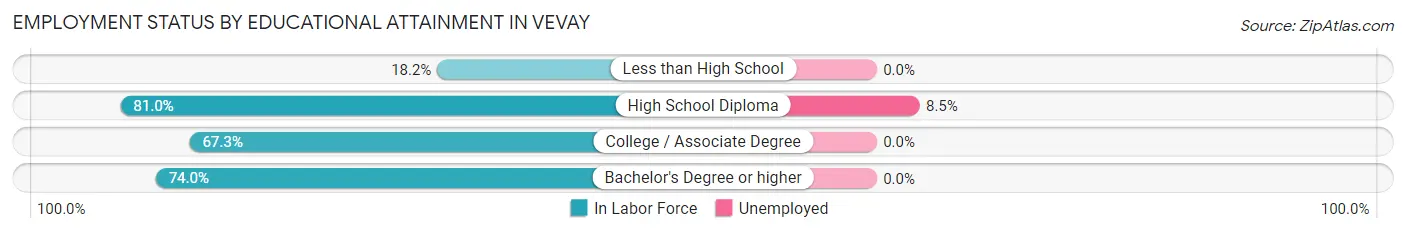
| Educational Attainment | In Labor Force | Unemployed |
| Less than High School | 16 (18.2%) | 0 (0.0%) |
| High School Diploma | 235 (81.0%) | 25 (8.5%) |
| College / Associate Degree | 261 (67.3%) | 0 (0.0%) |
| Bachelor's Degree or higher | 97 (74.0%) | 0 (0.0%) |
| Total | 609 (67.9%) | 30 (3.3%) |
Employment Occupations by Sex in Vevay
Management, Business, Science and Arts Occupations
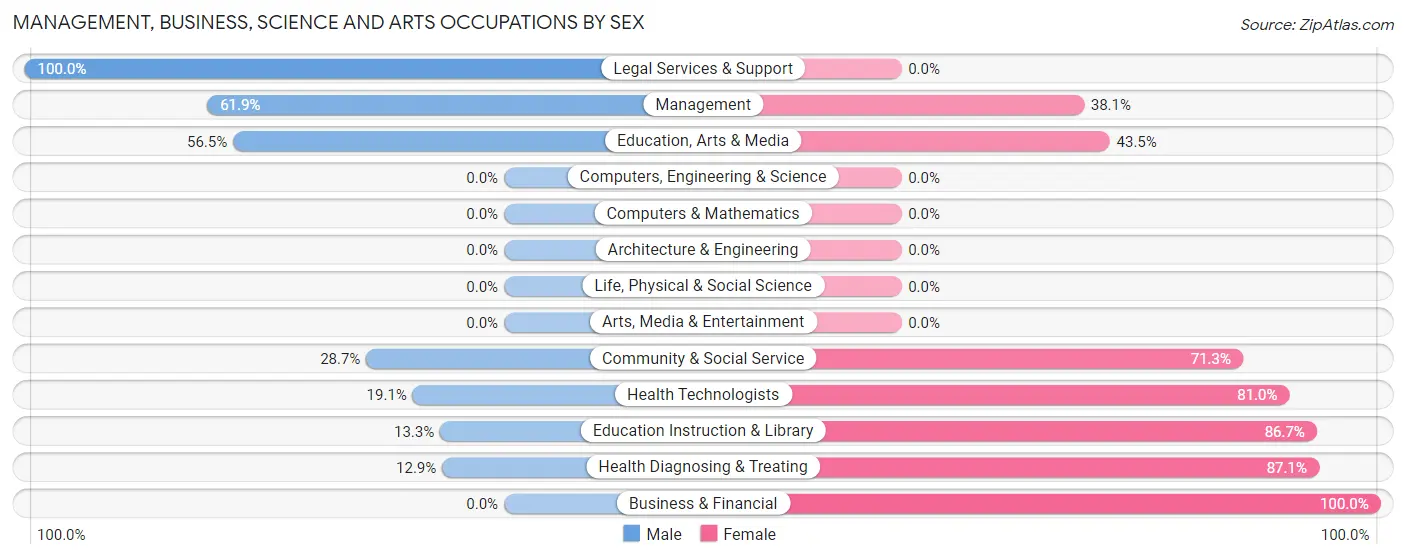
The most common Management, Business, Science and Arts occupations in Vevay are Community & Social Service (87 | 10.7%), Education Instruction & Library (60 | 7.4%), Business & Financial (59 | 7.3%), Management (42 | 5.2%), and Health Diagnosing & Treating (31 | 3.8%).
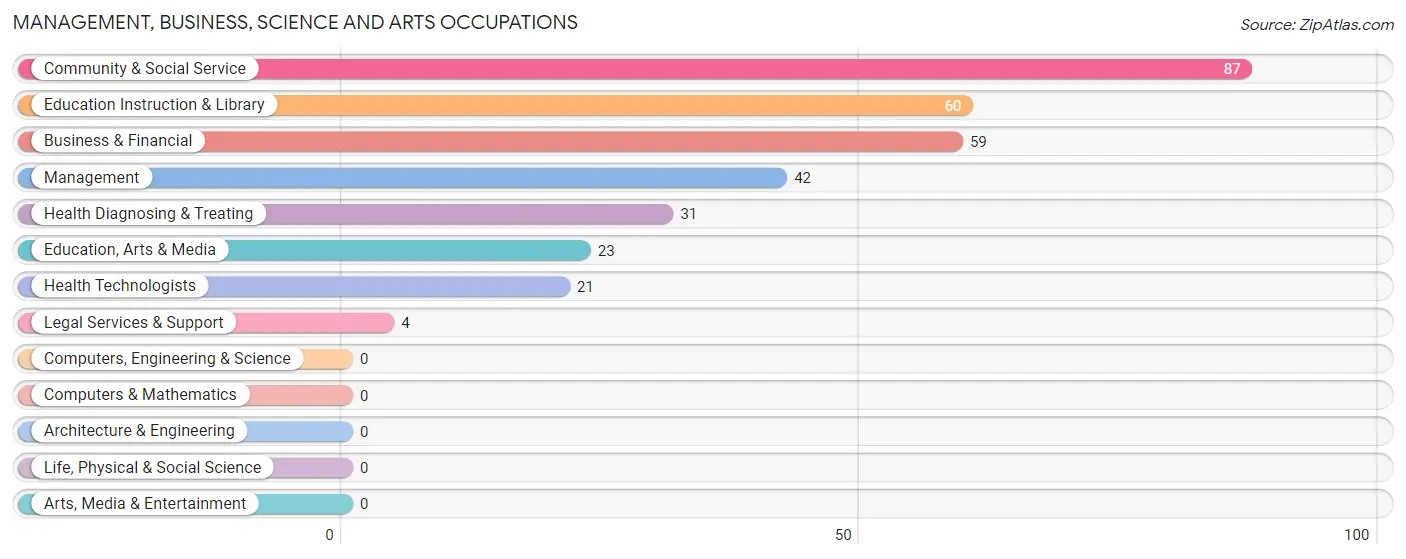
Management, Business, Science and Arts Occupations by Sex
Within the Management, Business, Science and Arts occupations in Vevay, the most male-oriented occupations are Legal Services & Support (100.0%), Management (61.9%), and Education, Arts & Media (56.5%), while the most female-oriented occupations are Business & Financial (100.0%), Health Diagnosing & Treating (87.1%), and Education Instruction & Library (86.7%).
| Occupation | Male | Female |
| Management | 26 (61.9%) | 16 (38.1%) |
| Business & Financial | 0 (0.0%) | 59 (100.0%) |
| Computers, Engineering & Science | 0 (0.0%) | 0 (0.0%) |
| Computers & Mathematics | 0 (0.0%) | 0 (0.0%) |
| Architecture & Engineering | 0 (0.0%) | 0 (0.0%) |
| Life, Physical & Social Science | 0 (0.0%) | 0 (0.0%) |
| Community & Social Service | 25 (28.7%) | 62 (71.3%) |
| Education, Arts & Media | 13 (56.5%) | 10 (43.5%) |
| Legal Services & Support | 4 (100.0%) | 0 (0.0%) |
| Education Instruction & Library | 8 (13.3%) | 52 (86.7%) |
| Arts, Media & Entertainment | 0 (0.0%) | 0 (0.0%) |
| Health Diagnosing & Treating | 4 (12.9%) | 27 (87.1%) |
| Health Technologists | 4 (19.1%) | 17 (80.9%) |
| Total (Category) | 55 (25.1%) | 164 (74.9%) |
| Total (Overall) | 392 (48.3%) | 419 (51.7%) |
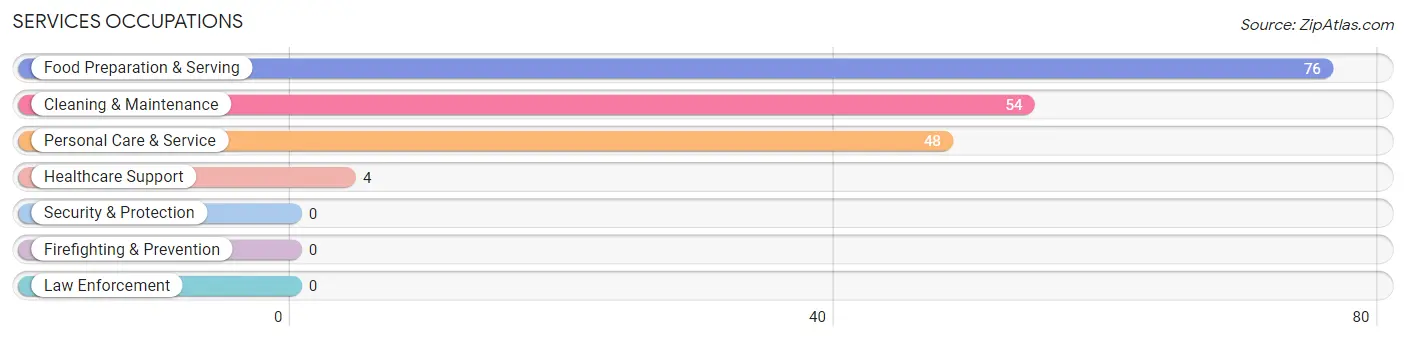
Services Occupations
The most common Services occupations in Vevay are Food Preparation & Serving (76 | 9.4%), Cleaning & Maintenance (54 | 6.7%), Personal Care & Service (48 | 5.9%), and Healthcare Support (4 | 0.5%).
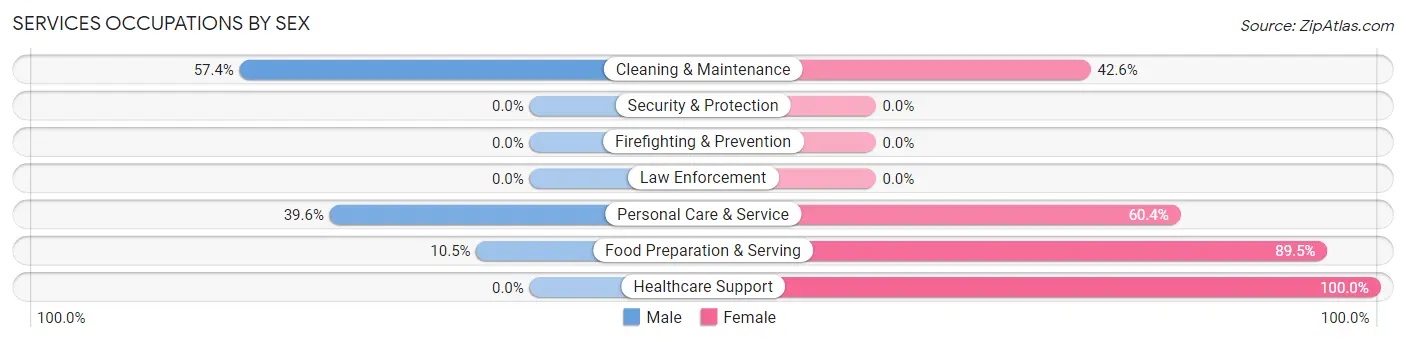
Services Occupations by Sex
Within the Services occupations in Vevay, the most male-oriented occupations are Cleaning & Maintenance (57.4%), Personal Care & Service (39.6%), and Food Preparation & Serving (10.5%), while the most female-oriented occupations are Healthcare Support (100.0%), Food Preparation & Serving (89.5%), and Personal Care & Service (60.4%).
| Occupation | Male | Female |
| Healthcare Support | 0 (0.0%) | 4 (100.0%) |
| Security & Protection | 0 (0.0%) | 0 (0.0%) |
| Firefighting & Prevention | 0 (0.0%) | 0 (0.0%) |
| Law Enforcement | 0 (0.0%) | 0 (0.0%) |
| Food Preparation & Serving | 8 (10.5%) | 68 (89.5%) |
| Cleaning & Maintenance | 31 (57.4%) | 23 (42.6%) |
| Personal Care & Service | 19 (39.6%) | 29 (60.4%) |
| Total (Category) | 58 (31.9%) | 124 (68.1%) |
| Total (Overall) | 392 (48.3%) | 419 (51.7%) |
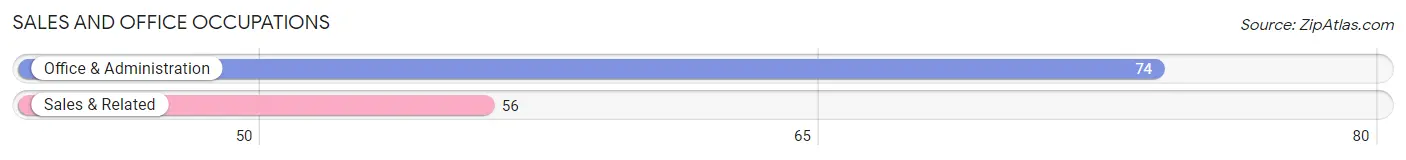
Sales and Office Occupations
The most common Sales and Office occupations in Vevay are Office & Administration (74 | 9.1%), and Sales & Related (56 | 6.9%).
Sales and Office Occupations by Sex
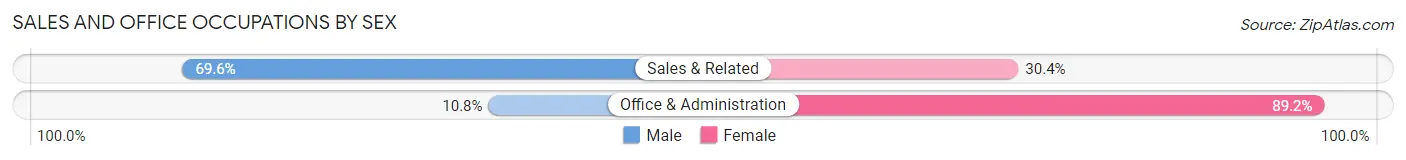
| Occupation | Male | Female |
| Sales & Related | 39 (69.6%) | 17 (30.4%) |
| Office & Administration | 8 (10.8%) | 66 (89.2%) |
| Total (Category) | 47 (36.1%) | 83 (63.8%) |
| Total (Overall) | 392 (48.3%) | 419 (51.7%) |
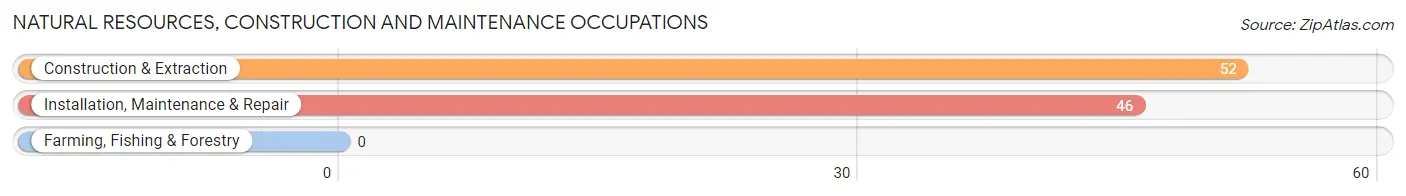
Natural Resources, Construction and Maintenance Occupations
The most common Natural Resources, Construction and Maintenance occupations in Vevay are Construction & Extraction (52 | 6.4%), and Installation, Maintenance & Repair (46 | 5.7%).
Natural Resources, Construction and Maintenance Occupations by Sex
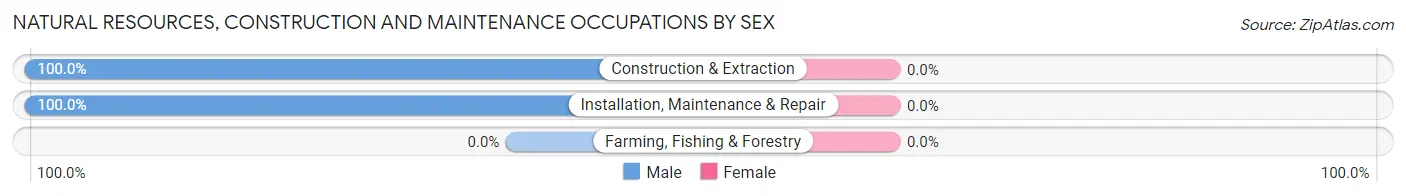
| Occupation | Male | Female |
| Farming, Fishing & Forestry | 0 (0.0%) | 0 (0.0%) |
| Construction & Extraction | 52 (100.0%) | 0 (0.0%) |
| Installation, Maintenance & Repair | 46 (100.0%) | 0 (0.0%) |
| Total (Category) | 98 (100.0%) | 0 (0.0%) |
| Total (Overall) | 392 (48.3%) | 419 (51.7%) |
Production, Transportation and Moving Occupations
The most common Production, Transportation and Moving occupations in Vevay are Production (124 | 15.3%), and Material Moving (58 | 7.1%).
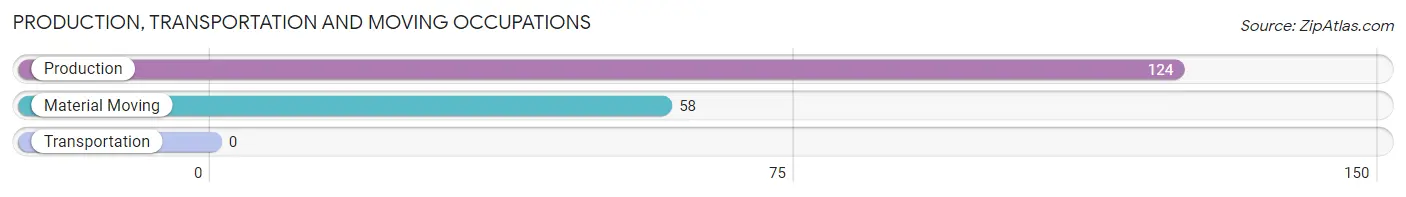
Production, Transportation and Moving Occupations by Sex
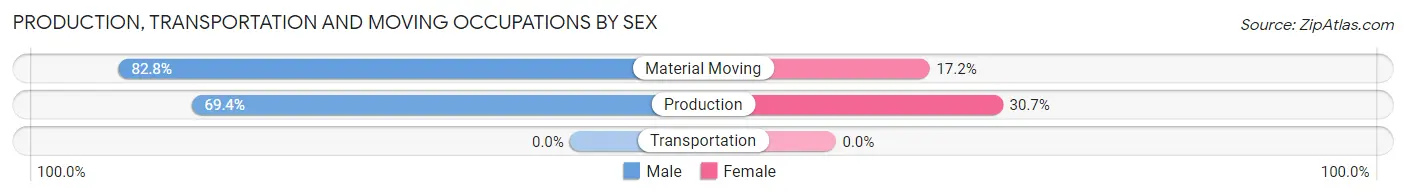
| Occupation | Male | Female |
| Production | 86 (69.4%) | 38 (30.6%) |
| Transportation | 0 (0.0%) | 0 (0.0%) |
| Material Moving | 48 (82.8%) | 10 (17.2%) |
| Total (Category) | 134 (73.6%) | 48 (26.4%) |
| Total (Overall) | 392 (48.3%) | 419 (51.7%) |
Employment Industries by Sex in Vevay
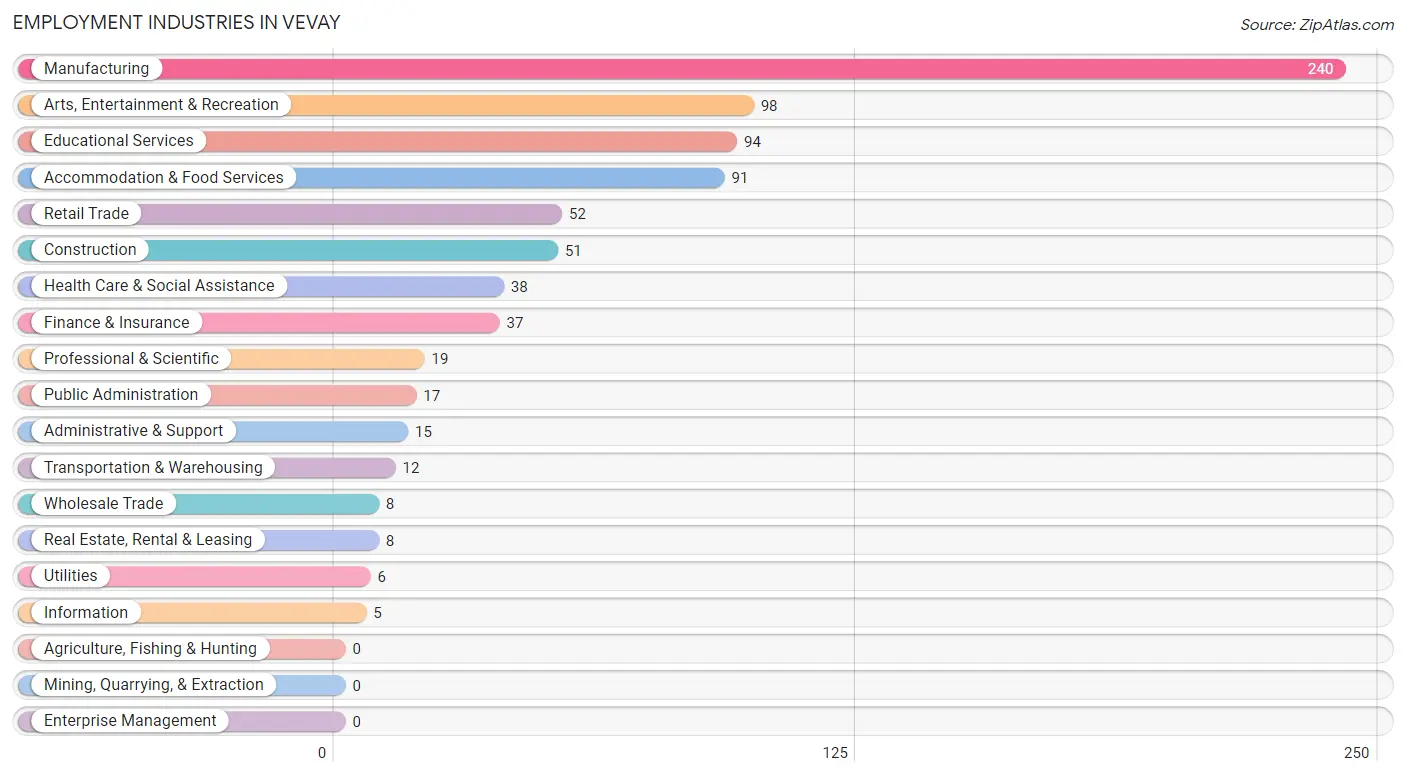
Employment Industries in Vevay
The major employment industries in Vevay include Manufacturing (240 | 29.6%), Arts, Entertainment & Recreation (98 | 12.1%), Educational Services (94 | 11.6%), Accommodation & Food Services (91 | 11.2%), and Retail Trade (52 | 6.4%).
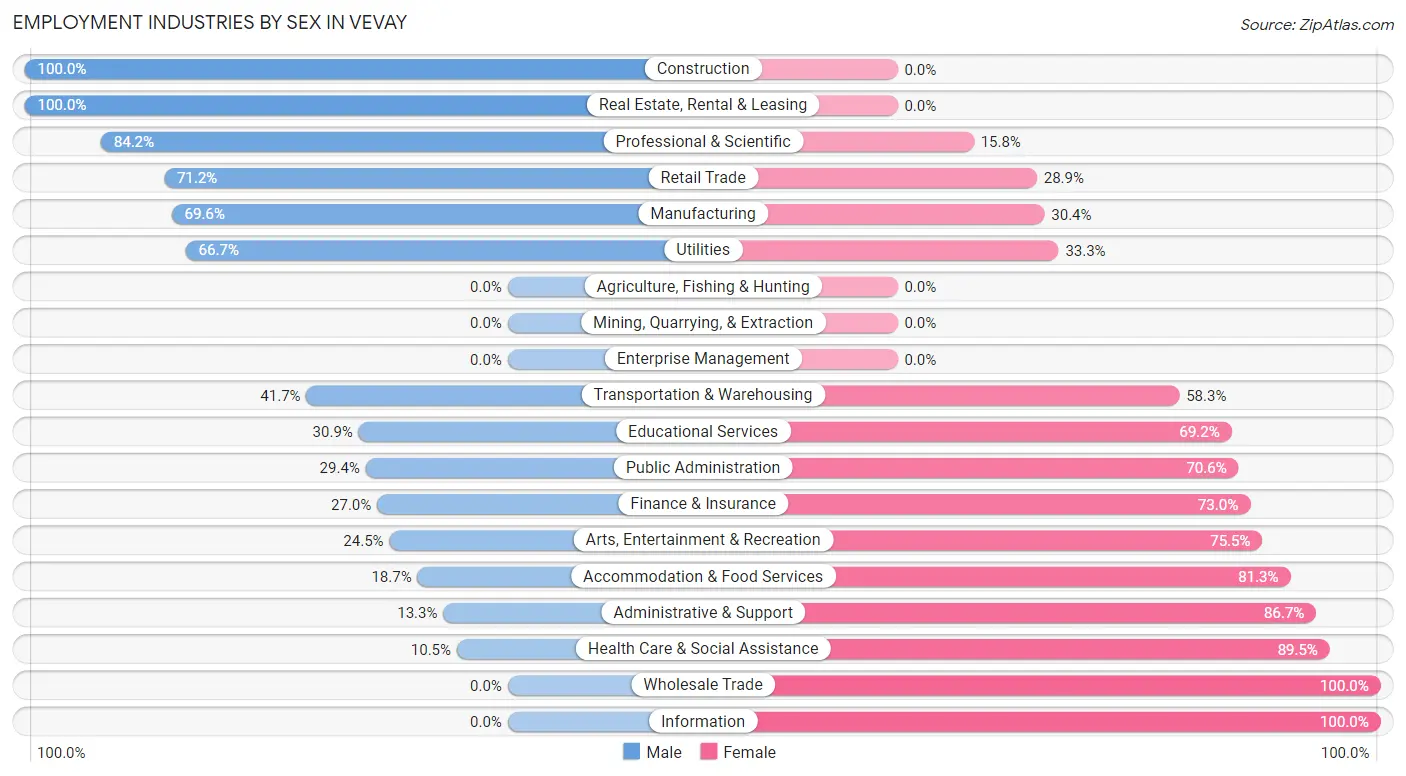
Employment Industries by Sex in Vevay
The Vevay industries that see more men than women are Construction (100.0%), Real Estate, Rental & Leasing (100.0%), and Professional & Scientific (84.2%), whereas the industries that tend to have a higher number of women are Wholesale Trade (100.0%), Information (100.0%), and Health Care & Social Assistance (89.5%).
| Industry | Male | Female |
| Agriculture, Fishing & Hunting | 0 (0.0%) | 0 (0.0%) |
| Mining, Quarrying, & Extraction | 0 (0.0%) | 0 (0.0%) |
| Construction | 51 (100.0%) | 0 (0.0%) |
| Manufacturing | 167 (69.6%) | 73 (30.4%) |
| Wholesale Trade | 0 (0.0%) | 8 (100.0%) |
| Retail Trade | 37 (71.2%) | 15 (28.8%) |
| Transportation & Warehousing | 5 (41.7%) | 7 (58.3%) |
| Utilities | 4 (66.7%) | 2 (33.3%) |
| Information | 0 (0.0%) | 5 (100.0%) |
| Finance & Insurance | 10 (27.0%) | 27 (73.0%) |
| Real Estate, Rental & Leasing | 8 (100.0%) | 0 (0.0%) |
| Professional & Scientific | 16 (84.2%) | 3 (15.8%) |
| Enterprise Management | 0 (0.0%) | 0 (0.0%) |
| Administrative & Support | 2 (13.3%) | 13 (86.7%) |
| Educational Services | 29 (30.8%) | 65 (69.2%) |
| Health Care & Social Assistance | 4 (10.5%) | 34 (89.5%) |
| Arts, Entertainment & Recreation | 24 (24.5%) | 74 (75.5%) |
| Accommodation & Food Services | 17 (18.7%) | 74 (81.3%) |
| Public Administration | 5 (29.4%) | 12 (70.6%) |
| Total | 392 (48.3%) | 419 (51.7%) |
Education in Vevay
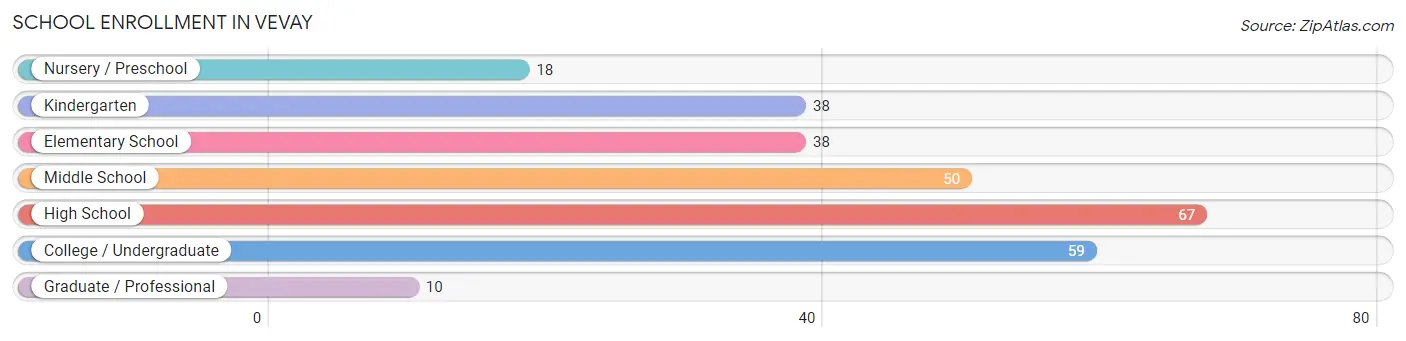
School Enrollment in Vevay
The most common levels of schooling among the 280 students in Vevay are high school (67 | 23.9%), college / undergraduate (59 | 21.1%), and middle school (50 | 17.9%).
| School Level | # Students | % Students |
| Nursery / Preschool | 18 | 6.4% |
| Kindergarten | 38 | 13.6% |
| Elementary School | 38 | 13.6% |
| Middle School | 50 | 17.9% |
| High School | 67 | 23.9% |
| College / Undergraduate | 59 | 21.1% |
| Graduate / Professional | 10 | 3.6% |
| Total | 280 | 100.0% |
School Enrollment by Age by Funding Source in Vevay
Out of a total of 280 students who are enrolled in schools in Vevay, 57 (20.4%) attend a private institution, while the remaining 223 (79.6%) are enrolled in public schools. The age group of 35 years and over has the highest likelihood of being enrolled in private schools, with 13 (100.0% in the age bracket) enrolled. Conversely, the age group of 3 to 4 year olds has the lowest likelihood of being enrolled in a private school, with 10 (100.0% in the age bracket) attending a public institution.
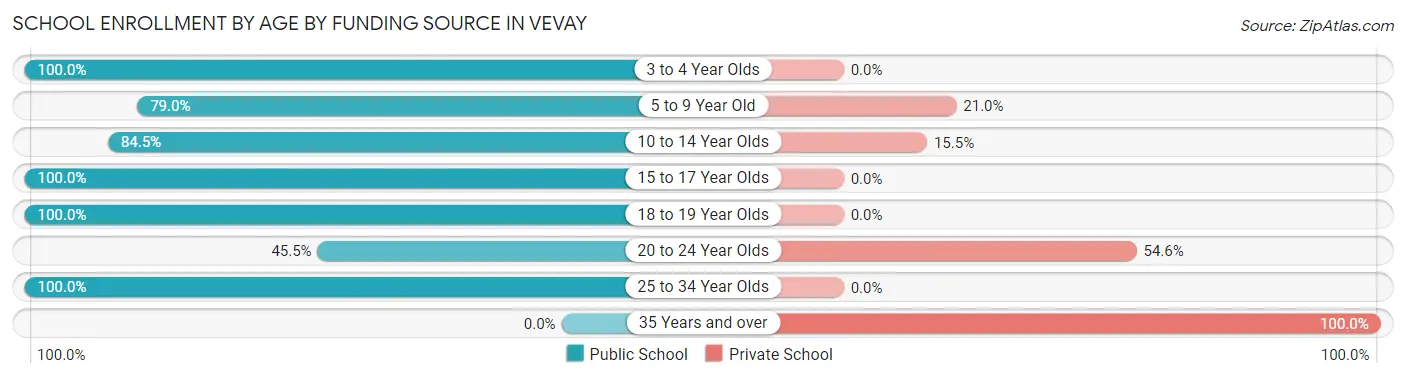
| Age Bracket | Public School | Private School |
| 3 to 4 Year Olds | 10 (100.0%) | 0 (0.0%) |
| 5 to 9 Year Old | 64 (79.0%) | 17 (21.0%) |
| 10 to 14 Year Olds | 49 (84.5%) | 9 (15.5%) |
| 15 to 17 Year Olds | 48 (100.0%) | 0 (0.0%) |
| 18 to 19 Year Olds | 2 (100.0%) | 0 (0.0%) |
| 20 to 24 Year Olds | 15 (45.5%) | 18 (54.5%) |
| 25 to 34 Year Olds | 35 (100.0%) | 0 (0.0%) |
| 35 Years and over | 0 (0.0%) | 13 (100.0%) |
| Total | 223 (79.6%) | 57 (20.4%) |
Educational Attainment by Field of Study in Vevay
Bio, nature & agricultural (51 | 26.7%), business (39 | 20.4%), liberal arts & history (30 | 15.7%), education (26 | 13.6%), and science & technology (10 | 5.2%) are the most common fields of study among 191 individuals in Vevay who have obtained a bachelor's degree or higher.
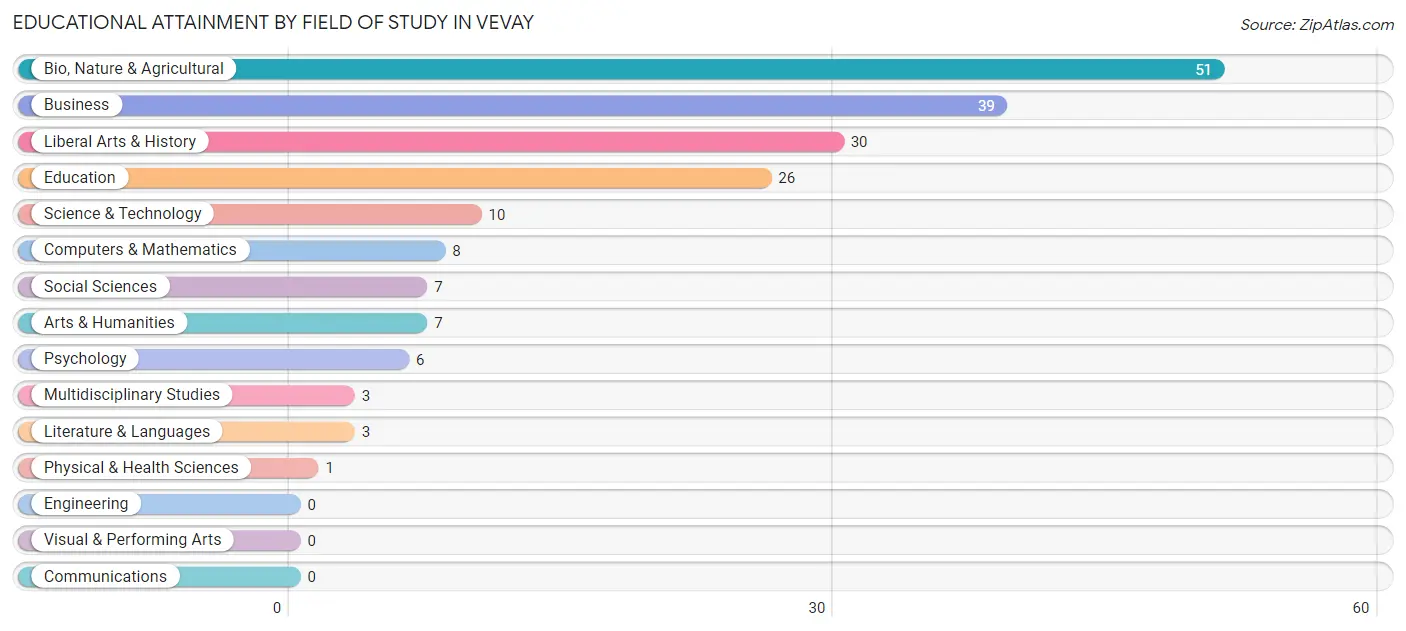
| Field of Study | # Graduates | % Graduates |
| Computers & Mathematics | 8 | 4.2% |
| Bio, Nature & Agricultural | 51 | 26.7% |
| Physical & Health Sciences | 1 | 0.5% |
| Psychology | 6 | 3.1% |
| Social Sciences | 7 | 3.7% |
| Engineering | 0 | 0.0% |
| Multidisciplinary Studies | 3 | 1.6% |
| Science & Technology | 10 | 5.2% |
| Business | 39 | 20.4% |
| Education | 26 | 13.6% |
| Literature & Languages | 3 | 1.6% |
| Liberal Arts & History | 30 | 15.7% |
| Visual & Performing Arts | 0 | 0.0% |
| Communications | 0 | 0.0% |
| Arts & Humanities | 7 | 3.7% |
| Total | 191 | 100.0% |
Transportation & Commute in Vevay
Vehicle Availability by Sex in Vevay
The most prevalent vehicle ownership categories in Vevay are males with 2 vehicles (176, accounting for 45.4%) and females with 2 vehicles (175, making up 42.0%).
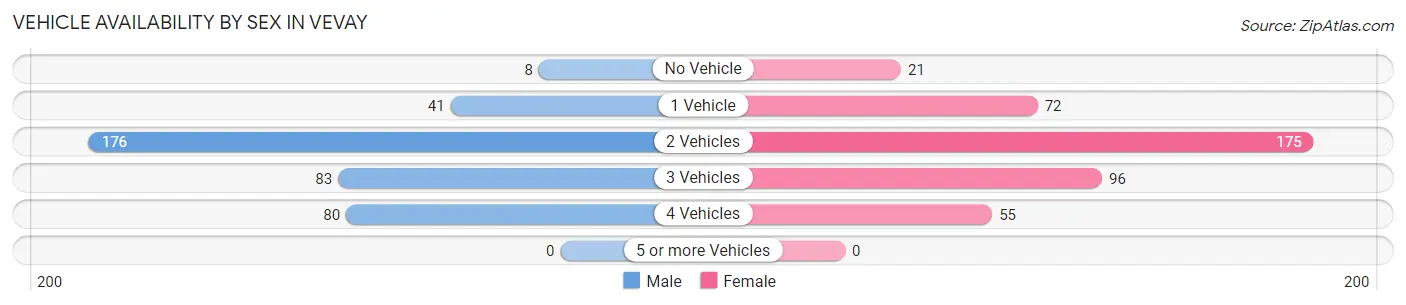
| Vehicles Available | Male | Female |
| No Vehicle | 8 (2.1%) | 21 (5.0%) |
| 1 Vehicle | 41 (10.6%) | 72 (17.2%) |
| 2 Vehicles | 176 (45.4%) | 175 (41.8%) |
| 3 Vehicles | 83 (21.4%) | 96 (22.9%) |
| 4 Vehicles | 80 (20.6%) | 55 (13.1%) |
| 5 or more Vehicles | 0 (0.0%) | 0 (0.0%) |
| Total | 388 (100.0%) | 419 (100.0%) |
Commute Time in Vevay
The most frequently occuring commute durations in Vevay are 15 to 19 minutes (119 commuters, 15.3%), 10 to 14 minutes (102 commuters, 13.1%), and 5 to 9 minutes (99 commuters, 12.8%).
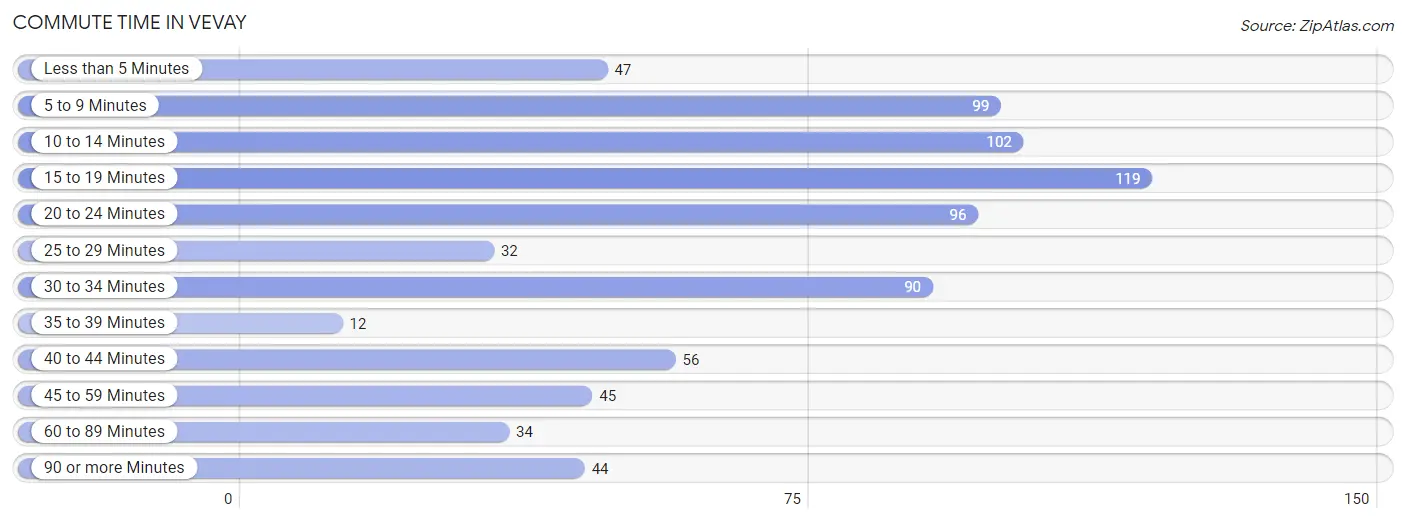
| Commute Time | # Commuters | % Commuters |
| Less than 5 Minutes | 47 | 6.1% |
| 5 to 9 Minutes | 99 | 12.8% |
| 10 to 14 Minutes | 102 | 13.1% |
| 15 to 19 Minutes | 119 | 15.3% |
| 20 to 24 Minutes | 96 | 12.4% |
| 25 to 29 Minutes | 32 | 4.1% |
| 30 to 34 Minutes | 90 | 11.6% |
| 35 to 39 Minutes | 12 | 1.5% |
| 40 to 44 Minutes | 56 | 7.2% |
| 45 to 59 Minutes | 45 | 5.8% |
| 60 to 89 Minutes | 34 | 4.4% |
| 90 or more Minutes | 44 | 5.7% |
Commute Time by Sex in Vevay
The most common commute times in Vevay are 15 to 19 minutes (84 commuters, 22.1%) for males and 10 to 14 minutes (75 commuters, 18.9%) for females.
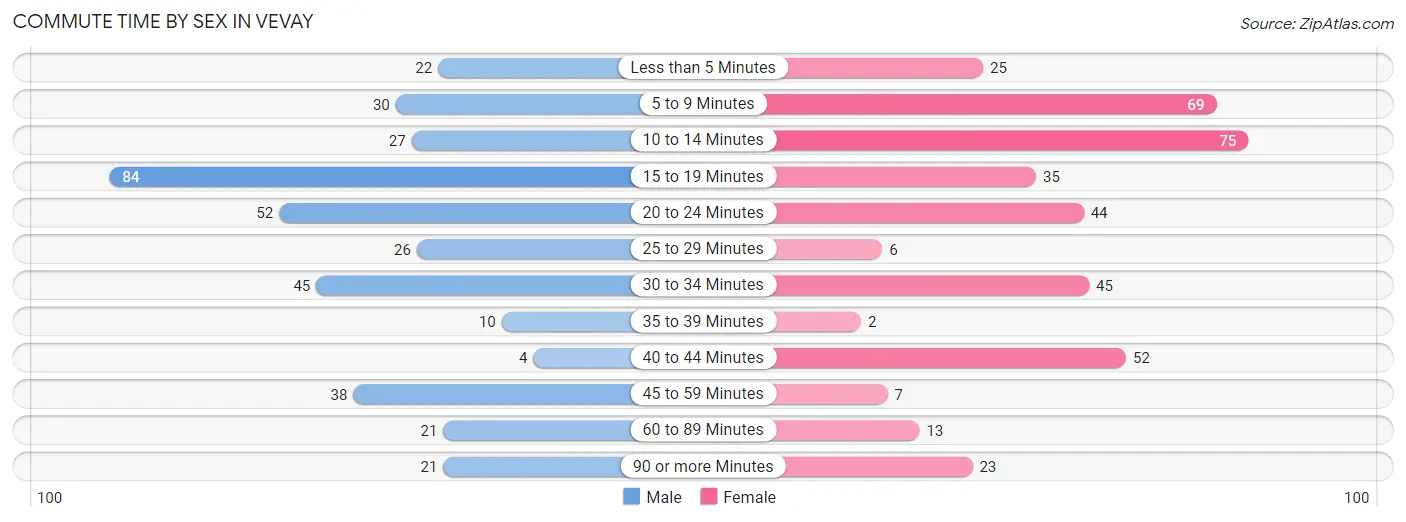
| Commute Time | Male | Female |
| Less than 5 Minutes | 22 (5.8%) | 25 (6.3%) |
| 5 to 9 Minutes | 30 (7.9%) | 69 (17.4%) |
| 10 to 14 Minutes | 27 (7.1%) | 75 (18.9%) |
| 15 to 19 Minutes | 84 (22.1%) | 35 (8.8%) |
| 20 to 24 Minutes | 52 (13.7%) | 44 (11.1%) |
| 25 to 29 Minutes | 26 (6.8%) | 6 (1.5%) |
| 30 to 34 Minutes | 45 (11.8%) | 45 (11.4%) |
| 35 to 39 Minutes | 10 (2.6%) | 2 (0.5%) |
| 40 to 44 Minutes | 4 (1.1%) | 52 (13.1%) |
| 45 to 59 Minutes | 38 (10.0%) | 7 (1.8%) |
| 60 to 89 Minutes | 21 (5.5%) | 13 (3.3%) |
| 90 or more Minutes | 21 (5.5%) | 23 (5.8%) |
Time of Departure to Work by Sex in Vevay
The most frequent times of departure to work in Vevay are 5:00 AM to 5:29 AM (70, 18.4%) for males and 7:00 AM to 7:29 AM (57, 14.4%) for females.
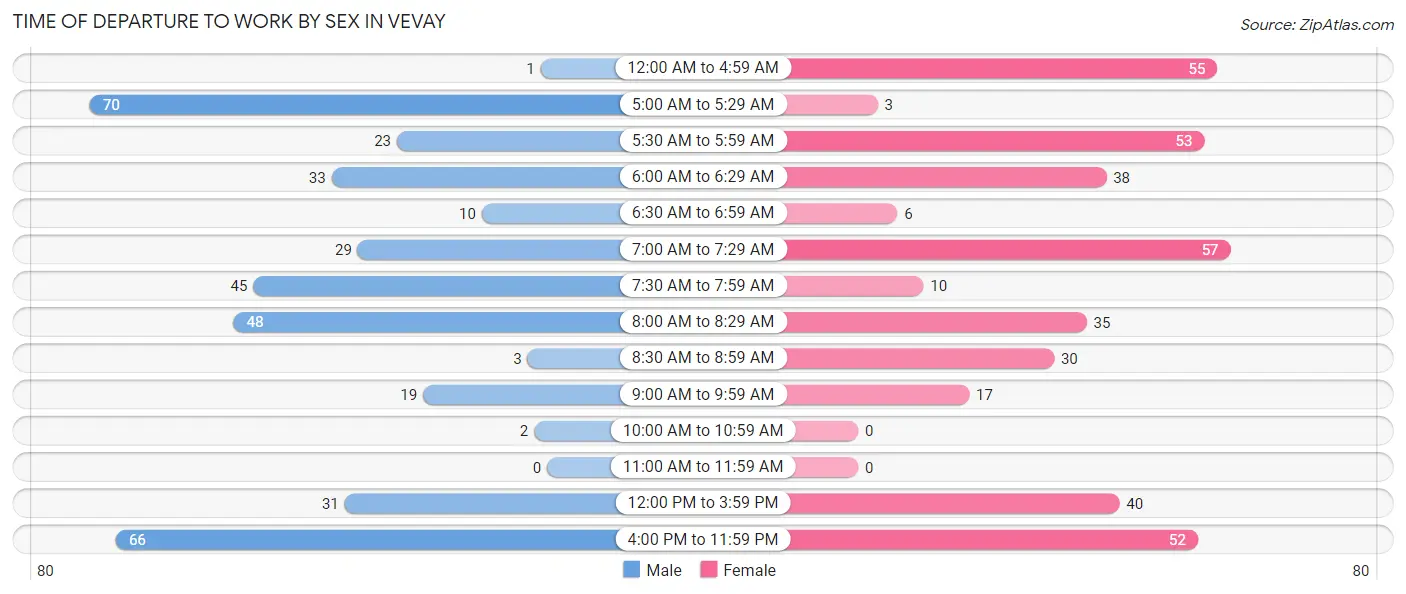
| Time of Departure | Male | Female |
| 12:00 AM to 4:59 AM | 1 (0.3%) | 55 (13.9%) |
| 5:00 AM to 5:29 AM | 70 (18.4%) | 3 (0.8%) |
| 5:30 AM to 5:59 AM | 23 (6.0%) | 53 (13.4%) |
| 6:00 AM to 6:29 AM | 33 (8.7%) | 38 (9.6%) |
| 6:30 AM to 6:59 AM | 10 (2.6%) | 6 (1.5%) |
| 7:00 AM to 7:29 AM | 29 (7.6%) | 57 (14.4%) |
| 7:30 AM to 7:59 AM | 45 (11.8%) | 10 (2.5%) |
| 8:00 AM to 8:29 AM | 48 (12.6%) | 35 (8.8%) |
| 8:30 AM to 8:59 AM | 3 (0.8%) | 30 (7.6%) |
| 9:00 AM to 9:59 AM | 19 (5.0%) | 17 (4.3%) |
| 10:00 AM to 10:59 AM | 2 (0.5%) | 0 (0.0%) |
| 11:00 AM to 11:59 AM | 0 (0.0%) | 0 (0.0%) |
| 12:00 PM to 3:59 PM | 31 (8.2%) | 40 (10.1%) |
| 4:00 PM to 11:59 PM | 66 (17.4%) | 52 (13.1%) |
| Total | 380 (100.0%) | 396 (100.0%) |
Housing Occupancy in Vevay
Occupancy by Ownership in Vevay
Of the total 807 dwellings in Vevay, owner-occupied units account for 391 (48.4%), while renter-occupied units make up 416 (51.5%).
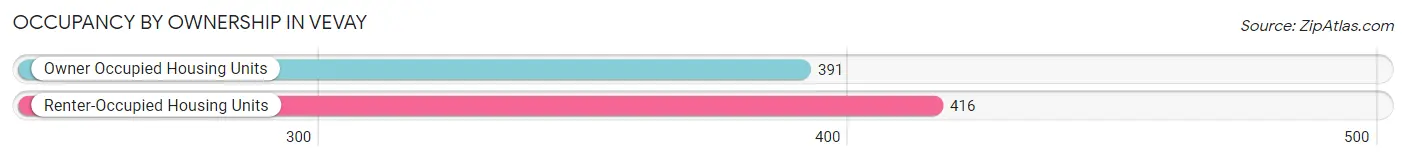
| Occupancy | # Housing Units | % Housing Units |
| Owner Occupied Housing Units | 391 | 48.4% |
| Renter-Occupied Housing Units | 416 | 51.5% |
| Total Occupied Housing Units | 807 | 100.0% |
Occupancy by Household Size in Vevay
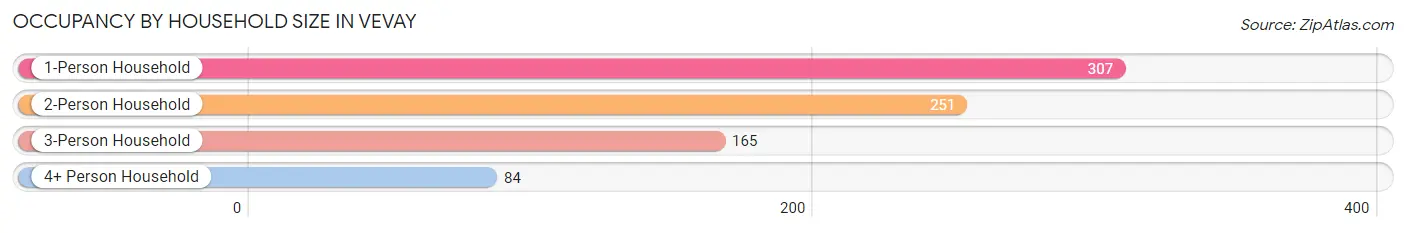
| Household Size | # Housing Units | % Housing Units |
| 1-Person Household | 307 | 38.0% |
| 2-Person Household | 251 | 31.1% |
| 3-Person Household | 165 | 20.4% |
| 4+ Person Household | 84 | 10.4% |
| Total Housing Units | 807 | 100.0% |
Occupancy by Ownership by Household Size in Vevay
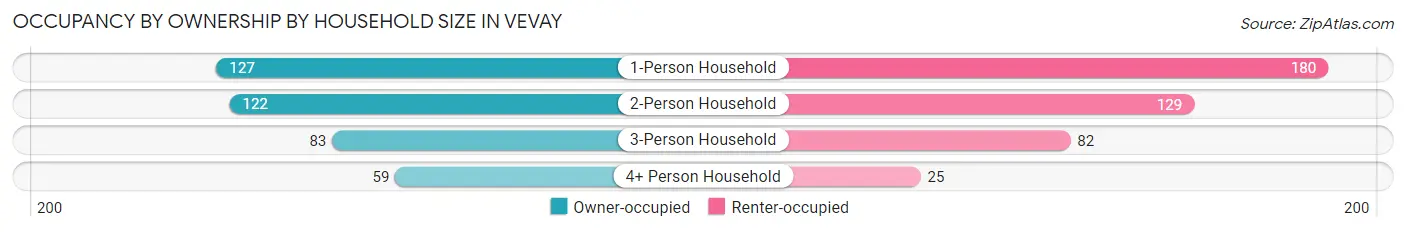
| Household Size | Owner-occupied | Renter-occupied |
| 1-Person Household | 127 (41.4%) | 180 (58.6%) |
| 2-Person Household | 122 (48.6%) | 129 (51.4%) |
| 3-Person Household | 83 (50.3%) | 82 (49.7%) |
| 4+ Person Household | 59 (70.2%) | 25 (29.8%) |
| Total Housing Units | 391 (48.4%) | 416 (51.5%) |
Occupancy by Educational Attainment in Vevay
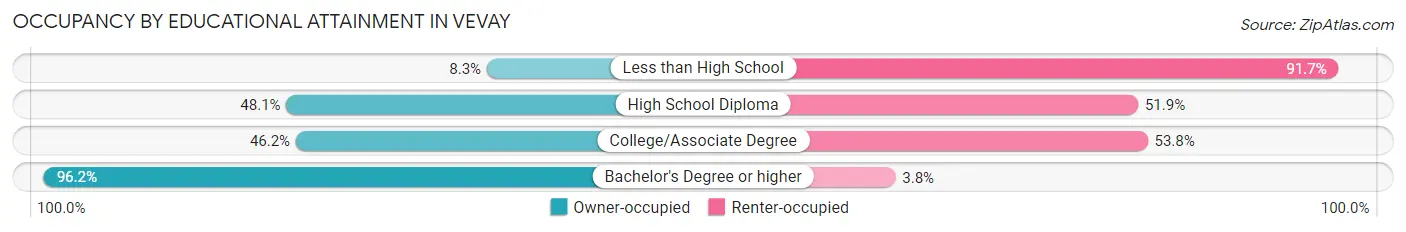
| Household Size | Owner-occupied | Renter-occupied |
| Less than High School | 6 (8.3%) | 66 (91.7%) |
| High School Diploma | 151 (48.1%) | 163 (51.9%) |
| College/Associate Degree | 158 (46.2%) | 184 (53.8%) |
| Bachelor's Degree or higher | 76 (96.2%) | 3 (3.8%) |
Occupancy by Age of Householder in Vevay
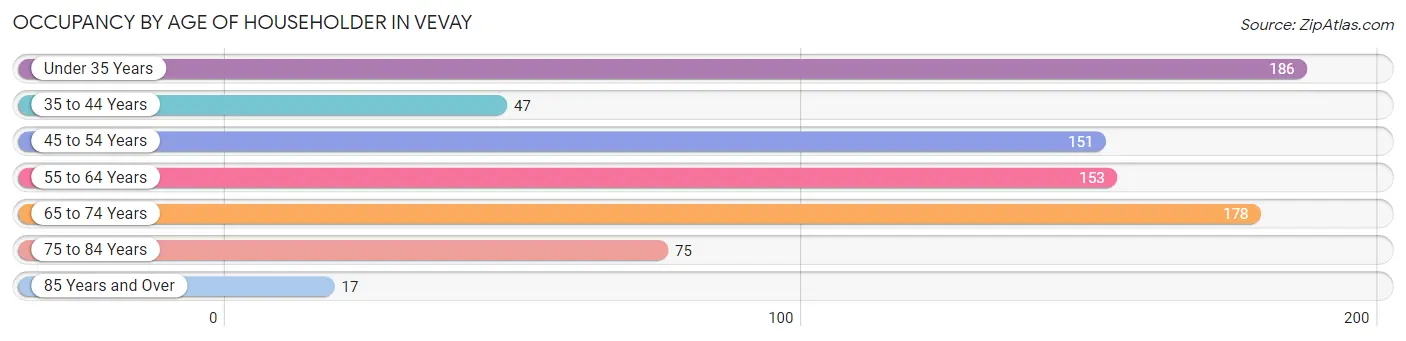
| Age Bracket | # Households | % Households |
| Under 35 Years | 186 | 23.1% |
| 35 to 44 Years | 47 | 5.8% |
| 45 to 54 Years | 151 | 18.7% |
| 55 to 64 Years | 153 | 19.0% |
| 65 to 74 Years | 178 | 22.1% |
| 75 to 84 Years | 75 | 9.3% |
| 85 Years and Over | 17 | 2.1% |
| Total | 807 | 100.0% |
Housing Finances in Vevay
Median Income by Occupancy in Vevay
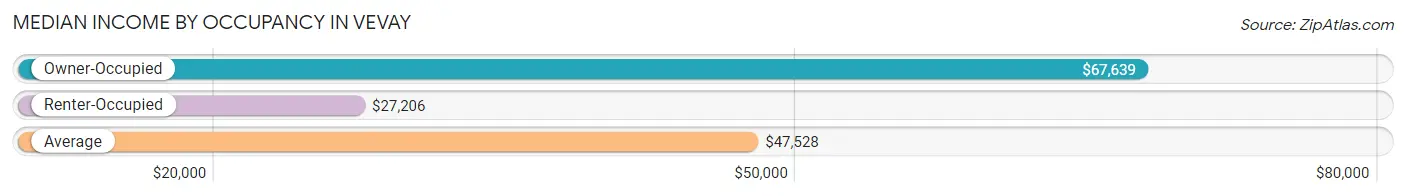
| Occupancy Type | # Households | Median Income |
| Owner-Occupied | 391 (48.4%) | $67,639 |
| Renter-Occupied | 416 (51.5%) | $27,206 |
| Average | 807 (100.0%) | $47,528 |
Occupancy by Householder Income Bracket in Vevay
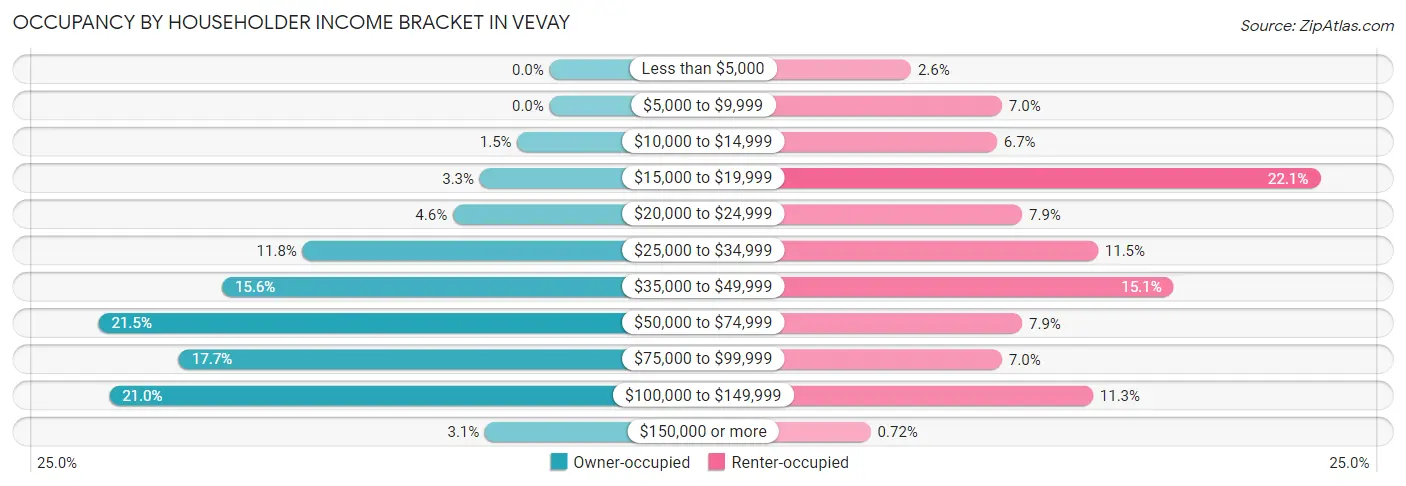
| Income Bracket | Owner-occupied | Renter-occupied |
| Less than $5,000 | 0 (0.0%) | 11 (2.6%) |
| $5,000 to $9,999 | 0 (0.0%) | 29 (7.0%) |
| $10,000 to $14,999 | 6 (1.5%) | 28 (6.7%) |
| $15,000 to $19,999 | 13 (3.3%) | 92 (22.1%) |
| $20,000 to $24,999 | 18 (4.6%) | 33 (7.9%) |
| $25,000 to $34,999 | 46 (11.8%) | 48 (11.5%) |
| $35,000 to $49,999 | 61 (15.6%) | 63 (15.1%) |
| $50,000 to $74,999 | 84 (21.5%) | 33 (7.9%) |
| $75,000 to $99,999 | 69 (17.6%) | 29 (7.0%) |
| $100,000 to $149,999 | 82 (21.0%) | 47 (11.3%) |
| $150,000 or more | 12 (3.1%) | 3 (0.7%) |
| Total | 391 (100.0%) | 416 (100.0%) |
Monthly Housing Cost Tiers in Vevay
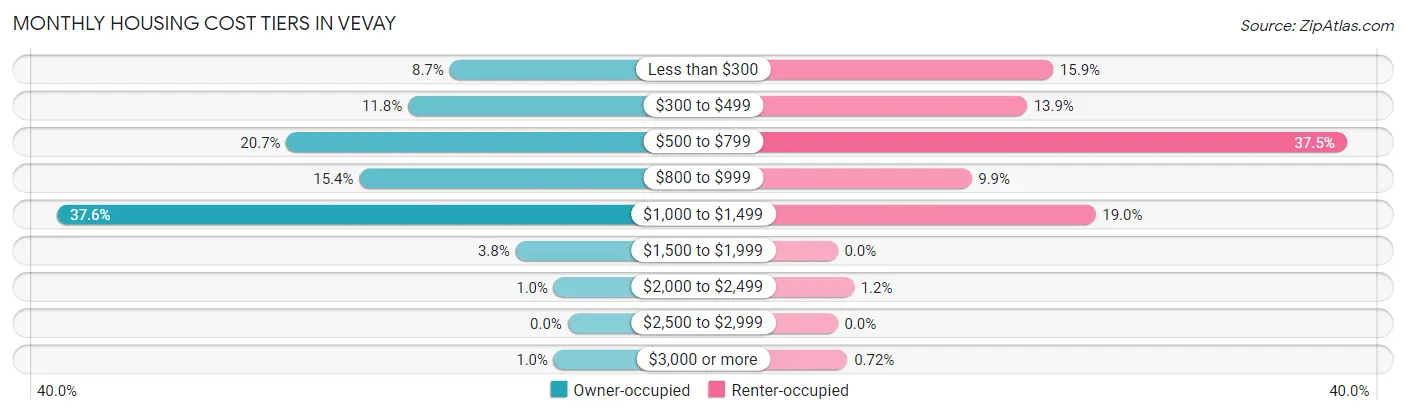
| Monthly Cost | Owner-occupied | Renter-occupied |
| Less than $300 | 34 (8.7%) | 66 (15.9%) |
| $300 to $499 | 46 (11.8%) | 58 (13.9%) |
| $500 to $799 | 81 (20.7%) | 156 (37.5%) |
| $800 to $999 | 60 (15.3%) | 41 (9.9%) |
| $1,000 to $1,499 | 147 (37.6%) | 79 (19.0%) |
| $1,500 to $1,999 | 15 (3.8%) | 0 (0.0%) |
| $2,000 to $2,499 | 4 (1.0%) | 5 (1.2%) |
| $2,500 to $2,999 | 0 (0.0%) | 0 (0.0%) |
| $3,000 or more | 4 (1.0%) | 3 (0.7%) |
| Total | 391 (100.0%) | 416 (100.0%) |
Physical Housing Characteristics in Vevay
Housing Structures in Vevay
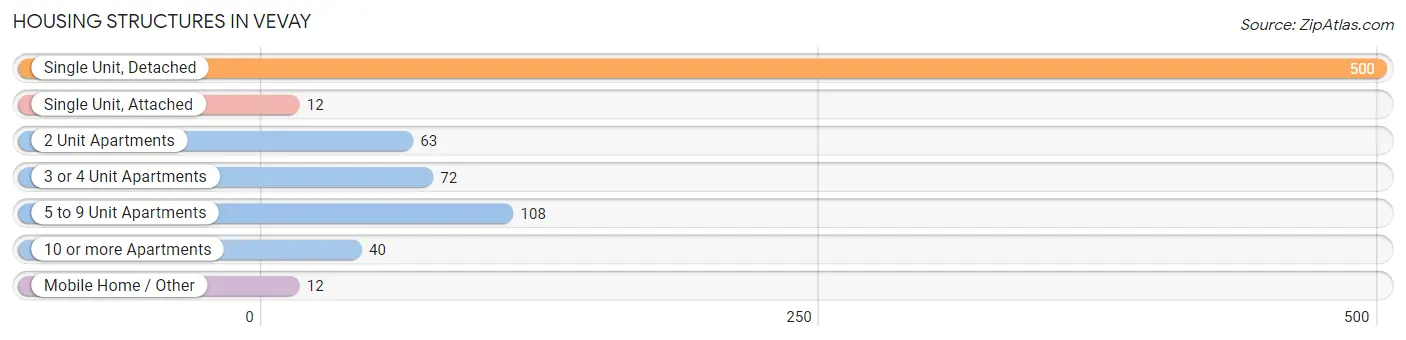
| Structure Type | # Housing Units | % Housing Units |
| Single Unit, Detached | 500 | 62.0% |
| Single Unit, Attached | 12 | 1.5% |
| 2 Unit Apartments | 63 | 7.8% |
| 3 or 4 Unit Apartments | 72 | 8.9% |
| 5 to 9 Unit Apartments | 108 | 13.4% |
| 10 or more Apartments | 40 | 5.0% |
| Mobile Home / Other | 12 | 1.5% |
| Total | 807 | 100.0% |
Housing Structures by Occupancy in Vevay
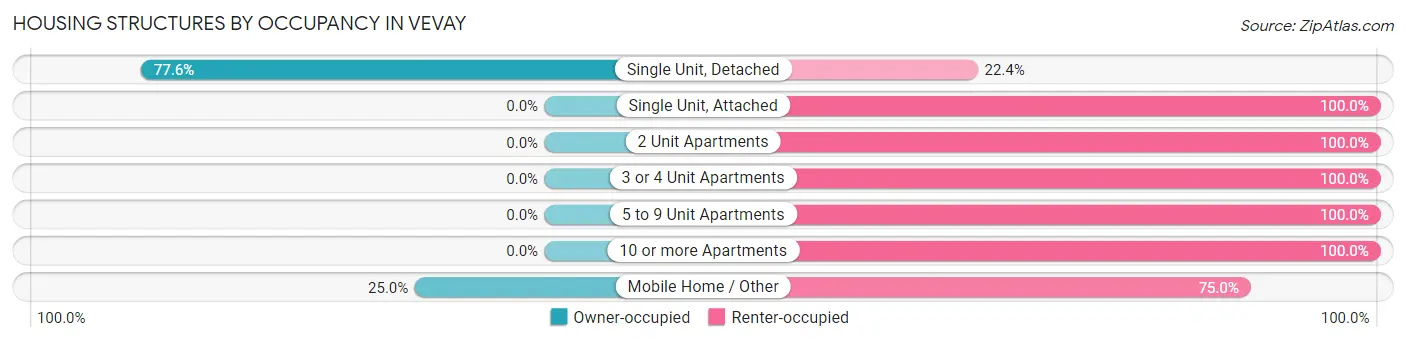
| Structure Type | Owner-occupied | Renter-occupied |
| Single Unit, Detached | 388 (77.6%) | 112 (22.4%) |
| Single Unit, Attached | 0 (0.0%) | 12 (100.0%) |
| 2 Unit Apartments | 0 (0.0%) | 63 (100.0%) |
| 3 or 4 Unit Apartments | 0 (0.0%) | 72 (100.0%) |
| 5 to 9 Unit Apartments | 0 (0.0%) | 108 (100.0%) |
| 10 or more Apartments | 0 (0.0%) | 40 (100.0%) |
| Mobile Home / Other | 3 (25.0%) | 9 (75.0%) |
| Total | 391 (48.4%) | 416 (51.5%) |
Housing Structures by Number of Rooms in Vevay
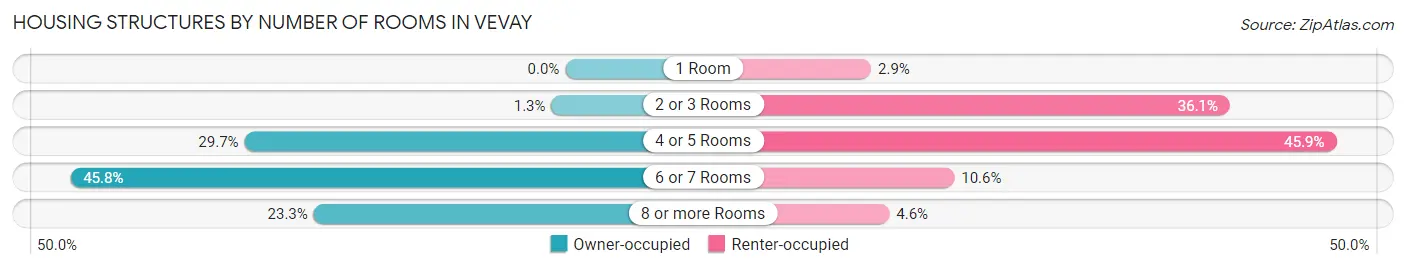
| Number of Rooms | Owner-occupied | Renter-occupied |
| 1 Room | 0 (0.0%) | 12 (2.9%) |
| 2 or 3 Rooms | 5 (1.3%) | 150 (36.1%) |
| 4 or 5 Rooms | 116 (29.7%) | 191 (45.9%) |
| 6 or 7 Rooms | 179 (45.8%) | 44 (10.6%) |
| 8 or more Rooms | 91 (23.3%) | 19 (4.6%) |
| Total | 391 (100.0%) | 416 (100.0%) |
Housing Structure by Heating Type in Vevay
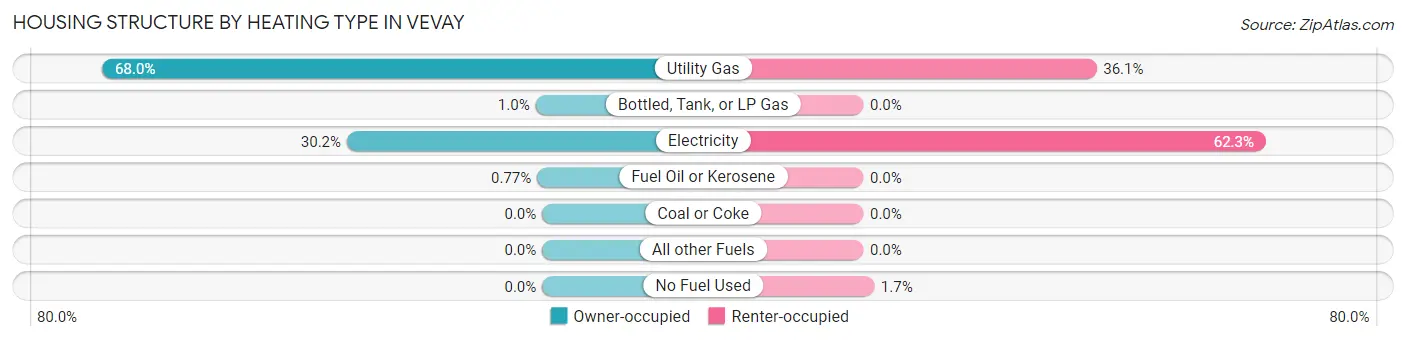
| Heating Type | Owner-occupied | Renter-occupied |
| Utility Gas | 266 (68.0%) | 150 (36.1%) |
| Bottled, Tank, or LP Gas | 4 (1.0%) | 0 (0.0%) |
| Electricity | 118 (30.2%) | 259 (62.3%) |
| Fuel Oil or Kerosene | 3 (0.8%) | 0 (0.0%) |
| Coal or Coke | 0 (0.0%) | 0 (0.0%) |
| All other Fuels | 0 (0.0%) | 0 (0.0%) |
| No Fuel Used | 0 (0.0%) | 7 (1.7%) |
| Total | 391 (100.0%) | 416 (100.0%) |
Household Vehicle Usage in Vevay
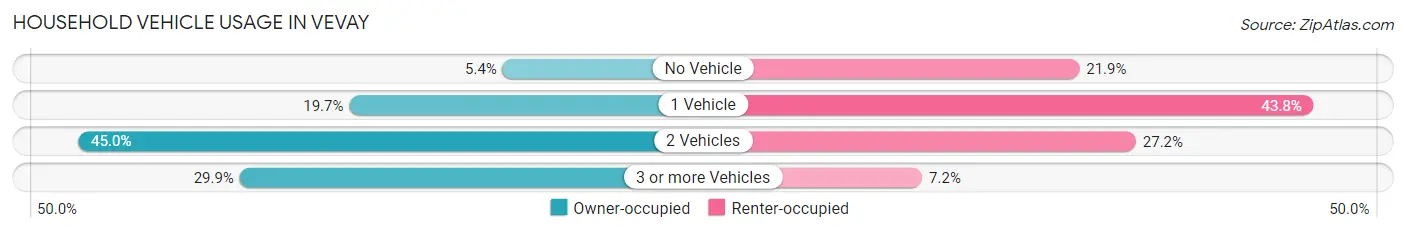
| Vehicles per Household | Owner-occupied | Renter-occupied |
| No Vehicle | 21 (5.4%) | 91 (21.9%) |
| 1 Vehicle | 77 (19.7%) | 182 (43.8%) |
| 2 Vehicles | 176 (45.0%) | 113 (27.2%) |
| 3 or more Vehicles | 117 (29.9%) | 30 (7.2%) |
| Total | 391 (100.0%) | 416 (100.0%) |
Real Estate & Mortgages in Vevay
Real Estate and Mortgage Overview in Vevay
| Characteristic | Without Mortgage | With Mortgage |
| Housing Units | 99 | 292 |
| Median Property Value | $108,500 | $152,200 |
| Median Household Income | $41,563 | $12 |
| Monthly Housing Costs | $343 | $4 |
| Real Estate Taxes | $630 | $15 |
Property Value by Mortgage Status in Vevay
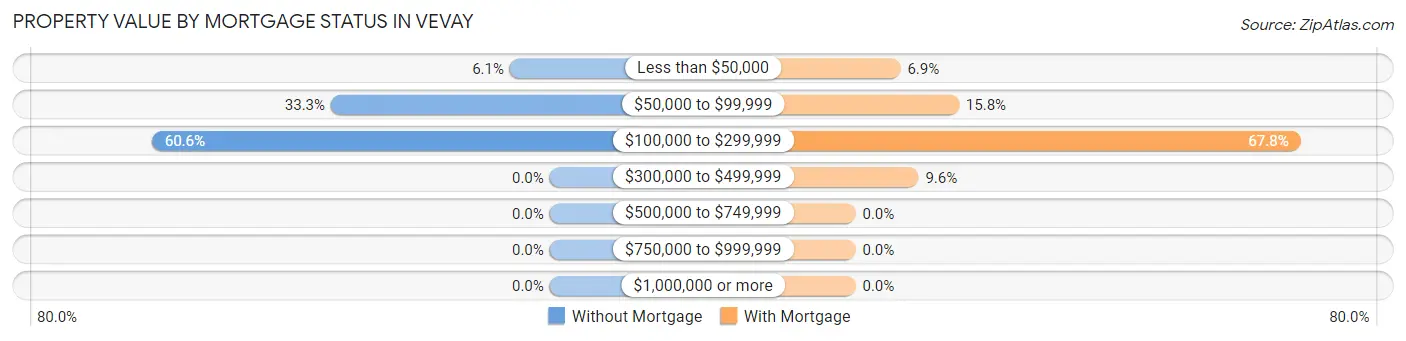
| Property Value | Without Mortgage | With Mortgage |
| Less than $50,000 | 6 (6.1%) | 20 (6.9%) |
| $50,000 to $99,999 | 33 (33.3%) | 46 (15.8%) |
| $100,000 to $299,999 | 60 (60.6%) | 198 (67.8%) |
| $300,000 to $499,999 | 0 (0.0%) | 28 (9.6%) |
| $500,000 to $749,999 | 0 (0.0%) | 0 (0.0%) |
| $750,000 to $999,999 | 0 (0.0%) | 0 (0.0%) |
| $1,000,000 or more | 0 (0.0%) | 0 (0.0%) |
| Total | 99 (100.0%) | 292 (100.0%) |
Household Income by Mortgage Status in Vevay
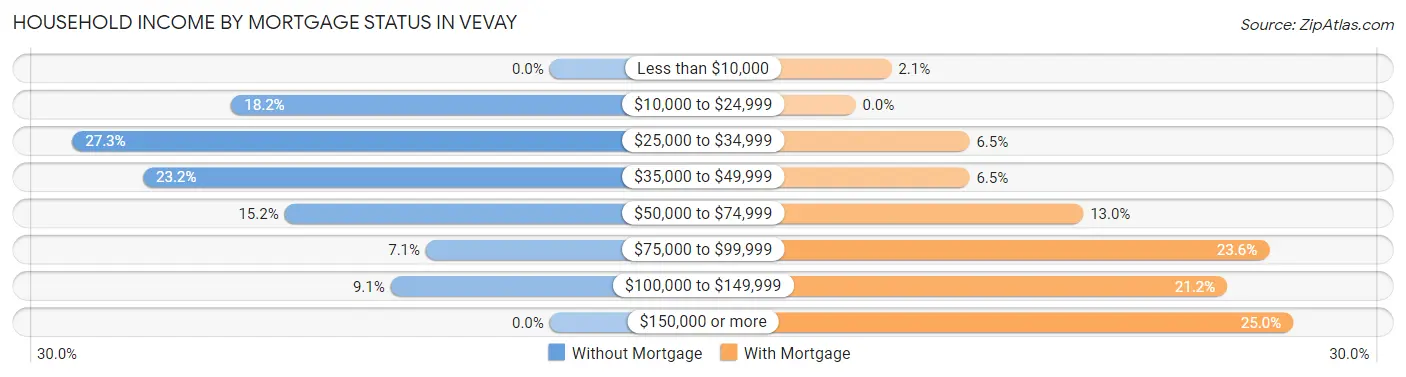
| Household Income | Without Mortgage | With Mortgage |
| Less than $10,000 | 0 (0.0%) | 6 (2.1%) |
| $10,000 to $24,999 | 18 (18.2%) | 0 (0.0%) |
| $25,000 to $34,999 | 27 (27.3%) | 19 (6.5%) |
| $35,000 to $49,999 | 23 (23.2%) | 19 (6.5%) |
| $50,000 to $74,999 | 15 (15.1%) | 38 (13.0%) |
| $75,000 to $99,999 | 7 (7.1%) | 69 (23.6%) |
| $100,000 to $149,999 | 9 (9.1%) | 62 (21.2%) |
| $150,000 or more | 0 (0.0%) | 73 (25.0%) |
| Total | 99 (100.0%) | 292 (100.0%) |
Property Value to Household Income Ratio in Vevay
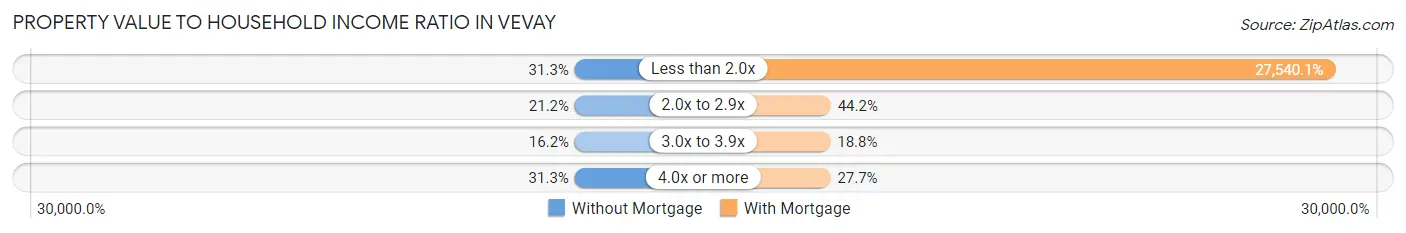
| Value-to-Income Ratio | Without Mortgage | With Mortgage |
| Less than 2.0x | 31 (31.3%) | 80,417 (27,540.1%) |
| 2.0x to 2.9x | 21 (21.2%) | 129 (44.2%) |
| 3.0x to 3.9x | 16 (16.2%) | 55 (18.8%) |
| 4.0x or more | 31 (31.3%) | 81 (27.7%) |
| Total | 99 (100.0%) | 292 (100.0%) |
Real Estate Taxes by Mortgage Status in Vevay
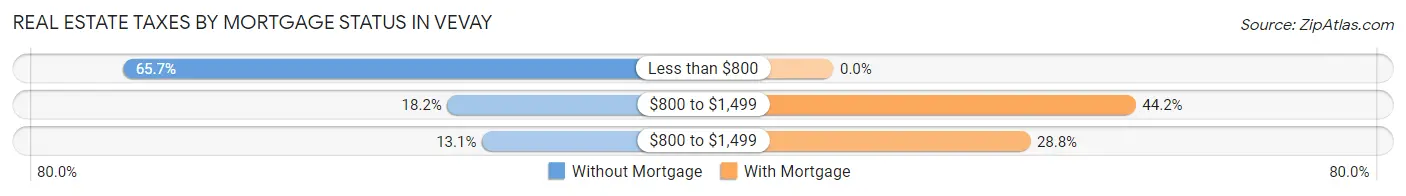
| Property Taxes | Without Mortgage | With Mortgage |
| Less than $800 | 65 (65.7%) | 0 (0.0%) |
| $800 to $1,499 | 18 (18.2%) | 129 (44.2%) |
| $800 to $1,499 | 13 (13.1%) | 84 (28.8%) |
| Total | 99 (100.0%) | 292 (100.0%) |
Health & Disability in Vevay
Health Insurance Coverage by Age in Vevay
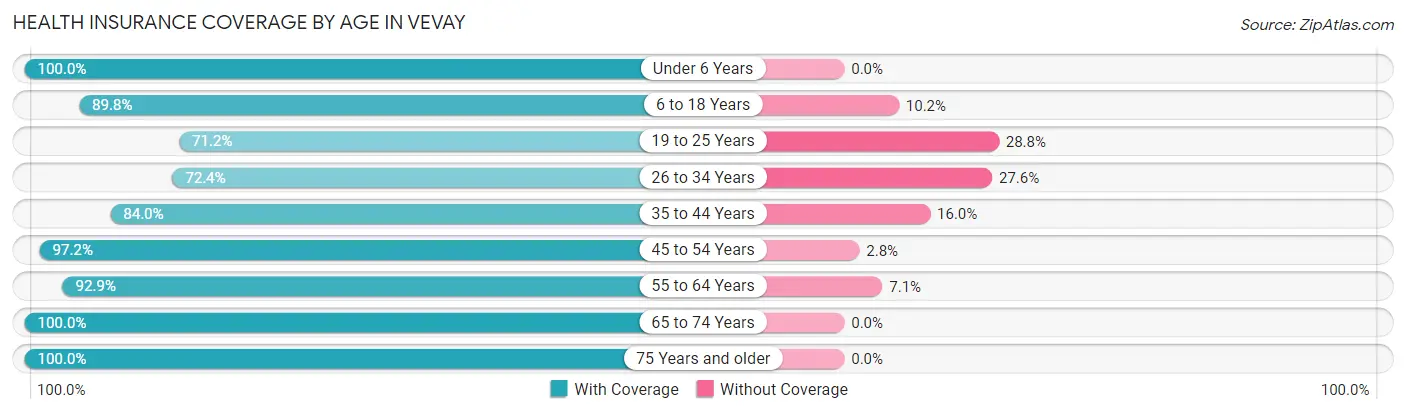
| Age Bracket | With Coverage | Without Coverage |
| Under 6 Years | 205 (100.0%) | 0 (0.0%) |
| 6 to 18 Years | 159 (89.8%) | 18 (10.2%) |
| 19 to 25 Years | 173 (71.2%) | 70 (28.8%) |
| 26 to 34 Years | 113 (72.4%) | 43 (27.6%) |
| 35 to 44 Years | 105 (84.0%) | 20 (16.0%) |
| 45 to 54 Years | 242 (97.2%) | 7 (2.8%) |
| 55 to 64 Years | 275 (92.9%) | 21 (7.1%) |
| 65 to 74 Years | 216 (100.0%) | 0 (0.0%) |
| 75 Years and older | 121 (100.0%) | 0 (0.0%) |
| Total | 1,609 (90.0%) | 179 (10.0%) |
Health Insurance Coverage by Citizenship Status in Vevay
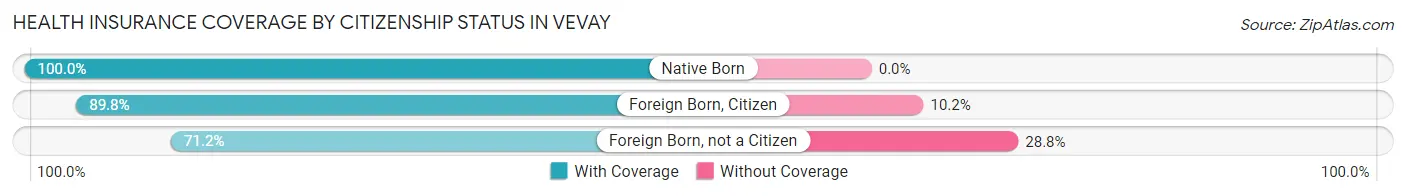
| Citizenship Status | With Coverage | Without Coverage |
| Native Born | 205 (100.0%) | 0 (0.0%) |
| Foreign Born, Citizen | 159 (89.8%) | 18 (10.2%) |
| Foreign Born, not a Citizen | 173 (71.2%) | 70 (28.8%) |
Health Insurance Coverage by Household Income in Vevay
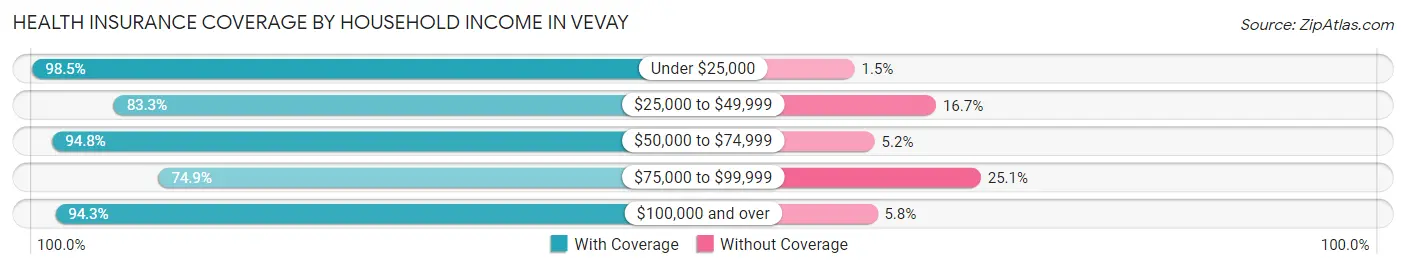
| Household Income | With Coverage | Without Coverage |
| Under $25,000 | 337 (98.5%) | 5 (1.5%) |
| $25,000 to $49,999 | 344 (83.3%) | 69 (16.7%) |
| $50,000 to $74,999 | 254 (94.8%) | 14 (5.2%) |
| $75,000 to $99,999 | 182 (74.9%) | 61 (25.1%) |
| $100,000 and over | 492 (94.3%) | 30 (5.8%) |
Public vs Private Health Insurance Coverage by Age in Vevay
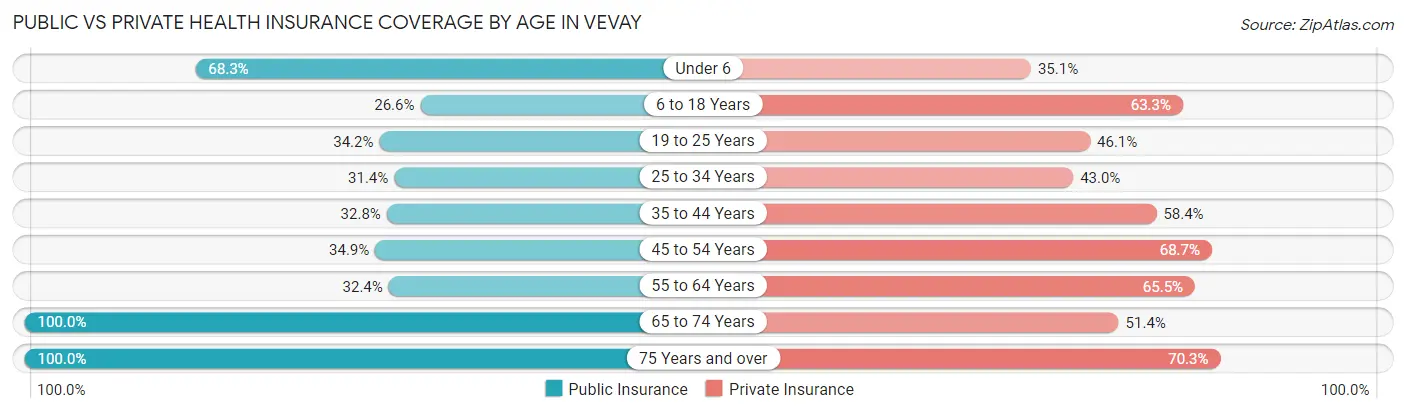
| Age Bracket | Public Insurance | Private Insurance |
| Under 6 | 140 (68.3%) | 72 (35.1%) |
| 6 to 18 Years | 47 (26.6%) | 112 (63.3%) |
| 19 to 25 Years | 83 (34.2%) | 112 (46.1%) |
| 25 to 34 Years | 49 (31.4%) | 67 (42.9%) |
| 35 to 44 Years | 41 (32.8%) | 73 (58.4%) |
| 45 to 54 Years | 87 (34.9%) | 171 (68.7%) |
| 55 to 64 Years | 96 (32.4%) | 194 (65.5%) |
| 65 to 74 Years | 216 (100.0%) | 111 (51.4%) |
| 75 Years and over | 121 (100.0%) | 85 (70.3%) |
| Total | 880 (49.2%) | 997 (55.8%) |
Disability Status by Sex by Age in Vevay
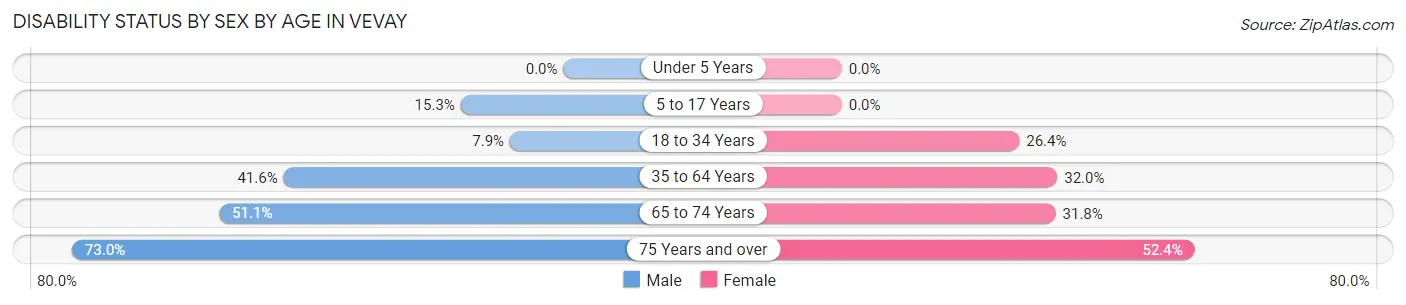
| Age Bracket | Male | Female |
| Under 5 Years | 0 (0.0%) | 0 (0.0%) |
| 5 to 17 Years | 18 (15.2%) | 0 (0.0%) |
| 18 to 34 Years | 13 (7.9%) | 63 (26.4%) |
| 35 to 64 Years | 133 (41.6%) | 112 (32.0%) |
| 65 to 74 Years | 46 (51.1%) | 40 (31.8%) |
| 75 Years and over | 27 (73.0%) | 44 (52.4%) |
Disability Class by Sex by Age in Vevay
Disability Class: Hearing Difficulty
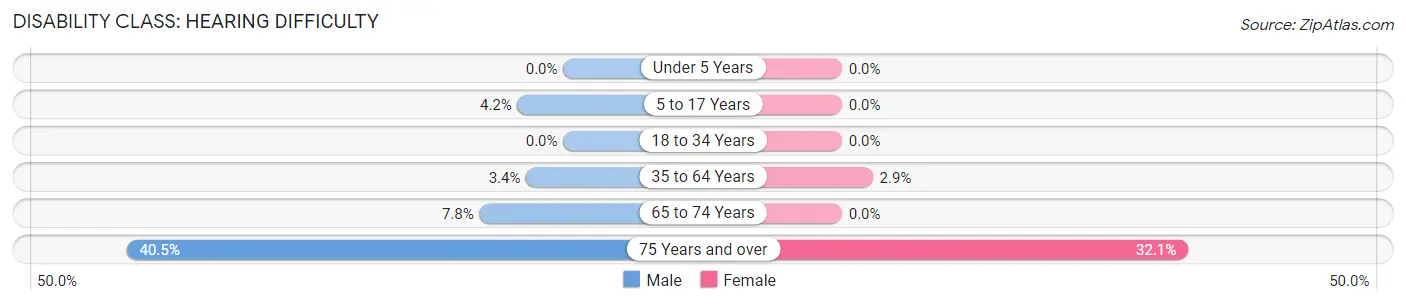
| Age Bracket | Male | Female |
| Under 5 Years | 0 (0.0%) | 0 (0.0%) |
| 5 to 17 Years | 5 (4.2%) | 0 (0.0%) |
| 18 to 34 Years | 0 (0.0%) | 0 (0.0%) |
| 35 to 64 Years | 11 (3.4%) | 10 (2.9%) |
| 65 to 74 Years | 7 (7.8%) | 0 (0.0%) |
| 75 Years and over | 15 (40.5%) | 27 (32.1%) |
Disability Class: Vision Difficulty
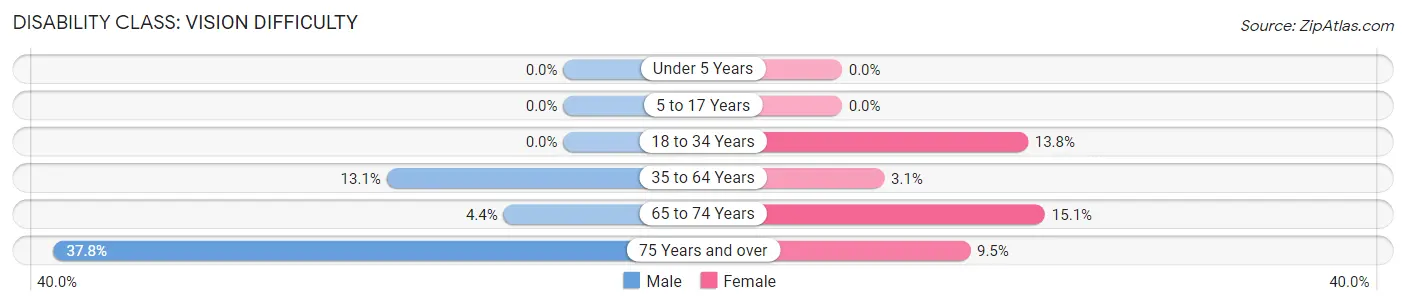
| Age Bracket | Male | Female |
| Under 5 Years | 0 (0.0%) | 0 (0.0%) |
| 5 to 17 Years | 0 (0.0%) | 0 (0.0%) |
| 18 to 34 Years | 0 (0.0%) | 33 (13.8%) |
| 35 to 64 Years | 42 (13.1%) | 11 (3.1%) |
| 65 to 74 Years | 4 (4.4%) | 19 (15.1%) |
| 75 Years and over | 14 (37.8%) | 8 (9.5%) |
Disability Class: Cognitive Difficulty
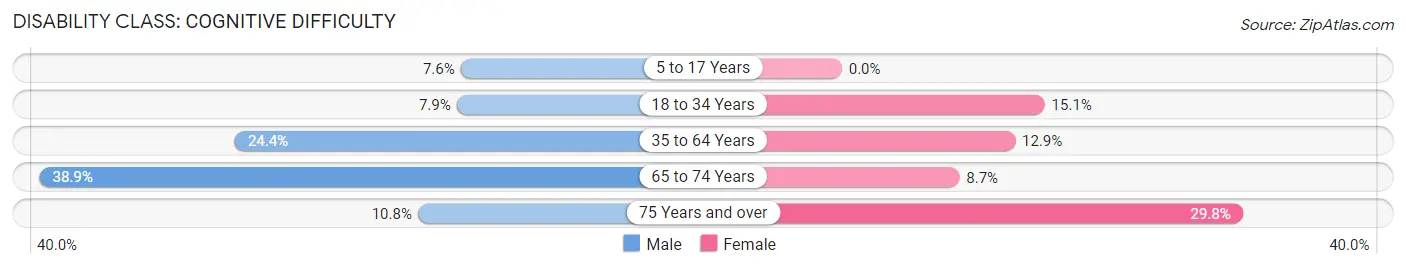
| Age Bracket | Male | Female |
| 5 to 17 Years | 9 (7.6%) | 0 (0.0%) |
| 18 to 34 Years | 13 (7.9%) | 36 (15.1%) |
| 35 to 64 Years | 78 (24.4%) | 45 (12.9%) |
| 65 to 74 Years | 35 (38.9%) | 11 (8.7%) |
| 75 Years and over | 4 (10.8%) | 25 (29.8%) |
Disability Class: Ambulatory Difficulty
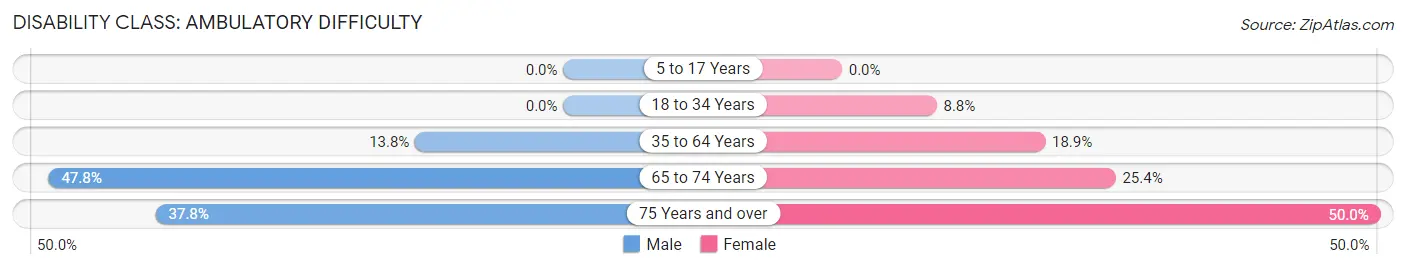
| Age Bracket | Male | Female |
| 5 to 17 Years | 0 (0.0%) | 0 (0.0%) |
| 18 to 34 Years | 0 (0.0%) | 21 (8.8%) |
| 35 to 64 Years | 44 (13.8%) | 66 (18.9%) |
| 65 to 74 Years | 43 (47.8%) | 32 (25.4%) |
| 75 Years and over | 14 (37.8%) | 42 (50.0%) |
Disability Class: Self-Care Difficulty
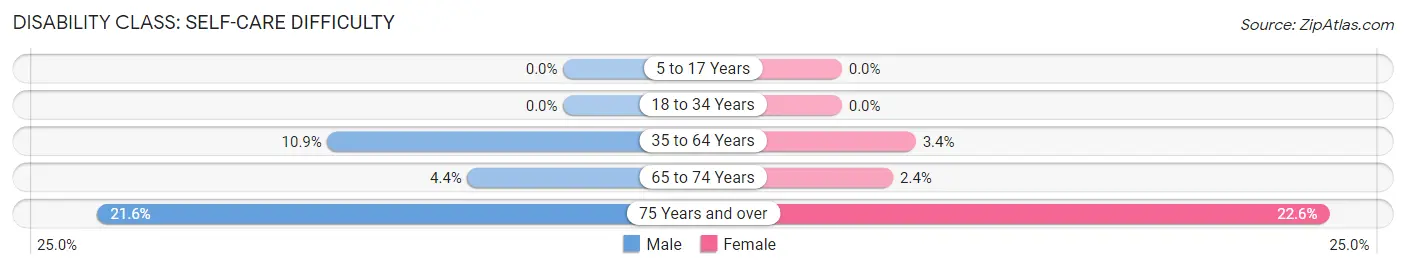
| Age Bracket | Male | Female |
| 5 to 17 Years | 0 (0.0%) | 0 (0.0%) |
| 18 to 34 Years | 0 (0.0%) | 0 (0.0%) |
| 35 to 64 Years | 35 (10.9%) | 12 (3.4%) |
| 65 to 74 Years | 4 (4.4%) | 3 (2.4%) |
| 75 Years and over | 8 (21.6%) | 19 (22.6%) |
Technology Access in Vevay
Computing Device Access in Vevay
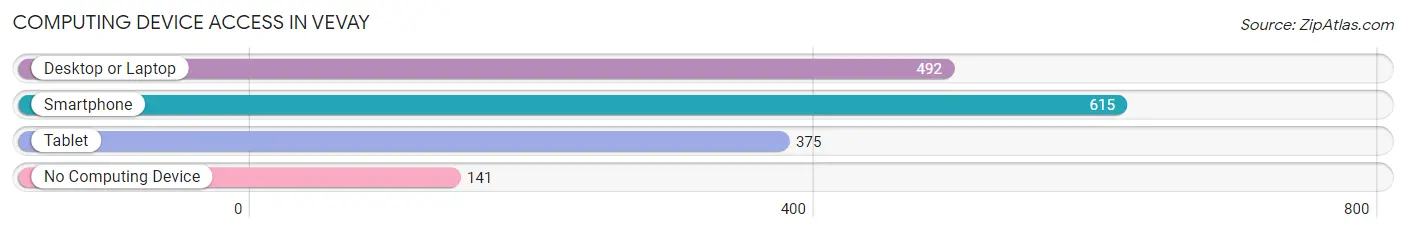
| Device Type | # Households | % Households |
| Desktop or Laptop | 492 | 61.0% |
| Smartphone | 615 | 76.2% |
| Tablet | 375 | 46.5% |
| No Computing Device | 141 | 17.5% |
| Total | 807 | 100.0% |
Internet Access in Vevay
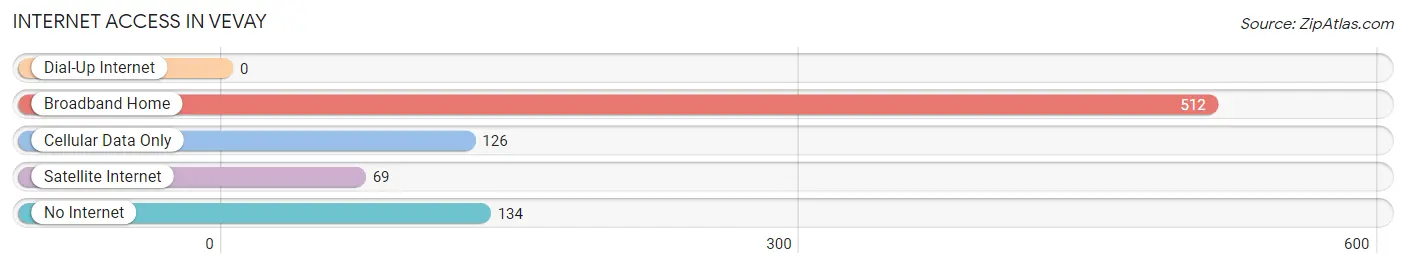
| Internet Type | # Households | % Households |
| Dial-Up Internet | 0 | 0.0% |
| Broadband Home | 512 | 63.4% |
| Cellular Data Only | 126 | 15.6% |
| Satellite Internet | 69 | 8.6% |
| No Internet | 134 | 16.6% |
| Total | 807 | 100.0% |
Vevay Summary
Vevay, Indiana is a small town located in Switzerland County, Indiana. It is situated on the banks of the Ohio River and is the county seat of Switzerland County. The town was founded in 1813 and is named after the Swiss city of Vevey. The population of Vevay was 1,683 at the 2010 census.
History
Vevay was founded in 1813 by a group of Swiss immigrants led by Colonel William Jones. The town was named after the Swiss city of Vevey, and the settlers were hoping to recreate the same atmosphere of their homeland. The town was laid out in a grid pattern, with the main street running east and west. The town was incorporated in 1818 and the first post office was established in 1819.
The town quickly became a center of commerce and industry, with the first steamboat arriving in 1820. The steamboat brought goods from Cincinnati and Louisville, and the town soon became a major port on the Ohio River. The town also became a center of the wine industry, with several wineries being established in the area.
In 1844, the first railroad line was built through Vevay, connecting it to Cincinnati and Louisville. This allowed the town to become even more connected to the rest of the country, and it soon became a popular tourist destination.
Geography
Vevay is located in Switzerland County, Indiana, on the banks of the Ohio River. The town is situated at an elevation of 545 feet above sea level. The town is located about 40 miles southeast of Indianapolis and about 60 miles northwest of Cincinnati.
The town is surrounded by rolling hills and farmland, and is located in a temperate climate zone. The average temperature in the summer is around 75 degrees Fahrenheit, and the average temperature in the winter is around 35 degrees Fahrenheit.
Economy
The economy of Vevay is largely based on agriculture and tourism. The town is home to several wineries, and the wine industry is a major part of the local economy. The town is also home to several small businesses, including restaurants, shops, and other services.
The town is also home to several manufacturing companies, including a plastics factory and a furniture factory. The town is also home to a large number of antique stores, which attract tourists from all over the country.
Demographics
As of the 2010 census, the population of Vevay was 1,683. The racial makeup of the town was 97.3% White, 0.7% African American, 0.2% Native American, 0.2% Asian, 0.1% Pacific Islander, 0.3% from other races, and 1.3% from two or more races. Hispanic or Latino of any race were 1.2% of the population.
The median income for a household in Vevay was $37,500, and the median income for a family was $45,000. The per capita income for the town was $19,845. About 11.2% of families and 14.2% of the population were below the poverty line, including 18.2% of those under age 18 and 8.3% of those age 65 or over.
Common Questions
What is Per Capita Income in Vevay?
Per Capita income in Vevay is $26,324.
What is the Median Family Income in Vevay?
Median Family Income in Vevay is $58,750.
What is the Median Household income in Vevay?
Median Household Income in Vevay is $47,528.
What is Income or Wage Gap in Vevay?
Income or Wage Gap in Vevay is 17.6%.
Women in Vevay earn 82.4 cents for every dollar earned by a man.
What is Family Income Deficit in Vevay?
Family Income Deficit in Vevay is $11,406.
Families that are below poverty line in Vevay earn $11,406 less on average than the poverty threshold level.
What is Inequality or Gini Index in Vevay?
Inequality or Gini Index in Vevay is 0.40.
What is the Total Population of Vevay?
Total Population of Vevay is 1,889.
What is the Total Male Population of Vevay?
Total Male Population of Vevay is 873.
What is the Total Female Population of Vevay?
Total Female Population of Vevay is 1,016.
What is the Ratio of Males per 100 Females in Vevay?
There are 85.93 Males per 100 Females in Vevay.
What is the Ratio of Females per 100 Males in Vevay?
There are 116.38 Females per 100 Males in Vevay.
What is the Median Population Age in Vevay?
Median Population Age in Vevay is 45.5 Years.
What is the Average Family Size in Vevay
Average Family Size in Vevay is 3.0 People.
What is the Average Household Size in Vevay
Average Household Size in Vevay is 2.2 People.
How Large is the Labor Force in Vevay?
There are 844 People in the Labor Forcein in Vevay.
What is the Percentage of People in the Labor Force in Vevay?
54.1% of People are in the Labor Force in Vevay.
What is the Unemployment Rate in Vevay?
Unemployment Rate in Vevay is 3.9%.