Spring Grove, IN Map & Demographics
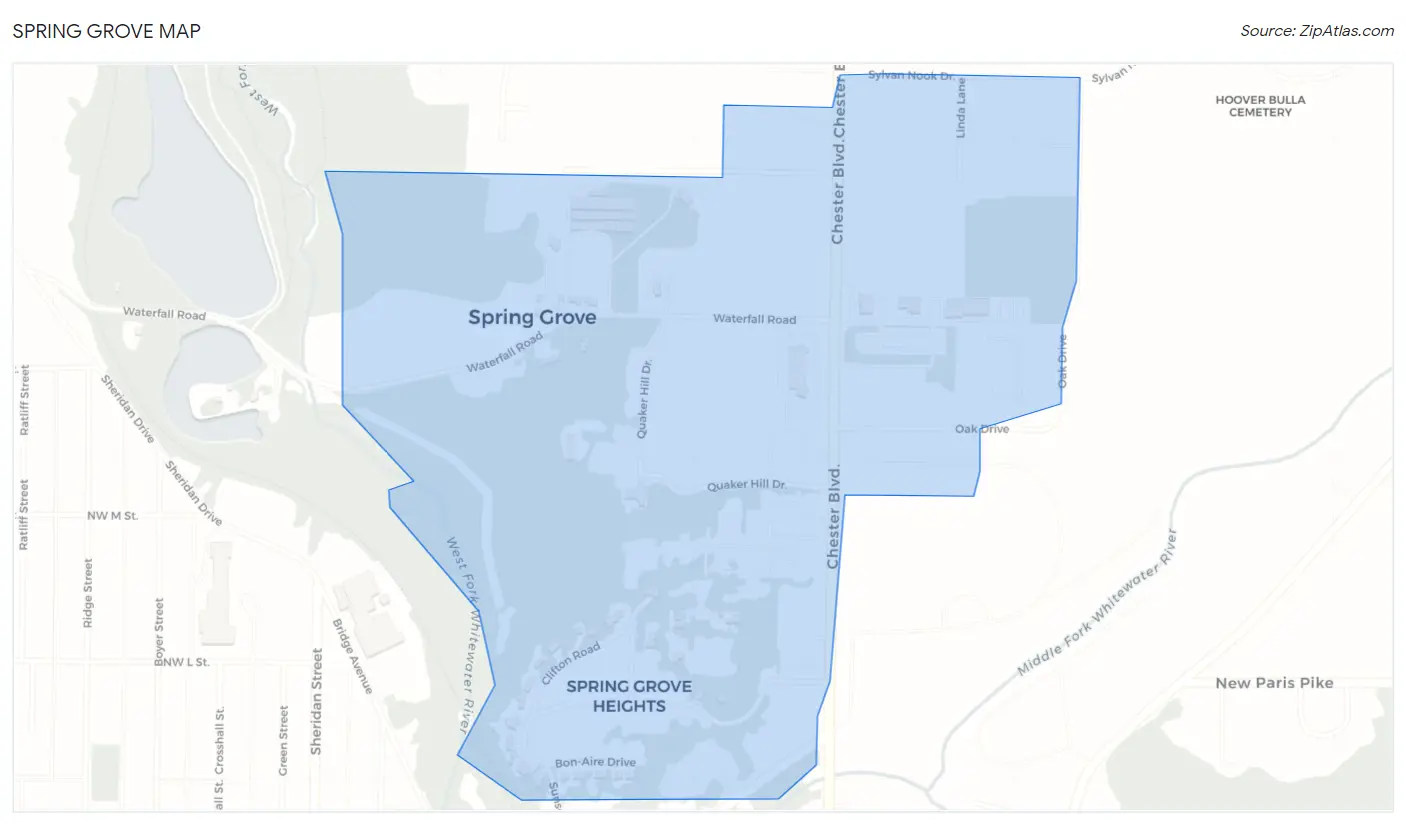
Spring Grove Map
Spring Grove Overview
$29,757
PER CAPITA INCOME
$56,250
AVG FAMILY INCOME
$40,000
AVG HOUSEHOLD INCOME
64.8%
WAGE / INCOME GAP [ % ]
35.2¢/ $1
WAGE / INCOME GAP [ $ ]
0.52
INEQUALITY / GINI INDEX
427
TOTAL POPULATION
160
MALE POPULATION
267
FEMALE POPULATION
59.93
MALES / 100 FEMALES
166.88
FEMALES / 100 MALES
48.5
MEDIAN AGE
2.4
AVG FAMILY SIZE
1.9
AVG HOUSEHOLD SIZE
186
LABOR FORCE [ PEOPLE ]
49.6%
PERCENT IN LABOR FORCE
5.4%
UNEMPLOYMENT RATE
Income in Spring Grove
Income Overview in Spring Grove
Per Capita Income in Spring Grove is $29,757, while median incomes of families and households are $56,250 and $40,000 respectively.
| Characteristic | Number | Measure |
| Per Capita Income | 427 | $29,757 |
| Median Family Income | 122 | $56,250 |
| Mean Family Income | 122 | $76,212 |
| Median Household Income | 182 | $40,000 |
| Mean Household Income | 182 | $64,485 |
| Income Deficit | 122 | $0 |
| Wage / Income Gap (%) | 427 | 64.84% |
| Wage / Income Gap ($) | 427 | 35.16¢ per $1 |
| Gini / Inequality Index | 427 | 0.52 |
Earnings by Sex in Spring Grove
Average Earnings in Spring Grove are $21,429, $53,333 for men and $18,750 for women, a difference of 64.8%.
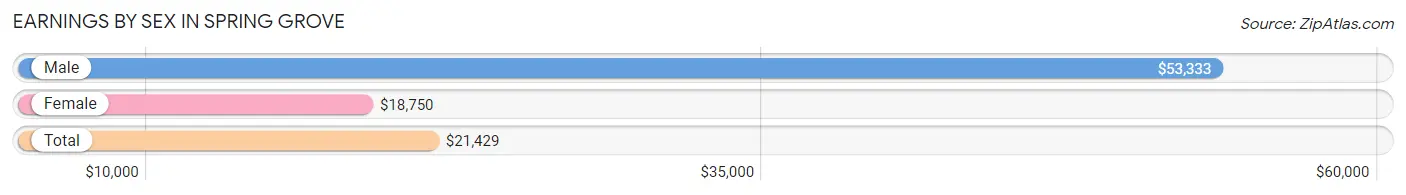
| Sex | Number | Average Earnings |
| Male | 84 (42.0%) | $53,333 |
| Female | 116 (58.0%) | $18,750 |
| Total | 200 (100.0%) | $21,429 |
Earnings by Sex by Income Bracket in Spring Grove
The most common earnings brackets in Spring Grove are $100,000+ for men (17 | 20.2%) and $17,500 to $19,999 for women (40 | 34.5%).
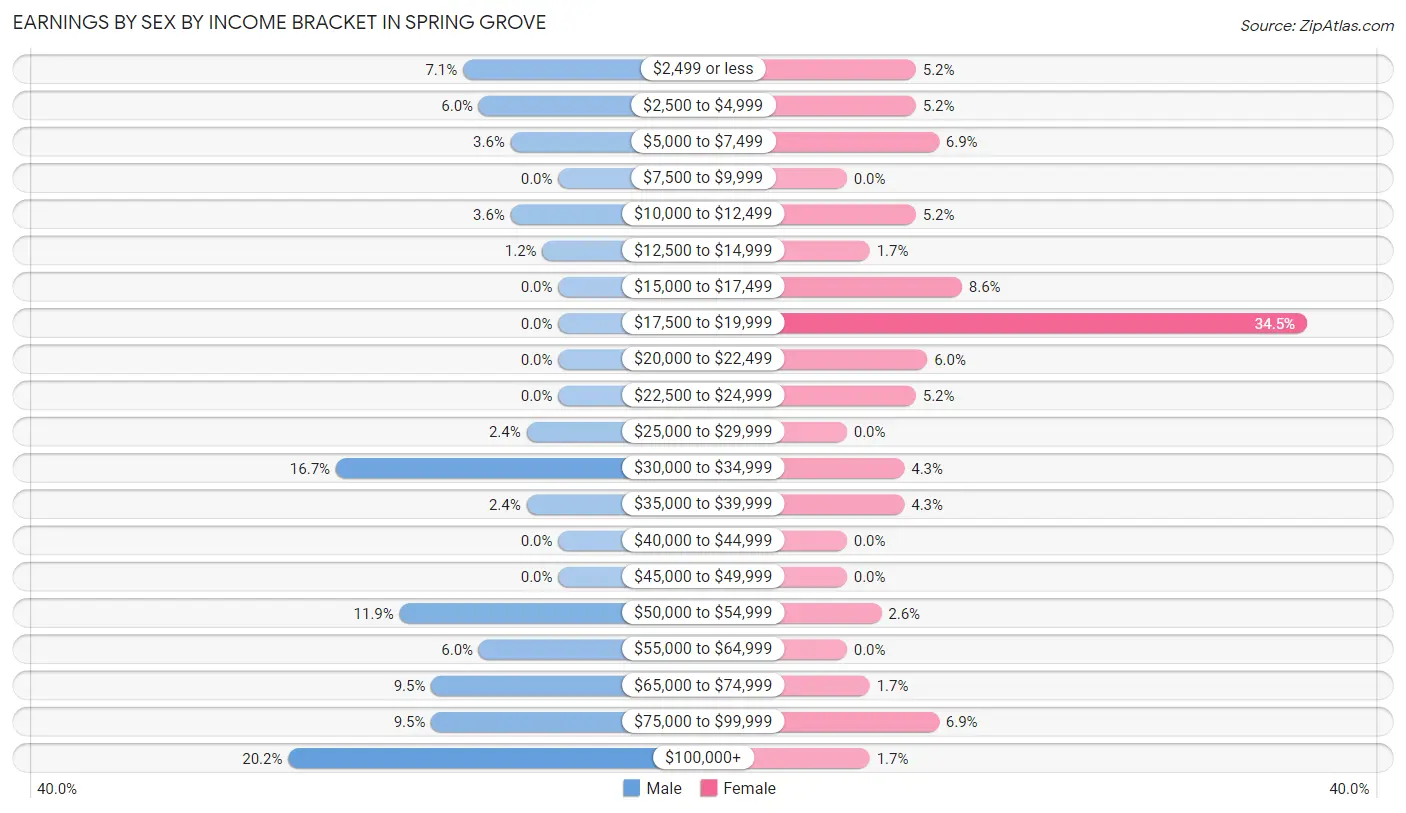
| Income | Male | Female |
| $2,499 or less | 6 (7.1%) | 6 (5.2%) |
| $2,500 to $4,999 | 5 (5.9%) | 6 (5.2%) |
| $5,000 to $7,499 | 3 (3.6%) | 8 (6.9%) |
| $7,500 to $9,999 | 0 (0.0%) | 0 (0.0%) |
| $10,000 to $12,499 | 3 (3.6%) | 6 (5.2%) |
| $12,500 to $14,999 | 1 (1.2%) | 2 (1.7%) |
| $15,000 to $17,499 | 0 (0.0%) | 10 (8.6%) |
| $17,500 to $19,999 | 0 (0.0%) | 40 (34.5%) |
| $20,000 to $22,499 | 0 (0.0%) | 7 (6.0%) |
| $22,500 to $24,999 | 0 (0.0%) | 6 (5.2%) |
| $25,000 to $29,999 | 2 (2.4%) | 0 (0.0%) |
| $30,000 to $34,999 | 14 (16.7%) | 5 (4.3%) |
| $35,000 to $39,999 | 2 (2.4%) | 5 (4.3%) |
| $40,000 to $44,999 | 0 (0.0%) | 0 (0.0%) |
| $45,000 to $49,999 | 0 (0.0%) | 0 (0.0%) |
| $50,000 to $54,999 | 10 (11.9%) | 3 (2.6%) |
| $55,000 to $64,999 | 5 (5.9%) | 0 (0.0%) |
| $65,000 to $74,999 | 8 (9.5%) | 2 (1.7%) |
| $75,000 to $99,999 | 8 (9.5%) | 8 (6.9%) |
| $100,000+ | 17 (20.2%) | 2 (1.7%) |
| Total | 84 (100.0%) | 116 (100.0%) |
Earnings by Sex by Educational Attainment in Spring Grove
Average earnings in Spring Grove are $62,500 for men and $19,281 for women, a difference of 69.2%. Men with an educational attainment of college or associate's degree enjoy the highest average annual earnings of $101,250, while those with bachelor's degree education earn the least with $65,833. Women with an educational attainment of college or associate's degree earn the most with the average annual earnings of $19,031, while those with college or associate's degree education have the smallest earnings of $19,031.
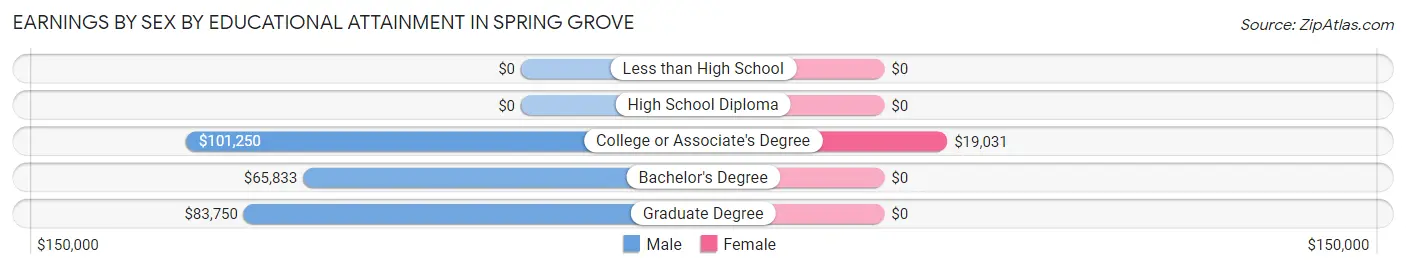
| Educational Attainment | Male Income | Female Income |
| Less than High School | - | - |
| High School Diploma | - | - |
| College or Associate's Degree | $101,250 | $19,031 |
| Bachelor's Degree | $65,833 | $0 |
| Graduate Degree | $83,750 | $0 |
| Total | $62,500 | $19,281 |
Family Income in Spring Grove
Family Income Brackets in Spring Grove
According to the Spring Grove family income data, there are 43 families falling into the $15,000 to $24,999 income range, which is the most common income bracket and makes up 35.2% of all families.
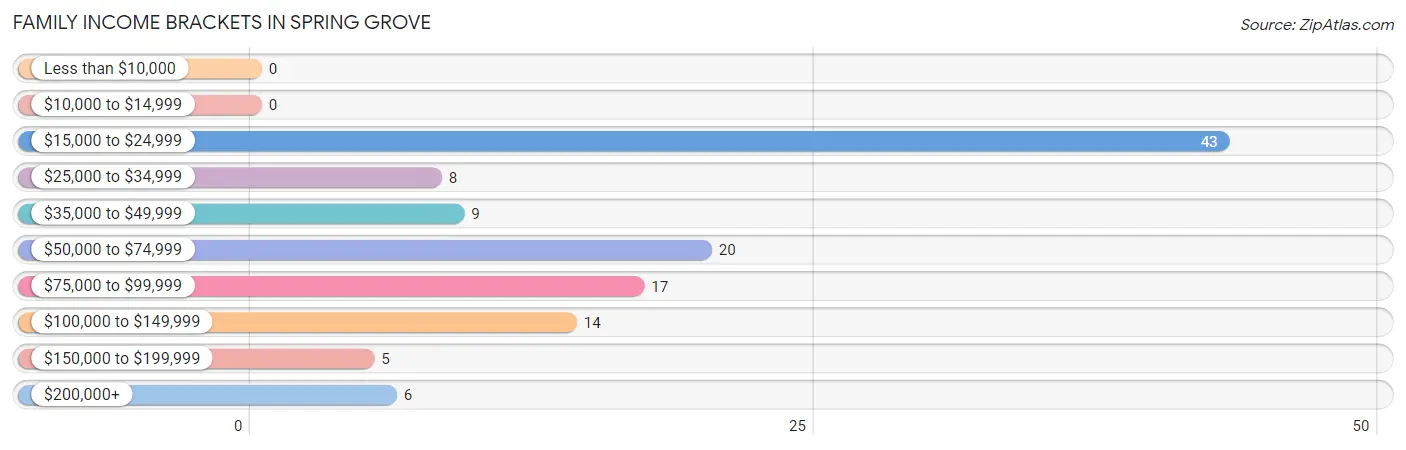
| Income Bracket | # Families | % Families |
| Less than $10,000 | 0 | 0.0% |
| $10,000 to $14,999 | 0 | 0.0% |
| $15,000 to $24,999 | 43 | 35.2% |
| $25,000 to $34,999 | 8 | 6.6% |
| $35,000 to $49,999 | 9 | 7.4% |
| $50,000 to $74,999 | 20 | 16.4% |
| $75,000 to $99,999 | 17 | 13.9% |
| $100,000 to $149,999 | 14 | 11.5% |
| $150,000 to $199,999 | 5 | 4.1% |
| $200,000+ | 6 | 4.9% |
Family Income by Famaliy Size in Spring Grove
4-person families (15 | 12.3%) account for the highest median family income in Spring Grove with $113,125 per family, while 4-person families (15 | 12.3%) have the highest median income of $28,281 per family member.
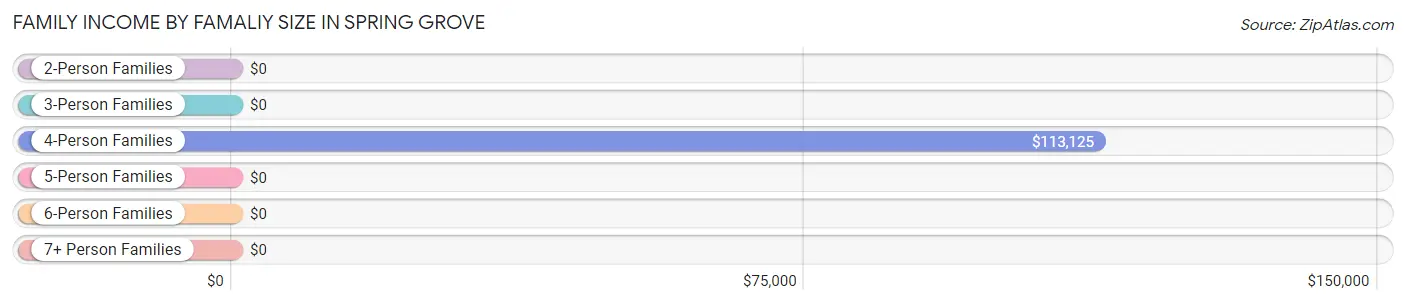
| Income Bracket | # Families | Median Income |
| 2-Person Families | 92 (75.4%) | $0 |
| 3-Person Families | 7 (5.7%) | $0 |
| 4-Person Families | 15 (12.3%) | $113,125 |
| 5-Person Families | 6 (4.9%) | $0 |
| 6-Person Families | 2 (1.6%) | $0 |
| 7+ Person Families | 0 (0.0%) | $0 |
| Total | 122 (100.0%) | $56,250 |
Family Income by Number of Earners in Spring Grove
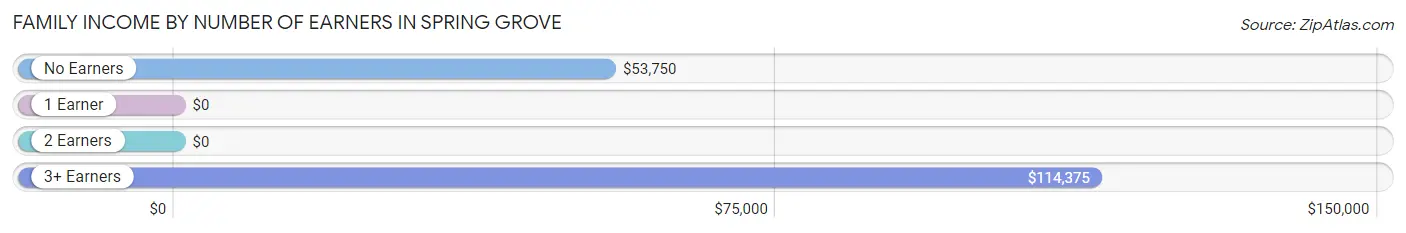
| Number of Earners | # Families | Median Income |
| No Earners | 16 (13.1%) | $53,750 |
| 1 Earner | 79 (64.7%) | $0 |
| 2 Earners | 14 (11.5%) | $0 |
| 3+ Earners | 13 (10.7%) | $114,375 |
| Total | 122 (100.0%) | $56,250 |
Household Income in Spring Grove
Household Income Brackets in Spring Grove
With 56 households falling in the category, the $15,000 to $24,999 income range is the most frequent in Spring Grove, accounting for 30.8% of all households. In contrast, only 5 households (2.8%) fall into the $150,000 to $199,999 income bracket, making it the least populous group.
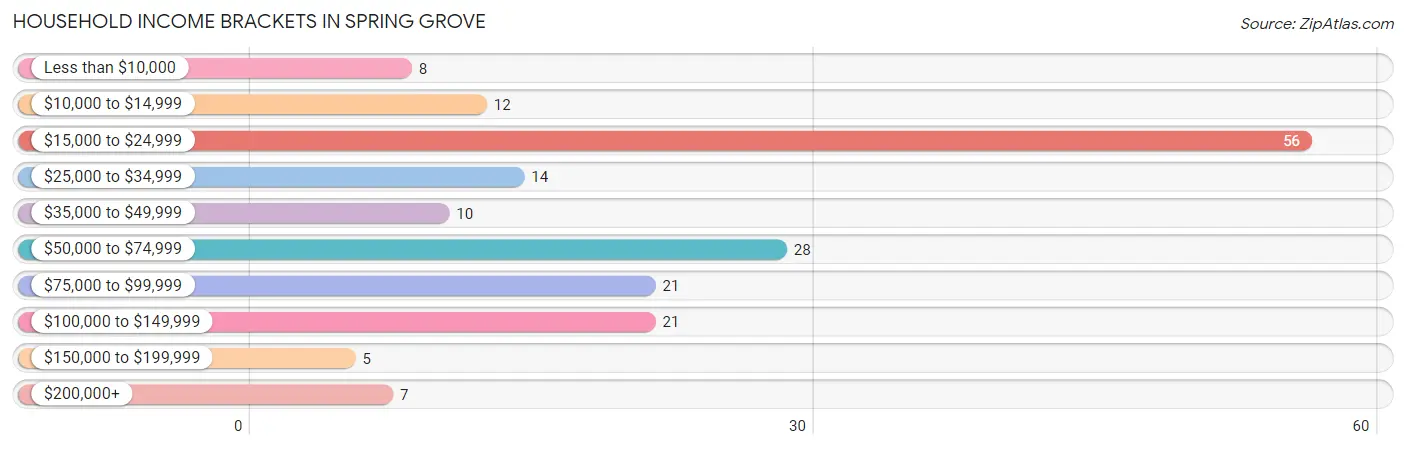
| Income Bracket | # Households | % Households |
| Less than $10,000 | 8 | 4.4% |
| $10,000 to $14,999 | 12 | 6.6% |
| $15,000 to $24,999 | 56 | 30.8% |
| $25,000 to $34,999 | 14 | 7.7% |
| $35,000 to $49,999 | 10 | 5.5% |
| $50,000 to $74,999 | 28 | 15.4% |
| $75,000 to $99,999 | 21 | 11.5% |
| $100,000 to $149,999 | 21 | 11.5% |
| $150,000 to $199,999 | 5 | 2.7% |
| $200,000+ | 7 | 3.8% |
Household Income by Householder Age in Spring Grove
The median household income in Spring Grove is $40,000, with the highest median household income of $88,750 found in the 45 to 64 years age bracket for the primary householder. A total of 57 households (31.3%) fall into this category. Meanwhile, the 15 to 24 years age bracket for the primary householder has the lowest median household income of $0, with 12 households (6.6%) in this group.
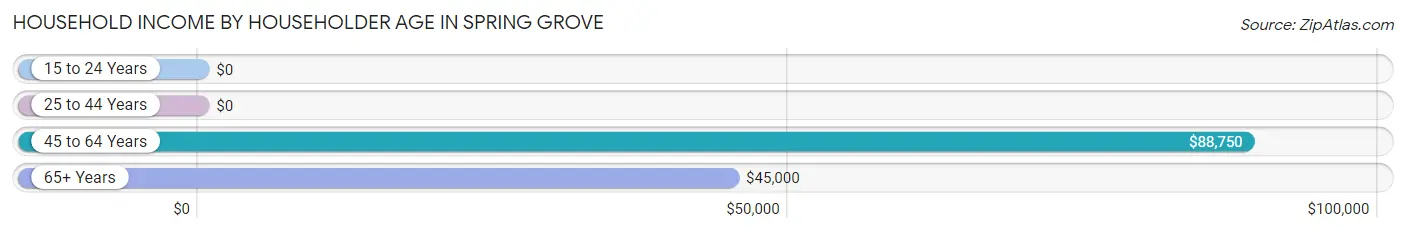
| Income Bracket | # Households | Median Income |
| 15 to 24 Years | 12 (6.6%) | $0 |
| 25 to 44 Years | 63 (34.6%) | $0 |
| 45 to 64 Years | 57 (31.3%) | $88,750 |
| 65+ Years | 50 (27.5%) | $45,000 |
| Total | 182 (100.0%) | $40,000 |
Poverty in Spring Grove
Income Below Poverty by Sex and Age in Spring Grove
With 7.9% poverty level for males and 37.5% for females among the residents of Spring Grove, 35 to 44 year old males and 6 to 11 year old females are the most vulnerable to poverty, with 6 males (27.3%) and 23 females (85.2%) in their respective age groups living below the poverty level.
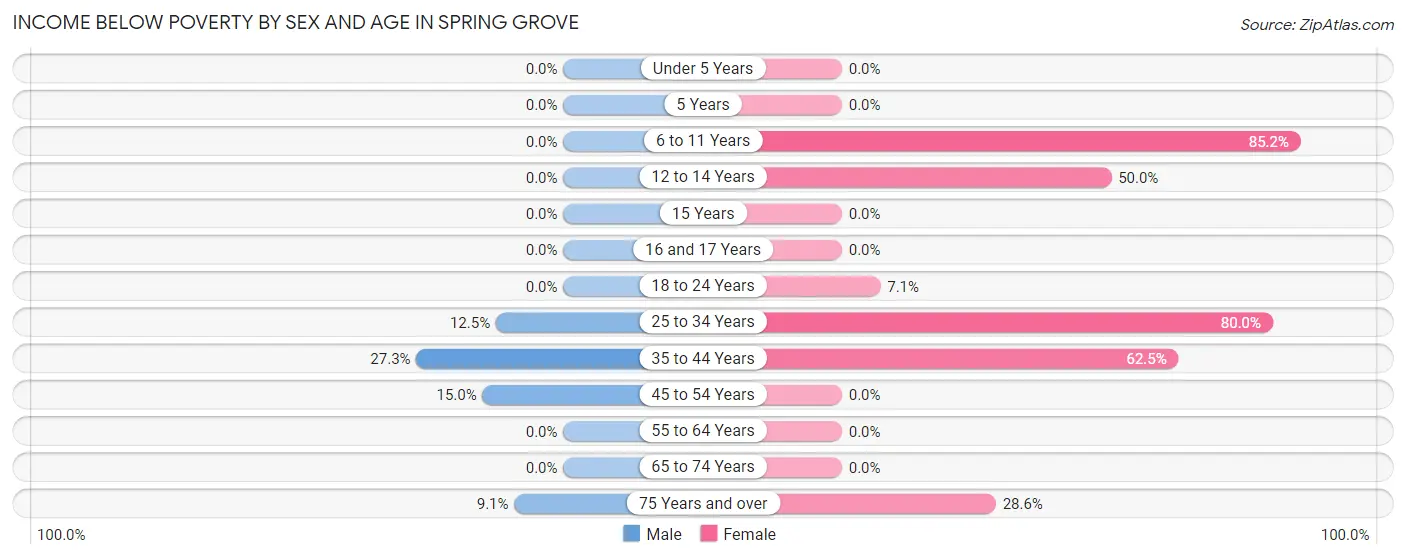
| Age Bracket | Male | Female |
| Under 5 Years | 0 (0.0%) | 0 (0.0%) |
| 5 Years | 0 (0.0%) | 0 (0.0%) |
| 6 to 11 Years | 0 (0.0%) | 23 (85.2%) |
| 12 to 14 Years | 0 (0.0%) | 3 (50.0%) |
| 15 Years | 0 (0.0%) | 0 (0.0%) |
| 16 and 17 Years | 0 (0.0%) | 0 (0.0%) |
| 18 to 24 Years | 0 (0.0%) | 2 (7.1%) |
| 25 to 34 Years | 1 (12.5%) | 40 (80.0%) |
| 35 to 44 Years | 6 (27.3%) | 5 (62.5%) |
| 45 to 54 Years | 3 (15.0%) | 0 (0.0%) |
| 55 to 64 Years | 0 (0.0%) | 0 (0.0%) |
| 65 to 74 Years | 0 (0.0%) | 0 (0.0%) |
| 75 Years and over | 1 (9.1%) | 8 (28.6%) |
| Total | 11 (7.9%) | 81 (37.5%) |
Income Above Poverty by Sex and Age in Spring Grove
According to the poverty statistics in Spring Grove, males aged under 5 years and females aged under 5 years are the age groups that are most secure financially, with 100.0% of males and 100.0% of females in these age groups living above the poverty line.
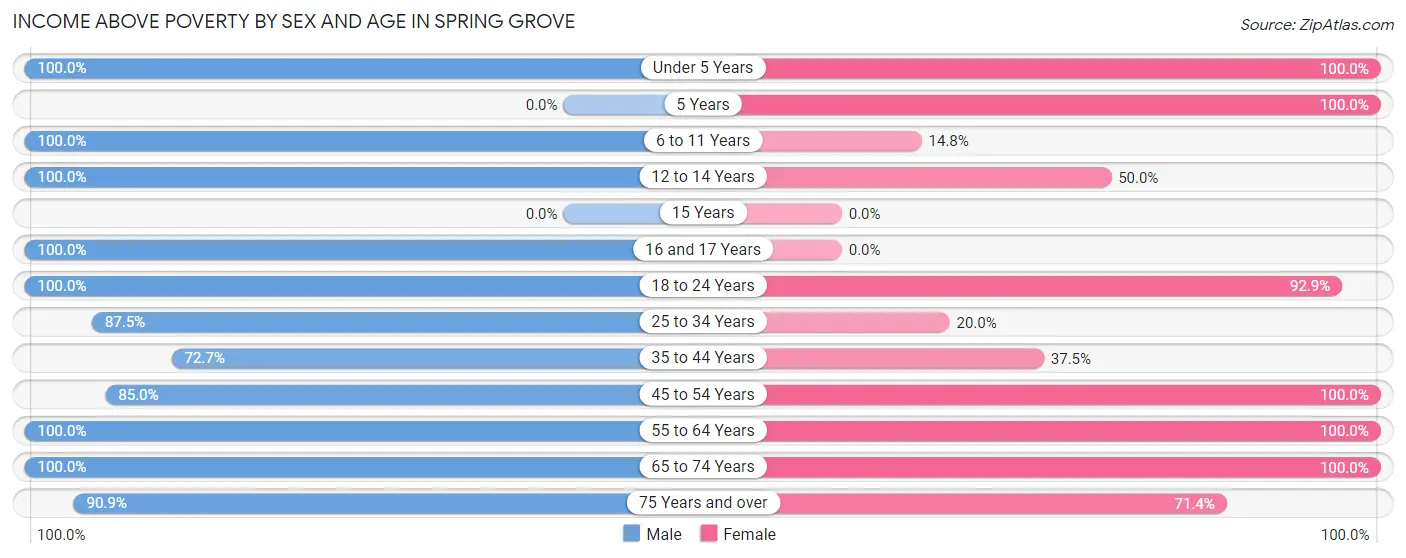
| Age Bracket | Male | Female |
| Under 5 Years | 3 (100.0%) | 7 (100.0%) |
| 5 Years | 0 (0.0%) | 3 (100.0%) |
| 6 to 11 Years | 3 (100.0%) | 4 (14.8%) |
| 12 to 14 Years | 3 (100.0%) | 3 (50.0%) |
| 15 Years | 0 (0.0%) | 0 (0.0%) |
| 16 and 17 Years | 5 (100.0%) | 0 (0.0%) |
| 18 to 24 Years | 18 (100.0%) | 26 (92.9%) |
| 25 to 34 Years | 7 (87.5%) | 10 (20.0%) |
| 35 to 44 Years | 16 (72.7%) | 3 (37.5%) |
| 45 to 54 Years | 17 (85.0%) | 19 (100.0%) |
| 55 to 64 Years | 21 (100.0%) | 25 (100.0%) |
| 65 to 74 Years | 25 (100.0%) | 15 (100.0%) |
| 75 Years and over | 10 (90.9%) | 20 (71.4%) |
| Total | 128 (92.1%) | 135 (62.5%) |
Income Below Poverty Among Married-Couple Families in Spring Grove
The poverty statistics for married-couple families in Spring Grove show that 4.4% or 3 of the total 68 families live below the poverty line. Families with 1 or 2 children have the highest poverty rate of 37.5%, comprising of 3 families. On the other hand, families with no children have the lowest poverty rate of 0.0%, which includes 0 families.
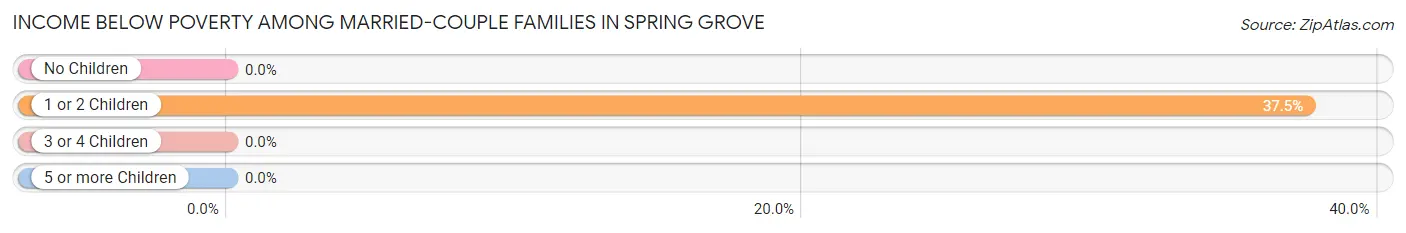
| Children | Above Poverty | Below Poverty |
| No Children | 55 (100.0%) | 0 (0.0%) |
| 1 or 2 Children | 5 (62.5%) | 3 (37.5%) |
| 3 or 4 Children | 5 (100.0%) | 0 (0.0%) |
| 5 or more Children | 0 (0.0%) | 0 (0.0%) |
| Total | 65 (95.6%) | 3 (4.4%) |
Income Below Poverty Among Single-Parent Households in Spring Grove
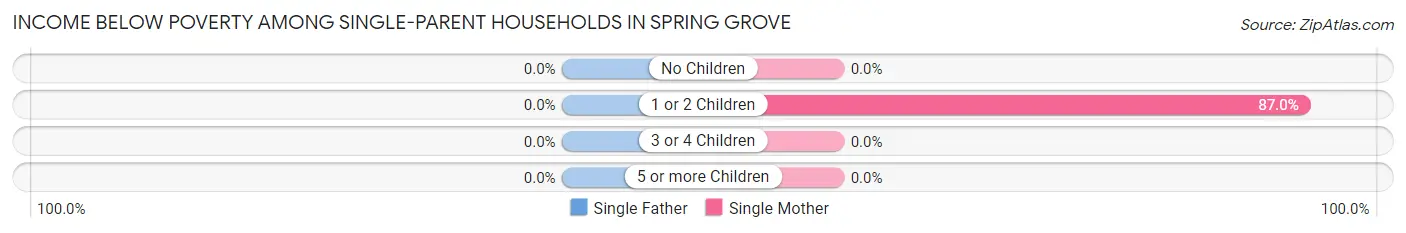
| Children | Single Father | Single Mother |
| No Children | 0 (0.0%) | 0 (0.0%) |
| 1 or 2 Children | 0 (0.0%) | 40 (87.0%) |
| 3 or 4 Children | 0 (0.0%) | 0 (0.0%) |
| 5 or more Children | 0 (0.0%) | 0 (0.0%) |
| Total | 0 (0.0%) | 40 (83.3%) |
Income Below Poverty Among Married-Couple vs Single-Parent Households in Spring Grove
The poverty data for Spring Grove shows that 3 of the married-couple family households (4.4%) and 40 of the single-parent households (74.1%) are living below the poverty level. Within the married-couple family households, those with 1 or 2 children have the highest poverty rate, with 3 households (37.5%) falling below the poverty line. Among the single-parent households, those with 1 or 2 children have the highest poverty rate, with 40 household (80.0%) living below poverty.
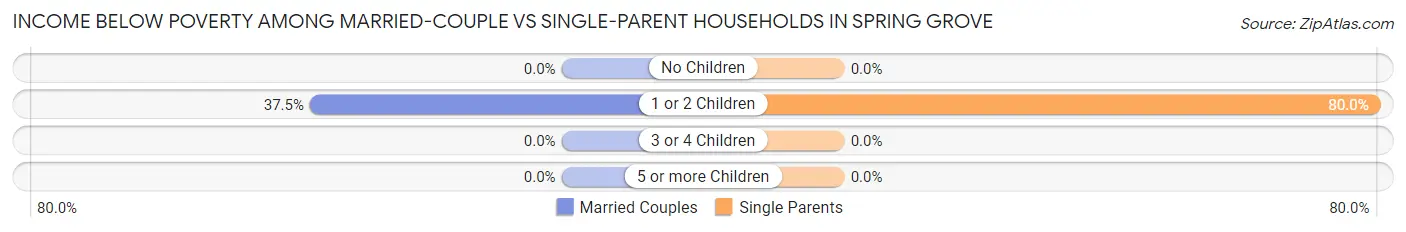
| Children | Married-Couple Families | Single-Parent Households |
| No Children | 0 (0.0%) | 0 (0.0%) |
| 1 or 2 Children | 3 (37.5%) | 40 (80.0%) |
| 3 or 4 Children | 0 (0.0%) | 0 (0.0%) |
| 5 or more Children | 0 (0.0%) | 0 (0.0%) |
| Total | 3 (4.4%) | 40 (74.1%) |
Race in Spring Grove
The most populous races in Spring Grove are White / Caucasian (403 | 94.4%), Two or more Races (12 | 2.8%), and Black / African American (10 | 2.3%).
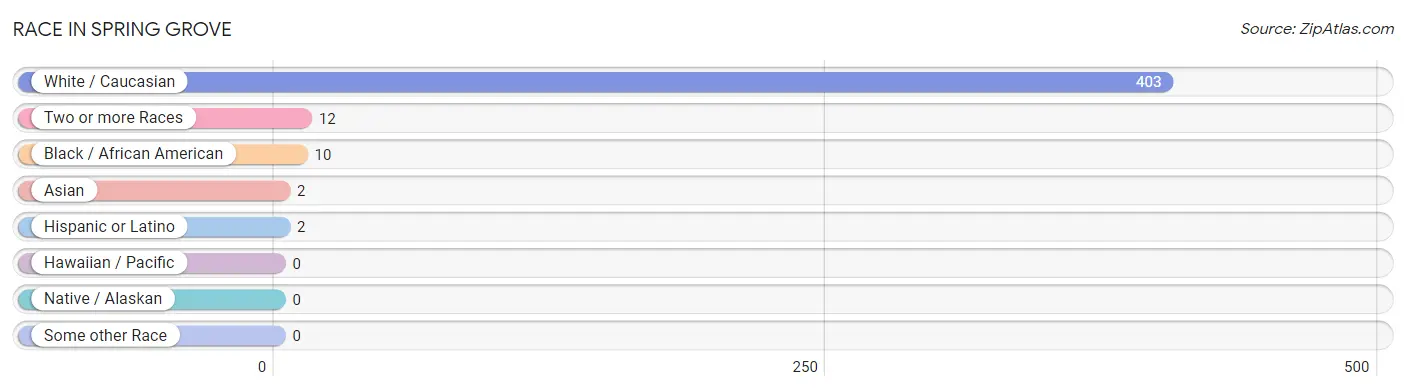
| Race | # Population | % Population |
| Asian | 2 | 0.5% |
| Black / African American | 10 | 2.3% |
| Hawaiian / Pacific | 0 | 0.0% |
| Hispanic or Latino | 2 | 0.5% |
| Native / Alaskan | 0 | 0.0% |
| White / Caucasian | 403 | 94.4% |
| Two or more Races | 12 | 2.8% |
| Some other Race | 0 | 0.0% |
| Total | 427 | 100.0% |
Ancestry in Spring Grove
The most populous ancestries reported in Spring Grove are English (115 | 26.9%), Irish (74 | 17.3%), German (68 | 15.9%), American (40 | 9.4%), and European (14 | 3.3%), together accounting for 72.8% of all Spring Grove residents.
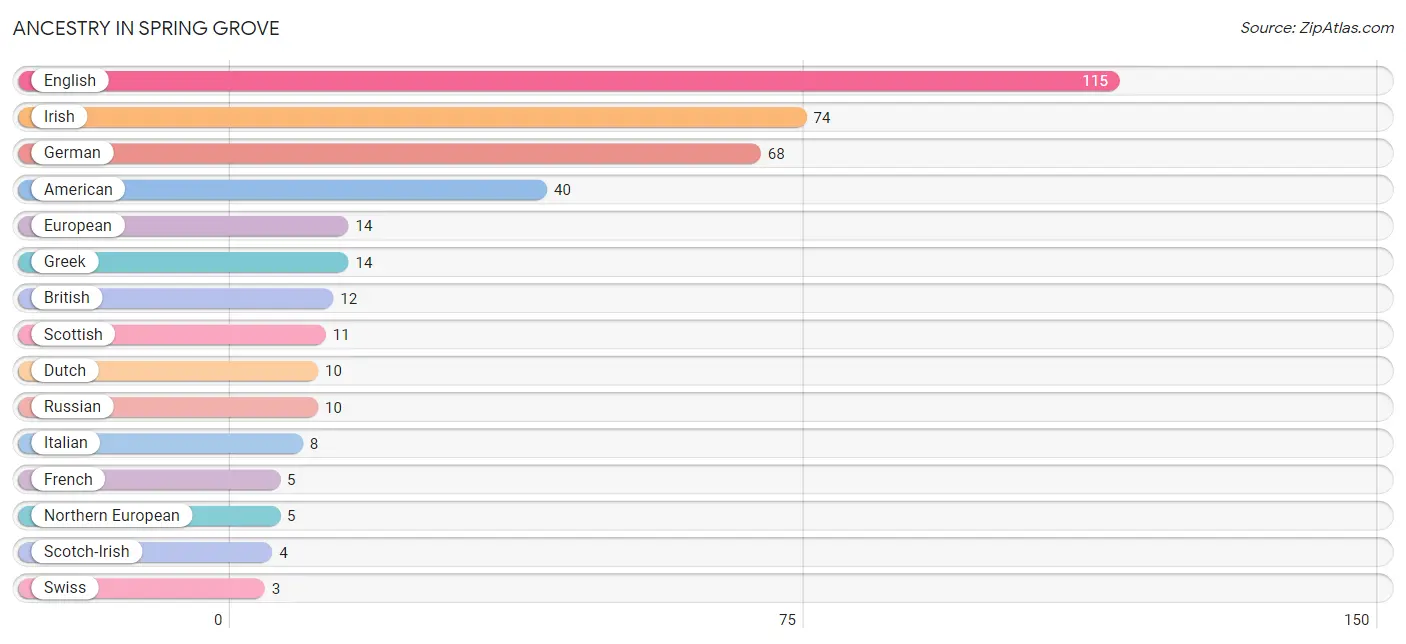
| Ancestry | # Population | % Population |
| American | 40 | 9.4% |
| British | 12 | 2.8% |
| Burmese | 2 | 0.5% |
| Danish | 2 | 0.5% |
| Dutch | 10 | 2.3% |
| English | 115 | 26.9% |
| European | 14 | 3.3% |
| French | 5 | 1.2% |
| German | 68 | 15.9% |
| Greek | 14 | 3.3% |
| Irish | 74 | 17.3% |
| Italian | 8 | 1.9% |
| Mexican | 2 | 0.5% |
| Northern European | 5 | 1.2% |
| Russian | 10 | 2.3% |
| Scandinavian | 2 | 0.5% |
| Scotch-Irish | 4 | 0.9% |
| Scottish | 11 | 2.6% |
| Swiss | 3 | 0.7% | View All 19 Rows |
Immigrants in Spring Grove
The most numerous immigrant groups reported in Spring Grove came from Europe (14 | 3.3%), Greece (8 | 1.9%), Southern Europe (8 | 1.9%), Asia (6 | 1.4%), and South Central Asia (6 | 1.4%), together accounting for 9.8% of all Spring Grove residents.
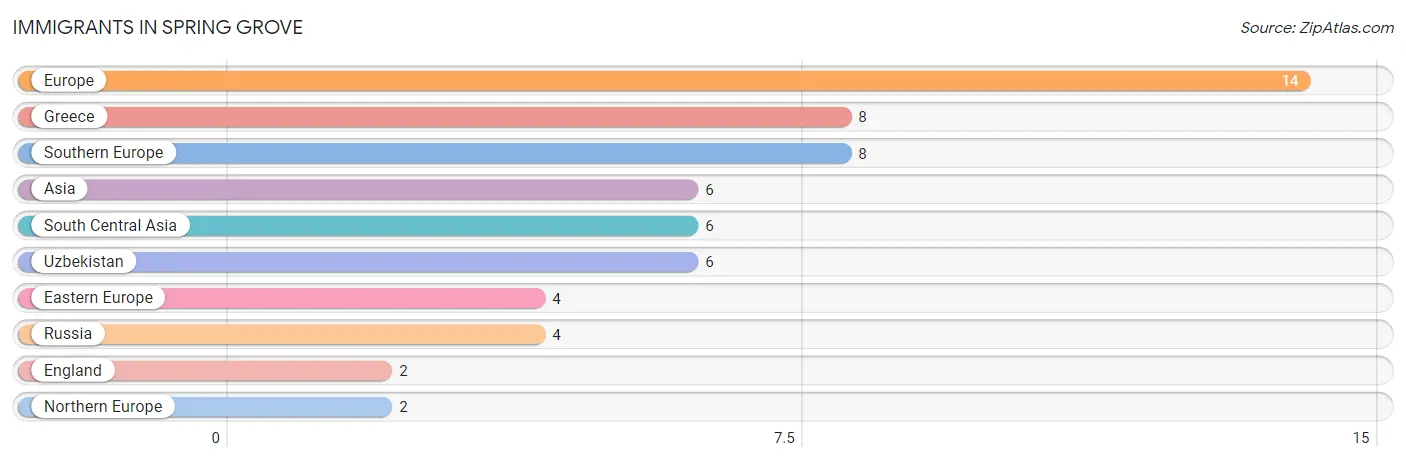
| Immigration Origin | # Population | % Population |
| Asia | 6 | 1.4% |
| Eastern Europe | 4 | 0.9% |
| England | 2 | 0.5% |
| Europe | 14 | 3.3% |
| Greece | 8 | 1.9% |
| Northern Europe | 2 | 0.5% |
| Russia | 4 | 0.9% |
| South Central Asia | 6 | 1.4% |
| Southern Europe | 8 | 1.9% |
| Uzbekistan | 6 | 1.4% | View All 10 Rows |
Sex and Age in Spring Grove
Sex and Age in Spring Grove
The most populous age groups in Spring Grove are 65 to 69 Years (20 | 12.5%) for men and 30 to 34 Years (47 | 17.6%) for women.
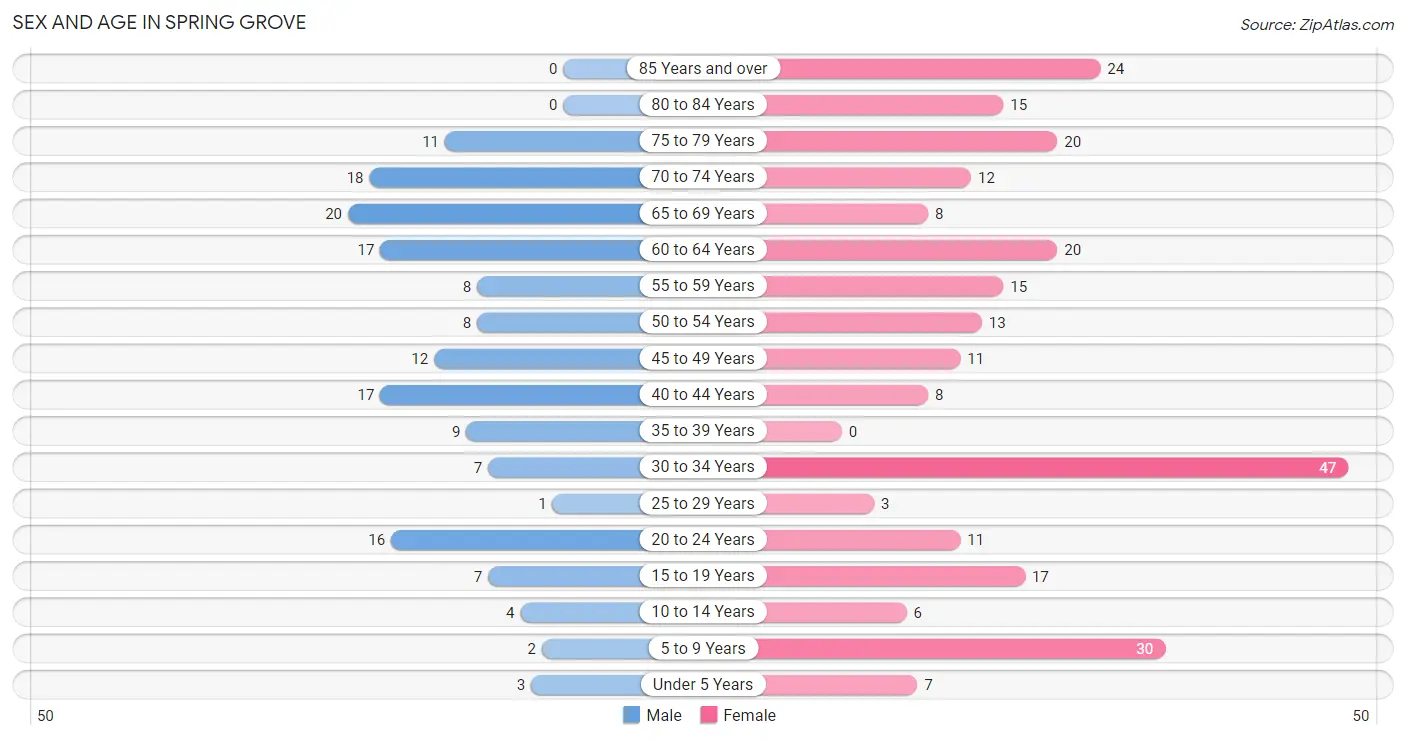
| Age Bracket | Male | Female |
| Under 5 Years | 3 (1.9%) | 7 (2.6%) |
| 5 to 9 Years | 2 (1.3%) | 30 (11.2%) |
| 10 to 14 Years | 4 (2.5%) | 6 (2.2%) |
| 15 to 19 Years | 7 (4.4%) | 17 (6.4%) |
| 20 to 24 Years | 16 (10.0%) | 11 (4.1%) |
| 25 to 29 Years | 1 (0.6%) | 3 (1.1%) |
| 30 to 34 Years | 7 (4.4%) | 47 (17.6%) |
| 35 to 39 Years | 9 (5.6%) | 0 (0.0%) |
| 40 to 44 Years | 17 (10.6%) | 8 (3.0%) |
| 45 to 49 Years | 12 (7.5%) | 11 (4.1%) |
| 50 to 54 Years | 8 (5.0%) | 13 (4.9%) |
| 55 to 59 Years | 8 (5.0%) | 15 (5.6%) |
| 60 to 64 Years | 17 (10.6%) | 20 (7.5%) |
| 65 to 69 Years | 20 (12.5%) | 8 (3.0%) |
| 70 to 74 Years | 18 (11.3%) | 12 (4.5%) |
| 75 to 79 Years | 11 (6.9%) | 20 (7.5%) |
| 80 to 84 Years | 0 (0.0%) | 15 (5.6%) |
| 85 Years and over | 0 (0.0%) | 24 (9.0%) |
| Total | 160 (100.0%) | 267 (100.0%) |
Families and Households in Spring Grove
Median Family Size in Spring Grove
The median family size in Spring Grove is 2.35 persons per family, with single male/father families (6 | 4.9%) accounting for the largest median family size of 3.5 persons per family. On the other hand, single female/mother families (48 | 39.3%) represent the smallest median family size with 1.60 persons per family.
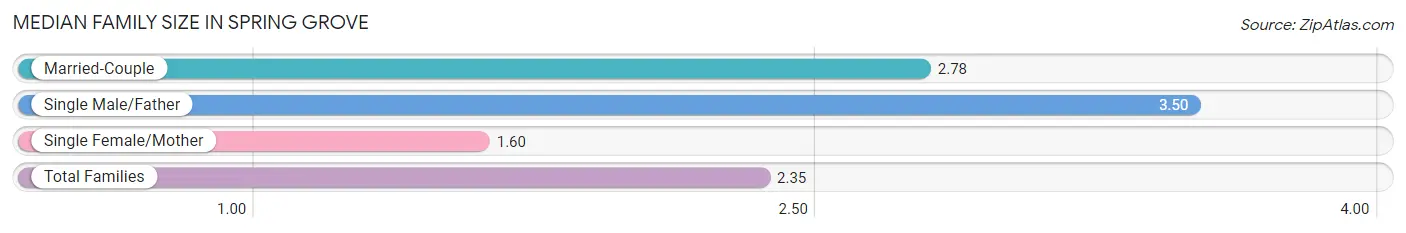
| Family Type | # Families | Family Size |
| Married-Couple | 68 (55.7%) | 2.78 |
| Single Male/Father | 6 (4.9%) | 3.50 |
| Single Female/Mother | 48 (39.3%) | 1.60 |
| Total Families | 122 (100.0%) | 2.35 |
Median Household Size in Spring Grove
The median household size in Spring Grove is 1.95 persons per household, with single male/father households (6 | 3.3%) accounting for the largest median household size of 3.83 persons per household. non-family households (60 | 33.0%) represent the smallest median household size with 1.08 persons per household.
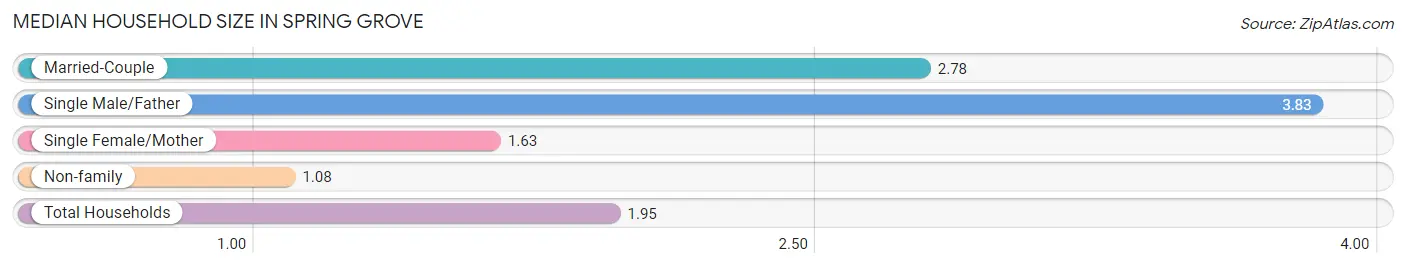
| Household Type | # Households | Household Size |
| Married-Couple | 68 (37.4%) | 2.78 |
| Single Male/Father | 6 (3.3%) | 3.83 |
| Single Female/Mother | 48 (26.4%) | 1.63 |
| Non-family | 60 (33.0%) | 1.08 |
| Total Households | 182 (100.0%) | 1.95 |
Household Size by Marriage Status in Spring Grove
Out of a total of 182 households in Spring Grove, 122 (67.0%) are family households, while 60 (33.0%) are nonfamily households. The most numerous type of family households are 2-person households, comprising 91, and the most common type of nonfamily households are 1-person households, comprising 55.
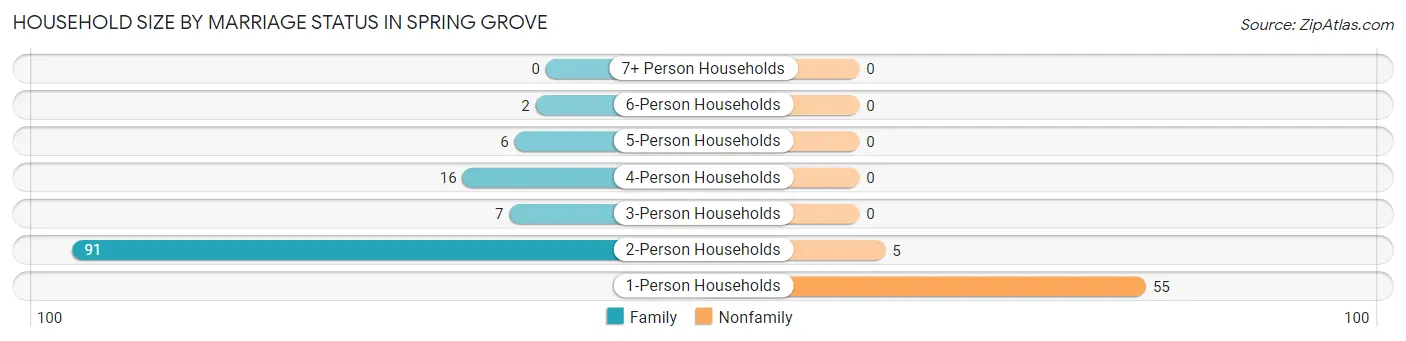
| Household Size | Family Households | Nonfamily Households |
| 1-Person Households | - | 55 (30.2%) |
| 2-Person Households | 91 (50.0%) | 5 (2.8%) |
| 3-Person Households | 7 (3.8%) | 0 (0.0%) |
| 4-Person Households | 16 (8.8%) | 0 (0.0%) |
| 5-Person Households | 6 (3.3%) | 0 (0.0%) |
| 6-Person Households | 2 (1.1%) | 0 (0.0%) |
| 7+ Person Households | 0 (0.0%) | 0 (0.0%) |
| Total | 122 (67.0%) | 60 (33.0%) |
Female Fertility in Spring Grove
Fertility by Age in Spring Grove
| Age Bracket | Women with Births | Births / 1,000 Women |
| 15 to 19 years | 0 (0.0%) | 0.0 |
| 20 to 34 years | 0 (0.0%) | 0.0 |
| 35 to 50 years | 0 (0.0%) | 0.0 |
| Total | 0 (0.0%) | 0.0 |
Fertility by Age by Marriage Status in Spring Grove
| Age Bracket | Married | Unmarried |
| 15 to 19 years | 0 (0.0%) | 0 (0.0%) |
| 20 to 34 years | 0 (0.0%) | 0 (0.0%) |
| 35 to 50 years | 0 (0.0%) | 0 (0.0%) |
| Total | 0 (0.0%) | 0 (0.0%) |
Fertility by Education in Spring Grove
| Educational Attainment | Women with Births | Births / 1,000 Women |
| Less than High School | 0 (0.0%) | 0.0 |
| High School Diploma | 0 (0.0%) | 0.0 |
| College or Associate's Degree | 0 (0.0%) | 0.0 |
| Bachelor's Degree | 0 (0.0%) | 0.0 |
| Graduate Degree | 0 (0.0%) | 0.0 |
| Total | 0 (0.0%) | 0.0 |
Fertility by Education by Marriage Status in Spring Grove
| Educational Attainment | Married | Unmarried |
| Less than High School | 0 (0.0%) | 0 (0.0%) |
| High School Diploma | 0 (0.0%) | 0 (0.0%) |
| College or Associate's Degree | 0 (0.0%) | 0 (0.0%) |
| Bachelor's Degree | 0 (0.0%) | 0 (0.0%) |
| Graduate Degree | 0 (0.0%) | 0 (0.0%) |
| Total | 0 (0.0%) | 0 (0.0%) |
Employment Characteristics in Spring Grove
Employment by Class of Employer in Spring Grove
Among the 174 employed individuals in Spring Grove, private company employees (92 | 52.9%), local government employees (25 | 14.4%), and self-employed (not incorporated) (18 | 10.3%) make up the most common classes of employment.
| Employer Class | # Employees | % Employees |
| Private Company Employees | 92 | 52.9% |
| Self-Employed (Incorporated) | 12 | 6.9% |
| Self-Employed (Not Incorporated) | 18 | 10.3% |
| Not-for-profit Organizations | 15 | 8.6% |
| Local Government Employees | 25 | 14.4% |
| State Government Employees | 10 | 5.8% |
| Federal Government Employees | 2 | 1.1% |
| Unpaid Family Workers | 0 | 0.0% |
| Total | 174 | 100.0% |
Employment Status by Age in Spring Grove
According to the labor force statistics for Spring Grove, out of the total population over 16 years of age (375), 49.6% or 186 individuals are in the labor force, with 5.4% or 10 of them unemployed. The age group with the highest labor force participation rate is 30 to 34 years, with 90.7% or 49 individuals in the labor force. Within the labor force, the 65 to 74 years age range has the highest percentage of unemployed individuals, with 33.3% or 2 of them being unemployed.
| Age Bracket | In Labor Force | Unemployed |
| 16 to 19 Years | 14 (58.3%) | 0 (0.0%) |
| 20 to 24 Years | 24 (88.9%) | 2 (8.3%) |
| 25 to 29 Years | 3 (75.0%) | 0 (0.0%) |
| 30 to 34 Years | 49 (90.7%) | 0 (0.0%) |
| 35 to 44 Years | 21 (61.8%) | 6 (28.6%) |
| 45 to 54 Years | 29 (65.9%) | 0 (0.0%) |
| 55 to 59 Years | 17 (73.9%) | 0 (0.0%) |
| 60 to 64 Years | 17 (45.9%) | 0 (0.0%) |
| 65 to 74 Years | 6 (10.3%) | 2 (33.3%) |
| 75 Years and over | 6 (8.6%) | 0 (0.0%) |
| Total | 186 (49.6%) | 10 (5.4%) |
Employment Status by Educational Attainment in Spring Grove
According to labor force statistics for Spring Grove, 69.4% of individuals (136) out of the total population between 25 and 64 years of age (196) are in the labor force, with 4.4% or 6 of them being unemployed. The group with the highest labor force participation rate are those with the educational attainment of college / associate degree, with 76.8% or 63 individuals in the labor force. Within the labor force, individuals with high school diploma education have the highest percentage of unemployment, with 27.3% or 6 of them being unemployed.
| Educational Attainment | In Labor Force | Unemployed |
| Less than High School | 6 (60.0%) | 0 (0.0%) |
| High School Diploma | 22 (50.0%) | 12 (27.3%) |
| College / Associate Degree | 63 (76.8%) | 0 (0.0%) |
| Bachelor's Degree or higher | 45 (75.0%) | 0 (0.0%) |
| Total | 136 (69.4%) | 9 (4.4%) |
Employment Occupations by Sex in Spring Grove
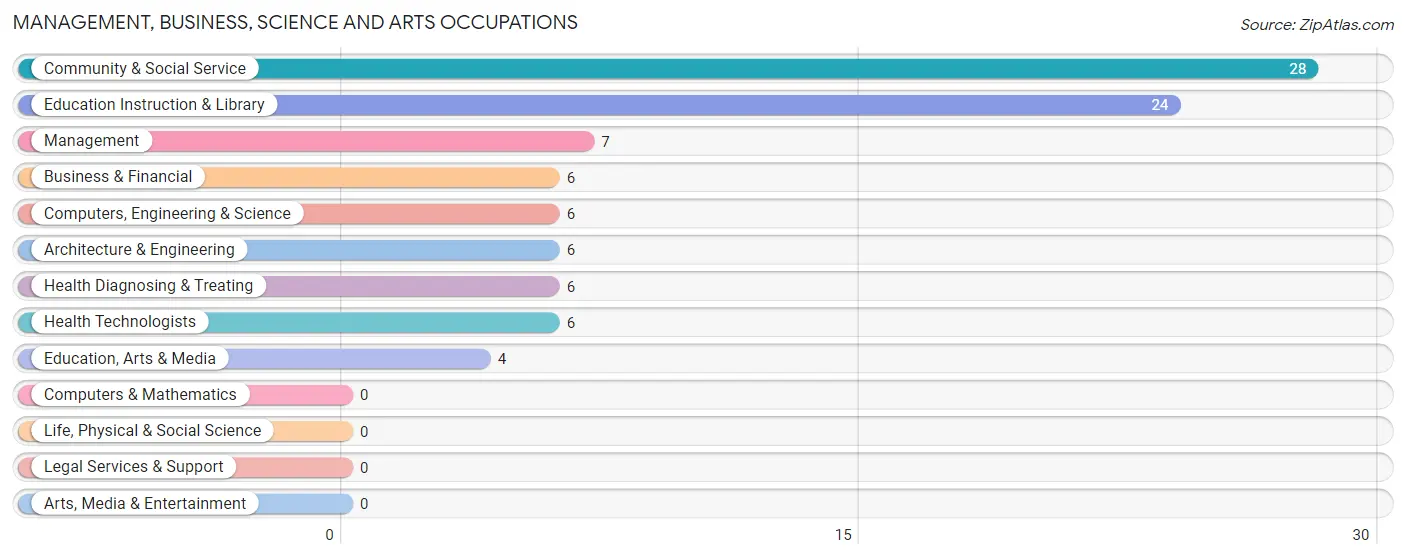
Management, Business, Science and Arts Occupations
The most common Management, Business, Science and Arts occupations in Spring Grove are Community & Social Service (28 | 15.9%), Education Instruction & Library (24 | 13.6%), Management (7 | 4.0%), Business & Financial (6 | 3.4%), and Computers, Engineering & Science (6 | 3.4%).
Management, Business, Science and Arts Occupations by Sex
Within the Management, Business, Science and Arts occupations in Spring Grove, the most male-oriented occupations are Computers, Engineering & Science (100.0%), Architecture & Engineering (100.0%), and Business & Financial (50.0%), while the most female-oriented occupations are Education, Arts & Media (100.0%), Community & Social Service (67.9%), and Education Instruction & Library (62.5%).
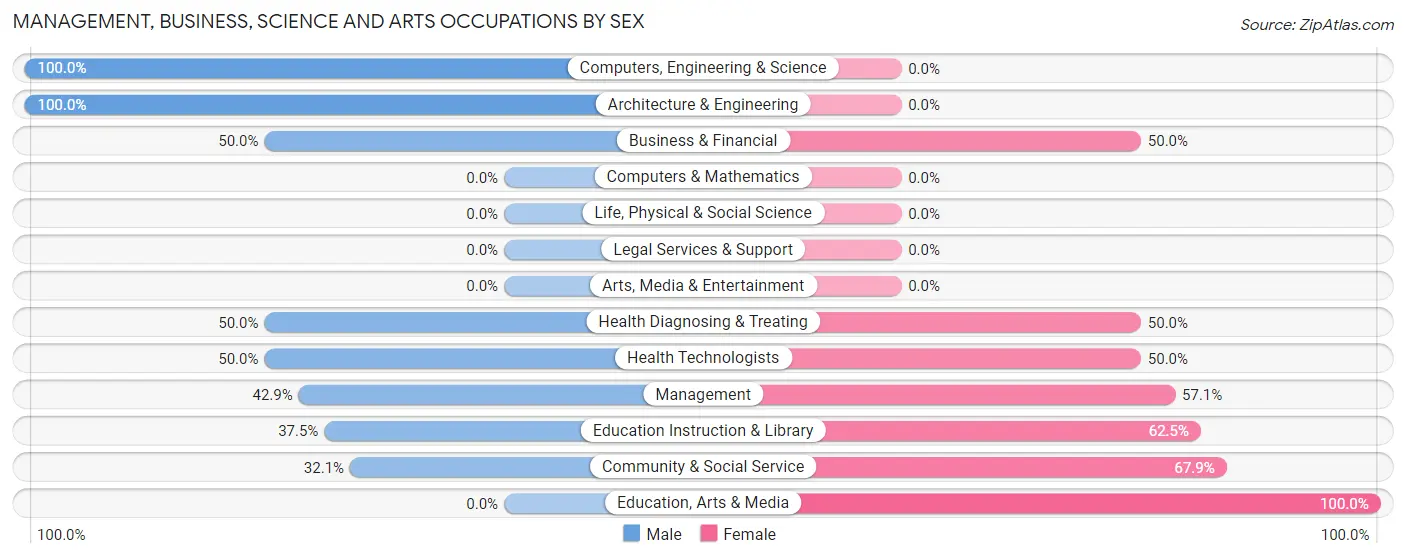
| Occupation | Male | Female |
| Management | 3 (42.9%) | 4 (57.1%) |
| Business & Financial | 3 (50.0%) | 3 (50.0%) |
| Computers, Engineering & Science | 6 (100.0%) | 0 (0.0%) |
| Computers & Mathematics | 0 (0.0%) | 0 (0.0%) |
| Architecture & Engineering | 6 (100.0%) | 0 (0.0%) |
| Life, Physical & Social Science | 0 (0.0%) | 0 (0.0%) |
| Community & Social Service | 9 (32.1%) | 19 (67.9%) |
| Education, Arts & Media | 0 (0.0%) | 4 (100.0%) |
| Legal Services & Support | 0 (0.0%) | 0 (0.0%) |
| Education Instruction & Library | 9 (37.5%) | 15 (62.5%) |
| Arts, Media & Entertainment | 0 (0.0%) | 0 (0.0%) |
| Health Diagnosing & Treating | 3 (50.0%) | 3 (50.0%) |
| Health Technologists | 3 (50.0%) | 3 (50.0%) |
| Total (Category) | 24 (45.3%) | 29 (54.7%) |
| Total (Overall) | 70 (39.8%) | 106 (60.2%) |
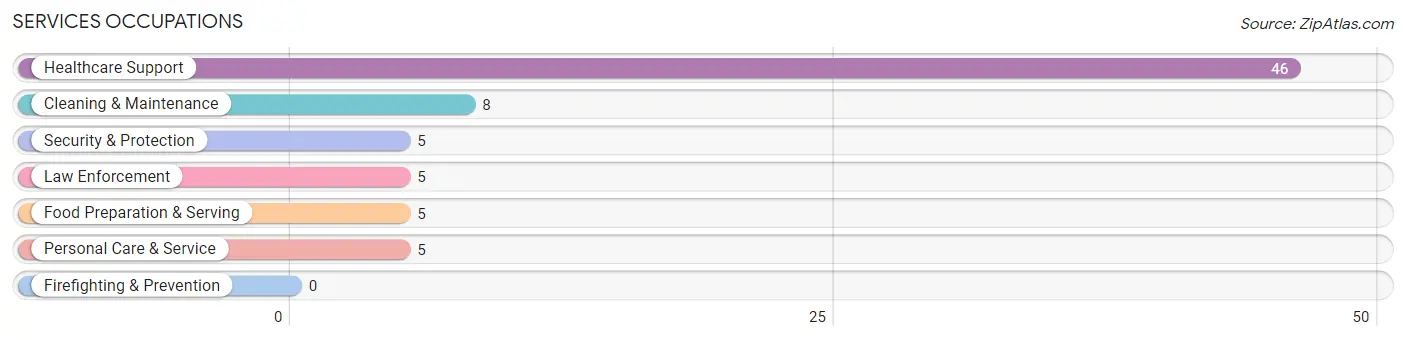
Services Occupations
The most common Services occupations in Spring Grove are Healthcare Support (46 | 26.1%), Cleaning & Maintenance (8 | 4.5%), Security & Protection (5 | 2.8%), Law Enforcement (5 | 2.8%), and Food Preparation & Serving (5 | 2.8%).
Services Occupations by Sex
Within the Services occupations in Spring Grove, the most male-oriented occupations are Security & Protection (100.0%), Law Enforcement (100.0%), and Personal Care & Service (60.0%), while the most female-oriented occupations are Healthcare Support (100.0%), Food Preparation & Serving (100.0%), and Cleaning & Maintenance (87.5%).
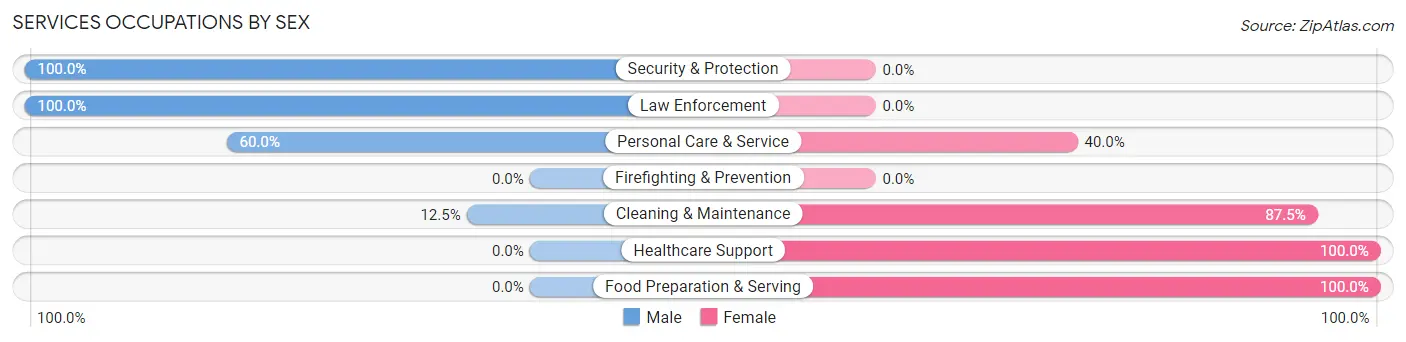
| Occupation | Male | Female |
| Healthcare Support | 0 (0.0%) | 46 (100.0%) |
| Security & Protection | 5 (100.0%) | 0 (0.0%) |
| Firefighting & Prevention | 0 (0.0%) | 0 (0.0%) |
| Law Enforcement | 5 (100.0%) | 0 (0.0%) |
| Food Preparation & Serving | 0 (0.0%) | 5 (100.0%) |
| Cleaning & Maintenance | 1 (12.5%) | 7 (87.5%) |
| Personal Care & Service | 3 (60.0%) | 2 (40.0%) |
| Total (Category) | 9 (13.0%) | 60 (87.0%) |
| Total (Overall) | 70 (39.8%) | 106 (60.2%) |
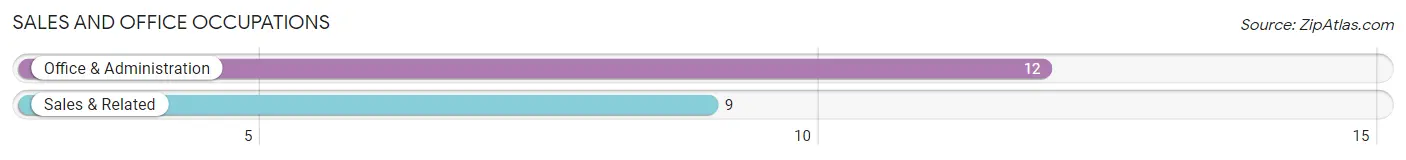
Sales and Office Occupations
The most common Sales and Office occupations in Spring Grove are Office & Administration (12 | 6.8%), and Sales & Related (9 | 5.1%).
Sales and Office Occupations by Sex
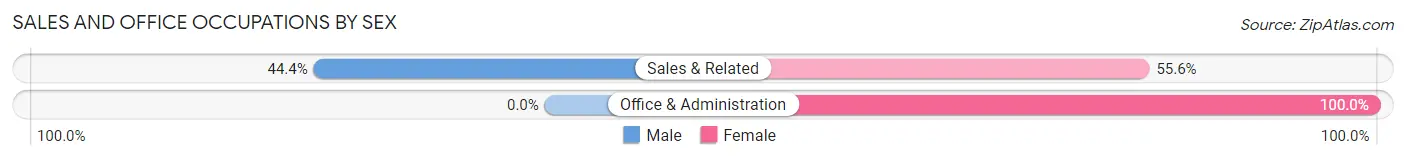
| Occupation | Male | Female |
| Sales & Related | 4 (44.4%) | 5 (55.6%) |
| Office & Administration | 0 (0.0%) | 12 (100.0%) |
| Total (Category) | 4 (19.1%) | 17 (80.9%) |
| Total (Overall) | 70 (39.8%) | 106 (60.2%) |
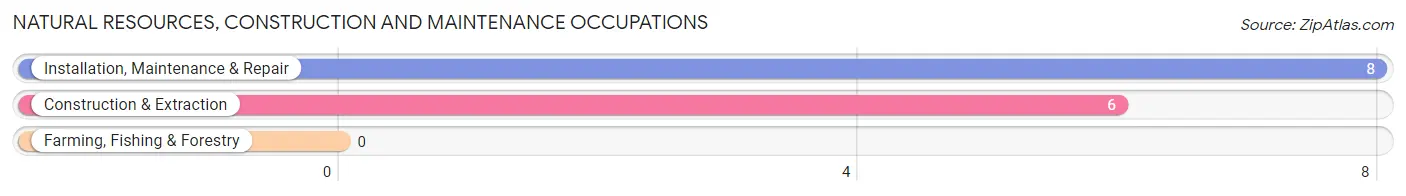
Natural Resources, Construction and Maintenance Occupations
The most common Natural Resources, Construction and Maintenance occupations in Spring Grove are Installation, Maintenance & Repair (8 | 4.5%), and Construction & Extraction (6 | 3.4%).
Natural Resources, Construction and Maintenance Occupations by Sex
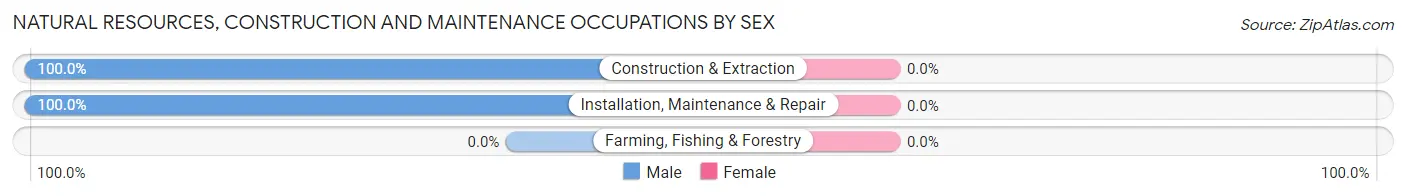
| Occupation | Male | Female |
| Farming, Fishing & Forestry | 0 (0.0%) | 0 (0.0%) |
| Construction & Extraction | 6 (100.0%) | 0 (0.0%) |
| Installation, Maintenance & Repair | 8 (100.0%) | 0 (0.0%) |
| Total (Category) | 14 (100.0%) | 0 (0.0%) |
| Total (Overall) | 70 (39.8%) | 106 (60.2%) |
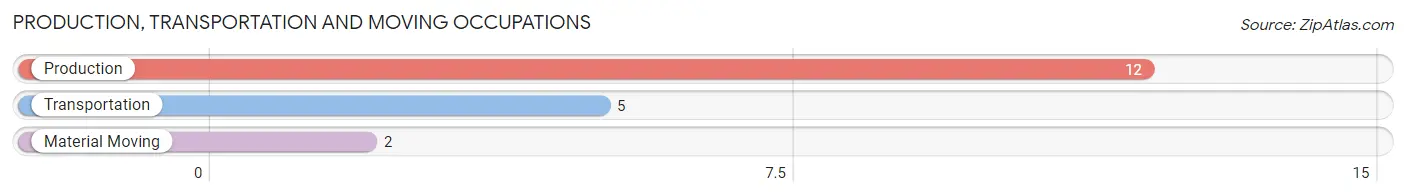
Production, Transportation and Moving Occupations
The most common Production, Transportation and Moving occupations in Spring Grove are Production (12 | 6.8%), Transportation (5 | 2.8%), and Material Moving (2 | 1.1%).
Production, Transportation and Moving Occupations by Sex
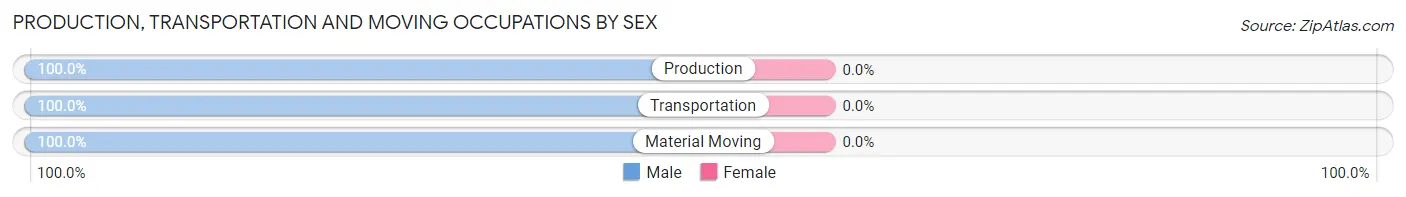
| Occupation | Male | Female |
| Production | 12 (100.0%) | 0 (0.0%) |
| Transportation | 5 (100.0%) | 0 (0.0%) |
| Material Moving | 2 (100.0%) | 0 (0.0%) |
| Total (Category) | 19 (100.0%) | 0 (0.0%) |
| Total (Overall) | 70 (39.8%) | 106 (60.2%) |
Employment Industries by Sex in Spring Grove
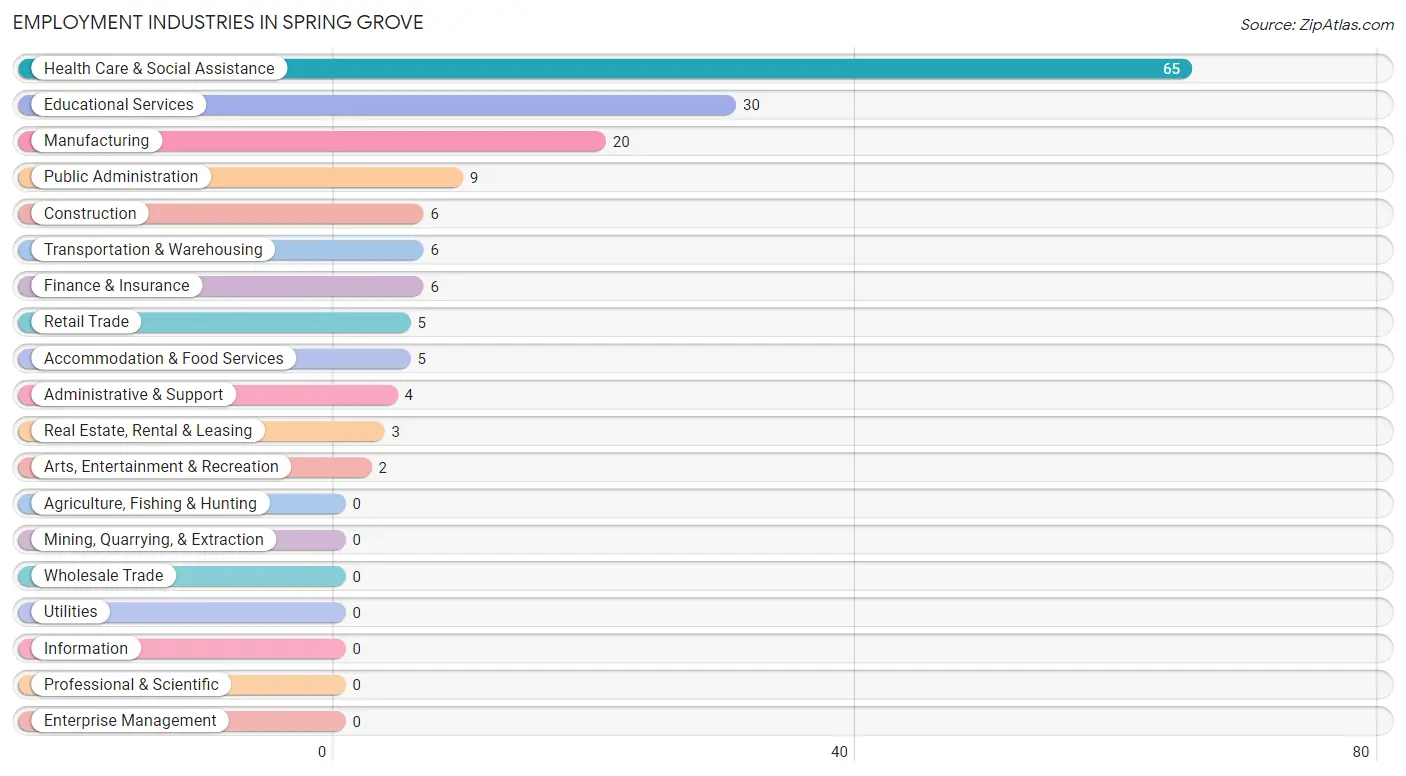
Employment Industries in Spring Grove
The major employment industries in Spring Grove include Health Care & Social Assistance (65 | 36.9%), Educational Services (30 | 17.1%), Manufacturing (20 | 11.4%), Public Administration (9 | 5.1%), and Construction (6 | 3.4%).
Employment Industries by Sex in Spring Grove
The Spring Grove industries that see more men than women are Construction (100.0%), Transportation & Warehousing (100.0%), and Manufacturing (85.0%), whereas the industries that tend to have a higher number of women are Real Estate, Rental & Leasing (100.0%), Arts, Entertainment & Recreation (100.0%), and Accommodation & Food Services (100.0%).
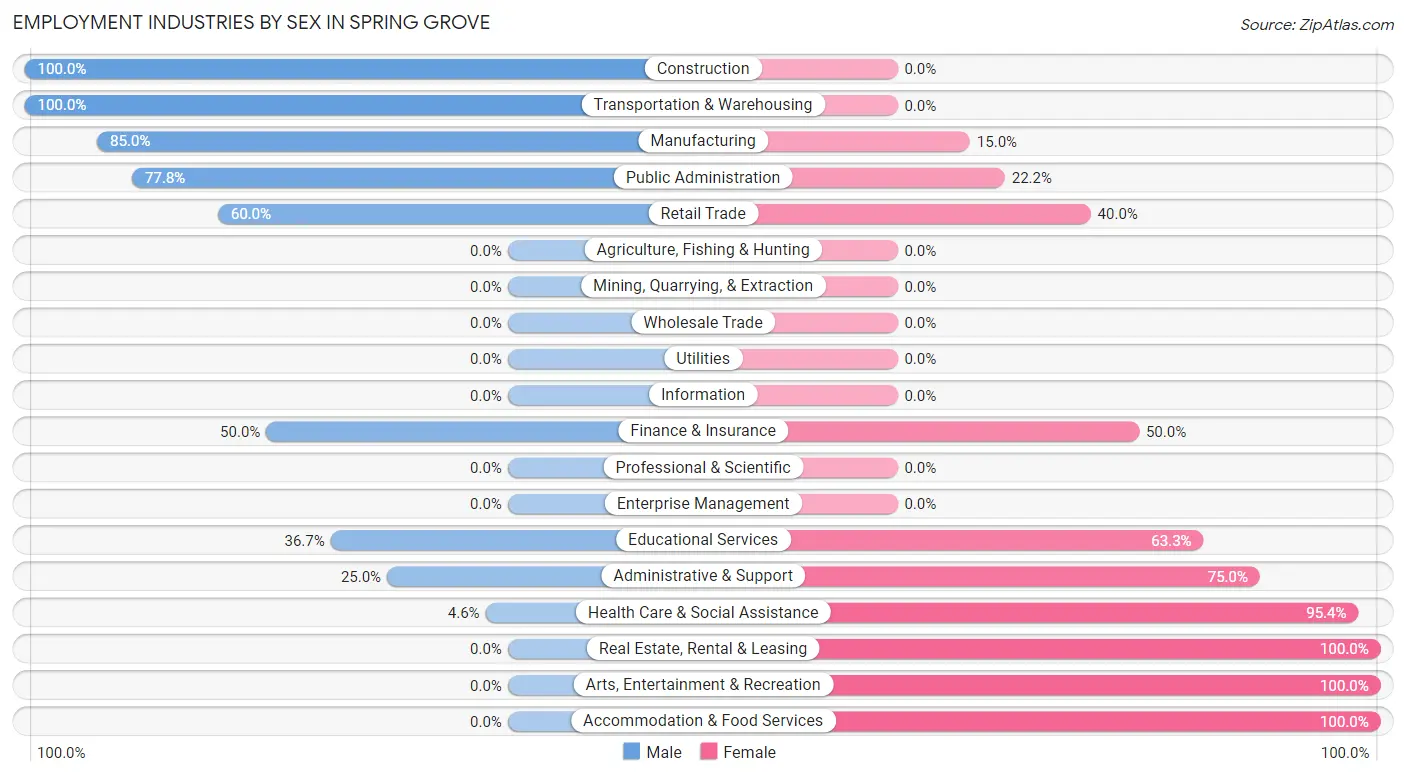
| Industry | Male | Female |
| Agriculture, Fishing & Hunting | 0 (0.0%) | 0 (0.0%) |
| Mining, Quarrying, & Extraction | 0 (0.0%) | 0 (0.0%) |
| Construction | 6 (100.0%) | 0 (0.0%) |
| Manufacturing | 17 (85.0%) | 3 (15.0%) |
| Wholesale Trade | 0 (0.0%) | 0 (0.0%) |
| Retail Trade | 3 (60.0%) | 2 (40.0%) |
| Transportation & Warehousing | 6 (100.0%) | 0 (0.0%) |
| Utilities | 0 (0.0%) | 0 (0.0%) |
| Information | 0 (0.0%) | 0 (0.0%) |
| Finance & Insurance | 3 (50.0%) | 3 (50.0%) |
| Real Estate, Rental & Leasing | 0 (0.0%) | 3 (100.0%) |
| Professional & Scientific | 0 (0.0%) | 0 (0.0%) |
| Enterprise Management | 0 (0.0%) | 0 (0.0%) |
| Administrative & Support | 1 (25.0%) | 3 (75.0%) |
| Educational Services | 11 (36.7%) | 19 (63.3%) |
| Health Care & Social Assistance | 3 (4.6%) | 62 (95.4%) |
| Arts, Entertainment & Recreation | 0 (0.0%) | 2 (100.0%) |
| Accommodation & Food Services | 0 (0.0%) | 5 (100.0%) |
| Public Administration | 7 (77.8%) | 2 (22.2%) |
| Total | 70 (39.8%) | 106 (60.2%) |
Education in Spring Grove
School Enrollment in Spring Grove
The most common levels of schooling among the 115 students in Spring Grove are college / undergraduate (52 | 45.2%), elementary school (30 | 26.1%), and high school (12 | 10.4%).
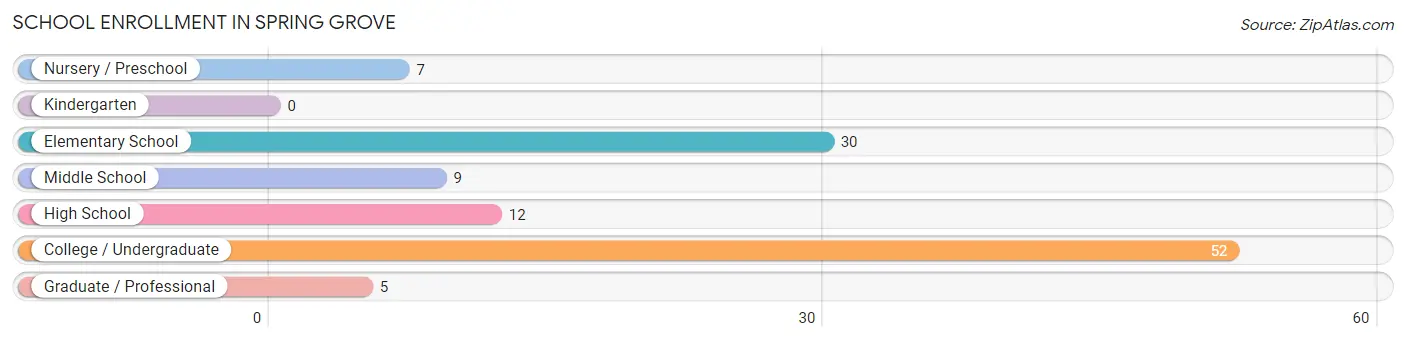
| School Level | # Students | % Students |
| Nursery / Preschool | 7 | 6.1% |
| Kindergarten | 0 | 0.0% |
| Elementary School | 30 | 26.1% |
| Middle School | 9 | 7.8% |
| High School | 12 | 10.4% |
| College / Undergraduate | 52 | 45.2% |
| Graduate / Professional | 5 | 4.3% |
| Total | 115 | 100.0% |
School Enrollment by Age by Funding Source in Spring Grove
Out of a total of 115 students who are enrolled in schools in Spring Grove, 18 (15.7%) attend a private institution, while the remaining 97 (84.3%) are enrolled in public schools. The age group of 20 to 24 year olds has the highest likelihood of being enrolled in private schools, with 4 (100.0% in the age bracket) enrolled. Conversely, the age group of 15 to 17 year olds has the lowest likelihood of being enrolled in a private school, with 5 (100.0% in the age bracket) attending a public institution.
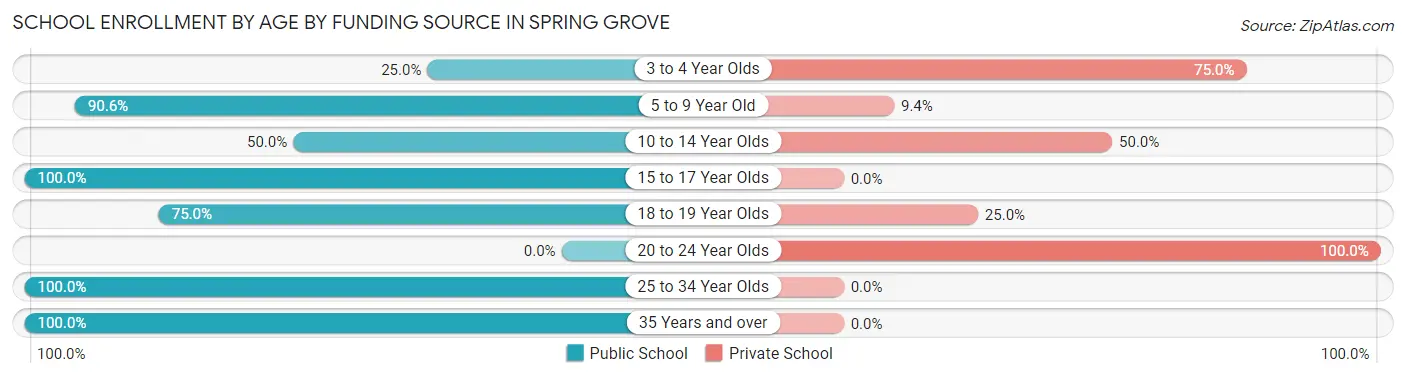
| Age Bracket | Public School | Private School |
| 3 to 4 Year Olds | 1 (25.0%) | 3 (75.0%) |
| 5 to 9 Year Old | 29 (90.6%) | 3 (9.4%) |
| 10 to 14 Year Olds | 5 (50.0%) | 5 (50.0%) |
| 15 to 17 Year Olds | 5 (100.0%) | 0 (0.0%) |
| 18 to 19 Year Olds | 9 (75.0%) | 3 (25.0%) |
| 20 to 24 Year Olds | 0 (0.0%) | 4 (100.0%) |
| 25 to 34 Year Olds | 40 (100.0%) | 0 (0.0%) |
| 35 Years and over | 8 (100.0%) | 0 (0.0%) |
| Total | 97 (84.3%) | 18 (15.7%) |
Educational Attainment by Field of Study in Spring Grove
Education (26 | 26.8%), physical & health sciences (9 | 9.3%), engineering (9 | 9.3%), arts & humanities (9 | 9.3%), and science & technology (8 | 8.3%) are the most common fields of study among 97 individuals in Spring Grove who have obtained a bachelor's degree or higher.
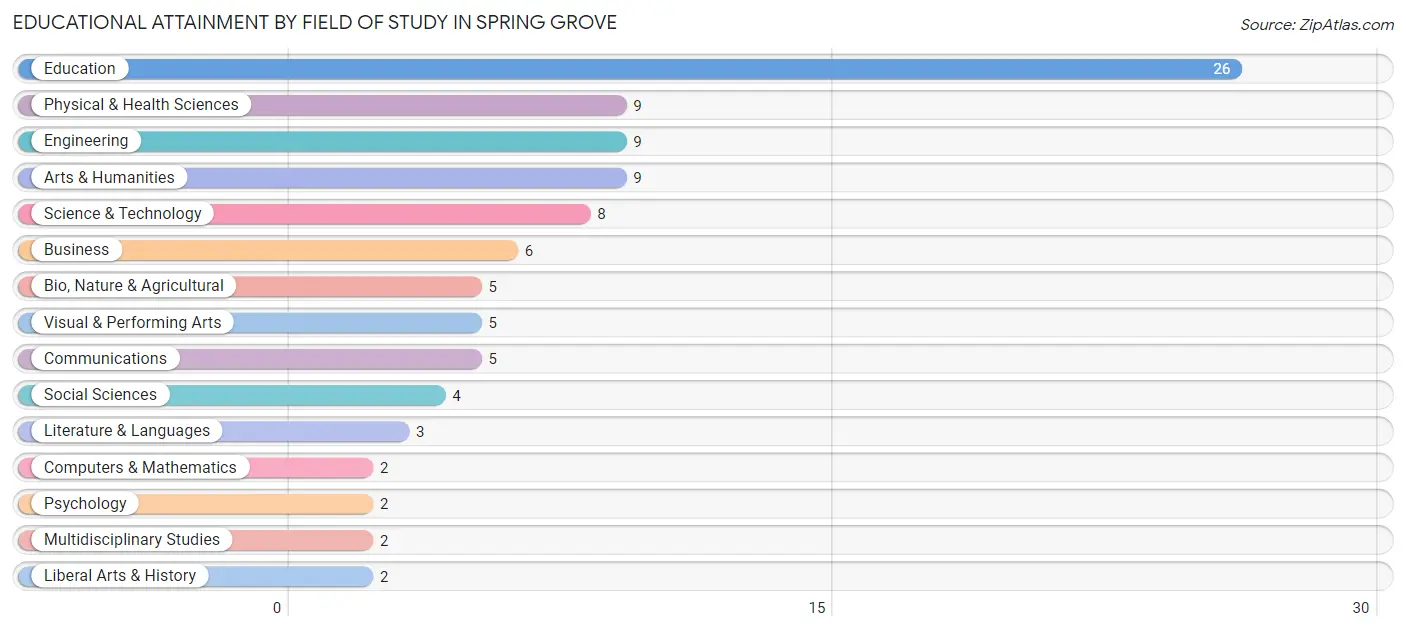
| Field of Study | # Graduates | % Graduates |
| Computers & Mathematics | 2 | 2.1% |
| Bio, Nature & Agricultural | 5 | 5.1% |
| Physical & Health Sciences | 9 | 9.3% |
| Psychology | 2 | 2.1% |
| Social Sciences | 4 | 4.1% |
| Engineering | 9 | 9.3% |
| Multidisciplinary Studies | 2 | 2.1% |
| Science & Technology | 8 | 8.3% |
| Business | 6 | 6.2% |
| Education | 26 | 26.8% |
| Literature & Languages | 3 | 3.1% |
| Liberal Arts & History | 2 | 2.1% |
| Visual & Performing Arts | 5 | 5.1% |
| Communications | 5 | 5.1% |
| Arts & Humanities | 9 | 9.3% |
| Total | 97 | 100.0% |
Transportation & Commute in Spring Grove
Vehicle Availability by Sex in Spring Grove
The most prevalent vehicle ownership categories in Spring Grove are males with 2 vehicles (35, accounting for 50.0%) and females with 2 vehicles (60, making up 33.7%).
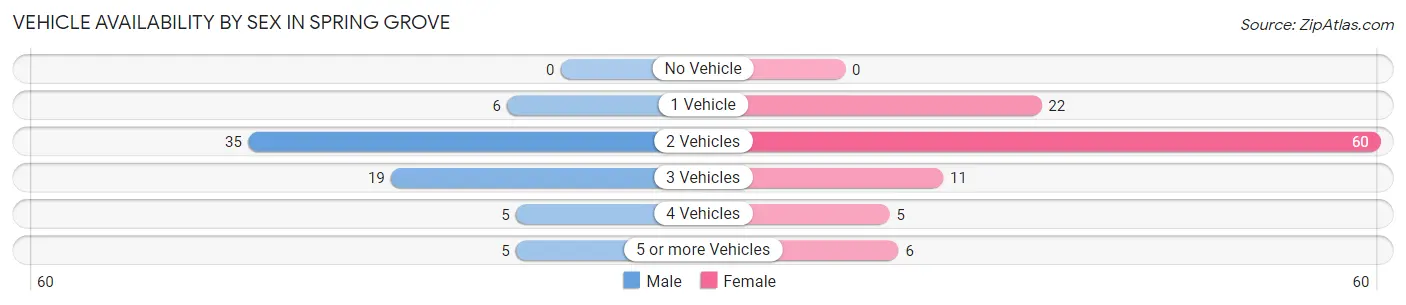
| Vehicles Available | Male | Female |
| No Vehicle | 0 (0.0%) | 0 (0.0%) |
| 1 Vehicle | 6 (8.6%) | 22 (21.1%) |
| 2 Vehicles | 35 (50.0%) | 60 (57.7%) |
| 3 Vehicles | 19 (27.1%) | 11 (10.6%) |
| 4 Vehicles | 5 (7.1%) | 5 (4.8%) |
| 5 or more Vehicles | 5 (7.1%) | 6 (5.8%) |
| Total | 70 (100.0%) | 104 (100.0%) |
Commute Time in Spring Grove
The most frequently occuring commute durations in Spring Grove are 5 to 9 minutes (50 commuters, 29.8%), 30 to 34 minutes (42 commuters, 25.0%), and less than 5 minutes (38 commuters, 22.6%).
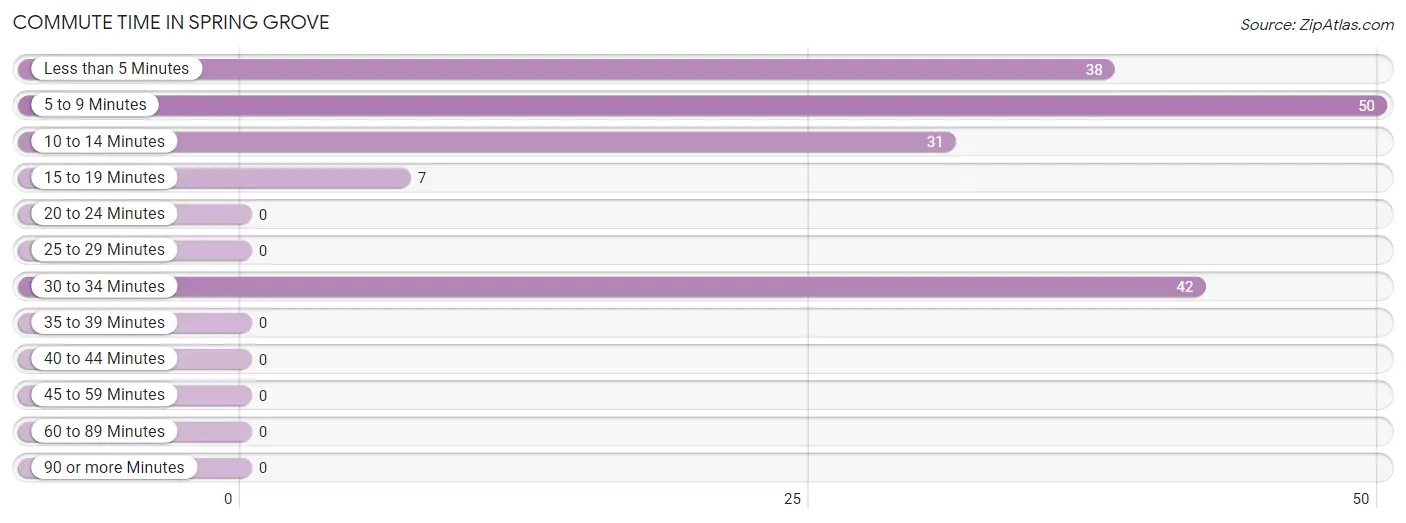
| Commute Time | # Commuters | % Commuters |
| Less than 5 Minutes | 38 | 22.6% |
| 5 to 9 Minutes | 50 | 29.8% |
| 10 to 14 Minutes | 31 | 18.4% |
| 15 to 19 Minutes | 7 | 4.2% |
| 20 to 24 Minutes | 0 | 0.0% |
| 25 to 29 Minutes | 0 | 0.0% |
| 30 to 34 Minutes | 42 | 25.0% |
| 35 to 39 Minutes | 0 | 0.0% |
| 40 to 44 Minutes | 0 | 0.0% |
| 45 to 59 Minutes | 0 | 0.0% |
| 60 to 89 Minutes | 0 | 0.0% |
| 90 or more Minutes | 0 | 0.0% |
Commute Time by Sex in Spring Grove
The most common commute times in Spring Grove are less than 5 minutes (26 commuters, 38.8%) for males and 30 to 34 minutes (40 commuters, 39.6%) for females.
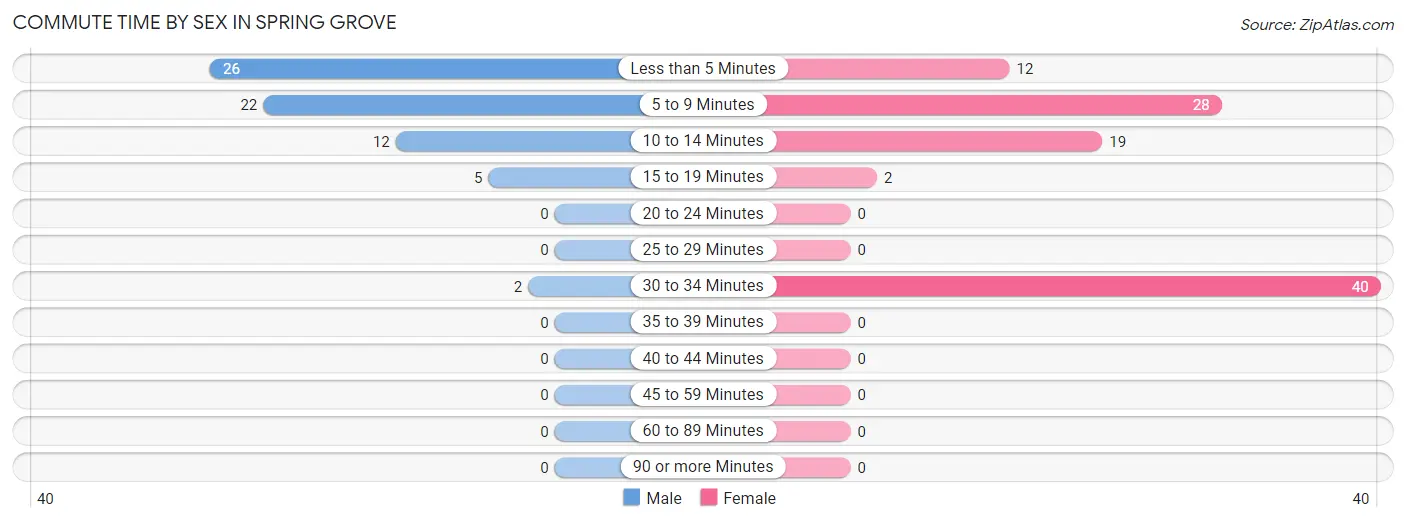
| Commute Time | Male | Female |
| Less than 5 Minutes | 26 (38.8%) | 12 (11.9%) |
| 5 to 9 Minutes | 22 (32.8%) | 28 (27.7%) |
| 10 to 14 Minutes | 12 (17.9%) | 19 (18.8%) |
| 15 to 19 Minutes | 5 (7.5%) | 2 (2.0%) |
| 20 to 24 Minutes | 0 (0.0%) | 0 (0.0%) |
| 25 to 29 Minutes | 0 (0.0%) | 0 (0.0%) |
| 30 to 34 Minutes | 2 (3.0%) | 40 (39.6%) |
| 35 to 39 Minutes | 0 (0.0%) | 0 (0.0%) |
| 40 to 44 Minutes | 0 (0.0%) | 0 (0.0%) |
| 45 to 59 Minutes | 0 (0.0%) | 0 (0.0%) |
| 60 to 89 Minutes | 0 (0.0%) | 0 (0.0%) |
| 90 or more Minutes | 0 (0.0%) | 0 (0.0%) |
Time of Departure to Work by Sex in Spring Grove
The most frequent times of departure to work in Spring Grove are 8:00 AM to 8:29 AM (21, 31.3%) for males and 5:30 AM to 5:59 AM (42, 41.6%) for females.
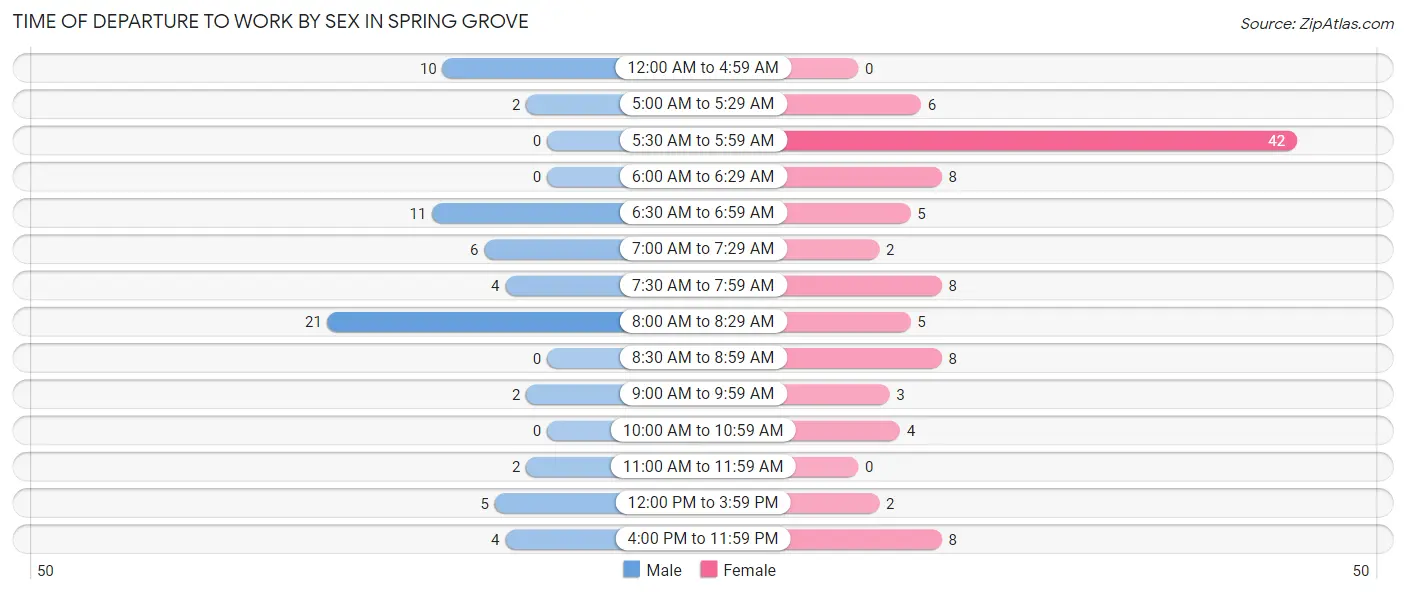
| Time of Departure | Male | Female |
| 12:00 AM to 4:59 AM | 10 (14.9%) | 0 (0.0%) |
| 5:00 AM to 5:29 AM | 2 (3.0%) | 6 (5.9%) |
| 5:30 AM to 5:59 AM | 0 (0.0%) | 42 (41.6%) |
| 6:00 AM to 6:29 AM | 0 (0.0%) | 8 (7.9%) |
| 6:30 AM to 6:59 AM | 11 (16.4%) | 5 (5.0%) |
| 7:00 AM to 7:29 AM | 6 (9.0%) | 2 (2.0%) |
| 7:30 AM to 7:59 AM | 4 (6.0%) | 8 (7.9%) |
| 8:00 AM to 8:29 AM | 21 (31.3%) | 5 (5.0%) |
| 8:30 AM to 8:59 AM | 0 (0.0%) | 8 (7.9%) |
| 9:00 AM to 9:59 AM | 2 (3.0%) | 3 (3.0%) |
| 10:00 AM to 10:59 AM | 0 (0.0%) | 4 (4.0%) |
| 11:00 AM to 11:59 AM | 2 (3.0%) | 0 (0.0%) |
| 12:00 PM to 3:59 PM | 5 (7.5%) | 2 (2.0%) |
| 4:00 PM to 11:59 PM | 4 (6.0%) | 8 (7.9%) |
| Total | 67 (100.0%) | 101 (100.0%) |
Housing Occupancy in Spring Grove
Occupancy by Ownership in Spring Grove
Of the total 182 dwellings in Spring Grove, owner-occupied units account for 125 (68.7%), while renter-occupied units make up 57 (31.3%).
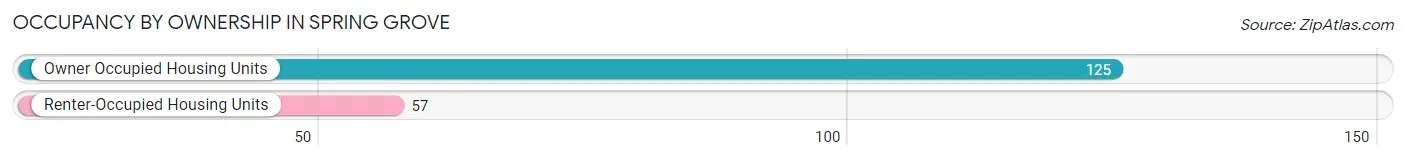
| Occupancy | # Housing Units | % Housing Units |
| Owner Occupied Housing Units | 125 | 68.7% |
| Renter-Occupied Housing Units | 57 | 31.3% |
| Total Occupied Housing Units | 182 | 100.0% |
Occupancy by Household Size in Spring Grove
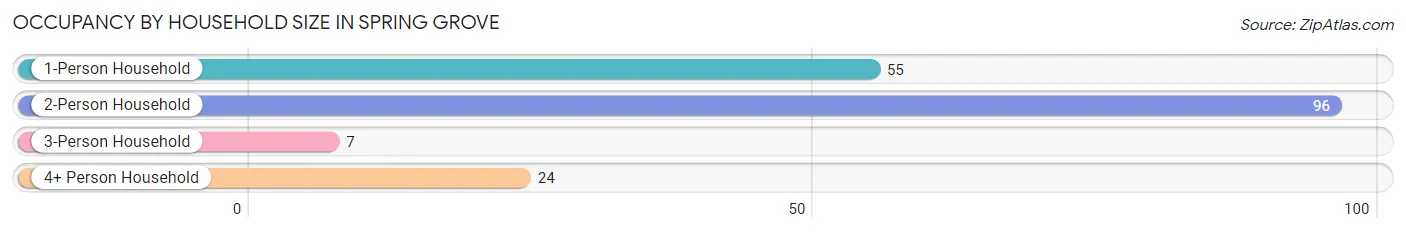
| Household Size | # Housing Units | % Housing Units |
| 1-Person Household | 55 | 30.2% |
| 2-Person Household | 96 | 52.7% |
| 3-Person Household | 7 | 3.8% |
| 4+ Person Household | 24 | 13.2% |
| Total Housing Units | 182 | 100.0% |
Occupancy by Ownership by Household Size in Spring Grove
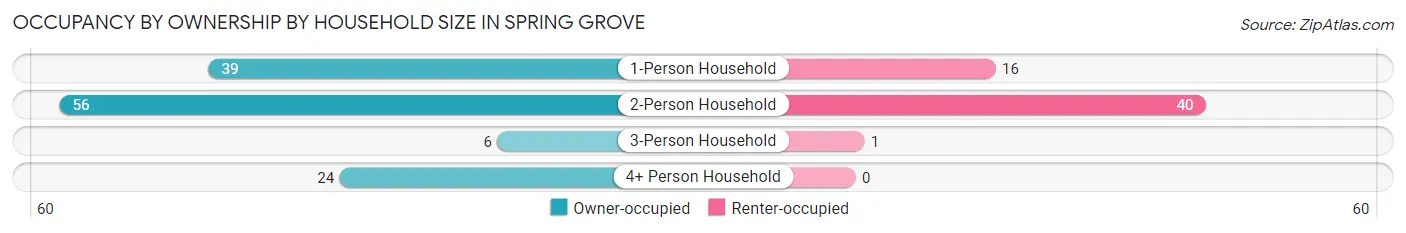
| Household Size | Owner-occupied | Renter-occupied |
| 1-Person Household | 39 (70.9%) | 16 (29.1%) |
| 2-Person Household | 56 (58.3%) | 40 (41.7%) |
| 3-Person Household | 6 (85.7%) | 1 (14.3%) |
| 4+ Person Household | 24 (100.0%) | 0 (0.0%) |
| Total Housing Units | 125 (68.7%) | 57 (31.3%) |
Occupancy by Educational Attainment in Spring Grove
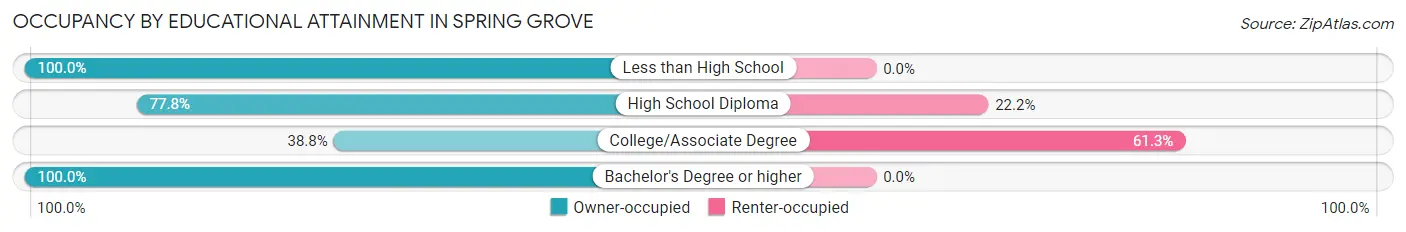
| Household Size | Owner-occupied | Renter-occupied |
| Less than High School | 19 (100.0%) | 0 (0.0%) |
| High School Diploma | 28 (77.8%) | 8 (22.2%) |
| College/Associate Degree | 31 (38.8%) | 49 (61.3%) |
| Bachelor's Degree or higher | 47 (100.0%) | 0 (0.0%) |
Occupancy by Age of Householder in Spring Grove
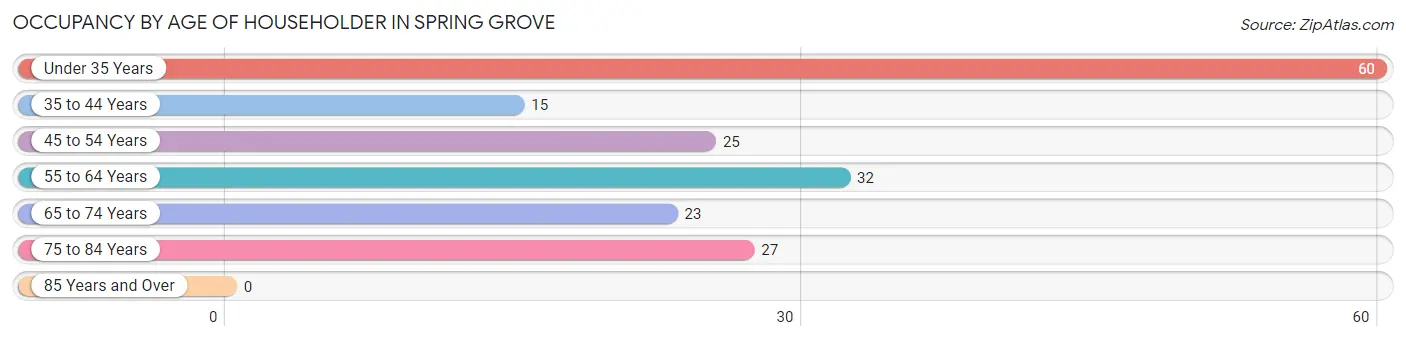
| Age Bracket | # Households | % Households |
| Under 35 Years | 60 | 33.0% |
| 35 to 44 Years | 15 | 8.2% |
| 45 to 54 Years | 25 | 13.7% |
| 55 to 64 Years | 32 | 17.6% |
| 65 to 74 Years | 23 | 12.6% |
| 75 to 84 Years | 27 | 14.8% |
| 85 Years and Over | 0 | 0.0% |
| Total | 182 | 100.0% |
Housing Finances in Spring Grove
Median Income by Occupancy in Spring Grove
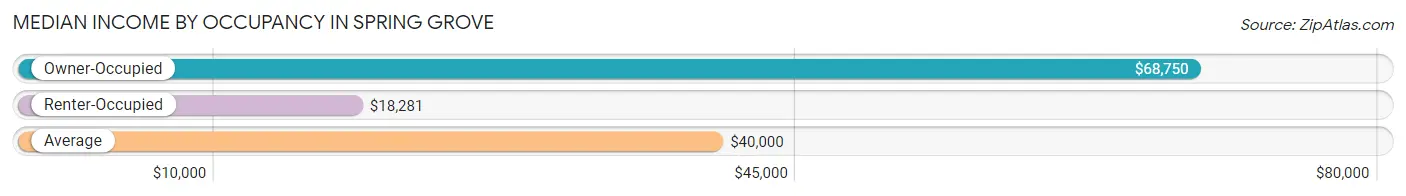
| Occupancy Type | # Households | Median Income |
| Owner-Occupied | 125 (68.7%) | $68,750 |
| Renter-Occupied | 57 (31.3%) | $18,281 |
| Average | 182 (100.0%) | $40,000 |
Occupancy by Householder Income Bracket in Spring Grove
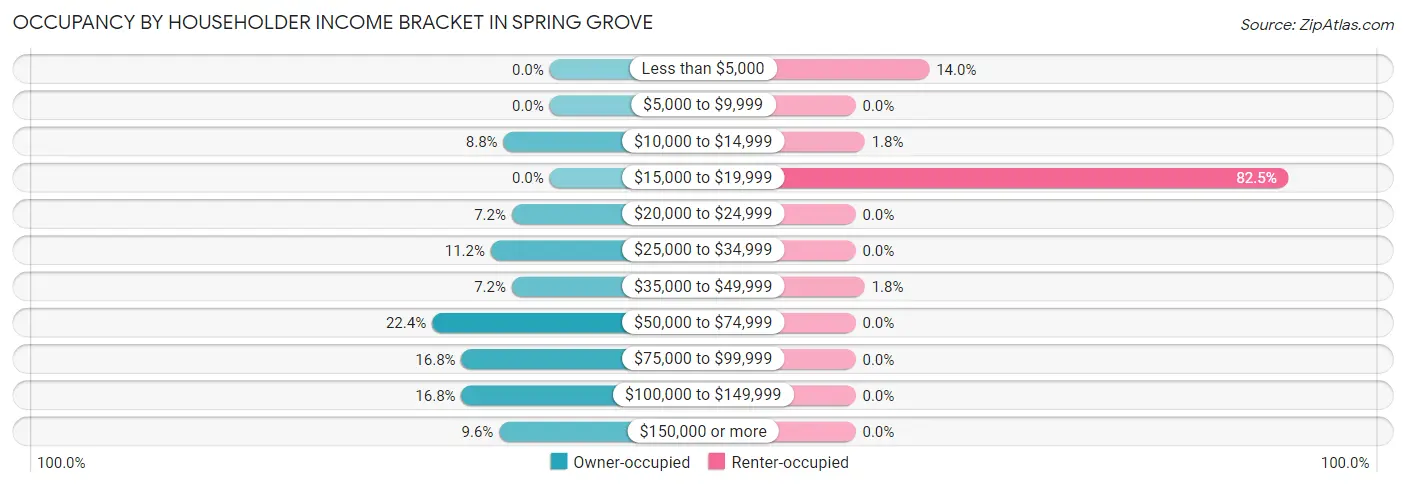
| Income Bracket | Owner-occupied | Renter-occupied |
| Less than $5,000 | 0 (0.0%) | 8 (14.0%) |
| $5,000 to $9,999 | 0 (0.0%) | 0 (0.0%) |
| $10,000 to $14,999 | 11 (8.8%) | 1 (1.8%) |
| $15,000 to $19,999 | 0 (0.0%) | 47 (82.5%) |
| $20,000 to $24,999 | 9 (7.2%) | 0 (0.0%) |
| $25,000 to $34,999 | 14 (11.2%) | 0 (0.0%) |
| $35,000 to $49,999 | 9 (7.2%) | 1 (1.8%) |
| $50,000 to $74,999 | 28 (22.4%) | 0 (0.0%) |
| $75,000 to $99,999 | 21 (16.8%) | 0 (0.0%) |
| $100,000 to $149,999 | 21 (16.8%) | 0 (0.0%) |
| $150,000 or more | 12 (9.6%) | 0 (0.0%) |
| Total | 125 (100.0%) | 57 (100.0%) |
Monthly Housing Cost Tiers in Spring Grove
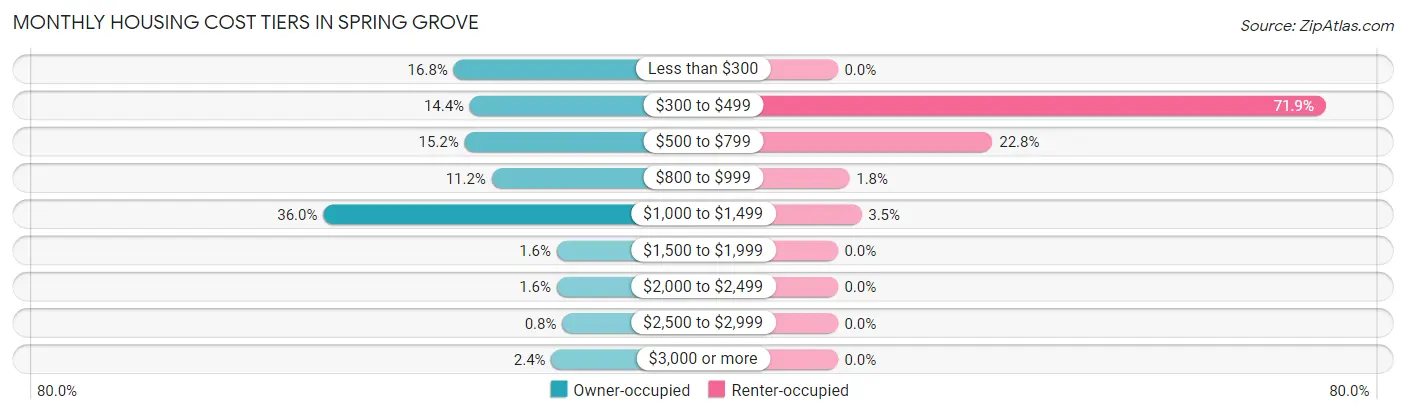
| Monthly Cost | Owner-occupied | Renter-occupied |
| Less than $300 | 21 (16.8%) | 0 (0.0%) |
| $300 to $499 | 18 (14.4%) | 41 (71.9%) |
| $500 to $799 | 19 (15.2%) | 13 (22.8%) |
| $800 to $999 | 14 (11.2%) | 1 (1.8%) |
| $1,000 to $1,499 | 45 (36.0%) | 2 (3.5%) |
| $1,500 to $1,999 | 2 (1.6%) | 0 (0.0%) |
| $2,000 to $2,499 | 2 (1.6%) | 0 (0.0%) |
| $2,500 to $2,999 | 1 (0.8%) | 0 (0.0%) |
| $3,000 or more | 3 (2.4%) | 0 (0.0%) |
| Total | 125 (100.0%) | 57 (100.0%) |
Physical Housing Characteristics in Spring Grove
Housing Structures in Spring Grove
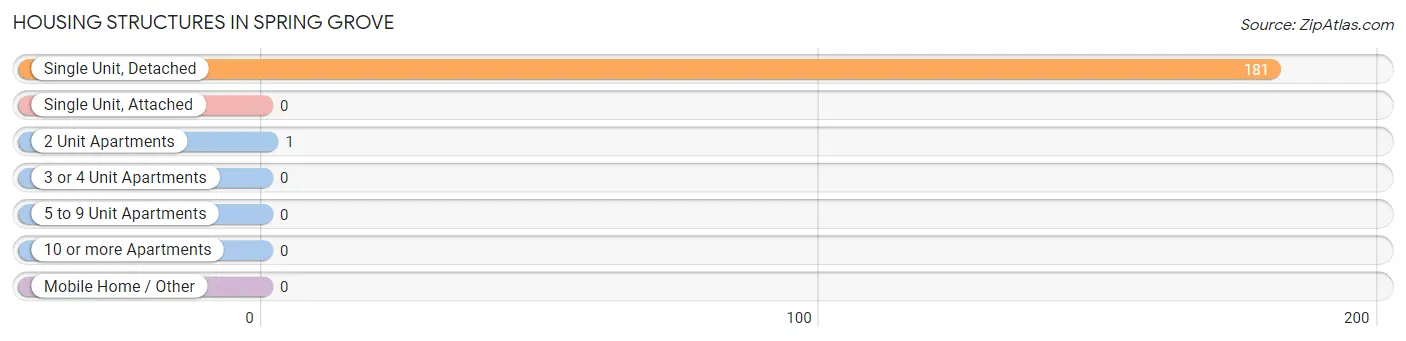
| Structure Type | # Housing Units | % Housing Units |
| Single Unit, Detached | 181 | 99.5% |
| Single Unit, Attached | 0 | 0.0% |
| 2 Unit Apartments | 1 | 0.5% |
| 3 or 4 Unit Apartments | 0 | 0.0% |
| 5 to 9 Unit Apartments | 0 | 0.0% |
| 10 or more Apartments | 0 | 0.0% |
| Mobile Home / Other | 0 | 0.0% |
| Total | 182 | 100.0% |
Housing Structures by Occupancy in Spring Grove
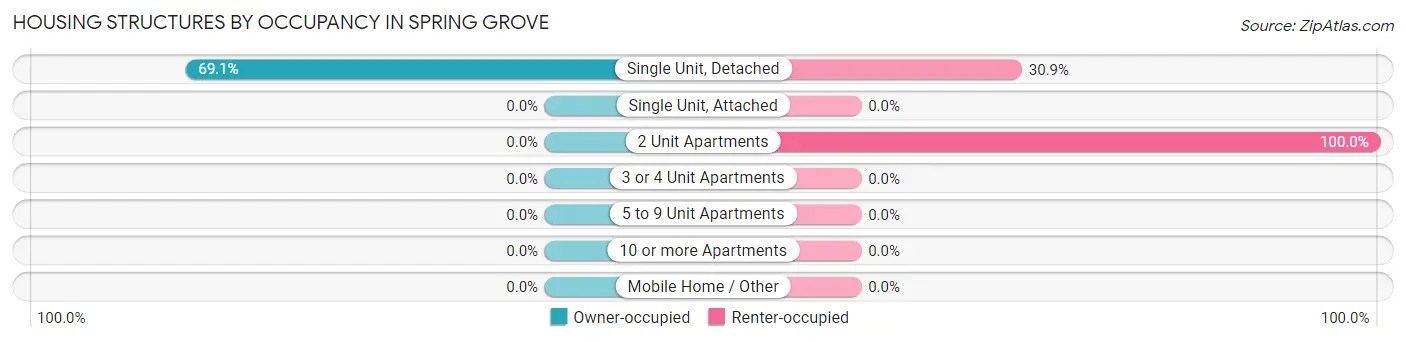
| Structure Type | Owner-occupied | Renter-occupied |
| Single Unit, Detached | 125 (69.1%) | 56 (30.9%) |
| Single Unit, Attached | 0 (0.0%) | 0 (0.0%) |
| 2 Unit Apartments | 0 (0.0%) | 1 (100.0%) |
| 3 or 4 Unit Apartments | 0 (0.0%) | 0 (0.0%) |
| 5 to 9 Unit Apartments | 0 (0.0%) | 0 (0.0%) |
| 10 or more Apartments | 0 (0.0%) | 0 (0.0%) |
| Mobile Home / Other | 0 (0.0%) | 0 (0.0%) |
| Total | 125 (68.7%) | 57 (31.3%) |
Housing Structures by Number of Rooms in Spring Grove
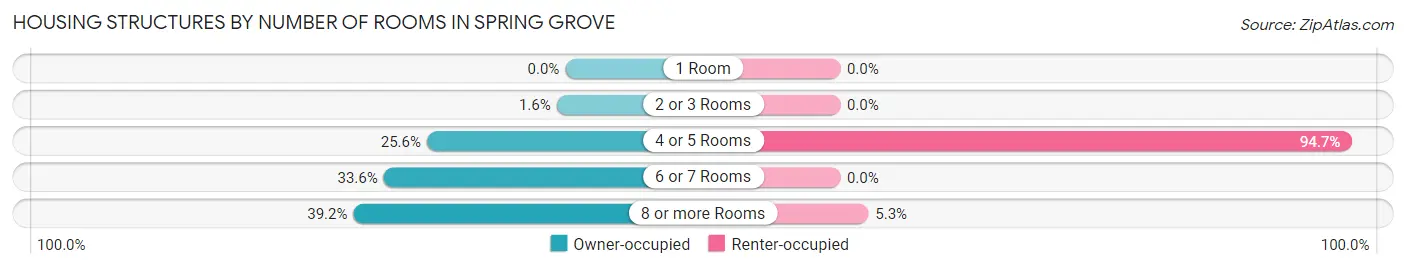
| Number of Rooms | Owner-occupied | Renter-occupied |
| 1 Room | 0 (0.0%) | 0 (0.0%) |
| 2 or 3 Rooms | 2 (1.6%) | 0 (0.0%) |
| 4 or 5 Rooms | 32 (25.6%) | 54 (94.7%) |
| 6 or 7 Rooms | 42 (33.6%) | 0 (0.0%) |
| 8 or more Rooms | 49 (39.2%) | 3 (5.3%) |
| Total | 125 (100.0%) | 57 (100.0%) |
Housing Structure by Heating Type in Spring Grove
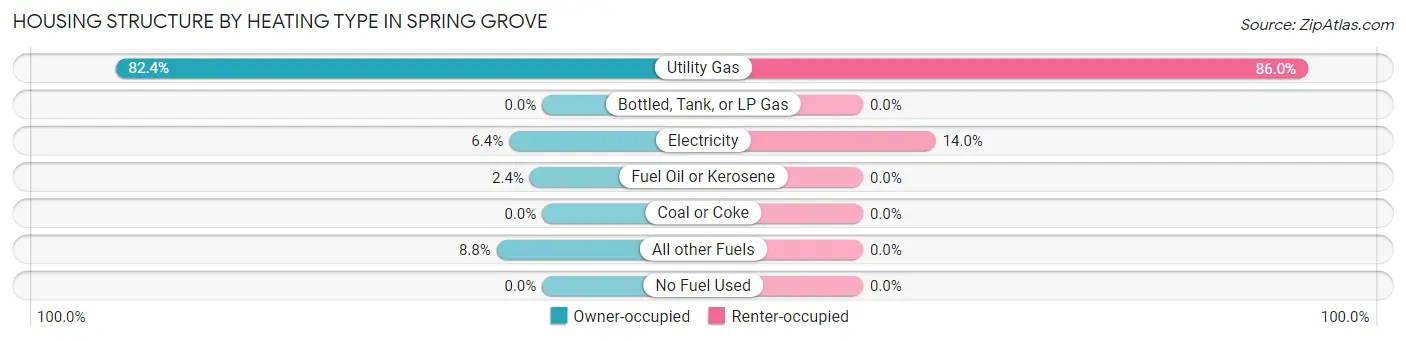
| Heating Type | Owner-occupied | Renter-occupied |
| Utility Gas | 103 (82.4%) | 49 (86.0%) |
| Bottled, Tank, or LP Gas | 0 (0.0%) | 0 (0.0%) |
| Electricity | 8 (6.4%) | 8 (14.0%) |
| Fuel Oil or Kerosene | 3 (2.4%) | 0 (0.0%) |
| Coal or Coke | 0 (0.0%) | 0 (0.0%) |
| All other Fuels | 11 (8.8%) | 0 (0.0%) |
| No Fuel Used | 0 (0.0%) | 0 (0.0%) |
| Total | 125 (100.0%) | 57 (100.0%) |
Household Vehicle Usage in Spring Grove
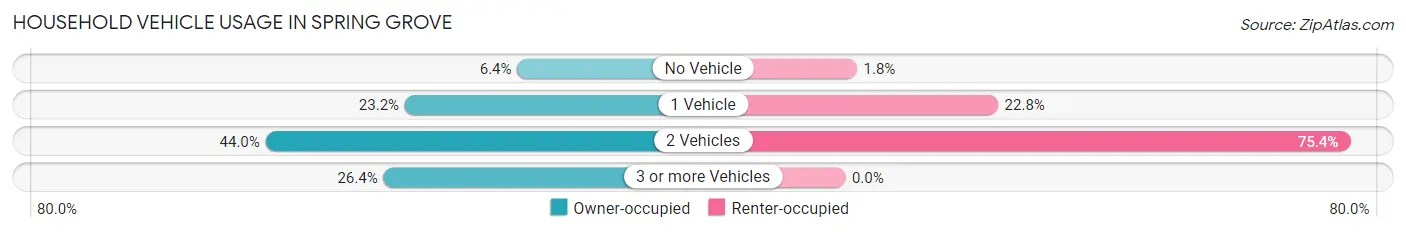
| Vehicles per Household | Owner-occupied | Renter-occupied |
| No Vehicle | 8 (6.4%) | 1 (1.8%) |
| 1 Vehicle | 29 (23.2%) | 13 (22.8%) |
| 2 Vehicles | 55 (44.0%) | 43 (75.4%) |
| 3 or more Vehicles | 33 (26.4%) | 0 (0.0%) |
| Total | 125 (100.0%) | 57 (100.0%) |
Real Estate & Mortgages in Spring Grove
Real Estate and Mortgage Overview in Spring Grove
| Characteristic | Without Mortgage | With Mortgage |
| Housing Units | 48 | 77 |
| Median Property Value | $93,300 | $137,100 |
| Median Household Income | $31,667 | $12 |
| Monthly Housing Costs | $380 | $3 |
| Real Estate Taxes | - | - |
Property Value by Mortgage Status in Spring Grove
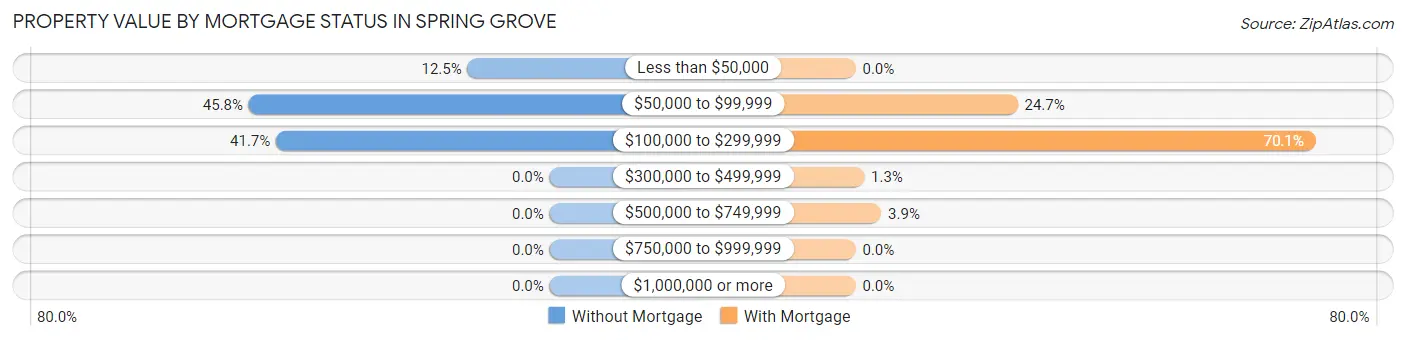
| Property Value | Without Mortgage | With Mortgage |
| Less than $50,000 | 6 (12.5%) | 0 (0.0%) |
| $50,000 to $99,999 | 22 (45.8%) | 19 (24.7%) |
| $100,000 to $299,999 | 20 (41.7%) | 54 (70.1%) |
| $300,000 to $499,999 | 0 (0.0%) | 1 (1.3%) |
| $500,000 to $749,999 | 0 (0.0%) | 3 (3.9%) |
| $750,000 to $999,999 | 0 (0.0%) | 0 (0.0%) |
| $1,000,000 or more | 0 (0.0%) | 0 (0.0%) |
| Total | 48 (100.0%) | 77 (100.0%) |
Household Income by Mortgage Status in Spring Grove
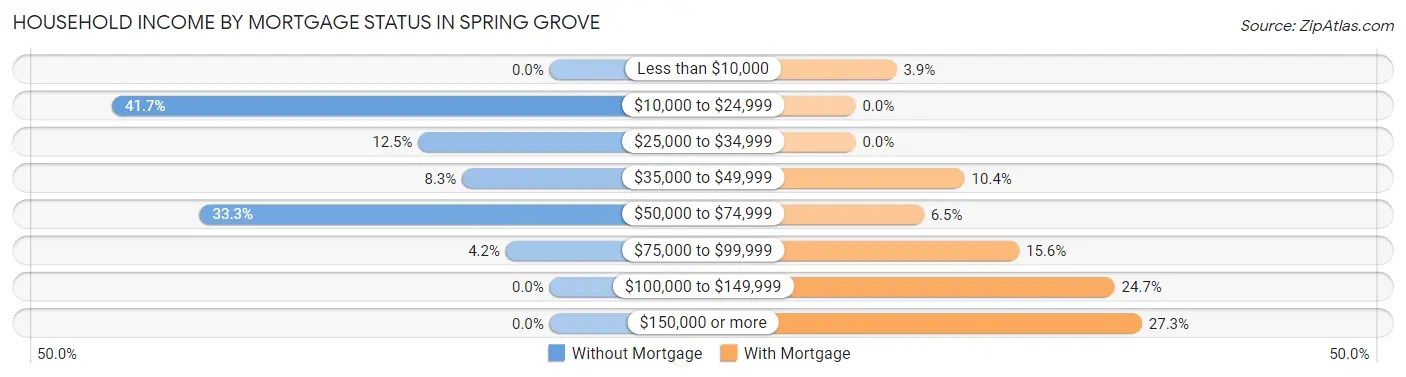
| Household Income | Without Mortgage | With Mortgage |
| Less than $10,000 | 0 (0.0%) | 3 (3.9%) |
| $10,000 to $24,999 | 20 (41.7%) | 0 (0.0%) |
| $25,000 to $34,999 | 6 (12.5%) | 0 (0.0%) |
| $35,000 to $49,999 | 4 (8.3%) | 8 (10.4%) |
| $50,000 to $74,999 | 16 (33.3%) | 5 (6.5%) |
| $75,000 to $99,999 | 2 (4.2%) | 12 (15.6%) |
| $100,000 to $149,999 | 0 (0.0%) | 19 (24.7%) |
| $150,000 or more | 0 (0.0%) | 21 (27.3%) |
| Total | 48 (100.0%) | 77 (100.0%) |
Property Value to Household Income Ratio in Spring Grove
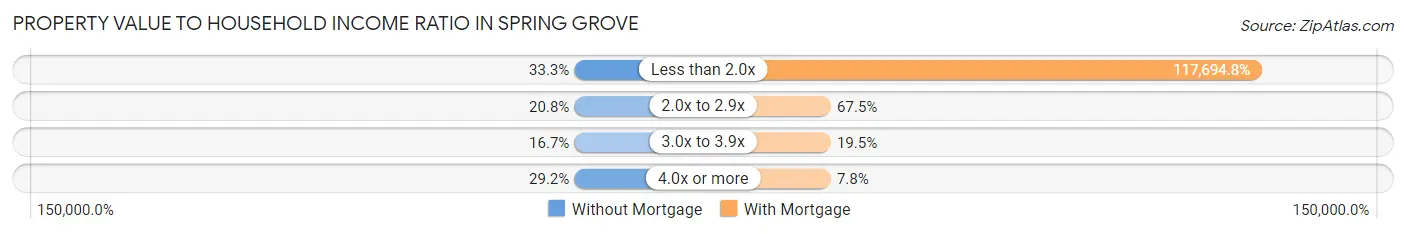
| Value-to-Income Ratio | Without Mortgage | With Mortgage |
| Less than 2.0x | 16 (33.3%) | 90,625 (117,694.8%) |
| 2.0x to 2.9x | 10 (20.8%) | 52 (67.5%) |
| 3.0x to 3.9x | 8 (16.7%) | 15 (19.5%) |
| 4.0x or more | 14 (29.2%) | 6 (7.8%) |
| Total | 48 (100.0%) | 77 (100.0%) |
Real Estate Taxes by Mortgage Status in Spring Grove
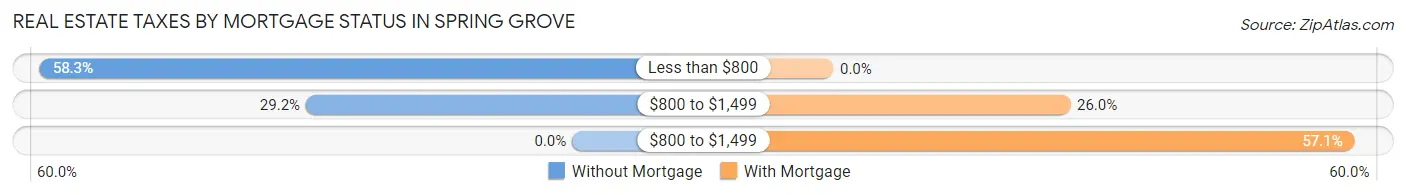
| Property Taxes | Without Mortgage | With Mortgage |
| Less than $800 | 28 (58.3%) | 0 (0.0%) |
| $800 to $1,499 | 14 (29.2%) | 20 (26.0%) |
| $800 to $1,499 | 0 (0.0%) | 44 (57.1%) |
| Total | 48 (100.0%) | 77 (100.0%) |
Health & Disability in Spring Grove
Health Insurance Coverage by Age in Spring Grove
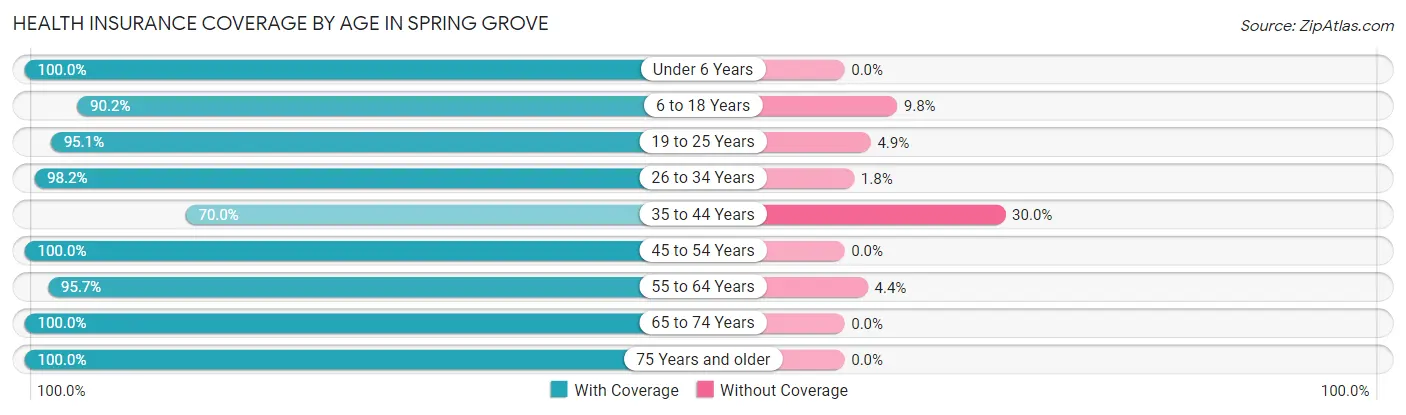
| Age Bracket | With Coverage | Without Coverage |
| Under 6 Years | 13 (100.0%) | 0 (0.0%) |
| 6 to 18 Years | 46 (90.2%) | 5 (9.8%) |
| 19 to 25 Years | 39 (95.1%) | 2 (4.9%) |
| 26 to 34 Years | 55 (98.2%) | 1 (1.8%) |
| 35 to 44 Years | 21 (70.0%) | 9 (30.0%) |
| 45 to 54 Years | 39 (100.0%) | 0 (0.0%) |
| 55 to 64 Years | 44 (95.7%) | 2 (4.3%) |
| 65 to 74 Years | 40 (100.0%) | 0 (0.0%) |
| 75 Years and older | 39 (100.0%) | 0 (0.0%) |
| Total | 336 (94.7%) | 19 (5.3%) |
Health Insurance Coverage by Citizenship Status in Spring Grove
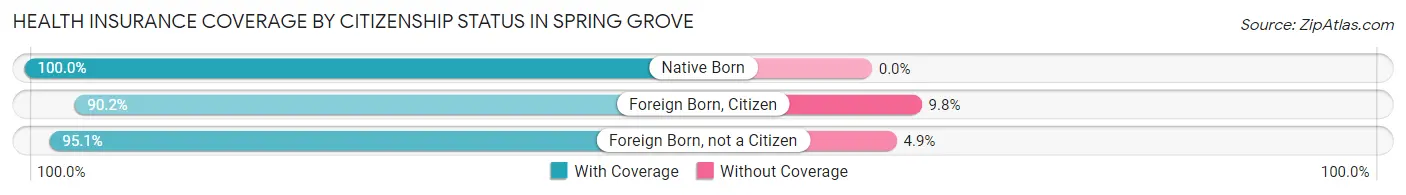
| Citizenship Status | With Coverage | Without Coverage |
| Native Born | 13 (100.0%) | 0 (0.0%) |
| Foreign Born, Citizen | 46 (90.2%) | 5 (9.8%) |
| Foreign Born, not a Citizen | 39 (95.1%) | 2 (4.9%) |
Health Insurance Coverage by Household Income in Spring Grove
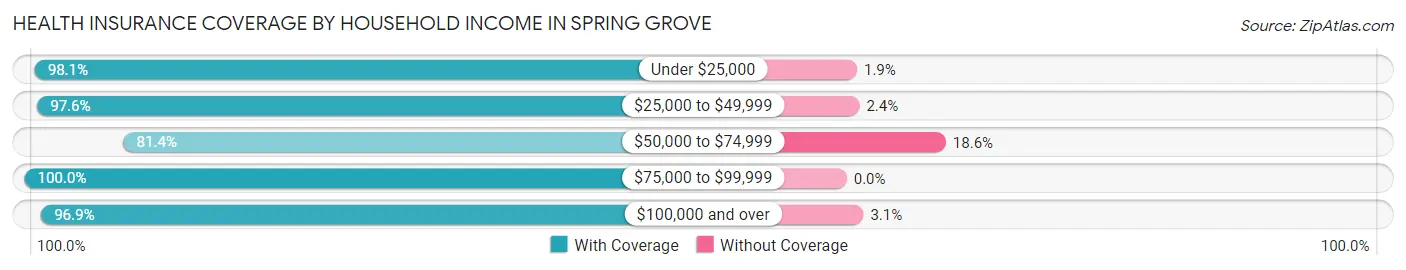
| Household Income | With Coverage | Without Coverage |
| Under $25,000 | 102 (98.1%) | 2 (1.9%) |
| $25,000 to $49,999 | 41 (97.6%) | 1 (2.4%) |
| $50,000 to $74,999 | 57 (81.4%) | 13 (18.6%) |
| $75,000 to $99,999 | 43 (100.0%) | 0 (0.0%) |
| $100,000 and over | 93 (96.9%) | 3 (3.1%) |
Public vs Private Health Insurance Coverage by Age in Spring Grove
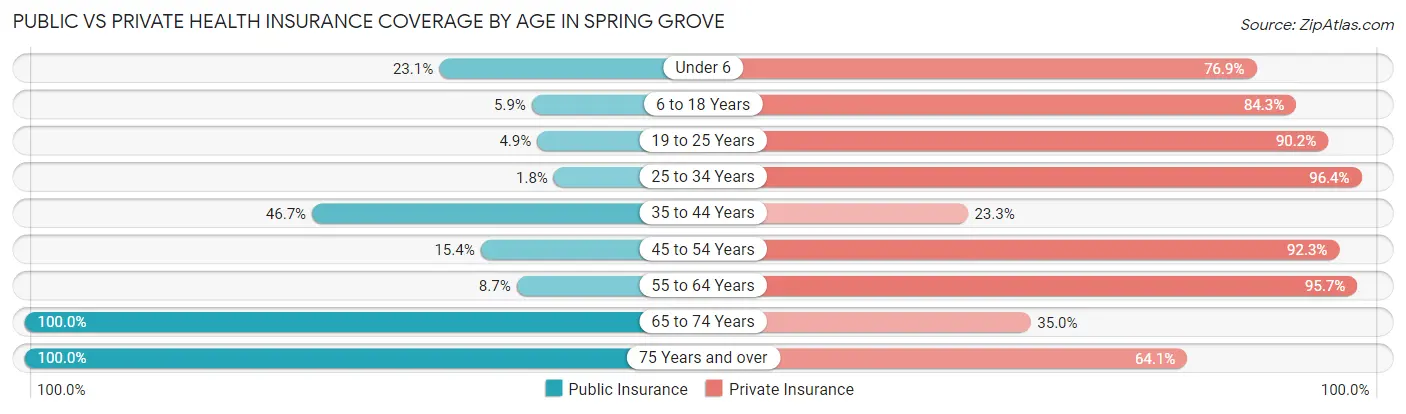
| Age Bracket | Public Insurance | Private Insurance |
| Under 6 | 3 (23.1%) | 10 (76.9%) |
| 6 to 18 Years | 3 (5.9%) | 43 (84.3%) |
| 19 to 25 Years | 2 (4.9%) | 37 (90.2%) |
| 25 to 34 Years | 1 (1.8%) | 54 (96.4%) |
| 35 to 44 Years | 14 (46.7%) | 7 (23.3%) |
| 45 to 54 Years | 6 (15.4%) | 36 (92.3%) |
| 55 to 64 Years | 4 (8.7%) | 44 (95.7%) |
| 65 to 74 Years | 40 (100.0%) | 14 (35.0%) |
| 75 Years and over | 39 (100.0%) | 25 (64.1%) |
| Total | 112 (31.6%) | 270 (76.1%) |
Disability Status by Sex by Age in Spring Grove
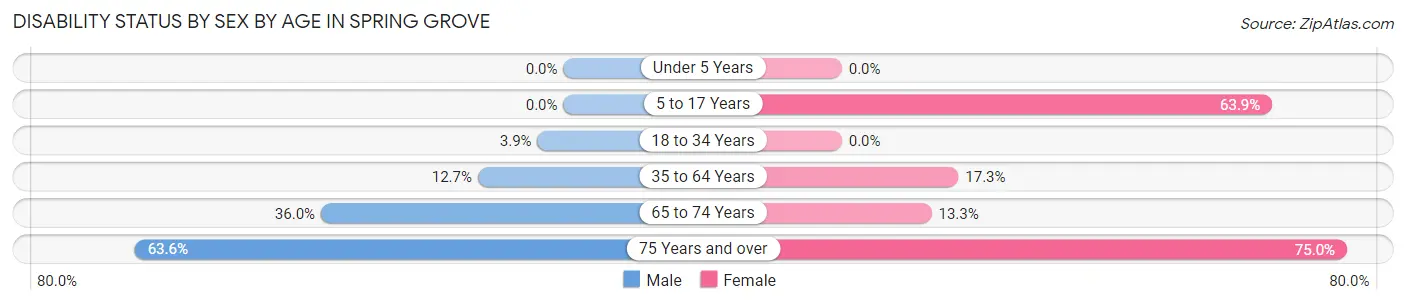
| Age Bracket | Male | Female |
| Under 5 Years | 0 (0.0%) | 0 (0.0%) |
| 5 to 17 Years | 0 (0.0%) | 23 (63.9%) |
| 18 to 34 Years | 1 (3.8%) | 0 (0.0%) |
| 35 to 64 Years | 8 (12.7%) | 9 (17.3%) |
| 65 to 74 Years | 9 (36.0%) | 2 (13.3%) |
| 75 Years and over | 7 (63.6%) | 21 (75.0%) |
Disability Class by Sex by Age in Spring Grove
Disability Class: Hearing Difficulty
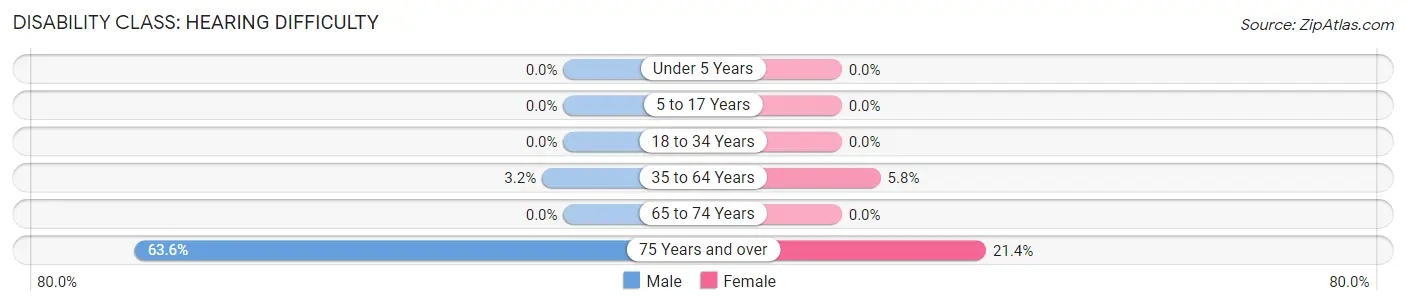
| Age Bracket | Male | Female |
| Under 5 Years | 0 (0.0%) | 0 (0.0%) |
| 5 to 17 Years | 0 (0.0%) | 0 (0.0%) |
| 18 to 34 Years | 0 (0.0%) | 0 (0.0%) |
| 35 to 64 Years | 2 (3.2%) | 3 (5.8%) |
| 65 to 74 Years | 0 (0.0%) | 0 (0.0%) |
| 75 Years and over | 7 (63.6%) | 6 (21.4%) |
Disability Class: Vision Difficulty
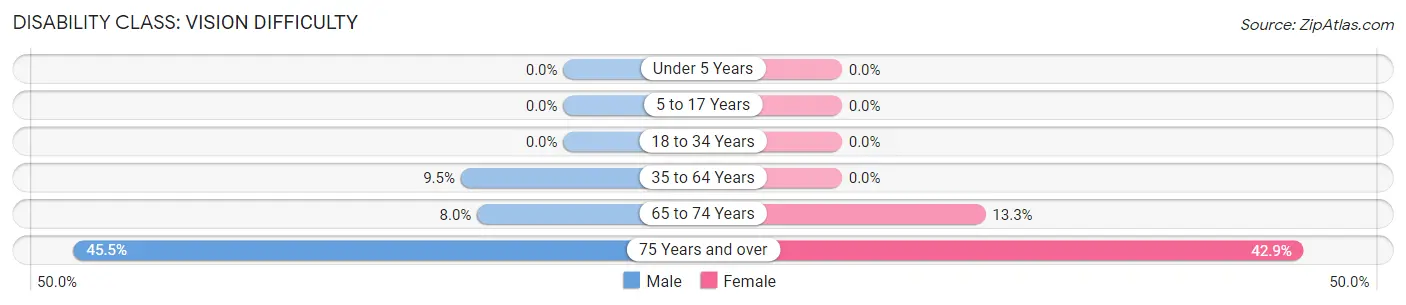
| Age Bracket | Male | Female |
| Under 5 Years | 0 (0.0%) | 0 (0.0%) |
| 5 to 17 Years | 0 (0.0%) | 0 (0.0%) |
| 18 to 34 Years | 0 (0.0%) | 0 (0.0%) |
| 35 to 64 Years | 6 (9.5%) | 0 (0.0%) |
| 65 to 74 Years | 2 (8.0%) | 2 (13.3%) |
| 75 Years and over | 5 (45.5%) | 12 (42.9%) |
Disability Class: Cognitive Difficulty
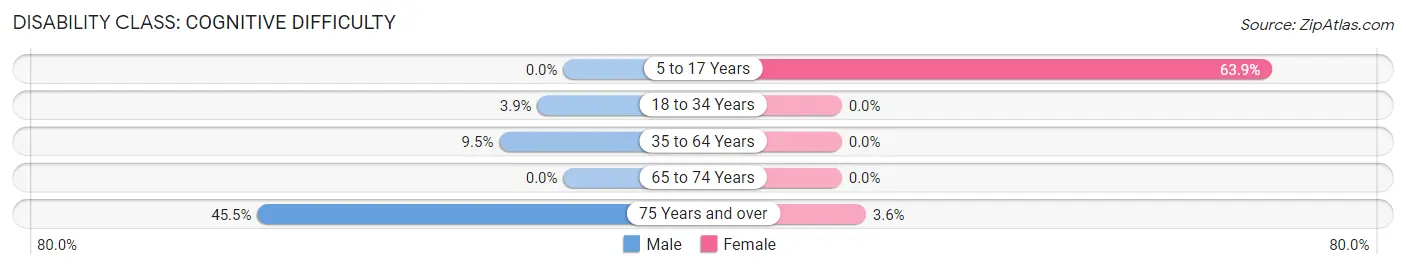
| Age Bracket | Male | Female |
| 5 to 17 Years | 0 (0.0%) | 23 (63.9%) |
| 18 to 34 Years | 1 (3.8%) | 0 (0.0%) |
| 35 to 64 Years | 6 (9.5%) | 0 (0.0%) |
| 65 to 74 Years | 0 (0.0%) | 0 (0.0%) |
| 75 Years and over | 5 (45.5%) | 1 (3.6%) |
Disability Class: Ambulatory Difficulty
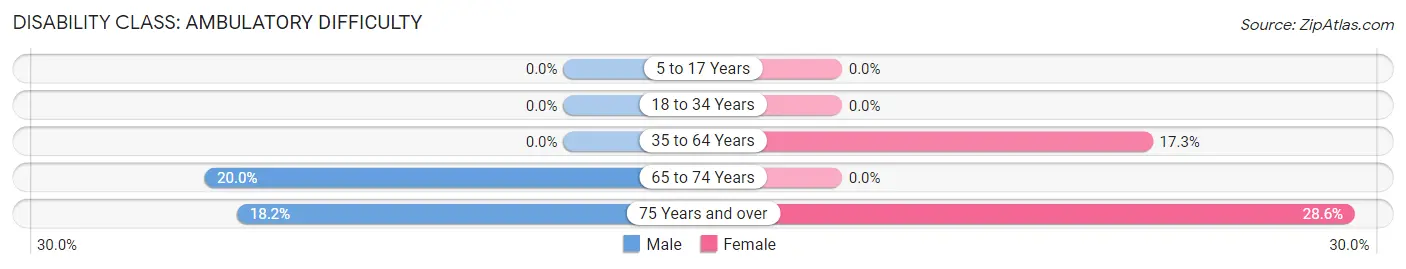
| Age Bracket | Male | Female |
| 5 to 17 Years | 0 (0.0%) | 0 (0.0%) |
| 18 to 34 Years | 0 (0.0%) | 0 (0.0%) |
| 35 to 64 Years | 0 (0.0%) | 9 (17.3%) |
| 65 to 74 Years | 5 (20.0%) | 0 (0.0%) |
| 75 Years and over | 2 (18.2%) | 8 (28.6%) |
Disability Class: Self-Care Difficulty
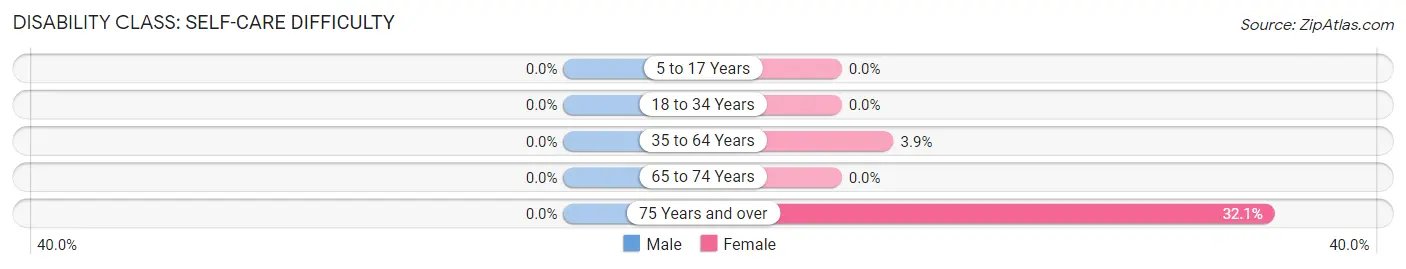
| Age Bracket | Male | Female |
| 5 to 17 Years | 0 (0.0%) | 0 (0.0%) |
| 18 to 34 Years | 0 (0.0%) | 0 (0.0%) |
| 35 to 64 Years | 0 (0.0%) | 2 (3.8%) |
| 65 to 74 Years | 0 (0.0%) | 0 (0.0%) |
| 75 Years and over | 0 (0.0%) | 9 (32.1%) |
Technology Access in Spring Grove
Computing Device Access in Spring Grove
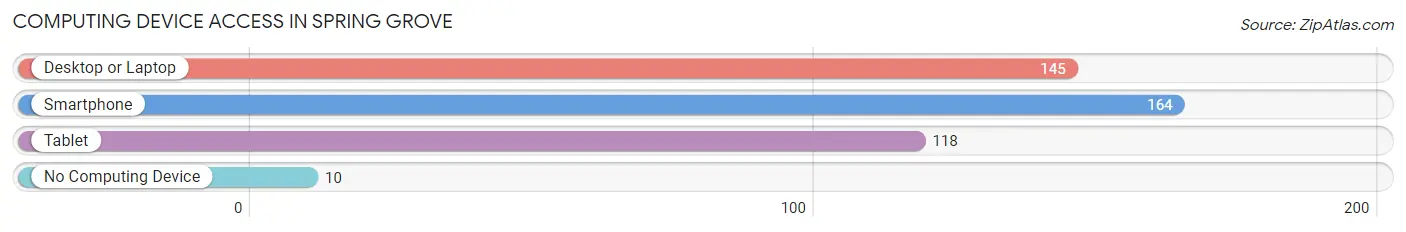
| Device Type | # Households | % Households |
| Desktop or Laptop | 145 | 79.7% |
| Smartphone | 164 | 90.1% |
| Tablet | 118 | 64.8% |
| No Computing Device | 10 | 5.5% |
| Total | 182 | 100.0% |
Internet Access in Spring Grove
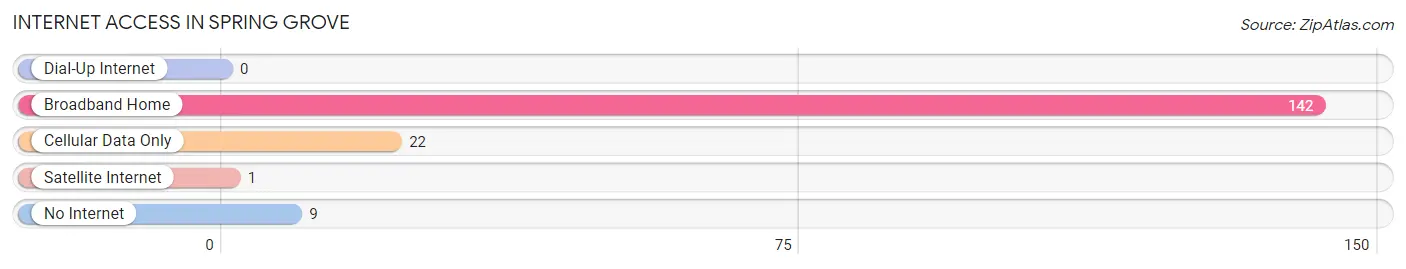
| Internet Type | # Households | % Households |
| Dial-Up Internet | 0 | 0.0% |
| Broadband Home | 142 | 78.0% |
| Cellular Data Only | 22 | 12.1% |
| Satellite Internet | 1 | 0.5% |
| No Internet | 9 | 5.0% |
| Total | 182 | 100.0% |
Spring Grove Summary
History
The town of Spring Grove, Indiana is located in the northern part of the state, in the county of Lake. It is a small town with a population of just over 1,000 people. The town was founded in 1837 by a group of settlers from New York. The settlers were looking for a place to settle and start a new life. They chose the area because of its fertile soil and abundant natural resources.
The town was originally called Spring Grove Township, but the name was changed to Spring Grove in 1845. The town was incorporated in 1851 and has remained a small, rural community ever since.
The town has a rich history of farming and industry. In the late 1800s, the town was home to several sawmills, gristmills, and a brickyard. The town also had a thriving dairy industry, with several local farms producing milk and cheese.
In the early 1900s, the town began to experience a period of growth and prosperity. The town was home to several businesses, including a bank, a hotel, a movie theater, and a variety of stores. The town also had a thriving school system, with several elementary and high schools.
The town experienced a period of decline in the mid-1900s, as many of the businesses and industries closed or moved away. However, the town has experienced a resurgence in recent years, with new businesses and industries moving into the area.
Geography
Spring Grove is located in the northern part of Lake County, Indiana. It is situated on the banks of the Kankakee River, which flows through the town. The town is surrounded by rolling hills and farmland, with several small lakes and ponds in the area.
The town is located approximately 40 miles from Chicago, and is easily accessible by car or train. The town is also close to several major highways, including Interstate 65 and Interstate 80.
Economy
The economy of Spring Grove is largely based on agriculture and tourism. The town is home to several farms, which produce a variety of crops, including corn, soybeans, and wheat. The town also has several wineries and breweries, which attract tourists from all over the region.
The town is also home to several small businesses, including restaurants, shops, and other services. The town also has a thriving arts and culture scene, with several galleries, museums, and theaters.
Demographics
As of the 2010 census, the population of Spring Grove was 1,072. The town is predominantly white, with a small percentage of African Americans, Hispanics, and Asians. The median household income is $50,000, and the median home value is $150,000.
The town has a low unemployment rate, and the majority of the population is employed in the agricultural and tourism industries. The town also has a high rate of college graduates, with nearly 40% of the population having a college degree.
Conclusion
Spring Grove, Indiana is a small town with a rich history and a vibrant economy. The town is home to several farms, wineries, and breweries, as well as a variety of small businesses. The town also has a thriving arts and culture scene, with several galleries, museums, and theaters. The town has a predominantly white population, with a small percentage of African Americans, Hispanics, and Asians. The town has a low unemployment rate, and the majority of the population is employed in the agricultural and tourism industries.
Common Questions
What is Per Capita Income in Spring Grove?
Per Capita income in Spring Grove is $29,757.
What is the Median Family Income in Spring Grove?
Median Family Income in Spring Grove is $56,250.
What is the Median Household income in Spring Grove?
Median Household Income in Spring Grove is $40,000.
What is Income or Wage Gap in Spring Grove?
Income or Wage Gap in Spring Grove is 64.8%.
Women in Spring Grove earn 35.2 cents for every dollar earned by a man.
What is Inequality or Gini Index in Spring Grove?
Inequality or Gini Index in Spring Grove is 0.52.
What is the Total Population of Spring Grove?
Total Population of Spring Grove is 427.
What is the Total Male Population of Spring Grove?
Total Male Population of Spring Grove is 160.
What is the Total Female Population of Spring Grove?
Total Female Population of Spring Grove is 267.
What is the Ratio of Males per 100 Females in Spring Grove?
There are 59.93 Males per 100 Females in Spring Grove.
What is the Ratio of Females per 100 Males in Spring Grove?
There are 166.88 Females per 100 Males in Spring Grove.
What is the Median Population Age in Spring Grove?
Median Population Age in Spring Grove is 48.5 Years.
What is the Average Family Size in Spring Grove
Average Family Size in Spring Grove is 2.4 People.
What is the Average Household Size in Spring Grove
Average Household Size in Spring Grove is 1.9 People.
How Large is the Labor Force in Spring Grove?
There are 186 People in the Labor Forcein in Spring Grove.
What is the Percentage of People in the Labor Force in Spring Grove?
49.6% of People are in the Labor Force in Spring Grove.
What is the Unemployment Rate in Spring Grove?
Unemployment Rate in Spring Grove is 5.4%.