North Terre Haute, IN Map & Demographics
North Terre Haute Map
North Terre Haute Overview
$32,881
PER CAPITA INCOME
$77,000
AVG FAMILY INCOME
$57,531
AVG HOUSEHOLD INCOME
11.0%
WAGE / INCOME GAP [ % ]
89.0¢/ $1
WAGE / INCOME GAP [ $ ]
0.38
INEQUALITY / GINI INDEX
4,449
TOTAL POPULATION
2,064
MALE POPULATION
2,385
FEMALE POPULATION
86.54
MALES / 100 FEMALES
115.55
FEMALES / 100 MALES
52.3
MEDIAN AGE
2.6
AVG FAMILY SIZE
2.0
AVG HOUSEHOLD SIZE
2,344
LABOR FORCE [ PEOPLE ]
59.3%
PERCENT IN LABOR FORCE
5.0%
UNEMPLOYMENT RATE
North Terre Haute Area Codes
Income in North Terre Haute
Income Overview in North Terre Haute
Per Capita Income in North Terre Haute is $32,881, while median incomes of families and households are $77,000 and $57,531 respectively.
| Characteristic | Number | Measure |
| Per Capita Income | 4,449 | $32,881 |
| Median Family Income | 1,146 | $77,000 |
| Mean Family Income | 1,146 | $82,672 |
| Median Household Income | 2,225 | $57,531 |
| Mean Household Income | 2,225 | $63,049 |
| Income Deficit | 1,146 | $0 |
| Wage / Income Gap (%) | 4,449 | 10.98% |
| Wage / Income Gap ($) | 4,449 | 89.02¢ per $1 |
| Gini / Inequality Index | 4,449 | 0.38 |
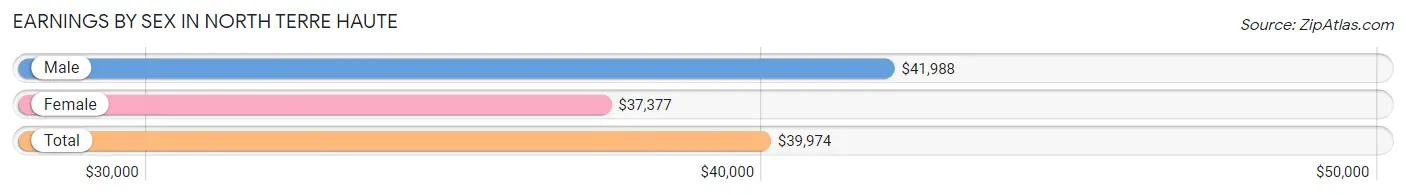
Earnings by Sex in North Terre Haute
Average Earnings in North Terre Haute are $39,974, $41,988 for men and $37,377 for women, a difference of 11.0%.
| Sex | Number | Average Earnings |
| Male | 1,194 (47.6%) | $41,988 |
| Female | 1,314 (52.4%) | $37,377 |
| Total | 2,508 (100.0%) | $39,974 |
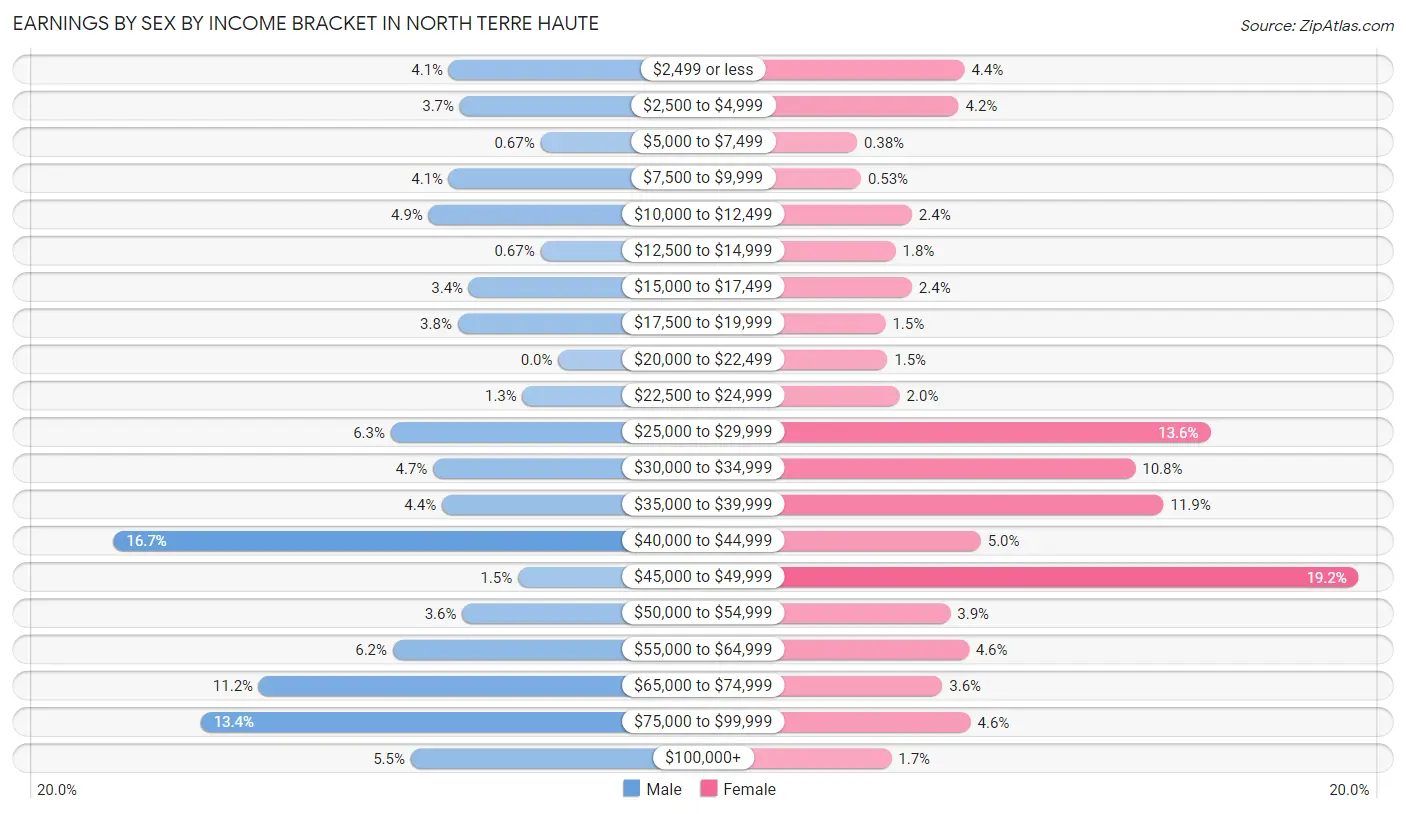
Earnings by Sex by Income Bracket in North Terre Haute
The most common earnings brackets in North Terre Haute are $40,000 to $44,999 for men (199 | 16.7%) and $45,000 to $49,999 for women (252 | 19.2%).
| Income | Male | Female |
| $2,499 or less | 49 (4.1%) | 58 (4.4%) |
| $2,500 to $4,999 | 44 (3.7%) | 55 (4.2%) |
| $5,000 to $7,499 | 8 (0.7%) | 5 (0.4%) |
| $7,500 to $9,999 | 49 (4.1%) | 7 (0.5%) |
| $10,000 to $12,499 | 58 (4.9%) | 32 (2.4%) |
| $12,500 to $14,999 | 8 (0.7%) | 24 (1.8%) |
| $15,000 to $17,499 | 40 (3.4%) | 32 (2.4%) |
| $17,500 to $19,999 | 45 (3.8%) | 19 (1.5%) |
| $20,000 to $22,499 | 0 (0.0%) | 20 (1.5%) |
| $22,500 to $24,999 | 16 (1.3%) | 26 (2.0%) |
| $25,000 to $29,999 | 75 (6.3%) | 179 (13.6%) |
| $30,000 to $34,999 | 56 (4.7%) | 142 (10.8%) |
| $35,000 to $39,999 | 52 (4.4%) | 156 (11.9%) |
| $40,000 to $44,999 | 199 (16.7%) | 66 (5.0%) |
| $45,000 to $49,999 | 18 (1.5%) | 252 (19.2%) |
| $50,000 to $54,999 | 43 (3.6%) | 51 (3.9%) |
| $55,000 to $64,999 | 74 (6.2%) | 60 (4.6%) |
| $65,000 to $74,999 | 134 (11.2%) | 47 (3.6%) |
| $75,000 to $99,999 | 160 (13.4%) | 61 (4.6%) |
| $100,000+ | 66 (5.5%) | 22 (1.7%) |
| Total | 1,194 (100.0%) | 1,314 (100.0%) |
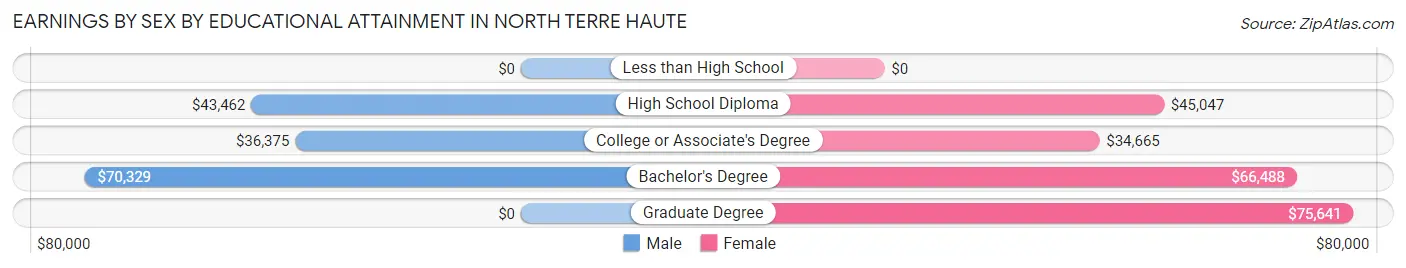
Earnings by Sex by Educational Attainment in North Terre Haute
Average earnings in North Terre Haute are $50,145 for men and $39,831 for women, a difference of 20.6%. Men with an educational attainment of bachelor's degree enjoy the highest average annual earnings of $70,329, while those with college or associate's degree education earn the least with $36,375. Women with an educational attainment of graduate degree earn the most with the average annual earnings of $75,641, while those with college or associate's degree education have the smallest earnings of $34,665.
| Educational Attainment | Male Income | Female Income |
| Less than High School | - | - |
| High School Diploma | $43,462 | $45,047 |
| College or Associate's Degree | $36,375 | $34,665 |
| Bachelor's Degree | $70,329 | $66,488 |
| Graduate Degree | - | - |
| Total | $50,145 | $39,831 |
Family Income in North Terre Haute
Family Income Brackets in North Terre Haute
According to the North Terre Haute family income data, there are 278 families falling into the $75,000 to $99,999 income range, which is the most common income bracket and makes up 24.3% of all families. Conversely, the $10,000 to $14,999 income bracket is the least frequent group with only 6 families (0.5%) belonging to this category.
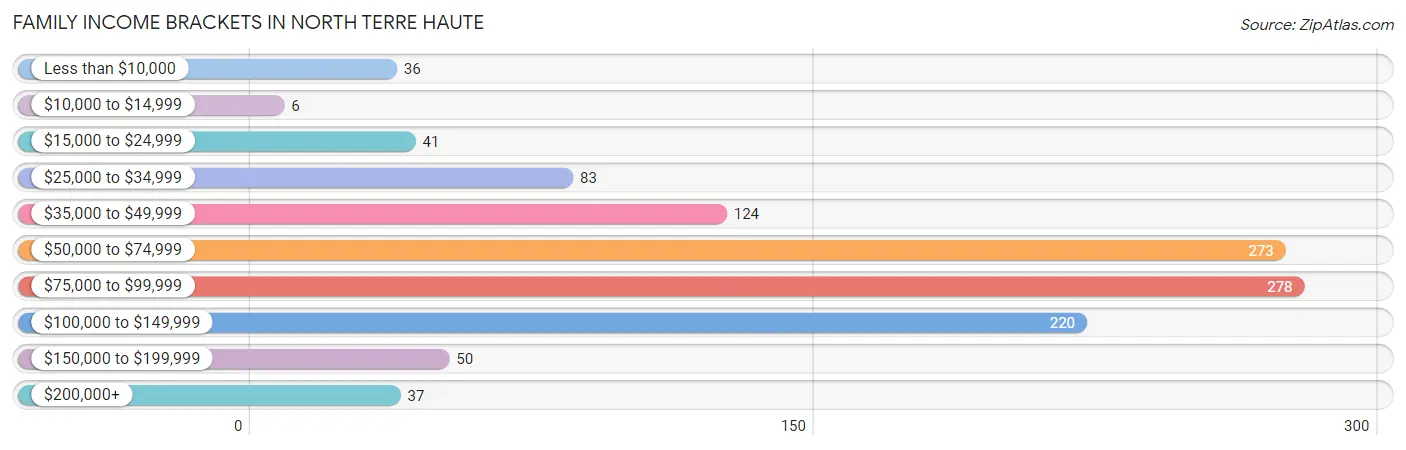
| Income Bracket | # Families | % Families |
| Less than $10,000 | 36 | 3.1% |
| $10,000 to $14,999 | 6 | 0.5% |
| $15,000 to $24,999 | 41 | 3.6% |
| $25,000 to $34,999 | 83 | 7.2% |
| $35,000 to $49,999 | 124 | 10.8% |
| $50,000 to $74,999 | 273 | 23.8% |
| $75,000 to $99,999 | 278 | 24.3% |
| $100,000 to $149,999 | 220 | 19.2% |
| $150,000 to $199,999 | 50 | 4.4% |
| $200,000+ | 37 | 3.2% |
Family Income by Famaliy Size in North Terre Haute
4-person families (81 | 7.1%) account for the highest median family income in North Terre Haute with $95,573 per family, while 2-person families (824 | 71.9%) have the highest median income of $34,951 per family member.
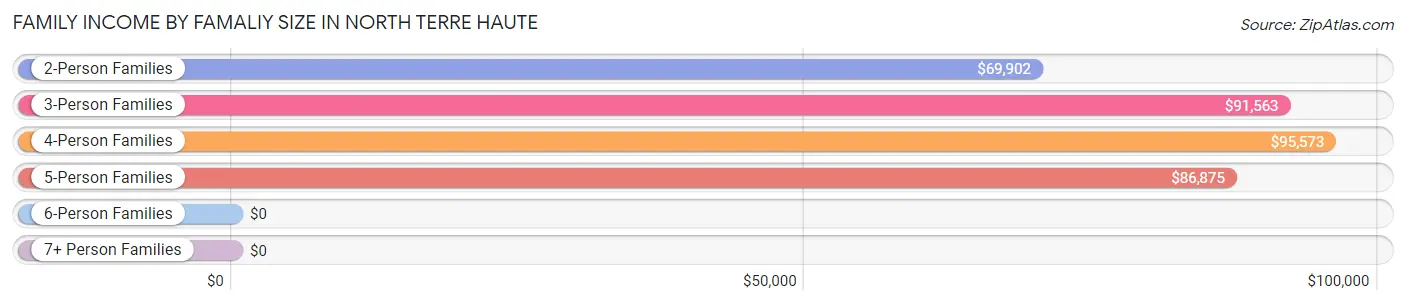
| Income Bracket | # Families | Median Income |
| 2-Person Families | 824 (71.9%) | $69,902 |
| 3-Person Families | 198 (17.3%) | $91,563 |
| 4-Person Families | 81 (7.1%) | $95,573 |
| 5-Person Families | 30 (2.6%) | $86,875 |
| 6-Person Families | 13 (1.1%) | $0 |
| 7+ Person Families | 0 (0.0%) | $0 |
| Total | 1,146 (100.0%) | $77,000 |
Family Income by Number of Earners in North Terre Haute
The median family income in North Terre Haute is $77,000, with families comprising 3+ earners (64) having the highest median family income of $147,917, while families with no earners (288) have the lowest median family income of $49,052, accounting for 5.6% and 25.1% of families, respectively.
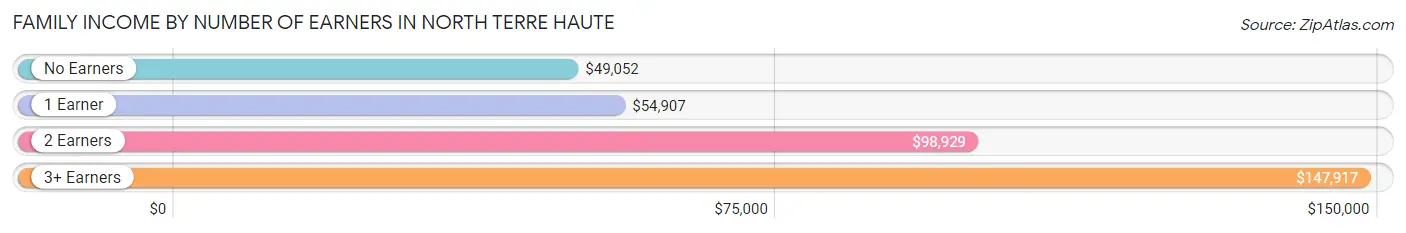
| Number of Earners | # Families | Median Income |
| No Earners | 288 (25.1%) | $49,052 |
| 1 Earner | 414 (36.1%) | $54,907 |
| 2 Earners | 380 (33.2%) | $98,929 |
| 3+ Earners | 64 (5.6%) | $147,917 |
| Total | 1,146 (100.0%) | $77,000 |
Household Income in North Terre Haute
Household Income Brackets in North Terre Haute
With 561 households falling in the category, the $50,000 to $74,999 income range is the most frequent in North Terre Haute, accounting for 25.2% of all households. In contrast, only 44 households (2.0%) fall into the $200,000+ income bracket, making it the least populous group.
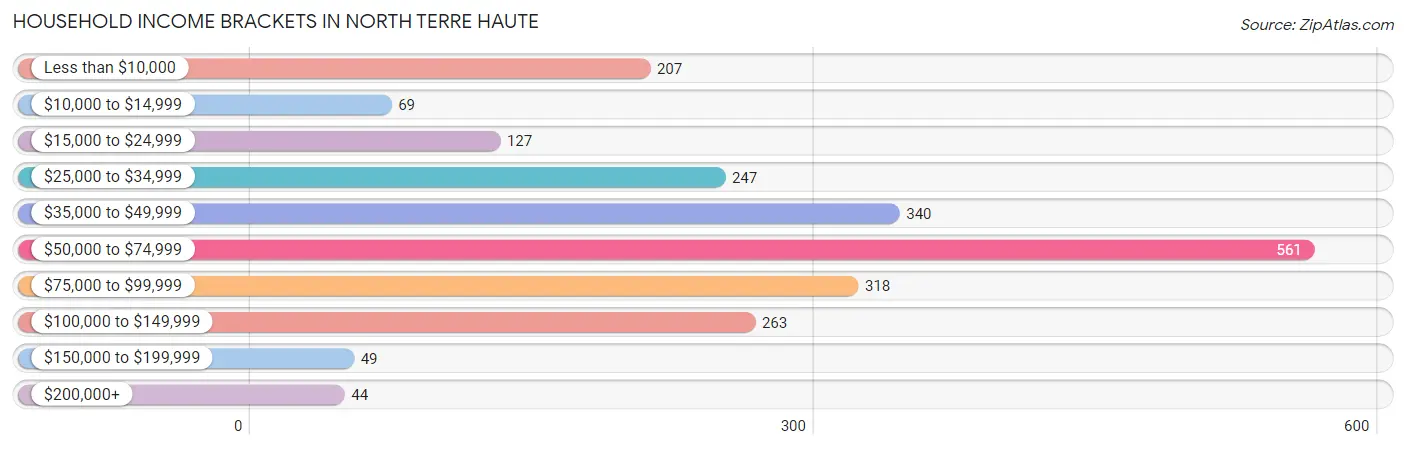
| Income Bracket | # Households | % Households |
| Less than $10,000 | 207 | 9.3% |
| $10,000 to $14,999 | 69 | 3.1% |
| $15,000 to $24,999 | 127 | 5.7% |
| $25,000 to $34,999 | 247 | 11.1% |
| $35,000 to $49,999 | 340 | 15.3% |
| $50,000 to $74,999 | 561 | 25.2% |
| $75,000 to $99,999 | 318 | 14.3% |
| $100,000 to $149,999 | 263 | 11.8% |
| $150,000 to $199,999 | 49 | 2.2% |
| $200,000+ | 44 | 2.0% |
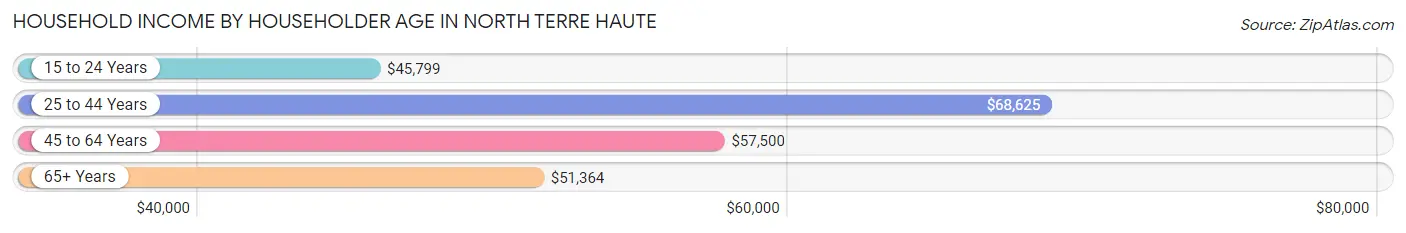
Household Income by Householder Age in North Terre Haute
The median household income in North Terre Haute is $57,531, with the highest median household income of $68,625 found in the 25 to 44 years age bracket for the primary householder. A total of 514 households (23.1%) fall into this category. Meanwhile, the 15 to 24 years age bracket for the primary householder has the lowest median household income of $45,799, with 193 households (8.7%) in this group.
| Income Bracket | # Households | Median Income |
| 15 to 24 Years | 193 (8.7%) | $45,799 |
| 25 to 44 Years | 514 (23.1%) | $68,625 |
| 45 to 64 Years | 956 (43.0%) | $57,500 |
| 65+ Years | 562 (25.3%) | $51,364 |
| Total | 2,225 (100.0%) | $57,531 |
Poverty in North Terre Haute
Income Below Poverty by Sex and Age in North Terre Haute
With 18.8% poverty level for males and 10.7% for females among the residents of North Terre Haute, 6 to 11 year old males and 5 year old females are the most vulnerable to poverty, with 52 males (43.0%) and 27 females (100.0%) in their respective age groups living below the poverty level.
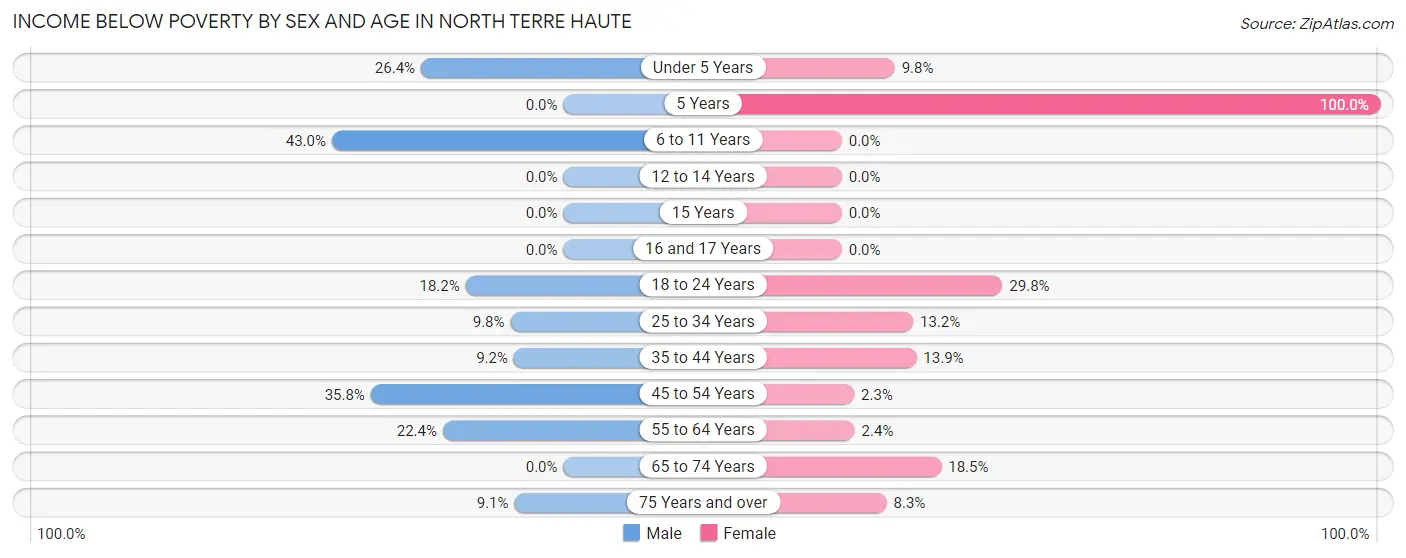
| Age Bracket | Male | Female |
| Under 5 Years | 23 (26.4%) | 11 (9.8%) |
| 5 Years | 0 (0.0%) | 27 (100.0%) |
| 6 to 11 Years | 52 (43.0%) | 0 (0.0%) |
| 12 to 14 Years | 0 (0.0%) | 0 (0.0%) |
| 15 Years | 0 (0.0%) | 0 (0.0%) |
| 16 and 17 Years | 0 (0.0%) | 0 (0.0%) |
| 18 to 24 Years | 51 (18.1%) | 62 (29.8%) |
| 25 to 34 Years | 23 (9.8%) | 25 (13.2%) |
| 35 to 44 Years | 15 (9.2%) | 36 (13.9%) |
| 45 to 54 Years | 108 (35.8%) | 6 (2.3%) |
| 55 to 64 Years | 102 (22.4%) | 15 (2.4%) |
| 65 to 74 Years | 0 (0.0%) | 41 (18.5%) |
| 75 Years and over | 13 (9.1%) | 31 (8.3%) |
| Total | 387 (18.8%) | 254 (10.7%) |
Income Above Poverty by Sex and Age in North Terre Haute
According to the poverty statistics in North Terre Haute, males aged 5 years and females aged 6 to 11 years are the age groups that are most secure financially, with 100.0% of males and 100.0% of females in these age groups living above the poverty line.
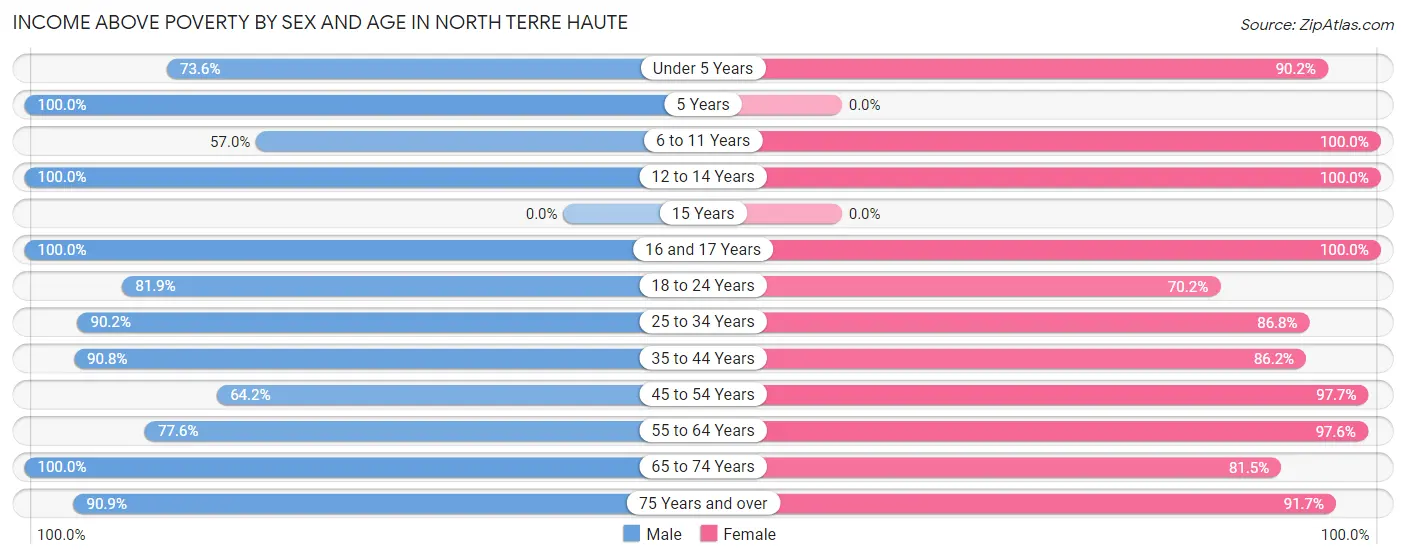
| Age Bracket | Male | Female |
| Under 5 Years | 64 (73.6%) | 101 (90.2%) |
| 5 Years | 9 (100.0%) | 0 (0.0%) |
| 6 to 11 Years | 69 (57.0%) | 47 (100.0%) |
| 12 to 14 Years | 59 (100.0%) | 19 (100.0%) |
| 15 Years | 0 (0.0%) | 0 (0.0%) |
| 16 and 17 Years | 31 (100.0%) | 22 (100.0%) |
| 18 to 24 Years | 230 (81.9%) | 146 (70.2%) |
| 25 to 34 Years | 211 (90.2%) | 164 (86.8%) |
| 35 to 44 Years | 148 (90.8%) | 224 (86.2%) |
| 45 to 54 Years | 194 (64.2%) | 257 (97.7%) |
| 55 to 64 Years | 354 (77.6%) | 612 (97.6%) |
| 65 to 74 Years | 178 (100.0%) | 181 (81.5%) |
| 75 Years and over | 130 (90.9%) | 342 (91.7%) |
| Total | 1,677 (81.2%) | 2,115 (89.3%) |
Income Below Poverty Among Married-Couple Families in North Terre Haute
The poverty statistics for married-couple families in North Terre Haute show that 0.7% or 6 of the total 835 families live below the poverty line. Families with no children have the highest poverty rate of 0.9%, comprising of 6 families. On the other hand, families with 1 or 2 children have the lowest poverty rate of 0.0%, which includes 0 families.
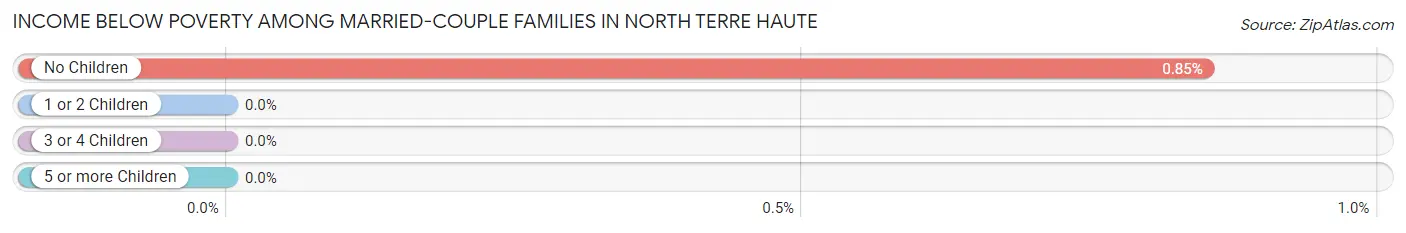
| Children | Above Poverty | Below Poverty |
| No Children | 700 (99.2%) | 6 (0.9%) |
| 1 or 2 Children | 86 (100.0%) | 0 (0.0%) |
| 3 or 4 Children | 43 (100.0%) | 0 (0.0%) |
| 5 or more Children | 0 (0.0%) | 0 (0.0%) |
| Total | 829 (99.3%) | 6 (0.7%) |
Income Below Poverty Among Single-Parent Households in North Terre Haute
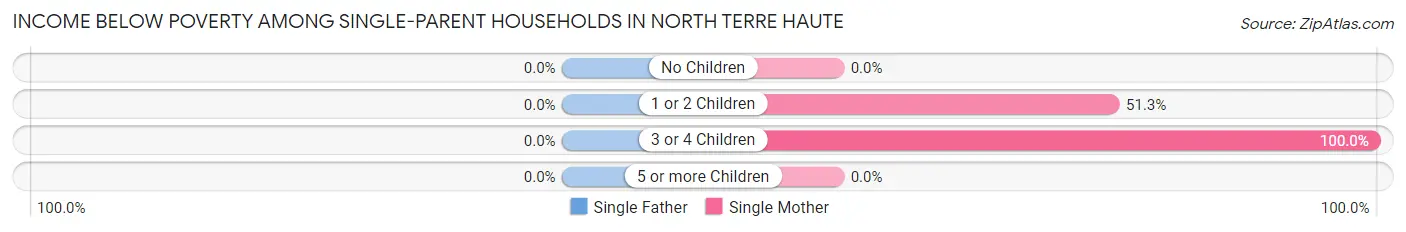
| Children | Single Father | Single Mother |
| No Children | 0 (0.0%) | 0 (0.0%) |
| 1 or 2 Children | 0 (0.0%) | 59 (51.3%) |
| 3 or 4 Children | 0 (0.0%) | 7 (100.0%) |
| 5 or more Children | 0 (0.0%) | 0 (0.0%) |
| Total | 0 (0.0%) | 66 (28.6%) |
Income Below Poverty Among Married-Couple vs Single-Parent Households in North Terre Haute
The poverty data for North Terre Haute shows that 6 of the married-couple family households (0.7%) and 66 of the single-parent households (21.2%) are living below the poverty level. Within the married-couple family households, those with no children have the highest poverty rate, with 6 households (0.9%) falling below the poverty line. Among the single-parent households, those with 3 or 4 children have the highest poverty rate, with 7 household (100.0%) living below poverty.
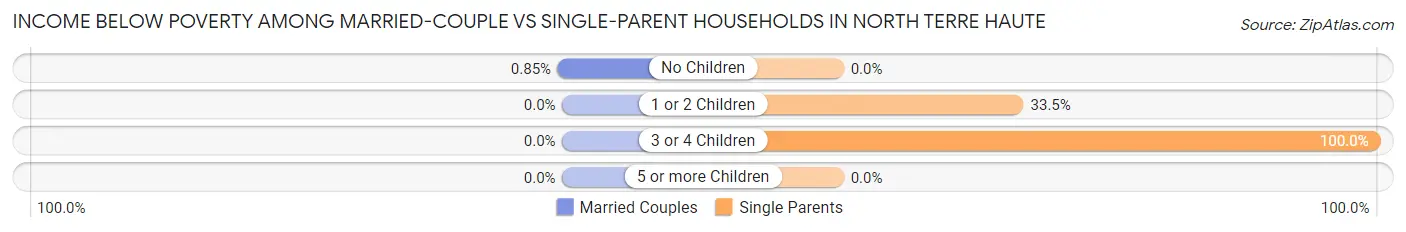
| Children | Married-Couple Families | Single-Parent Households |
| No Children | 6 (0.9%) | 0 (0.0%) |
| 1 or 2 Children | 0 (0.0%) | 59 (33.5%) |
| 3 or 4 Children | 0 (0.0%) | 7 (100.0%) |
| 5 or more Children | 0 (0.0%) | 0 (0.0%) |
| Total | 6 (0.7%) | 66 (21.2%) |
Race in North Terre Haute
The most populous races in North Terre Haute are White / Caucasian (4,143 | 93.1%), Two or more Races (159 | 3.6%), and Black / African American (77 | 1.7%).
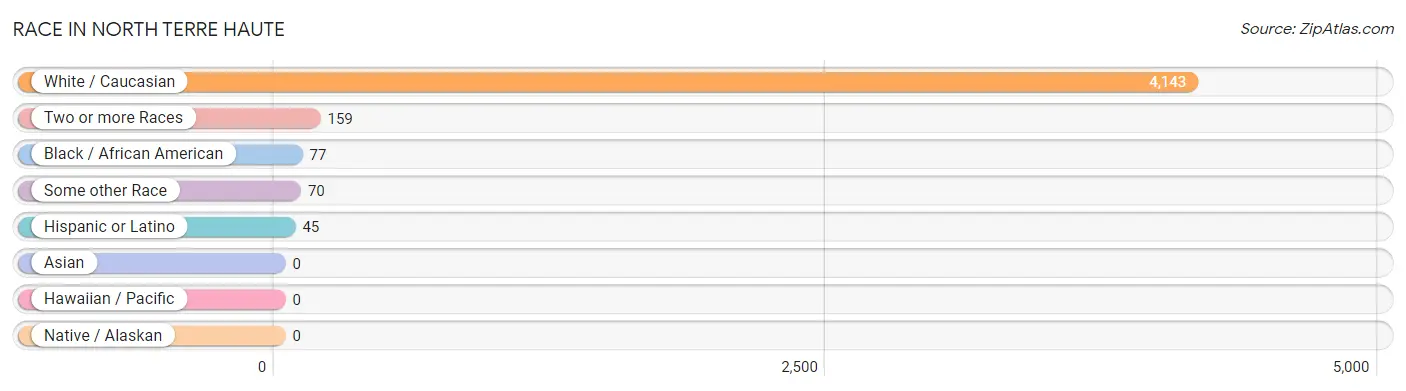
| Race | # Population | % Population |
| Asian | 0 | 0.0% |
| Black / African American | 77 | 1.7% |
| Hawaiian / Pacific | 0 | 0.0% |
| Hispanic or Latino | 45 | 1.0% |
| Native / Alaskan | 0 | 0.0% |
| White / Caucasian | 4,143 | 93.1% |
| Two or more Races | 159 | 3.6% |
| Some other Race | 70 | 1.6% |
| Total | 4,449 | 100.0% |
Ancestry in North Terre Haute
The most populous ancestries reported in North Terre Haute are German (789 | 17.7%), English (506 | 11.4%), Irish (447 | 10.1%), American (342 | 7.7%), and Italian (285 | 6.4%), together accounting for 53.3% of all North Terre Haute residents.
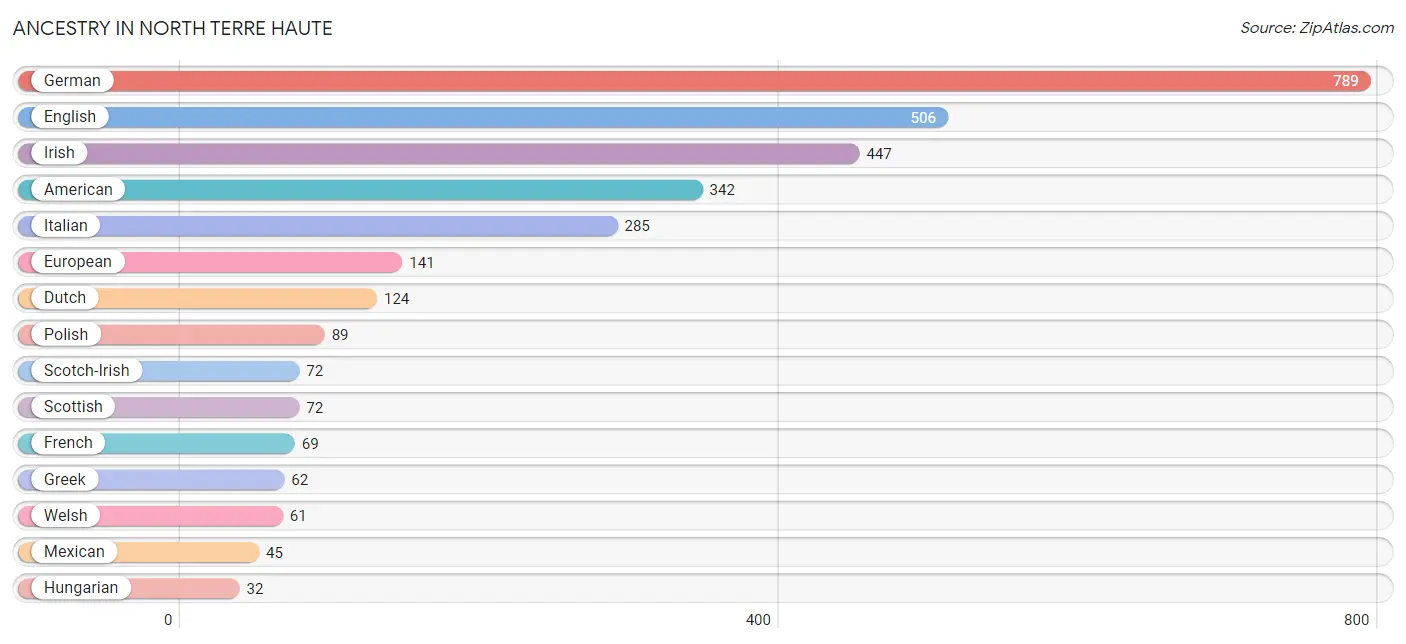
| Ancestry | # Population | % Population |
| African | 23 | 0.5% |
| American | 342 | 7.7% |
| Australian | 21 | 0.5% |
| Czech | 5 | 0.1% |
| Czechoslovakian | 8 | 0.2% |
| Dutch | 124 | 2.8% |
| Eastern European | 18 | 0.4% |
| English | 506 | 11.4% |
| European | 141 | 3.2% |
| French | 69 | 1.5% |
| French Canadian | 15 | 0.3% |
| German | 789 | 17.7% |
| Greek | 62 | 1.4% |
| Hungarian | 32 | 0.7% |
| Irish | 447 | 10.1% |
| Italian | 285 | 6.4% |
| Mexican | 45 | 1.0% |
| Norwegian | 14 | 0.3% |
| Polish | 89 | 2.0% |
| Scandinavian | 13 | 0.3% |
| Scotch-Irish | 72 | 1.6% |
| Scottish | 72 | 1.6% |
| Subsaharan African | 23 | 0.5% |
| Welsh | 61 | 1.4% | View All 24 Rows |
Immigrants in North Terre Haute
The most numerous immigrant groups reported in North Terre Haute came from Europe (1 | 0.0%), Germany (1 | 0.0%), and Western Europe (1 | 0.0%), together accounting for 0.1% of all North Terre Haute residents.
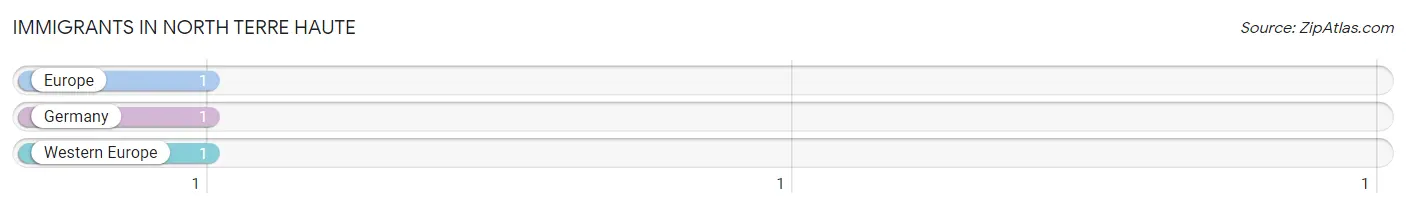
| Immigration Origin | # Population | % Population |
| Europe | 1 | 0.0% |
| Germany | 1 | 0.0% |
| Western Europe | 1 | 0.0% | View All 3 Rows |
Sex and Age in North Terre Haute
Sex and Age in North Terre Haute
The most populous age groups in North Terre Haute are 60 to 64 Years (318 | 15.4%) for men and 60 to 64 Years (378 | 15.9%) for women.
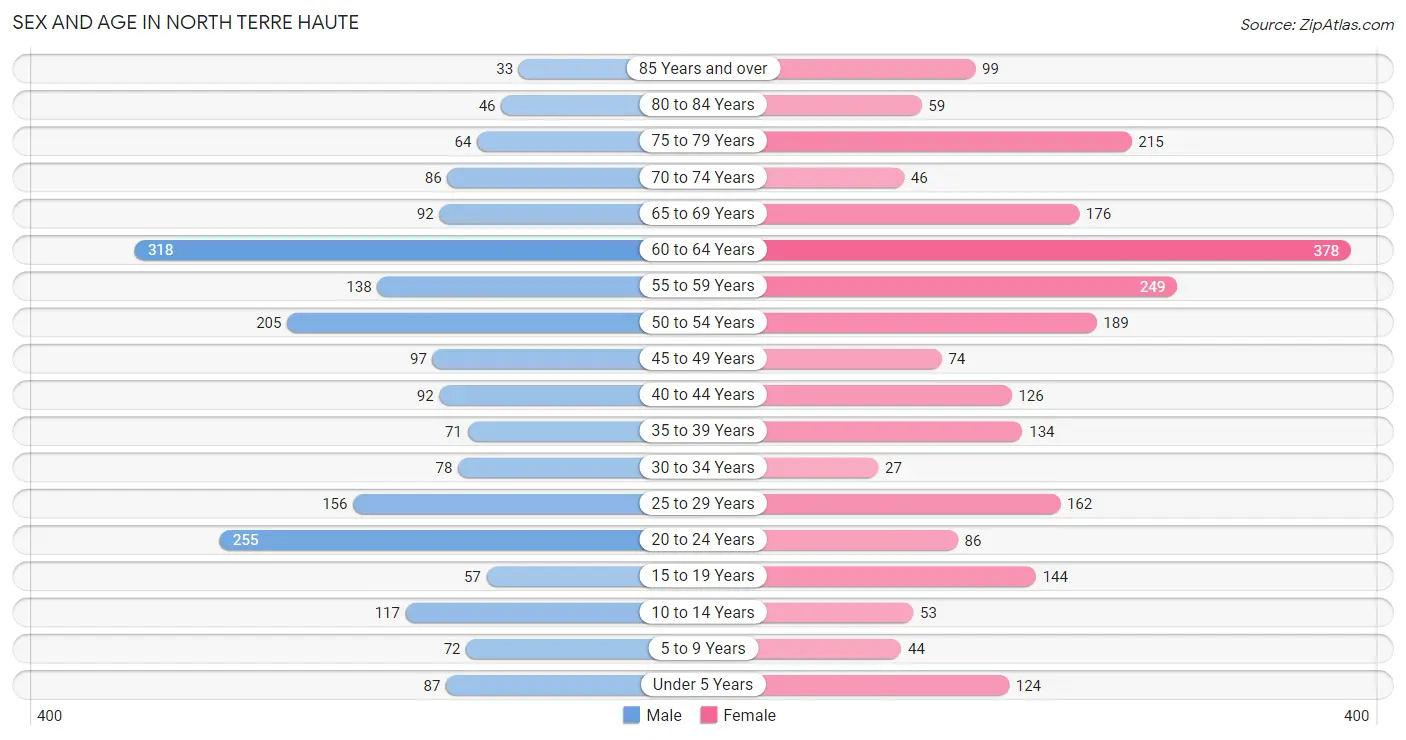
| Age Bracket | Male | Female |
| Under 5 Years | 87 (4.2%) | 124 (5.2%) |
| 5 to 9 Years | 72 (3.5%) | 44 (1.8%) |
| 10 to 14 Years | 117 (5.7%) | 53 (2.2%) |
| 15 to 19 Years | 57 (2.8%) | 144 (6.0%) |
| 20 to 24 Years | 255 (12.3%) | 86 (3.6%) |
| 25 to 29 Years | 156 (7.6%) | 162 (6.8%) |
| 30 to 34 Years | 78 (3.8%) | 27 (1.1%) |
| 35 to 39 Years | 71 (3.4%) | 134 (5.6%) |
| 40 to 44 Years | 92 (4.5%) | 126 (5.3%) |
| 45 to 49 Years | 97 (4.7%) | 74 (3.1%) |
| 50 to 54 Years | 205 (9.9%) | 189 (7.9%) |
| 55 to 59 Years | 138 (6.7%) | 249 (10.4%) |
| 60 to 64 Years | 318 (15.4%) | 378 (15.9%) |
| 65 to 69 Years | 92 (4.5%) | 176 (7.4%) |
| 70 to 74 Years | 86 (4.2%) | 46 (1.9%) |
| 75 to 79 Years | 64 (3.1%) | 215 (9.0%) |
| 80 to 84 Years | 46 (2.2%) | 59 (2.5%) |
| 85 Years and over | 33 (1.6%) | 99 (4.2%) |
| Total | 2,064 (100.0%) | 2,385 (100.0%) |
Families and Households in North Terre Haute
Median Family Size in North Terre Haute
The median family size in North Terre Haute is 2.58 persons per family, with married-couple families (835 | 72.9%) accounting for the largest median family size of 2.6 persons per family. On the other hand, single female/mother families (231 | 20.2%) represent the smallest median family size with 2.52 persons per family.
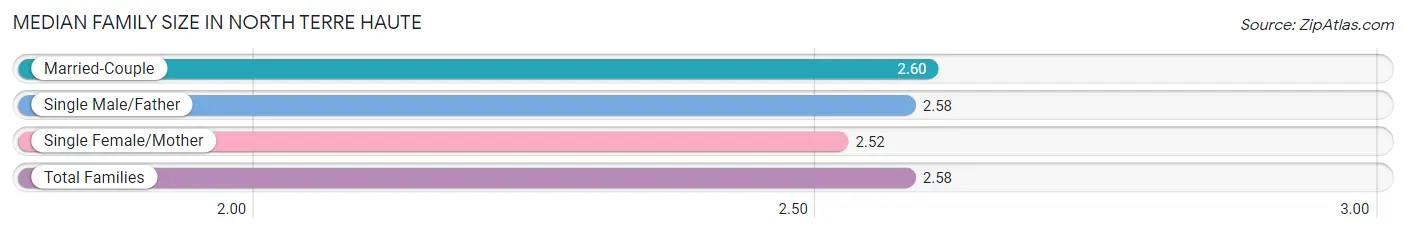
| Family Type | # Families | Family Size |
| Married-Couple | 835 (72.9%) | 2.60 |
| Single Male/Father | 80 (7.0%) | 2.58 |
| Single Female/Mother | 231 (20.2%) | 2.52 |
| Total Families | 1,146 (100.0%) | 2.58 |
Median Household Size in North Terre Haute
The median household size in North Terre Haute is 1.99 persons per household, with single male/father households (80 | 3.6%) accounting for the largest median household size of 3.33 persons per household. non-family households (1,079 | 48.5%) represent the smallest median household size with 1.20 persons per household.
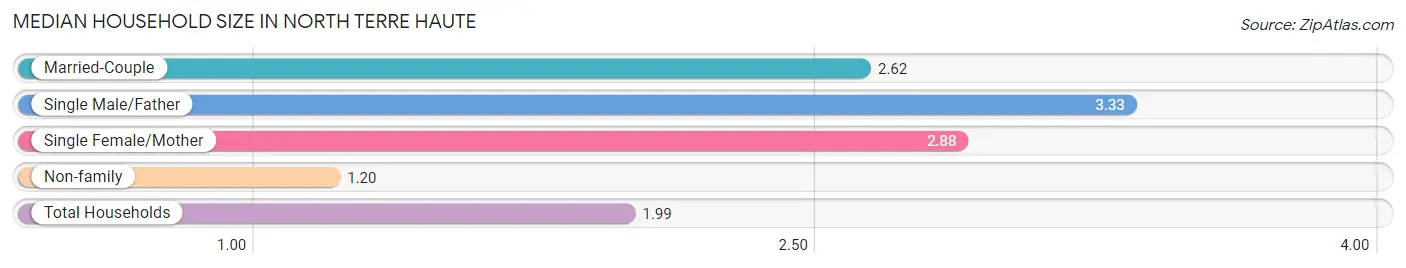
| Household Type | # Households | Household Size |
| Married-Couple | 835 (37.5%) | 2.62 |
| Single Male/Father | 80 (3.6%) | 3.33 |
| Single Female/Mother | 231 (10.4%) | 2.88 |
| Non-family | 1,079 (48.5%) | 1.20 |
| Total Households | 2,225 (100.0%) | 1.99 |
Household Size by Marriage Status in North Terre Haute
Out of a total of 2,225 households in North Terre Haute, 1,146 (51.5%) are family households, while 1,079 (48.5%) are nonfamily households. The most numerous type of family households are 2-person households, comprising 725, and the most common type of nonfamily households are 1-person households, comprising 903.
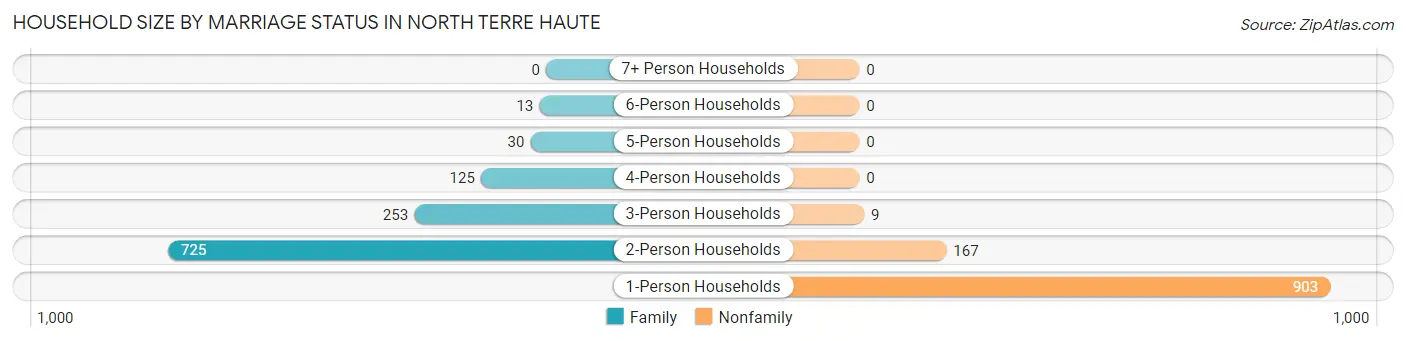
| Household Size | Family Households | Nonfamily Households |
| 1-Person Households | - | 903 (40.6%) |
| 2-Person Households | 725 (32.6%) | 167 (7.5%) |
| 3-Person Households | 253 (11.4%) | 9 (0.4%) |
| 4-Person Households | 125 (5.6%) | 0 (0.0%) |
| 5-Person Households | 30 (1.3%) | 0 (0.0%) |
| 6-Person Households | 13 (0.6%) | 0 (0.0%) |
| 7+ Person Households | 0 (0.0%) | 0 (0.0%) |
| Total | 1,146 (51.5%) | 1,079 (48.5%) |
Female Fertility in North Terre Haute
Fertility by Age in North Terre Haute
Average fertility rate in North Terre Haute is 39.0 births per 1,000 women. Women in the age bracket of 20 to 34 years have the highest fertility rate with 102.0 births per 1,000 women. Women in the age bracket of 20 to 34 years acount for 96.6% of all women with births.
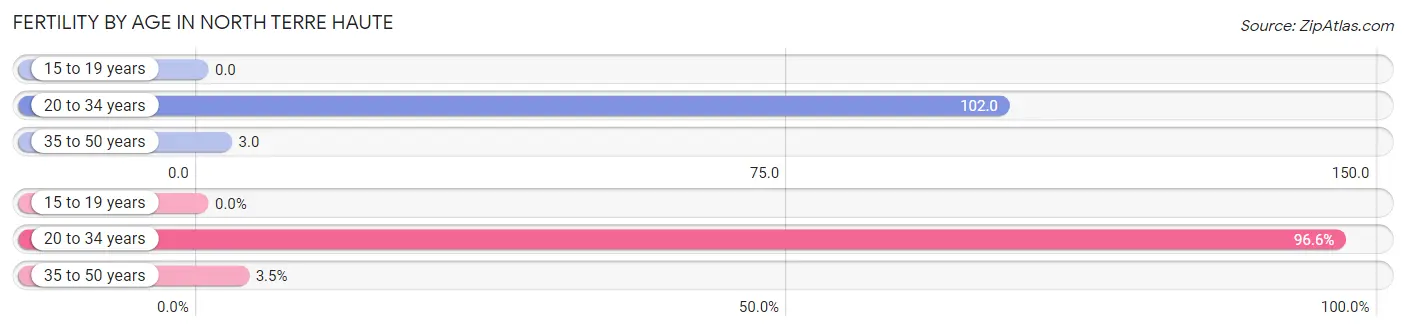
| Age Bracket | Women with Births | Births / 1,000 Women |
| 15 to 19 years | 0 (0.0%) | 0.0 |
| 20 to 34 years | 28 (96.6%) | 102.0 |
| 35 to 50 years | 1 (3.5%) | 3.0 |
| Total | 29 (100.0%) | 39.0 |
Fertility by Age by Marriage Status in North Terre Haute
13.8% of women with births (29) in North Terre Haute are married. The highest percentage of unmarried women with births falls into 20 to 34 years age bracket with 89.3% of them unmarried at the time of birth, while the lowest percentage of unmarried women with births belong to 35 to 50 years age bracket with 0.0% of them unmarried.
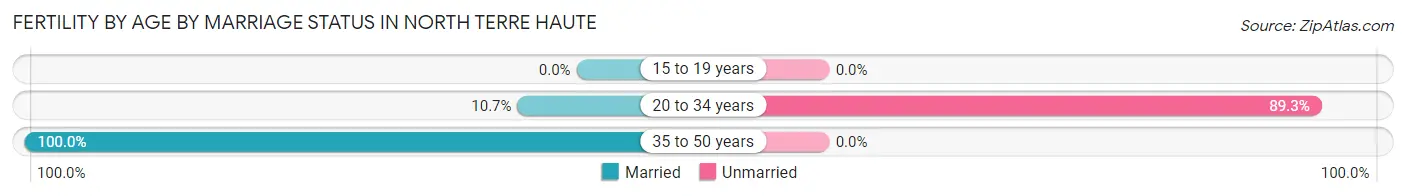
| Age Bracket | Married | Unmarried |
| 15 to 19 years | 0 (0.0%) | 0 (0.0%) |
| 20 to 34 years | 3 (10.7%) | 25 (89.3%) |
| 35 to 50 years | 1 (100.0%) | 0 (0.0%) |
| Total | 4 (13.8%) | 25 (86.2%) |
Fertility by Education in North Terre Haute
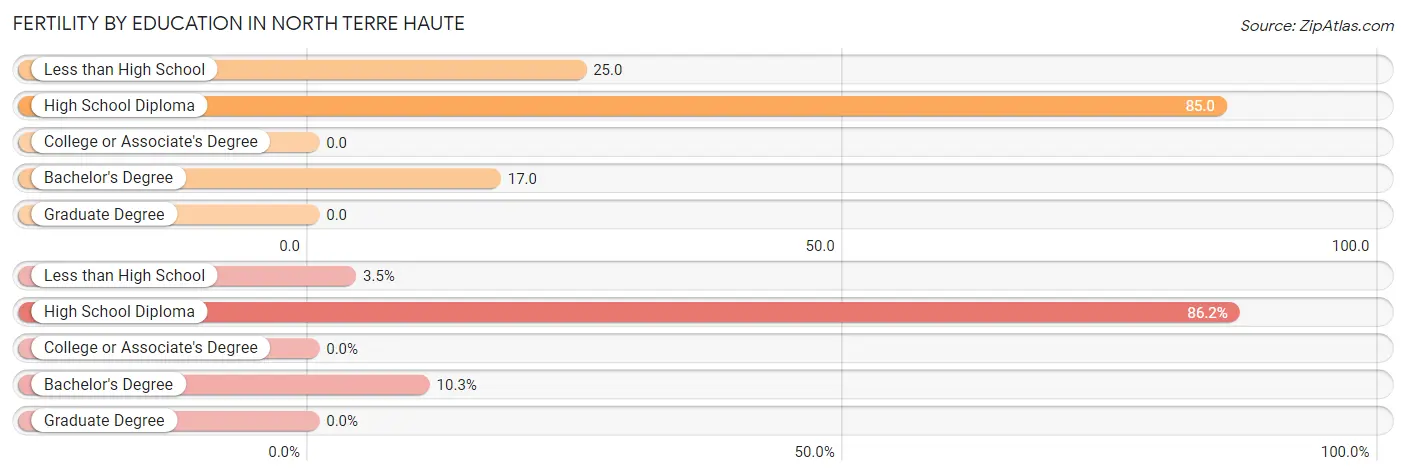
| Educational Attainment | Women with Births | Births / 1,000 Women |
| Less than High School | 1 (3.5%) | 25.0 |
| High School Diploma | 25 (86.2%) | 85.0 |
| College or Associate's Degree | 0 (0.0%) | 0.0 |
| Bachelor's Degree | 3 (10.3%) | 17.0 |
| Graduate Degree | 0 (0.0%) | 0.0 |
| Total | 29 (100.0%) | 39.0 |
Fertility by Education by Marriage Status in North Terre Haute
86.2% of women with births in North Terre Haute are unmarried. Women with the educational attainment of less than high school are most likely to be married with 100.0% of them married at childbirth, while women with the educational attainment of high school diploma are least likely to be married with 100.0% of them unmarried at childbirth.
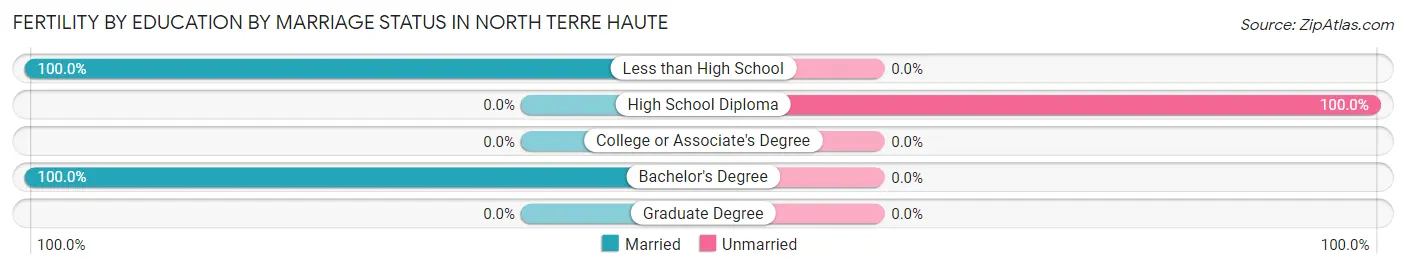
| Educational Attainment | Married | Unmarried |
| Less than High School | 1 (100.0%) | 0 (0.0%) |
| High School Diploma | 0 (0.0%) | 25 (100.0%) |
| College or Associate's Degree | 0 (0.0%) | 0 (0.0%) |
| Bachelor's Degree | 3 (100.0%) | 0 (0.0%) |
| Graduate Degree | 0 (0.0%) | 0 (0.0%) |
| Total | 4 (13.8%) | 25 (86.2%) |
Employment Characteristics in North Terre Haute
Employment by Class of Employer in North Terre Haute
Among the 2,184 employed individuals in North Terre Haute, private company employees (1,221 | 55.9%), local government employees (473 | 21.7%), and not-for-profit organizations (188 | 8.6%) make up the most common classes of employment.
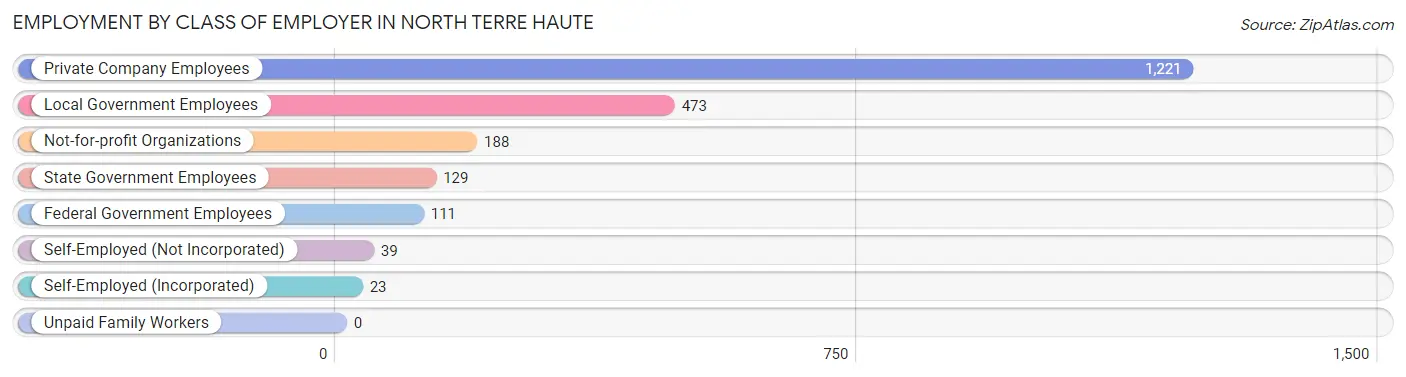
| Employer Class | # Employees | % Employees |
| Private Company Employees | 1,221 | 55.9% |
| Self-Employed (Incorporated) | 23 | 1.1% |
| Self-Employed (Not Incorporated) | 39 | 1.8% |
| Not-for-profit Organizations | 188 | 8.6% |
| Local Government Employees | 473 | 21.7% |
| State Government Employees | 129 | 5.9% |
| Federal Government Employees | 111 | 5.1% |
| Unpaid Family Workers | 0 | 0.0% |
| Total | 2,184 | 100.0% |
Employment Status by Age in North Terre Haute
According to the labor force statistics for North Terre Haute, out of the total population over 16 years of age (3,952), 59.3% or 2,344 individuals are in the labor force, with 5.0% or 117 of them unemployed. The age group with the highest labor force participation rate is 25 to 29 years, with 88.7% or 282 individuals in the labor force. Within the labor force, the 16 to 19 years age range has the highest percentage of unemployed individuals, with 34.3% or 36 of them being unemployed.
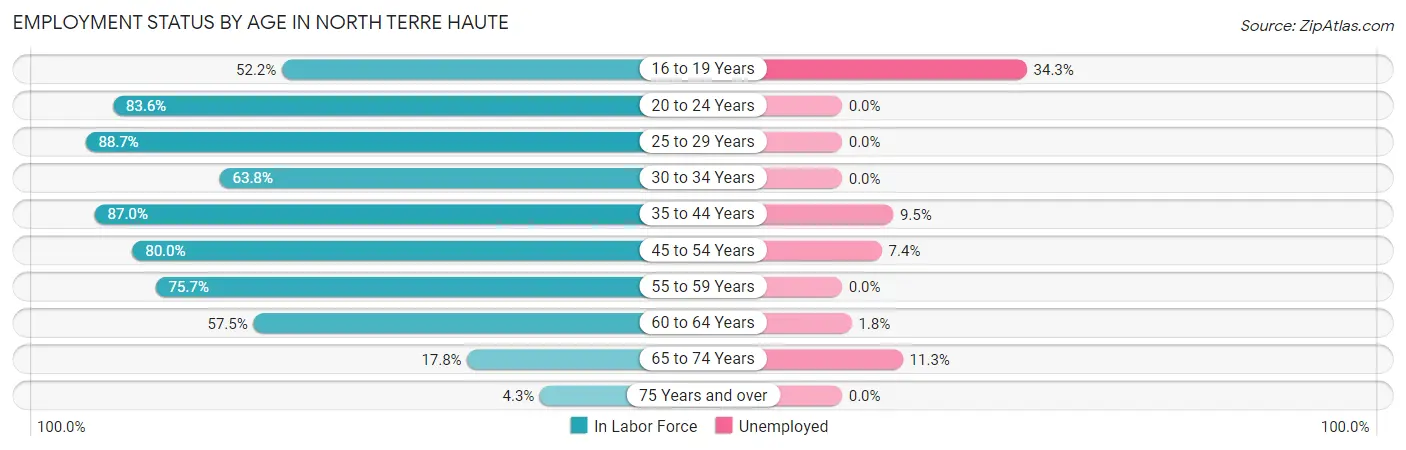
| Age Bracket | In Labor Force | Unemployed |
| 16 to 19 Years | 105 (52.2%) | 36 (34.3%) |
| 20 to 24 Years | 285 (83.6%) | 0 (0.0%) |
| 25 to 29 Years | 282 (88.7%) | 0 (0.0%) |
| 30 to 34 Years | 67 (63.8%) | 0 (0.0%) |
| 35 to 44 Years | 368 (87.0%) | 35 (9.5%) |
| 45 to 54 Years | 452 (80.0%) | 33 (7.4%) |
| 55 to 59 Years | 293 (75.7%) | 0 (0.0%) |
| 60 to 64 Years | 400 (57.5%) | 7 (1.8%) |
| 65 to 74 Years | 71 (17.8%) | 8 (11.3%) |
| 75 Years and over | 22 (4.3%) | 0 (0.0%) |
| Total | 2,344 (59.3%) | 117 (5.0%) |
Employment Status by Educational Attainment in North Terre Haute
According to labor force statistics for North Terre Haute, 74.7% of individuals (1,863) out of the total population between 25 and 64 years of age (2,494) are in the labor force, with 4.0% or 75 of them being unemployed. The group with the highest labor force participation rate are those with the educational attainment of bachelor's degree or higher, with 85.8% or 497 individuals in the labor force. Within the labor force, individuals with less than high school education have the highest percentage of unemployment, with 29.8% or 14 of them being unemployed.
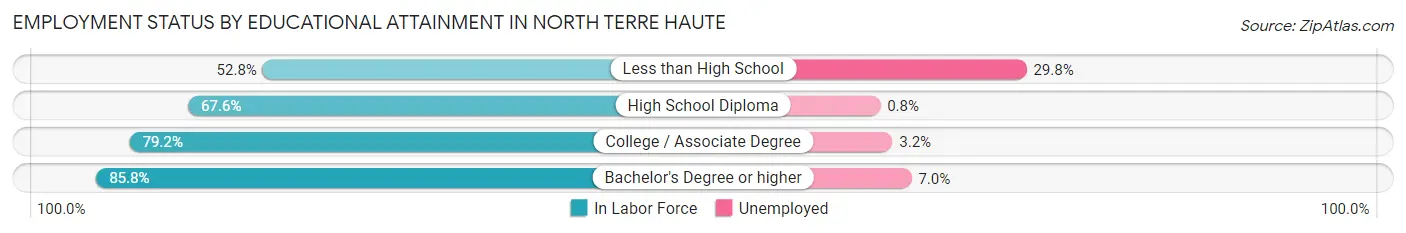
| Educational Attainment | In Labor Force | Unemployed |
| Less than High School | 47 (52.8%) | 27 (29.8%) |
| High School Diploma | 746 (67.6%) | 9 (0.8%) |
| College / Associate Degree | 572 (79.2%) | 23 (3.2%) |
| Bachelor's Degree or higher | 497 (85.8%) | 41 (7.0%) |
| Total | 1,863 (74.7%) | 100 (4.0%) |
Employment Occupations by Sex in North Terre Haute
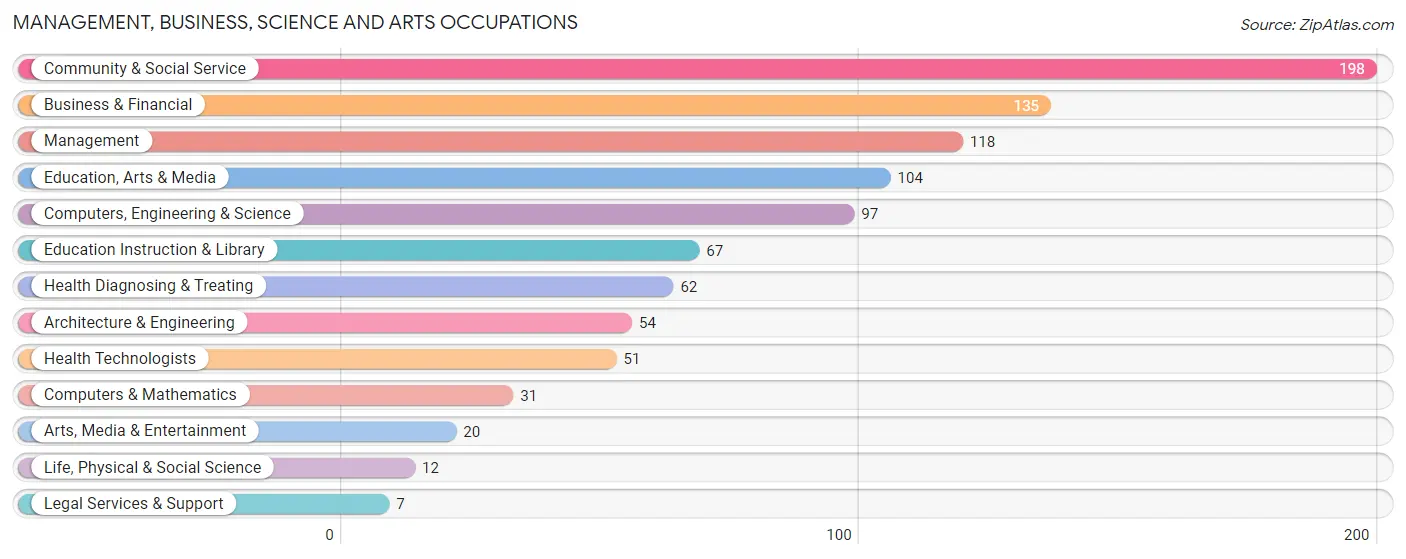
Management, Business, Science and Arts Occupations
The most common Management, Business, Science and Arts occupations in North Terre Haute are Community & Social Service (198 | 9.1%), Business & Financial (135 | 6.2%), Management (118 | 5.4%), Education, Arts & Media (104 | 4.8%), and Computers, Engineering & Science (97 | 4.4%).
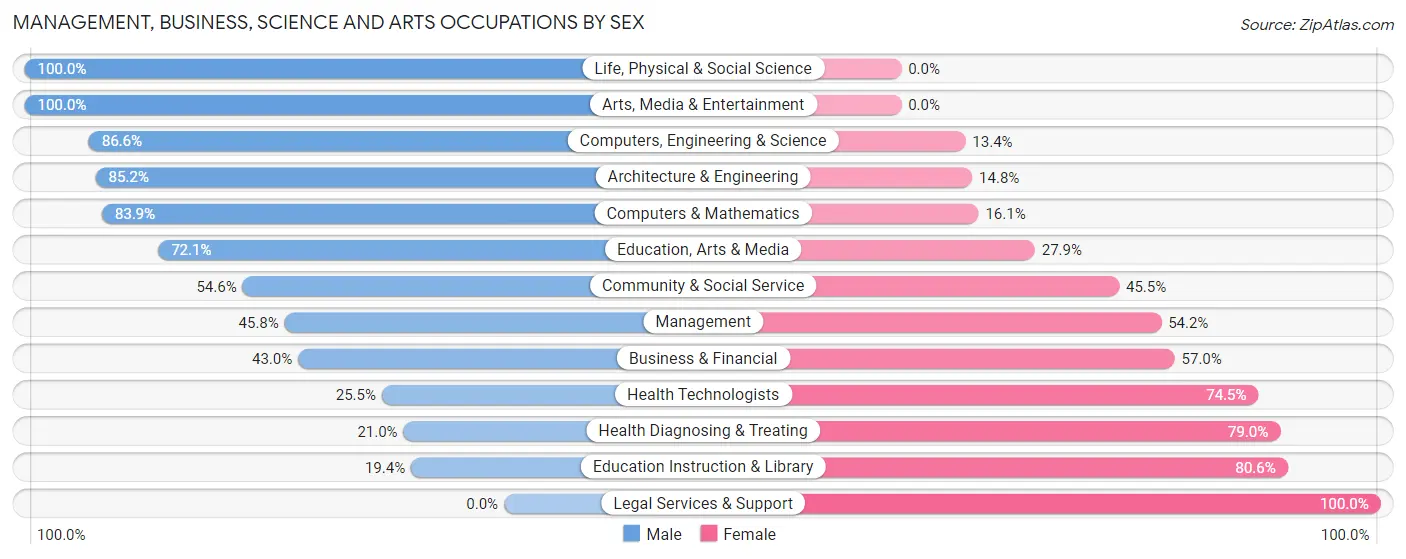
Management, Business, Science and Arts Occupations by Sex
Within the Management, Business, Science and Arts occupations in North Terre Haute, the most male-oriented occupations are Life, Physical & Social Science (100.0%), Arts, Media & Entertainment (100.0%), and Computers, Engineering & Science (86.6%), while the most female-oriented occupations are Legal Services & Support (100.0%), Education Instruction & Library (80.6%), and Health Diagnosing & Treating (79.0%).
| Occupation | Male | Female |
| Management | 54 (45.8%) | 64 (54.2%) |
| Business & Financial | 58 (43.0%) | 77 (57.0%) |
| Computers, Engineering & Science | 84 (86.6%) | 13 (13.4%) |
| Computers & Mathematics | 26 (83.9%) | 5 (16.1%) |
| Architecture & Engineering | 46 (85.2%) | 8 (14.8%) |
| Life, Physical & Social Science | 12 (100.0%) | 0 (0.0%) |
| Community & Social Service | 108 (54.5%) | 90 (45.5%) |
| Education, Arts & Media | 75 (72.1%) | 29 (27.9%) |
| Legal Services & Support | 0 (0.0%) | 7 (100.0%) |
| Education Instruction & Library | 13 (19.4%) | 54 (80.6%) |
| Arts, Media & Entertainment | 20 (100.0%) | 0 (0.0%) |
| Health Diagnosing & Treating | 13 (21.0%) | 49 (79.0%) |
| Health Technologists | 13 (25.5%) | 38 (74.5%) |
| Total (Category) | 317 (52.0%) | 293 (48.0%) |
| Total (Overall) | 959 (44.0%) | 1,223 (56.0%) |
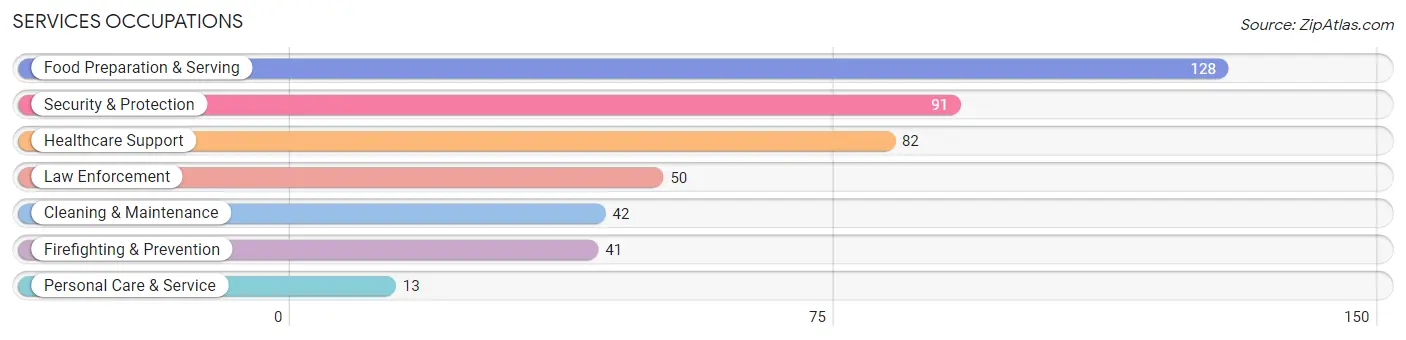
Services Occupations
The most common Services occupations in North Terre Haute are Food Preparation & Serving (128 | 5.9%), Security & Protection (91 | 4.2%), Healthcare Support (82 | 3.8%), Law Enforcement (50 | 2.3%), and Cleaning & Maintenance (42 | 1.9%).
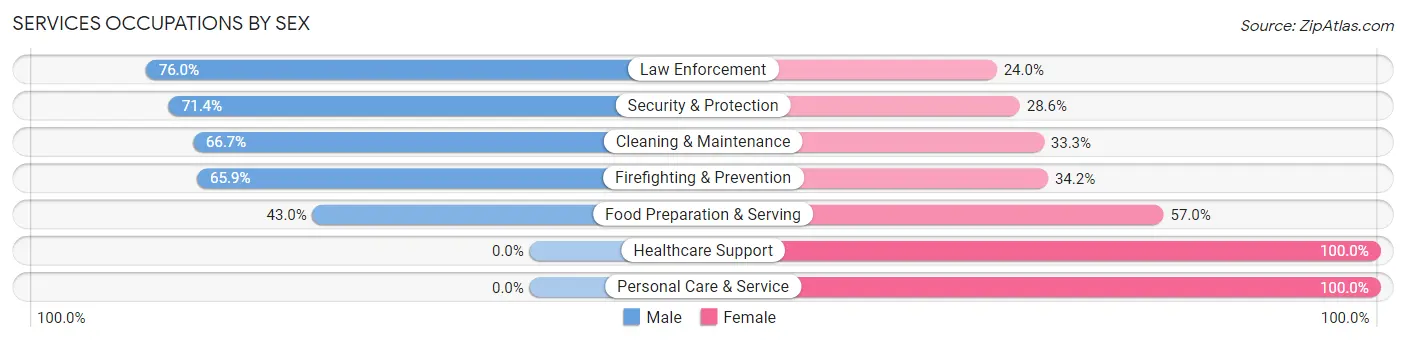
Services Occupations by Sex
Within the Services occupations in North Terre Haute, the most male-oriented occupations are Law Enforcement (76.0%), Security & Protection (71.4%), and Cleaning & Maintenance (66.7%), while the most female-oriented occupations are Healthcare Support (100.0%), Personal Care & Service (100.0%), and Food Preparation & Serving (57.0%).
| Occupation | Male | Female |
| Healthcare Support | 0 (0.0%) | 82 (100.0%) |
| Security & Protection | 65 (71.4%) | 26 (28.6%) |
| Firefighting & Prevention | 27 (65.8%) | 14 (34.2%) |
| Law Enforcement | 38 (76.0%) | 12 (24.0%) |
| Food Preparation & Serving | 55 (43.0%) | 73 (57.0%) |
| Cleaning & Maintenance | 28 (66.7%) | 14 (33.3%) |
| Personal Care & Service | 0 (0.0%) | 13 (100.0%) |
| Total (Category) | 148 (41.6%) | 208 (58.4%) |
| Total (Overall) | 959 (44.0%) | 1,223 (56.0%) |
Sales and Office Occupations
The most common Sales and Office occupations in North Terre Haute are Office & Administration (470 | 21.5%), and Sales & Related (212 | 9.7%).
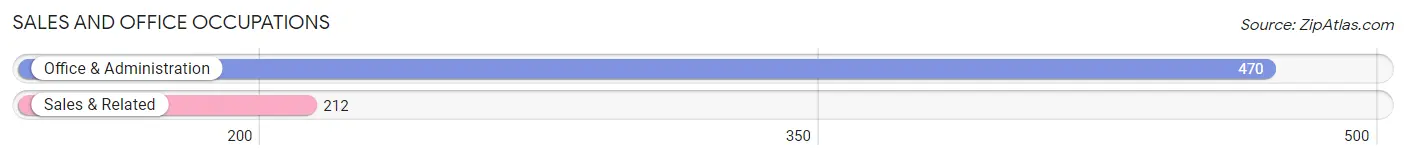
Sales and Office Occupations by Sex
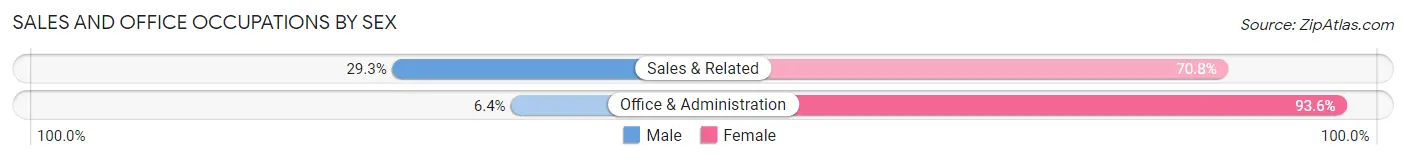
| Occupation | Male | Female |
| Sales & Related | 62 (29.2%) | 150 (70.8%) |
| Office & Administration | 30 (6.4%) | 440 (93.6%) |
| Total (Category) | 92 (13.5%) | 590 (86.5%) |
| Total (Overall) | 959 (44.0%) | 1,223 (56.0%) |
Natural Resources, Construction and Maintenance Occupations
The most common Natural Resources, Construction and Maintenance occupations in North Terre Haute are Installation, Maintenance & Repair (65 | 3.0%), Construction & Extraction (39 | 1.8%), and Farming, Fishing & Forestry (23 | 1.1%).
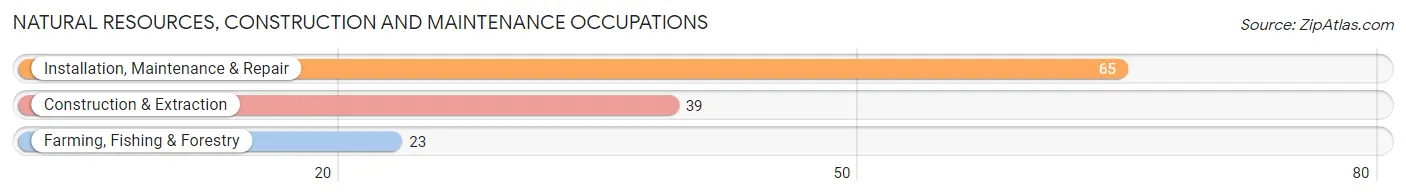
Natural Resources, Construction and Maintenance Occupations by Sex
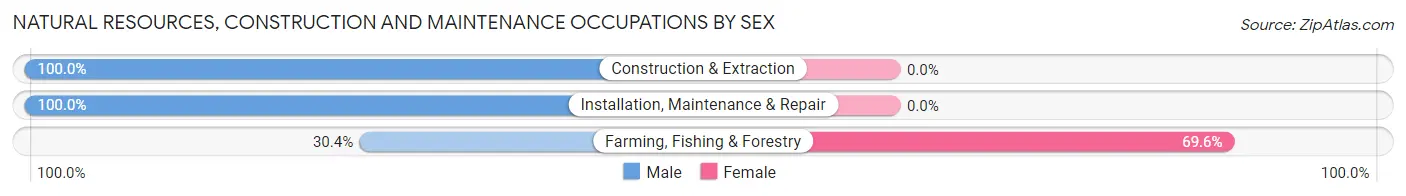
| Occupation | Male | Female |
| Farming, Fishing & Forestry | 7 (30.4%) | 16 (69.6%) |
| Construction & Extraction | 39 (100.0%) | 0 (0.0%) |
| Installation, Maintenance & Repair | 65 (100.0%) | 0 (0.0%) |
| Total (Category) | 111 (87.4%) | 16 (12.6%) |
| Total (Overall) | 959 (44.0%) | 1,223 (56.0%) |
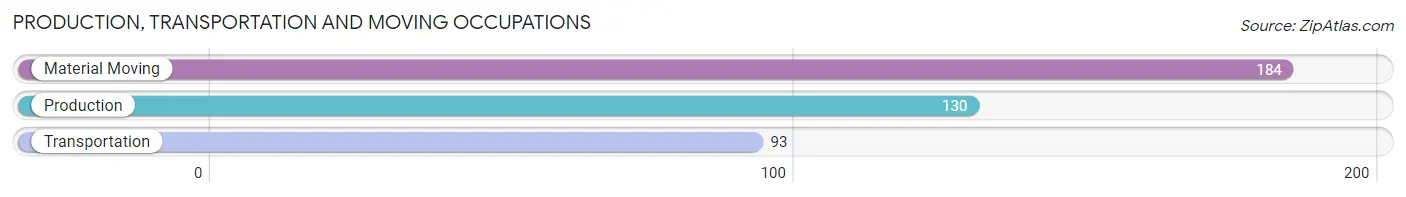
Production, Transportation and Moving Occupations
The most common Production, Transportation and Moving occupations in North Terre Haute are Material Moving (184 | 8.4%), Production (130 | 6.0%), and Transportation (93 | 4.3%).
Production, Transportation and Moving Occupations by Sex
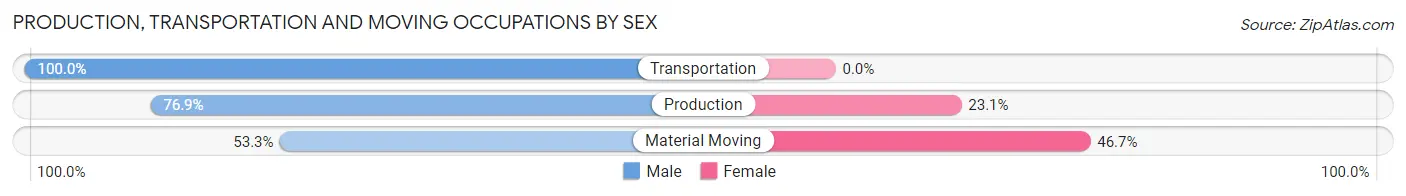
| Occupation | Male | Female |
| Production | 100 (76.9%) | 30 (23.1%) |
| Transportation | 93 (100.0%) | 0 (0.0%) |
| Material Moving | 98 (53.3%) | 86 (46.7%) |
| Total (Category) | 291 (71.5%) | 116 (28.5%) |
| Total (Overall) | 959 (44.0%) | 1,223 (56.0%) |
Employment Industries by Sex in North Terre Haute
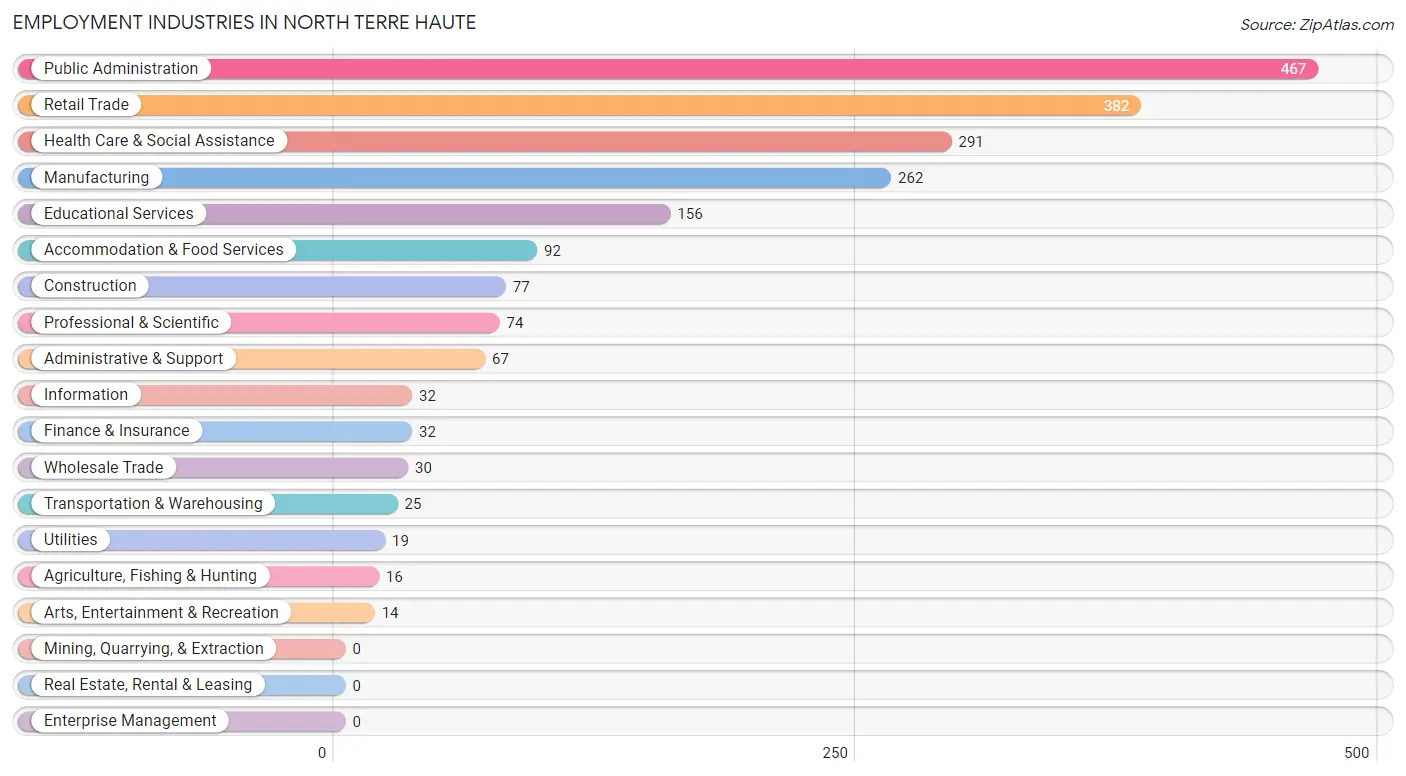
Employment Industries in North Terre Haute
The major employment industries in North Terre Haute include Public Administration (467 | 21.4%), Retail Trade (382 | 17.5%), Health Care & Social Assistance (291 | 13.3%), Manufacturing (262 | 12.0%), and Educational Services (156 | 7.1%).
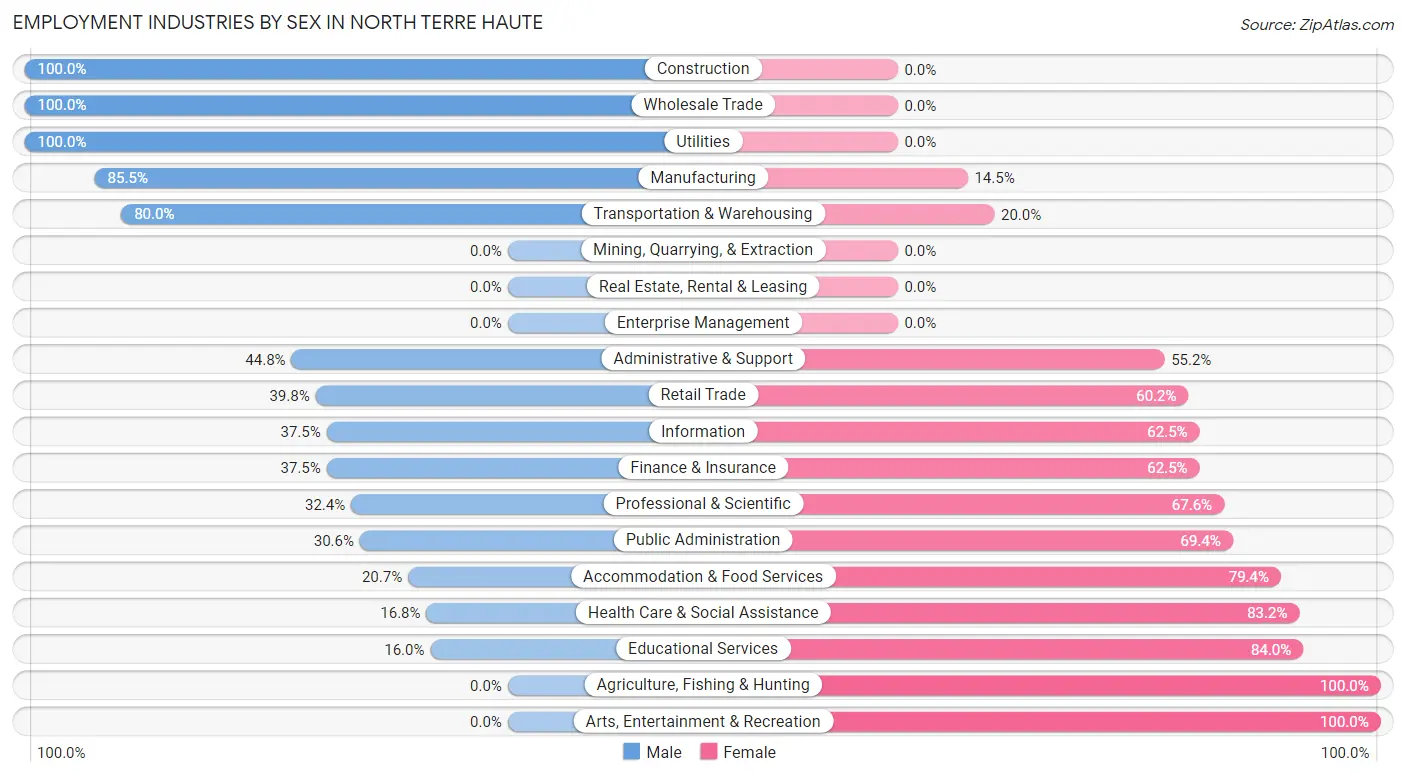
Employment Industries by Sex in North Terre Haute
The North Terre Haute industries that see more men than women are Construction (100.0%), Wholesale Trade (100.0%), and Utilities (100.0%), whereas the industries that tend to have a higher number of women are Agriculture, Fishing & Hunting (100.0%), Arts, Entertainment & Recreation (100.0%), and Educational Services (84.0%).
| Industry | Male | Female |
| Agriculture, Fishing & Hunting | 0 (0.0%) | 16 (100.0%) |
| Mining, Quarrying, & Extraction | 0 (0.0%) | 0 (0.0%) |
| Construction | 77 (100.0%) | 0 (0.0%) |
| Manufacturing | 224 (85.5%) | 38 (14.5%) |
| Wholesale Trade | 30 (100.0%) | 0 (0.0%) |
| Retail Trade | 152 (39.8%) | 230 (60.2%) |
| Transportation & Warehousing | 20 (80.0%) | 5 (20.0%) |
| Utilities | 19 (100.0%) | 0 (0.0%) |
| Information | 12 (37.5%) | 20 (62.5%) |
| Finance & Insurance | 12 (37.5%) | 20 (62.5%) |
| Real Estate, Rental & Leasing | 0 (0.0%) | 0 (0.0%) |
| Professional & Scientific | 24 (32.4%) | 50 (67.6%) |
| Enterprise Management | 0 (0.0%) | 0 (0.0%) |
| Administrative & Support | 30 (44.8%) | 37 (55.2%) |
| Educational Services | 25 (16.0%) | 131 (84.0%) |
| Health Care & Social Assistance | 49 (16.8%) | 242 (83.2%) |
| Arts, Entertainment & Recreation | 0 (0.0%) | 14 (100.0%) |
| Accommodation & Food Services | 19 (20.6%) | 73 (79.3%) |
| Public Administration | 143 (30.6%) | 324 (69.4%) |
| Total | 959 (44.0%) | 1,223 (56.0%) |
Education in North Terre Haute
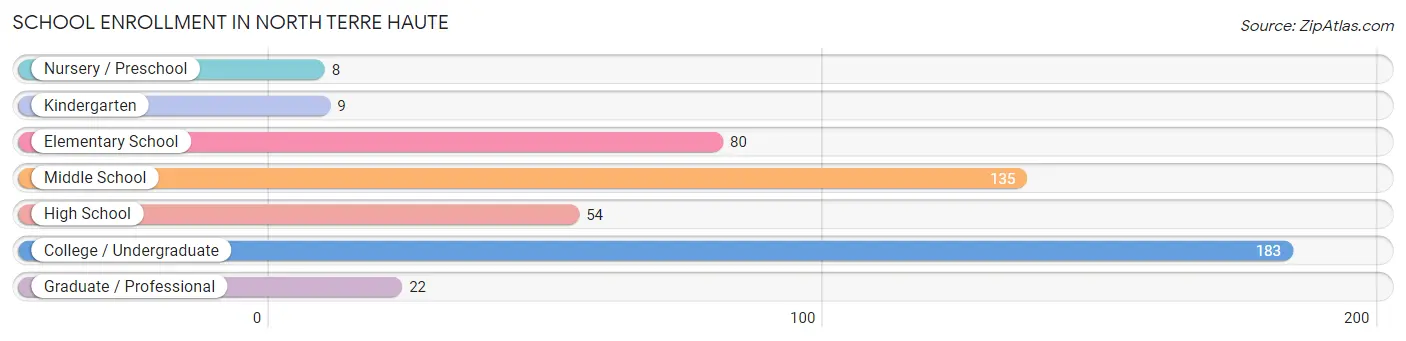
School Enrollment in North Terre Haute
The most common levels of schooling among the 491 students in North Terre Haute are college / undergraduate (183 | 37.3%), middle school (135 | 27.5%), and elementary school (80 | 16.3%).
| School Level | # Students | % Students |
| Nursery / Preschool | 8 | 1.6% |
| Kindergarten | 9 | 1.8% |
| Elementary School | 80 | 16.3% |
| Middle School | 135 | 27.5% |
| High School | 54 | 11.0% |
| College / Undergraduate | 183 | 37.3% |
| Graduate / Professional | 22 | 4.5% |
| Total | 491 | 100.0% |
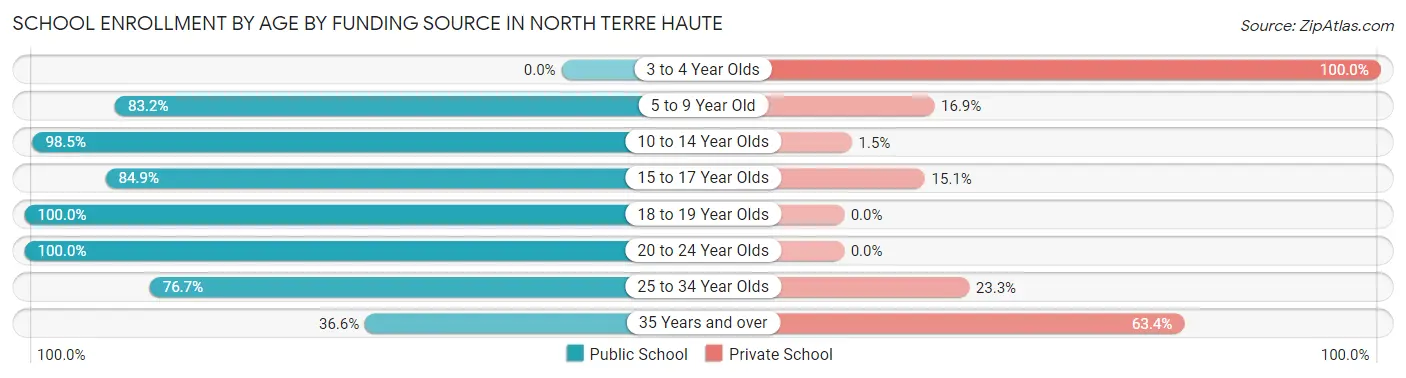
School Enrollment by Age by Funding Source in North Terre Haute
Out of a total of 491 students who are enrolled in schools in North Terre Haute, 73 (14.9%) attend a private institution, while the remaining 418 (85.1%) are enrolled in public schools. The age group of 3 to 4 year olds has the highest likelihood of being enrolled in private schools, with 8 (100.0% in the age bracket) enrolled. Conversely, the age group of 18 to 19 year olds has the lowest likelihood of being enrolled in a private school, with 44 (100.0% in the age bracket) attending a public institution.
| Age Bracket | Public School | Private School |
| 3 to 4 Year Olds | 0 (0.0%) | 8 (100.0%) |
| 5 to 9 Year Old | 74 (83.2%) | 15 (16.9%) |
| 10 to 14 Year Olds | 134 (98.5%) | 2 (1.5%) |
| 15 to 17 Year Olds | 45 (84.9%) | 8 (15.1%) |
| 18 to 19 Year Olds | 44 (100.0%) | 0 (0.0%) |
| 20 to 24 Year Olds | 60 (100.0%) | 0 (0.0%) |
| 25 to 34 Year Olds | 46 (76.7%) | 14 (23.3%) |
| 35 Years and over | 15 (36.6%) | 26 (63.4%) |
| Total | 418 (85.1%) | 73 (14.9%) |
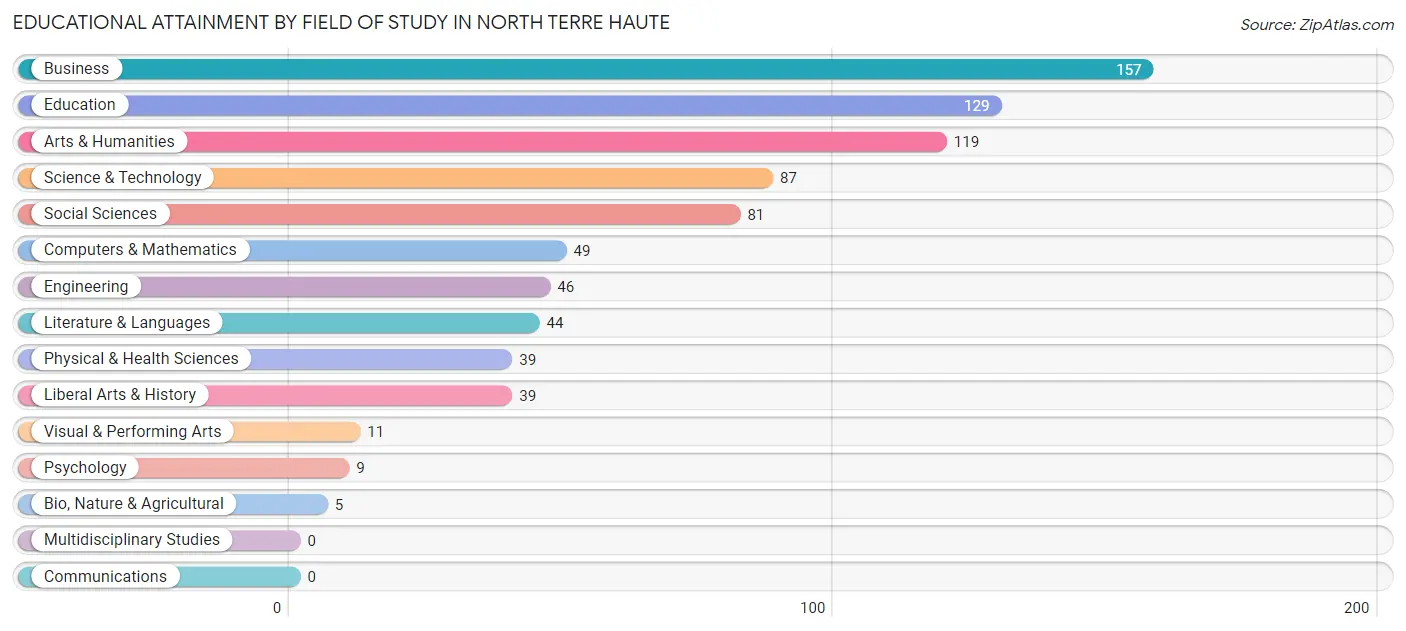
Educational Attainment by Field of Study in North Terre Haute
Business (157 | 19.3%), education (129 | 15.8%), arts & humanities (119 | 14.6%), science & technology (87 | 10.7%), and social sciences (81 | 9.9%) are the most common fields of study among 815 individuals in North Terre Haute who have obtained a bachelor's degree or higher.
| Field of Study | # Graduates | % Graduates |
| Computers & Mathematics | 49 | 6.0% |
| Bio, Nature & Agricultural | 5 | 0.6% |
| Physical & Health Sciences | 39 | 4.8% |
| Psychology | 9 | 1.1% |
| Social Sciences | 81 | 9.9% |
| Engineering | 46 | 5.6% |
| Multidisciplinary Studies | 0 | 0.0% |
| Science & Technology | 87 | 10.7% |
| Business | 157 | 19.3% |
| Education | 129 | 15.8% |
| Literature & Languages | 44 | 5.4% |
| Liberal Arts & History | 39 | 4.8% |
| Visual & Performing Arts | 11 | 1.3% |
| Communications | 0 | 0.0% |
| Arts & Humanities | 119 | 14.6% |
| Total | 815 | 100.0% |
Transportation & Commute in North Terre Haute
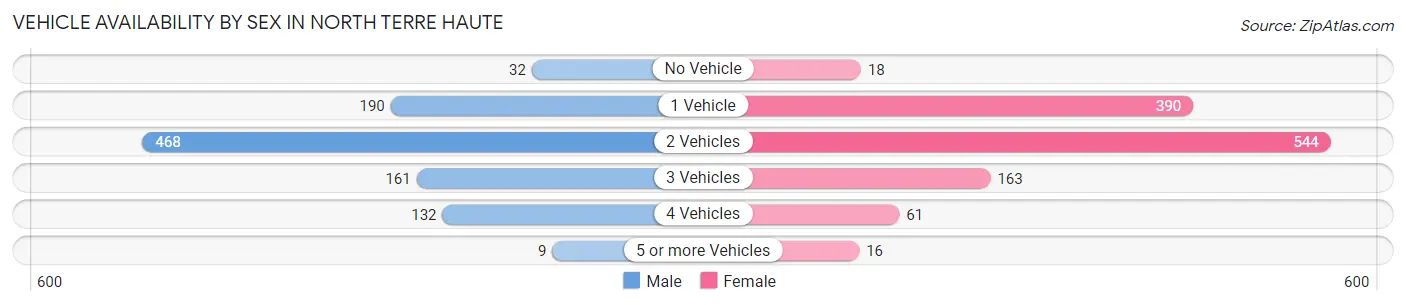
Vehicle Availability by Sex in North Terre Haute
The most prevalent vehicle ownership categories in North Terre Haute are males with 2 vehicles (468, accounting for 47.2%) and females with 2 vehicles (544, making up 39.3%).
| Vehicles Available | Male | Female |
| No Vehicle | 32 (3.2%) | 18 (1.5%) |
| 1 Vehicle | 190 (19.2%) | 390 (32.7%) |
| 2 Vehicles | 468 (47.2%) | 544 (45.6%) |
| 3 Vehicles | 161 (16.2%) | 163 (13.7%) |
| 4 Vehicles | 132 (13.3%) | 61 (5.1%) |
| 5 or more Vehicles | 9 (0.9%) | 16 (1.3%) |
| Total | 992 (100.0%) | 1,192 (100.0%) |
Commute Time in North Terre Haute
The most frequently occuring commute durations in North Terre Haute are 20 to 24 minutes (623 commuters, 29.2%), 15 to 19 minutes (527 commuters, 24.7%), and 10 to 14 minutes (265 commuters, 12.4%).
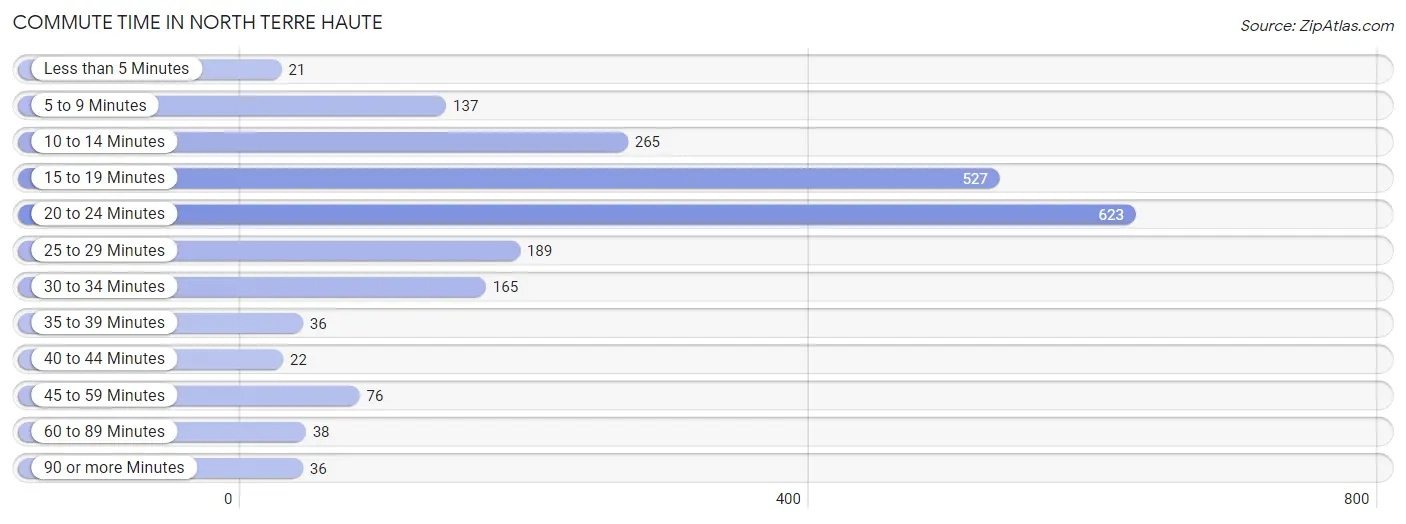
| Commute Time | # Commuters | % Commuters |
| Less than 5 Minutes | 21 | 1.0% |
| 5 to 9 Minutes | 137 | 6.4% |
| 10 to 14 Minutes | 265 | 12.4% |
| 15 to 19 Minutes | 527 | 24.7% |
| 20 to 24 Minutes | 623 | 29.2% |
| 25 to 29 Minutes | 189 | 8.8% |
| 30 to 34 Minutes | 165 | 7.7% |
| 35 to 39 Minutes | 36 | 1.7% |
| 40 to 44 Minutes | 22 | 1.0% |
| 45 to 59 Minutes | 76 | 3.6% |
| 60 to 89 Minutes | 38 | 1.8% |
| 90 or more Minutes | 36 | 1.7% |
Commute Time by Sex in North Terre Haute
The most common commute times in North Terre Haute are 20 to 24 minutes (220 commuters, 22.6%) for males and 20 to 24 minutes (403 commuters, 34.7%) for females.
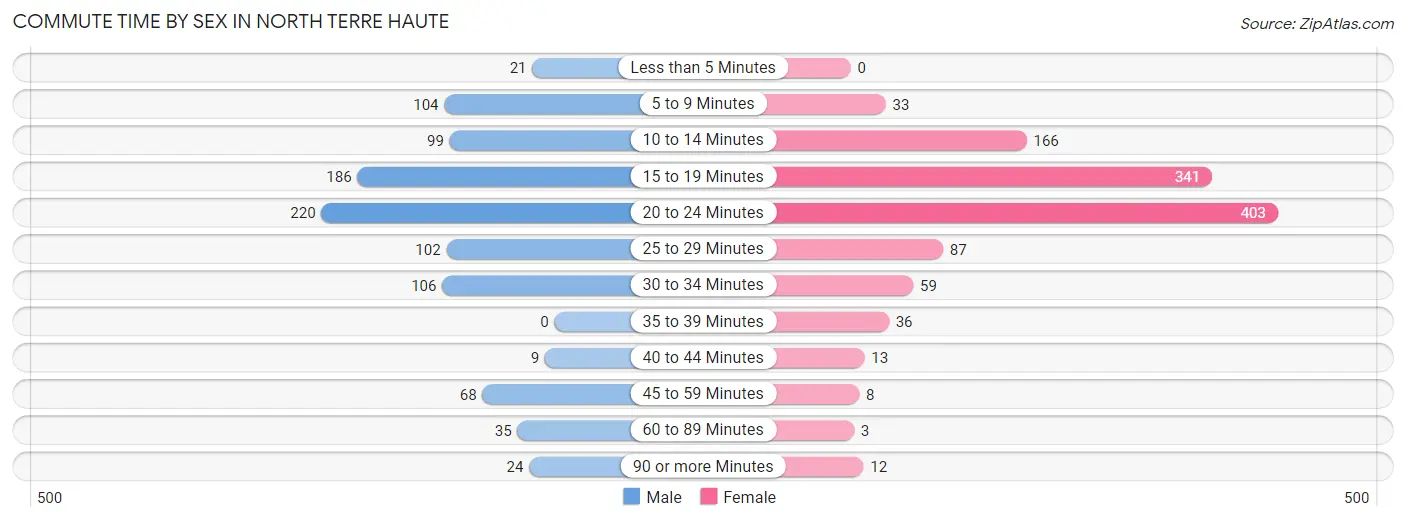
| Commute Time | Male | Female |
| Less than 5 Minutes | 21 (2.2%) | 0 (0.0%) |
| 5 to 9 Minutes | 104 (10.7%) | 33 (2.8%) |
| 10 to 14 Minutes | 99 (10.2%) | 166 (14.3%) |
| 15 to 19 Minutes | 186 (19.1%) | 341 (29.4%) |
| 20 to 24 Minutes | 220 (22.6%) | 403 (34.7%) |
| 25 to 29 Minutes | 102 (10.5%) | 87 (7.5%) |
| 30 to 34 Minutes | 106 (10.9%) | 59 (5.1%) |
| 35 to 39 Minutes | 0 (0.0%) | 36 (3.1%) |
| 40 to 44 Minutes | 9 (0.9%) | 13 (1.1%) |
| 45 to 59 Minutes | 68 (7.0%) | 8 (0.7%) |
| 60 to 89 Minutes | 35 (3.6%) | 3 (0.3%) |
| 90 or more Minutes | 24 (2.5%) | 12 (1.0%) |
Time of Departure to Work by Sex in North Terre Haute
The most frequent times of departure to work in North Terre Haute are 7:30 AM to 7:59 AM (220, 22.6%) for males and 7:30 AM to 7:59 AM (353, 30.4%) for females.
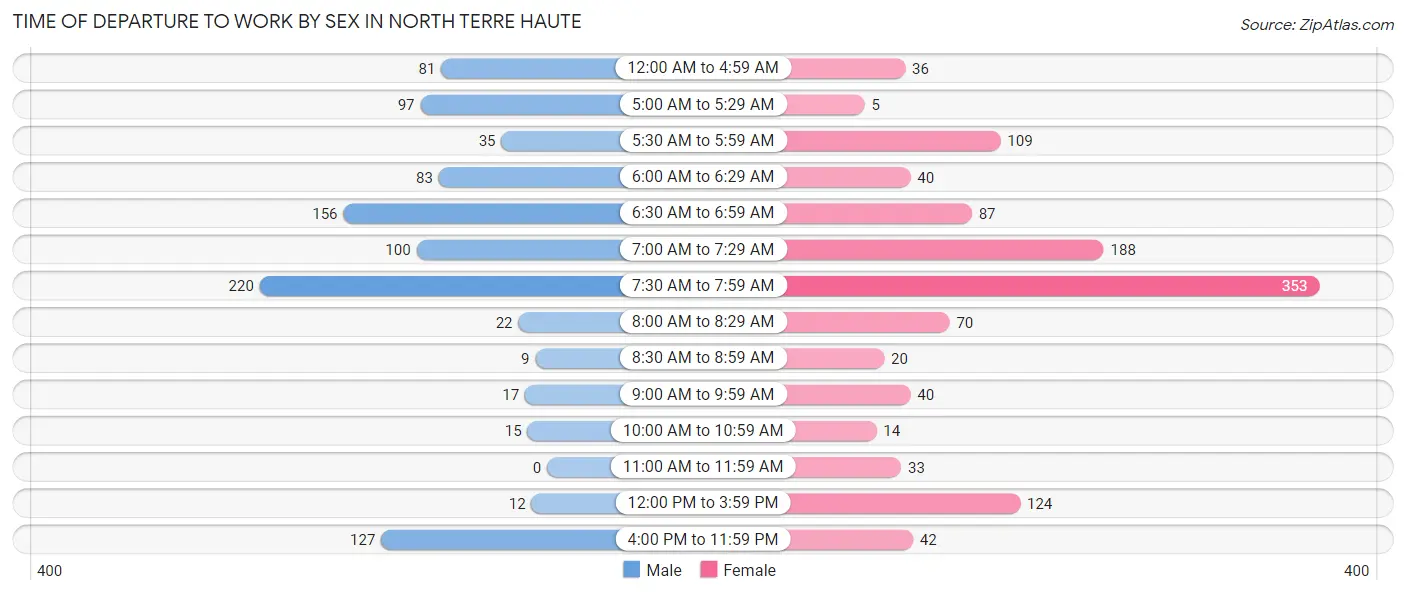
| Time of Departure | Male | Female |
| 12:00 AM to 4:59 AM | 81 (8.3%) | 36 (3.1%) |
| 5:00 AM to 5:29 AM | 97 (10.0%) | 5 (0.4%) |
| 5:30 AM to 5:59 AM | 35 (3.6%) | 109 (9.4%) |
| 6:00 AM to 6:29 AM | 83 (8.5%) | 40 (3.5%) |
| 6:30 AM to 6:59 AM | 156 (16.0%) | 87 (7.5%) |
| 7:00 AM to 7:29 AM | 100 (10.3%) | 188 (16.2%) |
| 7:30 AM to 7:59 AM | 220 (22.6%) | 353 (30.4%) |
| 8:00 AM to 8:29 AM | 22 (2.3%) | 70 (6.0%) |
| 8:30 AM to 8:59 AM | 9 (0.9%) | 20 (1.7%) |
| 9:00 AM to 9:59 AM | 17 (1.8%) | 40 (3.5%) |
| 10:00 AM to 10:59 AM | 15 (1.5%) | 14 (1.2%) |
| 11:00 AM to 11:59 AM | 0 (0.0%) | 33 (2.8%) |
| 12:00 PM to 3:59 PM | 12 (1.2%) | 124 (10.7%) |
| 4:00 PM to 11:59 PM | 127 (13.0%) | 42 (3.6%) |
| Total | 974 (100.0%) | 1,161 (100.0%) |
Housing Occupancy in North Terre Haute
Occupancy by Ownership in North Terre Haute
Of the total 2,225 dwellings in North Terre Haute, owner-occupied units account for 1,548 (69.6%), while renter-occupied units make up 677 (30.4%).
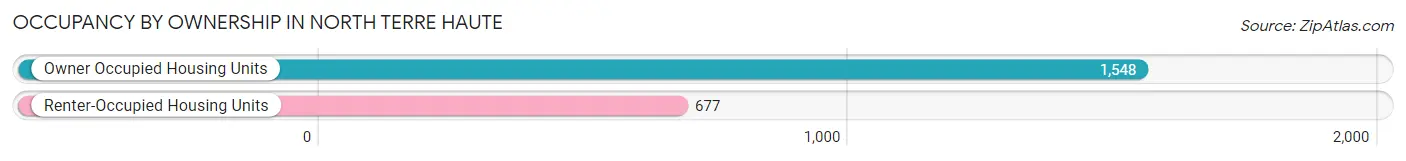
| Occupancy | # Housing Units | % Housing Units |
| Owner Occupied Housing Units | 1,548 | 69.6% |
| Renter-Occupied Housing Units | 677 | 30.4% |
| Total Occupied Housing Units | 2,225 | 100.0% |
Occupancy by Household Size in North Terre Haute
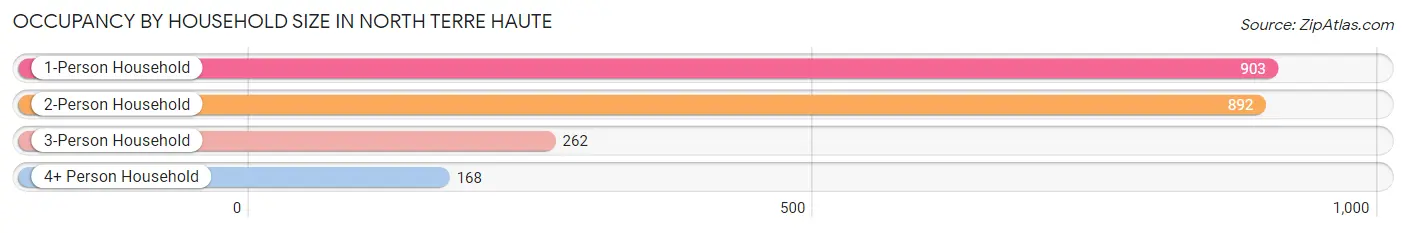
| Household Size | # Housing Units | % Housing Units |
| 1-Person Household | 903 | 40.6% |
| 2-Person Household | 892 | 40.1% |
| 3-Person Household | 262 | 11.8% |
| 4+ Person Household | 168 | 7.5% |
| Total Housing Units | 2,225 | 100.0% |
Occupancy by Ownership by Household Size in North Terre Haute
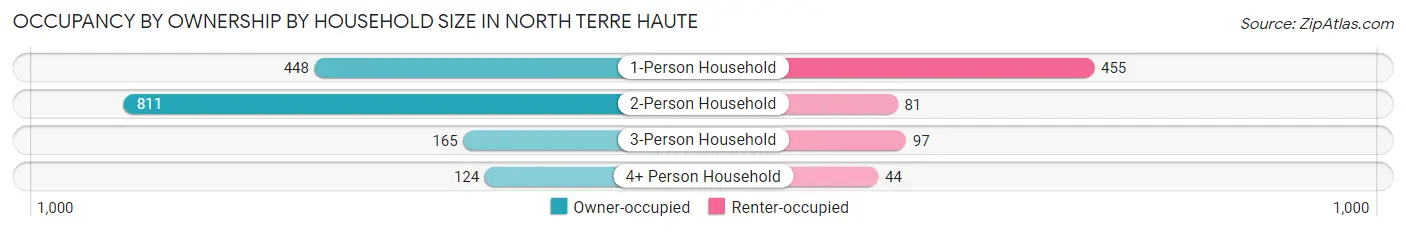
| Household Size | Owner-occupied | Renter-occupied |
| 1-Person Household | 448 (49.6%) | 455 (50.4%) |
| 2-Person Household | 811 (90.9%) | 81 (9.1%) |
| 3-Person Household | 165 (63.0%) | 97 (37.0%) |
| 4+ Person Household | 124 (73.8%) | 44 (26.2%) |
| Total Housing Units | 1,548 (69.6%) | 677 (30.4%) |
Occupancy by Educational Attainment in North Terre Haute
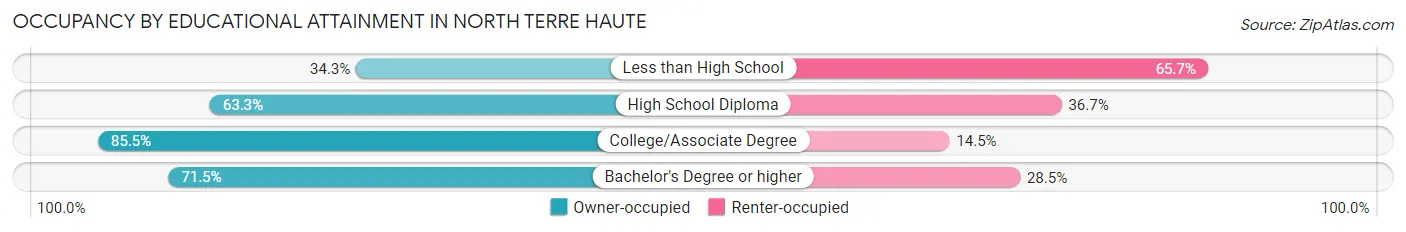
| Household Size | Owner-occupied | Renter-occupied |
| Less than High School | 49 (34.3%) | 94 (65.7%) |
| High School Diploma | 606 (63.3%) | 352 (36.7%) |
| College/Associate Degree | 547 (85.5%) | 93 (14.5%) |
| Bachelor's Degree or higher | 346 (71.5%) | 138 (28.5%) |
Occupancy by Age of Householder in North Terre Haute
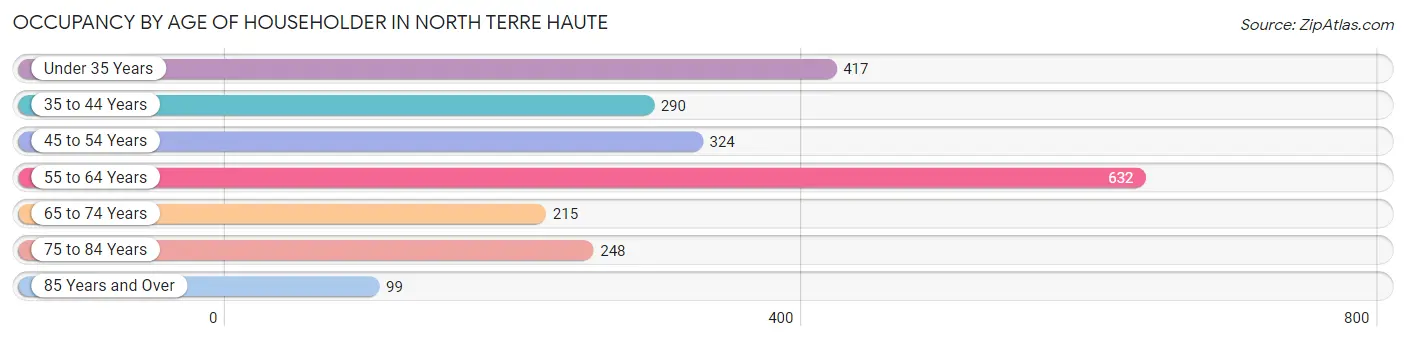
| Age Bracket | # Households | % Households |
| Under 35 Years | 417 | 18.7% |
| 35 to 44 Years | 290 | 13.0% |
| 45 to 54 Years | 324 | 14.6% |
| 55 to 64 Years | 632 | 28.4% |
| 65 to 74 Years | 215 | 9.7% |
| 75 to 84 Years | 248 | 11.2% |
| 85 Years and Over | 99 | 4.4% |
| Total | 2,225 | 100.0% |
Housing Finances in North Terre Haute
Median Income by Occupancy in North Terre Haute
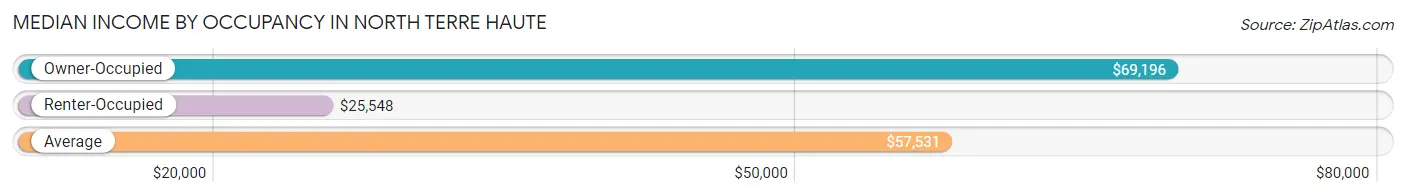
| Occupancy Type | # Households | Median Income |
| Owner-Occupied | 1,548 (69.6%) | $69,196 |
| Renter-Occupied | 677 (30.4%) | $25,548 |
| Average | 2,225 (100.0%) | $57,531 |
Occupancy by Householder Income Bracket in North Terre Haute
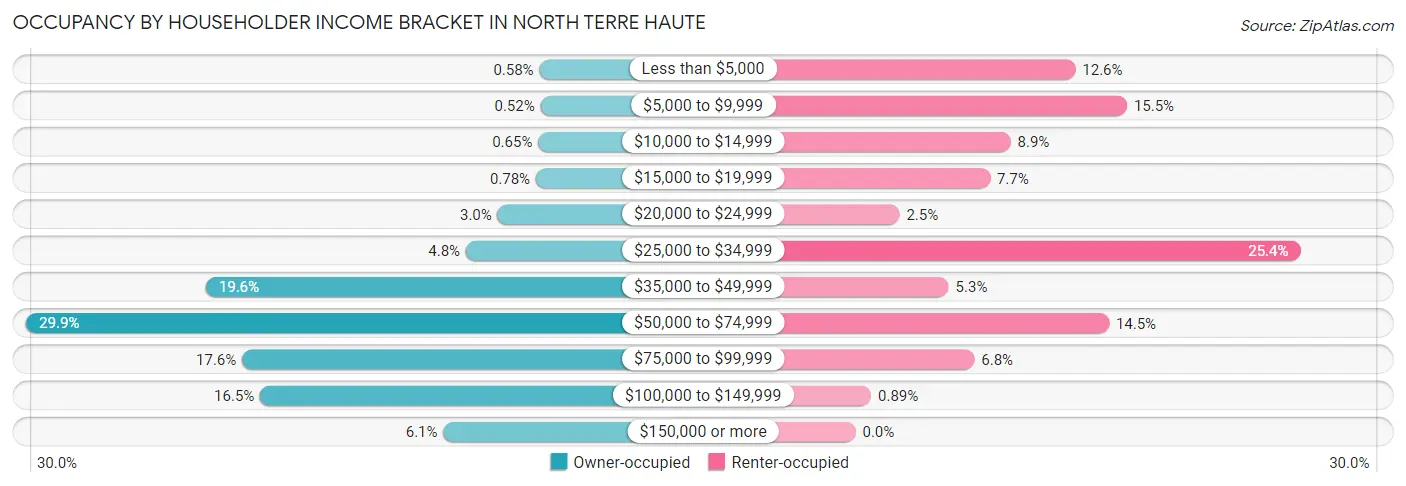
| Income Bracket | Owner-occupied | Renter-occupied |
| Less than $5,000 | 9 (0.6%) | 85 (12.6%) |
| $5,000 to $9,999 | 8 (0.5%) | 105 (15.5%) |
| $10,000 to $14,999 | 10 (0.6%) | 60 (8.9%) |
| $15,000 to $19,999 | 12 (0.8%) | 52 (7.7%) |
| $20,000 to $24,999 | 46 (3.0%) | 17 (2.5%) |
| $25,000 to $34,999 | 74 (4.8%) | 172 (25.4%) |
| $35,000 to $49,999 | 304 (19.6%) | 36 (5.3%) |
| $50,000 to $74,999 | 463 (29.9%) | 98 (14.5%) |
| $75,000 to $99,999 | 272 (17.6%) | 46 (6.8%) |
| $100,000 to $149,999 | 256 (16.5%) | 6 (0.9%) |
| $150,000 or more | 94 (6.1%) | 0 (0.0%) |
| Total | 1,548 (100.0%) | 677 (100.0%) |
Monthly Housing Cost Tiers in North Terre Haute
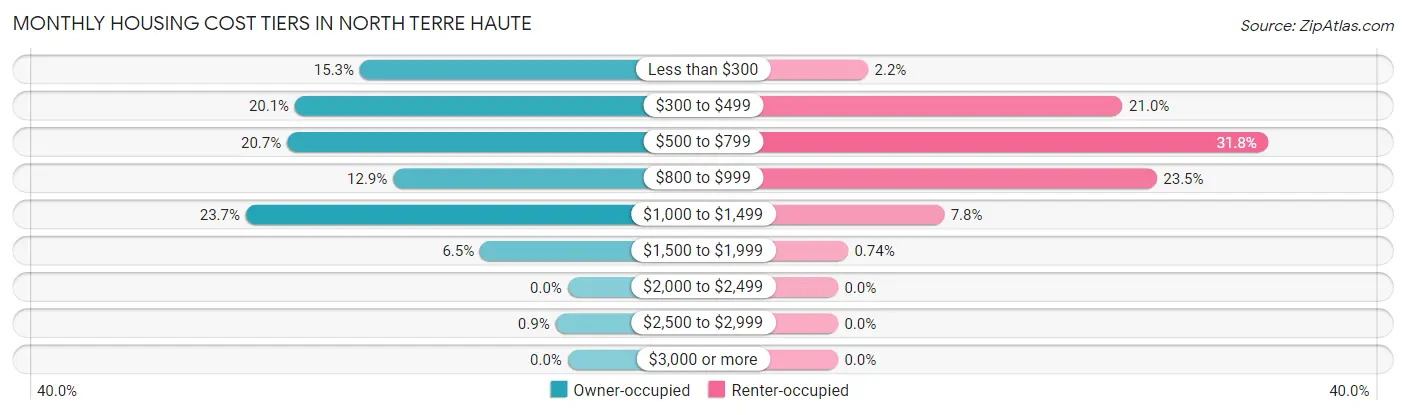
| Monthly Cost | Owner-occupied | Renter-occupied |
| Less than $300 | 237 (15.3%) | 15 (2.2%) |
| $300 to $499 | 311 (20.1%) | 142 (21.0%) |
| $500 to $799 | 320 (20.7%) | 215 (31.8%) |
| $800 to $999 | 199 (12.9%) | 159 (23.5%) |
| $1,000 to $1,499 | 367 (23.7%) | 53 (7.8%) |
| $1,500 to $1,999 | 100 (6.5%) | 5 (0.7%) |
| $2,000 to $2,499 | 0 (0.0%) | 0 (0.0%) |
| $2,500 to $2,999 | 14 (0.9%) | 0 (0.0%) |
| $3,000 or more | 0 (0.0%) | 0 (0.0%) |
| Total | 1,548 (100.0%) | 677 (100.0%) |
Physical Housing Characteristics in North Terre Haute
Housing Structures in North Terre Haute
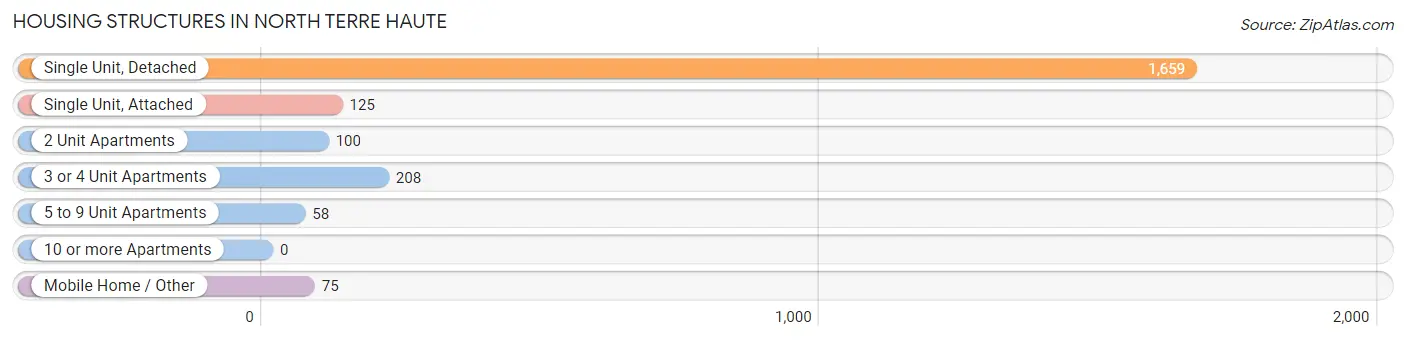
| Structure Type | # Housing Units | % Housing Units |
| Single Unit, Detached | 1,659 | 74.6% |
| Single Unit, Attached | 125 | 5.6% |
| 2 Unit Apartments | 100 | 4.5% |
| 3 or 4 Unit Apartments | 208 | 9.3% |
| 5 to 9 Unit Apartments | 58 | 2.6% |
| 10 or more Apartments | 0 | 0.0% |
| Mobile Home / Other | 75 | 3.4% |
| Total | 2,225 | 100.0% |
Housing Structures by Occupancy in North Terre Haute
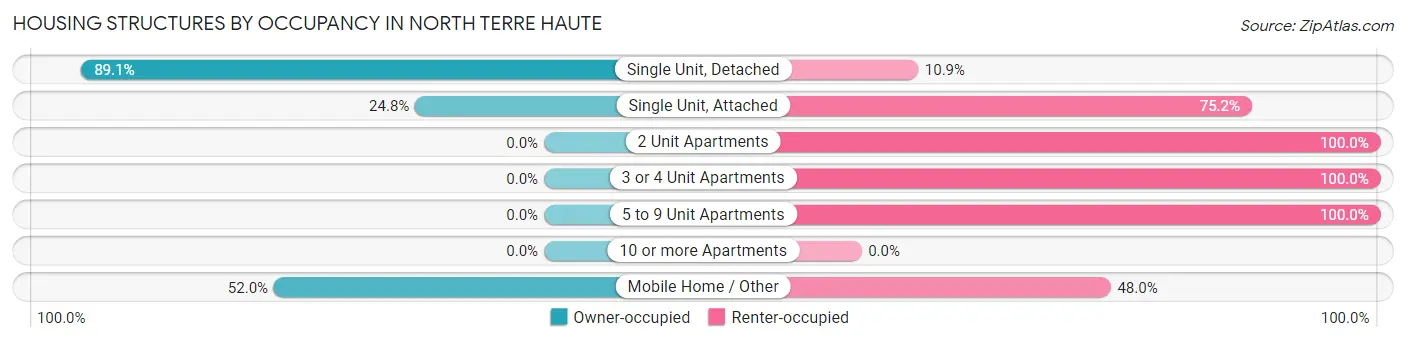
| Structure Type | Owner-occupied | Renter-occupied |
| Single Unit, Detached | 1,478 (89.1%) | 181 (10.9%) |
| Single Unit, Attached | 31 (24.8%) | 94 (75.2%) |
| 2 Unit Apartments | 0 (0.0%) | 100 (100.0%) |
| 3 or 4 Unit Apartments | 0 (0.0%) | 208 (100.0%) |
| 5 to 9 Unit Apartments | 0 (0.0%) | 58 (100.0%) |
| 10 or more Apartments | 0 (0.0%) | 0 (0.0%) |
| Mobile Home / Other | 39 (52.0%) | 36 (48.0%) |
| Total | 1,548 (69.6%) | 677 (30.4%) |
Housing Structures by Number of Rooms in North Terre Haute
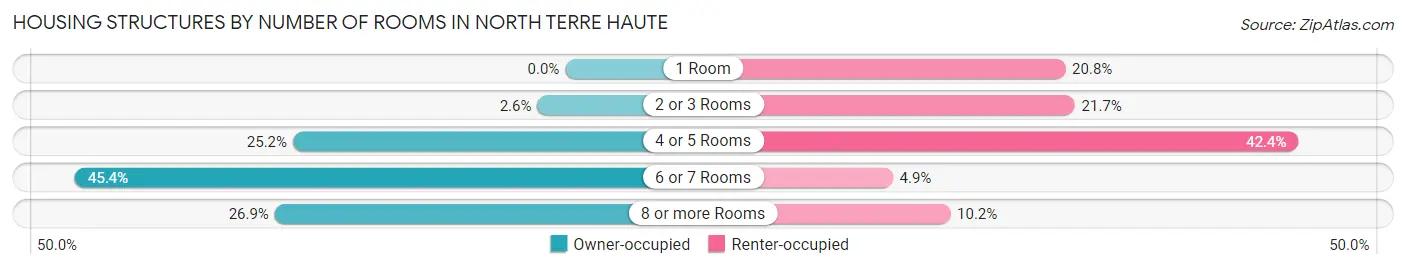
| Number of Rooms | Owner-occupied | Renter-occupied |
| 1 Room | 0 (0.0%) | 141 (20.8%) |
| 2 or 3 Rooms | 40 (2.6%) | 147 (21.7%) |
| 4 or 5 Rooms | 390 (25.2%) | 287 (42.4%) |
| 6 or 7 Rooms | 702 (45.4%) | 33 (4.9%) |
| 8 or more Rooms | 416 (26.9%) | 69 (10.2%) |
| Total | 1,548 (100.0%) | 677 (100.0%) |
Housing Structure by Heating Type in North Terre Haute
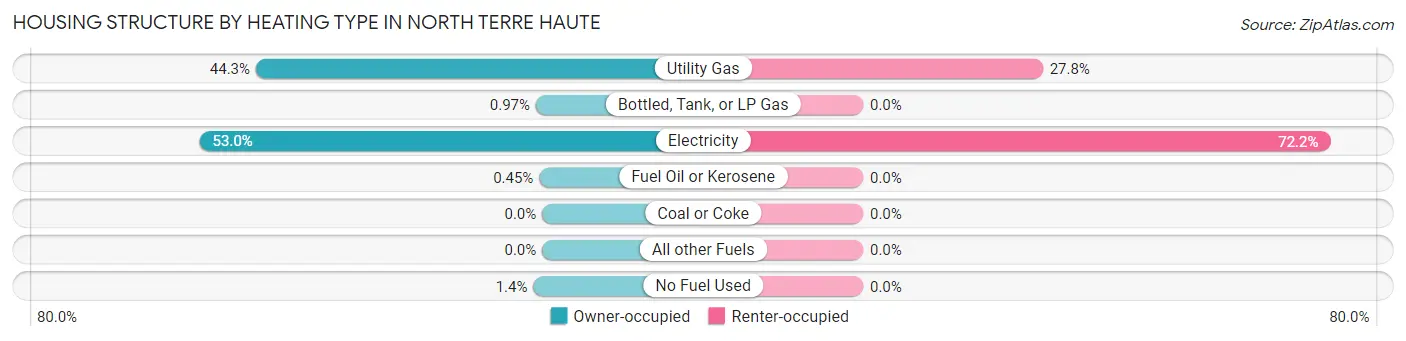
| Heating Type | Owner-occupied | Renter-occupied |
| Utility Gas | 685 (44.3%) | 188 (27.8%) |
| Bottled, Tank, or LP Gas | 15 (1.0%) | 0 (0.0%) |
| Electricity | 820 (53.0%) | 489 (72.2%) |
| Fuel Oil or Kerosene | 7 (0.4%) | 0 (0.0%) |
| Coal or Coke | 0 (0.0%) | 0 (0.0%) |
| All other Fuels | 0 (0.0%) | 0 (0.0%) |
| No Fuel Used | 21 (1.4%) | 0 (0.0%) |
| Total | 1,548 (100.0%) | 677 (100.0%) |
Household Vehicle Usage in North Terre Haute
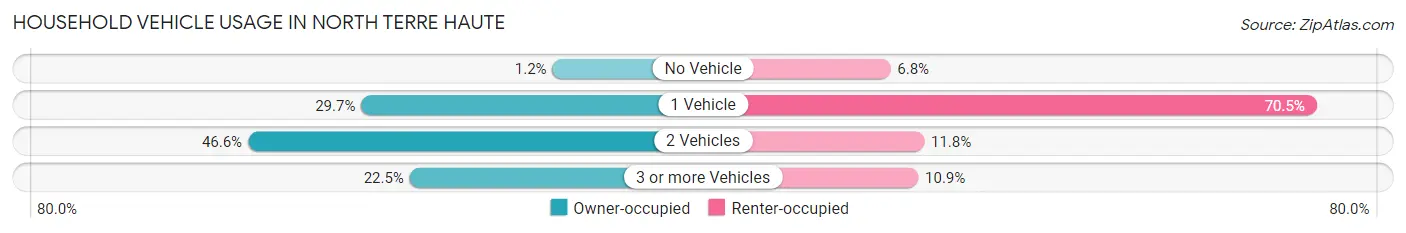
| Vehicles per Household | Owner-occupied | Renter-occupied |
| No Vehicle | 18 (1.2%) | 46 (6.8%) |
| 1 Vehicle | 460 (29.7%) | 477 (70.5%) |
| 2 Vehicles | 722 (46.6%) | 80 (11.8%) |
| 3 or more Vehicles | 348 (22.5%) | 74 (10.9%) |
| Total | 1,548 (100.0%) | 677 (100.0%) |
Real Estate & Mortgages in North Terre Haute
Real Estate and Mortgage Overview in North Terre Haute
| Characteristic | Without Mortgage | With Mortgage |
| Housing Units | 752 | 796 |
| Median Property Value | $105,100 | $137,800 |
| Median Household Income | $67,912 | $57 |
| Monthly Housing Costs | $377 | $0 |
| Real Estate Taxes | $1,207 | $23 |
Property Value by Mortgage Status in North Terre Haute
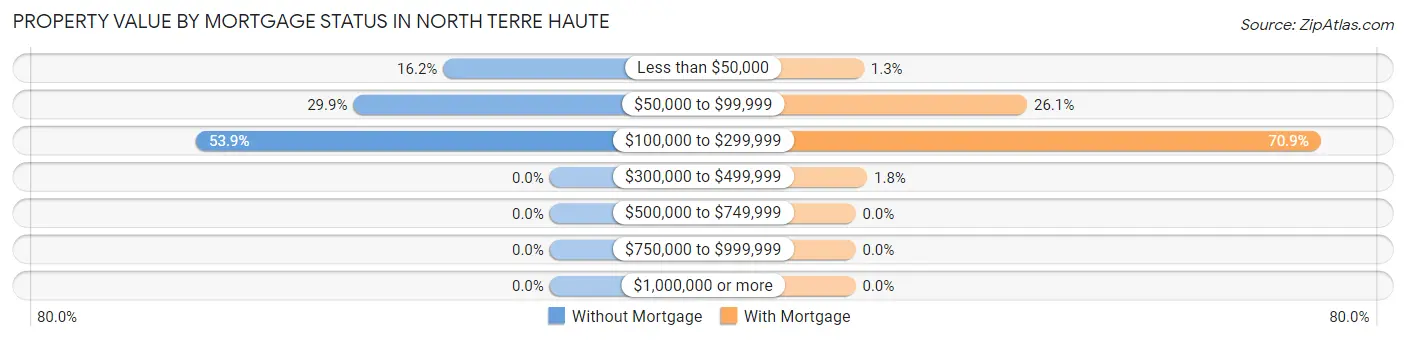
| Property Value | Without Mortgage | With Mortgage |
| Less than $50,000 | 122 (16.2%) | 10 (1.3%) |
| $50,000 to $99,999 | 225 (29.9%) | 208 (26.1%) |
| $100,000 to $299,999 | 405 (53.9%) | 564 (70.9%) |
| $300,000 to $499,999 | 0 (0.0%) | 14 (1.8%) |
| $500,000 to $749,999 | 0 (0.0%) | 0 (0.0%) |
| $750,000 to $999,999 | 0 (0.0%) | 0 (0.0%) |
| $1,000,000 or more | 0 (0.0%) | 0 (0.0%) |
| Total | 752 (100.0%) | 796 (100.0%) |
Household Income by Mortgage Status in North Terre Haute
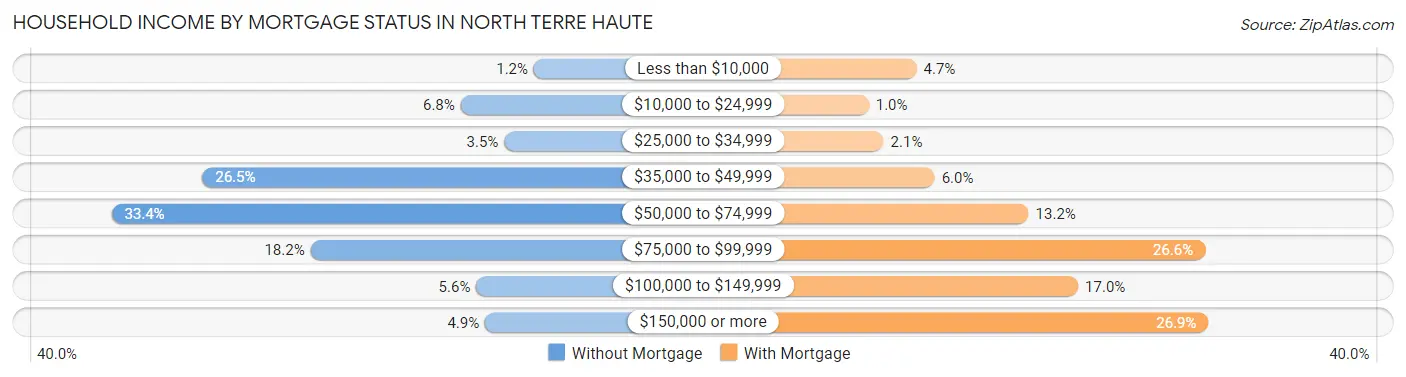
| Household Income | Without Mortgage | With Mortgage |
| Less than $10,000 | 9 (1.2%) | 37 (4.6%) |
| $10,000 to $24,999 | 51 (6.8%) | 8 (1.0%) |
| $25,000 to $34,999 | 26 (3.5%) | 17 (2.1%) |
| $35,000 to $49,999 | 199 (26.5%) | 48 (6.0%) |
| $50,000 to $74,999 | 251 (33.4%) | 105 (13.2%) |
| $75,000 to $99,999 | 137 (18.2%) | 212 (26.6%) |
| $100,000 to $149,999 | 42 (5.6%) | 135 (17.0%) |
| $150,000 or more | 37 (4.9%) | 214 (26.9%) |
| Total | 752 (100.0%) | 796 (100.0%) |
Property Value to Household Income Ratio in North Terre Haute
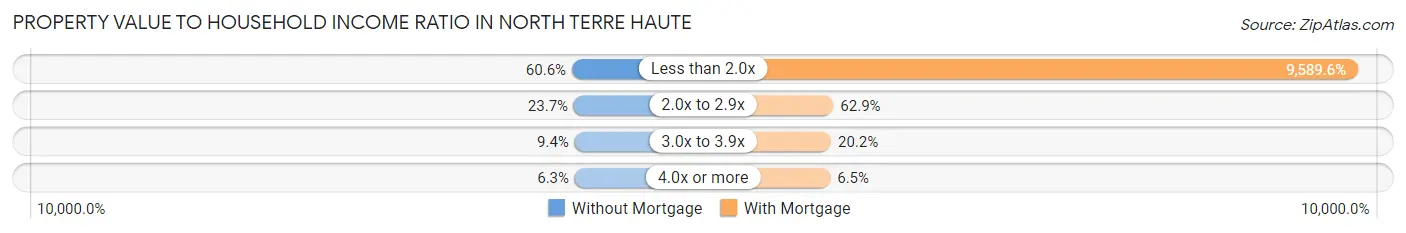
| Value-to-Income Ratio | Without Mortgage | With Mortgage |
| Less than 2.0x | 456 (60.6%) | 76,333 (9,589.6%) |
| 2.0x to 2.9x | 178 (23.7%) | 501 (62.9%) |
| 3.0x to 3.9x | 71 (9.4%) | 161 (20.2%) |
| 4.0x or more | 47 (6.2%) | 52 (6.5%) |
| Total | 752 (100.0%) | 796 (100.0%) |
Real Estate Taxes by Mortgage Status in North Terre Haute
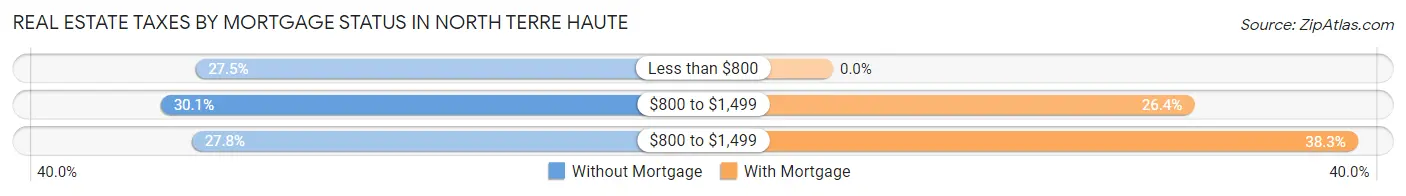
| Property Taxes | Without Mortgage | With Mortgage |
| Less than $800 | 207 (27.5%) | 0 (0.0%) |
| $800 to $1,499 | 226 (30.0%) | 210 (26.4%) |
| $800 to $1,499 | 209 (27.8%) | 305 (38.3%) |
| Total | 752 (100.0%) | 796 (100.0%) |
Health & Disability in North Terre Haute
Health Insurance Coverage by Age in North Terre Haute
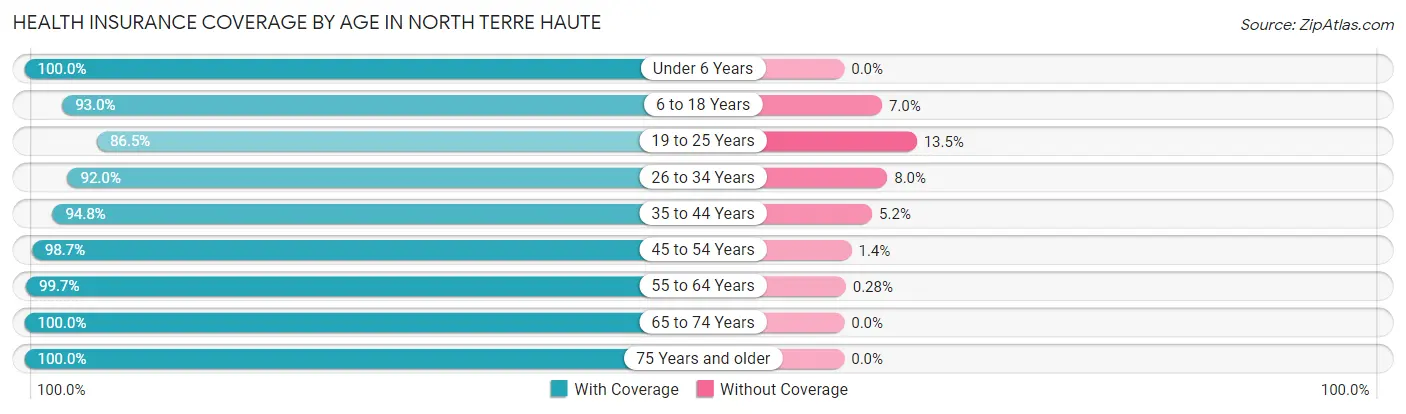
| Age Bracket | With Coverage | Without Coverage |
| Under 6 Years | 246 (100.0%) | 0 (0.0%) |
| 6 to 18 Years | 278 (93.0%) | 21 (7.0%) |
| 19 to 25 Years | 487 (86.5%) | 76 (13.5%) |
| 26 to 34 Years | 321 (92.0%) | 28 (8.0%) |
| 35 to 44 Years | 401 (94.8%) | 22 (5.2%) |
| 45 to 54 Years | 511 (98.7%) | 7 (1.3%) |
| 55 to 64 Years | 1,080 (99.7%) | 3 (0.3%) |
| 65 to 74 Years | 400 (100.0%) | 0 (0.0%) |
| 75 Years and older | 516 (100.0%) | 0 (0.0%) |
| Total | 4,240 (96.4%) | 157 (3.6%) |
Health Insurance Coverage by Citizenship Status in North Terre Haute
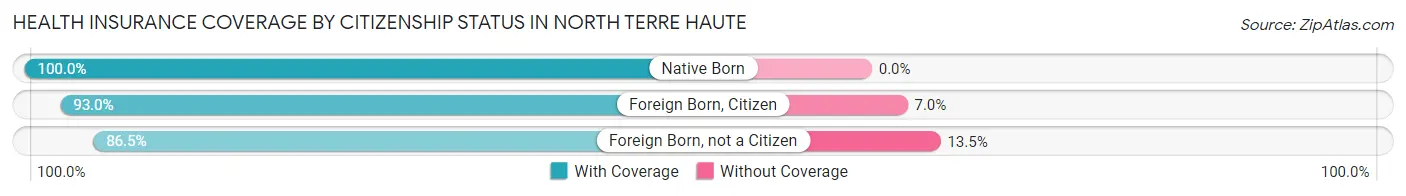
| Citizenship Status | With Coverage | Without Coverage |
| Native Born | 246 (100.0%) | 0 (0.0%) |
| Foreign Born, Citizen | 278 (93.0%) | 21 (7.0%) |
| Foreign Born, not a Citizen | 487 (86.5%) | 76 (13.5%) |
Health Insurance Coverage by Household Income in North Terre Haute
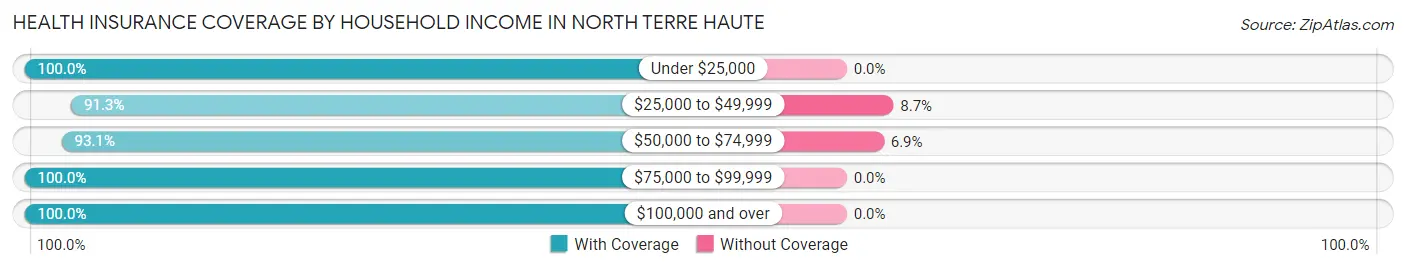
| Household Income | With Coverage | Without Coverage |
| Under $25,000 | 516 (100.0%) | 0 (0.0%) |
| $25,000 to $49,999 | 858 (91.3%) | 82 (8.7%) |
| $50,000 to $74,999 | 1,008 (93.1%) | 75 (6.9%) |
| $75,000 to $99,999 | 874 (100.0%) | 0 (0.0%) |
| $100,000 and over | 960 (100.0%) | 0 (0.0%) |
Public vs Private Health Insurance Coverage by Age in North Terre Haute
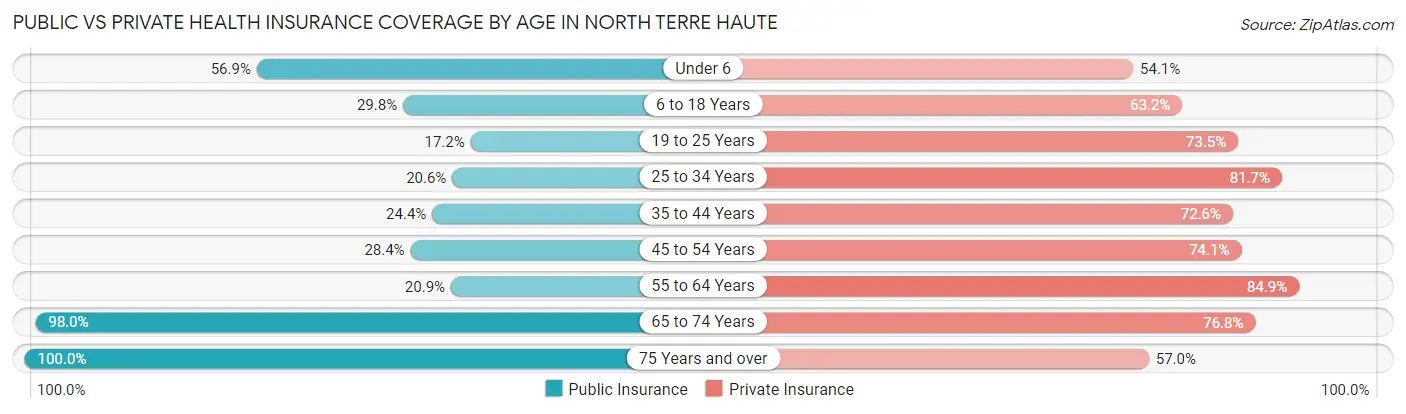
| Age Bracket | Public Insurance | Private Insurance |
| Under 6 | 140 (56.9%) | 133 (54.1%) |
| 6 to 18 Years | 89 (29.8%) | 189 (63.2%) |
| 19 to 25 Years | 97 (17.2%) | 414 (73.5%) |
| 25 to 34 Years | 72 (20.6%) | 285 (81.7%) |
| 35 to 44 Years | 103 (24.3%) | 307 (72.6%) |
| 45 to 54 Years | 147 (28.4%) | 384 (74.1%) |
| 55 to 64 Years | 226 (20.9%) | 919 (84.9%) |
| 65 to 74 Years | 392 (98.0%) | 307 (76.7%) |
| 75 Years and over | 516 (100.0%) | 294 (57.0%) |
| Total | 1,782 (40.5%) | 3,232 (73.5%) |
Disability Status by Sex by Age in North Terre Haute
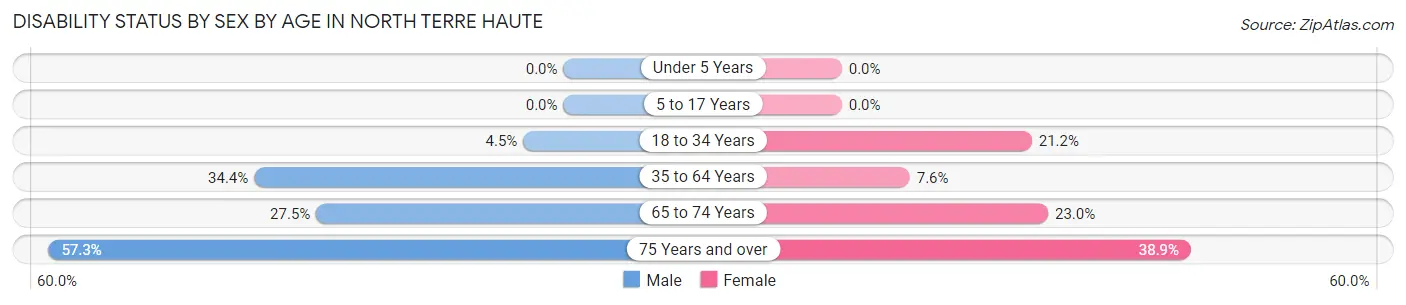
| Age Bracket | Male | Female |
| Under 5 Years | 0 (0.0%) | 0 (0.0%) |
| 5 to 17 Years | 0 (0.0%) | 0 (0.0%) |
| 18 to 34 Years | 23 (4.5%) | 84 (21.2%) |
| 35 to 64 Years | 301 (34.4%) | 87 (7.6%) |
| 65 to 74 Years | 49 (27.5%) | 51 (23.0%) |
| 75 Years and over | 82 (57.3%) | 145 (38.9%) |
Disability Class by Sex by Age in North Terre Haute
Disability Class: Hearing Difficulty
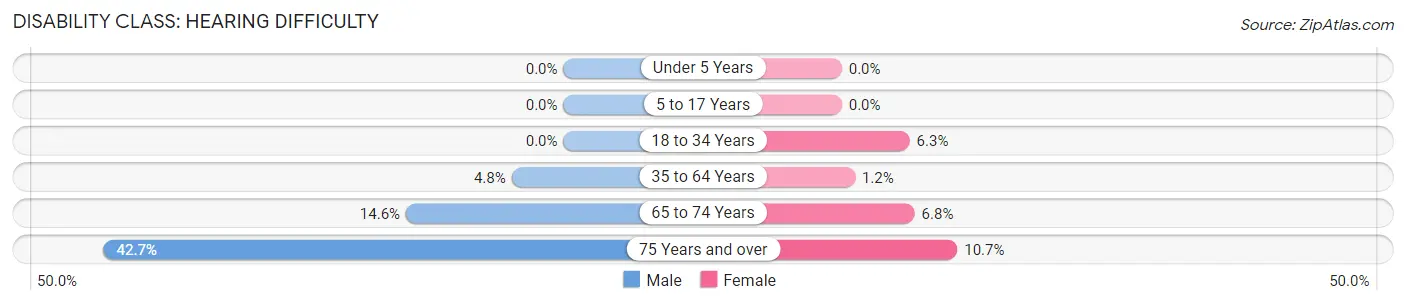
| Age Bracket | Male | Female |
| Under 5 Years | 0 (0.0%) | 0 (0.0%) |
| 5 to 17 Years | 0 (0.0%) | 0 (0.0%) |
| 18 to 34 Years | 0 (0.0%) | 25 (6.3%) |
| 35 to 64 Years | 42 (4.8%) | 14 (1.2%) |
| 65 to 74 Years | 26 (14.6%) | 15 (6.8%) |
| 75 Years and over | 61 (42.7%) | 40 (10.7%) |
Disability Class: Vision Difficulty
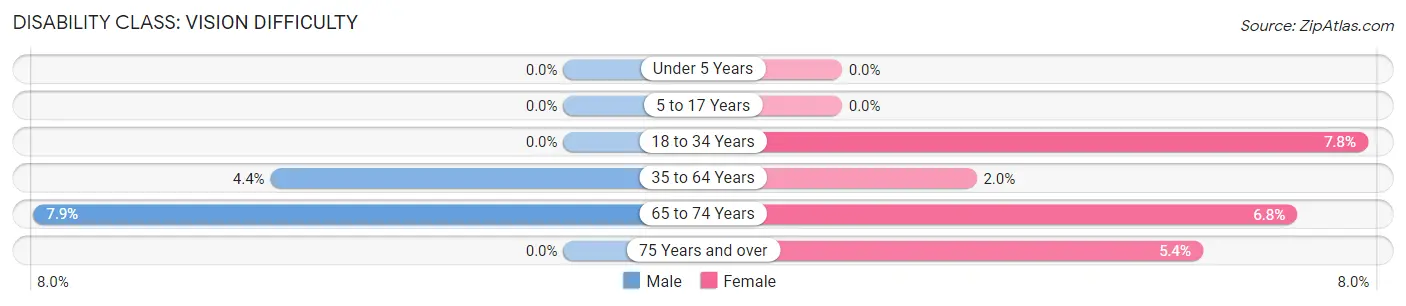
| Age Bracket | Male | Female |
| Under 5 Years | 0 (0.0%) | 0 (0.0%) |
| 5 to 17 Years | 0 (0.0%) | 0 (0.0%) |
| 18 to 34 Years | 0 (0.0%) | 31 (7.8%) |
| 35 to 64 Years | 38 (4.3%) | 23 (2.0%) |
| 65 to 74 Years | 14 (7.9%) | 15 (6.8%) |
| 75 Years and over | 0 (0.0%) | 20 (5.4%) |
Disability Class: Cognitive Difficulty
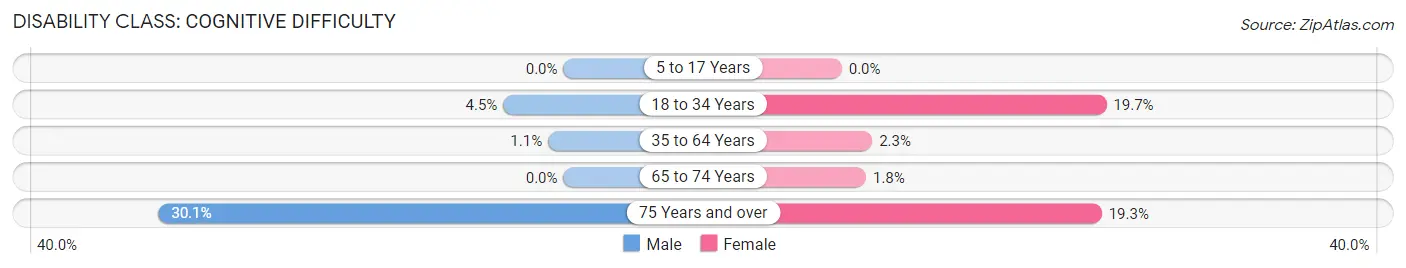
| Age Bracket | Male | Female |
| 5 to 17 Years | 0 (0.0%) | 0 (0.0%) |
| 18 to 34 Years | 23 (4.5%) | 78 (19.7%) |
| 35 to 64 Years | 10 (1.1%) | 26 (2.3%) |
| 65 to 74 Years | 0 (0.0%) | 4 (1.8%) |
| 75 Years and over | 43 (30.1%) | 72 (19.3%) |
Disability Class: Ambulatory Difficulty
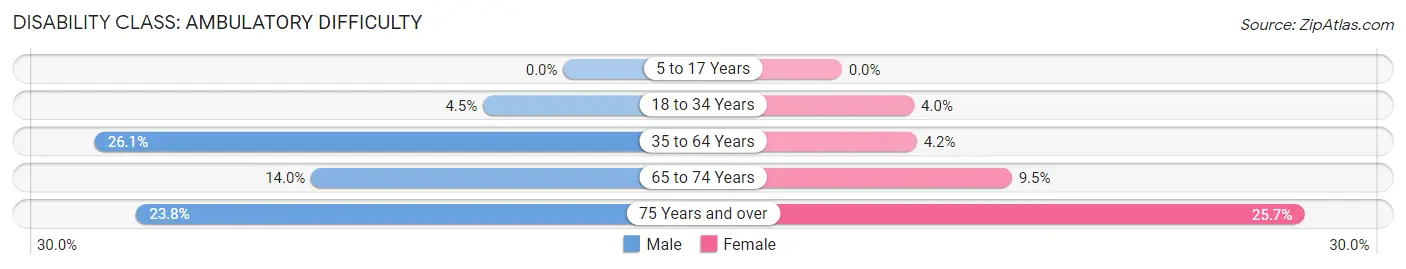
| Age Bracket | Male | Female |
| 5 to 17 Years | 0 (0.0%) | 0 (0.0%) |
| 18 to 34 Years | 23 (4.5%) | 16 (4.0%) |
| 35 to 64 Years | 228 (26.1%) | 48 (4.2%) |
| 65 to 74 Years | 25 (14.0%) | 21 (9.5%) |
| 75 Years and over | 34 (23.8%) | 96 (25.7%) |
Disability Class: Self-Care Difficulty
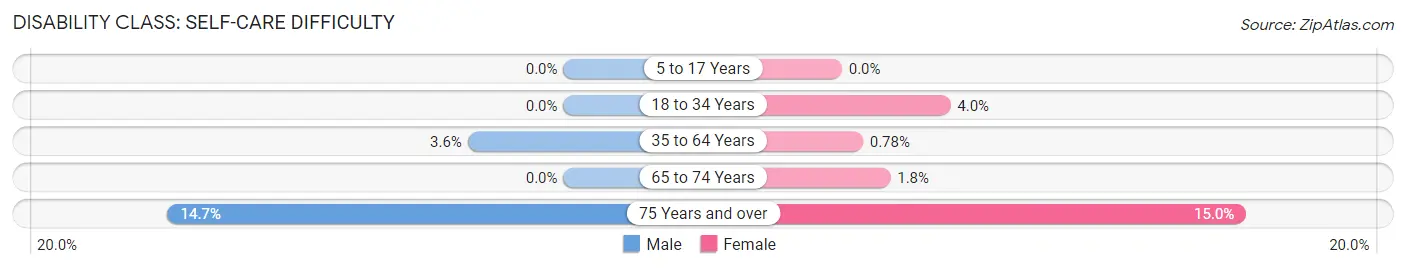
| Age Bracket | Male | Female |
| 5 to 17 Years | 0 (0.0%) | 0 (0.0%) |
| 18 to 34 Years | 0 (0.0%) | 16 (4.0%) |
| 35 to 64 Years | 31 (3.5%) | 9 (0.8%) |
| 65 to 74 Years | 0 (0.0%) | 4 (1.8%) |
| 75 Years and over | 21 (14.7%) | 56 (15.0%) |
Technology Access in North Terre Haute
Computing Device Access in North Terre Haute
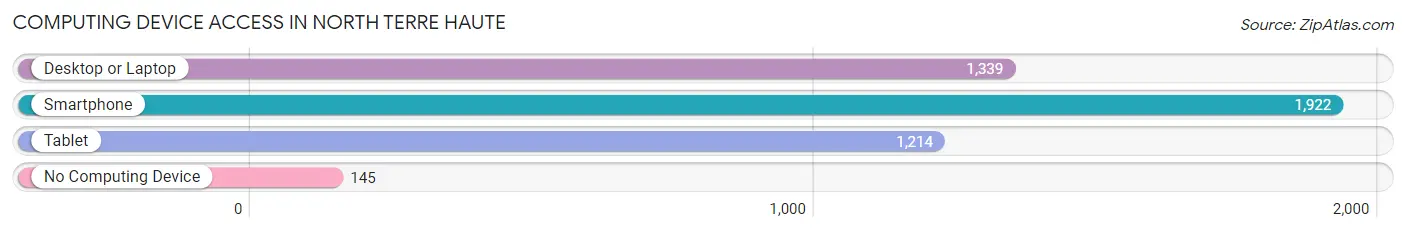
| Device Type | # Households | % Households |
| Desktop or Laptop | 1,339 | 60.2% |
| Smartphone | 1,922 | 86.4% |
| Tablet | 1,214 | 54.6% |
| No Computing Device | 145 | 6.5% |
| Total | 2,225 | 100.0% |
Internet Access in North Terre Haute
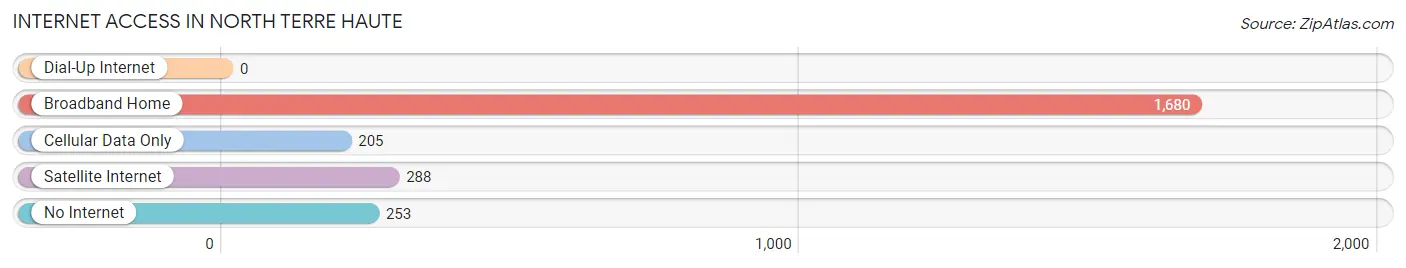
| Internet Type | # Households | % Households |
| Dial-Up Internet | 0 | 0.0% |
| Broadband Home | 1,680 | 75.5% |
| Cellular Data Only | 205 | 9.2% |
| Satellite Internet | 288 | 12.9% |
| No Internet | 253 | 11.4% |
| Total | 2,225 | 100.0% |
North Terre Haute Summary
Terre Haute is a city located in Vigo County, Indiana, United States. It is the county seat of Vigo County and the principal city of the Terre Haute Metropolitan Statistical Area, which covers all of Vigo County and had a population of 170,943 at the 2010 census. As of the 2010 census, the city had a total population of 60,785 and its metropolitan area had a population of 170,943.
History
The area that is now Terre Haute was first settled in 1816 by a group of settlers from Kentucky, led by General William Henry Harrison, who later became the ninth President of the United States. The settlement was named Fort Harrison in honor of Harrison's military service. In 1821, the fort was renamed Terre Haute, which is French for "high ground."
The city was officially incorporated in 1832 and quickly became a major transportation hub, with the completion of the Wabash and Erie Canal in 1853. The city was also a major center for the Union during the Civil War, and was the site of the Battle of Terre Haute in 1863.
In the late 19th century, Terre Haute became a major industrial center, with the establishment of several steel mills and other manufacturing plants. The city also became a major center for education, with the establishment of Indiana State University in 1865.
Geography
Terre Haute is located in western Indiana, in the Wabash Valley region. The city is situated on the banks of the Wabash River, and is bordered by the cities of West Terre Haute to the west, and North Terre Haute to the north. The city is located approximately 70 miles west of Indianapolis, and is about halfway between St. Louis, Missouri and Cincinnati, Ohio.
The city has a total area of 24.2 square miles, of which 24.1 square miles is land and 0.1 square miles is water. The city is located in a hilly region, with the highest point in the city being the intersection of Wabash Avenue and 13th Street, which is 890 feet above sea level.
Economy
Terre Haute is a major industrial center, with a diverse economy that includes manufacturing, healthcare, education, and retail. The city is home to several major employers, including Indiana State University, Union Hospital, and the Terre Haute Regional Airport.
The city is also home to several major manufacturing companies, including Alcoa, ArcelorMittal, and ThyssenKrupp. The city is also home to several major retail stores, including Walmart, Target, and Kohl's.
Demographics
As of the 2010 census, the city had a population of 60,785. The racial makeup of the city was 79.2% White, 15.3% African American, 0.4% Native American, 1.2% Asian, 0.1% Pacific Islander, 1.3% from other races, and 2.5% from two or more races. Hispanic or Latino of any race were 4.2% of the population.
The median income for a household in the city was $35,945, and the median income for a family was $45,945. The per capita income for the city was $19,945. About 15.3% of families and 19.2% of the population were below the poverty line, including 28.2% of those under age 18 and 8.7% of those age 65 or over.
Common Questions
What is Per Capita Income in North Terre Haute?
Per Capita income in North Terre Haute is $32,881.
What is the Median Family Income in North Terre Haute?
Median Family Income in North Terre Haute is $77,000.
What is the Median Household income in North Terre Haute?
Median Household Income in North Terre Haute is $57,531.
What is Income or Wage Gap in North Terre Haute?
Income or Wage Gap in North Terre Haute is 11.0%.
Women in North Terre Haute earn 89.0 cents for every dollar earned by a man.
What is Inequality or Gini Index in North Terre Haute?
Inequality or Gini Index in North Terre Haute is 0.38.
What is the Total Population of North Terre Haute?
Total Population of North Terre Haute is 4,449.
What is the Total Male Population of North Terre Haute?
Total Male Population of North Terre Haute is 2,064.
What is the Total Female Population of North Terre Haute?
Total Female Population of North Terre Haute is 2,385.
What is the Ratio of Males per 100 Females in North Terre Haute?
There are 86.54 Males per 100 Females in North Terre Haute.
What is the Ratio of Females per 100 Males in North Terre Haute?
There are 115.55 Females per 100 Males in North Terre Haute.
What is the Median Population Age in North Terre Haute?
Median Population Age in North Terre Haute is 52.3 Years.
What is the Average Family Size in North Terre Haute
Average Family Size in North Terre Haute is 2.6 People.
What is the Average Household Size in North Terre Haute
Average Household Size in North Terre Haute is 2.0 People.
How Large is the Labor Force in North Terre Haute?
There are 2,344 People in the Labor Forcein in North Terre Haute.
What is the Percentage of People in the Labor Force in North Terre Haute?
59.3% of People are in the Labor Force in North Terre Haute.
What is the Unemployment Rate in North Terre Haute?
Unemployment Rate in North Terre Haute is 5.0%.