Berne, IN Map & Demographics
Berne Map
Berne Overview
$26,682
PER CAPITA INCOME
$75,625
AVG FAMILY INCOME
$55,223
AVG HOUSEHOLD INCOME
38.0%
WAGE / INCOME GAP [ % ]
62.0¢/ $1
WAGE / INCOME GAP [ $ ]
$2,134
FAMILY INCOME DEFICIT
0.35
INEQUALITY / GINI INDEX
3,926
TOTAL POPULATION
1,611
MALE POPULATION
2,315
FEMALE POPULATION
69.59
MALES / 100 FEMALES
143.70
FEMALES / 100 MALES
38.5
MEDIAN AGE
3.2
AVG FAMILY SIZE
2.4
AVG HOUSEHOLD SIZE
1,829
LABOR FORCE [ PEOPLE ]
61.6%
PERCENT IN LABOR FORCE
4.4%
UNEMPLOYMENT RATE
Berne Zip Codes
Berne Area Codes
Income in Berne
Income Overview in Berne
Per Capita Income in Berne is $26,682, while median incomes of families and households are $75,625 and $55,223 respectively.
| Characteristic | Number | Measure |
| Per Capita Income | 3,926 | $26,682 |
| Median Family Income | 961 | $75,625 |
| Mean Family Income | 961 | $79,730 |
| Median Household Income | 1,511 | $55,223 |
| Mean Household Income | 1,511 | $66,519 |
| Income Deficit | 961 | $2,134 |
| Wage / Income Gap (%) | 3,926 | 38.00% |
| Wage / Income Gap ($) | 3,926 | 62.00¢ per $1 |
| Gini / Inequality Index | 3,926 | 0.35 |
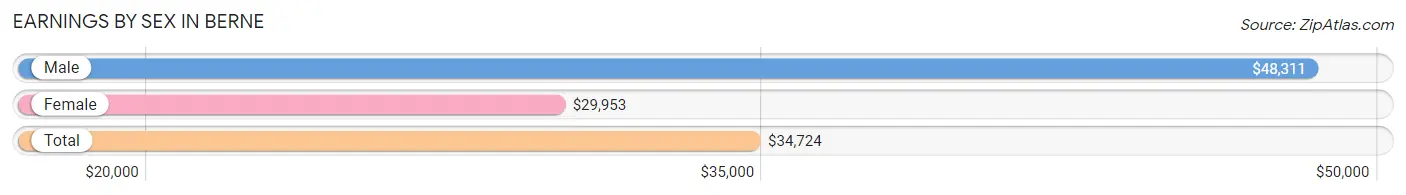
Earnings by Sex in Berne
Average Earnings in Berne are $34,724, $48,311 for men and $29,953 for women, a difference of 38.0%.
| Sex | Number | Average Earnings |
| Male | 825 (41.6%) | $48,311 |
| Female | 1,159 (58.4%) | $29,953 |
| Total | 1,984 (100.0%) | $34,724 |
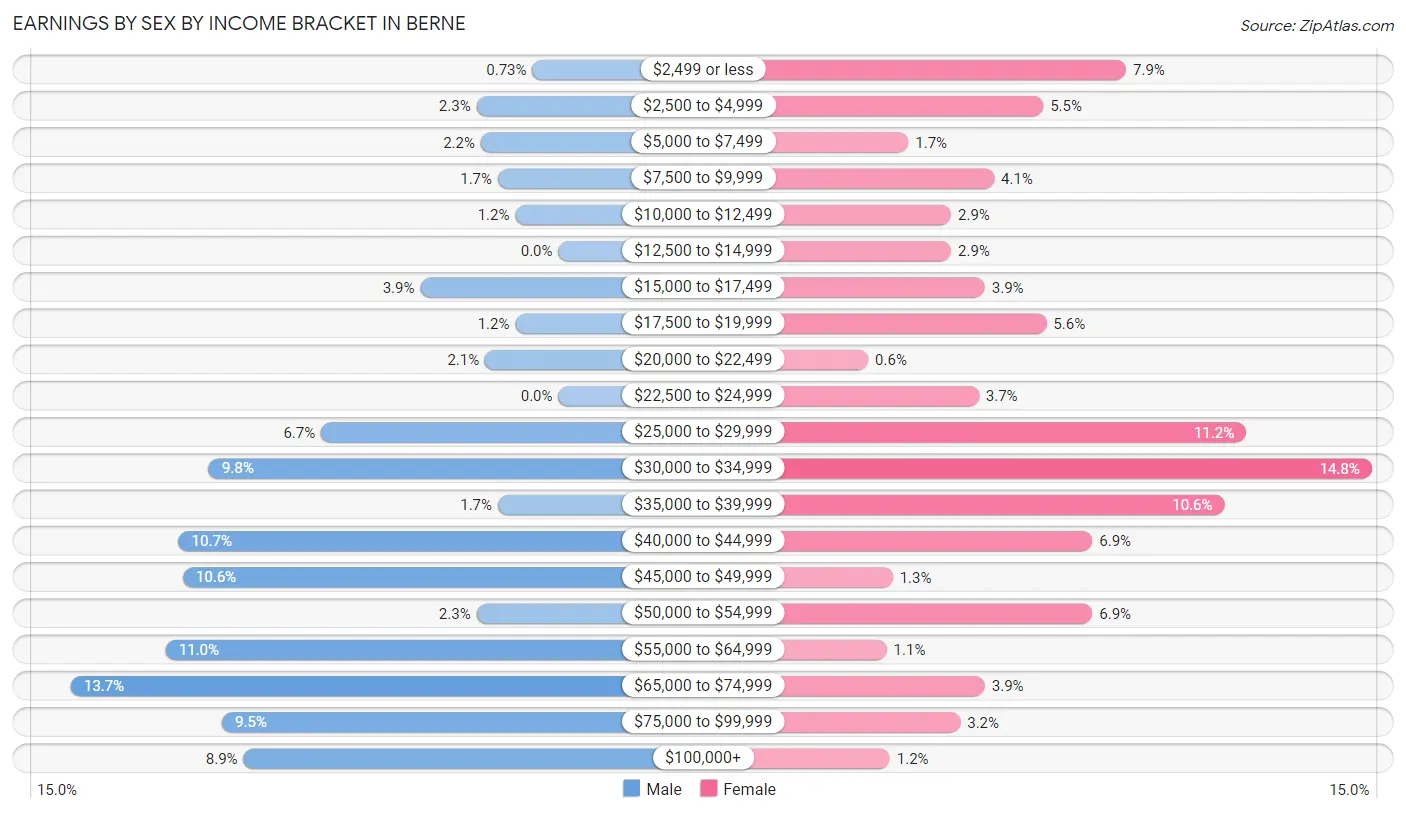
Earnings by Sex by Income Bracket in Berne
The most common earnings brackets in Berne are $65,000 to $74,999 for men (113 | 13.7%) and $30,000 to $34,999 for women (171 | 14.7%).
| Income | Male | Female |
| $2,499 or less | 6 (0.7%) | 91 (7.9%) |
| $2,500 to $4,999 | 19 (2.3%) | 64 (5.5%) |
| $5,000 to $7,499 | 18 (2.2%) | 20 (1.7%) |
| $7,500 to $9,999 | 14 (1.7%) | 48 (4.1%) |
| $10,000 to $12,499 | 10 (1.2%) | 34 (2.9%) |
| $12,500 to $14,999 | 0 (0.0%) | 34 (2.9%) |
| $15,000 to $17,499 | 32 (3.9%) | 45 (3.9%) |
| $17,500 to $19,999 | 10 (1.2%) | 65 (5.6%) |
| $20,000 to $22,499 | 17 (2.1%) | 7 (0.6%) |
| $22,500 to $24,999 | 0 (0.0%) | 43 (3.7%) |
| $25,000 to $29,999 | 55 (6.7%) | 130 (11.2%) |
| $30,000 to $34,999 | 81 (9.8%) | 171 (14.7%) |
| $35,000 to $39,999 | 14 (1.7%) | 123 (10.6%) |
| $40,000 to $44,999 | 88 (10.7%) | 80 (6.9%) |
| $45,000 to $49,999 | 87 (10.5%) | 15 (1.3%) |
| $50,000 to $54,999 | 19 (2.3%) | 80 (6.9%) |
| $55,000 to $64,999 | 91 (11.0%) | 13 (1.1%) |
| $65,000 to $74,999 | 113 (13.7%) | 45 (3.9%) |
| $75,000 to $99,999 | 78 (9.5%) | 37 (3.2%) |
| $100,000+ | 73 (8.8%) | 14 (1.2%) |
| Total | 825 (100.0%) | 1,159 (100.0%) |
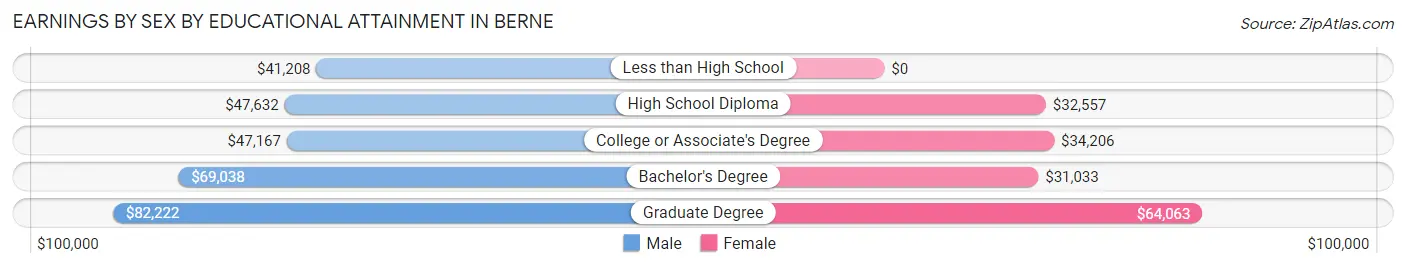
Earnings by Sex by Educational Attainment in Berne
Average earnings in Berne are $50,417 for men and $33,898 for women, a difference of 32.8%. Men with an educational attainment of graduate degree enjoy the highest average annual earnings of $82,222, while those with less than high school education earn the least with $41,208. Women with an educational attainment of graduate degree earn the most with the average annual earnings of $64,063, while those with bachelor's degree education have the smallest earnings of $31,033.
| Educational Attainment | Male Income | Female Income |
| Less than High School | $41,208 | $0 |
| High School Diploma | $47,632 | $32,557 |
| College or Associate's Degree | $47,167 | $34,206 |
| Bachelor's Degree | $69,038 | $31,033 |
| Graduate Degree | $82,222 | $64,063 |
| Total | $50,417 | $33,898 |
Family Income in Berne
Family Income Brackets in Berne
According to the Berne family income data, there are 262 families falling into the $100,000 to $149,999 income range, which is the most common income bracket and makes up 27.3% of all families.
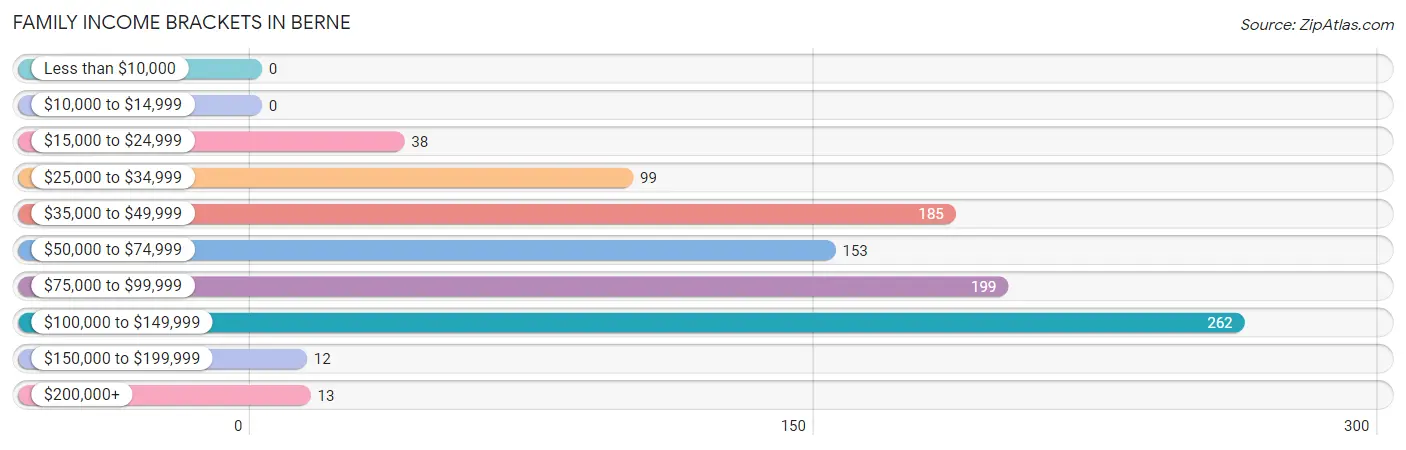
| Income Bracket | # Families | % Families |
| Less than $10,000 | 0 | 0.0% |
| $10,000 to $14,999 | 0 | 0.0% |
| $15,000 to $24,999 | 38 | 4.0% |
| $25,000 to $34,999 | 99 | 10.3% |
| $35,000 to $49,999 | 185 | 19.3% |
| $50,000 to $74,999 | 153 | 15.9% |
| $75,000 to $99,999 | 199 | 20.7% |
| $100,000 to $149,999 | 262 | 27.3% |
| $150,000 to $199,999 | 12 | 1.2% |
| $200,000+ | 13 | 1.4% |
Family Income by Famaliy Size in Berne
4-person families (174 | 18.1%) account for the highest median family income in Berne with $106,471 per family, while 2-person families (505 | 52.5%) have the highest median income of $37,153 per family member.
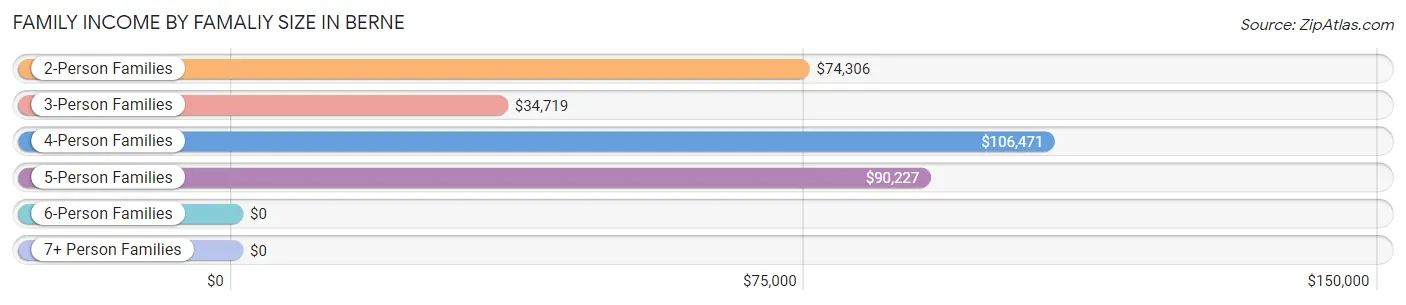
| Income Bracket | # Families | Median Income |
| 2-Person Families | 505 (52.5%) | $74,306 |
| 3-Person Families | 133 (13.8%) | $34,719 |
| 4-Person Families | 174 (18.1%) | $106,471 |
| 5-Person Families | 116 (12.1%) | $90,227 |
| 6-Person Families | 10 (1.0%) | $0 |
| 7+ Person Families | 23 (2.4%) | $0 |
| Total | 961 (100.0%) | $75,625 |
Family Income by Number of Earners in Berne
The median family income in Berne is $75,625, with families comprising 2 earners (441) having the highest median family income of $95,288, while families with 1 earner (284) have the lowest median family income of $38,700, accounting for 45.9% and 29.5% of families, respectively.
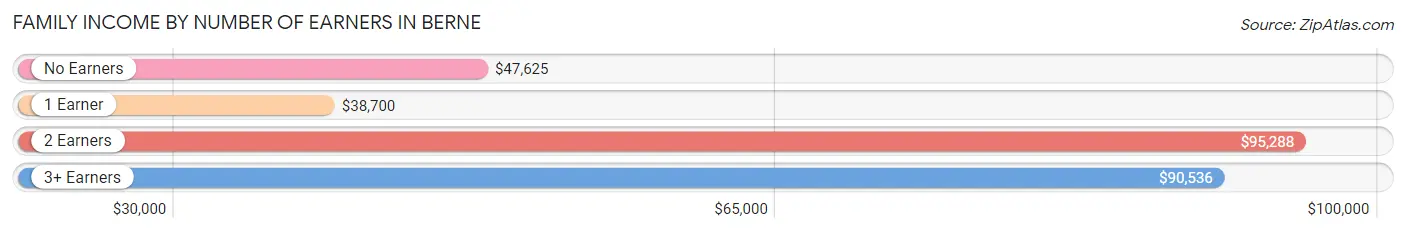
| Number of Earners | # Families | Median Income |
| No Earners | 123 (12.8%) | $47,625 |
| 1 Earner | 284 (29.5%) | $38,700 |
| 2 Earners | 441 (45.9%) | $95,288 |
| 3+ Earners | 113 (11.8%) | $90,536 |
| Total | 961 (100.0%) | $75,625 |
Household Income in Berne
Household Income Brackets in Berne
With 277 households falling in the category, the $50,000 to $74,999 income range is the most frequent in Berne, accounting for 18.3% of all households. In contrast, only 14 households (0.9%) fall into the $200,000+ income bracket, making it the least populous group.
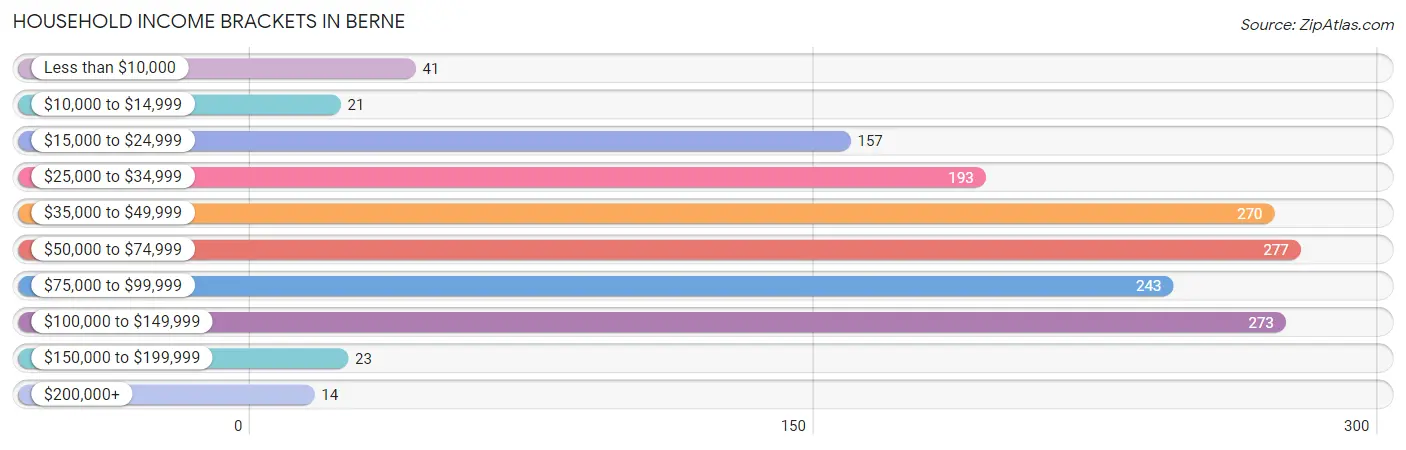
| Income Bracket | # Households | % Households |
| Less than $10,000 | 41 | 2.7% |
| $10,000 to $14,999 | 21 | 1.4% |
| $15,000 to $24,999 | 157 | 10.4% |
| $25,000 to $34,999 | 193 | 12.8% |
| $35,000 to $49,999 | 270 | 17.9% |
| $50,000 to $74,999 | 277 | 18.3% |
| $75,000 to $99,999 | 243 | 16.1% |
| $100,000 to $149,999 | 273 | 18.1% |
| $150,000 to $199,999 | 23 | 1.5% |
| $200,000+ | 14 | 0.9% |
Household Income by Householder Age in Berne
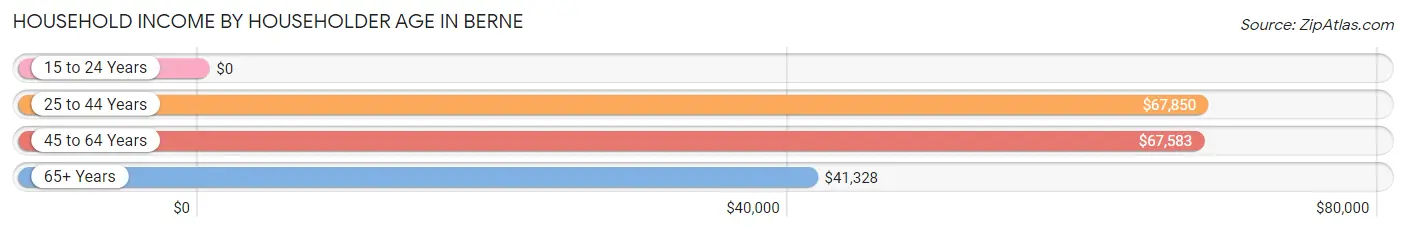
The median household income in Berne is $55,223, with the highest median household income of $67,850 found in the 25 to 44 years age bracket for the primary householder. A total of 575 households (38.1%) fall into this category. Meanwhile, the 15 to 24 years age bracket for the primary householder has the lowest median household income of $0, with 53 households (3.5%) in this group.
| Income Bracket | # Households | Median Income |
| 15 to 24 Years | 53 (3.5%) | $0 |
| 25 to 44 Years | 575 (38.1%) | $67,850 |
| 45 to 64 Years | 447 (29.6%) | $67,583 |
| 65+ Years | 436 (28.9%) | $41,328 |
| Total | 1,511 (100.0%) | $55,223 |
Poverty in Berne
Income Below Poverty by Sex and Age in Berne
With 5.7% poverty level for males and 4.2% for females among the residents of Berne, 75 year old and over males and 55 to 64 year old females are the most vulnerable to poverty, with 35 males (23.8%) and 21 females (8.5%) in their respective age groups living below the poverty level.
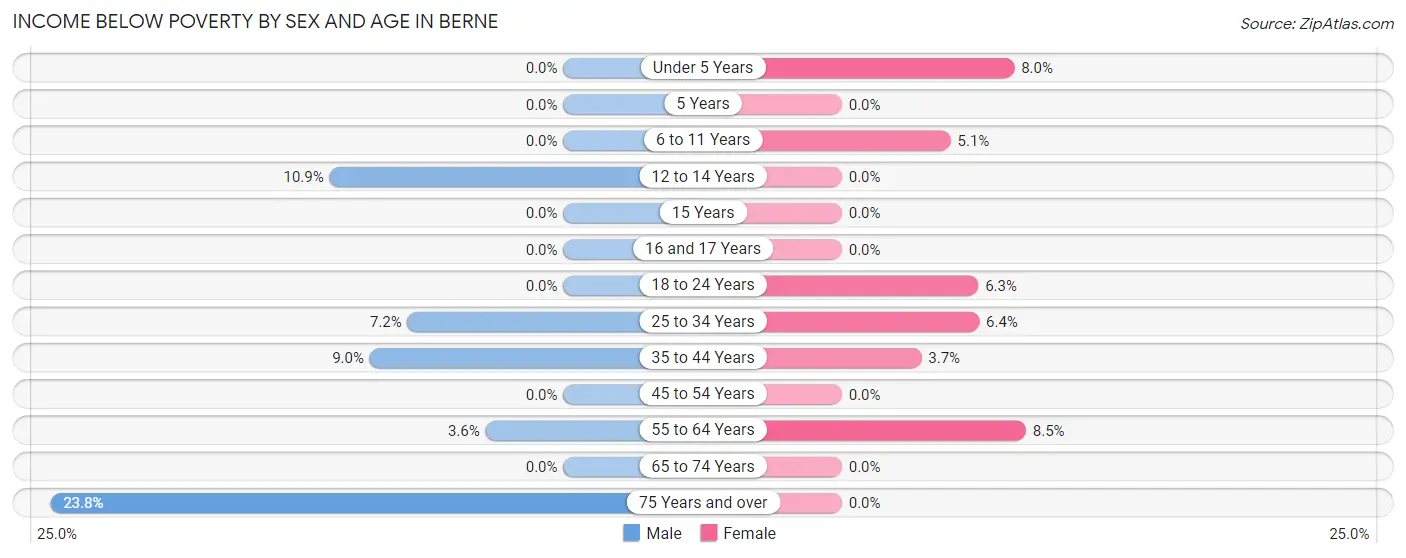
| Age Bracket | Male | Female |
| Under 5 Years | 0 (0.0%) | 14 (8.0%) |
| 5 Years | 0 (0.0%) | 0 (0.0%) |
| 6 to 11 Years | 0 (0.0%) | 11 (5.1%) |
| 12 to 14 Years | 14 (10.8%) | 0 (0.0%) |
| 15 Years | 0 (0.0%) | 0 (0.0%) |
| 16 and 17 Years | 0 (0.0%) | 0 (0.0%) |
| 18 to 24 Years | 0 (0.0%) | 15 (6.3%) |
| 25 to 34 Years | 17 (7.2%) | 17 (6.4%) |
| 35 to 44 Years | 15 (9.0%) | 11 (3.7%) |
| 45 to 54 Years | 0 (0.0%) | 0 (0.0%) |
| 55 to 64 Years | 6 (3.6%) | 21 (8.5%) |
| 65 to 74 Years | 0 (0.0%) | 0 (0.0%) |
| 75 Years and over | 35 (23.8%) | 0 (0.0%) |
| Total | 87 (5.7%) | 89 (4.2%) |
Income Above Poverty by Sex and Age in Berne
According to the poverty statistics in Berne, males aged under 5 years and females aged 5 years are the age groups that are most secure financially, with 100.0% of males and 100.0% of females in these age groups living above the poverty line.
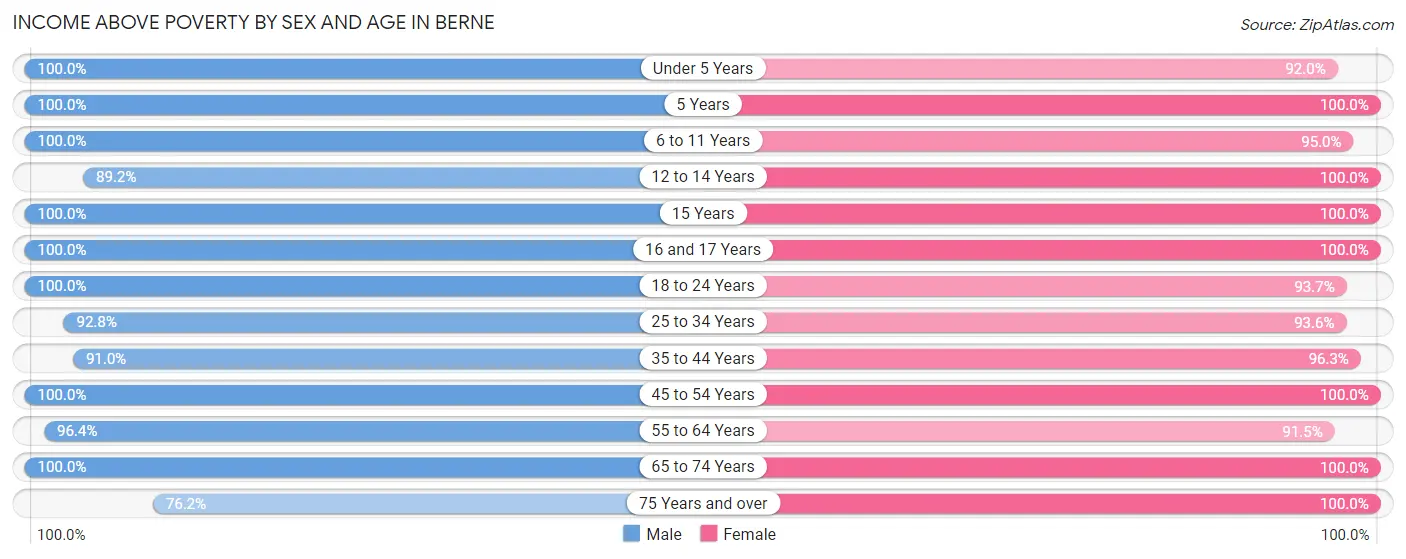
| Age Bracket | Male | Female |
| Under 5 Years | 82 (100.0%) | 161 (92.0%) |
| 5 Years | 11 (100.0%) | 19 (100.0%) |
| 6 to 11 Years | 136 (100.0%) | 207 (95.0%) |
| 12 to 14 Years | 115 (89.1%) | 95 (100.0%) |
| 15 Years | 46 (100.0%) | 12 (100.0%) |
| 16 and 17 Years | 24 (100.0%) | 81 (100.0%) |
| 18 to 24 Years | 66 (100.0%) | 222 (93.7%) |
| 25 to 34 Years | 218 (92.8%) | 250 (93.6%) |
| 35 to 44 Years | 152 (91.0%) | 287 (96.3%) |
| 45 to 54 Years | 210 (100.0%) | 142 (100.0%) |
| 55 to 64 Years | 160 (96.4%) | 225 (91.5%) |
| 65 to 74 Years | 110 (100.0%) | 159 (100.0%) |
| 75 Years and over | 112 (76.2%) | 198 (100.0%) |
| Total | 1,442 (94.3%) | 2,058 (95.9%) |
Income Below Poverty Among Married-Couple Families in Berne
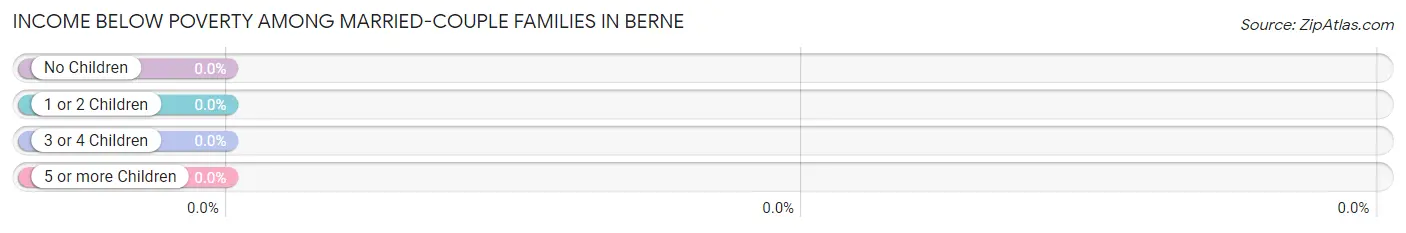
| Children | Above Poverty | Below Poverty |
| No Children | 405 (100.0%) | 0 (0.0%) |
| 1 or 2 Children | 248 (100.0%) | 0 (0.0%) |
| 3 or 4 Children | 74 (100.0%) | 0 (0.0%) |
| 5 or more Children | 23 (100.0%) | 0 (0.0%) |
| Total | 750 (100.0%) | 0 (0.0%) |
Income Below Poverty Among Single-Parent Households in Berne
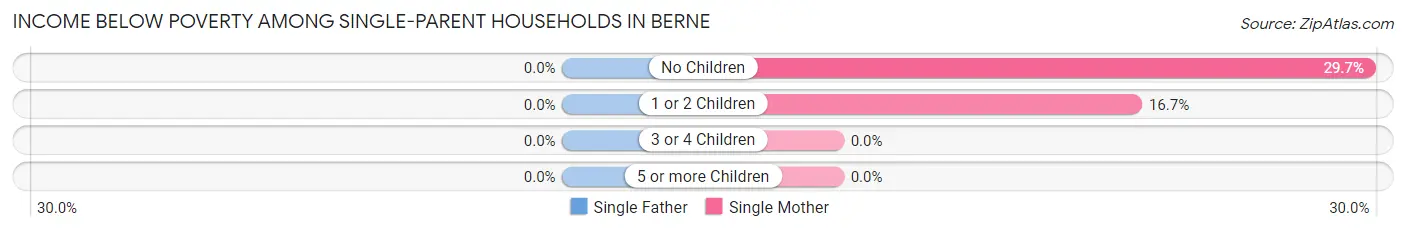
| Children | Single Father | Single Mother |
| No Children | 0 (0.0%) | 11 (29.7%) |
| 1 or 2 Children | 0 (0.0%) | 27 (16.7%) |
| 3 or 4 Children | 0 (0.0%) | 0 (0.0%) |
| 5 or more Children | 0 (0.0%) | 0 (0.0%) |
| Total | 0 (0.0%) | 38 (19.1%) |
Income Below Poverty Among Married-Couple vs Single-Parent Households in Berne
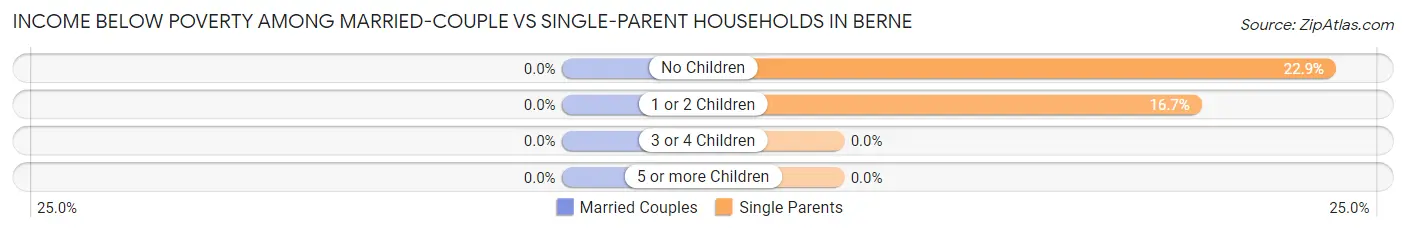
| Children | Married-Couple Families | Single-Parent Households |
| No Children | 0 (0.0%) | 11 (22.9%) |
| 1 or 2 Children | 0 (0.0%) | 27 (16.7%) |
| 3 or 4 Children | 0 (0.0%) | 0 (0.0%) |
| 5 or more Children | 0 (0.0%) | 0 (0.0%) |
| Total | 0 (0.0%) | 38 (18.0%) |
Race in Berne
The most populous races in Berne are White / Caucasian (3,589 | 91.4%), Two or more Races (279 | 7.1%), and Hispanic or Latino (239 | 6.1%).
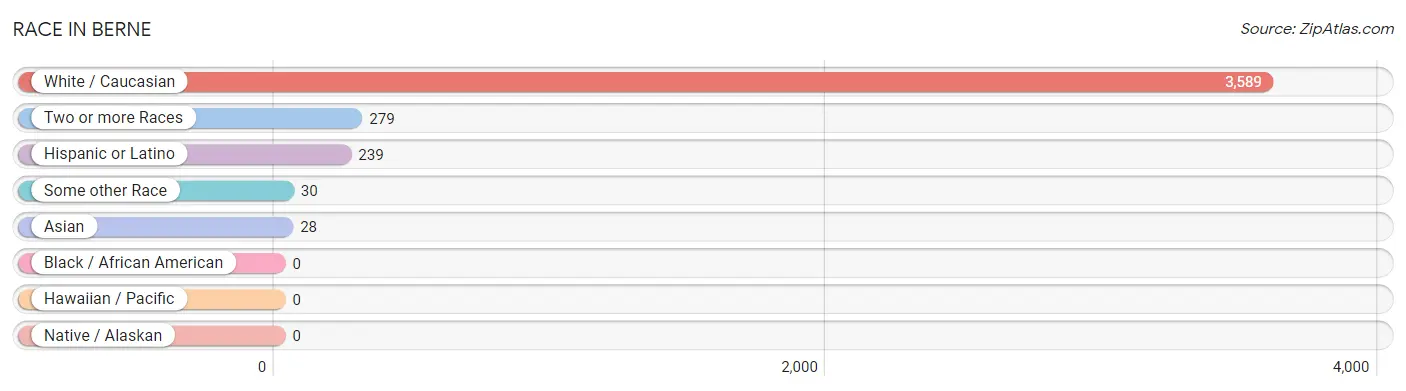
| Race | # Population | % Population |
| Asian | 28 | 0.7% |
| Black / African American | 0 | 0.0% |
| Hawaiian / Pacific | 0 | 0.0% |
| Hispanic or Latino | 239 | 6.1% |
| Native / Alaskan | 0 | 0.0% |
| White / Caucasian | 3,589 | 91.4% |
| Two or more Races | 279 | 7.1% |
| Some other Race | 30 | 0.8% |
| Total | 3,926 | 100.0% |
Ancestry in Berne
The most populous ancestries reported in Berne are German (1,139 | 29.0%), Swiss (549 | 14.0%), Irish (334 | 8.5%), English (303 | 7.7%), and American (271 | 6.9%), together accounting for 66.1% of all Berne residents.
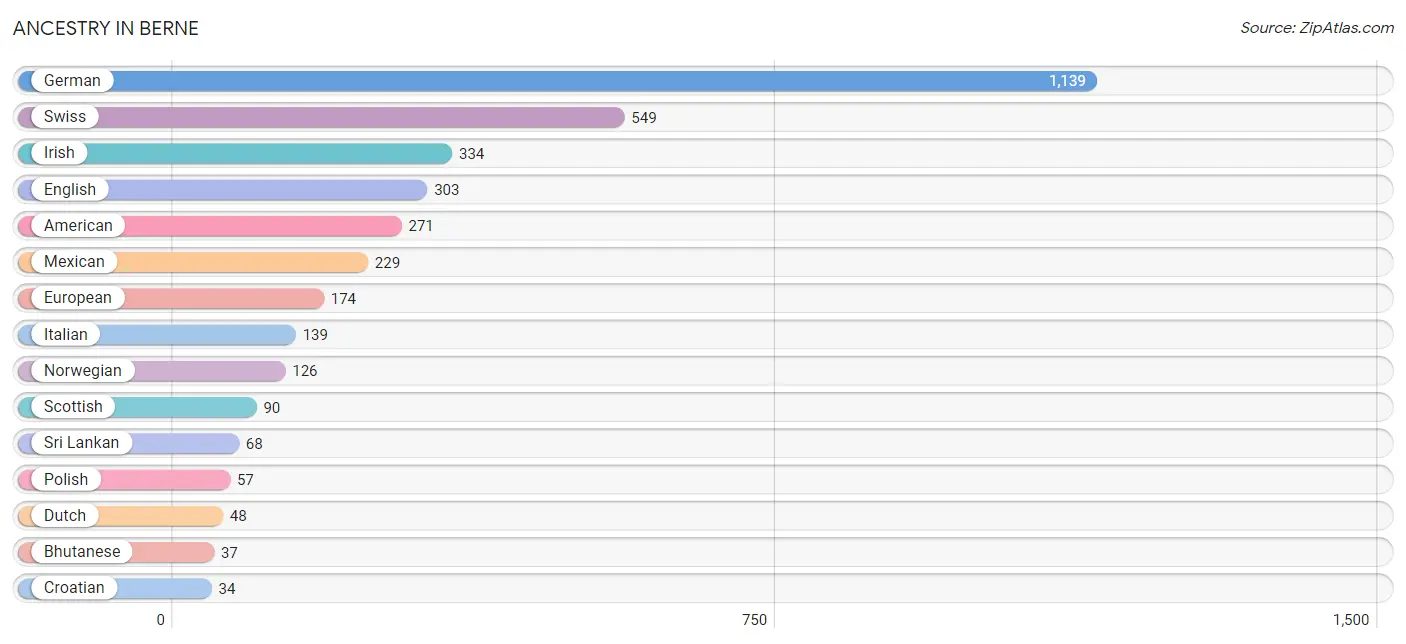
| Ancestry | # Population | % Population |
| African | 1 | 0.0% |
| American | 271 | 6.9% |
| Apache | 24 | 0.6% |
| Belgian | 13 | 0.3% |
| Bhutanese | 37 | 0.9% |
| Central American | 8 | 0.2% |
| Central American Indian | 2 | 0.1% |
| Croatian | 34 | 0.9% |
| Danish | 11 | 0.3% |
| Dutch | 48 | 1.2% |
| Eastern European | 10 | 0.3% |
| English | 303 | 7.7% |
| European | 174 | 4.4% |
| French | 28 | 0.7% |
| German | 1,139 | 29.0% |
| Honduran | 8 | 0.2% |
| Irish | 334 | 8.5% |
| Italian | 139 | 3.5% |
| Mexican | 229 | 5.8% |
| Norwegian | 126 | 3.2% |
| Polish | 57 | 1.5% |
| Puerto Rican | 2 | 0.1% |
| Scandinavian | 12 | 0.3% |
| Scotch-Irish | 2 | 0.1% |
| Scottish | 90 | 2.3% |
| Sri Lankan | 68 | 1.7% |
| Subsaharan African | 1 | 0.0% |
| Swiss | 549 | 14.0% |
| Welsh | 9 | 0.2% | View All 29 Rows |
Immigrants in Berne
The most numerous immigrant groups reported in Berne came from Central America (45 | 1.1%), Latin America (45 | 1.1%), Mexico (45 | 1.1%), Asia (28 | 0.7%), and South Eastern Asia (15 | 0.4%), together accounting for 4.5% of all Berne residents.
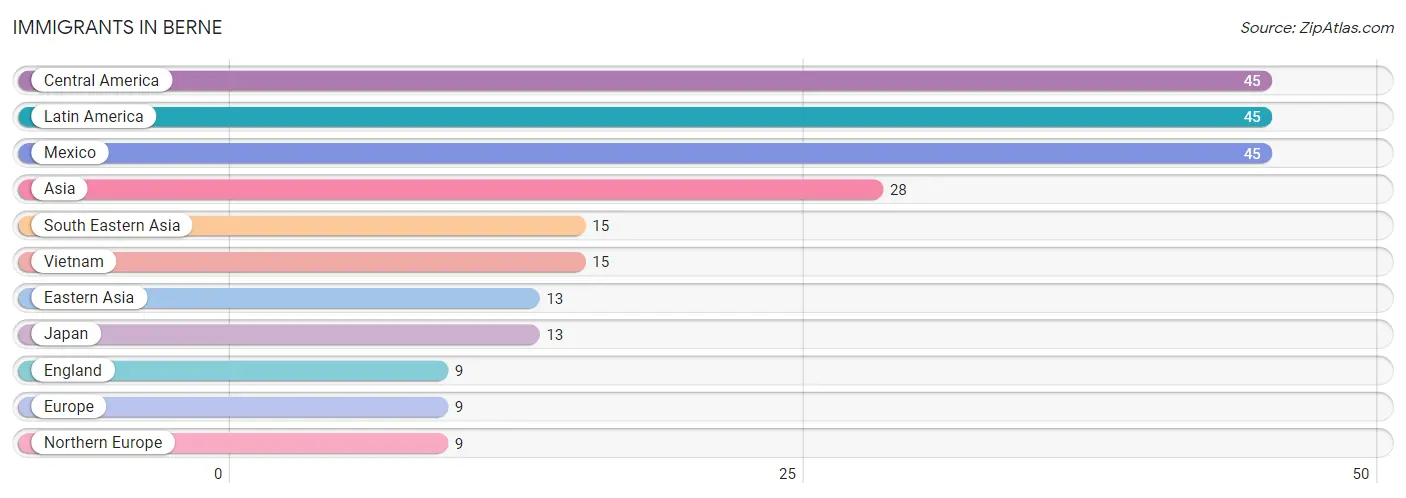
| Immigration Origin | # Population | % Population |
| Asia | 28 | 0.7% |
| Central America | 45 | 1.1% |
| Eastern Asia | 13 | 0.3% |
| England | 9 | 0.2% |
| Europe | 9 | 0.2% |
| Japan | 13 | 0.3% |
| Latin America | 45 | 1.1% |
| Mexico | 45 | 1.1% |
| Northern Europe | 9 | 0.2% |
| South Eastern Asia | 15 | 0.4% |
| Vietnam | 15 | 0.4% | View All 11 Rows |
Sex and Age in Berne
Sex and Age in Berne
The most populous age groups in Berne are 10 to 14 Years (207 | 12.9%) for men and 40 to 44 Years (205 | 8.9%) for women.
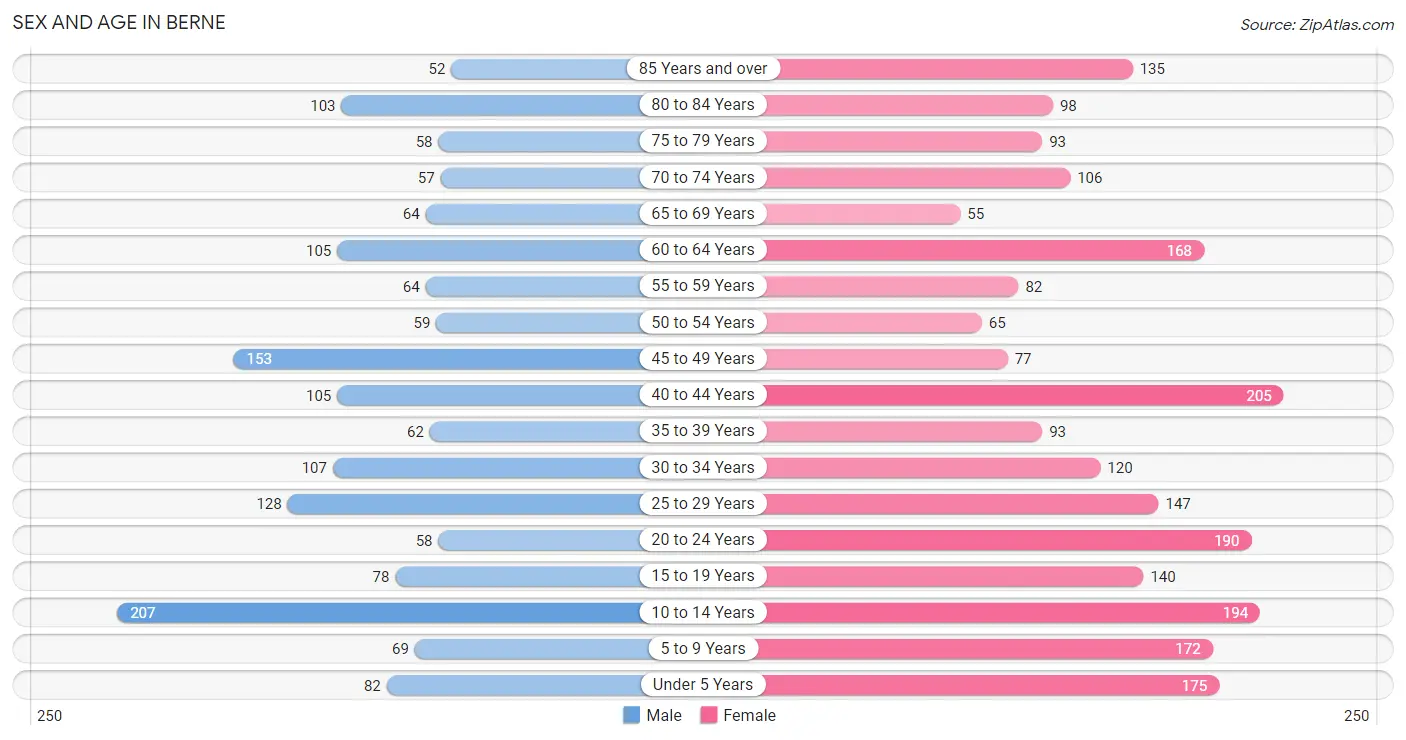
| Age Bracket | Male | Female |
| Under 5 Years | 82 (5.1%) | 175 (7.6%) |
| 5 to 9 Years | 69 (4.3%) | 172 (7.4%) |
| 10 to 14 Years | 207 (12.9%) | 194 (8.4%) |
| 15 to 19 Years | 78 (4.8%) | 140 (6.0%) |
| 20 to 24 Years | 58 (3.6%) | 190 (8.2%) |
| 25 to 29 Years | 128 (8.0%) | 147 (6.4%) |
| 30 to 34 Years | 107 (6.6%) | 120 (5.2%) |
| 35 to 39 Years | 62 (3.8%) | 93 (4.0%) |
| 40 to 44 Years | 105 (6.5%) | 205 (8.9%) |
| 45 to 49 Years | 153 (9.5%) | 77 (3.3%) |
| 50 to 54 Years | 59 (3.7%) | 65 (2.8%) |
| 55 to 59 Years | 64 (4.0%) | 82 (3.5%) |
| 60 to 64 Years | 105 (6.5%) | 168 (7.3%) |
| 65 to 69 Years | 64 (4.0%) | 55 (2.4%) |
| 70 to 74 Years | 57 (3.5%) | 106 (4.6%) |
| 75 to 79 Years | 58 (3.6%) | 93 (4.0%) |
| 80 to 84 Years | 103 (6.4%) | 98 (4.2%) |
| 85 Years and over | 52 (3.2%) | 135 (5.8%) |
| Total | 1,611 (100.0%) | 2,315 (100.0%) |
Families and Households in Berne
Median Family Size in Berne
The median family size in Berne is 3.16 persons per family, with single male/father families (12 | 1.3%) accounting for the largest median family size of 7.33 persons per family. On the other hand, single female/mother families (199 | 20.7%) represent the smallest median family size with 2.31 persons per family.
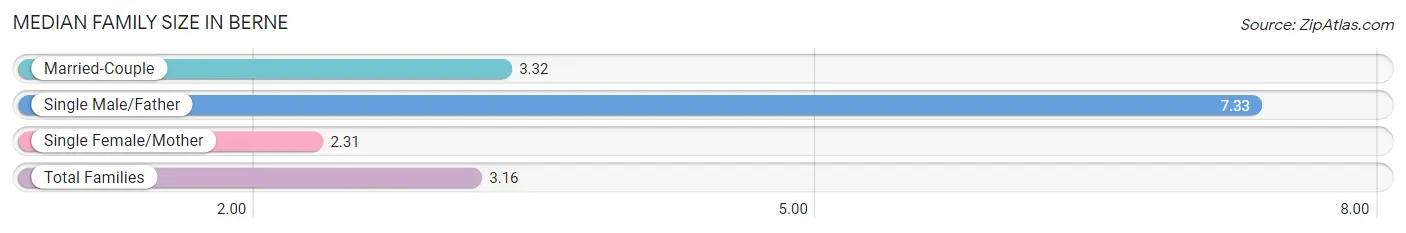
| Family Type | # Families | Family Size |
| Married-Couple | 750 (78.0%) | 3.32 |
| Single Male/Father | 12 (1.3%) | 7.33 |
| Single Female/Mother | 199 (20.7%) | 2.31 |
| Total Families | 961 (100.0%) | 3.16 |
Median Household Size in Berne
The median household size in Berne is 2.44 persons per household, with single male/father households (12 | 0.8%) accounting for the largest median household size of 8.25 persons per household. non-family households (550 | 36.4%) represent the smallest median household size with 1.06 persons per household.
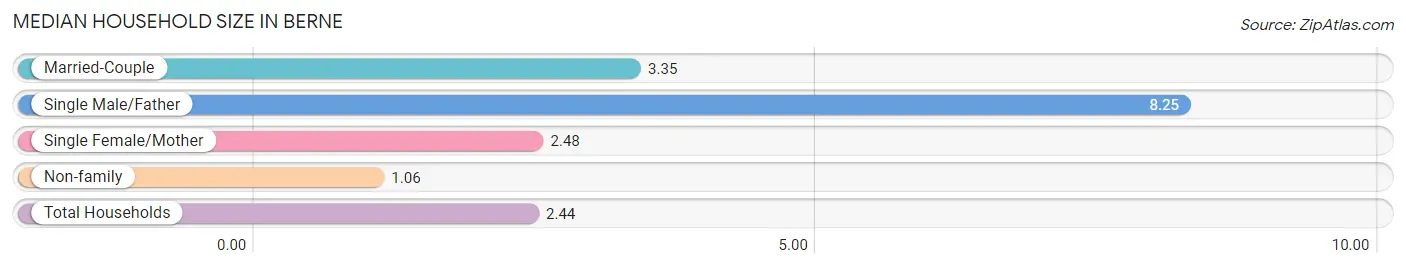
| Household Type | # Households | Household Size |
| Married-Couple | 750 (49.6%) | 3.35 |
| Single Male/Father | 12 (0.8%) | 8.25 |
| Single Female/Mother | 199 (13.2%) | 2.48 |
| Non-family | 550 (36.4%) | 1.06 |
| Total Households | 1,511 (100.0%) | 2.44 |
Household Size by Marriage Status in Berne
Out of a total of 1,511 households in Berne, 961 (63.6%) are family households, while 550 (36.4%) are nonfamily households. The most numerous type of family households are 2-person households, comprising 477, and the most common type of nonfamily households are 1-person households, comprising 513.
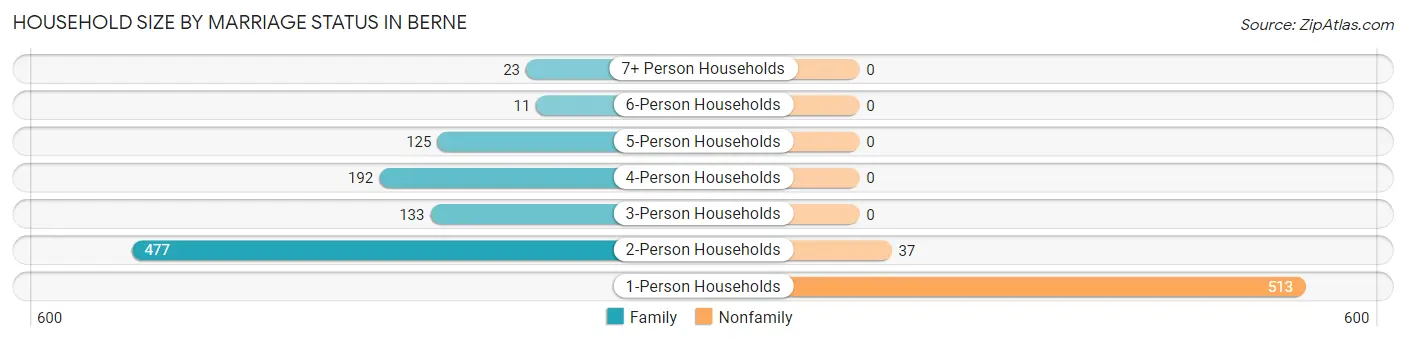
| Household Size | Family Households | Nonfamily Households |
| 1-Person Households | - | 513 (34.0%) |
| 2-Person Households | 477 (31.6%) | 37 (2.5%) |
| 3-Person Households | 133 (8.8%) | 0 (0.0%) |
| 4-Person Households | 192 (12.7%) | 0 (0.0%) |
| 5-Person Households | 125 (8.3%) | 0 (0.0%) |
| 6-Person Households | 11 (0.7%) | 0 (0.0%) |
| 7+ Person Households | 23 (1.5%) | 0 (0.0%) |
| Total | 961 (63.6%) | 550 (36.4%) |
Female Fertility in Berne
Fertility by Age in Berne
Average fertility rate in Berne is 61.0 births per 1,000 women. Women in the age bracket of 20 to 34 years have the highest fertility rate with 112.0 births per 1,000 women. Women in the age bracket of 20 to 34 years acount for 85.0% of all women with births.
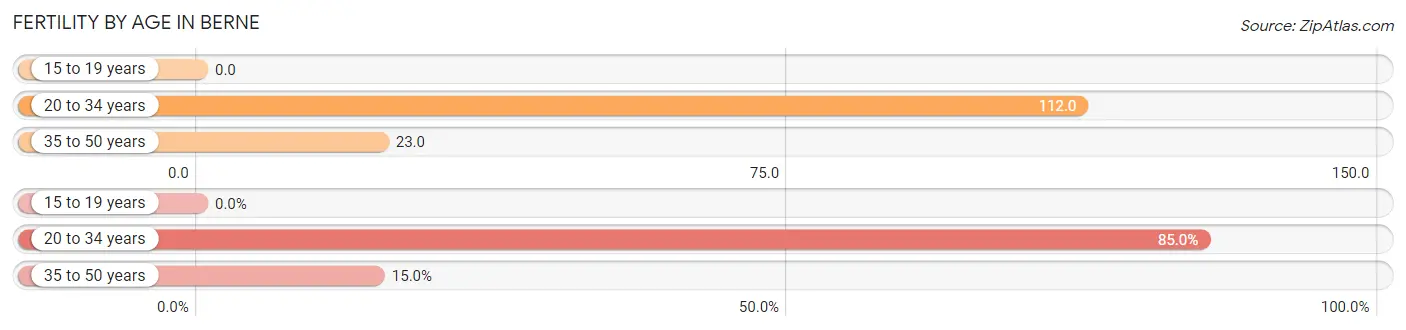
| Age Bracket | Women with Births | Births / 1,000 Women |
| 15 to 19 years | 0 (0.0%) | 0.0 |
| 20 to 34 years | 51 (85.0%) | 112.0 |
| 35 to 50 years | 9 (15.0%) | 23.0 |
| Total | 60 (100.0%) | 61.0 |
Fertility by Age by Marriage Status in Berne
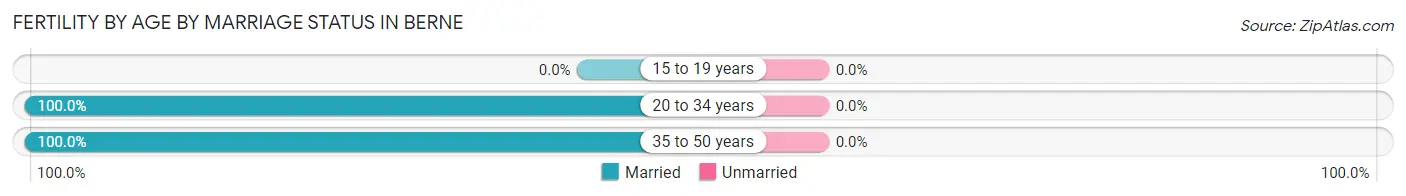
| Age Bracket | Married | Unmarried |
| 15 to 19 years | 0 (0.0%) | 0 (0.0%) |
| 20 to 34 years | 51 (100.0%) | 0 (0.0%) |
| 35 to 50 years | 9 (100.0%) | 0 (0.0%) |
| Total | 60 (100.0%) | 0 (0.0%) |
Fertility by Education in Berne

| Educational Attainment | Women with Births | Births / 1,000 Women |
| Less than High School | 0 (0.0%) | 0.0 |
| High School Diploma | 0 (0.0%) | 0.0 |
| College or Associate's Degree | 45 (75.0%) | 136.0 |
| Bachelor's Degree | 15 (25.0%) | 103.0 |
| Graduate Degree | 0 (0.0%) | 0.0 |
| Total | 60 (100.0%) | 61.0 |
Fertility by Education by Marriage Status in Berne
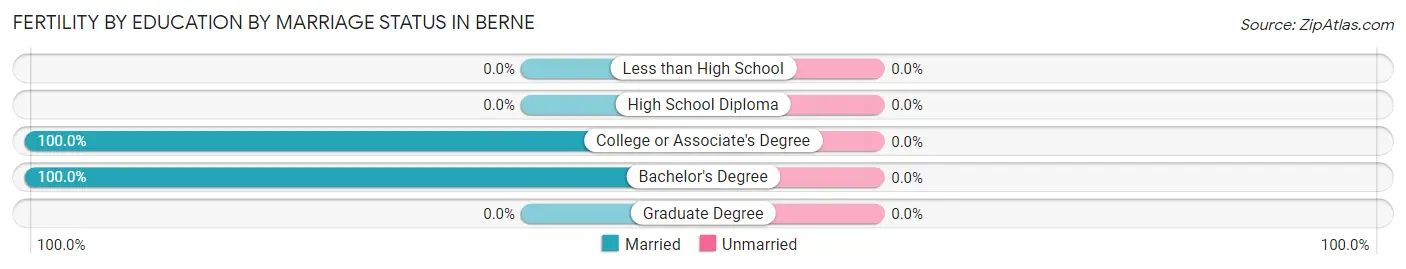
| Educational Attainment | Married | Unmarried |
| Less than High School | 0 (0.0%) | 0 (0.0%) |
| High School Diploma | 0 (0.0%) | 0 (0.0%) |
| College or Associate's Degree | 45 (100.0%) | 0 (0.0%) |
| Bachelor's Degree | 15 (100.0%) | 0 (0.0%) |
| Graduate Degree | 0 (0.0%) | 0 (0.0%) |
| Total | 60 (100.0%) | 0 (0.0%) |
Employment Characteristics in Berne
Employment by Class of Employer in Berne
Among the 1,738 employed individuals in Berne, private company employees (1,150 | 66.2%), not-for-profit organizations (259 | 14.9%), and local government employees (111 | 6.4%) make up the most common classes of employment.
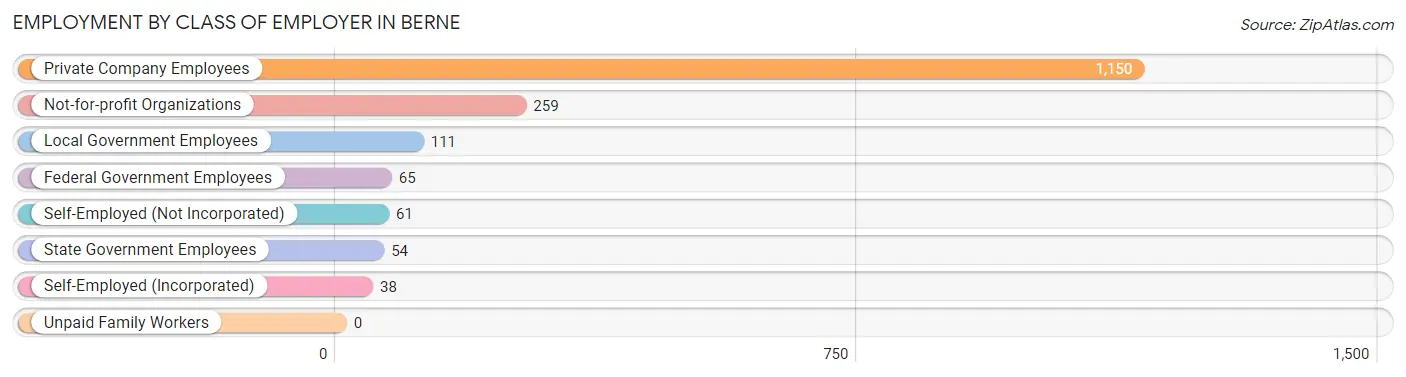
| Employer Class | # Employees | % Employees |
| Private Company Employees | 1,150 | 66.2% |
| Self-Employed (Incorporated) | 38 | 2.2% |
| Self-Employed (Not Incorporated) | 61 | 3.5% |
| Not-for-profit Organizations | 259 | 14.9% |
| Local Government Employees | 111 | 6.4% |
| State Government Employees | 54 | 3.1% |
| Federal Government Employees | 65 | 3.7% |
| Unpaid Family Workers | 0 | 0.0% |
| Total | 1,738 | 100.0% |
Employment Status by Age in Berne
According to the labor force statistics for Berne, out of the total population over 16 years of age (2,969), 61.6% or 1,829 individuals are in the labor force, with 4.4% or 80 of them unemployed. The age group with the highest labor force participation rate is 30 to 34 years, with 100.0% or 227 individuals in the labor force. Within the labor force, the 16 to 19 years age range has the highest percentage of unemployed individuals, with 30.6% or 34 of them being unemployed.
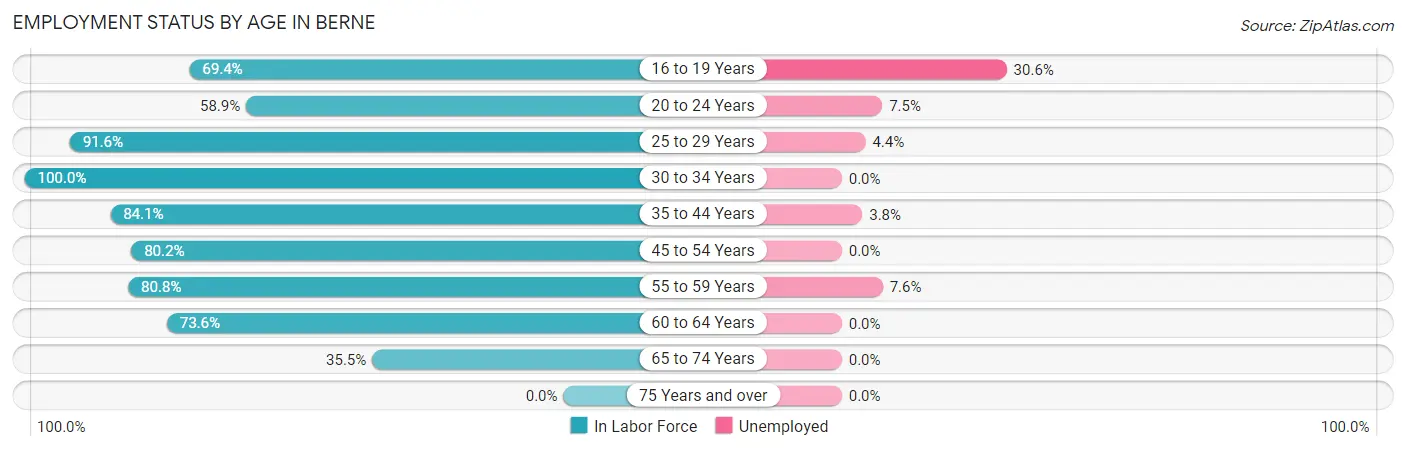
| Age Bracket | In Labor Force | Unemployed |
| 16 to 19 Years | 111 (69.4%) | 34 (30.6%) |
| 20 to 24 Years | 146 (58.9%) | 11 (7.5%) |
| 25 to 29 Years | 252 (91.6%) | 11 (4.4%) |
| 30 to 34 Years | 227 (100.0%) | 0 (0.0%) |
| 35 to 44 Years | 391 (84.1%) | 15 (3.8%) |
| 45 to 54 Years | 284 (80.2%) | 0 (0.0%) |
| 55 to 59 Years | 118 (80.8%) | 9 (7.6%) |
| 60 to 64 Years | 201 (73.6%) | 0 (0.0%) |
| 65 to 74 Years | 100 (35.5%) | 0 (0.0%) |
| 75 Years and over | 0 (0.0%) | 0 (0.0%) |
| Total | 1,829 (61.6%) | 80 (4.4%) |
Employment Status by Educational Attainment in Berne
According to labor force statistics for Berne, 84.7% of individuals (1,474) out of the total population between 25 and 64 years of age (1,740) are in the labor force, with 2.4% or 35 of them being unemployed. The group with the highest labor force participation rate are those with the educational attainment of college / associate degree, with 94.9% or 428 individuals in the labor force. Within the labor force, individuals with less than high school education have the highest percentage of unemployment, with 15.1% or 11 of them being unemployed.
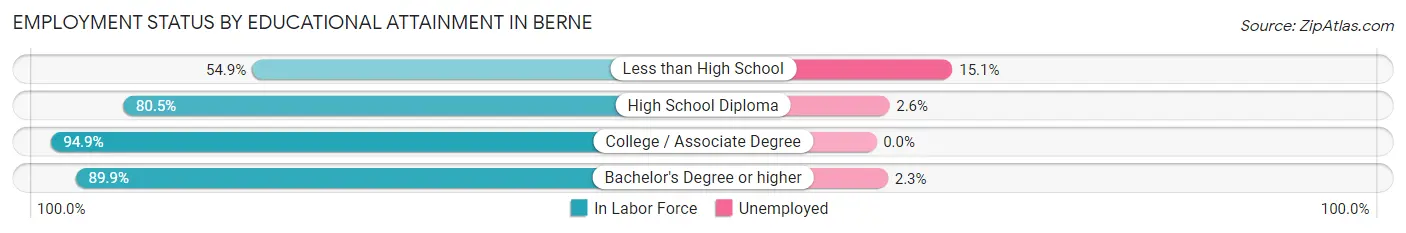
| Educational Attainment | In Labor Force | Unemployed |
| Less than High School | 73 (54.9%) | 20 (15.1%) |
| High School Diploma | 573 (80.5%) | 19 (2.6%) |
| College / Associate Degree | 428 (94.9%) | 0 (0.0%) |
| Bachelor's Degree or higher | 399 (89.9%) | 10 (2.3%) |
| Total | 1,474 (84.7%) | 42 (2.4%) |
Employment Occupations by Sex in Berne
Management, Business, Science and Arts Occupations
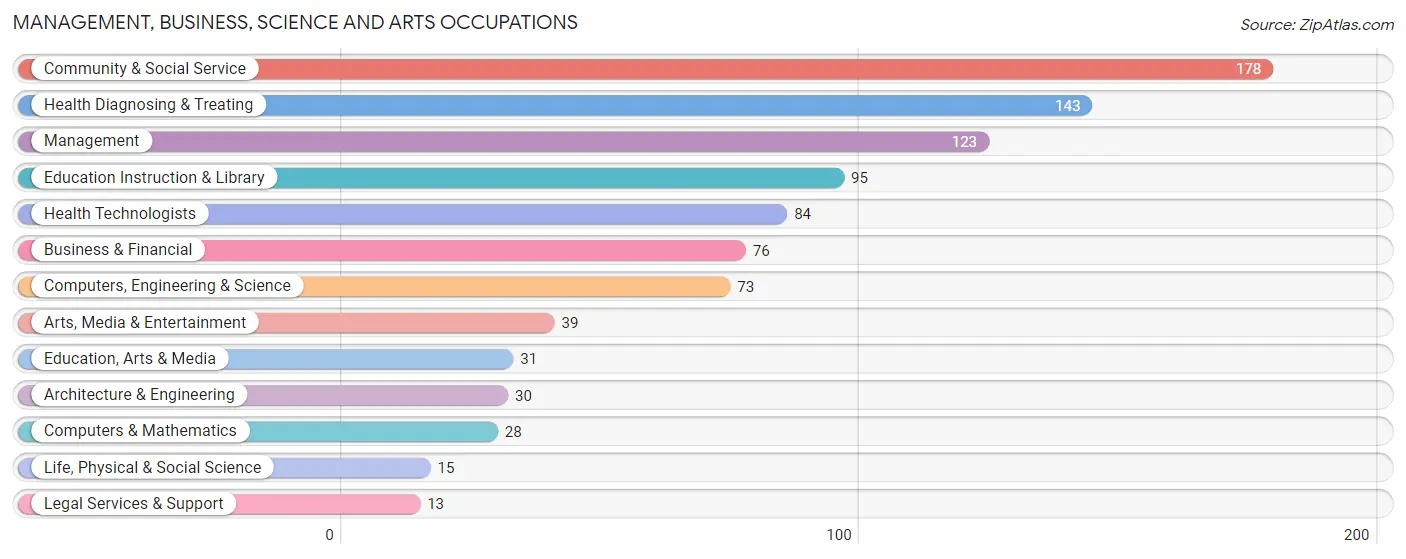
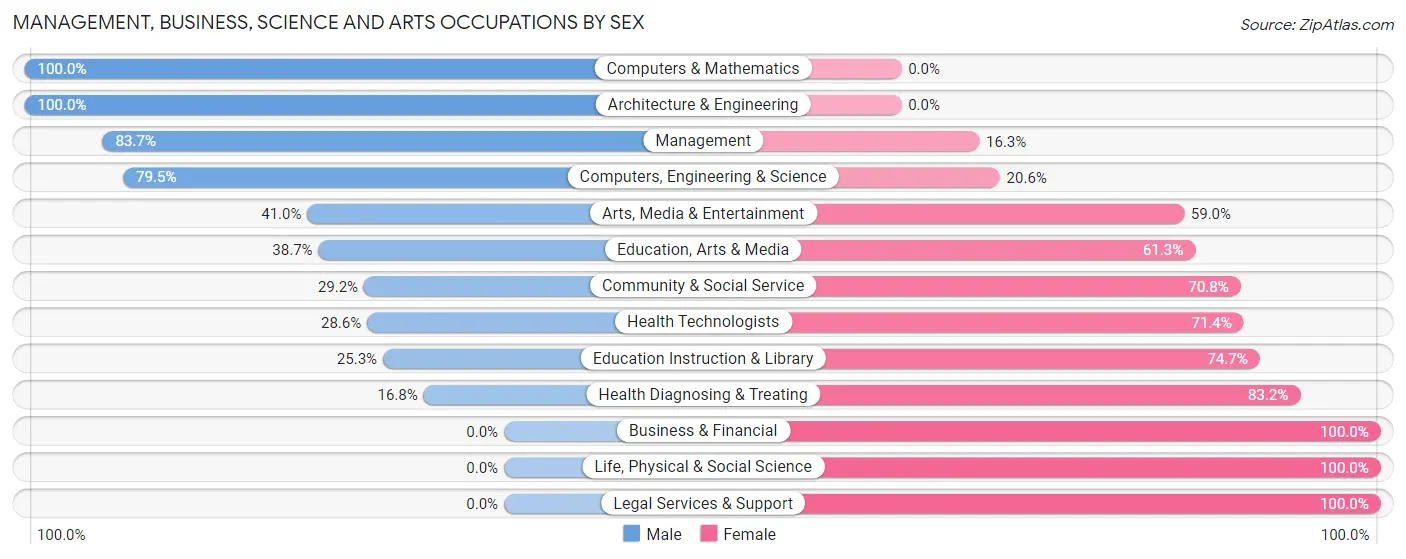
The most common Management, Business, Science and Arts occupations in Berne are Community & Social Service (178 | 10.2%), Health Diagnosing & Treating (143 | 8.2%), Management (123 | 7.0%), Education Instruction & Library (95 | 5.4%), and Health Technologists (84 | 4.8%).
Management, Business, Science and Arts Occupations by Sex
Within the Management, Business, Science and Arts occupations in Berne, the most male-oriented occupations are Computers & Mathematics (100.0%), Architecture & Engineering (100.0%), and Management (83.7%), while the most female-oriented occupations are Business & Financial (100.0%), Life, Physical & Social Science (100.0%), and Legal Services & Support (100.0%).
| Occupation | Male | Female |
| Management | 103 (83.7%) | 20 (16.3%) |
| Business & Financial | 0 (0.0%) | 76 (100.0%) |
| Computers, Engineering & Science | 58 (79.4%) | 15 (20.5%) |
| Computers & Mathematics | 28 (100.0%) | 0 (0.0%) |
| Architecture & Engineering | 30 (100.0%) | 0 (0.0%) |
| Life, Physical & Social Science | 0 (0.0%) | 15 (100.0%) |
| Community & Social Service | 52 (29.2%) | 126 (70.8%) |
| Education, Arts & Media | 12 (38.7%) | 19 (61.3%) |
| Legal Services & Support | 0 (0.0%) | 13 (100.0%) |
| Education Instruction & Library | 24 (25.3%) | 71 (74.7%) |
| Arts, Media & Entertainment | 16 (41.0%) | 23 (59.0%) |
| Health Diagnosing & Treating | 24 (16.8%) | 119 (83.2%) |
| Health Technologists | 24 (28.6%) | 60 (71.4%) |
| Total (Category) | 237 (40.0%) | 356 (60.0%) |
| Total (Overall) | 774 (44.2%) | 976 (55.8%) |
Services Occupations
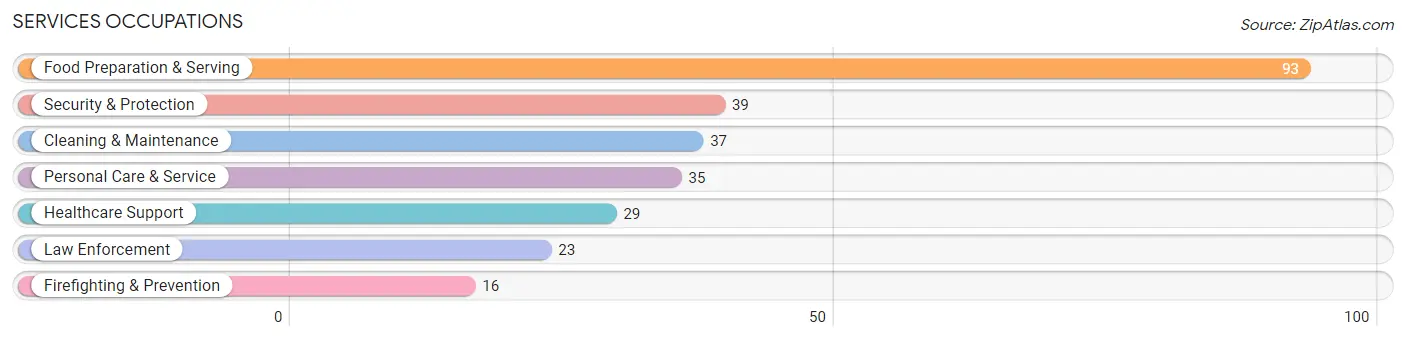
The most common Services occupations in Berne are Food Preparation & Serving (93 | 5.3%), Security & Protection (39 | 2.2%), Cleaning & Maintenance (37 | 2.1%), Personal Care & Service (35 | 2.0%), and Healthcare Support (29 | 1.7%).
Services Occupations by Sex
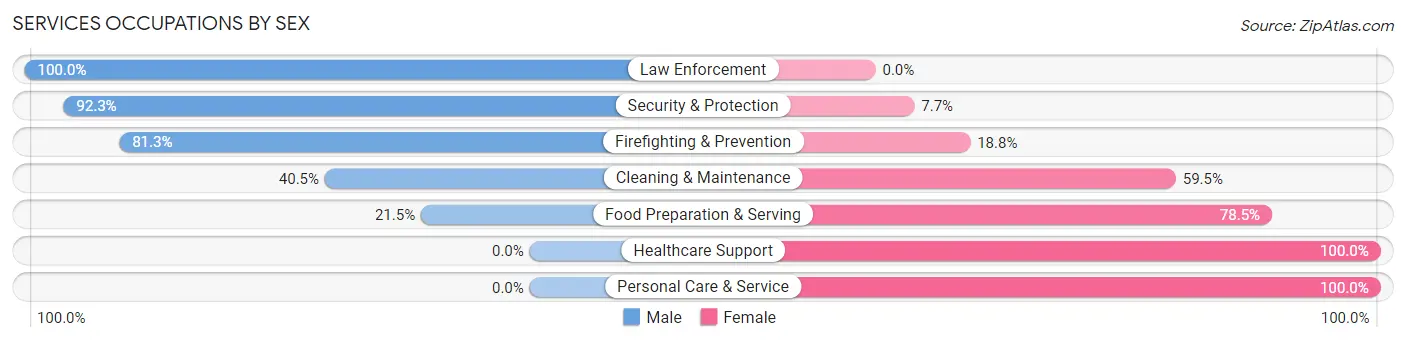
Within the Services occupations in Berne, the most male-oriented occupations are Law Enforcement (100.0%), Security & Protection (92.3%), and Firefighting & Prevention (81.2%), while the most female-oriented occupations are Healthcare Support (100.0%), Personal Care & Service (100.0%), and Food Preparation & Serving (78.5%).
| Occupation | Male | Female |
| Healthcare Support | 0 (0.0%) | 29 (100.0%) |
| Security & Protection | 36 (92.3%) | 3 (7.7%) |
| Firefighting & Prevention | 13 (81.2%) | 3 (18.8%) |
| Law Enforcement | 23 (100.0%) | 0 (0.0%) |
| Food Preparation & Serving | 20 (21.5%) | 73 (78.5%) |
| Cleaning & Maintenance | 15 (40.5%) | 22 (59.5%) |
| Personal Care & Service | 0 (0.0%) | 35 (100.0%) |
| Total (Category) | 71 (30.5%) | 162 (69.5%) |
| Total (Overall) | 774 (44.2%) | 976 (55.8%) |
Sales and Office Occupations
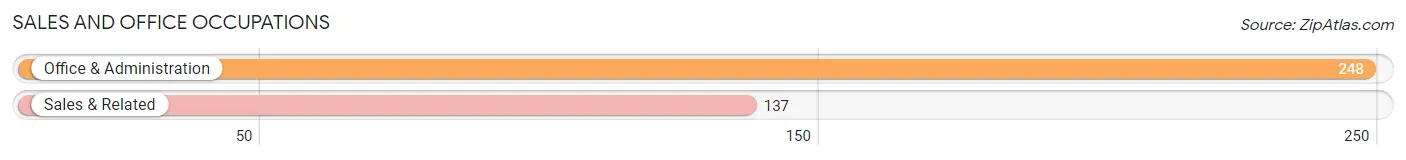
The most common Sales and Office occupations in Berne are Office & Administration (248 | 14.2%), and Sales & Related (137 | 7.8%).
Sales and Office Occupations by Sex
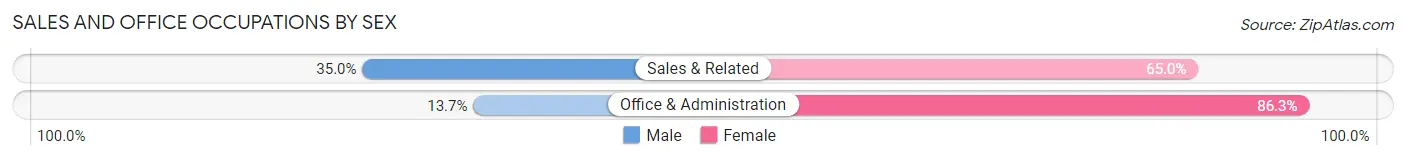
| Occupation | Male | Female |
| Sales & Related | 48 (35.0%) | 89 (65.0%) |
| Office & Administration | 34 (13.7%) | 214 (86.3%) |
| Total (Category) | 82 (21.3%) | 303 (78.7%) |
| Total (Overall) | 774 (44.2%) | 976 (55.8%) |
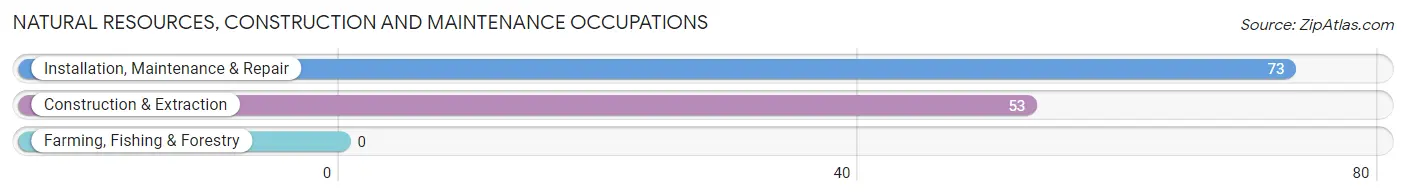
Natural Resources, Construction and Maintenance Occupations
The most common Natural Resources, Construction and Maintenance occupations in Berne are Installation, Maintenance & Repair (73 | 4.2%), and Construction & Extraction (53 | 3.0%).
Natural Resources, Construction and Maintenance Occupations by Sex
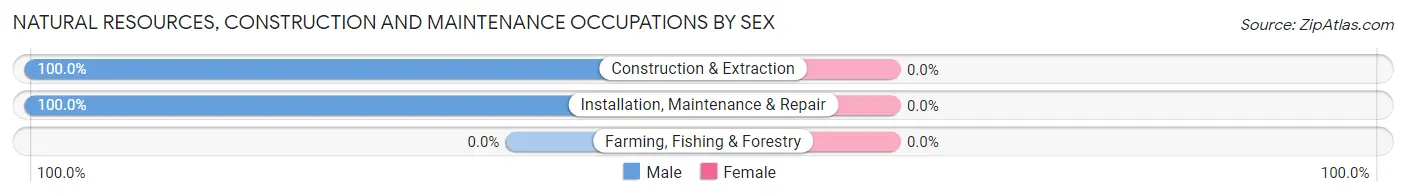
| Occupation | Male | Female |
| Farming, Fishing & Forestry | 0 (0.0%) | 0 (0.0%) |
| Construction & Extraction | 53 (100.0%) | 0 (0.0%) |
| Installation, Maintenance & Repair | 73 (100.0%) | 0 (0.0%) |
| Total (Category) | 126 (100.0%) | 0 (0.0%) |
| Total (Overall) | 774 (44.2%) | 976 (55.8%) |
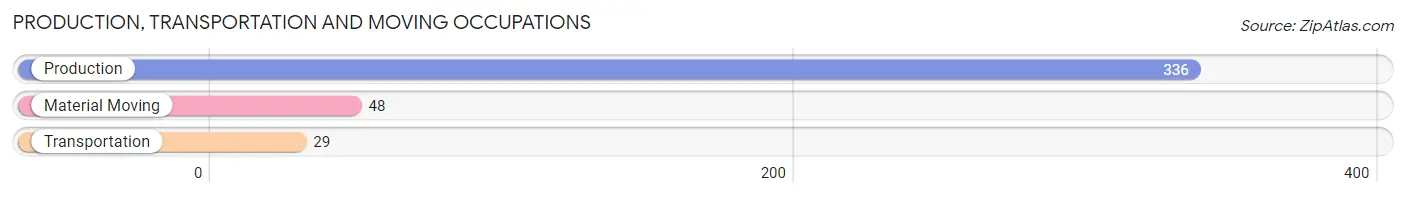
Production, Transportation and Moving Occupations
The most common Production, Transportation and Moving occupations in Berne are Production (336 | 19.2%), Material Moving (48 | 2.7%), and Transportation (29 | 1.7%).
Production, Transportation and Moving Occupations by Sex
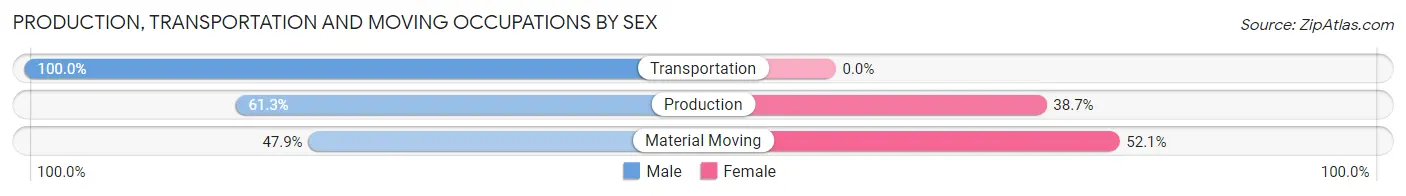
| Occupation | Male | Female |
| Production | 206 (61.3%) | 130 (38.7%) |
| Transportation | 29 (100.0%) | 0 (0.0%) |
| Material Moving | 23 (47.9%) | 25 (52.1%) |
| Total (Category) | 258 (62.5%) | 155 (37.5%) |
| Total (Overall) | 774 (44.2%) | 976 (55.8%) |
Employment Industries by Sex in Berne
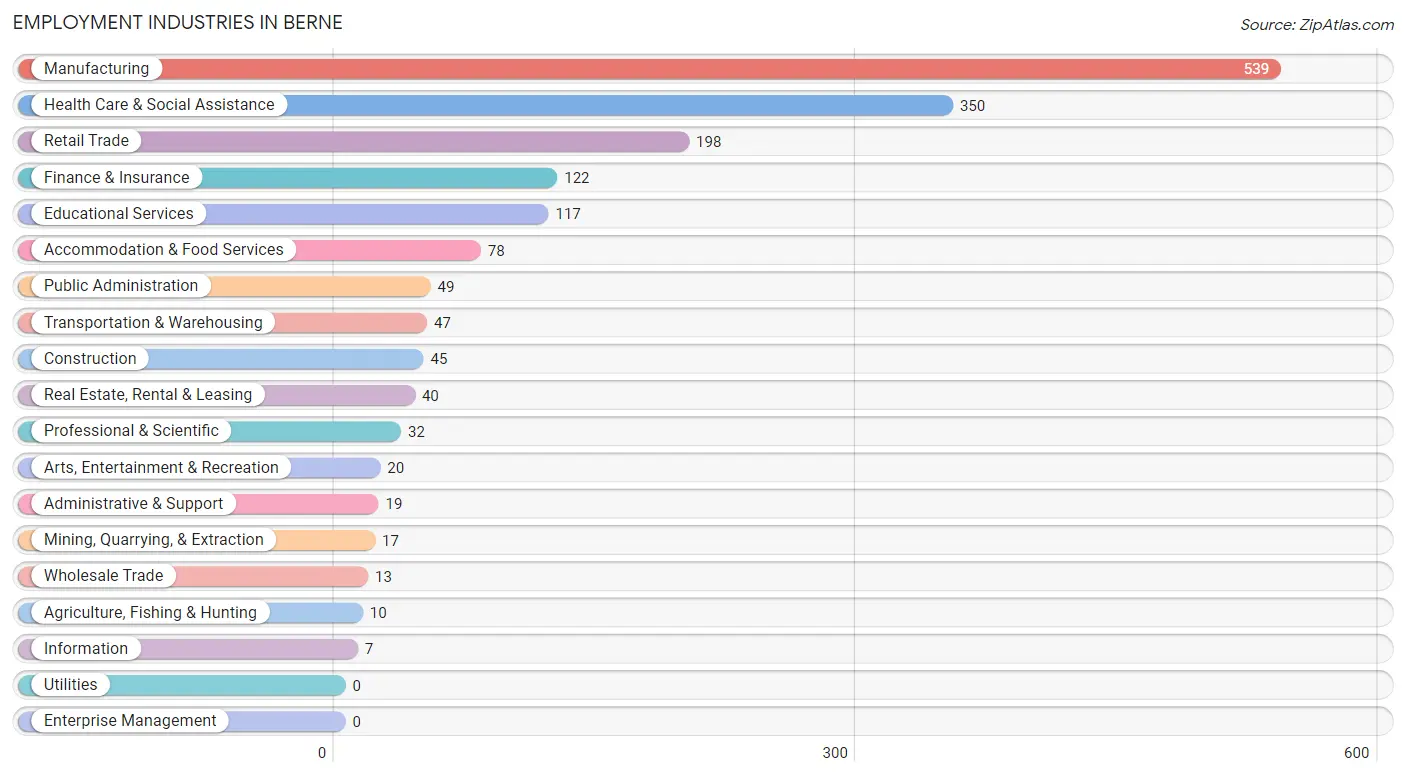
Employment Industries in Berne
The major employment industries in Berne include Manufacturing (539 | 30.8%), Health Care & Social Assistance (350 | 20.0%), Retail Trade (198 | 11.3%), Finance & Insurance (122 | 7.0%), and Educational Services (117 | 6.7%).
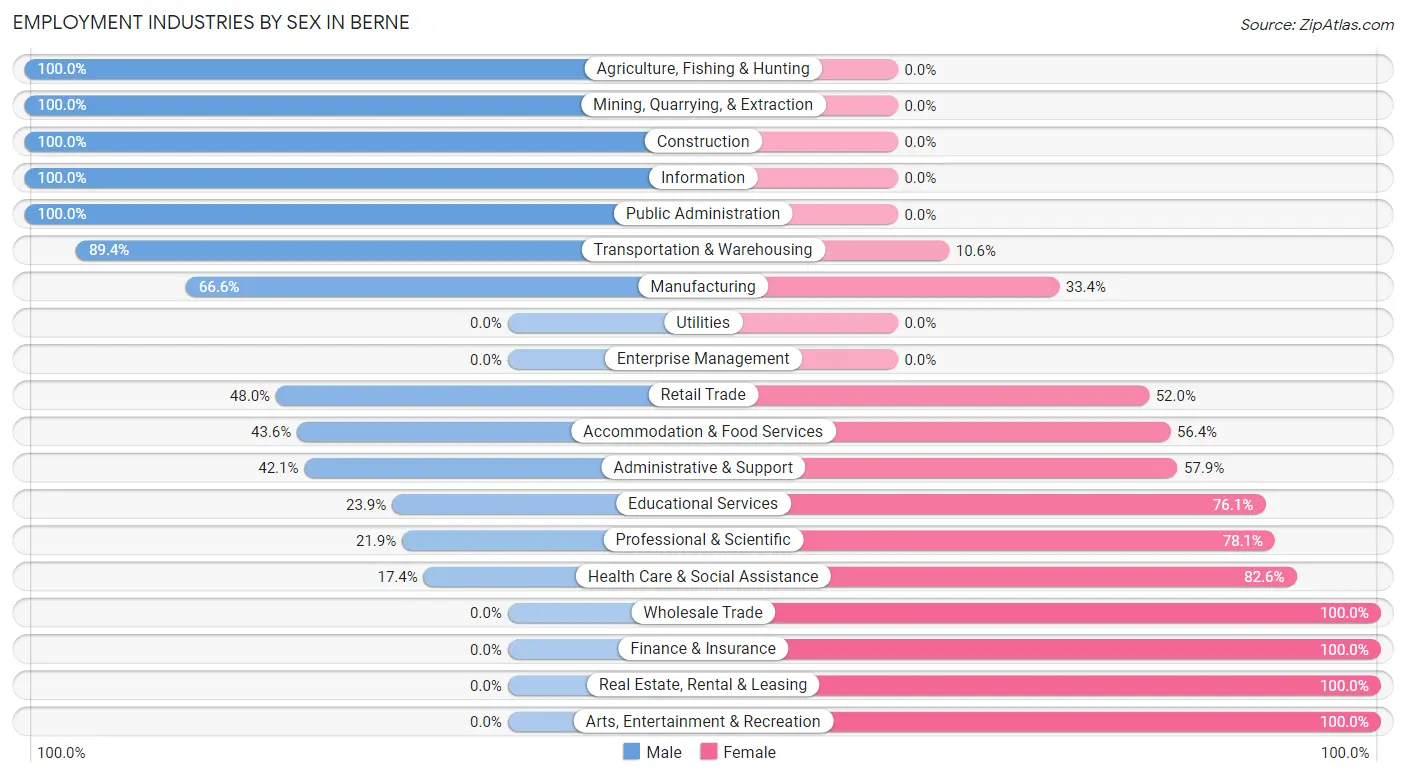
Employment Industries by Sex in Berne
The Berne industries that see more men than women are Agriculture, Fishing & Hunting (100.0%), Mining, Quarrying, & Extraction (100.0%), and Construction (100.0%), whereas the industries that tend to have a higher number of women are Wholesale Trade (100.0%), Finance & Insurance (100.0%), and Real Estate, Rental & Leasing (100.0%).
| Industry | Male | Female |
| Agriculture, Fishing & Hunting | 10 (100.0%) | 0 (0.0%) |
| Mining, Quarrying, & Extraction | 17 (100.0%) | 0 (0.0%) |
| Construction | 45 (100.0%) | 0 (0.0%) |
| Manufacturing | 359 (66.6%) | 180 (33.4%) |
| Wholesale Trade | 0 (0.0%) | 13 (100.0%) |
| Retail Trade | 95 (48.0%) | 103 (52.0%) |
| Transportation & Warehousing | 42 (89.4%) | 5 (10.6%) |
| Utilities | 0 (0.0%) | 0 (0.0%) |
| Information | 7 (100.0%) | 0 (0.0%) |
| Finance & Insurance | 0 (0.0%) | 122 (100.0%) |
| Real Estate, Rental & Leasing | 0 (0.0%) | 40 (100.0%) |
| Professional & Scientific | 7 (21.9%) | 25 (78.1%) |
| Enterprise Management | 0 (0.0%) | 0 (0.0%) |
| Administrative & Support | 8 (42.1%) | 11 (57.9%) |
| Educational Services | 28 (23.9%) | 89 (76.1%) |
| Health Care & Social Assistance | 61 (17.4%) | 289 (82.6%) |
| Arts, Entertainment & Recreation | 0 (0.0%) | 20 (100.0%) |
| Accommodation & Food Services | 34 (43.6%) | 44 (56.4%) |
| Public Administration | 49 (100.0%) | 0 (0.0%) |
| Total | 774 (44.2%) | 976 (55.8%) |
Education in Berne
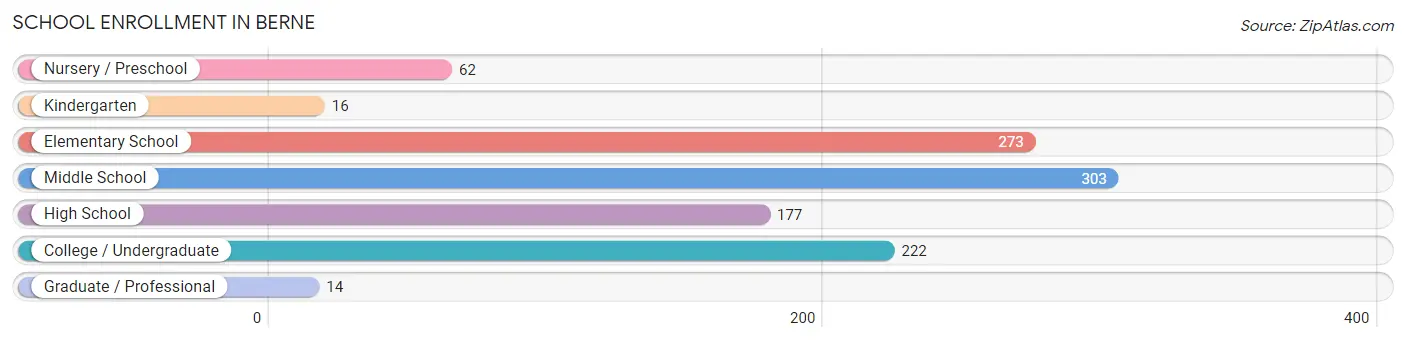
School Enrollment in Berne
The most common levels of schooling among the 1,067 students in Berne are middle school (303 | 28.4%), elementary school (273 | 25.6%), and college / undergraduate (222 | 20.8%).
| School Level | # Students | % Students |
| Nursery / Preschool | 62 | 5.8% |
| Kindergarten | 16 | 1.5% |
| Elementary School | 273 | 25.6% |
| Middle School | 303 | 28.4% |
| High School | 177 | 16.6% |
| College / Undergraduate | 222 | 20.8% |
| Graduate / Professional | 14 | 1.3% |
| Total | 1,067 | 100.0% |
School Enrollment by Age by Funding Source in Berne
Out of a total of 1,067 students who are enrolled in schools in Berne, 212 (19.9%) attend a private institution, while the remaining 855 (80.1%) are enrolled in public schools. The age group of 3 to 4 year olds has the highest likelihood of being enrolled in private schools, with 40 (64.5% in the age bracket) enrolled. Conversely, the age group of 18 to 19 year olds has the lowest likelihood of being enrolled in a private school, with 47 (100.0% in the age bracket) attending a public institution.
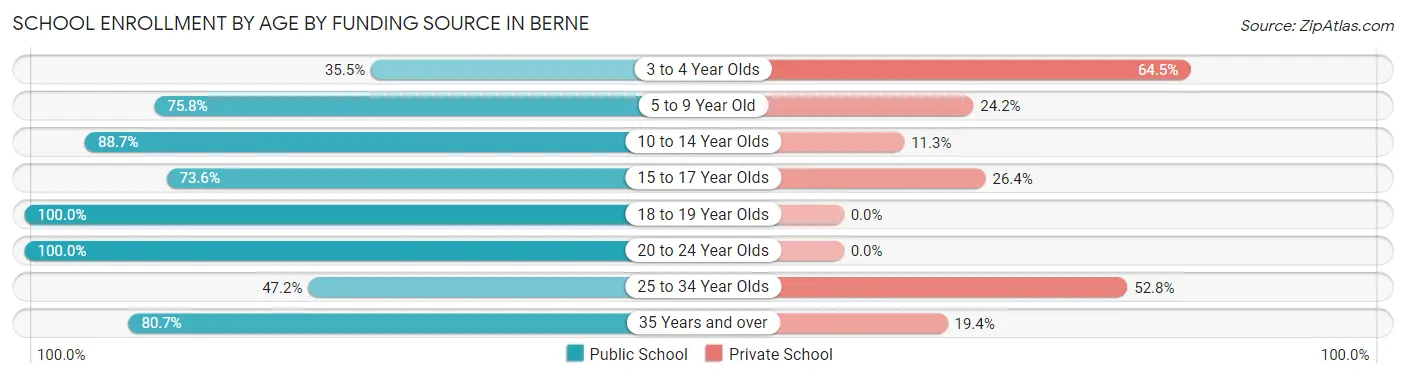
| Age Bracket | Public School | Private School |
| 3 to 4 Year Olds | 22 (35.5%) | 40 (64.5%) |
| 5 to 9 Year Old | 160 (75.8%) | 51 (24.2%) |
| 10 to 14 Year Olds | 346 (88.7%) | 44 (11.3%) |
| 15 to 17 Year Olds | 103 (73.6%) | 37 (26.4%) |
| 18 to 19 Year Olds | 47 (100.0%) | 0 (0.0%) |
| 20 to 24 Year Olds | 102 (100.0%) | 0 (0.0%) |
| 25 to 34 Year Olds | 25 (47.2%) | 28 (52.8%) |
| 35 Years and over | 50 (80.6%) | 12 (19.4%) |
| Total | 855 (80.1%) | 212 (19.9%) |
Educational Attainment by Field of Study in Berne
Education (136 | 22.7%), science & technology (113 | 18.8%), business (98 | 16.3%), arts & humanities (84 | 14.0%), and liberal arts & history (59 | 9.8%) are the most common fields of study among 600 individuals in Berne who have obtained a bachelor's degree or higher.
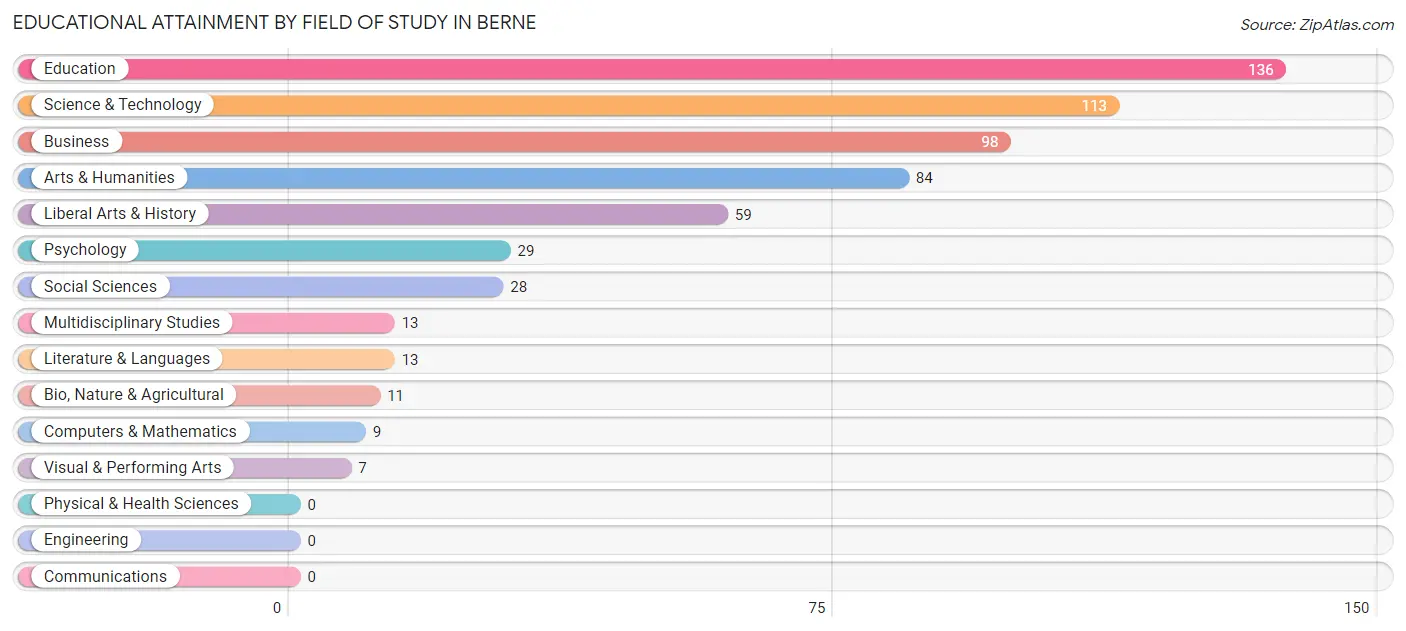
| Field of Study | # Graduates | % Graduates |
| Computers & Mathematics | 9 | 1.5% |
| Bio, Nature & Agricultural | 11 | 1.8% |
| Physical & Health Sciences | 0 | 0.0% |
| Psychology | 29 | 4.8% |
| Social Sciences | 28 | 4.7% |
| Engineering | 0 | 0.0% |
| Multidisciplinary Studies | 13 | 2.2% |
| Science & Technology | 113 | 18.8% |
| Business | 98 | 16.3% |
| Education | 136 | 22.7% |
| Literature & Languages | 13 | 2.2% |
| Liberal Arts & History | 59 | 9.8% |
| Visual & Performing Arts | 7 | 1.2% |
| Communications | 0 | 0.0% |
| Arts & Humanities | 84 | 14.0% |
| Total | 600 | 100.0% |
Transportation & Commute in Berne
Vehicle Availability by Sex in Berne
The most prevalent vehicle ownership categories in Berne are males with 2 vehicles (423, accounting for 55.2%) and females with 2 vehicles (475, making up 43.8%).
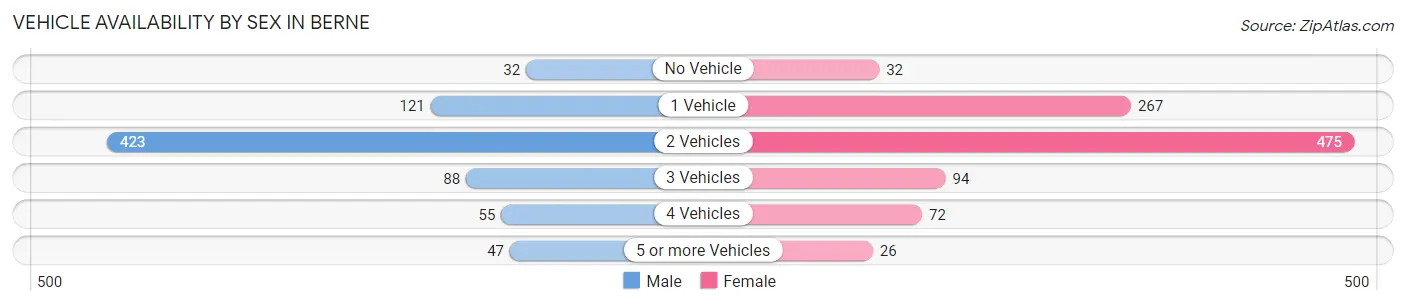
| Vehicles Available | Male | Female |
| No Vehicle | 32 (4.2%) | 32 (3.3%) |
| 1 Vehicle | 121 (15.8%) | 267 (27.6%) |
| 2 Vehicles | 423 (55.2%) | 475 (49.2%) |
| 3 Vehicles | 88 (11.5%) | 94 (9.7%) |
| 4 Vehicles | 55 (7.2%) | 72 (7.4%) |
| 5 or more Vehicles | 47 (6.1%) | 26 (2.7%) |
| Total | 766 (100.0%) | 966 (100.0%) |
Commute Time in Berne
The most frequently occuring commute durations in Berne are 5 to 9 minutes (458 commuters, 28.7%), less than 5 minutes (297 commuters, 18.6%), and 20 to 24 minutes (267 commuters, 16.7%).
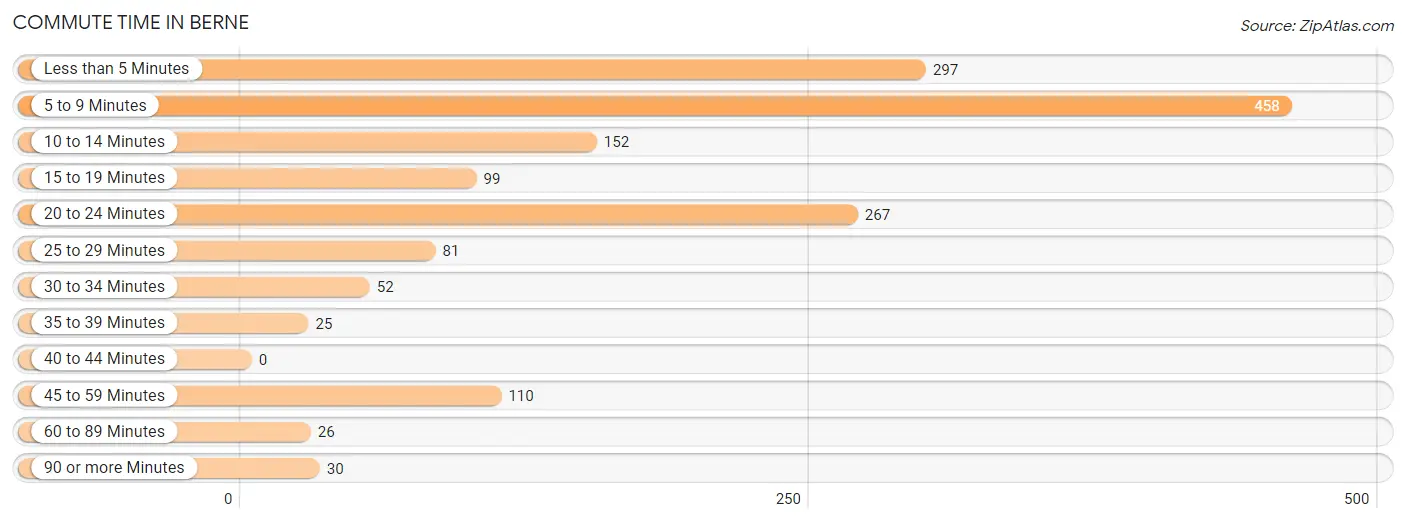
| Commute Time | # Commuters | % Commuters |
| Less than 5 Minutes | 297 | 18.6% |
| 5 to 9 Minutes | 458 | 28.7% |
| 10 to 14 Minutes | 152 | 9.5% |
| 15 to 19 Minutes | 99 | 6.2% |
| 20 to 24 Minutes | 267 | 16.7% |
| 25 to 29 Minutes | 81 | 5.1% |
| 30 to 34 Minutes | 52 | 3.3% |
| 35 to 39 Minutes | 25 | 1.6% |
| 40 to 44 Minutes | 0 | 0.0% |
| 45 to 59 Minutes | 110 | 6.9% |
| 60 to 89 Minutes | 26 | 1.6% |
| 90 or more Minutes | 30 | 1.9% |
Commute Time by Sex in Berne
The most common commute times in Berne are 5 to 9 minutes (171 commuters, 24.4%) for males and 5 to 9 minutes (287 commuters, 32.0%) for females.
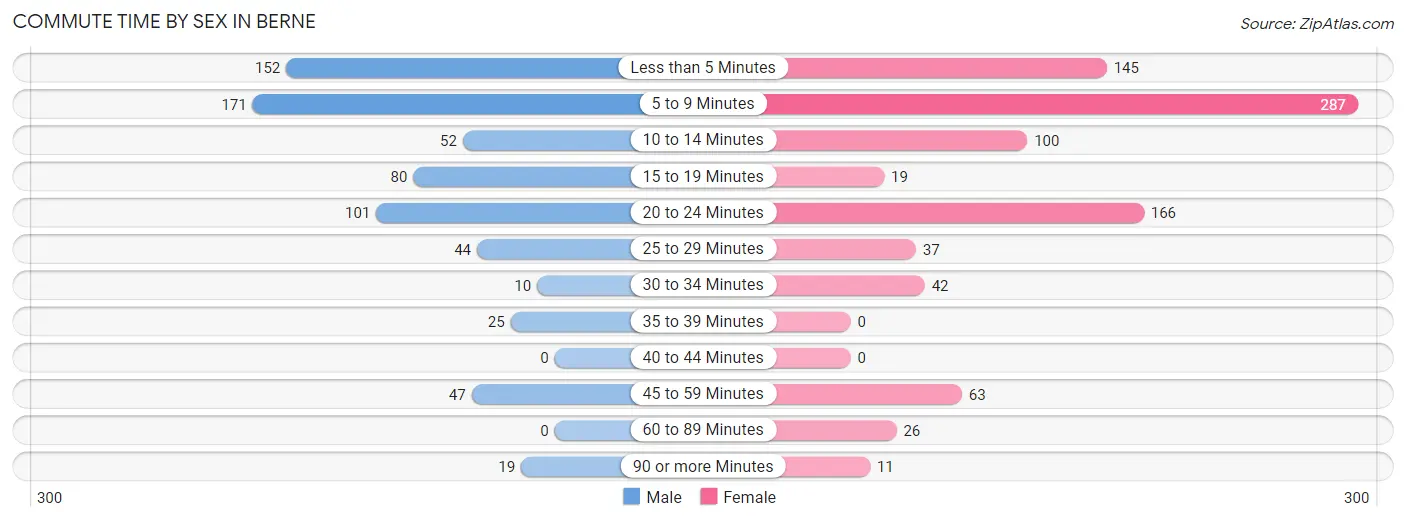
| Commute Time | Male | Female |
| Less than 5 Minutes | 152 (21.7%) | 145 (16.2%) |
| 5 to 9 Minutes | 171 (24.4%) | 287 (32.0%) |
| 10 to 14 Minutes | 52 (7.4%) | 100 (11.2%) |
| 15 to 19 Minutes | 80 (11.4%) | 19 (2.1%) |
| 20 to 24 Minutes | 101 (14.4%) | 166 (18.5%) |
| 25 to 29 Minutes | 44 (6.3%) | 37 (4.1%) |
| 30 to 34 Minutes | 10 (1.4%) | 42 (4.7%) |
| 35 to 39 Minutes | 25 (3.6%) | 0 (0.0%) |
| 40 to 44 Minutes | 0 (0.0%) | 0 (0.0%) |
| 45 to 59 Minutes | 47 (6.7%) | 63 (7.0%) |
| 60 to 89 Minutes | 0 (0.0%) | 26 (2.9%) |
| 90 or more Minutes | 19 (2.7%) | 11 (1.2%) |
Time of Departure to Work by Sex in Berne
The most frequent times of departure to work in Berne are 6:30 AM to 6:59 AM (124, 17.7%) for males and 7:00 AM to 7:29 AM (196, 21.9%) for females.
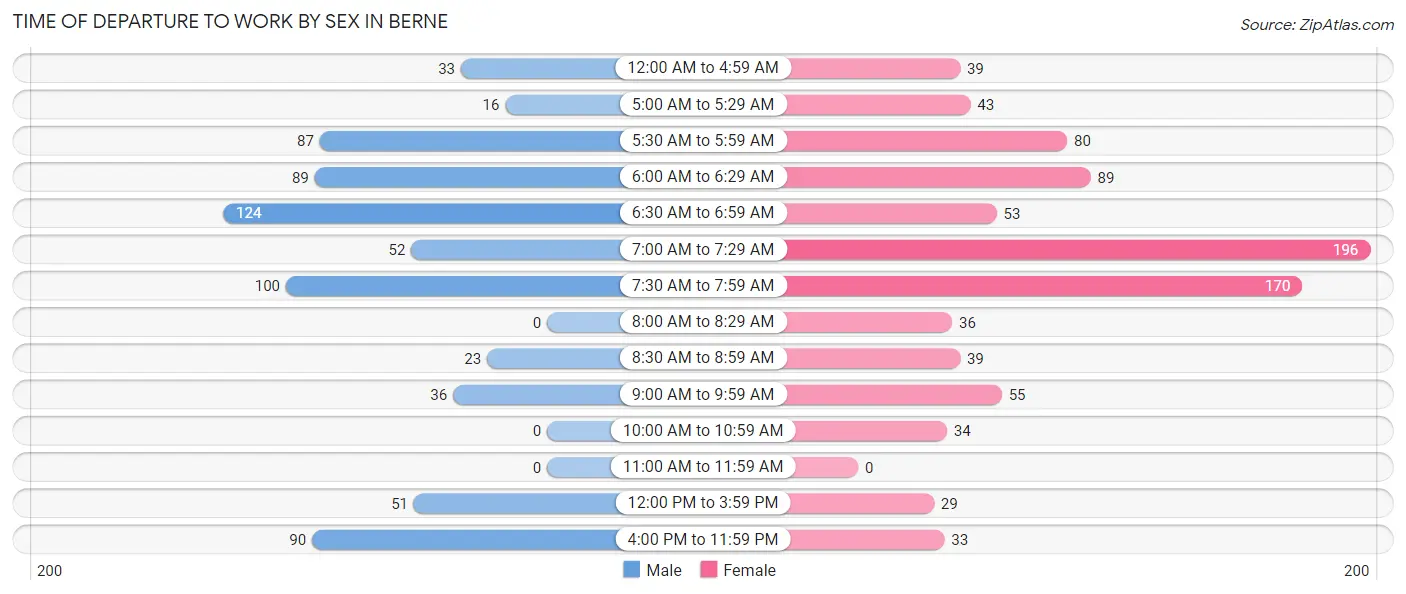
| Time of Departure | Male | Female |
| 12:00 AM to 4:59 AM | 33 (4.7%) | 39 (4.3%) |
| 5:00 AM to 5:29 AM | 16 (2.3%) | 43 (4.8%) |
| 5:30 AM to 5:59 AM | 87 (12.4%) | 80 (8.9%) |
| 6:00 AM to 6:29 AM | 89 (12.7%) | 89 (9.9%) |
| 6:30 AM to 6:59 AM | 124 (17.7%) | 53 (5.9%) |
| 7:00 AM to 7:29 AM | 52 (7.4%) | 196 (21.9%) |
| 7:30 AM to 7:59 AM | 100 (14.3%) | 170 (19.0%) |
| 8:00 AM to 8:29 AM | 0 (0.0%) | 36 (4.0%) |
| 8:30 AM to 8:59 AM | 23 (3.3%) | 39 (4.3%) |
| 9:00 AM to 9:59 AM | 36 (5.1%) | 55 (6.1%) |
| 10:00 AM to 10:59 AM | 0 (0.0%) | 34 (3.8%) |
| 11:00 AM to 11:59 AM | 0 (0.0%) | 0 (0.0%) |
| 12:00 PM to 3:59 PM | 51 (7.3%) | 29 (3.2%) |
| 4:00 PM to 11:59 PM | 90 (12.8%) | 33 (3.7%) |
| Total | 701 (100.0%) | 896 (100.0%) |
Housing Occupancy in Berne
Occupancy by Ownership in Berne
Of the total 1,511 dwellings in Berne, owner-occupied units account for 1,093 (72.3%), while renter-occupied units make up 418 (27.7%).
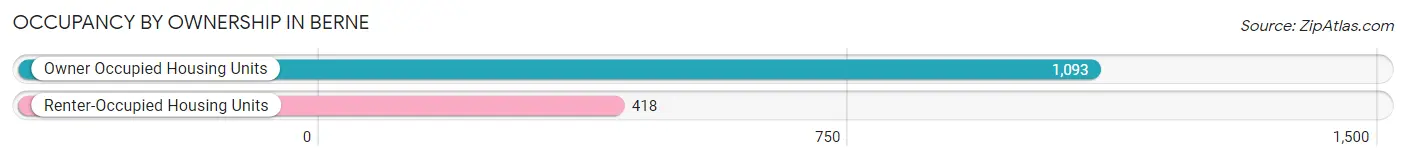
| Occupancy | # Housing Units | % Housing Units |
| Owner Occupied Housing Units | 1,093 | 72.3% |
| Renter-Occupied Housing Units | 418 | 27.7% |
| Total Occupied Housing Units | 1,511 | 100.0% |
Occupancy by Household Size in Berne
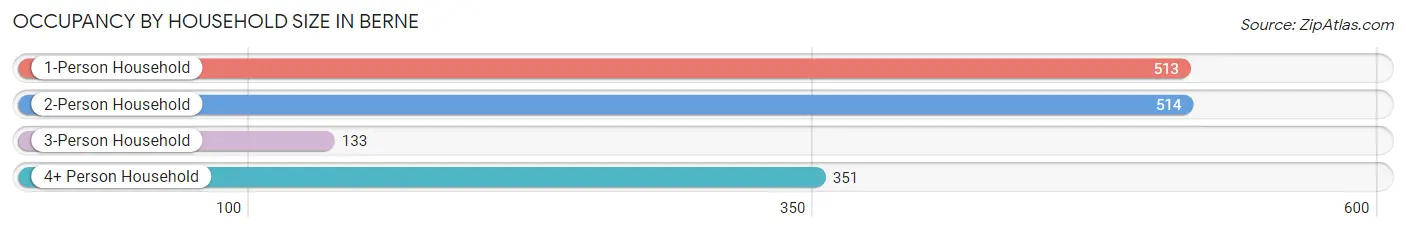
| Household Size | # Housing Units | % Housing Units |
| 1-Person Household | 513 | 34.0% |
| 2-Person Household | 514 | 34.0% |
| 3-Person Household | 133 | 8.8% |
| 4+ Person Household | 351 | 23.2% |
| Total Housing Units | 1,511 | 100.0% |
Occupancy by Ownership by Household Size in Berne
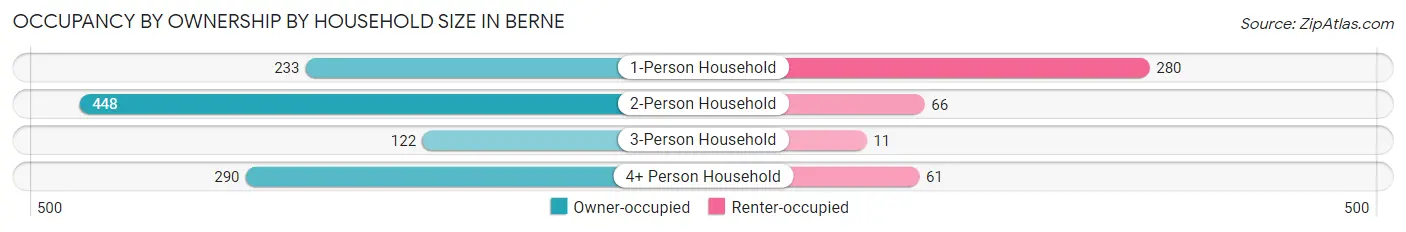
| Household Size | Owner-occupied | Renter-occupied |
| 1-Person Household | 233 (45.4%) | 280 (54.6%) |
| 2-Person Household | 448 (87.2%) | 66 (12.8%) |
| 3-Person Household | 122 (91.7%) | 11 (8.3%) |
| 4+ Person Household | 290 (82.6%) | 61 (17.4%) |
| Total Housing Units | 1,093 (72.3%) | 418 (27.7%) |
Occupancy by Educational Attainment in Berne
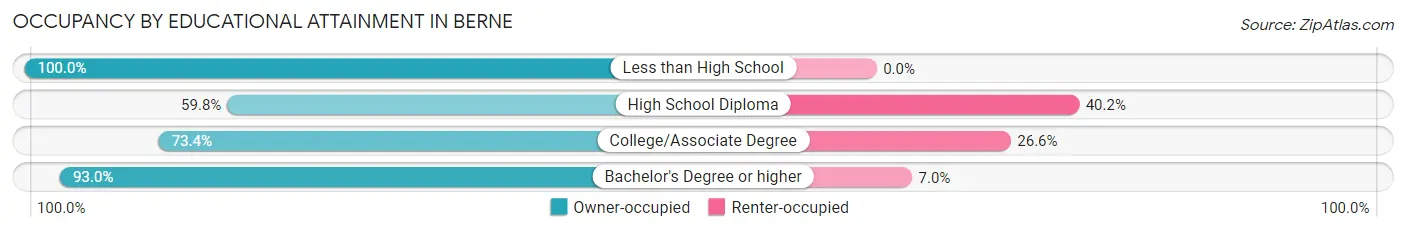
| Household Size | Owner-occupied | Renter-occupied |
| Less than High School | 61 (100.0%) | 0 (0.0%) |
| High School Diploma | 438 (59.8%) | 294 (40.2%) |
| College/Associate Degree | 276 (73.4%) | 100 (26.6%) |
| Bachelor's Degree or higher | 318 (93.0%) | 24 (7.0%) |
Occupancy by Age of Householder in Berne
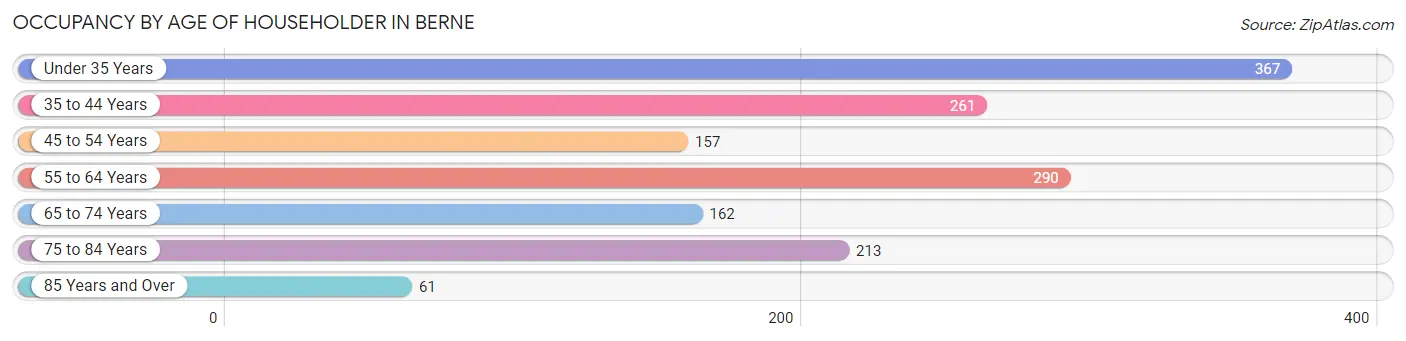
| Age Bracket | # Households | % Households |
| Under 35 Years | 367 | 24.3% |
| 35 to 44 Years | 261 | 17.3% |
| 45 to 54 Years | 157 | 10.4% |
| 55 to 64 Years | 290 | 19.2% |
| 65 to 74 Years | 162 | 10.7% |
| 75 to 84 Years | 213 | 14.1% |
| 85 Years and Over | 61 | 4.0% |
| Total | 1,511 | 100.0% |
Housing Finances in Berne
Median Income by Occupancy in Berne
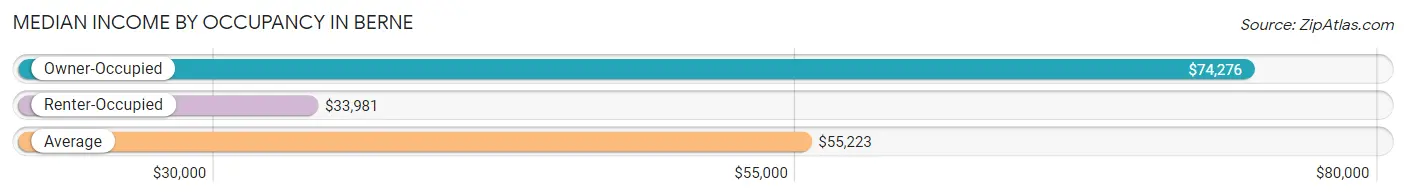
| Occupancy Type | # Households | Median Income |
| Owner-Occupied | 1,093 (72.3%) | $74,276 |
| Renter-Occupied | 418 (27.7%) | $33,981 |
| Average | 1,511 (100.0%) | $55,223 |
Occupancy by Householder Income Bracket in Berne
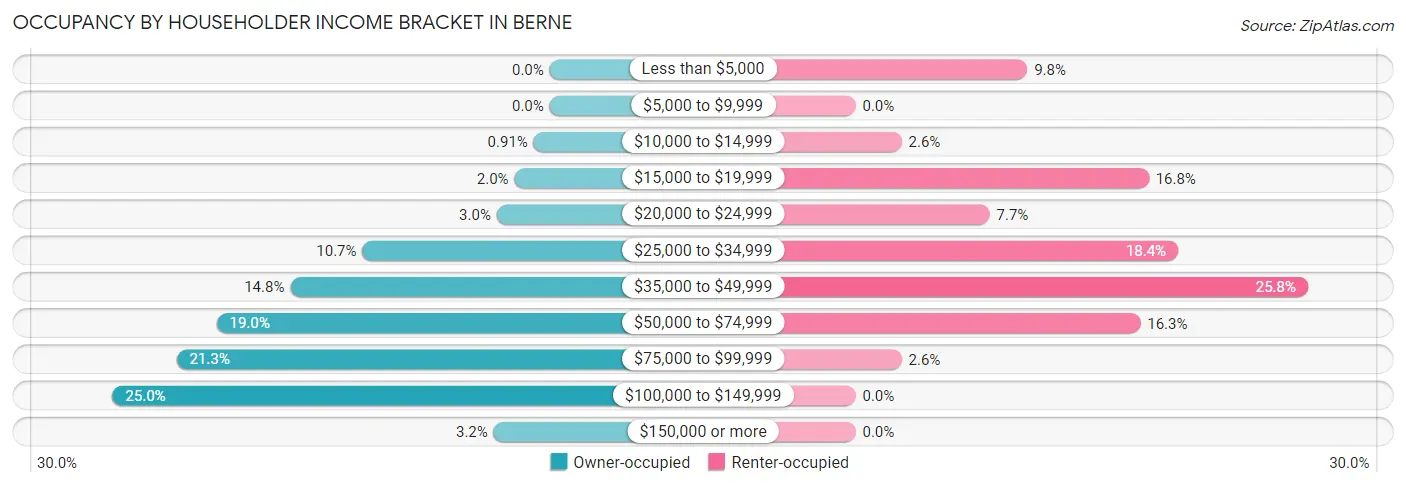
| Income Bracket | Owner-occupied | Renter-occupied |
| Less than $5,000 | 0 (0.0%) | 41 (9.8%) |
| $5,000 to $9,999 | 0 (0.0%) | 0 (0.0%) |
| $10,000 to $14,999 | 10 (0.9%) | 11 (2.6%) |
| $15,000 to $19,999 | 22 (2.0%) | 70 (16.8%) |
| $20,000 to $24,999 | 33 (3.0%) | 32 (7.7%) |
| $25,000 to $34,999 | 117 (10.7%) | 77 (18.4%) |
| $35,000 to $49,999 | 162 (14.8%) | 108 (25.8%) |
| $50,000 to $74,999 | 208 (19.0%) | 68 (16.3%) |
| $75,000 to $99,999 | 233 (21.3%) | 11 (2.6%) |
| $100,000 to $149,999 | 273 (25.0%) | 0 (0.0%) |
| $150,000 or more | 35 (3.2%) | 0 (0.0%) |
| Total | 1,093 (100.0%) | 418 (100.0%) |
Monthly Housing Cost Tiers in Berne
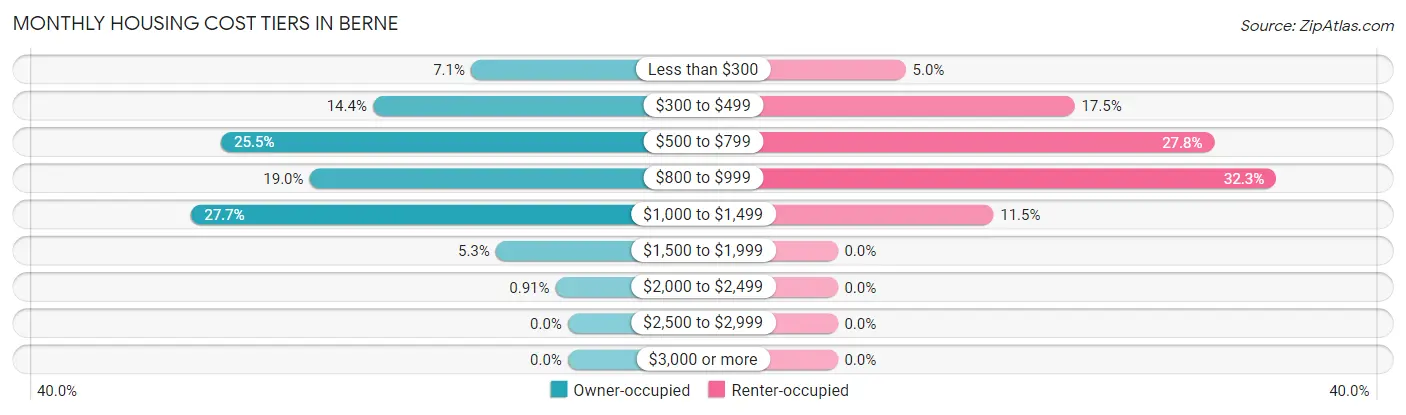
| Monthly Cost | Owner-occupied | Renter-occupied |
| Less than $300 | 78 (7.1%) | 21 (5.0%) |
| $300 to $499 | 157 (14.4%) | 73 (17.5%) |
| $500 to $799 | 279 (25.5%) | 116 (27.8%) |
| $800 to $999 | 208 (19.0%) | 135 (32.3%) |
| $1,000 to $1,499 | 303 (27.7%) | 48 (11.5%) |
| $1,500 to $1,999 | 58 (5.3%) | 0 (0.0%) |
| $2,000 to $2,499 | 10 (0.9%) | 0 (0.0%) |
| $2,500 to $2,999 | 0 (0.0%) | 0 (0.0%) |
| $3,000 or more | 0 (0.0%) | 0 (0.0%) |
| Total | 1,093 (100.0%) | 418 (100.0%) |
Physical Housing Characteristics in Berne
Housing Structures in Berne
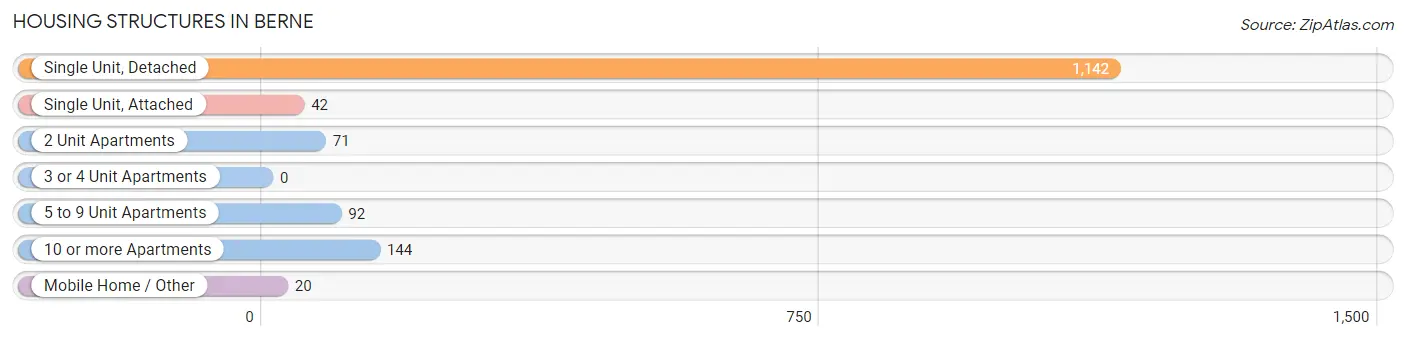
| Structure Type | # Housing Units | % Housing Units |
| Single Unit, Detached | 1,142 | 75.6% |
| Single Unit, Attached | 42 | 2.8% |
| 2 Unit Apartments | 71 | 4.7% |
| 3 or 4 Unit Apartments | 0 | 0.0% |
| 5 to 9 Unit Apartments | 92 | 6.1% |
| 10 or more Apartments | 144 | 9.5% |
| Mobile Home / Other | 20 | 1.3% |
| Total | 1,511 | 100.0% |
Housing Structures by Occupancy in Berne
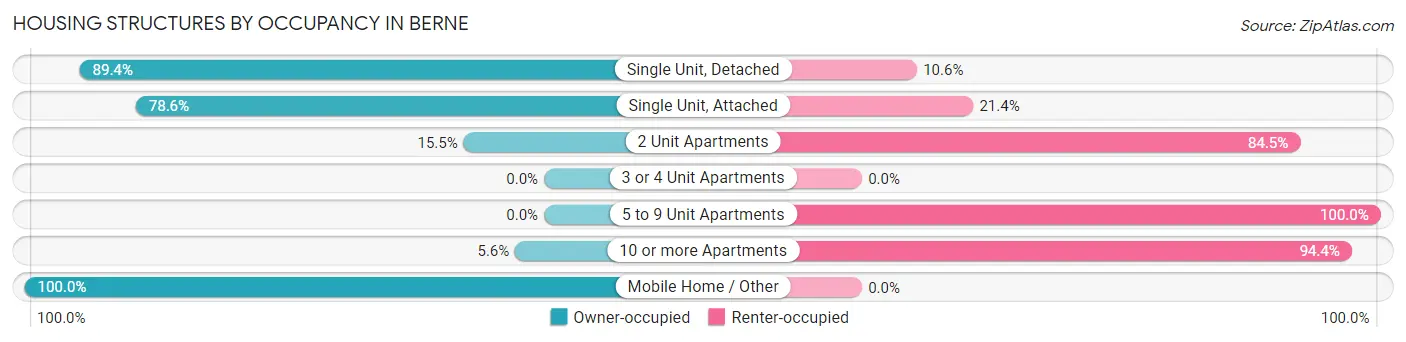
| Structure Type | Owner-occupied | Renter-occupied |
| Single Unit, Detached | 1,021 (89.4%) | 121 (10.6%) |
| Single Unit, Attached | 33 (78.6%) | 9 (21.4%) |
| 2 Unit Apartments | 11 (15.5%) | 60 (84.5%) |
| 3 or 4 Unit Apartments | 0 (0.0%) | 0 (0.0%) |
| 5 to 9 Unit Apartments | 0 (0.0%) | 92 (100.0%) |
| 10 or more Apartments | 8 (5.6%) | 136 (94.4%) |
| Mobile Home / Other | 20 (100.0%) | 0 (0.0%) |
| Total | 1,093 (72.3%) | 418 (27.7%) |
Housing Structures by Number of Rooms in Berne
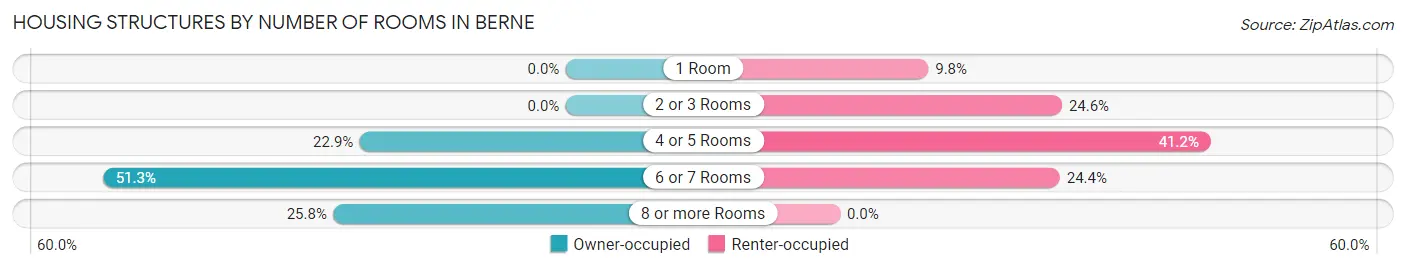
| Number of Rooms | Owner-occupied | Renter-occupied |
| 1 Room | 0 (0.0%) | 41 (9.8%) |
| 2 or 3 Rooms | 0 (0.0%) | 103 (24.6%) |
| 4 or 5 Rooms | 250 (22.9%) | 172 (41.1%) |
| 6 or 7 Rooms | 561 (51.3%) | 102 (24.4%) |
| 8 or more Rooms | 282 (25.8%) | 0 (0.0%) |
| Total | 1,093 (100.0%) | 418 (100.0%) |
Housing Structure by Heating Type in Berne
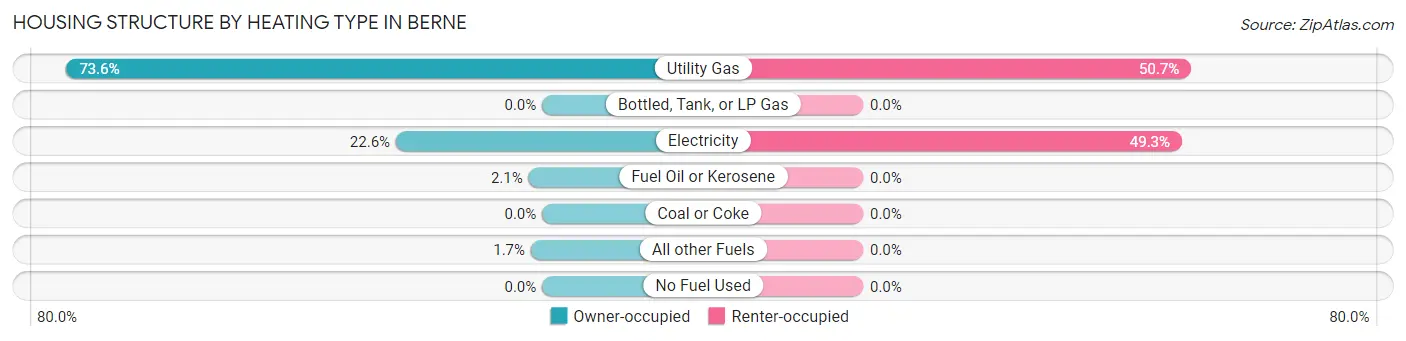
| Heating Type | Owner-occupied | Renter-occupied |
| Utility Gas | 804 (73.6%) | 212 (50.7%) |
| Bottled, Tank, or LP Gas | 0 (0.0%) | 0 (0.0%) |
| Electricity | 247 (22.6%) | 206 (49.3%) |
| Fuel Oil or Kerosene | 23 (2.1%) | 0 (0.0%) |
| Coal or Coke | 0 (0.0%) | 0 (0.0%) |
| All other Fuels | 19 (1.7%) | 0 (0.0%) |
| No Fuel Used | 0 (0.0%) | 0 (0.0%) |
| Total | 1,093 (100.0%) | 418 (100.0%) |
Household Vehicle Usage in Berne
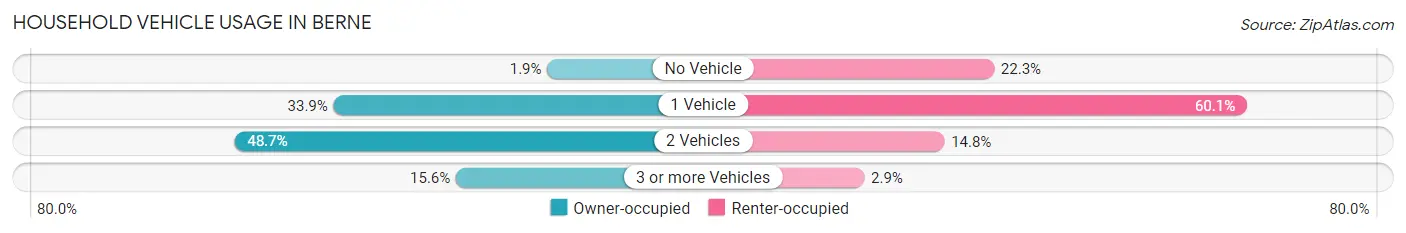
| Vehicles per Household | Owner-occupied | Renter-occupied |
| No Vehicle | 21 (1.9%) | 93 (22.3%) |
| 1 Vehicle | 370 (33.9%) | 251 (60.1%) |
| 2 Vehicles | 532 (48.7%) | 62 (14.8%) |
| 3 or more Vehicles | 170 (15.5%) | 12 (2.9%) |
| Total | 1,093 (100.0%) | 418 (100.0%) |
Real Estate & Mortgages in Berne
Real Estate and Mortgage Overview in Berne
| Characteristic | Without Mortgage | With Mortgage |
| Housing Units | 318 | 775 |
| Median Property Value | $135,500 | $139,100 |
| Median Household Income | $52,132 | $18 |
| Monthly Housing Costs | $425 | $0 |
| Real Estate Taxes | $890 | $35 |
Property Value by Mortgage Status in Berne
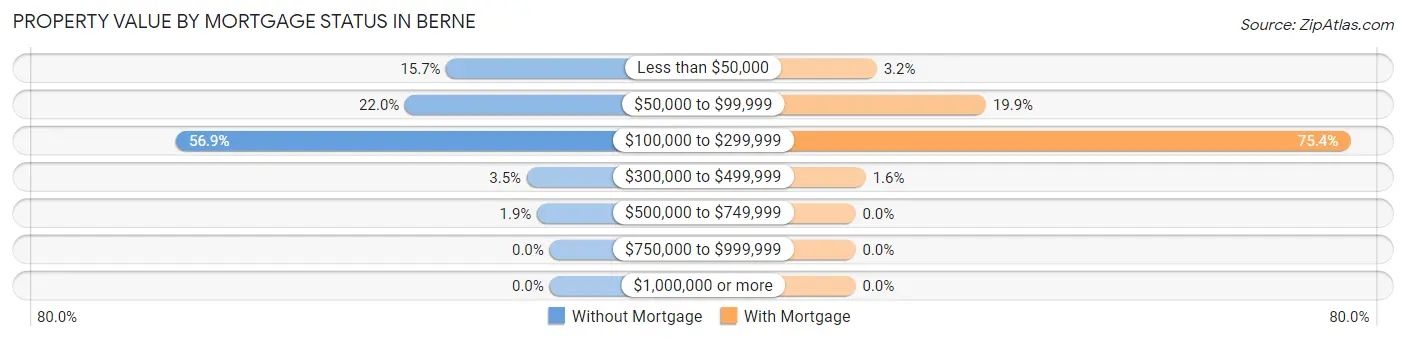
| Property Value | Without Mortgage | With Mortgage |
| Less than $50,000 | 50 (15.7%) | 25 (3.2%) |
| $50,000 to $99,999 | 70 (22.0%) | 154 (19.9%) |
| $100,000 to $299,999 | 181 (56.9%) | 584 (75.3%) |
| $300,000 to $499,999 | 11 (3.5%) | 12 (1.5%) |
| $500,000 to $749,999 | 6 (1.9%) | 0 (0.0%) |
| $750,000 to $999,999 | 0 (0.0%) | 0 (0.0%) |
| $1,000,000 or more | 0 (0.0%) | 0 (0.0%) |
| Total | 318 (100.0%) | 775 (100.0%) |
Household Income by Mortgage Status in Berne
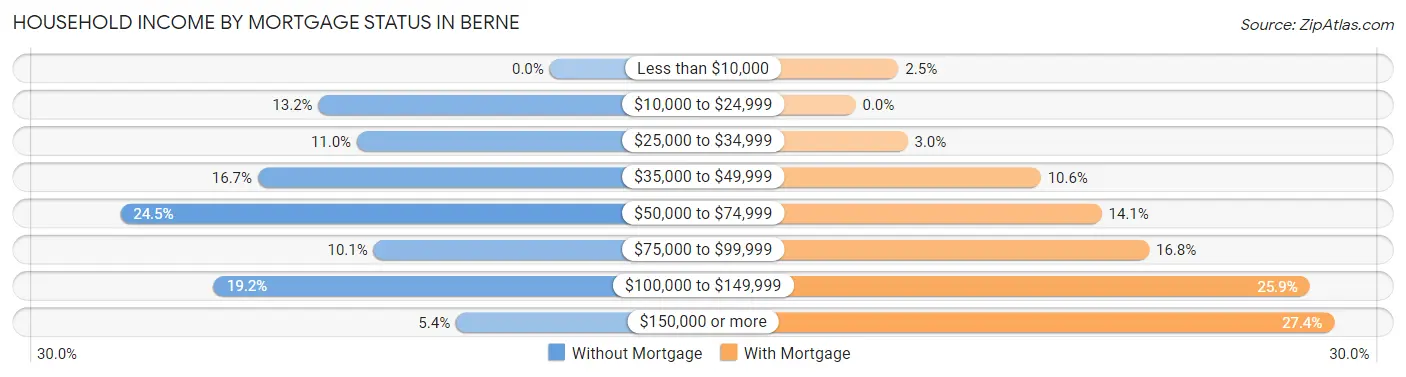
| Household Income | Without Mortgage | With Mortgage |
| Less than $10,000 | 0 (0.0%) | 19 (2.5%) |
| $10,000 to $24,999 | 42 (13.2%) | 0 (0.0%) |
| $25,000 to $34,999 | 35 (11.0%) | 23 (3.0%) |
| $35,000 to $49,999 | 53 (16.7%) | 82 (10.6%) |
| $50,000 to $74,999 | 78 (24.5%) | 109 (14.1%) |
| $75,000 to $99,999 | 32 (10.1%) | 130 (16.8%) |
| $100,000 to $149,999 | 61 (19.2%) | 201 (25.9%) |
| $150,000 or more | 17 (5.3%) | 212 (27.4%) |
| Total | 318 (100.0%) | 775 (100.0%) |
Property Value to Household Income Ratio in Berne
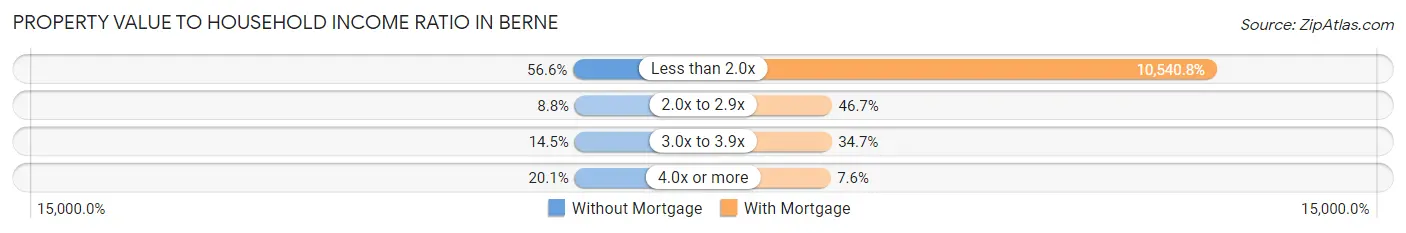
| Value-to-Income Ratio | Without Mortgage | With Mortgage |
| Less than 2.0x | 180 (56.6%) | 81,691 (10,540.8%) |
| 2.0x to 2.9x | 28 (8.8%) | 362 (46.7%) |
| 3.0x to 3.9x | 46 (14.5%) | 269 (34.7%) |
| 4.0x or more | 64 (20.1%) | 59 (7.6%) |
| Total | 318 (100.0%) | 775 (100.0%) |
Real Estate Taxes by Mortgage Status in Berne
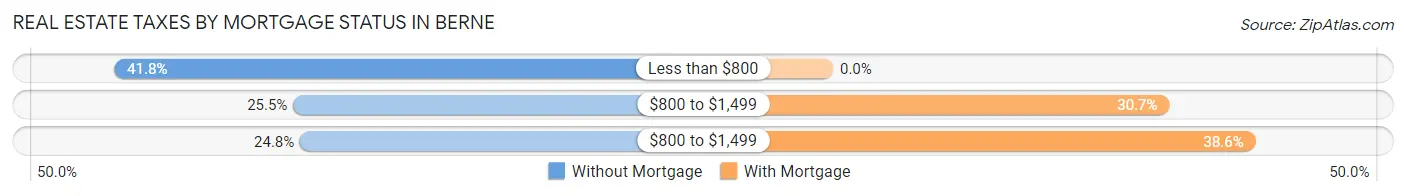
| Property Taxes | Without Mortgage | With Mortgage |
| Less than $800 | 133 (41.8%) | 0 (0.0%) |
| $800 to $1,499 | 81 (25.5%) | 238 (30.7%) |
| $800 to $1,499 | 79 (24.8%) | 299 (38.6%) |
| Total | 318 (100.0%) | 775 (100.0%) |
Health & Disability in Berne
Health Insurance Coverage by Age in Berne
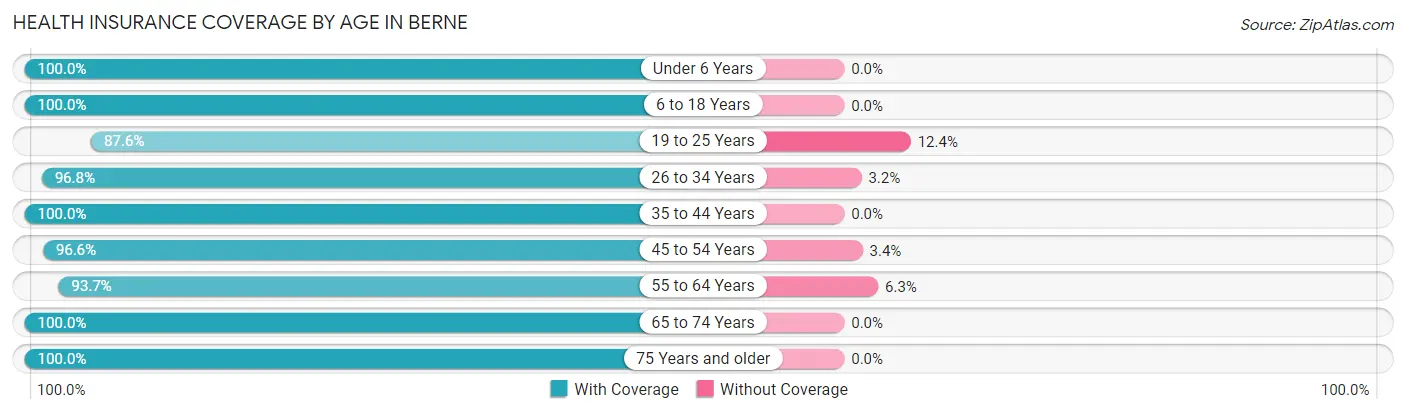
| Age Bracket | With Coverage | Without Coverage |
| Under 6 Years | 287 (100.0%) | 0 (0.0%) |
| 6 to 18 Years | 803 (100.0%) | 0 (0.0%) |
| 19 to 25 Years | 297 (87.6%) | 42 (12.4%) |
| 26 to 34 Years | 424 (96.8%) | 14 (3.2%) |
| 35 to 44 Years | 465 (100.0%) | 0 (0.0%) |
| 45 to 54 Years | 340 (96.6%) | 12 (3.4%) |
| 55 to 64 Years | 386 (93.7%) | 26 (6.3%) |
| 65 to 74 Years | 269 (100.0%) | 0 (0.0%) |
| 75 Years and older | 345 (100.0%) | 0 (0.0%) |
| Total | 3,616 (97.5%) | 94 (2.5%) |
Health Insurance Coverage by Citizenship Status in Berne
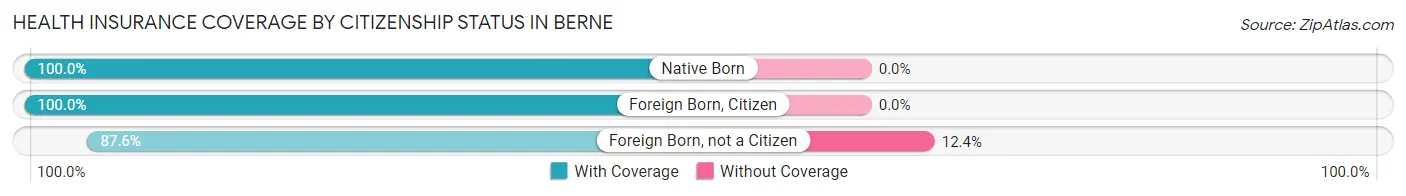
| Citizenship Status | With Coverage | Without Coverage |
| Native Born | 287 (100.0%) | 0 (0.0%) |
| Foreign Born, Citizen | 803 (100.0%) | 0 (0.0%) |
| Foreign Born, not a Citizen | 297 (87.6%) | 42 (12.4%) |
Health Insurance Coverage by Household Income in Berne
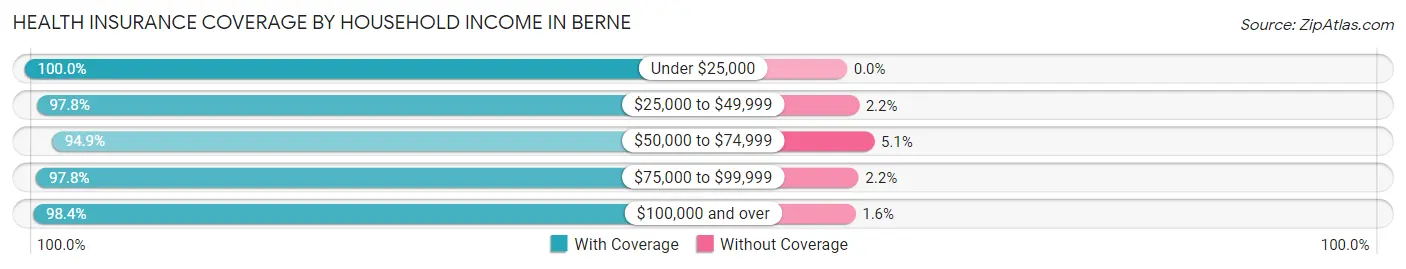
| Household Income | With Coverage | Without Coverage |
| Under $25,000 | 279 (100.0%) | 0 (0.0%) |
| $25,000 to $49,999 | 877 (97.8%) | 20 (2.2%) |
| $50,000 to $74,999 | 819 (94.9%) | 44 (5.1%) |
| $75,000 to $99,999 | 630 (97.8%) | 14 (2.2%) |
| $100,000 and over | 993 (98.4%) | 16 (1.6%) |
Public vs Private Health Insurance Coverage by Age in Berne
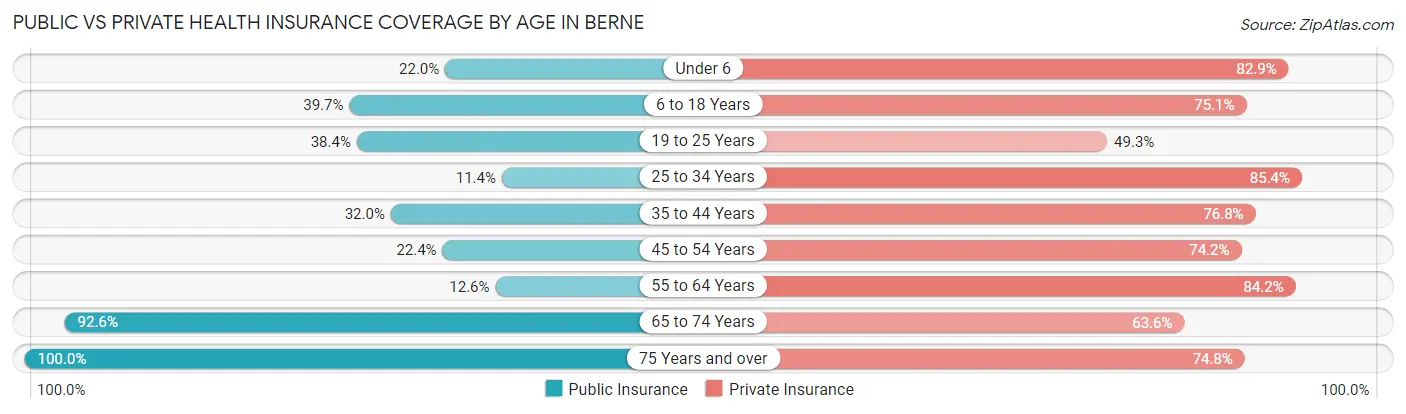
| Age Bracket | Public Insurance | Private Insurance |
| Under 6 | 63 (22.0%) | 238 (82.9%) |
| 6 to 18 Years | 319 (39.7%) | 603 (75.1%) |
| 19 to 25 Years | 130 (38.4%) | 167 (49.3%) |
| 25 to 34 Years | 50 (11.4%) | 374 (85.4%) |
| 35 to 44 Years | 149 (32.0%) | 357 (76.8%) |
| 45 to 54 Years | 79 (22.4%) | 261 (74.2%) |
| 55 to 64 Years | 52 (12.6%) | 347 (84.2%) |
| 65 to 74 Years | 249 (92.6%) | 171 (63.6%) |
| 75 Years and over | 345 (100.0%) | 258 (74.8%) |
| Total | 1,436 (38.7%) | 2,776 (74.8%) |
Disability Status by Sex by Age in Berne
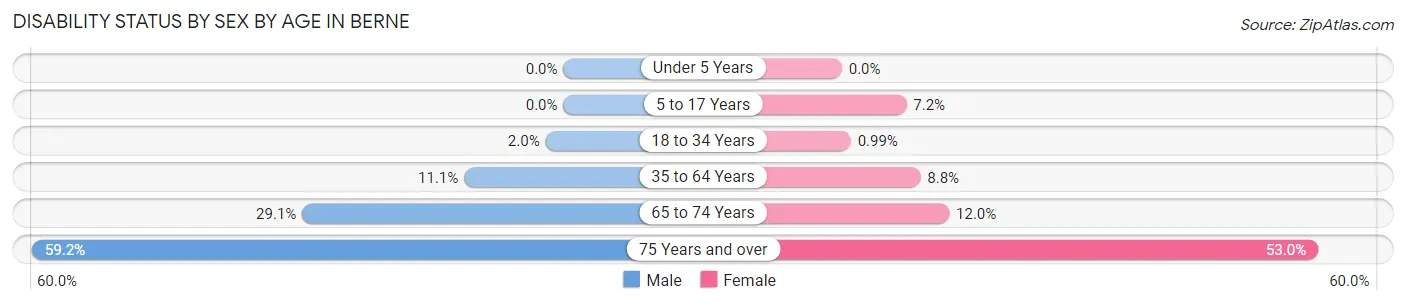
| Age Bracket | Male | Female |
| Under 5 Years | 0 (0.0%) | 0 (0.0%) |
| 5 to 17 Years | 0 (0.0%) | 33 (7.2%) |
| 18 to 34 Years | 6 (2.0%) | 5 (1.0%) |
| 35 to 64 Years | 60 (11.1%) | 60 (8.7%) |
| 65 to 74 Years | 32 (29.1%) | 19 (11.9%) |
| 75 Years and over | 87 (59.2%) | 105 (53.0%) |
Disability Class by Sex by Age in Berne
Disability Class: Hearing Difficulty
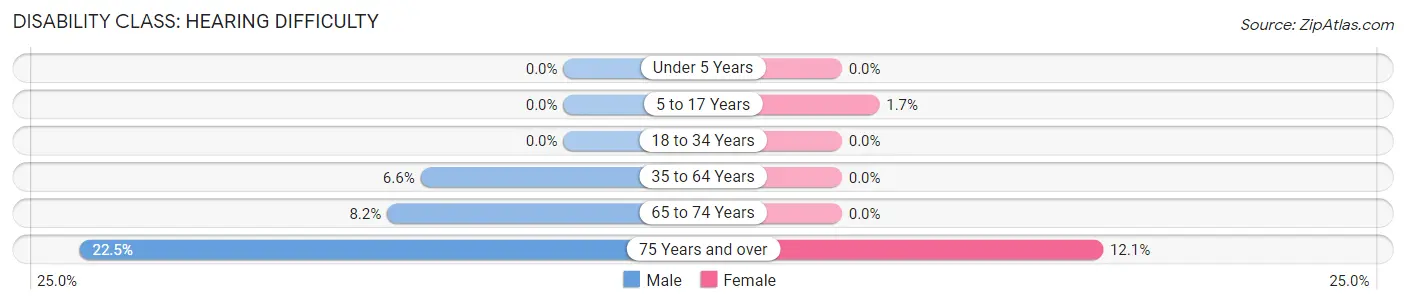
| Age Bracket | Male | Female |
| Under 5 Years | 0 (0.0%) | 0 (0.0%) |
| 5 to 17 Years | 0 (0.0%) | 8 (1.7%) |
| 18 to 34 Years | 0 (0.0%) | 0 (0.0%) |
| 35 to 64 Years | 36 (6.6%) | 0 (0.0%) |
| 65 to 74 Years | 9 (8.2%) | 0 (0.0%) |
| 75 Years and over | 33 (22.5%) | 24 (12.1%) |
Disability Class: Vision Difficulty
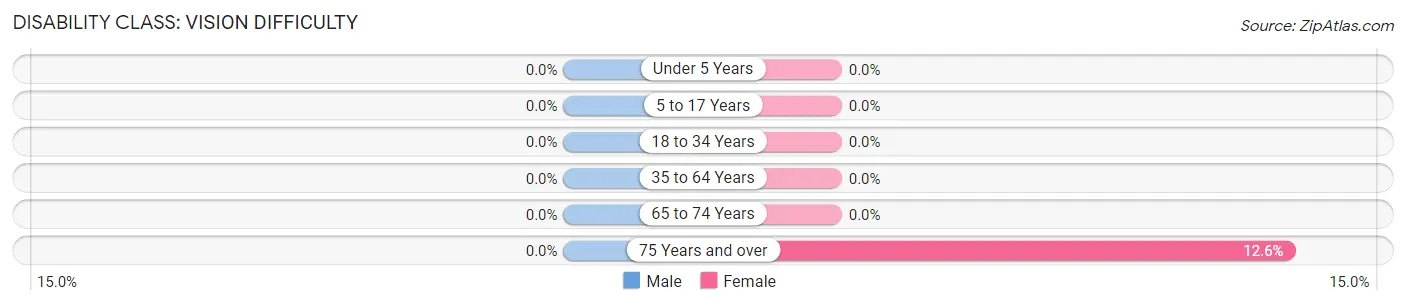
| Age Bracket | Male | Female |
| Under 5 Years | 0 (0.0%) | 0 (0.0%) |
| 5 to 17 Years | 0 (0.0%) | 0 (0.0%) |
| 18 to 34 Years | 0 (0.0%) | 0 (0.0%) |
| 35 to 64 Years | 0 (0.0%) | 0 (0.0%) |
| 65 to 74 Years | 0 (0.0%) | 0 (0.0%) |
| 75 Years and over | 0 (0.0%) | 25 (12.6%) |
Disability Class: Cognitive Difficulty
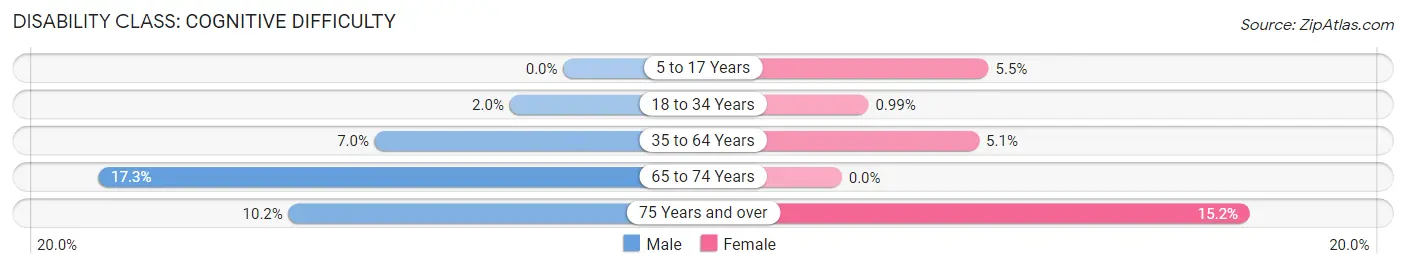
| Age Bracket | Male | Female |
| 5 to 17 Years | 0 (0.0%) | 25 (5.4%) |
| 18 to 34 Years | 6 (2.0%) | 5 (1.0%) |
| 35 to 64 Years | 38 (7.0%) | 35 (5.1%) |
| 65 to 74 Years | 19 (17.3%) | 0 (0.0%) |
| 75 Years and over | 15 (10.2%) | 30 (15.1%) |
Disability Class: Ambulatory Difficulty
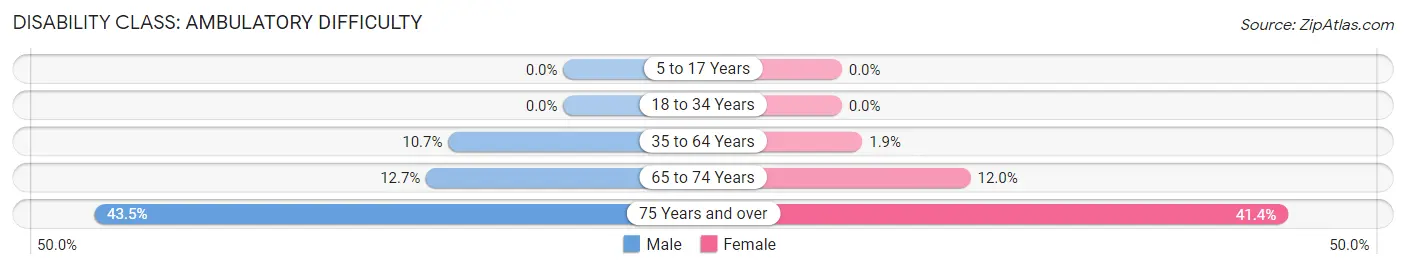
| Age Bracket | Male | Female |
| 5 to 17 Years | 0 (0.0%) | 0 (0.0%) |
| 18 to 34 Years | 0 (0.0%) | 0 (0.0%) |
| 35 to 64 Years | 58 (10.7%) | 13 (1.9%) |
| 65 to 74 Years | 14 (12.7%) | 19 (11.9%) |
| 75 Years and over | 64 (43.5%) | 82 (41.4%) |
Disability Class: Self-Care Difficulty
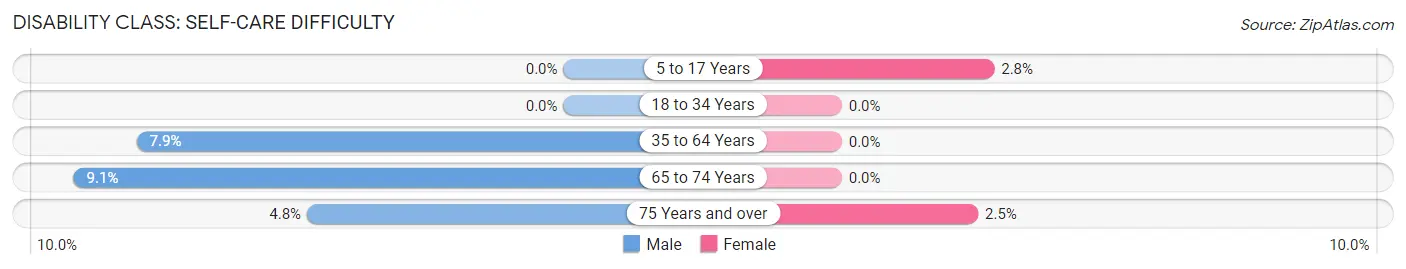
| Age Bracket | Male | Female |
| 5 to 17 Years | 0 (0.0%) | 13 (2.8%) |
| 18 to 34 Years | 0 (0.0%) | 0 (0.0%) |
| 35 to 64 Years | 43 (7.9%) | 0 (0.0%) |
| 65 to 74 Years | 10 (9.1%) | 0 (0.0%) |
| 75 Years and over | 7 (4.8%) | 5 (2.5%) |
Technology Access in Berne
Computing Device Access in Berne
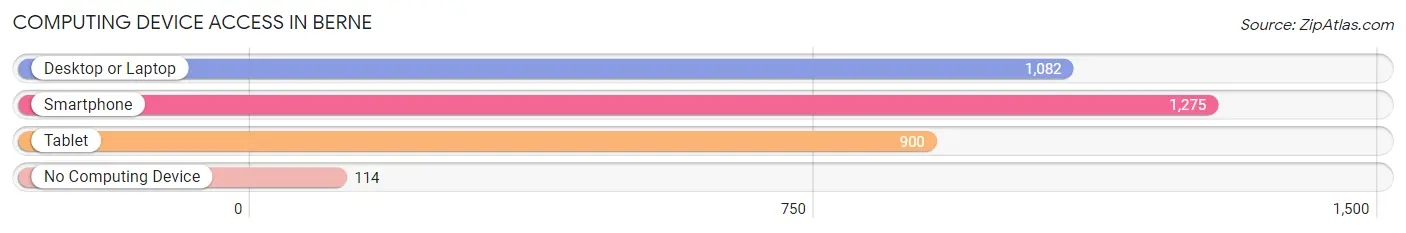
| Device Type | # Households | % Households |
| Desktop or Laptop | 1,082 | 71.6% |
| Smartphone | 1,275 | 84.4% |
| Tablet | 900 | 59.6% |
| No Computing Device | 114 | 7.5% |
| Total | 1,511 | 100.0% |
Internet Access in Berne
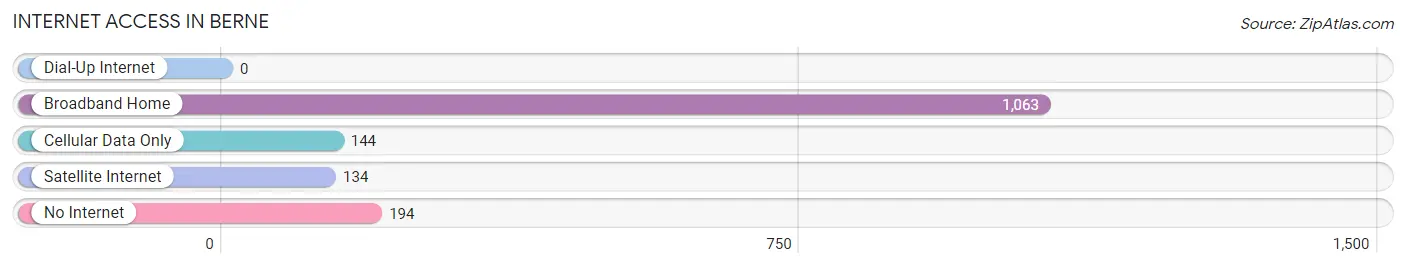
| Internet Type | # Households | % Households |
| Dial-Up Internet | 0 | 0.0% |
| Broadband Home | 1,063 | 70.4% |
| Cellular Data Only | 144 | 9.5% |
| Satellite Internet | 134 | 8.9% |
| No Internet | 194 | 12.8% |
| Total | 1,511 | 100.0% |
Berne Summary
Berne, Indiana is a small city located in Adams County, Indiana. It is the county seat of Adams County and is located in the northeastern part of the state. The city has a population of 4,637 as of the 2010 census.
Geography
Berne is located at 40°45'25"N 84°59'45"W (40.7569, -84.9958). It is situated in the northeastern part of Indiana, approximately 40 miles south of Fort Wayne and 60 miles north of Indianapolis. The city is located in the heart of the Midwest, and is surrounded by farmland. The city is situated on the banks of the Wabash River, and is part of the Wabash Valley.
The city has a total area of 2.2 square miles, all of which is land. The terrain is mostly flat, with some rolling hills. The climate is humid continental, with hot summers and cold winters.
History
Berne was founded in 1852 by Swiss immigrants. The city was named after the Swiss capital of Bern. The city was incorporated in 1867.
Berne was an important stop on the Wabash and Erie Canal, which was built in the 1840s. The canal was used to transport goods and people between the Great Lakes and the Ohio River. The canal was abandoned in the late 19th century, but the city still has a few remnants of the canal, including a lock and a few bridges.
Berne was also an important stop on the Pennsylvania Railroad, which ran through the city from 1871 to 1971. The railroad was used to transport goods and people between the East Coast and the Midwest.
Economy
Berne's economy is largely based on agriculture. The city is home to several large farms, and the surrounding area is known for its production of corn, soybeans, and wheat.
The city is also home to several manufacturing companies, including a furniture manufacturer, a plastics manufacturer, and a metal fabrication company.
Demographics
As of the 2010 census, Berne had a population of 4,637. The racial makeup of the city was 97.2% White, 0.7% African American, 0.3% Native American, 0.3% Asian, 0.2% from other races, and 1.5% from two or more races. Hispanic or Latino of any race were 1.2% of the population.
The median income for a household in the city was $41,944, and the median income for a family was $50,938. The per capita income for the city was $20,845. About 8.2% of families and 10.2% of the population were below the poverty line, including 14.2% of those under age 18 and 8.2% of those age 65 or over.
Berne is served by the South Adams School Corporation, which consists of three elementary schools, one middle school, and one high school. The city also has a public library, a hospital, and several churches.
Common Questions
What is Per Capita Income in Berne?
Per Capita income in Berne is $26,682.
What is the Median Family Income in Berne?
Median Family Income in Berne is $75,625.
What is the Median Household income in Berne?
Median Household Income in Berne is $55,223.
What is Income or Wage Gap in Berne?
Income or Wage Gap in Berne is 38.0%.
Women in Berne earn 62.0 cents for every dollar earned by a man.
What is Family Income Deficit in Berne?
Family Income Deficit in Berne is $2,134.
Families that are below poverty line in Berne earn $2,134 less on average than the poverty threshold level.
What is Inequality or Gini Index in Berne?
Inequality or Gini Index in Berne is 0.35.
What is the Total Population of Berne?
Total Population of Berne is 3,926.
What is the Total Male Population of Berne?
Total Male Population of Berne is 1,611.
What is the Total Female Population of Berne?
Total Female Population of Berne is 2,315.
What is the Ratio of Males per 100 Females in Berne?
There are 69.59 Males per 100 Females in Berne.
What is the Ratio of Females per 100 Males in Berne?
There are 143.70 Females per 100 Males in Berne.
What is the Median Population Age in Berne?
Median Population Age in Berne is 38.5 Years.
What is the Average Family Size in Berne
Average Family Size in Berne is 3.2 People.
What is the Average Household Size in Berne
Average Household Size in Berne is 2.4 People.
How Large is the Labor Force in Berne?
There are 1,829 People in the Labor Forcein in Berne.
What is the Percentage of People in the Labor Force in Berne?
61.6% of People are in the Labor Force in Berne.
What is the Unemployment Rate in Berne?
Unemployment Rate in Berne is 4.4%.