Thomasville, NC Map & Demographics
Thomasville Map
Thomasville Overview
$25,013
PER CAPITA INCOME
$64,227
AVG FAMILY INCOME
$48,457
AVG HOUSEHOLD INCOME
25.6%
WAGE / INCOME GAP [ % ]
74.4¢/ $1
WAGE / INCOME GAP [ $ ]
0.42
INEQUALITY / GINI INDEX
27,130
TOTAL POPULATION
12,401
MALE POPULATION
14,729
FEMALE POPULATION
84.19
MALES / 100 FEMALES
118.77
FEMALES / 100 MALES
37.8
MEDIAN AGE
3.0
AVG FAMILY SIZE
2.5
AVG HOUSEHOLD SIZE
12,528
LABOR FORCE [ PEOPLE ]
58.6%
PERCENT IN LABOR FORCE
5.2%
UNEMPLOYMENT RATE
Thomasville Zip Codes
Thomasville Area Codes
Income in Thomasville
Income Overview in Thomasville
Per Capita Income in Thomasville is $25,013, while median incomes of families and households are $64,227 and $48,457 respectively.
| Characteristic | Number | Measure |
| Per Capita Income | 27,130 | $25,013 |
| Median Family Income | 7,251 | $64,227 |
| Mean Family Income | 7,251 | $68,362 |
| Median Household Income | 10,786 | $48,457 |
| Mean Household Income | 10,786 | $62,149 |
| Income Deficit | 7,251 | $0 |
| Wage / Income Gap (%) | 27,130 | 25.56% |
| Wage / Income Gap ($) | 27,130 | 74.44¢ per $1 |
| Gini / Inequality Index | 27,130 | 0.42 |
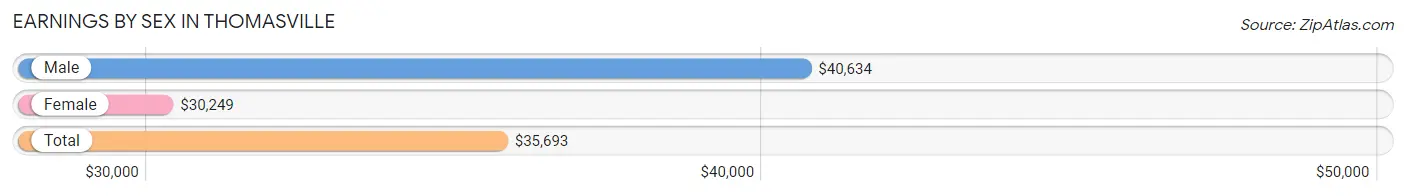
Earnings by Sex in Thomasville
Average Earnings in Thomasville are $35,693, $40,634 for men and $30,249 for women, a difference of 25.6%.
| Sex | Number | Average Earnings |
| Male | 6,886 (53.2%) | $40,634 |
| Female | 6,050 (46.8%) | $30,249 |
| Total | 12,936 (100.0%) | $35,693 |
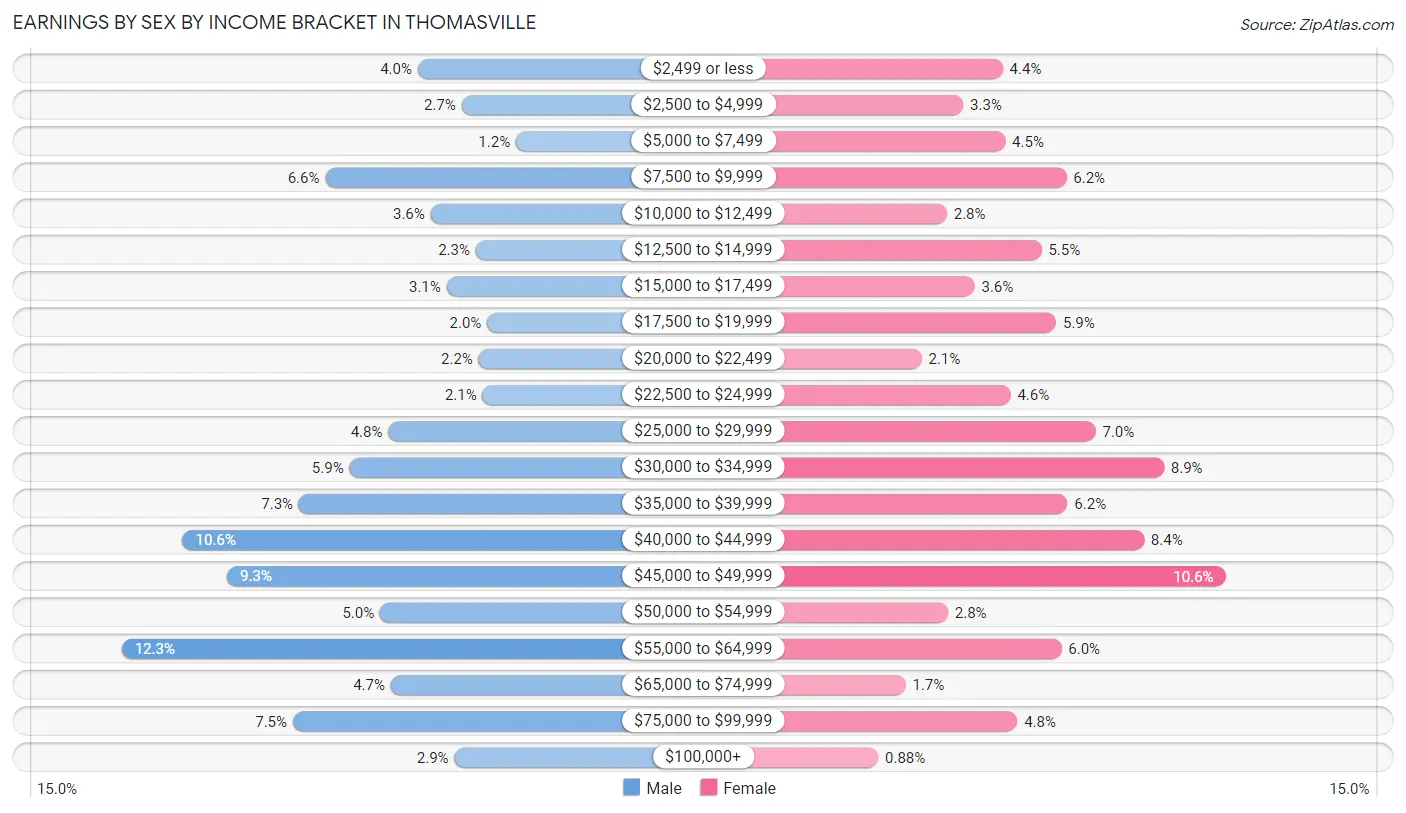
Earnings by Sex by Income Bracket in Thomasville
The most common earnings brackets in Thomasville are $55,000 to $64,999 for men (845 | 12.3%) and $45,000 to $49,999 for women (644 | 10.6%).
| Income | Male | Female |
| $2,499 or less | 272 (4.0%) | 265 (4.4%) |
| $2,500 to $4,999 | 187 (2.7%) | 198 (3.3%) |
| $5,000 to $7,499 | 82 (1.2%) | 269 (4.4%) |
| $7,500 to $9,999 | 451 (6.6%) | 373 (6.2%) |
| $10,000 to $12,499 | 247 (3.6%) | 170 (2.8%) |
| $12,500 to $14,999 | 160 (2.3%) | 331 (5.5%) |
| $15,000 to $17,499 | 216 (3.1%) | 217 (3.6%) |
| $17,500 to $19,999 | 138 (2.0%) | 356 (5.9%) |
| $20,000 to $22,499 | 154 (2.2%) | 127 (2.1%) |
| $22,500 to $24,999 | 147 (2.1%) | 278 (4.6%) |
| $25,000 to $29,999 | 329 (4.8%) | 423 (7.0%) |
| $30,000 to $34,999 | 404 (5.9%) | 539 (8.9%) |
| $35,000 to $39,999 | 502 (7.3%) | 375 (6.2%) |
| $40,000 to $44,999 | 727 (10.6%) | 505 (8.4%) |
| $45,000 to $49,999 | 641 (9.3%) | 644 (10.6%) |
| $50,000 to $54,999 | 345 (5.0%) | 172 (2.8%) |
| $55,000 to $64,999 | 845 (12.3%) | 365 (6.0%) |
| $65,000 to $74,999 | 324 (4.7%) | 100 (1.7%) |
| $75,000 to $99,999 | 514 (7.5%) | 290 (4.8%) |
| $100,000+ | 201 (2.9%) | 53 (0.9%) |
| Total | 6,886 (100.0%) | 6,050 (100.0%) |
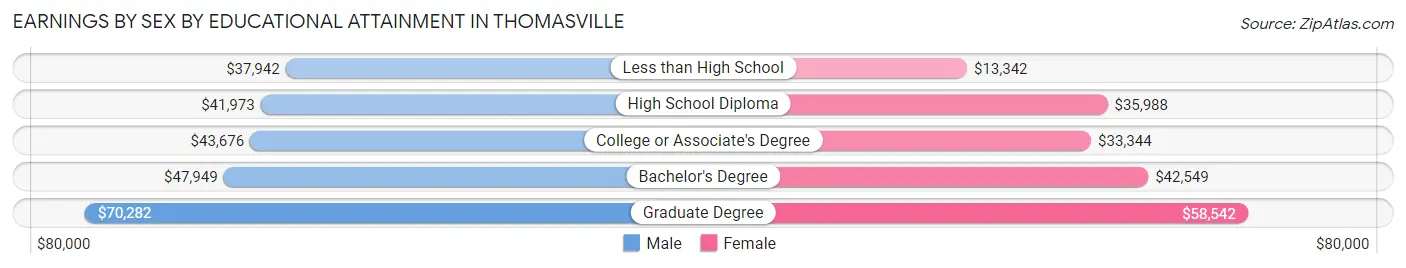
Earnings by Sex by Educational Attainment in Thomasville
Average earnings in Thomasville are $42,275 for men and $33,994 for women, a difference of 19.6%. Men with an educational attainment of graduate degree enjoy the highest average annual earnings of $70,282, while those with less than high school education earn the least with $37,942. Women with an educational attainment of graduate degree earn the most with the average annual earnings of $58,542, while those with less than high school education have the smallest earnings of $13,342.
| Educational Attainment | Male Income | Female Income |
| Less than High School | $37,942 | $13,342 |
| High School Diploma | $41,973 | $35,988 |
| College or Associate's Degree | $43,676 | $33,344 |
| Bachelor's Degree | $47,949 | $42,549 |
| Graduate Degree | $70,282 | $58,542 |
| Total | $42,275 | $33,994 |
Family Income in Thomasville
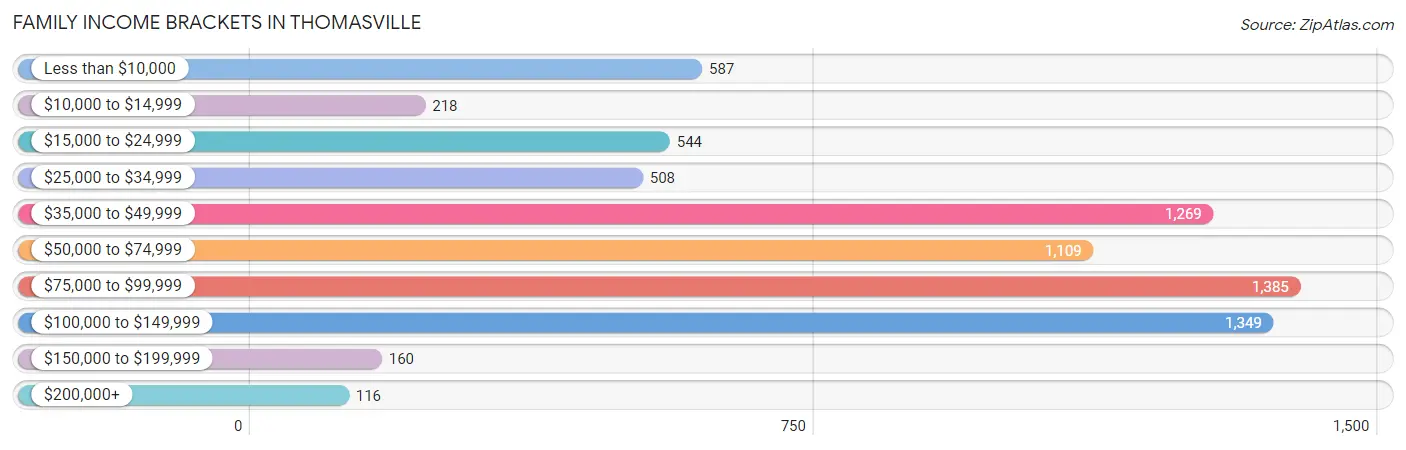
Family Income Brackets in Thomasville
According to the Thomasville family income data, there are 1,385 families falling into the $75,000 to $99,999 income range, which is the most common income bracket and makes up 19.1% of all families. Conversely, the $200,000+ income bracket is the least frequent group with only 116 families (1.6%) belonging to this category.
| Income Bracket | # Families | % Families |
| Less than $10,000 | 587 | 8.1% |
| $10,000 to $14,999 | 218 | 3.0% |
| $15,000 to $24,999 | 544 | 7.5% |
| $25,000 to $34,999 | 508 | 7.0% |
| $35,000 to $49,999 | 1,269 | 17.5% |
| $50,000 to $74,999 | 1,109 | 15.3% |
| $75,000 to $99,999 | 1,385 | 19.1% |
| $100,000 to $149,999 | 1,349 | 18.6% |
| $150,000 to $199,999 | 160 | 2.2% |
| $200,000+ | 116 | 1.6% |
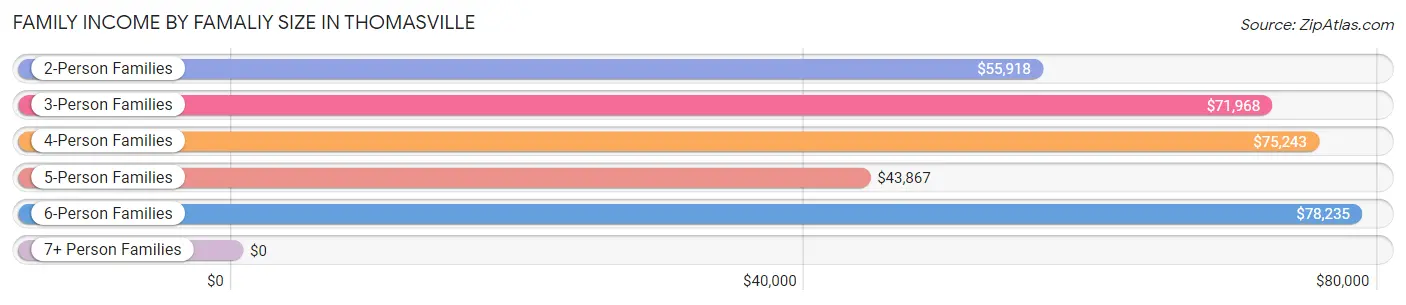
Family Income by Famaliy Size in Thomasville
6-person families (310 | 4.3%) account for the highest median family income in Thomasville with $78,235 per family, while 2-person families (3,772 | 52.0%) have the highest median income of $27,959 per family member.
| Income Bracket | # Families | Median Income |
| 2-Person Families | 3,772 (52.0%) | $55,918 |
| 3-Person Families | 1,414 (19.5%) | $71,968 |
| 4-Person Families | 1,235 (17.0%) | $75,243 |
| 5-Person Families | 520 (7.2%) | $43,867 |
| 6-Person Families | 310 (4.3%) | $78,235 |
| 7+ Person Families | 0 (0.0%) | $0 |
| Total | 7,251 (100.0%) | $64,227 |
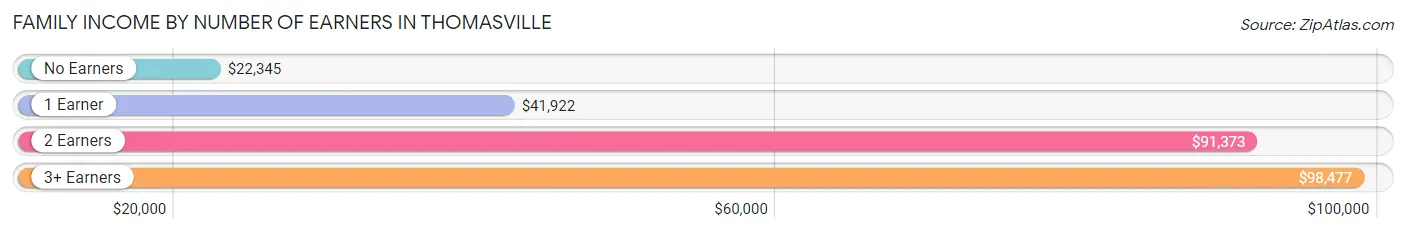
Family Income by Number of Earners in Thomasville
The median family income in Thomasville is $64,227, with families comprising 3+ earners (718) having the highest median family income of $98,477, while families with no earners (1,212) have the lowest median family income of $22,345, accounting for 9.9% and 16.7% of families, respectively.
| Number of Earners | # Families | Median Income |
| No Earners | 1,212 (16.7%) | $22,345 |
| 1 Earner | 3,016 (41.6%) | $41,922 |
| 2 Earners | 2,305 (31.8%) | $91,373 |
| 3+ Earners | 718 (9.9%) | $98,477 |
| Total | 7,251 (100.0%) | $64,227 |
Household Income in Thomasville
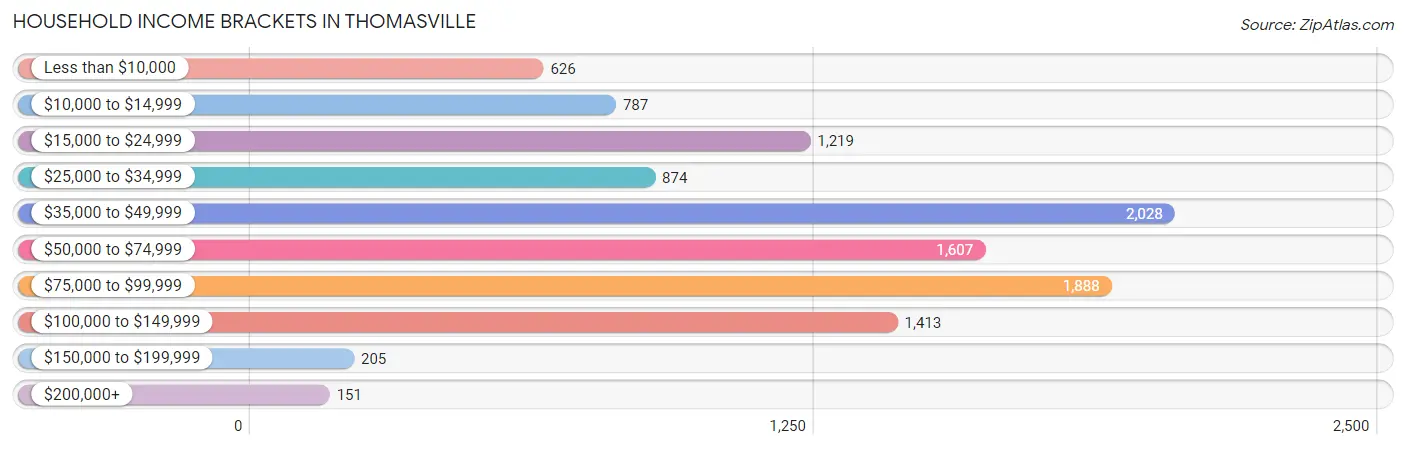
Household Income Brackets in Thomasville
With 2,028 households falling in the category, the $35,000 to $49,999 income range is the most frequent in Thomasville, accounting for 18.8% of all households. In contrast, only 151 households (1.4%) fall into the $200,000+ income bracket, making it the least populous group.
| Income Bracket | # Households | % Households |
| Less than $10,000 | 626 | 5.8% |
| $10,000 to $14,999 | 787 | 7.3% |
| $15,000 to $24,999 | 1,219 | 11.3% |
| $25,000 to $34,999 | 874 | 8.1% |
| $35,000 to $49,999 | 2,028 | 18.8% |
| $50,000 to $74,999 | 1,607 | 14.9% |
| $75,000 to $99,999 | 1,888 | 17.5% |
| $100,000 to $149,999 | 1,413 | 13.1% |
| $150,000 to $199,999 | 205 | 1.9% |
| $200,000+ | 151 | 1.4% |
Household Income by Householder Age in Thomasville
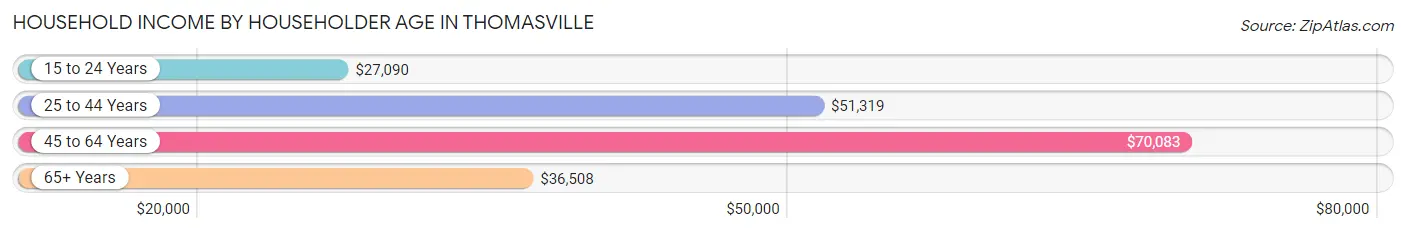
The median household income in Thomasville is $48,457, with the highest median household income of $70,083 found in the 45 to 64 years age bracket for the primary householder. A total of 3,905 households (36.2%) fall into this category. Meanwhile, the 15 to 24 years age bracket for the primary householder has the lowest median household income of $27,090, with 581 households (5.4%) in this group.
| Income Bracket | # Households | Median Income |
| 15 to 24 Years | 581 (5.4%) | $27,090 |
| 25 to 44 Years | 3,182 (29.5%) | $51,319 |
| 45 to 64 Years | 3,905 (36.2%) | $70,083 |
| 65+ Years | 3,118 (28.9%) | $36,508 |
| Total | 10,786 (100.0%) | $48,457 |
Poverty in Thomasville
Income Below Poverty by Sex and Age in Thomasville
With 13.2% poverty level for males and 27.0% for females among the residents of Thomasville, 12 to 14 year old males and 5 year old females are the most vulnerable to poverty, with 142 males (29.6%) and 141 females (53.2%) in their respective age groups living below the poverty level.
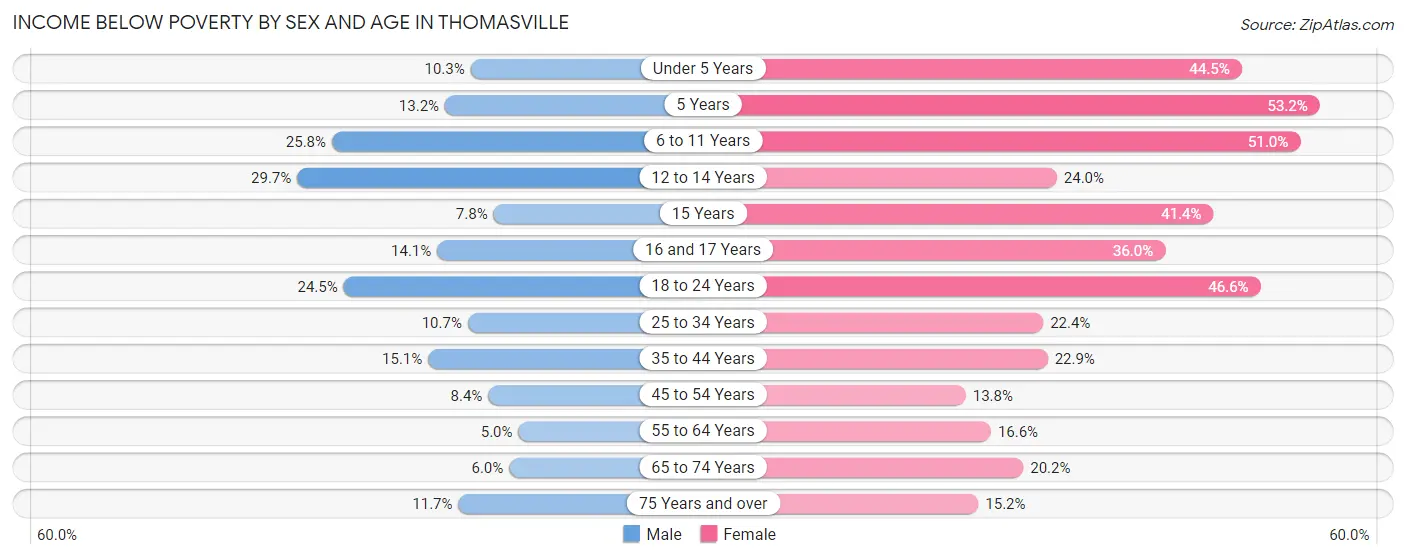
| Age Bracket | Male | Female |
| Under 5 Years | 63 (10.3%) | 573 (44.5%) |
| 5 Years | 31 (13.2%) | 141 (53.2%) |
| 6 to 11 Years | 222 (25.8%) | 540 (51.0%) |
| 12 to 14 Years | 142 (29.6%) | 143 (23.9%) |
| 15 Years | 7 (7.8%) | 36 (41.4%) |
| 16 and 17 Years | 62 (14.1%) | 126 (36.0%) |
| 18 to 24 Years | 292 (24.5%) | 566 (46.6%) |
| 25 to 34 Years | 192 (10.6%) | 421 (22.4%) |
| 35 to 44 Years | 243 (15.1%) | 337 (22.9%) |
| 45 to 54 Years | 126 (8.4%) | 232 (13.8%) |
| 55 to 64 Years | 81 (5.0%) | 318 (16.6%) |
| 65 to 74 Years | 64 (6.0%) | 233 (20.2%) |
| 75 Years and over | 81 (11.7%) | 218 (15.2%) |
| Total | 1,606 (13.2%) | 3,884 (27.0%) |
Income Above Poverty by Sex and Age in Thomasville
According to the poverty statistics in Thomasville, males aged 55 to 64 years and females aged 45 to 54 years are the age groups that are most secure financially, with 95.0% of males and 86.2% of females in these age groups living above the poverty line.
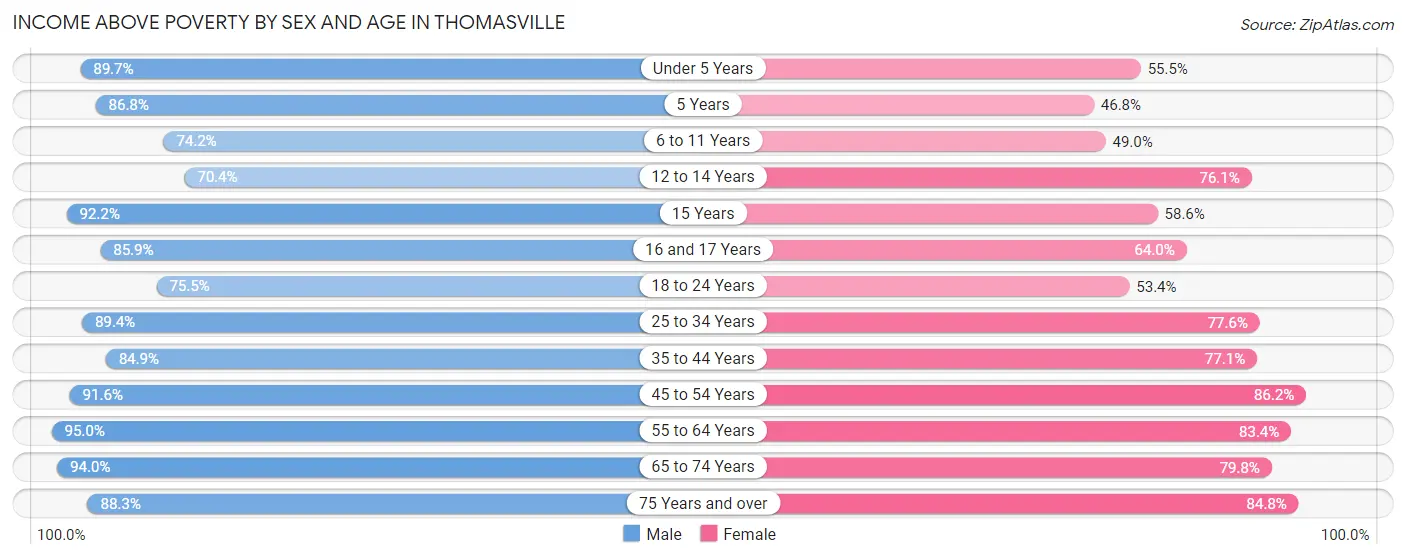
| Age Bracket | Male | Female |
| Under 5 Years | 546 (89.7%) | 714 (55.5%) |
| 5 Years | 204 (86.8%) | 124 (46.8%) |
| 6 to 11 Years | 639 (74.2%) | 518 (49.0%) |
| 12 to 14 Years | 337 (70.4%) | 454 (76.0%) |
| 15 Years | 83 (92.2%) | 51 (58.6%) |
| 16 and 17 Years | 379 (85.9%) | 224 (64.0%) |
| 18 to 24 Years | 901 (75.5%) | 648 (53.4%) |
| 25 to 34 Years | 1,611 (89.3%) | 1,456 (77.6%) |
| 35 to 44 Years | 1,371 (84.9%) | 1,133 (77.1%) |
| 45 to 54 Years | 1,379 (91.6%) | 1,448 (86.2%) |
| 55 to 64 Years | 1,536 (95.0%) | 1,597 (83.4%) |
| 65 to 74 Years | 995 (94.0%) | 920 (79.8%) |
| 75 Years and over | 612 (88.3%) | 1,215 (84.8%) |
| Total | 10,593 (86.8%) | 10,502 (73.0%) |
Income Below Poverty Among Married-Couple Families in Thomasville
The poverty statistics for married-couple families in Thomasville show that 7.6% or 343 of the total 4,515 families live below the poverty line. Families with 3 or 4 children have the highest poverty rate of 32.5%, comprising of 118 families. On the other hand, families with no children have the lowest poverty rate of 4.6%, which includes 125 families.
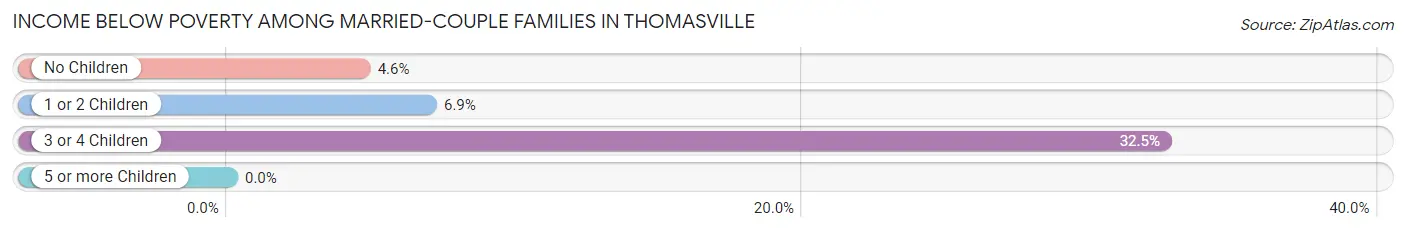
| Children | Above Poverty | Below Poverty |
| No Children | 2,583 (95.4%) | 125 (4.6%) |
| 1 or 2 Children | 1,344 (93.1%) | 100 (6.9%) |
| 3 or 4 Children | 245 (67.5%) | 118 (32.5%) |
| 5 or more Children | 0 (0.0%) | 0 (0.0%) |
| Total | 4,172 (92.4%) | 343 (7.6%) |
Income Below Poverty Among Single-Parent Households in Thomasville
According to the poverty data in Thomasville, 8.4% or 79 single-father households and 49.9% or 896 single-mother households are living below the poverty line. Among single-father households, those with 1 or 2 children have the highest poverty rate, with 79 households (23.9%) experiencing poverty. Likewise, among single-mother households, those with 3 or 4 children have the highest poverty rate, with 162 households (70.4%) falling below the poverty line.
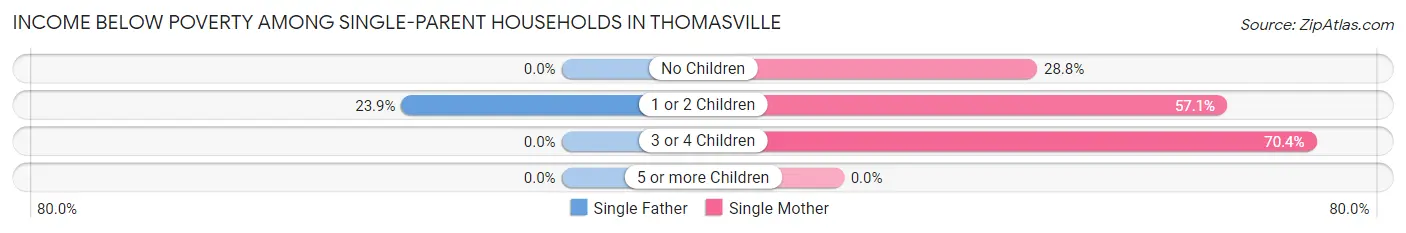
| Children | Single Father | Single Mother |
| No Children | 0 (0.0%) | 164 (28.8%) |
| 1 or 2 Children | 79 (23.9%) | 570 (57.1%) |
| 3 or 4 Children | 0 (0.0%) | 162 (70.4%) |
| 5 or more Children | 0 (0.0%) | 0 (0.0%) |
| Total | 79 (8.4%) | 896 (49.9%) |
Income Below Poverty Among Married-Couple vs Single-Parent Households in Thomasville
The poverty data for Thomasville shows that 343 of the married-couple family households (7.6%) and 975 of the single-parent households (35.6%) are living below the poverty level. Within the married-couple family households, those with 3 or 4 children have the highest poverty rate, with 118 households (32.5%) falling below the poverty line. Among the single-parent households, those with 3 or 4 children have the highest poverty rate, with 162 household (54.2%) living below poverty.
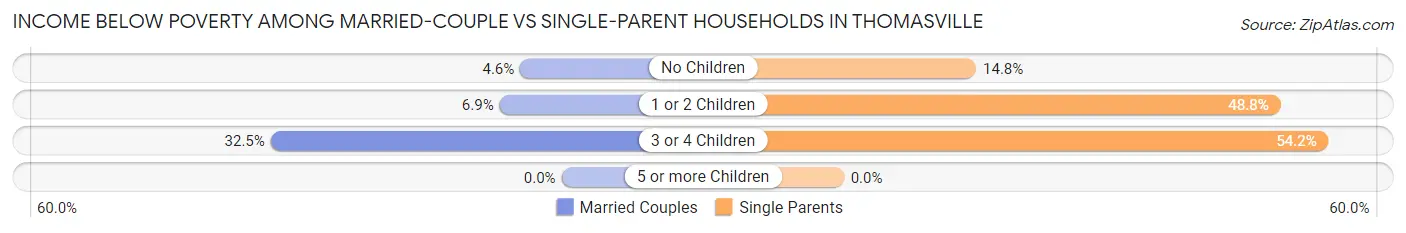
| Children | Married-Couple Families | Single-Parent Households |
| No Children | 125 (4.6%) | 164 (14.8%) |
| 1 or 2 Children | 100 (6.9%) | 649 (48.8%) |
| 3 or 4 Children | 118 (32.5%) | 162 (54.2%) |
| 5 or more Children | 0 (0.0%) | 0 (0.0%) |
| Total | 343 (7.6%) | 975 (35.6%) |
Race in Thomasville
The most populous races in Thomasville are White / Caucasian (18,173 | 67.0%), Black / African American (4,863 | 17.9%), and Hispanic or Latino (4,375 | 16.1%).
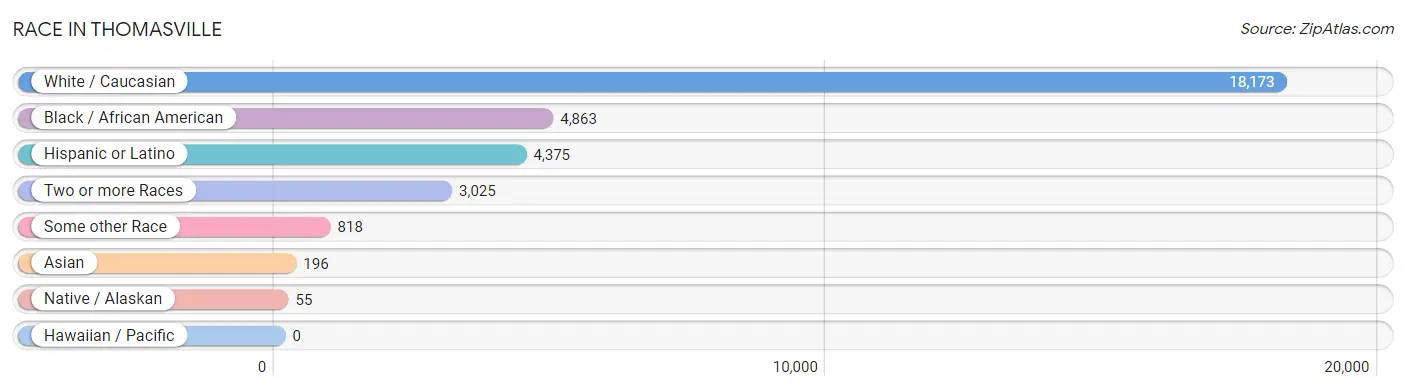
| Race | # Population | % Population |
| Asian | 196 | 0.7% |
| Black / African American | 4,863 | 17.9% |
| Hawaiian / Pacific | 0 | 0.0% |
| Hispanic or Latino | 4,375 | 16.1% |
| Native / Alaskan | 55 | 0.2% |
| White / Caucasian | 18,173 | 67.0% |
| Two or more Races | 3,025 | 11.2% |
| Some other Race | 818 | 3.0% |
| Total | 27,130 | 100.0% |
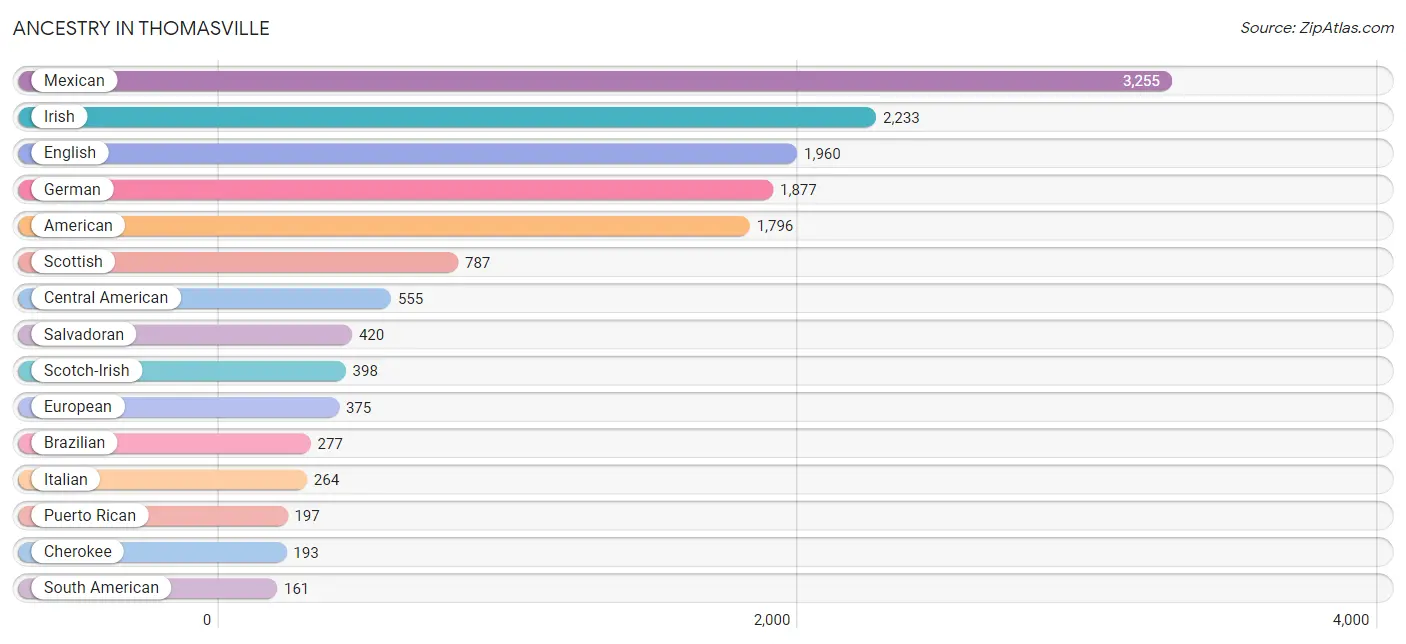
Ancestry in Thomasville
The most populous ancestries reported in Thomasville are Mexican (3,255 | 12.0%), Irish (2,233 | 8.2%), English (1,960 | 7.2%), German (1,877 | 6.9%), and American (1,796 | 6.6%), together accounting for 41.0% of all Thomasville residents.
| Ancestry | # Population | % Population |
| African | 135 | 0.5% |
| American | 1,796 | 6.6% |
| Arab | 7 | 0.0% |
| Austrian | 9 | 0.0% |
| Belgian | 6 | 0.0% |
| Bhutanese | 38 | 0.1% |
| Brazilian | 277 | 1.0% |
| British | 25 | 0.1% |
| Canadian | 16 | 0.1% |
| Central American | 555 | 2.1% |
| Cherokee | 193 | 0.7% |
| Chippewa | 10 | 0.0% |
| Colombian | 158 | 0.6% |
| Czech | 9 | 0.0% |
| Danish | 8 | 0.0% |
| Dominican | 23 | 0.1% |
| Dutch | 130 | 0.5% |
| Eastern European | 29 | 0.1% |
| Egyptian | 7 | 0.0% |
| English | 1,960 | 7.2% |
| European | 375 | 1.4% |
| Finnish | 123 | 0.4% |
| French | 144 | 0.5% |
| French Canadian | 14 | 0.1% |
| German | 1,877 | 6.9% |
| Guatemalan | 34 | 0.1% |
| Honduran | 85 | 0.3% |
| Indian (Asian) | 38 | 0.1% |
| Irish | 2,233 | 8.2% |
| Iroquois | 4 | 0.0% |
| Italian | 264 | 1.0% |
| Korean | 88 | 0.3% |
| Lithuanian | 9 | 0.0% |
| Lumbee | 41 | 0.2% |
| Malaysian | 60 | 0.2% |
| Mexican | 3,255 | 12.0% |
| Mexican American Indian | 37 | 0.1% |
| Norwegian | 56 | 0.2% |
| Pakistani | 16 | 0.1% |
| Panamanian | 16 | 0.1% |
| Peruvian | 3 | 0.0% |
| Polish | 75 | 0.3% |
| Portuguese | 117 | 0.4% |
| Puerto Rican | 197 | 0.7% |
| Romanian | 27 | 0.1% |
| Salvadoran | 420 | 1.5% |
| Scandinavian | 95 | 0.4% |
| Scotch-Irish | 398 | 1.5% |
| Scottish | 787 | 2.9% |
| South American | 161 | 0.6% |
| Sri Lankan | 120 | 0.4% |
| Subsaharan African | 135 | 0.5% |
| Swedish | 23 | 0.1% |
| Ukrainian | 53 | 0.2% |
| Welsh | 107 | 0.4% |
| West Indian | 144 | 0.5% | View All 56 Rows |
Immigrants in Thomasville
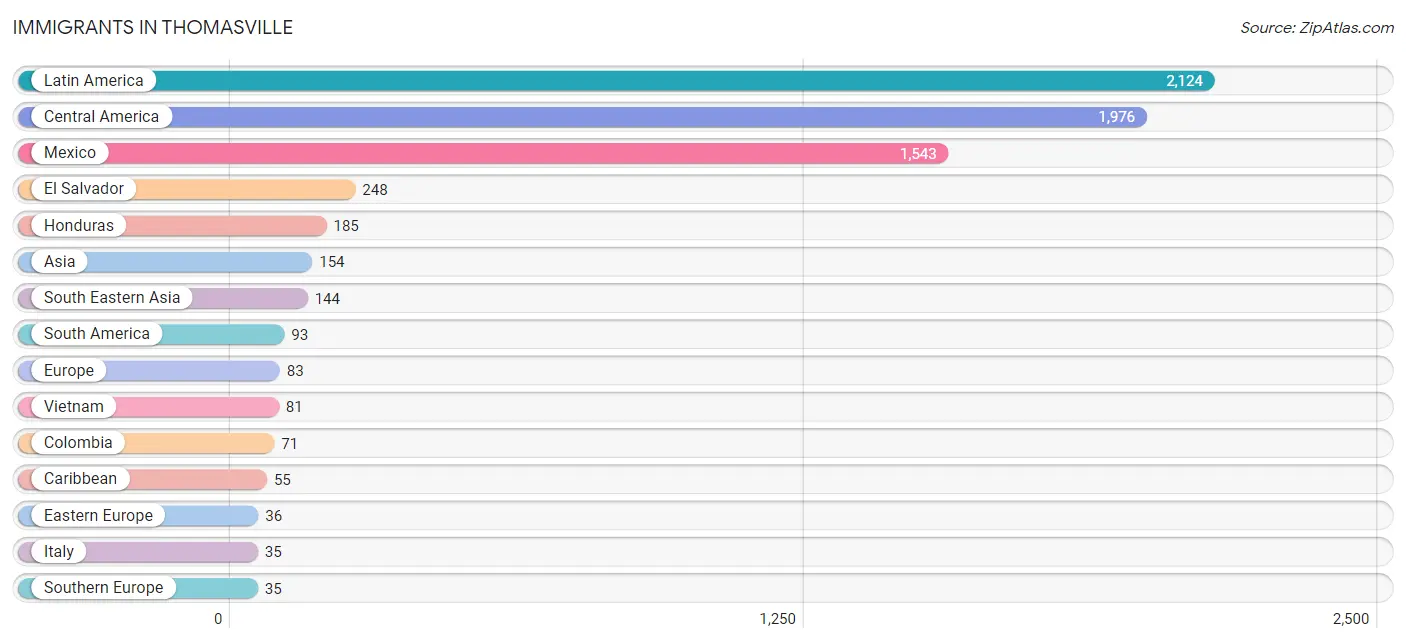
The most numerous immigrant groups reported in Thomasville came from Latin America (2,124 | 7.8%), Central America (1,976 | 7.3%), Mexico (1,543 | 5.7%), El Salvador (248 | 0.9%), and Honduras (185 | 0.7%), together accounting for 22.4% of all Thomasville residents.
| Immigration Origin | # Population | % Population |
| Africa | 7 | 0.0% |
| Asia | 154 | 0.6% |
| Cambodia | 18 | 0.1% |
| Canada | 16 | 0.1% |
| Caribbean | 55 | 0.2% |
| Central America | 1,976 | 7.3% |
| China | 10 | 0.0% |
| Colombia | 71 | 0.3% |
| Dominican Republic | 23 | 0.1% |
| Eastern Asia | 10 | 0.0% |
| Eastern Europe | 36 | 0.1% |
| Egypt | 7 | 0.0% |
| El Salvador | 248 | 0.9% |
| Europe | 83 | 0.3% |
| Germany | 7 | 0.0% |
| Guyana | 19 | 0.1% |
| Honduras | 185 | 0.7% |
| Italy | 35 | 0.1% |
| Latin America | 2,124 | 7.8% |
| Mexico | 1,543 | 5.7% |
| Northern Africa | 7 | 0.0% |
| Northern Europe | 5 | 0.0% |
| Peru | 3 | 0.0% |
| Philippines | 20 | 0.1% |
| Poland | 20 | 0.1% |
| Scotland | 5 | 0.0% |
| South America | 93 | 0.3% |
| South Eastern Asia | 144 | 0.5% |
| Southern Europe | 35 | 0.1% |
| St. Vincent and the Grenadines | 32 | 0.1% |
| Thailand | 25 | 0.1% |
| Ukraine | 16 | 0.1% |
| Vietnam | 81 | 0.3% |
| Western Europe | 7 | 0.0% | View All 34 Rows |
Sex and Age in Thomasville
Sex and Age in Thomasville
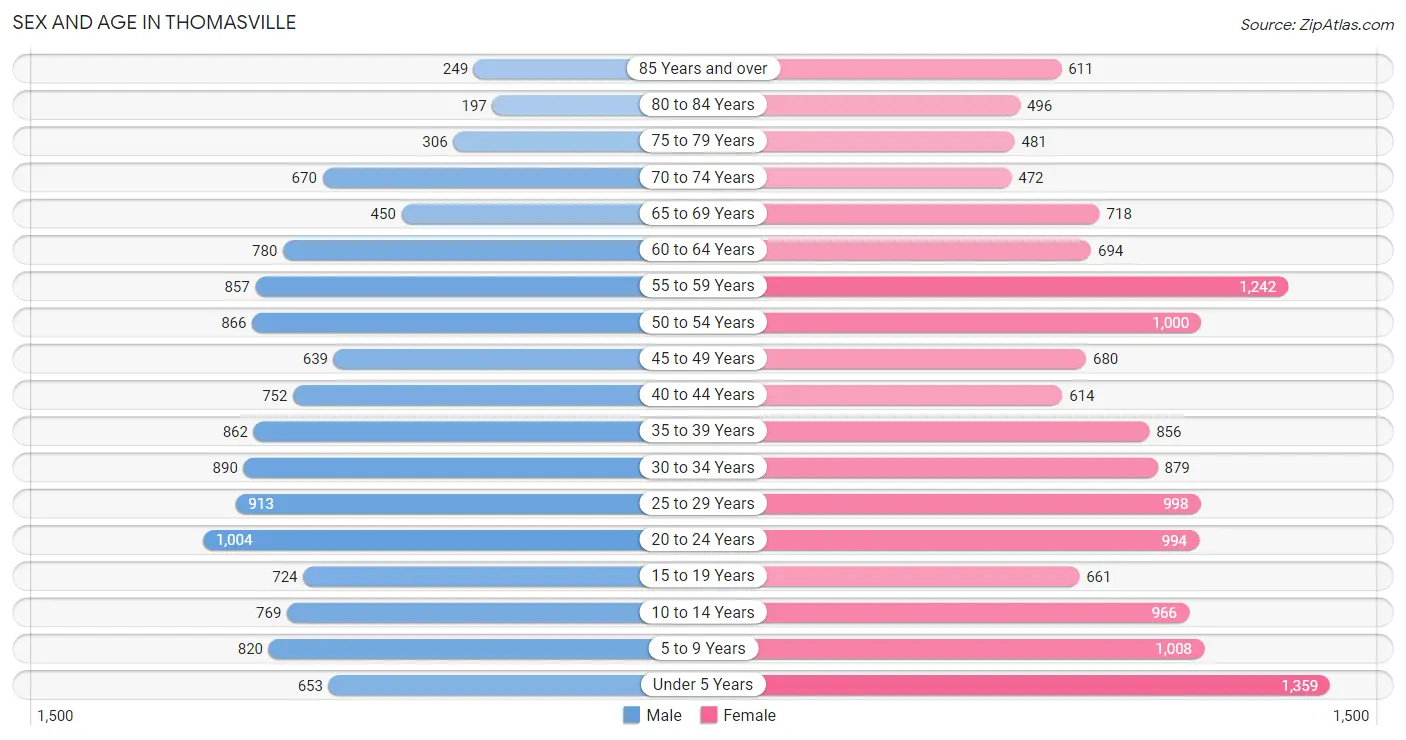
The most populous age groups in Thomasville are 20 to 24 Years (1,004 | 8.1%) for men and Under 5 Years (1,359 | 9.2%) for women.
| Age Bracket | Male | Female |
| Under 5 Years | 653 (5.3%) | 1,359 (9.2%) |
| 5 to 9 Years | 820 (6.6%) | 1,008 (6.8%) |
| 10 to 14 Years | 769 (6.2%) | 966 (6.6%) |
| 15 to 19 Years | 724 (5.8%) | 661 (4.5%) |
| 20 to 24 Years | 1,004 (8.1%) | 994 (6.8%) |
| 25 to 29 Years | 913 (7.4%) | 998 (6.8%) |
| 30 to 34 Years | 890 (7.2%) | 879 (6.0%) |
| 35 to 39 Years | 862 (7.0%) | 856 (5.8%) |
| 40 to 44 Years | 752 (6.1%) | 614 (4.2%) |
| 45 to 49 Years | 639 (5.1%) | 680 (4.6%) |
| 50 to 54 Years | 866 (7.0%) | 1,000 (6.8%) |
| 55 to 59 Years | 857 (6.9%) | 1,242 (8.4%) |
| 60 to 64 Years | 780 (6.3%) | 694 (4.7%) |
| 65 to 69 Years | 450 (3.6%) | 718 (4.9%) |
| 70 to 74 Years | 670 (5.4%) | 472 (3.2%) |
| 75 to 79 Years | 306 (2.5%) | 481 (3.3%) |
| 80 to 84 Years | 197 (1.6%) | 496 (3.4%) |
| 85 Years and over | 249 (2.0%) | 611 (4.2%) |
| Total | 12,401 (100.0%) | 14,729 (100.0%) |
Families and Households in Thomasville
Median Family Size in Thomasville
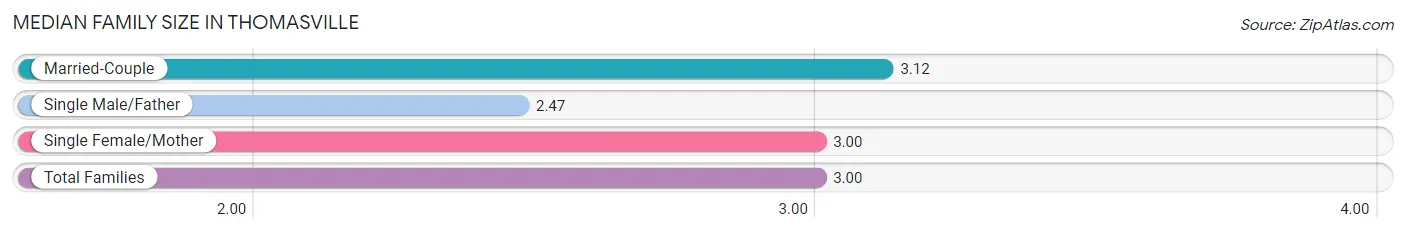
The median family size in Thomasville is 3.00 persons per family, with married-couple families (4,515 | 62.3%) accounting for the largest median family size of 3.12 persons per family. On the other hand, single male/father families (939 | 13.0%) represent the smallest median family size with 2.47 persons per family.
| Family Type | # Families | Family Size |
| Married-Couple | 4,515 (62.3%) | 3.12 |
| Single Male/Father | 939 (13.0%) | 2.47 |
| Single Female/Mother | 1,797 (24.8%) | 3.00 |
| Total Families | 7,251 (100.0%) | 3.00 |
Median Household Size in Thomasville
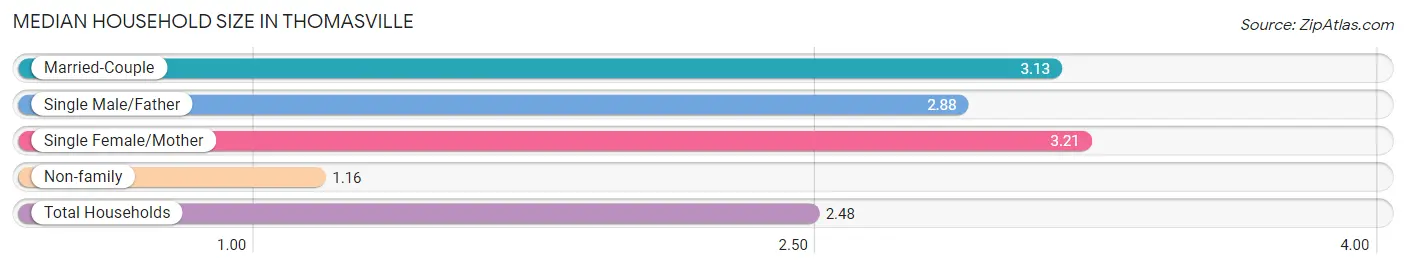
The median household size in Thomasville is 2.48 persons per household, with single female/mother households (1,797 | 16.7%) accounting for the largest median household size of 3.21 persons per household. non-family households (3,535 | 32.8%) represent the smallest median household size with 1.16 persons per household.
| Household Type | # Households | Household Size |
| Married-Couple | 4,515 (41.9%) | 3.13 |
| Single Male/Father | 939 (8.7%) | 2.88 |
| Single Female/Mother | 1,797 (16.7%) | 3.21 |
| Non-family | 3,535 (32.8%) | 1.16 |
| Total Households | 10,786 (100.0%) | 2.48 |
Household Size by Marriage Status in Thomasville
Out of a total of 10,786 households in Thomasville, 7,251 (67.2%) are family households, while 3,535 (32.8%) are nonfamily households. The most numerous type of family households are 2-person households, comprising 3,257, and the most common type of nonfamily households are 1-person households, comprising 3,088.
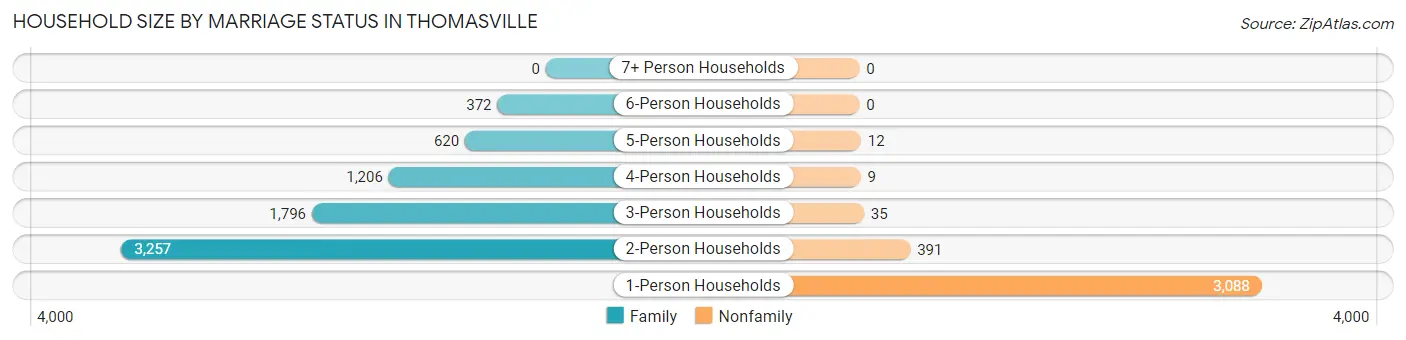
| Household Size | Family Households | Nonfamily Households |
| 1-Person Households | - | 3,088 (28.6%) |
| 2-Person Households | 3,257 (30.2%) | 391 (3.6%) |
| 3-Person Households | 1,796 (16.7%) | 35 (0.3%) |
| 4-Person Households | 1,206 (11.2%) | 9 (0.1%) |
| 5-Person Households | 620 (5.8%) | 12 (0.1%) |
| 6-Person Households | 372 (3.5%) | 0 (0.0%) |
| 7+ Person Households | 0 (0.0%) | 0 (0.0%) |
| Total | 7,251 (67.2%) | 3,535 (32.8%) |
Female Fertility in Thomasville
Fertility by Age in Thomasville
Average fertility rate in Thomasville is 70.0 births per 1,000 women. Women in the age bracket of 20 to 34 years have the highest fertility rate with 119.0 births per 1,000 women. Women in the age bracket of 20 to 34 years acount for 84.3% of all women with births.
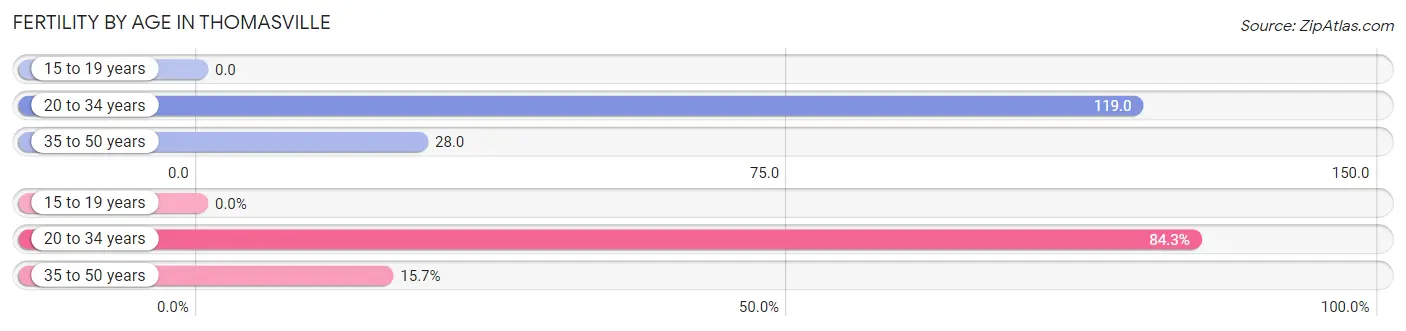
| Age Bracket | Women with Births | Births / 1,000 Women |
| 15 to 19 years | 0 (0.0%) | 0.0 |
| 20 to 34 years | 343 (84.3%) | 119.0 |
| 35 to 50 years | 64 (15.7%) | 28.0 |
| Total | 407 (100.0%) | 70.0 |
Fertility by Age by Marriage Status in Thomasville
38.8% of women with births (407) in Thomasville are married. The highest percentage of unmarried women with births falls into 20 to 34 years age bracket with 72.6% of them unmarried at the time of birth, while the lowest percentage of unmarried women with births belong to 35 to 50 years age bracket with 0.0% of them unmarried.
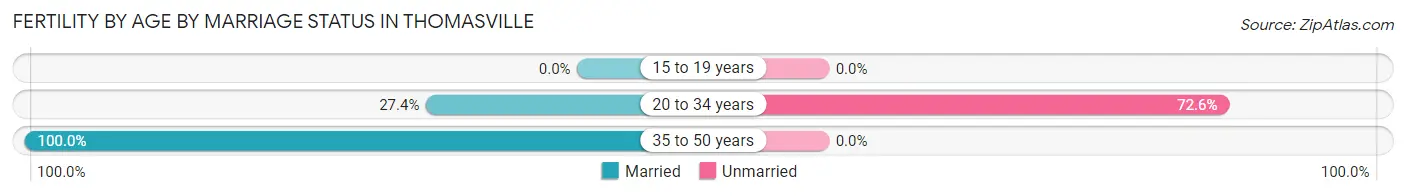
| Age Bracket | Married | Unmarried |
| 15 to 19 years | 0 (0.0%) | 0 (0.0%) |
| 20 to 34 years | 94 (27.4%) | 249 (72.6%) |
| 35 to 50 years | 64 (100.0%) | 0 (0.0%) |
| Total | 158 (38.8%) | 249 (61.2%) |
Fertility by Education in Thomasville
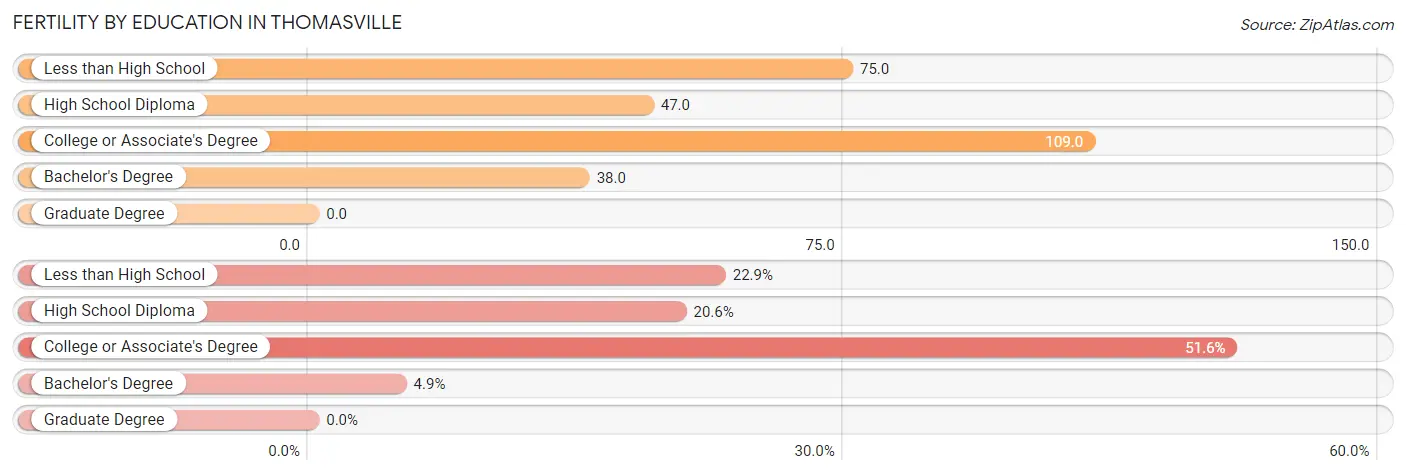
| Educational Attainment | Women with Births | Births / 1,000 Women |
| Less than High School | 93 (22.9%) | 75.0 |
| High School Diploma | 84 (20.6%) | 47.0 |
| College or Associate's Degree | 210 (51.6%) | 109.0 |
| Bachelor's Degree | 20 (4.9%) | 38.0 |
| Graduate Degree | 0 (0.0%) | 0.0 |
| Total | 407 (100.0%) | 70.0 |
Fertility by Education by Marriage Status in Thomasville
61.2% of women with births in Thomasville are unmarried. Women with the educational attainment of bachelor's degree are most likely to be married with 100.0% of them married at childbirth, while women with the educational attainment of college or associate's degree are least likely to be married with 71.4% of them unmarried at childbirth.
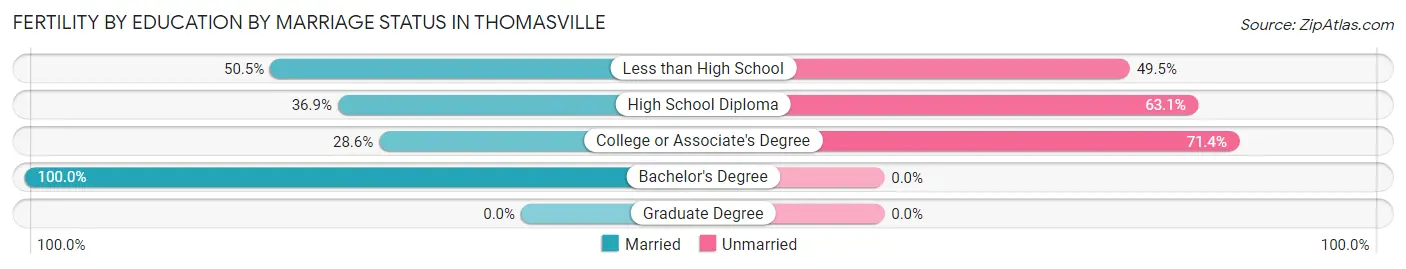
| Educational Attainment | Married | Unmarried |
| Less than High School | 47 (50.5%) | 46 (49.5%) |
| High School Diploma | 31 (36.9%) | 53 (63.1%) |
| College or Associate's Degree | 60 (28.6%) | 150 (71.4%) |
| Bachelor's Degree | 20 (100.0%) | 0 (0.0%) |
| Graduate Degree | 0 (0.0%) | 0 (0.0%) |
| Total | 158 (38.8%) | 249 (61.2%) |
Employment Characteristics in Thomasville
Employment by Class of Employer in Thomasville
Among the 11,642 employed individuals in Thomasville, private company employees (9,132 | 78.4%), self-employed (not incorporated) (577 | 5.0%), and not-for-profit organizations (557 | 4.8%) make up the most common classes of employment.
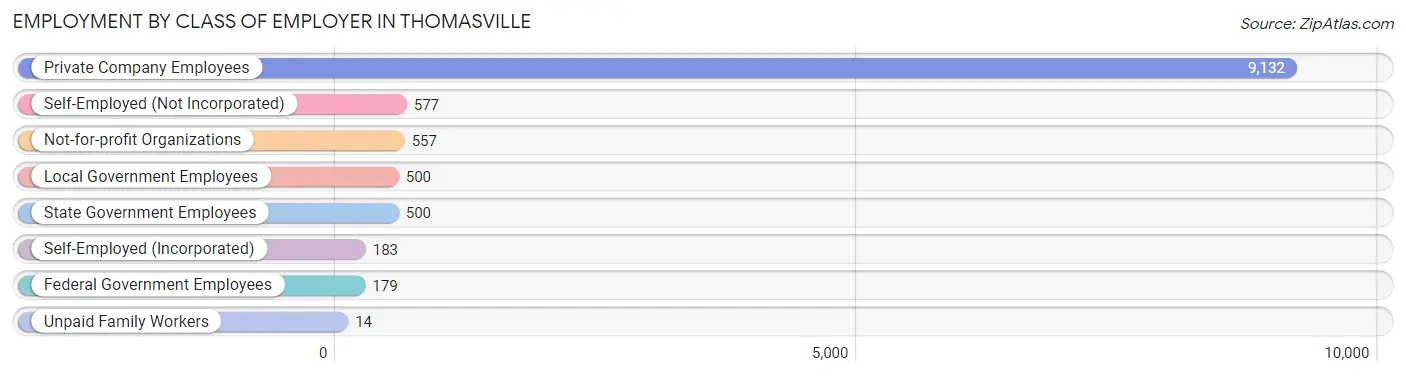
| Employer Class | # Employees | % Employees |
| Private Company Employees | 9,132 | 78.4% |
| Self-Employed (Incorporated) | 183 | 1.6% |
| Self-Employed (Not Incorporated) | 577 | 5.0% |
| Not-for-profit Organizations | 557 | 4.8% |
| Local Government Employees | 500 | 4.3% |
| State Government Employees | 500 | 4.3% |
| Federal Government Employees | 179 | 1.5% |
| Unpaid Family Workers | 14 | 0.1% |
| Total | 11,642 | 100.0% |
Employment Status by Age in Thomasville
According to the labor force statistics for Thomasville, out of the total population over 16 years of age (21,378), 58.6% or 12,528 individuals are in the labor force, with 5.2% or 651 of them unemployed. The age group with the highest labor force participation rate is 35 to 44 years, with 83.1% or 2,563 individuals in the labor force. Within the labor force, the 35 to 44 years age range has the highest percentage of unemployed individuals, with 11.8% or 302 of them being unemployed.
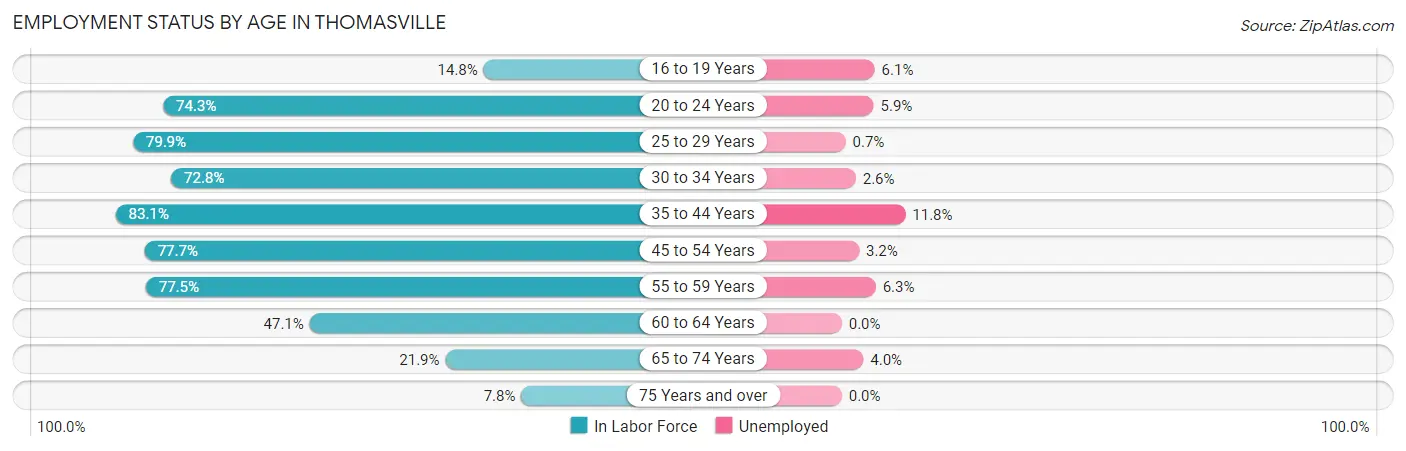
| Age Bracket | In Labor Force | Unemployed |
| 16 to 19 Years | 179 (14.8%) | 11 (6.1%) |
| 20 to 24 Years | 1,485 (74.3%) | 88 (5.9%) |
| 25 to 29 Years | 1,527 (79.9%) | 11 (0.7%) |
| 30 to 34 Years | 1,288 (72.8%) | 33 (2.6%) |
| 35 to 44 Years | 2,563 (83.1%) | 302 (11.8%) |
| 45 to 54 Years | 2,475 (77.7%) | 79 (3.2%) |
| 55 to 59 Years | 1,627 (77.5%) | 103 (6.3%) |
| 60 to 64 Years | 694 (47.1%) | 0 (0.0%) |
| 65 to 74 Years | 506 (21.9%) | 20 (4.0%) |
| 75 Years and over | 183 (7.8%) | 0 (0.0%) |
| Total | 12,528 (58.6%) | 651 (5.2%) |
Employment Status by Educational Attainment in Thomasville
According to labor force statistics for Thomasville, 75.2% of individuals (10,169) out of the total population between 25 and 64 years of age (13,522) are in the labor force, with 5.2% or 529 of them being unemployed. The group with the highest labor force participation rate are those with the educational attainment of college / associate degree, with 80.9% or 3,768 individuals in the labor force. Within the labor force, individuals with high school diploma education have the highest percentage of unemployment, with 8.0% or 291 of them being unemployed.
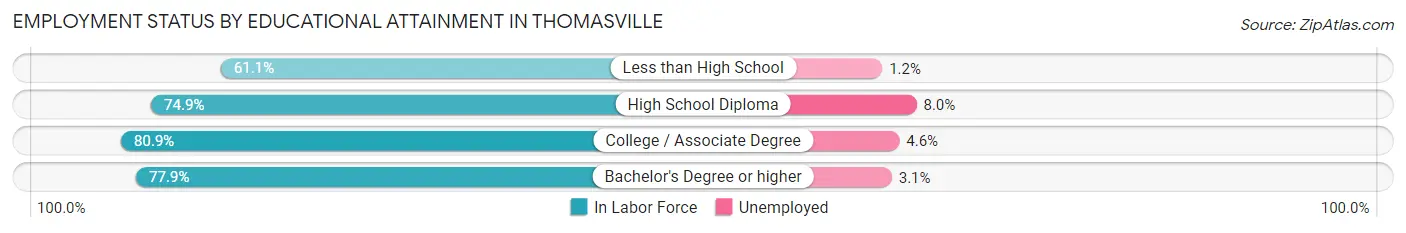
| Educational Attainment | In Labor Force | Unemployed |
| Less than High School | 1,281 (61.1%) | 25 (1.2%) |
| High School Diploma | 3,641 (74.9%) | 389 (8.0%) |
| College / Associate Degree | 3,768 (80.9%) | 214 (4.6%) |
| Bachelor's Degree or higher | 1,486 (77.9%) | 59 (3.1%) |
| Total | 10,169 (75.2%) | 703 (5.2%) |
Employment Occupations by Sex in Thomasville
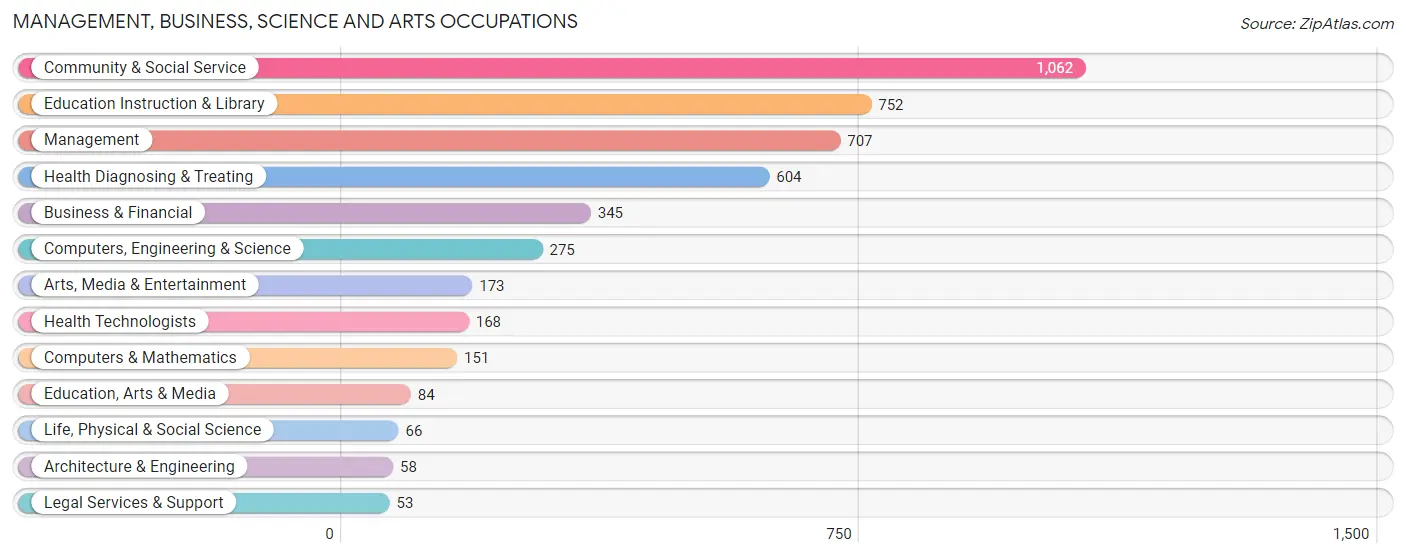
Management, Business, Science and Arts Occupations
The most common Management, Business, Science and Arts occupations in Thomasville are Community & Social Service (1,062 | 9.0%), Education Instruction & Library (752 | 6.4%), Management (707 | 6.0%), Health Diagnosing & Treating (604 | 5.1%), and Business & Financial (345 | 2.9%).
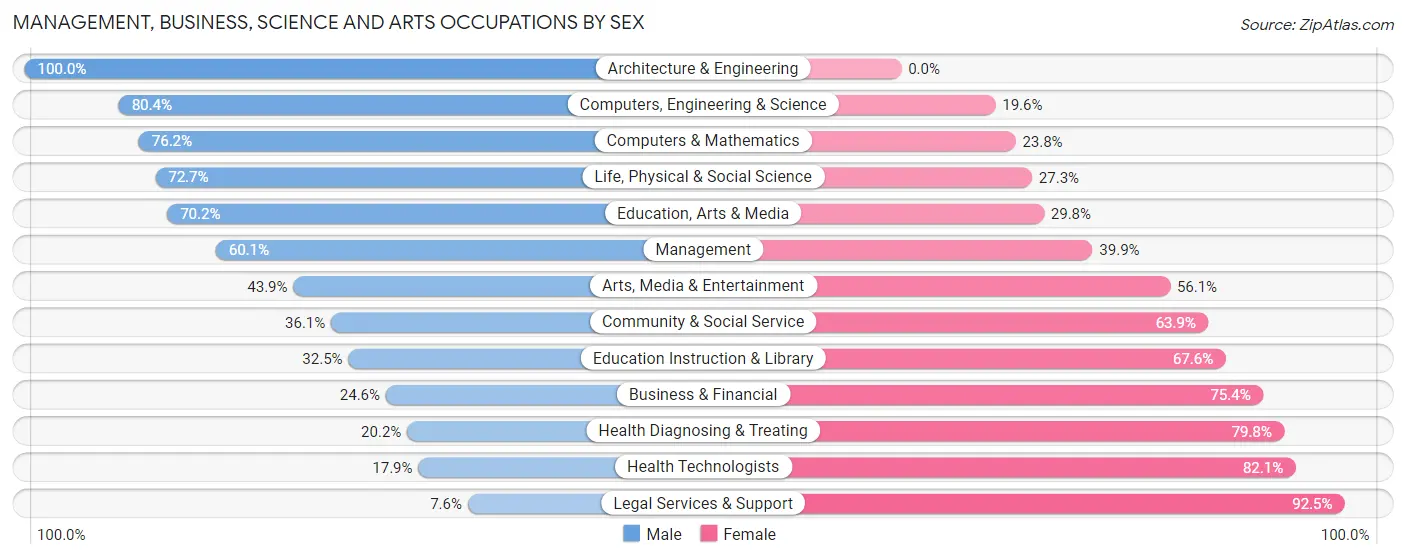
Management, Business, Science and Arts Occupations by Sex
Within the Management, Business, Science and Arts occupations in Thomasville, the most male-oriented occupations are Architecture & Engineering (100.0%), Computers, Engineering & Science (80.4%), and Computers & Mathematics (76.2%), while the most female-oriented occupations are Legal Services & Support (92.4%), Health Technologists (82.1%), and Health Diagnosing & Treating (79.8%).
| Occupation | Male | Female |
| Management | 425 (60.1%) | 282 (39.9%) |
| Business & Financial | 85 (24.6%) | 260 (75.4%) |
| Computers, Engineering & Science | 221 (80.4%) | 54 (19.6%) |
| Computers & Mathematics | 115 (76.2%) | 36 (23.8%) |
| Architecture & Engineering | 58 (100.0%) | 0 (0.0%) |
| Life, Physical & Social Science | 48 (72.7%) | 18 (27.3%) |
| Community & Social Service | 383 (36.1%) | 679 (63.9%) |
| Education, Arts & Media | 59 (70.2%) | 25 (29.8%) |
| Legal Services & Support | 4 (7.5%) | 49 (92.4%) |
| Education Instruction & Library | 244 (32.5%) | 508 (67.5%) |
| Arts, Media & Entertainment | 76 (43.9%) | 97 (56.1%) |
| Health Diagnosing & Treating | 122 (20.2%) | 482 (79.8%) |
| Health Technologists | 30 (17.9%) | 138 (82.1%) |
| Total (Category) | 1,236 (41.3%) | 1,757 (58.7%) |
| Total (Overall) | 6,534 (55.1%) | 5,314 (44.9%) |
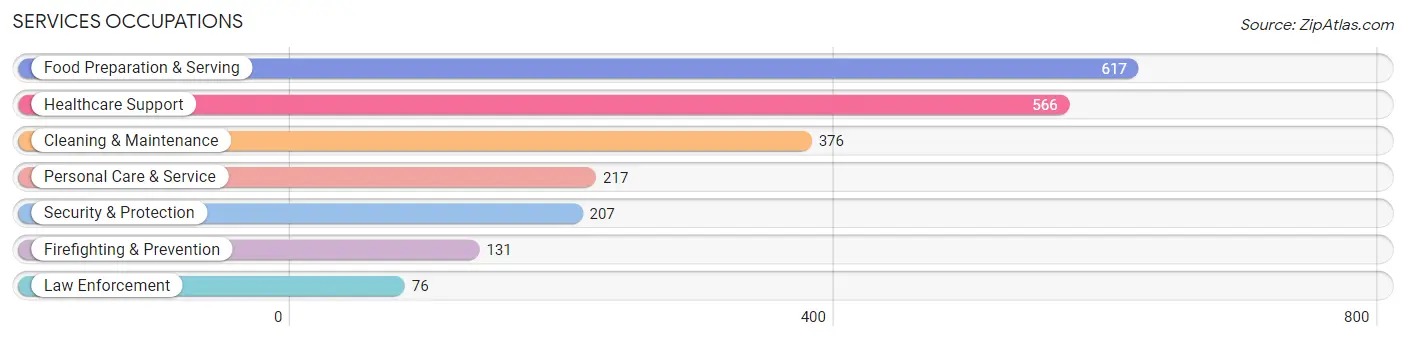
Services Occupations
The most common Services occupations in Thomasville are Food Preparation & Serving (617 | 5.2%), Healthcare Support (566 | 4.8%), Cleaning & Maintenance (376 | 3.2%), Personal Care & Service (217 | 1.8%), and Security & Protection (207 | 1.8%).
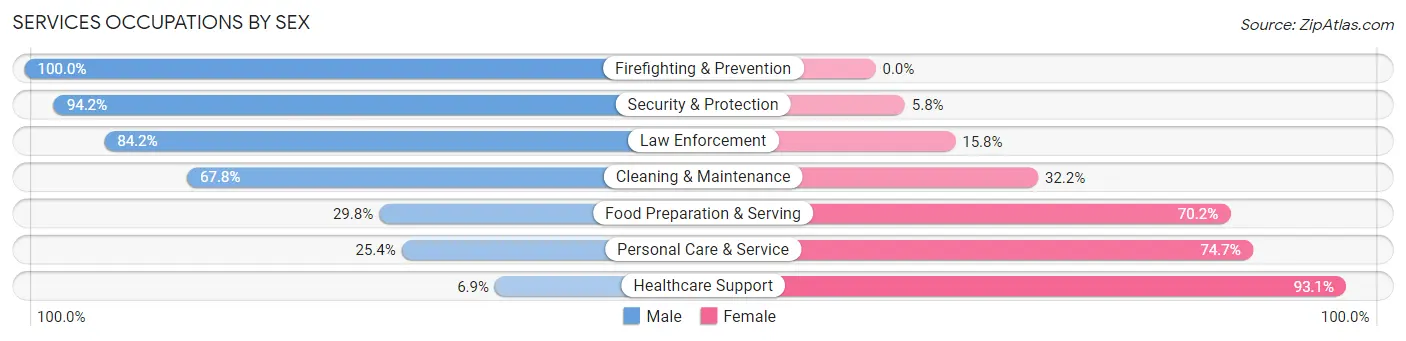
Services Occupations by Sex
Within the Services occupations in Thomasville, the most male-oriented occupations are Firefighting & Prevention (100.0%), Security & Protection (94.2%), and Law Enforcement (84.2%), while the most female-oriented occupations are Healthcare Support (93.1%), Personal Care & Service (74.7%), and Food Preparation & Serving (70.2%).
| Occupation | Male | Female |
| Healthcare Support | 39 (6.9%) | 527 (93.1%) |
| Security & Protection | 195 (94.2%) | 12 (5.8%) |
| Firefighting & Prevention | 131 (100.0%) | 0 (0.0%) |
| Law Enforcement | 64 (84.2%) | 12 (15.8%) |
| Food Preparation & Serving | 184 (29.8%) | 433 (70.2%) |
| Cleaning & Maintenance | 255 (67.8%) | 121 (32.2%) |
| Personal Care & Service | 55 (25.4%) | 162 (74.7%) |
| Total (Category) | 728 (36.7%) | 1,255 (63.3%) |
| Total (Overall) | 6,534 (55.1%) | 5,314 (44.9%) |
Sales and Office Occupations
The most common Sales and Office occupations in Thomasville are Office & Administration (1,196 | 10.1%), and Sales & Related (1,194 | 10.1%).

Sales and Office Occupations by Sex
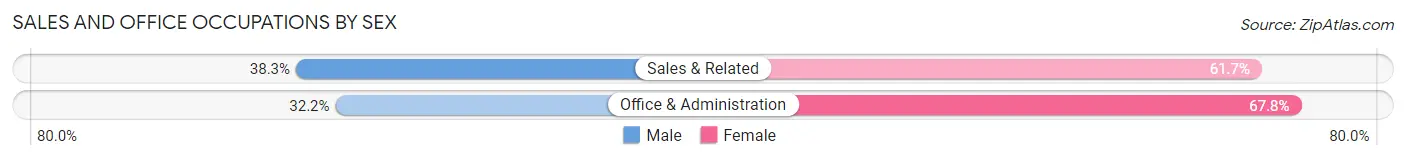
| Occupation | Male | Female |
| Sales & Related | 457 (38.3%) | 737 (61.7%) |
| Office & Administration | 385 (32.2%) | 811 (67.8%) |
| Total (Category) | 842 (35.2%) | 1,548 (64.8%) |
| Total (Overall) | 6,534 (55.1%) | 5,314 (44.9%) |
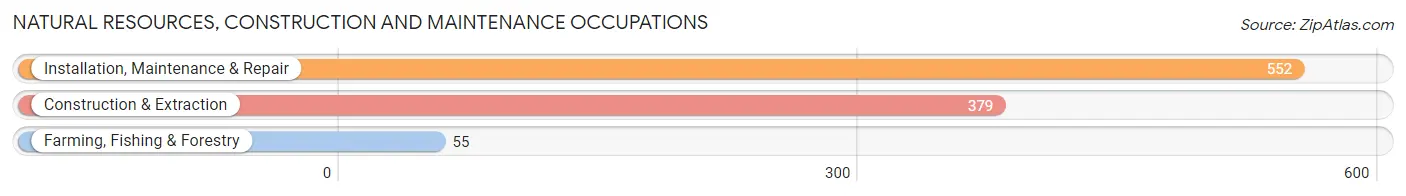
Natural Resources, Construction and Maintenance Occupations
The most common Natural Resources, Construction and Maintenance occupations in Thomasville are Installation, Maintenance & Repair (552 | 4.7%), Construction & Extraction (379 | 3.2%), and Farming, Fishing & Forestry (55 | 0.5%).
Natural Resources, Construction and Maintenance Occupations by Sex
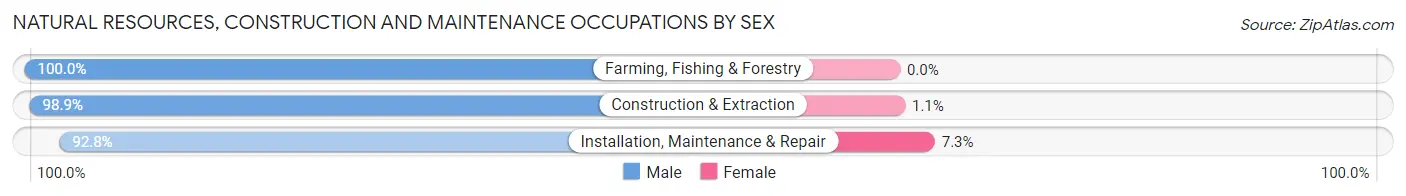
| Occupation | Male | Female |
| Farming, Fishing & Forestry | 55 (100.0%) | 0 (0.0%) |
| Construction & Extraction | 375 (98.9%) | 4 (1.1%) |
| Installation, Maintenance & Repair | 512 (92.7%) | 40 (7.2%) |
| Total (Category) | 942 (95.5%) | 44 (4.5%) |
| Total (Overall) | 6,534 (55.1%) | 5,314 (44.9%) |
Production, Transportation and Moving Occupations
The most common Production, Transportation and Moving occupations in Thomasville are Production (1,849 | 15.6%), Transportation (1,045 | 8.8%), and Material Moving (602 | 5.1%).
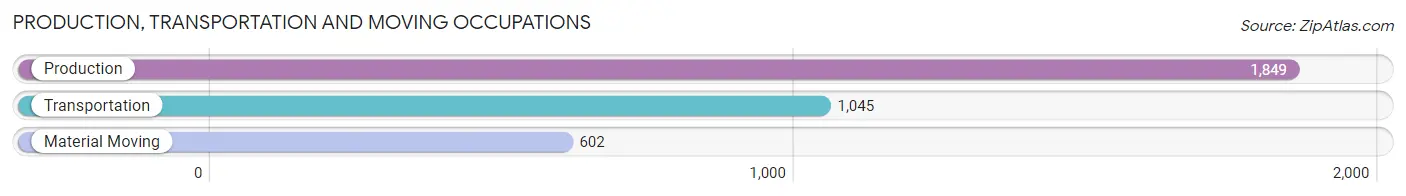
Production, Transportation and Moving Occupations by Sex

| Occupation | Male | Female |
| Production | 1,388 (75.1%) | 461 (24.9%) |
| Transportation | 938 (89.8%) | 107 (10.2%) |
| Material Moving | 460 (76.4%) | 142 (23.6%) |
| Total (Category) | 2,786 (79.7%) | 710 (20.3%) |
| Total (Overall) | 6,534 (55.1%) | 5,314 (44.9%) |
Employment Industries by Sex in Thomasville
Employment Industries in Thomasville
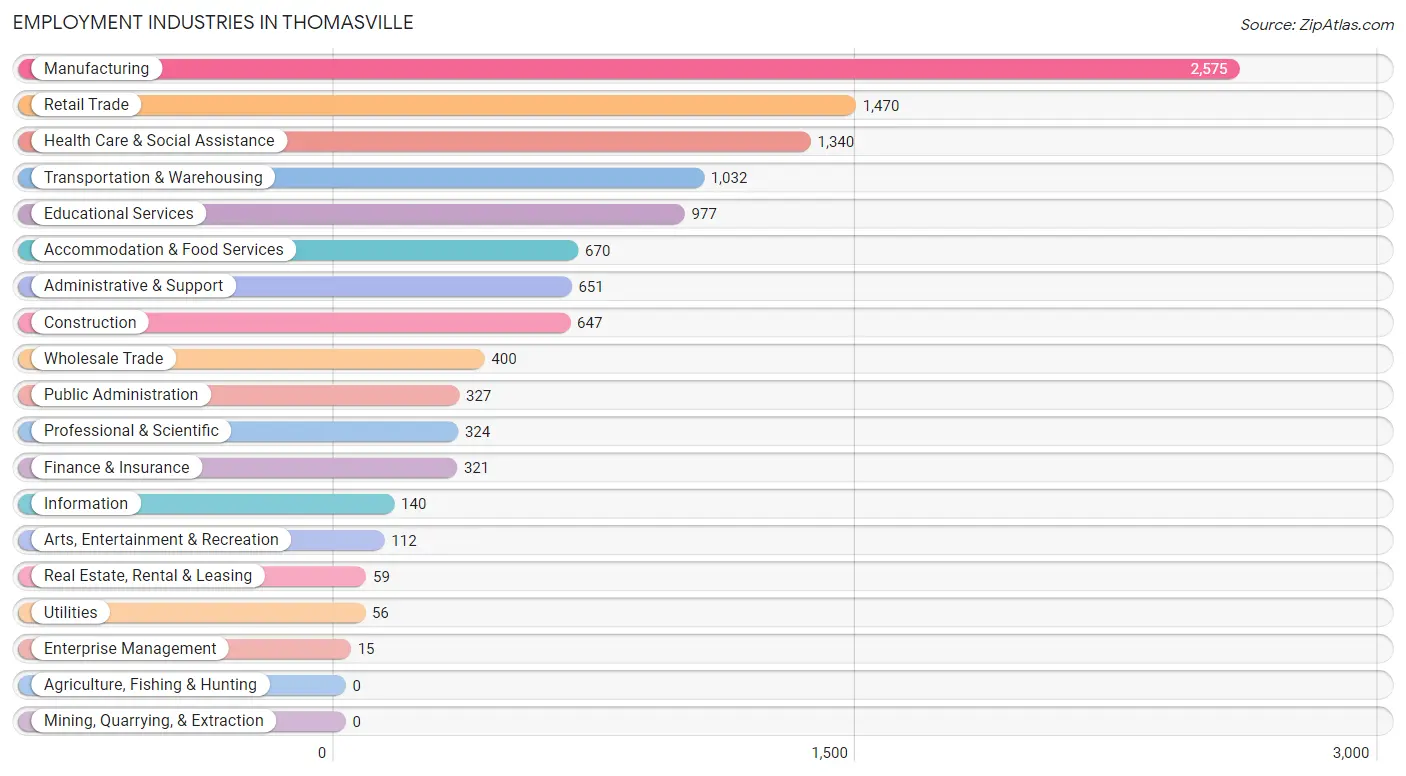
The major employment industries in Thomasville include Manufacturing (2,575 | 21.7%), Retail Trade (1,470 | 12.4%), Health Care & Social Assistance (1,340 | 11.3%), Transportation & Warehousing (1,032 | 8.7%), and Educational Services (977 | 8.3%).
Employment Industries by Sex in Thomasville
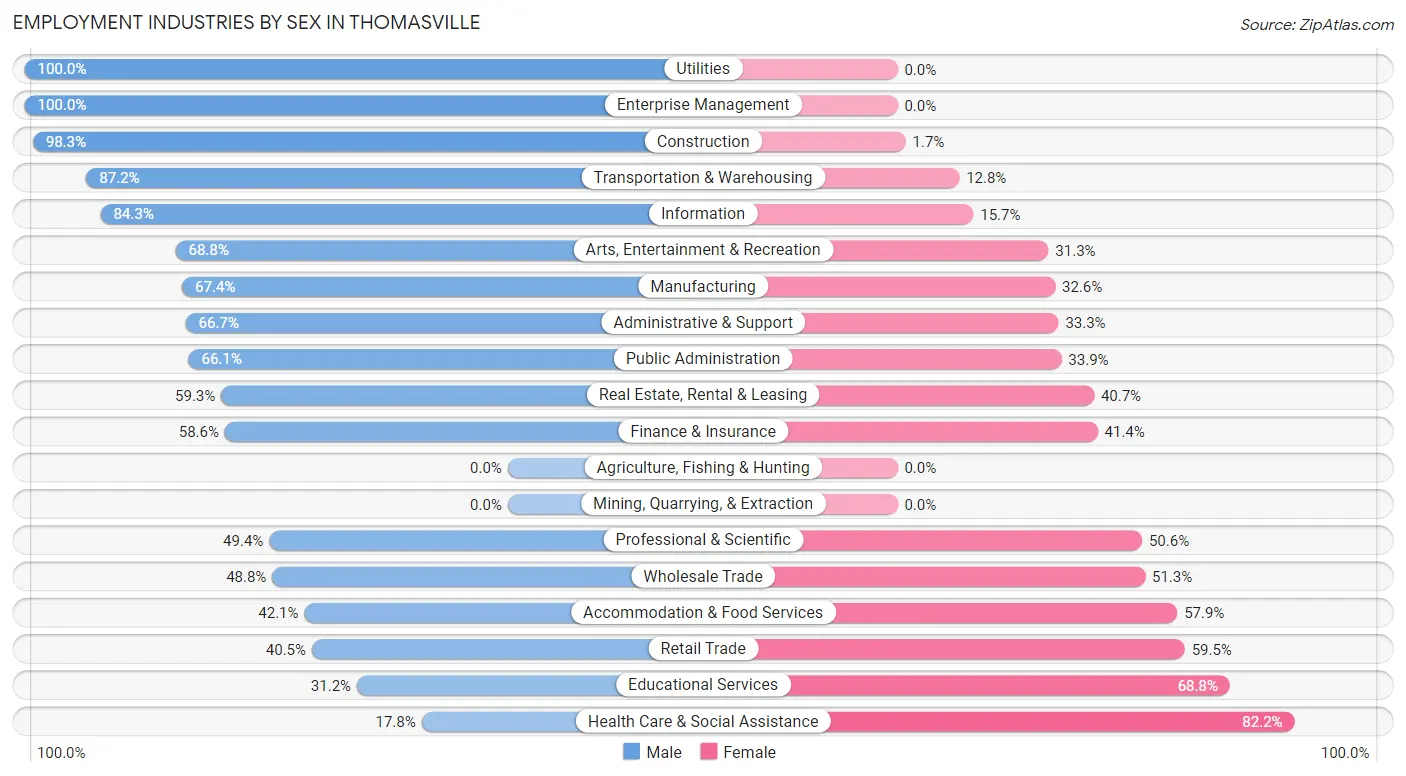
The Thomasville industries that see more men than women are Utilities (100.0%), Enterprise Management (100.0%), and Construction (98.3%), whereas the industries that tend to have a higher number of women are Health Care & Social Assistance (82.2%), Educational Services (68.8%), and Retail Trade (59.5%).
| Industry | Male | Female |
| Agriculture, Fishing & Hunting | 0 (0.0%) | 0 (0.0%) |
| Mining, Quarrying, & Extraction | 0 (0.0%) | 0 (0.0%) |
| Construction | 636 (98.3%) | 11 (1.7%) |
| Manufacturing | 1,735 (67.4%) | 840 (32.6%) |
| Wholesale Trade | 195 (48.7%) | 205 (51.2%) |
| Retail Trade | 596 (40.5%) | 874 (59.5%) |
| Transportation & Warehousing | 900 (87.2%) | 132 (12.8%) |
| Utilities | 56 (100.0%) | 0 (0.0%) |
| Information | 118 (84.3%) | 22 (15.7%) |
| Finance & Insurance | 188 (58.6%) | 133 (41.4%) |
| Real Estate, Rental & Leasing | 35 (59.3%) | 24 (40.7%) |
| Professional & Scientific | 160 (49.4%) | 164 (50.6%) |
| Enterprise Management | 15 (100.0%) | 0 (0.0%) |
| Administrative & Support | 434 (66.7%) | 217 (33.3%) |
| Educational Services | 305 (31.2%) | 672 (68.8%) |
| Health Care & Social Assistance | 239 (17.8%) | 1,101 (82.2%) |
| Arts, Entertainment & Recreation | 77 (68.8%) | 35 (31.2%) |
| Accommodation & Food Services | 282 (42.1%) | 388 (57.9%) |
| Public Administration | 216 (66.1%) | 111 (33.9%) |
| Total | 6,534 (55.1%) | 5,314 (44.9%) |
Education in Thomasville
School Enrollment in Thomasville
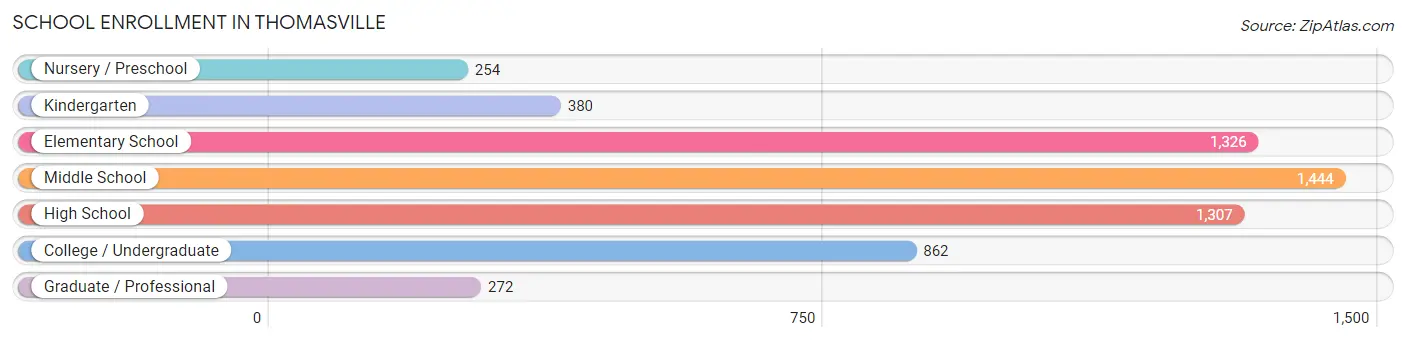
The most common levels of schooling among the 5,845 students in Thomasville are middle school (1,444 | 24.7%), elementary school (1,326 | 22.7%), and high school (1,307 | 22.4%).
| School Level | # Students | % Students |
| Nursery / Preschool | 254 | 4.3% |
| Kindergarten | 380 | 6.5% |
| Elementary School | 1,326 | 22.7% |
| Middle School | 1,444 | 24.7% |
| High School | 1,307 | 22.4% |
| College / Undergraduate | 862 | 14.7% |
| Graduate / Professional | 272 | 4.6% |
| Total | 5,845 | 100.0% |
School Enrollment by Age by Funding Source in Thomasville
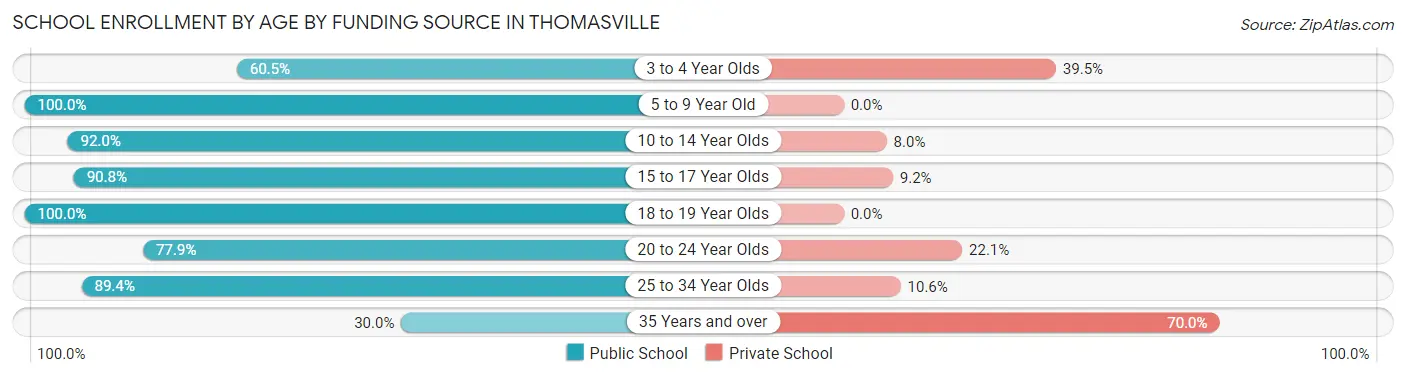
Out of a total of 5,845 students who are enrolled in schools in Thomasville, 631 (10.8%) attend a private institution, while the remaining 5,214 (89.2%) are enrolled in public schools. The age group of 35 years and over has the highest likelihood of being enrolled in private schools, with 212 (70.0% in the age bracket) enrolled. Conversely, the age group of 5 to 9 year old has the lowest likelihood of being enrolled in a private school, with 1,675 (100.0% in the age bracket) attending a public institution.
| Age Bracket | Public School | Private School |
| 3 to 4 Year Olds | 104 (60.5%) | 68 (39.5%) |
| 5 to 9 Year Old | 1,675 (100.0%) | 0 (0.0%) |
| 10 to 14 Year Olds | 1,596 (92.0%) | 139 (8.0%) |
| 15 to 17 Year Olds | 863 (90.8%) | 87 (9.2%) |
| 18 to 19 Year Olds | 263 (100.0%) | 0 (0.0%) |
| 20 to 24 Year Olds | 325 (77.9%) | 92 (22.1%) |
| 25 to 34 Year Olds | 295 (89.4%) | 35 (10.6%) |
| 35 Years and over | 91 (30.0%) | 212 (70.0%) |
| Total | 5,214 (89.2%) | 631 (10.8%) |
Educational Attainment by Field of Study in Thomasville
Education (600 | 22.4%), business (472 | 17.6%), psychology (227 | 8.5%), bio, nature & agricultural (205 | 7.7%), and liberal arts & history (202 | 7.5%) are the most common fields of study among 2,674 individuals in Thomasville who have obtained a bachelor's degree or higher.
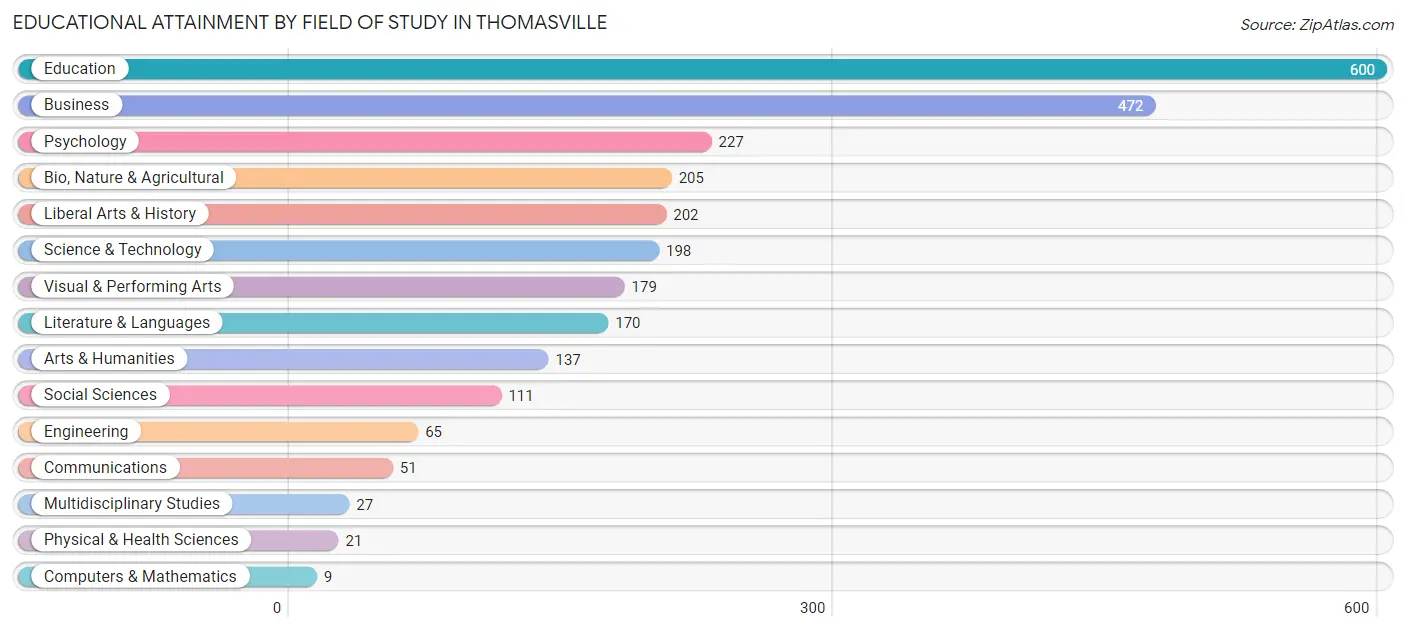
| Field of Study | # Graduates | % Graduates |
| Computers & Mathematics | 9 | 0.3% |
| Bio, Nature & Agricultural | 205 | 7.7% |
| Physical & Health Sciences | 21 | 0.8% |
| Psychology | 227 | 8.5% |
| Social Sciences | 111 | 4.2% |
| Engineering | 65 | 2.4% |
| Multidisciplinary Studies | 27 | 1.0% |
| Science & Technology | 198 | 7.4% |
| Business | 472 | 17.6% |
| Education | 600 | 22.4% |
| Literature & Languages | 170 | 6.4% |
| Liberal Arts & History | 202 | 7.5% |
| Visual & Performing Arts | 179 | 6.7% |
| Communications | 51 | 1.9% |
| Arts & Humanities | 137 | 5.1% |
| Total | 2,674 | 100.0% |
Transportation & Commute in Thomasville
Vehicle Availability by Sex in Thomasville
The most prevalent vehicle ownership categories in Thomasville are males with 2 vehicles (2,836, accounting for 44.2%) and females with 2 vehicles (1,971, making up 54.3%).
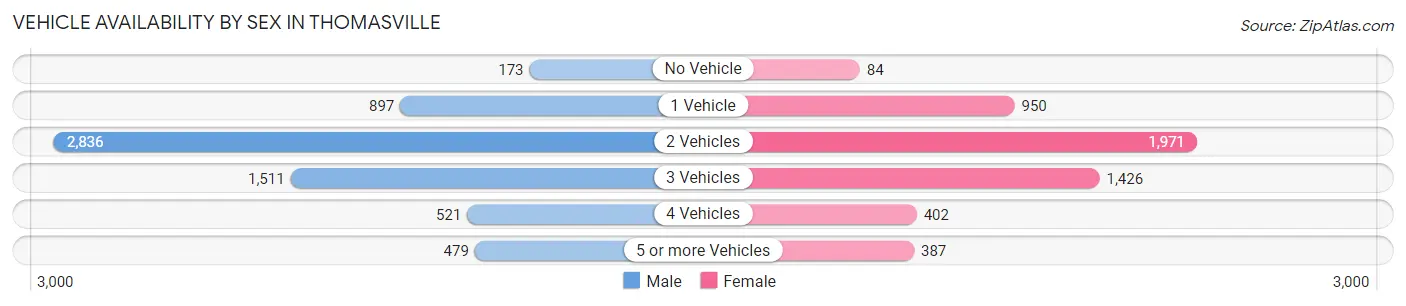
| Vehicles Available | Male | Female |
| No Vehicle | 173 (2.7%) | 84 (1.6%) |
| 1 Vehicle | 897 (14.0%) | 950 (18.2%) |
| 2 Vehicles | 2,836 (44.2%) | 1,971 (37.8%) |
| 3 Vehicles | 1,511 (23.5%) | 1,426 (27.3%) |
| 4 Vehicles | 521 (8.1%) | 402 (7.7%) |
| 5 or more Vehicles | 479 (7.5%) | 387 (7.4%) |
| Total | 6,417 (100.0%) | 5,220 (100.0%) |
Commute Time in Thomasville
The most frequently occuring commute durations in Thomasville are 15 to 19 minutes (1,958 commuters, 17.8%), 5 to 9 minutes (1,713 commuters, 15.6%), and 10 to 14 minutes (1,657 commuters, 15.1%).
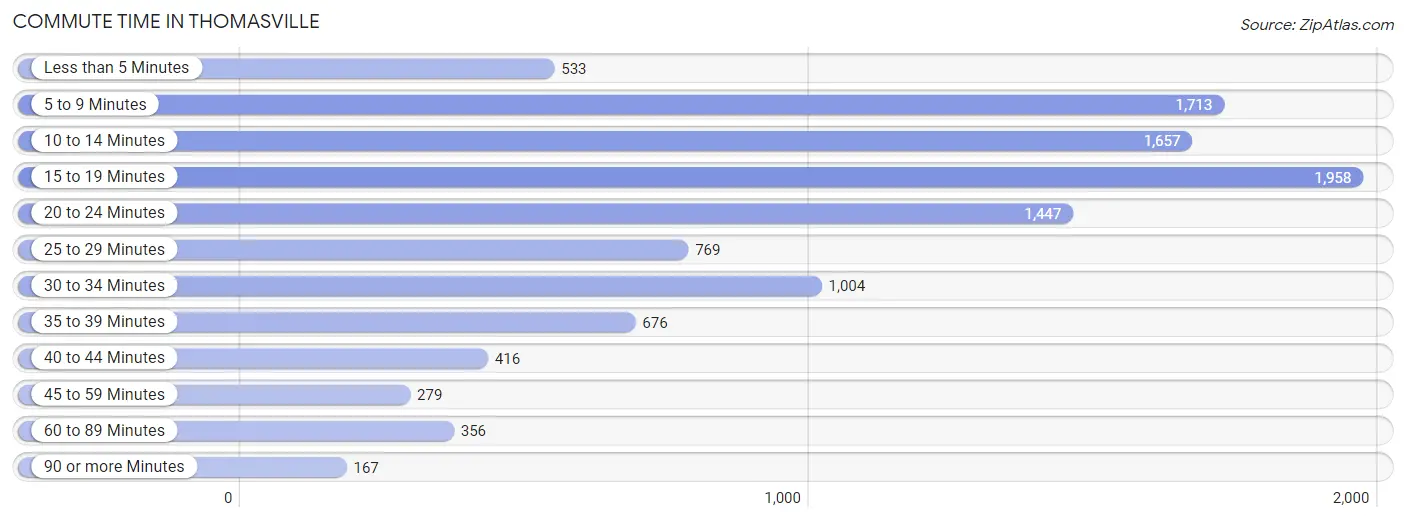
| Commute Time | # Commuters | % Commuters |
| Less than 5 Minutes | 533 | 4.9% |
| 5 to 9 Minutes | 1,713 | 15.6% |
| 10 to 14 Minutes | 1,657 | 15.1% |
| 15 to 19 Minutes | 1,958 | 17.8% |
| 20 to 24 Minutes | 1,447 | 13.2% |
| 25 to 29 Minutes | 769 | 7.0% |
| 30 to 34 Minutes | 1,004 | 9.1% |
| 35 to 39 Minutes | 676 | 6.2% |
| 40 to 44 Minutes | 416 | 3.8% |
| 45 to 59 Minutes | 279 | 2.5% |
| 60 to 89 Minutes | 356 | 3.2% |
| 90 or more Minutes | 167 | 1.5% |
Commute Time by Sex in Thomasville
The most common commute times in Thomasville are 15 to 19 minutes (1,169 commuters, 19.0%) for males and 10 to 14 minutes (898 commuters, 18.6%) for females.
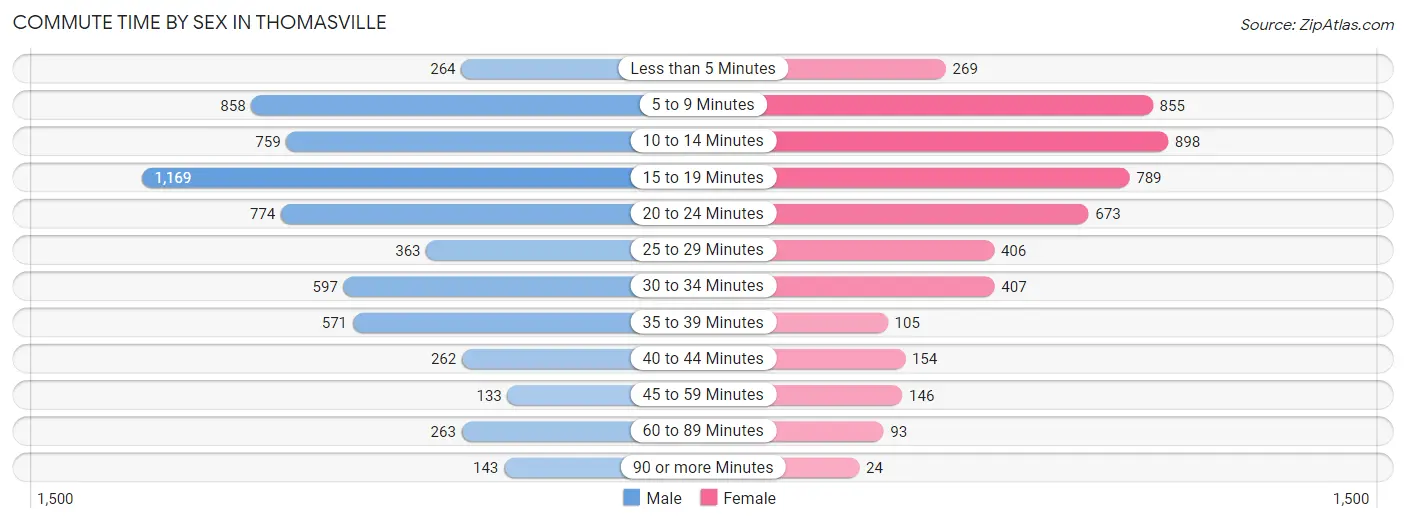
| Commute Time | Male | Female |
| Less than 5 Minutes | 264 (4.3%) | 269 (5.6%) |
| 5 to 9 Minutes | 858 (13.9%) | 855 (17.7%) |
| 10 to 14 Minutes | 759 (12.3%) | 898 (18.6%) |
| 15 to 19 Minutes | 1,169 (19.0%) | 789 (16.4%) |
| 20 to 24 Minutes | 774 (12.6%) | 673 (14.0%) |
| 25 to 29 Minutes | 363 (5.9%) | 406 (8.4%) |
| 30 to 34 Minutes | 597 (9.7%) | 407 (8.5%) |
| 35 to 39 Minutes | 571 (9.3%) | 105 (2.2%) |
| 40 to 44 Minutes | 262 (4.3%) | 154 (3.2%) |
| 45 to 59 Minutes | 133 (2.2%) | 146 (3.0%) |
| 60 to 89 Minutes | 263 (4.3%) | 93 (1.9%) |
| 90 or more Minutes | 143 (2.3%) | 24 (0.5%) |
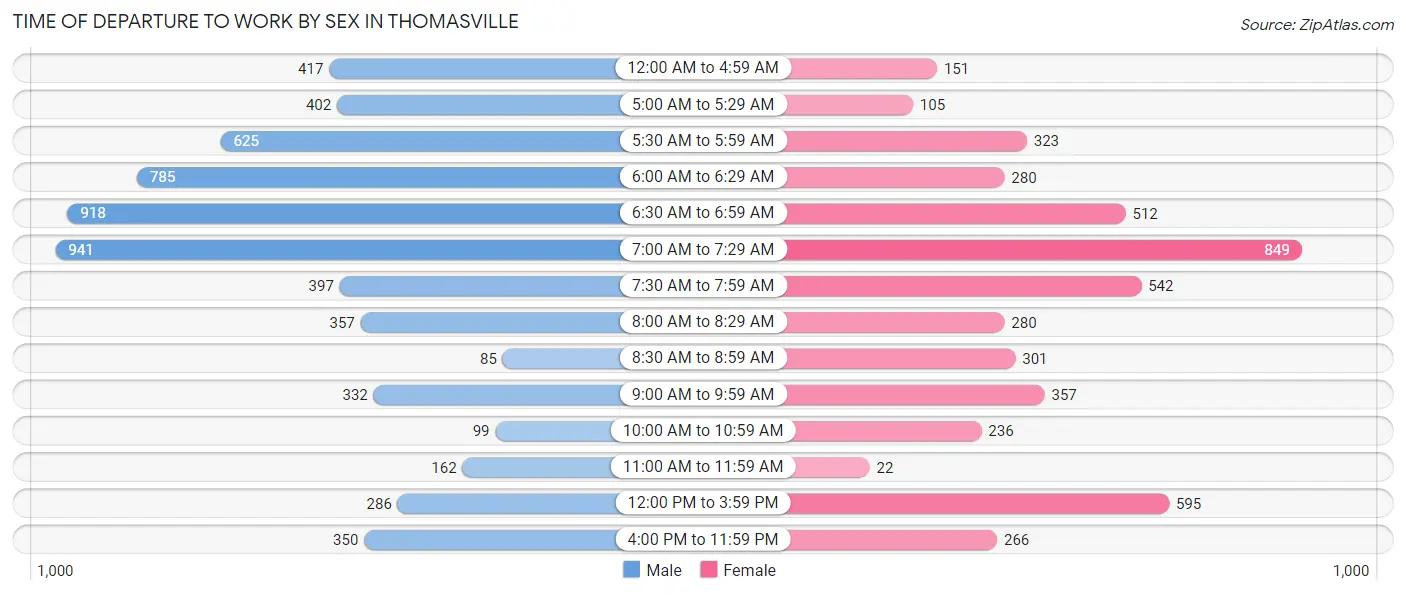
Time of Departure to Work by Sex in Thomasville
The most frequent times of departure to work in Thomasville are 7:00 AM to 7:29 AM (941, 15.3%) for males and 7:00 AM to 7:29 AM (849, 17.6%) for females.
| Time of Departure | Male | Female |
| 12:00 AM to 4:59 AM | 417 (6.8%) | 151 (3.1%) |
| 5:00 AM to 5:29 AM | 402 (6.5%) | 105 (2.2%) |
| 5:30 AM to 5:59 AM | 625 (10.2%) | 323 (6.7%) |
| 6:00 AM to 6:29 AM | 785 (12.8%) | 280 (5.8%) |
| 6:30 AM to 6:59 AM | 918 (14.9%) | 512 (10.6%) |
| 7:00 AM to 7:29 AM | 941 (15.3%) | 849 (17.6%) |
| 7:30 AM to 7:59 AM | 397 (6.5%) | 542 (11.3%) |
| 8:00 AM to 8:29 AM | 357 (5.8%) | 280 (5.8%) |
| 8:30 AM to 8:59 AM | 85 (1.4%) | 301 (6.2%) |
| 9:00 AM to 9:59 AM | 332 (5.4%) | 357 (7.4%) |
| 10:00 AM to 10:59 AM | 99 (1.6%) | 236 (4.9%) |
| 11:00 AM to 11:59 AM | 162 (2.6%) | 22 (0.5%) |
| 12:00 PM to 3:59 PM | 286 (4.6%) | 595 (12.3%) |
| 4:00 PM to 11:59 PM | 350 (5.7%) | 266 (5.5%) |
| Total | 6,156 (100.0%) | 4,819 (100.0%) |
Housing Occupancy in Thomasville
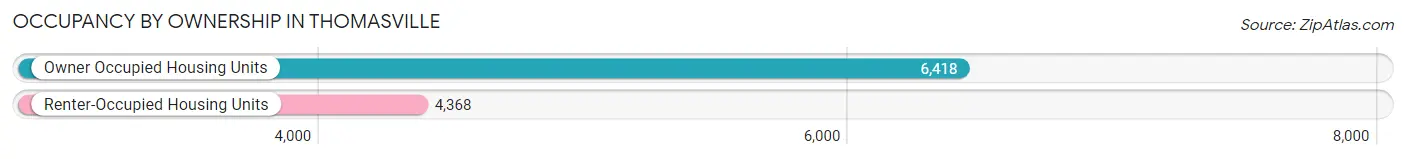
Occupancy by Ownership in Thomasville
Of the total 10,786 dwellings in Thomasville, owner-occupied units account for 6,418 (59.5%), while renter-occupied units make up 4,368 (40.5%).
| Occupancy | # Housing Units | % Housing Units |
| Owner Occupied Housing Units | 6,418 | 59.5% |
| Renter-Occupied Housing Units | 4,368 | 40.5% |
| Total Occupied Housing Units | 10,786 | 100.0% |
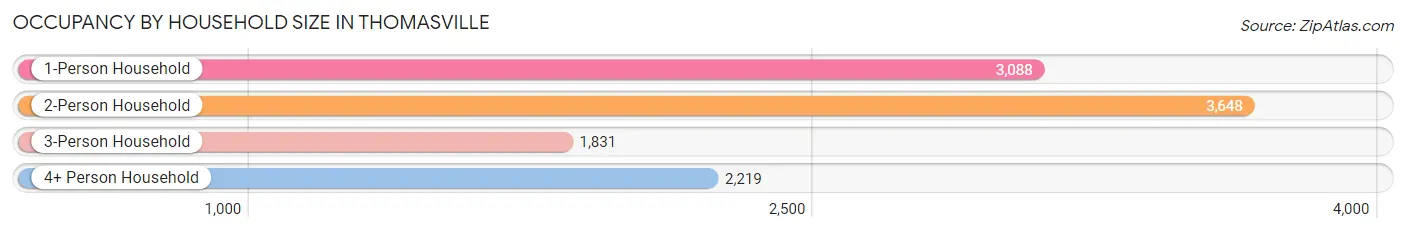
Occupancy by Household Size in Thomasville
| Household Size | # Housing Units | % Housing Units |
| 1-Person Household | 3,088 | 28.6% |
| 2-Person Household | 3,648 | 33.8% |
| 3-Person Household | 1,831 | 17.0% |
| 4+ Person Household | 2,219 | 20.6% |
| Total Housing Units | 10,786 | 100.0% |
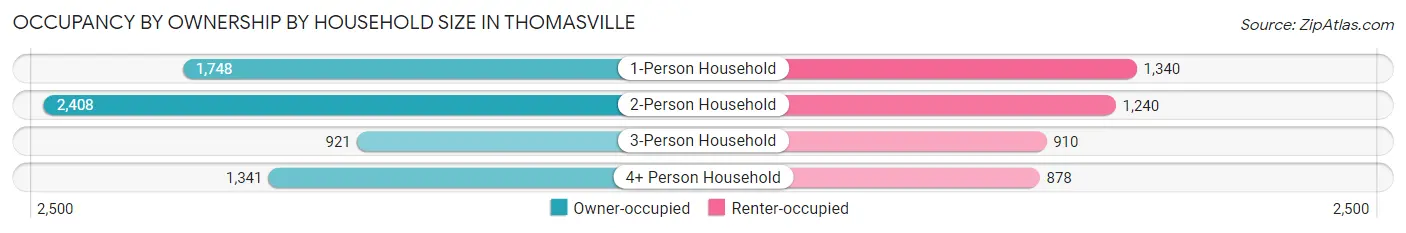
Occupancy by Ownership by Household Size in Thomasville
| Household Size | Owner-occupied | Renter-occupied |
| 1-Person Household | 1,748 (56.6%) | 1,340 (43.4%) |
| 2-Person Household | 2,408 (66.0%) | 1,240 (34.0%) |
| 3-Person Household | 921 (50.3%) | 910 (49.7%) |
| 4+ Person Household | 1,341 (60.4%) | 878 (39.6%) |
| Total Housing Units | 6,418 (59.5%) | 4,368 (40.5%) |
Occupancy by Educational Attainment in Thomasville
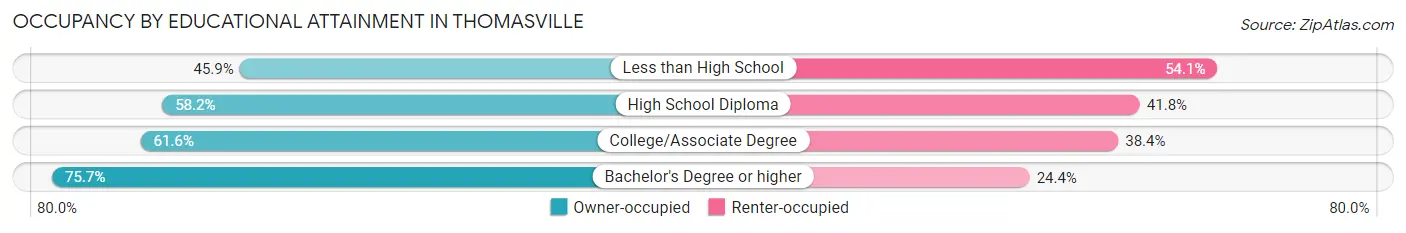
| Household Size | Owner-occupied | Renter-occupied |
| Less than High School | 880 (45.9%) | 1,037 (54.1%) |
| High School Diploma | 2,029 (58.2%) | 1,459 (41.8%) |
| College/Associate Degree | 2,462 (61.6%) | 1,535 (38.4%) |
| Bachelor's Degree or higher | 1,047 (75.6%) | 337 (24.3%) |
Occupancy by Age of Householder in Thomasville
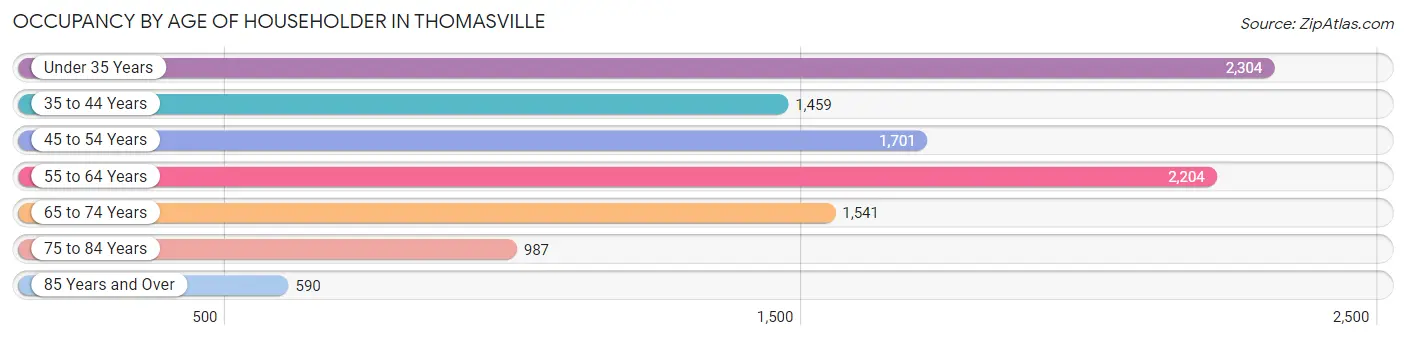
| Age Bracket | # Households | % Households |
| Under 35 Years | 2,304 | 21.4% |
| 35 to 44 Years | 1,459 | 13.5% |
| 45 to 54 Years | 1,701 | 15.8% |
| 55 to 64 Years | 2,204 | 20.4% |
| 65 to 74 Years | 1,541 | 14.3% |
| 75 to 84 Years | 987 | 9.1% |
| 85 Years and Over | 590 | 5.5% |
| Total | 10,786 | 100.0% |
Housing Finances in Thomasville
Median Income by Occupancy in Thomasville
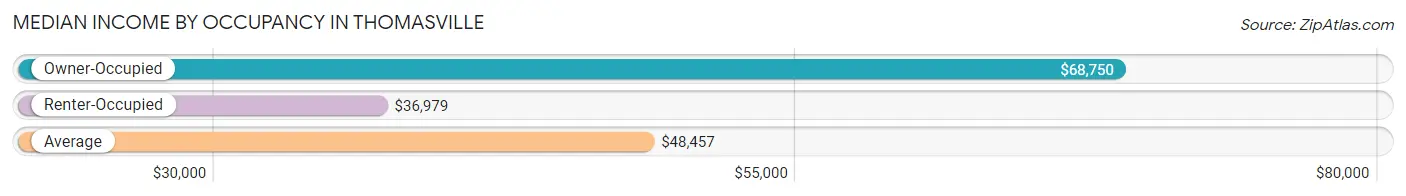
| Occupancy Type | # Households | Median Income |
| Owner-Occupied | 6,418 (59.5%) | $68,750 |
| Renter-Occupied | 4,368 (40.5%) | $36,979 |
| Average | 10,786 (100.0%) | $48,457 |
Occupancy by Householder Income Bracket in Thomasville
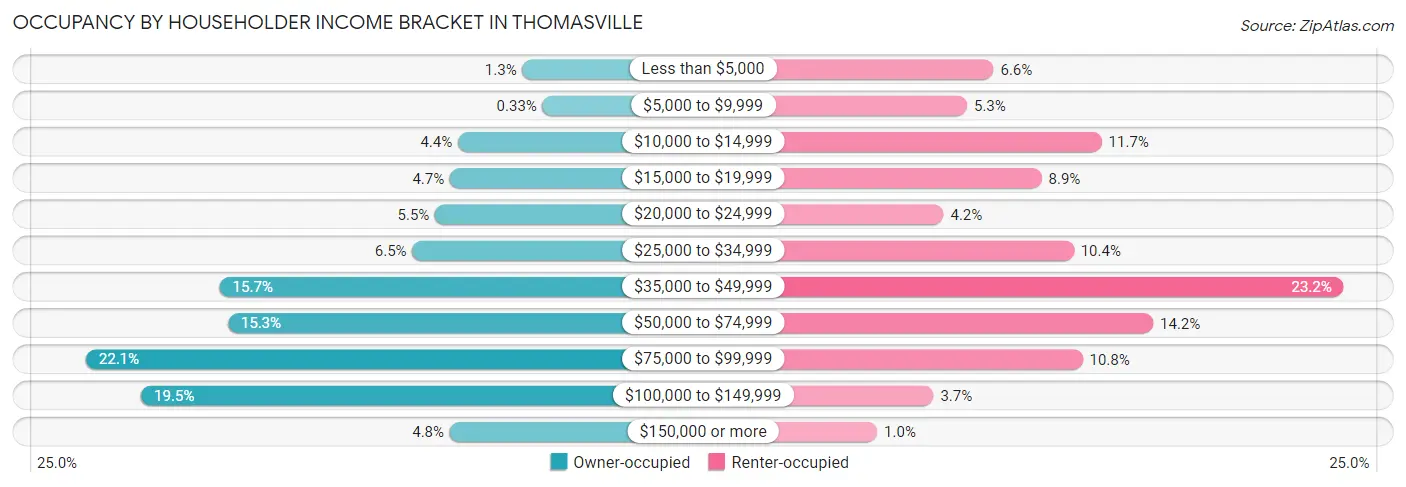
| Income Bracket | Owner-occupied | Renter-occupied |
| Less than $5,000 | 83 (1.3%) | 287 (6.6%) |
| $5,000 to $9,999 | 21 (0.3%) | 232 (5.3%) |
| $10,000 to $14,999 | 280 (4.4%) | 512 (11.7%) |
| $15,000 to $19,999 | 304 (4.7%) | 387 (8.9%) |
| $20,000 to $24,999 | 350 (5.4%) | 183 (4.2%) |
| $25,000 to $34,999 | 419 (6.5%) | 454 (10.4%) |
| $35,000 to $49,999 | 1,008 (15.7%) | 1,015 (23.2%) |
| $50,000 to $74,999 | 983 (15.3%) | 619 (14.2%) |
| $75,000 to $99,999 | 1,417 (22.1%) | 472 (10.8%) |
| $100,000 to $149,999 | 1,248 (19.5%) | 162 (3.7%) |
| $150,000 or more | 305 (4.8%) | 45 (1.0%) |
| Total | 6,418 (100.0%) | 4,368 (100.0%) |
Monthly Housing Cost Tiers in Thomasville
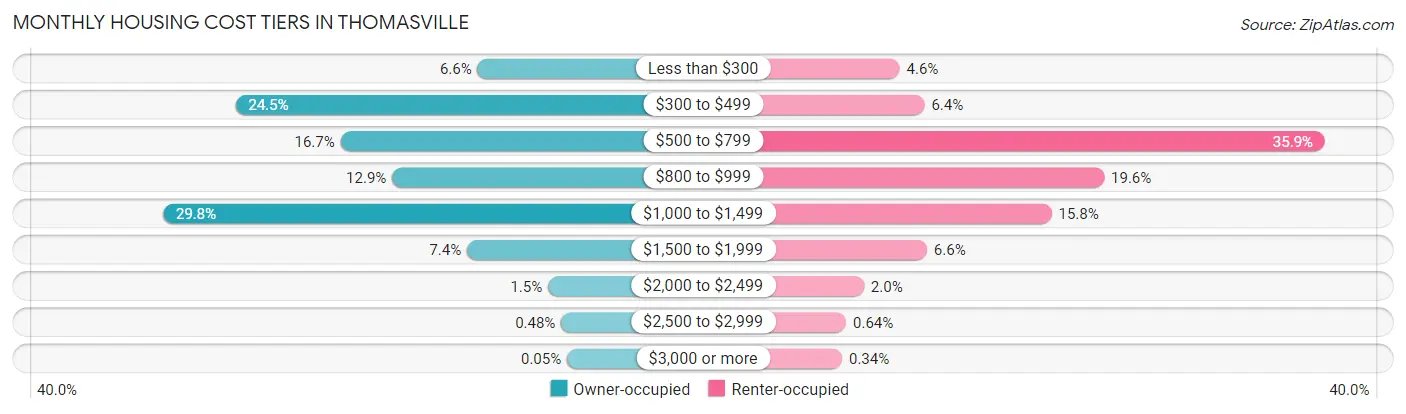
| Monthly Cost | Owner-occupied | Renter-occupied |
| Less than $300 | 426 (6.6%) | 200 (4.6%) |
| $300 to $499 | 1,571 (24.5%) | 280 (6.4%) |
| $500 to $799 | 1,074 (16.7%) | 1,568 (35.9%) |
| $800 to $999 | 830 (12.9%) | 858 (19.6%) |
| $1,000 to $1,499 | 1,914 (29.8%) | 689 (15.8%) |
| $1,500 to $1,999 | 476 (7.4%) | 288 (6.6%) |
| $2,000 to $2,499 | 93 (1.5%) | 85 (1.9%) |
| $2,500 to $2,999 | 31 (0.5%) | 28 (0.6%) |
| $3,000 or more | 3 (0.1%) | 15 (0.3%) |
| Total | 6,418 (100.0%) | 4,368 (100.0%) |
Physical Housing Characteristics in Thomasville
Housing Structures in Thomasville
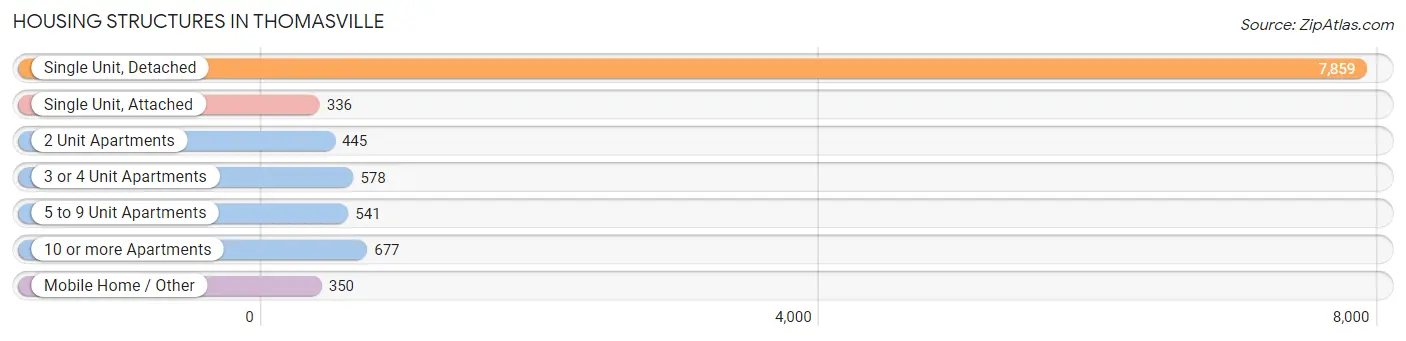
| Structure Type | # Housing Units | % Housing Units |
| Single Unit, Detached | 7,859 | 72.9% |
| Single Unit, Attached | 336 | 3.1% |
| 2 Unit Apartments | 445 | 4.1% |
| 3 or 4 Unit Apartments | 578 | 5.4% |
| 5 to 9 Unit Apartments | 541 | 5.0% |
| 10 or more Apartments | 677 | 6.3% |
| Mobile Home / Other | 350 | 3.2% |
| Total | 10,786 | 100.0% |
Housing Structures by Occupancy in Thomasville
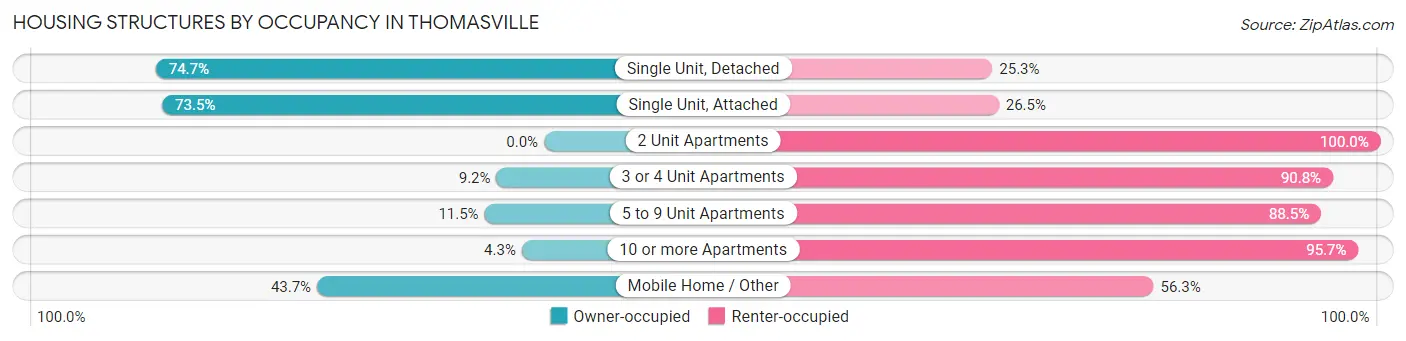
| Structure Type | Owner-occupied | Renter-occupied |
| Single Unit, Detached | 5,874 (74.7%) | 1,985 (25.3%) |
| Single Unit, Attached | 247 (73.5%) | 89 (26.5%) |
| 2 Unit Apartments | 0 (0.0%) | 445 (100.0%) |
| 3 or 4 Unit Apartments | 53 (9.2%) | 525 (90.8%) |
| 5 to 9 Unit Apartments | 62 (11.5%) | 479 (88.5%) |
| 10 or more Apartments | 29 (4.3%) | 648 (95.7%) |
| Mobile Home / Other | 153 (43.7%) | 197 (56.3%) |
| Total | 6,418 (59.5%) | 4,368 (40.5%) |
Housing Structures by Number of Rooms in Thomasville
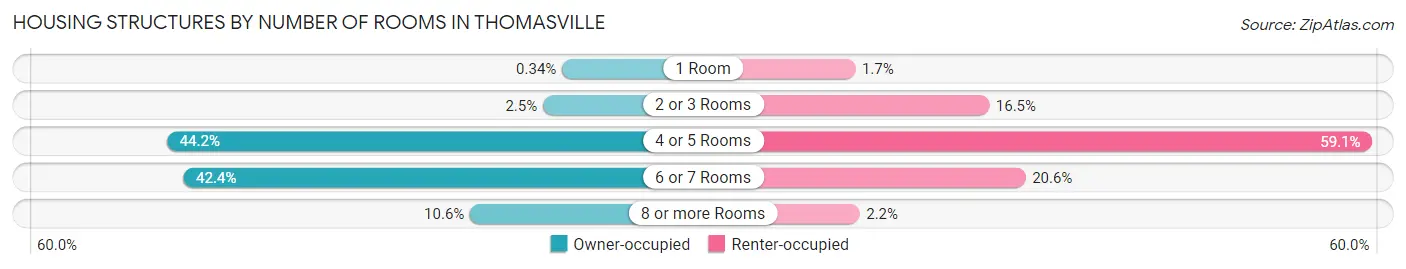
| Number of Rooms | Owner-occupied | Renter-occupied |
| 1 Room | 22 (0.3%) | 73 (1.7%) |
| 2 or 3 Rooms | 158 (2.5%) | 722 (16.5%) |
| 4 or 5 Rooms | 2,839 (44.2%) | 2,581 (59.1%) |
| 6 or 7 Rooms | 2,722 (42.4%) | 898 (20.6%) |
| 8 or more Rooms | 677 (10.5%) | 94 (2.1%) |
| Total | 6,418 (100.0%) | 4,368 (100.0%) |
Housing Structure by Heating Type in Thomasville
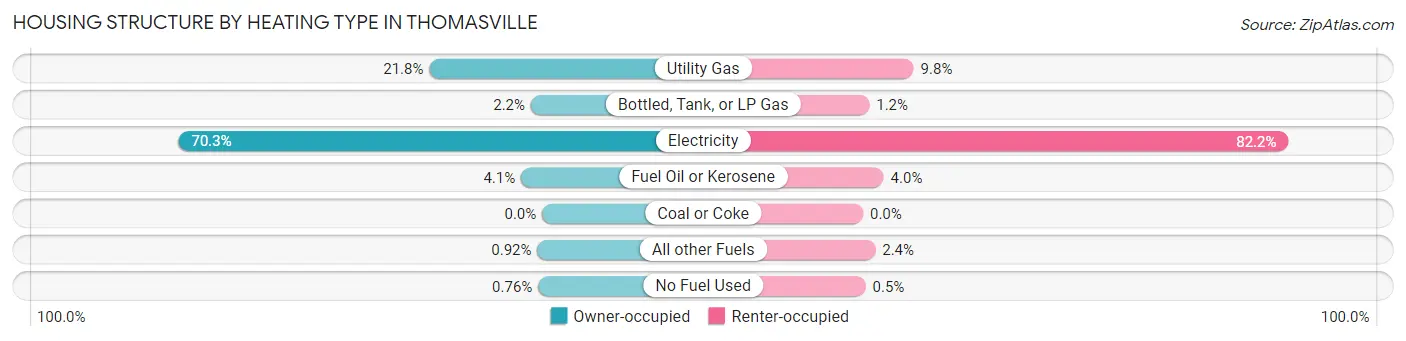
| Heating Type | Owner-occupied | Renter-occupied |
| Utility Gas | 1,399 (21.8%) | 427 (9.8%) |
| Bottled, Tank, or LP Gas | 139 (2.2%) | 53 (1.2%) |
| Electricity | 4,511 (70.3%) | 3,589 (82.2%) |
| Fuel Oil or Kerosene | 261 (4.1%) | 174 (4.0%) |
| Coal or Coke | 0 (0.0%) | 0 (0.0%) |
| All other Fuels | 59 (0.9%) | 103 (2.4%) |
| No Fuel Used | 49 (0.8%) | 22 (0.5%) |
| Total | 6,418 (100.0%) | 4,368 (100.0%) |
Household Vehicle Usage in Thomasville
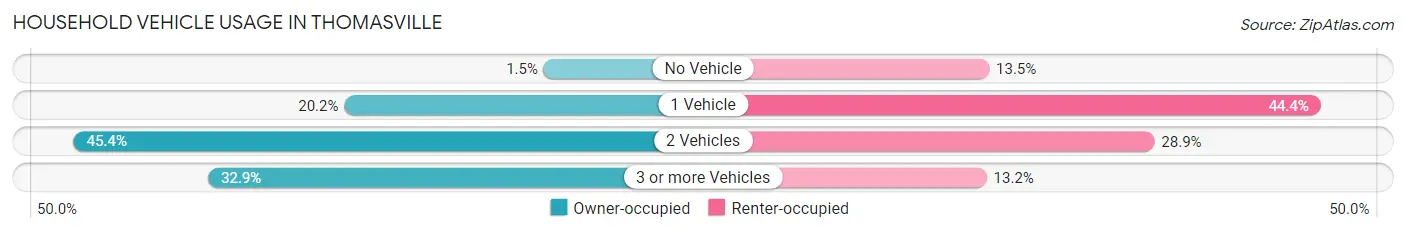
| Vehicles per Household | Owner-occupied | Renter-occupied |
| No Vehicle | 98 (1.5%) | 588 (13.5%) |
| 1 Vehicle | 1,294 (20.2%) | 1,940 (44.4%) |
| 2 Vehicles | 2,916 (45.4%) | 1,262 (28.9%) |
| 3 or more Vehicles | 2,110 (32.9%) | 578 (13.2%) |
| Total | 6,418 (100.0%) | 4,368 (100.0%) |
Real Estate & Mortgages in Thomasville
Real Estate and Mortgage Overview in Thomasville
| Characteristic | Without Mortgage | With Mortgage |
| Housing Units | 2,449 | 3,969 |
| Median Property Value | $126,200 | $157,400 |
| Median Household Income | $40,486 | $177 |
| Monthly Housing Costs | $410 | $3 |
| Real Estate Taxes | $1,260 | $68 |
Property Value by Mortgage Status in Thomasville
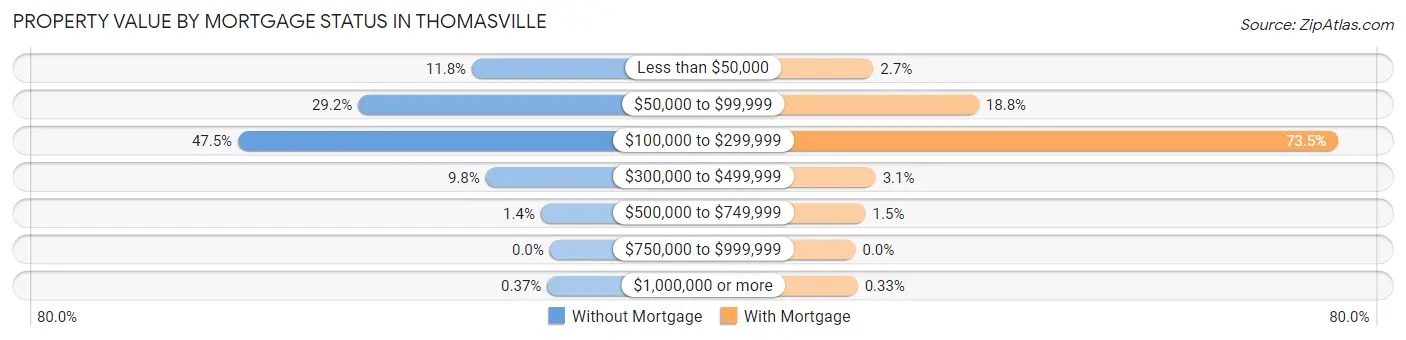
| Property Value | Without Mortgage | With Mortgage |
| Less than $50,000 | 290 (11.8%) | 108 (2.7%) |
| $50,000 to $99,999 | 715 (29.2%) | 746 (18.8%) |
| $100,000 to $299,999 | 1,163 (47.5%) | 2,919 (73.5%) |
| $300,000 to $499,999 | 239 (9.8%) | 122 (3.1%) |
| $500,000 to $749,999 | 33 (1.3%) | 61 (1.5%) |
| $750,000 to $999,999 | 0 (0.0%) | 0 (0.0%) |
| $1,000,000 or more | 9 (0.4%) | 13 (0.3%) |
| Total | 2,449 (100.0%) | 3,969 (100.0%) |
Household Income by Mortgage Status in Thomasville
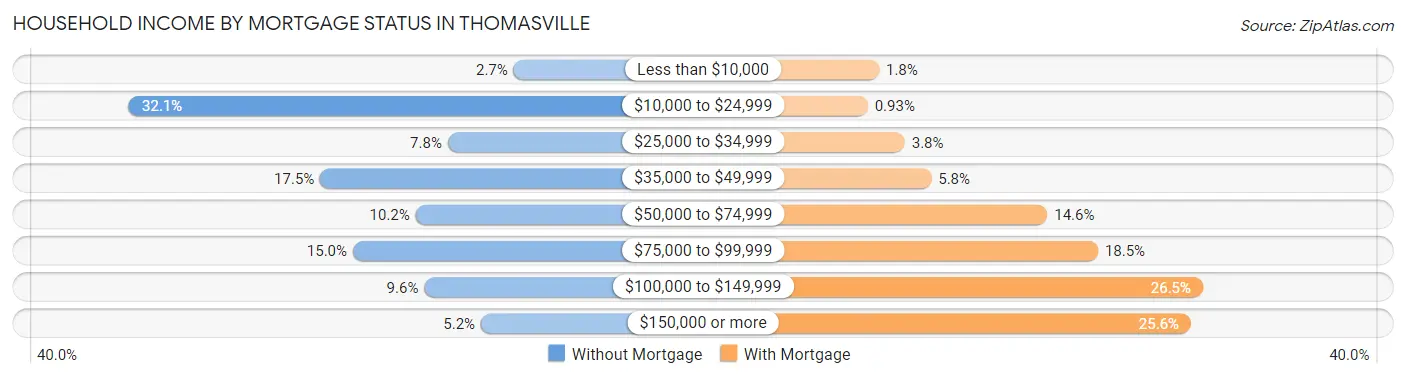
| Household Income | Without Mortgage | With Mortgage |
| Less than $10,000 | 67 (2.7%) | 71 (1.8%) |
| $10,000 to $24,999 | 785 (32.1%) | 37 (0.9%) |
| $25,000 to $34,999 | 190 (7.8%) | 149 (3.7%) |
| $35,000 to $49,999 | 428 (17.5%) | 229 (5.8%) |
| $50,000 to $74,999 | 250 (10.2%) | 580 (14.6%) |
| $75,000 to $99,999 | 367 (15.0%) | 733 (18.5%) |
| $100,000 to $149,999 | 234 (9.6%) | 1,050 (26.5%) |
| $150,000 or more | 128 (5.2%) | 1,014 (25.6%) |
| Total | 2,449 (100.0%) | 3,969 (100.0%) |
Property Value to Household Income Ratio in Thomasville
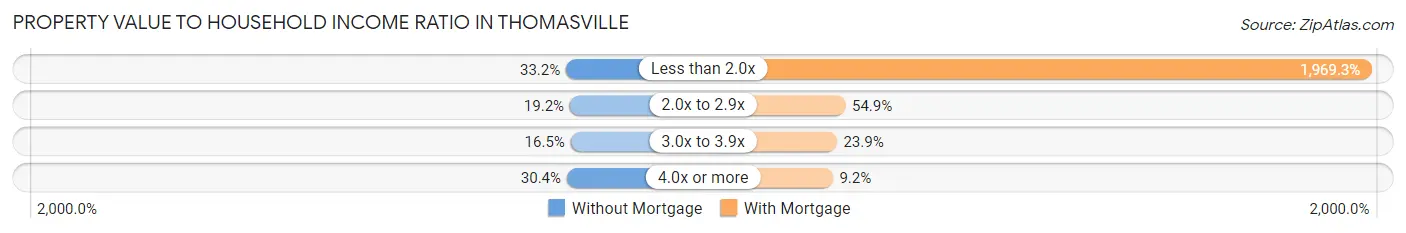
| Value-to-Income Ratio | Without Mortgage | With Mortgage |
| Less than 2.0x | 814 (33.2%) | 78,162 (1,969.3%) |
| 2.0x to 2.9x | 471 (19.2%) | 2,178 (54.9%) |
| 3.0x to 3.9x | 405 (16.5%) | 948 (23.9%) |
| 4.0x or more | 744 (30.4%) | 363 (9.1%) |
| Total | 2,449 (100.0%) | 3,969 (100.0%) |
Real Estate Taxes by Mortgage Status in Thomasville
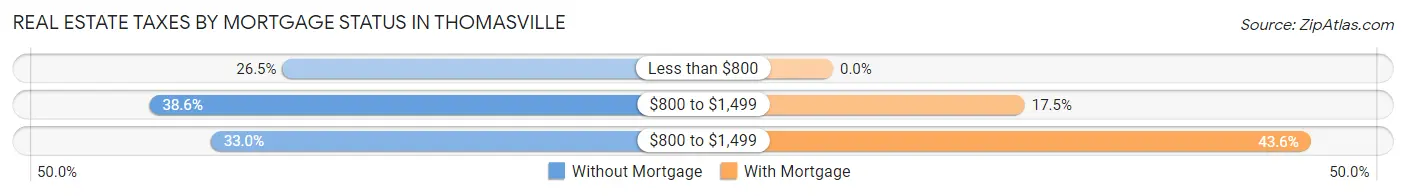
| Property Taxes | Without Mortgage | With Mortgage |
| Less than $800 | 648 (26.5%) | 0 (0.0%) |
| $800 to $1,499 | 945 (38.6%) | 695 (17.5%) |
| $800 to $1,499 | 808 (33.0%) | 1,731 (43.6%) |
| Total | 2,449 (100.0%) | 3,969 (100.0%) |
Health & Disability in Thomasville
Health Insurance Coverage by Age in Thomasville
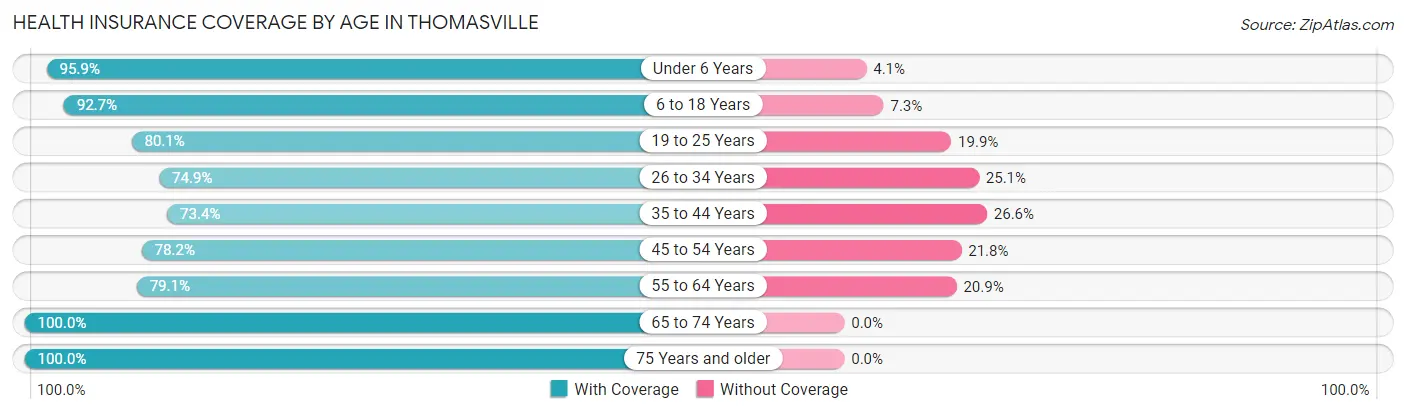
| Age Bracket | With Coverage | Without Coverage |
| Under 6 Years | 2,412 (95.9%) | 103 (4.1%) |
| 6 to 18 Years | 3,898 (92.7%) | 308 (7.3%) |
| 19 to 25 Years | 2,045 (80.1%) | 509 (19.9%) |
| 26 to 34 Years | 2,454 (74.9%) | 822 (25.1%) |
| 35 to 44 Years | 2,264 (73.4%) | 820 (26.6%) |
| 45 to 54 Years | 2,490 (78.2%) | 695 (21.8%) |
| 55 to 64 Years | 2,793 (79.1%) | 739 (20.9%) |
| 65 to 74 Years | 2,212 (100.0%) | 0 (0.0%) |
| 75 Years and older | 2,126 (100.0%) | 0 (0.0%) |
| Total | 22,694 (85.0%) | 3,996 (15.0%) |
Health Insurance Coverage by Citizenship Status in Thomasville
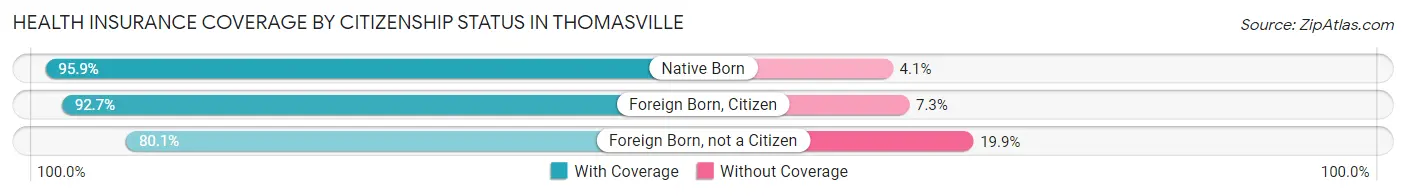
| Citizenship Status | With Coverage | Without Coverage |
| Native Born | 2,412 (95.9%) | 103 (4.1%) |
| Foreign Born, Citizen | 3,898 (92.7%) | 308 (7.3%) |
| Foreign Born, not a Citizen | 2,045 (80.1%) | 509 (19.9%) |
Health Insurance Coverage by Household Income in Thomasville
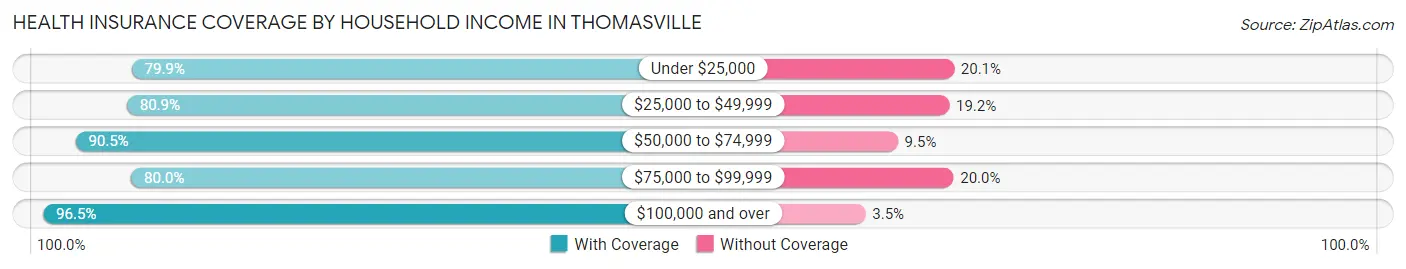
| Household Income | With Coverage | Without Coverage |
| Under $25,000 | 3,861 (79.9%) | 969 (20.1%) |
| $25,000 to $49,999 | 5,751 (80.8%) | 1,362 (19.2%) |
| $50,000 to $74,999 | 3,960 (90.5%) | 417 (9.5%) |
| $75,000 to $99,999 | 4,279 (80.0%) | 1,067 (20.0%) |
| $100,000 and over | 4,833 (96.5%) | 174 (3.5%) |
Public vs Private Health Insurance Coverage by Age in Thomasville
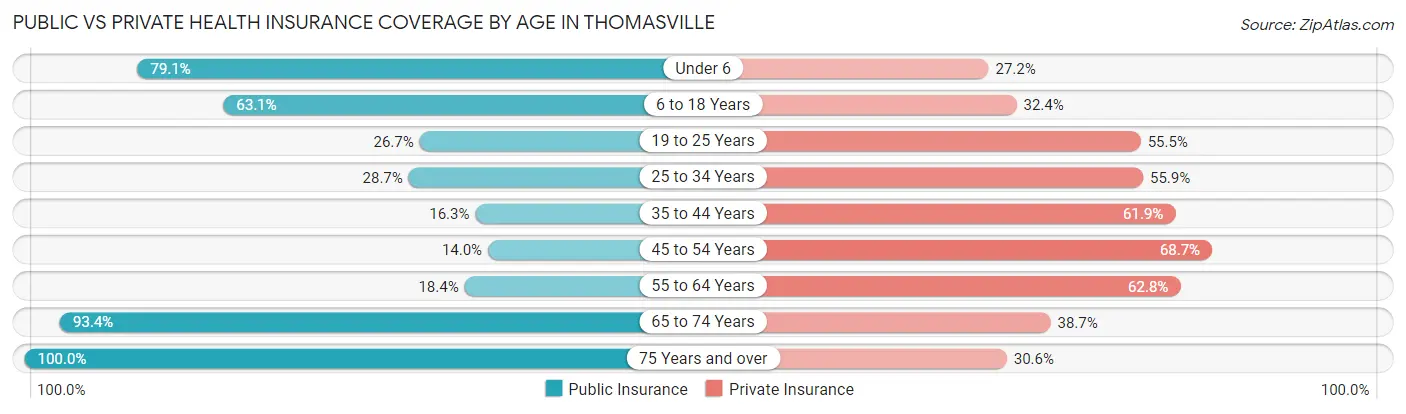
| Age Bracket | Public Insurance | Private Insurance |
| Under 6 | 1,988 (79.0%) | 685 (27.2%) |
| 6 to 18 Years | 2,654 (63.1%) | 1,364 (32.4%) |
| 19 to 25 Years | 682 (26.7%) | 1,417 (55.5%) |
| 25 to 34 Years | 941 (28.7%) | 1,832 (55.9%) |
| 35 to 44 Years | 504 (16.3%) | 1,908 (61.9%) |
| 45 to 54 Years | 446 (14.0%) | 2,188 (68.7%) |
| 55 to 64 Years | 648 (18.3%) | 2,218 (62.8%) |
| 65 to 74 Years | 2,067 (93.4%) | 857 (38.7%) |
| 75 Years and over | 2,126 (100.0%) | 651 (30.6%) |
| Total | 12,056 (45.2%) | 13,120 (49.2%) |
Disability Status by Sex by Age in Thomasville
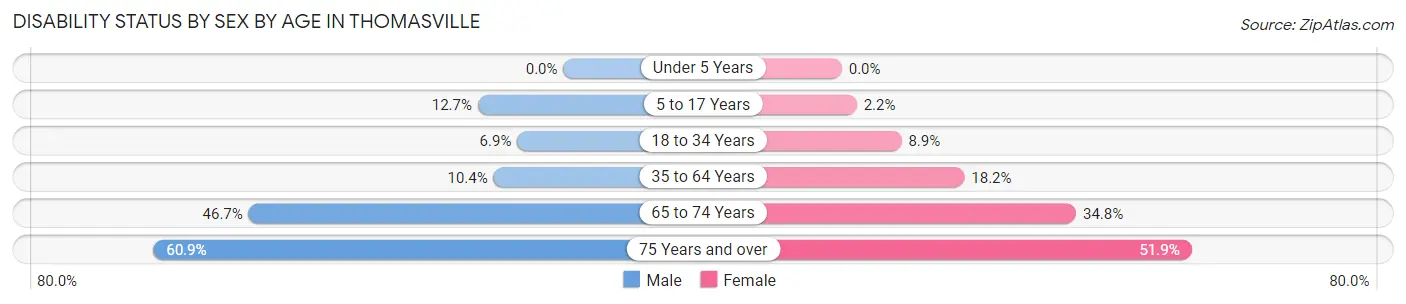
| Age Bracket | Male | Female |
| Under 5 Years | 0 (0.0%) | 0 (0.0%) |
| 5 to 17 Years | 268 (12.7%) | 53 (2.2%) |
| 18 to 34 Years | 203 (6.9%) | 274 (8.9%) |
| 35 to 64 Years | 491 (10.4%) | 922 (18.2%) |
| 65 to 74 Years | 495 (46.7%) | 401 (34.8%) |
| 75 Years and over | 422 (60.9%) | 744 (51.9%) |
Disability Class by Sex by Age in Thomasville
Disability Class: Hearing Difficulty
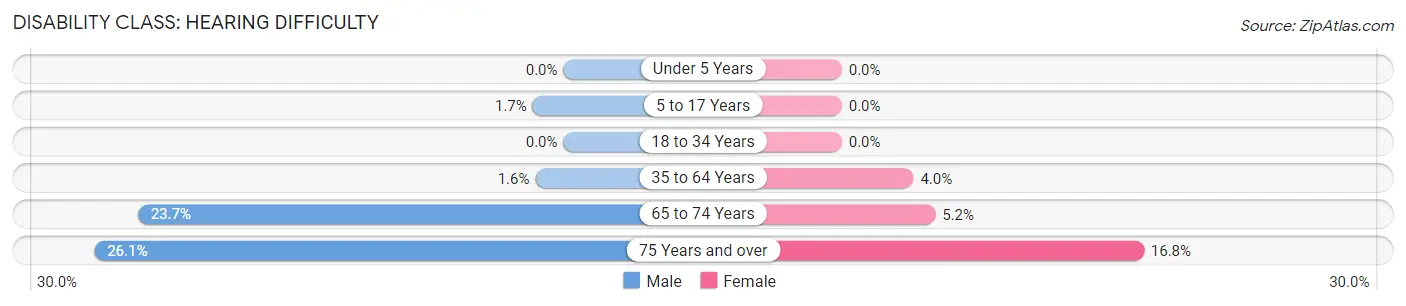
| Age Bracket | Male | Female |
| Under 5 Years | 0 (0.0%) | 0 (0.0%) |
| 5 to 17 Years | 36 (1.7%) | 0 (0.0%) |
| 18 to 34 Years | 0 (0.0%) | 0 (0.0%) |
| 35 to 64 Years | 74 (1.6%) | 202 (4.0%) |
| 65 to 74 Years | 251 (23.7%) | 60 (5.2%) |
| 75 Years and over | 181 (26.1%) | 241 (16.8%) |
Disability Class: Vision Difficulty
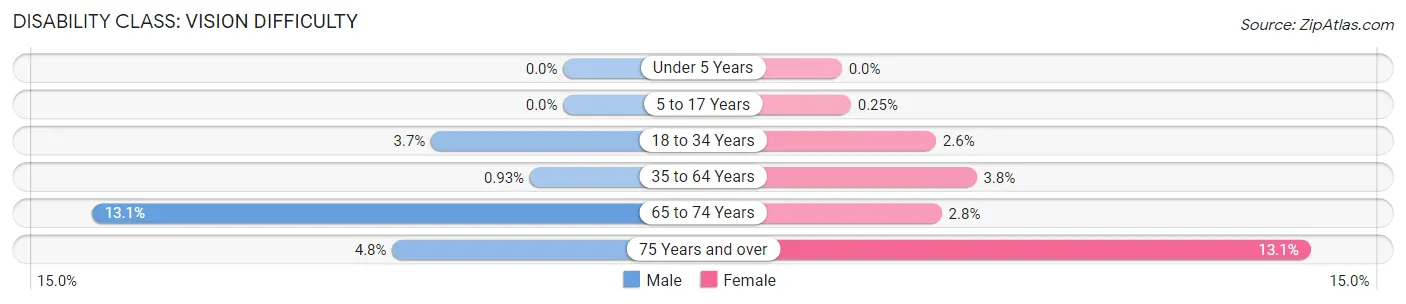
| Age Bracket | Male | Female |
| Under 5 Years | 0 (0.0%) | 0 (0.0%) |
| 5 to 17 Years | 0 (0.0%) | 6 (0.3%) |
| 18 to 34 Years | 109 (3.7%) | 81 (2.6%) |
| 35 to 64 Years | 44 (0.9%) | 190 (3.7%) |
| 65 to 74 Years | 139 (13.1%) | 32 (2.8%) |
| 75 Years and over | 33 (4.8%) | 187 (13.1%) |
Disability Class: Cognitive Difficulty
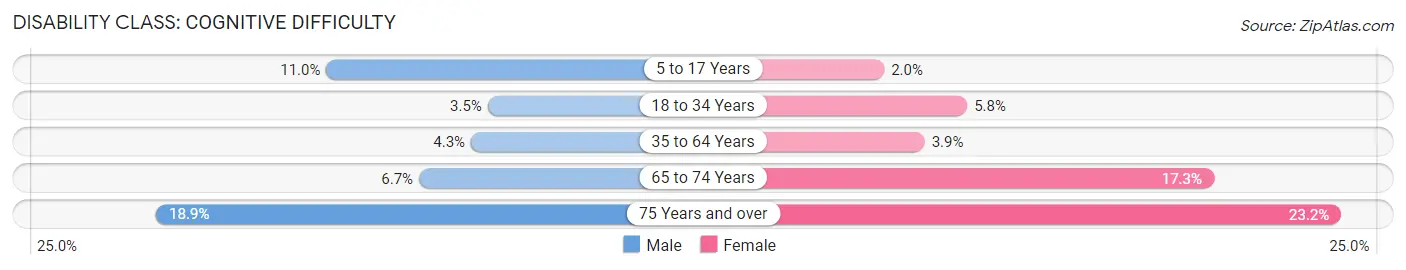
| Age Bracket | Male | Female |
| 5 to 17 Years | 232 (11.0%) | 47 (2.0%) |
| 18 to 34 Years | 104 (3.5%) | 180 (5.8%) |
| 35 to 64 Years | 203 (4.3%) | 195 (3.8%) |
| 65 to 74 Years | 71 (6.7%) | 199 (17.3%) |
| 75 Years and over | 131 (18.9%) | 332 (23.2%) |
Disability Class: Ambulatory Difficulty
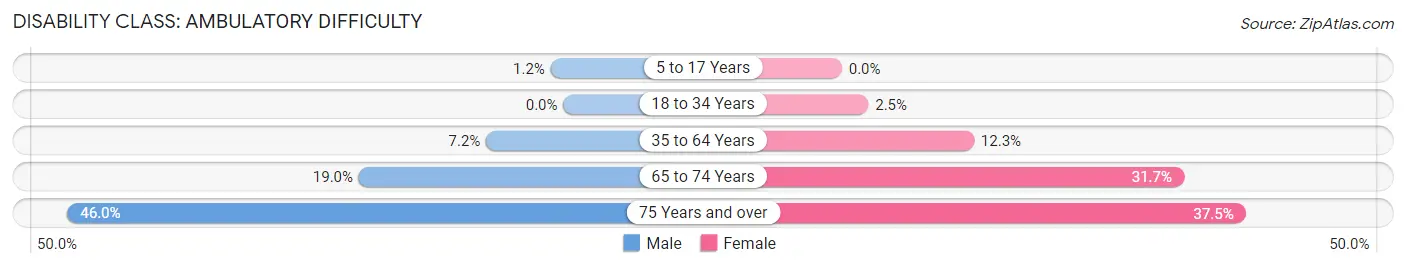
| Age Bracket | Male | Female |
| 5 to 17 Years | 25 (1.2%) | 0 (0.0%) |
| 18 to 34 Years | 0 (0.0%) | 76 (2.5%) |
| 35 to 64 Years | 339 (7.2%) | 621 (12.3%) |
| 65 to 74 Years | 201 (19.0%) | 366 (31.7%) |
| 75 Years and over | 319 (46.0%) | 537 (37.5%) |
Disability Class: Self-Care Difficulty
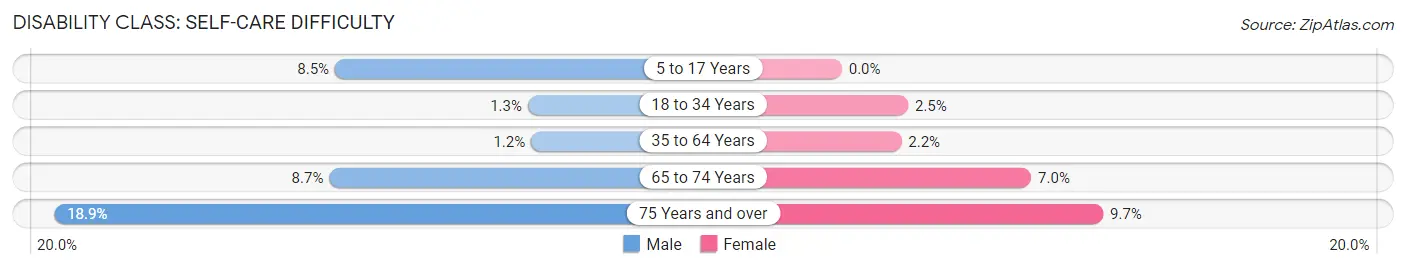
| Age Bracket | Male | Female |
| 5 to 17 Years | 179 (8.5%) | 0 (0.0%) |
| 18 to 34 Years | 39 (1.3%) | 76 (2.5%) |
| 35 to 64 Years | 57 (1.2%) | 112 (2.2%) |
| 65 to 74 Years | 92 (8.7%) | 81 (7.0%) |
| 75 Years and over | 131 (18.9%) | 139 (9.7%) |
Technology Access in Thomasville
Computing Device Access in Thomasville
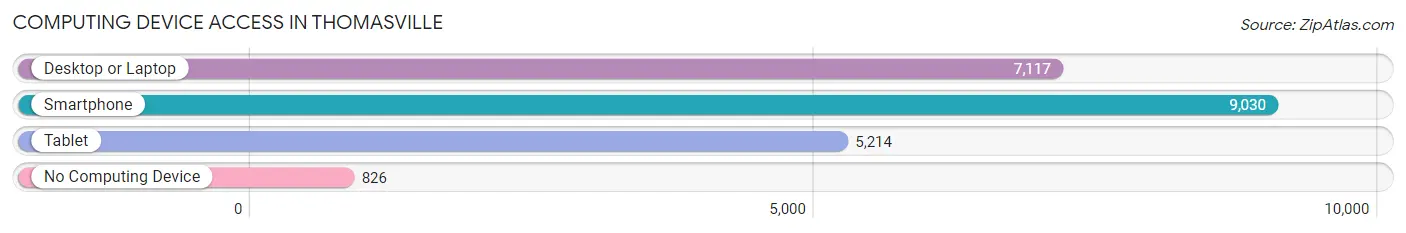
| Device Type | # Households | % Households |
| Desktop or Laptop | 7,117 | 66.0% |
| Smartphone | 9,030 | 83.7% |
| Tablet | 5,214 | 48.3% |
| No Computing Device | 826 | 7.7% |
| Total | 10,786 | 100.0% |
Internet Access in Thomasville
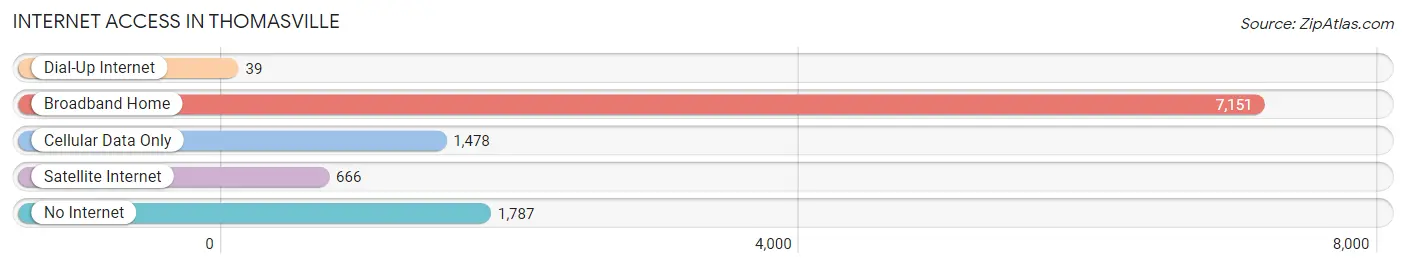
| Internet Type | # Households | % Households |
| Dial-Up Internet | 39 | 0.4% |
| Broadband Home | 7,151 | 66.3% |
| Cellular Data Only | 1,478 | 13.7% |
| Satellite Internet | 666 | 6.2% |
| No Internet | 1,787 | 16.6% |
| Total | 10,786 | 100.0% |
Thomasville Summary
Thomasville, NC is a small city located in Davidson County, North Carolina. It is situated in the Piedmont region of the state, approximately 40 miles north of Winston-Salem and 60 miles south of Greensboro. The city is home to a population of approximately 26,000 people, making it the largest city in Davidson County.
History
Thomasville was founded in 1852 by William Thomas, a local farmer and businessman. The city was named after him and was incorporated in 1873. The city quickly grew and became a major center for the production of furniture, textiles, and other goods. The city was also home to several major tobacco companies, including R.J. Reynolds and Brown & Williamson.
In the early 20th century, Thomasville was a major stop on the Seaboard Air Line Railway, which connected the city to other major cities in the region. The city was also home to several military bases during World War II, including Camp Butner and Camp Rucker.
Geography
Thomasville is located in the Piedmont region of North Carolina, approximately 40 miles north of Winston-Salem and 60 miles south of Greensboro. The city is situated in the Yadkin Valley, which is part of the larger Appalachian Mountains region. The city is located at an elevation of approximately 800 feet above sea level.
The city is located in a humid subtropical climate zone, with hot, humid summers and mild winters. The average annual temperature is around 60 degrees Fahrenheit, with an average high of around 80 degrees in the summer and an average low of around 40 degrees in the winter.
Economy
Thomasville’s economy is largely based on manufacturing and agriculture. The city is home to several major furniture manufacturers, including Thomasville Furniture Industries, which is the largest employer in the city. Other major employers include the Thomasville Regional Medical Center, the Davidson County Schools, and the Thomasville Times.
Agriculture is also an important part of the local economy, with the city being home to several large farms. The city is also home to several wineries, including the Yadkin Valley Winery and the Thomasville Winery.
Demographics
As of the 2010 census, Thomasville had a population of 26,757 people. The racial makeup of the city was 73.3% White, 19.2% African American, 0.4% Native American, 1.2% Asian, 0.1% Pacific Islander, and 4.8% from other races. Hispanic or Latino of any race were 8.2% of the population.
The median household income in Thomasville was $37,845, and the median family income was $45,945. The per capita income was $20,945. About 17.2% of the population was below the poverty line.
Thomasville is home to several churches, including the Thomasville United Methodist Church, the Thomasville Baptist Church, and the Thomasville Presbyterian Church. The city is also home to several schools, including Thomasville High School, Thomasville Middle School, and Thomasville Elementary School.
Common Questions
What is Per Capita Income in Thomasville?
Per Capita income in Thomasville is $25,013.
What is the Median Family Income in Thomasville?
Median Family Income in Thomasville is $64,227.
What is the Median Household income in Thomasville?
Median Household Income in Thomasville is $48,457.
What is Income or Wage Gap in Thomasville?
Income or Wage Gap in Thomasville is 25.6%.
Women in Thomasville earn 74.4 cents for every dollar earned by a man.
What is Inequality or Gini Index in Thomasville?
Inequality or Gini Index in Thomasville is 0.42.
What is the Total Population of Thomasville?
Total Population of Thomasville is 27,130.
What is the Total Male Population of Thomasville?
Total Male Population of Thomasville is 12,401.
What is the Total Female Population of Thomasville?
Total Female Population of Thomasville is 14,729.
What is the Ratio of Males per 100 Females in Thomasville?
There are 84.19 Males per 100 Females in Thomasville.
What is the Ratio of Females per 100 Males in Thomasville?
There are 118.77 Females per 100 Males in Thomasville.
What is the Median Population Age in Thomasville?
Median Population Age in Thomasville is 37.8 Years.
What is the Average Family Size in Thomasville
Average Family Size in Thomasville is 3.0 People.
What is the Average Household Size in Thomasville
Average Household Size in Thomasville is 2.5 People.
How Large is the Labor Force in Thomasville?
There are 12,528 People in the Labor Forcein in Thomasville.
What is the Percentage of People in the Labor Force in Thomasville?
58.6% of People are in the Labor Force in Thomasville.
What is the Unemployment Rate in Thomasville?
Unemployment Rate in Thomasville is 5.2%.