Greenbelt, MD Map & Demographics
Greenbelt Map
Greenbelt Overview
$44,710
PER CAPITA INCOME
$108,041
AVG FAMILY INCOME
$82,019
AVG HOUSEHOLD INCOME
5.0%
WAGE / INCOME GAP [ % ]
95.0¢/ $1
WAGE / INCOME GAP [ $ ]
$12,884
FAMILY INCOME DEFICIT
0.46
INEQUALITY / GINI INDEX
24,646
TOTAL POPULATION
11,465
MALE POPULATION
13,181
FEMALE POPULATION
86.98
MALES / 100 FEMALES
114.97
FEMALES / 100 MALES
37.2
MEDIAN AGE
3.2
AVG FAMILY SIZE
2.4
AVG HOUSEHOLD SIZE
14,551
LABOR FORCE [ PEOPLE ]
73.7%
PERCENT IN LABOR FORCE
8.6%
UNEMPLOYMENT RATE
Greenbelt Zip Codes
Income in Greenbelt
Income Overview in Greenbelt
Per Capita Income in Greenbelt is $44,710, while median incomes of families and households are $108,041 and $82,019 respectively.
| Characteristic | Number | Measure |
| Per Capita Income | 24,646 | $44,710 |
| Median Family Income | 5,754 | $108,041 |
| Mean Family Income | 5,754 | $128,780 |
| Median Household Income | 10,235 | $82,019 |
| Mean Household Income | 10,235 | $106,273 |
| Income Deficit | 5,754 | $12,884 |
| Wage / Income Gap (%) | 24,646 | 4.96% |
| Wage / Income Gap ($) | 24,646 | 95.04¢ per $1 |
| Gini / Inequality Index | 24,646 | 0.46 |
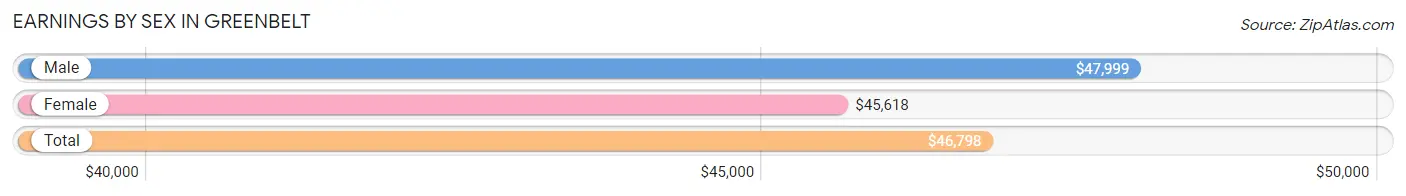
Earnings by Sex in Greenbelt
Average Earnings in Greenbelt are $46,798, $47,999 for men and $45,618 for women, a difference of 5.0%.
| Sex | Number | Average Earnings |
| Male | 7,162 (49.1%) | $47,999 |
| Female | 7,430 (50.9%) | $45,618 |
| Total | 14,592 (100.0%) | $46,798 |
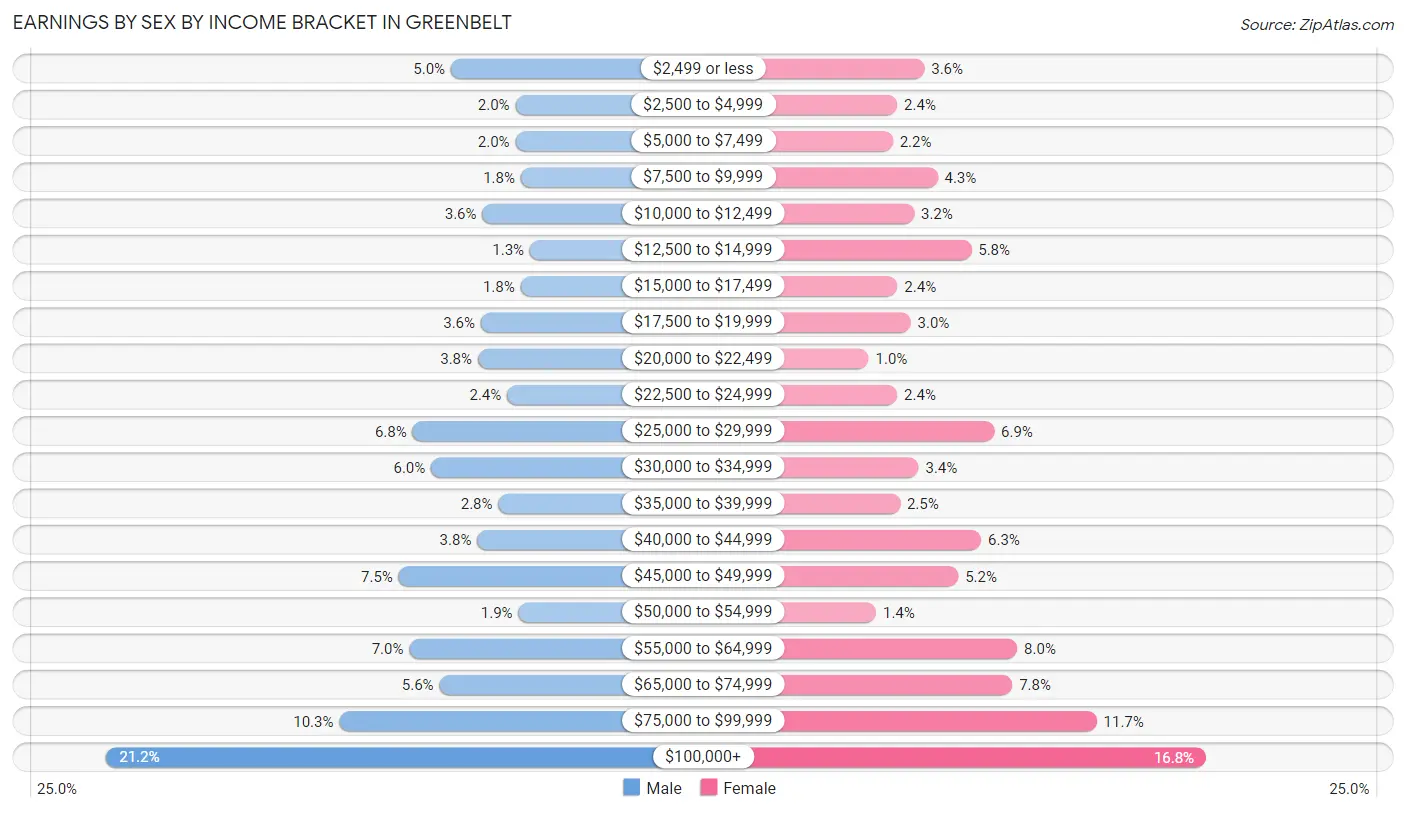
Earnings by Sex by Income Bracket in Greenbelt
The most common earnings brackets in Greenbelt are $100,000+ for men (1,516 | 21.2%) and $100,000+ for women (1,250 | 16.8%).
| Income | Male | Female |
| $2,499 or less | 360 (5.0%) | 270 (3.6%) |
| $2,500 to $4,999 | 144 (2.0%) | 175 (2.4%) |
| $5,000 to $7,499 | 144 (2.0%) | 160 (2.1%) |
| $7,500 to $9,999 | 126 (1.8%) | 316 (4.3%) |
| $10,000 to $12,499 | 255 (3.6%) | 234 (3.2%) |
| $12,500 to $14,999 | 95 (1.3%) | 433 (5.8%) |
| $15,000 to $17,499 | 127 (1.8%) | 176 (2.4%) |
| $17,500 to $19,999 | 260 (3.6%) | 222 (3.0%) |
| $20,000 to $22,499 | 270 (3.8%) | 76 (1.0%) |
| $22,500 to $24,999 | 172 (2.4%) | 175 (2.4%) |
| $25,000 to $29,999 | 489 (6.8%) | 513 (6.9%) |
| $30,000 to $34,999 | 427 (6.0%) | 250 (3.4%) |
| $35,000 to $39,999 | 201 (2.8%) | 185 (2.5%) |
| $40,000 to $44,999 | 272 (3.8%) | 467 (6.3%) |
| $45,000 to $49,999 | 536 (7.5%) | 388 (5.2%) |
| $50,000 to $54,999 | 134 (1.9%) | 102 (1.4%) |
| $55,000 to $64,999 | 500 (7.0%) | 593 (8.0%) |
| $65,000 to $74,999 | 399 (5.6%) | 576 (7.7%) |
| $75,000 to $99,999 | 735 (10.3%) | 869 (11.7%) |
| $100,000+ | 1,516 (21.2%) | 1,250 (16.8%) |
| Total | 7,162 (100.0%) | 7,430 (100.0%) |
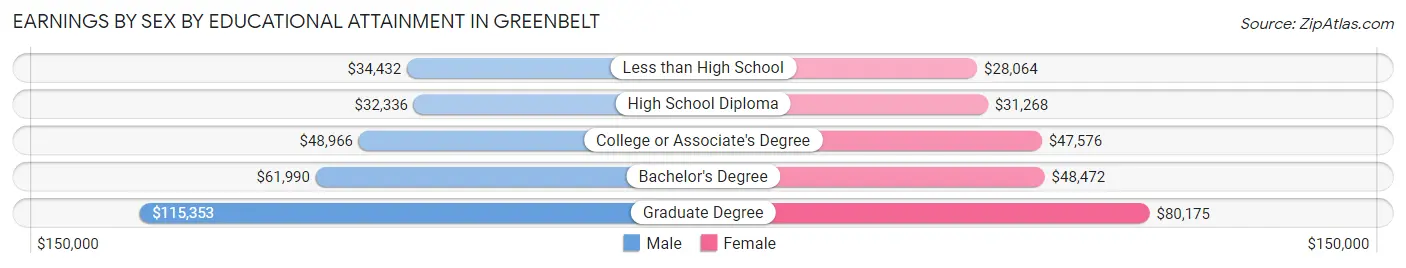
Earnings by Sex by Educational Attainment in Greenbelt
Average earnings in Greenbelt are $51,784 for men and $50,966 for women, a difference of 1.6%. Men with an educational attainment of graduate degree enjoy the highest average annual earnings of $115,353, while those with high school diploma education earn the least with $32,336. Women with an educational attainment of graduate degree earn the most with the average annual earnings of $80,175, while those with less than high school education have the smallest earnings of $28,064.
| Educational Attainment | Male Income | Female Income |
| Less than High School | $34,432 | $28,064 |
| High School Diploma | $32,336 | $31,268 |
| College or Associate's Degree | $48,966 | $47,576 |
| Bachelor's Degree | $61,990 | $48,472 |
| Graduate Degree | $115,353 | $80,175 |
| Total | $51,784 | $50,966 |
Family Income in Greenbelt
Family Income Brackets in Greenbelt
According to the Greenbelt family income data, there are 1,485 families falling into the $100,000 to $149,999 income range, which is the most common income bracket and makes up 25.8% of all families. Conversely, the $25,000 to $34,999 income bracket is the least frequent group with only 104 families (1.8%) belonging to this category.
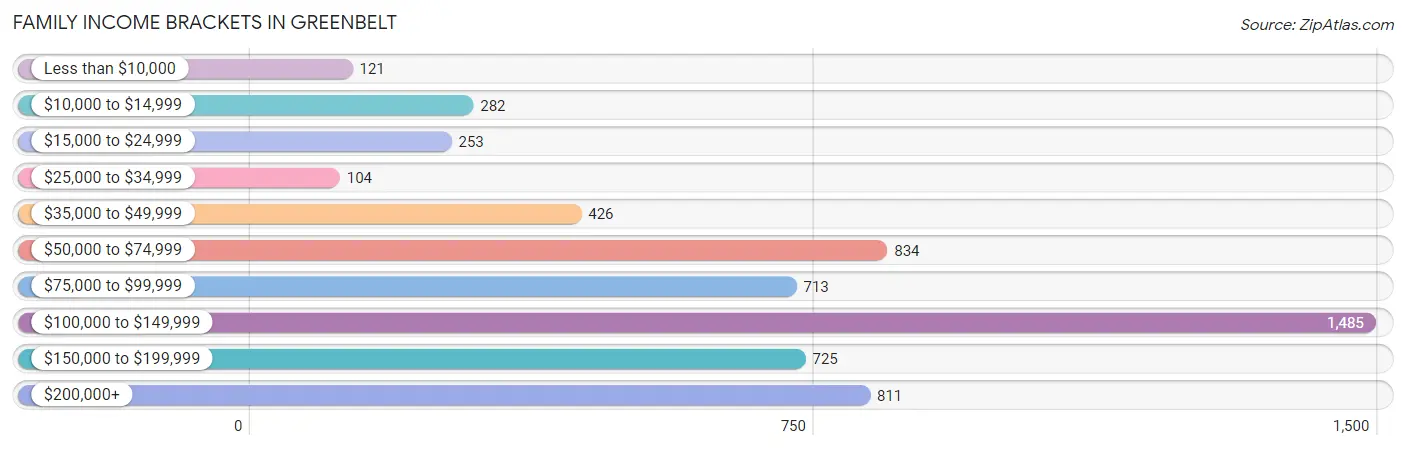
| Income Bracket | # Families | % Families |
| Less than $10,000 | 121 | 2.1% |
| $10,000 to $14,999 | 282 | 4.9% |
| $15,000 to $24,999 | 253 | 4.4% |
| $25,000 to $34,999 | 104 | 1.8% |
| $35,000 to $49,999 | 426 | 7.4% |
| $50,000 to $74,999 | 834 | 14.5% |
| $75,000 to $99,999 | 713 | 12.4% |
| $100,000 to $149,999 | 1,485 | 25.8% |
| $150,000 to $199,999 | 725 | 12.6% |
| $200,000+ | 811 | 14.1% |
Family Income by Famaliy Size in Greenbelt
3-person families (1,274 | 22.1%) account for the highest median family income in Greenbelt with $135,021 per family, while 2-person families (2,466 | 42.9%) have the highest median income of $54,218 per family member.
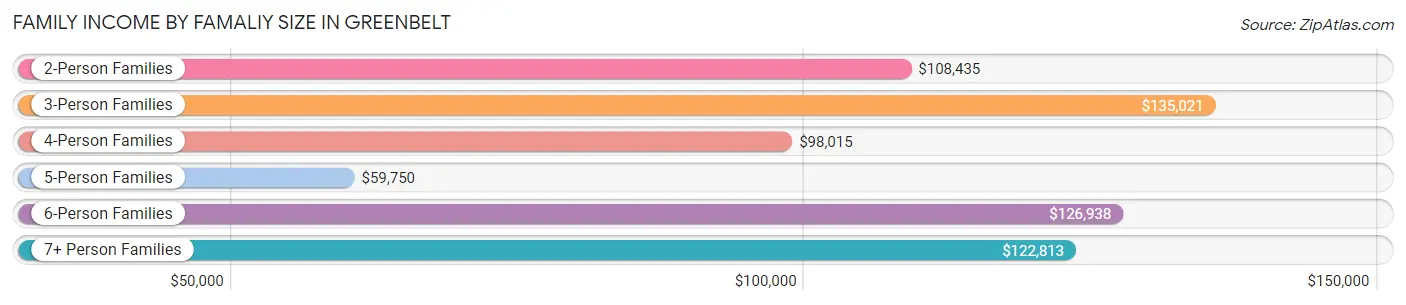
| Income Bracket | # Families | Median Income |
| 2-Person Families | 2,466 (42.9%) | $108,435 |
| 3-Person Families | 1,274 (22.1%) | $135,021 |
| 4-Person Families | 1,261 (21.9%) | $98,015 |
| 5-Person Families | 523 (9.1%) | $59,750 |
| 6-Person Families | 165 (2.9%) | $126,938 |
| 7+ Person Families | 65 (1.1%) | $122,813 |
| Total | 5,754 (100.0%) | $108,041 |
Family Income by Number of Earners in Greenbelt
The median family income in Greenbelt is $108,041, with families comprising 3+ earners (1,003) having the highest median family income of $137,793, while families with 1 earner (1,766) have the lowest median family income of $72,900, accounting for 17.4% and 30.7% of families, respectively.
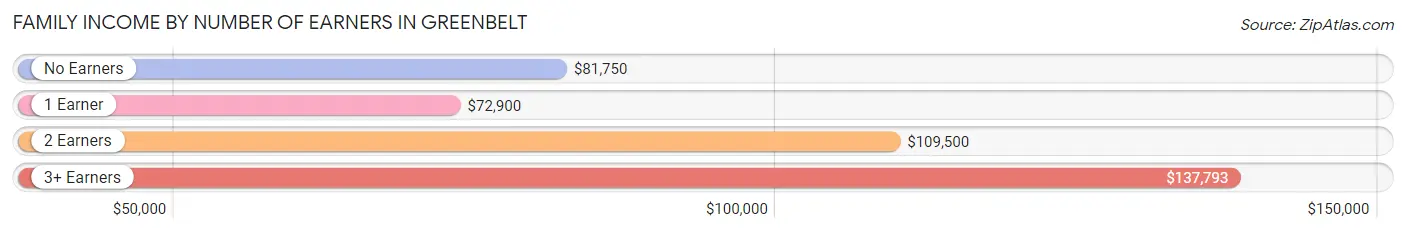
| Number of Earners | # Families | Median Income |
| No Earners | 245 (4.3%) | $81,750 |
| 1 Earner | 1,766 (30.7%) | $72,900 |
| 2 Earners | 2,740 (47.6%) | $109,500 |
| 3+ Earners | 1,003 (17.4%) | $137,793 |
| Total | 5,754 (100.0%) | $108,041 |
Household Income in Greenbelt
Household Income Brackets in Greenbelt
With 2,119 households falling in the category, the $100,000 to $149,999 income range is the most frequent in Greenbelt, accounting for 20.7% of all households. In contrast, only 368 households (3.6%) fall into the $25,000 to $34,999 income bracket, making it the least populous group.
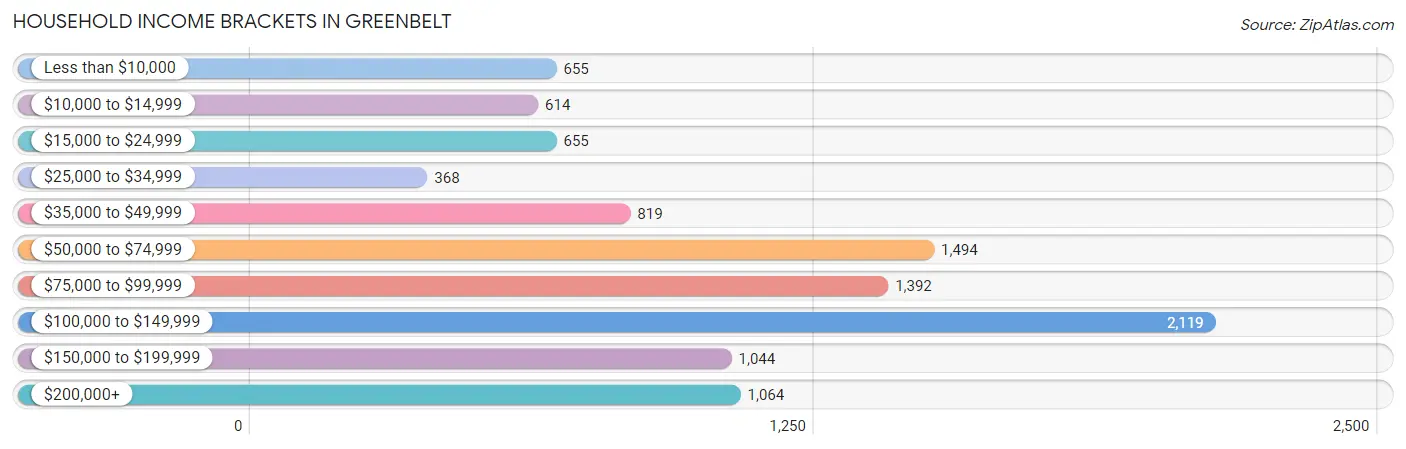
| Income Bracket | # Households | % Households |
| Less than $10,000 | 655 | 6.4% |
| $10,000 to $14,999 | 614 | 6.0% |
| $15,000 to $24,999 | 655 | 6.4% |
| $25,000 to $34,999 | 368 | 3.6% |
| $35,000 to $49,999 | 819 | 8.0% |
| $50,000 to $74,999 | 1,494 | 14.6% |
| $75,000 to $99,999 | 1,392 | 13.6% |
| $100,000 to $149,999 | 2,119 | 20.7% |
| $150,000 to $199,999 | 1,044 | 10.2% |
| $200,000+ | 1,064 | 10.4% |
Household Income by Householder Age in Greenbelt
The median household income in Greenbelt is $82,019, with the highest median household income of $108,969 found in the 45 to 64 years age bracket for the primary householder. A total of 3,971 households (38.8%) fall into this category. Meanwhile, the 15 to 24 years age bracket for the primary householder has the lowest median household income of $0, with 431 households (4.2%) in this group.
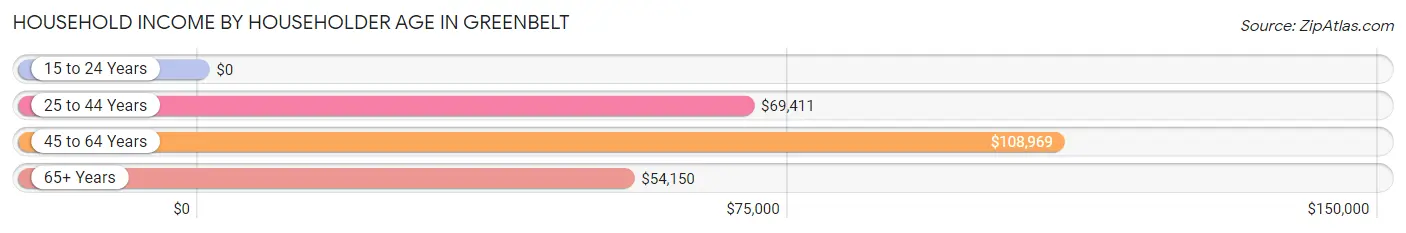
| Income Bracket | # Households | Median Income |
| 15 to 24 Years | 431 (4.2%) | $0 |
| 25 to 44 Years | 3,343 (32.7%) | $69,411 |
| 45 to 64 Years | 3,971 (38.8%) | $108,969 |
| 65+ Years | 2,490 (24.3%) | $54,150 |
| Total | 10,235 (100.0%) | $82,019 |
Poverty in Greenbelt
Income Below Poverty by Sex and Age in Greenbelt
With 11.9% poverty level for males and 16.9% for females among the residents of Greenbelt, 6 to 11 year old males and 12 to 14 year old females are the most vulnerable to poverty, with 338 males (42.0%) and 288 females (46.2%) in their respective age groups living below the poverty level.
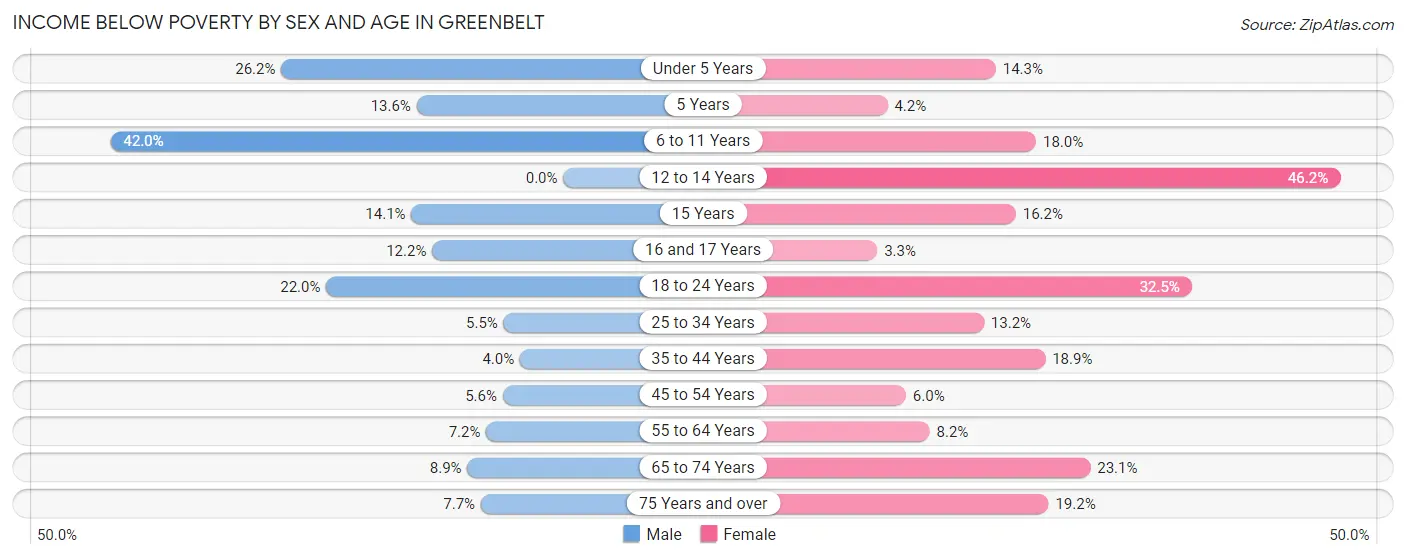
| Age Bracket | Male | Female |
| Under 5 Years | 200 (26.2%) | 110 (14.3%) |
| 5 Years | 20 (13.6%) | 5 (4.2%) |
| 6 to 11 Years | 338 (42.0%) | 119 (18.0%) |
| 12 to 14 Years | 0 (0.0%) | 288 (46.2%) |
| 15 Years | 32 (14.1%) | 31 (16.2%) |
| 16 and 17 Years | 32 (12.2%) | 8 (3.3%) |
| 18 to 24 Years | 280 (22.0%) | 362 (32.5%) |
| 25 to 34 Years | 107 (5.5%) | 238 (13.2%) |
| 35 to 44 Years | 62 (4.0%) | 318 (18.9%) |
| 45 to 54 Years | 88 (5.6%) | 103 (5.9%) |
| 55 to 64 Years | 81 (7.1%) | 172 (8.2%) |
| 65 to 74 Years | 85 (8.9%) | 372 (23.1%) |
| 75 Years and over | 26 (7.6%) | 84 (19.2%) |
| Total | 1,351 (11.9%) | 2,210 (16.9%) |
Income Above Poverty by Sex and Age in Greenbelt
According to the poverty statistics in Greenbelt, males aged 12 to 14 years and females aged 16 and 17 years are the age groups that are most secure financially, with 100.0% of males and 96.7% of females in these age groups living above the poverty line.
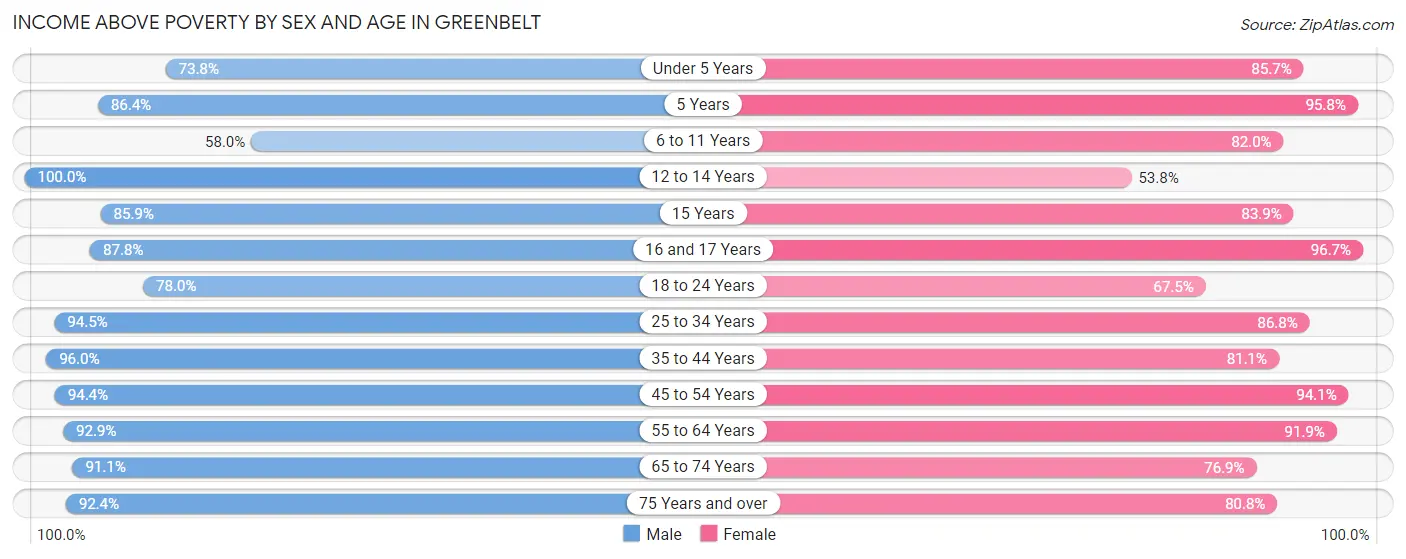
| Age Bracket | Male | Female |
| Under 5 Years | 564 (73.8%) | 660 (85.7%) |
| 5 Years | 127 (86.4%) | 113 (95.8%) |
| 6 to 11 Years | 466 (58.0%) | 541 (82.0%) |
| 12 to 14 Years | 439 (100.0%) | 335 (53.8%) |
| 15 Years | 195 (85.9%) | 161 (83.9%) |
| 16 and 17 Years | 231 (87.8%) | 235 (96.7%) |
| 18 to 24 Years | 993 (78.0%) | 753 (67.5%) |
| 25 to 34 Years | 1,824 (94.5%) | 1,567 (86.8%) |
| 35 to 44 Years | 1,482 (96.0%) | 1,366 (81.1%) |
| 45 to 54 Years | 1,477 (94.4%) | 1,628 (94.1%) |
| 55 to 64 Years | 1,052 (92.8%) | 1,939 (91.8%) |
| 65 to 74 Years | 870 (91.1%) | 1,241 (76.9%) |
| 75 Years and over | 314 (92.3%) | 354 (80.8%) |
| Total | 10,034 (88.1%) | 10,893 (83.1%) |
Income Below Poverty Among Married-Couple Families in Greenbelt
The poverty statistics for married-couple families in Greenbelt show that 4.3% or 132 of the total 3,104 families live below the poverty line. Families with 1 or 2 children have the highest poverty rate of 7.9%, comprising of 100 families. On the other hand, families with 3 or 4 children have the lowest poverty rate of 0.0%, which includes 0 families.
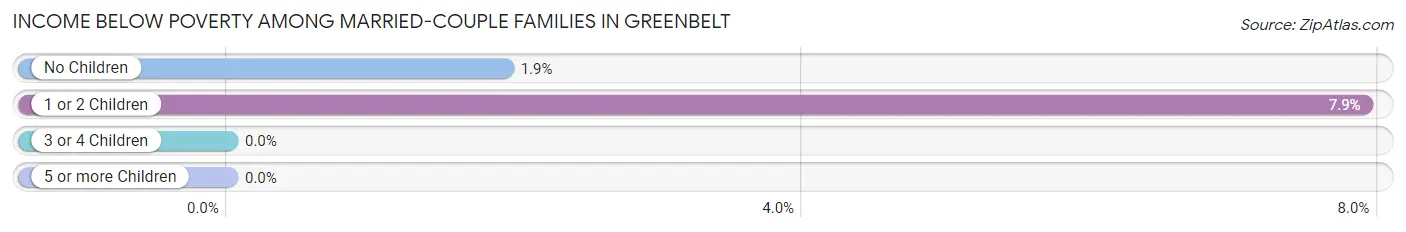
| Children | Above Poverty | Below Poverty |
| No Children | 1,634 (98.1%) | 32 (1.9%) |
| 1 or 2 Children | 1,166 (92.1%) | 100 (7.9%) |
| 3 or 4 Children | 172 (100.0%) | 0 (0.0%) |
| 5 or more Children | 0 (0.0%) | 0 (0.0%) |
| Total | 2,972 (95.8%) | 132 (4.3%) |
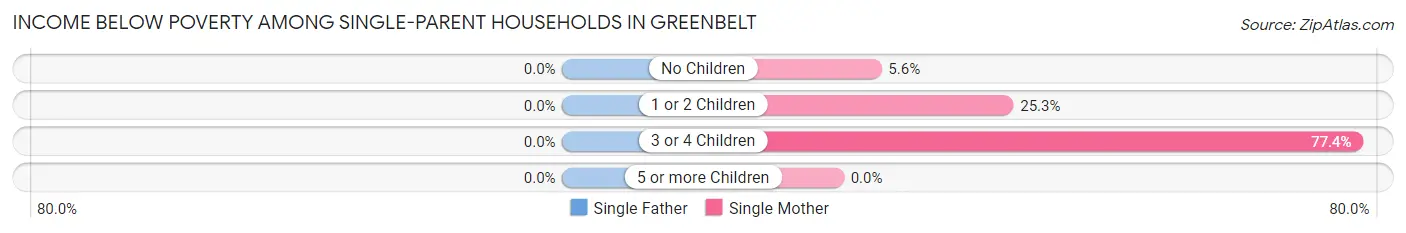
Income Below Poverty Among Single-Parent Households in Greenbelt
| Children | Single Father | Single Mother |
| No Children | 0 (0.0%) | 53 (5.6%) |
| 1 or 2 Children | 0 (0.0%) | 223 (25.3%) |
| 3 or 4 Children | 0 (0.0%) | 192 (77.4%) |
| 5 or more Children | 0 (0.0%) | 0 (0.0%) |
| Total | 0 (0.0%) | 468 (22.6%) |
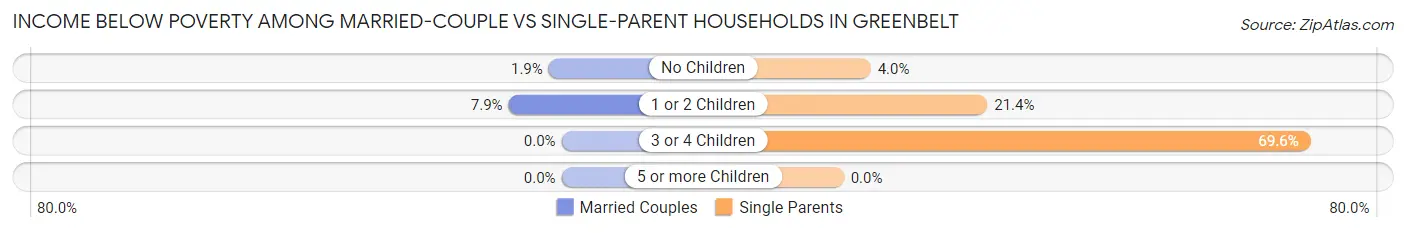
Income Below Poverty Among Married-Couple vs Single-Parent Households in Greenbelt
The poverty data for Greenbelt shows that 132 of the married-couple family households (4.3%) and 468 of the single-parent households (17.7%) are living below the poverty level. Within the married-couple family households, those with 1 or 2 children have the highest poverty rate, with 100 households (7.9%) falling below the poverty line. Among the single-parent households, those with 3 or 4 children have the highest poverty rate, with 192 household (69.6%) living below poverty.
| Children | Married-Couple Families | Single-Parent Households |
| No Children | 32 (1.9%) | 53 (4.0%) |
| 1 or 2 Children | 100 (7.9%) | 223 (21.4%) |
| 3 or 4 Children | 0 (0.0%) | 192 (69.6%) |
| 5 or more Children | 0 (0.0%) | 0 (0.0%) |
| Total | 132 (4.3%) | 468 (17.7%) |
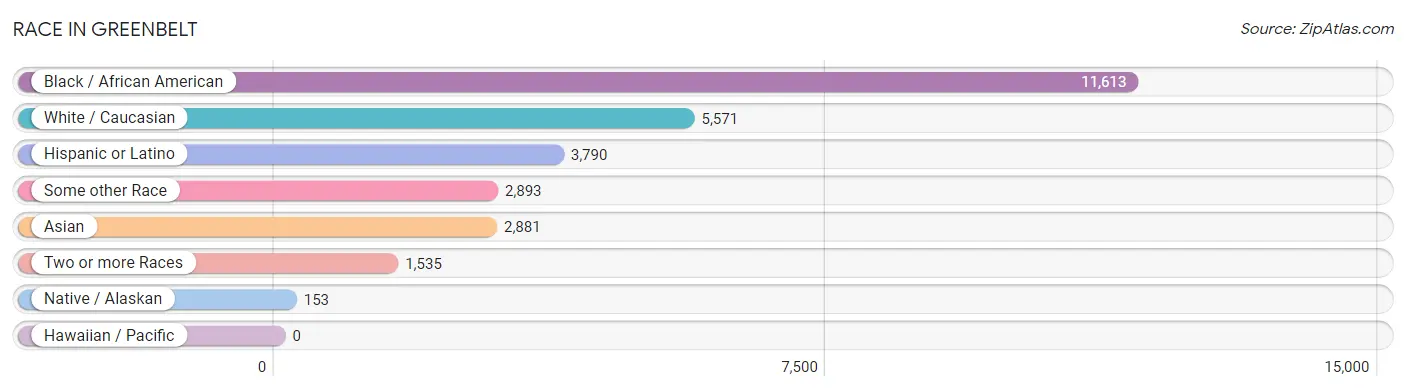
Race in Greenbelt
The most populous races in Greenbelt are Black / African American (11,613 | 47.1%), White / Caucasian (5,571 | 22.6%), and Hispanic or Latino (3,790 | 15.4%).
| Race | # Population | % Population |
| Asian | 2,881 | 11.7% |
| Black / African American | 11,613 | 47.1% |
| Hawaiian / Pacific | 0 | 0.0% |
| Hispanic or Latino | 3,790 | 15.4% |
| Native / Alaskan | 153 | 0.6% |
| White / Caucasian | 5,571 | 22.6% |
| Two or more Races | 1,535 | 6.2% |
| Some other Race | 2,893 | 11.7% |
| Total | 24,646 | 100.0% |
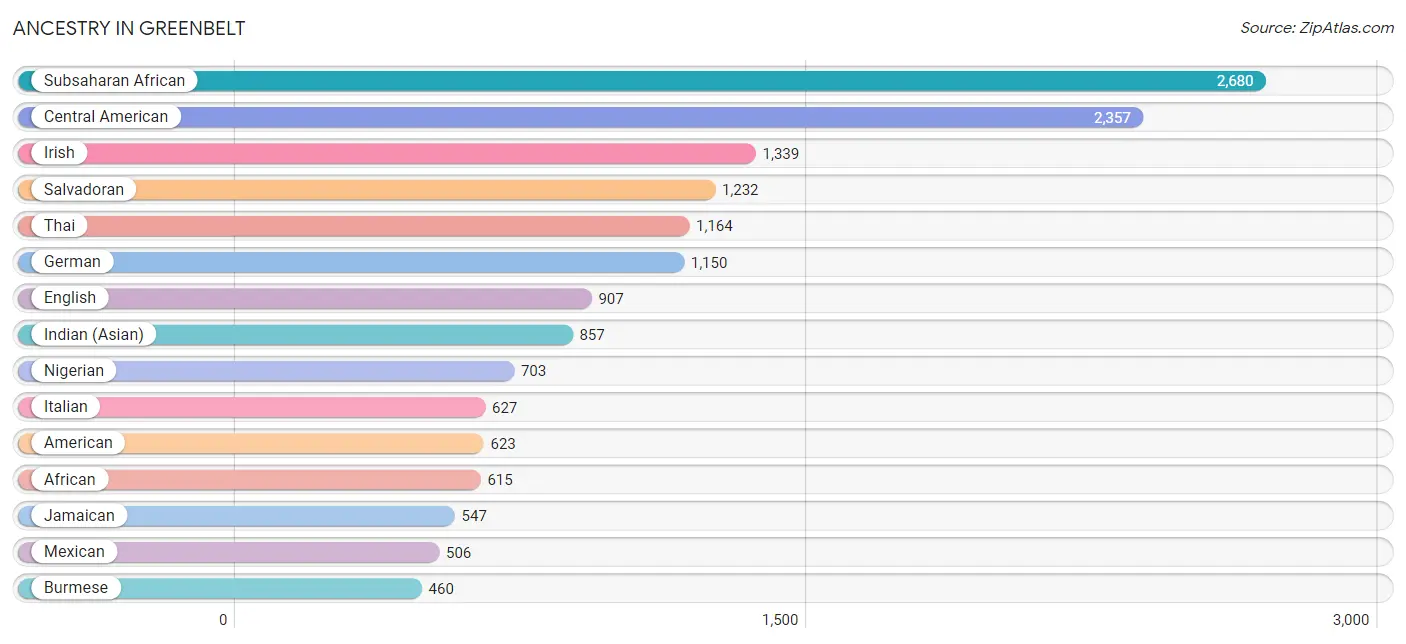
Ancestry in Greenbelt
The most populous ancestries reported in Greenbelt are Subsaharan African (2,680 | 10.9%), Central American (2,357 | 9.6%), Irish (1,339 | 5.4%), Salvadoran (1,232 | 5.0%), and Thai (1,164 | 4.7%), together accounting for 35.6% of all Greenbelt residents.
| Ancestry | # Population | % Population |
| African | 615 | 2.5% |
| American | 623 | 2.5% |
| Arab | 143 | 0.6% |
| Argentinean | 132 | 0.5% |
| Armenian | 93 | 0.4% |
| Austrian | 9 | 0.0% |
| Belgian | 17 | 0.1% |
| Bhutanese | 151 | 0.6% |
| Blackfeet | 12 | 0.1% |
| British | 145 | 0.6% |
| Bulgarian | 18 | 0.1% |
| Burmese | 460 | 1.9% |
| Canadian | 20 | 0.1% |
| Central American | 2,357 | 9.6% |
| Cherokee | 44 | 0.2% |
| Cheyenne | 87 | 0.4% |
| Chilean | 32 | 0.1% |
| Colombian | 19 | 0.1% |
| Costa Rican | 34 | 0.1% |
| Cuban | 39 | 0.2% |
| Czech | 29 | 0.1% |
| Czechoslovakian | 25 | 0.1% |
| Danish | 24 | 0.1% |
| Dominican | 74 | 0.3% |
| Dutch | 52 | 0.2% |
| Eastern European | 42 | 0.2% |
| Ecuadorian | 63 | 0.3% |
| English | 907 | 3.7% |
| Ethiopian | 72 | 0.3% |
| European | 215 | 0.9% |
| Filipino | 42 | 0.2% |
| Finnish | 69 | 0.3% |
| French | 272 | 1.1% |
| French Canadian | 108 | 0.4% |
| German | 1,150 | 4.7% |
| Ghanaian | 245 | 1.0% |
| Greek | 36 | 0.2% |
| Guatemalan | 349 | 1.4% |
| Guyanese | 107 | 0.4% |
| Haitian | 246 | 1.0% |
| Honduran | 387 | 1.6% |
| Hungarian | 68 | 0.3% |
| Indian (Asian) | 857 | 3.5% |
| Indonesian | 132 | 0.5% |
| Irish | 1,339 | 5.4% |
| Italian | 627 | 2.5% |
| Jamaican | 547 | 2.2% |
| Korean | 377 | 1.5% |
| Laotian | 55 | 0.2% |
| Lebanese | 16 | 0.1% |
| Liberian | 52 | 0.2% |
| Lithuanian | 129 | 0.5% |
| Mexican | 506 | 2.1% |
| Mexican American Indian | 35 | 0.1% |
| Moroccan | 77 | 0.3% |
| Navajo | 29 | 0.1% |
| Nicaraguan | 355 | 1.4% |
| Nigerian | 703 | 2.9% |
| Northern European | 43 | 0.2% |
| Norwegian | 182 | 0.7% |
| Okinawan | 6 | 0.0% |
| Osage | 52 | 0.2% |
| Pakistani | 19 | 0.1% |
| Peruvian | 36 | 0.2% |
| Polish | 200 | 0.8% |
| Portuguese | 32 | 0.1% |
| Puerto Rican | 233 | 0.9% |
| Romanian | 109 | 0.4% |
| Russian | 65 | 0.3% |
| Salvadoran | 1,232 | 5.0% |
| Scotch-Irish | 45 | 0.2% |
| Scottish | 247 | 1.0% |
| Sierra Leonean | 38 | 0.2% |
| Slavic | 22 | 0.1% |
| Slovak | 24 | 0.1% |
| Slovene | 13 | 0.1% |
| South American | 375 | 1.5% |
| Spaniard | 96 | 0.4% |
| Sri Lankan | 63 | 0.3% |
| Subsaharan African | 2,680 | 10.9% |
| Swedish | 71 | 0.3% |
| Swiss | 9 | 0.0% |
| Thai | 1,164 | 4.7% |
| Trinidadian and Tobagonian | 60 | 0.2% |
| Turkish | 25 | 0.1% |
| U.S. Virgin Islander | 63 | 0.3% |
| Ugandan | 6 | 0.0% |
| Ukrainian | 69 | 0.3% |
| Venezuelan | 93 | 0.4% |
| Vietnamese | 49 | 0.2% |
| Welsh | 99 | 0.4% |
| West Indian | 157 | 0.6% |
| Zimbabwean | 113 | 0.5% | View All 93 Rows |
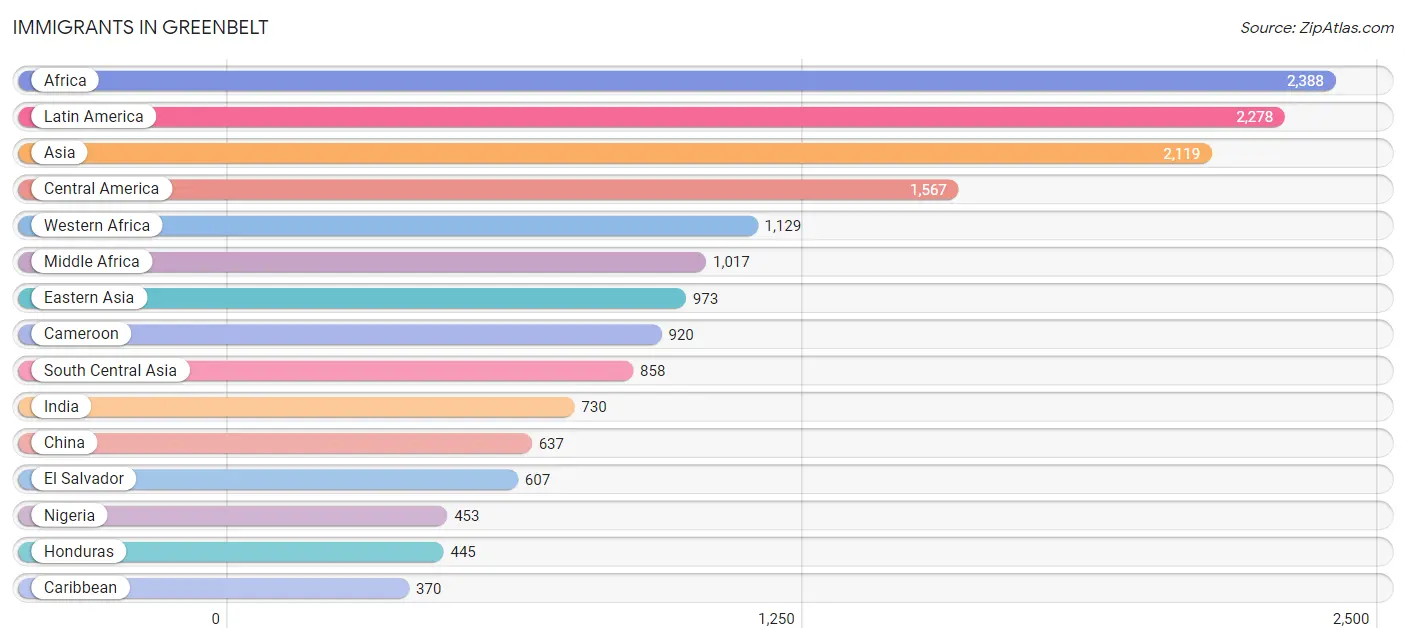
Immigrants in Greenbelt
The most numerous immigrant groups reported in Greenbelt came from Africa (2,388 | 9.7%), Latin America (2,278 | 9.2%), Asia (2,119 | 8.6%), Central America (1,567 | 6.4%), and Western Africa (1,129 | 4.6%), together accounting for 38.5% of all Greenbelt residents.
| Immigration Origin | # Population | % Population |
| Africa | 2,388 | 9.7% |
| Argentina | 56 | 0.2% |
| Asia | 2,119 | 8.6% |
| Bangladesh | 54 | 0.2% |
| Belgium | 17 | 0.1% |
| Brazil | 32 | 0.1% |
| Bulgaria | 18 | 0.1% |
| Cameroon | 920 | 3.7% |
| Canada | 50 | 0.2% |
| Caribbean | 370 | 1.5% |
| Central America | 1,567 | 6.4% |
| Chile | 32 | 0.1% |
| China | 637 | 2.6% |
| Colombia | 19 | 0.1% |
| Cuba | 15 | 0.1% |
| Dominica | 13 | 0.1% |
| Dominican Republic | 53 | 0.2% |
| Eastern Africa | 192 | 0.8% |
| Eastern Asia | 973 | 4.0% |
| Eastern Europe | 129 | 0.5% |
| Ecuador | 63 | 0.3% |
| El Salvador | 607 | 2.5% |
| England | 16 | 0.1% |
| Ethiopia | 92 | 0.4% |
| Europe | 366 | 1.5% |
| France | 27 | 0.1% |
| Germany | 78 | 0.3% |
| Ghana | 246 | 1.0% |
| Grenada | 36 | 0.2% |
| Guatemala | 330 | 1.3% |
| Guyana | 18 | 0.1% |
| Haiti | 110 | 0.4% |
| Honduras | 445 | 1.8% |
| India | 730 | 3.0% |
| Indonesia | 55 | 0.2% |
| Israel | 6 | 0.0% |
| Jamaica | 21 | 0.1% |
| Japan | 109 | 0.4% |
| Kazakhstan | 17 | 0.1% |
| Korea | 227 | 0.9% |
| Latin America | 2,278 | 9.2% |
| Liberia | 101 | 0.4% |
| Mexico | 166 | 0.7% |
| Middle Africa | 1,017 | 4.1% |
| Morocco | 50 | 0.2% |
| Nepal | 43 | 0.2% |
| Nicaragua | 19 | 0.1% |
| Nigeria | 453 | 1.8% |
| Northern Africa | 50 | 0.2% |
| Northern Europe | 37 | 0.2% |
| Pakistan | 14 | 0.1% |
| Peru | 28 | 0.1% |
| Philippines | 200 | 0.8% |
| Romania | 109 | 0.4% |
| Russia | 2 | 0.0% |
| Sierra Leone | 288 | 1.2% |
| South America | 341 | 1.4% |
| South Central Asia | 858 | 3.5% |
| South Eastern Asia | 282 | 1.1% |
| Southern Europe | 69 | 0.3% |
| Spain | 69 | 0.3% |
| St. Vincent and the Grenadines | 49 | 0.2% |
| Switzerland | 9 | 0.0% |
| Taiwan | 90 | 0.4% |
| Thailand | 19 | 0.1% |
| Trinidad and Tobago | 73 | 0.3% |
| Uganda | 9 | 0.0% |
| Venezuela | 93 | 0.4% |
| Western Africa | 1,129 | 4.6% |
| Western Asia | 6 | 0.0% |
| Western Europe | 131 | 0.5% |
| Zaire | 97 | 0.4% |
| Zimbabwe | 35 | 0.1% | View All 73 Rows |
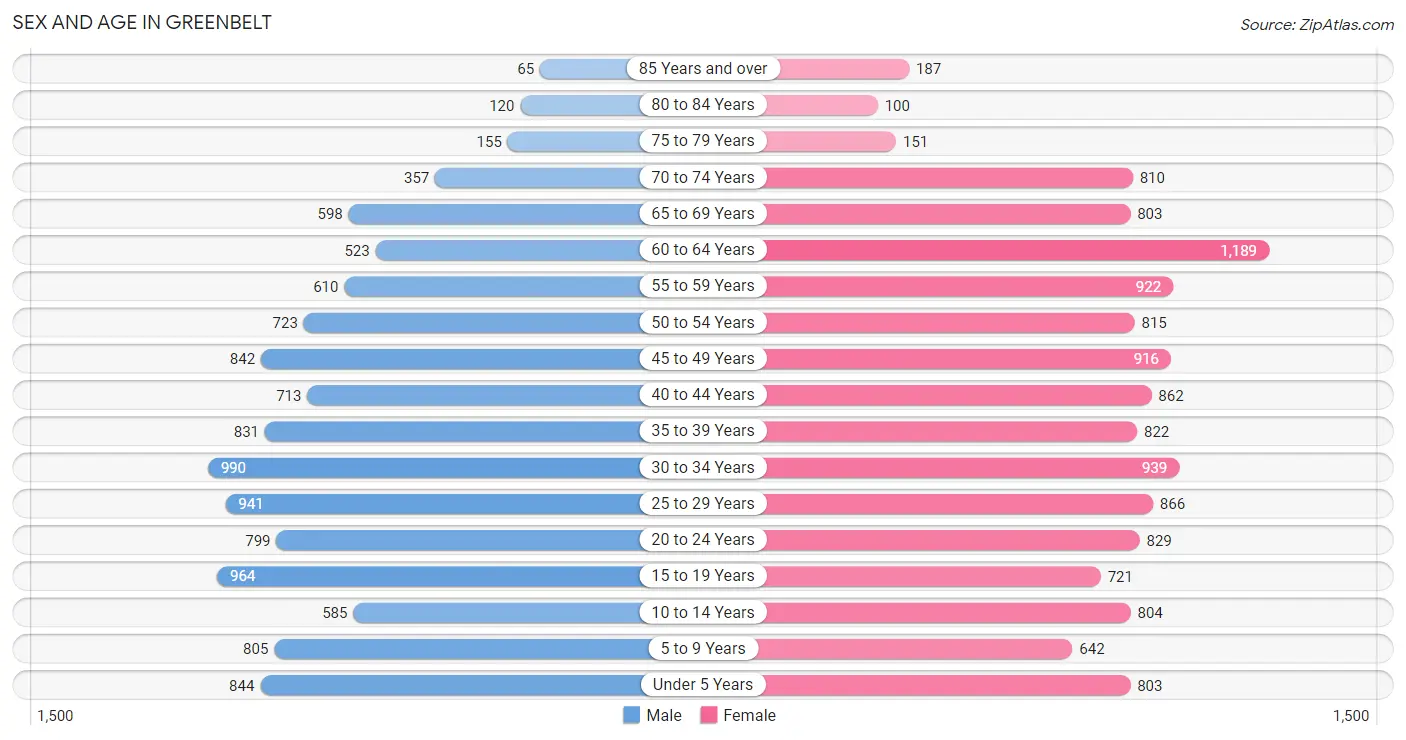
Sex and Age in Greenbelt
Sex and Age in Greenbelt
The most populous age groups in Greenbelt are 30 to 34 Years (990 | 8.6%) for men and 60 to 64 Years (1,189 | 9.0%) for women.
| Age Bracket | Male | Female |
| Under 5 Years | 844 (7.4%) | 803 (6.1%) |
| 5 to 9 Years | 805 (7.0%) | 642 (4.9%) |
| 10 to 14 Years | 585 (5.1%) | 804 (6.1%) |
| 15 to 19 Years | 964 (8.4%) | 721 (5.5%) |
| 20 to 24 Years | 799 (7.0%) | 829 (6.3%) |
| 25 to 29 Years | 941 (8.2%) | 866 (6.6%) |
| 30 to 34 Years | 990 (8.6%) | 939 (7.1%) |
| 35 to 39 Years | 831 (7.2%) | 822 (6.2%) |
| 40 to 44 Years | 713 (6.2%) | 862 (6.5%) |
| 45 to 49 Years | 842 (7.3%) | 916 (7.0%) |
| 50 to 54 Years | 723 (6.3%) | 815 (6.2%) |
| 55 to 59 Years | 610 (5.3%) | 922 (7.0%) |
| 60 to 64 Years | 523 (4.6%) | 1,189 (9.0%) |
| 65 to 69 Years | 598 (5.2%) | 803 (6.1%) |
| 70 to 74 Years | 357 (3.1%) | 810 (6.1%) |
| 75 to 79 Years | 155 (1.3%) | 151 (1.1%) |
| 80 to 84 Years | 120 (1.1%) | 100 (0.8%) |
| 85 Years and over | 65 (0.6%) | 187 (1.4%) |
| Total | 11,465 (100.0%) | 13,181 (100.0%) |
Families and Households in Greenbelt
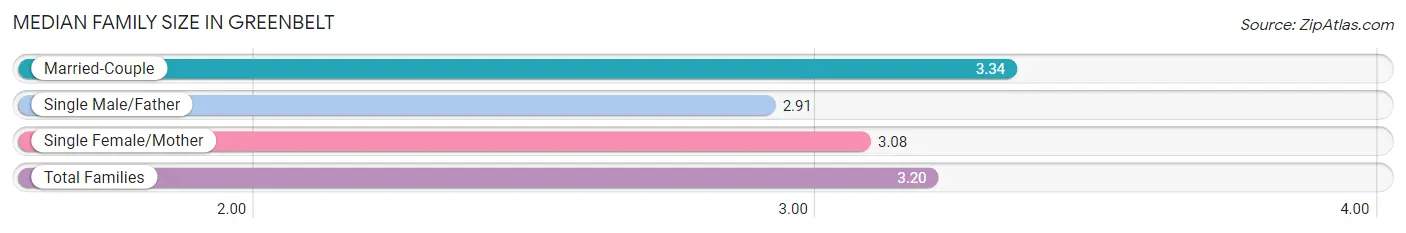
Median Family Size in Greenbelt
The median family size in Greenbelt is 3.20 persons per family, with married-couple families (3,104 | 53.9%) accounting for the largest median family size of 3.34 persons per family. On the other hand, single male/father families (577 | 10.0%) represent the smallest median family size with 2.91 persons per family.
| Family Type | # Families | Family Size |
| Married-Couple | 3,104 (53.9%) | 3.34 |
| Single Male/Father | 577 (10.0%) | 2.91 |
| Single Female/Mother | 2,073 (36.0%) | 3.08 |
| Total Families | 5,754 (100.0%) | 3.20 |
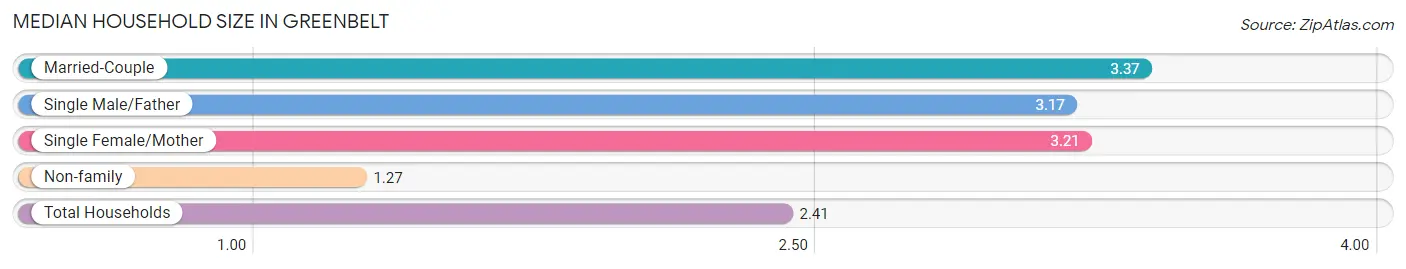
Median Household Size in Greenbelt
The median household size in Greenbelt is 2.41 persons per household, with married-couple households (3,104 | 30.3%) accounting for the largest median household size of 3.37 persons per household. non-family households (4,481 | 43.8%) represent the smallest median household size with 1.27 persons per household.
| Household Type | # Households | Household Size |
| Married-Couple | 3,104 (30.3%) | 3.37 |
| Single Male/Father | 577 (5.6%) | 3.17 |
| Single Female/Mother | 2,073 (20.3%) | 3.21 |
| Non-family | 4,481 (43.8%) | 1.27 |
| Total Households | 10,235 (100.0%) | 2.41 |
Household Size by Marriage Status in Greenbelt
Out of a total of 10,235 households in Greenbelt, 5,754 (56.2%) are family households, while 4,481 (43.8%) are nonfamily households. The most numerous type of family households are 2-person households, comprising 2,308, and the most common type of nonfamily households are 1-person households, comprising 3,936.
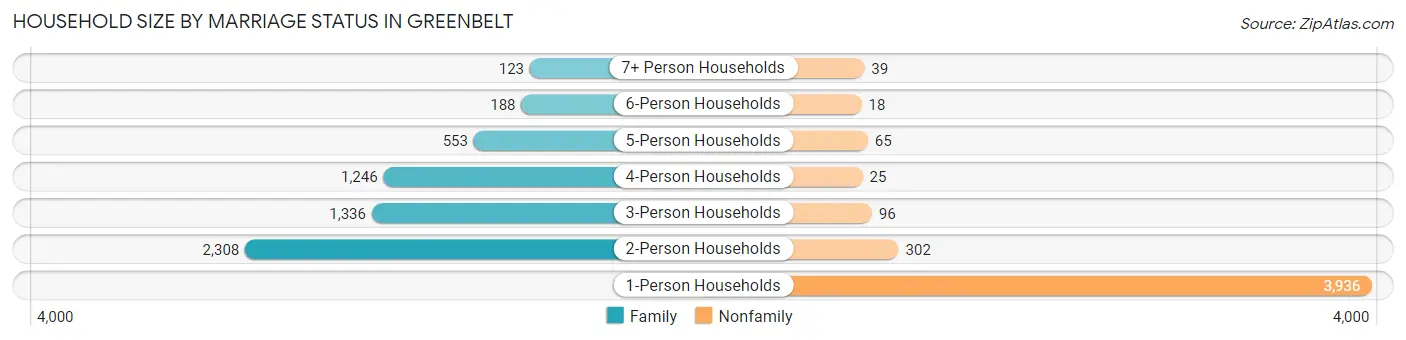
| Household Size | Family Households | Nonfamily Households |
| 1-Person Households | - | 3,936 (38.5%) |
| 2-Person Households | 2,308 (22.6%) | 302 (2.9%) |
| 3-Person Households | 1,336 (13.1%) | 96 (0.9%) |
| 4-Person Households | 1,246 (12.2%) | 25 (0.2%) |
| 5-Person Households | 553 (5.4%) | 65 (0.6%) |
| 6-Person Households | 188 (1.8%) | 18 (0.2%) |
| 7+ Person Households | 123 (1.2%) | 39 (0.4%) |
| Total | 5,754 (56.2%) | 4,481 (43.8%) |
Female Fertility in Greenbelt
Fertility by Age in Greenbelt
Average fertility rate in Greenbelt is 48.0 births per 1,000 women. Women in the age bracket of 20 to 34 years have the highest fertility rate with 76.0 births per 1,000 women. Women in the age bracket of 20 to 34 years acount for 68.6% of all women with births.
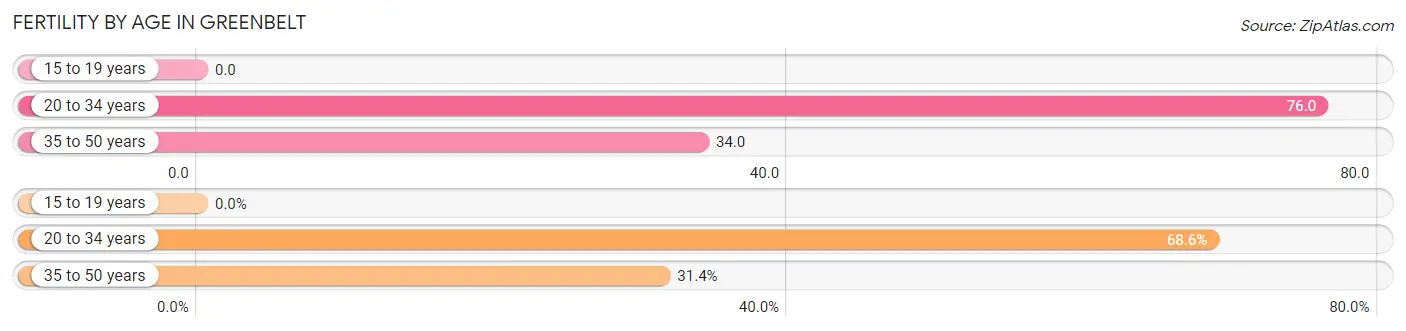
| Age Bracket | Women with Births | Births / 1,000 Women |
| 15 to 19 years | 0 (0.0%) | 0.0 |
| 20 to 34 years | 199 (68.6%) | 76.0 |
| 35 to 50 years | 91 (31.4%) | 34.0 |
| Total | 290 (100.0%) | 48.0 |
Fertility by Age by Marriage Status in Greenbelt
61.7% of women with births (290) in Greenbelt are married. The highest percentage of unmarried women with births falls into 20 to 34 years age bracket with 55.8% of them unmarried at the time of birth, while the lowest percentage of unmarried women with births belong to 35 to 50 years age bracket with 0.0% of them unmarried.
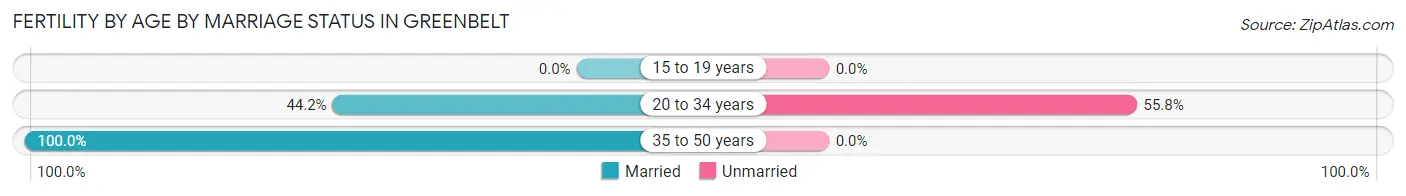
| Age Bracket | Married | Unmarried |
| 15 to 19 years | 0 (0.0%) | 0 (0.0%) |
| 20 to 34 years | 88 (44.2%) | 111 (55.8%) |
| 35 to 50 years | 91 (100.0%) | 0 (0.0%) |
| Total | 179 (61.7%) | 111 (38.3%) |
Fertility by Education in Greenbelt
Average fertility rate in Greenbelt is 48.0 births per 1,000 women. Women with the education attainment of high school diploma have the highest fertility rate of 80.0 births per 1,000 women, while women with the education attainment of graduate degree have the lowest fertility at 23.0 births per 1,000 women. Women with the education attainment of high school diploma represent 31.7% of all women with births.
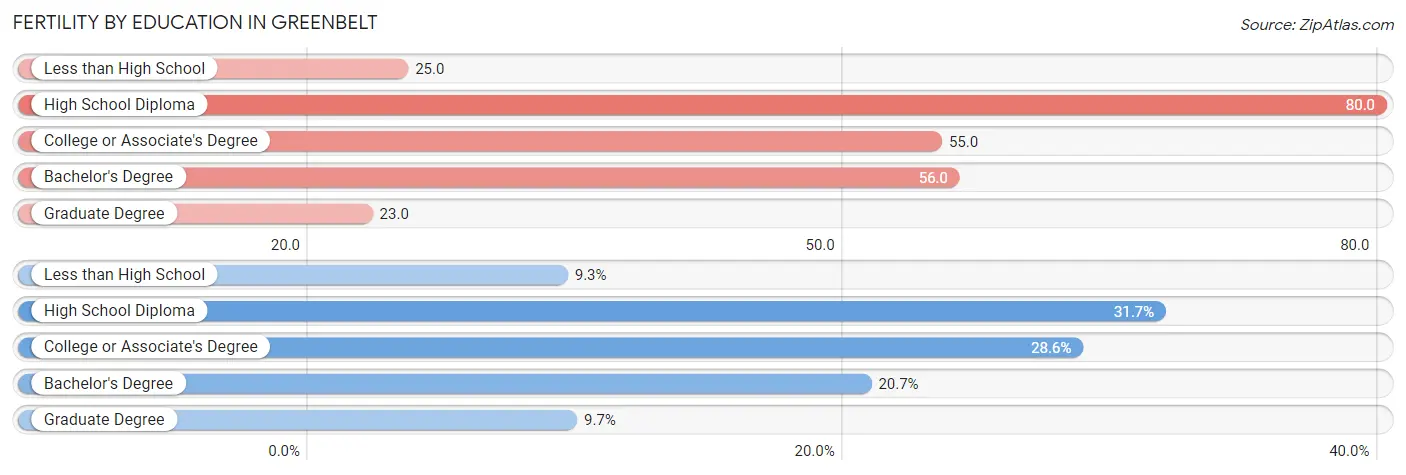
| Educational Attainment | Women with Births | Births / 1,000 Women |
| Less than High School | 27 (9.3%) | 25.0 |
| High School Diploma | 92 (31.7%) | 80.0 |
| College or Associate's Degree | 83 (28.6%) | 55.0 |
| Bachelor's Degree | 60 (20.7%) | 56.0 |
| Graduate Degree | 28 (9.7%) | 23.0 |
| Total | 290 (100.0%) | 48.0 |
Fertility by Education by Marriage Status in Greenbelt
38.3% of women with births in Greenbelt are unmarried. Women with the educational attainment of bachelor's degree are most likely to be married with 100.0% of them married at childbirth, while women with the educational attainment of less than high school are least likely to be married with 100.0% of them unmarried at childbirth.
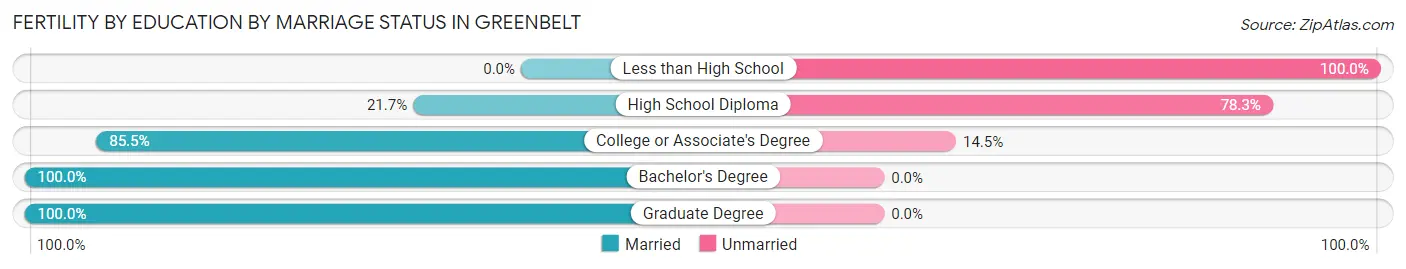
| Educational Attainment | Married | Unmarried |
| Less than High School | 0 (0.0%) | 27 (100.0%) |
| High School Diploma | 20 (21.7%) | 72 (78.3%) |
| College or Associate's Degree | 71 (85.5%) | 12 (14.5%) |
| Bachelor's Degree | 60 (100.0%) | 0 (0.0%) |
| Graduate Degree | 28 (100.0%) | 0 (0.0%) |
| Total | 179 (61.7%) | 111 (38.3%) |
Employment Characteristics in Greenbelt
Employment by Class of Employer in Greenbelt
Among the 12,821 employed individuals in Greenbelt, private company employees (7,315 | 57.1%), federal government employees (1,628 | 12.7%), and not-for-profit organizations (1,366 | 10.6%) make up the most common classes of employment.
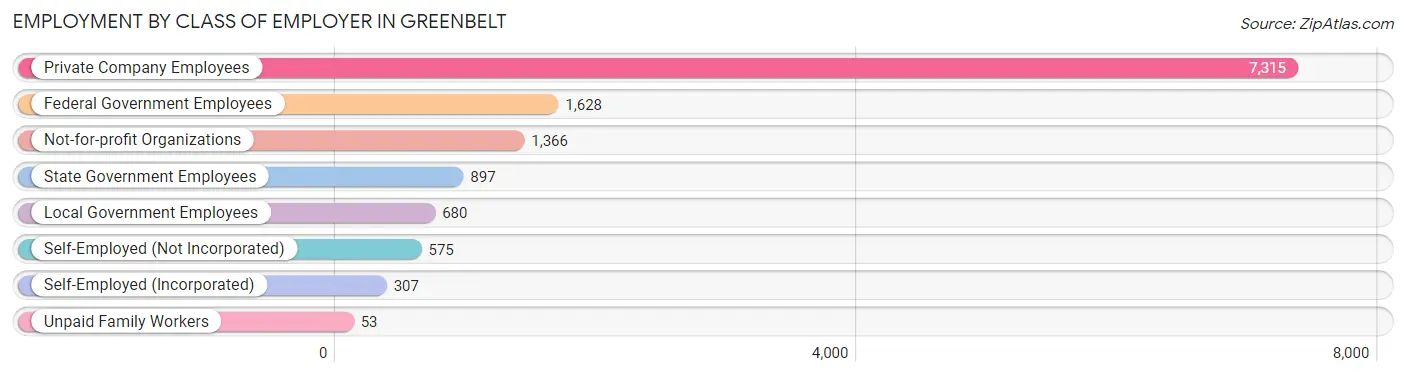
| Employer Class | # Employees | % Employees |
| Private Company Employees | 7,315 | 57.1% |
| Self-Employed (Incorporated) | 307 | 2.4% |
| Self-Employed (Not Incorporated) | 575 | 4.5% |
| Not-for-profit Organizations | 1,366 | 10.6% |
| Local Government Employees | 680 | 5.3% |
| State Government Employees | 897 | 7.0% |
| Federal Government Employees | 1,628 | 12.7% |
| Unpaid Family Workers | 53 | 0.4% |
| Total | 12,821 | 100.0% |
Employment Status by Age in Greenbelt
According to the labor force statistics for Greenbelt, out of the total population over 16 years of age (19,744), 73.7% or 14,551 individuals are in the labor force, with 8.6% or 1,251 of them unemployed. The age group with the highest labor force participation rate is 30 to 34 years, with 91.8% or 1,771 individuals in the labor force. Within the labor force, the 65 to 74 years age range has the highest percentage of unemployed individuals, with 25.8% or 273 of them being unemployed.
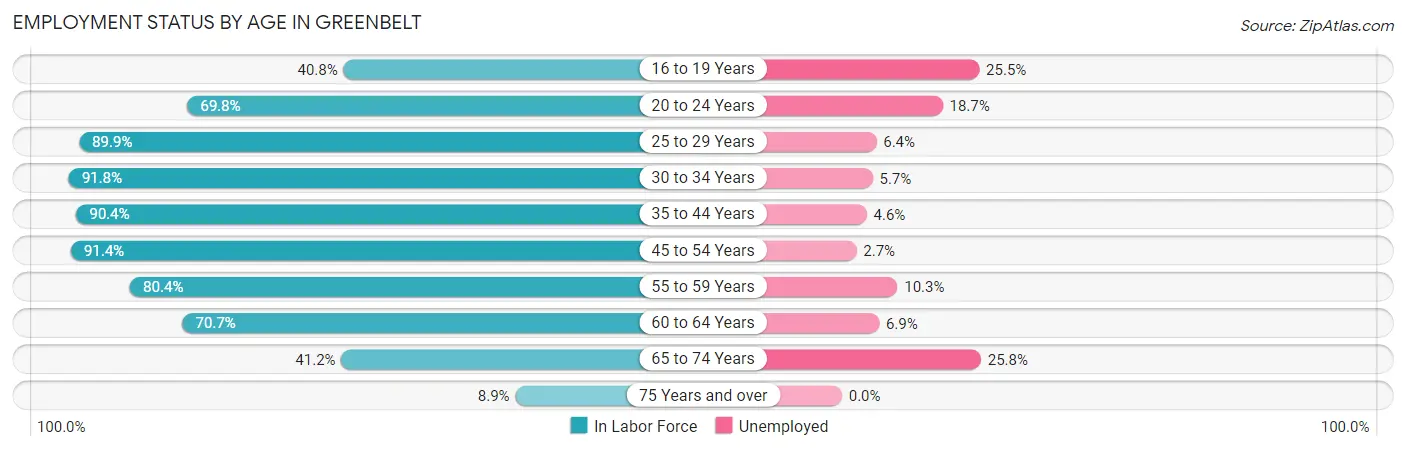
| Age Bracket | In Labor Force | Unemployed |
| 16 to 19 Years | 517 (40.8%) | 132 (25.5%) |
| 20 to 24 Years | 1,136 (69.8%) | 212 (18.7%) |
| 25 to 29 Years | 1,624 (89.9%) | 104 (6.4%) |
| 30 to 34 Years | 1,771 (91.8%) | 101 (5.7%) |
| 35 to 44 Years | 2,918 (90.4%) | 134 (4.6%) |
| 45 to 54 Years | 3,013 (91.4%) | 81 (2.7%) |
| 55 to 59 Years | 1,232 (80.4%) | 127 (10.3%) |
| 60 to 64 Years | 1,210 (70.7%) | 83 (6.9%) |
| 65 to 74 Years | 1,058 (41.2%) | 273 (25.8%) |
| 75 Years and over | 69 (8.9%) | 0 (0.0%) |
| Total | 14,551 (73.7%) | 1,251 (8.6%) |
Employment Status by Educational Attainment in Greenbelt
According to labor force statistics for Greenbelt, 87.1% of individuals (11,762) out of the total population between 25 and 64 years of age (13,504) are in the labor force, with 5.3% or 623 of them being unemployed. The group with the highest labor force participation rate are those with the educational attainment of bachelor's degree or higher, with 91.9% or 5,793 individuals in the labor force. Within the labor force, individuals with high school diploma education have the highest percentage of unemployment, with 12.1% or 227 of them being unemployed.
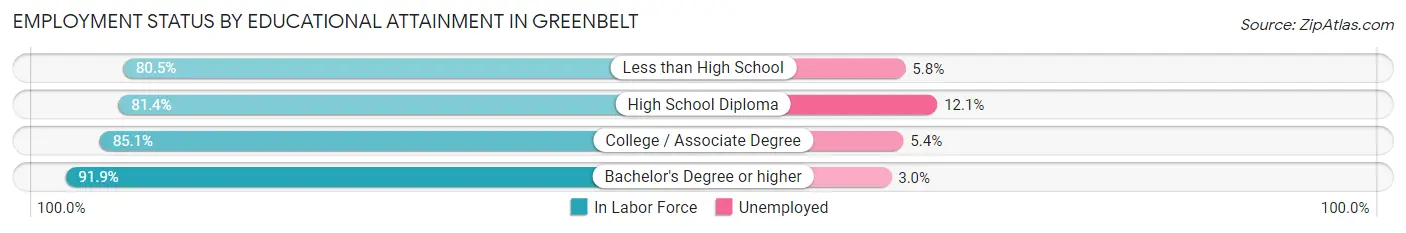
| Educational Attainment | In Labor Force | Unemployed |
| Less than High School | 1,135 (80.5%) | 82 (5.8%) |
| High School Diploma | 1,876 (81.4%) | 279 (12.1%) |
| College / Associate Degree | 2,966 (85.1%) | 188 (5.4%) |
| Bachelor's Degree or higher | 5,793 (91.9%) | 189 (3.0%) |
| Total | 11,762 (87.1%) | 716 (5.3%) |
Employment Occupations by Sex in Greenbelt
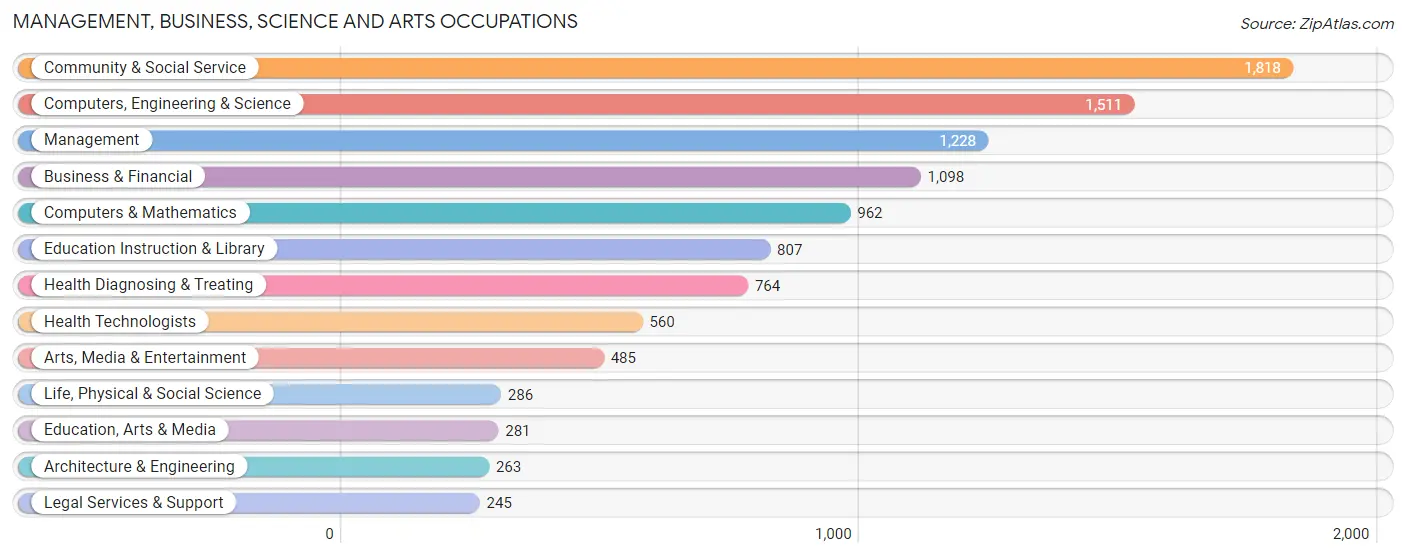
Management, Business, Science and Arts Occupations
The most common Management, Business, Science and Arts occupations in Greenbelt are Community & Social Service (1,818 | 13.7%), Computers, Engineering & Science (1,511 | 11.4%), Management (1,228 | 9.2%), Business & Financial (1,098 | 8.3%), and Computers & Mathematics (962 | 7.2%).
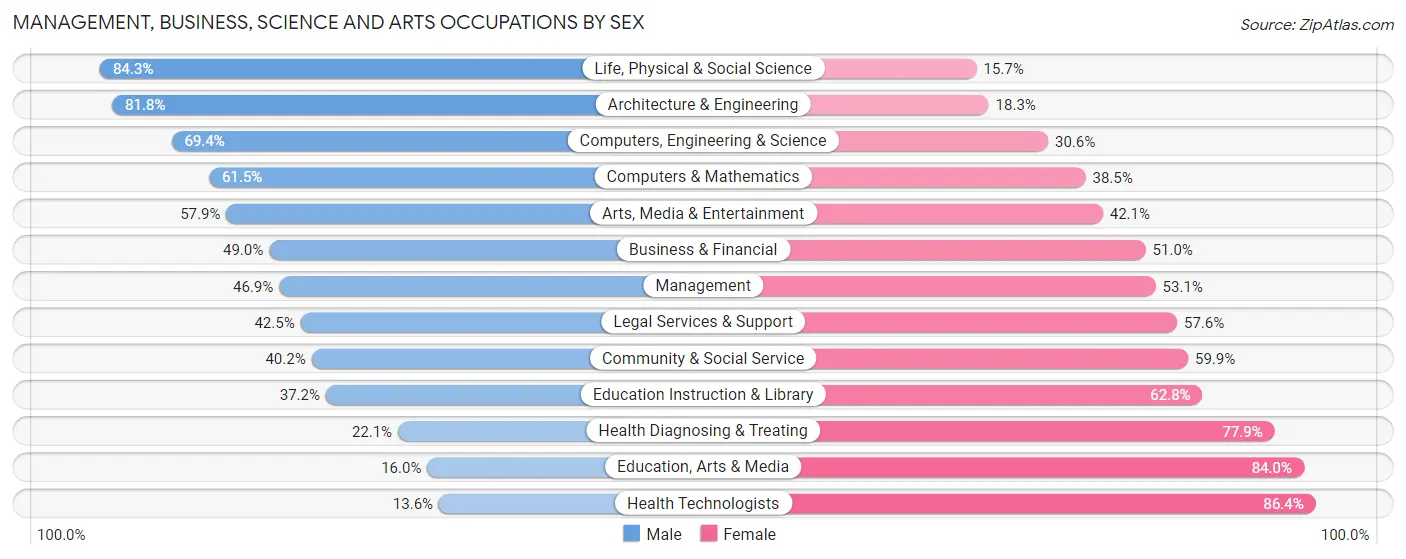
Management, Business, Science and Arts Occupations by Sex
Within the Management, Business, Science and Arts occupations in Greenbelt, the most male-oriented occupations are Life, Physical & Social Science (84.3%), Architecture & Engineering (81.8%), and Computers, Engineering & Science (69.4%), while the most female-oriented occupations are Health Technologists (86.4%), Education, Arts & Media (84.0%), and Health Diagnosing & Treating (77.9%).
| Occupation | Male | Female |
| Management | 576 (46.9%) | 652 (53.1%) |
| Business & Financial | 538 (49.0%) | 560 (51.0%) |
| Computers, Engineering & Science | 1,048 (69.4%) | 463 (30.6%) |
| Computers & Mathematics | 592 (61.5%) | 370 (38.5%) |
| Architecture & Engineering | 215 (81.8%) | 48 (18.2%) |
| Life, Physical & Social Science | 241 (84.3%) | 45 (15.7%) |
| Community & Social Service | 730 (40.2%) | 1,088 (59.9%) |
| Education, Arts & Media | 45 (16.0%) | 236 (84.0%) |
| Legal Services & Support | 104 (42.4%) | 141 (57.6%) |
| Education Instruction & Library | 300 (37.2%) | 507 (62.8%) |
| Arts, Media & Entertainment | 281 (57.9%) | 204 (42.1%) |
| Health Diagnosing & Treating | 169 (22.1%) | 595 (77.9%) |
| Health Technologists | 76 (13.6%) | 484 (86.4%) |
| Total (Category) | 3,061 (47.7%) | 3,358 (52.3%) |
| Total (Overall) | 6,656 (50.1%) | 6,626 (49.9%) |
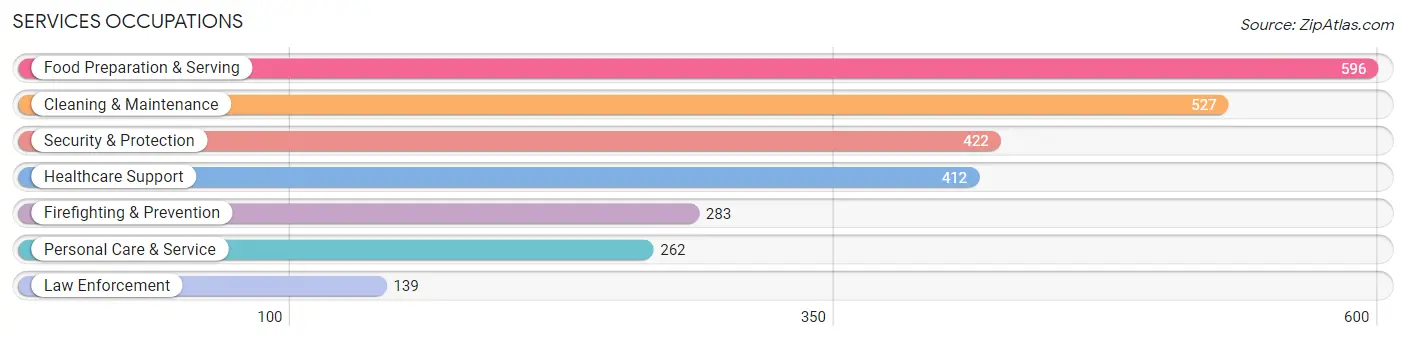
Services Occupations
The most common Services occupations in Greenbelt are Food Preparation & Serving (596 | 4.5%), Cleaning & Maintenance (527 | 4.0%), Security & Protection (422 | 3.2%), Healthcare Support (412 | 3.1%), and Firefighting & Prevention (283 | 2.1%).
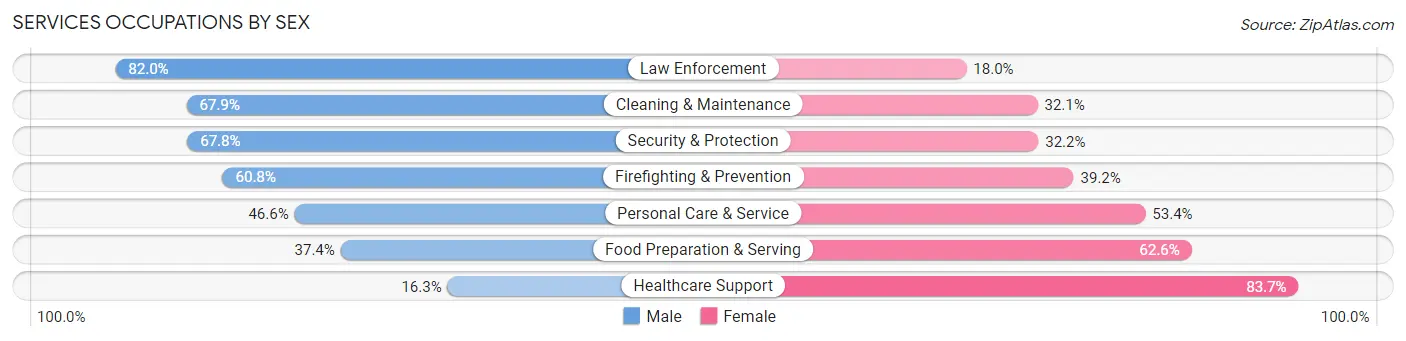
Services Occupations by Sex
Within the Services occupations in Greenbelt, the most male-oriented occupations are Law Enforcement (82.0%), Cleaning & Maintenance (67.9%), and Security & Protection (67.8%), while the most female-oriented occupations are Healthcare Support (83.7%), Food Preparation & Serving (62.6%), and Personal Care & Service (53.4%).
| Occupation | Male | Female |
| Healthcare Support | 67 (16.3%) | 345 (83.7%) |
| Security & Protection | 286 (67.8%) | 136 (32.2%) |
| Firefighting & Prevention | 172 (60.8%) | 111 (39.2%) |
| Law Enforcement | 114 (82.0%) | 25 (18.0%) |
| Food Preparation & Serving | 223 (37.4%) | 373 (62.6%) |
| Cleaning & Maintenance | 358 (67.9%) | 169 (32.1%) |
| Personal Care & Service | 122 (46.6%) | 140 (53.4%) |
| Total (Category) | 1,056 (47.6%) | 1,163 (52.4%) |
| Total (Overall) | 6,656 (50.1%) | 6,626 (49.9%) |
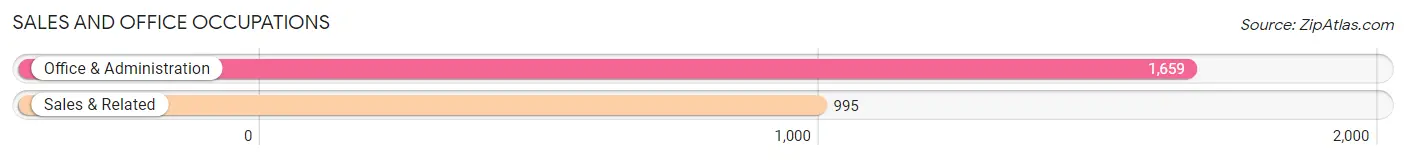
Sales and Office Occupations
The most common Sales and Office occupations in Greenbelt are Office & Administration (1,659 | 12.5%), and Sales & Related (995 | 7.5%).
Sales and Office Occupations by Sex
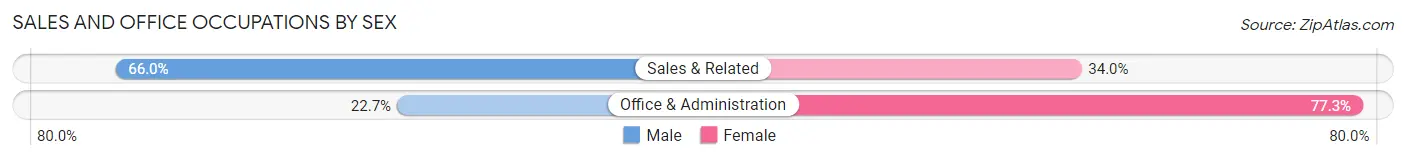
| Occupation | Male | Female |
| Sales & Related | 657 (66.0%) | 338 (34.0%) |
| Office & Administration | 377 (22.7%) | 1,282 (77.3%) |
| Total (Category) | 1,034 (39.0%) | 1,620 (61.0%) |
| Total (Overall) | 6,656 (50.1%) | 6,626 (49.9%) |
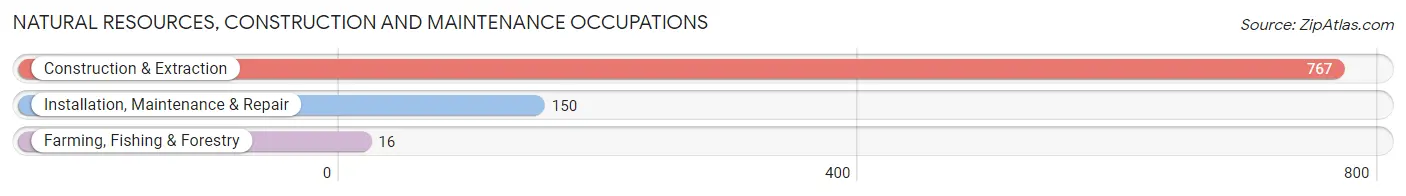
Natural Resources, Construction and Maintenance Occupations
The most common Natural Resources, Construction and Maintenance occupations in Greenbelt are Construction & Extraction (767 | 5.8%), Installation, Maintenance & Repair (150 | 1.1%), and Farming, Fishing & Forestry (16 | 0.1%).
Natural Resources, Construction and Maintenance Occupations by Sex
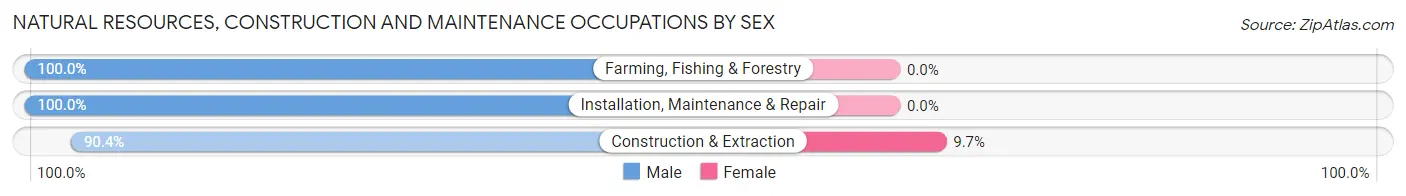
| Occupation | Male | Female |
| Farming, Fishing & Forestry | 16 (100.0%) | 0 (0.0%) |
| Construction & Extraction | 693 (90.3%) | 74 (9.7%) |
| Installation, Maintenance & Repair | 150 (100.0%) | 0 (0.0%) |
| Total (Category) | 859 (92.1%) | 74 (7.9%) |
| Total (Overall) | 6,656 (50.1%) | 6,626 (49.9%) |
Production, Transportation and Moving Occupations
The most common Production, Transportation and Moving occupations in Greenbelt are Transportation (634 | 4.8%), Production (282 | 2.1%), and Material Moving (141 | 1.1%).
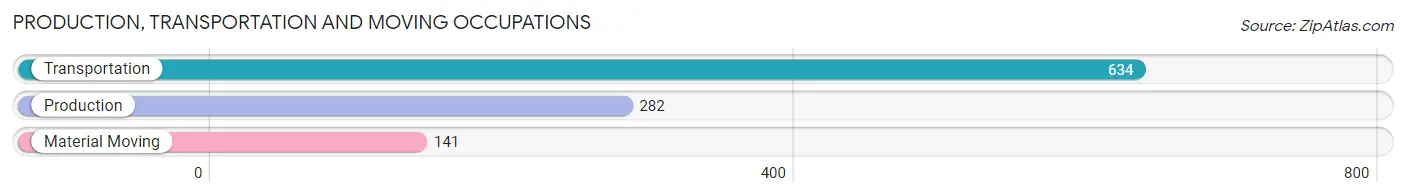
Production, Transportation and Moving Occupations by Sex
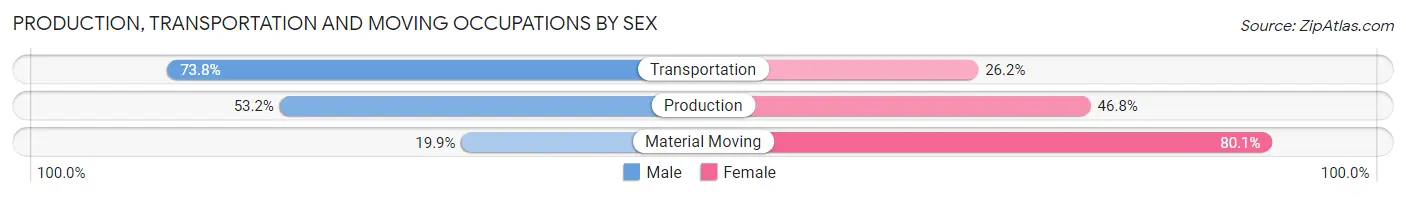
| Occupation | Male | Female |
| Production | 150 (53.2%) | 132 (46.8%) |
| Transportation | 468 (73.8%) | 166 (26.2%) |
| Material Moving | 28 (19.9%) | 113 (80.1%) |
| Total (Category) | 646 (61.1%) | 411 (38.9%) |
| Total (Overall) | 6,656 (50.1%) | 6,626 (49.9%) |
Employment Industries by Sex in Greenbelt
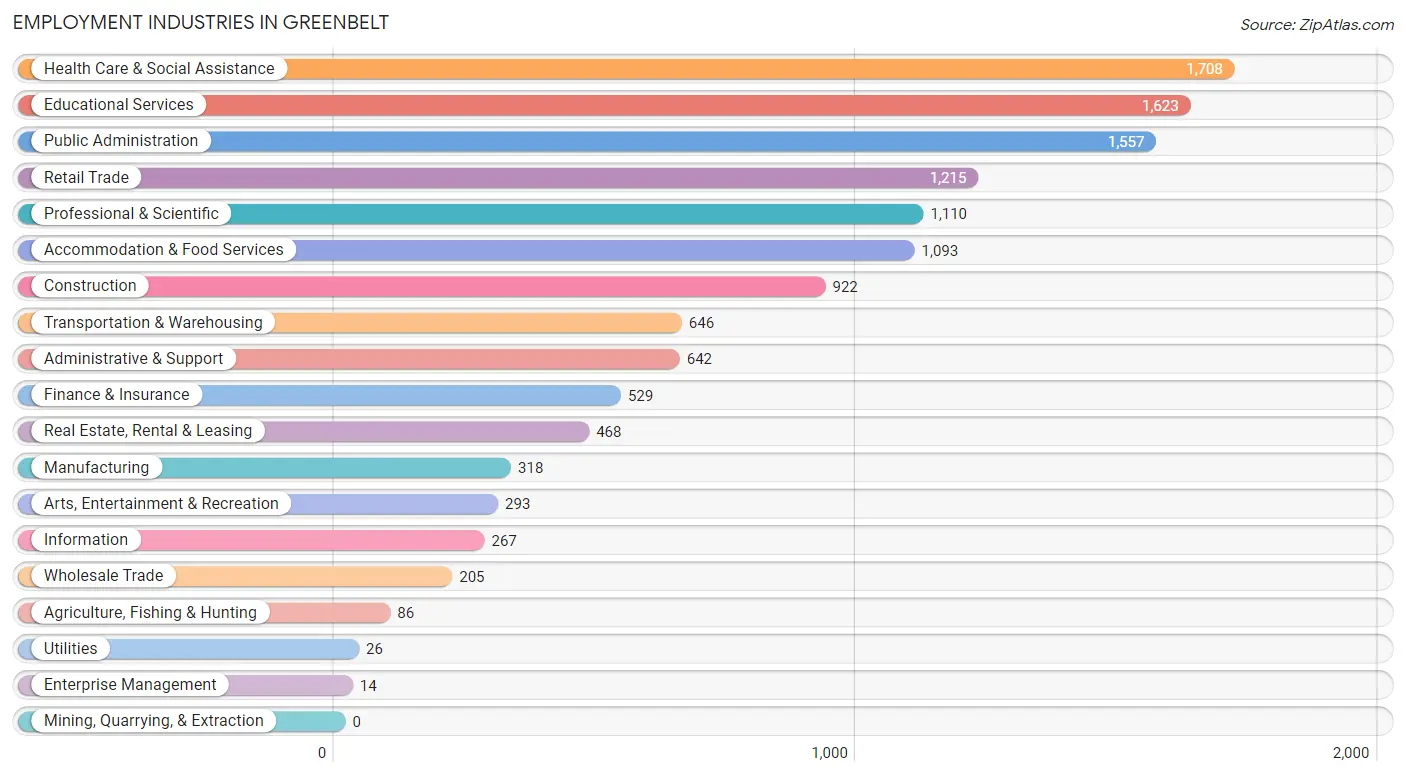
Employment Industries in Greenbelt
The major employment industries in Greenbelt include Health Care & Social Assistance (1,708 | 12.9%), Educational Services (1,623 | 12.2%), Public Administration (1,557 | 11.7%), Retail Trade (1,215 | 9.1%), and Professional & Scientific (1,110 | 8.4%).
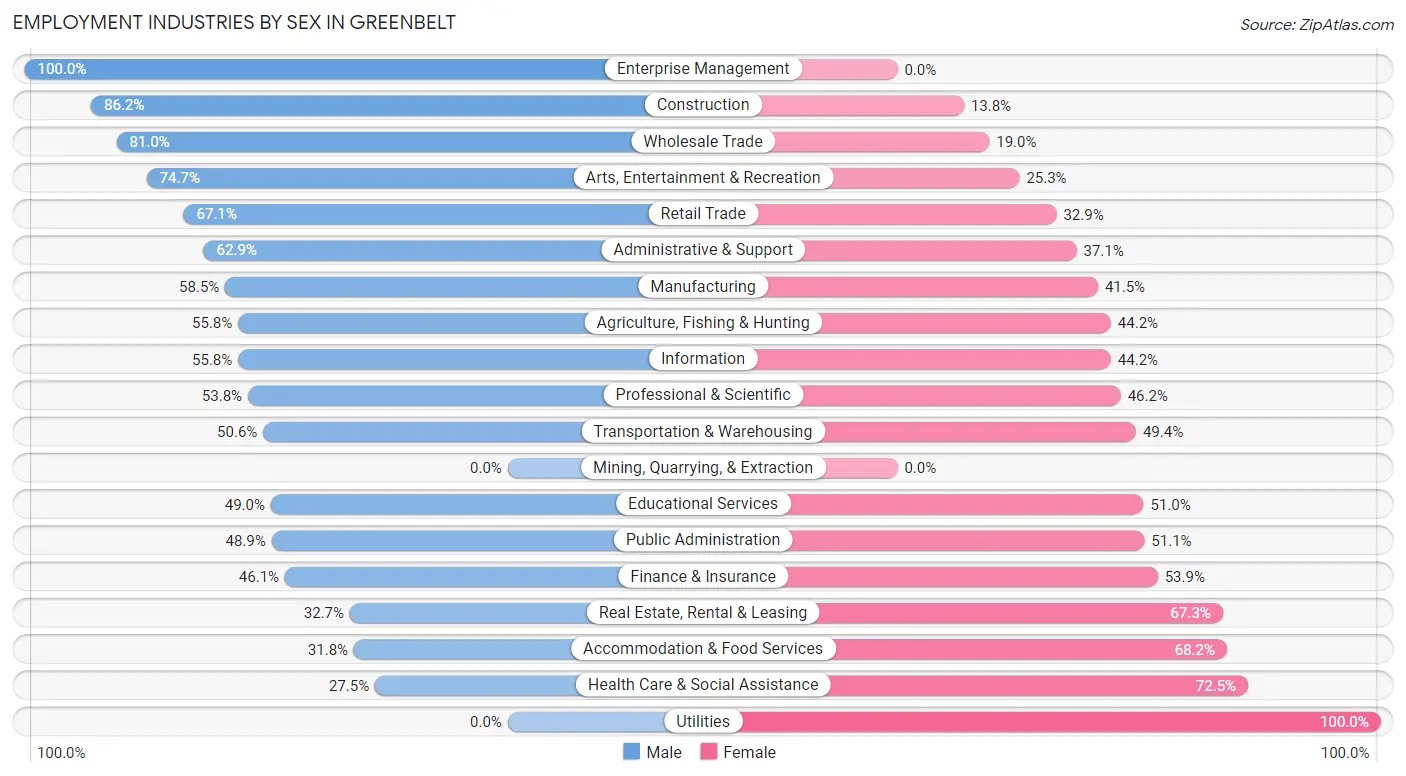
Employment Industries by Sex in Greenbelt
The Greenbelt industries that see more men than women are Enterprise Management (100.0%), Construction (86.2%), and Wholesale Trade (81.0%), whereas the industries that tend to have a higher number of women are Utilities (100.0%), Health Care & Social Assistance (72.5%), and Accommodation & Food Services (68.2%).
| Industry | Male | Female |
| Agriculture, Fishing & Hunting | 48 (55.8%) | 38 (44.2%) |
| Mining, Quarrying, & Extraction | 0 (0.0%) | 0 (0.0%) |
| Construction | 795 (86.2%) | 127 (13.8%) |
| Manufacturing | 186 (58.5%) | 132 (41.5%) |
| Wholesale Trade | 166 (81.0%) | 39 (19.0%) |
| Retail Trade | 815 (67.1%) | 400 (32.9%) |
| Transportation & Warehousing | 327 (50.6%) | 319 (49.4%) |
| Utilities | 0 (0.0%) | 26 (100.0%) |
| Information | 149 (55.8%) | 118 (44.2%) |
| Finance & Insurance | 244 (46.1%) | 285 (53.9%) |
| Real Estate, Rental & Leasing | 153 (32.7%) | 315 (67.3%) |
| Professional & Scientific | 597 (53.8%) | 513 (46.2%) |
| Enterprise Management | 14 (100.0%) | 0 (0.0%) |
| Administrative & Support | 404 (62.9%) | 238 (37.1%) |
| Educational Services | 796 (49.0%) | 827 (51.0%) |
| Health Care & Social Assistance | 469 (27.5%) | 1,239 (72.5%) |
| Arts, Entertainment & Recreation | 219 (74.7%) | 74 (25.3%) |
| Accommodation & Food Services | 348 (31.8%) | 745 (68.2%) |
| Public Administration | 761 (48.9%) | 796 (51.1%) |
| Total | 6,656 (50.1%) | 6,626 (49.9%) |
Education in Greenbelt
School Enrollment in Greenbelt
The most common levels of schooling among the 6,231 students in Greenbelt are college / undergraduate (1,533 | 24.6%), high school (1,405 | 22.6%), and middle school (990 | 15.9%).
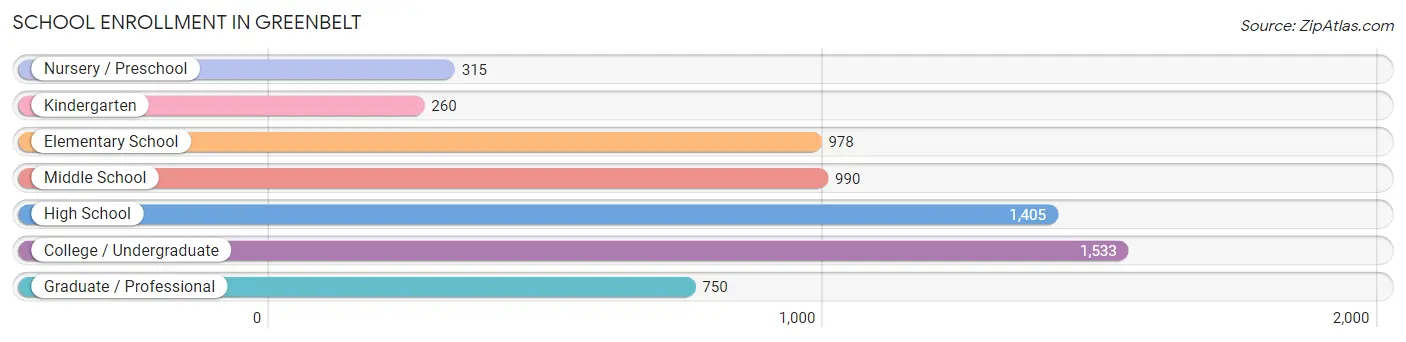
| School Level | # Students | % Students |
| Nursery / Preschool | 315 | 5.1% |
| Kindergarten | 260 | 4.2% |
| Elementary School | 978 | 15.7% |
| Middle School | 990 | 15.9% |
| High School | 1,405 | 22.6% |
| College / Undergraduate | 1,533 | 24.6% |
| Graduate / Professional | 750 | 12.0% |
| Total | 6,231 | 100.0% |
School Enrollment by Age by Funding Source in Greenbelt
Out of a total of 6,231 students who are enrolled in schools in Greenbelt, 1,240 (19.9%) attend a private institution, while the remaining 4,991 (80.1%) are enrolled in public schools. The age group of 3 to 4 year olds has the highest likelihood of being enrolled in private schools, with 61 (39.9% in the age bracket) enrolled. Conversely, the age group of 18 to 19 year olds has the lowest likelihood of being enrolled in a private school, with 440 (86.8% in the age bracket) attending a public institution.
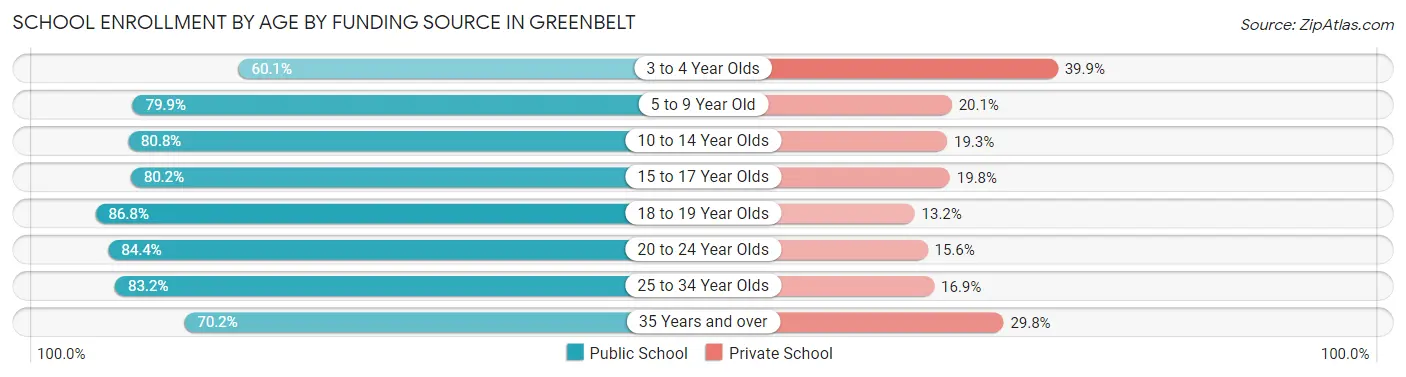
| Age Bracket | Public School | Private School |
| 3 to 4 Year Olds | 92 (60.1%) | 61 (39.9%) |
| 5 to 9 Year Old | 1,072 (79.9%) | 270 (20.1%) |
| 10 to 14 Year Olds | 1,099 (80.7%) | 262 (19.3%) |
| 15 to 17 Year Olds | 653 (80.2%) | 161 (19.8%) |
| 18 to 19 Year Olds | 440 (86.8%) | 67 (13.2%) |
| 20 to 24 Year Olds | 670 (84.4%) | 124 (15.6%) |
| 25 to 34 Year Olds | 528 (83.2%) | 107 (16.9%) |
| 35 Years and over | 439 (70.2%) | 186 (29.8%) |
| Total | 4,991 (80.1%) | 1,240 (19.9%) |
Educational Attainment by Field of Study in Greenbelt
Business (1,434 | 16.5%), social sciences (1,042 | 12.0%), engineering (831 | 9.5%), science & technology (778 | 8.9%), and computers & mathematics (737 | 8.5%) are the most common fields of study among 8,711 individuals in Greenbelt who have obtained a bachelor's degree or higher.
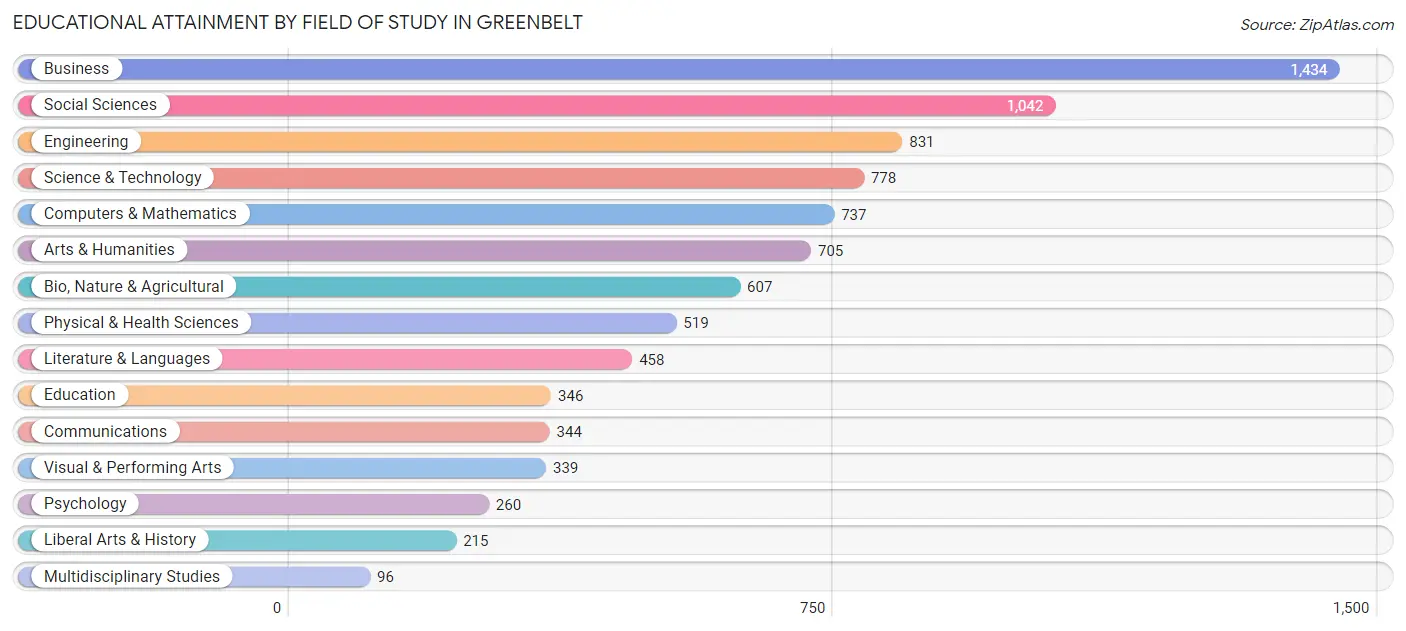
| Field of Study | # Graduates | % Graduates |
| Computers & Mathematics | 737 | 8.5% |
| Bio, Nature & Agricultural | 607 | 7.0% |
| Physical & Health Sciences | 519 | 6.0% |
| Psychology | 260 | 3.0% |
| Social Sciences | 1,042 | 12.0% |
| Engineering | 831 | 9.5% |
| Multidisciplinary Studies | 96 | 1.1% |
| Science & Technology | 778 | 8.9% |
| Business | 1,434 | 16.5% |
| Education | 346 | 4.0% |
| Literature & Languages | 458 | 5.3% |
| Liberal Arts & History | 215 | 2.5% |
| Visual & Performing Arts | 339 | 3.9% |
| Communications | 344 | 4.0% |
| Arts & Humanities | 705 | 8.1% |
| Total | 8,711 | 100.0% |
Transportation & Commute in Greenbelt
Vehicle Availability by Sex in Greenbelt
The most prevalent vehicle ownership categories in Greenbelt are males with 2 vehicles (2,578, accounting for 40.1%) and females with 2 vehicles (1,847, making up 40.4%).
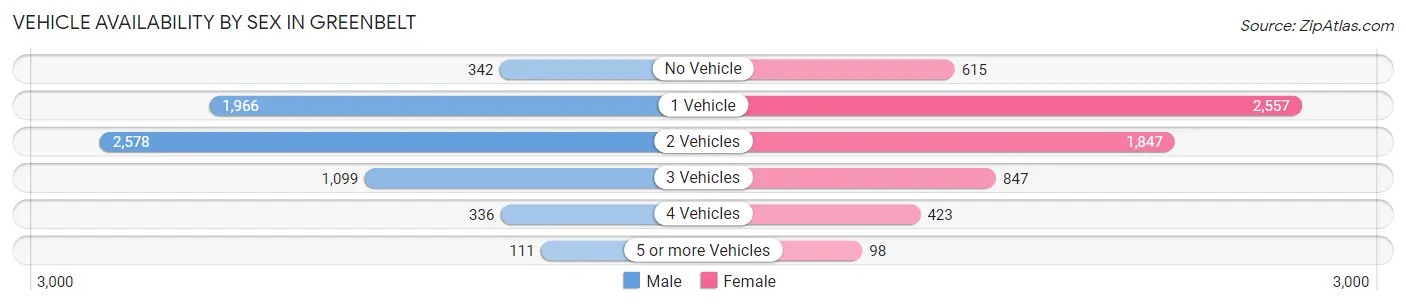
| Vehicles Available | Male | Female |
| No Vehicle | 342 (5.3%) | 615 (9.6%) |
| 1 Vehicle | 1,966 (30.6%) | 2,557 (40.0%) |
| 2 Vehicles | 2,578 (40.1%) | 1,847 (28.9%) |
| 3 Vehicles | 1,099 (17.1%) | 847 (13.3%) |
| 4 Vehicles | 336 (5.2%) | 423 (6.6%) |
| 5 or more Vehicles | 111 (1.7%) | 98 (1.5%) |
| Total | 6,432 (100.0%) | 6,387 (100.0%) |
Commute Time in Greenbelt
The most frequently occuring commute durations in Greenbelt are 30 to 34 minutes (1,781 commuters, 15.9%), 60 to 89 minutes (1,474 commuters, 13.2%), and 15 to 19 minutes (1,418 commuters, 12.7%).
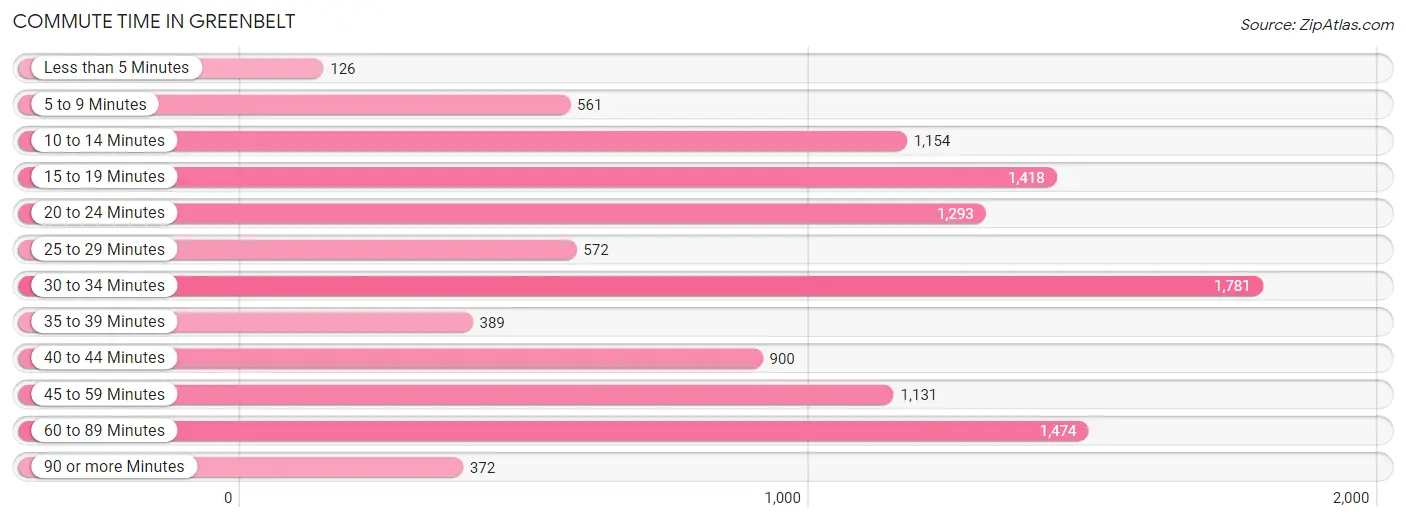
| Commute Time | # Commuters | % Commuters |
| Less than 5 Minutes | 126 | 1.1% |
| 5 to 9 Minutes | 561 | 5.0% |
| 10 to 14 Minutes | 1,154 | 10.3% |
| 15 to 19 Minutes | 1,418 | 12.7% |
| 20 to 24 Minutes | 1,293 | 11.6% |
| 25 to 29 Minutes | 572 | 5.1% |
| 30 to 34 Minutes | 1,781 | 15.9% |
| 35 to 39 Minutes | 389 | 3.5% |
| 40 to 44 Minutes | 900 | 8.1% |
| 45 to 59 Minutes | 1,131 | 10.1% |
| 60 to 89 Minutes | 1,474 | 13.2% |
| 90 or more Minutes | 372 | 3.3% |
Commute Time by Sex in Greenbelt
The most common commute times in Greenbelt are 30 to 34 minutes (896 commuters, 15.8%) for males and 30 to 34 minutes (885 commuters, 16.1%) for females.
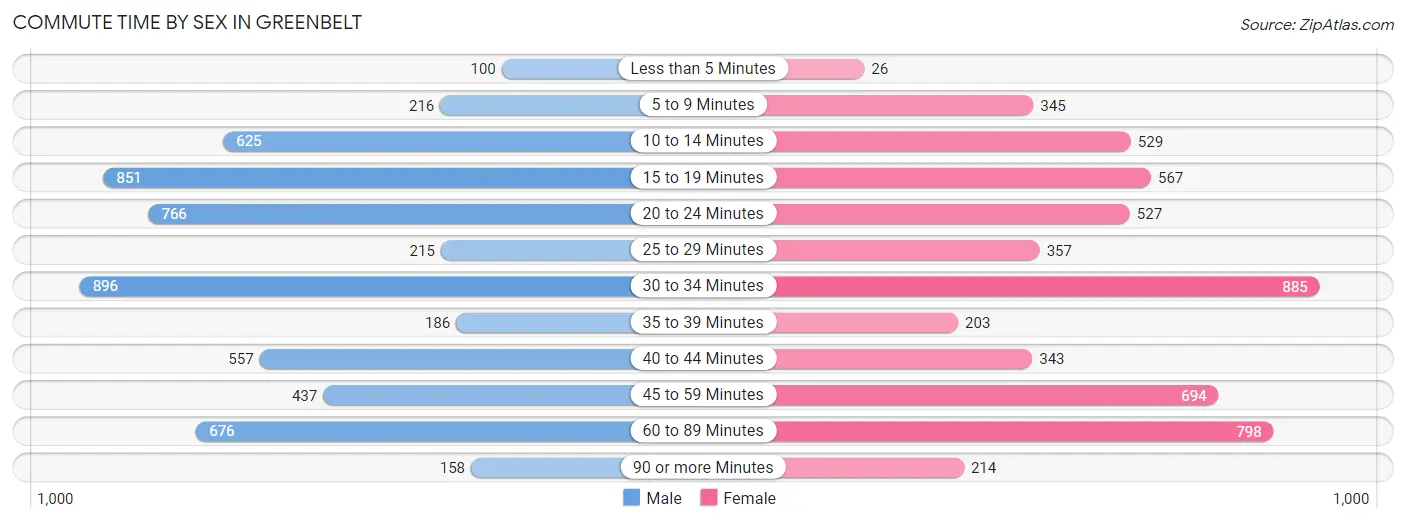
| Commute Time | Male | Female |
| Less than 5 Minutes | 100 (1.8%) | 26 (0.5%) |
| 5 to 9 Minutes | 216 (3.8%) | 345 (6.3%) |
| 10 to 14 Minutes | 625 (11.0%) | 529 (9.6%) |
| 15 to 19 Minutes | 851 (15.0%) | 567 (10.3%) |
| 20 to 24 Minutes | 766 (13.5%) | 527 (9.6%) |
| 25 to 29 Minutes | 215 (3.8%) | 357 (6.5%) |
| 30 to 34 Minutes | 896 (15.8%) | 885 (16.1%) |
| 35 to 39 Minutes | 186 (3.3%) | 203 (3.7%) |
| 40 to 44 Minutes | 557 (9.8%) | 343 (6.2%) |
| 45 to 59 Minutes | 437 (7.7%) | 694 (12.7%) |
| 60 to 89 Minutes | 676 (11.9%) | 798 (14.5%) |
| 90 or more Minutes | 158 (2.8%) | 214 (3.9%) |
Time of Departure to Work by Sex in Greenbelt
The most frequent times of departure to work in Greenbelt are 7:00 AM to 7:29 AM (818, 14.4%) for males and 8:00 AM to 8:29 AM (887, 16.2%) for females.
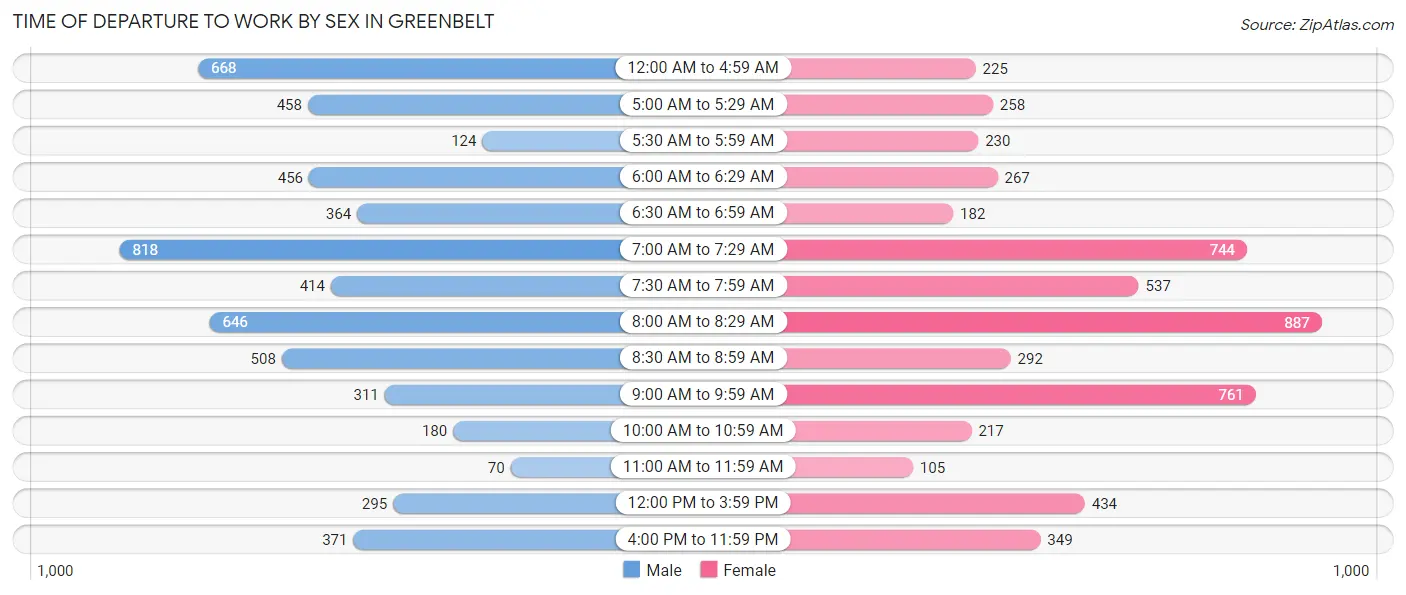
| Time of Departure | Male | Female |
| 12:00 AM to 4:59 AM | 668 (11.7%) | 225 (4.1%) |
| 5:00 AM to 5:29 AM | 458 (8.1%) | 258 (4.7%) |
| 5:30 AM to 5:59 AM | 124 (2.2%) | 230 (4.2%) |
| 6:00 AM to 6:29 AM | 456 (8.0%) | 267 (4.9%) |
| 6:30 AM to 6:59 AM | 364 (6.4%) | 182 (3.3%) |
| 7:00 AM to 7:29 AM | 818 (14.4%) | 744 (13.6%) |
| 7:30 AM to 7:59 AM | 414 (7.3%) | 537 (9.8%) |
| 8:00 AM to 8:29 AM | 646 (11.4%) | 887 (16.2%) |
| 8:30 AM to 8:59 AM | 508 (8.9%) | 292 (5.3%) |
| 9:00 AM to 9:59 AM | 311 (5.5%) | 761 (13.9%) |
| 10:00 AM to 10:59 AM | 180 (3.2%) | 217 (4.0%) |
| 11:00 AM to 11:59 AM | 70 (1.2%) | 105 (1.9%) |
| 12:00 PM to 3:59 PM | 295 (5.2%) | 434 (7.9%) |
| 4:00 PM to 11:59 PM | 371 (6.5%) | 349 (6.4%) |
| Total | 5,683 (100.0%) | 5,488 (100.0%) |
Housing Occupancy in Greenbelt
Occupancy by Ownership in Greenbelt
Of the total 10,235 dwellings in Greenbelt, owner-occupied units account for 5,254 (51.3%), while renter-occupied units make up 4,981 (48.7%).
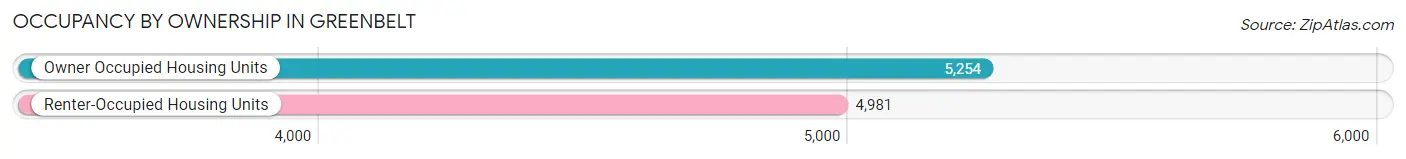
| Occupancy | # Housing Units | % Housing Units |
| Owner Occupied Housing Units | 5,254 | 51.3% |
| Renter-Occupied Housing Units | 4,981 | 48.7% |
| Total Occupied Housing Units | 10,235 | 100.0% |
Occupancy by Household Size in Greenbelt
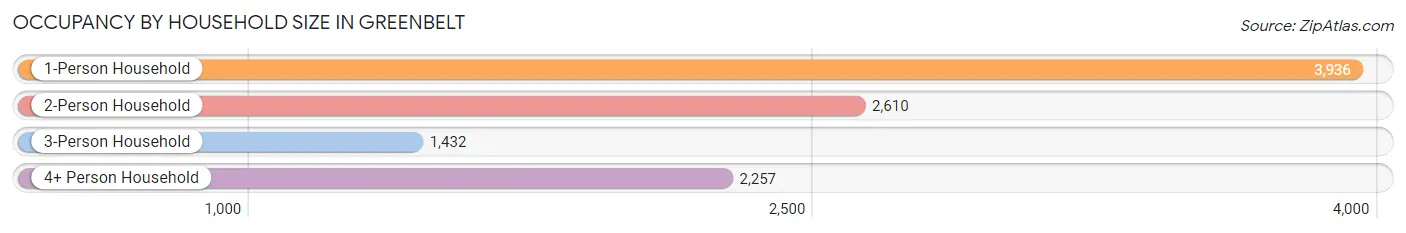
| Household Size | # Housing Units | % Housing Units |
| 1-Person Household | 3,936 | 38.5% |
| 2-Person Household | 2,610 | 25.5% |
| 3-Person Household | 1,432 | 14.0% |
| 4+ Person Household | 2,257 | 22.1% |
| Total Housing Units | 10,235 | 100.0% |
Occupancy by Ownership by Household Size in Greenbelt
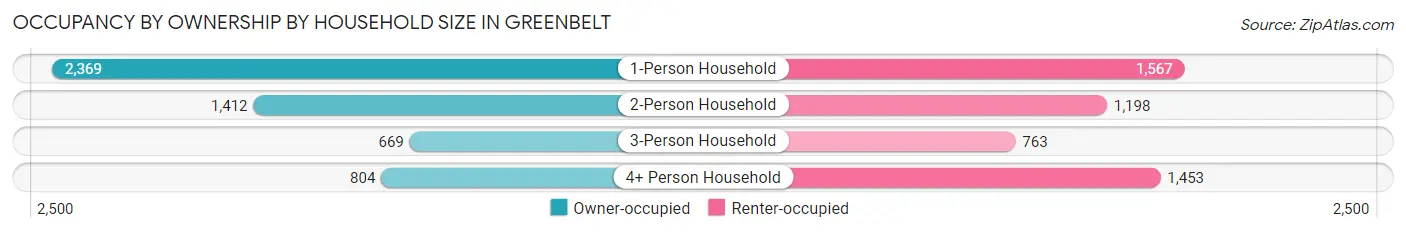
| Household Size | Owner-occupied | Renter-occupied |
| 1-Person Household | 2,369 (60.2%) | 1,567 (39.8%) |
| 2-Person Household | 1,412 (54.1%) | 1,198 (45.9%) |
| 3-Person Household | 669 (46.7%) | 763 (53.3%) |
| 4+ Person Household | 804 (35.6%) | 1,453 (64.4%) |
| Total Housing Units | 5,254 (51.3%) | 4,981 (48.7%) |
Occupancy by Educational Attainment in Greenbelt
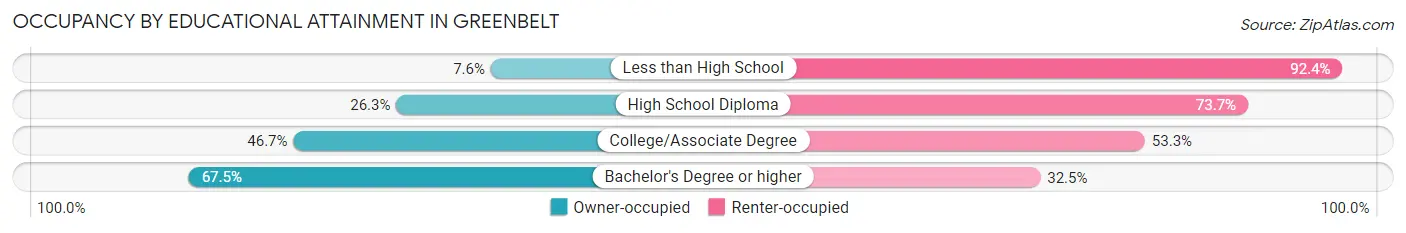
| Household Size | Owner-occupied | Renter-occupied |
| Less than High School | 59 (7.6%) | 720 (92.4%) |
| High School Diploma | 375 (26.3%) | 1,051 (73.7%) |
| College/Associate Degree | 1,345 (46.7%) | 1,534 (53.3%) |
| Bachelor's Degree or higher | 3,475 (67.5%) | 1,676 (32.5%) |
Occupancy by Age of Householder in Greenbelt
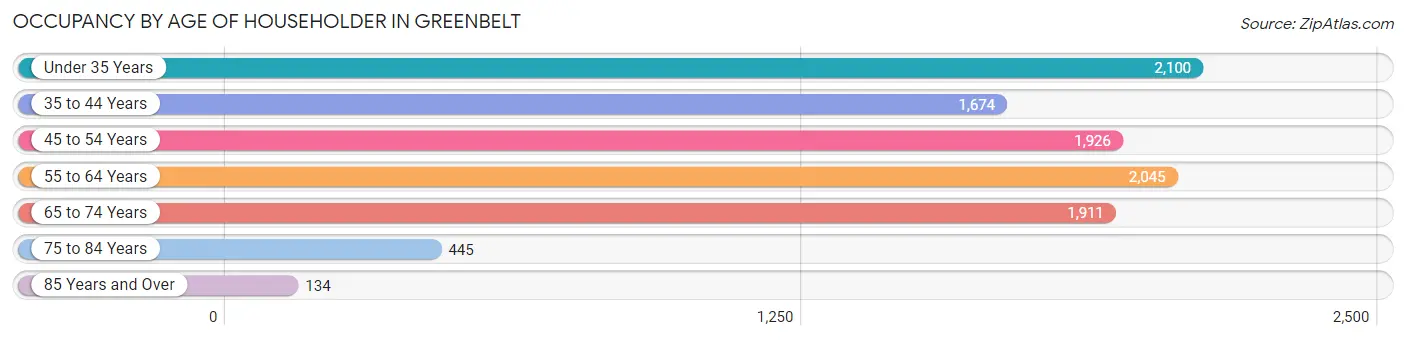
| Age Bracket | # Households | % Households |
| Under 35 Years | 2,100 | 20.5% |
| 35 to 44 Years | 1,674 | 16.4% |
| 45 to 54 Years | 1,926 | 18.8% |
| 55 to 64 Years | 2,045 | 20.0% |
| 65 to 74 Years | 1,911 | 18.7% |
| 75 to 84 Years | 445 | 4.3% |
| 85 Years and Over | 134 | 1.3% |
| Total | 10,235 | 100.0% |
Housing Finances in Greenbelt
Median Income by Occupancy in Greenbelt
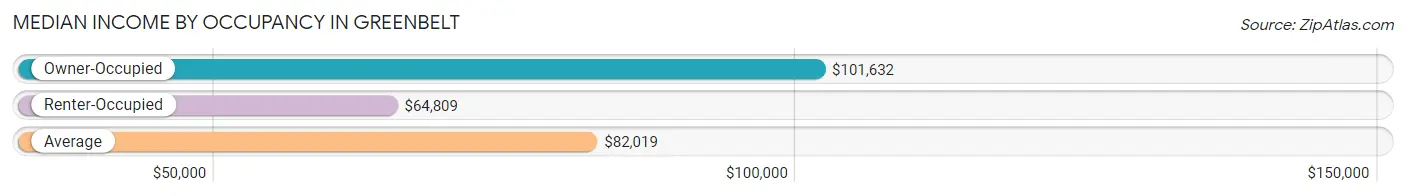
| Occupancy Type | # Households | Median Income |
| Owner-Occupied | 5,254 (51.3%) | $101,632 |
| Renter-Occupied | 4,981 (48.7%) | $64,809 |
| Average | 10,235 (100.0%) | $82,019 |
Occupancy by Householder Income Bracket in Greenbelt
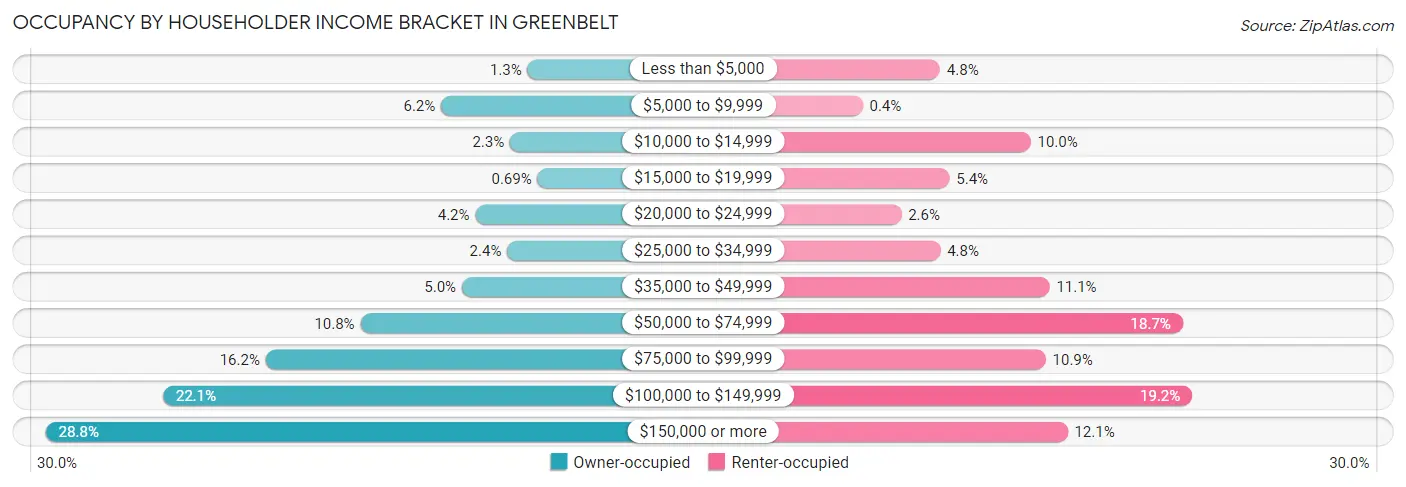
| Income Bracket | Owner-occupied | Renter-occupied |
| Less than $5,000 | 66 (1.3%) | 240 (4.8%) |
| $5,000 to $9,999 | 326 (6.2%) | 20 (0.4%) |
| $10,000 to $14,999 | 119 (2.3%) | 498 (10.0%) |
| $15,000 to $19,999 | 36 (0.7%) | 267 (5.4%) |
| $20,000 to $24,999 | 223 (4.2%) | 130 (2.6%) |
| $25,000 to $34,999 | 127 (2.4%) | 241 (4.8%) |
| $35,000 to $49,999 | 263 (5.0%) | 552 (11.1%) |
| $50,000 to $74,999 | 568 (10.8%) | 931 (18.7%) |
| $75,000 to $99,999 | 852 (16.2%) | 541 (10.9%) |
| $100,000 to $149,999 | 1,161 (22.1%) | 958 (19.2%) |
| $150,000 or more | 1,513 (28.8%) | 603 (12.1%) |
| Total | 5,254 (100.0%) | 4,981 (100.0%) |
Monthly Housing Cost Tiers in Greenbelt
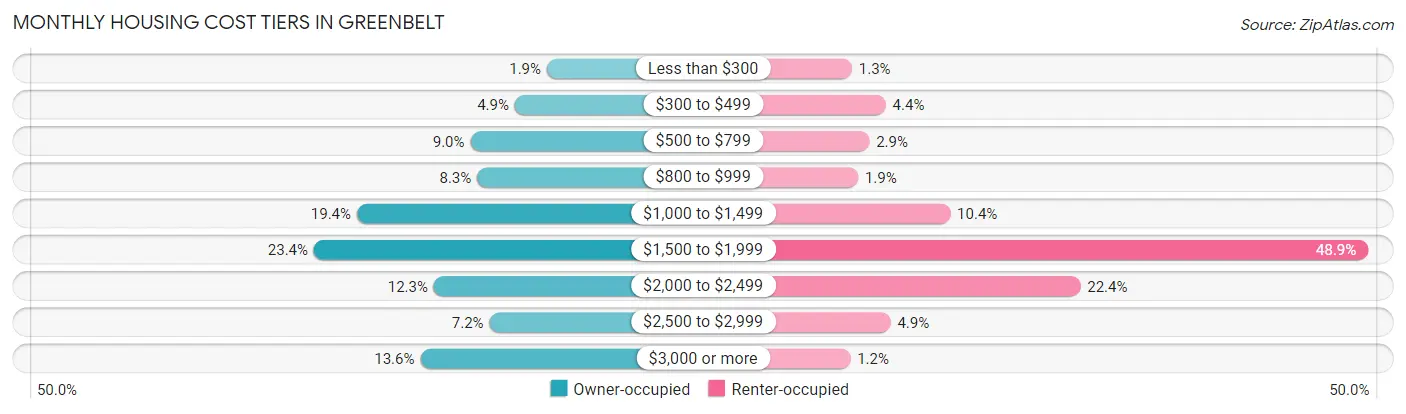
| Monthly Cost | Owner-occupied | Renter-occupied |
| Less than $300 | 101 (1.9%) | 66 (1.3%) |
| $300 to $499 | 256 (4.9%) | 221 (4.4%) |
| $500 to $799 | 471 (9.0%) | 146 (2.9%) |
| $800 to $999 | 438 (8.3%) | 94 (1.9%) |
| $1,000 to $1,499 | 1,020 (19.4%) | 517 (10.4%) |
| $1,500 to $1,999 | 1,228 (23.4%) | 2,433 (48.8%) |
| $2,000 to $2,499 | 648 (12.3%) | 1,114 (22.4%) |
| $2,500 to $2,999 | 379 (7.2%) | 243 (4.9%) |
| $3,000 or more | 713 (13.6%) | 59 (1.2%) |
| Total | 5,254 (100.0%) | 4,981 (100.0%) |
Physical Housing Characteristics in Greenbelt
Housing Structures in Greenbelt
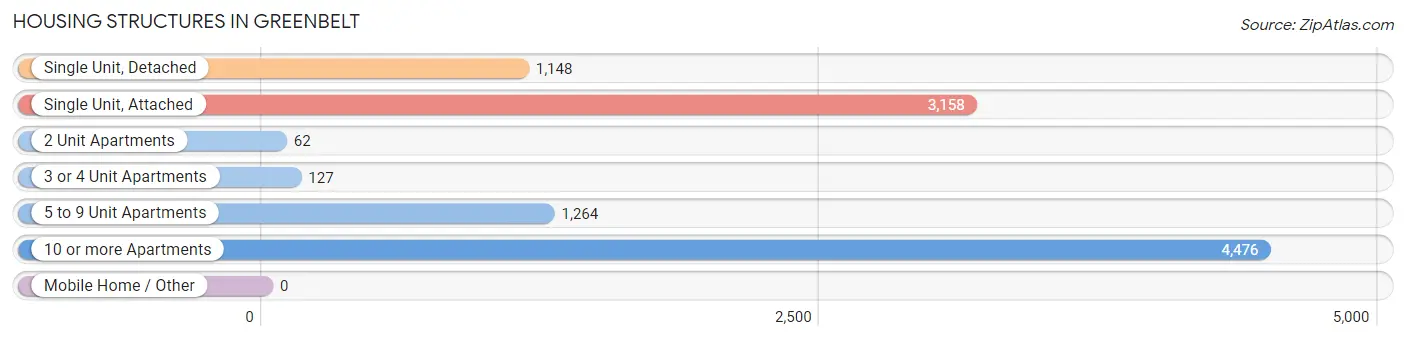
| Structure Type | # Housing Units | % Housing Units |
| Single Unit, Detached | 1,148 | 11.2% |
| Single Unit, Attached | 3,158 | 30.8% |
| 2 Unit Apartments | 62 | 0.6% |
| 3 or 4 Unit Apartments | 127 | 1.2% |
| 5 to 9 Unit Apartments | 1,264 | 12.3% |
| 10 or more Apartments | 4,476 | 43.7% |
| Mobile Home / Other | 0 | 0.0% |
| Total | 10,235 | 100.0% |
Housing Structures by Occupancy in Greenbelt
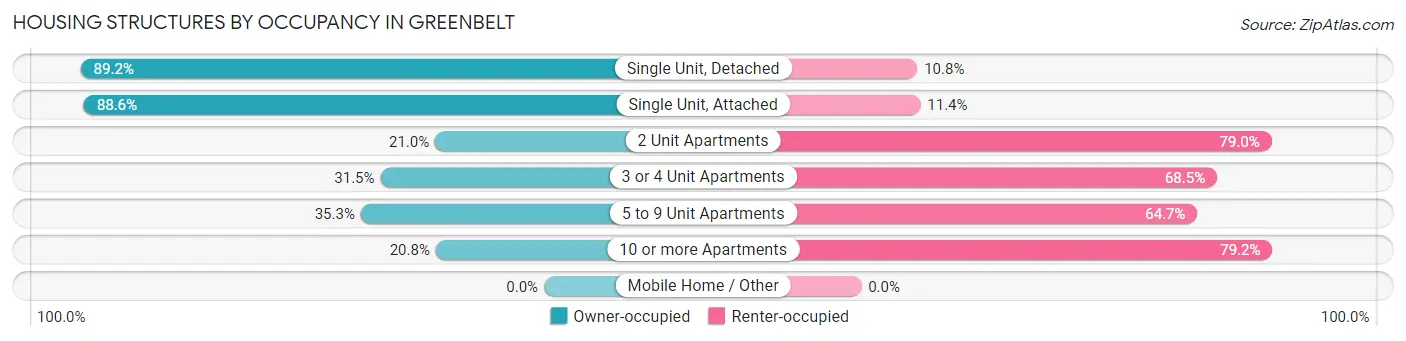
| Structure Type | Owner-occupied | Renter-occupied |
| Single Unit, Detached | 1,024 (89.2%) | 124 (10.8%) |
| Single Unit, Attached | 2,798 (88.6%) | 360 (11.4%) |
| 2 Unit Apartments | 13 (21.0%) | 49 (79.0%) |
| 3 or 4 Unit Apartments | 40 (31.5%) | 87 (68.5%) |
| 5 to 9 Unit Apartments | 446 (35.3%) | 818 (64.7%) |
| 10 or more Apartments | 933 (20.8%) | 3,543 (79.2%) |
| Mobile Home / Other | 0 (0.0%) | 0 (0.0%) |
| Total | 5,254 (51.3%) | 4,981 (48.7%) |
Housing Structures by Number of Rooms in Greenbelt
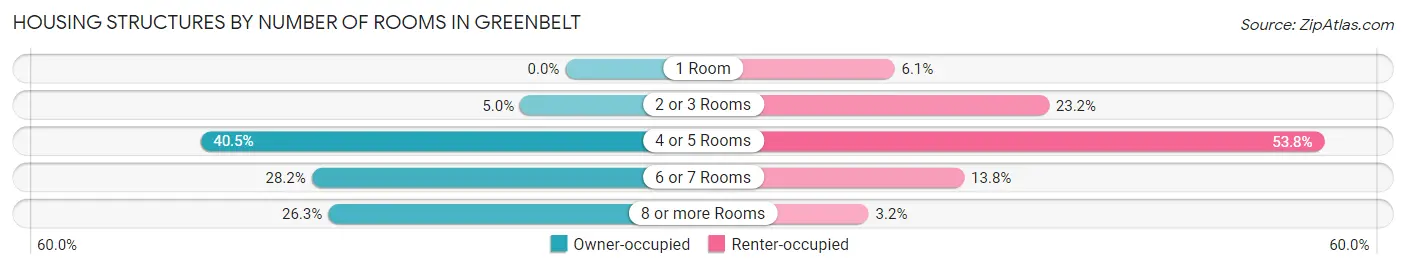
| Number of Rooms | Owner-occupied | Renter-occupied |
| 1 Room | 0 (0.0%) | 302 (6.1%) |
| 2 or 3 Rooms | 264 (5.0%) | 1,155 (23.2%) |
| 4 or 5 Rooms | 2,128 (40.5%) | 2,678 (53.8%) |
| 6 or 7 Rooms | 1,479 (28.1%) | 687 (13.8%) |
| 8 or more Rooms | 1,383 (26.3%) | 159 (3.2%) |
| Total | 5,254 (100.0%) | 4,981 (100.0%) |
Housing Structure by Heating Type in Greenbelt
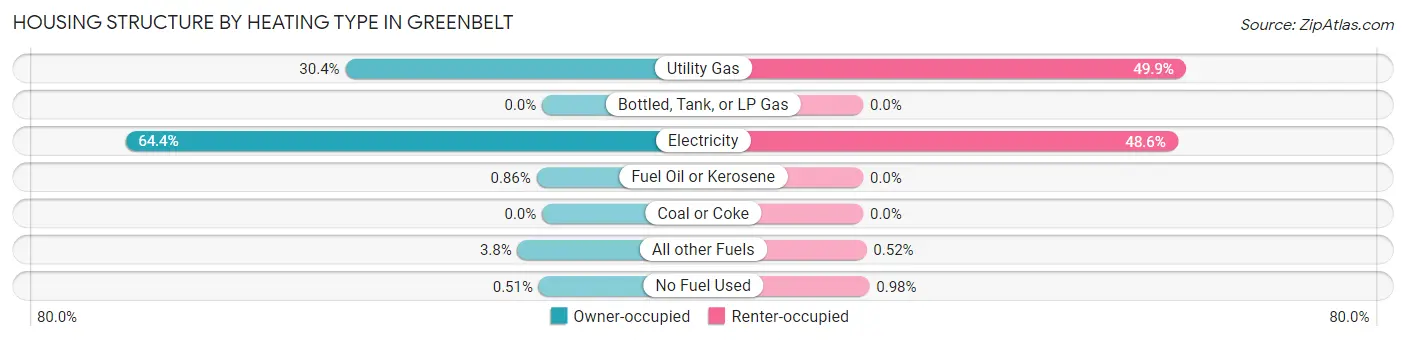
| Heating Type | Owner-occupied | Renter-occupied |
| Utility Gas | 1,598 (30.4%) | 2,484 (49.9%) |
| Bottled, Tank, or LP Gas | 0 (0.0%) | 0 (0.0%) |
| Electricity | 3,385 (64.4%) | 2,422 (48.6%) |
| Fuel Oil or Kerosene | 45 (0.9%) | 0 (0.0%) |
| Coal or Coke | 0 (0.0%) | 0 (0.0%) |
| All other Fuels | 199 (3.8%) | 26 (0.5%) |
| No Fuel Used | 27 (0.5%) | 49 (1.0%) |
| Total | 5,254 (100.0%) | 4,981 (100.0%) |
Household Vehicle Usage in Greenbelt
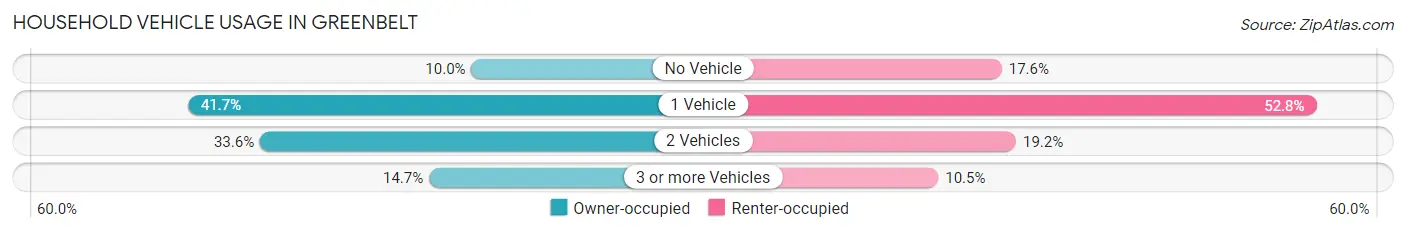
| Vehicles per Household | Owner-occupied | Renter-occupied |
| No Vehicle | 523 (10.0%) | 875 (17.6%) |
| 1 Vehicle | 2,192 (41.7%) | 2,630 (52.8%) |
| 2 Vehicles | 1,767 (33.6%) | 955 (19.2%) |
| 3 or more Vehicles | 772 (14.7%) | 521 (10.5%) |
| Total | 5,254 (100.0%) | 4,981 (100.0%) |
Real Estate & Mortgages in Greenbelt
Real Estate and Mortgage Overview in Greenbelt
| Characteristic | Without Mortgage | With Mortgage |
| Housing Units | 1,343 | 3,911 |
| Median Property Value | $218,300 | $293,300 |
| Median Household Income | $75,496 | $1,269 |
| Monthly Housing Costs | $762 | $713 |
| Real Estate Taxes | $2,834 | $61 |
Property Value by Mortgage Status in Greenbelt
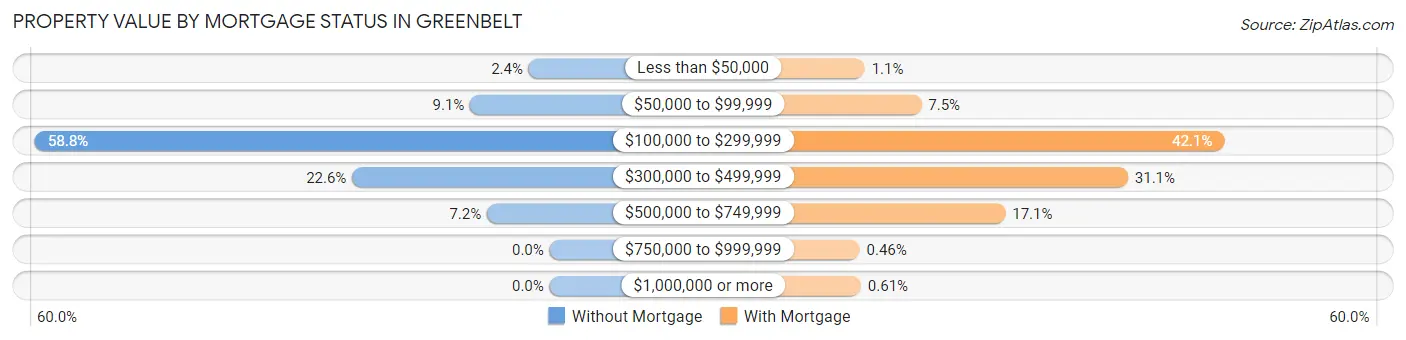
| Property Value | Without Mortgage | With Mortgage |
| Less than $50,000 | 32 (2.4%) | 41 (1.1%) |
| $50,000 to $99,999 | 122 (9.1%) | 294 (7.5%) |
| $100,000 to $299,999 | 790 (58.8%) | 1,648 (42.1%) |
| $300,000 to $499,999 | 303 (22.6%) | 1,217 (31.1%) |
| $500,000 to $749,999 | 96 (7.1%) | 669 (17.1%) |
| $750,000 to $999,999 | 0 (0.0%) | 18 (0.5%) |
| $1,000,000 or more | 0 (0.0%) | 24 (0.6%) |
| Total | 1,343 (100.0%) | 3,911 (100.0%) |
Household Income by Mortgage Status in Greenbelt
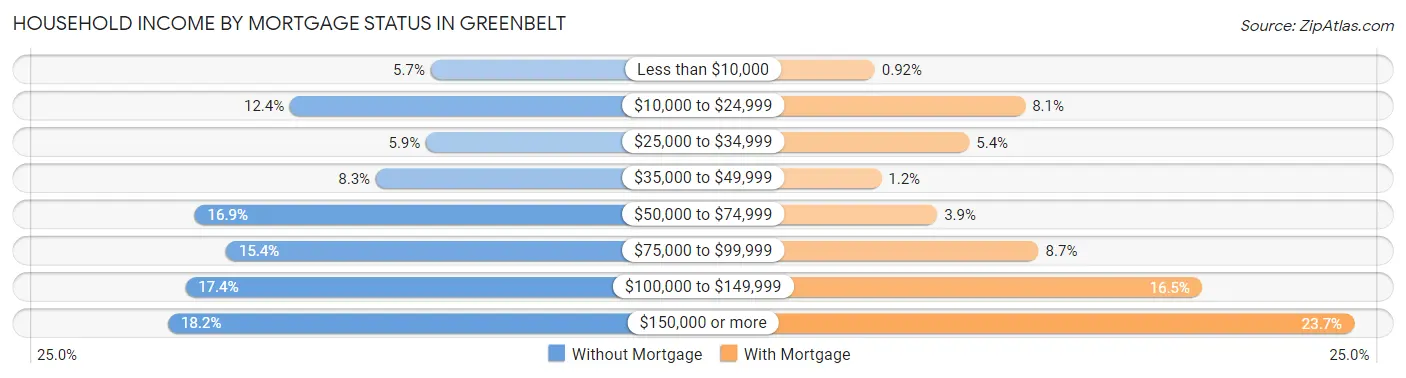
| Household Income | Without Mortgage | With Mortgage |
| Less than $10,000 | 76 (5.7%) | 36 (0.9%) |
| $10,000 to $24,999 | 166 (12.4%) | 316 (8.1%) |
| $25,000 to $34,999 | 79 (5.9%) | 212 (5.4%) |
| $35,000 to $49,999 | 111 (8.3%) | 48 (1.2%) |
| $50,000 to $74,999 | 227 (16.9%) | 152 (3.9%) |
| $75,000 to $99,999 | 207 (15.4%) | 341 (8.7%) |
| $100,000 to $149,999 | 233 (17.3%) | 645 (16.5%) |
| $150,000 or more | 244 (18.2%) | 928 (23.7%) |
| Total | 1,343 (100.0%) | 3,911 (100.0%) |
Property Value to Household Income Ratio in Greenbelt
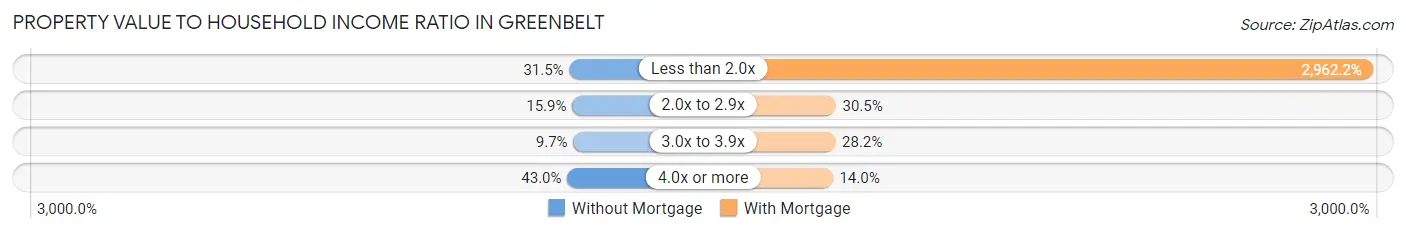
| Value-to-Income Ratio | Without Mortgage | With Mortgage |
| Less than 2.0x | 423 (31.5%) | 115,852 (2,962.2%) |
| 2.0x to 2.9x | 213 (15.9%) | 1,194 (30.5%) |
| 3.0x to 3.9x | 130 (9.7%) | 1,103 (28.2%) |
| 4.0x or more | 577 (43.0%) | 549 (14.0%) |
| Total | 1,343 (100.0%) | 3,911 (100.0%) |
Real Estate Taxes by Mortgage Status in Greenbelt
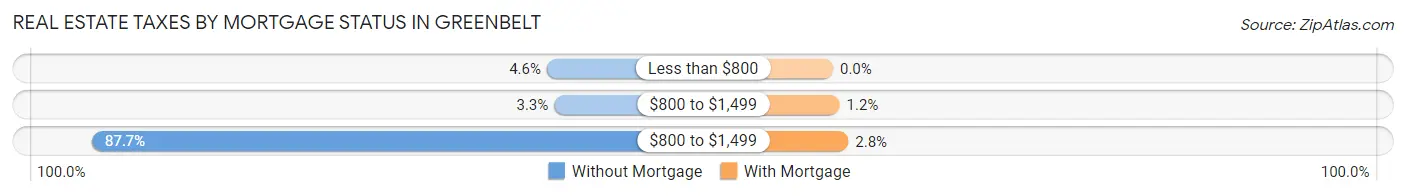
| Property Taxes | Without Mortgage | With Mortgage |
| Less than $800 | 62 (4.6%) | 0 (0.0%) |
| $800 to $1,499 | 44 (3.3%) | 47 (1.2%) |
| $800 to $1,499 | 1,178 (87.7%) | 109 (2.8%) |
| Total | 1,343 (100.0%) | 3,911 (100.0%) |
Health & Disability in Greenbelt
Health Insurance Coverage by Age in Greenbelt
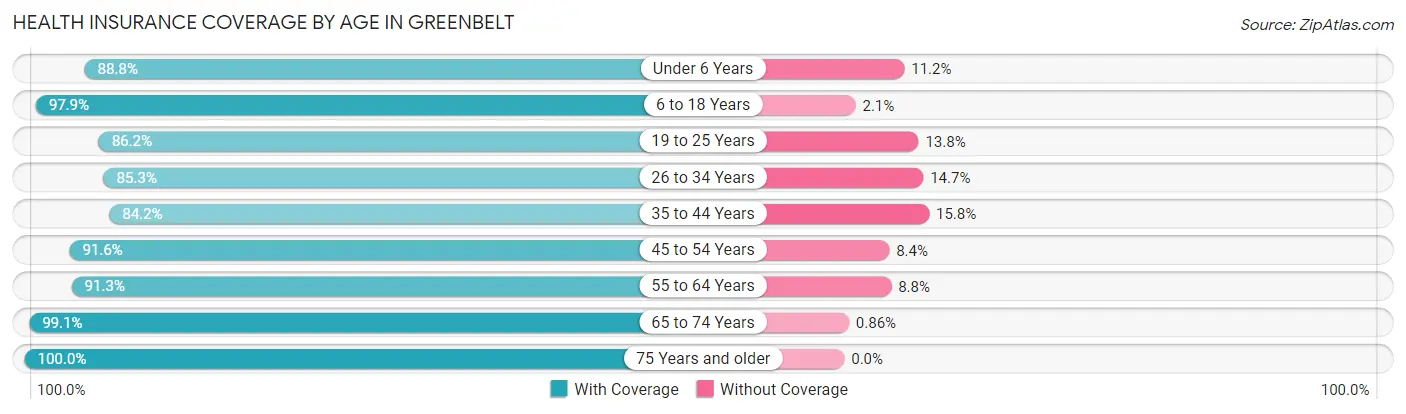
| Age Bracket | With Coverage | Without Coverage |
| Under 6 Years | 1,698 (88.8%) | 214 (11.2%) |
| 6 to 18 Years | 3,860 (97.9%) | 83 (2.1%) |
| 19 to 25 Years | 2,150 (86.2%) | 345 (13.8%) |
| 26 to 34 Years | 2,693 (85.3%) | 465 (14.7%) |
| 35 to 44 Years | 2,718 (84.2%) | 510 (15.8%) |
| 45 to 54 Years | 3,020 (91.6%) | 276 (8.4%) |
| 55 to 64 Years | 2,960 (91.2%) | 284 (8.7%) |
| 65 to 74 Years | 2,546 (99.1%) | 22 (0.9%) |
| 75 Years and older | 778 (100.0%) | 0 (0.0%) |
| Total | 22,423 (91.1%) | 2,199 (8.9%) |
Health Insurance Coverage by Citizenship Status in Greenbelt
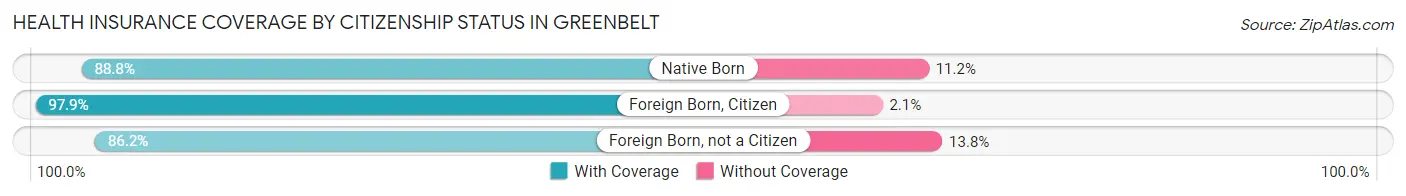
| Citizenship Status | With Coverage | Without Coverage |
| Native Born | 1,698 (88.8%) | 214 (11.2%) |
| Foreign Born, Citizen | 3,860 (97.9%) | 83 (2.1%) |
| Foreign Born, not a Citizen | 2,150 (86.2%) | 345 (13.8%) |
Health Insurance Coverage by Household Income in Greenbelt
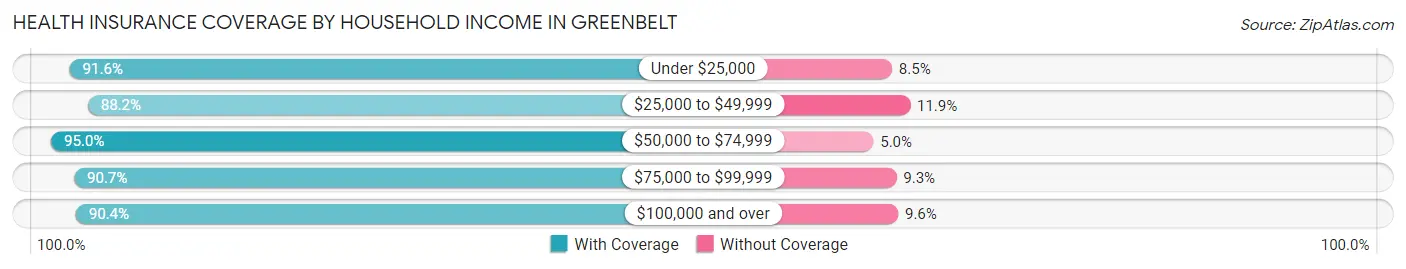
| Household Income | With Coverage | Without Coverage |
| Under $25,000 | 3,260 (91.5%) | 301 (8.5%) |
| $25,000 to $49,999 | 2,016 (88.1%) | 271 (11.8%) |
| $50,000 to $74,999 | 3,372 (95.0%) | 176 (5.0%) |
| $75,000 to $99,999 | 3,000 (90.7%) | 307 (9.3%) |
| $100,000 and over | 10,768 (90.4%) | 1,144 (9.6%) |
Public vs Private Health Insurance Coverage by Age in Greenbelt
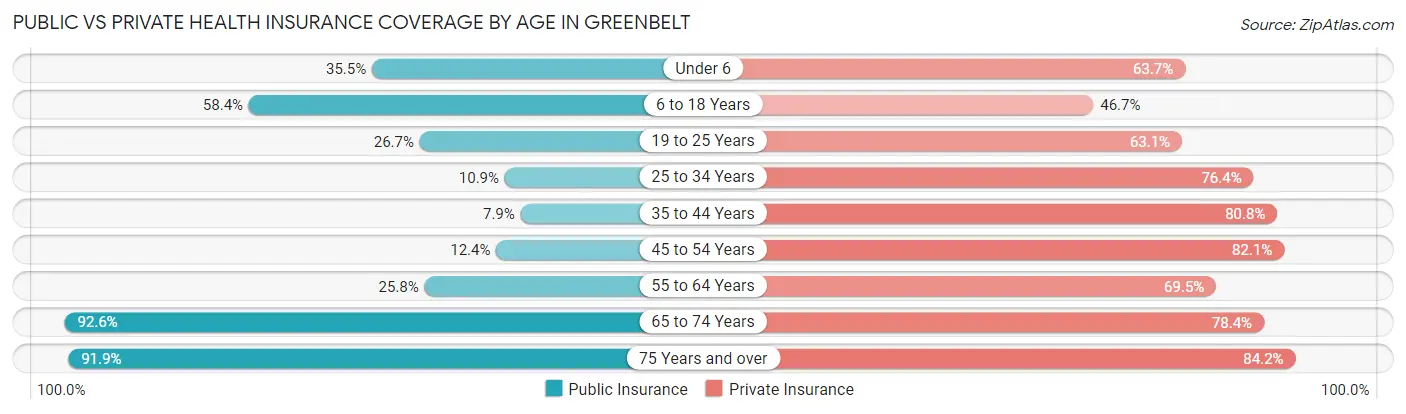
| Age Bracket | Public Insurance | Private Insurance |
| Under 6 | 679 (35.5%) | 1,218 (63.7%) |
| 6 to 18 Years | 2,301 (58.4%) | 1,841 (46.7%) |
| 19 to 25 Years | 665 (26.7%) | 1,575 (63.1%) |
| 25 to 34 Years | 343 (10.9%) | 2,413 (76.4%) |
| 35 to 44 Years | 256 (7.9%) | 2,609 (80.8%) |
| 45 to 54 Years | 410 (12.4%) | 2,706 (82.1%) |
| 55 to 64 Years | 836 (25.8%) | 2,254 (69.5%) |
| 65 to 74 Years | 2,378 (92.6%) | 2,012 (78.3%) |
| 75 Years and over | 715 (91.9%) | 655 (84.2%) |
| Total | 8,583 (34.9%) | 17,283 (70.2%) |
Disability Status by Sex by Age in Greenbelt
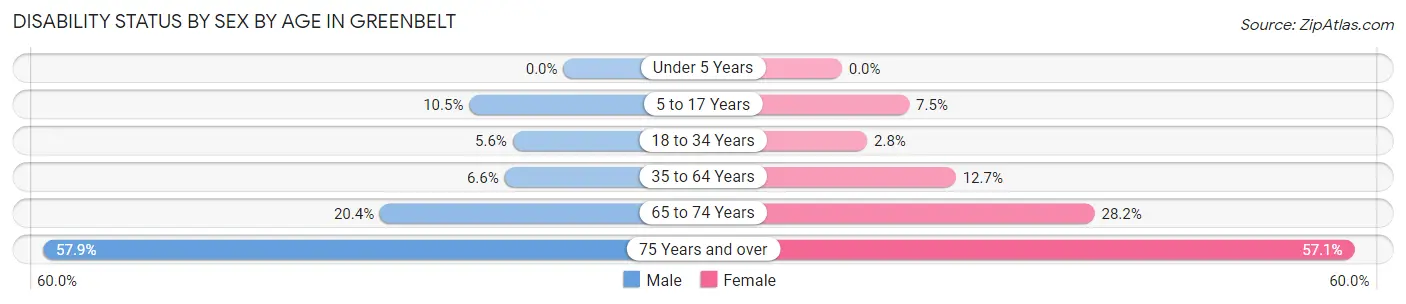
| Age Bracket | Male | Female |
| Under 5 Years | 0 (0.0%) | 0 (0.0%) |
| 5 to 17 Years | 197 (10.5%) | 141 (7.5%) |
| 18 to 34 Years | 180 (5.6%) | 82 (2.8%) |
| 35 to 64 Years | 278 (6.6%) | 701 (12.7%) |
| 65 to 74 Years | 195 (20.4%) | 454 (28.1%) |
| 75 Years and over | 197 (57.9%) | 250 (57.1%) |
Disability Class by Sex by Age in Greenbelt
Disability Class: Hearing Difficulty
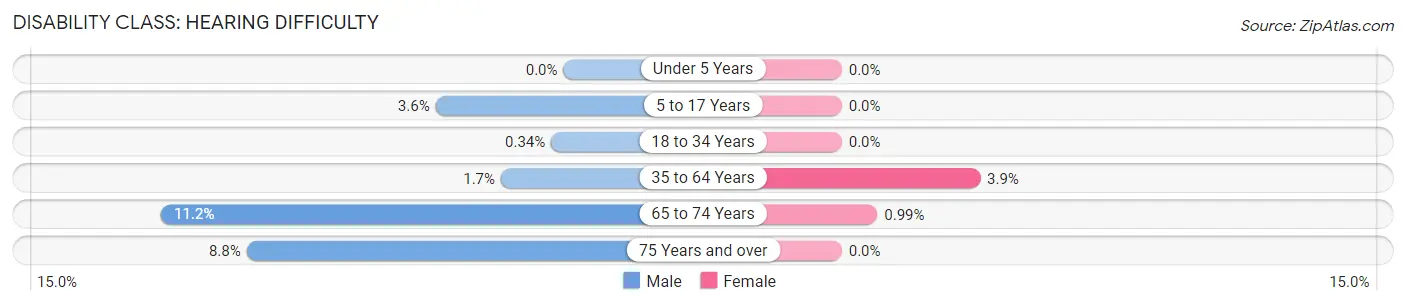
| Age Bracket | Male | Female |
| Under 5 Years | 0 (0.0%) | 0 (0.0%) |
| 5 to 17 Years | 67 (3.6%) | 0 (0.0%) |
| 18 to 34 Years | 11 (0.3%) | 0 (0.0%) |
| 35 to 64 Years | 74 (1.7%) | 213 (3.8%) |
| 65 to 74 Years | 107 (11.2%) | 16 (1.0%) |
| 75 Years and over | 30 (8.8%) | 0 (0.0%) |
Disability Class: Vision Difficulty
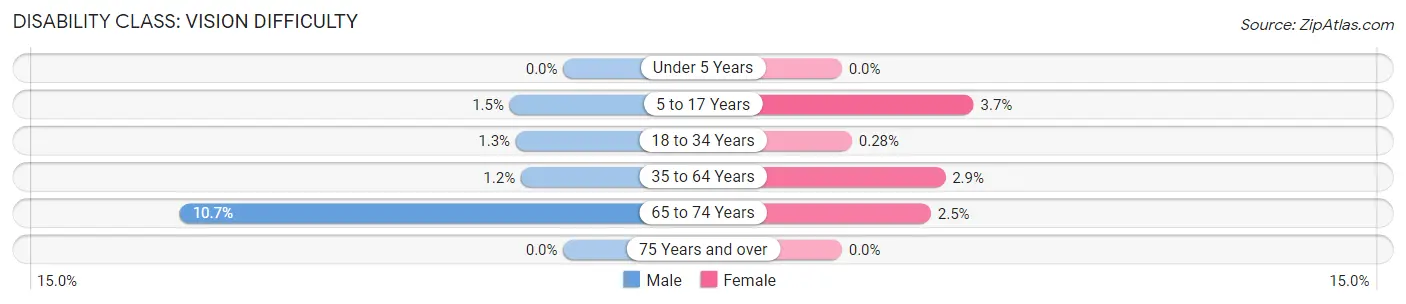
| Age Bracket | Male | Female |
| Under 5 Years | 0 (0.0%) | 0 (0.0%) |
| 5 to 17 Years | 28 (1.5%) | 69 (3.7%) |
| 18 to 34 Years | 42 (1.3%) | 8 (0.3%) |
| 35 to 64 Years | 50 (1.2%) | 159 (2.9%) |
| 65 to 74 Years | 102 (10.7%) | 40 (2.5%) |
| 75 Years and over | 0 (0.0%) | 0 (0.0%) |
Disability Class: Cognitive Difficulty
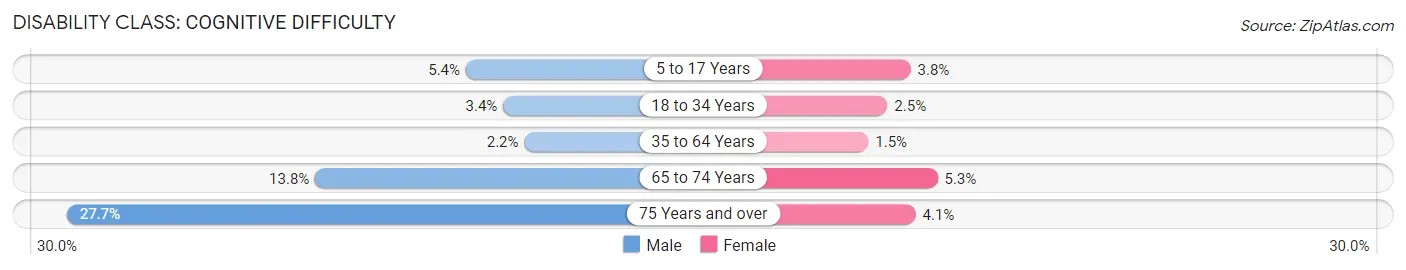
| Age Bracket | Male | Female |
| 5 to 17 Years | 102 (5.4%) | 72 (3.8%) |
| 18 to 34 Years | 107 (3.4%) | 74 (2.5%) |
| 35 to 64 Years | 92 (2.2%) | 82 (1.5%) |
| 65 to 74 Years | 132 (13.8%) | 86 (5.3%) |
| 75 Years and over | 94 (27.7%) | 18 (4.1%) |
Disability Class: Ambulatory Difficulty
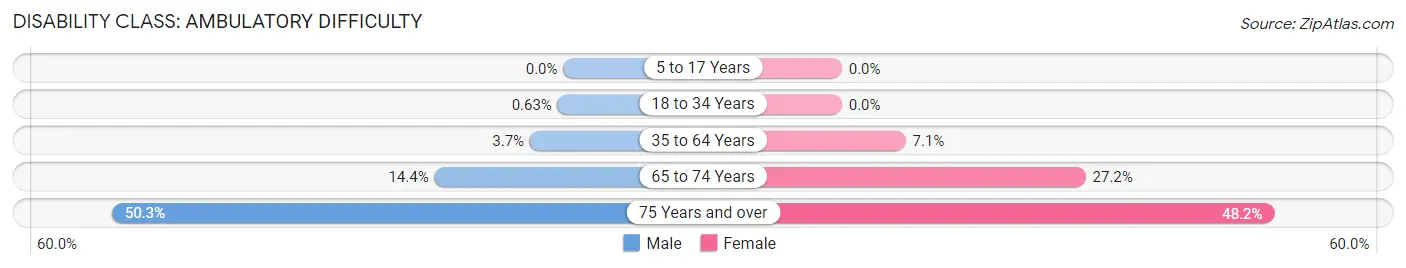
| Age Bracket | Male | Female |
| 5 to 17 Years | 0 (0.0%) | 0 (0.0%) |
| 18 to 34 Years | 20 (0.6%) | 0 (0.0%) |
| 35 to 64 Years | 158 (3.7%) | 393 (7.1%) |
| 65 to 74 Years | 137 (14.3%) | 438 (27.2%) |
| 75 Years and over | 171 (50.3%) | 211 (48.2%) |
Disability Class: Self-Care Difficulty
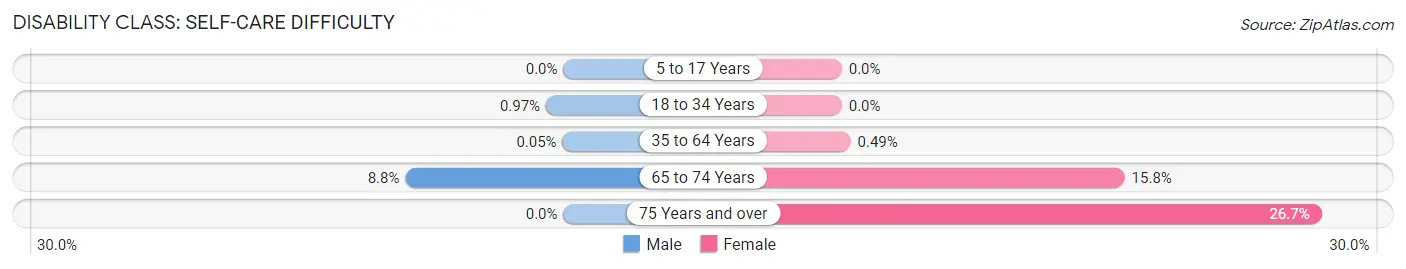
| Age Bracket | Male | Female |
| 5 to 17 Years | 0 (0.0%) | 0 (0.0%) |
| 18 to 34 Years | 31 (1.0%) | 0 (0.0%) |
| 35 to 64 Years | 2 (0.1%) | 27 (0.5%) |
| 65 to 74 Years | 84 (8.8%) | 254 (15.8%) |
| 75 Years and over | 0 (0.0%) | 117 (26.7%) |
Technology Access in Greenbelt
Computing Device Access in Greenbelt
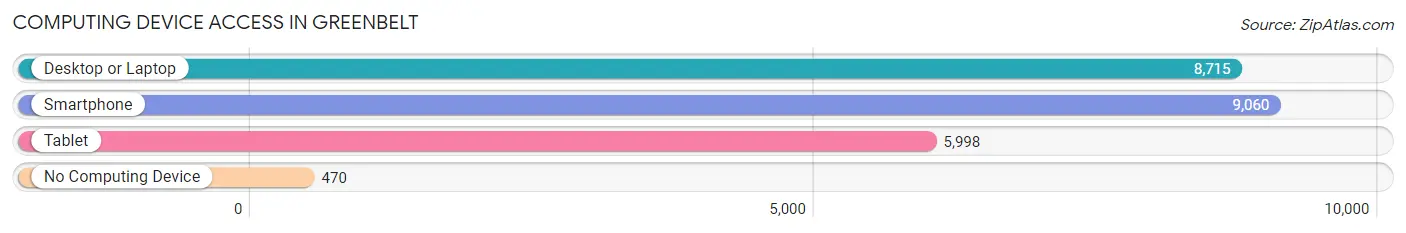
| Device Type | # Households | % Households |
| Desktop or Laptop | 8,715 | 85.2% |
| Smartphone | 9,060 | 88.5% |
| Tablet | 5,998 | 58.6% |
| No Computing Device | 470 | 4.6% |
| Total | 10,235 | 100.0% |
Internet Access in Greenbelt
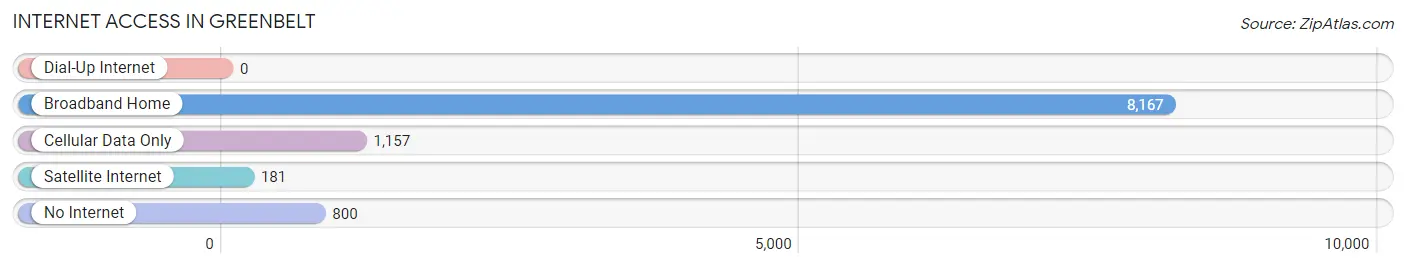
| Internet Type | # Households | % Households |
| Dial-Up Internet | 0 | 0.0% |
| Broadband Home | 8,167 | 79.8% |
| Cellular Data Only | 1,157 | 11.3% |
| Satellite Internet | 181 | 1.8% |
| No Internet | 800 | 7.8% |
| Total | 10,235 | 100.0% |
Greenbelt Summary
Greenbelt, Maryland is a city located in Prince George’s County, Maryland, United States. It is located just east of Washington, D.C. and is part of the Washington metropolitan area. The population of Greenbelt was 23,068 at the 2010 census.
History
Greenbelt was founded in 1937 as part of the New Deal, a series of programs and projects initiated by President Franklin D. Roosevelt to combat the Great Depression. The city was designed by the architectural firm of Ehrenkrantz, Eckstut & Whitelaw and was the first planned community in the United States. The city was designed to be a self-contained community with a town center, residential neighborhoods, and a commercial district. The city was also designed to be racially and economically integrated, with a mix of public and private housing.
The city was built on land that was formerly part of the Beltsville Agricultural Research Center. The city was named after the surrounding belt of green space, which was designed to provide a buffer between the city and the surrounding countryside.
Geography
Greenbelt is located at 38°59′N 76°53′W (38.983, -76.878). According to the United States Census Bureau, the city has a total area of 6.34 square miles (16.4 km2), of which 6.32 square miles (16.3 km2) is land and 0.02 square miles (0.05 km2) is water.
Economy
Greenbelt is home to a variety of businesses, including retail stores, restaurants, and professional services. The city is also home to the University of Maryland, College Park, which is located just outside the city limits.
The city is served by two major highways, Interstate 95 and the Baltimore-Washington Parkway. The city is also served by the Washington Metro, which has two stations in Greenbelt.
Demographics
As of the 2010 census, there were 23,068 people, 8,890 households, and 5,717 families residing in the city. The population density was 3,637.3 people per square mile (1,406.2/km2). There were 9,541 housing units at an average density of 1,510.3 per square mile (582.2/km2). The racial makeup of the city was 44.2% White, 33.3% African American, 0.3% Native American, 11.3% Asian, 0.1% Pacific Islander, 6.2% from other races, and 4.6% from two or more races. Hispanic or Latino of any race were 13.3% of the population.
There were 8,890 households, out of which 32.2% had children under the age of 18 living with them, 44.2% were married couples living together, 14.7% had a female householder with no husband present, and 35.2% were non-families. 28.2% of all households were made up of individuals, and 8.2% had someone living alone who was 65 years of age or older. The average household size was 2.56 and the average family size was 3.17.
In the city, the population was spread out, with 24.2% under the age of 18, 8.7% from 18 to 24, 33.2% from 25 to 44, 22.2% from 45 to 64, and 11.7% who were 65 years of age or older. The median age was 36 years. For every 100 females, there were 91.2 males. For every 100 females age 18 and over, there were 87.7 males.
The median income for a household in the city was $54,711, and the median income for a family was $64,945. Males had a median income of $41,945 versus $35,836 for females. The per capita income for the city was $25,890. About 6.2% of families and 8.7% of the population were below the poverty line, including 11.2% of those under age 18 and 6.2% of those age 65 or over.
Common Questions
What is Per Capita Income in Greenbelt?
Per Capita income in Greenbelt is $44,710.
What is the Median Family Income in Greenbelt?
Median Family Income in Greenbelt is $108,041.
What is the Median Household income in Greenbelt?
Median Household Income in Greenbelt is $82,019.
What is Income or Wage Gap in Greenbelt?
Income or Wage Gap in Greenbelt is 5.0%.
Women in Greenbelt earn 95.0 cents for every dollar earned by a man.
What is Family Income Deficit in Greenbelt?
Family Income Deficit in Greenbelt is $12,884.
Families that are below poverty line in Greenbelt earn $12,884 less on average than the poverty threshold level.
What is Inequality or Gini Index in Greenbelt?
Inequality or Gini Index in Greenbelt is 0.46.
What is the Total Population of Greenbelt?
Total Population of Greenbelt is 24,646.
What is the Total Male Population of Greenbelt?
Total Male Population of Greenbelt is 11,465.
What is the Total Female Population of Greenbelt?
Total Female Population of Greenbelt is 13,181.
What is the Ratio of Males per 100 Females in Greenbelt?
There are 86.98 Males per 100 Females in Greenbelt.
What is the Ratio of Females per 100 Males in Greenbelt?
There are 114.97 Females per 100 Males in Greenbelt.
What is the Median Population Age in Greenbelt?
Median Population Age in Greenbelt is 37.2 Years.
What is the Average Family Size in Greenbelt
Average Family Size in Greenbelt is 3.2 People.
What is the Average Household Size in Greenbelt
Average Household Size in Greenbelt is 2.4 People.
How Large is the Labor Force in Greenbelt?
There are 14,551 People in the Labor Forcein in Greenbelt.
What is the Percentage of People in the Labor Force in Greenbelt?
73.7% of People are in the Labor Force in Greenbelt.
What is the Unemployment Rate in Greenbelt?
Unemployment Rate in Greenbelt is 8.6%.