Waco, TX Map & Demographics
Waco Map
Waco Overview
$26,825
PER CAPITA INCOME
$65,196
AVG FAMILY INCOME
$47,421
AVG HOUSEHOLD INCOME
24.2%
WAGE / INCOME GAP [ % ]
75.8¢/ $1
WAGE / INCOME GAP [ $ ]
$10,299
FAMILY INCOME DEFICIT
0.50
INEQUALITY / GINI INDEX
140,545
TOTAL POPULATION
68,355
MALE POPULATION
72,190
FEMALE POPULATION
94.69
MALES / 100 FEMALES
105.61
FEMALES / 100 MALES
28.8
MEDIAN AGE
3.2
AVG FAMILY SIZE
2.5
AVG HOUSEHOLD SIZE
67,304
LABOR FORCE [ PEOPLE ]
60.7%
PERCENT IN LABOR FORCE
4.5%
UNEMPLOYMENT RATE
Waco Area Codes
Income in Waco
Income Overview in Waco
Per Capita Income in Waco is $26,825, while median incomes of families and households are $65,196 and $47,421 respectively.
| Characteristic | Number | Measure |
| Per Capita Income | 140,545 | $26,825 |
| Median Family Income | 29,686 | $65,196 |
| Mean Family Income | 29,686 | $88,912 |
| Median Household Income | 52,256 | $47,421 |
| Mean Household Income | 52,256 | $69,561 |
| Income Deficit | 29,686 | $10,299 |
| Wage / Income Gap (%) | 140,545 | 24.20% |
| Wage / Income Gap ($) | 140,545 | 75.80¢ per $1 |
| Gini / Inequality Index | 140,545 | 0.50 |
Earnings by Sex in Waco
Average Earnings in Waco are $27,597, $31,874 for men and $24,161 for women, a difference of 24.2%.

| Sex | Number | Average Earnings |
| Male | 37,629 (50.4%) | $31,874 |
| Female | 36,986 (49.6%) | $24,161 |
| Total | 74,615 (100.0%) | $27,597 |
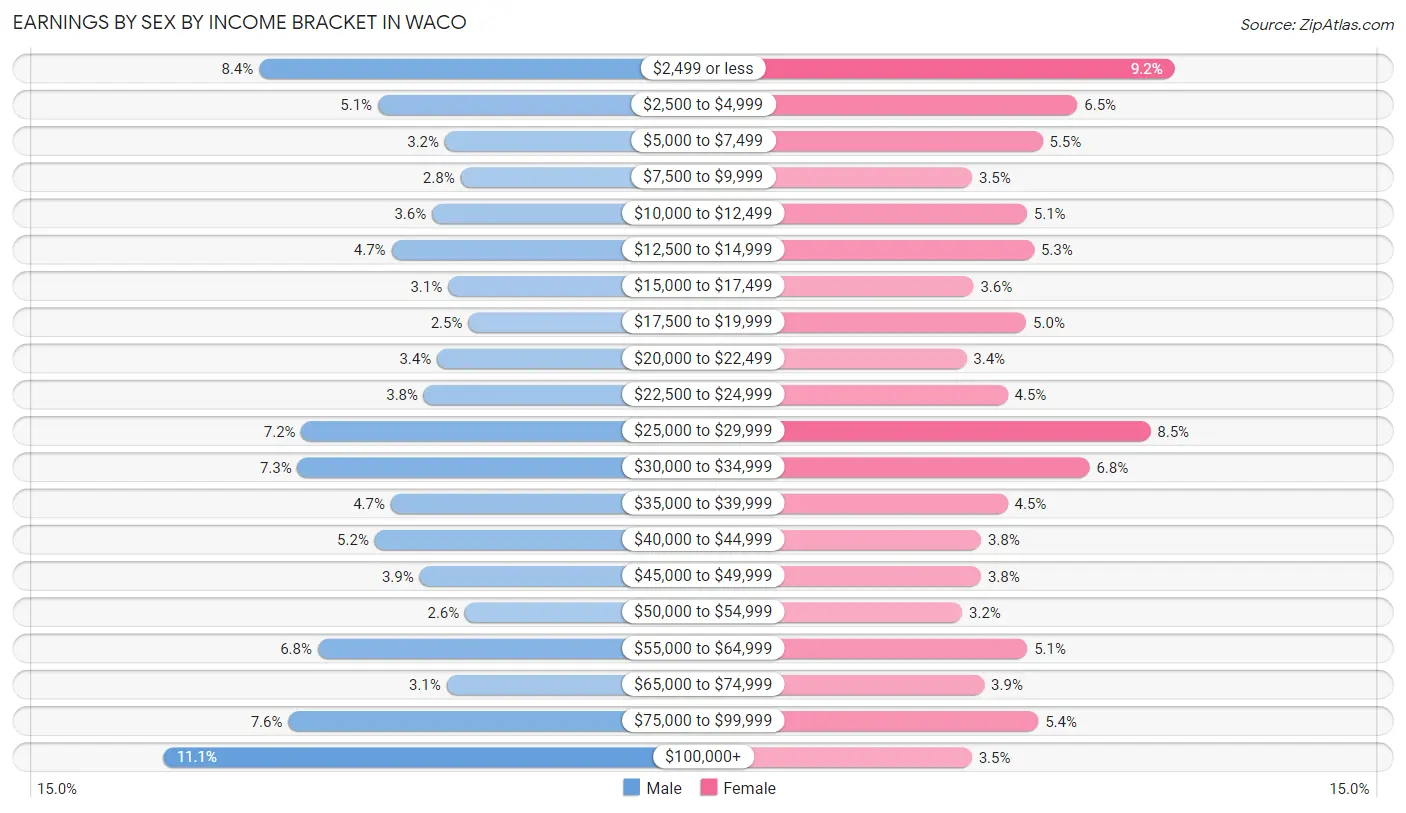
Earnings by Sex by Income Bracket in Waco
The most common earnings brackets in Waco are $100,000+ for men (4,173 | 11.1%) and $2,499 or less for women (3,406 | 9.2%).
| Income | Male | Female |
| $2,499 or less | 3,164 (8.4%) | 3,406 (9.2%) |
| $2,500 to $4,999 | 1,908 (5.1%) | 2,397 (6.5%) |
| $5,000 to $7,499 | 1,200 (3.2%) | 2,036 (5.5%) |
| $7,500 to $9,999 | 1,036 (2.8%) | 1,303 (3.5%) |
| $10,000 to $12,499 | 1,335 (3.5%) | 1,871 (5.1%) |
| $12,500 to $14,999 | 1,766 (4.7%) | 1,947 (5.3%) |
| $15,000 to $17,499 | 1,167 (3.1%) | 1,315 (3.6%) |
| $17,500 to $19,999 | 951 (2.5%) | 1,865 (5.0%) |
| $20,000 to $22,499 | 1,284 (3.4%) | 1,243 (3.4%) |
| $22,500 to $24,999 | 1,424 (3.8%) | 1,671 (4.5%) |
| $25,000 to $29,999 | 2,718 (7.2%) | 3,156 (8.5%) |
| $30,000 to $34,999 | 2,757 (7.3%) | 2,522 (6.8%) |
| $35,000 to $39,999 | 1,774 (4.7%) | 1,672 (4.5%) |
| $40,000 to $44,999 | 1,940 (5.2%) | 1,394 (3.8%) |
| $45,000 to $49,999 | 1,467 (3.9%) | 1,393 (3.8%) |
| $50,000 to $54,999 | 985 (2.6%) | 1,200 (3.2%) |
| $55,000 to $64,999 | 2,545 (6.8%) | 1,876 (5.1%) |
| $65,000 to $74,999 | 1,180 (3.1%) | 1,429 (3.9%) |
| $75,000 to $99,999 | 2,855 (7.6%) | 1,991 (5.4%) |
| $100,000+ | 4,173 (11.1%) | 1,299 (3.5%) |
| Total | 37,629 (100.0%) | 36,986 (100.0%) |
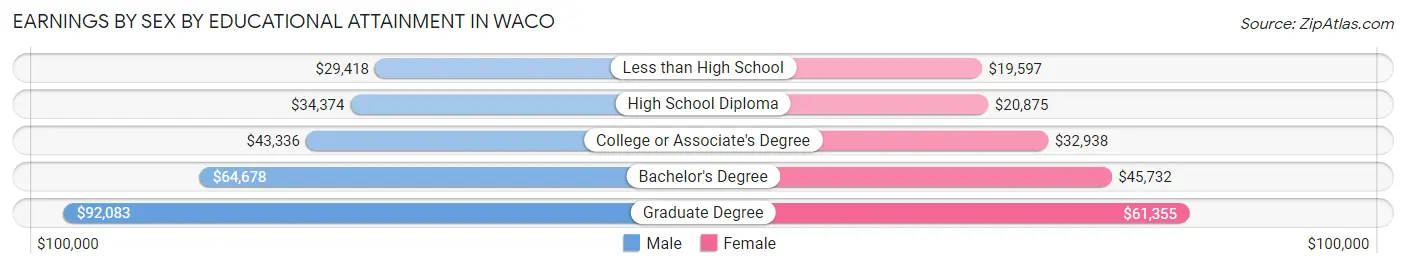
Earnings by Sex by Educational Attainment in Waco
Average earnings in Waco are $42,053 for men and $32,009 for women, a difference of 23.9%. Men with an educational attainment of graduate degree enjoy the highest average annual earnings of $92,083, while those with less than high school education earn the least with $29,418. Women with an educational attainment of graduate degree earn the most with the average annual earnings of $61,355, while those with less than high school education have the smallest earnings of $19,597.
| Educational Attainment | Male Income | Female Income |
| Less than High School | $29,418 | $19,597 |
| High School Diploma | $34,374 | $20,875 |
| College or Associate's Degree | $43,336 | $32,938 |
| Bachelor's Degree | $64,678 | $45,732 |
| Graduate Degree | $92,083 | $61,355 |
| Total | $42,053 | $32,009 |
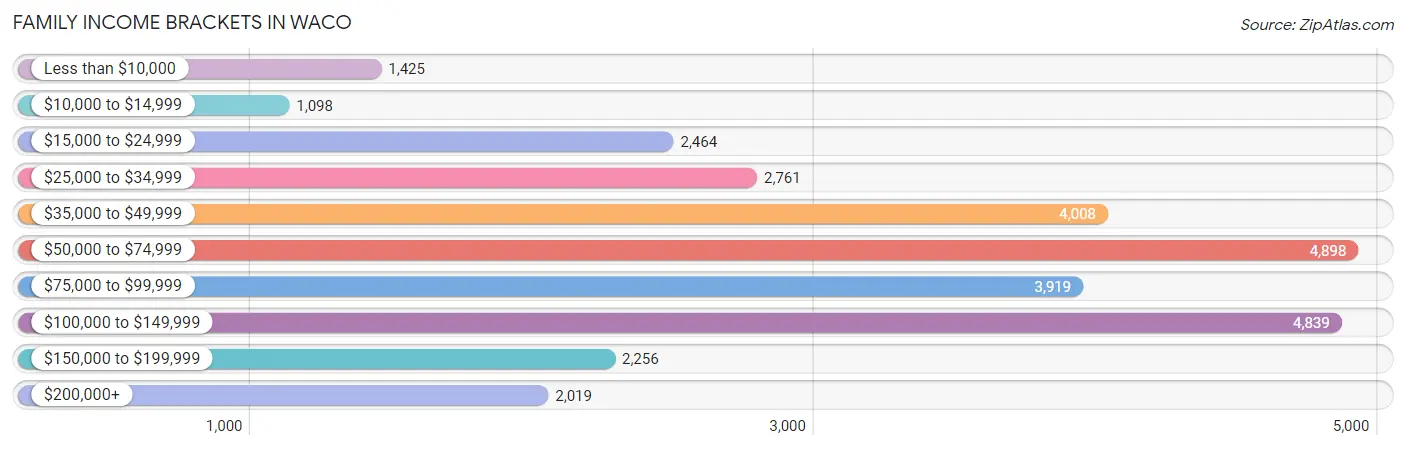
Family Income in Waco
Family Income Brackets in Waco
According to the Waco family income data, there are 4,898 families falling into the $50,000 to $74,999 income range, which is the most common income bracket and makes up 16.5% of all families. Conversely, the $10,000 to $14,999 income bracket is the least frequent group with only 1,098 families (3.7%) belonging to this category.
| Income Bracket | # Families | % Families |
| Less than $10,000 | 1,425 | 4.8% |
| $10,000 to $14,999 | 1,098 | 3.7% |
| $15,000 to $24,999 | 2,464 | 8.3% |
| $25,000 to $34,999 | 2,761 | 9.3% |
| $35,000 to $49,999 | 4,008 | 13.5% |
| $50,000 to $74,999 | 4,898 | 16.5% |
| $75,000 to $99,999 | 3,919 | 13.2% |
| $100,000 to $149,999 | 4,839 | 16.3% |
| $150,000 to $199,999 | 2,256 | 7.6% |
| $200,000+ | 2,019 | 6.8% |
Family Income by Famaliy Size in Waco
7+ person families (542 | 1.8%) account for the highest median family income in Waco with $102,344 per family, while 2-person families (13,413 | 45.2%) have the highest median income of $30,158 per family member.
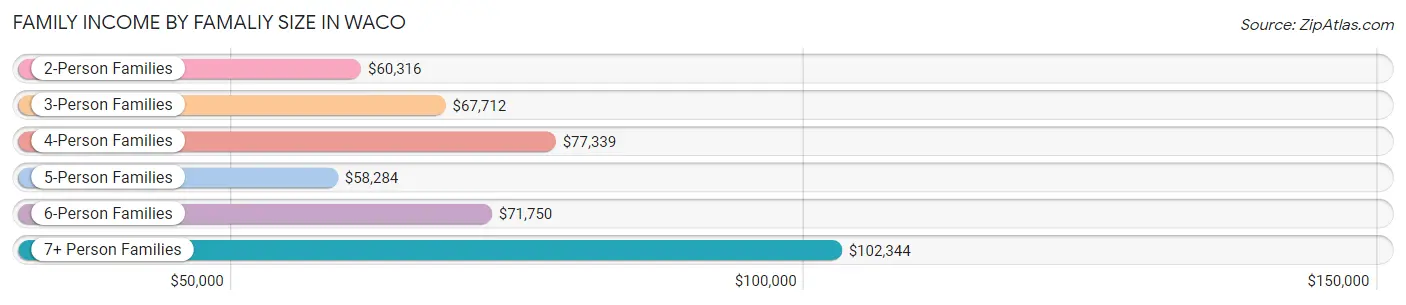
| Income Bracket | # Families | Median Income |
| 2-Person Families | 13,413 (45.2%) | $60,316 |
| 3-Person Families | 6,448 (21.7%) | $67,712 |
| 4-Person Families | 5,415 (18.2%) | $77,339 |
| 5-Person Families | 2,896 (9.8%) | $58,284 |
| 6-Person Families | 972 (3.3%) | $71,750 |
| 7+ Person Families | 542 (1.8%) | $102,344 |
| Total | 29,686 (100.0%) | $65,196 |
Family Income by Number of Earners in Waco
The median family income in Waco is $65,196, with families comprising 3+ earners (2,582) having the highest median family income of $106,750, while families with no earners (3,531) have the lowest median family income of $35,557, accounting for 8.7% and 11.9% of families, respectively.
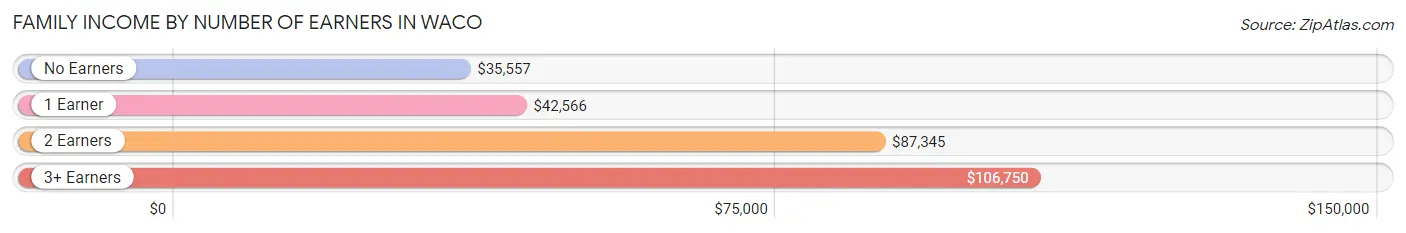
| Number of Earners | # Families | Median Income |
| No Earners | 3,531 (11.9%) | $35,557 |
| 1 Earner | 11,377 (38.3%) | $42,566 |
| 2 Earners | 12,196 (41.1%) | $87,345 |
| 3+ Earners | 2,582 (8.7%) | $106,750 |
| Total | 29,686 (100.0%) | $65,196 |
Household Income in Waco
Household Income Brackets in Waco
With 8,204 households falling in the category, the $50,000 to $74,999 income range is the most frequent in Waco, accounting for 15.7% of all households. In contrast, only 2,404 households (4.6%) fall into the $150,000 to $199,999 income bracket, making it the least populous group.
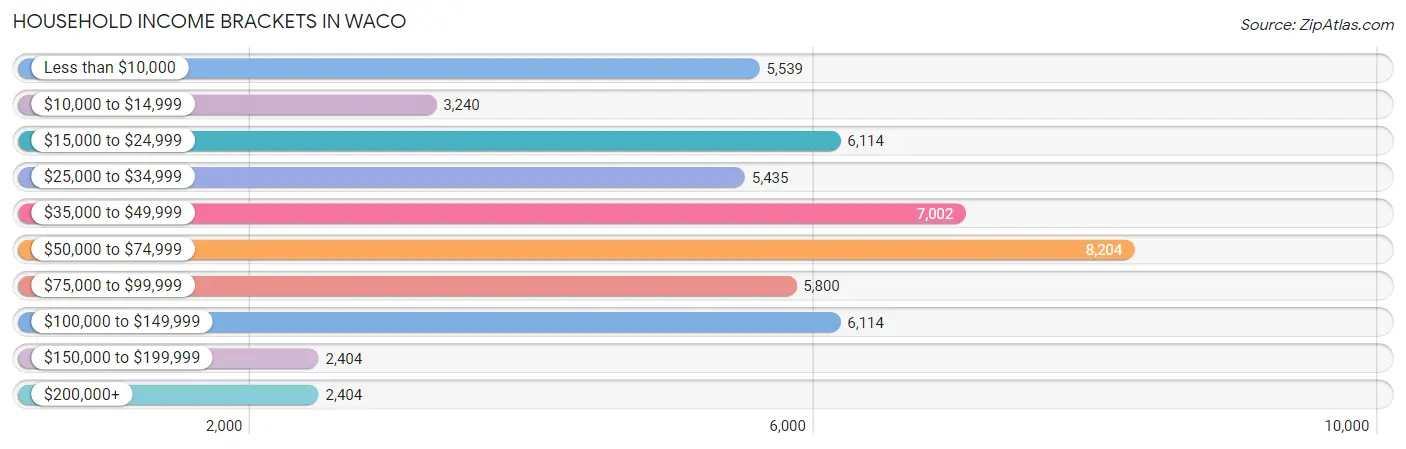
| Income Bracket | # Households | % Households |
| Less than $10,000 | 5,539 | 10.6% |
| $10,000 to $14,999 | 3,240 | 6.2% |
| $15,000 to $24,999 | 6,114 | 11.7% |
| $25,000 to $34,999 | 5,435 | 10.4% |
| $35,000 to $49,999 | 7,002 | 13.4% |
| $50,000 to $74,999 | 8,204 | 15.7% |
| $75,000 to $99,999 | 5,800 | 11.1% |
| $100,000 to $149,999 | 6,114 | 11.7% |
| $150,000 to $199,999 | 2,404 | 4.6% |
| $200,000+ | 2,404 | 4.6% |
Household Income by Householder Age in Waco
The median household income in Waco is $47,421, with the highest median household income of $62,165 found in the 45 to 64 years age bracket for the primary householder. A total of 15,002 households (28.7%) fall into this category. Meanwhile, the 15 to 24 years age bracket for the primary householder has the lowest median household income of $22,045, with 7,684 households (14.7%) in this group.
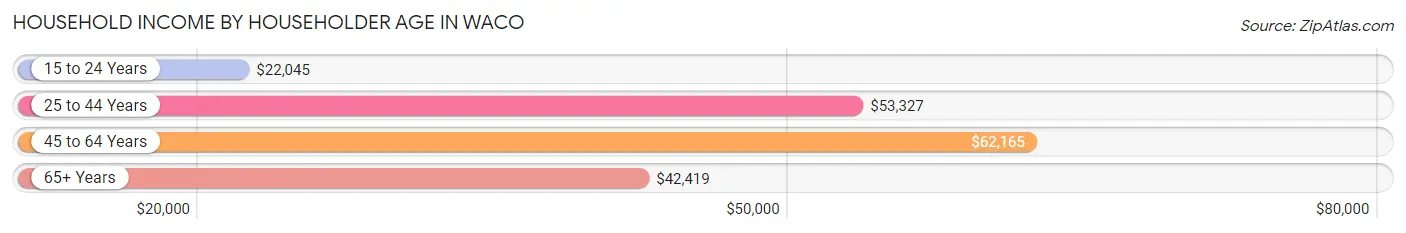
| Income Bracket | # Households | Median Income |
| 15 to 24 Years | 7,684 (14.7%) | $22,045 |
| 25 to 44 Years | 17,877 (34.2%) | $53,327 |
| 45 to 64 Years | 15,002 (28.7%) | $62,165 |
| 65+ Years | 11,693 (22.4%) | $42,419 |
| Total | 52,256 (100.0%) | $47,421 |
Poverty in Waco
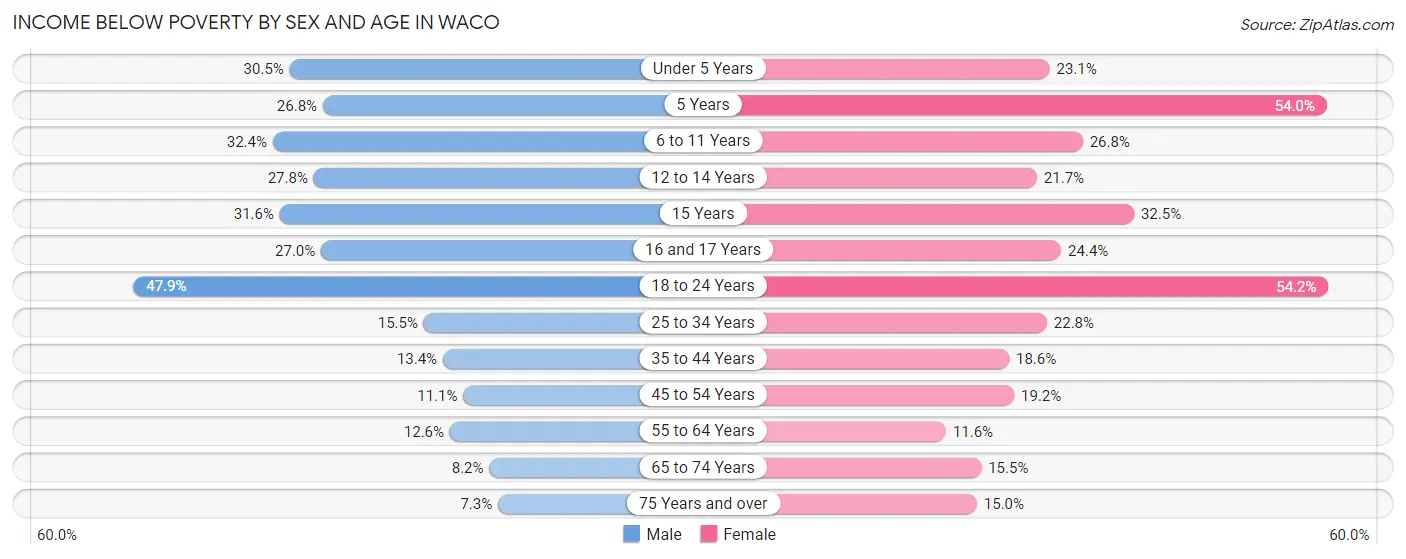
Income Below Poverty by Sex and Age in Waco
With 23.4% poverty level for males and 26.0% for females among the residents of Waco, 18 to 24 year old males and 18 to 24 year old females are the most vulnerable to poverty, with 5,537 males (47.9%) and 6,271 females (54.2%) in their respective age groups living below the poverty level.
| Age Bracket | Male | Female |
| Under 5 Years | 1,525 (30.5%) | 1,059 (23.1%) |
| 5 Years | 203 (26.8%) | 490 (54.0%) |
| 6 to 11 Years | 1,764 (32.4%) | 1,318 (26.8%) |
| 12 to 14 Years | 770 (27.8%) | 569 (21.7%) |
| 15 Years | 313 (31.6%) | 356 (32.5%) |
| 16 and 17 Years | 426 (27.0%) | 341 (24.4%) |
| 18 to 24 Years | 5,537 (47.9%) | 6,271 (54.2%) |
| 25 to 34 Years | 1,364 (15.5%) | 2,347 (22.8%) |
| 35 to 44 Years | 992 (13.4%) | 1,385 (18.6%) |
| 45 to 54 Years | 658 (11.1%) | 1,283 (19.2%) |
| 55 to 64 Years | 732 (12.6%) | 805 (11.6%) |
| 65 to 74 Years | 401 (8.2%) | 841 (15.5%) |
| 75 Years and over | 188 (7.3%) | 641 (15.0%) |
| Total | 14,873 (23.4%) | 17,706 (26.0%) |
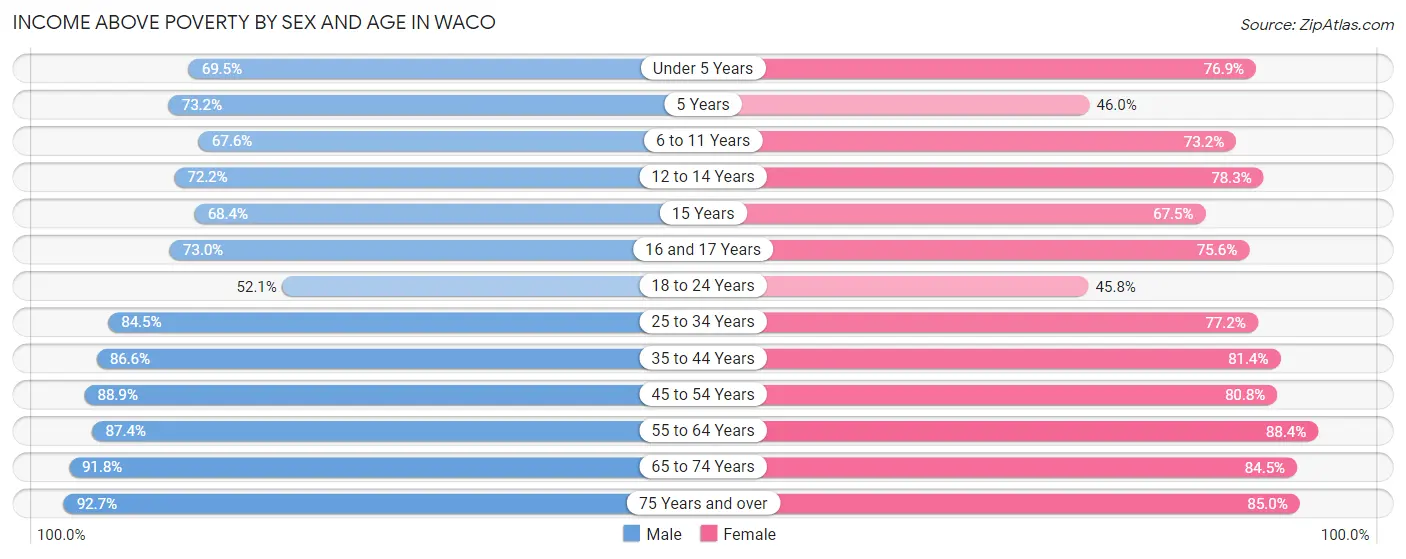
Income Above Poverty by Sex and Age in Waco
According to the poverty statistics in Waco, males aged 75 years and over and females aged 55 to 64 years are the age groups that are most secure financially, with 92.7% of males and 88.4% of females in these age groups living above the poverty line.
| Age Bracket | Male | Female |
| Under 5 Years | 3,479 (69.5%) | 3,517 (76.9%) |
| 5 Years | 555 (73.2%) | 417 (46.0%) |
| 6 to 11 Years | 3,688 (67.6%) | 3,595 (73.2%) |
| 12 to 14 Years | 2,000 (72.2%) | 2,050 (78.3%) |
| 15 Years | 678 (68.4%) | 738 (67.5%) |
| 16 and 17 Years | 1,153 (73.0%) | 1,055 (75.6%) |
| 18 to 24 Years | 6,025 (52.1%) | 5,303 (45.8%) |
| 25 to 34 Years | 7,413 (84.5%) | 7,928 (77.2%) |
| 35 to 44 Years | 6,405 (86.6%) | 6,049 (81.4%) |
| 45 to 54 Years | 5,250 (88.9%) | 5,402 (80.8%) |
| 55 to 64 Years | 5,060 (87.4%) | 6,136 (88.4%) |
| 65 to 74 Years | 4,465 (91.8%) | 4,573 (84.5%) |
| 75 Years and over | 2,397 (92.7%) | 3,622 (85.0%) |
| Total | 48,568 (76.6%) | 50,385 (74.0%) |
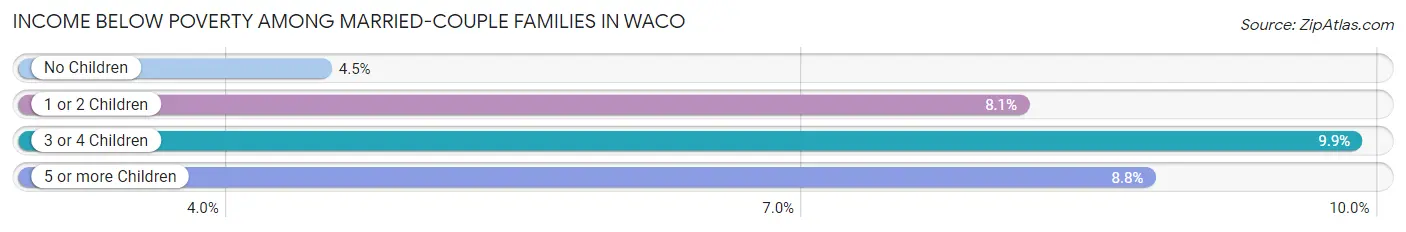
Income Below Poverty Among Married-Couple Families in Waco
The poverty statistics for married-couple families in Waco show that 6.3% or 1,189 of the total 18,765 families live below the poverty line. Families with 3 or 4 children have the highest poverty rate of 9.9%, comprising of 201 families. On the other hand, families with no children have the lowest poverty rate of 4.5%, which includes 460 families.
| Children | Above Poverty | Below Poverty |
| No Children | 9,795 (95.5%) | 460 (4.5%) |
| 1 or 2 Children | 5,697 (91.9%) | 504 (8.1%) |
| 3 or 4 Children | 1,835 (90.1%) | 201 (9.9%) |
| 5 or more Children | 249 (91.2%) | 24 (8.8%) |
| Total | 17,576 (93.7%) | 1,189 (6.3%) |
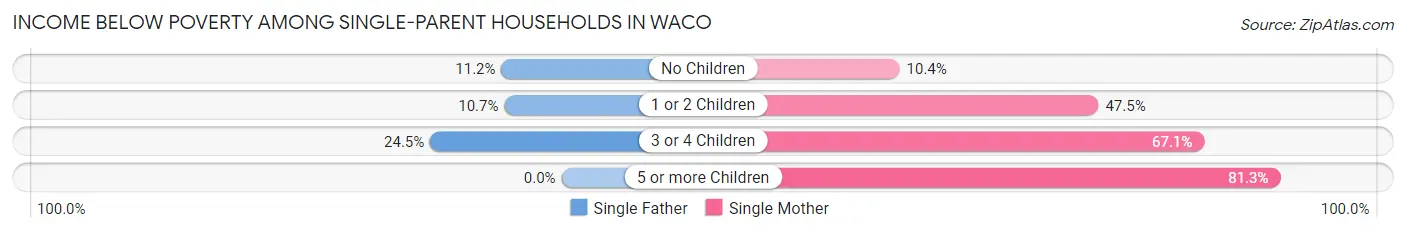
Income Below Poverty Among Single-Parent Households in Waco
According to the poverty data in Waco, 11.5% or 278 single-father households and 40.1% or 3,409 single-mother households are living below the poverty line. Among single-father households, those with 3 or 4 children have the highest poverty rate, with 23 households (24.5%) experiencing poverty. Likewise, among single-mother households, those with 5 or more children have the highest poverty rate, with 61 households (81.3%) falling below the poverty line.
| Children | Single Father | Single Mother |
| No Children | 135 (11.2%) | 266 (10.4%) |
| 1 or 2 Children | 120 (10.6%) | 2,065 (47.5%) |
| 3 or 4 Children | 23 (24.5%) | 1,017 (67.1%) |
| 5 or more Children | 0 (0.0%) | 61 (81.3%) |
| Total | 278 (11.5%) | 3,409 (40.1%) |
Income Below Poverty Among Married-Couple vs Single-Parent Households in Waco
The poverty data for Waco shows that 1,189 of the married-couple family households (6.3%) and 3,687 of the single-parent households (33.8%) are living below the poverty level. Within the married-couple family households, those with 3 or 4 children have the highest poverty rate, with 201 households (9.9%) falling below the poverty line. Among the single-parent households, those with 5 or more children have the highest poverty rate, with 61 household (81.3%) living below poverty.
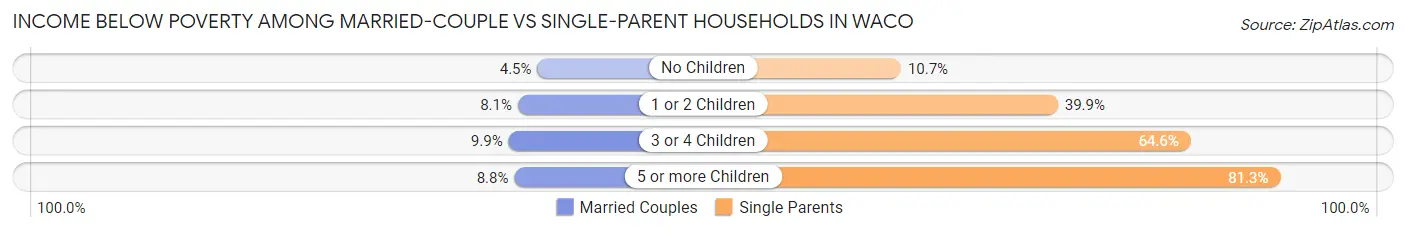
| Children | Married-Couple Families | Single-Parent Households |
| No Children | 460 (4.5%) | 401 (10.7%) |
| 1 or 2 Children | 504 (8.1%) | 2,185 (39.9%) |
| 3 or 4 Children | 201 (9.9%) | 1,040 (64.6%) |
| 5 or more Children | 24 (8.8%) | 61 (81.3%) |
| Total | 1,189 (6.3%) | 3,687 (33.8%) |
Race in Waco
The most populous races in Waco are White / Caucasian (84,224 | 59.9%), Hispanic or Latino (42,774 | 30.4%), and Black / African American (28,706 | 20.4%).
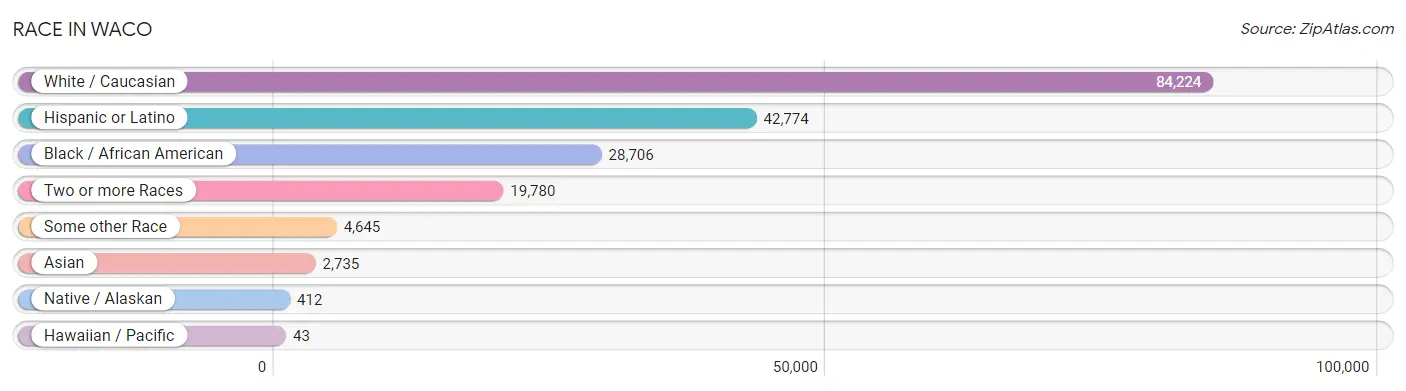
| Race | # Population | % Population |
| Asian | 2,735 | 1.9% |
| Black / African American | 28,706 | 20.4% |
| Hawaiian / Pacific | 43 | 0.0% |
| Hispanic or Latino | 42,774 | 30.4% |
| Native / Alaskan | 412 | 0.3% |
| White / Caucasian | 84,224 | 59.9% |
| Two or more Races | 19,780 | 14.1% |
| Some other Race | 4,645 | 3.3% |
| Total | 140,545 | 100.0% |
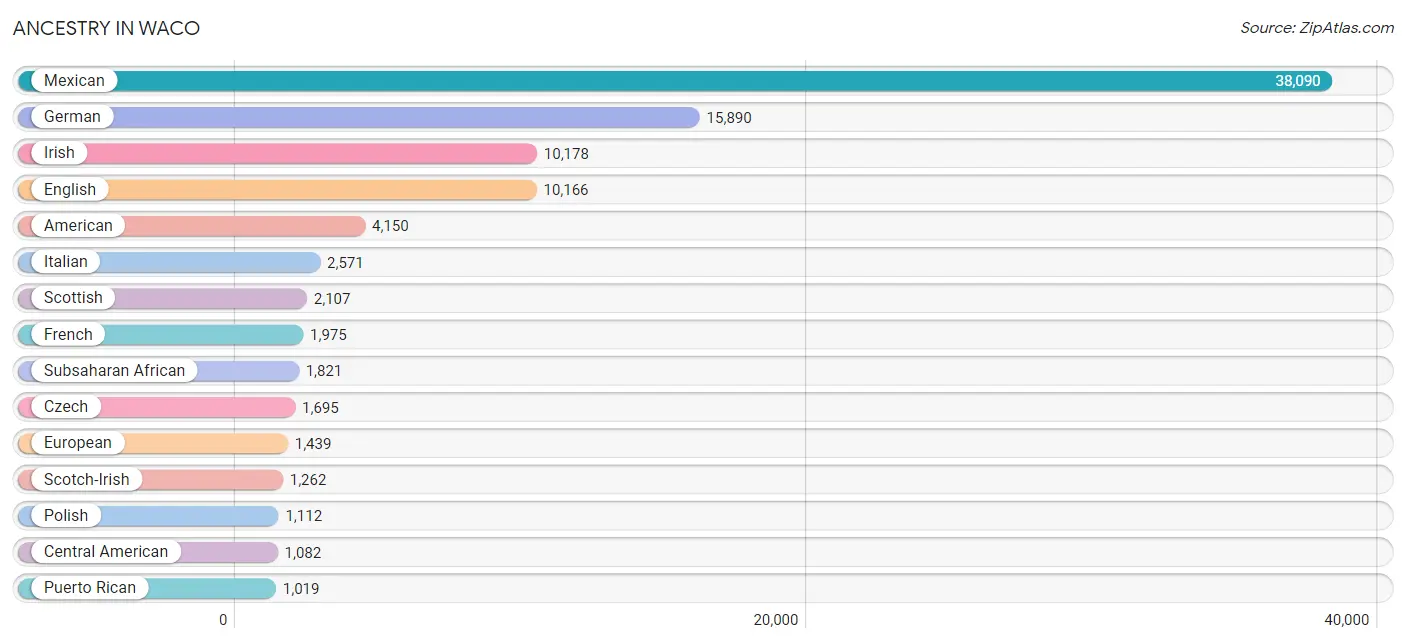
Ancestry in Waco
The most populous ancestries reported in Waco are Mexican (38,090 | 27.1%), German (15,890 | 11.3%), Irish (10,178 | 7.2%), English (10,166 | 7.2%), and American (4,150 | 2.9%), together accounting for 55.8% of all Waco residents.
| Ancestry | # Population | % Population |
| African | 1,018 | 0.7% |
| American | 4,150 | 2.9% |
| Apache | 19 | 0.0% |
| Arab | 176 | 0.1% |
| Argentinean | 41 | 0.0% |
| Armenian | 26 | 0.0% |
| Australian | 11 | 0.0% |
| Austrian | 108 | 0.1% |
| Bangladeshi | 1 | 0.0% |
| Bhutanese | 233 | 0.2% |
| Blackfeet | 53 | 0.0% |
| Bolivian | 31 | 0.0% |
| British | 879 | 0.6% |
| British West Indian | 149 | 0.1% |
| Bulgarian | 5 | 0.0% |
| Burmese | 790 | 0.6% |
| Cajun | 35 | 0.0% |
| Canadian | 99 | 0.1% |
| Cape Verdean | 21 | 0.0% |
| Carpatho Rusyn | 10 | 0.0% |
| Celtic | 40 | 0.0% |
| Central American | 1,082 | 0.8% |
| Central American Indian | 10 | 0.0% |
| Cherokee | 459 | 0.3% |
| Chickasaw | 20 | 0.0% |
| Chilean | 42 | 0.0% |
| Choctaw | 117 | 0.1% |
| Colombian | 109 | 0.1% |
| Comanche | 35 | 0.0% |
| Costa Rican | 9 | 0.0% |
| Creek | 41 | 0.0% |
| Croatian | 11 | 0.0% |
| Cuban | 435 | 0.3% |
| Czech | 1,695 | 1.2% |
| Czechoslovakian | 138 | 0.1% |
| Danish | 193 | 0.1% |
| Dominican | 8 | 0.0% |
| Dutch | 660 | 0.5% |
| Dutch West Indian | 4 | 0.0% |
| Eastern European | 166 | 0.1% |
| Ecuadorian | 34 | 0.0% |
| Egyptian | 29 | 0.0% |
| English | 10,166 | 7.2% |
| European | 1,439 | 1.0% |
| Filipino | 28 | 0.0% |
| Finnish | 117 | 0.1% |
| French | 1,975 | 1.4% |
| French Canadian | 335 | 0.2% |
| German | 15,890 | 11.3% |
| Ghanaian | 12 | 0.0% |
| Greek | 267 | 0.2% |
| Guamanian / Chamorro | 28 | 0.0% |
| Guatemalan | 370 | 0.3% |
| Haitian | 23 | 0.0% |
| Honduran | 520 | 0.4% |
| Hungarian | 163 | 0.1% |
| Icelander | 73 | 0.1% |
| Indian (Asian) | 960 | 0.7% |
| Inupiat | 30 | 0.0% |
| Iranian | 27 | 0.0% |
| Iraqi | 9 | 0.0% |
| Irish | 10,178 | 7.2% |
| Italian | 2,571 | 1.8% |
| Jamaican | 70 | 0.1% |
| Japanese | 51 | 0.0% |
| Jordanian | 10 | 0.0% |
| Kiowa | 24 | 0.0% |
| Korean | 517 | 0.4% |
| Laotian | 19 | 0.0% |
| Lebanese | 82 | 0.1% |
| Liberian | 303 | 0.2% |
| Lithuanian | 42 | 0.0% |
| Lumbee | 19 | 0.0% |
| Macedonian | 9 | 0.0% |
| Malaysian | 351 | 0.3% |
| Maltese | 5 | 0.0% |
| Mexican | 38,090 | 27.1% |
| Mexican American Indian | 94 | 0.1% |
| Moroccan | 12 | 0.0% |
| Native Hawaiian | 46 | 0.0% |
| Navajo | 31 | 0.0% |
| Nicaraguan | 6 | 0.0% |
| Nigerian | 410 | 0.3% |
| Northern European | 80 | 0.1% |
| Norwegian | 899 | 0.6% |
| Pakistani | 60 | 0.0% |
| Palestinian | 21 | 0.0% |
| Panamanian | 33 | 0.0% |
| Pennsylvania German | 35 | 0.0% |
| Peruvian | 84 | 0.1% |
| Polish | 1,112 | 0.8% |
| Portuguese | 49 | 0.0% |
| Pueblo | 12 | 0.0% |
| Puerto Rican | 1,019 | 0.7% |
| Romanian | 58 | 0.0% |
| Russian | 121 | 0.1% |
| Salvadoran | 144 | 0.1% |
| Samoan | 69 | 0.1% |
| Scandinavian | 217 | 0.2% |
| Scotch-Irish | 1,262 | 0.9% |
| Scottish | 2,107 | 1.5% |
| Sioux | 30 | 0.0% |
| Slovak | 29 | 0.0% |
| South American | 447 | 0.3% |
| Spaniard | 694 | 0.5% |
| Spanish | 349 | 0.3% |
| Sri Lankan | 196 | 0.1% |
| Subsaharan African | 1,821 | 1.3% |
| Swedish | 629 | 0.4% |
| Swiss | 33 | 0.0% |
| Syrian | 13 | 0.0% |
| Thai | 743 | 0.5% |
| Tongan | 69 | 0.1% |
| Trinidadian and Tobagonian | 12 | 0.0% |
| Turkish | 32 | 0.0% |
| Ukrainian | 41 | 0.0% |
| Venezuelan | 106 | 0.1% |
| Vietnamese | 13 | 0.0% |
| Welsh | 662 | 0.5% |
| West Indian | 27 | 0.0% |
| Yugoslavian | 19 | 0.0% | View All 121 Rows |
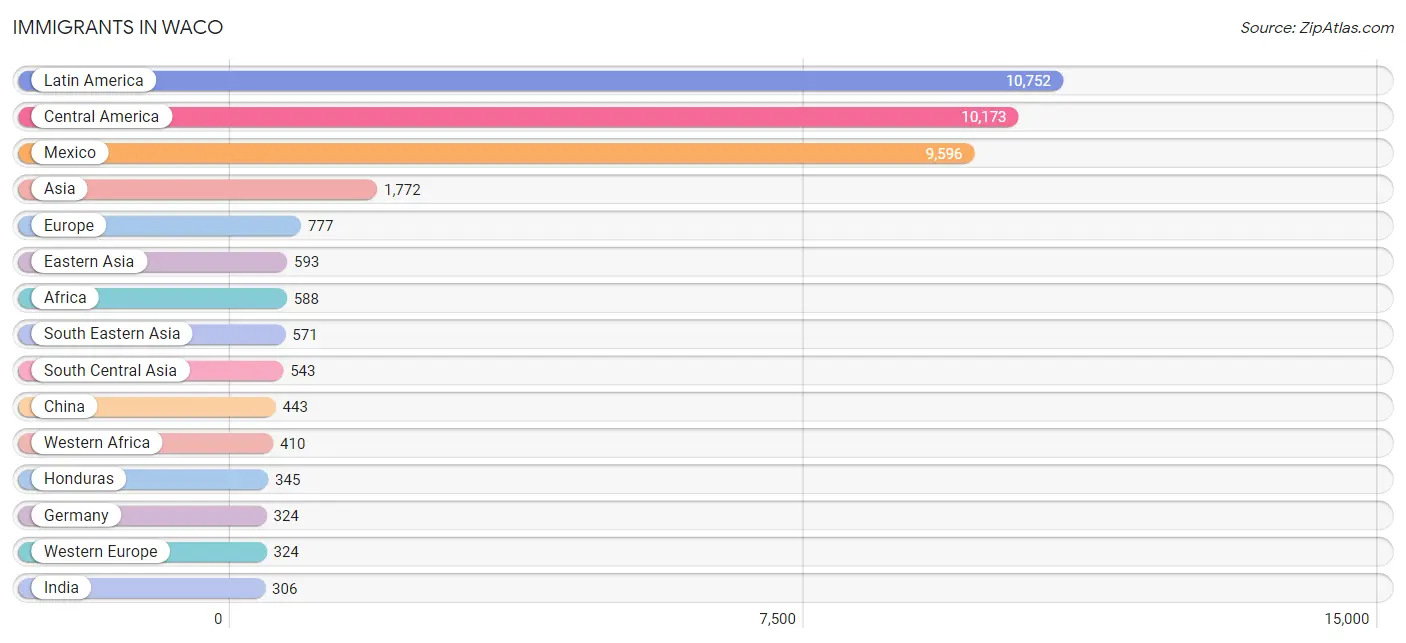
Immigrants in Waco
The most numerous immigrant groups reported in Waco came from Latin America (10,752 | 7.6%), Central America (10,173 | 7.2%), Mexico (9,596 | 6.8%), Asia (1,772 | 1.3%), and Europe (777 | 0.5%), together accounting for 23.5% of all Waco residents.
| Immigration Origin | # Population | % Population |
| Africa | 588 | 0.4% |
| Argentina | 28 | 0.0% |
| Asia | 1,772 | 1.3% |
| Australia | 37 | 0.0% |
| Bahamas | 13 | 0.0% |
| Bangladesh | 13 | 0.0% |
| Bosnia and Herzegovina | 10 | 0.0% |
| Bulgaria | 5 | 0.0% |
| Canada | 113 | 0.1% |
| Caribbean | 303 | 0.2% |
| Central America | 10,173 | 7.2% |
| Chile | 16 | 0.0% |
| China | 443 | 0.3% |
| Colombia | 100 | 0.1% |
| Cuba | 113 | 0.1% |
| Eastern Africa | 90 | 0.1% |
| Eastern Asia | 593 | 0.4% |
| Eastern Europe | 55 | 0.0% |
| Ecuador | 22 | 0.0% |
| Egypt | 19 | 0.0% |
| El Salvador | 107 | 0.1% |
| England | 58 | 0.0% |
| Europe | 777 | 0.5% |
| Fiji | 9 | 0.0% |
| Germany | 324 | 0.2% |
| Guatemala | 119 | 0.1% |
| Honduras | 345 | 0.3% |
| Hungary | 3 | 0.0% |
| India | 306 | 0.2% |
| Ireland | 27 | 0.0% |
| Italy | 169 | 0.1% |
| Jamaica | 17 | 0.0% |
| Japan | 25 | 0.0% |
| Kenya | 29 | 0.0% |
| Korea | 125 | 0.1% |
| Laos | 286 | 0.2% |
| Latin America | 10,752 | 7.6% |
| Liberia | 114 | 0.1% |
| Malaysia | 14 | 0.0% |
| Mexico | 9,596 | 6.8% |
| Nepal | 179 | 0.1% |
| Nicaragua | 6 | 0.0% |
| Nigeria | 296 | 0.2% |
| Northern Africa | 19 | 0.0% |
| Northern Europe | 203 | 0.1% |
| Oceania | 159 | 0.1% |
| Pakistan | 45 | 0.0% |
| Peru | 14 | 0.0% |
| Philippines | 113 | 0.1% |
| Portugal | 11 | 0.0% |
| Romania | 37 | 0.0% |
| Saudi Arabia | 16 | 0.0% |
| South Africa | 13 | 0.0% |
| South America | 276 | 0.2% |
| South Central Asia | 543 | 0.4% |
| South Eastern Asia | 571 | 0.4% |
| Southern Europe | 195 | 0.1% |
| Spain | 15 | 0.0% |
| St. Vincent and the Grenadines | 30 | 0.0% |
| Sweden | 15 | 0.0% |
| Trinidad and Tobago | 78 | 0.1% |
| Venezuela | 96 | 0.1% |
| Vietnam | 158 | 0.1% |
| Western Africa | 410 | 0.3% |
| Western Asia | 57 | 0.0% |
| Western Europe | 324 | 0.2% |
| Zimbabwe | 61 | 0.0% | View All 67 Rows |
Sex and Age in Waco
Sex and Age in Waco
The most populous age groups in Waco are 20 to 24 Years (10,231 | 15.0%) for men and 20 to 24 Years (9,813 | 13.6%) for women.
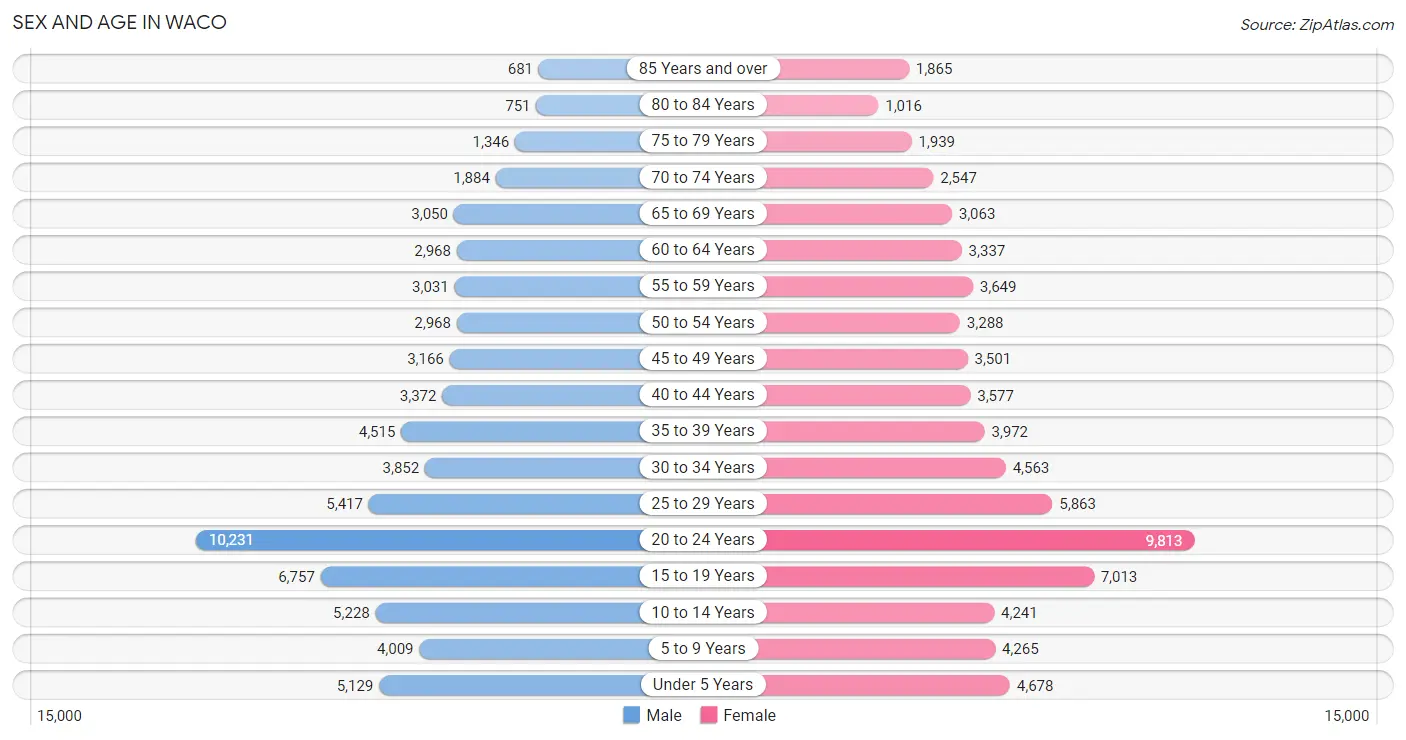
| Age Bracket | Male | Female |
| Under 5 Years | 5,129 (7.5%) | 4,678 (6.5%) |
| 5 to 9 Years | 4,009 (5.9%) | 4,265 (5.9%) |
| 10 to 14 Years | 5,228 (7.6%) | 4,241 (5.9%) |
| 15 to 19 Years | 6,757 (9.9%) | 7,013 (9.7%) |
| 20 to 24 Years | 10,231 (15.0%) | 9,813 (13.6%) |
| 25 to 29 Years | 5,417 (7.9%) | 5,863 (8.1%) |
| 30 to 34 Years | 3,852 (5.6%) | 4,563 (6.3%) |
| 35 to 39 Years | 4,515 (6.6%) | 3,972 (5.5%) |
| 40 to 44 Years | 3,372 (4.9%) | 3,577 (5.0%) |
| 45 to 49 Years | 3,166 (4.6%) | 3,501 (4.9%) |
| 50 to 54 Years | 2,968 (4.3%) | 3,288 (4.5%) |
| 55 to 59 Years | 3,031 (4.4%) | 3,649 (5.1%) |
| 60 to 64 Years | 2,968 (4.3%) | 3,337 (4.6%) |
| 65 to 69 Years | 3,050 (4.5%) | 3,063 (4.2%) |
| 70 to 74 Years | 1,884 (2.8%) | 2,547 (3.5%) |
| 75 to 79 Years | 1,346 (2.0%) | 1,939 (2.7%) |
| 80 to 84 Years | 751 (1.1%) | 1,016 (1.4%) |
| 85 Years and over | 681 (1.0%) | 1,865 (2.6%) |
| Total | 68,355 (100.0%) | 72,190 (100.0%) |
Families and Households in Waco
Median Family Size in Waco
The median family size in Waco is 3.24 persons per family, with single female/mother families (8,495 | 28.6%) accounting for the largest median family size of 3.3 persons per family. On the other hand, single male/father families (2,426 | 8.2%) represent the smallest median family size with 2.79 persons per family.
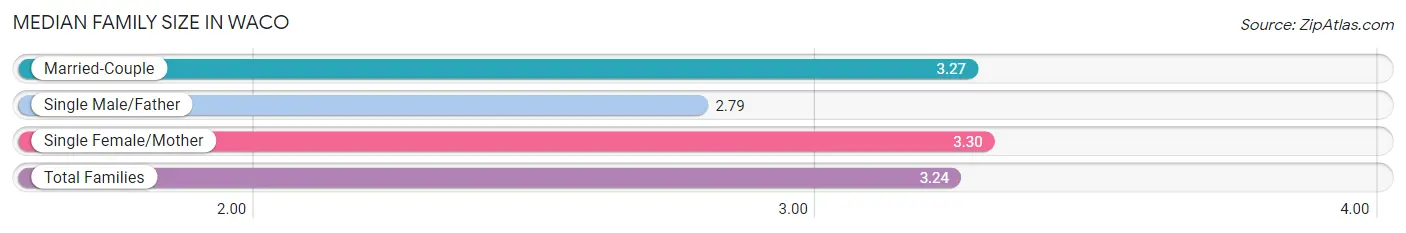
| Family Type | # Families | Family Size |
| Married-Couple | 18,765 (63.2%) | 3.27 |
| Single Male/Father | 2,426 (8.2%) | 2.79 |
| Single Female/Mother | 8,495 (28.6%) | 3.30 |
| Total Families | 29,686 (100.0%) | 3.24 |
Median Household Size in Waco
The median household size in Waco is 2.52 persons per household, with single female/mother households (8,495 | 16.3%) accounting for the largest median household size of 3.46 persons per household. non-family households (22,570 | 43.2%) represent the smallest median household size with 1.47 persons per household.
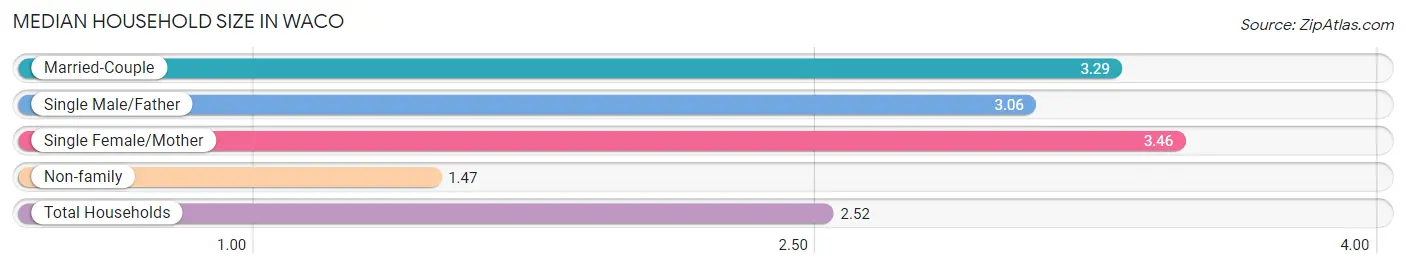
| Household Type | # Households | Household Size |
| Married-Couple | 18,765 (35.9%) | 3.29 |
| Single Male/Father | 2,426 (4.6%) | 3.06 |
| Single Female/Mother | 8,495 (16.3%) | 3.46 |
| Non-family | 22,570 (43.2%) | 1.47 |
| Total Households | 52,256 (100.0%) | 2.52 |
Household Size by Marriage Status in Waco
Out of a total of 52,256 households in Waco, 29,686 (56.8%) are family households, while 22,570 (43.2%) are nonfamily households. The most numerous type of family households are 2-person households, comprising 12,559, and the most common type of nonfamily households are 1-person households, comprising 16,775.
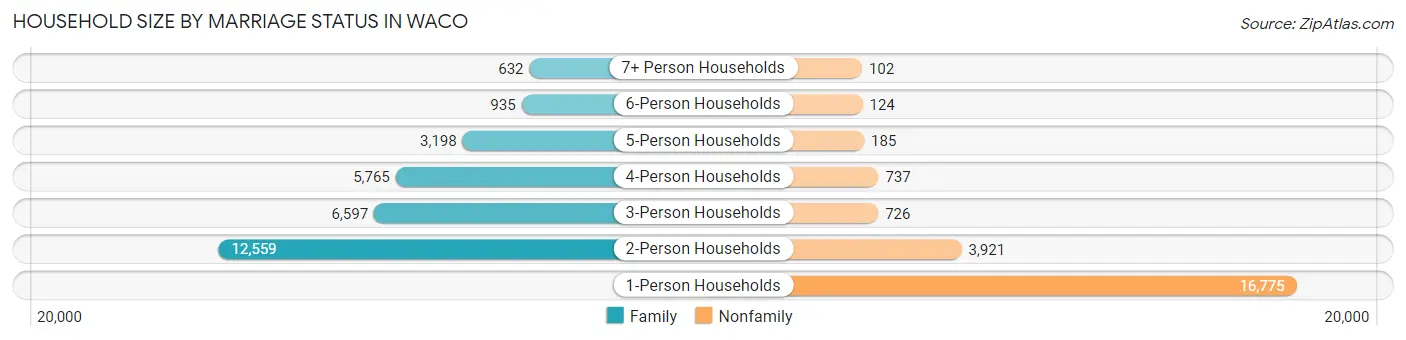
| Household Size | Family Households | Nonfamily Households |
| 1-Person Households | - | 16,775 (32.1%) |
| 2-Person Households | 12,559 (24.0%) | 3,921 (7.5%) |
| 3-Person Households | 6,597 (12.6%) | 726 (1.4%) |
| 4-Person Households | 5,765 (11.0%) | 737 (1.4%) |
| 5-Person Households | 3,198 (6.1%) | 185 (0.4%) |
| 6-Person Households | 935 (1.8%) | 124 (0.2%) |
| 7+ Person Households | 632 (1.2%) | 102 (0.2%) |
| Total | 29,686 (56.8%) | 22,570 (43.2%) |
Female Fertility in Waco
Fertility by Age in Waco
Average fertility rate in Waco is 50.0 births per 1,000 women. Women in the age bracket of 20 to 34 years have the highest fertility rate with 80.0 births per 1,000 women. Women in the age bracket of 20 to 34 years acount for 83.0% of all women with births.
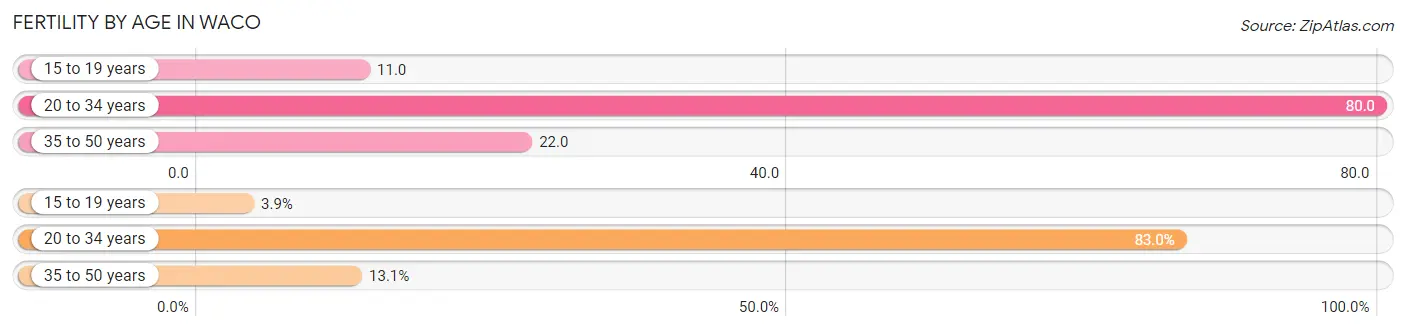
| Age Bracket | Women with Births | Births / 1,000 Women |
| 15 to 19 years | 76 (3.9%) | 11.0 |
| 20 to 34 years | 1,613 (83.0%) | 80.0 |
| 35 to 50 years | 254 (13.1%) | 22.0 |
| Total | 1,943 (100.0%) | 50.0 |
Fertility by Age by Marriage Status in Waco
60.5% of women with births (1,943) in Waco are married. The highest percentage of unmarried women with births falls into 15 to 19 years age bracket with 64.5% of them unmarried at the time of birth, while the lowest percentage of unmarried women with births belong to 35 to 50 years age bracket with 16.1% of them unmarried.
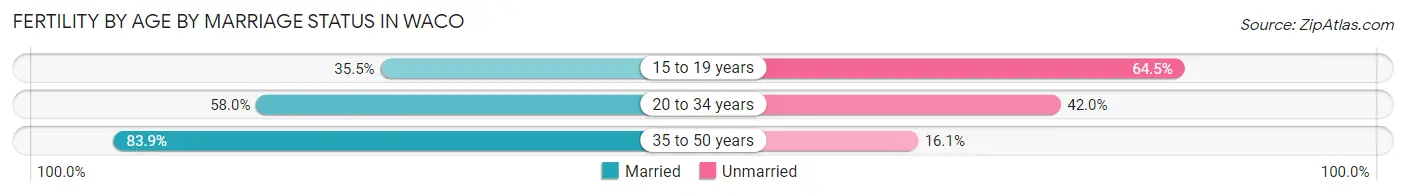
| Age Bracket | Married | Unmarried |
| 15 to 19 years | 27 (35.5%) | 49 (64.5%) |
| 20 to 34 years | 936 (58.0%) | 677 (42.0%) |
| 35 to 50 years | 213 (83.9%) | 41 (16.1%) |
| Total | 1,176 (60.5%) | 767 (39.5%) |
Fertility by Education in Waco
Average fertility rate in Waco is 50.0 births per 1,000 women. Women with the education attainment of bachelor's degree have the highest fertility rate of 78.0 births per 1,000 women, while women with the education attainment of less than high school have the lowest fertility at 32.0 births per 1,000 women. Women with the education attainment of high school diploma represent 29.7% of all women with births.
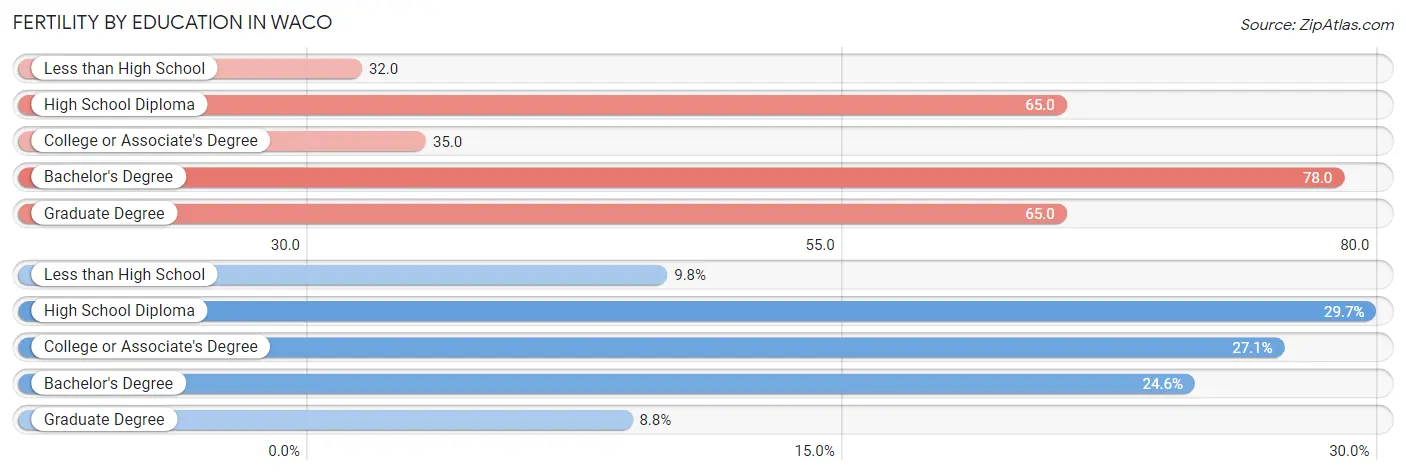
| Educational Attainment | Women with Births | Births / 1,000 Women |
| Less than High School | 190 (9.8%) | 32.0 |
| High School Diploma | 577 (29.7%) | 65.0 |
| College or Associate's Degree | 527 (27.1%) | 35.0 |
| Bachelor's Degree | 478 (24.6%) | 78.0 |
| Graduate Degree | 171 (8.8%) | 65.0 |
| Total | 1,943 (100.0%) | 50.0 |
Fertility by Education by Marriage Status in Waco
39.5% of women with births in Waco are unmarried. Women with the educational attainment of graduate degree are most likely to be married with 100.0% of them married at childbirth, while women with the educational attainment of high school diploma are least likely to be married with 60.0% of them unmarried at childbirth.
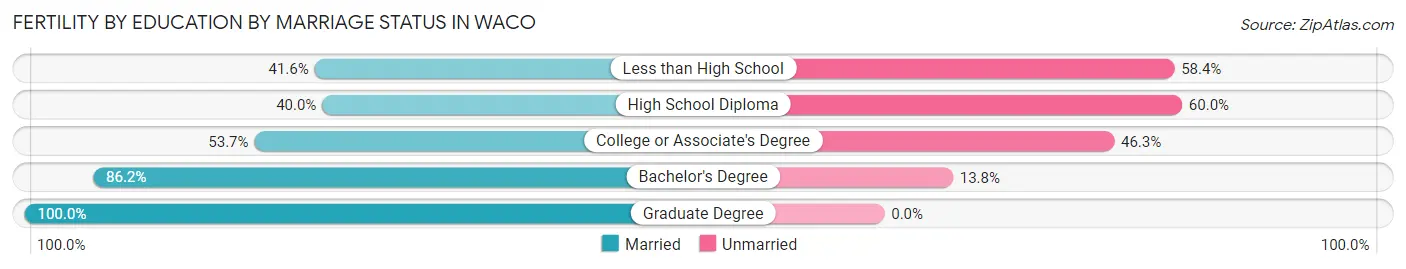
| Educational Attainment | Married | Unmarried |
| Less than High School | 79 (41.6%) | 111 (58.4%) |
| High School Diploma | 231 (40.0%) | 346 (60.0%) |
| College or Associate's Degree | 283 (53.7%) | 244 (46.3%) |
| Bachelor's Degree | 412 (86.2%) | 66 (13.8%) |
| Graduate Degree | 171 (100.0%) | 0 (0.0%) |
| Total | 1,176 (60.5%) | 767 (39.5%) |
Employment Characteristics in Waco
Employment by Class of Employer in Waco
Among the 63,117 employed individuals in Waco, private company employees (43,375 | 68.7%), not-for-profit organizations (6,331 | 10.0%), and self-employed (not incorporated) (3,512 | 5.6%) make up the most common classes of employment.
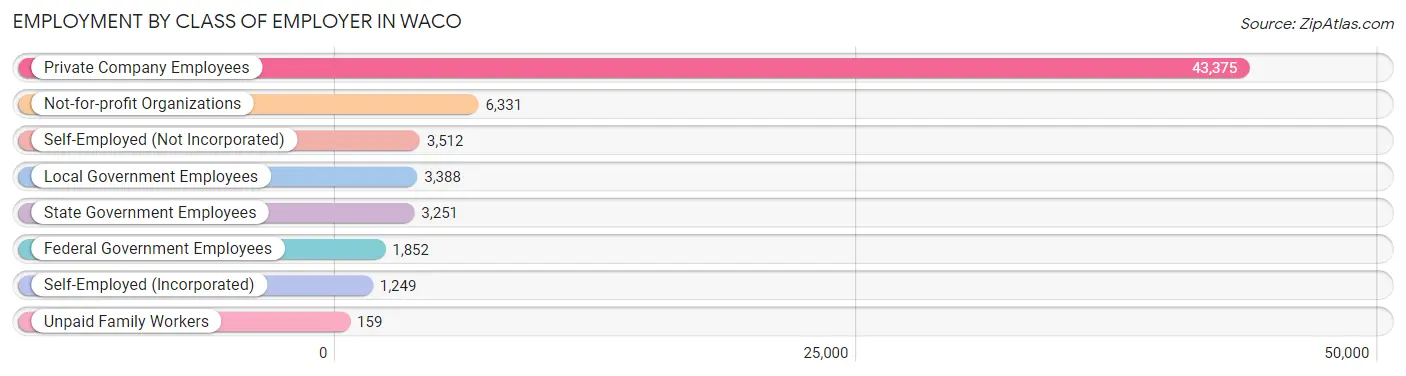
| Employer Class | # Employees | % Employees |
| Private Company Employees | 43,375 | 68.7% |
| Self-Employed (Incorporated) | 1,249 | 2.0% |
| Self-Employed (Not Incorporated) | 3,512 | 5.6% |
| Not-for-profit Organizations | 6,331 | 10.0% |
| Local Government Employees | 3,388 | 5.4% |
| State Government Employees | 3,251 | 5.1% |
| Federal Government Employees | 1,852 | 2.9% |
| Unpaid Family Workers | 159 | 0.3% |
| Total | 63,117 | 100.0% |
Employment Status by Age in Waco
According to the labor force statistics for Waco, out of the total population over 16 years of age (110,880), 60.7% or 67,304 individuals are in the labor force, with 4.5% or 3,029 of them unemployed. The age group with the highest labor force participation rate is 30 to 34 years, with 83.8% or 7,052 individuals in the labor force. Within the labor force, the 16 to 19 years age range has the highest percentage of unemployed individuals, with 12.8% or 467 of them being unemployed.
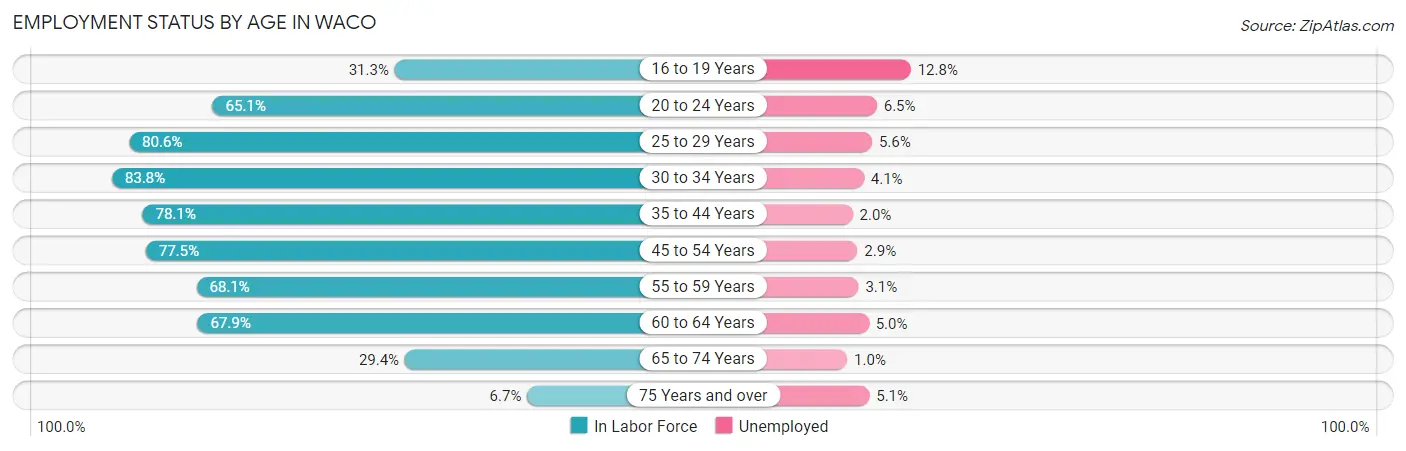
| Age Bracket | In Labor Force | Unemployed |
| 16 to 19 Years | 3,648 (31.3%) | 467 (12.8%) |
| 20 to 24 Years | 13,049 (65.1%) | 848 (6.5%) |
| 25 to 29 Years | 9,092 (80.6%) | 509 (5.6%) |
| 30 to 34 Years | 7,052 (83.8%) | 289 (4.1%) |
| 35 to 44 Years | 12,056 (78.1%) | 241 (2.0%) |
| 45 to 54 Years | 10,015 (77.5%) | 290 (2.9%) |
| 55 to 59 Years | 4,549 (68.1%) | 141 (3.1%) |
| 60 to 64 Years | 4,281 (67.9%) | 214 (5.0%) |
| 65 to 74 Years | 3,100 (29.4%) | 31 (1.0%) |
| 75 Years and over | 509 (6.7%) | 26 (5.1%) |
| Total | 67,304 (60.7%) | 3,029 (4.5%) |
Employment Status by Educational Attainment in Waco
According to labor force statistics for Waco, 77.1% of individuals (47,061) out of the total population between 25 and 64 years of age (61,039) are in the labor force, with 3.6% or 1,694 of them being unemployed. The group with the highest labor force participation rate are those with the educational attainment of bachelor's degree or higher, with 87.7% or 15,355 individuals in the labor force. Within the labor force, individuals with high school diploma education have the highest percentage of unemployment, with 5.0% or 545 of them being unemployed.
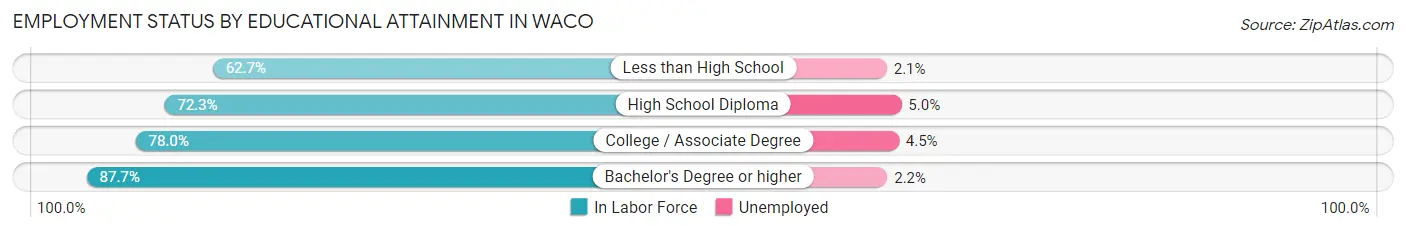
| Educational Attainment | In Labor Force | Unemployed |
| Less than High School | 5,792 (62.7%) | 194 (2.1%) |
| High School Diploma | 10,906 (72.3%) | 754 (5.0%) |
| College / Associate Degree | 14,983 (78.0%) | 864 (4.5%) |
| Bachelor's Degree or higher | 15,355 (87.7%) | 385 (2.2%) |
| Total | 47,061 (77.1%) | 2,197 (3.6%) |
Employment Occupations by Sex in Waco
Management, Business, Science and Arts Occupations
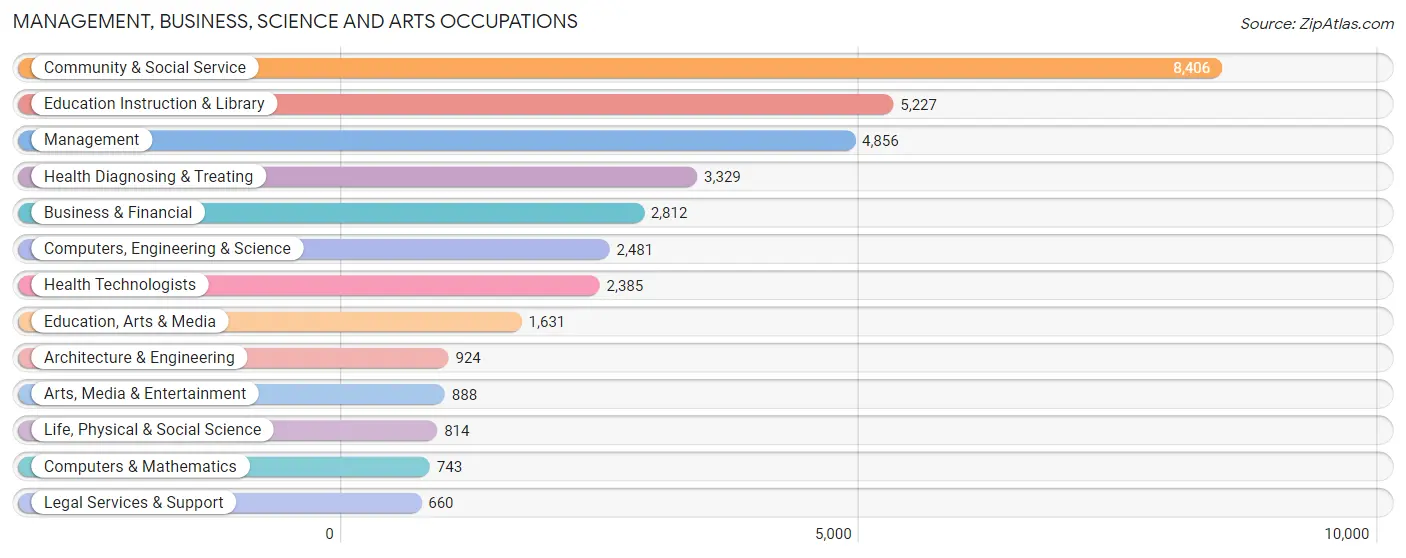
The most common Management, Business, Science and Arts occupations in Waco are Community & Social Service (8,406 | 13.1%), Education Instruction & Library (5,227 | 8.1%), Management (4,856 | 7.6%), Health Diagnosing & Treating (3,329 | 5.2%), and Business & Financial (2,812 | 4.4%).
Management, Business, Science and Arts Occupations by Sex
Within the Management, Business, Science and Arts occupations in Waco, the most male-oriented occupations are Architecture & Engineering (91.2%), Computers & Mathematics (76.4%), and Computers, Engineering & Science (65.3%), while the most female-oriented occupations are Life, Physical & Social Science (74.3%), Health Diagnosing & Treating (68.2%), and Health Technologists (63.9%).
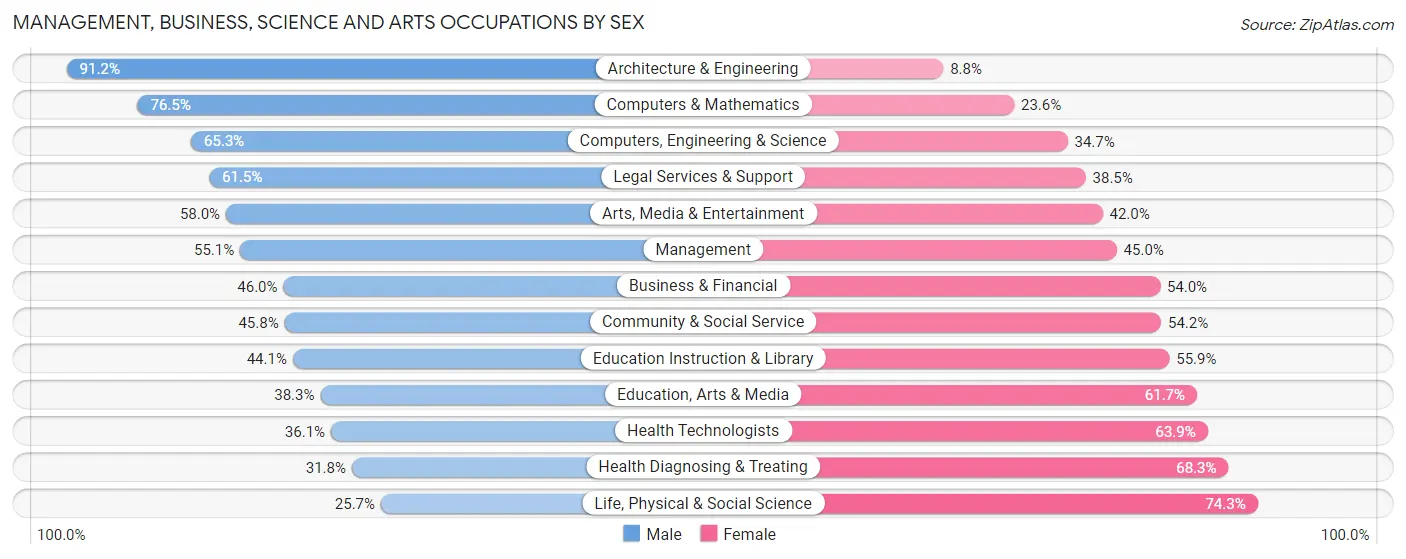
| Occupation | Male | Female |
| Management | 2,673 (55.0%) | 2,183 (45.0%) |
| Business & Financial | 1,294 (46.0%) | 1,518 (54.0%) |
| Computers, Engineering & Science | 1,620 (65.3%) | 861 (34.7%) |
| Computers & Mathematics | 568 (76.4%) | 175 (23.5%) |
| Architecture & Engineering | 843 (91.2%) | 81 (8.8%) |
| Life, Physical & Social Science | 209 (25.7%) | 605 (74.3%) |
| Community & Social Service | 3,849 (45.8%) | 4,557 (54.2%) |
| Education, Arts & Media | 625 (38.3%) | 1,006 (61.7%) |
| Legal Services & Support | 406 (61.5%) | 254 (38.5%) |
| Education Instruction & Library | 2,303 (44.1%) | 2,924 (55.9%) |
| Arts, Media & Entertainment | 515 (58.0%) | 373 (42.0%) |
| Health Diagnosing & Treating | 1,057 (31.8%) | 2,272 (68.2%) |
| Health Technologists | 861 (36.1%) | 1,524 (63.9%) |
| Total (Category) | 10,493 (47.9%) | 11,391 (52.0%) |
| Total (Overall) | 32,391 (50.4%) | 31,822 (49.6%) |
Services Occupations
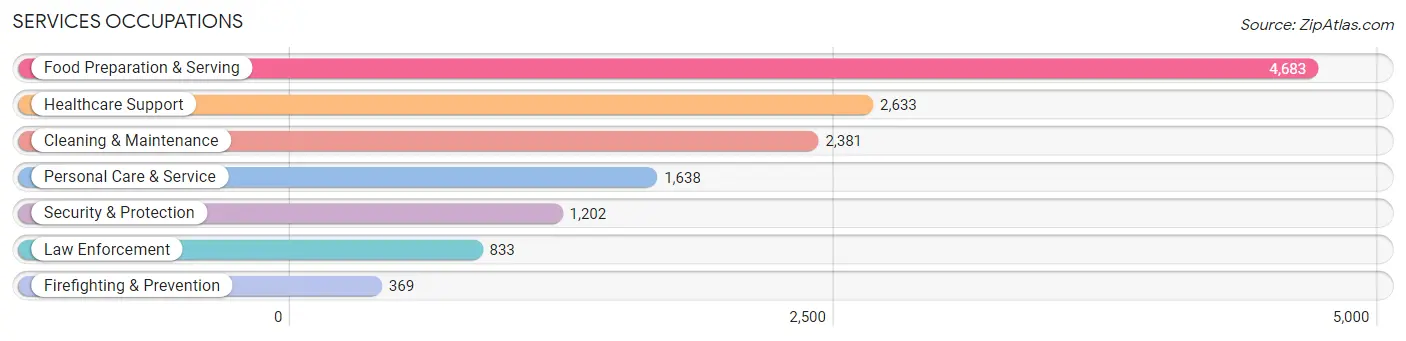
The most common Services occupations in Waco are Food Preparation & Serving (4,683 | 7.3%), Healthcare Support (2,633 | 4.1%), Cleaning & Maintenance (2,381 | 3.7%), Personal Care & Service (1,638 | 2.5%), and Security & Protection (1,202 | 1.9%).
Services Occupations by Sex
Within the Services occupations in Waco, the most male-oriented occupations are Firefighting & Prevention (74.8%), Security & Protection (69.3%), and Law Enforcement (66.9%), while the most female-oriented occupations are Healthcare Support (91.8%), Personal Care & Service (73.3%), and Food Preparation & Serving (63.0%).

| Occupation | Male | Female |
| Healthcare Support | 215 (8.2%) | 2,418 (91.8%) |
| Security & Protection | 833 (69.3%) | 369 (30.7%) |
| Firefighting & Prevention | 276 (74.8%) | 93 (25.2%) |
| Law Enforcement | 557 (66.9%) | 276 (33.1%) |
| Food Preparation & Serving | 1,731 (37.0%) | 2,952 (63.0%) |
| Cleaning & Maintenance | 1,067 (44.8%) | 1,314 (55.2%) |
| Personal Care & Service | 438 (26.7%) | 1,200 (73.3%) |
| Total (Category) | 4,284 (34.2%) | 8,253 (65.8%) |
| Total (Overall) | 32,391 (50.4%) | 31,822 (49.6%) |
Sales and Office Occupations
The most common Sales and Office occupations in Waco are Office & Administration (7,614 | 11.9%), and Sales & Related (6,746 | 10.5%).

Sales and Office Occupations by Sex

| Occupation | Male | Female |
| Sales & Related | 2,855 (42.3%) | 3,891 (57.7%) |
| Office & Administration | 2,033 (26.7%) | 5,581 (73.3%) |
| Total (Category) | 4,888 (34.0%) | 9,472 (66.0%) |
| Total (Overall) | 32,391 (50.4%) | 31,822 (49.6%) |
Natural Resources, Construction and Maintenance Occupations
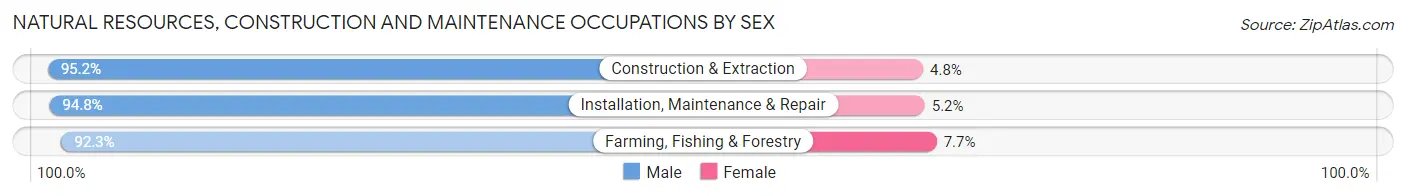
The most common Natural Resources, Construction and Maintenance occupations in Waco are Construction & Extraction (3,198 | 5.0%), Installation, Maintenance & Repair (1,836 | 2.9%), and Farming, Fishing & Forestry (248 | 0.4%).

Natural Resources, Construction and Maintenance Occupations by Sex
| Occupation | Male | Female |
| Farming, Fishing & Forestry | 229 (92.3%) | 19 (7.7%) |
| Construction & Extraction | 3,044 (95.2%) | 154 (4.8%) |
| Installation, Maintenance & Repair | 1,741 (94.8%) | 95 (5.2%) |
| Total (Category) | 5,014 (94.9%) | 268 (5.1%) |
| Total (Overall) | 32,391 (50.4%) | 31,822 (49.6%) |
Production, Transportation and Moving Occupations
The most common Production, Transportation and Moving occupations in Waco are Production (5,160 | 8.0%), Material Moving (2,529 | 3.9%), and Transportation (2,461 | 3.8%).
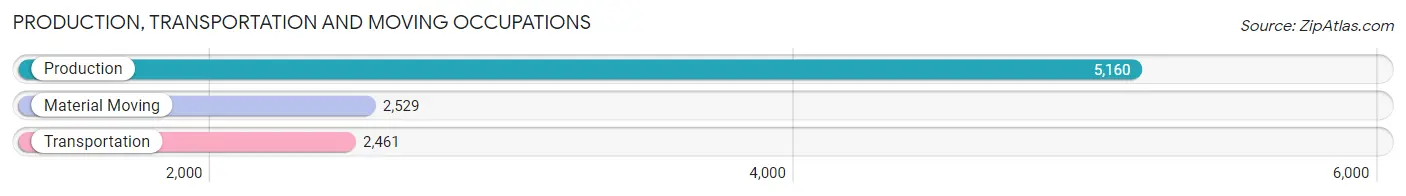
Production, Transportation and Moving Occupations by Sex
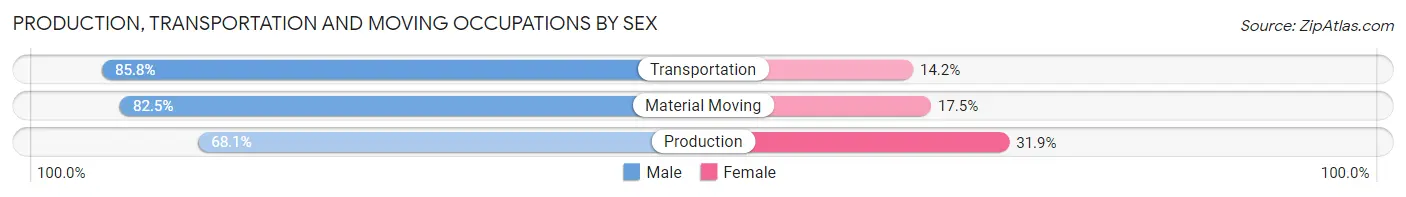
| Occupation | Male | Female |
| Production | 3,515 (68.1%) | 1,645 (31.9%) |
| Transportation | 2,111 (85.8%) | 350 (14.2%) |
| Material Moving | 2,086 (82.5%) | 443 (17.5%) |
| Total (Category) | 7,712 (76.0%) | 2,438 (24.0%) |
| Total (Overall) | 32,391 (50.4%) | 31,822 (49.6%) |
Employment Industries by Sex in Waco
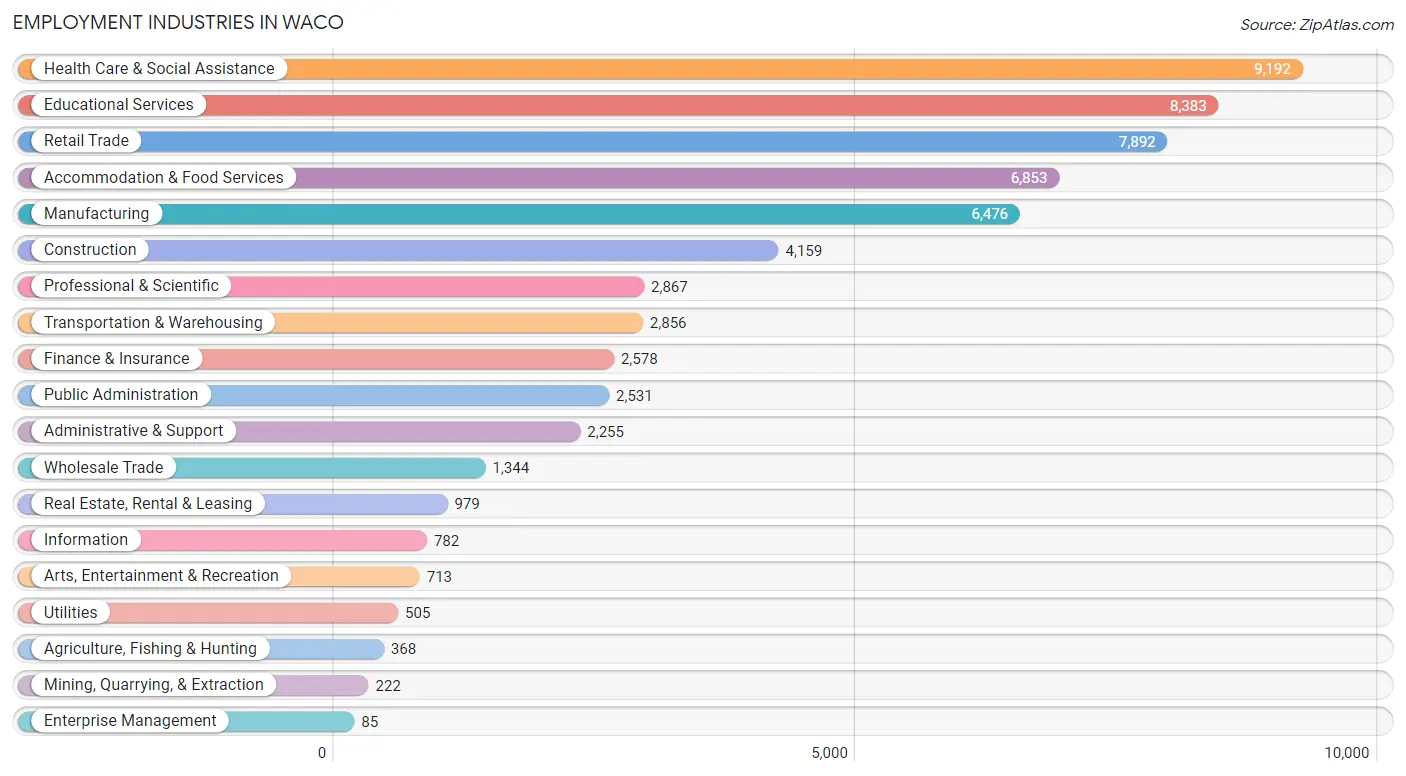
Employment Industries in Waco
The major employment industries in Waco include Health Care & Social Assistance (9,192 | 14.3%), Educational Services (8,383 | 13.1%), Retail Trade (7,892 | 12.3%), Accommodation & Food Services (6,853 | 10.7%), and Manufacturing (6,476 | 10.1%).
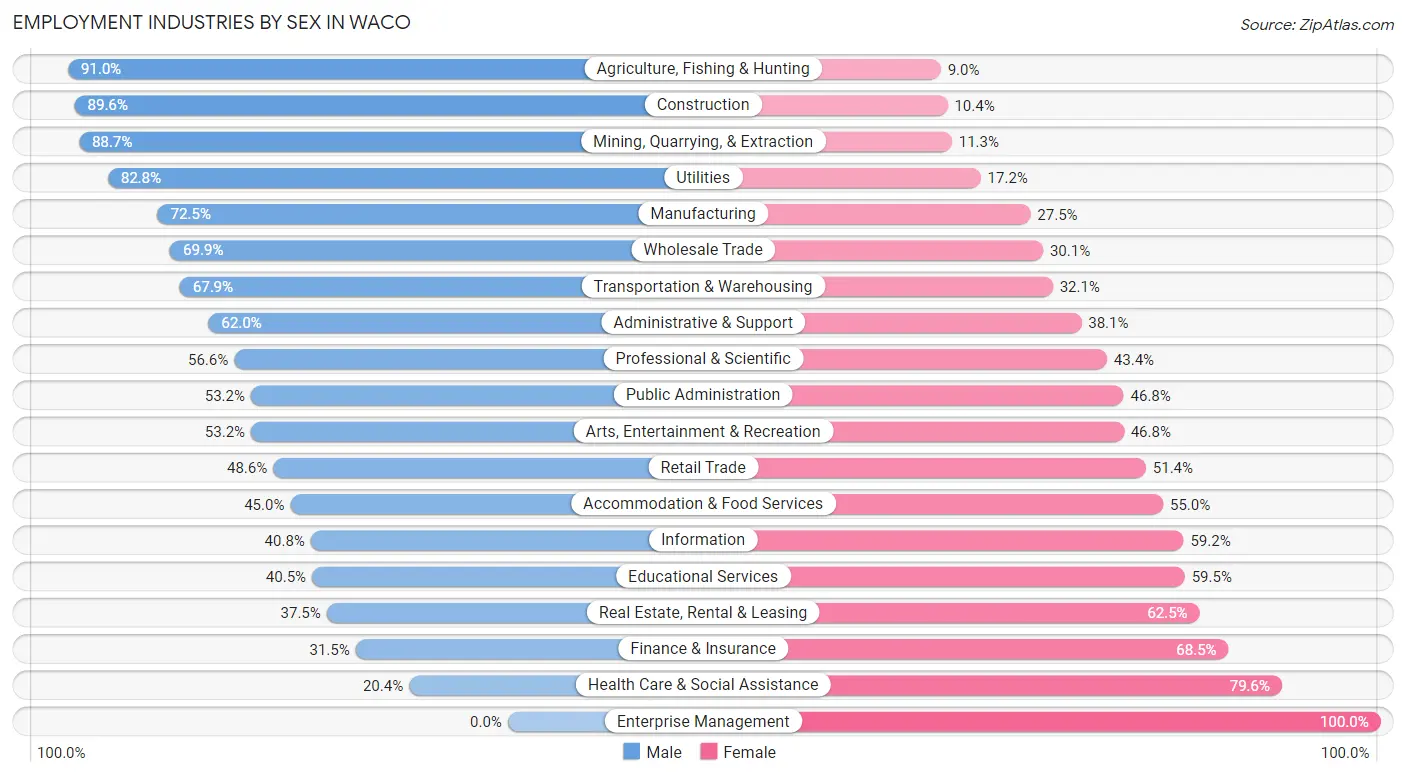
Employment Industries by Sex in Waco
The Waco industries that see more men than women are Agriculture, Fishing & Hunting (91.0%), Construction (89.6%), and Mining, Quarrying, & Extraction (88.7%), whereas the industries that tend to have a higher number of women are Enterprise Management (100.0%), Health Care & Social Assistance (79.6%), and Finance & Insurance (68.5%).
| Industry | Male | Female |
| Agriculture, Fishing & Hunting | 335 (91.0%) | 33 (9.0%) |
| Mining, Quarrying, & Extraction | 197 (88.7%) | 25 (11.3%) |
| Construction | 3,728 (89.6%) | 431 (10.4%) |
| Manufacturing | 4,693 (72.5%) | 1,783 (27.5%) |
| Wholesale Trade | 939 (69.9%) | 405 (30.1%) |
| Retail Trade | 3,834 (48.6%) | 4,058 (51.4%) |
| Transportation & Warehousing | 1,938 (67.9%) | 918 (32.1%) |
| Utilities | 418 (82.8%) | 87 (17.2%) |
| Information | 319 (40.8%) | 463 (59.2%) |
| Finance & Insurance | 812 (31.5%) | 1,766 (68.5%) |
| Real Estate, Rental & Leasing | 367 (37.5%) | 612 (62.5%) |
| Professional & Scientific | 1,624 (56.6%) | 1,243 (43.4%) |
| Enterprise Management | 0 (0.0%) | 85 (100.0%) |
| Administrative & Support | 1,397 (62.0%) | 858 (38.1%) |
| Educational Services | 3,398 (40.5%) | 4,985 (59.5%) |
| Health Care & Social Assistance | 1,879 (20.4%) | 7,313 (79.6%) |
| Arts, Entertainment & Recreation | 379 (53.2%) | 334 (46.8%) |
| Accommodation & Food Services | 3,085 (45.0%) | 3,768 (55.0%) |
| Public Administration | 1,346 (53.2%) | 1,185 (46.8%) |
| Total | 32,391 (50.4%) | 31,822 (49.6%) |
Education in Waco
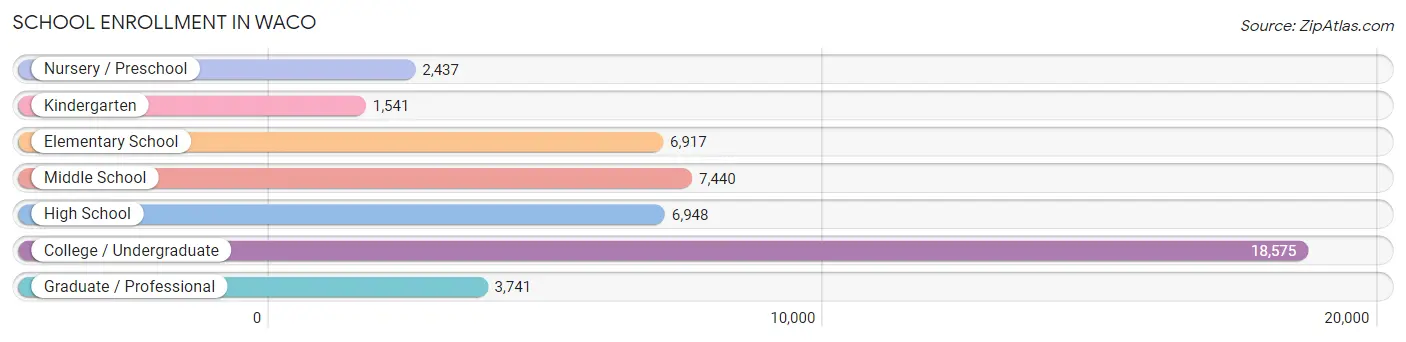
School Enrollment in Waco
The most common levels of schooling among the 47,599 students in Waco are college / undergraduate (18,575 | 39.0%), middle school (7,440 | 15.6%), and high school (6,948 | 14.6%).
| School Level | # Students | % Students |
| Nursery / Preschool | 2,437 | 5.1% |
| Kindergarten | 1,541 | 3.2% |
| Elementary School | 6,917 | 14.5% |
| Middle School | 7,440 | 15.6% |
| High School | 6,948 | 14.6% |
| College / Undergraduate | 18,575 | 39.0% |
| Graduate / Professional | 3,741 | 7.9% |
| Total | 47,599 | 100.0% |
School Enrollment by Age by Funding Source in Waco
Out of a total of 47,599 students who are enrolled in schools in Waco, 17,040 (35.8%) attend a private institution, while the remaining 30,559 (64.2%) are enrolled in public schools. The age group of 20 to 24 year olds has the highest likelihood of being enrolled in private schools, with 8,389 (71.8% in the age bracket) enrolled. Conversely, the age group of 10 to 14 year olds has the lowest likelihood of being enrolled in a private school, with 8,622 (92.2% in the age bracket) attending a public institution.
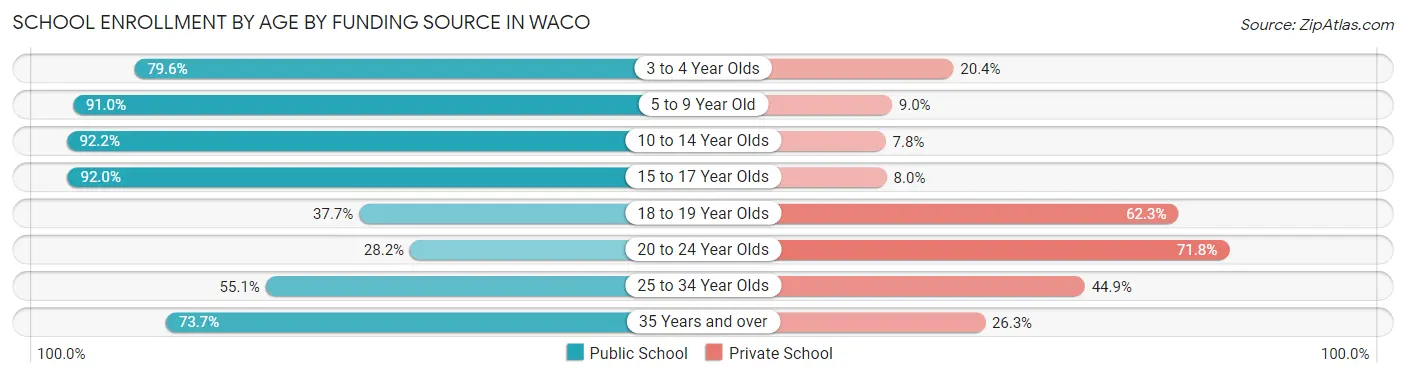
| Age Bracket | Public School | Private School |
| 3 to 4 Year Olds | 1,449 (79.6%) | 372 (20.4%) |
| 5 to 9 Year Old | 6,909 (91.0%) | 682 (9.0%) |
| 10 to 14 Year Olds | 8,622 (92.2%) | 730 (7.8%) |
| 15 to 17 Year Olds | 4,629 (92.0%) | 403 (8.0%) |
| 18 to 19 Year Olds | 2,797 (37.7%) | 4,624 (62.3%) |
| 20 to 24 Year Olds | 3,300 (28.2%) | 8,389 (71.8%) |
| 25 to 34 Year Olds | 1,773 (55.1%) | 1,445 (44.9%) |
| 35 Years and over | 1,087 (73.7%) | 388 (26.3%) |
| Total | 30,559 (64.2%) | 17,040 (35.8%) |
Educational Attainment by Field of Study in Waco
Business (4,389 | 18.5%), education (3,168 | 13.3%), science & technology (2,303 | 9.7%), arts & humanities (2,274 | 9.6%), and bio, nature & agricultural (1,617 | 6.8%) are the most common fields of study among 23,744 individuals in Waco who have obtained a bachelor's degree or higher.
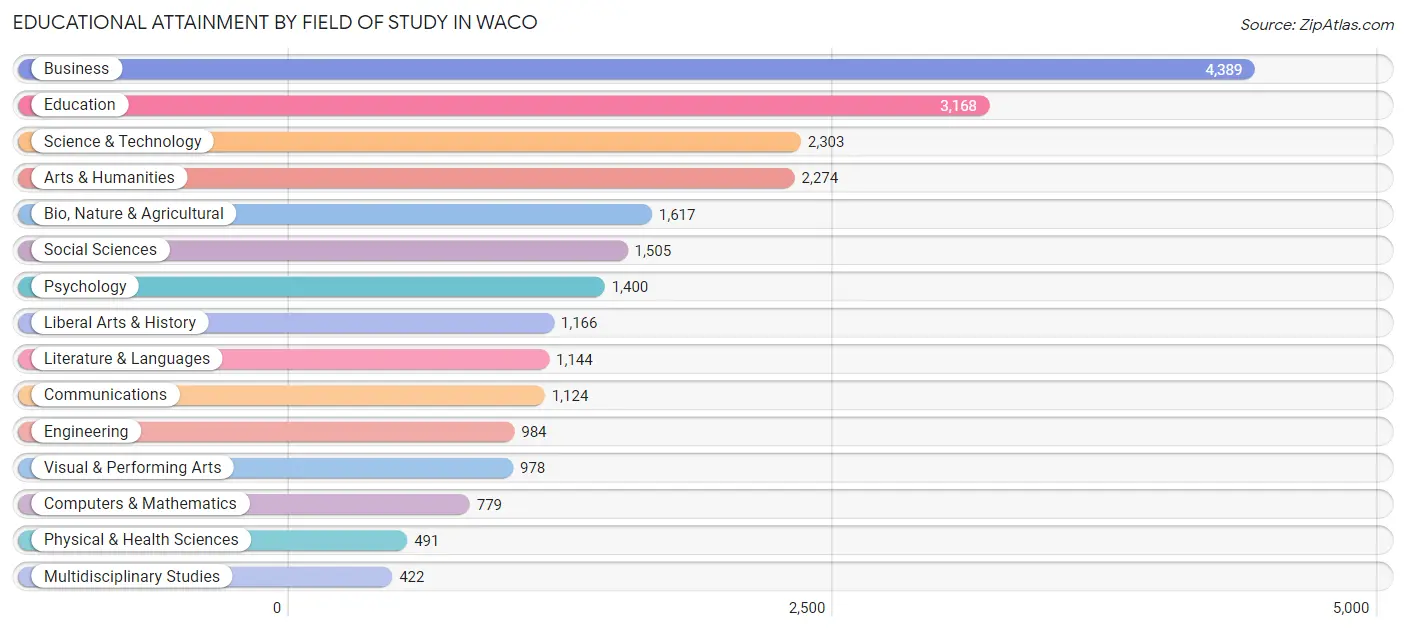
| Field of Study | # Graduates | % Graduates |
| Computers & Mathematics | 779 | 3.3% |
| Bio, Nature & Agricultural | 1,617 | 6.8% |
| Physical & Health Sciences | 491 | 2.1% |
| Psychology | 1,400 | 5.9% |
| Social Sciences | 1,505 | 6.3% |
| Engineering | 984 | 4.1% |
| Multidisciplinary Studies | 422 | 1.8% |
| Science & Technology | 2,303 | 9.7% |
| Business | 4,389 | 18.5% |
| Education | 3,168 | 13.3% |
| Literature & Languages | 1,144 | 4.8% |
| Liberal Arts & History | 1,166 | 4.9% |
| Visual & Performing Arts | 978 | 4.1% |
| Communications | 1,124 | 4.7% |
| Arts & Humanities | 2,274 | 9.6% |
| Total | 23,744 | 100.0% |
Transportation & Commute in Waco
Vehicle Availability by Sex in Waco
The most prevalent vehicle ownership categories in Waco are males with 2 vehicles (14,257, accounting for 45.8%) and females with 2 vehicles (12,576, making up 46.6%).
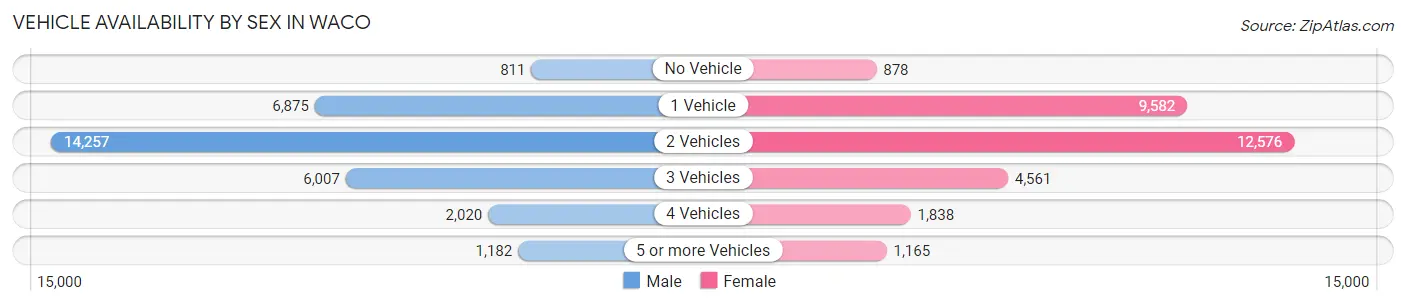
| Vehicles Available | Male | Female |
| No Vehicle | 811 (2.6%) | 878 (2.9%) |
| 1 Vehicle | 6,875 (22.1%) | 9,582 (31.3%) |
| 2 Vehicles | 14,257 (45.8%) | 12,576 (41.1%) |
| 3 Vehicles | 6,007 (19.3%) | 4,561 (14.9%) |
| 4 Vehicles | 2,020 (6.5%) | 1,838 (6.0%) |
| 5 or more Vehicles | 1,182 (3.8%) | 1,165 (3.8%) |
| Total | 31,152 (100.0%) | 30,600 (100.0%) |
Commute Time in Waco
The most frequently occuring commute durations in Waco are 15 to 19 minutes (17,000 commuters, 29.1%), 10 to 14 minutes (12,206 commuters, 20.9%), and 5 to 9 minutes (9,091 commuters, 15.6%).
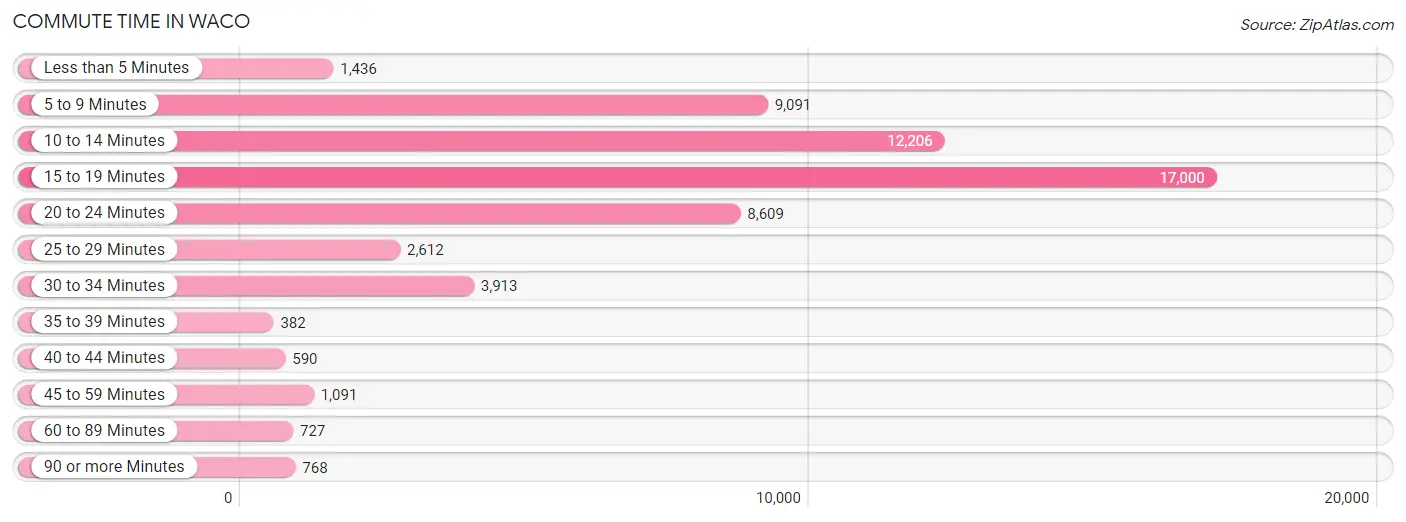
| Commute Time | # Commuters | % Commuters |
| Less than 5 Minutes | 1,436 | 2.5% |
| 5 to 9 Minutes | 9,091 | 15.6% |
| 10 to 14 Minutes | 12,206 | 20.9% |
| 15 to 19 Minutes | 17,000 | 29.1% |
| 20 to 24 Minutes | 8,609 | 14.7% |
| 25 to 29 Minutes | 2,612 | 4.5% |
| 30 to 34 Minutes | 3,913 | 6.7% |
| 35 to 39 Minutes | 382 | 0.6% |
| 40 to 44 Minutes | 590 | 1.0% |
| 45 to 59 Minutes | 1,091 | 1.9% |
| 60 to 89 Minutes | 727 | 1.2% |
| 90 or more Minutes | 768 | 1.3% |
Commute Time by Sex in Waco
The most common commute times in Waco are 15 to 19 minutes (8,613 commuters, 29.0%) for males and 15 to 19 minutes (8,387 commuters, 29.2%) for females.
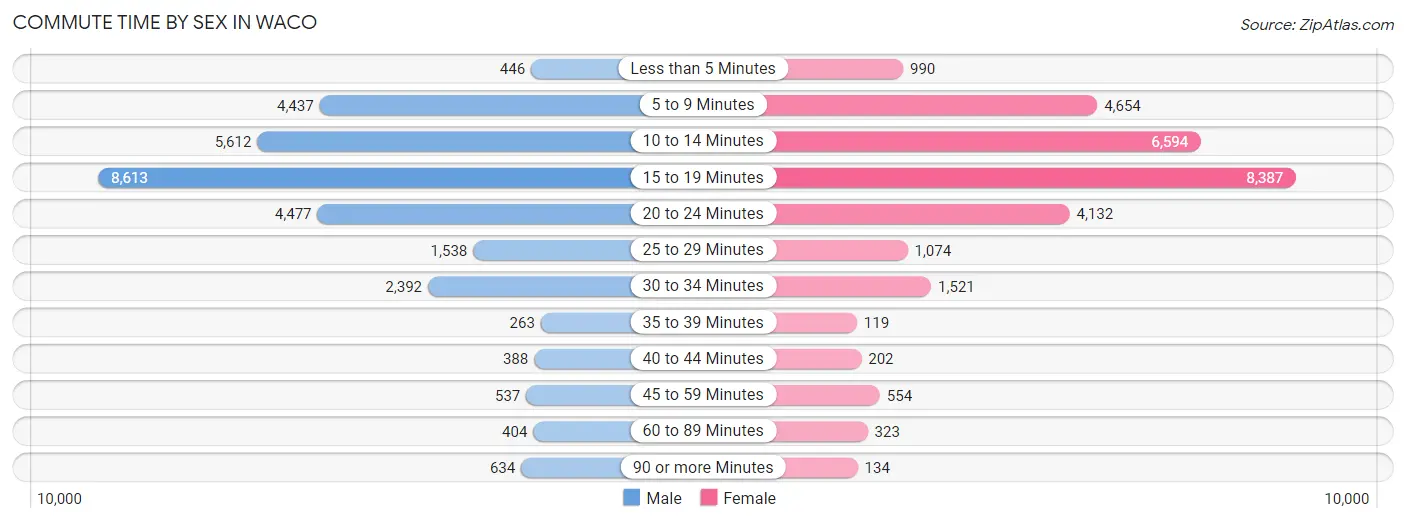
| Commute Time | Male | Female |
| Less than 5 Minutes | 446 (1.5%) | 990 (3.5%) |
| 5 to 9 Minutes | 4,437 (14.9%) | 4,654 (16.2%) |
| 10 to 14 Minutes | 5,612 (18.9%) | 6,594 (23.0%) |
| 15 to 19 Minutes | 8,613 (29.0%) | 8,387 (29.2%) |
| 20 to 24 Minutes | 4,477 (15.0%) | 4,132 (14.4%) |
| 25 to 29 Minutes | 1,538 (5.2%) | 1,074 (3.7%) |
| 30 to 34 Minutes | 2,392 (8.0%) | 1,521 (5.3%) |
| 35 to 39 Minutes | 263 (0.9%) | 119 (0.4%) |
| 40 to 44 Minutes | 388 (1.3%) | 202 (0.7%) |
| 45 to 59 Minutes | 537 (1.8%) | 554 (1.9%) |
| 60 to 89 Minutes | 404 (1.4%) | 323 (1.1%) |
| 90 or more Minutes | 634 (2.1%) | 134 (0.5%) |
Time of Departure to Work by Sex in Waco
The most frequent times of departure to work in Waco are 7:00 AM to 7:29 AM (4,032, 13.6%) for males and 7:30 AM to 7:59 AM (5,422, 18.9%) for females.
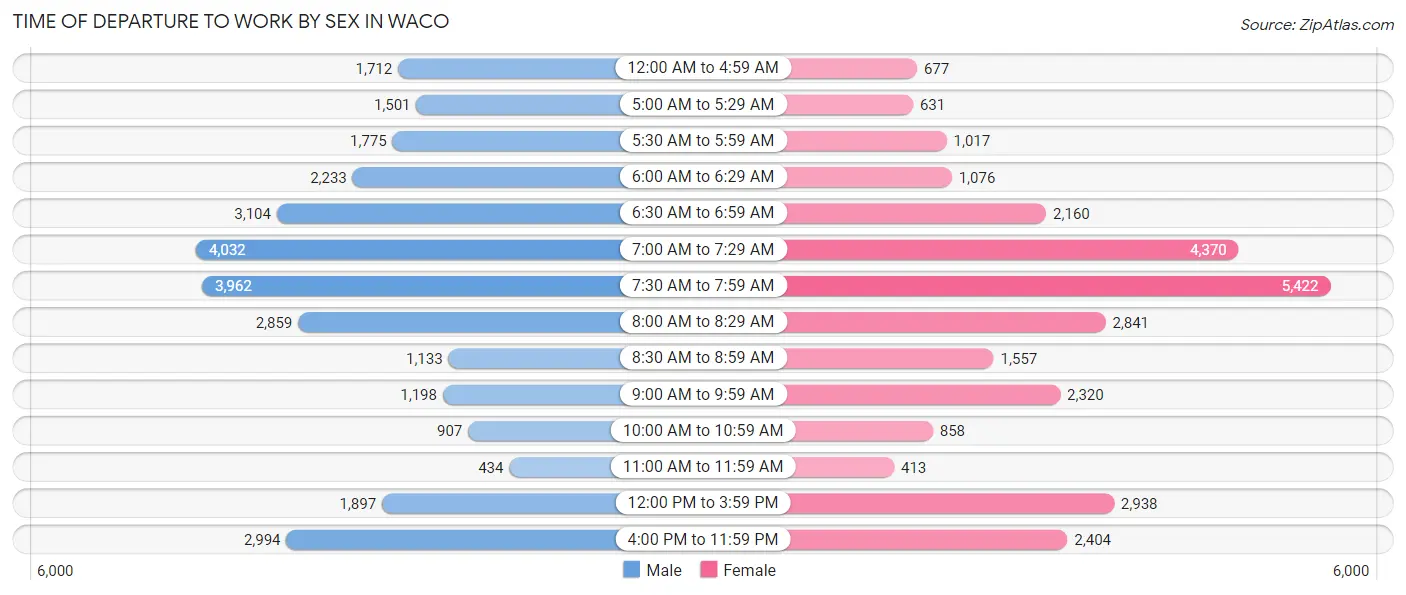
| Time of Departure | Male | Female |
| 12:00 AM to 4:59 AM | 1,712 (5.8%) | 677 (2.4%) |
| 5:00 AM to 5:29 AM | 1,501 (5.1%) | 631 (2.2%) |
| 5:30 AM to 5:59 AM | 1,775 (6.0%) | 1,017 (3.5%) |
| 6:00 AM to 6:29 AM | 2,233 (7.5%) | 1,076 (3.7%) |
| 6:30 AM to 6:59 AM | 3,104 (10.4%) | 2,160 (7.5%) |
| 7:00 AM to 7:29 AM | 4,032 (13.6%) | 4,370 (15.2%) |
| 7:30 AM to 7:59 AM | 3,962 (13.3%) | 5,422 (18.9%) |
| 8:00 AM to 8:29 AM | 2,859 (9.6%) | 2,841 (9.9%) |
| 8:30 AM to 8:59 AM | 1,133 (3.8%) | 1,557 (5.4%) |
| 9:00 AM to 9:59 AM | 1,198 (4.0%) | 2,320 (8.1%) |
| 10:00 AM to 10:59 AM | 907 (3.0%) | 858 (3.0%) |
| 11:00 AM to 11:59 AM | 434 (1.5%) | 413 (1.4%) |
| 12:00 PM to 3:59 PM | 1,897 (6.4%) | 2,938 (10.2%) |
| 4:00 PM to 11:59 PM | 2,994 (10.1%) | 2,404 (8.4%) |
| Total | 29,741 (100.0%) | 28,684 (100.0%) |
Housing Occupancy in Waco
Occupancy by Ownership in Waco
Of the total 52,256 dwellings in Waco, owner-occupied units account for 24,699 (47.3%), while renter-occupied units make up 27,557 (52.7%).
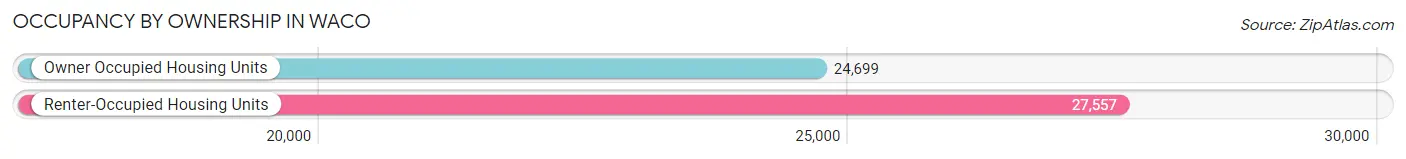
| Occupancy | # Housing Units | % Housing Units |
| Owner Occupied Housing Units | 24,699 | 47.3% |
| Renter-Occupied Housing Units | 27,557 | 52.7% |
| Total Occupied Housing Units | 52,256 | 100.0% |
Occupancy by Household Size in Waco
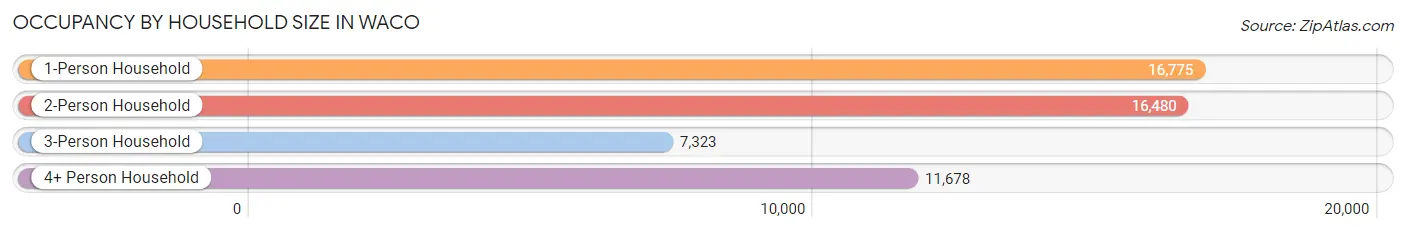
| Household Size | # Housing Units | % Housing Units |
| 1-Person Household | 16,775 | 32.1% |
| 2-Person Household | 16,480 | 31.5% |
| 3-Person Household | 7,323 | 14.0% |
| 4+ Person Household | 11,678 | 22.4% |
| Total Housing Units | 52,256 | 100.0% |
Occupancy by Ownership by Household Size in Waco
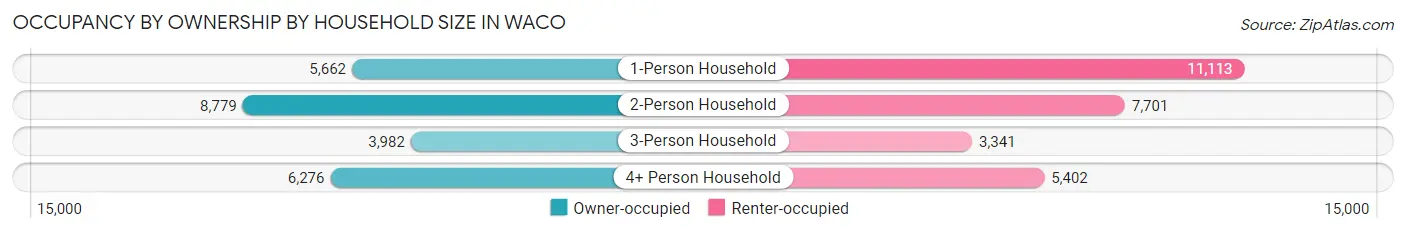
| Household Size | Owner-occupied | Renter-occupied |
| 1-Person Household | 5,662 (33.8%) | 11,113 (66.2%) |
| 2-Person Household | 8,779 (53.3%) | 7,701 (46.7%) |
| 3-Person Household | 3,982 (54.4%) | 3,341 (45.6%) |
| 4+ Person Household | 6,276 (53.7%) | 5,402 (46.3%) |
| Total Housing Units | 24,699 (47.3%) | 27,557 (52.7%) |
Occupancy by Educational Attainment in Waco
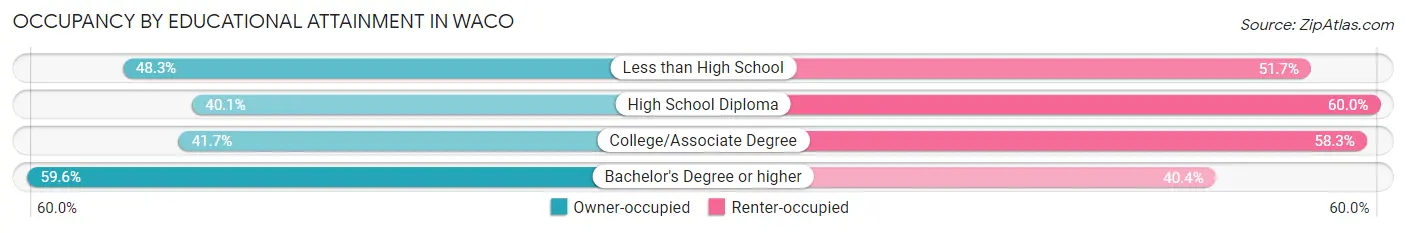
| Household Size | Owner-occupied | Renter-occupied |
| Less than High School | 3,129 (48.3%) | 3,349 (51.7%) |
| High School Diploma | 4,840 (40.1%) | 7,244 (60.0%) |
| College/Associate Degree | 7,795 (41.7%) | 10,918 (58.3%) |
| Bachelor's Degree or higher | 8,935 (59.6%) | 6,046 (40.4%) |
Occupancy by Age of Householder in Waco
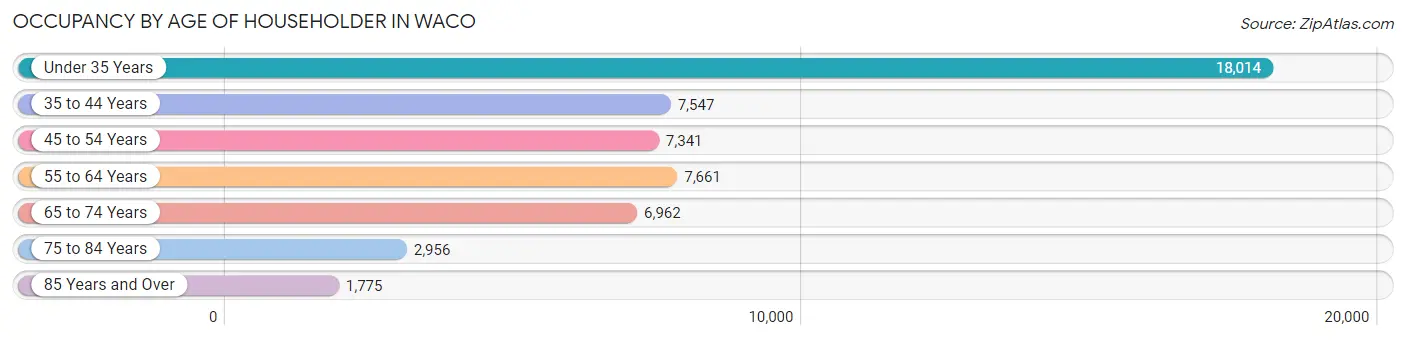
| Age Bracket | # Households | % Households |
| Under 35 Years | 18,014 | 34.5% |
| 35 to 44 Years | 7,547 | 14.4% |
| 45 to 54 Years | 7,341 | 14.1% |
| 55 to 64 Years | 7,661 | 14.7% |
| 65 to 74 Years | 6,962 | 13.3% |
| 75 to 84 Years | 2,956 | 5.7% |
| 85 Years and Over | 1,775 | 3.4% |
| Total | 52,256 | 100.0% |
Housing Finances in Waco
Median Income by Occupancy in Waco
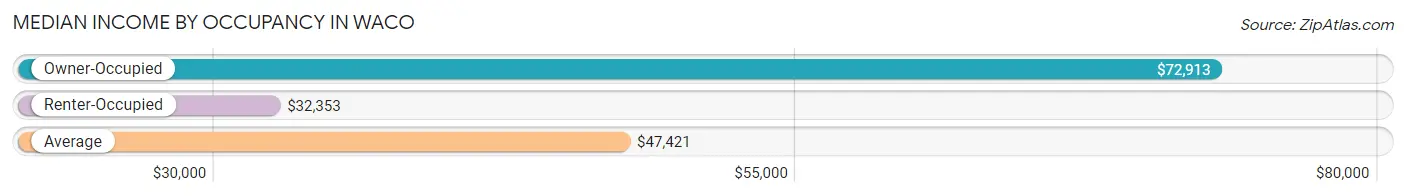
| Occupancy Type | # Households | Median Income |
| Owner-Occupied | 24,699 (47.3%) | $72,913 |
| Renter-Occupied | 27,557 (52.7%) | $32,353 |
| Average | 52,256 (100.0%) | $47,421 |
Occupancy by Householder Income Bracket in Waco
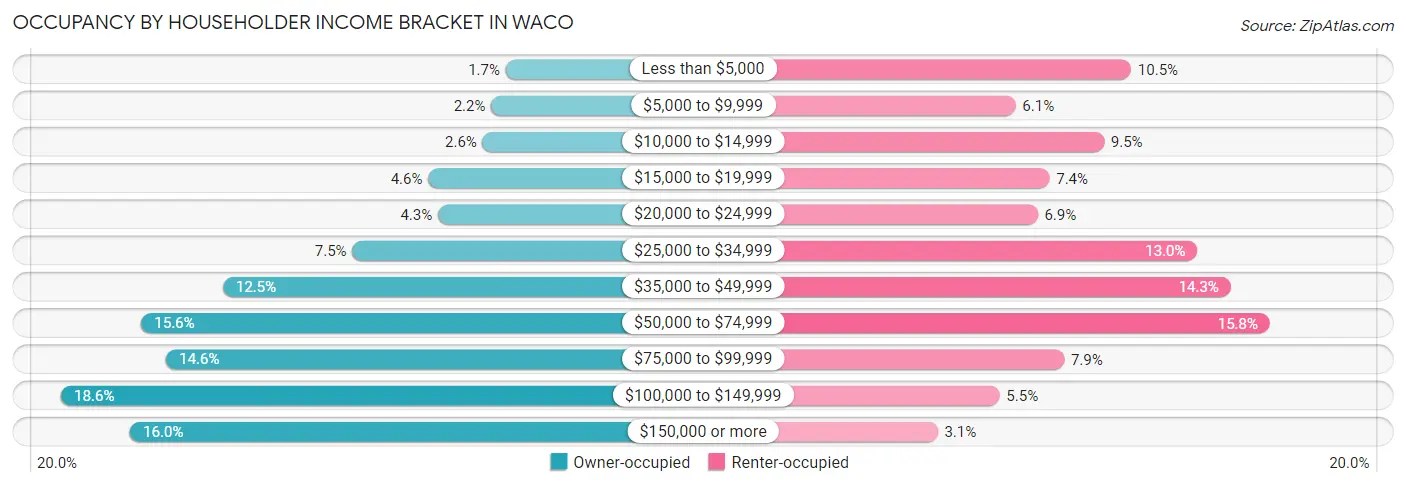
| Income Bracket | Owner-occupied | Renter-occupied |
| Less than $5,000 | 412 (1.7%) | 2,891 (10.5%) |
| $5,000 to $9,999 | 548 (2.2%) | 1,678 (6.1%) |
| $10,000 to $14,999 | 629 (2.5%) | 2,607 (9.5%) |
| $15,000 to $19,999 | 1,140 (4.6%) | 2,035 (7.4%) |
| $20,000 to $24,999 | 1,049 (4.3%) | 1,911 (6.9%) |
| $25,000 to $34,999 | 1,855 (7.5%) | 3,588 (13.0%) |
| $35,000 to $49,999 | 3,076 (12.4%) | 3,937 (14.3%) |
| $50,000 to $74,999 | 3,840 (15.5%) | 4,349 (15.8%) |
| $75,000 to $99,999 | 3,608 (14.6%) | 2,189 (7.9%) |
| $100,000 to $149,999 | 4,596 (18.6%) | 1,511 (5.5%) |
| $150,000 or more | 3,946 (16.0%) | 861 (3.1%) |
| Total | 24,699 (100.0%) | 27,557 (100.0%) |
Monthly Housing Cost Tiers in Waco
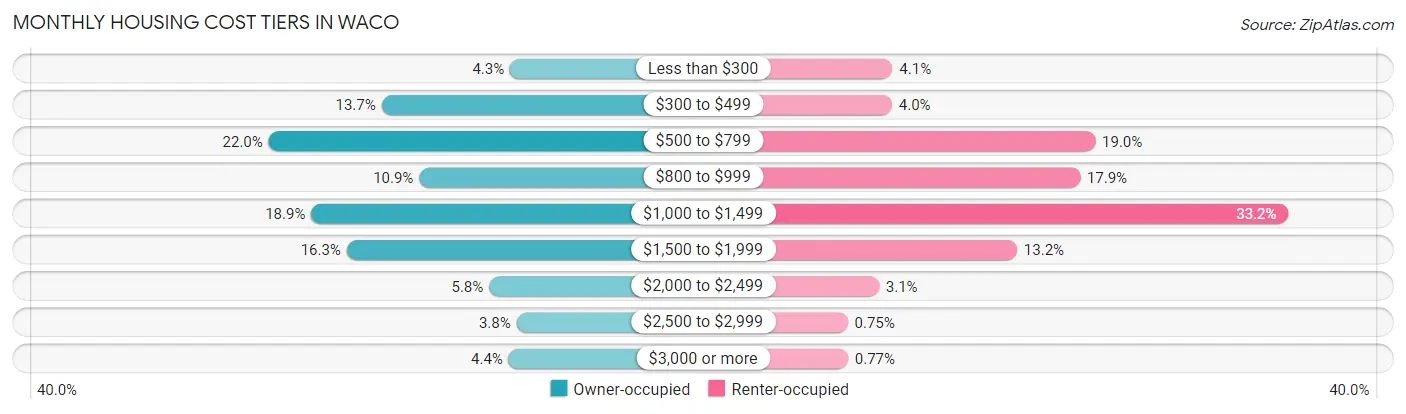
| Monthly Cost | Owner-occupied | Renter-occupied |
| Less than $300 | 1,049 (4.3%) | 1,116 (4.1%) |
| $300 to $499 | 3,386 (13.7%) | 1,106 (4.0%) |
| $500 to $799 | 5,440 (22.0%) | 5,230 (19.0%) |
| $800 to $999 | 2,702 (10.9%) | 4,921 (17.9%) |
| $1,000 to $1,499 | 4,665 (18.9%) | 9,153 (33.2%) |
| $1,500 to $1,999 | 4,020 (16.3%) | 3,643 (13.2%) |
| $2,000 to $2,499 | 1,430 (5.8%) | 841 (3.0%) |
| $2,500 to $2,999 | 932 (3.8%) | 207 (0.7%) |
| $3,000 or more | 1,075 (4.3%) | 213 (0.8%) |
| Total | 24,699 (100.0%) | 27,557 (100.0%) |
Physical Housing Characteristics in Waco
Housing Structures in Waco
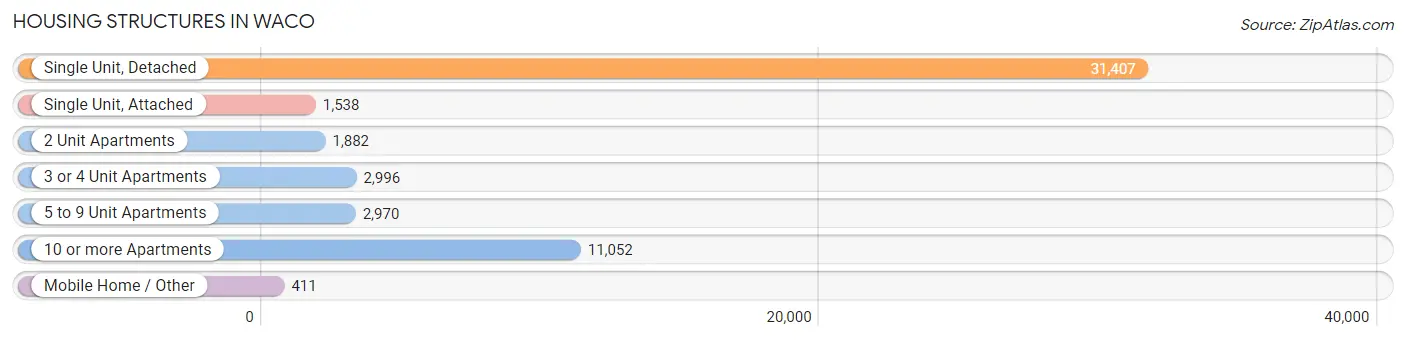
| Structure Type | # Housing Units | % Housing Units |
| Single Unit, Detached | 31,407 | 60.1% |
| Single Unit, Attached | 1,538 | 2.9% |
| 2 Unit Apartments | 1,882 | 3.6% |
| 3 or 4 Unit Apartments | 2,996 | 5.7% |
| 5 to 9 Unit Apartments | 2,970 | 5.7% |
| 10 or more Apartments | 11,052 | 21.1% |
| Mobile Home / Other | 411 | 0.8% |
| Total | 52,256 | 100.0% |
Housing Structures by Occupancy in Waco
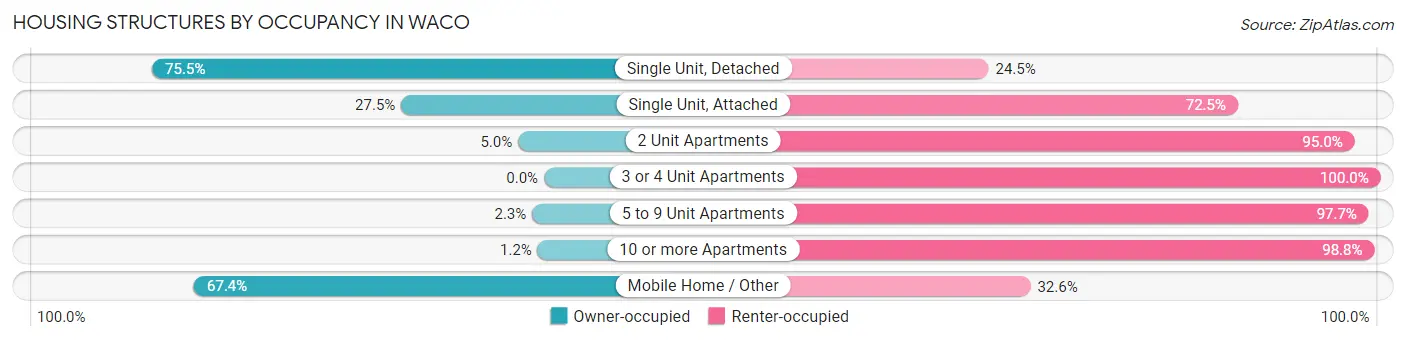
| Structure Type | Owner-occupied | Renter-occupied |
| Single Unit, Detached | 23,703 (75.5%) | 7,704 (24.5%) |
| Single Unit, Attached | 423 (27.5%) | 1,115 (72.5%) |
| 2 Unit Apartments | 94 (5.0%) | 1,788 (95.0%) |
| 3 or 4 Unit Apartments | 0 (0.0%) | 2,996 (100.0%) |
| 5 to 9 Unit Apartments | 68 (2.3%) | 2,902 (97.7%) |
| 10 or more Apartments | 134 (1.2%) | 10,918 (98.8%) |
| Mobile Home / Other | 277 (67.4%) | 134 (32.6%) |
| Total | 24,699 (47.3%) | 27,557 (52.7%) |
Housing Structures by Number of Rooms in Waco
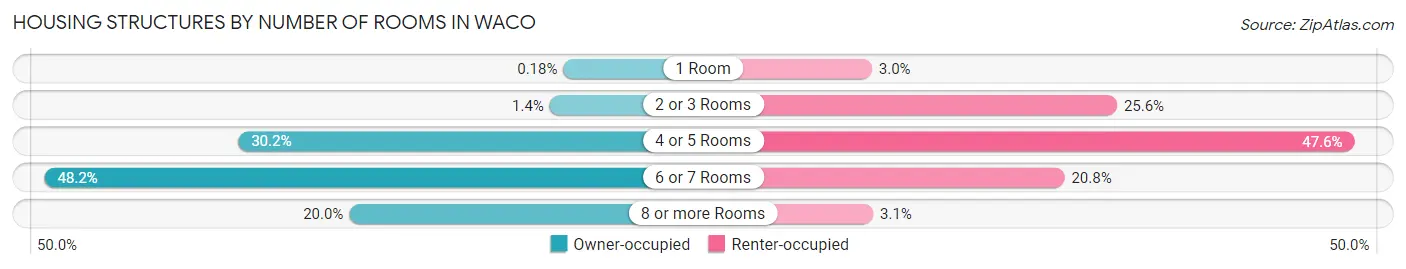
| Number of Rooms | Owner-occupied | Renter-occupied |
| 1 Room | 45 (0.2%) | 814 (2.9%) |
| 2 or 3 Rooms | 356 (1.4%) | 7,061 (25.6%) |
| 4 or 5 Rooms | 7,468 (30.2%) | 13,112 (47.6%) |
| 6 or 7 Rooms | 11,896 (48.2%) | 5,724 (20.8%) |
| 8 or more Rooms | 4,934 (20.0%) | 846 (3.1%) |
| Total | 24,699 (100.0%) | 27,557 (100.0%) |
Housing Structure by Heating Type in Waco
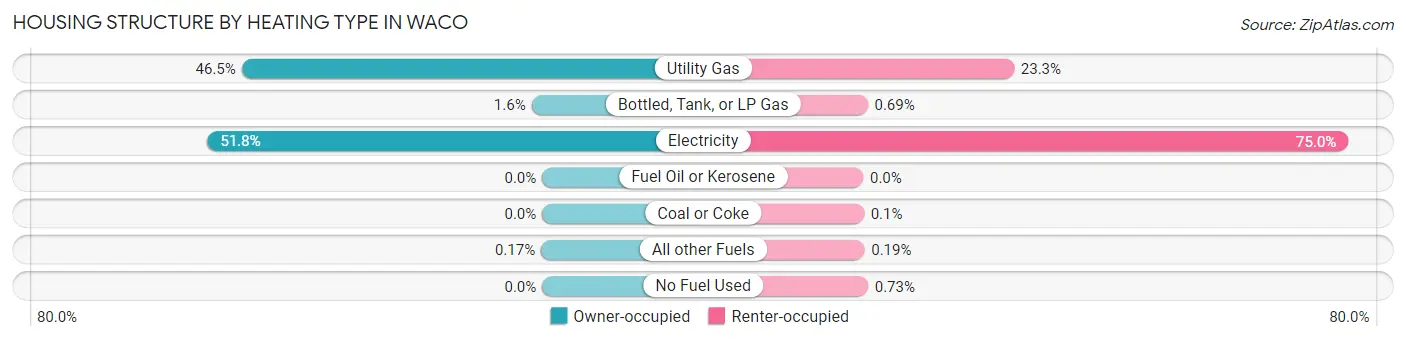
| Heating Type | Owner-occupied | Renter-occupied |
| Utility Gas | 11,472 (46.5%) | 6,423 (23.3%) |
| Bottled, Tank, or LP Gas | 405 (1.6%) | 189 (0.7%) |
| Electricity | 12,781 (51.7%) | 20,664 (75.0%) |
| Fuel Oil or Kerosene | 0 (0.0%) | 0 (0.0%) |
| Coal or Coke | 0 (0.0%) | 27 (0.1%) |
| All other Fuels | 41 (0.2%) | 52 (0.2%) |
| No Fuel Used | 0 (0.0%) | 202 (0.7%) |
| Total | 24,699 (100.0%) | 27,557 (100.0%) |
Household Vehicle Usage in Waco
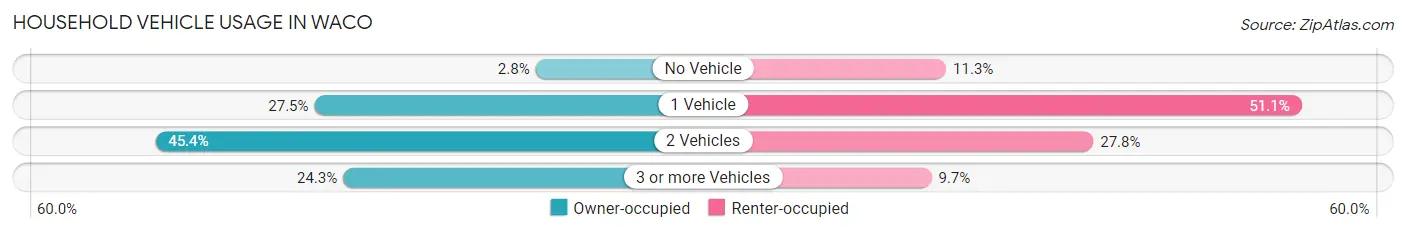
| Vehicles per Household | Owner-occupied | Renter-occupied |
| No Vehicle | 684 (2.8%) | 3,125 (11.3%) |
| 1 Vehicle | 6,801 (27.5%) | 14,092 (51.1%) |
| 2 Vehicles | 11,204 (45.4%) | 7,667 (27.8%) |
| 3 or more Vehicles | 6,010 (24.3%) | 2,673 (9.7%) |
| Total | 24,699 (100.0%) | 27,557 (100.0%) |
Real Estate & Mortgages in Waco
Real Estate and Mortgage Overview in Waco
| Characteristic | Without Mortgage | With Mortgage |
| Housing Units | 12,255 | 12,444 |
| Median Property Value | $123,400 | $207,700 |
| Median Household Income | $55,710 | $2,603 |
| Monthly Housing Costs | $590 | $1,075 |
| Real Estate Taxes | $2,098 | $308 |
Property Value by Mortgage Status in Waco
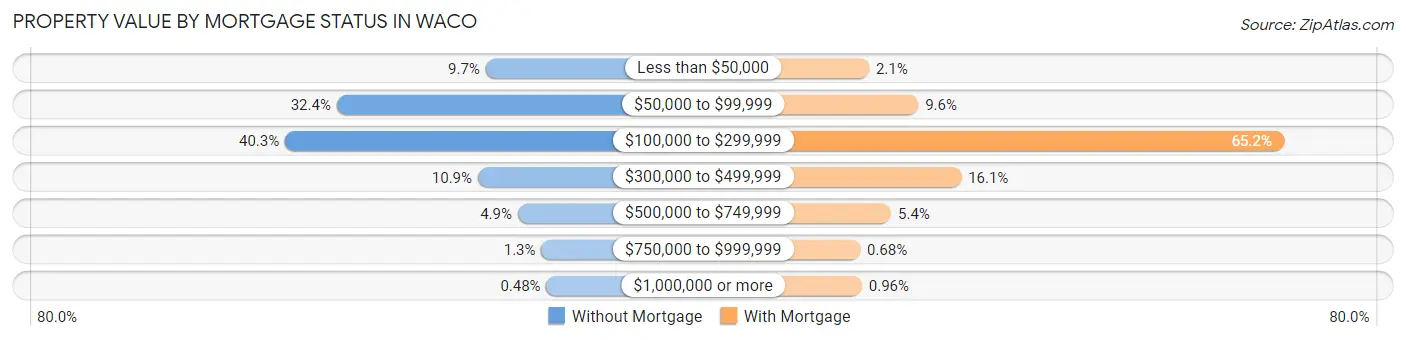
| Property Value | Without Mortgage | With Mortgage |
| Less than $50,000 | 1,194 (9.7%) | 255 (2.1%) |
| $50,000 to $99,999 | 3,976 (32.4%) | 1,189 (9.6%) |
| $100,000 to $299,999 | 4,940 (40.3%) | 8,119 (65.2%) |
| $300,000 to $499,999 | 1,339 (10.9%) | 2,003 (16.1%) |
| $500,000 to $749,999 | 594 (4.9%) | 674 (5.4%) |
| $750,000 to $999,999 | 153 (1.3%) | 84 (0.7%) |
| $1,000,000 or more | 59 (0.5%) | 120 (1.0%) |
| Total | 12,255 (100.0%) | 12,444 (100.0%) |
Household Income by Mortgage Status in Waco
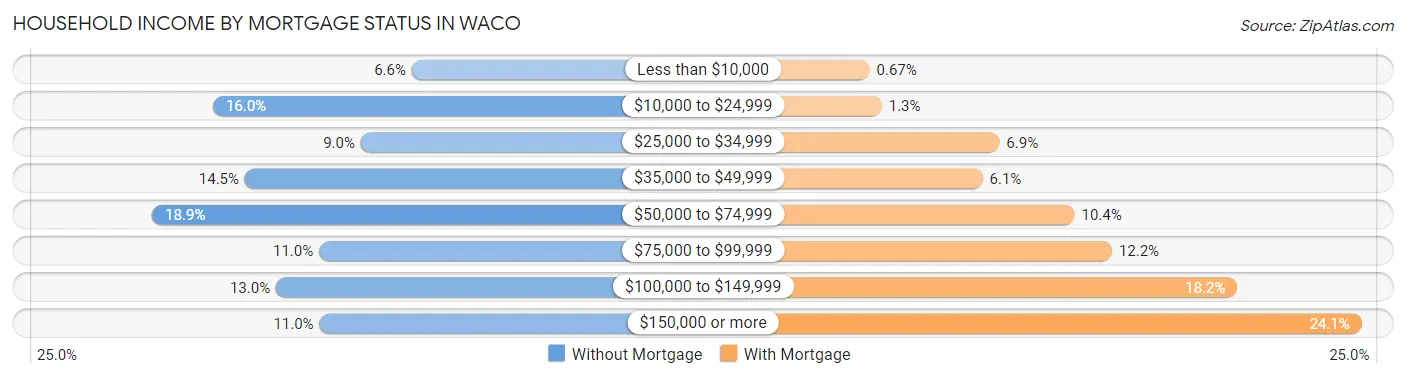
| Household Income | Without Mortgage | With Mortgage |
| Less than $10,000 | 804 (6.6%) | 83 (0.7%) |
| $10,000 to $24,999 | 1,965 (16.0%) | 156 (1.3%) |
| $25,000 to $34,999 | 1,102 (9.0%) | 853 (6.9%) |
| $35,000 to $49,999 | 1,778 (14.5%) | 753 (6.0%) |
| $50,000 to $74,999 | 2,320 (18.9%) | 1,298 (10.4%) |
| $75,000 to $99,999 | 1,346 (11.0%) | 1,520 (12.2%) |
| $100,000 to $149,999 | 1,597 (13.0%) | 2,262 (18.2%) |
| $150,000 or more | 1,343 (11.0%) | 2,999 (24.1%) |
| Total | 12,255 (100.0%) | 12,444 (100.0%) |
Property Value to Household Income Ratio in Waco
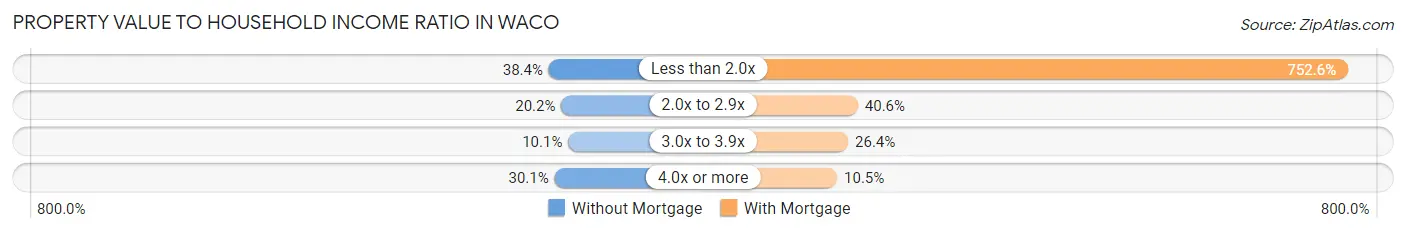
| Value-to-Income Ratio | Without Mortgage | With Mortgage |
| Less than 2.0x | 4,705 (38.4%) | 93,659 (752.6%) |
| 2.0x to 2.9x | 2,478 (20.2%) | 5,052 (40.6%) |
| 3.0x to 3.9x | 1,243 (10.1%) | 3,286 (26.4%) |
| 4.0x or more | 3,688 (30.1%) | 1,303 (10.5%) |
| Total | 12,255 (100.0%) | 12,444 (100.0%) |
Real Estate Taxes by Mortgage Status in Waco

| Property Taxes | Without Mortgage | With Mortgage |
| Less than $800 | 1,438 (11.7%) | 36 (0.3%) |
| $800 to $1,499 | 2,393 (19.5%) | 299 (2.4%) |
| $800 to $1,499 | 8,004 (65.3%) | 817 (6.6%) |
| Total | 12,255 (100.0%) | 12,444 (100.0%) |
Health & Disability in Waco
Health Insurance Coverage by Age in Waco
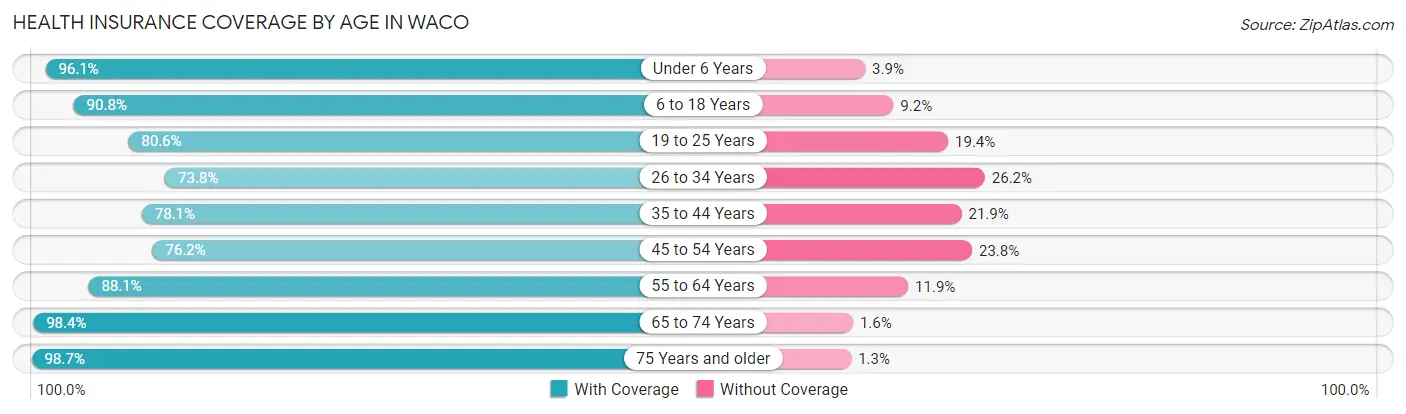
| Age Bracket | With Coverage | Without Coverage |
| Under 6 Years | 11,026 (96.1%) | 446 (3.9%) |
| 6 to 18 Years | 23,100 (90.8%) | 2,330 (9.2%) |
| 19 to 25 Years | 21,466 (80.6%) | 5,153 (19.4%) |
| 26 to 34 Years | 12,245 (73.8%) | 4,349 (26.2%) |
| 35 to 44 Years | 11,564 (78.1%) | 3,235 (21.9%) |
| 45 to 54 Years | 9,593 (76.2%) | 3,002 (23.8%) |
| 55 to 64 Years | 11,217 (88.1%) | 1,516 (11.9%) |
| 65 to 74 Years | 10,114 (98.4%) | 166 (1.6%) |
| 75 Years and older | 6,760 (98.7%) | 88 (1.3%) |
| Total | 117,085 (85.2%) | 20,285 (14.8%) |
Health Insurance Coverage by Citizenship Status in Waco

| Citizenship Status | With Coverage | Without Coverage |
| Native Born | 11,026 (96.1%) | 446 (3.9%) |
| Foreign Born, Citizen | 23,100 (90.8%) | 2,330 (9.2%) |
| Foreign Born, not a Citizen | 21,466 (80.6%) | 5,153 (19.4%) |
Health Insurance Coverage by Household Income in Waco
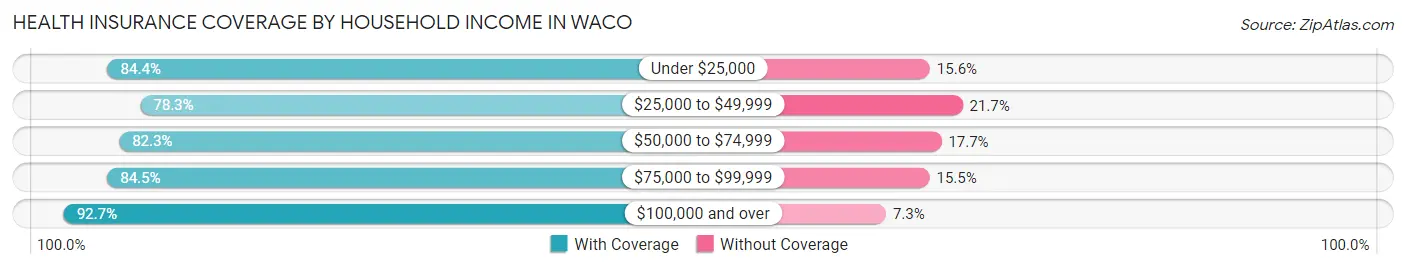
| Household Income | With Coverage | Without Coverage |
| Under $25,000 | 24,783 (84.4%) | 4,572 (15.6%) |
| $25,000 to $49,999 | 23,059 (78.3%) | 6,386 (21.7%) |
| $50,000 to $74,999 | 17,063 (82.3%) | 3,677 (17.7%) |
| $75,000 to $99,999 | 14,679 (84.5%) | 2,693 (15.5%) |
| $100,000 and over | 32,229 (92.7%) | 2,553 (7.3%) |
Public vs Private Health Insurance Coverage by Age in Waco
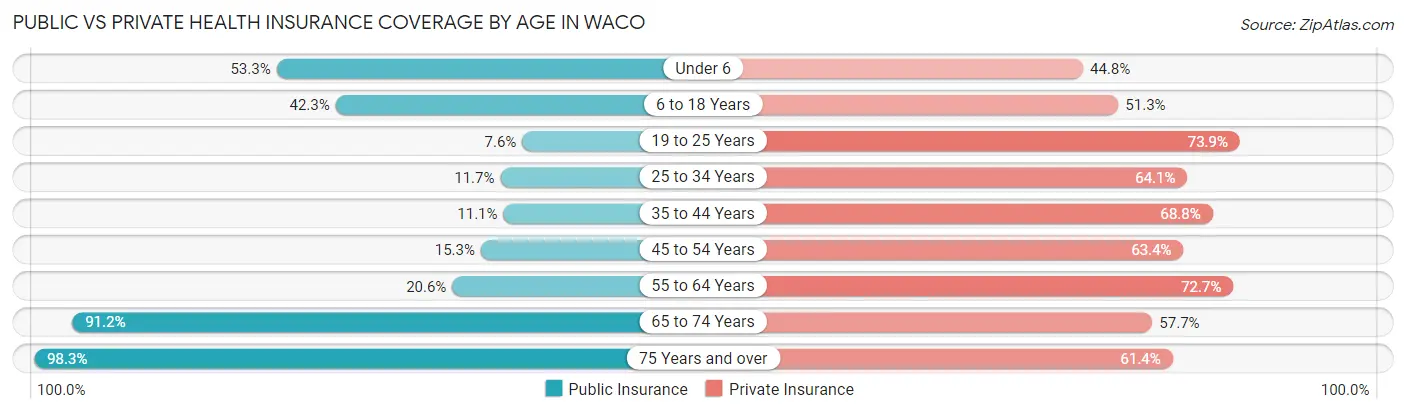
| Age Bracket | Public Insurance | Private Insurance |
| Under 6 | 6,109 (53.2%) | 5,138 (44.8%) |
| 6 to 18 Years | 10,751 (42.3%) | 13,056 (51.3%) |
| 19 to 25 Years | 2,035 (7.6%) | 19,663 (73.9%) |
| 25 to 34 Years | 1,941 (11.7%) | 10,642 (64.1%) |
| 35 to 44 Years | 1,647 (11.1%) | 10,183 (68.8%) |
| 45 to 54 Years | 1,930 (15.3%) | 7,987 (63.4%) |
| 55 to 64 Years | 2,627 (20.6%) | 9,250 (72.7%) |
| 65 to 74 Years | 9,370 (91.1%) | 5,926 (57.7%) |
| 75 Years and over | 6,728 (98.3%) | 4,205 (61.4%) |
| Total | 43,138 (31.4%) | 86,050 (62.6%) |
Disability Status by Sex by Age in Waco
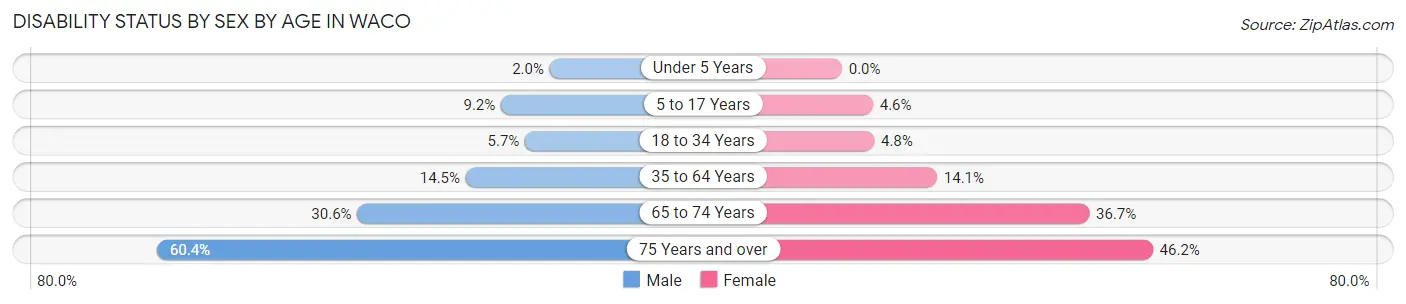
| Age Bracket | Male | Female |
| Under 5 Years | 103 (2.0%) | 0 (0.0%) |
| 5 to 17 Years | 1,090 (9.2%) | 506 (4.6%) |
| 18 to 34 Years | 1,300 (5.7%) | 1,179 (4.8%) |
| 35 to 64 Years | 2,764 (14.5%) | 2,972 (14.1%) |
| 65 to 74 Years | 1,488 (30.6%) | 1,988 (36.7%) |
| 75 Years and over | 1,560 (60.4%) | 1,968 (46.2%) |
Disability Class by Sex by Age in Waco
Disability Class: Hearing Difficulty
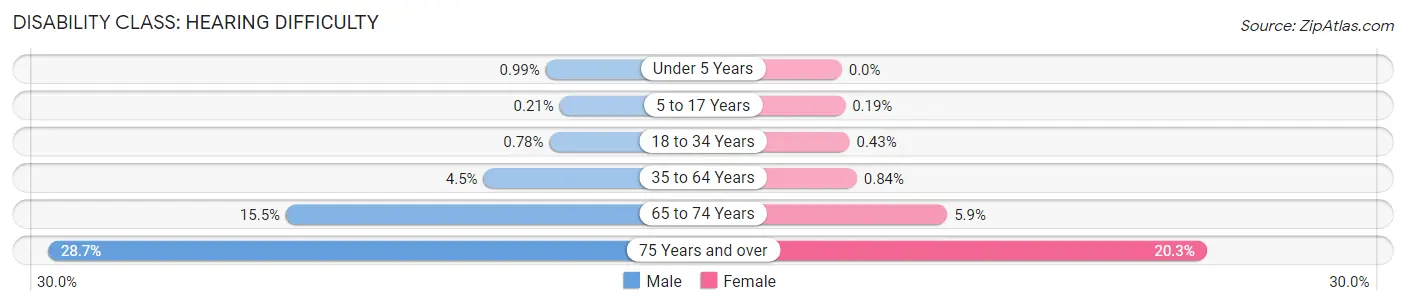
| Age Bracket | Male | Female |
| Under 5 Years | 51 (1.0%) | 0 (0.0%) |
| 5 to 17 Years | 25 (0.2%) | 21 (0.2%) |
| 18 to 34 Years | 178 (0.8%) | 106 (0.4%) |
| 35 to 64 Years | 850 (4.4%) | 176 (0.8%) |
| 65 to 74 Years | 752 (15.4%) | 318 (5.9%) |
| 75 Years and over | 742 (28.7%) | 866 (20.3%) |
Disability Class: Vision Difficulty
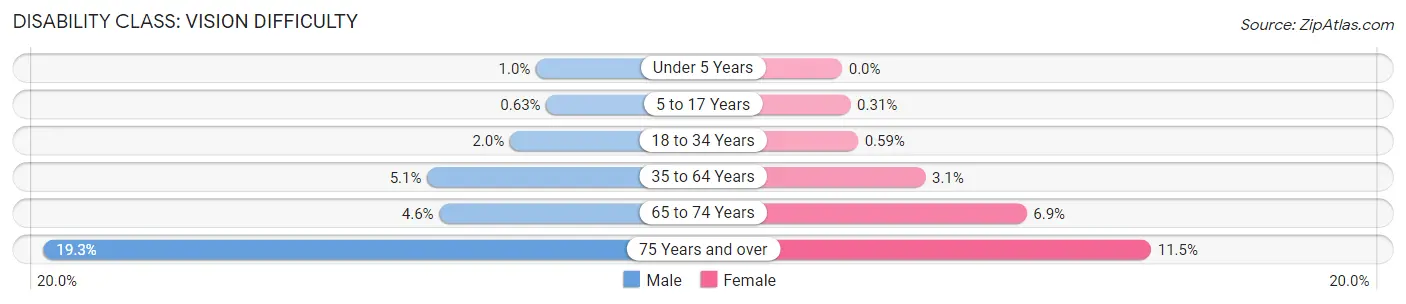
| Age Bracket | Male | Female |
| Under 5 Years | 52 (1.0%) | 0 (0.0%) |
| 5 to 17 Years | 74 (0.6%) | 34 (0.3%) |
| 18 to 34 Years | 454 (2.0%) | 146 (0.6%) |
| 35 to 64 Years | 963 (5.1%) | 650 (3.1%) |
| 65 to 74 Years | 224 (4.6%) | 371 (6.9%) |
| 75 Years and over | 499 (19.3%) | 489 (11.5%) |
Disability Class: Cognitive Difficulty
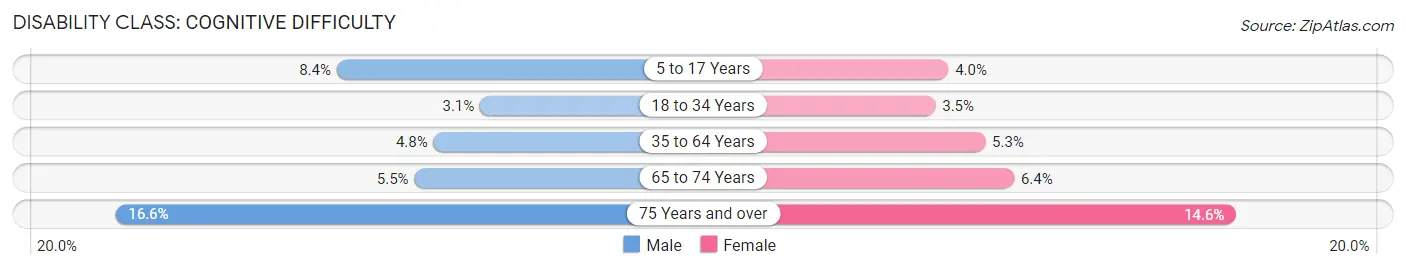
| Age Bracket | Male | Female |
| 5 to 17 Years | 992 (8.4%) | 434 (4.0%) |
| 18 to 34 Years | 707 (3.1%) | 853 (3.5%) |
| 35 to 64 Years | 920 (4.8%) | 1,119 (5.3%) |
| 65 to 74 Years | 269 (5.5%) | 346 (6.4%) |
| 75 Years and over | 430 (16.6%) | 624 (14.6%) |
Disability Class: Ambulatory Difficulty
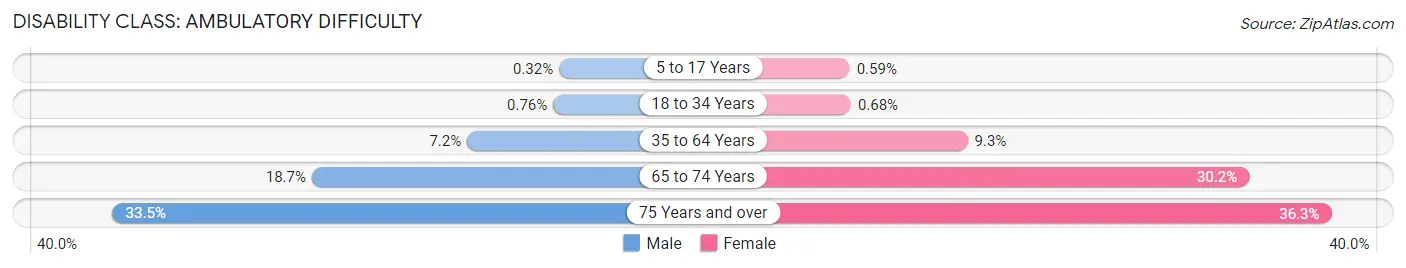
| Age Bracket | Male | Female |
| 5 to 17 Years | 38 (0.3%) | 65 (0.6%) |
| 18 to 34 Years | 174 (0.8%) | 168 (0.7%) |
| 35 to 64 Years | 1,365 (7.1%) | 1,966 (9.3%) |
| 65 to 74 Years | 909 (18.7%) | 1,637 (30.2%) |
| 75 Years and over | 865 (33.5%) | 1,549 (36.3%) |
Disability Class: Self-Care Difficulty
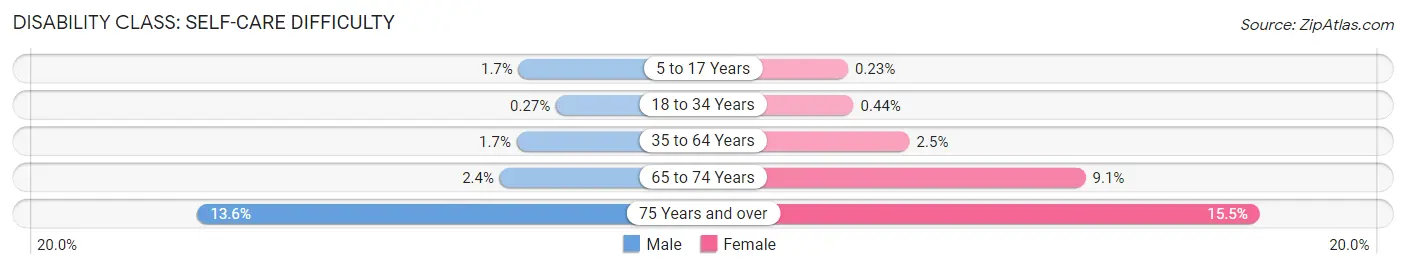
| Age Bracket | Male | Female |
| 5 to 17 Years | 196 (1.7%) | 25 (0.2%) |
| 18 to 34 Years | 62 (0.3%) | 109 (0.4%) |
| 35 to 64 Years | 331 (1.7%) | 531 (2.5%) |
| 65 to 74 Years | 115 (2.4%) | 490 (9.0%) |
| 75 Years and over | 351 (13.6%) | 661 (15.5%) |
Technology Access in Waco
Computing Device Access in Waco
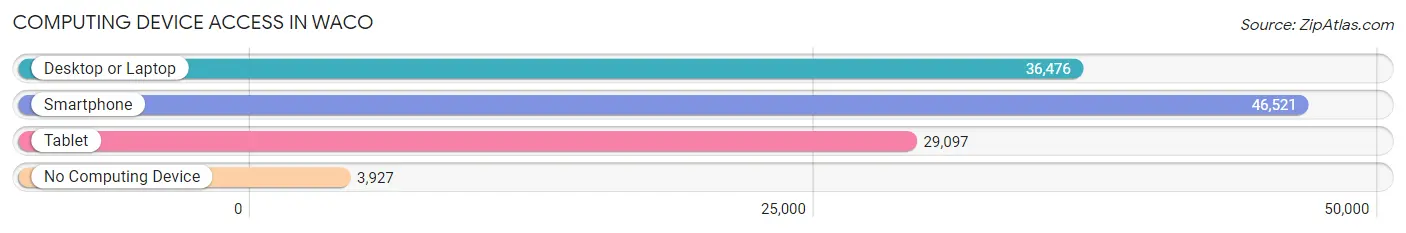
| Device Type | # Households | % Households |
| Desktop or Laptop | 36,476 | 69.8% |
| Smartphone | 46,521 | 89.0% |
| Tablet | 29,097 | 55.7% |
| No Computing Device | 3,927 | 7.5% |
| Total | 52,256 | 100.0% |
Internet Access in Waco
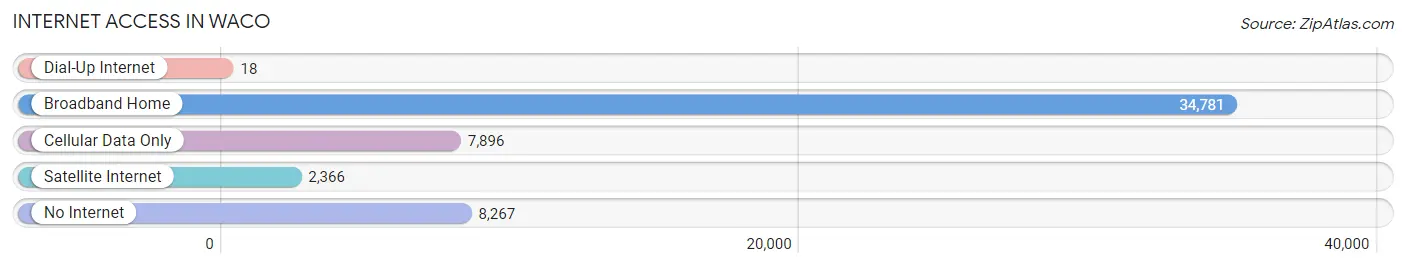
| Internet Type | # Households | % Households |
| Dial-Up Internet | 18 | 0.0% |
| Broadband Home | 34,781 | 66.6% |
| Cellular Data Only | 7,896 | 15.1% |
| Satellite Internet | 2,366 | 4.5% |
| No Internet | 8,267 | 15.8% |
| Total | 52,256 | 100.0% |
Waco Summary
Waco, Texas is a city located in McLennan County, Texas, United States. It is situated along the Brazos River and I-35, halfway between Dallas and Austin. The city is the county seat of McLennan County and is the 22nd-most populous city in the state of Texas. The city's population was 124,805 at the 2010 census, making it the 22nd-most populous city in the state of Texas.
History
The area that is now Waco was inhabited by the Wichita Native American tribe prior to the arrival of European settlers in the area. The first Europeans to settle in the area were the Spanish, who established a mission in the area in 1749. The mission was abandoned in 1772, and the area was later settled by Anglo-American settlers in 1837. The city was officially incorporated in 1849 and named after the Waco tribe, who had inhabited the area prior to the arrival of the Europeans.
The city experienced rapid growth in the late 19th century, due to the arrival of the railroad and the establishment of several cotton mills. The city was also home to several prominent figures in the early 20th century, including the first president of Baylor University, Rufus Burleson, and the first president of Texas A&M University, Thomas S. Gathright.
Geography
Waco is located in Central Texas, approximately halfway between Dallas and Austin. The city is situated along the Brazos River and I-35, and is surrounded by several smaller towns and cities, including Robinson, Hewitt, Woodway, and Bellmead. The city has a total area of 97.5 square miles, of which 95.9 square miles is land and 1.6 square miles is water.
Economy
Waco's economy is largely based on the service industry, with the largest employers in the city being Baylor University, Providence Health Center, and Waco ISD. The city is also home to several manufacturing companies, including Magnablend, a chemical manufacturing company, and L-3 Communications, an aerospace and defense company. The city is also home to several retail stores, including Walmart, Target, and Best Buy.
Demographics
As of the 2010 census, the population of Waco was 124,805, with a population density of 1,288 people per square mile. The racial makeup of the city was 63.2% White, 22.2% African American, 0.7% Native American, 1.7% Asian, 0.1% Pacific Islander, 9.7% from other races, and 2.4% from two or more races. Hispanic or Latino of any race were 20.7% of the population.
The median income for a household in the city was $37,837, and the median income for a family was $45,919. The per capita income for the city was $20,845. About 17.2% of families and 21.3% of the population were below the poverty line, including 30.2% of those under age 18 and 11.7% of those age 65 or over.
Common Questions
What is Per Capita Income in Waco?
Per Capita income in Waco is $26,825.
What is the Median Family Income in Waco?
Median Family Income in Waco is $65,196.
What is the Median Household income in Waco?
Median Household Income in Waco is $47,421.
What is Income or Wage Gap in Waco?
Income or Wage Gap in Waco is 24.2%.
Women in Waco earn 75.8 cents for every dollar earned by a man.
What is Family Income Deficit in Waco?
Family Income Deficit in Waco is $10,299.
Families that are below poverty line in Waco earn $10,299 less on average than the poverty threshold level.
What is Inequality or Gini Index in Waco?
Inequality or Gini Index in Waco is 0.50.
What is the Total Population of Waco?
Total Population of Waco is 140,545.
What is the Total Male Population of Waco?
Total Male Population of Waco is 68,355.
What is the Total Female Population of Waco?
Total Female Population of Waco is 72,190.
What is the Ratio of Males per 100 Females in Waco?
There are 94.69 Males per 100 Females in Waco.
What is the Ratio of Females per 100 Males in Waco?
There are 105.61 Females per 100 Males in Waco.
What is the Median Population Age in Waco?
Median Population Age in Waco is 28.8 Years.
What is the Average Family Size in Waco
Average Family Size in Waco is 3.2 People.
What is the Average Household Size in Waco
Average Household Size in Waco is 2.5 People.
How Large is the Labor Force in Waco?
There are 67,304 People in the Labor Forcein in Waco.
What is the Percentage of People in the Labor Force in Waco?
60.7% of People are in the Labor Force in Waco.
What is the Unemployment Rate in Waco?
Unemployment Rate in Waco is 4.5%.