Gibsonton, FL Map & Demographics
Gibsonton Map
Gibsonton Overview
$31,631
PER CAPITA INCOME
$82,180
AVG FAMILY INCOME
$73,167
AVG HOUSEHOLD INCOME
13.9%
WAGE / INCOME GAP [ % ]
86.1¢/ $1
WAGE / INCOME GAP [ $ ]
$12,402
FAMILY INCOME DEFICIT
0.47
INEQUALITY / GINI INDEX
17,879
TOTAL POPULATION
8,747
MALE POPULATION
9,132
FEMALE POPULATION
95.78
MALES / 100 FEMALES
104.40
FEMALES / 100 MALES
34.1
MEDIAN AGE
3.5
AVG FAMILY SIZE
3.1
AVG HOUSEHOLD SIZE
8,987
LABOR FORCE [ PEOPLE ]
68.8%
PERCENT IN LABOR FORCE
6.2%
UNEMPLOYMENT RATE
Gibsonton Zip Codes
Gibsonton Area Codes
Income in Gibsonton
Income Overview in Gibsonton
Per Capita Income in Gibsonton is $31,631, while median incomes of families and households are $82,180 and $73,167 respectively.
| Characteristic | Number | Measure |
| Per Capita Income | 17,879 | $31,631 |
| Median Family Income | 4,269 | $82,180 |
| Mean Family Income | 4,269 | $100,854 |
| Median Household Income | 5,818 | $73,167 |
| Mean Household Income | 5,818 | $93,925 |
| Income Deficit | 4,269 | $12,402 |
| Wage / Income Gap (%) | 17,879 | 13.86% |
| Wage / Income Gap ($) | 17,879 | 86.14¢ per $1 |
| Gini / Inequality Index | 17,879 | 0.47 |
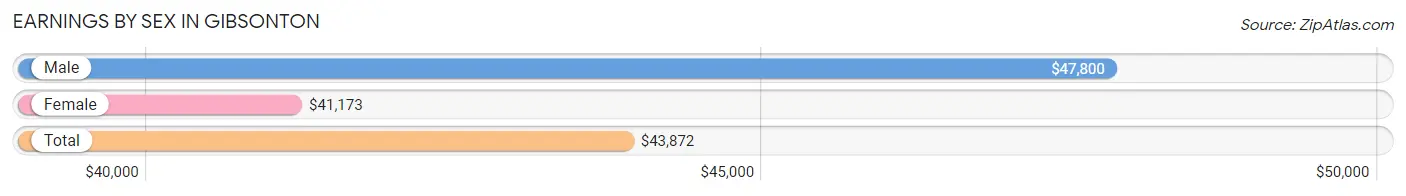
Earnings by Sex in Gibsonton
Average Earnings in Gibsonton are $43,872, $47,800 for men and $41,173 for women, a difference of 13.9%.
| Sex | Number | Average Earnings |
| Male | 4,778 (54.4%) | $47,800 |
| Female | 4,008 (45.6%) | $41,173 |
| Total | 8,786 (100.0%) | $43,872 |
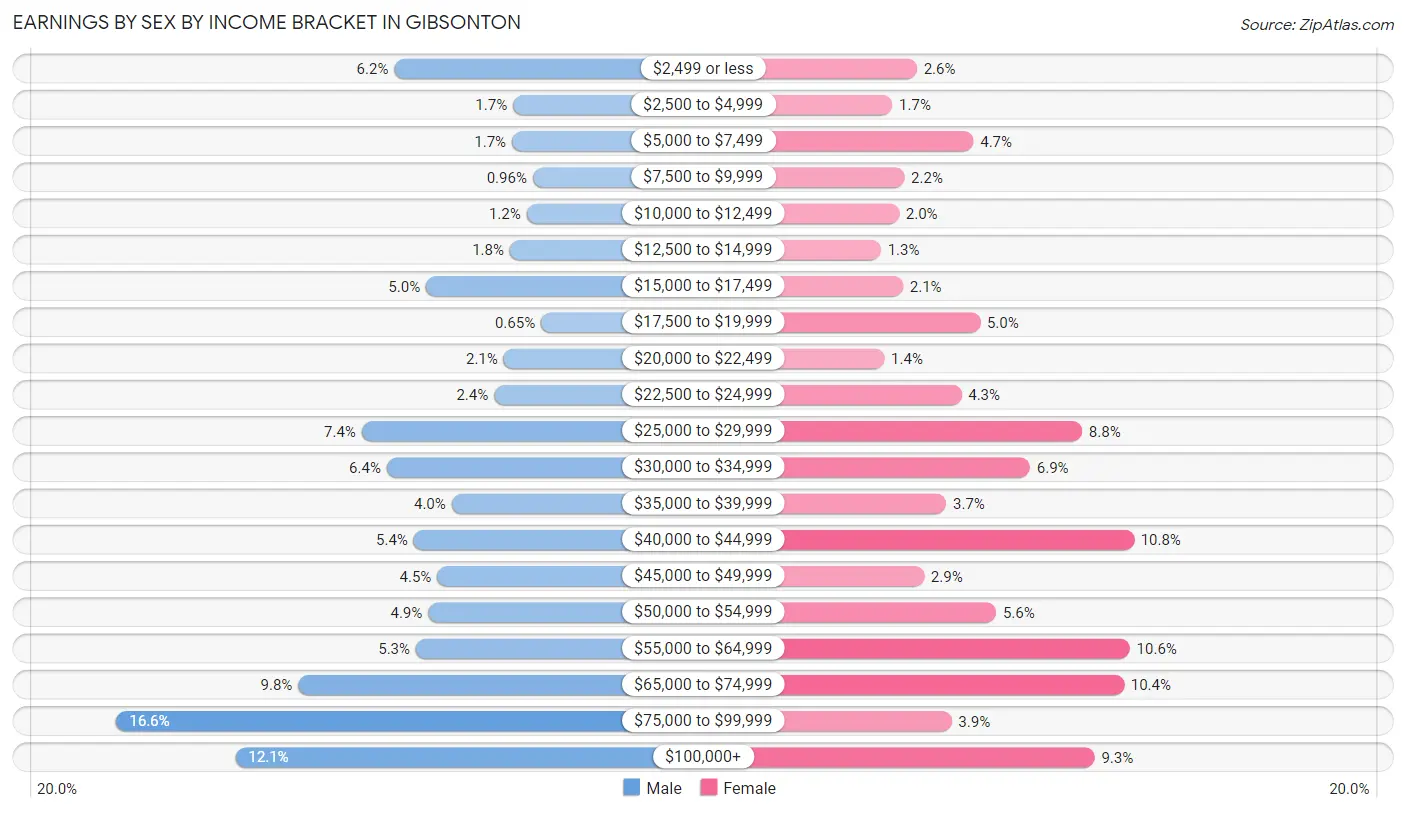
Earnings by Sex by Income Bracket in Gibsonton
The most common earnings brackets in Gibsonton are $75,000 to $99,999 for men (791 | 16.6%) and $40,000 to $44,999 for women (431 | 10.7%).
| Income | Male | Female |
| $2,499 or less | 294 (6.1%) | 105 (2.6%) |
| $2,500 to $4,999 | 81 (1.7%) | 68 (1.7%) |
| $5,000 to $7,499 | 83 (1.7%) | 190 (4.7%) |
| $7,500 to $9,999 | 46 (1.0%) | 86 (2.1%) |
| $10,000 to $12,499 | 57 (1.2%) | 78 (1.9%) |
| $12,500 to $14,999 | 87 (1.8%) | 51 (1.3%) |
| $15,000 to $17,499 | 237 (5.0%) | 84 (2.1%) |
| $17,500 to $19,999 | 31 (0.6%) | 200 (5.0%) |
| $20,000 to $22,499 | 98 (2.1%) | 56 (1.4%) |
| $22,500 to $24,999 | 115 (2.4%) | 172 (4.3%) |
| $25,000 to $29,999 | 352 (7.4%) | 353 (8.8%) |
| $30,000 to $34,999 | 307 (6.4%) | 275 (6.9%) |
| $35,000 to $39,999 | 191 (4.0%) | 149 (3.7%) |
| $40,000 to $44,999 | 259 (5.4%) | 431 (10.7%) |
| $45,000 to $49,999 | 217 (4.5%) | 116 (2.9%) |
| $50,000 to $54,999 | 233 (4.9%) | 224 (5.6%) |
| $55,000 to $64,999 | 255 (5.3%) | 425 (10.6%) |
| $65,000 to $74,999 | 466 (9.8%) | 416 (10.4%) |
| $75,000 to $99,999 | 791 (16.6%) | 157 (3.9%) |
| $100,000+ | 578 (12.1%) | 372 (9.3%) |
| Total | 4,778 (100.0%) | 4,008 (100.0%) |
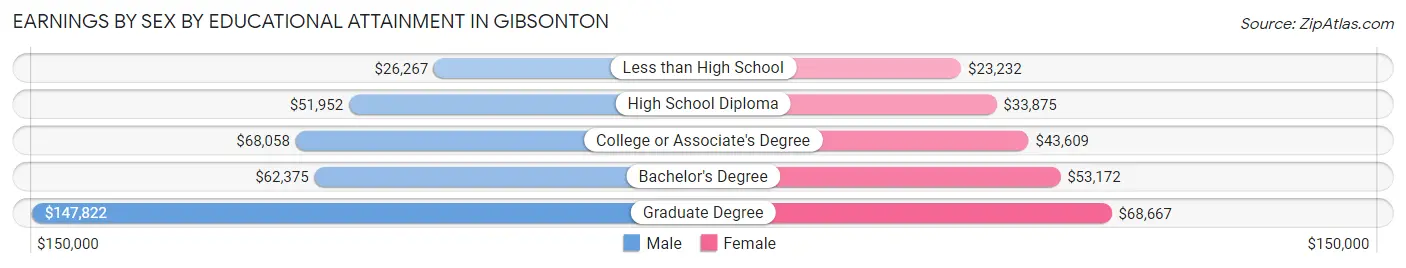
Earnings by Sex by Educational Attainment in Gibsonton
Average earnings in Gibsonton are $53,256 for men and $43,885 for women, a difference of 17.6%. Men with an educational attainment of graduate degree enjoy the highest average annual earnings of $147,822, while those with less than high school education earn the least with $26,267. Women with an educational attainment of graduate degree earn the most with the average annual earnings of $68,667, while those with less than high school education have the smallest earnings of $23,232.
| Educational Attainment | Male Income | Female Income |
| Less than High School | $26,267 | $23,232 |
| High School Diploma | $51,952 | $33,875 |
| College or Associate's Degree | $68,058 | $43,609 |
| Bachelor's Degree | $62,375 | $53,172 |
| Graduate Degree | $147,822 | $68,667 |
| Total | $53,256 | $43,885 |
Family Income in Gibsonton
Family Income Brackets in Gibsonton
According to the Gibsonton family income data, there are 1,178 families falling into the $100,000 to $149,999 income range, which is the most common income bracket and makes up 27.6% of all families. Conversely, the $10,000 to $14,999 income bracket is the least frequent group with only 111 families (2.6%) belonging to this category.
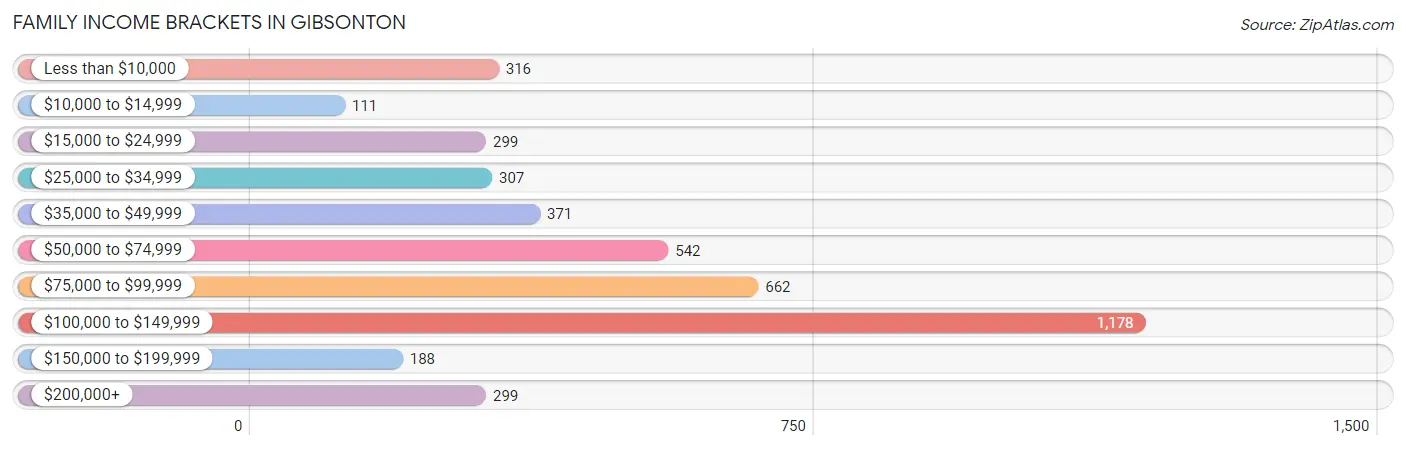
| Income Bracket | # Families | % Families |
| Less than $10,000 | 316 | 7.4% |
| $10,000 to $14,999 | 111 | 2.6% |
| $15,000 to $24,999 | 299 | 7.0% |
| $25,000 to $34,999 | 307 | 7.2% |
| $35,000 to $49,999 | 371 | 8.7% |
| $50,000 to $74,999 | 542 | 12.7% |
| $75,000 to $99,999 | 662 | 15.5% |
| $100,000 to $149,999 | 1,178 | 27.6% |
| $150,000 to $199,999 | 188 | 4.4% |
| $200,000+ | 299 | 7.0% |
Family Income by Famaliy Size in Gibsonton
6-person families (215 | 5.0%) account for the highest median family income in Gibsonton with $134,821 per family, while 2-person families (1,539 | 36.0%) have the highest median income of $40,680 per family member.
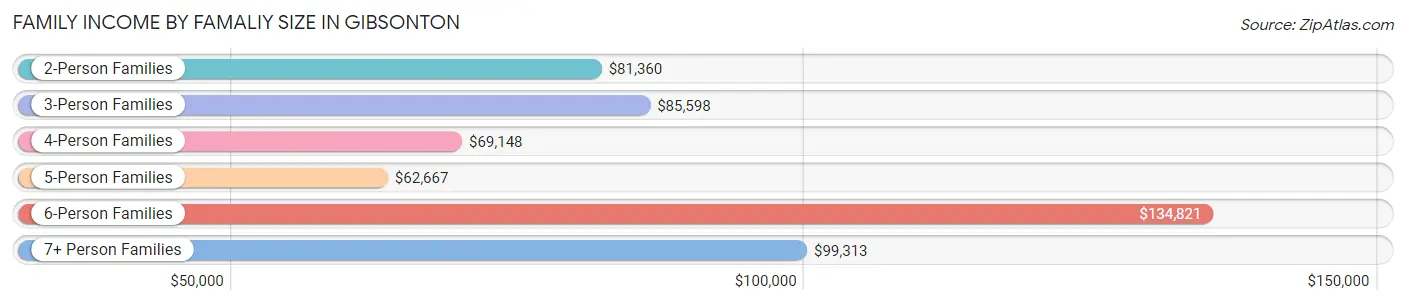
| Income Bracket | # Families | Median Income |
| 2-Person Families | 1,539 (36.0%) | $81,360 |
| 3-Person Families | 981 (23.0%) | $85,598 |
| 4-Person Families | 1,017 (23.8%) | $69,148 |
| 5-Person Families | 460 (10.8%) | $62,667 |
| 6-Person Families | 215 (5.0%) | $134,821 |
| 7+ Person Families | 57 (1.3%) | $99,313 |
| Total | 4,269 (100.0%) | $82,180 |
Family Income by Number of Earners in Gibsonton
The median family income in Gibsonton is $82,180, with families comprising 2 earners (1,874) having the highest median family income of $115,714, while families with no earners (464) have the lowest median family income of $16,507, accounting for 43.9% and 10.9% of families, respectively.
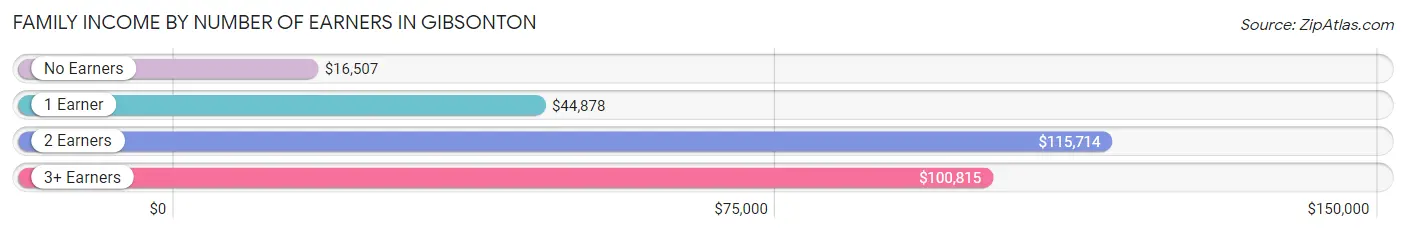
| Number of Earners | # Families | Median Income |
| No Earners | 464 (10.9%) | $16,507 |
| 1 Earner | 1,550 (36.3%) | $44,878 |
| 2 Earners | 1,874 (43.9%) | $115,714 |
| 3+ Earners | 381 (8.9%) | $100,815 |
| Total | 4,269 (100.0%) | $82,180 |
Household Income in Gibsonton
Household Income Brackets in Gibsonton
With 1,327 households falling in the category, the $100,000 to $149,999 income range is the most frequent in Gibsonton, accounting for 22.8% of all households. In contrast, only 262 households (4.5%) fall into the $10,000 to $14,999 income bracket, making it the least populous group.
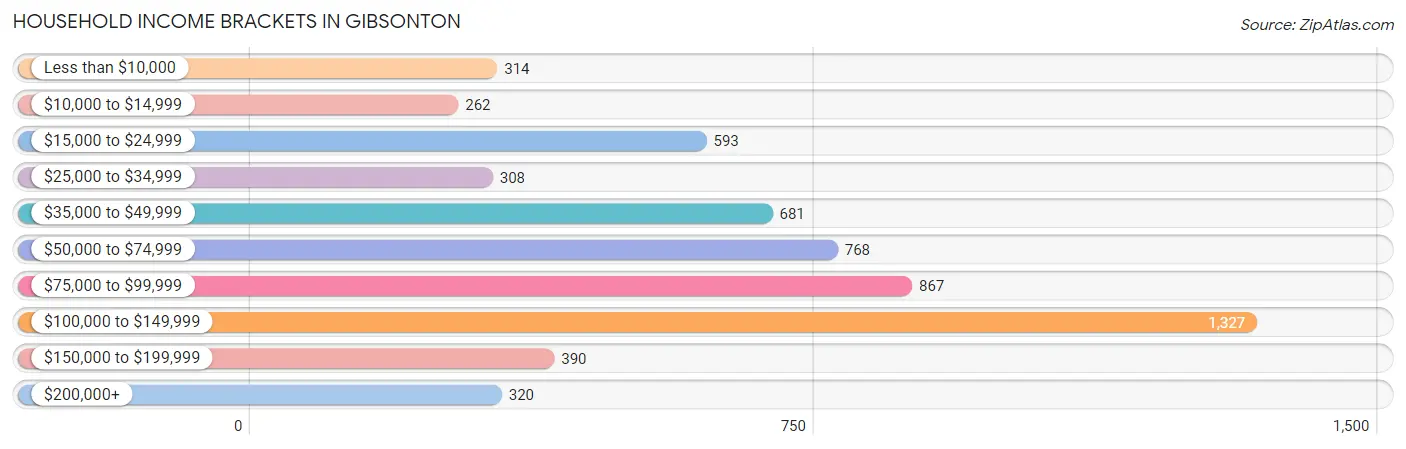
| Income Bracket | # Households | % Households |
| Less than $10,000 | 314 | 5.4% |
| $10,000 to $14,999 | 262 | 4.5% |
| $15,000 to $24,999 | 593 | 10.2% |
| $25,000 to $34,999 | 308 | 5.3% |
| $35,000 to $49,999 | 681 | 11.7% |
| $50,000 to $74,999 | 768 | 13.2% |
| $75,000 to $99,999 | 867 | 14.9% |
| $100,000 to $149,999 | 1,327 | 22.8% |
| $150,000 to $199,999 | 390 | 6.7% |
| $200,000+ | 320 | 5.5% |
Household Income by Householder Age in Gibsonton
The median household income in Gibsonton is $73,167, with the highest median household income of $88,401 found in the 45 to 64 years age bracket for the primary householder. A total of 2,185 households (37.6%) fall into this category. Meanwhile, the 65+ years age bracket for the primary householder has the lowest median household income of $36,341, with 753 households (12.9%) in this group.
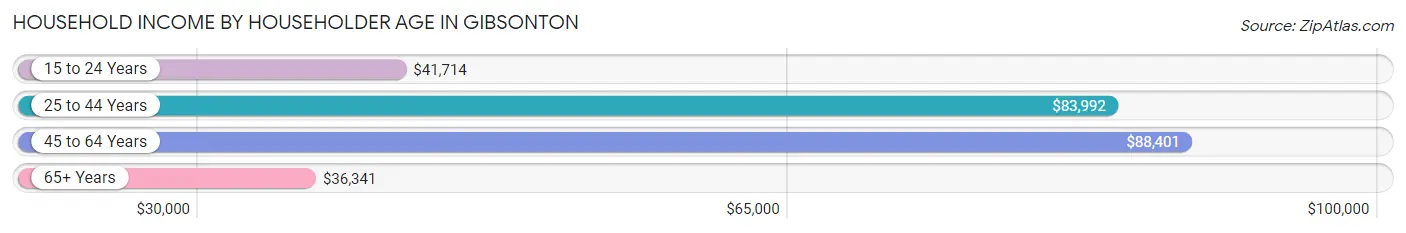
| Income Bracket | # Households | Median Income |
| 15 to 24 Years | 181 (3.1%) | $41,714 |
| 25 to 44 Years | 2,699 (46.4%) | $83,992 |
| 45 to 64 Years | 2,185 (37.6%) | $88,401 |
| 65+ Years | 753 (12.9%) | $36,341 |
| Total | 5,818 (100.0%) | $73,167 |
Poverty in Gibsonton
Income Below Poverty by Sex and Age in Gibsonton
With 17.1% poverty level for males and 24.7% for females among the residents of Gibsonton, 5 year old males and 5 year old females are the most vulnerable to poverty, with 47 males (50.5%) and 122 females (64.5%) in their respective age groups living below the poverty level.
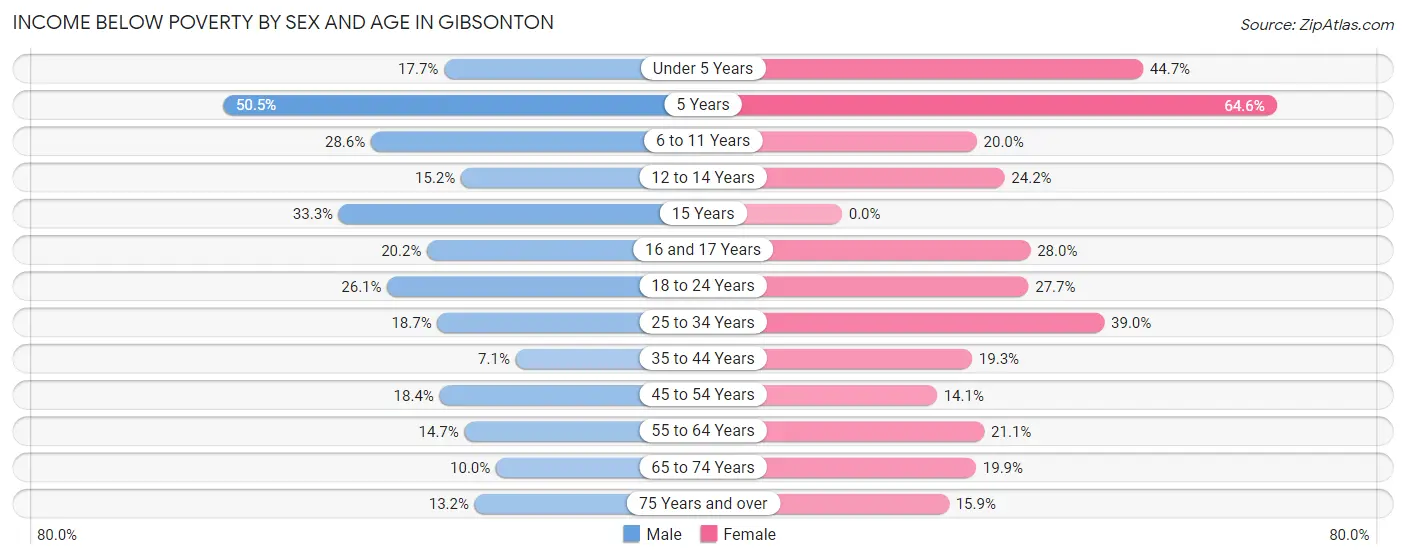
| Age Bracket | Male | Female |
| Under 5 Years | 103 (17.7%) | 228 (44.7%) |
| 5 Years | 47 (50.5%) | 122 (64.5%) |
| 6 to 11 Years | 239 (28.5%) | 166 (20.0%) |
| 12 to 14 Years | 112 (15.2%) | 184 (24.1%) |
| 15 Years | 17 (33.3%) | 0 (0.0%) |
| 16 and 17 Years | 58 (20.2%) | 129 (28.0%) |
| 18 to 24 Years | 167 (26.1%) | 182 (27.7%) |
| 25 to 34 Years | 222 (18.7%) | 402 (39.0%) |
| 35 to 44 Years | 114 (7.1%) | 341 (19.3%) |
| 45 to 54 Years | 217 (18.4%) | 150 (14.1%) |
| 55 to 64 Years | 106 (14.7%) | 204 (21.1%) |
| 65 to 74 Years | 54 (10.0%) | 91 (19.9%) |
| 75 Years and over | 28 (13.2%) | 44 (15.9%) |
| Total | 1,484 (17.1%) | 2,243 (24.7%) |
Income Above Poverty by Sex and Age in Gibsonton
According to the poverty statistics in Gibsonton, males aged 35 to 44 years and females aged 15 years are the age groups that are most secure financially, with 92.9% of males and 100.0% of females in these age groups living above the poverty line.
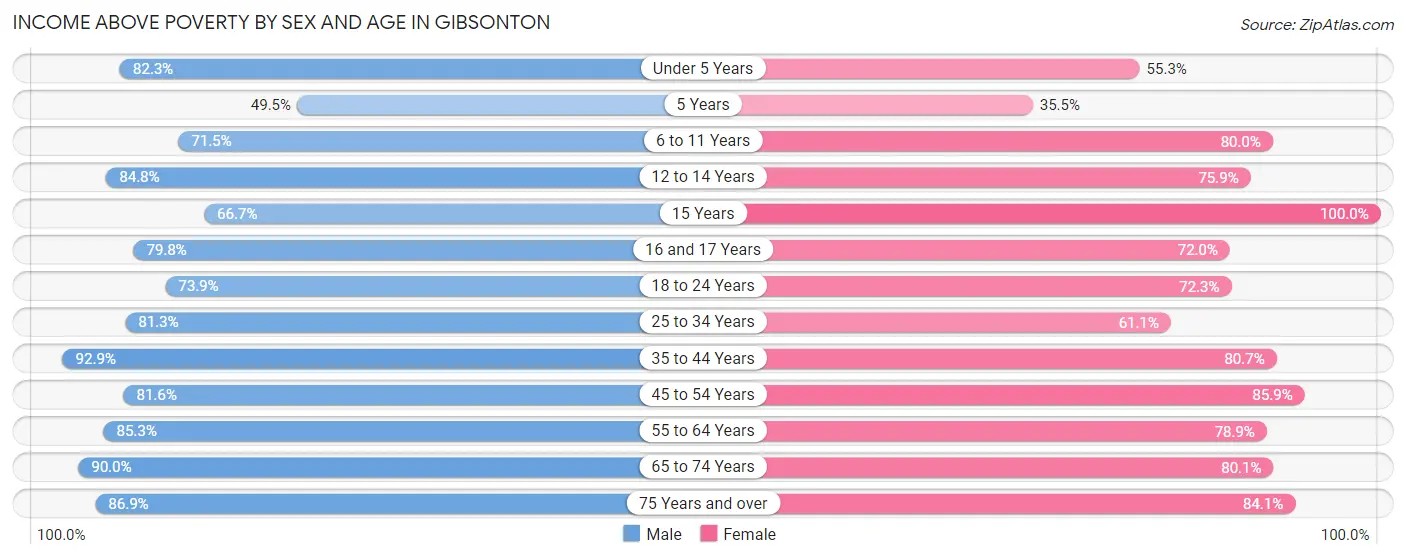
| Age Bracket | Male | Female |
| Under 5 Years | 479 (82.3%) | 282 (55.3%) |
| 5 Years | 46 (49.5%) | 67 (35.4%) |
| 6 to 11 Years | 598 (71.5%) | 663 (80.0%) |
| 12 to 14 Years | 626 (84.8%) | 578 (75.8%) |
| 15 Years | 34 (66.7%) | 125 (100.0%) |
| 16 and 17 Years | 229 (79.8%) | 332 (72.0%) |
| 18 to 24 Years | 472 (73.9%) | 475 (72.3%) |
| 25 to 34 Years | 966 (81.3%) | 630 (61.1%) |
| 35 to 44 Years | 1,498 (92.9%) | 1,424 (80.7%) |
| 45 to 54 Years | 964 (81.6%) | 914 (85.9%) |
| 55 to 64 Years | 617 (85.3%) | 761 (78.9%) |
| 65 to 74 Years | 487 (90.0%) | 366 (80.1%) |
| 75 Years and over | 185 (86.9%) | 233 (84.1%) |
| Total | 7,201 (82.9%) | 6,850 (75.3%) |
Income Below Poverty Among Married-Couple Families in Gibsonton
The poverty statistics for married-couple families in Gibsonton show that 8.9% or 257 of the total 2,878 families live below the poverty line. Families with 1 or 2 children have the highest poverty rate of 11.2%, comprising of 121 families. On the other hand, families with 5 or more children have the lowest poverty rate of 0.0%, which includes 0 families.
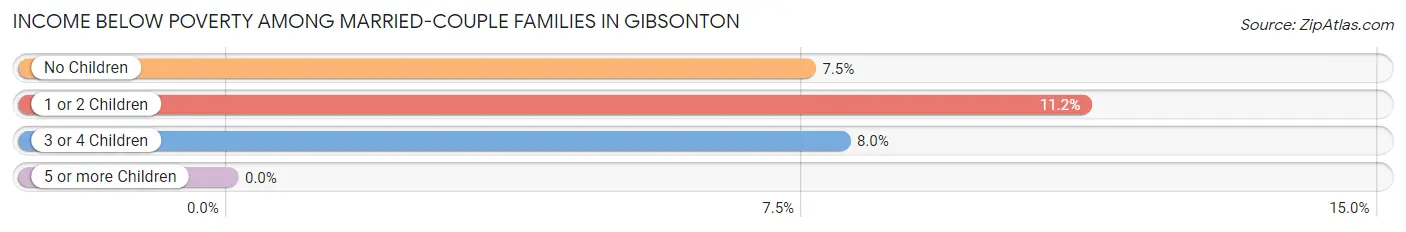
| Children | Above Poverty | Below Poverty |
| No Children | 1,313 (92.5%) | 107 (7.5%) |
| 1 or 2 Children | 964 (88.8%) | 121 (11.2%) |
| 3 or 4 Children | 334 (92.0%) | 29 (8.0%) |
| 5 or more Children | 10 (100.0%) | 0 (0.0%) |
| Total | 2,621 (91.1%) | 257 (8.9%) |
Income Below Poverty Among Single-Parent Households in Gibsonton
According to the poverty data in Gibsonton, 45.3% or 206 single-father households and 37.4% or 350 single-mother households are living below the poverty line. Among single-father households, those with 5 or more children have the highest poverty rate, with 14 households (100.0%) experiencing poverty. Likewise, among single-mother households, those with 5 or more children have the highest poverty rate, with 13 households (100.0%) falling below the poverty line.
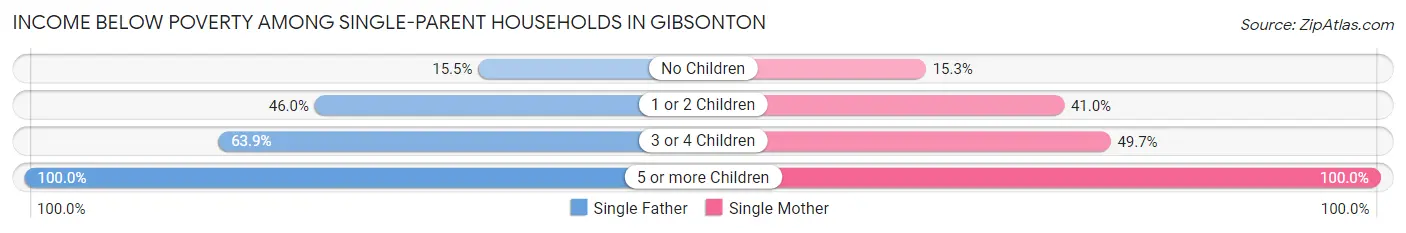
| Children | Single Father | Single Mother |
| No Children | 11 (15.5%) | 33 (15.3%) |
| 1 or 2 Children | 142 (46.0%) | 224 (41.0%) |
| 3 or 4 Children | 39 (63.9%) | 80 (49.7%) |
| 5 or more Children | 14 (100.0%) | 13 (100.0%) |
| Total | 206 (45.3%) | 350 (37.4%) |
Income Below Poverty Among Married-Couple vs Single-Parent Households in Gibsonton
The poverty data for Gibsonton shows that 257 of the married-couple family households (8.9%) and 556 of the single-parent households (40.0%) are living below the poverty level. Within the married-couple family households, those with 1 or 2 children have the highest poverty rate, with 121 households (11.2%) falling below the poverty line. Among the single-parent households, those with 5 or more children have the highest poverty rate, with 27 household (100.0%) living below poverty.
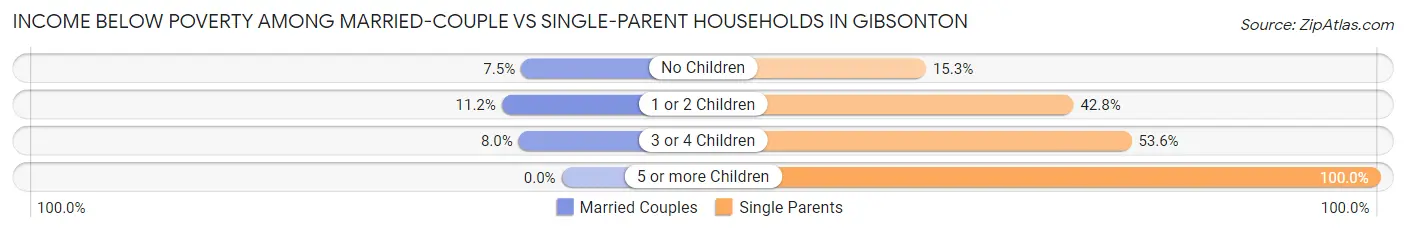
| Children | Married-Couple Families | Single-Parent Households |
| No Children | 107 (7.5%) | 44 (15.3%) |
| 1 or 2 Children | 121 (11.2%) | 366 (42.8%) |
| 3 or 4 Children | 29 (8.0%) | 119 (53.6%) |
| 5 or more Children | 0 (0.0%) | 27 (100.0%) |
| Total | 257 (8.9%) | 556 (40.0%) |
Race in Gibsonton
The most populous races in Gibsonton are White / Caucasian (9,279 | 51.9%), Hispanic or Latino (6,557 | 36.7%), and Two or more Races (3,600 | 20.1%).
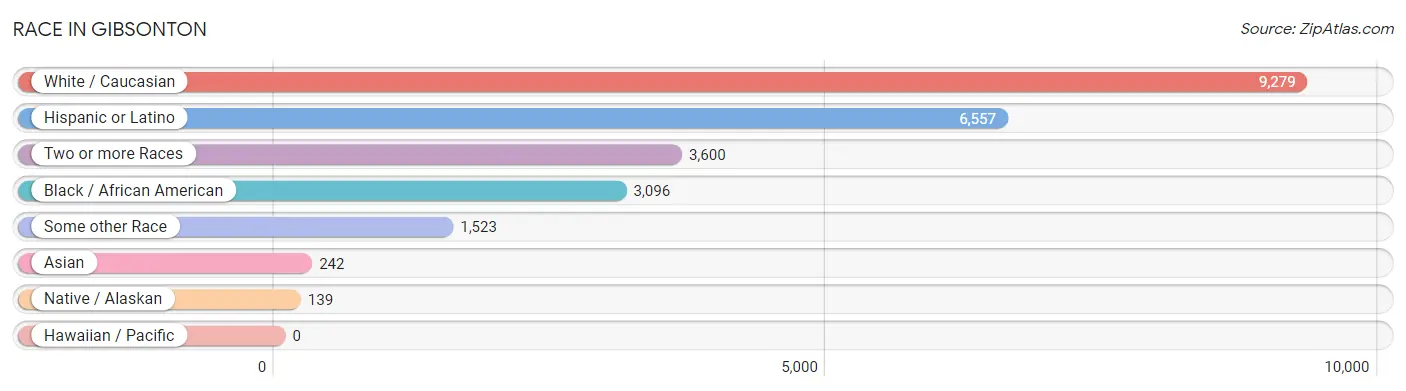
| Race | # Population | % Population |
| Asian | 242 | 1.3% |
| Black / African American | 3,096 | 17.3% |
| Hawaiian / Pacific | 0 | 0.0% |
| Hispanic or Latino | 6,557 | 36.7% |
| Native / Alaskan | 139 | 0.8% |
| White / Caucasian | 9,279 | 51.9% |
| Two or more Races | 3,600 | 20.1% |
| Some other Race | 1,523 | 8.5% |
| Total | 17,879 | 100.0% |
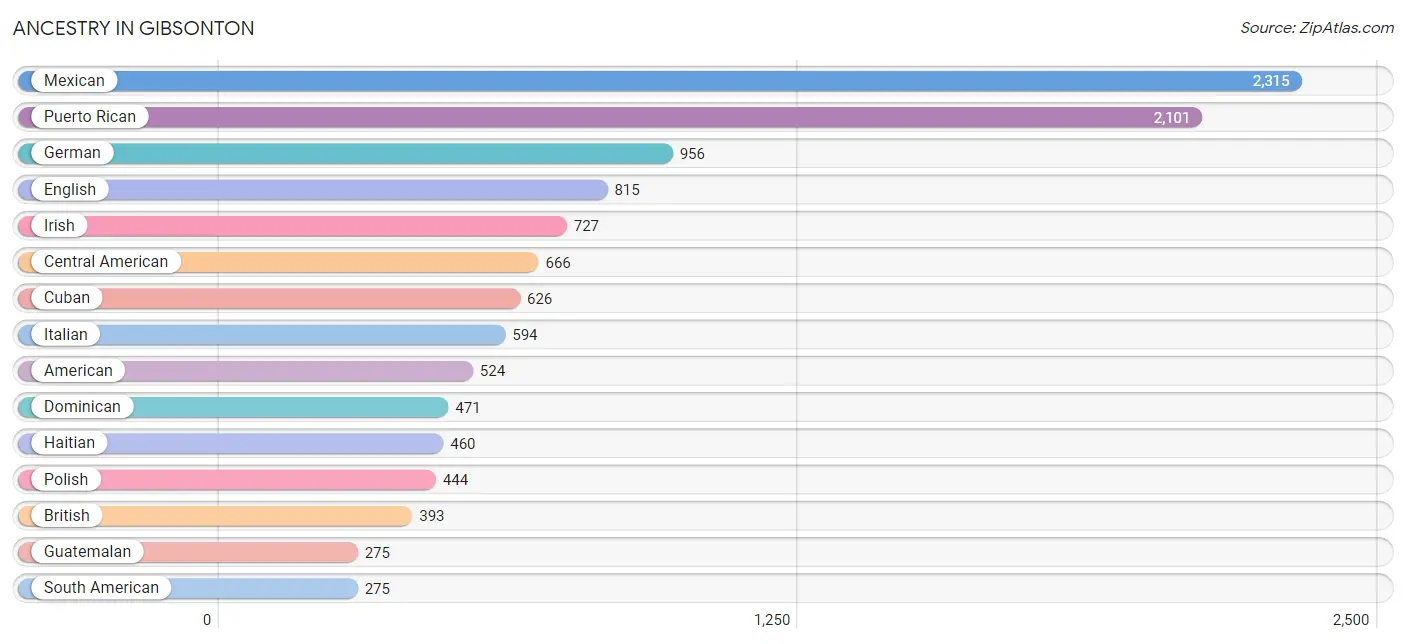
Ancestry in Gibsonton
The most populous ancestries reported in Gibsonton are Mexican (2,315 | 13.0%), Puerto Rican (2,101 | 11.7%), German (956 | 5.3%), English (815 | 4.6%), and Irish (727 | 4.1%), together accounting for 38.7% of all Gibsonton residents.
| Ancestry | # Population | % Population |
| African | 148 | 0.8% |
| American | 524 | 2.9% |
| Apache | 23 | 0.1% |
| Arab | 3 | 0.0% |
| Argentinean | 19 | 0.1% |
| Austrian | 31 | 0.2% |
| Belizean | 28 | 0.2% |
| Bhutanese | 59 | 0.3% |
| Blackfeet | 35 | 0.2% |
| British | 393 | 2.2% |
| British West Indian | 186 | 1.0% |
| Central American | 666 | 3.7% |
| Central American Indian | 62 | 0.4% |
| Cherokee | 34 | 0.2% |
| Choctaw | 20 | 0.1% |
| Colombian | 162 | 0.9% |
| Costa Rican | 62 | 0.4% |
| Cuban | 626 | 3.5% |
| Czechoslovakian | 52 | 0.3% |
| Dominican | 471 | 2.6% |
| Dutch | 22 | 0.1% |
| Eastern European | 49 | 0.3% |
| Ecuadorian | 36 | 0.2% |
| English | 815 | 4.6% |
| European | 61 | 0.3% |
| Finnish | 58 | 0.3% |
| French | 154 | 0.9% |
| French Canadian | 110 | 0.6% |
| German | 956 | 5.3% |
| Greek | 64 | 0.4% |
| Guatemalan | 275 | 1.5% |
| Guyanese | 59 | 0.3% |
| Haitian | 460 | 2.6% |
| Honduran | 46 | 0.3% |
| Indian (Asian) | 154 | 0.9% |
| Irish | 727 | 4.1% |
| Italian | 594 | 3.3% |
| Jamaican | 66 | 0.4% |
| Korean | 180 | 1.0% |
| Mexican | 2,315 | 13.0% |
| Navajo | 17 | 0.1% |
| Nicaraguan | 178 | 1.0% |
| Nigerian | 80 | 0.4% |
| Norwegian | 12 | 0.1% |
| Pakistani | 40 | 0.2% |
| Panamanian | 63 | 0.4% |
| Peruvian | 8 | 0.0% |
| Polish | 444 | 2.5% |
| Portuguese | 155 | 0.9% |
| Puerto Rican | 2,101 | 11.7% |
| Russian | 12 | 0.1% |
| Salvadoran | 42 | 0.2% |
| Scandinavian | 76 | 0.4% |
| Scotch-Irish | 33 | 0.2% |
| Scottish | 100 | 0.6% |
| Slovak | 15 | 0.1% |
| South American | 275 | 1.5% |
| Spaniard | 95 | 0.5% |
| Sri Lankan | 11 | 0.1% |
| Subsaharan African | 228 | 1.3% |
| Swiss | 15 | 0.1% |
| Thai | 34 | 0.2% |
| Trinidadian and Tobagonian | 17 | 0.1% |
| Venezuelan | 50 | 0.3% |
| Welsh | 26 | 0.2% |
| West Indian | 50 | 0.3% | View All 66 Rows |
Immigrants in Gibsonton
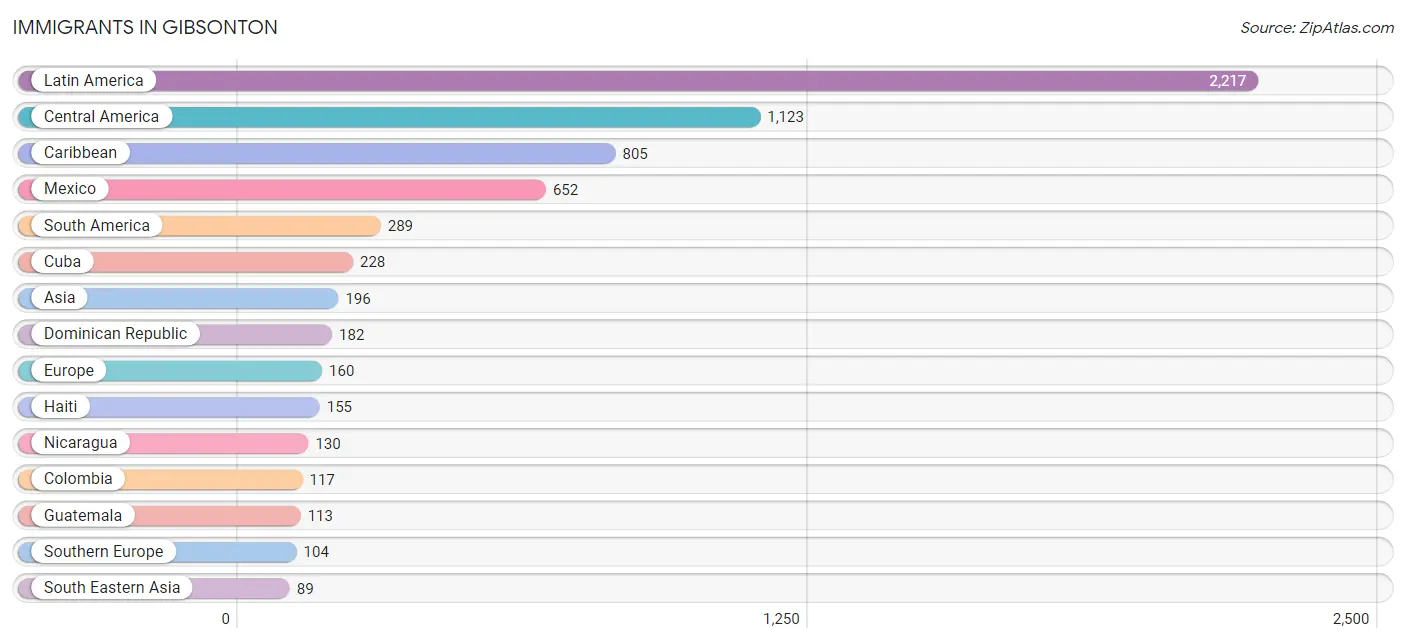
The most numerous immigrant groups reported in Gibsonton came from Latin America (2,217 | 12.4%), Central America (1,123 | 6.3%), Caribbean (805 | 4.5%), Mexico (652 | 3.6%), and South America (289 | 1.6%), together accounting for 28.4% of all Gibsonton residents.
| Immigration Origin | # Population | % Population |
| Africa | 81 | 0.4% |
| Argentina | 19 | 0.1% |
| Asia | 196 | 1.1% |
| Canada | 51 | 0.3% |
| Caribbean | 805 | 4.5% |
| Central America | 1,123 | 6.3% |
| China | 60 | 0.3% |
| Colombia | 117 | 0.6% |
| Costa Rica | 62 | 0.4% |
| Cuba | 228 | 1.3% |
| Dominican Republic | 182 | 1.0% |
| Eastern Africa | 13 | 0.1% |
| Eastern Asia | 87 | 0.5% |
| Eastern Europe | 12 | 0.1% |
| Ecuador | 36 | 0.2% |
| El Salvador | 88 | 0.5% |
| Europe | 160 | 0.9% |
| Germany | 44 | 0.3% |
| Greece | 50 | 0.3% |
| Grenada | 69 | 0.4% |
| Guatemala | 113 | 0.6% |
| Guyana | 59 | 0.3% |
| Haiti | 155 | 0.9% |
| Honduras | 15 | 0.1% |
| India | 17 | 0.1% |
| Jamaica | 48 | 0.3% |
| Japan | 27 | 0.2% |
| Latin America | 2,217 | 12.4% |
| Mexico | 652 | 3.6% |
| Nicaragua | 130 | 0.7% |
| Nigeria | 68 | 0.4% |
| Panama | 63 | 0.4% |
| Peru | 8 | 0.0% |
| Philippines | 46 | 0.3% |
| Portugal | 47 | 0.3% |
| Russia | 12 | 0.1% |
| South America | 289 | 1.6% |
| South Central Asia | 17 | 0.1% |
| South Eastern Asia | 89 | 0.5% |
| Southern Europe | 104 | 0.6% |
| Spain | 7 | 0.0% |
| St. Vincent and the Grenadines | 26 | 0.2% |
| Syria | 3 | 0.0% |
| Thailand | 32 | 0.2% |
| Trinidad and Tobago | 17 | 0.1% |
| Venezuela | 50 | 0.3% |
| Vietnam | 11 | 0.1% |
| Western Africa | 68 | 0.4% |
| Western Asia | 3 | 0.0% |
| Western Europe | 44 | 0.3% | View All 50 Rows |
Sex and Age in Gibsonton
Sex and Age in Gibsonton
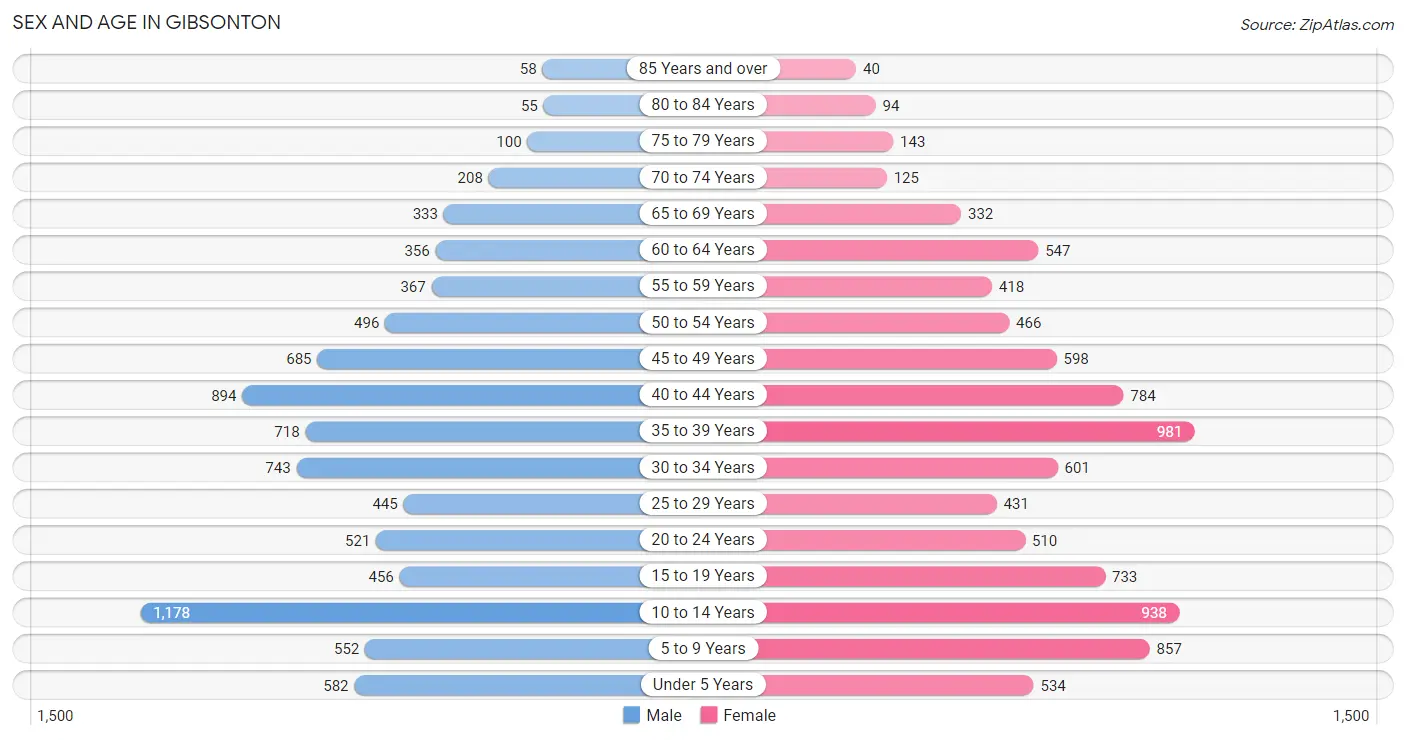
The most populous age groups in Gibsonton are 10 to 14 Years (1,178 | 13.5%) for men and 35 to 39 Years (981 | 10.7%) for women.
| Age Bracket | Male | Female |
| Under 5 Years | 582 (6.7%) | 534 (5.9%) |
| 5 to 9 Years | 552 (6.3%) | 857 (9.4%) |
| 10 to 14 Years | 1,178 (13.5%) | 938 (10.3%) |
| 15 to 19 Years | 456 (5.2%) | 733 (8.0%) |
| 20 to 24 Years | 521 (6.0%) | 510 (5.6%) |
| 25 to 29 Years | 445 (5.1%) | 431 (4.7%) |
| 30 to 34 Years | 743 (8.5%) | 601 (6.6%) |
| 35 to 39 Years | 718 (8.2%) | 981 (10.7%) |
| 40 to 44 Years | 894 (10.2%) | 784 (8.6%) |
| 45 to 49 Years | 685 (7.8%) | 598 (6.6%) |
| 50 to 54 Years | 496 (5.7%) | 466 (5.1%) |
| 55 to 59 Years | 367 (4.2%) | 418 (4.6%) |
| 60 to 64 Years | 356 (4.1%) | 547 (6.0%) |
| 65 to 69 Years | 333 (3.8%) | 332 (3.6%) |
| 70 to 74 Years | 208 (2.4%) | 125 (1.4%) |
| 75 to 79 Years | 100 (1.1%) | 143 (1.6%) |
| 80 to 84 Years | 55 (0.6%) | 94 (1.0%) |
| 85 Years and over | 58 (0.7%) | 40 (0.4%) |
| Total | 8,747 (100.0%) | 9,132 (100.0%) |
Families and Households in Gibsonton
Median Family Size in Gibsonton
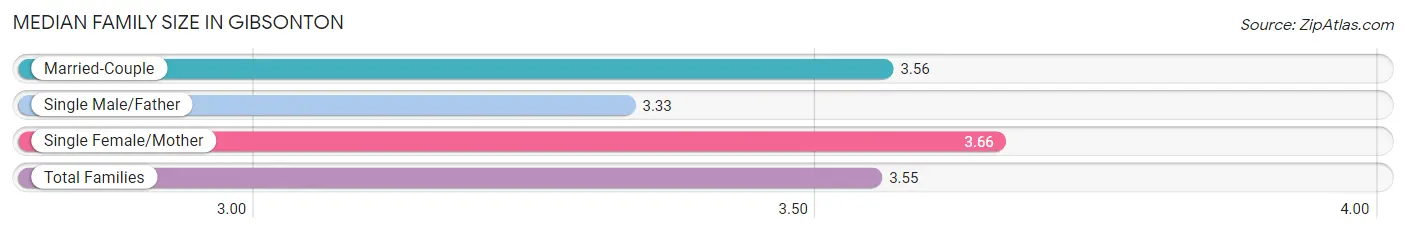
The median family size in Gibsonton is 3.55 persons per family, with single female/mother families (936 | 21.9%) accounting for the largest median family size of 3.66 persons per family. On the other hand, single male/father families (455 | 10.7%) represent the smallest median family size with 3.33 persons per family.
| Family Type | # Families | Family Size |
| Married-Couple | 2,878 (67.4%) | 3.56 |
| Single Male/Father | 455 (10.7%) | 3.33 |
| Single Female/Mother | 936 (21.9%) | 3.66 |
| Total Families | 4,269 (100.0%) | 3.55 |
Median Household Size in Gibsonton
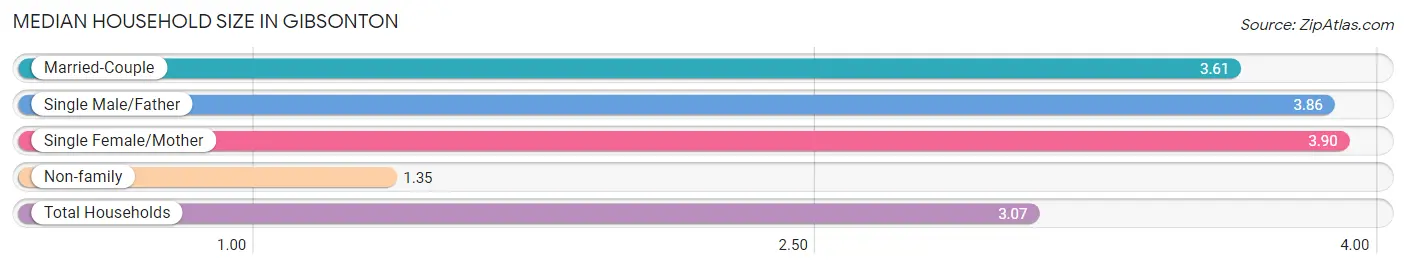
The median household size in Gibsonton is 3.07 persons per household, with single female/mother households (936 | 16.1%) accounting for the largest median household size of 3.9 persons per household. non-family households (1,549 | 26.6%) represent the smallest median household size with 1.35 persons per household.
| Household Type | # Households | Household Size |
| Married-Couple | 2,878 (49.5%) | 3.61 |
| Single Male/Father | 455 (7.8%) | 3.86 |
| Single Female/Mother | 936 (16.1%) | 3.90 |
| Non-family | 1,549 (26.6%) | 1.35 |
| Total Households | 5,818 (100.0%) | 3.07 |
Household Size by Marriage Status in Gibsonton
Out of a total of 5,818 households in Gibsonton, 4,269 (73.4%) are family households, while 1,549 (26.6%) are nonfamily households. The most numerous type of family households are 2-person households, comprising 1,380, and the most common type of nonfamily households are 1-person households, comprising 1,110.
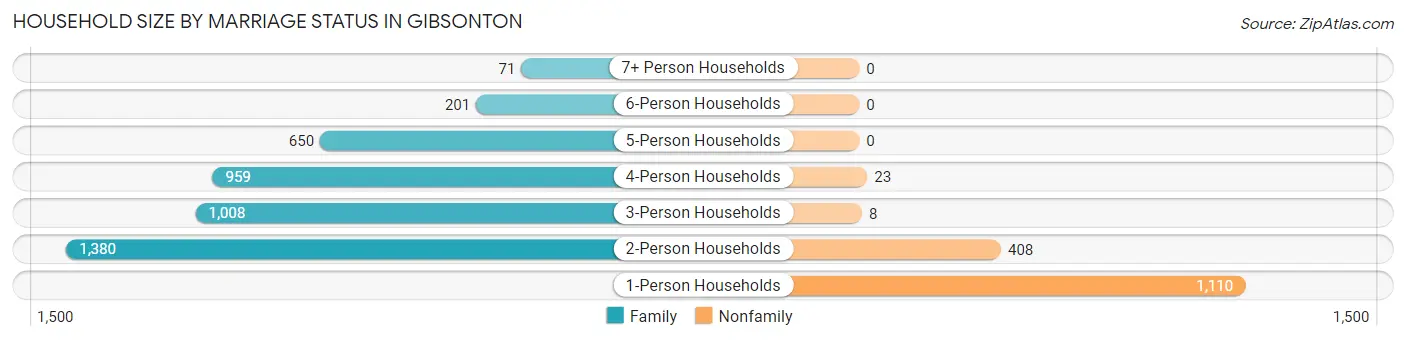
| Household Size | Family Households | Nonfamily Households |
| 1-Person Households | - | 1,110 (19.1%) |
| 2-Person Households | 1,380 (23.7%) | 408 (7.0%) |
| 3-Person Households | 1,008 (17.3%) | 8 (0.1%) |
| 4-Person Households | 959 (16.5%) | 23 (0.4%) |
| 5-Person Households | 650 (11.2%) | 0 (0.0%) |
| 6-Person Households | 201 (3.5%) | 0 (0.0%) |
| 7+ Person Households | 71 (1.2%) | 0 (0.0%) |
| Total | 4,269 (73.4%) | 1,549 (26.6%) |
Female Fertility in Gibsonton
Fertility by Age in Gibsonton
Average fertility rate in Gibsonton is 32.0 births per 1,000 women. Women in the age bracket of 20 to 34 years have the highest fertility rate with 88.0 births per 1,000 women. Women in the age bracket of 20 to 34 years acount for 88.8% of all women with births.
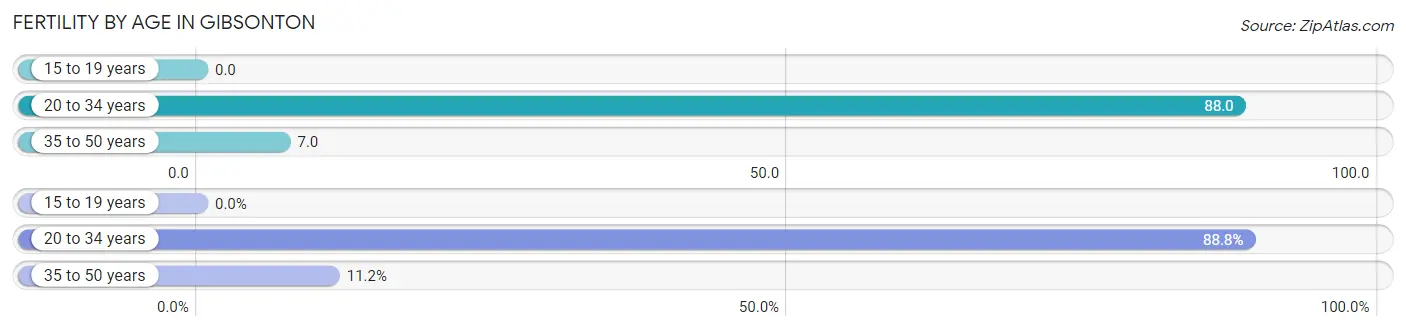
| Age Bracket | Women with Births | Births / 1,000 Women |
| 15 to 19 years | 0 (0.0%) | 0.0 |
| 20 to 34 years | 135 (88.8%) | 88.0 |
| 35 to 50 years | 17 (11.2%) | 7.0 |
| Total | 152 (100.0%) | 32.0 |
Fertility by Age by Marriage Status in Gibsonton
38.2% of women with births (152) in Gibsonton are married. The highest percentage of unmarried women with births falls into 20 to 34 years age bracket with 69.6% of them unmarried at the time of birth, while the lowest percentage of unmarried women with births belong to 35 to 50 years age bracket with 0.0% of them unmarried.
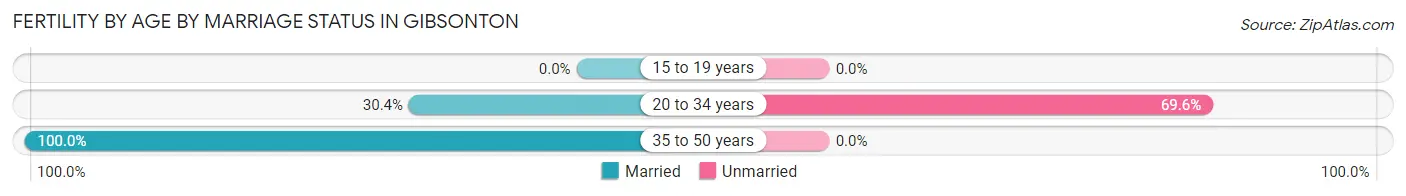
| Age Bracket | Married | Unmarried |
| 15 to 19 years | 0 (0.0%) | 0 (0.0%) |
| 20 to 34 years | 41 (30.4%) | 94 (69.6%) |
| 35 to 50 years | 17 (100.0%) | 0 (0.0%) |
| Total | 58 (38.2%) | 94 (61.8%) |
Fertility by Education in Gibsonton
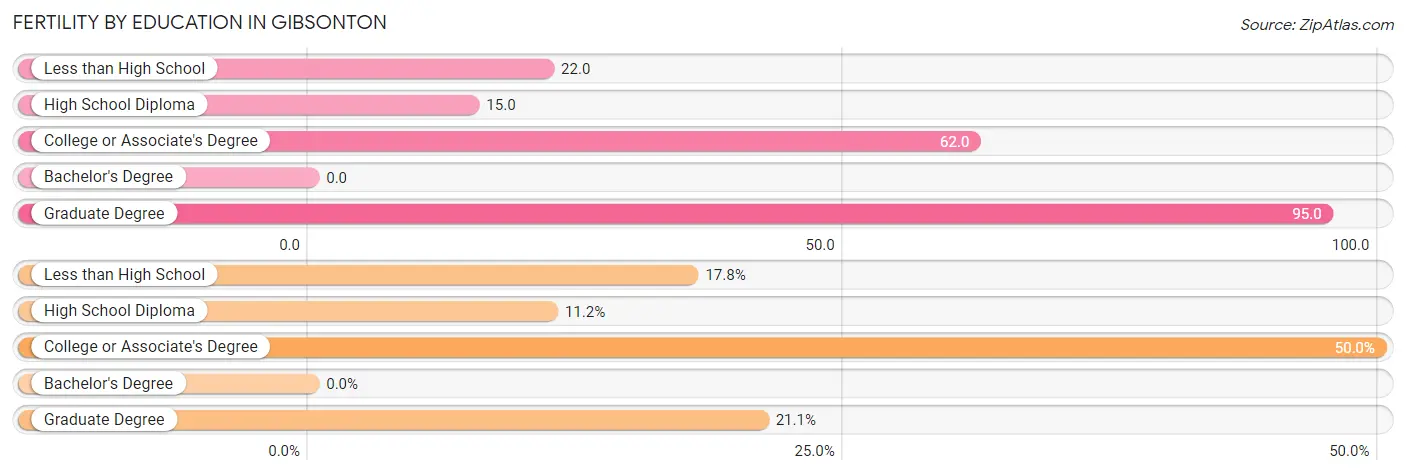
| Educational Attainment | Women with Births | Births / 1,000 Women |
| Less than High School | 27 (17.8%) | 22.0 |
| High School Diploma | 17 (11.2%) | 15.0 |
| College or Associate's Degree | 76 (50.0%) | 62.0 |
| Bachelor's Degree | 0 (0.0%) | 0.0 |
| Graduate Degree | 32 (21.0%) | 95.0 |
| Total | 152 (100.0%) | 32.0 |
Fertility by Education by Marriage Status in Gibsonton
61.8% of women with births in Gibsonton are unmarried. Women with the educational attainment of high school diploma are most likely to be married with 100.0% of them married at childbirth, while women with the educational attainment of less than high school are least likely to be married with 100.0% of them unmarried at childbirth.
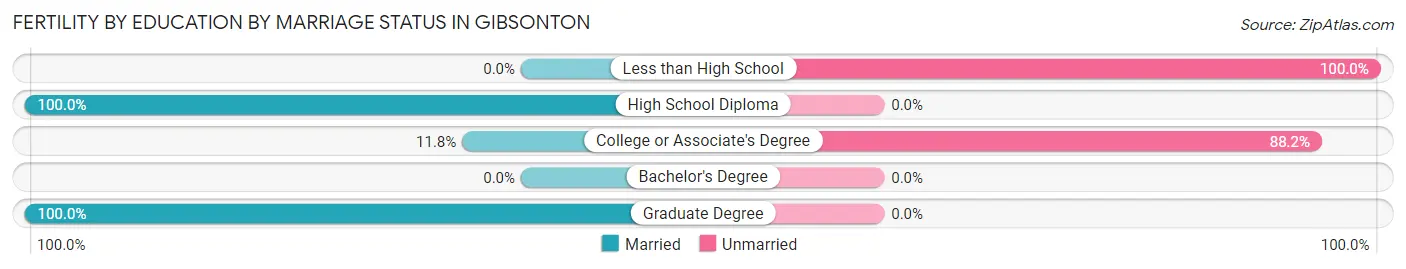
| Educational Attainment | Married | Unmarried |
| Less than High School | 0 (0.0%) | 27 (100.0%) |
| High School Diploma | 17 (100.0%) | 0 (0.0%) |
| College or Associate's Degree | 9 (11.8%) | 67 (88.2%) |
| Bachelor's Degree | 0 (0.0%) | 0 (0.0%) |
| Graduate Degree | 32 (100.0%) | 0 (0.0%) |
| Total | 58 (38.2%) | 94 (61.8%) |
Employment Characteristics in Gibsonton
Employment by Class of Employer in Gibsonton
Among the 8,340 employed individuals in Gibsonton, private company employees (6,030 | 72.3%), self-employed (not incorporated) (714 | 8.6%), and local government employees (473 | 5.7%) make up the most common classes of employment.
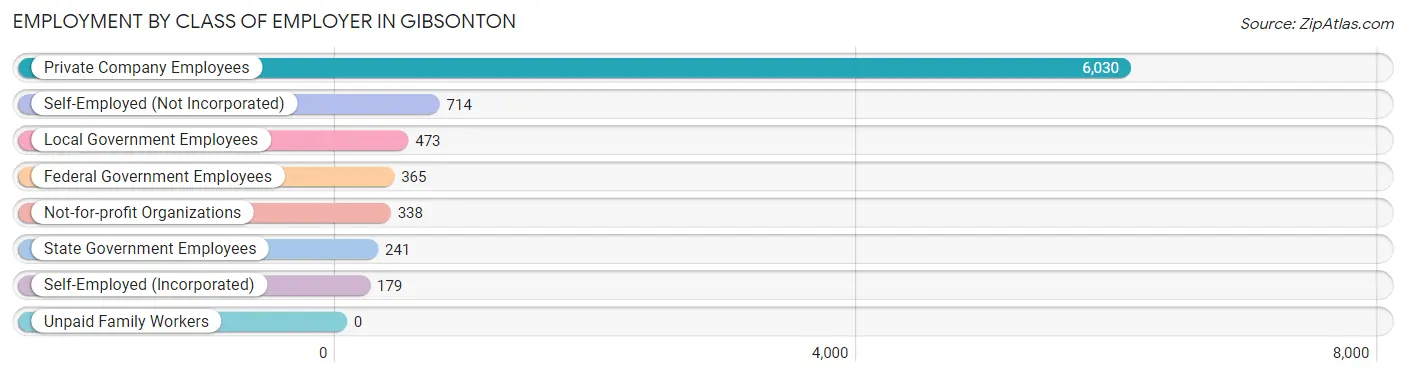
| Employer Class | # Employees | % Employees |
| Private Company Employees | 6,030 | 72.3% |
| Self-Employed (Incorporated) | 179 | 2.1% |
| Self-Employed (Not Incorporated) | 714 | 8.6% |
| Not-for-profit Organizations | 338 | 4.1% |
| Local Government Employees | 473 | 5.7% |
| State Government Employees | 241 | 2.9% |
| Federal Government Employees | 365 | 4.4% |
| Unpaid Family Workers | 0 | 0.0% |
| Total | 8,340 | 100.0% |
Employment Status by Age in Gibsonton
According to the labor force statistics for Gibsonton, out of the total population over 16 years of age (13,062), 68.8% or 8,987 individuals are in the labor force, with 6.2% or 557 of them unemployed. The age group with the highest labor force participation rate is 45 to 54 years, with 87.6% or 1,967 individuals in the labor force. Within the labor force, the 25 to 29 years age range has the highest percentage of unemployed individuals, with 19.7% or 146 of them being unemployed.
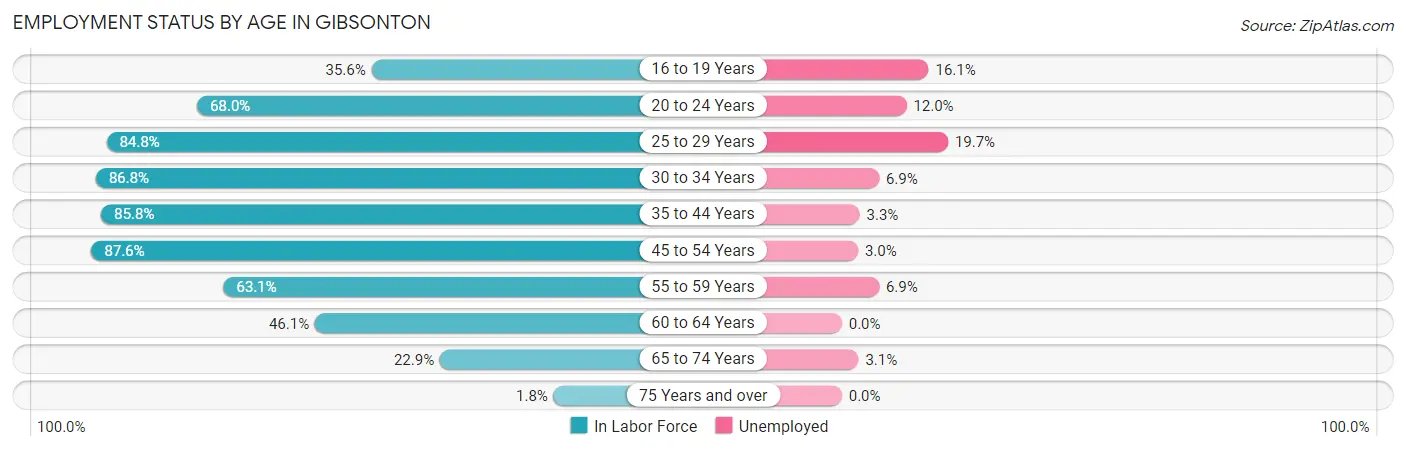
| Age Bracket | In Labor Force | Unemployed |
| 16 to 19 Years | 361 (35.6%) | 58 (16.1%) |
| 20 to 24 Years | 701 (68.0%) | 84 (12.0%) |
| 25 to 29 Years | 743 (84.8%) | 146 (19.7%) |
| 30 to 34 Years | 1,167 (86.8%) | 81 (6.9%) |
| 35 to 44 Years | 2,897 (85.8%) | 96 (3.3%) |
| 45 to 54 Years | 1,967 (87.6%) | 59 (3.0%) |
| 55 to 59 Years | 495 (63.1%) | 34 (6.9%) |
| 60 to 64 Years | 416 (46.1%) | 0 (0.0%) |
| 65 to 74 Years | 229 (22.9%) | 7 (3.1%) |
| 75 Years and over | 9 (1.8%) | 0 (0.0%) |
| Total | 8,987 (68.8%) | 557 (6.2%) |
Employment Status by Educational Attainment in Gibsonton
According to labor force statistics for Gibsonton, 80.6% of individuals (7,681) out of the total population between 25 and 64 years of age (9,530) are in the labor force, with 5.4% or 415 of them being unemployed. The group with the highest labor force participation rate are those with the educational attainment of bachelor's degree or higher, with 92.3% or 1,965 individuals in the labor force. Within the labor force, individuals with less than high school education have the highest percentage of unemployment, with 8.5% or 95 of them being unemployed.
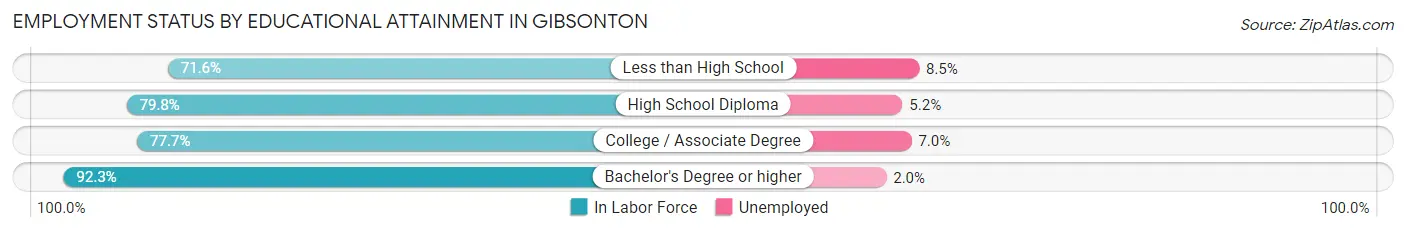
| Educational Attainment | In Labor Force | Unemployed |
| Less than High School | 1,121 (71.6%) | 133 (8.5%) |
| High School Diploma | 2,511 (79.8%) | 164 (5.2%) |
| College / Associate Degree | 2,089 (77.7%) | 188 (7.0%) |
| Bachelor's Degree or higher | 1,965 (92.3%) | 43 (2.0%) |
| Total | 7,681 (80.6%) | 515 (5.4%) |
Employment Occupations by Sex in Gibsonton
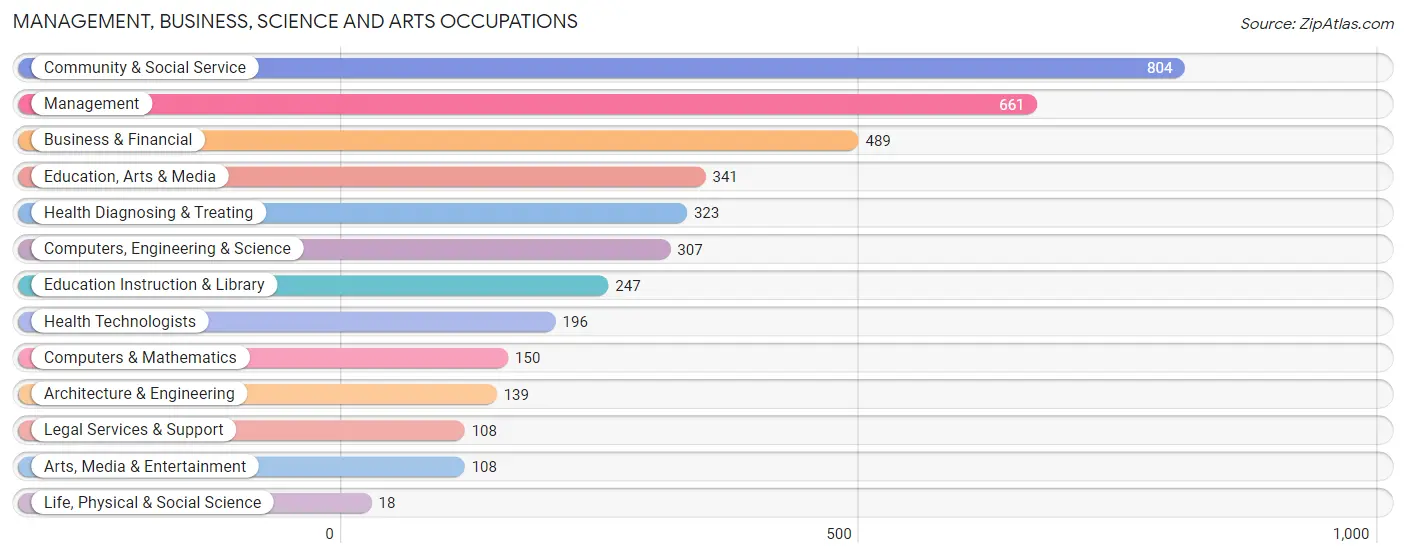
Management, Business, Science and Arts Occupations
The most common Management, Business, Science and Arts occupations in Gibsonton are Community & Social Service (804 | 9.7%), Management (661 | 8.0%), Business & Financial (489 | 5.9%), Education, Arts & Media (341 | 4.1%), and Health Diagnosing & Treating (323 | 3.9%).
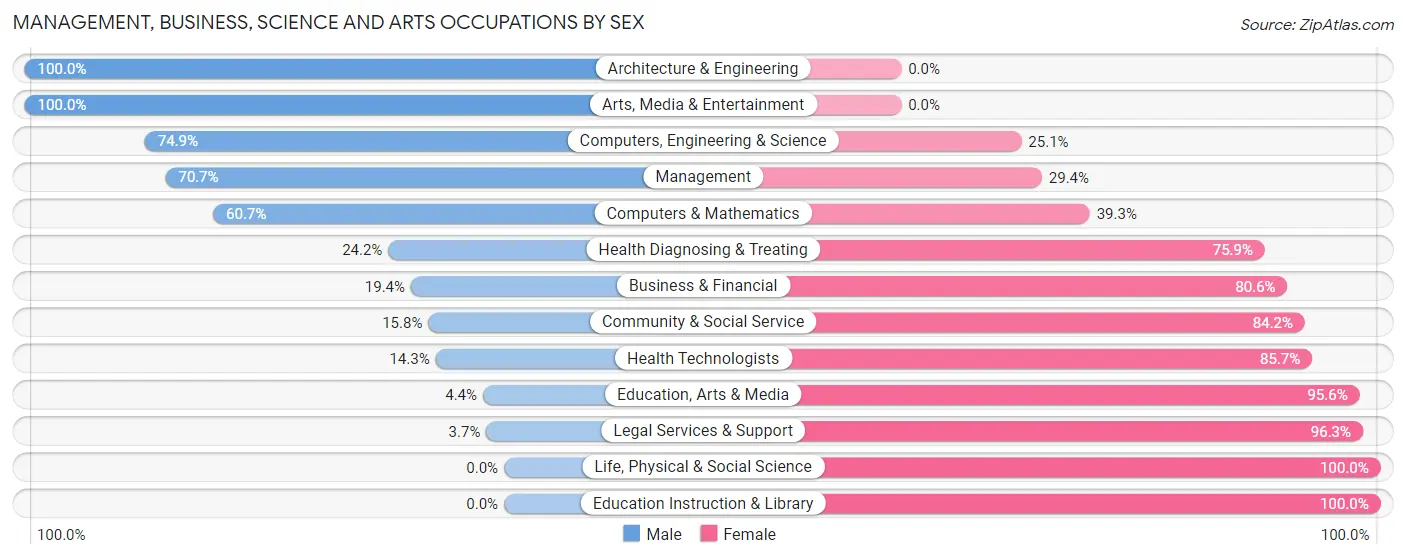
Management, Business, Science and Arts Occupations by Sex
Within the Management, Business, Science and Arts occupations in Gibsonton, the most male-oriented occupations are Architecture & Engineering (100.0%), Arts, Media & Entertainment (100.0%), and Computers, Engineering & Science (74.9%), while the most female-oriented occupations are Life, Physical & Social Science (100.0%), Education Instruction & Library (100.0%), and Legal Services & Support (96.3%).
| Occupation | Male | Female |
| Management | 467 (70.7%) | 194 (29.3%) |
| Business & Financial | 95 (19.4%) | 394 (80.6%) |
| Computers, Engineering & Science | 230 (74.9%) | 77 (25.1%) |
| Computers & Mathematics | 91 (60.7%) | 59 (39.3%) |
| Architecture & Engineering | 139 (100.0%) | 0 (0.0%) |
| Life, Physical & Social Science | 0 (0.0%) | 18 (100.0%) |
| Community & Social Service | 127 (15.8%) | 677 (84.2%) |
| Education, Arts & Media | 15 (4.4%) | 326 (95.6%) |
| Legal Services & Support | 4 (3.7%) | 104 (96.3%) |
| Education Instruction & Library | 0 (0.0%) | 247 (100.0%) |
| Arts, Media & Entertainment | 108 (100.0%) | 0 (0.0%) |
| Health Diagnosing & Treating | 78 (24.1%) | 245 (75.8%) |
| Health Technologists | 28 (14.3%) | 168 (85.7%) |
| Total (Category) | 997 (38.6%) | 1,587 (61.4%) |
| Total (Overall) | 4,457 (53.7%) | 3,838 (46.3%) |
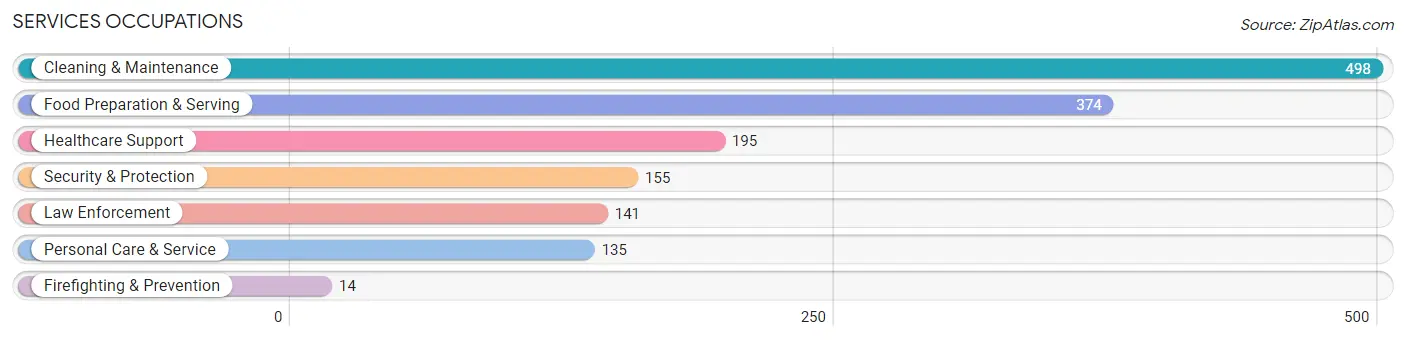
Services Occupations
The most common Services occupations in Gibsonton are Cleaning & Maintenance (498 | 6.0%), Food Preparation & Serving (374 | 4.5%), Healthcare Support (195 | 2.4%), Security & Protection (155 | 1.9%), and Law Enforcement (141 | 1.7%).
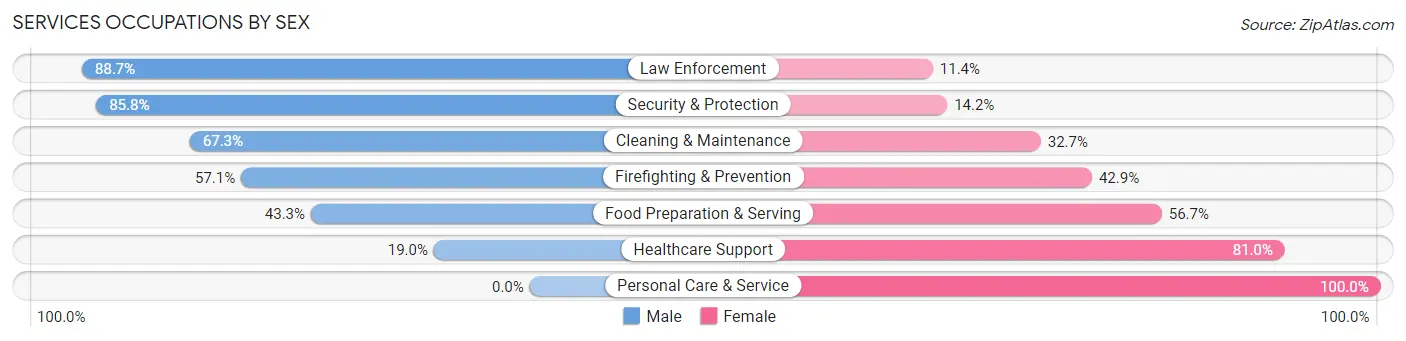
Services Occupations by Sex
Within the Services occupations in Gibsonton, the most male-oriented occupations are Law Enforcement (88.6%), Security & Protection (85.8%), and Cleaning & Maintenance (67.3%), while the most female-oriented occupations are Personal Care & Service (100.0%), Healthcare Support (81.0%), and Food Preparation & Serving (56.7%).
| Occupation | Male | Female |
| Healthcare Support | 37 (19.0%) | 158 (81.0%) |
| Security & Protection | 133 (85.8%) | 22 (14.2%) |
| Firefighting & Prevention | 8 (57.1%) | 6 (42.9%) |
| Law Enforcement | 125 (88.6%) | 16 (11.4%) |
| Food Preparation & Serving | 162 (43.3%) | 212 (56.7%) |
| Cleaning & Maintenance | 335 (67.3%) | 163 (32.7%) |
| Personal Care & Service | 0 (0.0%) | 135 (100.0%) |
| Total (Category) | 667 (49.1%) | 690 (50.8%) |
| Total (Overall) | 4,457 (53.7%) | 3,838 (46.3%) |
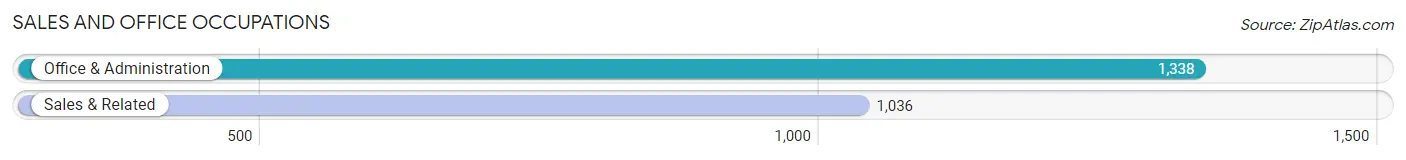
Sales and Office Occupations
The most common Sales and Office occupations in Gibsonton are Office & Administration (1,338 | 16.1%), and Sales & Related (1,036 | 12.5%).
Sales and Office Occupations by Sex
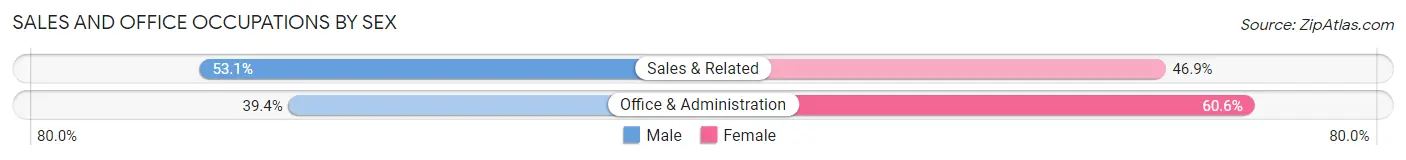
| Occupation | Male | Female |
| Sales & Related | 550 (53.1%) | 486 (46.9%) |
| Office & Administration | 527 (39.4%) | 811 (60.6%) |
| Total (Category) | 1,077 (45.4%) | 1,297 (54.6%) |
| Total (Overall) | 4,457 (53.7%) | 3,838 (46.3%) |
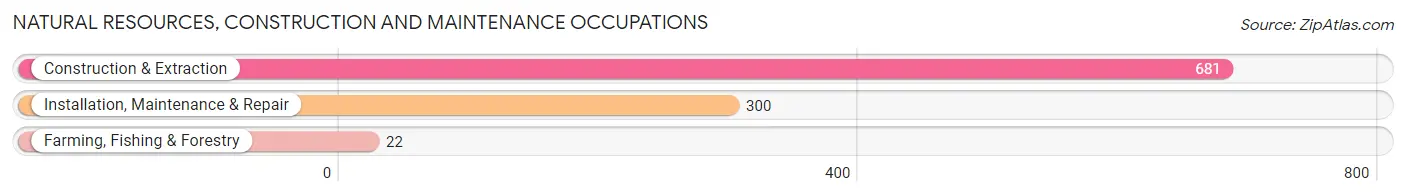
Natural Resources, Construction and Maintenance Occupations
The most common Natural Resources, Construction and Maintenance occupations in Gibsonton are Construction & Extraction (681 | 8.2%), Installation, Maintenance & Repair (300 | 3.6%), and Farming, Fishing & Forestry (22 | 0.3%).
Natural Resources, Construction and Maintenance Occupations by Sex
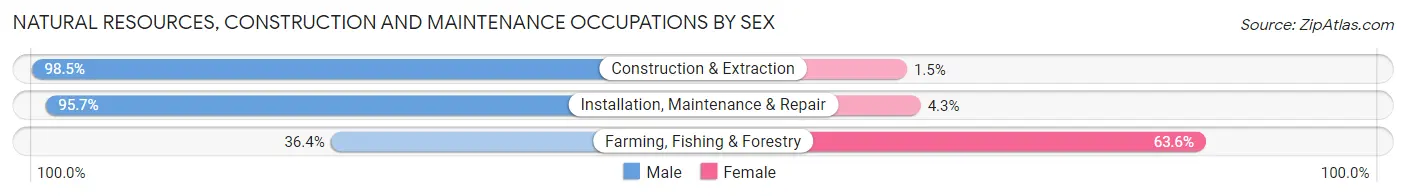
| Occupation | Male | Female |
| Farming, Fishing & Forestry | 8 (36.4%) | 14 (63.6%) |
| Construction & Extraction | 671 (98.5%) | 10 (1.5%) |
| Installation, Maintenance & Repair | 287 (95.7%) | 13 (4.3%) |
| Total (Category) | 966 (96.3%) | 37 (3.7%) |
| Total (Overall) | 4,457 (53.7%) | 3,838 (46.3%) |
Production, Transportation and Moving Occupations
The most common Production, Transportation and Moving occupations in Gibsonton are Transportation (433 | 5.2%), Material Moving (389 | 4.7%), and Production (155 | 1.9%).
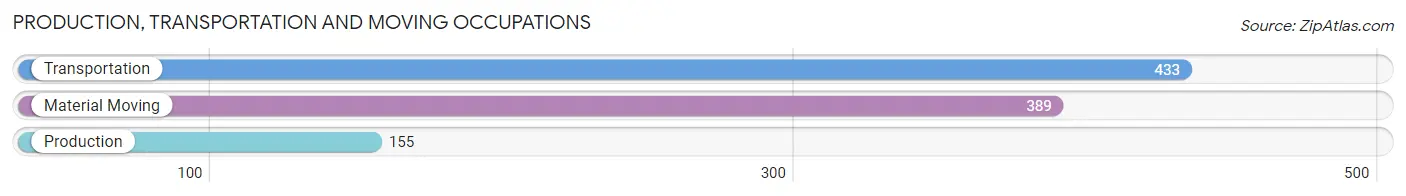
Production, Transportation and Moving Occupations by Sex
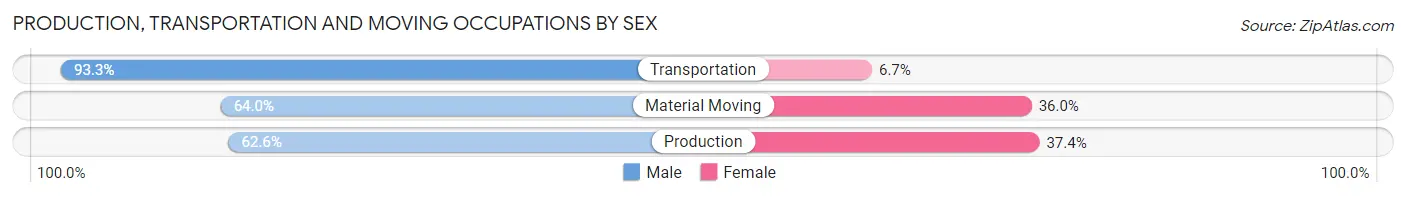
| Occupation | Male | Female |
| Production | 97 (62.6%) | 58 (37.4%) |
| Transportation | 404 (93.3%) | 29 (6.7%) |
| Material Moving | 249 (64.0%) | 140 (36.0%) |
| Total (Category) | 750 (76.8%) | 227 (23.2%) |
| Total (Overall) | 4,457 (53.7%) | 3,838 (46.3%) |
Employment Industries by Sex in Gibsonton
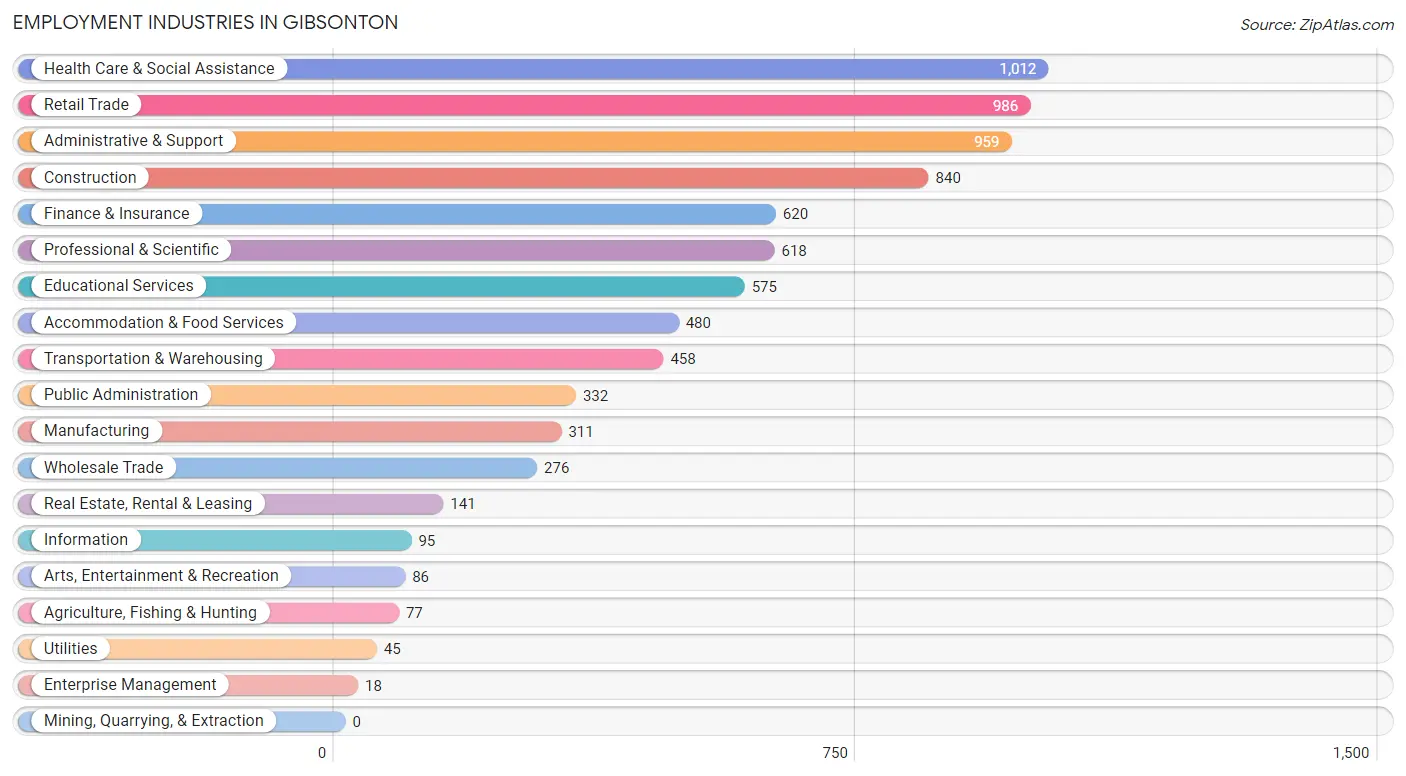
Employment Industries in Gibsonton
The major employment industries in Gibsonton include Health Care & Social Assistance (1,012 | 12.2%), Retail Trade (986 | 11.9%), Administrative & Support (959 | 11.6%), Construction (840 | 10.1%), and Finance & Insurance (620 | 7.5%).
Employment Industries by Sex in Gibsonton
The Gibsonton industries that see more men than women are Information (100.0%), Enterprise Management (100.0%), and Construction (98.3%), whereas the industries that tend to have a higher number of women are Health Care & Social Assistance (87.5%), Educational Services (85.7%), and Finance & Insurance (84.5%).
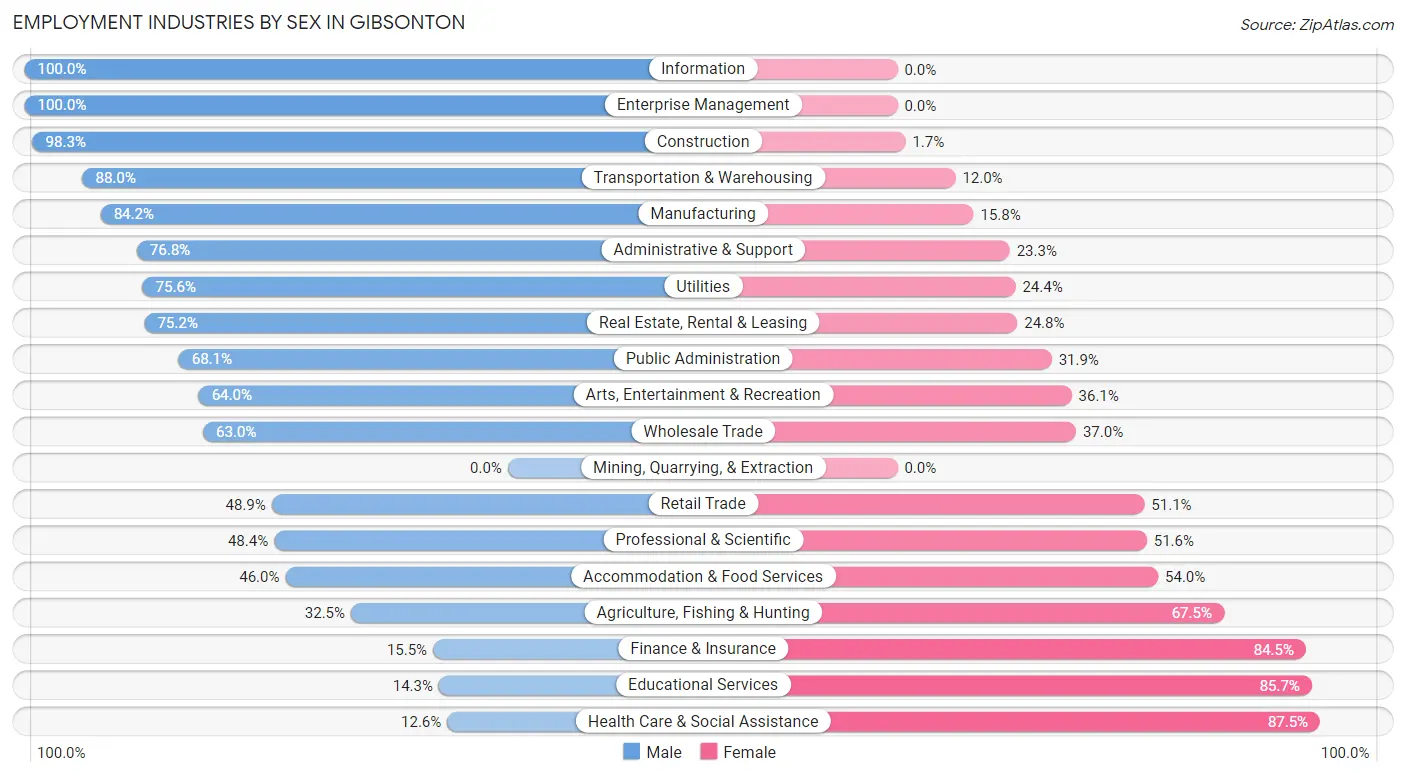
| Industry | Male | Female |
| Agriculture, Fishing & Hunting | 25 (32.5%) | 52 (67.5%) |
| Mining, Quarrying, & Extraction | 0 (0.0%) | 0 (0.0%) |
| Construction | 826 (98.3%) | 14 (1.7%) |
| Manufacturing | 262 (84.2%) | 49 (15.8%) |
| Wholesale Trade | 174 (63.0%) | 102 (37.0%) |
| Retail Trade | 482 (48.9%) | 504 (51.1%) |
| Transportation & Warehousing | 403 (88.0%) | 55 (12.0%) |
| Utilities | 34 (75.6%) | 11 (24.4%) |
| Information | 95 (100.0%) | 0 (0.0%) |
| Finance & Insurance | 96 (15.5%) | 524 (84.5%) |
| Real Estate, Rental & Leasing | 106 (75.2%) | 35 (24.8%) |
| Professional & Scientific | 299 (48.4%) | 319 (51.6%) |
| Enterprise Management | 18 (100.0%) | 0 (0.0%) |
| Administrative & Support | 736 (76.7%) | 223 (23.3%) |
| Educational Services | 82 (14.3%) | 493 (85.7%) |
| Health Care & Social Assistance | 127 (12.6%) | 885 (87.5%) |
| Arts, Entertainment & Recreation | 55 (63.9%) | 31 (36.0%) |
| Accommodation & Food Services | 221 (46.0%) | 259 (54.0%) |
| Public Administration | 226 (68.1%) | 106 (31.9%) |
| Total | 4,457 (53.7%) | 3,838 (46.3%) |
Education in Gibsonton
School Enrollment in Gibsonton
The most common levels of schooling among the 5,385 students in Gibsonton are middle school (1,461 | 27.1%), high school (1,427 | 26.5%), and elementary school (1,301 | 24.2%).
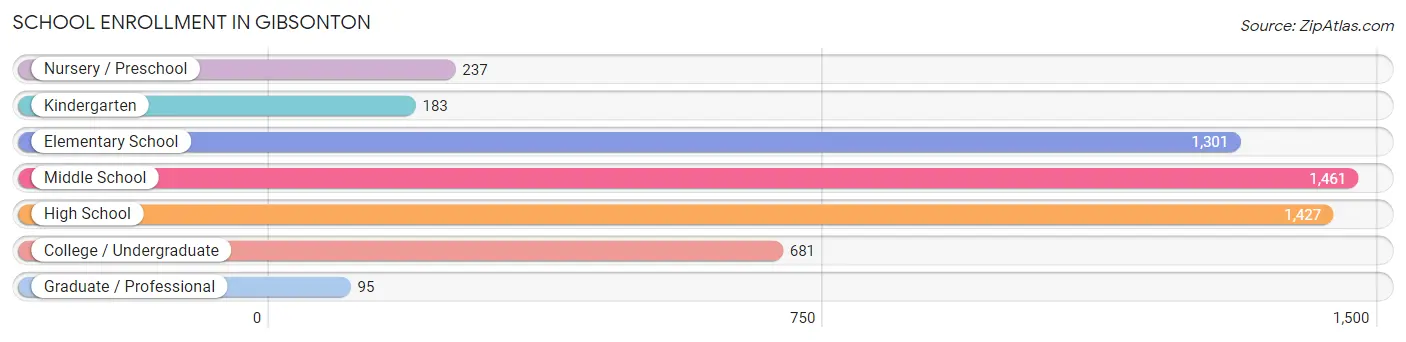
| School Level | # Students | % Students |
| Nursery / Preschool | 237 | 4.4% |
| Kindergarten | 183 | 3.4% |
| Elementary School | 1,301 | 24.2% |
| Middle School | 1,461 | 27.1% |
| High School | 1,427 | 26.5% |
| College / Undergraduate | 681 | 12.7% |
| Graduate / Professional | 95 | 1.8% |
| Total | 5,385 | 100.0% |
School Enrollment by Age by Funding Source in Gibsonton
Out of a total of 5,385 students who are enrolled in schools in Gibsonton, 743 (13.8%) attend a private institution, while the remaining 4,642 (86.2%) are enrolled in public schools. The age group of 25 to 34 year olds has the highest likelihood of being enrolled in private schools, with 93 (78.8% in the age bracket) enrolled. Conversely, the age group of 3 to 4 year olds has the lowest likelihood of being enrolled in a private school, with 176 (100.0% in the age bracket) attending a public institution.
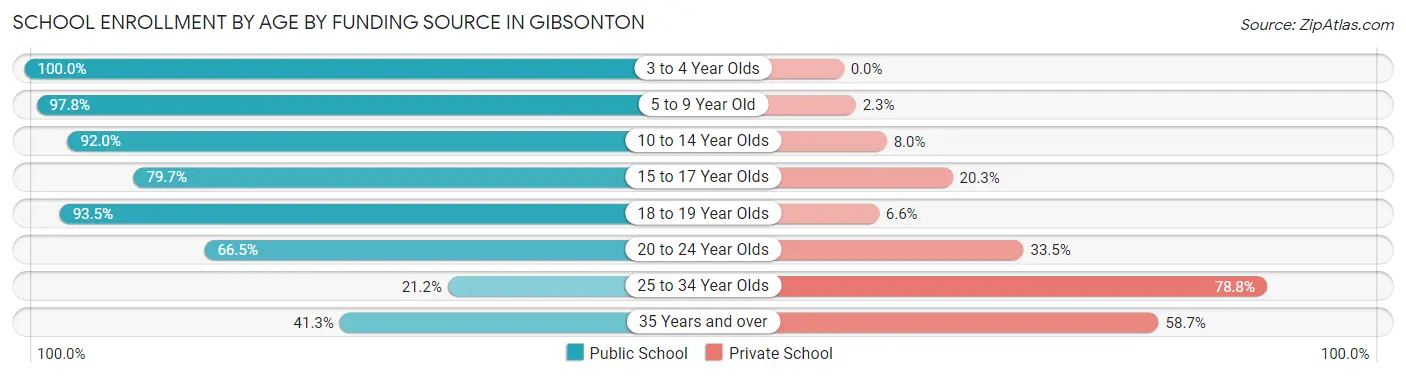
| Age Bracket | Public School | Private School |
| 3 to 4 Year Olds | 176 (100.0%) | 0 (0.0%) |
| 5 to 9 Year Old | 1,301 (97.8%) | 30 (2.2%) |
| 10 to 14 Year Olds | 1,915 (92.0%) | 167 (8.0%) |
| 15 to 17 Year Olds | 727 (79.7%) | 185 (20.3%) |
| 18 to 19 Year Olds | 157 (93.4%) | 11 (6.6%) |
| 20 to 24 Year Olds | 248 (66.5%) | 125 (33.5%) |
| 25 to 34 Year Olds | 25 (21.2%) | 93 (78.8%) |
| 35 Years and over | 93 (41.3%) | 132 (58.7%) |
| Total | 4,642 (86.2%) | 743 (13.8%) |
Educational Attainment by Field of Study in Gibsonton
Business (952 | 38.8%), communications (238 | 9.7%), social sciences (173 | 7.0%), literature & languages (167 | 6.8%), and arts & humanities (160 | 6.5%) are the most common fields of study among 2,457 individuals in Gibsonton who have obtained a bachelor's degree or higher.
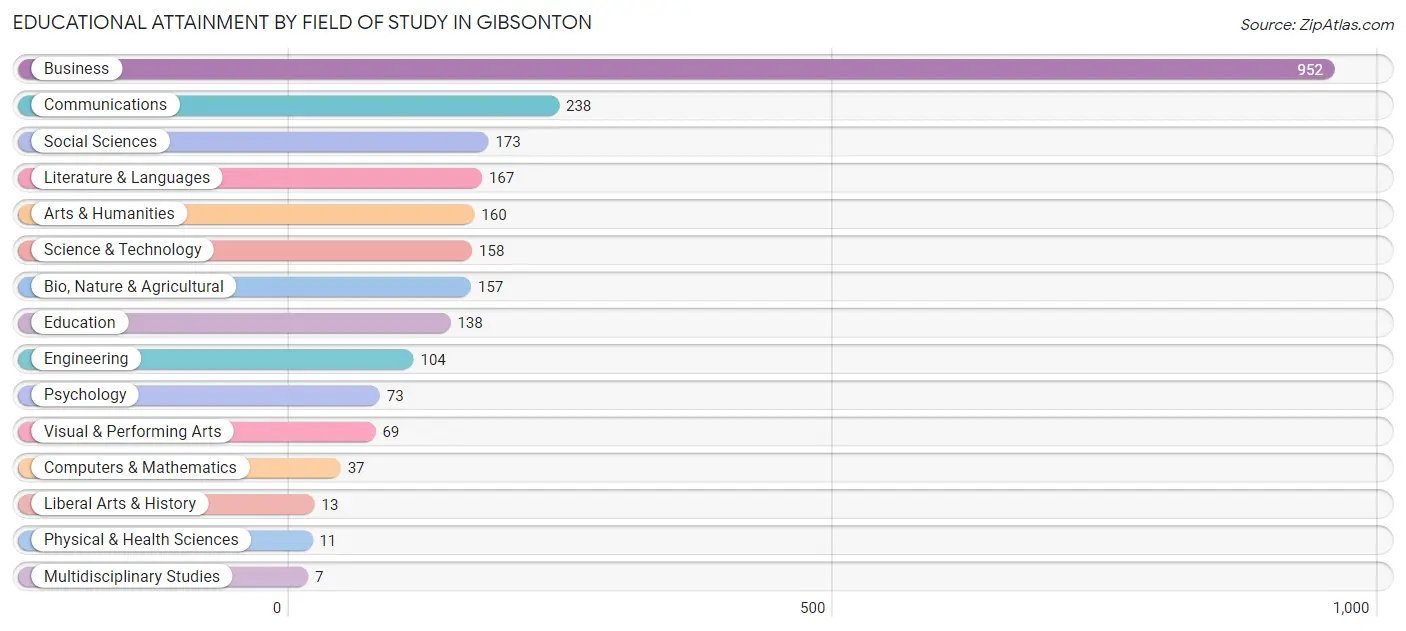
| Field of Study | # Graduates | % Graduates |
| Computers & Mathematics | 37 | 1.5% |
| Bio, Nature & Agricultural | 157 | 6.4% |
| Physical & Health Sciences | 11 | 0.4% |
| Psychology | 73 | 3.0% |
| Social Sciences | 173 | 7.0% |
| Engineering | 104 | 4.2% |
| Multidisciplinary Studies | 7 | 0.3% |
| Science & Technology | 158 | 6.4% |
| Business | 952 | 38.8% |
| Education | 138 | 5.6% |
| Literature & Languages | 167 | 6.8% |
| Liberal Arts & History | 13 | 0.5% |
| Visual & Performing Arts | 69 | 2.8% |
| Communications | 238 | 9.7% |
| Arts & Humanities | 160 | 6.5% |
| Total | 2,457 | 100.0% |
Transportation & Commute in Gibsonton
Vehicle Availability by Sex in Gibsonton
The most prevalent vehicle ownership categories in Gibsonton are males with 2 vehicles (2,512, accounting for 55.0%) and females with 2 vehicles (2,064, making up 66.6%).
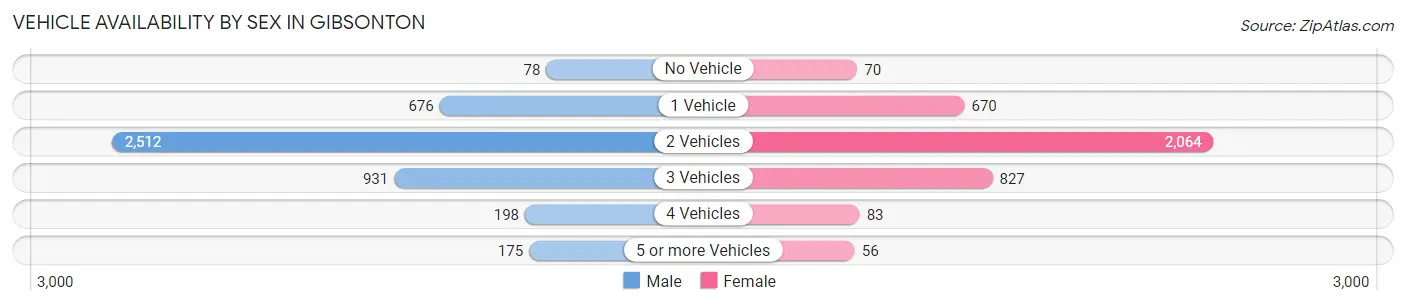
| Vehicles Available | Male | Female |
| No Vehicle | 78 (1.7%) | 70 (1.9%) |
| 1 Vehicle | 676 (14.8%) | 670 (17.8%) |
| 2 Vehicles | 2,512 (55.0%) | 2,064 (54.7%) |
| 3 Vehicles | 931 (20.4%) | 827 (21.9%) |
| 4 Vehicles | 198 (4.3%) | 83 (2.2%) |
| 5 or more Vehicles | 175 (3.8%) | 56 (1.5%) |
| Total | 4,570 (100.0%) | 3,770 (100.0%) |
Commute Time in Gibsonton
The most frequently occuring commute durations in Gibsonton are 45 to 59 minutes (1,413 commuters, 19.3%), 30 to 34 minutes (1,155 commuters, 15.7%), and 20 to 24 minutes (1,099 commuters, 15.0%).
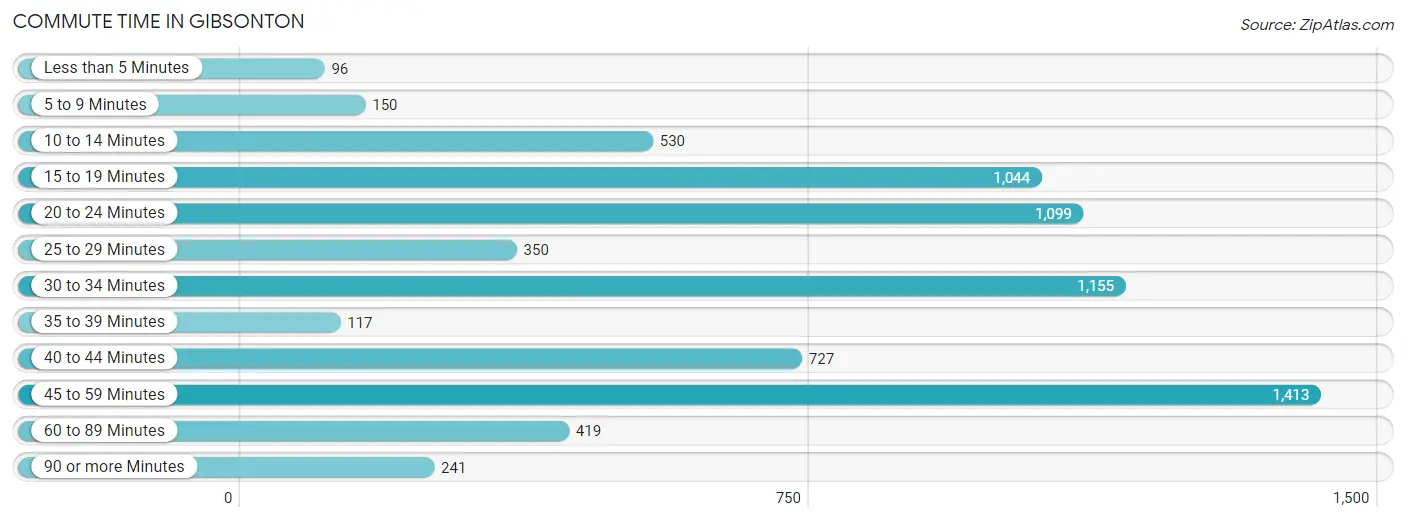
| Commute Time | # Commuters | % Commuters |
| Less than 5 Minutes | 96 | 1.3% |
| 5 to 9 Minutes | 150 | 2.0% |
| 10 to 14 Minutes | 530 | 7.2% |
| 15 to 19 Minutes | 1,044 | 14.2% |
| 20 to 24 Minutes | 1,099 | 15.0% |
| 25 to 29 Minutes | 350 | 4.8% |
| 30 to 34 Minutes | 1,155 | 15.7% |
| 35 to 39 Minutes | 117 | 1.6% |
| 40 to 44 Minutes | 727 | 9.9% |
| 45 to 59 Minutes | 1,413 | 19.3% |
| 60 to 89 Minutes | 419 | 5.7% |
| 90 or more Minutes | 241 | 3.3% |
Commute Time by Sex in Gibsonton
The most common commute times in Gibsonton are 45 to 59 minutes (801 commuters, 19.2%) for males and 15 to 19 minutes (631 commuters, 20.0%) for females.
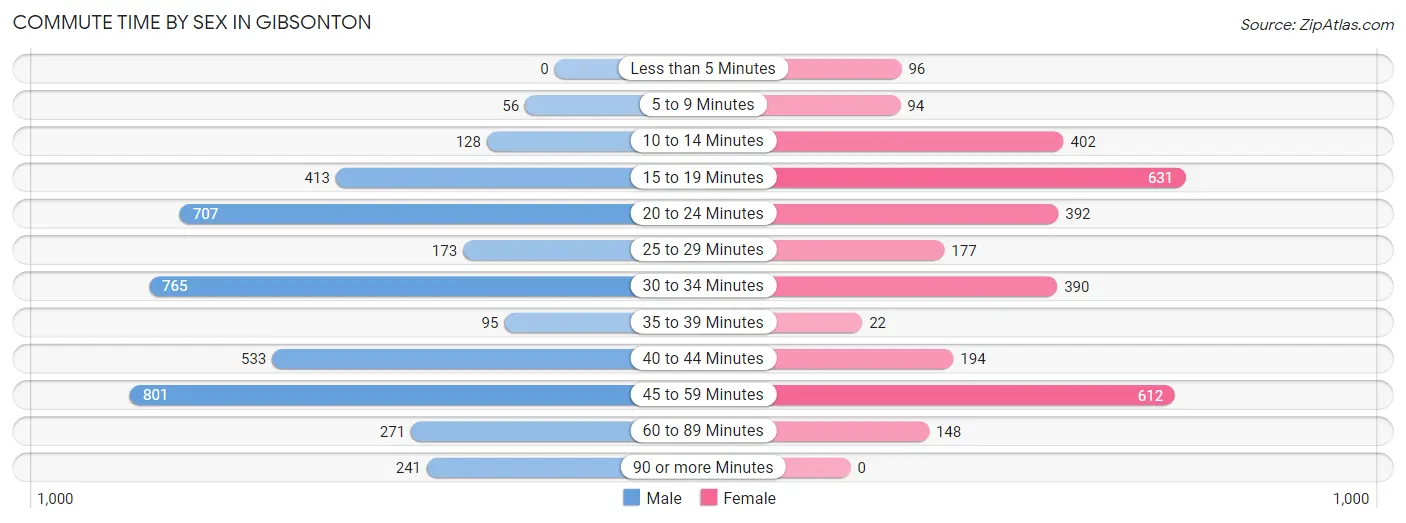
| Commute Time | Male | Female |
| Less than 5 Minutes | 0 (0.0%) | 96 (3.0%) |
| 5 to 9 Minutes | 56 (1.3%) | 94 (3.0%) |
| 10 to 14 Minutes | 128 (3.1%) | 402 (12.7%) |
| 15 to 19 Minutes | 413 (9.9%) | 631 (20.0%) |
| 20 to 24 Minutes | 707 (16.9%) | 392 (12.4%) |
| 25 to 29 Minutes | 173 (4.1%) | 177 (5.6%) |
| 30 to 34 Minutes | 765 (18.3%) | 390 (12.3%) |
| 35 to 39 Minutes | 95 (2.3%) | 22 (0.7%) |
| 40 to 44 Minutes | 533 (12.7%) | 194 (6.1%) |
| 45 to 59 Minutes | 801 (19.2%) | 612 (19.4%) |
| 60 to 89 Minutes | 271 (6.5%) | 148 (4.7%) |
| 90 or more Minutes | 241 (5.8%) | 0 (0.0%) |
Time of Departure to Work by Sex in Gibsonton
The most frequent times of departure to work in Gibsonton are 7:00 AM to 7:29 AM (1,060, 25.3%) for males and 6:30 AM to 6:59 AM (841, 26.6%) for females.
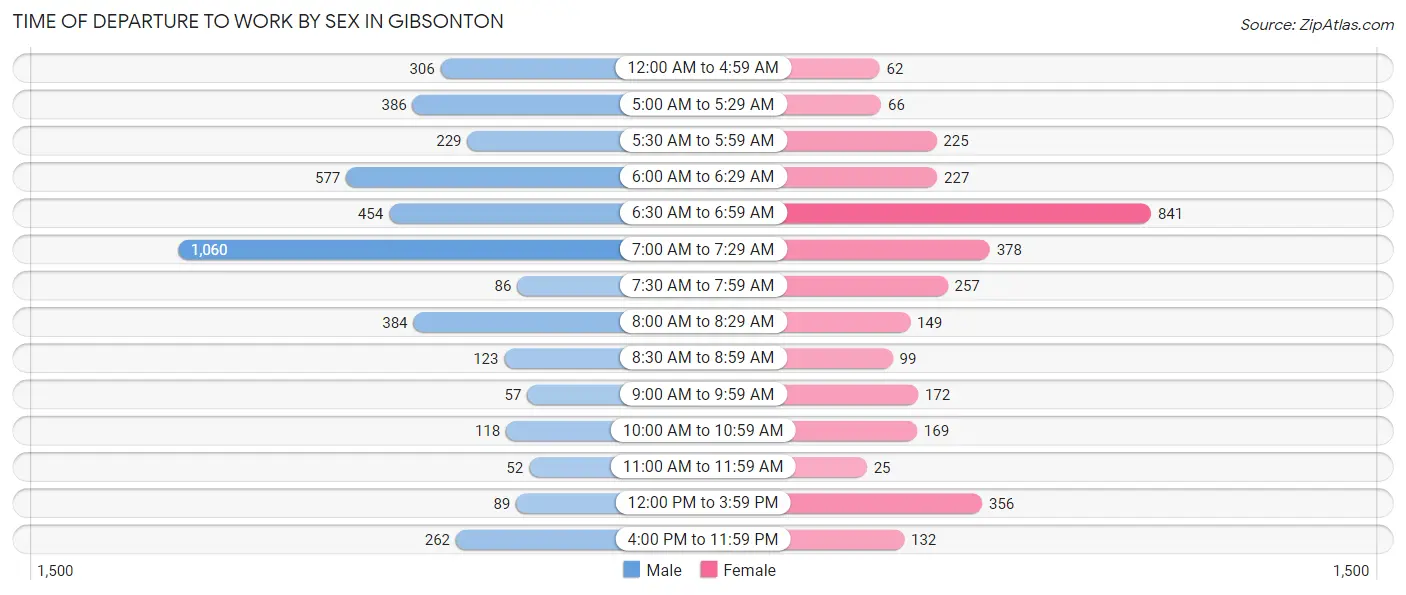
| Time of Departure | Male | Female |
| 12:00 AM to 4:59 AM | 306 (7.3%) | 62 (2.0%) |
| 5:00 AM to 5:29 AM | 386 (9.2%) | 66 (2.1%) |
| 5:30 AM to 5:59 AM | 229 (5.5%) | 225 (7.1%) |
| 6:00 AM to 6:29 AM | 577 (13.8%) | 227 (7.2%) |
| 6:30 AM to 6:59 AM | 454 (10.8%) | 841 (26.6%) |
| 7:00 AM to 7:29 AM | 1,060 (25.3%) | 378 (12.0%) |
| 7:30 AM to 7:59 AM | 86 (2.1%) | 257 (8.1%) |
| 8:00 AM to 8:29 AM | 384 (9.2%) | 149 (4.7%) |
| 8:30 AM to 8:59 AM | 123 (2.9%) | 99 (3.1%) |
| 9:00 AM to 9:59 AM | 57 (1.4%) | 172 (5.4%) |
| 10:00 AM to 10:59 AM | 118 (2.8%) | 169 (5.3%) |
| 11:00 AM to 11:59 AM | 52 (1.2%) | 25 (0.8%) |
| 12:00 PM to 3:59 PM | 89 (2.1%) | 356 (11.3%) |
| 4:00 PM to 11:59 PM | 262 (6.3%) | 132 (4.2%) |
| Total | 4,183 (100.0%) | 3,158 (100.0%) |
Housing Occupancy in Gibsonton
Occupancy by Ownership in Gibsonton
Of the total 5,818 dwellings in Gibsonton, owner-occupied units account for 4,012 (69.0%), while renter-occupied units make up 1,806 (31.0%).
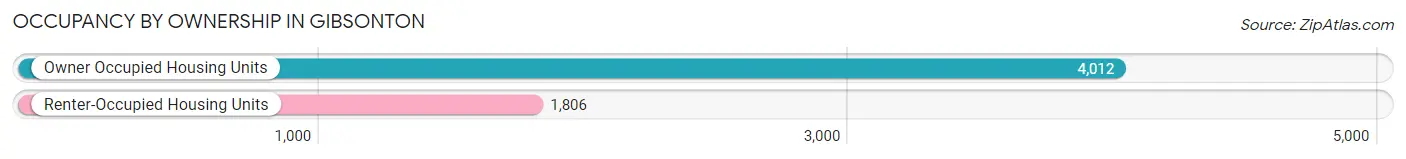
| Occupancy | # Housing Units | % Housing Units |
| Owner Occupied Housing Units | 4,012 | 69.0% |
| Renter-Occupied Housing Units | 1,806 | 31.0% |
| Total Occupied Housing Units | 5,818 | 100.0% |
Occupancy by Household Size in Gibsonton
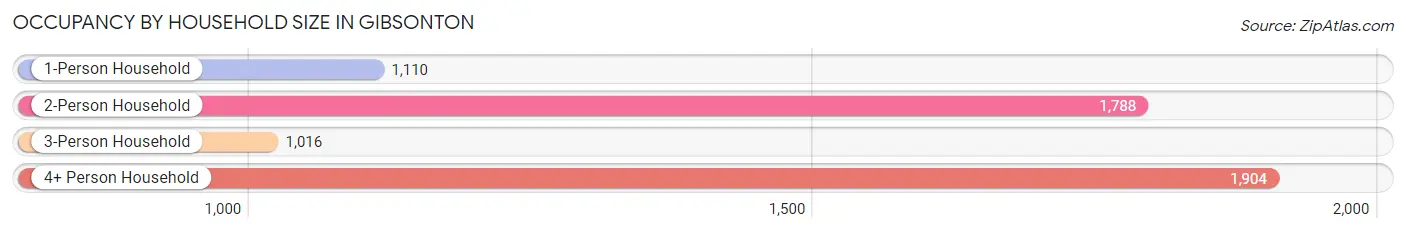
| Household Size | # Housing Units | % Housing Units |
| 1-Person Household | 1,110 | 19.1% |
| 2-Person Household | 1,788 | 30.7% |
| 3-Person Household | 1,016 | 17.5% |
| 4+ Person Household | 1,904 | 32.7% |
| Total Housing Units | 5,818 | 100.0% |
Occupancy by Ownership by Household Size in Gibsonton
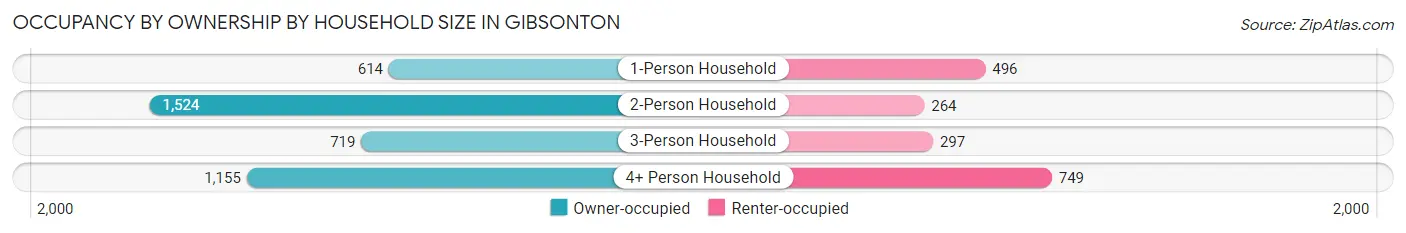
| Household Size | Owner-occupied | Renter-occupied |
| 1-Person Household | 614 (55.3%) | 496 (44.7%) |
| 2-Person Household | 1,524 (85.2%) | 264 (14.8%) |
| 3-Person Household | 719 (70.8%) | 297 (29.2%) |
| 4+ Person Household | 1,155 (60.7%) | 749 (39.3%) |
| Total Housing Units | 4,012 (69.0%) | 1,806 (31.0%) |
Occupancy by Educational Attainment in Gibsonton
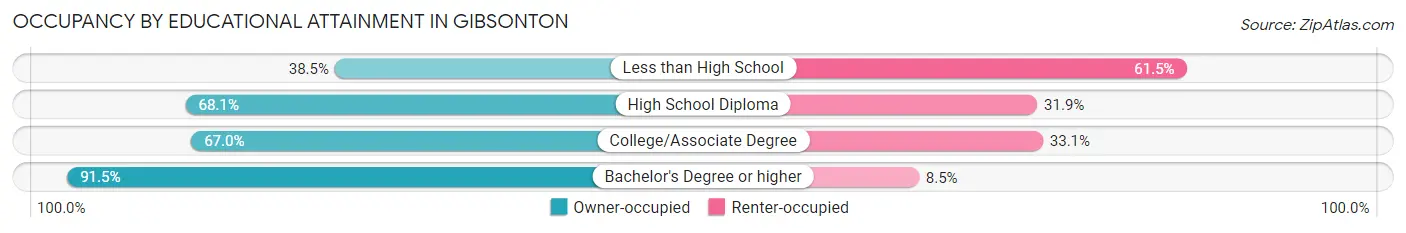
| Household Size | Owner-occupied | Renter-occupied |
| Less than High School | 338 (38.5%) | 540 (61.5%) |
| High School Diploma | 1,269 (68.1%) | 595 (31.9%) |
| College/Associate Degree | 1,118 (66.9%) | 552 (33.1%) |
| Bachelor's Degree or higher | 1,287 (91.5%) | 119 (8.5%) |
Occupancy by Age of Householder in Gibsonton
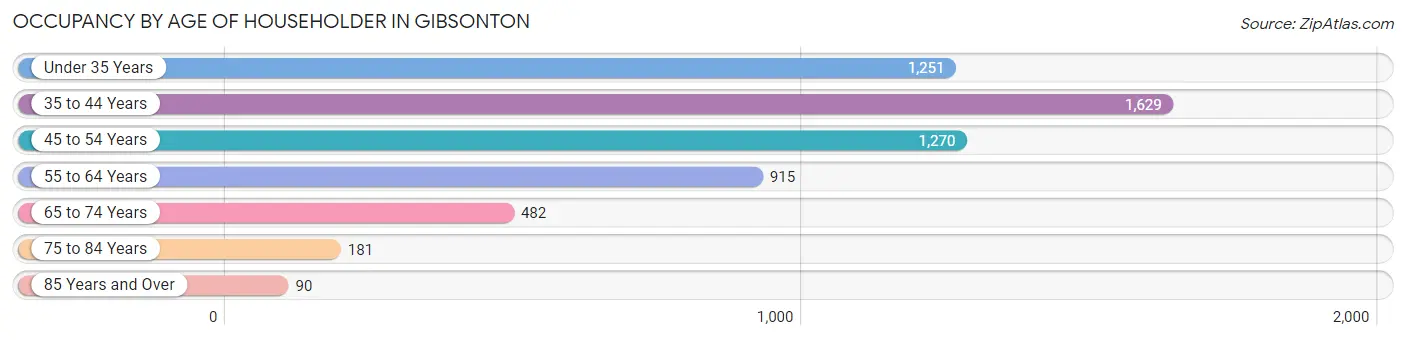
| Age Bracket | # Households | % Households |
| Under 35 Years | 1,251 | 21.5% |
| 35 to 44 Years | 1,629 | 28.0% |
| 45 to 54 Years | 1,270 | 21.8% |
| 55 to 64 Years | 915 | 15.7% |
| 65 to 74 Years | 482 | 8.3% |
| 75 to 84 Years | 181 | 3.1% |
| 85 Years and Over | 90 | 1.5% |
| Total | 5,818 | 100.0% |
Housing Finances in Gibsonton
Median Income by Occupancy in Gibsonton
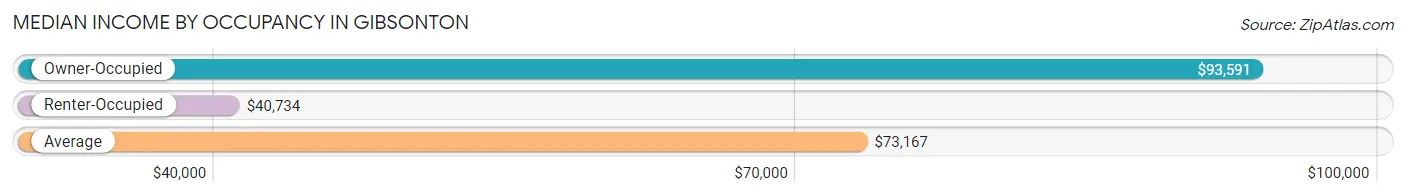
| Occupancy Type | # Households | Median Income |
| Owner-Occupied | 4,012 (69.0%) | $93,591 |
| Renter-Occupied | 1,806 (31.0%) | $40,734 |
| Average | 5,818 (100.0%) | $73,167 |
Occupancy by Householder Income Bracket in Gibsonton
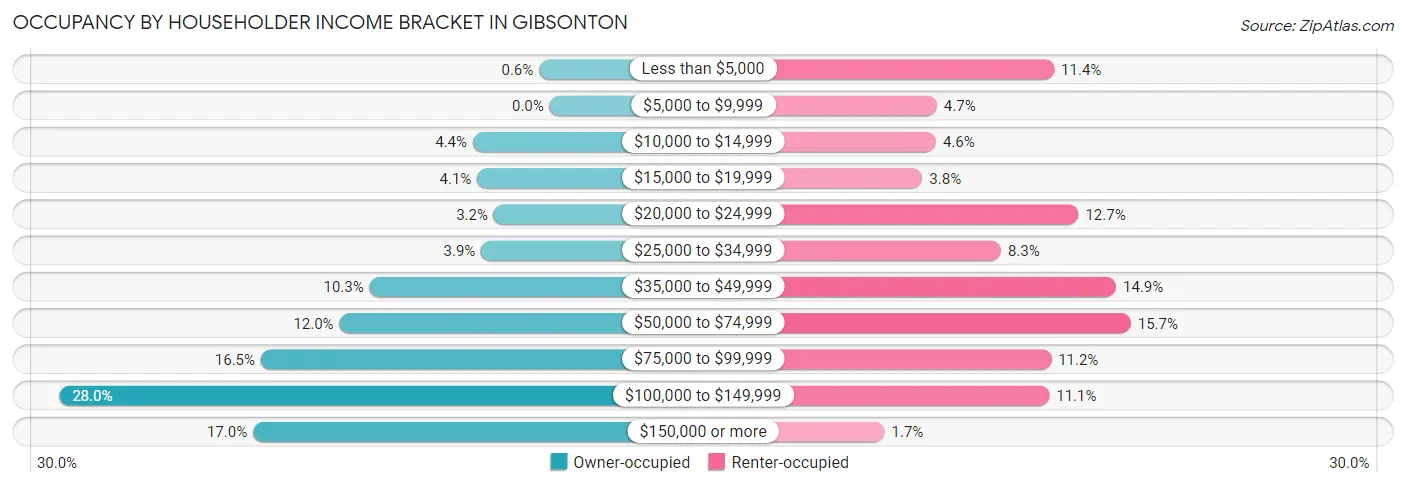
| Income Bracket | Owner-occupied | Renter-occupied |
| Less than $5,000 | 24 (0.6%) | 205 (11.4%) |
| $5,000 to $9,999 | 0 (0.0%) | 84 (4.6%) |
| $10,000 to $14,999 | 176 (4.4%) | 83 (4.6%) |
| $15,000 to $19,999 | 166 (4.1%) | 69 (3.8%) |
| $20,000 to $24,999 | 128 (3.2%) | 230 (12.7%) |
| $25,000 to $34,999 | 157 (3.9%) | 150 (8.3%) |
| $35,000 to $49,999 | 413 (10.3%) | 269 (14.9%) |
| $50,000 to $74,999 | 482 (12.0%) | 284 (15.7%) |
| $75,000 to $99,999 | 662 (16.5%) | 202 (11.2%) |
| $100,000 to $149,999 | 1,124 (28.0%) | 200 (11.1%) |
| $150,000 or more | 680 (17.0%) | 30 (1.7%) |
| Total | 4,012 (100.0%) | 1,806 (100.0%) |
Monthly Housing Cost Tiers in Gibsonton
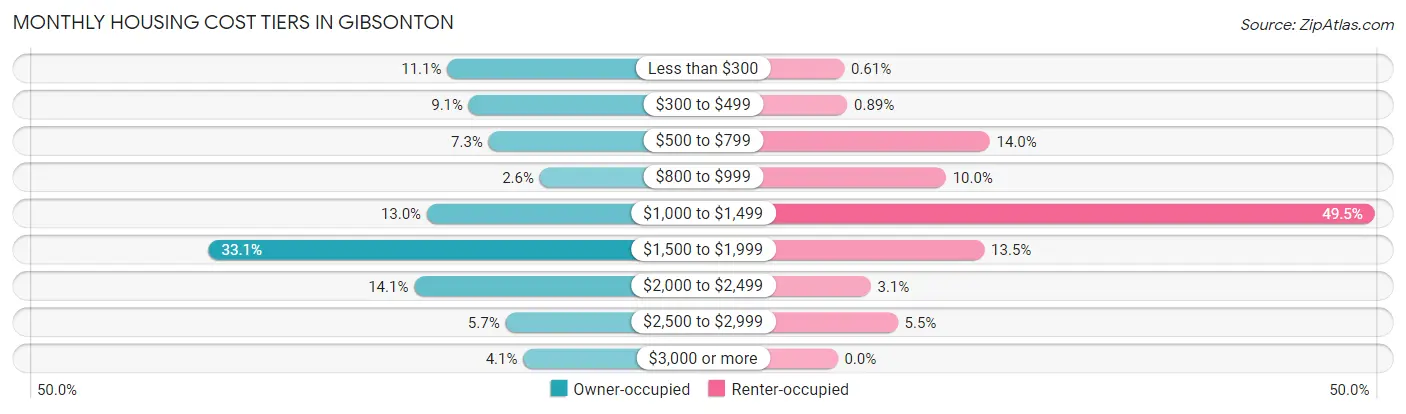
| Monthly Cost | Owner-occupied | Renter-occupied |
| Less than $300 | 445 (11.1%) | 11 (0.6%) |
| $300 to $499 | 365 (9.1%) | 16 (0.9%) |
| $500 to $799 | 292 (7.3%) | 253 (14.0%) |
| $800 to $999 | 103 (2.6%) | 180 (10.0%) |
| $1,000 to $1,499 | 520 (13.0%) | 893 (49.4%) |
| $1,500 to $1,999 | 1,326 (33.1%) | 244 (13.5%) |
| $2,000 to $2,499 | 567 (14.1%) | 55 (3.0%) |
| $2,500 to $2,999 | 230 (5.7%) | 100 (5.5%) |
| $3,000 or more | 164 (4.1%) | 0 (0.0%) |
| Total | 4,012 (100.0%) | 1,806 (100.0%) |
Physical Housing Characteristics in Gibsonton
Housing Structures in Gibsonton
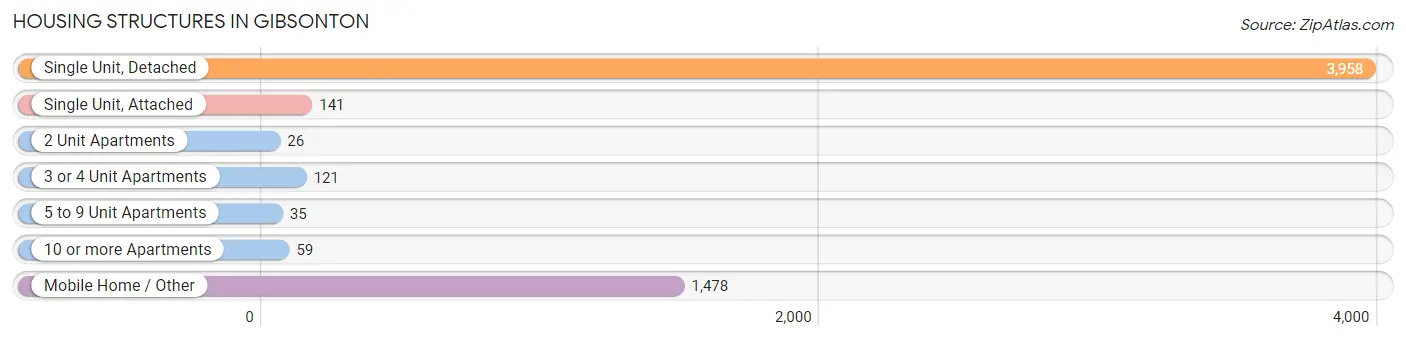
| Structure Type | # Housing Units | % Housing Units |
| Single Unit, Detached | 3,958 | 68.0% |
| Single Unit, Attached | 141 | 2.4% |
| 2 Unit Apartments | 26 | 0.4% |
| 3 or 4 Unit Apartments | 121 | 2.1% |
| 5 to 9 Unit Apartments | 35 | 0.6% |
| 10 or more Apartments | 59 | 1.0% |
| Mobile Home / Other | 1,478 | 25.4% |
| Total | 5,818 | 100.0% |
Housing Structures by Occupancy in Gibsonton
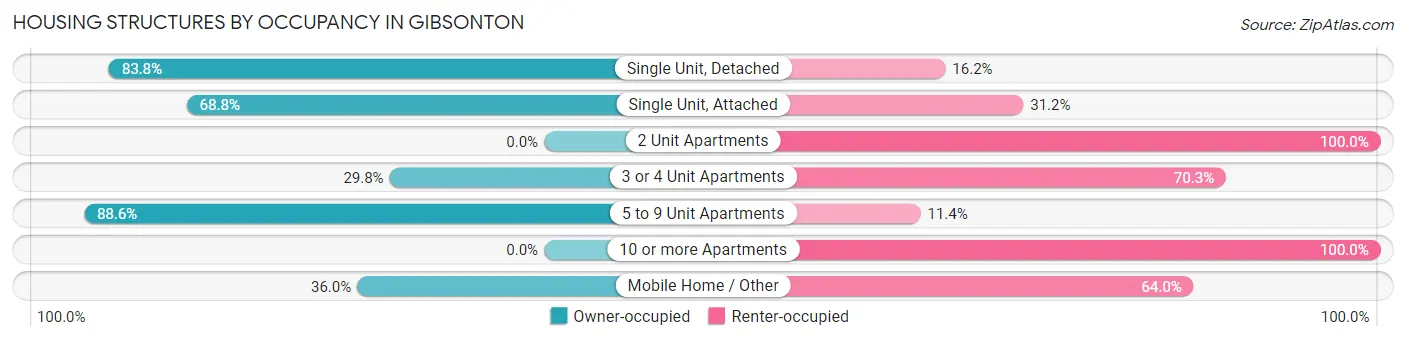
| Structure Type | Owner-occupied | Renter-occupied |
| Single Unit, Detached | 3,316 (83.8%) | 642 (16.2%) |
| Single Unit, Attached | 97 (68.8%) | 44 (31.2%) |
| 2 Unit Apartments | 0 (0.0%) | 26 (100.0%) |
| 3 or 4 Unit Apartments | 36 (29.7%) | 85 (70.3%) |
| 5 to 9 Unit Apartments | 31 (88.6%) | 4 (11.4%) |
| 10 or more Apartments | 0 (0.0%) | 59 (100.0%) |
| Mobile Home / Other | 532 (36.0%) | 946 (64.0%) |
| Total | 4,012 (69.0%) | 1,806 (31.0%) |
Housing Structures by Number of Rooms in Gibsonton
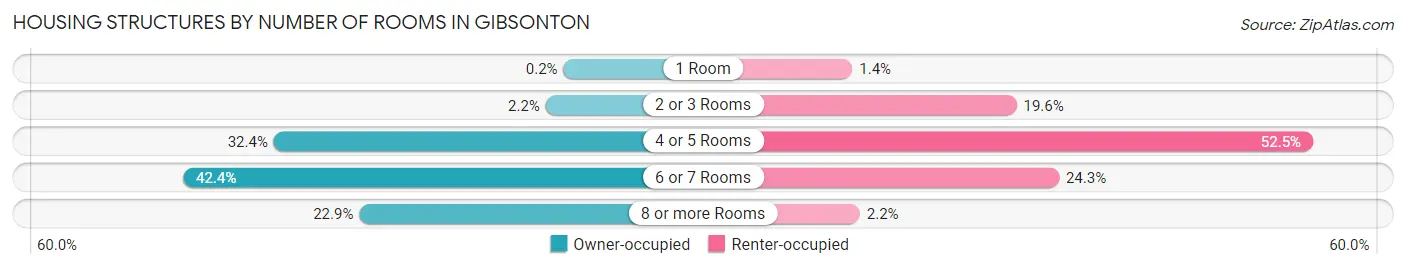
| Number of Rooms | Owner-occupied | Renter-occupied |
| 1 Room | 8 (0.2%) | 25 (1.4%) |
| 2 or 3 Rooms | 87 (2.2%) | 354 (19.6%) |
| 4 or 5 Rooms | 1,298 (32.4%) | 948 (52.5%) |
| 6 or 7 Rooms | 1,702 (42.4%) | 439 (24.3%) |
| 8 or more Rooms | 917 (22.9%) | 40 (2.2%) |
| Total | 4,012 (100.0%) | 1,806 (100.0%) |
Housing Structure by Heating Type in Gibsonton
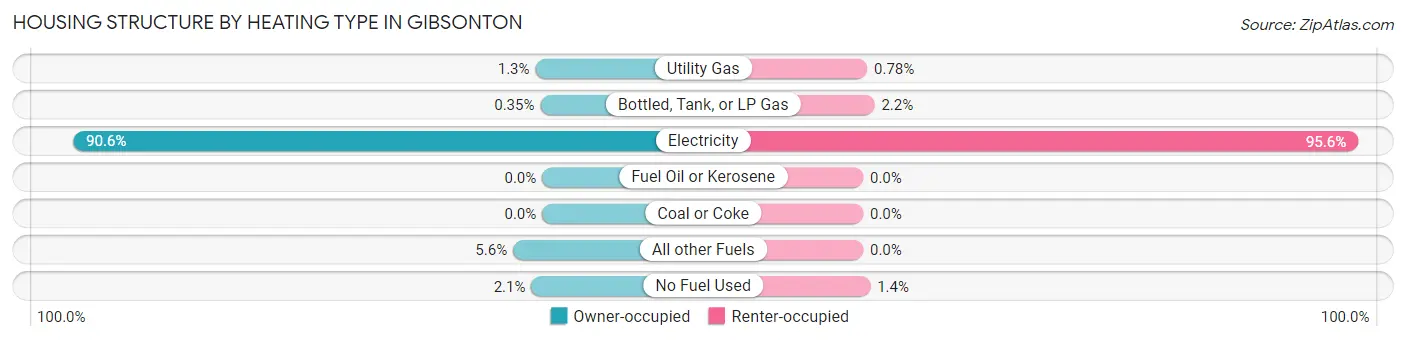
| Heating Type | Owner-occupied | Renter-occupied |
| Utility Gas | 52 (1.3%) | 14 (0.8%) |
| Bottled, Tank, or LP Gas | 14 (0.4%) | 40 (2.2%) |
| Electricity | 3,636 (90.6%) | 1,727 (95.6%) |
| Fuel Oil or Kerosene | 0 (0.0%) | 0 (0.0%) |
| Coal or Coke | 0 (0.0%) | 0 (0.0%) |
| All other Fuels | 226 (5.6%) | 0 (0.0%) |
| No Fuel Used | 84 (2.1%) | 25 (1.4%) |
| Total | 4,012 (100.0%) | 1,806 (100.0%) |
Household Vehicle Usage in Gibsonton
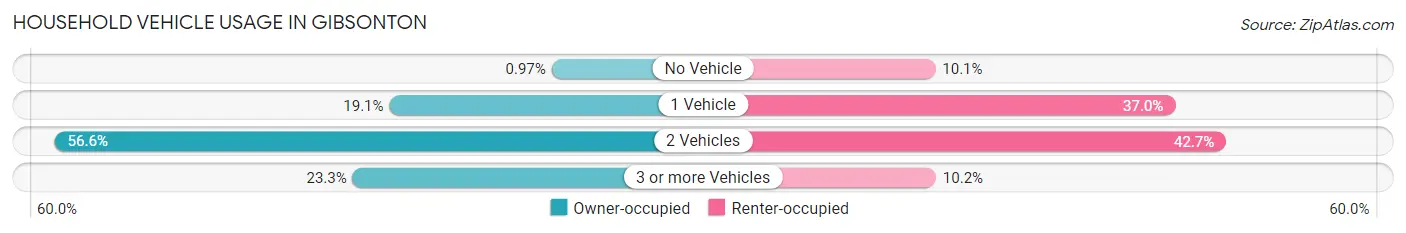
| Vehicles per Household | Owner-occupied | Renter-occupied |
| No Vehicle | 39 (1.0%) | 183 (10.1%) |
| 1 Vehicle | 768 (19.1%) | 668 (37.0%) |
| 2 Vehicles | 2,272 (56.6%) | 771 (42.7%) |
| 3 or more Vehicles | 933 (23.3%) | 184 (10.2%) |
| Total | 4,012 (100.0%) | 1,806 (100.0%) |
Real Estate & Mortgages in Gibsonton
Real Estate and Mortgage Overview in Gibsonton
| Characteristic | Without Mortgage | With Mortgage |
| Housing Units | 1,100 | 2,912 |
| Median Property Value | $170,300 | $265,500 |
| Median Household Income | $49,853 | $561 |
| Monthly Housing Costs | $407 | $164 |
| Real Estate Taxes | $1,302 | $93 |
Property Value by Mortgage Status in Gibsonton
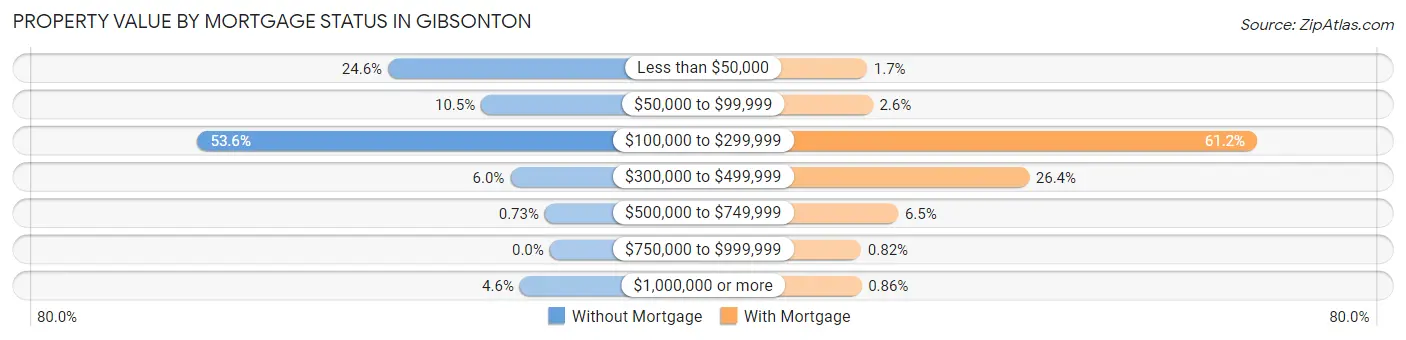
| Property Value | Without Mortgage | With Mortgage |
| Less than $50,000 | 271 (24.6%) | 50 (1.7%) |
| $50,000 to $99,999 | 115 (10.4%) | 75 (2.6%) |
| $100,000 to $299,999 | 590 (53.6%) | 1,781 (61.2%) |
| $300,000 to $499,999 | 66 (6.0%) | 769 (26.4%) |
| $500,000 to $749,999 | 8 (0.7%) | 188 (6.5%) |
| $750,000 to $999,999 | 0 (0.0%) | 24 (0.8%) |
| $1,000,000 or more | 50 (4.5%) | 25 (0.9%) |
| Total | 1,100 (100.0%) | 2,912 (100.0%) |
Household Income by Mortgage Status in Gibsonton
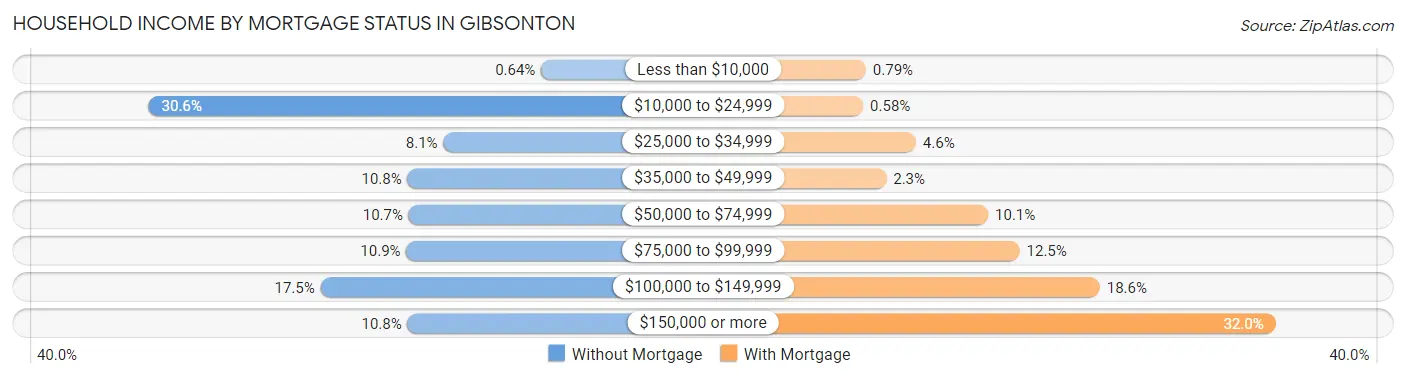
| Household Income | Without Mortgage | With Mortgage |
| Less than $10,000 | 7 (0.6%) | 23 (0.8%) |
| $10,000 to $24,999 | 336 (30.5%) | 17 (0.6%) |
| $25,000 to $34,999 | 89 (8.1%) | 134 (4.6%) |
| $35,000 to $49,999 | 119 (10.8%) | 68 (2.3%) |
| $50,000 to $74,999 | 118 (10.7%) | 294 (10.1%) |
| $75,000 to $99,999 | 120 (10.9%) | 364 (12.5%) |
| $100,000 to $149,999 | 192 (17.4%) | 542 (18.6%) |
| $150,000 or more | 119 (10.8%) | 932 (32.0%) |
| Total | 1,100 (100.0%) | 2,912 (100.0%) |
Property Value to Household Income Ratio in Gibsonton
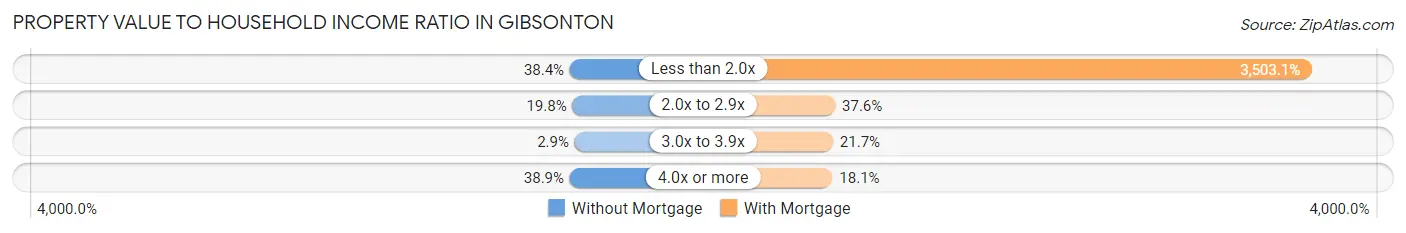
| Value-to-Income Ratio | Without Mortgage | With Mortgage |
| Less than 2.0x | 422 (38.4%) | 102,011 (3,503.1%) |
| 2.0x to 2.9x | 218 (19.8%) | 1,095 (37.6%) |
| 3.0x to 3.9x | 32 (2.9%) | 632 (21.7%) |
| 4.0x or more | 428 (38.9%) | 528 (18.1%) |
| Total | 1,100 (100.0%) | 2,912 (100.0%) |
Real Estate Taxes by Mortgage Status in Gibsonton
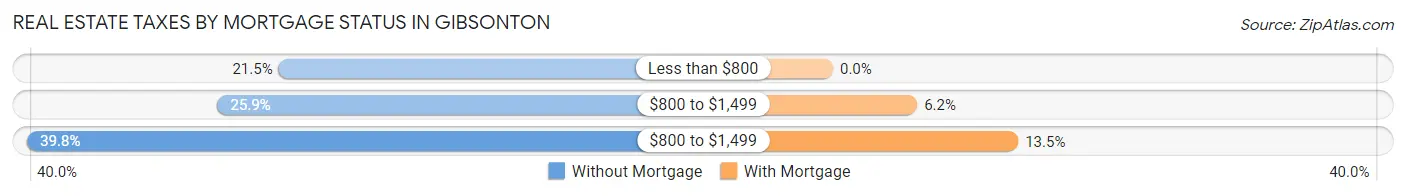
| Property Taxes | Without Mortgage | With Mortgage |
| Less than $800 | 236 (21.4%) | 0 (0.0%) |
| $800 to $1,499 | 285 (25.9%) | 179 (6.1%) |
| $800 to $1,499 | 438 (39.8%) | 394 (13.5%) |
| Total | 1,100 (100.0%) | 2,912 (100.0%) |
Health & Disability in Gibsonton
Health Insurance Coverage by Age in Gibsonton
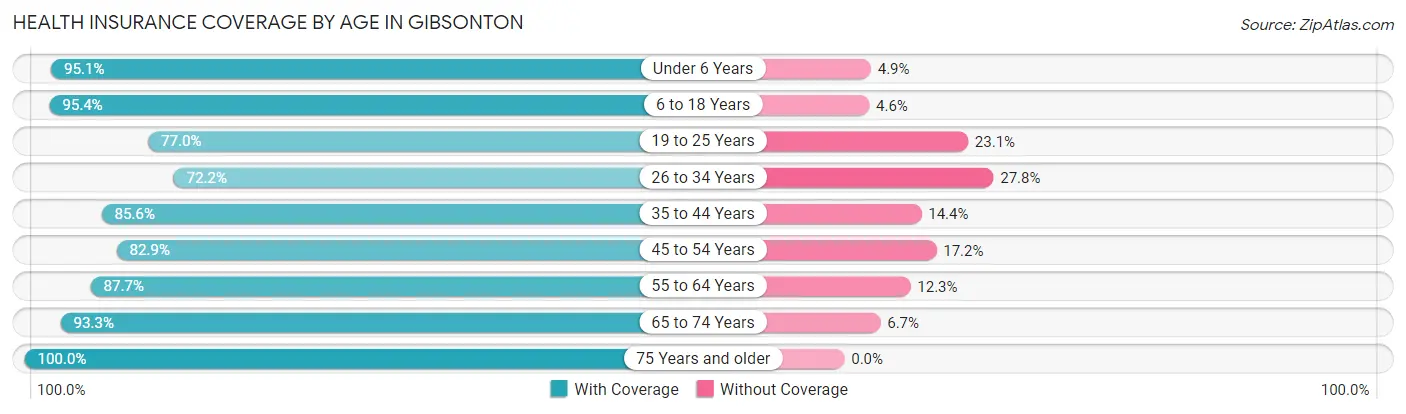
| Age Bracket | With Coverage | Without Coverage |
| Under 6 Years | 1,329 (95.1%) | 69 (4.9%) |
| 6 to 18 Years | 4,102 (95.4%) | 199 (4.6%) |
| 19 to 25 Years | 988 (76.9%) | 296 (23.1%) |
| 26 to 34 Years | 1,471 (72.2%) | 566 (27.8%) |
| 35 to 44 Years | 2,826 (85.6%) | 474 (14.4%) |
| 45 to 54 Years | 1,860 (82.9%) | 385 (17.2%) |
| 55 to 64 Years | 1,480 (87.7%) | 208 (12.3%) |
| 65 to 74 Years | 931 (93.3%) | 67 (6.7%) |
| 75 Years and older | 490 (100.0%) | 0 (0.0%) |
| Total | 15,477 (87.2%) | 2,264 (12.8%) |
Health Insurance Coverage by Citizenship Status in Gibsonton
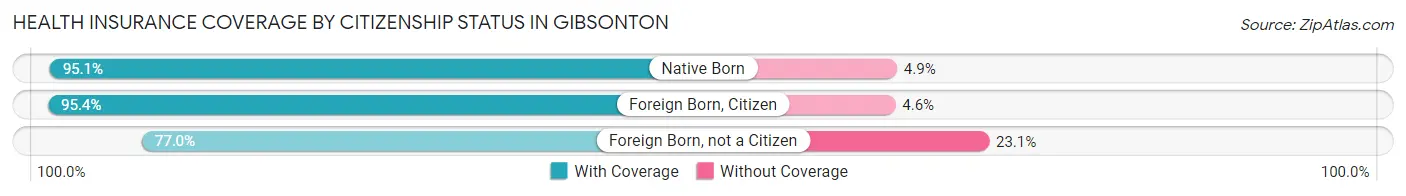
| Citizenship Status | With Coverage | Without Coverage |
| Native Born | 1,329 (95.1%) | 69 (4.9%) |
| Foreign Born, Citizen | 4,102 (95.4%) | 199 (4.6%) |
| Foreign Born, not a Citizen | 988 (76.9%) | 296 (23.1%) |
Health Insurance Coverage by Household Income in Gibsonton
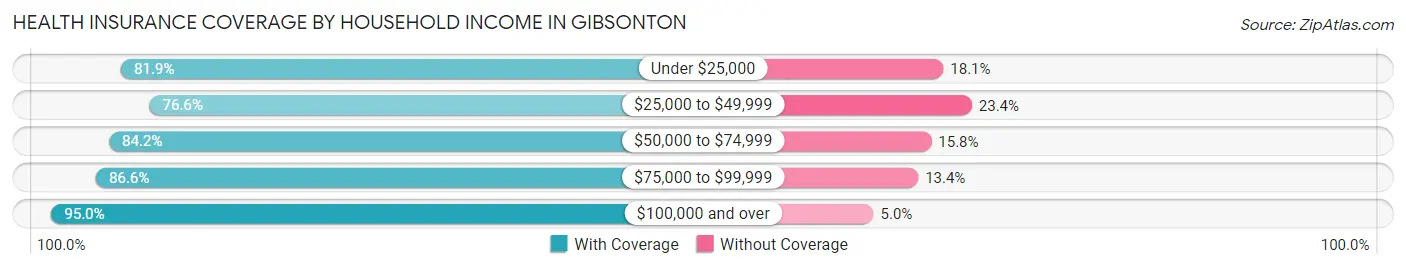
| Household Income | With Coverage | Without Coverage |
| Under $25,000 | 2,531 (81.9%) | 559 (18.1%) |
| $25,000 to $49,999 | 2,007 (76.6%) | 614 (23.4%) |
| $50,000 to $74,999 | 2,003 (84.2%) | 377 (15.8%) |
| $75,000 to $99,999 | 2,375 (86.6%) | 367 (13.4%) |
| $100,000 and over | 6,561 (95.0%) | 347 (5.0%) |
Public vs Private Health Insurance Coverage by Age in Gibsonton
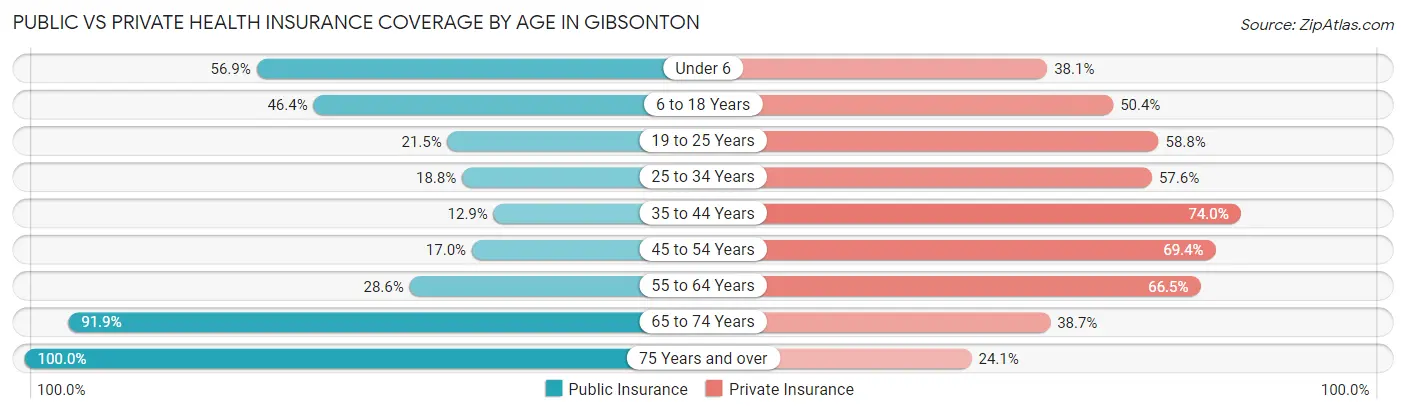
| Age Bracket | Public Insurance | Private Insurance |
| Under 6 | 796 (56.9%) | 533 (38.1%) |
| 6 to 18 Years | 1,995 (46.4%) | 2,167 (50.4%) |
| 19 to 25 Years | 276 (21.5%) | 755 (58.8%) |
| 25 to 34 Years | 383 (18.8%) | 1,173 (57.6%) |
| 35 to 44 Years | 427 (12.9%) | 2,442 (74.0%) |
| 45 to 54 Years | 381 (17.0%) | 1,557 (69.4%) |
| 55 to 64 Years | 482 (28.5%) | 1,123 (66.5%) |
| 65 to 74 Years | 917 (91.9%) | 386 (38.7%) |
| 75 Years and over | 490 (100.0%) | 118 (24.1%) |
| Total | 6,147 (34.6%) | 10,254 (57.8%) |
Disability Status by Sex by Age in Gibsonton
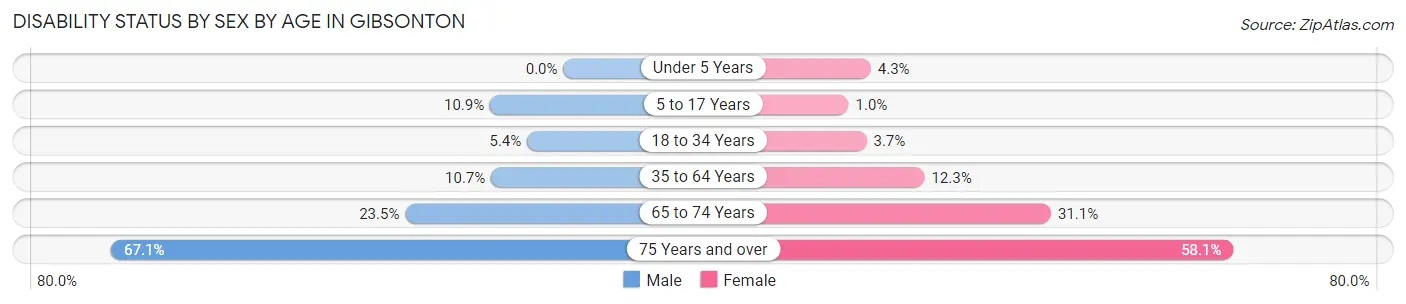
| Age Bracket | Male | Female |
| Under 5 Years | 0 (0.0%) | 23 (4.3%) |
| 5 to 17 Years | 225 (10.9%) | 24 (1.0%) |
| 18 to 34 Years | 95 (5.4%) | 62 (3.7%) |
| 35 to 64 Years | 369 (10.7%) | 466 (12.3%) |
| 65 to 74 Years | 127 (23.5%) | 142 (31.1%) |
| 75 Years and over | 143 (67.1%) | 161 (58.1%) |
Disability Class by Sex by Age in Gibsonton
Disability Class: Hearing Difficulty
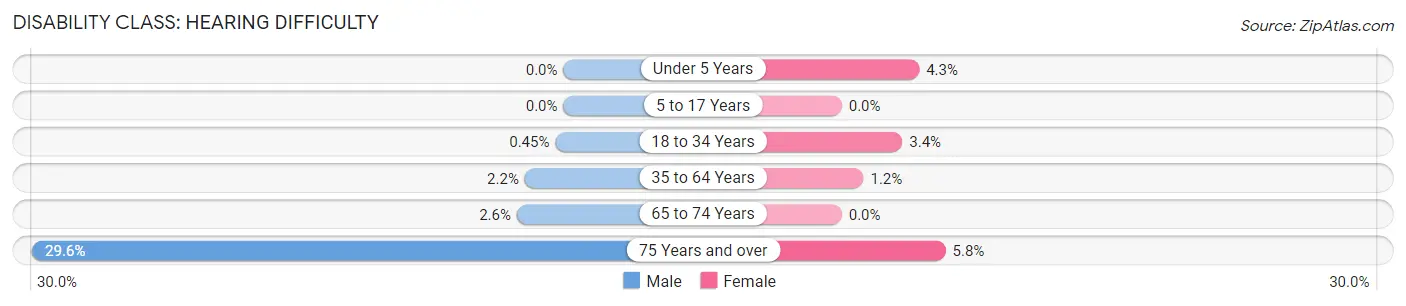
| Age Bracket | Male | Female |
| Under 5 Years | 0 (0.0%) | 23 (4.3%) |
| 5 to 17 Years | 0 (0.0%) | 0 (0.0%) |
| 18 to 34 Years | 8 (0.4%) | 57 (3.4%) |
| 35 to 64 Years | 74 (2.1%) | 46 (1.2%) |
| 65 to 74 Years | 14 (2.6%) | 0 (0.0%) |
| 75 Years and over | 63 (29.6%) | 16 (5.8%) |
Disability Class: Vision Difficulty
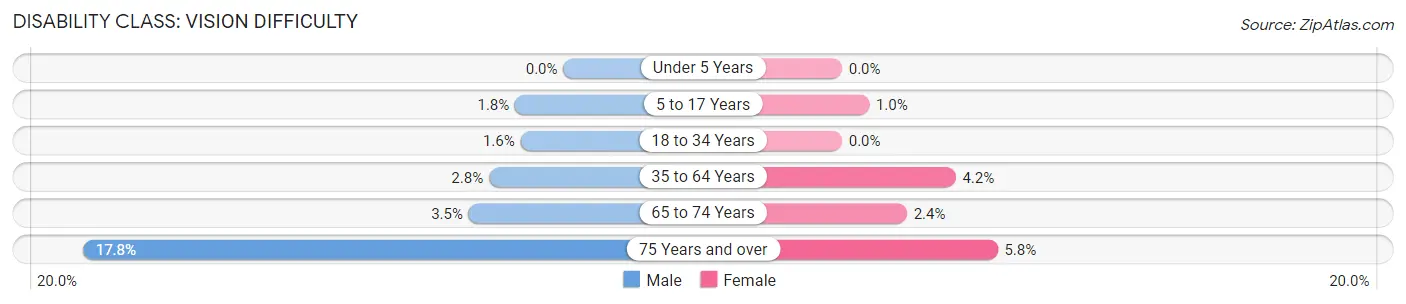
| Age Bracket | Male | Female |
| Under 5 Years | 0 (0.0%) | 0 (0.0%) |
| 5 to 17 Years | 37 (1.8%) | 24 (1.0%) |
| 18 to 34 Years | 28 (1.6%) | 0 (0.0%) |
| 35 to 64 Years | 95 (2.8%) | 160 (4.2%) |
| 65 to 74 Years | 19 (3.5%) | 11 (2.4%) |
| 75 Years and over | 38 (17.8%) | 16 (5.8%) |
Disability Class: Cognitive Difficulty
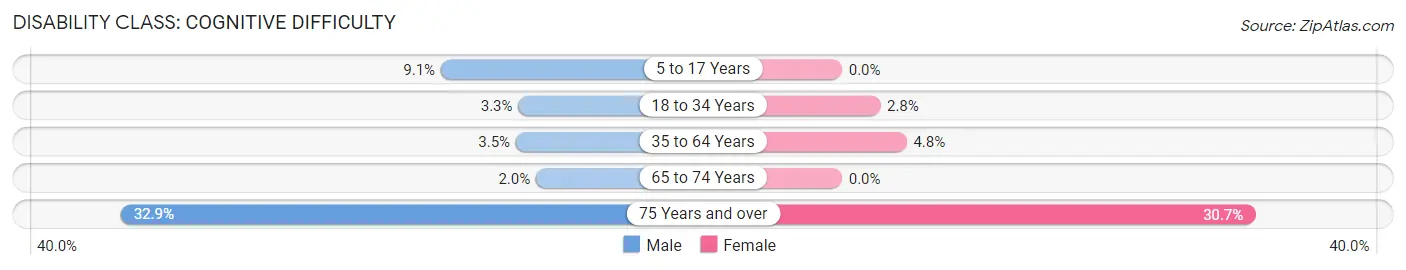
| Age Bracket | Male | Female |
| 5 to 17 Years | 188 (9.1%) | 0 (0.0%) |
| 18 to 34 Years | 59 (3.3%) | 48 (2.8%) |
| 35 to 64 Years | 121 (3.5%) | 182 (4.8%) |
| 65 to 74 Years | 11 (2.0%) | 0 (0.0%) |
| 75 Years and over | 70 (32.9%) | 85 (30.7%) |
Disability Class: Ambulatory Difficulty
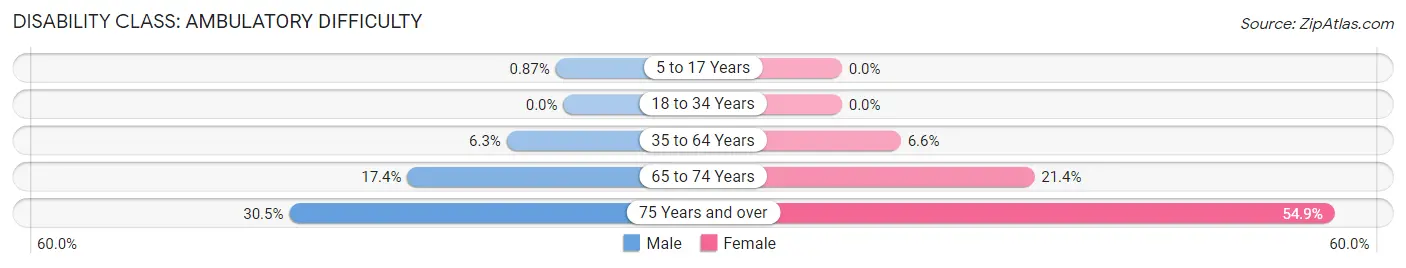
| Age Bracket | Male | Female |
| 5 to 17 Years | 18 (0.9%) | 0 (0.0%) |
| 18 to 34 Years | 0 (0.0%) | 0 (0.0%) |
| 35 to 64 Years | 217 (6.3%) | 249 (6.6%) |
| 65 to 74 Years | 94 (17.4%) | 98 (21.4%) |
| 75 Years and over | 65 (30.5%) | 152 (54.9%) |
Disability Class: Self-Care Difficulty
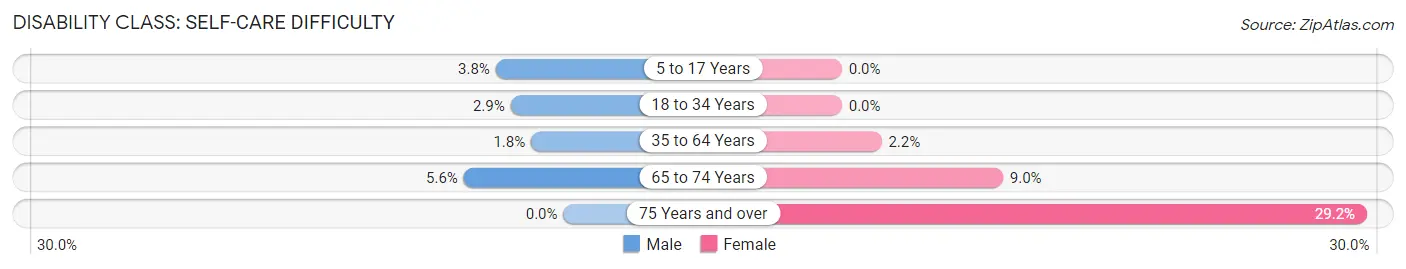
| Age Bracket | Male | Female |
| 5 to 17 Years | 78 (3.8%) | 0 (0.0%) |
| 18 to 34 Years | 52 (2.9%) | 0 (0.0%) |
| 35 to 64 Years | 62 (1.8%) | 84 (2.2%) |
| 65 to 74 Years | 30 (5.6%) | 41 (9.0%) |
| 75 Years and over | 0 (0.0%) | 81 (29.2%) |
Technology Access in Gibsonton
Computing Device Access in Gibsonton
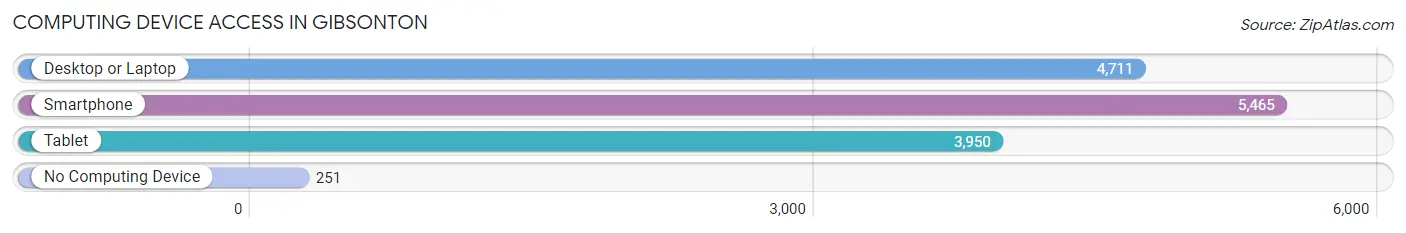
| Device Type | # Households | % Households |
| Desktop or Laptop | 4,711 | 81.0% |
| Smartphone | 5,465 | 93.9% |
| Tablet | 3,950 | 67.9% |
| No Computing Device | 251 | 4.3% |
| Total | 5,818 | 100.0% |
Internet Access in Gibsonton
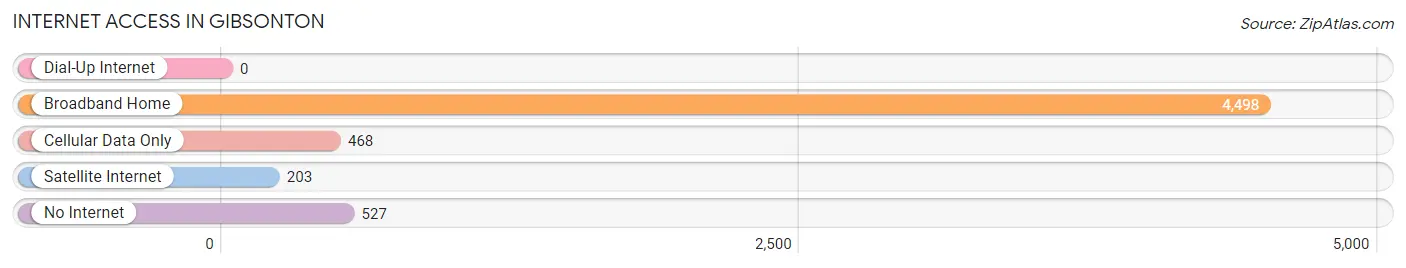
| Internet Type | # Households | % Households |
| Dial-Up Internet | 0 | 0.0% |
| Broadband Home | 4,498 | 77.3% |
| Cellular Data Only | 468 | 8.0% |
| Satellite Internet | 203 | 3.5% |
| No Internet | 527 | 9.1% |
| Total | 5,818 | 100.0% |
Gibsonton Summary
Gibsonton is a census-designated place (CDP) located in Hillsborough County, Florida, United States. The population was 14,234 at the 2010 census. It is located near Tampa and Brandon.
History
Gibsonton was founded in the early 1900s by a group of traveling carnival workers. The town was named after its first postmaster, James Gibson. The town was originally a winter home for carnival workers, and it was known as the “Showtown USA”. The town was home to many sideshow performers, including the world’s tallest man, the world’s smallest woman, and the world’s fattest man.
Geography
Gibsonton is located at 27°52′N 82°22′W (27.867, -82.367). According to the United States Census Bureau, the CDP has a total area of 8.3 square miles (21.5 km2), of which 8.2 square miles (21.3 km2) is land and 0.1 square miles (0.2 km2) (1.17%) is water.
Economy
Gibsonton’s economy is largely based on tourism and retail. The town is home to several large retail stores, including Walmart, Target, and Lowe’s. There are also several restaurants and bars in the area.
Demographics
As of the census of 2000, there were 14,234 people, 5,845 households, and 3,845 families residing in the CDP. The population density was 1,731.3 people per square mile (669.3/km2). There were 6,093 housing units at an average density of 741.3/sq mi (286.3/km2). The racial makeup of the CDP was 79.2% White, 11.2% African American, 0.4% Native American, 2.2% Asian, 0.1% Pacific Islander, 4.7% from other races, and 2.2% from two or more races. Hispanic or Latino of any race were 14.2% of the population.
There were 5,845 households, out of which 28.2% had children under the age of 18 living with them, 46.2% were married couples living together, 14.2% had a female householder with no husband present, and 33.7% were non-families. 25.7% of all households were made up of individuals, and 8.2% had someone living alone who was 65 years of age or older. The average household size was 2.41 and the average family size was 2.88.
In the CDP, the population was spread out, with 22.3% under the age of 18, 8.2% from 18 to 24, 32.2% from 25 to 44, 22.3% from 45 to 64, and 14.9% who were 65 years of age or older. The median age was 36 years. For every 100 females, there were 97.2 males. For every 100 females age 18 and over, there were 94.2 males.
The median income for a household in the CDP was $35,945, and the median income for a family was $41,945. Males had a median income of $30,945 versus $25,945 for females. The per capita income for the CDP was $17,945. About 9.2% of families and 11.2% of the population were below the poverty line, including 15.2% of those under age 18 and 8.2% of those age 65 or over.
Common Questions
What is Per Capita Income in Gibsonton?
Per Capita income in Gibsonton is $31,631.
What is the Median Family Income in Gibsonton?
Median Family Income in Gibsonton is $82,180.
What is the Median Household income in Gibsonton?
Median Household Income in Gibsonton is $73,167.
What is Income or Wage Gap in Gibsonton?
Income or Wage Gap in Gibsonton is 13.9%.
Women in Gibsonton earn 86.1 cents for every dollar earned by a man.
What is Family Income Deficit in Gibsonton?
Family Income Deficit in Gibsonton is $12,402.
Families that are below poverty line in Gibsonton earn $12,402 less on average than the poverty threshold level.
What is Inequality or Gini Index in Gibsonton?
Inequality or Gini Index in Gibsonton is 0.47.
What is the Total Population of Gibsonton?
Total Population of Gibsonton is 17,879.
What is the Total Male Population of Gibsonton?
Total Male Population of Gibsonton is 8,747.
What is the Total Female Population of Gibsonton?
Total Female Population of Gibsonton is 9,132.
What is the Ratio of Males per 100 Females in Gibsonton?
There are 95.78 Males per 100 Females in Gibsonton.
What is the Ratio of Females per 100 Males in Gibsonton?
There are 104.40 Females per 100 Males in Gibsonton.
What is the Median Population Age in Gibsonton?
Median Population Age in Gibsonton is 34.1 Years.
What is the Average Family Size in Gibsonton
Average Family Size in Gibsonton is 3.5 People.
What is the Average Household Size in Gibsonton
Average Household Size in Gibsonton is 3.1 People.
How Large is the Labor Force in Gibsonton?
There are 8,987 People in the Labor Forcein in Gibsonton.
What is the Percentage of People in the Labor Force in Gibsonton?
68.8% of People are in the Labor Force in Gibsonton.
What is the Unemployment Rate in Gibsonton?
Unemployment Rate in Gibsonton is 6.2%.