East Hartford, CT Map & Demographics
East Hartford Map
East Hartford Overview
$32,527
PER CAPITA INCOME
$77,413
AVG FAMILY INCOME
$64,244
AVG HOUSEHOLD INCOME
17.0%
WAGE / INCOME GAP [ % ]
83.0¢/ $1
WAGE / INCOME GAP [ $ ]
$8,244
FAMILY INCOME DEFICIT
0.44
INEQUALITY / GINI INDEX
50,942
TOTAL POPULATION
24,970
MALE POPULATION
25,972
FEMALE POPULATION
96.14
MALES / 100 FEMALES
104.01
FEMALES / 100 MALES
37.8
MEDIAN AGE
3.1
AVG FAMILY SIZE
2.5
AVG HOUSEHOLD SIZE
27,594
LABOR FORCE [ PEOPLE ]
66.3%
PERCENT IN LABOR FORCE
6.7%
UNEMPLOYMENT RATE
East Hartford Area Codes
Income in East Hartford
Income Overview in East Hartford
Per Capita Income in East Hartford is $32,527, while median incomes of families and households are $77,413 and $64,244 respectively.
| Characteristic | Number | Measure |
| Per Capita Income | 50,942 | $32,527 |
| Median Family Income | 12,960 | $77,413 |
| Mean Family Income | 12,960 | $90,266 |
| Median Household Income | 20,086 | $64,244 |
| Mean Household Income | 20,086 | $80,586 |
| Income Deficit | 12,960 | $8,244 |
| Wage / Income Gap (%) | 50,942 | 17.01% |
| Wage / Income Gap ($) | 50,942 | 82.99¢ per $1 |
| Gini / Inequality Index | 50,942 | 0.44 |
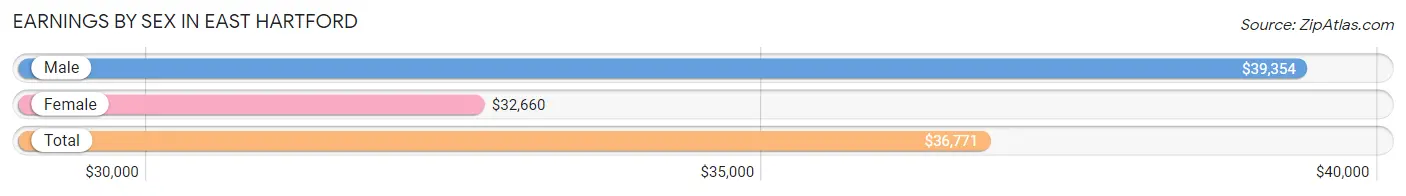
Earnings by Sex in East Hartford
Average Earnings in East Hartford are $36,771, $39,354 for men and $32,660 for women, a difference of 17.0%.
| Sex | Number | Average Earnings |
| Male | 14,432 (51.0%) | $39,354 |
| Female | 13,842 (49.0%) | $32,660 |
| Total | 28,274 (100.0%) | $36,771 |
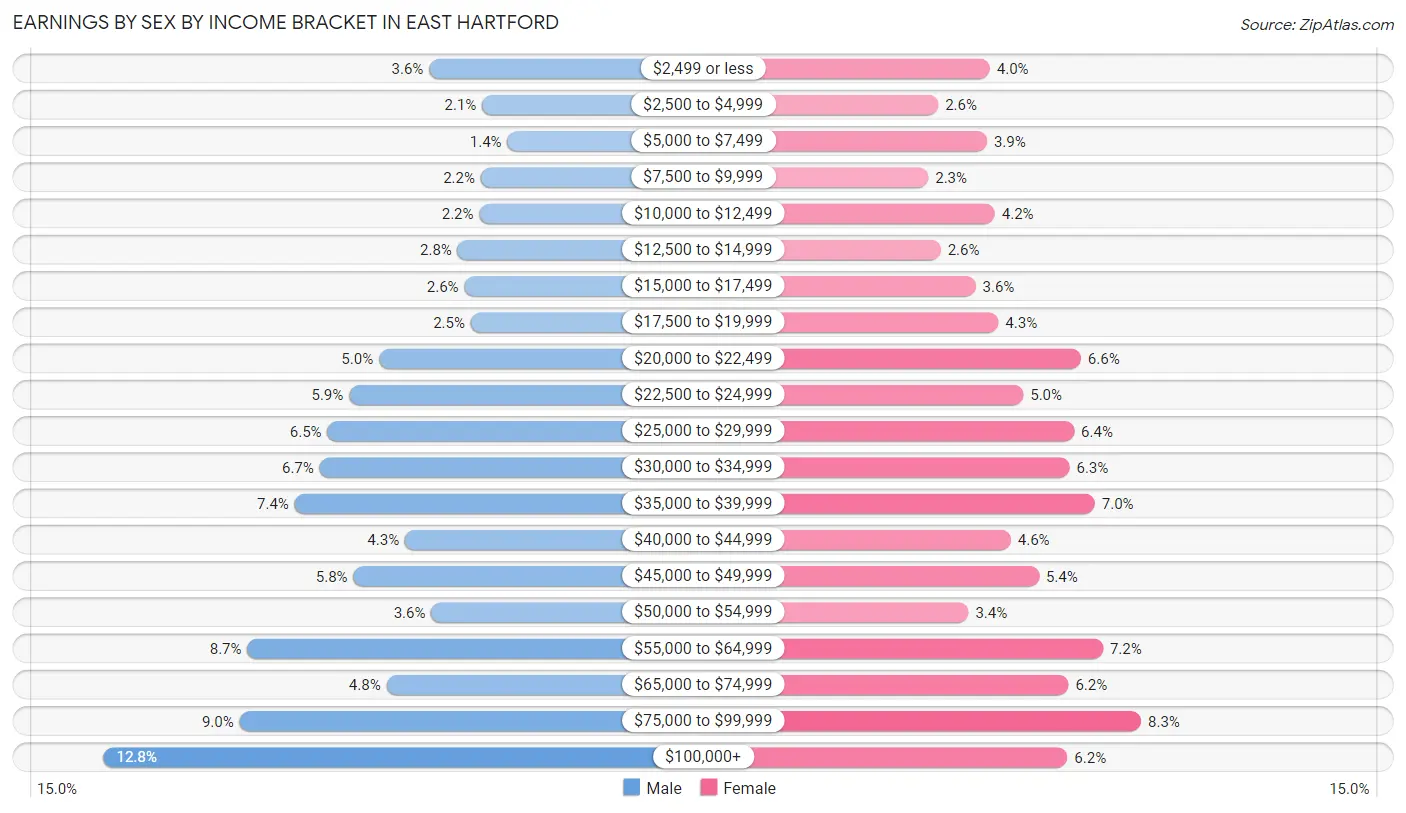
Earnings by Sex by Income Bracket in East Hartford
The most common earnings brackets in East Hartford are $100,000+ for men (1,845 | 12.8%) and $75,000 to $99,999 for women (1,145 | 8.3%).
| Income | Male | Female |
| $2,499 or less | 524 (3.6%) | 556 (4.0%) |
| $2,500 to $4,999 | 309 (2.1%) | 356 (2.6%) |
| $5,000 to $7,499 | 206 (1.4%) | 545 (3.9%) |
| $7,500 to $9,999 | 314 (2.2%) | 317 (2.3%) |
| $10,000 to $12,499 | 321 (2.2%) | 576 (4.2%) |
| $12,500 to $14,999 | 408 (2.8%) | 366 (2.6%) |
| $15,000 to $17,499 | 381 (2.6%) | 501 (3.6%) |
| $17,500 to $19,999 | 355 (2.5%) | 589 (4.3%) |
| $20,000 to $22,499 | 728 (5.0%) | 911 (6.6%) |
| $22,500 to $24,999 | 848 (5.9%) | 687 (5.0%) |
| $25,000 to $29,999 | 936 (6.5%) | 884 (6.4%) |
| $30,000 to $34,999 | 969 (6.7%) | 867 (6.3%) |
| $35,000 to $39,999 | 1,069 (7.4%) | 965 (7.0%) |
| $40,000 to $44,999 | 622 (4.3%) | 638 (4.6%) |
| $45,000 to $49,999 | 831 (5.8%) | 747 (5.4%) |
| $50,000 to $54,999 | 515 (3.6%) | 474 (3.4%) |
| $55,000 to $64,999 | 1,261 (8.7%) | 997 (7.2%) |
| $65,000 to $74,999 | 697 (4.8%) | 863 (6.2%) |
| $75,000 to $99,999 | 1,293 (9.0%) | 1,145 (8.3%) |
| $100,000+ | 1,845 (12.8%) | 858 (6.2%) |
| Total | 14,432 (100.0%) | 13,842 (100.0%) |
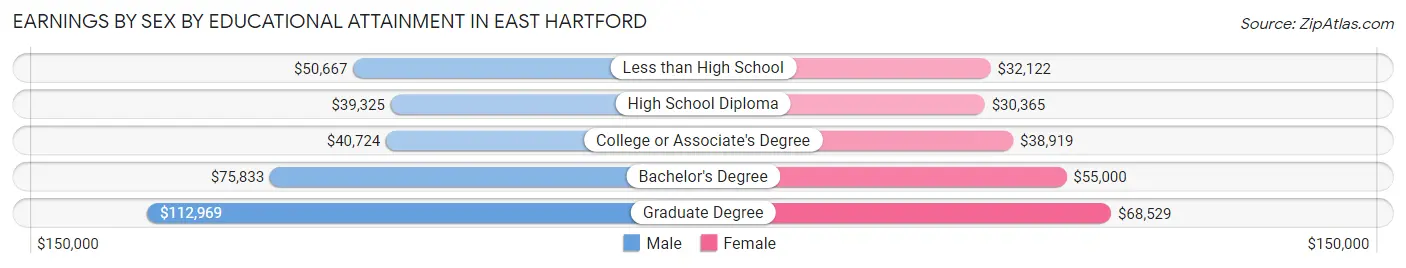
Earnings by Sex by Educational Attainment in East Hartford
Average earnings in East Hartford are $45,425 for men and $37,360 for women, a difference of 17.7%. Men with an educational attainment of graduate degree enjoy the highest average annual earnings of $112,969, while those with high school diploma education earn the least with $39,325. Women with an educational attainment of graduate degree earn the most with the average annual earnings of $68,529, while those with high school diploma education have the smallest earnings of $30,365.
| Educational Attainment | Male Income | Female Income |
| Less than High School | $50,667 | $32,122 |
| High School Diploma | $39,325 | $30,365 |
| College or Associate's Degree | $40,724 | $38,919 |
| Bachelor's Degree | $75,833 | $55,000 |
| Graduate Degree | $112,969 | $68,529 |
| Total | $45,425 | $37,360 |
Family Income in East Hartford
Family Income Brackets in East Hartford
According to the East Hartford family income data, there are 2,579 families falling into the $100,000 to $149,999 income range, which is the most common income bracket and makes up 19.9% of all families. Conversely, the $10,000 to $14,999 income bracket is the least frequent group with only 246 families (1.9%) belonging to this category.
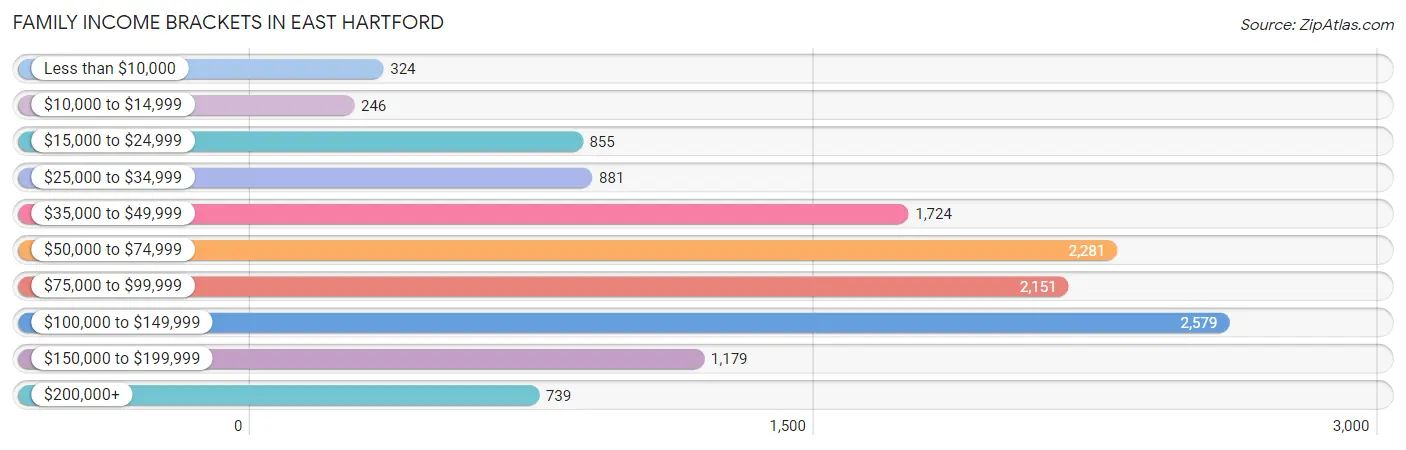
| Income Bracket | # Families | % Families |
| Less than $10,000 | 324 | 2.5% |
| $10,000 to $14,999 | 246 | 1.9% |
| $15,000 to $24,999 | 855 | 6.6% |
| $25,000 to $34,999 | 881 | 6.8% |
| $35,000 to $49,999 | 1,724 | 13.3% |
| $50,000 to $74,999 | 2,281 | 17.6% |
| $75,000 to $99,999 | 2,151 | 16.6% |
| $100,000 to $149,999 | 2,579 | 19.9% |
| $150,000 to $199,999 | 1,179 | 9.1% |
| $200,000+ | 739 | 5.7% |
Family Income by Famaliy Size in East Hartford
6-person families (393 | 3.0%) account for the highest median family income in East Hartford with $165,571 per family, while 2-person families (5,590 | 43.1%) have the highest median income of $31,789 per family member.
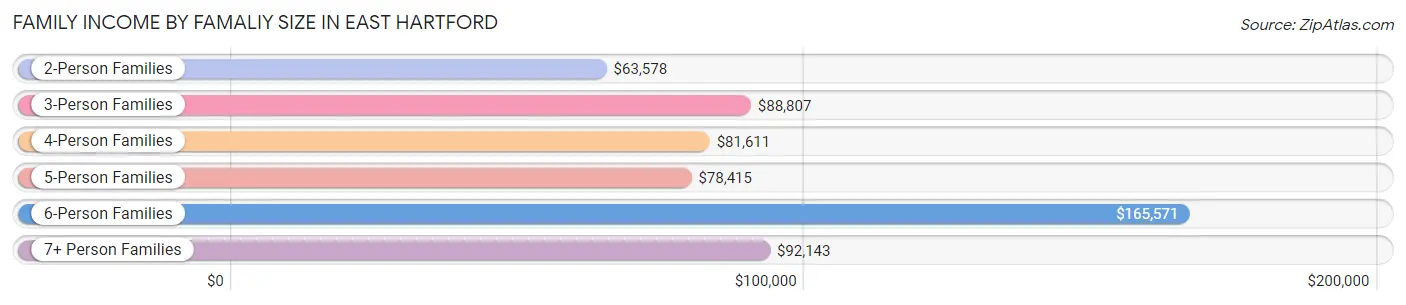
| Income Bracket | # Families | Median Income |
| 2-Person Families | 5,590 (43.1%) | $63,578 |
| 3-Person Families | 3,354 (25.9%) | $88,807 |
| 4-Person Families | 2,345 (18.1%) | $81,611 |
| 5-Person Families | 1,110 (8.6%) | $78,415 |
| 6-Person Families | 393 (3.0%) | $165,571 |
| 7+ Person Families | 168 (1.3%) | $92,143 |
| Total | 12,960 (100.0%) | $77,413 |
Family Income by Number of Earners in East Hartford
The median family income in East Hartford is $77,413, with families comprising 3+ earners (2,075) having the highest median family income of $134,659, while families with no earners (1,294) have the lowest median family income of $39,031, accounting for 16.0% and 10.0% of families, respectively.
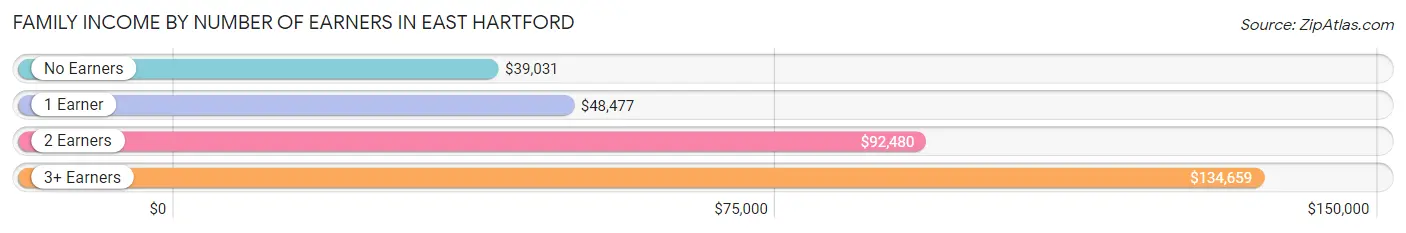
| Number of Earners | # Families | Median Income |
| No Earners | 1,294 (10.0%) | $39,031 |
| 1 Earner | 4,344 (33.5%) | $48,477 |
| 2 Earners | 5,247 (40.5%) | $92,480 |
| 3+ Earners | 2,075 (16.0%) | $134,659 |
| Total | 12,960 (100.0%) | $77,413 |
Household Income in East Hartford
Household Income Brackets in East Hartford
With 3,495 households falling in the category, the $50,000 to $74,999 income range is the most frequent in East Hartford, accounting for 17.4% of all households. In contrast, only 844 households (4.2%) fall into the $10,000 to $14,999 income bracket, making it the least populous group.
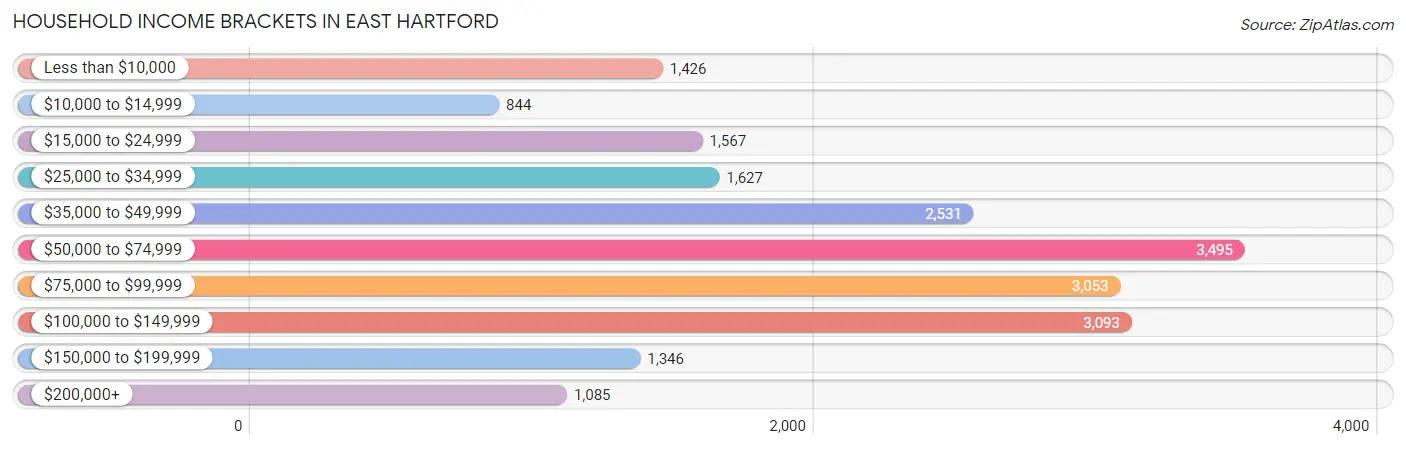
| Income Bracket | # Households | % Households |
| Less than $10,000 | 1,426 | 7.1% |
| $10,000 to $14,999 | 844 | 4.2% |
| $15,000 to $24,999 | 1,567 | 7.8% |
| $25,000 to $34,999 | 1,627 | 8.1% |
| $35,000 to $49,999 | 2,531 | 12.6% |
| $50,000 to $74,999 | 3,495 | 17.4% |
| $75,000 to $99,999 | 3,053 | 15.2% |
| $100,000 to $149,999 | 3,093 | 15.4% |
| $150,000 to $199,999 | 1,346 | 6.7% |
| $200,000+ | 1,085 | 5.4% |
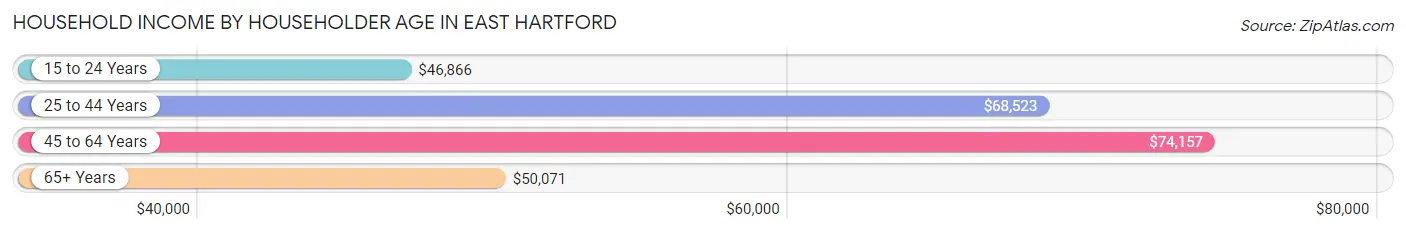
Household Income by Householder Age in East Hartford
The median household income in East Hartford is $64,244, with the highest median household income of $74,157 found in the 45 to 64 years age bracket for the primary householder. A total of 8,001 households (39.8%) fall into this category. Meanwhile, the 15 to 24 years age bracket for the primary householder has the lowest median household income of $46,866, with 542 households (2.7%) in this group.
| Income Bracket | # Households | Median Income |
| 15 to 24 Years | 542 (2.7%) | $46,866 |
| 25 to 44 Years | 7,113 (35.4%) | $68,523 |
| 45 to 64 Years | 8,001 (39.8%) | $74,157 |
| 65+ Years | 4,430 (22.1%) | $50,071 |
| Total | 20,086 (100.0%) | $64,244 |
Poverty in East Hartford
Income Below Poverty by Sex and Age in East Hartford
With 12.0% poverty level for males and 15.3% for females among the residents of East Hartford, under 5 year old males and 6 to 11 year old females are the most vulnerable to poverty, with 472 males (28.2%) and 429 females (23.1%) in their respective age groups living below the poverty level.
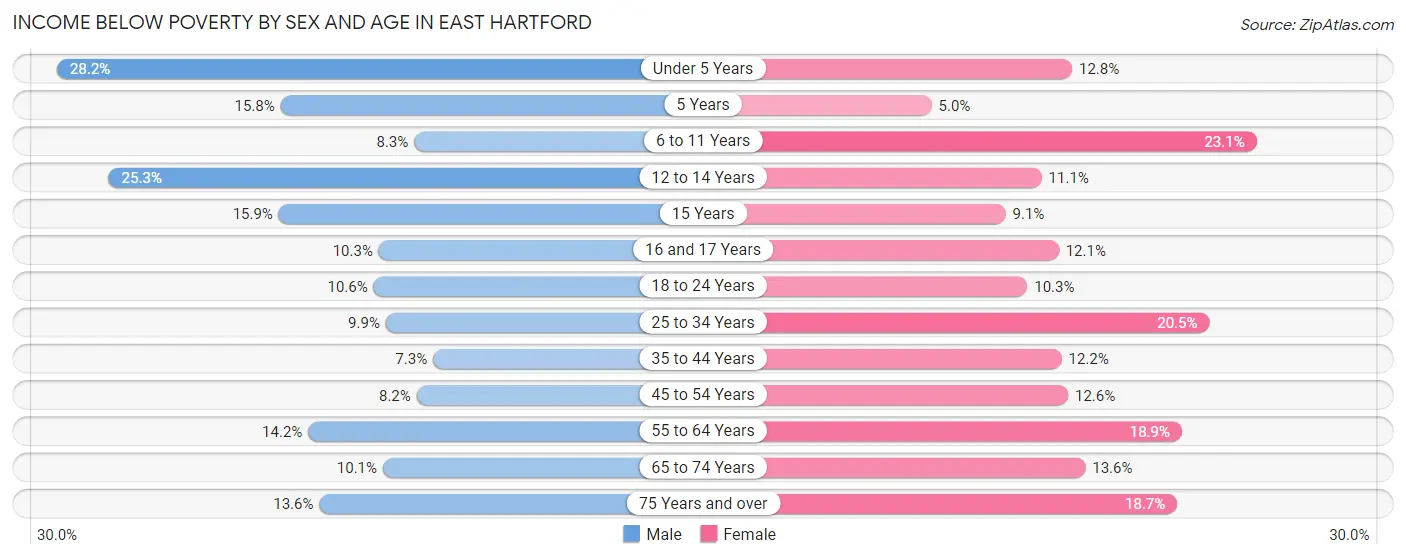
| Age Bracket | Male | Female |
| Under 5 Years | 472 (28.2%) | 182 (12.8%) |
| 5 Years | 46 (15.8%) | 5 (5.0%) |
| 6 to 11 Years | 111 (8.3%) | 429 (23.1%) |
| 12 to 14 Years | 257 (25.3%) | 86 (11.1%) |
| 15 Years | 39 (15.9%) | 33 (9.1%) |
| 16 and 17 Years | 106 (10.3%) | 82 (12.1%) |
| 18 to 24 Years | 258 (10.6%) | 278 (10.3%) |
| 25 to 34 Years | 387 (9.9%) | 664 (20.5%) |
| 35 to 44 Years | 264 (7.3%) | 459 (12.2%) |
| 45 to 54 Years | 253 (8.2%) | 390 (12.6%) |
| 55 to 64 Years | 454 (14.2%) | 705 (18.9%) |
| 65 to 74 Years | 180 (10.1%) | 306 (13.6%) |
| 75 Years and over | 150 (13.6%) | 314 (18.7%) |
| Total | 2,977 (12.0%) | 3,933 (15.3%) |
Income Above Poverty by Sex and Age in East Hartford
According to the poverty statistics in East Hartford, males aged 35 to 44 years and females aged 5 years are the age groups that are most secure financially, with 92.7% of males and 95.0% of females in these age groups living above the poverty line.
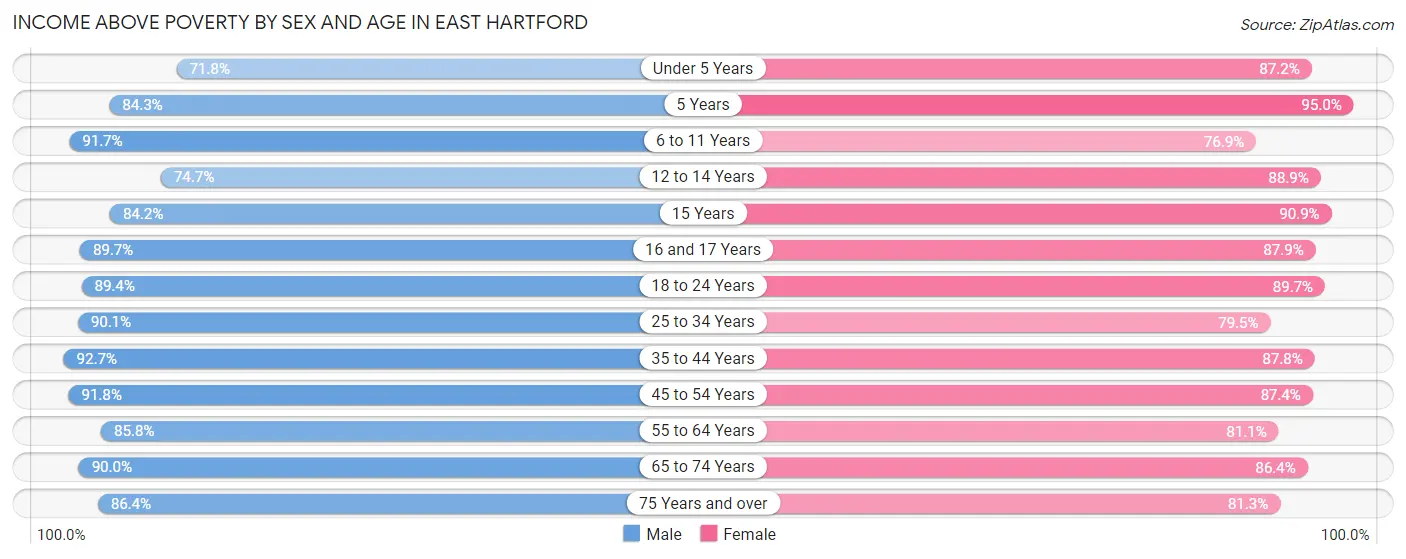
| Age Bracket | Male | Female |
| Under 5 Years | 1,202 (71.8%) | 1,238 (87.2%) |
| 5 Years | 246 (84.3%) | 95 (95.0%) |
| 6 to 11 Years | 1,224 (91.7%) | 1,429 (76.9%) |
| 12 to 14 Years | 758 (74.7%) | 687 (88.9%) |
| 15 Years | 207 (84.2%) | 329 (90.9%) |
| 16 and 17 Years | 925 (89.7%) | 597 (87.9%) |
| 18 to 24 Years | 2,184 (89.4%) | 2,413 (89.7%) |
| 25 to 34 Years | 3,526 (90.1%) | 2,582 (79.5%) |
| 35 to 44 Years | 3,370 (92.7%) | 3,292 (87.8%) |
| 45 to 54 Years | 2,845 (91.8%) | 2,705 (87.4%) |
| 55 to 64 Years | 2,740 (85.8%) | 3,019 (81.1%) |
| 65 to 74 Years | 1,611 (89.9%) | 1,951 (86.4%) |
| 75 Years and over | 954 (86.4%) | 1,368 (81.3%) |
| Total | 21,792 (88.0%) | 21,705 (84.7%) |
Income Below Poverty Among Married-Couple Families in East Hartford
The poverty statistics for married-couple families in East Hartford show that 3.8% or 272 of the total 7,114 families live below the poverty line. Families with 1 or 2 children have the highest poverty rate of 4.1%, comprising of 112 families. On the other hand, families with 5 or more children have the lowest poverty rate of 0.0%, which includes 0 families.
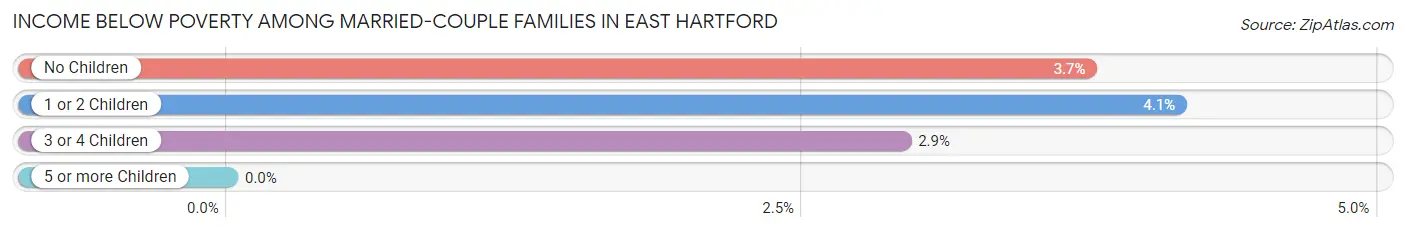
| Children | Above Poverty | Below Poverty |
| No Children | 3,813 (96.3%) | 148 (3.7%) |
| 1 or 2 Children | 2,600 (95.9%) | 112 (4.1%) |
| 3 or 4 Children | 398 (97.1%) | 12 (2.9%) |
| 5 or more Children | 31 (100.0%) | 0 (0.0%) |
| Total | 6,842 (96.2%) | 272 (3.8%) |
Income Below Poverty Among Single-Parent Households in East Hartford
According to the poverty data in East Hartford, 9.0% or 162 single-father households and 20.8% or 842 single-mother households are living below the poverty line. Among single-father households, those with 3 or 4 children have the highest poverty rate, with 71 households (57.3%) experiencing poverty. Likewise, among single-mother households, those with 5 or more children have the highest poverty rate, with 43 households (100.0%) falling below the poverty line.
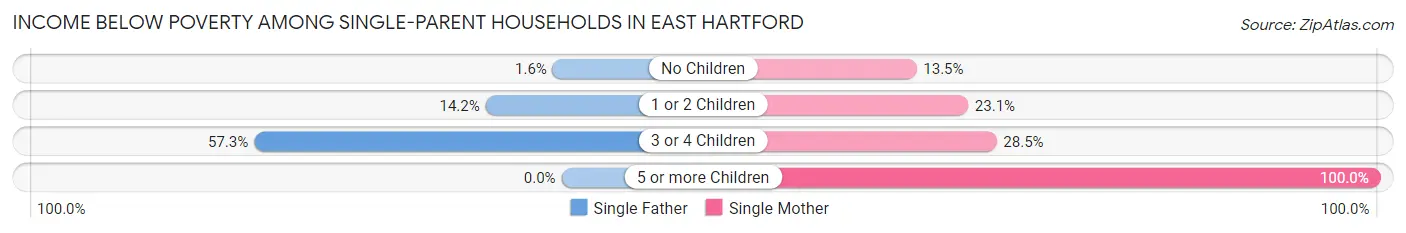
| Children | Single Father | Single Mother |
| No Children | 19 (1.6%) | 218 (13.5%) |
| 1 or 2 Children | 72 (14.1%) | 447 (23.1%) |
| 3 or 4 Children | 71 (57.3%) | 134 (28.4%) |
| 5 or more Children | 0 (0.0%) | 43 (100.0%) |
| Total | 162 (9.0%) | 842 (20.8%) |
Income Below Poverty Among Married-Couple vs Single-Parent Households in East Hartford
The poverty data for East Hartford shows that 272 of the married-couple family households (3.8%) and 1,004 of the single-parent households (17.2%) are living below the poverty level. Within the married-couple family households, those with 1 or 2 children have the highest poverty rate, with 112 households (4.1%) falling below the poverty line. Among the single-parent households, those with 5 or more children have the highest poverty rate, with 43 household (100.0%) living below poverty.
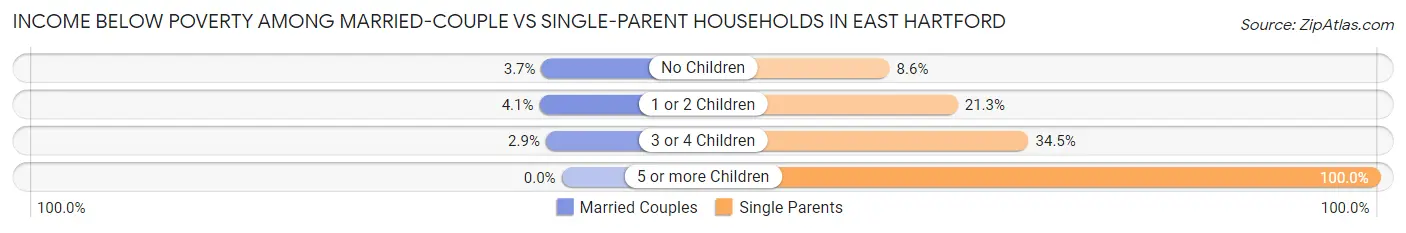
| Children | Married-Couple Families | Single-Parent Households |
| No Children | 148 (3.7%) | 237 (8.6%) |
| 1 or 2 Children | 112 (4.1%) | 519 (21.3%) |
| 3 or 4 Children | 12 (2.9%) | 205 (34.4%) |
| 5 or more Children | 0 (0.0%) | 43 (100.0%) |
| Total | 272 (3.8%) | 1,004 (17.2%) |
Race in East Hartford
The most populous races in East Hartford are White / Caucasian (23,939 | 47.0%), Hispanic or Latino (19,014 | 37.3%), and Black / African American (13,407 | 26.3%).
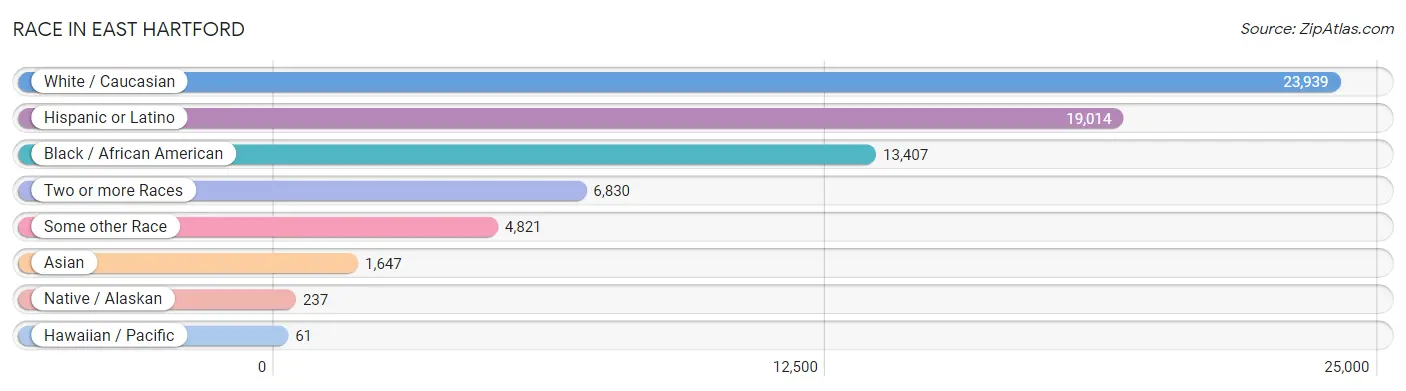
| Race | # Population | % Population |
| Asian | 1,647 | 3.2% |
| Black / African American | 13,407 | 26.3% |
| Hawaiian / Pacific | 61 | 0.1% |
| Hispanic or Latino | 19,014 | 37.3% |
| Native / Alaskan | 237 | 0.5% |
| White / Caucasian | 23,939 | 47.0% |
| Two or more Races | 6,830 | 13.4% |
| Some other Race | 4,821 | 9.5% |
| Total | 50,942 | 100.0% |
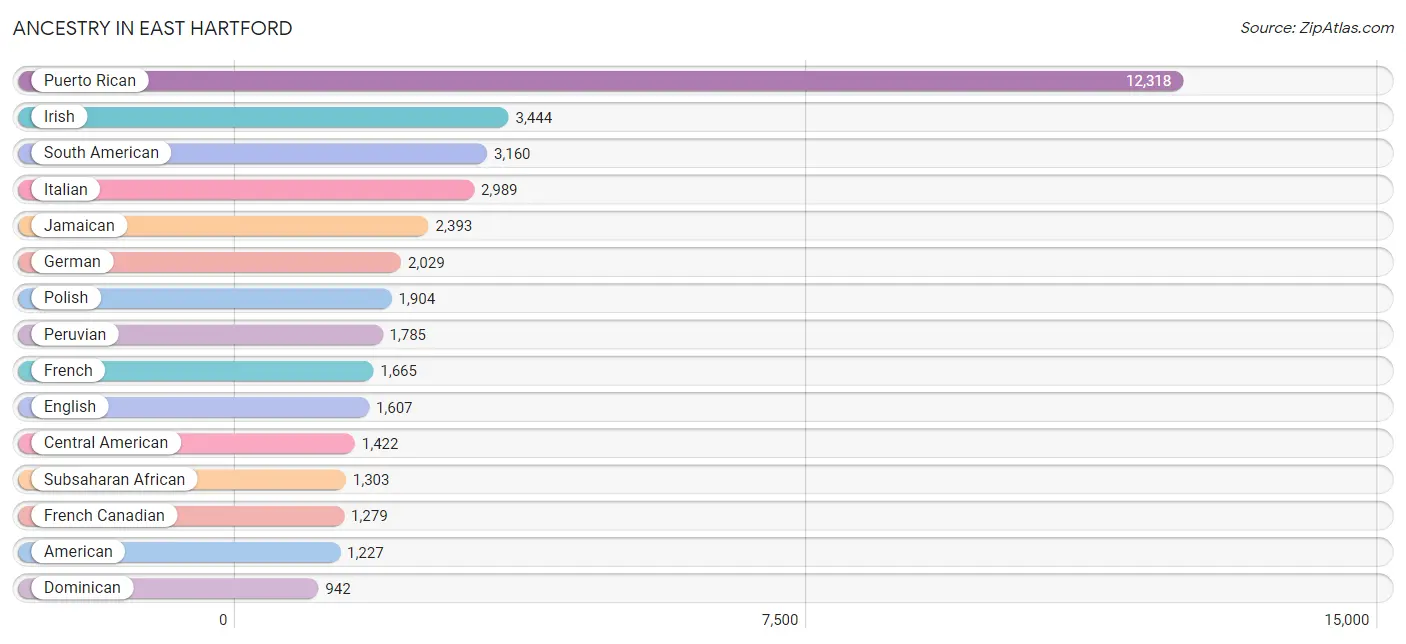
Ancestry in East Hartford
The most populous ancestries reported in East Hartford are Puerto Rican (12,318 | 24.2%), Irish (3,444 | 6.8%), South American (3,160 | 6.2%), Italian (2,989 | 5.9%), and Jamaican (2,393 | 4.7%), together accounting for 47.7% of all East Hartford residents.
| Ancestry | # Population | % Population |
| African | 263 | 0.5% |
| Albanian | 392 | 0.8% |
| American | 1,227 | 2.4% |
| Arab | 32 | 0.1% |
| Argentinean | 538 | 1.1% |
| Armenian | 21 | 0.0% |
| Austrian | 39 | 0.1% |
| Barbadian | 18 | 0.0% |
| Belizean | 15 | 0.0% |
| Bhutanese | 9 | 0.0% |
| Blackfeet | 13 | 0.0% |
| Bolivian | 188 | 0.4% |
| Brazilian | 791 | 1.5% |
| British | 47 | 0.1% |
| British West Indian | 71 | 0.1% |
| Burmese | 85 | 0.2% |
| Canadian | 286 | 0.6% |
| Central American | 1,422 | 2.8% |
| Central American Indian | 53 | 0.1% |
| Cherokee | 2 | 0.0% |
| Chilean | 62 | 0.1% |
| Colombian | 548 | 1.1% |
| Costa Rican | 21 | 0.0% |
| Cree | 13 | 0.0% |
| Cuban | 178 | 0.4% |
| Czech | 38 | 0.1% |
| Czechoslovakian | 11 | 0.0% |
| Danish | 77 | 0.2% |
| Dominican | 942 | 1.8% |
| Dutch | 121 | 0.2% |
| Eastern European | 23 | 0.1% |
| Ecuadorian | 18 | 0.0% |
| English | 1,607 | 3.2% |
| Ethiopian | 21 | 0.0% |
| European | 259 | 0.5% |
| Finnish | 15 | 0.0% |
| French | 1,665 | 3.3% |
| French American Indian | 20 | 0.0% |
| French Canadian | 1,279 | 2.5% |
| German | 2,029 | 4.0% |
| Ghanaian | 838 | 1.7% |
| Greek | 403 | 0.8% |
| Guatemalan | 64 | 0.1% |
| Guyanese | 323 | 0.6% |
| Haitian | 249 | 0.5% |
| Honduran | 462 | 0.9% |
| Hungarian | 61 | 0.1% |
| Indian (Asian) | 192 | 0.4% |
| Indonesian | 22 | 0.0% |
| Iraqi | 6 | 0.0% |
| Irish | 3,444 | 6.8% |
| Italian | 2,989 | 5.9% |
| Jamaican | 2,393 | 4.7% |
| Korean | 169 | 0.3% |
| Laotian | 5 | 0.0% |
| Latvian | 11 | 0.0% |
| Lebanese | 13 | 0.0% |
| Lithuanian | 336 | 0.7% |
| Malaysian | 121 | 0.2% |
| Mexican | 506 | 1.0% |
| Native Hawaiian | 9 | 0.0% |
| Nigerian | 181 | 0.4% |
| Northern European | 1 | 0.0% |
| Norwegian | 81 | 0.2% |
| Pakistani | 11 | 0.0% |
| Peruvian | 1,785 | 3.5% |
| Polish | 1,904 | 3.7% |
| Portuguese | 563 | 1.1% |
| Puerto Rican | 12,318 | 24.2% |
| Romanian | 7 | 0.0% |
| Russian | 626 | 1.2% |
| Salvadoran | 875 | 1.7% |
| Scandinavian | 11 | 0.0% |
| Scotch-Irish | 10 | 0.0% |
| Scottish | 318 | 0.6% |
| Serbian | 17 | 0.0% |
| South American | 3,160 | 6.2% |
| South American Indian | 13 | 0.0% |
| Spaniard | 67 | 0.1% |
| Sri Lankan | 683 | 1.3% |
| Subsaharan African | 1,303 | 2.6% |
| Swedish | 506 | 1.0% |
| Swiss | 10 | 0.0% |
| Syrian | 13 | 0.0% |
| Thai | 652 | 1.3% |
| Trinidadian and Tobagonian | 89 | 0.2% |
| Turkish | 19 | 0.0% |
| U.S. Virgin Islander | 2 | 0.0% |
| Ukrainian | 105 | 0.2% |
| Venezuelan | 21 | 0.0% |
| Vietnamese | 7 | 0.0% |
| Welsh | 52 | 0.1% |
| West Indian | 270 | 0.5% | View All 93 Rows |
Immigrants in East Hartford
The most numerous immigrant groups reported in East Hartford came from Latin America (6,083 | 11.9%), Caribbean (2,725 | 5.3%), South America (2,383 | 4.7%), Jamaica (1,692 | 3.3%), and Europe (1,422 | 2.8%), together accounting for 28.1% of all East Hartford residents.
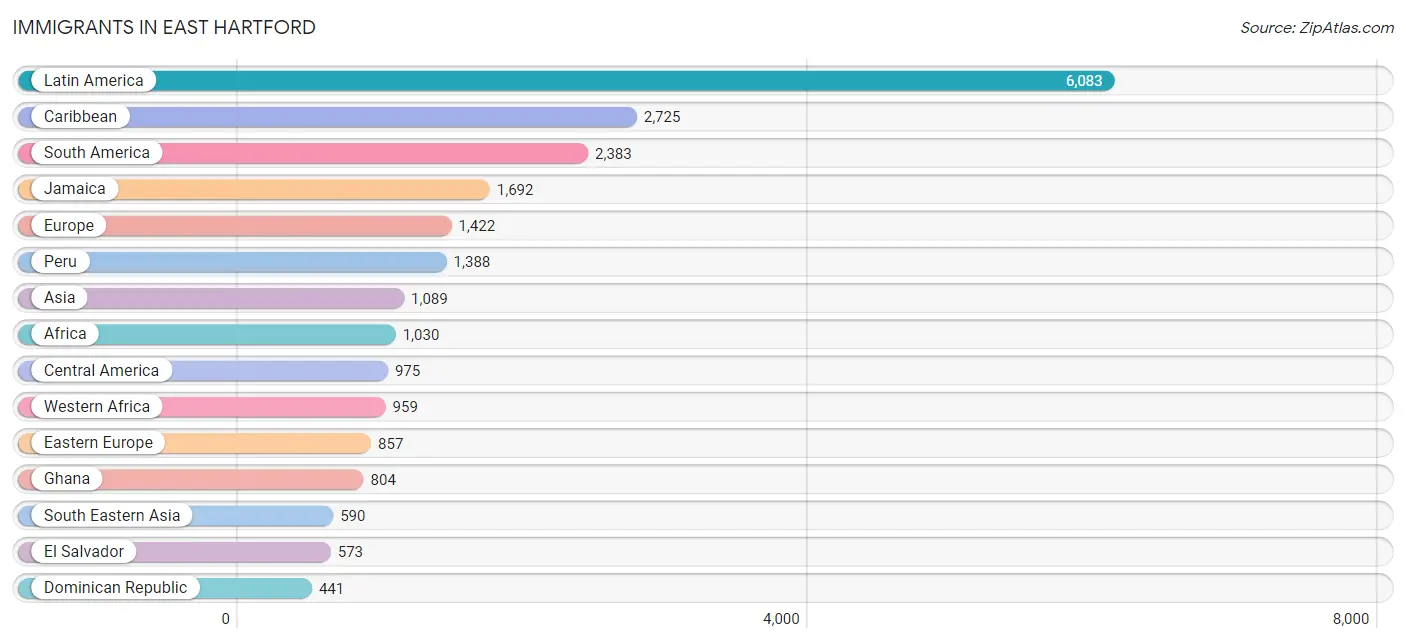
| Immigration Origin | # Population | % Population |
| Africa | 1,030 | 2.0% |
| Albania | 286 | 0.6% |
| Argentina | 127 | 0.3% |
| Asia | 1,089 | 2.1% |
| Australia | 23 | 0.1% |
| Azores | 17 | 0.0% |
| Bangladesh | 72 | 0.1% |
| Barbados | 15 | 0.0% |
| Bolivia | 74 | 0.2% |
| Brazil | 341 | 0.7% |
| Canada | 271 | 0.5% |
| Caribbean | 2,725 | 5.3% |
| Central America | 975 | 1.9% |
| Chile | 73 | 0.1% |
| China | 73 | 0.1% |
| Colombia | 198 | 0.4% |
| Costa Rica | 7 | 0.0% |
| Cuba | 81 | 0.2% |
| Dominican Republic | 441 | 0.9% |
| Eastern Africa | 7 | 0.0% |
| Eastern Asia | 73 | 0.1% |
| Eastern Europe | 857 | 1.7% |
| Ecuador | 18 | 0.0% |
| El Salvador | 573 | 1.1% |
| England | 53 | 0.1% |
| Ethiopia | 7 | 0.0% |
| Europe | 1,422 | 2.8% |
| Germany | 48 | 0.1% |
| Ghana | 804 | 1.6% |
| Greece | 91 | 0.2% |
| Guatemala | 14 | 0.0% |
| Guyana | 143 | 0.3% |
| Haiti | 124 | 0.2% |
| Honduras | 176 | 0.4% |
| Hong Kong | 13 | 0.0% |
| India | 340 | 0.7% |
| Indonesia | 5 | 0.0% |
| Iraq | 6 | 0.0% |
| Ireland | 4 | 0.0% |
| Italy | 132 | 0.3% |
| Jamaica | 1,692 | 3.3% |
| Laos | 73 | 0.1% |
| Latin America | 6,083 | 11.9% |
| Latvia | 4 | 0.0% |
| Mexico | 205 | 0.4% |
| Moldova | 23 | 0.1% |
| Nepal | 8 | 0.0% |
| Netherlands | 7 | 0.0% |
| Nigeria | 105 | 0.2% |
| Northern Europe | 99 | 0.2% |
| Oceania | 23 | 0.1% |
| Peru | 1,388 | 2.7% |
| Philippines | 85 | 0.2% |
| Poland | 115 | 0.2% |
| Portugal | 167 | 0.3% |
| Russia | 366 | 0.7% |
| South America | 2,383 | 4.7% |
| South Central Asia | 420 | 0.8% |
| South Eastern Asia | 590 | 1.2% |
| Southern Europe | 411 | 0.8% |
| Spain | 21 | 0.0% |
| St. Vincent and the Grenadines | 81 | 0.2% |
| Thailand | 6 | 0.0% |
| Trinidad and Tobago | 118 | 0.2% |
| Ukraine | 42 | 0.1% |
| Venezuela | 21 | 0.0% |
| Vietnam | 407 | 0.8% |
| West Indies | 17 | 0.0% |
| Western Africa | 959 | 1.9% |
| Western Asia | 6 | 0.0% |
| Western Europe | 55 | 0.1% | View All 71 Rows |
Sex and Age in East Hartford
Sex and Age in East Hartford
The most populous age groups in East Hartford are 25 to 29 Years (2,235 | 8.9%) for men and 55 to 59 Years (2,111 | 8.1%) for women.
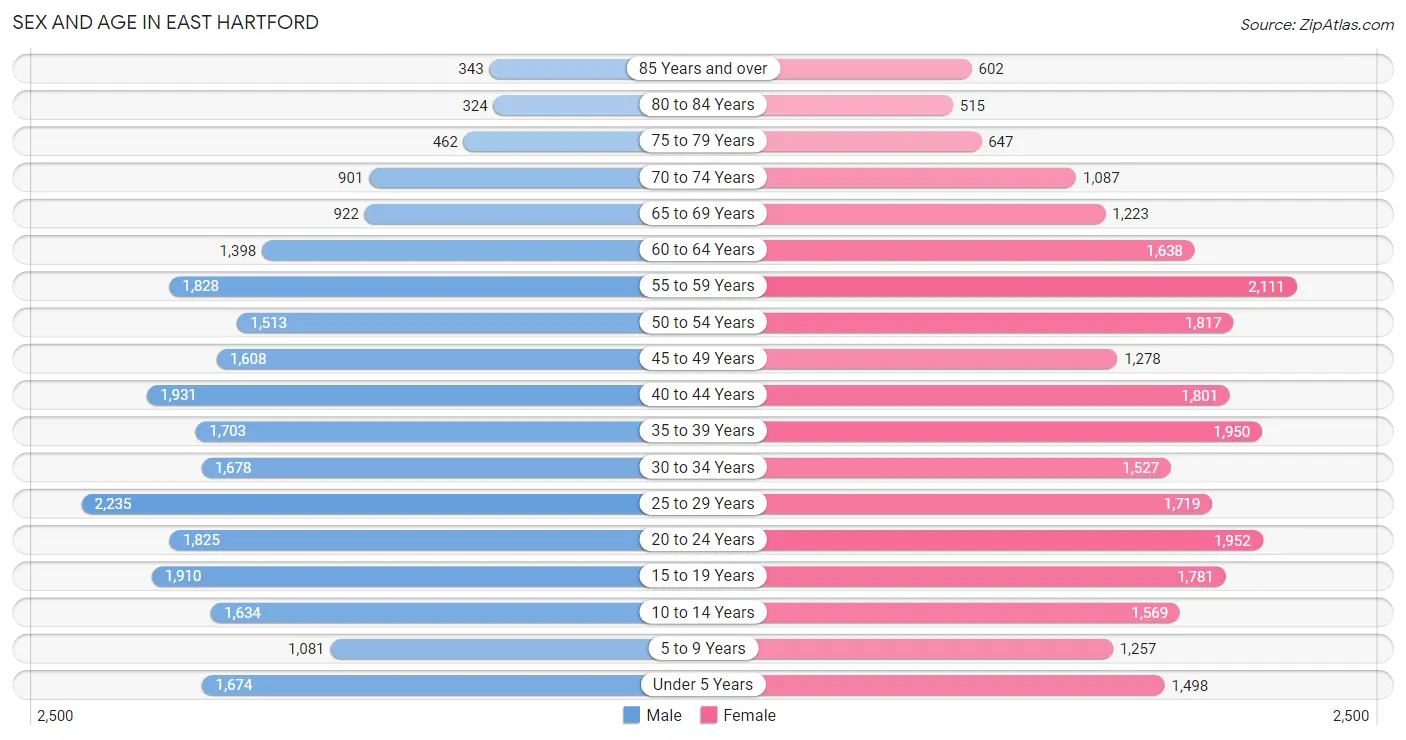
| Age Bracket | Male | Female |
| Under 5 Years | 1,674 (6.7%) | 1,498 (5.8%) |
| 5 to 9 Years | 1,081 (4.3%) | 1,257 (4.8%) |
| 10 to 14 Years | 1,634 (6.5%) | 1,569 (6.0%) |
| 15 to 19 Years | 1,910 (7.6%) | 1,781 (6.9%) |
| 20 to 24 Years | 1,825 (7.3%) | 1,952 (7.5%) |
| 25 to 29 Years | 2,235 (8.9%) | 1,719 (6.6%) |
| 30 to 34 Years | 1,678 (6.7%) | 1,527 (5.9%) |
| 35 to 39 Years | 1,703 (6.8%) | 1,950 (7.5%) |
| 40 to 44 Years | 1,931 (7.7%) | 1,801 (6.9%) |
| 45 to 49 Years | 1,608 (6.4%) | 1,278 (4.9%) |
| 50 to 54 Years | 1,513 (6.1%) | 1,817 (7.0%) |
| 55 to 59 Years | 1,828 (7.3%) | 2,111 (8.1%) |
| 60 to 64 Years | 1,398 (5.6%) | 1,638 (6.3%) |
| 65 to 69 Years | 922 (3.7%) | 1,223 (4.7%) |
| 70 to 74 Years | 901 (3.6%) | 1,087 (4.2%) |
| 75 to 79 Years | 462 (1.8%) | 647 (2.5%) |
| 80 to 84 Years | 324 (1.3%) | 515 (2.0%) |
| 85 Years and over | 343 (1.4%) | 602 (2.3%) |
| Total | 24,970 (100.0%) | 25,972 (100.0%) |
Families and Households in East Hartford
Median Family Size in East Hartford
The median family size in East Hartford is 3.11 persons per family, with married-couple families (7,114 | 54.9%) accounting for the largest median family size of 3.33 persons per family. On the other hand, single male/father families (1,790 | 13.8%) represent the smallest median family size with 2.59 persons per family.
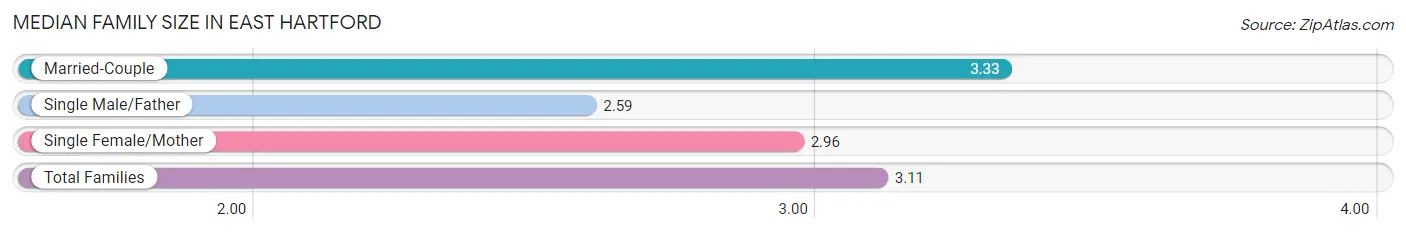
| Family Type | # Families | Family Size |
| Married-Couple | 7,114 (54.9%) | 3.33 |
| Single Male/Father | 1,790 (13.8%) | 2.59 |
| Single Female/Mother | 4,056 (31.3%) | 2.96 |
| Total Families | 12,960 (100.0%) | 3.11 |
Median Household Size in East Hartford
The median household size in East Hartford is 2.51 persons per household, with married-couple households (7,114 | 35.4%) accounting for the largest median household size of 3.39 persons per household. non-family households (7,126 | 35.5%) represent the smallest median household size with 1.17 persons per household.
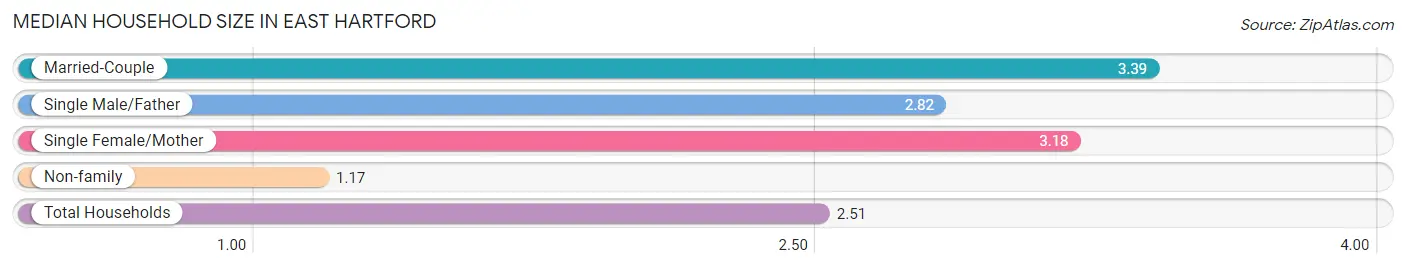
| Household Type | # Households | Household Size |
| Married-Couple | 7,114 (35.4%) | 3.39 |
| Single Male/Father | 1,790 (8.9%) | 2.82 |
| Single Female/Mother | 4,056 (20.2%) | 3.18 |
| Non-family | 7,126 (35.5%) | 1.17 |
| Total Households | 20,086 (100.0%) | 2.51 |
Household Size by Marriage Status in East Hartford
Out of a total of 20,086 households in East Hartford, 12,960 (64.5%) are family households, while 7,126 (35.5%) are nonfamily households. The most numerous type of family households are 2-person households, comprising 4,899, and the most common type of nonfamily households are 1-person households, comprising 6,000.
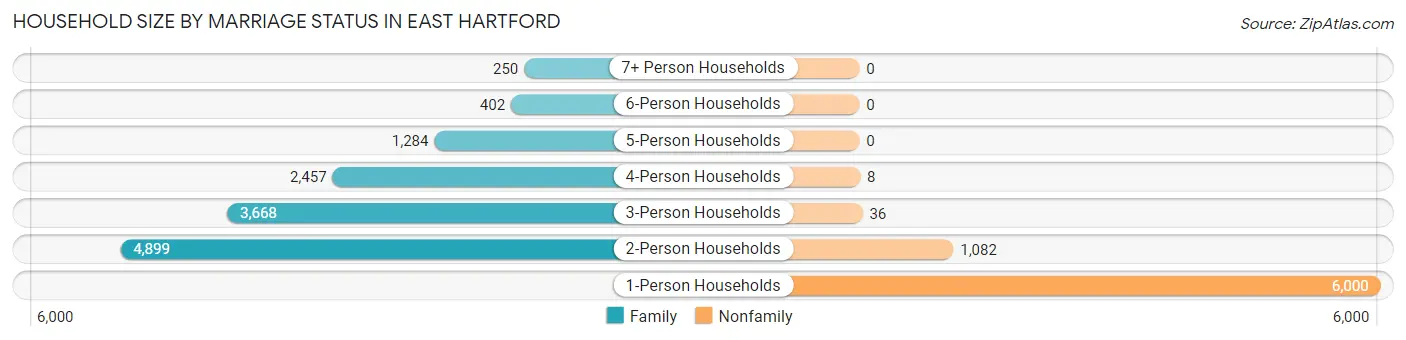
| Household Size | Family Households | Nonfamily Households |
| 1-Person Households | - | 6,000 (29.9%) |
| 2-Person Households | 4,899 (24.4%) | 1,082 (5.4%) |
| 3-Person Households | 3,668 (18.3%) | 36 (0.2%) |
| 4-Person Households | 2,457 (12.2%) | 8 (0.0%) |
| 5-Person Households | 1,284 (6.4%) | 0 (0.0%) |
| 6-Person Households | 402 (2.0%) | 0 (0.0%) |
| 7+ Person Households | 250 (1.2%) | 0 (0.0%) |
| Total | 12,960 (64.5%) | 7,126 (35.5%) |
Female Fertility in East Hartford
Fertility by Age in East Hartford
Average fertility rate in East Hartford is 72.0 births per 1,000 women. Women in the age bracket of 20 to 34 years have the highest fertility rate with 109.0 births per 1,000 women. Women in the age bracket of 20 to 34 years acount for 63.6% of all women with births.
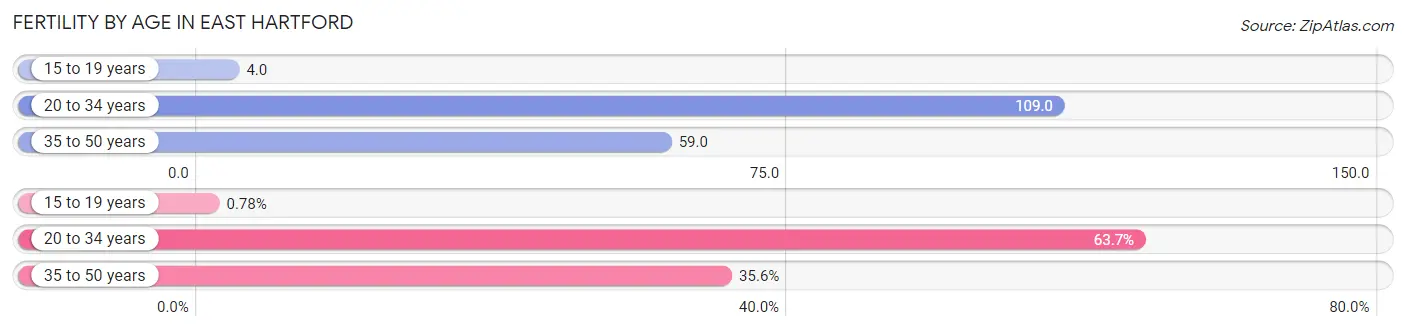
| Age Bracket | Women with Births | Births / 1,000 Women |
| 15 to 19 years | 7 (0.8%) | 4.0 |
| 20 to 34 years | 569 (63.6%) | 109.0 |
| 35 to 50 years | 318 (35.6%) | 59.0 |
| Total | 894 (100.0%) | 72.0 |
Fertility by Age by Marriage Status in East Hartford
38.9% of women with births (894) in East Hartford are married. The highest percentage of unmarried women with births falls into 15 to 19 years age bracket with 100.0% of them unmarried at the time of birth, while the lowest percentage of unmarried women with births belong to 35 to 50 years age bracket with 40.2% of them unmarried.
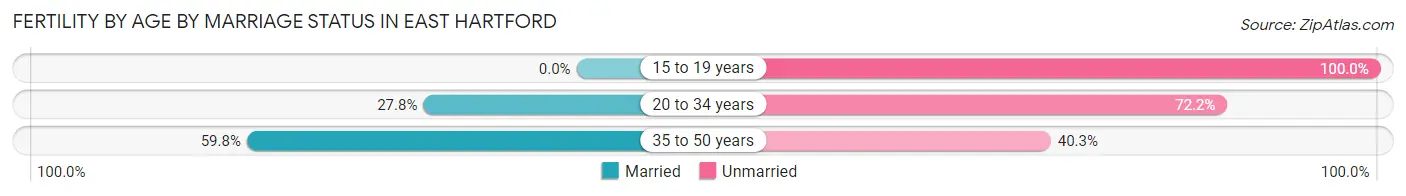
| Age Bracket | Married | Unmarried |
| 15 to 19 years | 0 (0.0%) | 7 (100.0%) |
| 20 to 34 years | 158 (27.8%) | 411 (72.2%) |
| 35 to 50 years | 190 (59.8%) | 128 (40.3%) |
| Total | 348 (38.9%) | 546 (61.1%) |
Fertility by Education in East Hartford
Average fertility rate in East Hartford is 72.0 births per 1,000 women. Women with the education attainment of bachelor's degree have the highest fertility rate of 186.0 births per 1,000 women, while women with the education attainment of less than high school have the lowest fertility at 32.0 births per 1,000 women. Women with the education attainment of bachelor's degree represent 36.0% of all women with births.
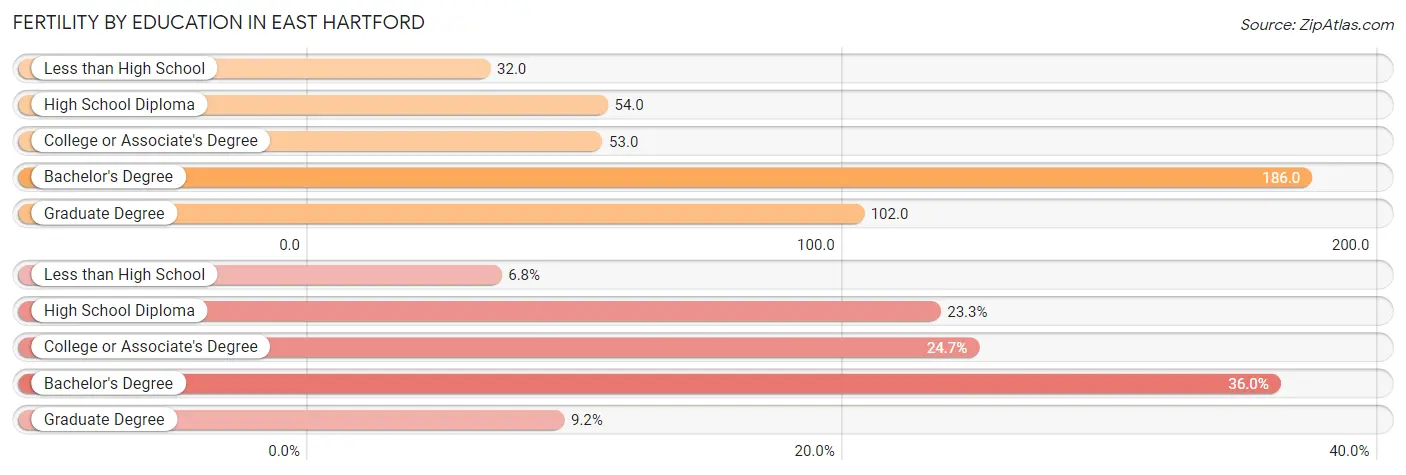
| Educational Attainment | Women with Births | Births / 1,000 Women |
| Less than High School | 61 (6.8%) | 32.0 |
| High School Diploma | 208 (23.3%) | 54.0 |
| College or Associate's Degree | 221 (24.7%) | 53.0 |
| Bachelor's Degree | 322 (36.0%) | 186.0 |
| Graduate Degree | 82 (9.2%) | 102.0 |
| Total | 894 (100.0%) | 72.0 |
Fertility by Education by Marriage Status in East Hartford
61.1% of women with births in East Hartford are unmarried. Women with the educational attainment of graduate degree are most likely to be married with 86.6% of them married at childbirth, while women with the educational attainment of less than high school are least likely to be married with 100.0% of them unmarried at childbirth.
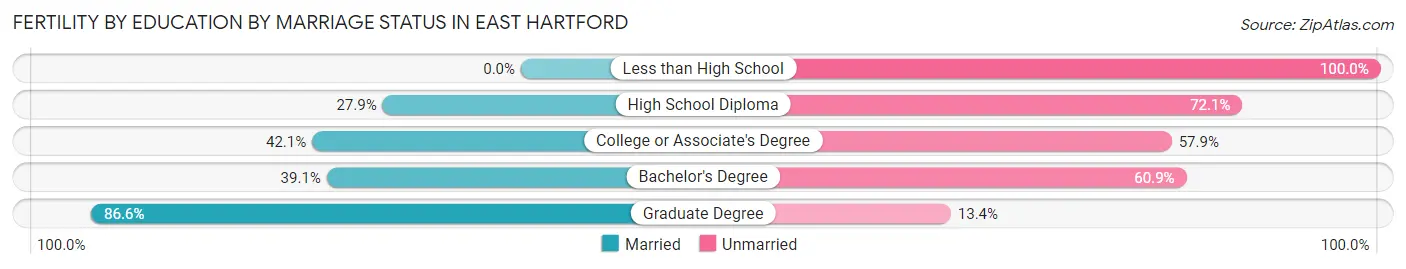
| Educational Attainment | Married | Unmarried |
| Less than High School | 0 (0.0%) | 61 (100.0%) |
| High School Diploma | 58 (27.9%) | 150 (72.1%) |
| College or Associate's Degree | 93 (42.1%) | 128 (57.9%) |
| Bachelor's Degree | 126 (39.1%) | 196 (60.9%) |
| Graduate Degree | 71 (86.6%) | 11 (13.4%) |
| Total | 348 (38.9%) | 546 (61.1%) |
Employment Characteristics in East Hartford
Employment by Class of Employer in East Hartford
Among the 25,272 employed individuals in East Hartford, private company employees (18,122 | 71.7%), not-for-profit organizations (2,245 | 8.9%), and state government employees (1,526 | 6.0%) make up the most common classes of employment.
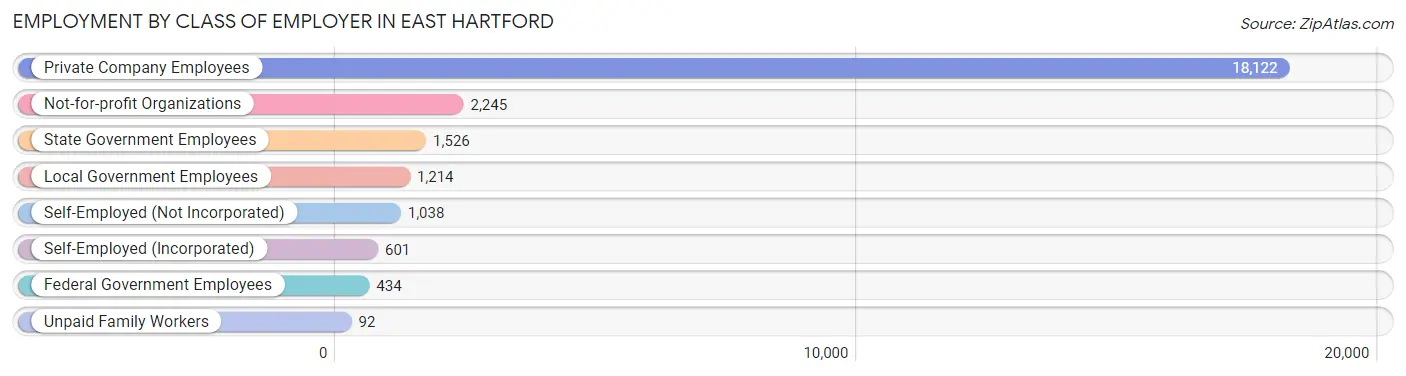
| Employer Class | # Employees | % Employees |
| Private Company Employees | 18,122 | 71.7% |
| Self-Employed (Incorporated) | 601 | 2.4% |
| Self-Employed (Not Incorporated) | 1,038 | 4.1% |
| Not-for-profit Organizations | 2,245 | 8.9% |
| Local Government Employees | 1,214 | 4.8% |
| State Government Employees | 1,526 | 6.0% |
| Federal Government Employees | 434 | 1.7% |
| Unpaid Family Workers | 92 | 0.4% |
| Total | 25,272 | 100.0% |
Employment Status by Age in East Hartford
According to the labor force statistics for East Hartford, out of the total population over 16 years of age (41,620), 66.3% or 27,594 individuals are in the labor force, with 6.7% or 1,849 of them unemployed. The age group with the highest labor force participation rate is 30 to 34 years, with 84.4% or 2,705 individuals in the labor force. Within the labor force, the 16 to 19 years age range has the highest percentage of unemployed individuals, with 23.2% or 319 of them being unemployed.
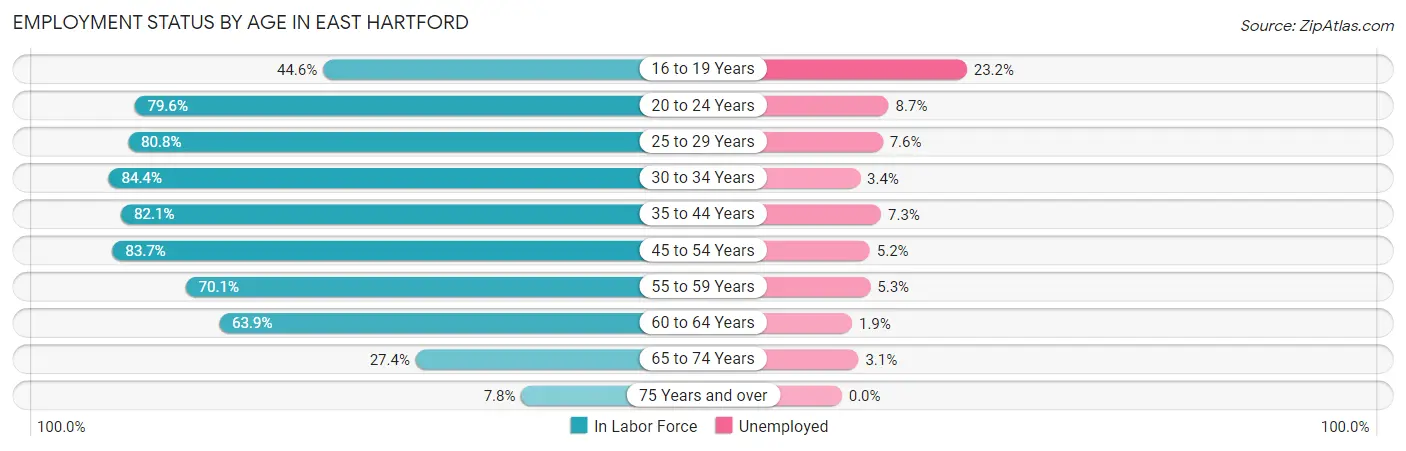
| Age Bracket | In Labor Force | Unemployed |
| 16 to 19 Years | 1,375 (44.6%) | 319 (23.2%) |
| 20 to 24 Years | 3,006 (79.6%) | 262 (8.7%) |
| 25 to 29 Years | 3,195 (80.8%) | 243 (7.6%) |
| 30 to 34 Years | 2,705 (84.4%) | 92 (3.4%) |
| 35 to 44 Years | 6,063 (82.1%) | 443 (7.3%) |
| 45 to 54 Years | 5,203 (83.7%) | 271 (5.2%) |
| 55 to 59 Years | 2,761 (70.1%) | 146 (5.3%) |
| 60 to 64 Years | 1,940 (63.9%) | 37 (1.9%) |
| 65 to 74 Years | 1,132 (27.4%) | 35 (3.1%) |
| 75 Years and over | 226 (7.8%) | 0 (0.0%) |
| Total | 27,594 (66.3%) | 1,849 (6.7%) |
Employment Status by Educational Attainment in East Hartford
According to labor force statistics for East Hartford, 78.8% of individuals (21,855) out of the total population between 25 and 64 years of age (27,735) are in the labor force, with 5.6% or 1,224 of them being unemployed. The group with the highest labor force participation rate are those with the educational attainment of bachelor's degree or higher, with 90.2% or 4,689 individuals in the labor force. Within the labor force, individuals with high school diploma education have the highest percentage of unemployment, with 8.6% or 714 of them being unemployed.
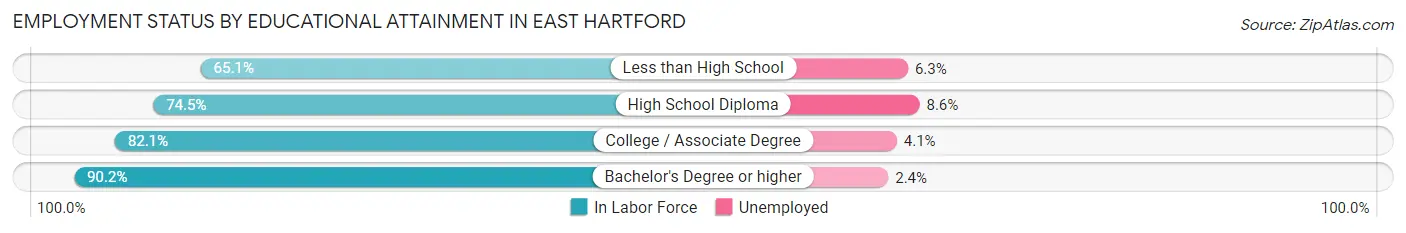
| Educational Attainment | In Labor Force | Unemployed |
| Less than High School | 1,825 (65.1%) | 177 (6.3%) |
| High School Diploma | 8,298 (74.5%) | 958 (8.6%) |
| College / Associate Degree | 7,057 (82.1%) | 352 (4.1%) |
| Bachelor's Degree or higher | 4,689 (90.2%) | 125 (2.4%) |
| Total | 21,855 (78.8%) | 1,553 (5.6%) |
Employment Occupations by Sex in East Hartford
Management, Business, Science and Arts Occupations
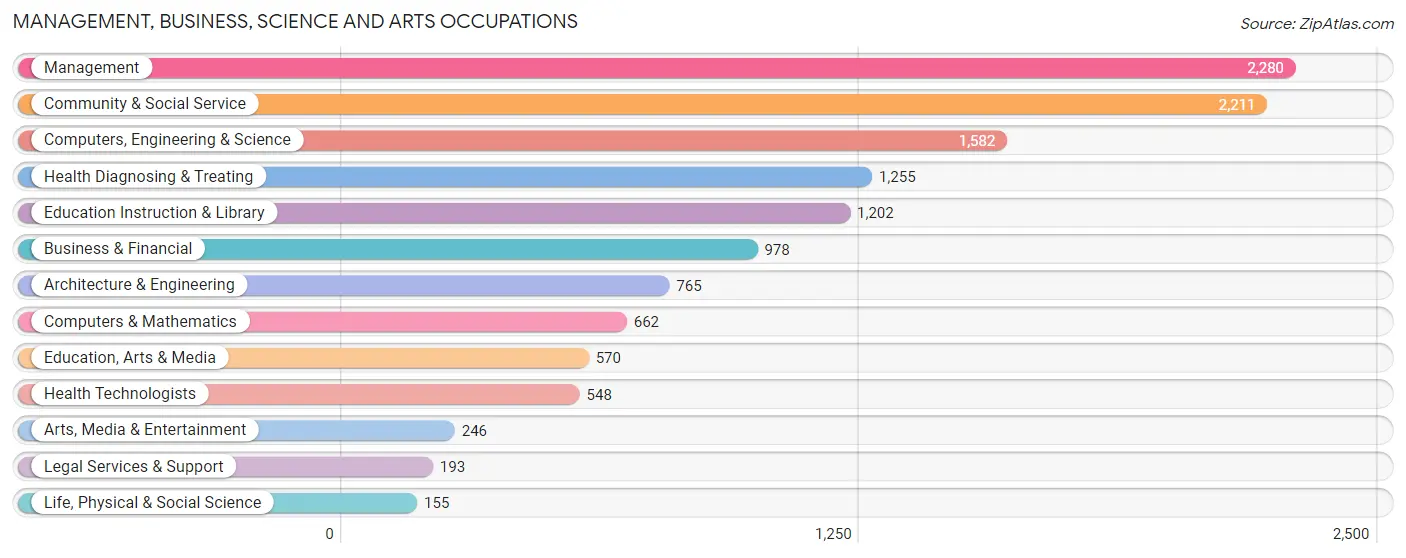
The most common Management, Business, Science and Arts occupations in East Hartford are Management (2,280 | 8.8%), Community & Social Service (2,211 | 8.6%), Computers, Engineering & Science (1,582 | 6.1%), Health Diagnosing & Treating (1,255 | 4.9%), and Education Instruction & Library (1,202 | 4.7%).
Management, Business, Science and Arts Occupations by Sex
Within the Management, Business, Science and Arts occupations in East Hartford, the most male-oriented occupations are Architecture & Engineering (86.5%), Arts, Media & Entertainment (75.2%), and Computers, Engineering & Science (74.1%), while the most female-oriented occupations are Legal Services & Support (87.6%), Education Instruction & Library (85.9%), and Education, Arts & Media (83.2%).
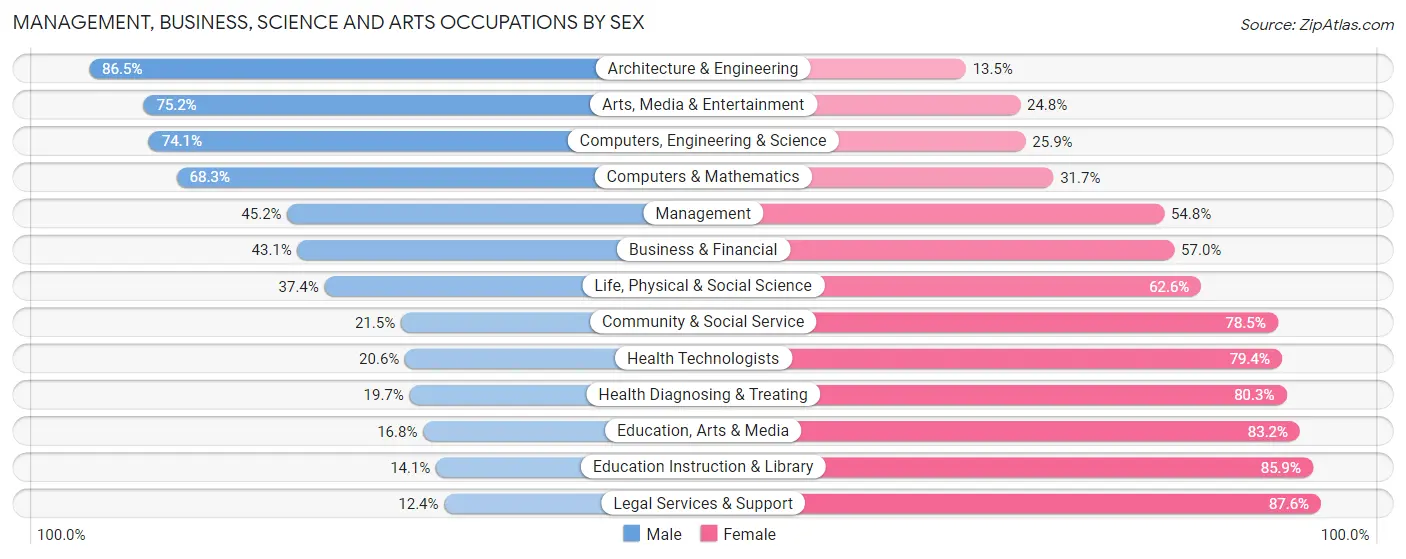
| Occupation | Male | Female |
| Management | 1,030 (45.2%) | 1,250 (54.8%) |
| Business & Financial | 421 (43.0%) | 557 (57.0%) |
| Computers, Engineering & Science | 1,172 (74.1%) | 410 (25.9%) |
| Computers & Mathematics | 452 (68.3%) | 210 (31.7%) |
| Architecture & Engineering | 662 (86.5%) | 103 (13.5%) |
| Life, Physical & Social Science | 58 (37.4%) | 97 (62.6%) |
| Community & Social Service | 475 (21.5%) | 1,736 (78.5%) |
| Education, Arts & Media | 96 (16.8%) | 474 (83.2%) |
| Legal Services & Support | 24 (12.4%) | 169 (87.6%) |
| Education Instruction & Library | 170 (14.1%) | 1,032 (85.9%) |
| Arts, Media & Entertainment | 185 (75.2%) | 61 (24.8%) |
| Health Diagnosing & Treating | 247 (19.7%) | 1,008 (80.3%) |
| Health Technologists | 113 (20.6%) | 435 (79.4%) |
| Total (Category) | 3,345 (40.3%) | 4,961 (59.7%) |
| Total (Overall) | 13,144 (51.0%) | 12,606 (49.0%) |
Services Occupations
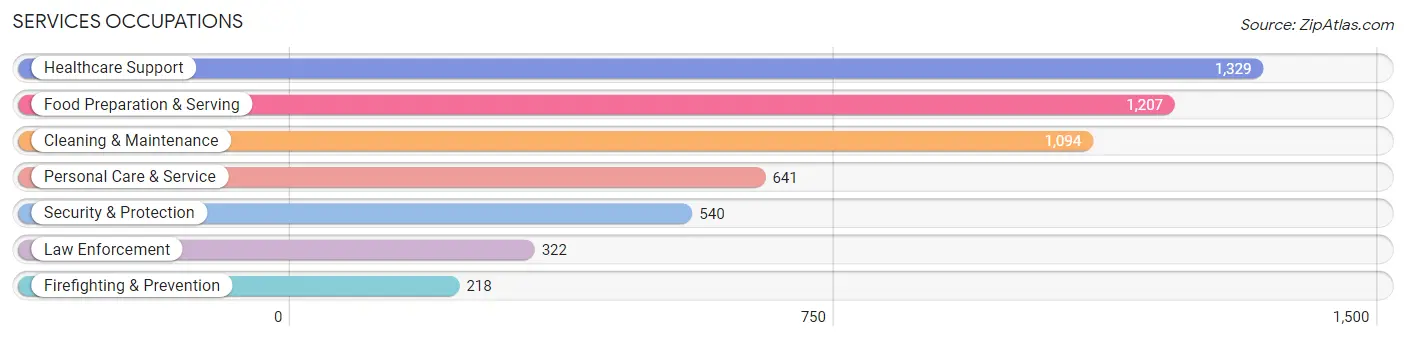
The most common Services occupations in East Hartford are Healthcare Support (1,329 | 5.2%), Food Preparation & Serving (1,207 | 4.7%), Cleaning & Maintenance (1,094 | 4.3%), Personal Care & Service (641 | 2.5%), and Security & Protection (540 | 2.1%).
Services Occupations by Sex
Within the Services occupations in East Hartford, the most male-oriented occupations are Law Enforcement (77.9%), Security & Protection (74.8%), and Firefighting & Prevention (70.2%), while the most female-oriented occupations are Healthcare Support (82.2%), Food Preparation & Serving (45.5%), and Cleaning & Maintenance (44.2%).
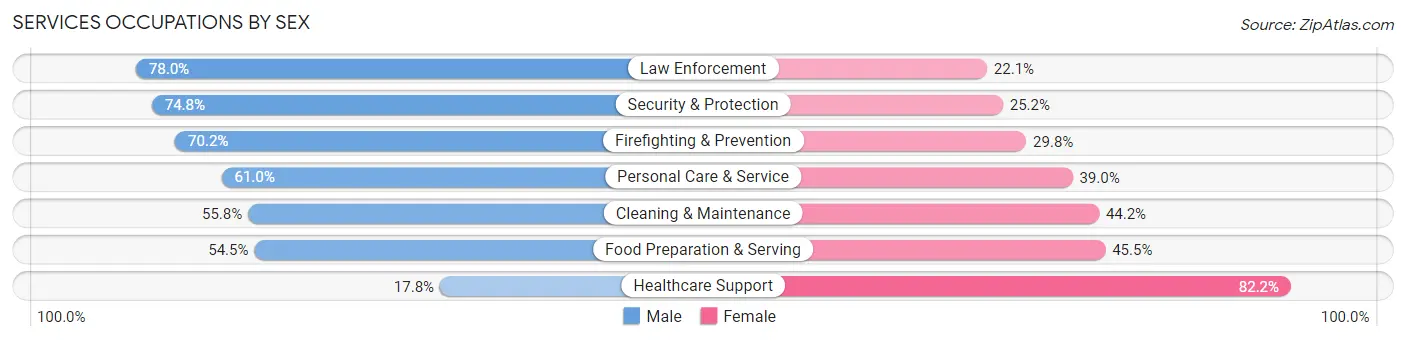
| Occupation | Male | Female |
| Healthcare Support | 236 (17.8%) | 1,093 (82.2%) |
| Security & Protection | 404 (74.8%) | 136 (25.2%) |
| Firefighting & Prevention | 153 (70.2%) | 65 (29.8%) |
| Law Enforcement | 251 (77.9%) | 71 (22.1%) |
| Food Preparation & Serving | 658 (54.5%) | 549 (45.5%) |
| Cleaning & Maintenance | 610 (55.8%) | 484 (44.2%) |
| Personal Care & Service | 391 (61.0%) | 250 (39.0%) |
| Total (Category) | 2,299 (47.8%) | 2,512 (52.2%) |
| Total (Overall) | 13,144 (51.0%) | 12,606 (49.0%) |
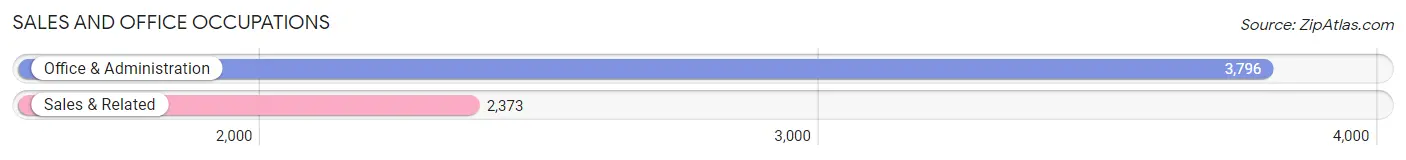
Sales and Office Occupations
The most common Sales and Office occupations in East Hartford are Office & Administration (3,796 | 14.7%), and Sales & Related (2,373 | 9.2%).
Sales and Office Occupations by Sex
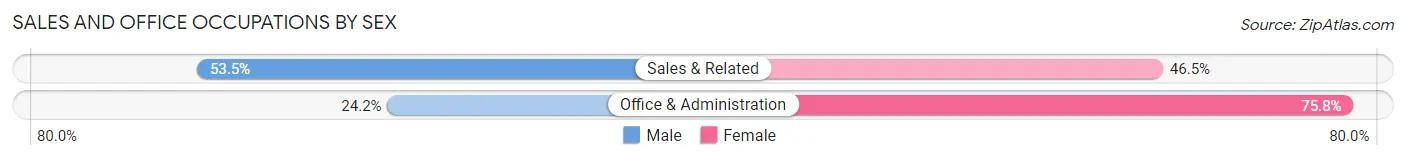
| Occupation | Male | Female |
| Sales & Related | 1,269 (53.5%) | 1,104 (46.5%) |
| Office & Administration | 918 (24.2%) | 2,878 (75.8%) |
| Total (Category) | 2,187 (35.4%) | 3,982 (64.5%) |
| Total (Overall) | 13,144 (51.0%) | 12,606 (49.0%) |
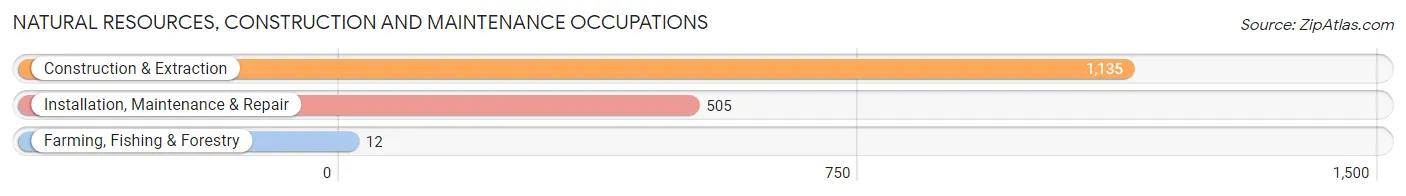
Natural Resources, Construction and Maintenance Occupations
The most common Natural Resources, Construction and Maintenance occupations in East Hartford are Construction & Extraction (1,135 | 4.4%), Installation, Maintenance & Repair (505 | 2.0%), and Farming, Fishing & Forestry (12 | 0.1%).
Natural Resources, Construction and Maintenance Occupations by Sex
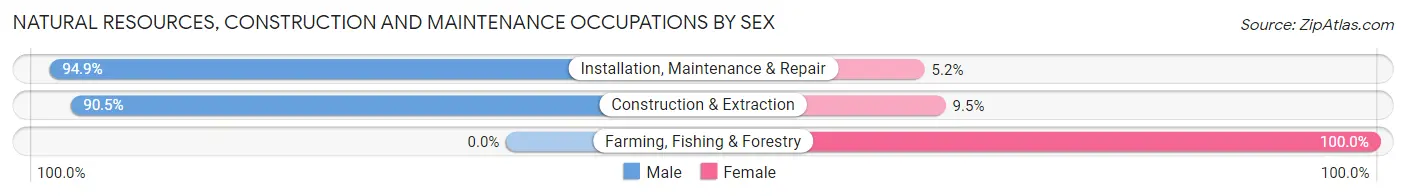
| Occupation | Male | Female |
| Farming, Fishing & Forestry | 0 (0.0%) | 12 (100.0%) |
| Construction & Extraction | 1,027 (90.5%) | 108 (9.5%) |
| Installation, Maintenance & Repair | 479 (94.9%) | 26 (5.1%) |
| Total (Category) | 1,506 (91.2%) | 146 (8.8%) |
| Total (Overall) | 13,144 (51.0%) | 12,606 (49.0%) |
Production, Transportation and Moving Occupations
The most common Production, Transportation and Moving occupations in East Hartford are Production (1,908 | 7.4%), Material Moving (1,701 | 6.6%), and Transportation (1,203 | 4.7%).
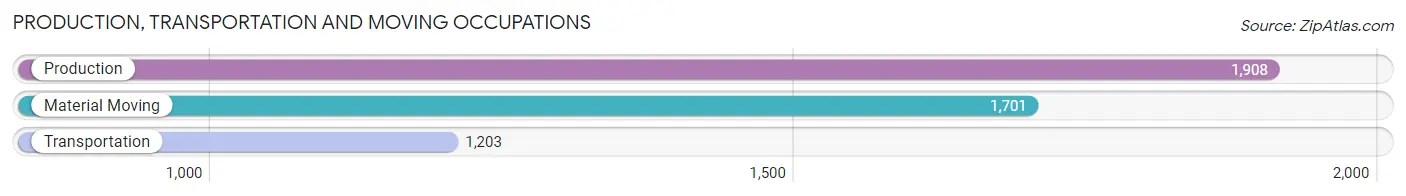
Production, Transportation and Moving Occupations by Sex
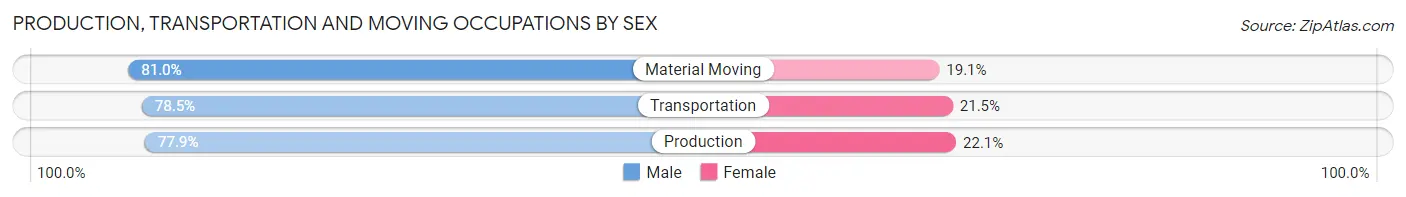
| Occupation | Male | Female |
| Production | 1,486 (77.9%) | 422 (22.1%) |
| Transportation | 944 (78.5%) | 259 (21.5%) |
| Material Moving | 1,377 (80.9%) | 324 (19.1%) |
| Total (Category) | 3,807 (79.1%) | 1,005 (20.9%) |
| Total (Overall) | 13,144 (51.0%) | 12,606 (49.0%) |
Employment Industries by Sex in East Hartford
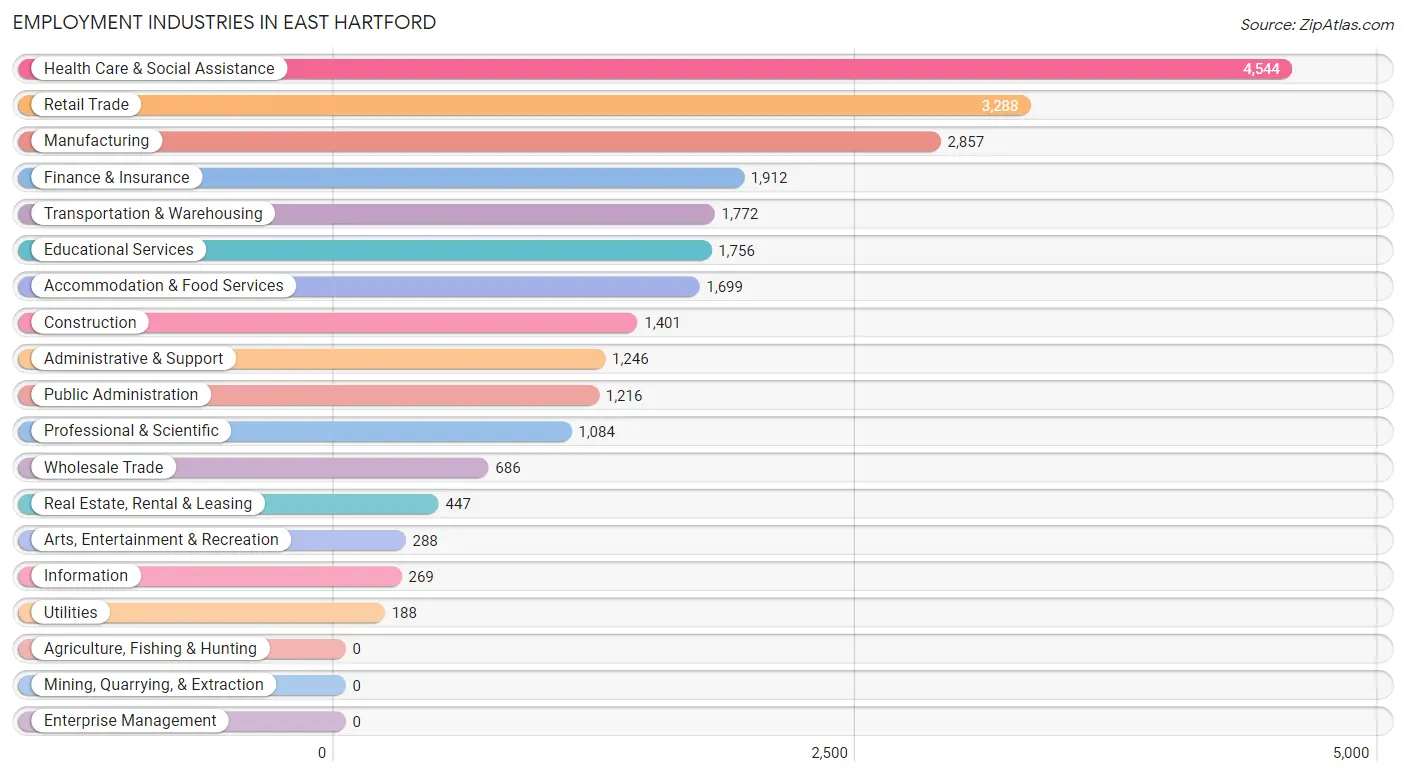
Employment Industries in East Hartford
The major employment industries in East Hartford include Health Care & Social Assistance (4,544 | 17.6%), Retail Trade (3,288 | 12.8%), Manufacturing (2,857 | 11.1%), Finance & Insurance (1,912 | 7.4%), and Transportation & Warehousing (1,772 | 6.9%).
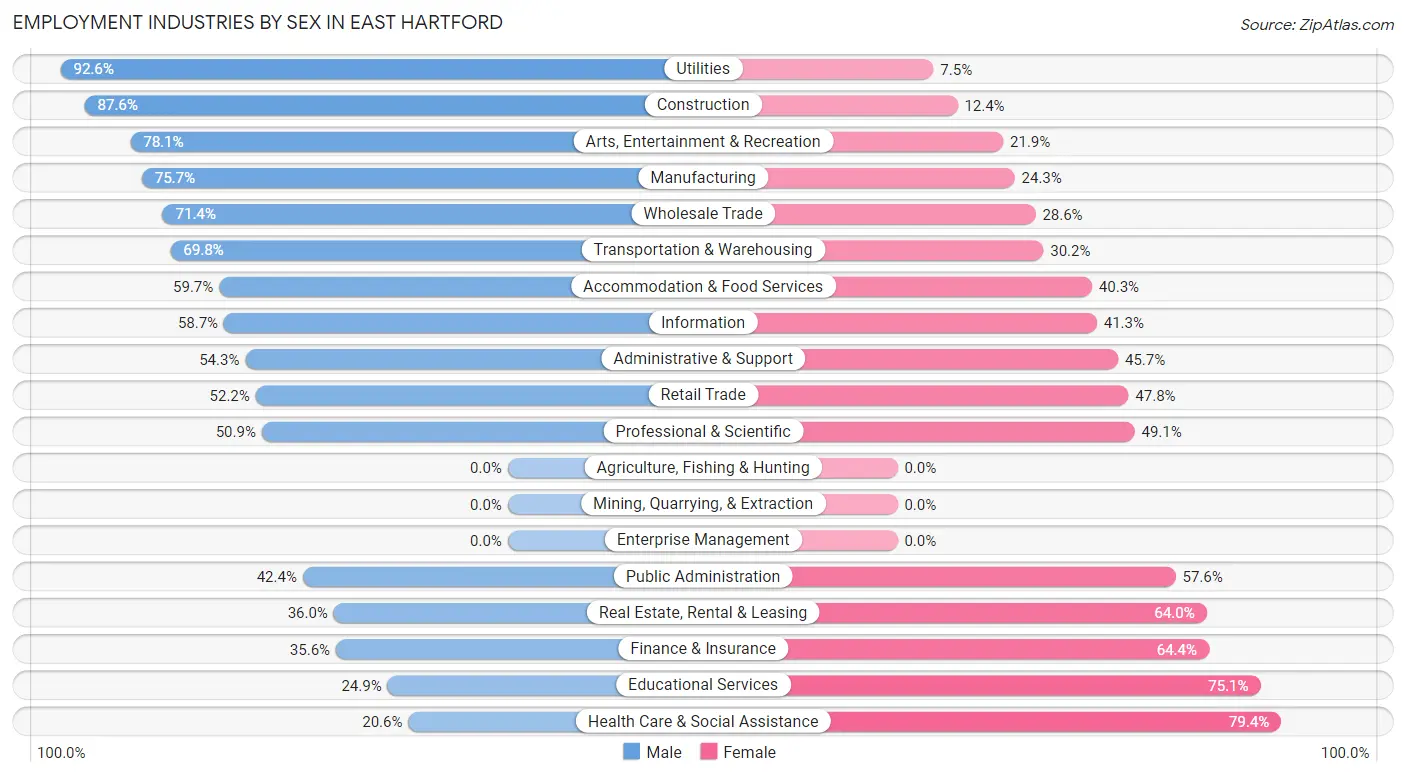
Employment Industries by Sex in East Hartford
The East Hartford industries that see more men than women are Utilities (92.5%), Construction (87.6%), and Arts, Entertainment & Recreation (78.1%), whereas the industries that tend to have a higher number of women are Health Care & Social Assistance (79.4%), Educational Services (75.1%), and Finance & Insurance (64.4%).
| Industry | Male | Female |
| Agriculture, Fishing & Hunting | 0 (0.0%) | 0 (0.0%) |
| Mining, Quarrying, & Extraction | 0 (0.0%) | 0 (0.0%) |
| Construction | 1,227 (87.6%) | 174 (12.4%) |
| Manufacturing | 2,164 (75.7%) | 693 (24.3%) |
| Wholesale Trade | 490 (71.4%) | 196 (28.6%) |
| Retail Trade | 1,716 (52.2%) | 1,572 (47.8%) |
| Transportation & Warehousing | 1,237 (69.8%) | 535 (30.2%) |
| Utilities | 174 (92.5%) | 14 (7.4%) |
| Information | 158 (58.7%) | 111 (41.3%) |
| Finance & Insurance | 680 (35.6%) | 1,232 (64.4%) |
| Real Estate, Rental & Leasing | 161 (36.0%) | 286 (64.0%) |
| Professional & Scientific | 552 (50.9%) | 532 (49.1%) |
| Enterprise Management | 0 (0.0%) | 0 (0.0%) |
| Administrative & Support | 677 (54.3%) | 569 (45.7%) |
| Educational Services | 437 (24.9%) | 1,319 (75.1%) |
| Health Care & Social Assistance | 935 (20.6%) | 3,609 (79.4%) |
| Arts, Entertainment & Recreation | 225 (78.1%) | 63 (21.9%) |
| Accommodation & Food Services | 1,015 (59.7%) | 684 (40.3%) |
| Public Administration | 516 (42.4%) | 700 (57.6%) |
| Total | 13,144 (51.0%) | 12,606 (49.0%) |
Education in East Hartford
School Enrollment in East Hartford
The most common levels of schooling among the 12,860 students in East Hartford are college / undergraduate (3,559 | 27.7%), high school (3,189 | 24.8%), and middle school (2,530 | 19.7%).
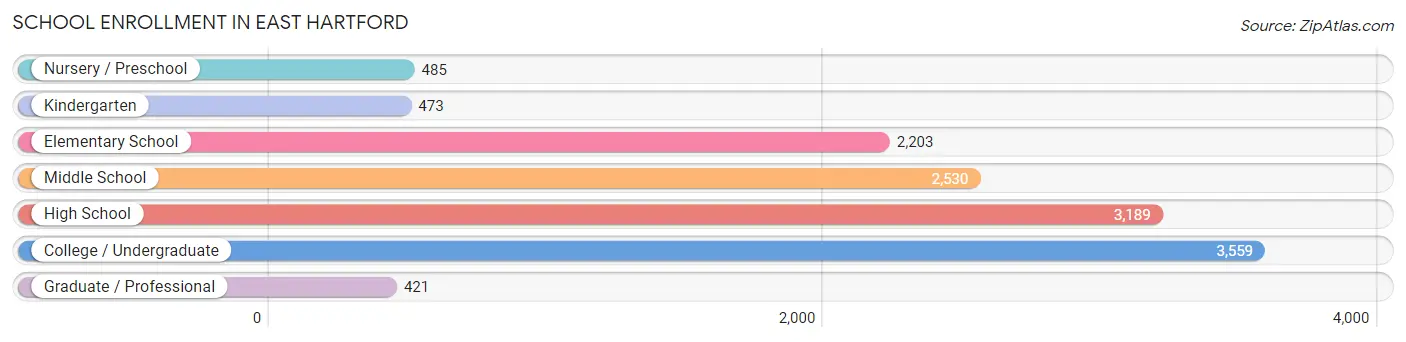
| School Level | # Students | % Students |
| Nursery / Preschool | 485 | 3.8% |
| Kindergarten | 473 | 3.7% |
| Elementary School | 2,203 | 17.1% |
| Middle School | 2,530 | 19.7% |
| High School | 3,189 | 24.8% |
| College / Undergraduate | 3,559 | 27.7% |
| Graduate / Professional | 421 | 3.3% |
| Total | 12,860 | 100.0% |
School Enrollment by Age by Funding Source in East Hartford
Out of a total of 12,860 students who are enrolled in schools in East Hartford, 1,517 (11.8%) attend a private institution, while the remaining 11,343 (88.2%) are enrolled in public schools. The age group of 3 to 4 year olds has the highest likelihood of being enrolled in private schools, with 222 (36.6% in the age bracket) enrolled. Conversely, the age group of 15 to 17 year olds has the lowest likelihood of being enrolled in a private school, with 2,294 (99.4% in the age bracket) attending a public institution.
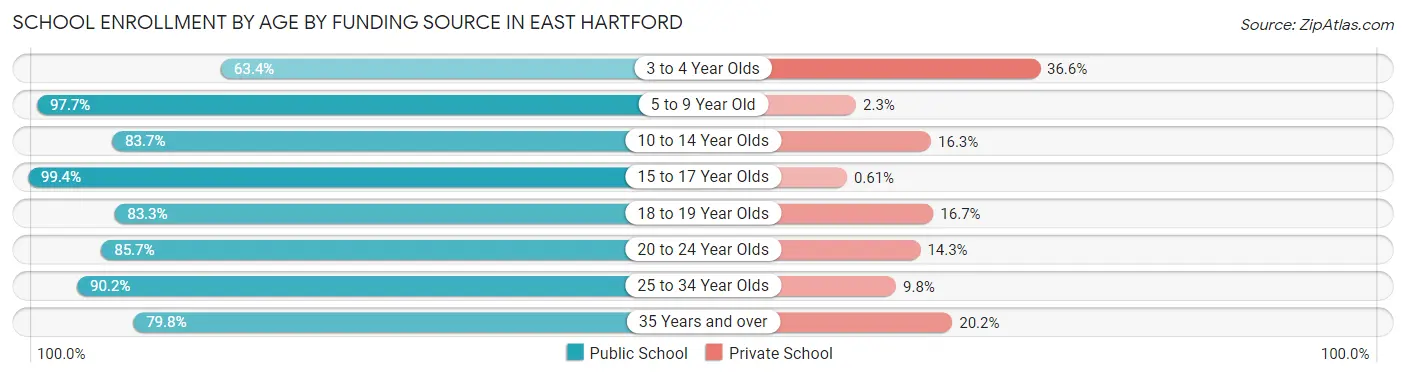
| Age Bracket | Public School | Private School |
| 3 to 4 Year Olds | 385 (63.4%) | 222 (36.6%) |
| 5 to 9 Year Old | 2,114 (97.7%) | 50 (2.3%) |
| 10 to 14 Year Olds | 2,652 (83.7%) | 516 (16.3%) |
| 15 to 17 Year Olds | 2,294 (99.4%) | 14 (0.6%) |
| 18 to 19 Year Olds | 917 (83.3%) | 184 (16.7%) |
| 20 to 24 Year Olds | 1,372 (85.7%) | 229 (14.3%) |
| 25 to 34 Year Olds | 739 (90.2%) | 80 (9.8%) |
| 35 Years and over | 871 (79.8%) | 221 (20.2%) |
| Total | 11,343 (88.2%) | 1,517 (11.8%) |
Educational Attainment by Field of Study in East Hartford
Business (1,165 | 17.2%), engineering (828 | 12.2%), arts & humanities (724 | 10.7%), science & technology (605 | 8.9%), and education (518 | 7.6%) are the most common fields of study among 6,783 individuals in East Hartford who have obtained a bachelor's degree or higher.
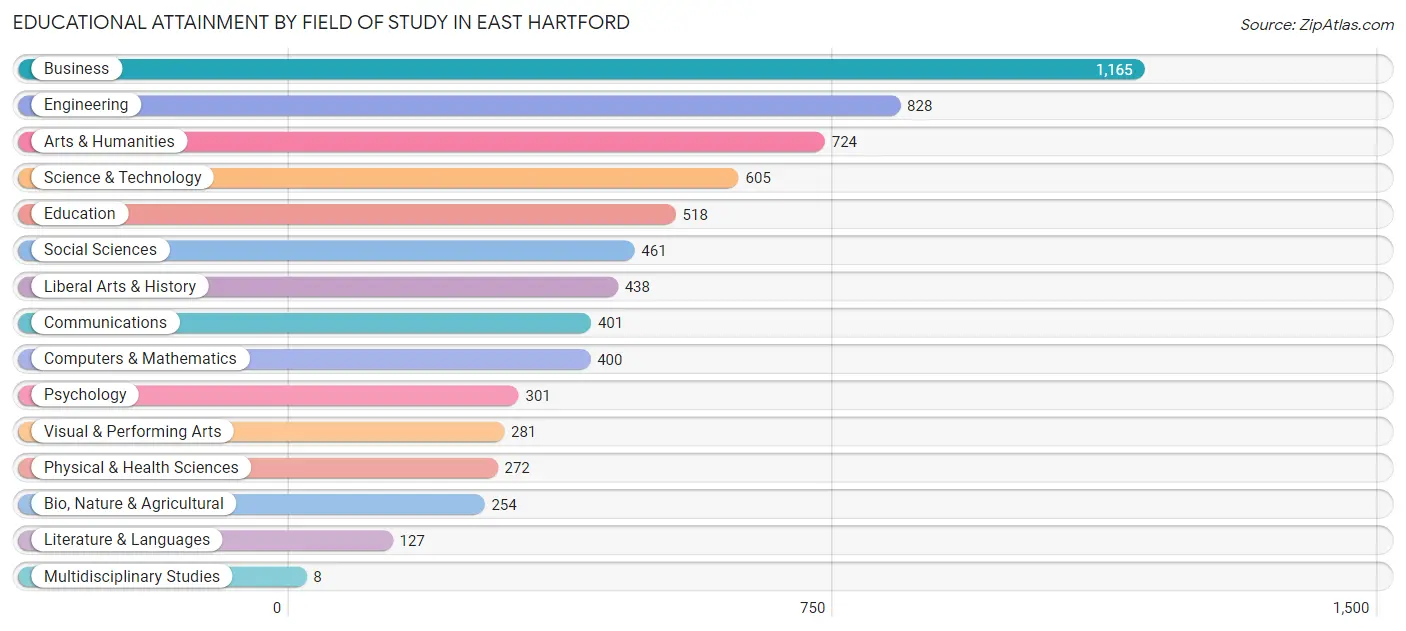
| Field of Study | # Graduates | % Graduates |
| Computers & Mathematics | 400 | 5.9% |
| Bio, Nature & Agricultural | 254 | 3.7% |
| Physical & Health Sciences | 272 | 4.0% |
| Psychology | 301 | 4.4% |
| Social Sciences | 461 | 6.8% |
| Engineering | 828 | 12.2% |
| Multidisciplinary Studies | 8 | 0.1% |
| Science & Technology | 605 | 8.9% |
| Business | 1,165 | 17.2% |
| Education | 518 | 7.6% |
| Literature & Languages | 127 | 1.9% |
| Liberal Arts & History | 438 | 6.5% |
| Visual & Performing Arts | 281 | 4.1% |
| Communications | 401 | 5.9% |
| Arts & Humanities | 724 | 10.7% |
| Total | 6,783 | 100.0% |
Transportation & Commute in East Hartford
Vehicle Availability by Sex in East Hartford
The most prevalent vehicle ownership categories in East Hartford are males with 2 vehicles (5,424, accounting for 41.9%) and females with 2 vehicles (4,820, making up 44.0%).
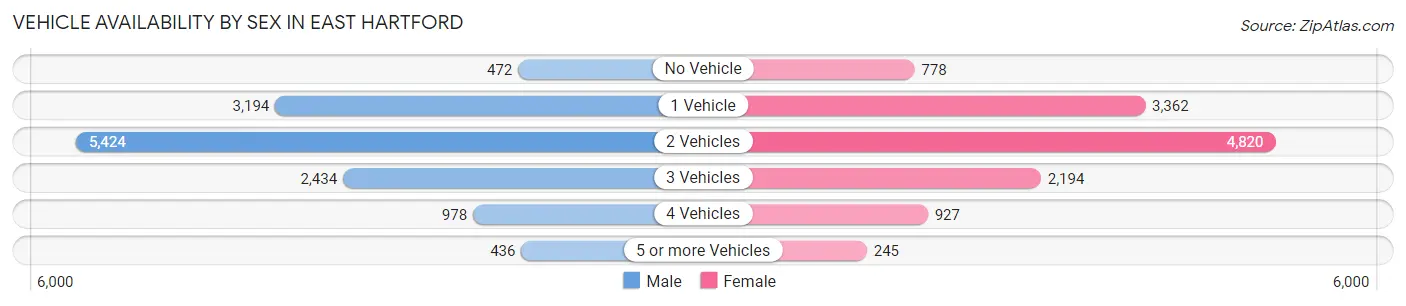
| Vehicles Available | Male | Female |
| No Vehicle | 472 (3.6%) | 778 (6.3%) |
| 1 Vehicle | 3,194 (24.7%) | 3,362 (27.3%) |
| 2 Vehicles | 5,424 (41.9%) | 4,820 (39.1%) |
| 3 Vehicles | 2,434 (18.8%) | 2,194 (17.8%) |
| 4 Vehicles | 978 (7.6%) | 927 (7.5%) |
| 5 or more Vehicles | 436 (3.4%) | 245 (2.0%) |
| Total | 12,938 (100.0%) | 12,326 (100.0%) |
Commute Time in East Hartford
The most frequently occuring commute durations in East Hartford are 15 to 19 minutes (5,511 commuters, 23.8%), 20 to 24 minutes (4,823 commuters, 20.8%), and 10 to 14 minutes (4,339 commuters, 18.8%).
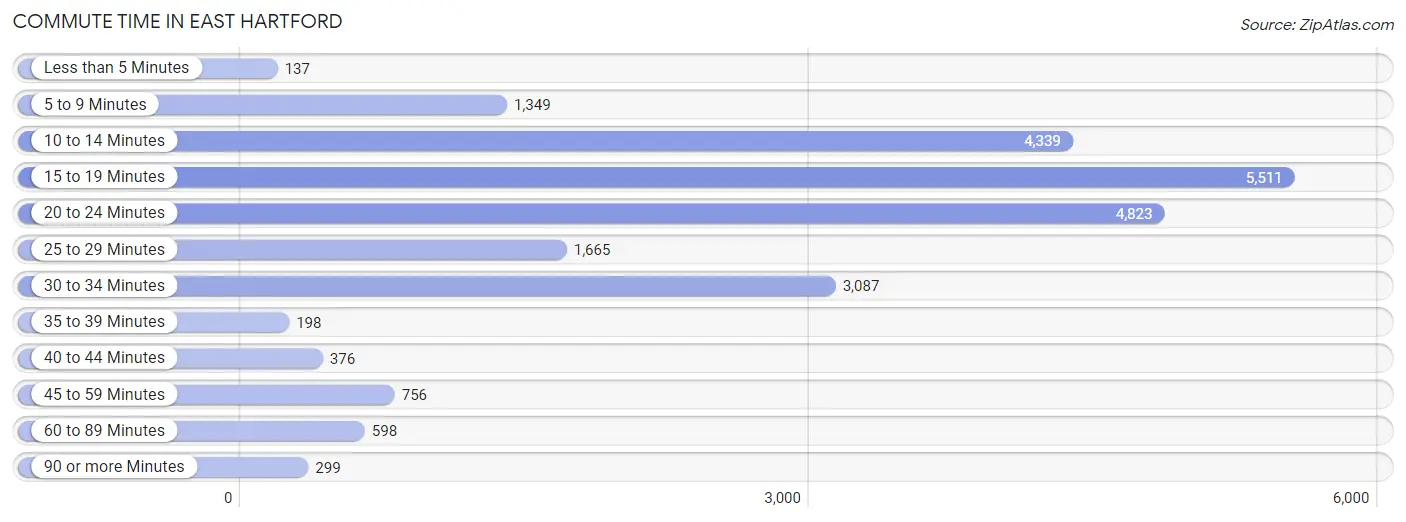
| Commute Time | # Commuters | % Commuters |
| Less than 5 Minutes | 137 | 0.6% |
| 5 to 9 Minutes | 1,349 | 5.8% |
| 10 to 14 Minutes | 4,339 | 18.8% |
| 15 to 19 Minutes | 5,511 | 23.8% |
| 20 to 24 Minutes | 4,823 | 20.8% |
| 25 to 29 Minutes | 1,665 | 7.2% |
| 30 to 34 Minutes | 3,087 | 13.3% |
| 35 to 39 Minutes | 198 | 0.9% |
| 40 to 44 Minutes | 376 | 1.6% |
| 45 to 59 Minutes | 756 | 3.3% |
| 60 to 89 Minutes | 598 | 2.6% |
| 90 or more Minutes | 299 | 1.3% |
Commute Time by Sex in East Hartford
The most common commute times in East Hartford are 15 to 19 minutes (2,649 commuters, 22.3%) for males and 15 to 19 minutes (2,862 commuters, 25.4%) for females.
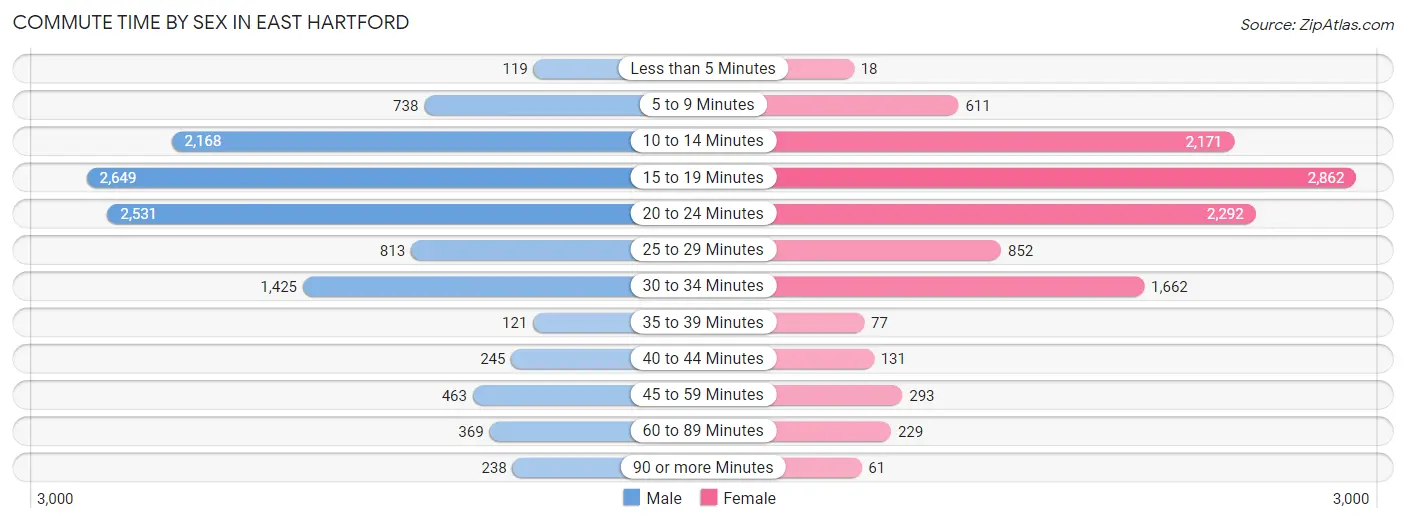
| Commute Time | Male | Female |
| Less than 5 Minutes | 119 (1.0%) | 18 (0.2%) |
| 5 to 9 Minutes | 738 (6.2%) | 611 (5.4%) |
| 10 to 14 Minutes | 2,168 (18.2%) | 2,171 (19.3%) |
| 15 to 19 Minutes | 2,649 (22.3%) | 2,862 (25.4%) |
| 20 to 24 Minutes | 2,531 (21.3%) | 2,292 (20.4%) |
| 25 to 29 Minutes | 813 (6.8%) | 852 (7.6%) |
| 30 to 34 Minutes | 1,425 (12.0%) | 1,662 (14.8%) |
| 35 to 39 Minutes | 121 (1.0%) | 77 (0.7%) |
| 40 to 44 Minutes | 245 (2.1%) | 131 (1.2%) |
| 45 to 59 Minutes | 463 (3.9%) | 293 (2.6%) |
| 60 to 89 Minutes | 369 (3.1%) | 229 (2.0%) |
| 90 or more Minutes | 238 (2.0%) | 61 (0.5%) |
Time of Departure to Work by Sex in East Hartford
The most frequent times of departure to work in East Hartford are 7:00 AM to 7:29 AM (1,505, 12.7%) for males and 7:30 AM to 7:59 AM (2,101, 18.7%) for females.
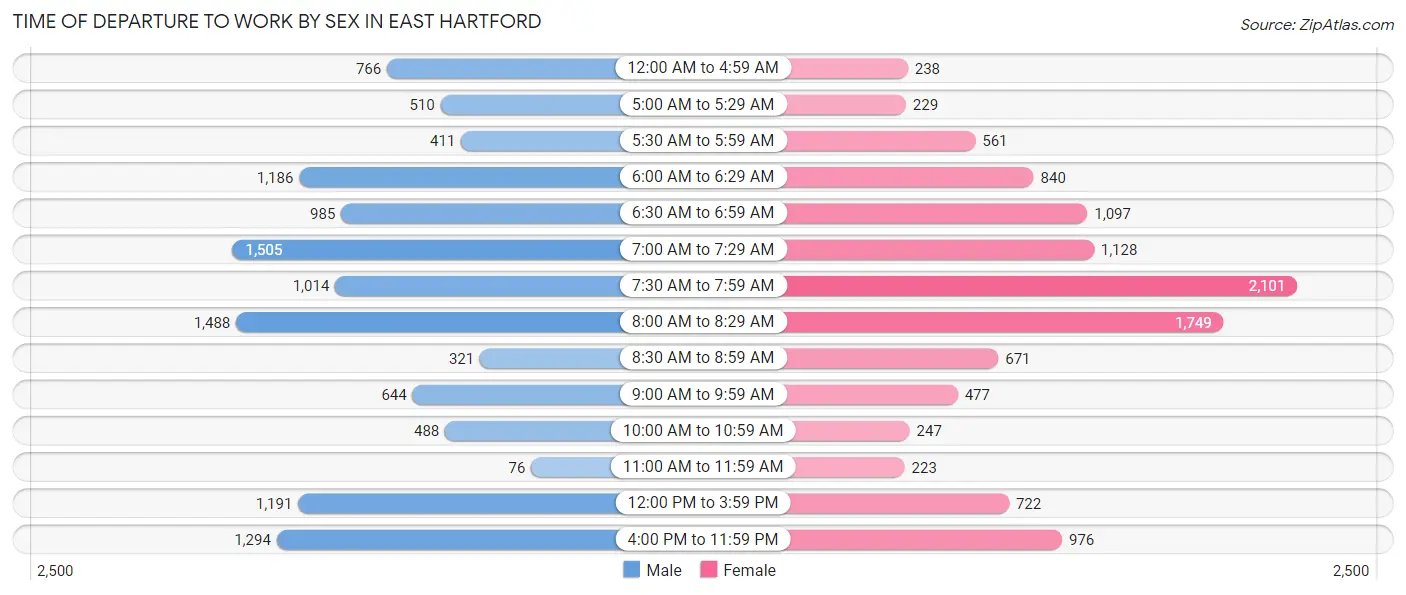
| Time of Departure | Male | Female |
| 12:00 AM to 4:59 AM | 766 (6.5%) | 238 (2.1%) |
| 5:00 AM to 5:29 AM | 510 (4.3%) | 229 (2.0%) |
| 5:30 AM to 5:59 AM | 411 (3.5%) | 561 (5.0%) |
| 6:00 AM to 6:29 AM | 1,186 (10.0%) | 840 (7.5%) |
| 6:30 AM to 6:59 AM | 985 (8.3%) | 1,097 (9.7%) |
| 7:00 AM to 7:29 AM | 1,505 (12.7%) | 1,128 (10.0%) |
| 7:30 AM to 7:59 AM | 1,014 (8.5%) | 2,101 (18.7%) |
| 8:00 AM to 8:29 AM | 1,488 (12.5%) | 1,749 (15.5%) |
| 8:30 AM to 8:59 AM | 321 (2.7%) | 671 (6.0%) |
| 9:00 AM to 9:59 AM | 644 (5.4%) | 477 (4.2%) |
| 10:00 AM to 10:59 AM | 488 (4.1%) | 247 (2.2%) |
| 11:00 AM to 11:59 AM | 76 (0.6%) | 223 (2.0%) |
| 12:00 PM to 3:59 PM | 1,191 (10.0%) | 722 (6.4%) |
| 4:00 PM to 11:59 PM | 1,294 (10.9%) | 976 (8.7%) |
| Total | 11,879 (100.0%) | 11,259 (100.0%) |
Housing Occupancy in East Hartford
Occupancy by Ownership in East Hartford
Of the total 20,086 dwellings in East Hartford, owner-occupied units account for 11,948 (59.5%), while renter-occupied units make up 8,138 (40.5%).
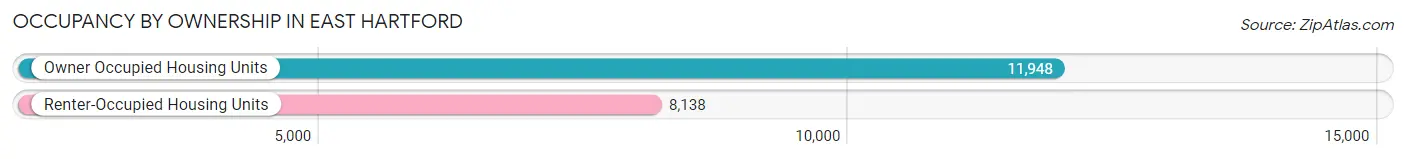
| Occupancy | # Housing Units | % Housing Units |
| Owner Occupied Housing Units | 11,948 | 59.5% |
| Renter-Occupied Housing Units | 8,138 | 40.5% |
| Total Occupied Housing Units | 20,086 | 100.0% |
Occupancy by Household Size in East Hartford
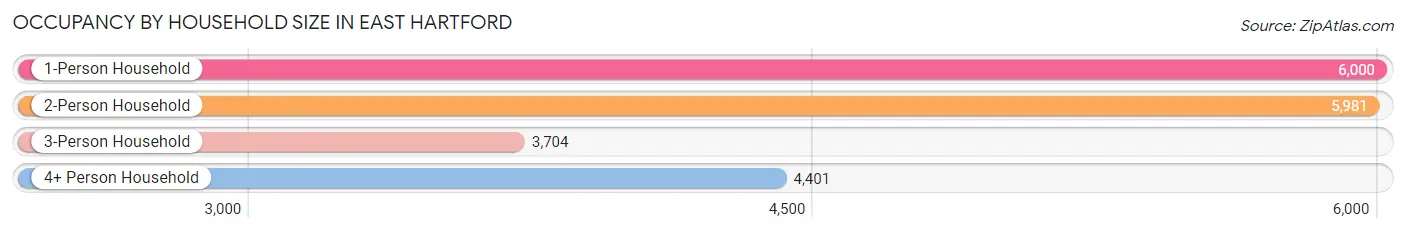
| Household Size | # Housing Units | % Housing Units |
| 1-Person Household | 6,000 | 29.9% |
| 2-Person Household | 5,981 | 29.8% |
| 3-Person Household | 3,704 | 18.4% |
| 4+ Person Household | 4,401 | 21.9% |
| Total Housing Units | 20,086 | 100.0% |
Occupancy by Ownership by Household Size in East Hartford
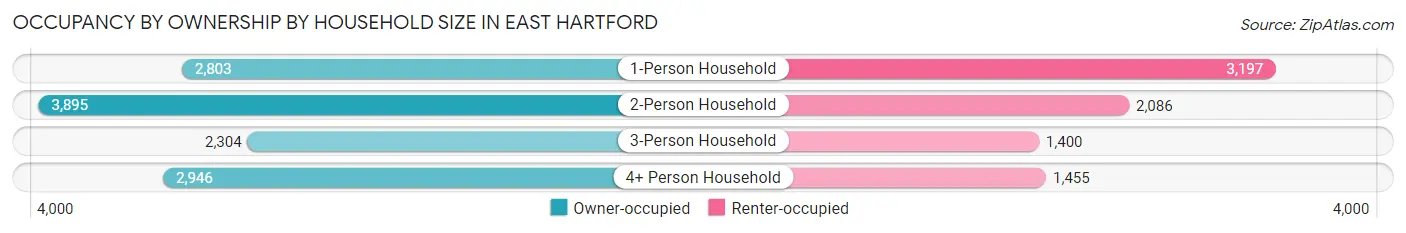
| Household Size | Owner-occupied | Renter-occupied |
| 1-Person Household | 2,803 (46.7%) | 3,197 (53.3%) |
| 2-Person Household | 3,895 (65.1%) | 2,086 (34.9%) |
| 3-Person Household | 2,304 (62.2%) | 1,400 (37.8%) |
| 4+ Person Household | 2,946 (66.9%) | 1,455 (33.1%) |
| Total Housing Units | 11,948 (59.5%) | 8,138 (40.5%) |
Occupancy by Educational Attainment in East Hartford
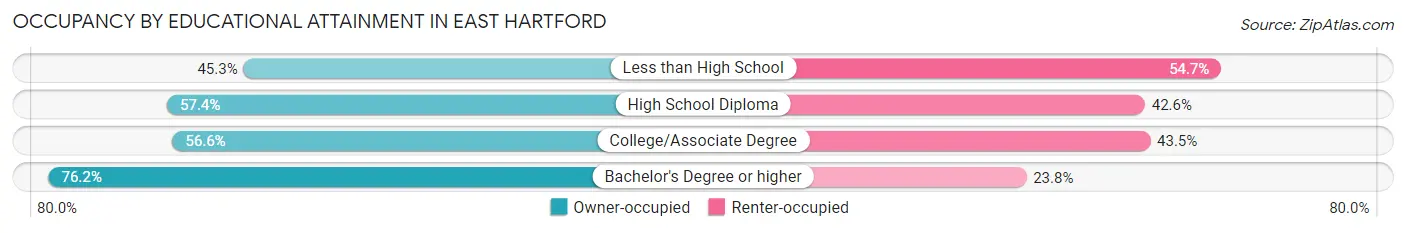
| Household Size | Owner-occupied | Renter-occupied |
| Less than High School | 1,078 (45.3%) | 1,303 (54.7%) |
| High School Diploma | 4,124 (57.4%) | 3,062 (42.6%) |
| College/Associate Degree | 3,654 (56.6%) | 2,807 (43.4%) |
| Bachelor's Degree or higher | 3,092 (76.2%) | 966 (23.8%) |
Occupancy by Age of Householder in East Hartford
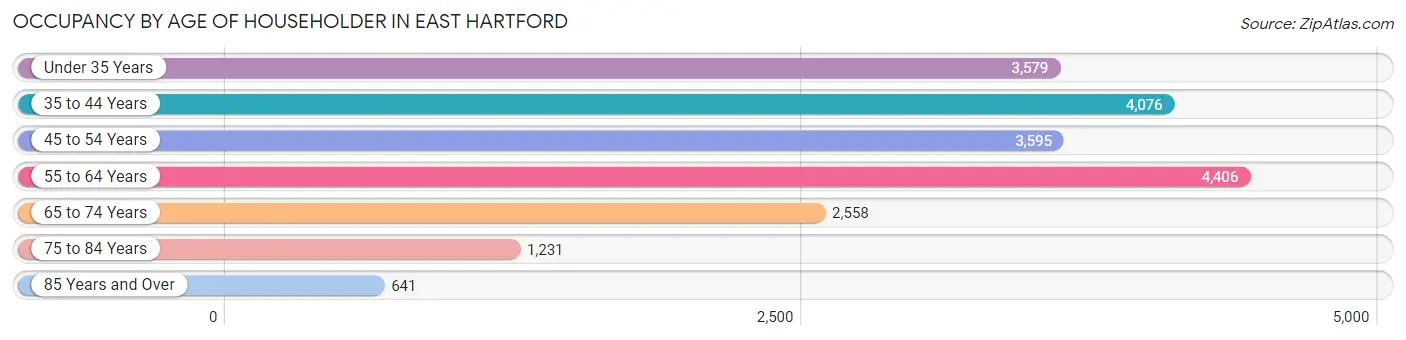
| Age Bracket | # Households | % Households |
| Under 35 Years | 3,579 | 17.8% |
| 35 to 44 Years | 4,076 | 20.3% |
| 45 to 54 Years | 3,595 | 17.9% |
| 55 to 64 Years | 4,406 | 21.9% |
| 65 to 74 Years | 2,558 | 12.7% |
| 75 to 84 Years | 1,231 | 6.1% |
| 85 Years and Over | 641 | 3.2% |
| Total | 20,086 | 100.0% |
Housing Finances in East Hartford
Median Income by Occupancy in East Hartford
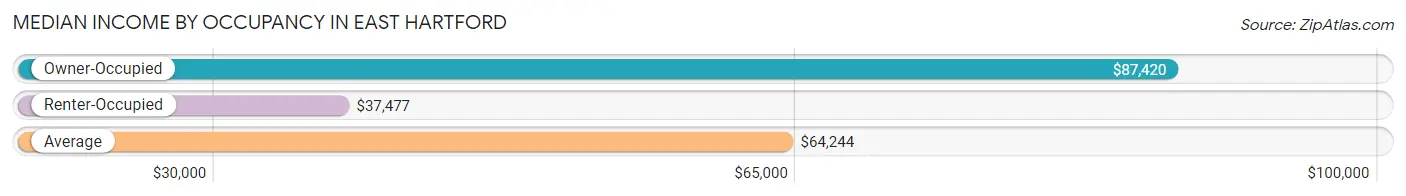
| Occupancy Type | # Households | Median Income |
| Owner-Occupied | 11,948 (59.5%) | $87,420 |
| Renter-Occupied | 8,138 (40.5%) | $37,477 |
| Average | 20,086 (100.0%) | $64,244 |
Occupancy by Householder Income Bracket in East Hartford
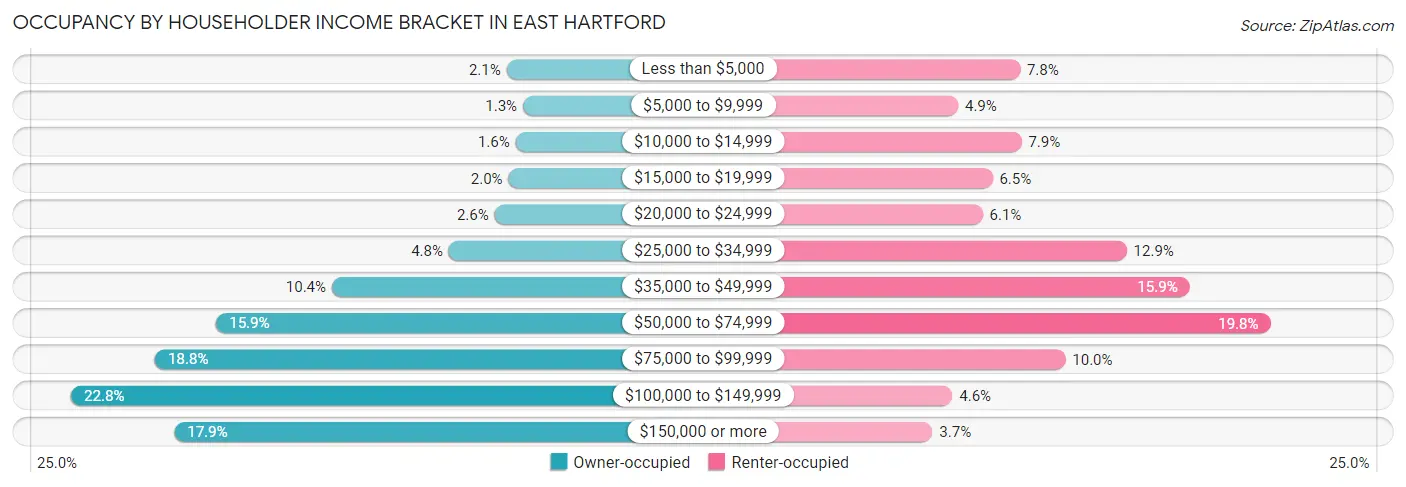
| Income Bracket | Owner-occupied | Renter-occupied |
| Less than $5,000 | 245 (2.1%) | 637 (7.8%) |
| $5,000 to $9,999 | 152 (1.3%) | 397 (4.9%) |
| $10,000 to $14,999 | 193 (1.6%) | 643 (7.9%) |
| $15,000 to $19,999 | 234 (2.0%) | 531 (6.5%) |
| $20,000 to $24,999 | 313 (2.6%) | 492 (6.0%) |
| $25,000 to $34,999 | 574 (4.8%) | 1,051 (12.9%) |
| $35,000 to $49,999 | 1,239 (10.4%) | 1,294 (15.9%) |
| $50,000 to $74,999 | 1,896 (15.9%) | 1,607 (19.8%) |
| $75,000 to $99,999 | 2,245 (18.8%) | 813 (10.0%) |
| $100,000 to $149,999 | 2,722 (22.8%) | 375 (4.6%) |
| $150,000 or more | 2,135 (17.9%) | 298 (3.7%) |
| Total | 11,948 (100.0%) | 8,138 (100.0%) |
Monthly Housing Cost Tiers in East Hartford
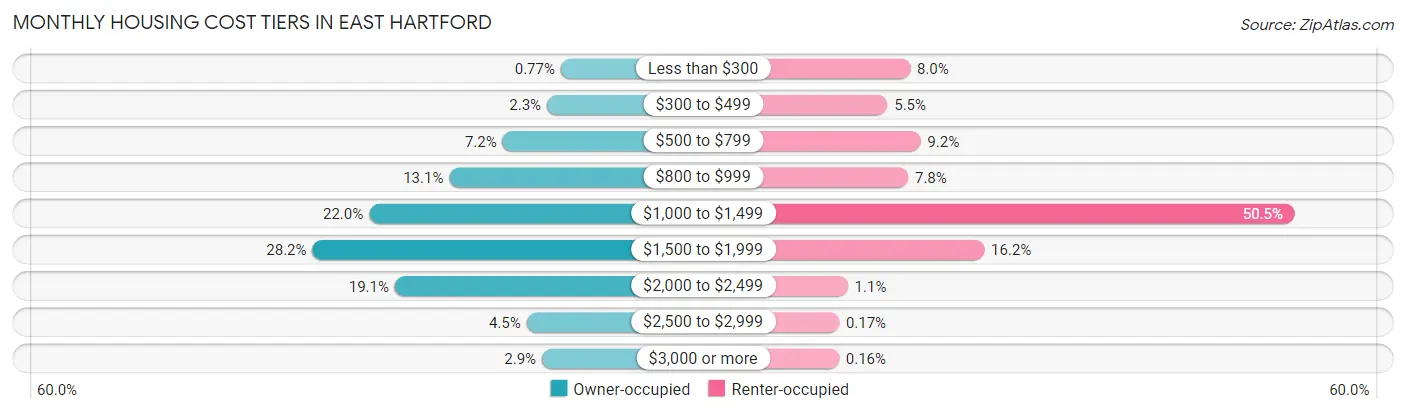
| Monthly Cost | Owner-occupied | Renter-occupied |
| Less than $300 | 92 (0.8%) | 652 (8.0%) |
| $300 to $499 | 275 (2.3%) | 448 (5.5%) |
| $500 to $799 | 860 (7.2%) | 746 (9.2%) |
| $800 to $999 | 1,564 (13.1%) | 635 (7.8%) |
| $1,000 to $1,499 | 2,622 (22.0%) | 4,112 (50.5%) |
| $1,500 to $1,999 | 3,371 (28.2%) | 1,319 (16.2%) |
| $2,000 to $2,499 | 2,282 (19.1%) | 92 (1.1%) |
| $2,500 to $2,999 | 542 (4.5%) | 14 (0.2%) |
| $3,000 or more | 340 (2.9%) | 13 (0.2%) |
| Total | 11,948 (100.0%) | 8,138 (100.0%) |
Physical Housing Characteristics in East Hartford
Housing Structures in East Hartford
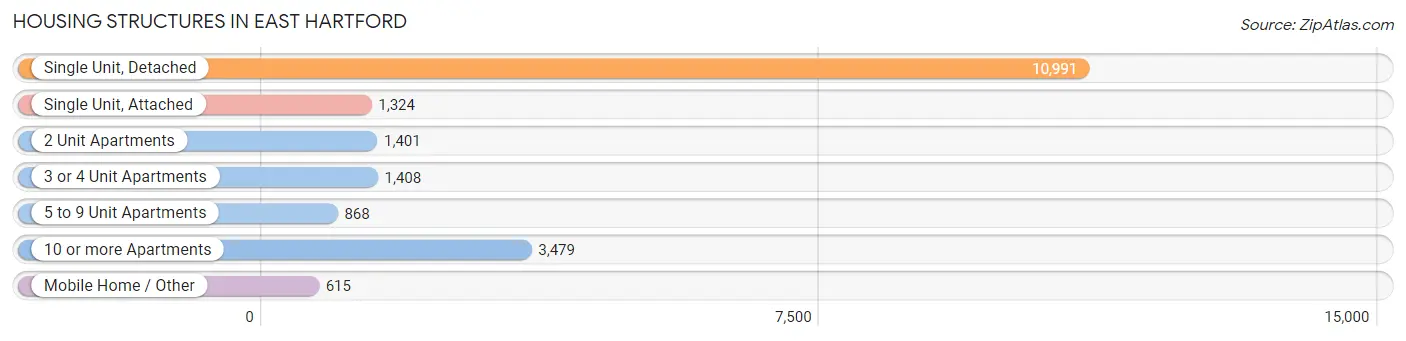
| Structure Type | # Housing Units | % Housing Units |
| Single Unit, Detached | 10,991 | 54.7% |
| Single Unit, Attached | 1,324 | 6.6% |
| 2 Unit Apartments | 1,401 | 7.0% |
| 3 or 4 Unit Apartments | 1,408 | 7.0% |
| 5 to 9 Unit Apartments | 868 | 4.3% |
| 10 or more Apartments | 3,479 | 17.3% |
| Mobile Home / Other | 615 | 3.1% |
| Total | 20,086 | 100.0% |
Housing Structures by Occupancy in East Hartford
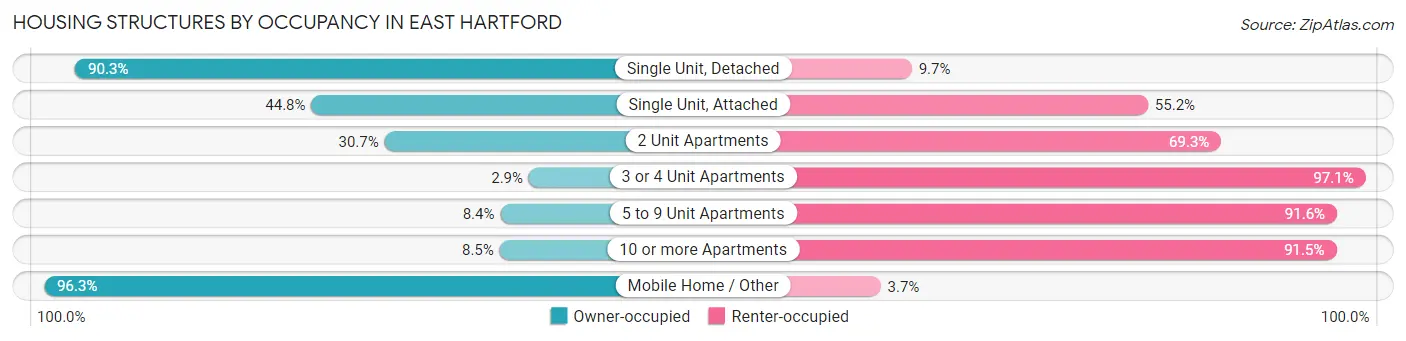
| Structure Type | Owner-occupied | Renter-occupied |
| Single Unit, Detached | 9,922 (90.3%) | 1,069 (9.7%) |
| Single Unit, Attached | 593 (44.8%) | 731 (55.2%) |
| 2 Unit Apartments | 430 (30.7%) | 971 (69.3%) |
| 3 or 4 Unit Apartments | 41 (2.9%) | 1,367 (97.1%) |
| 5 to 9 Unit Apartments | 73 (8.4%) | 795 (91.6%) |
| 10 or more Apartments | 297 (8.5%) | 3,182 (91.5%) |
| Mobile Home / Other | 592 (96.3%) | 23 (3.7%) |
| Total | 11,948 (59.5%) | 8,138 (40.5%) |
Housing Structures by Number of Rooms in East Hartford
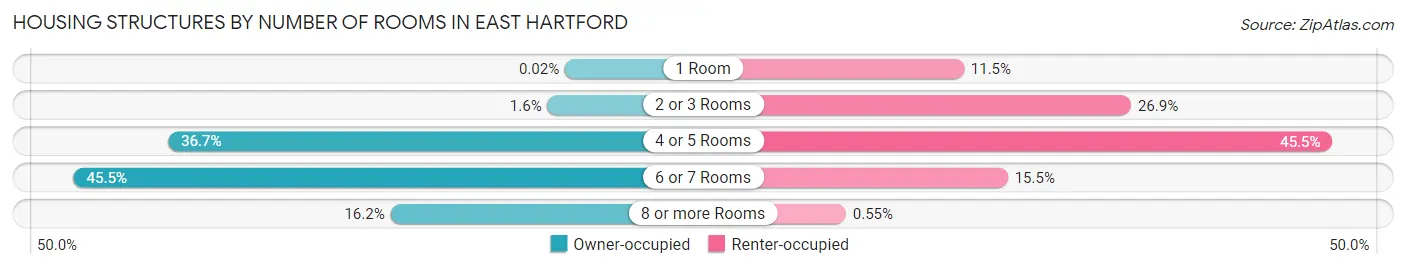
| Number of Rooms | Owner-occupied | Renter-occupied |
| 1 Room | 2 (0.0%) | 933 (11.5%) |
| 2 or 3 Rooms | 196 (1.6%) | 2,191 (26.9%) |
| 4 or 5 Rooms | 4,388 (36.7%) | 3,706 (45.5%) |
| 6 or 7 Rooms | 5,431 (45.5%) | 1,263 (15.5%) |
| 8 or more Rooms | 1,931 (16.2%) | 45 (0.5%) |
| Total | 11,948 (100.0%) | 8,138 (100.0%) |
Housing Structure by Heating Type in East Hartford
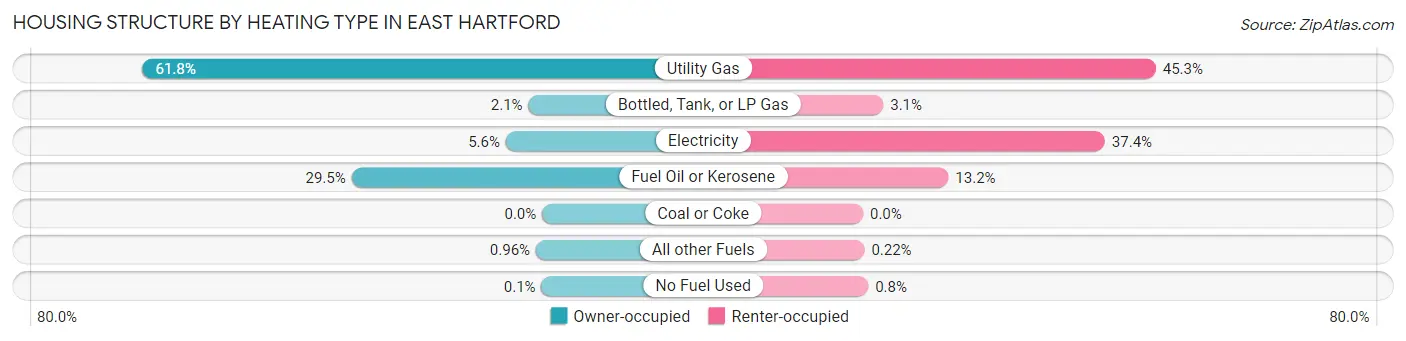
| Heating Type | Owner-occupied | Renter-occupied |
| Utility Gas | 7,379 (61.8%) | 3,683 (45.3%) |
| Bottled, Tank, or LP Gas | 252 (2.1%) | 255 (3.1%) |
| Electricity | 670 (5.6%) | 3,043 (37.4%) |
| Fuel Oil or Kerosene | 3,520 (29.5%) | 1,074 (13.2%) |
| Coal or Coke | 0 (0.0%) | 0 (0.0%) |
| All other Fuels | 115 (1.0%) | 18 (0.2%) |
| No Fuel Used | 12 (0.1%) | 65 (0.8%) |
| Total | 11,948 (100.0%) | 8,138 (100.0%) |
Household Vehicle Usage in East Hartford
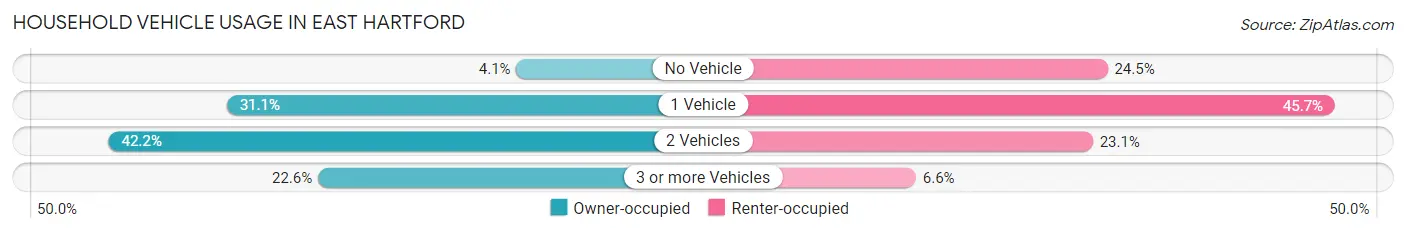
| Vehicles per Household | Owner-occupied | Renter-occupied |
| No Vehicle | 489 (4.1%) | 1,995 (24.5%) |
| 1 Vehicle | 3,720 (31.1%) | 3,722 (45.7%) |
| 2 Vehicles | 5,037 (42.2%) | 1,882 (23.1%) |
| 3 or more Vehicles | 2,702 (22.6%) | 539 (6.6%) |
| Total | 11,948 (100.0%) | 8,138 (100.0%) |
Real Estate & Mortgages in East Hartford
Real Estate and Mortgage Overview in East Hartford
| Characteristic | Without Mortgage | With Mortgage |
| Housing Units | 3,597 | 8,351 |
| Median Property Value | $190,900 | $204,700 |
| Median Household Income | $73,560 | $1,623 |
| Monthly Housing Costs | $913 | $335 |
| Real Estate Taxes | $5,562 | $94 |
Property Value by Mortgage Status in East Hartford
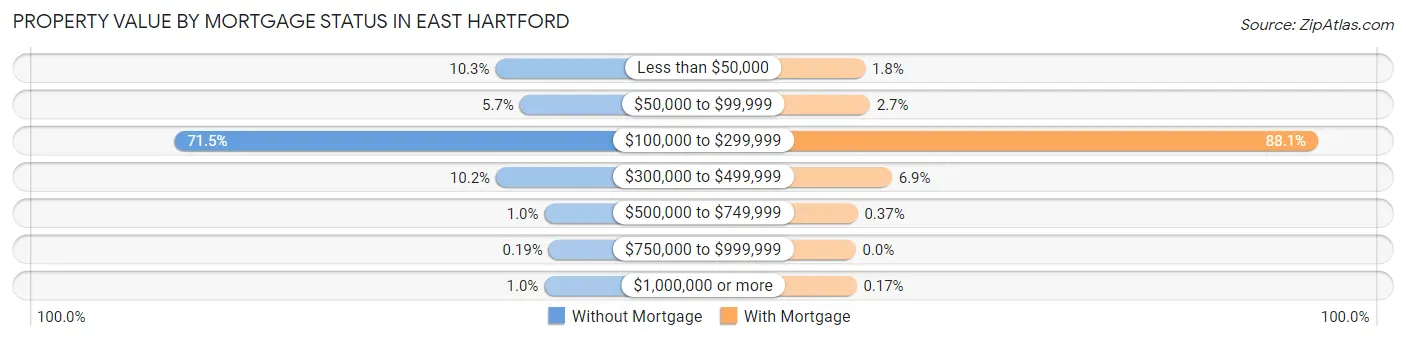
| Property Value | Without Mortgage | With Mortgage |
| Less than $50,000 | 372 (10.3%) | 150 (1.8%) |
| $50,000 to $99,999 | 205 (5.7%) | 226 (2.7%) |
| $100,000 to $299,999 | 2,572 (71.5%) | 7,354 (88.1%) |
| $300,000 to $499,999 | 368 (10.2%) | 576 (6.9%) |
| $500,000 to $749,999 | 36 (1.0%) | 31 (0.4%) |
| $750,000 to $999,999 | 7 (0.2%) | 0 (0.0%) |
| $1,000,000 or more | 37 (1.0%) | 14 (0.2%) |
| Total | 3,597 (100.0%) | 8,351 (100.0%) |
Household Income by Mortgage Status in East Hartford
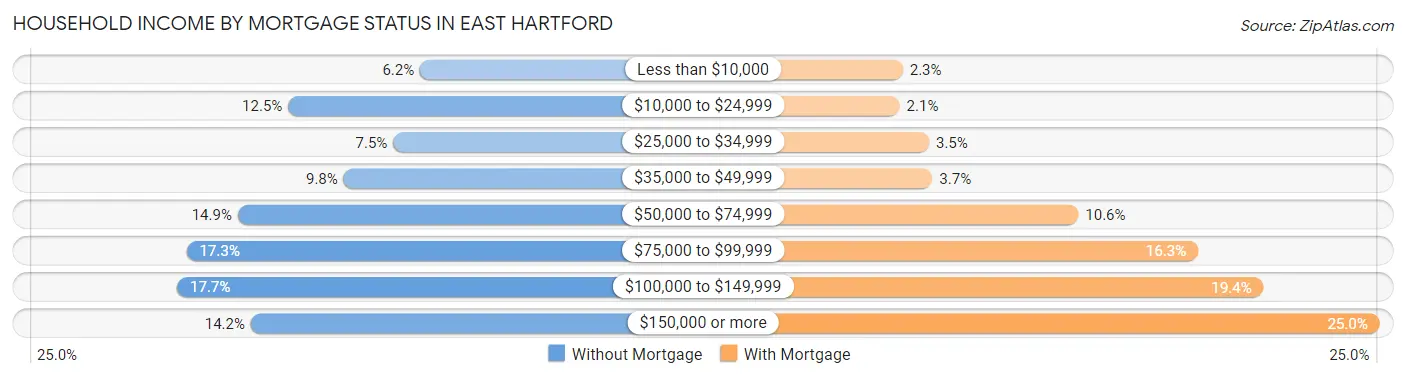
| Household Income | Without Mortgage | With Mortgage |
| Less than $10,000 | 222 (6.2%) | 188 (2.2%) |
| $10,000 to $24,999 | 448 (12.4%) | 175 (2.1%) |
| $25,000 to $34,999 | 268 (7.4%) | 292 (3.5%) |
| $35,000 to $49,999 | 353 (9.8%) | 306 (3.7%) |
| $50,000 to $74,999 | 534 (14.8%) | 886 (10.6%) |
| $75,000 to $99,999 | 622 (17.3%) | 1,362 (16.3%) |
| $100,000 to $149,999 | 638 (17.7%) | 1,623 (19.4%) |
| $150,000 or more | 512 (14.2%) | 2,084 (25.0%) |
| Total | 3,597 (100.0%) | 8,351 (100.0%) |
Property Value to Household Income Ratio in East Hartford
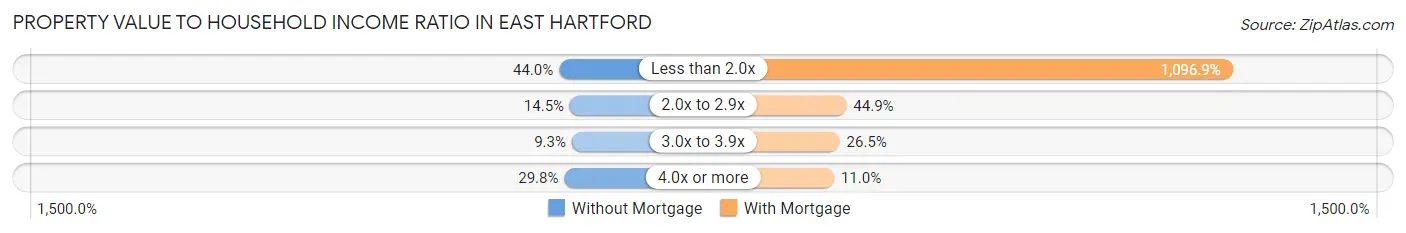
| Value-to-Income Ratio | Without Mortgage | With Mortgage |
| Less than 2.0x | 1,582 (44.0%) | 91,602 (1,096.9%) |
| 2.0x to 2.9x | 522 (14.5%) | 3,749 (44.9%) |
| 3.0x to 3.9x | 334 (9.3%) | 2,213 (26.5%) |
| 4.0x or more | 1,073 (29.8%) | 922 (11.0%) |
| Total | 3,597 (100.0%) | 8,351 (100.0%) |
Real Estate Taxes by Mortgage Status in East Hartford
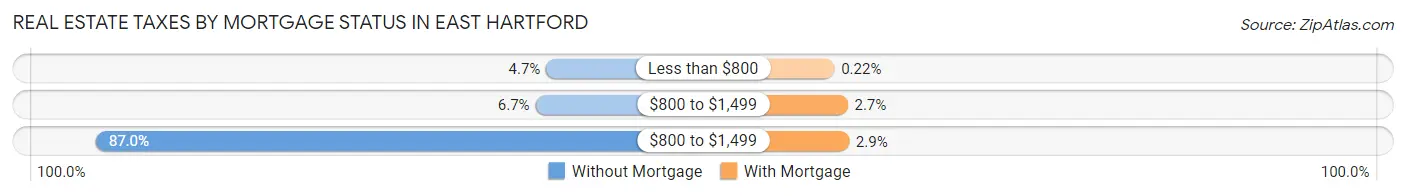
| Property Taxes | Without Mortgage | With Mortgage |
| Less than $800 | 170 (4.7%) | 18 (0.2%) |
| $800 to $1,499 | 241 (6.7%) | 221 (2.6%) |
| $800 to $1,499 | 3,129 (87.0%) | 242 (2.9%) |
| Total | 3,597 (100.0%) | 8,351 (100.0%) |
Health & Disability in East Hartford
Health Insurance Coverage by Age in East Hartford
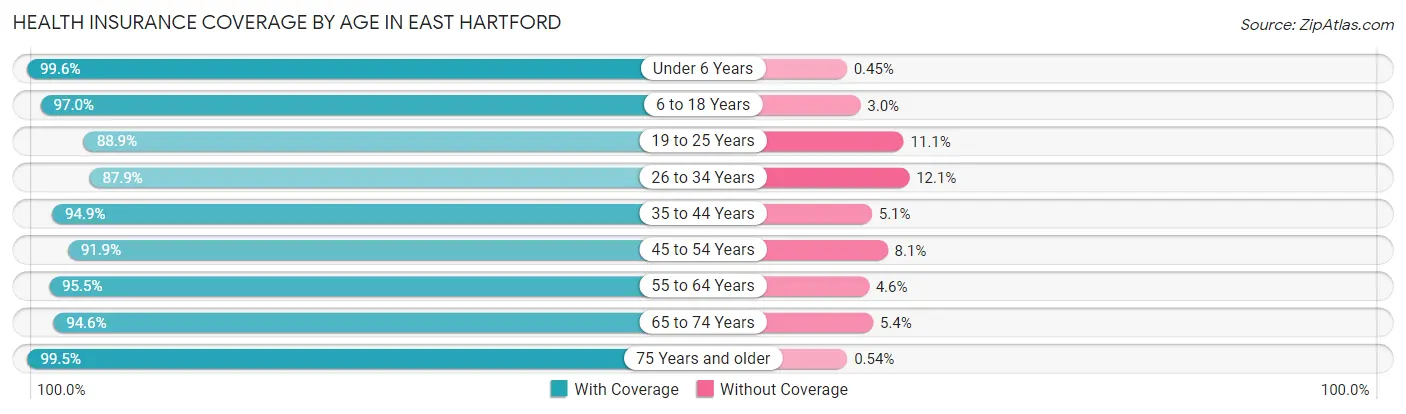
| Age Bracket | With Coverage | Without Coverage |
| Under 6 Years | 3,548 (99.6%) | 16 (0.4%) |
| 6 to 18 Years | 7,848 (97.0%) | 243 (3.0%) |
| 19 to 25 Years | 4,598 (88.9%) | 572 (11.1%) |
| 26 to 34 Years | 5,697 (87.9%) | 784 (12.1%) |
| 35 to 44 Years | 7,006 (94.9%) | 379 (5.1%) |
| 45 to 54 Years | 5,693 (91.9%) | 500 (8.1%) |
| 55 to 64 Years | 6,603 (95.5%) | 315 (4.5%) |
| 65 to 74 Years | 3,831 (94.6%) | 217 (5.4%) |
| 75 Years and older | 2,771 (99.5%) | 15 (0.5%) |
| Total | 47,595 (94.0%) | 3,041 (6.0%) |
Health Insurance Coverage by Citizenship Status in East Hartford
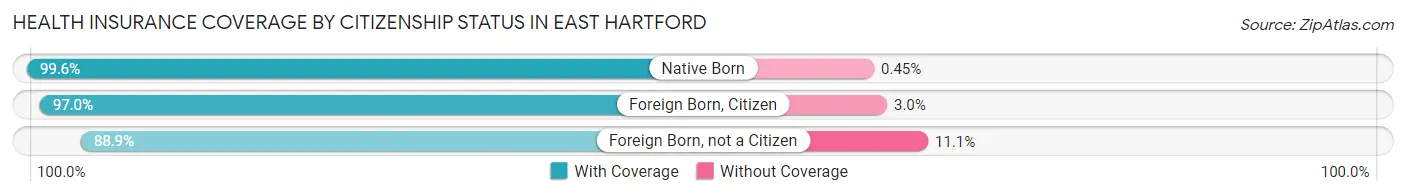
| Citizenship Status | With Coverage | Without Coverage |
| Native Born | 3,548 (99.6%) | 16 (0.4%) |
| Foreign Born, Citizen | 7,848 (97.0%) | 243 (3.0%) |
| Foreign Born, not a Citizen | 4,598 (88.9%) | 572 (11.1%) |
Health Insurance Coverage by Household Income in East Hartford
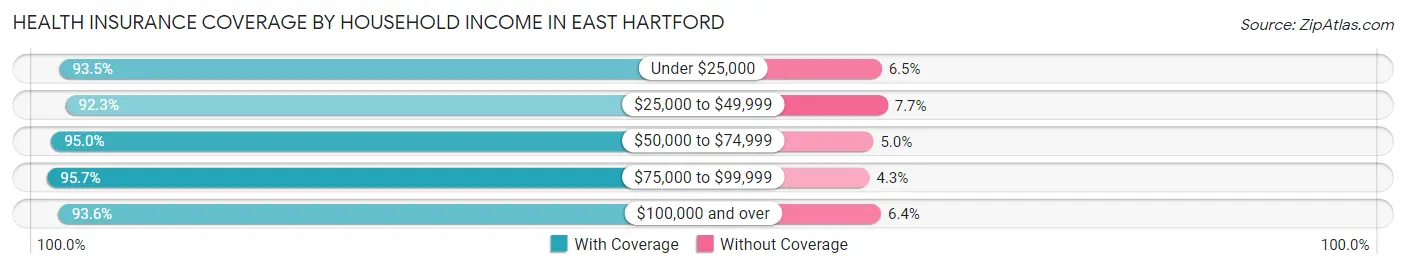
| Household Income | With Coverage | Without Coverage |
| Under $25,000 | 5,171 (93.5%) | 362 (6.5%) |
| $25,000 to $49,999 | 9,130 (92.3%) | 760 (7.7%) |
| $50,000 to $74,999 | 8,697 (95.0%) | 458 (5.0%) |
| $75,000 to $99,999 | 8,687 (95.7%) | 387 (4.3%) |
| $100,000 and over | 15,607 (93.6%) | 1,073 (6.4%) |
Public vs Private Health Insurance Coverage by Age in East Hartford
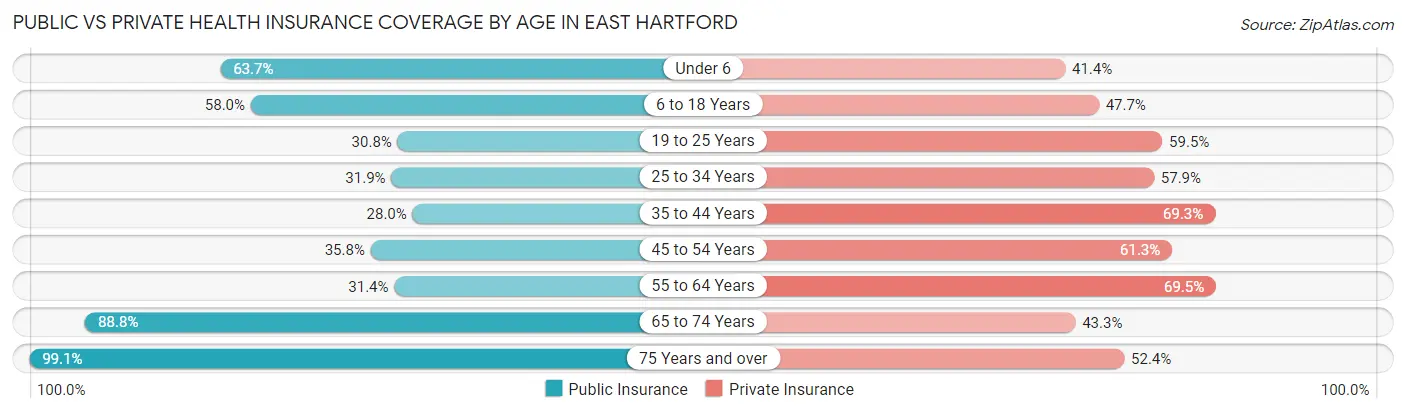
| Age Bracket | Public Insurance | Private Insurance |
| Under 6 | 2,270 (63.7%) | 1,477 (41.4%) |
| 6 to 18 Years | 4,693 (58.0%) | 3,858 (47.7%) |
| 19 to 25 Years | 1,590 (30.7%) | 3,074 (59.5%) |
| 25 to 34 Years | 2,068 (31.9%) | 3,754 (57.9%) |
| 35 to 44 Years | 2,066 (28.0%) | 5,117 (69.3%) |
| 45 to 54 Years | 2,214 (35.7%) | 3,797 (61.3%) |
| 55 to 64 Years | 2,170 (31.4%) | 4,805 (69.5%) |
| 65 to 74 Years | 3,594 (88.8%) | 1,754 (43.3%) |
| 75 Years and over | 2,762 (99.1%) | 1,460 (52.4%) |
| Total | 23,427 (46.3%) | 29,096 (57.5%) |
Disability Status by Sex by Age in East Hartford
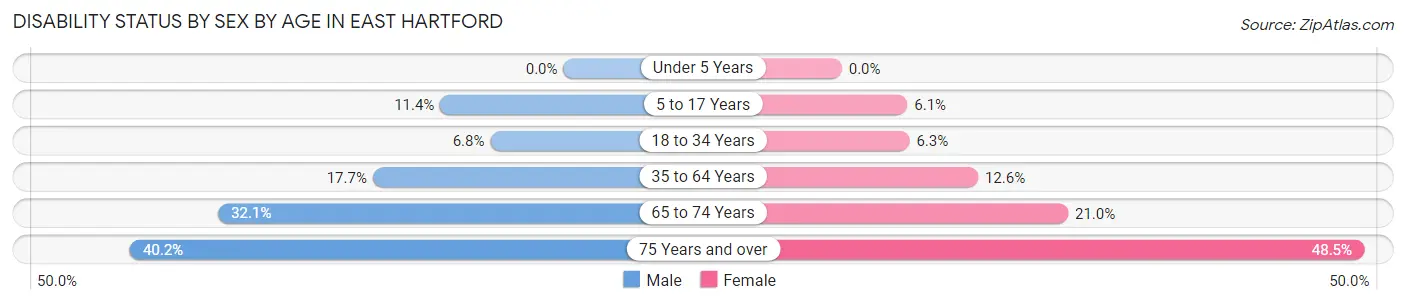
| Age Bracket | Male | Female |
| Under 5 Years | 0 (0.0%) | 0 (0.0%) |
| 5 to 17 Years | 456 (11.4%) | 235 (6.1%) |
| 18 to 34 Years | 430 (6.8%) | 373 (6.3%) |
| 35 to 64 Years | 1,756 (17.7%) | 1,336 (12.6%) |
| 65 to 74 Years | 574 (32.1%) | 474 (21.0%) |
| 75 Years and over | 444 (40.2%) | 815 (48.4%) |
Disability Class by Sex by Age in East Hartford
Disability Class: Hearing Difficulty
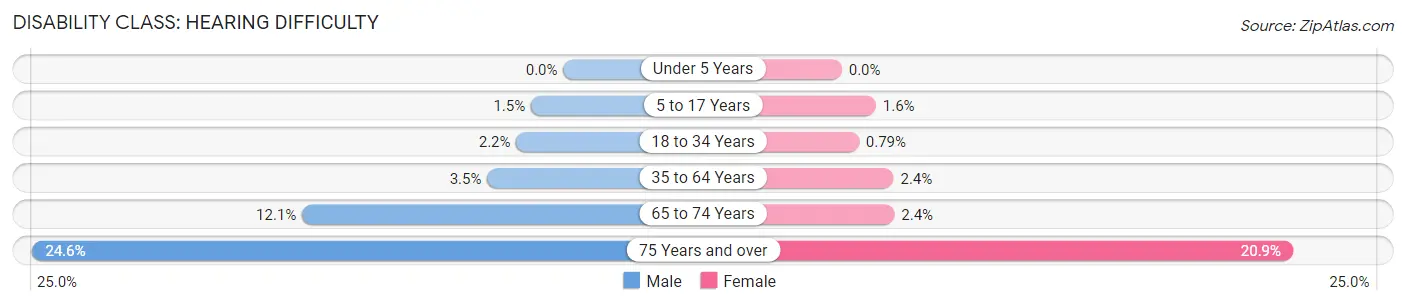
| Age Bracket | Male | Female |
| Under 5 Years | 0 (0.0%) | 0 (0.0%) |
| 5 to 17 Years | 60 (1.5%) | 61 (1.6%) |
| 18 to 34 Years | 138 (2.2%) | 47 (0.8%) |
| 35 to 64 Years | 350 (3.5%) | 254 (2.4%) |
| 65 to 74 Years | 217 (12.1%) | 55 (2.4%) |
| 75 Years and over | 272 (24.6%) | 352 (20.9%) |
Disability Class: Vision Difficulty
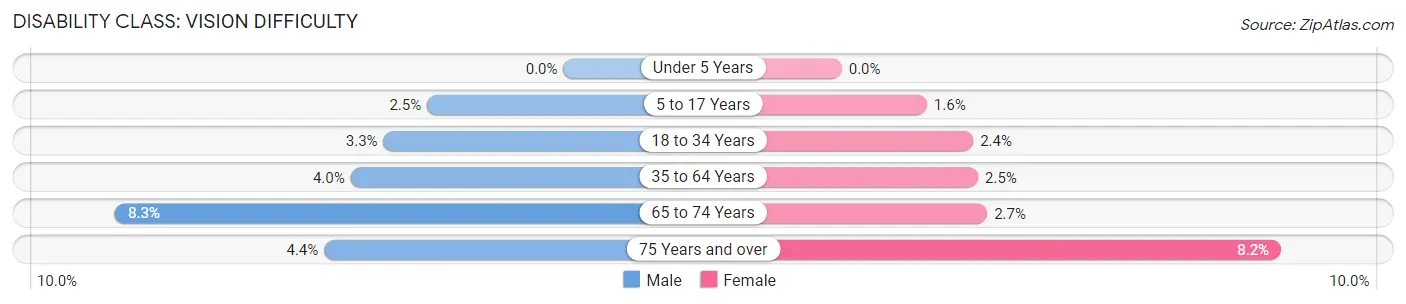
| Age Bracket | Male | Female |
| Under 5 Years | 0 (0.0%) | 0 (0.0%) |
| 5 to 17 Years | 101 (2.5%) | 61 (1.6%) |
| 18 to 34 Years | 212 (3.3%) | 145 (2.4%) |
| 35 to 64 Years | 392 (4.0%) | 267 (2.5%) |
| 65 to 74 Years | 149 (8.3%) | 61 (2.7%) |
| 75 Years and over | 49 (4.4%) | 137 (8.2%) |
Disability Class: Cognitive Difficulty
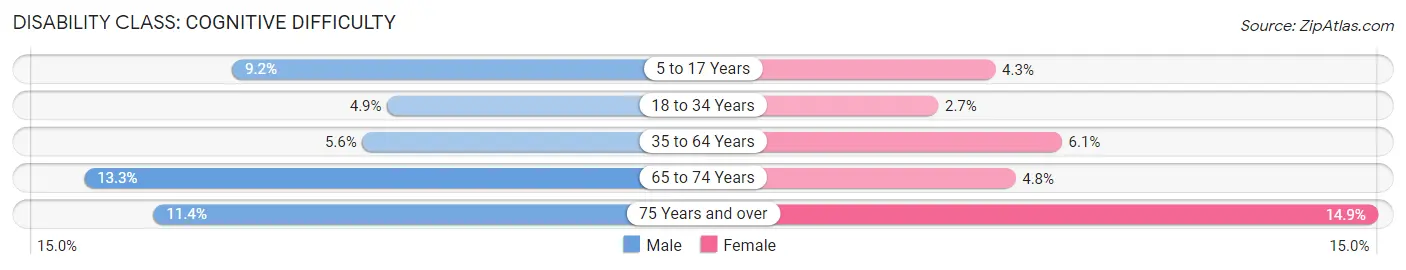
| Age Bracket | Male | Female |
| 5 to 17 Years | 368 (9.2%) | 165 (4.3%) |
| 18 to 34 Years | 311 (4.9%) | 159 (2.7%) |
| 35 to 64 Years | 555 (5.6%) | 647 (6.1%) |
| 65 to 74 Years | 239 (13.3%) | 109 (4.8%) |
| 75 Years and over | 126 (11.4%) | 251 (14.9%) |
Disability Class: Ambulatory Difficulty
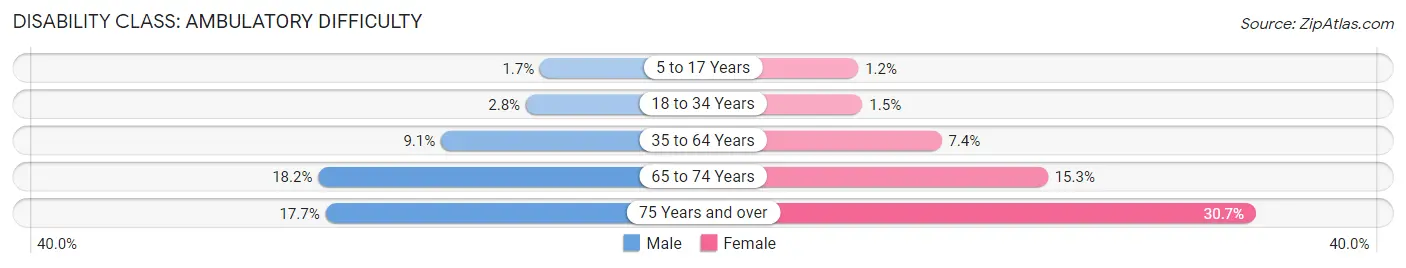
| Age Bracket | Male | Female |
| 5 to 17 Years | 69 (1.7%) | 47 (1.2%) |
| 18 to 34 Years | 176 (2.8%) | 91 (1.5%) |
| 35 to 64 Years | 901 (9.1%) | 782 (7.4%) |
| 65 to 74 Years | 326 (18.2%) | 345 (15.3%) |
| 75 Years and over | 195 (17.7%) | 517 (30.7%) |
Disability Class: Self-Care Difficulty
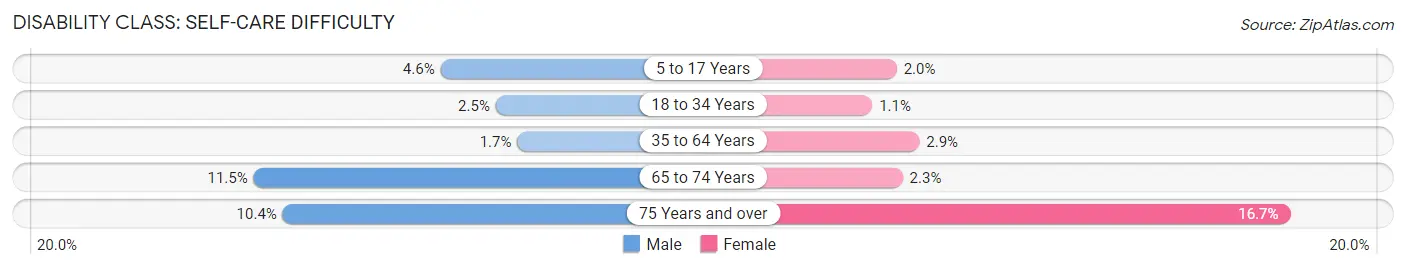
| Age Bracket | Male | Female |
| 5 to 17 Years | 182 (4.6%) | 79 (2.0%) |
| 18 to 34 Years | 159 (2.5%) | 67 (1.1%) |
| 35 to 64 Years | 170 (1.7%) | 304 (2.9%) |
| 65 to 74 Years | 206 (11.5%) | 51 (2.3%) |
| 75 Years and over | 115 (10.4%) | 280 (16.7%) |
Technology Access in East Hartford
Computing Device Access in East Hartford
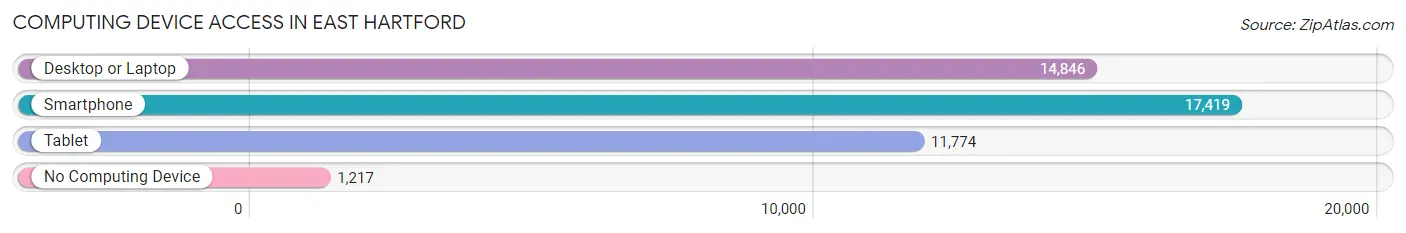
| Device Type | # Households | % Households |
| Desktop or Laptop | 14,846 | 73.9% |
| Smartphone | 17,419 | 86.7% |
| Tablet | 11,774 | 58.6% |
| No Computing Device | 1,217 | 6.1% |
| Total | 20,086 | 100.0% |
Internet Access in East Hartford
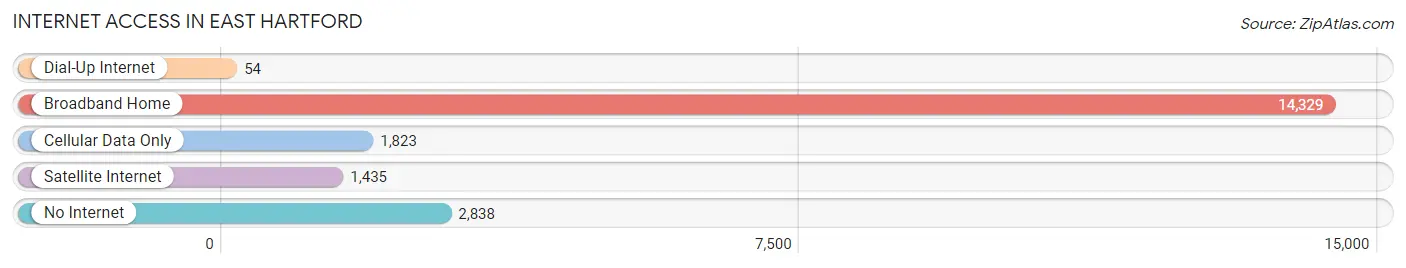
| Internet Type | # Households | % Households |
| Dial-Up Internet | 54 | 0.3% |
| Broadband Home | 14,329 | 71.3% |
| Cellular Data Only | 1,823 | 9.1% |
| Satellite Internet | 1,435 | 7.1% |
| No Internet | 2,838 | 14.1% |
| Total | 20,086 | 100.0% |
East Hartford Summary
History
East Hartford, Connecticut is a town located in Hartford County, Connecticut. It is situated on the east bank of the Connecticut River, directly across from Hartford, the state capital. The town was originally part of Hartford, but was incorporated as a separate town in 1783.
East Hartford has a long and rich history. The area was first settled by Europeans in 1636, when Thomas Hooker and his followers established the settlement of Hartford. The area that would become East Hartford was part of the original settlement, but was separated from Hartford in 1783.
The town was originally an agricultural community, with a focus on farming and fishing. In the 19th century, the town began to industrialize, with the establishment of several factories. The Pratt & Whitney Aircraft Company was founded in East Hartford in 1925, and the town became a major center of the aircraft industry.
Geography
East Hartford is located in Hartford County, Connecticut. It is situated on the east bank of the Connecticut River, directly across from Hartford, the state capital. The town is bordered by the towns of Manchester, South Windsor, Glastonbury, and Wethersfield.
East Hartford has a total area of 16.3 square miles, of which 15.9 square miles is land and 0.4 square miles is water. The town is mostly flat, with some rolling hills in the northern part of town. The Connecticut River forms the eastern border of the town.
Economy
East Hartford has a diverse economy, with a mix of manufacturing, retail, and service industries. The town is home to several major employers, including Pratt & Whitney Aircraft, United Technologies, and CIGNA.
The town is also home to several shopping centers, including the East Hartford Town Center and the Shoppes at Buckland Hills. The town also has a vibrant downtown area, with several restaurants, shops, and entertainment venues.
Demographics
As of the 2010 census, East Hartford had a population of 51,252. The racial makeup of the town was 63.2% White, 18.3% African American, 0.5% Native American, 8.2% Asian, 0.1% Pacific Islander, and 8.7% from other races. Hispanic or Latino of any race were 20.2% of the population.
The median household income in East Hartford was $50,945, and the median family income was $60,879. The per capita income was $25,945. About 11.3% of the population was below the poverty line.
East Hartford is served by the East Hartford Public Schools system. The town is also home to several private schools, including East Catholic High School and the East Hartford Montessori School.
Common Questions
What is Per Capita Income in East Hartford?
Per Capita income in East Hartford is $32,527.
What is the Median Family Income in East Hartford?
Median Family Income in East Hartford is $77,413.
What is the Median Household income in East Hartford?
Median Household Income in East Hartford is $64,244.
What is Income or Wage Gap in East Hartford?
Income or Wage Gap in East Hartford is 17.0%.
Women in East Hartford earn 83.0 cents for every dollar earned by a man.
What is Family Income Deficit in East Hartford?
Family Income Deficit in East Hartford is $8,244.
Families that are below poverty line in East Hartford earn $8,244 less on average than the poverty threshold level.
What is Inequality or Gini Index in East Hartford?
Inequality or Gini Index in East Hartford is 0.44.
What is the Total Population of East Hartford?
Total Population of East Hartford is 50,942.
What is the Total Male Population of East Hartford?
Total Male Population of East Hartford is 24,970.
What is the Total Female Population of East Hartford?
Total Female Population of East Hartford is 25,972.
What is the Ratio of Males per 100 Females in East Hartford?
There are 96.14 Males per 100 Females in East Hartford.
What is the Ratio of Females per 100 Males in East Hartford?
There are 104.01 Females per 100 Males in East Hartford.
What is the Median Population Age in East Hartford?
Median Population Age in East Hartford is 37.8 Years.
What is the Average Family Size in East Hartford
Average Family Size in East Hartford is 3.1 People.
What is the Average Household Size in East Hartford
Average Household Size in East Hartford is 2.5 People.
How Large is the Labor Force in East Hartford?
There are 27,594 People in the Labor Forcein in East Hartford.
What is the Percentage of People in the Labor Force in East Hartford?
66.3% of People are in the Labor Force in East Hartford.
What is the Unemployment Rate in East Hartford?
Unemployment Rate in East Hartford is 6.7%.