Middletown, NY Map & Demographics
Middletown Map
Middletown Overview
$31,484
PER CAPITA INCOME
$89,636
AVG FAMILY INCOME
$70,155
AVG HOUSEHOLD INCOME
24.5%
WAGE / INCOME GAP [ % ]
75.5¢/ $1
WAGE / INCOME GAP [ $ ]
0.44
INEQUALITY / GINI INDEX
30,169
TOTAL POPULATION
15,377
MALE POPULATION
14,792
FEMALE POPULATION
103.95
MALES / 100 FEMALES
96.20
FEMALES / 100 MALES
37.0
MEDIAN AGE
3.6
AVG FAMILY SIZE
2.9
AVG HOUSEHOLD SIZE
14,303
LABOR FORCE [ PEOPLE ]
61.7%
PERCENT IN LABOR FORCE
4.9%
UNEMPLOYMENT RATE
Income in Middletown
Income Overview in Middletown
Per Capita Income in Middletown is $31,484, while median incomes of families and households are $89,636 and $70,155 respectively.
| Characteristic | Number | Measure |
| Per Capita Income | 30,169 | $31,484 |
| Median Family Income | 6,827 | $89,636 |
| Mean Family Income | 6,827 | $103,900 |
| Median Household Income | 10,111 | $70,155 |
| Mean Household Income | 10,111 | $88,913 |
| Income Deficit | 6,827 | $0 |
| Wage / Income Gap (%) | 30,169 | 24.46% |
| Wage / Income Gap ($) | 30,169 | 75.54¢ per $1 |
| Gini / Inequality Index | 30,169 | 0.44 |
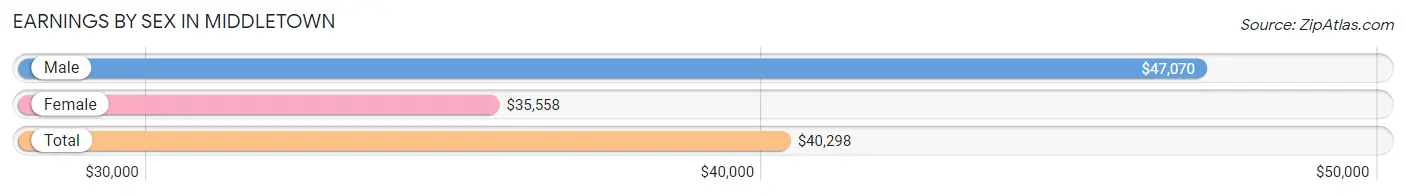
Earnings by Sex in Middletown
Average Earnings in Middletown are $40,298, $47,070 for men and $35,558 for women, a difference of 24.5%.
| Sex | Number | Average Earnings |
| Male | 7,472 (51.1%) | $47,070 |
| Female | 7,142 (48.9%) | $35,558 |
| Total | 14,614 (100.0%) | $40,298 |
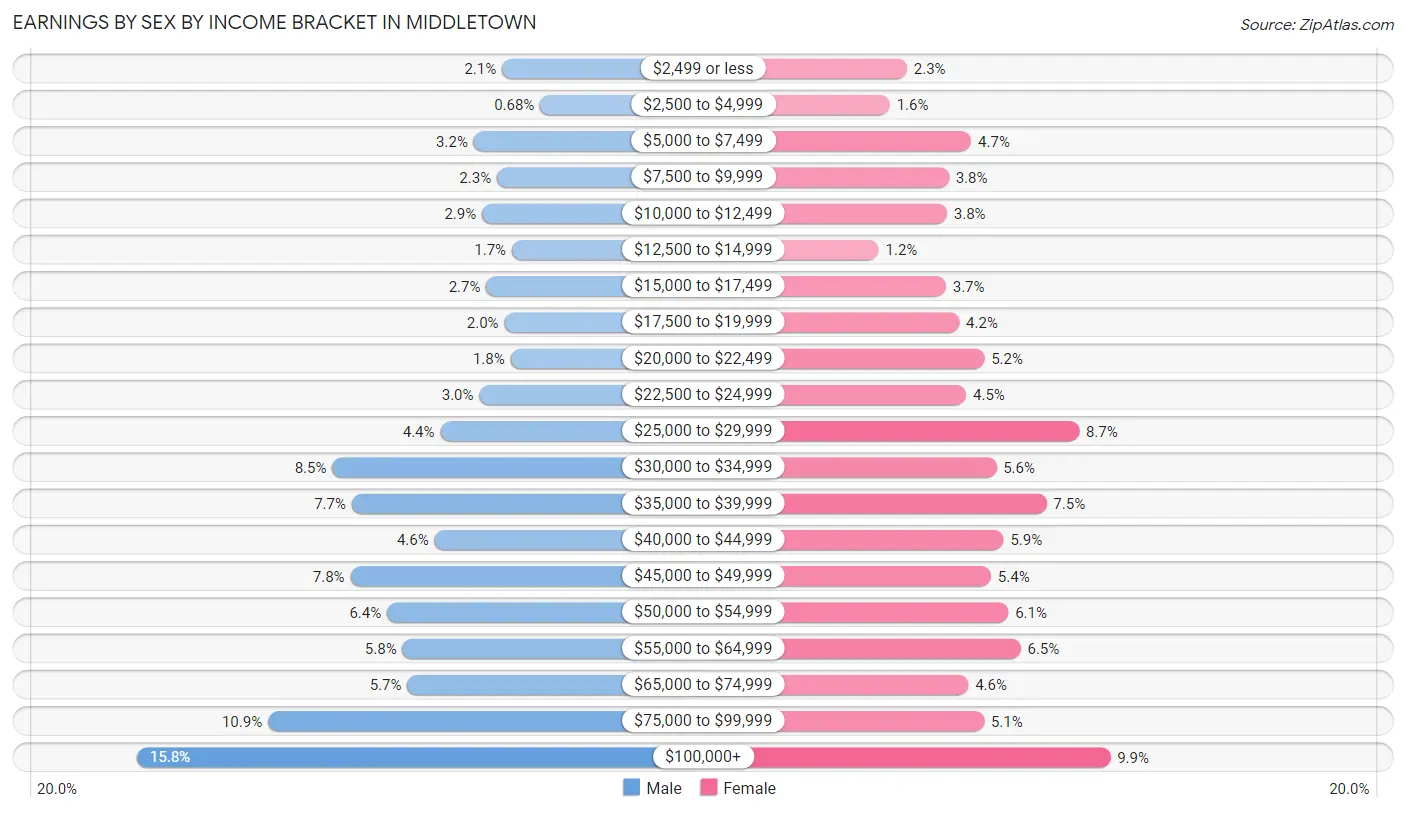
Earnings by Sex by Income Bracket in Middletown
The most common earnings brackets in Middletown are $100,000+ for men (1,180 | 15.8%) and $100,000+ for women (705 | 9.9%).
| Income | Male | Female |
| $2,499 or less | 158 (2.1%) | 161 (2.2%) |
| $2,500 to $4,999 | 51 (0.7%) | 115 (1.6%) |
| $5,000 to $7,499 | 237 (3.2%) | 333 (4.7%) |
| $7,500 to $9,999 | 172 (2.3%) | 273 (3.8%) |
| $10,000 to $12,499 | 214 (2.9%) | 268 (3.7%) |
| $12,500 to $14,999 | 130 (1.7%) | 85 (1.2%) |
| $15,000 to $17,499 | 202 (2.7%) | 265 (3.7%) |
| $17,500 to $19,999 | 151 (2.0%) | 301 (4.2%) |
| $20,000 to $22,499 | 134 (1.8%) | 368 (5.1%) |
| $22,500 to $24,999 | 221 (3.0%) | 319 (4.5%) |
| $25,000 to $29,999 | 330 (4.4%) | 621 (8.7%) |
| $30,000 to $34,999 | 633 (8.5%) | 400 (5.6%) |
| $35,000 to $39,999 | 578 (7.7%) | 534 (7.5%) |
| $40,000 to $44,999 | 347 (4.6%) | 419 (5.9%) |
| $45,000 to $49,999 | 582 (7.8%) | 386 (5.4%) |
| $50,000 to $54,999 | 480 (6.4%) | 432 (6.0%) |
| $55,000 to $64,999 | 436 (5.8%) | 465 (6.5%) |
| $65,000 to $74,999 | 423 (5.7%) | 325 (4.5%) |
| $75,000 to $99,999 | 813 (10.9%) | 367 (5.1%) |
| $100,000+ | 1,180 (15.8%) | 705 (9.9%) |
| Total | 7,472 (100.0%) | 7,142 (100.0%) |
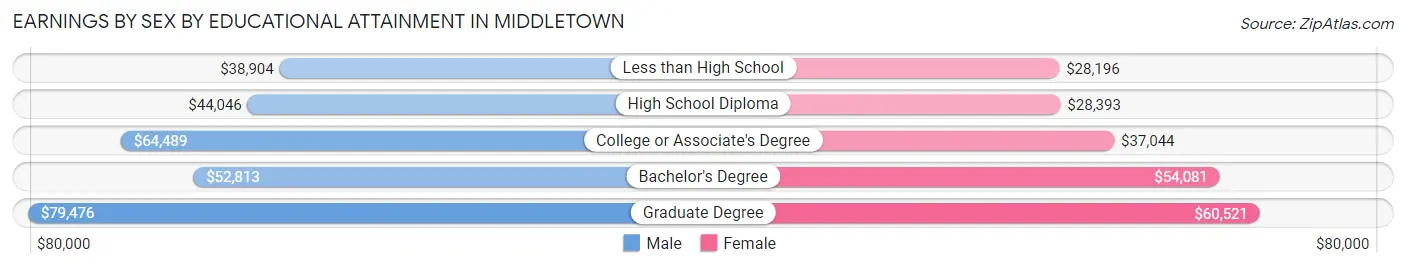
Earnings by Sex by Educational Attainment in Middletown
Average earnings in Middletown are $49,969 for men and $38,315 for women, a difference of 23.3%. Men with an educational attainment of graduate degree enjoy the highest average annual earnings of $79,476, while those with less than high school education earn the least with $38,904. Women with an educational attainment of graduate degree earn the most with the average annual earnings of $60,521, while those with less than high school education have the smallest earnings of $28,196.
| Educational Attainment | Male Income | Female Income |
| Less than High School | $38,904 | $28,196 |
| High School Diploma | $44,046 | $28,393 |
| College or Associate's Degree | $64,489 | $37,044 |
| Bachelor's Degree | $52,813 | $54,081 |
| Graduate Degree | $79,476 | $60,521 |
| Total | $49,969 | $38,315 |
Family Income in Middletown
Family Income Brackets in Middletown
According to the Middletown family income data, there are 1,584 families falling into the $100,000 to $149,999 income range, which is the most common income bracket and makes up 23.2% of all families. Conversely, the $10,000 to $14,999 income bracket is the least frequent group with only 89 families (1.3%) belonging to this category.
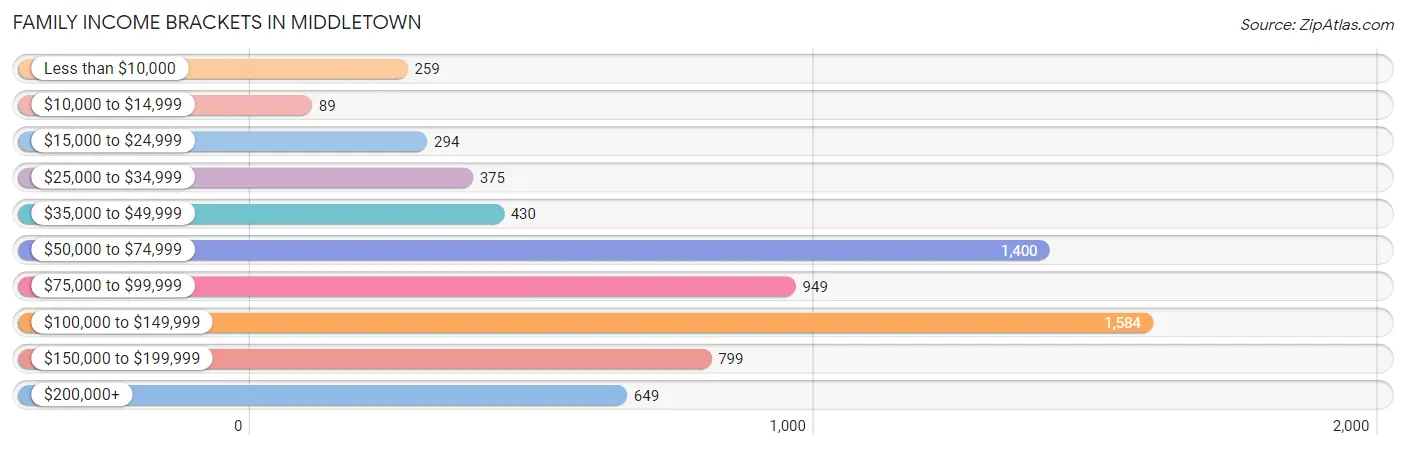
| Income Bracket | # Families | % Families |
| Less than $10,000 | 259 | 3.8% |
| $10,000 to $14,999 | 89 | 1.3% |
| $15,000 to $24,999 | 294 | 4.3% |
| $25,000 to $34,999 | 375 | 5.5% |
| $35,000 to $49,999 | 430 | 6.3% |
| $50,000 to $74,999 | 1,400 | 20.5% |
| $75,000 to $99,999 | 949 | 13.9% |
| $100,000 to $149,999 | 1,584 | 23.2% |
| $150,000 to $199,999 | 799 | 11.7% |
| $200,000+ | 649 | 9.5% |
Family Income by Famaliy Size in Middletown
7+ person families (465 | 6.8%) account for the highest median family income in Middletown with $110,163 per family, while 2-person families (2,580 | 37.8%) have the highest median income of $39,166 per family member.
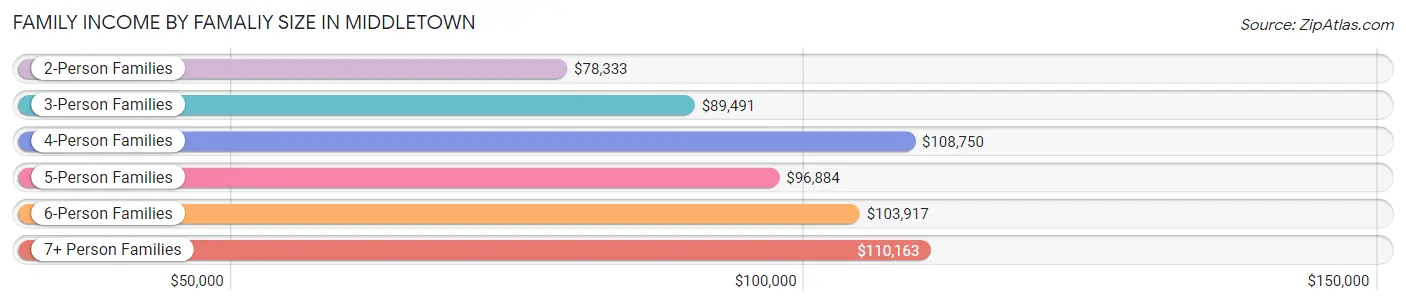
| Income Bracket | # Families | Median Income |
| 2-Person Families | 2,580 (37.8%) | $78,333 |
| 3-Person Families | 1,354 (19.8%) | $89,491 |
| 4-Person Families | 1,379 (20.2%) | $108,750 |
| 5-Person Families | 734 (10.7%) | $96,884 |
| 6-Person Families | 315 (4.6%) | $103,917 |
| 7+ Person Families | 465 (6.8%) | $110,163 |
| Total | 6,827 (100.0%) | $89,636 |
Family Income by Number of Earners in Middletown
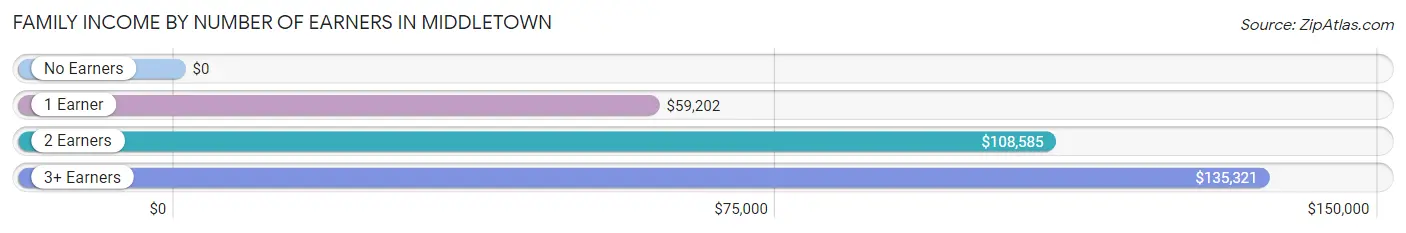
| Number of Earners | # Families | Median Income |
| No Earners | 478 (7.0%) | $0 |
| 1 Earner | 2,643 (38.7%) | $59,202 |
| 2 Earners | 2,674 (39.2%) | $108,585 |
| 3+ Earners | 1,032 (15.1%) | $135,321 |
| Total | 6,827 (100.0%) | $89,636 |
Household Income in Middletown
Household Income Brackets in Middletown
With 1,790 households falling in the category, the $50,000 to $74,999 income range is the most frequent in Middletown, accounting for 17.7% of all households. In contrast, only 354 households (3.5%) fall into the $10,000 to $14,999 income bracket, making it the least populous group.
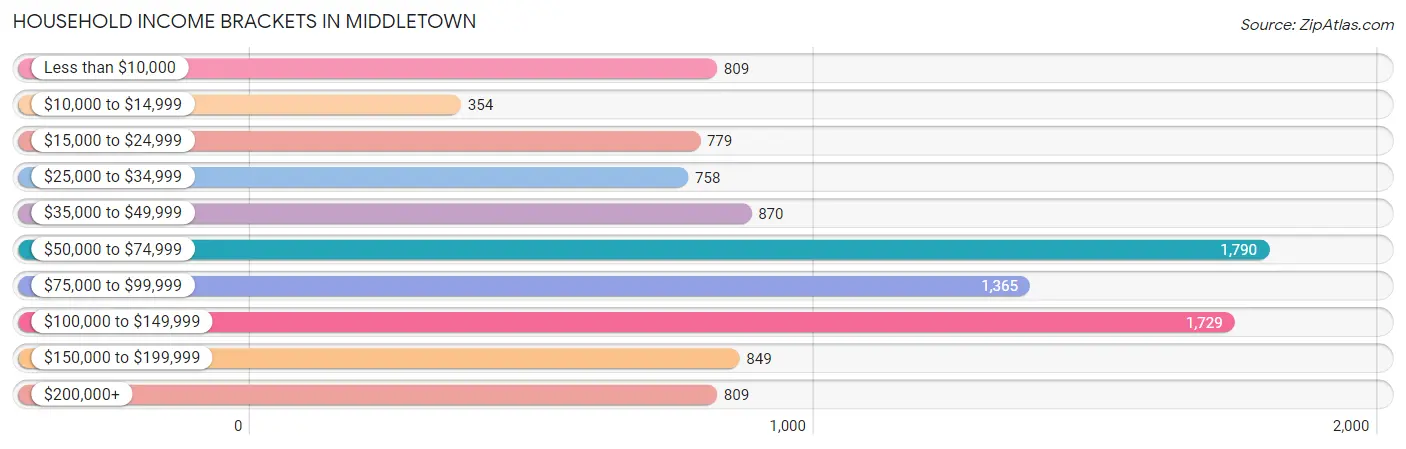
| Income Bracket | # Households | % Households |
| Less than $10,000 | 809 | 8.0% |
| $10,000 to $14,999 | 354 | 3.5% |
| $15,000 to $24,999 | 779 | 7.7% |
| $25,000 to $34,999 | 758 | 7.5% |
| $35,000 to $49,999 | 870 | 8.6% |
| $50,000 to $74,999 | 1,790 | 17.7% |
| $75,000 to $99,999 | 1,365 | 13.5% |
| $100,000 to $149,999 | 1,729 | 17.1% |
| $150,000 to $199,999 | 849 | 8.4% |
| $200,000+ | 809 | 8.0% |
Household Income by Householder Age in Middletown
The median household income in Middletown is $70,155, with the highest median household income of $95,223 found in the 45 to 64 years age bracket for the primary householder. A total of 4,213 households (41.7%) fall into this category. Meanwhile, the 15 to 24 years age bracket for the primary householder has the lowest median household income of $0, with 227 households (2.2%) in this group.
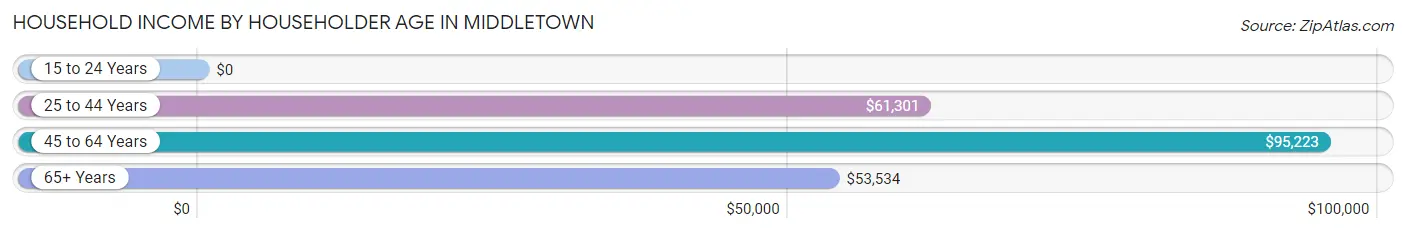
| Income Bracket | # Households | Median Income |
| 15 to 24 Years | 227 (2.2%) | $0 |
| 25 to 44 Years | 3,217 (31.8%) | $61,301 |
| 45 to 64 Years | 4,213 (41.7%) | $95,223 |
| 65+ Years | 2,454 (24.3%) | $53,534 |
| Total | 10,111 (100.0%) | $70,155 |
Poverty in Middletown
Income Below Poverty by Sex and Age in Middletown
With 14.9% poverty level for males and 15.3% for females among the residents of Middletown, 15 year old males and 12 to 14 year old females are the most vulnerable to poverty, with 102 males (51.8%) and 371 females (40.3%) in their respective age groups living below the poverty level.
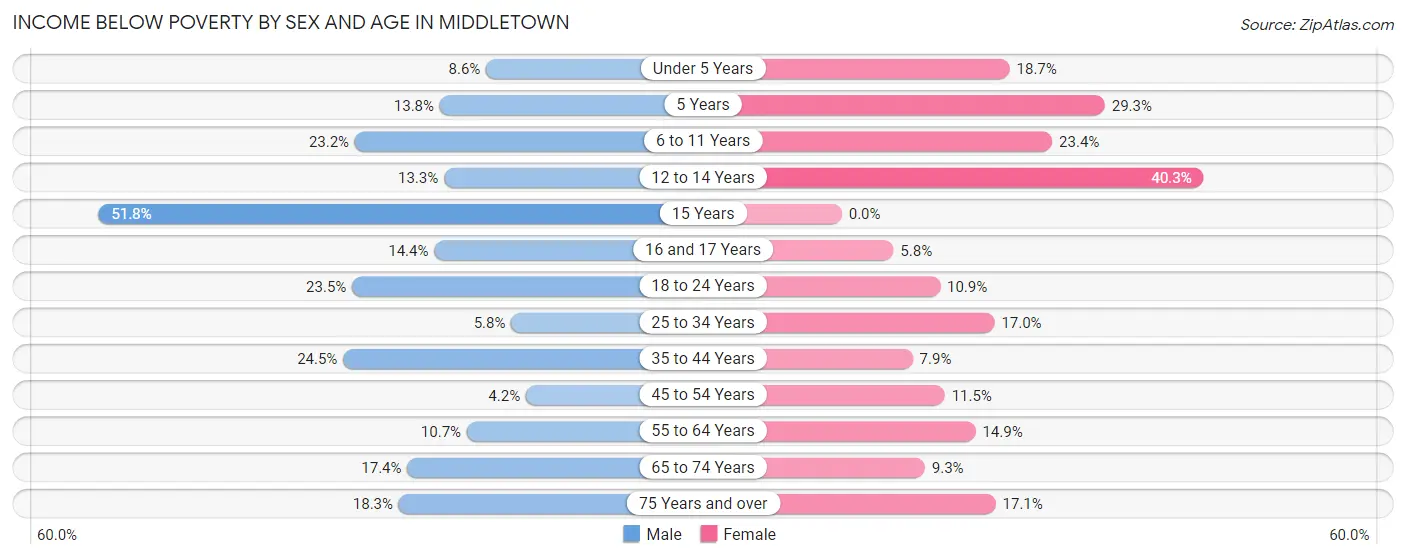
| Age Bracket | Male | Female |
| Under 5 Years | 96 (8.6%) | 208 (18.7%) |
| 5 Years | 22 (13.8%) | 41 (29.3%) |
| 6 to 11 Years | 314 (23.2%) | 198 (23.4%) |
| 12 to 14 Years | 105 (13.3%) | 371 (40.3%) |
| 15 Years | 102 (51.8%) | 0 (0.0%) |
| 16 and 17 Years | 77 (14.4%) | 18 (5.8%) |
| 18 to 24 Years | 329 (23.5%) | 132 (10.9%) |
| 25 to 34 Years | 121 (5.8%) | 320 (17.0%) |
| 35 to 44 Years | 503 (24.5%) | 144 (7.9%) |
| 45 to 54 Years | 81 (4.2%) | 221 (11.5%) |
| 55 to 64 Years | 188 (10.7%) | 306 (14.9%) |
| 65 to 74 Years | 211 (17.4%) | 125 (9.2%) |
| 75 Years and over | 122 (18.3%) | 135 (17.1%) |
| Total | 2,271 (14.9%) | 2,219 (15.3%) |
Income Above Poverty by Sex and Age in Middletown
According to the poverty statistics in Middletown, males aged 45 to 54 years and females aged 15 years are the age groups that are most secure financially, with 95.8% of males and 100.0% of females in these age groups living above the poverty line.
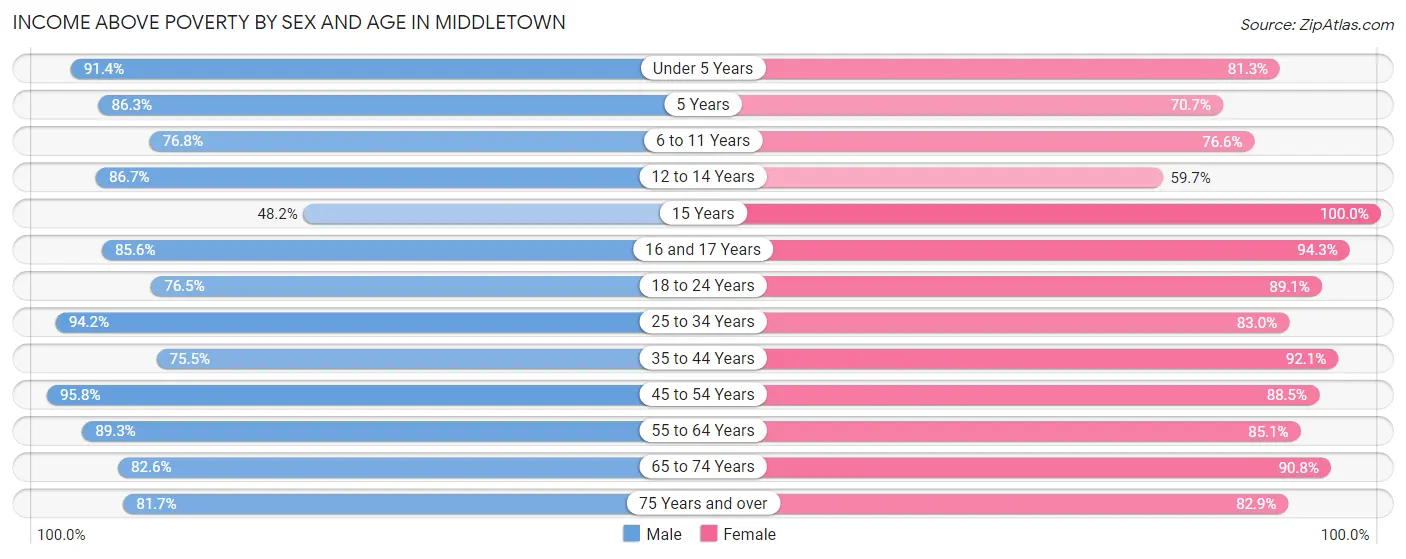
| Age Bracket | Male | Female |
| Under 5 Years | 1,022 (91.4%) | 905 (81.3%) |
| 5 Years | 138 (86.3%) | 99 (70.7%) |
| 6 to 11 Years | 1,039 (76.8%) | 647 (76.6%) |
| 12 to 14 Years | 685 (86.7%) | 550 (59.7%) |
| 15 Years | 95 (48.2%) | 159 (100.0%) |
| 16 and 17 Years | 459 (85.6%) | 295 (94.3%) |
| 18 to 24 Years | 1,070 (76.5%) | 1,075 (89.1%) |
| 25 to 34 Years | 1,967 (94.2%) | 1,562 (83.0%) |
| 35 to 44 Years | 1,548 (75.5%) | 1,682 (92.1%) |
| 45 to 54 Years | 1,866 (95.8%) | 1,708 (88.5%) |
| 55 to 64 Years | 1,562 (89.3%) | 1,749 (85.1%) |
| 65 to 74 Years | 1,004 (82.6%) | 1,226 (90.7%) |
| 75 Years and over | 544 (81.7%) | 653 (82.9%) |
| Total | 12,999 (85.1%) | 12,310 (84.7%) |
Income Below Poverty Among Married-Couple Families in Middletown
The poverty statistics for married-couple families in Middletown show that 6.5% or 305 of the total 4,725 families live below the poverty line. Families with 5 or more children have the highest poverty rate of 37.7%, comprising of 60 families. On the other hand, families with no children have the lowest poverty rate of 1.4%, which includes 33 families.
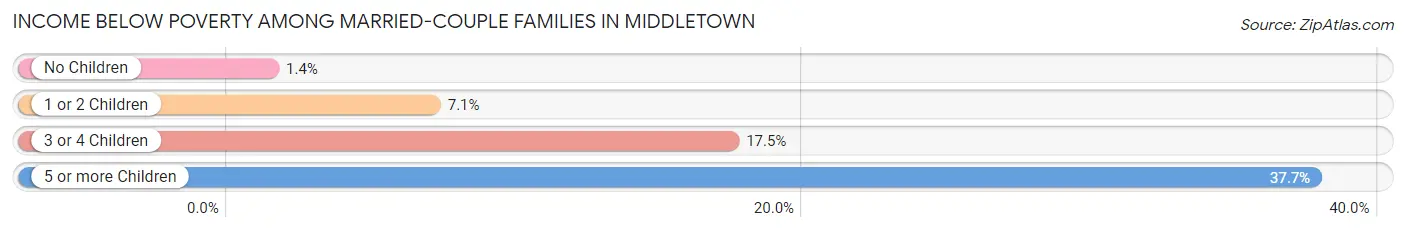
| Children | Above Poverty | Below Poverty |
| No Children | 2,280 (98.6%) | 33 (1.4%) |
| 1 or 2 Children | 1,620 (92.9%) | 123 (7.1%) |
| 3 or 4 Children | 421 (82.6%) | 89 (17.4%) |
| 5 or more Children | 99 (62.3%) | 60 (37.7%) |
| Total | 4,420 (93.5%) | 305 (6.5%) |
Income Below Poverty Among Single-Parent Households in Middletown
According to the poverty data in Middletown, 3.4% or 23 single-father households and 24.2% or 343 single-mother households are living below the poverty line. Among single-father households, those with 1 or 2 children have the highest poverty rate, with 23 households (7.3%) experiencing poverty. Likewise, among single-mother households, those with 5 or more children have the highest poverty rate, with 39 households (100.0%) falling below the poverty line.
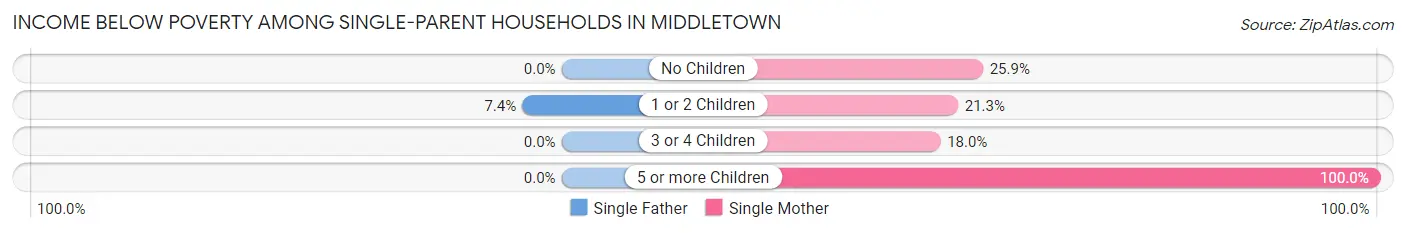
| Children | Single Father | Single Mother |
| No Children | 0 (0.0%) | 108 (25.9%) |
| 1 or 2 Children | 23 (7.3%) | 148 (21.3%) |
| 3 or 4 Children | 0 (0.0%) | 48 (18.0%) |
| 5 or more Children | 0 (0.0%) | 39 (100.0%) |
| Total | 23 (3.4%) | 343 (24.2%) |
Income Below Poverty Among Married-Couple vs Single-Parent Households in Middletown
The poverty data for Middletown shows that 305 of the married-couple family households (6.5%) and 366 of the single-parent households (17.4%) are living below the poverty level. Within the married-couple family households, those with 5 or more children have the highest poverty rate, with 60 households (37.7%) falling below the poverty line. Among the single-parent households, those with 5 or more children have the highest poverty rate, with 39 household (100.0%) living below poverty.
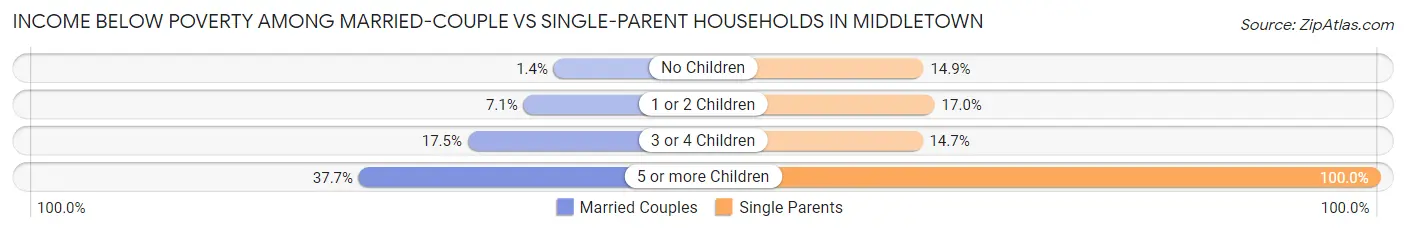
| Children | Married-Couple Families | Single-Parent Households |
| No Children | 33 (1.4%) | 108 (14.9%) |
| 1 or 2 Children | 123 (7.1%) | 171 (17.0%) |
| 3 or 4 Children | 89 (17.4%) | 48 (14.7%) |
| 5 or more Children | 60 (37.7%) | 39 (100.0%) |
| Total | 305 (6.5%) | 366 (17.4%) |
Race in Middletown
The most populous races in Middletown are Hispanic or Latino (12,154 | 40.3%), White / Caucasian (11,547 | 38.3%), and Black / African American (7,683 | 25.5%).
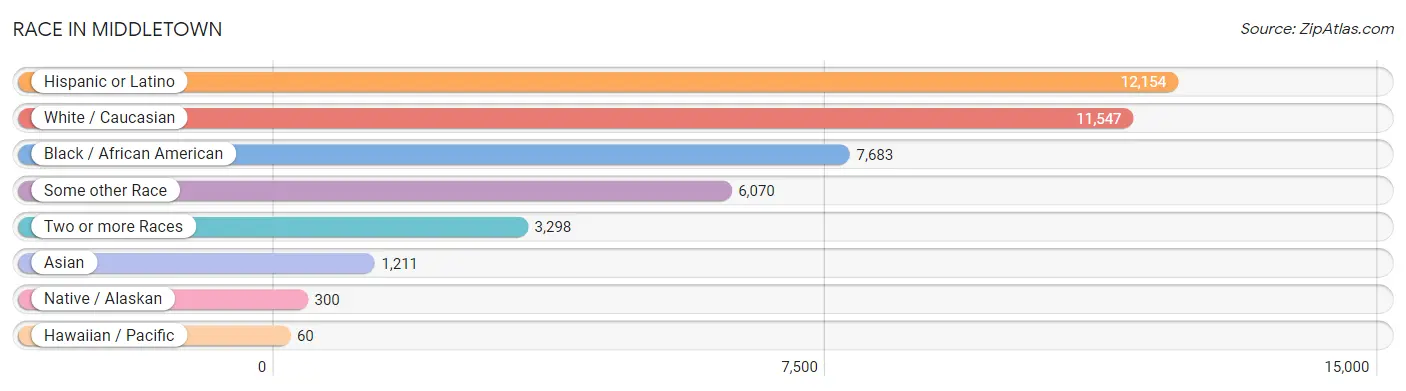
| Race | # Population | % Population |
| Asian | 1,211 | 4.0% |
| Black / African American | 7,683 | 25.5% |
| Hawaiian / Pacific | 60 | 0.2% |
| Hispanic or Latino | 12,154 | 40.3% |
| Native / Alaskan | 300 | 1.0% |
| White / Caucasian | 11,547 | 38.3% |
| Two or more Races | 3,298 | 10.9% |
| Some other Race | 6,070 | 20.1% |
| Total | 30,169 | 100.0% |
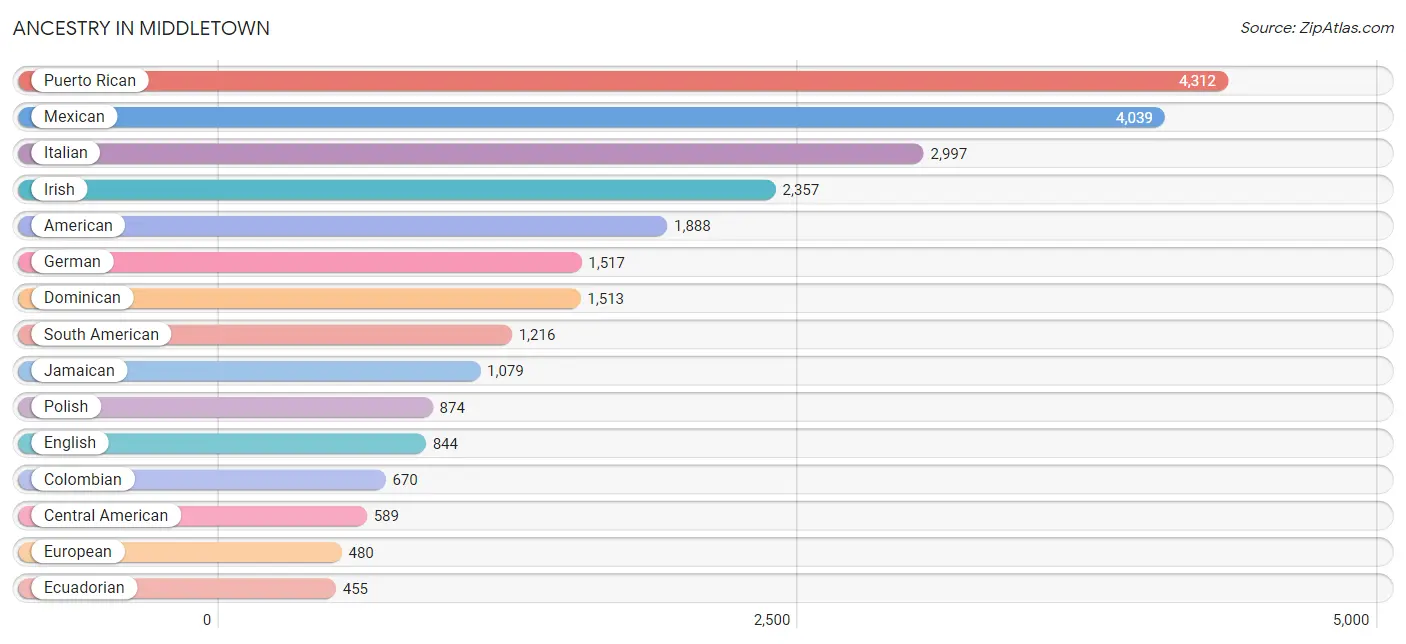
Ancestry in Middletown
The most populous ancestries reported in Middletown are Puerto Rican (4,312 | 14.3%), Mexican (4,039 | 13.4%), Italian (2,997 | 9.9%), Irish (2,357 | 7.8%), and American (1,888 | 6.3%), together accounting for 51.7% of all Middletown residents.
| Ancestry | # Population | % Population |
| African | 217 | 0.7% |
| American | 1,888 | 6.3% |
| Apache | 58 | 0.2% |
| Arab | 246 | 0.8% |
| Austrian | 87 | 0.3% |
| Barbadian | 112 | 0.4% |
| Belgian | 19 | 0.1% |
| Bhutanese | 18 | 0.1% |
| Blackfeet | 20 | 0.1% |
| British | 36 | 0.1% |
| British West Indian | 51 | 0.2% |
| Burmese | 37 | 0.1% |
| Cape Verdean | 31 | 0.1% |
| Central American | 589 | 1.9% |
| Central American Indian | 62 | 0.2% |
| Cherokee | 52 | 0.2% |
| Colombian | 670 | 2.2% |
| Croatian | 7 | 0.0% |
| Cuban | 83 | 0.3% |
| Czech | 15 | 0.1% |
| Czechoslovakian | 8 | 0.0% |
| Danish | 19 | 0.1% |
| Delaware | 26 | 0.1% |
| Dominican | 1,513 | 5.0% |
| Dutch | 287 | 0.9% |
| Ecuadorian | 455 | 1.5% |
| Egyptian | 28 | 0.1% |
| English | 844 | 2.8% |
| European | 480 | 1.6% |
| Filipino | 15 | 0.1% |
| French | 203 | 0.7% |
| French Canadian | 174 | 0.6% |
| German | 1,517 | 5.0% |
| German Russian | 9 | 0.0% |
| Greek | 163 | 0.5% |
| Guatemalan | 213 | 0.7% |
| Guyanese | 227 | 0.7% |
| Haitian | 411 | 1.4% |
| Honduran | 42 | 0.1% |
| Hungarian | 138 | 0.5% |
| Indian (Asian) | 309 | 1.0% |
| Irish | 2,357 | 7.8% |
| Iroquois | 3 | 0.0% |
| Italian | 2,997 | 9.9% |
| Jamaican | 1,079 | 3.6% |
| Korean | 9 | 0.0% |
| Lebanese | 1 | 0.0% |
| Lithuanian | 17 | 0.1% |
| Mexican | 4,039 | 13.4% |
| Mexican American Indian | 269 | 0.9% |
| Native Hawaiian | 78 | 0.3% |
| Nicaraguan | 84 | 0.3% |
| Nigerian | 47 | 0.2% |
| Northern European | 126 | 0.4% |
| Norwegian | 71 | 0.2% |
| Pakistani | 17 | 0.1% |
| Palestinian | 8 | 0.0% |
| Panamanian | 29 | 0.1% |
| Peruvian | 91 | 0.3% |
| Polish | 874 | 2.9% |
| Portuguese | 84 | 0.3% |
| Puerto Rican | 4,312 | 14.3% |
| Romanian | 13 | 0.0% |
| Russian | 180 | 0.6% |
| Salvadoran | 221 | 0.7% |
| Scotch-Irish | 12 | 0.0% |
| Scottish | 24 | 0.1% |
| Slovak | 38 | 0.1% |
| South African | 17 | 0.1% |
| South American | 1,216 | 4.0% |
| South American Indian | 20 | 0.1% |
| Spaniard | 178 | 0.6% |
| Sri Lankan | 344 | 1.1% |
| Subsaharan African | 312 | 1.0% |
| Swedish | 117 | 0.4% |
| Swiss | 14 | 0.1% |
| Thai | 433 | 1.4% |
| Trinidadian and Tobagonian | 35 | 0.1% |
| Turkish | 5 | 0.0% |
| Ukrainian | 105 | 0.4% |
| Vietnamese | 93 | 0.3% |
| Welsh | 30 | 0.1% |
| West Indian | 260 | 0.9% |
| Yugoslavian | 191 | 0.6% | View All 84 Rows |
Immigrants in Middletown
The most numerous immigrant groups reported in Middletown came from Latin America (4,142 | 13.7%), Central America (1,690 | 5.6%), Caribbean (1,629 | 5.4%), Mexico (1,309 | 4.3%), and Asia (916 | 3.0%), together accounting for 32.1% of all Middletown residents.
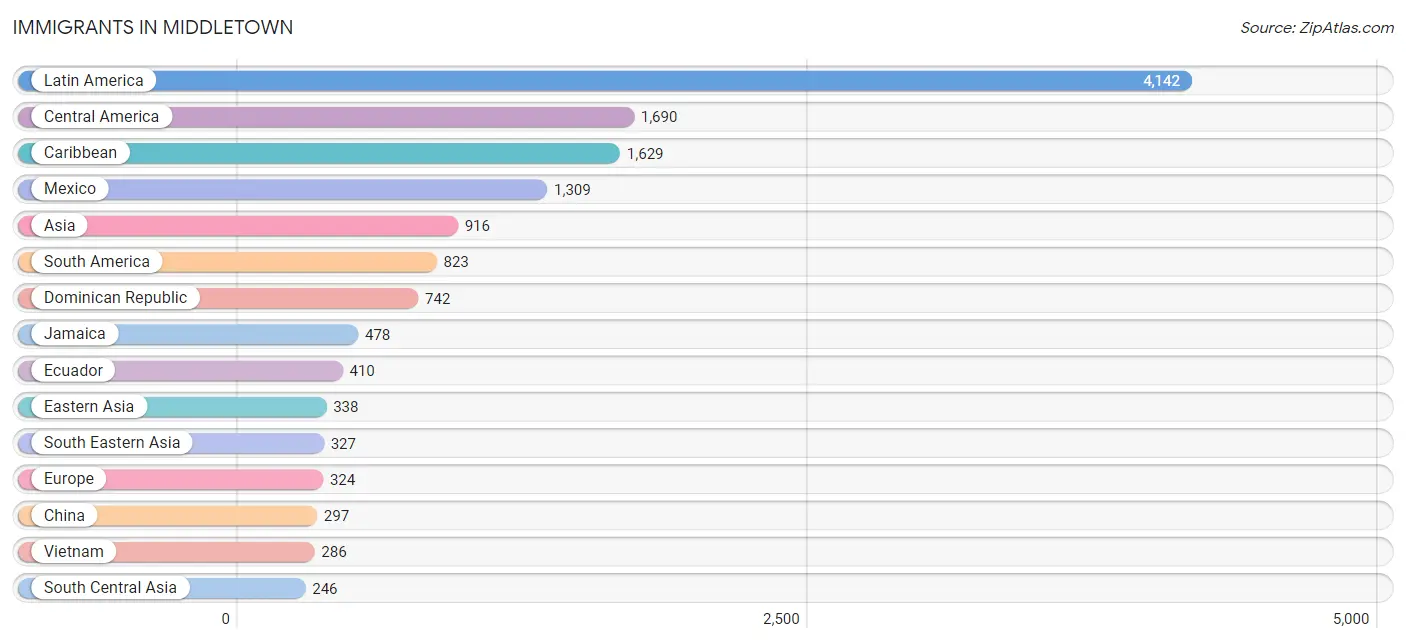
| Immigration Origin | # Population | % Population |
| Africa | 110 | 0.4% |
| Asia | 916 | 3.0% |
| Bangladesh | 13 | 0.0% |
| Barbados | 29 | 0.1% |
| Bosnia and Herzegovina | 52 | 0.2% |
| Caribbean | 1,629 | 5.4% |
| Central America | 1,690 | 5.6% |
| China | 297 | 1.0% |
| Colombia | 239 | 0.8% |
| Czechoslovakia | 9 | 0.0% |
| Dominica | 14 | 0.1% |
| Dominican Republic | 742 | 2.5% |
| Eastern Asia | 338 | 1.1% |
| Eastern Europe | 99 | 0.3% |
| Ecuador | 410 | 1.4% |
| Egypt | 28 | 0.1% |
| El Salvador | 71 | 0.2% |
| Europe | 324 | 1.1% |
| Germany | 45 | 0.2% |
| Greece | 27 | 0.1% |
| Guatemala | 234 | 0.8% |
| Guyana | 153 | 0.5% |
| Haiti | 175 | 0.6% |
| Honduras | 20 | 0.1% |
| India | 123 | 0.4% |
| Ireland | 15 | 0.1% |
| Italy | 91 | 0.3% |
| Jamaica | 478 | 1.6% |
| Korea | 41 | 0.1% |
| Laos | 19 | 0.1% |
| Latin America | 4,142 | 13.7% |
| Mexico | 1,309 | 4.3% |
| Nepal | 50 | 0.2% |
| Nicaragua | 56 | 0.2% |
| Nigeria | 21 | 0.1% |
| Northern Africa | 89 | 0.3% |
| Northern Europe | 26 | 0.1% |
| Norway | 11 | 0.0% |
| Pakistan | 60 | 0.2% |
| Peru | 21 | 0.1% |
| Philippines | 5 | 0.0% |
| Portugal | 33 | 0.1% |
| Romania | 13 | 0.0% |
| Russia | 25 | 0.1% |
| South America | 823 | 2.7% |
| South Central Asia | 246 | 0.8% |
| South Eastern Asia | 327 | 1.1% |
| Southern Europe | 154 | 0.5% |
| Spain | 3 | 0.0% |
| St. Vincent and the Grenadines | 39 | 0.1% |
| Taiwan | 20 | 0.1% |
| Thailand | 17 | 0.1% |
| Trinidad and Tobago | 26 | 0.1% |
| Vietnam | 286 | 0.9% |
| West Indies | 14 | 0.1% |
| Western Africa | 21 | 0.1% |
| Western Asia | 5 | 0.0% |
| Western Europe | 45 | 0.2% | View All 58 Rows |
Sex and Age in Middletown
Sex and Age in Middletown
The most populous age groups in Middletown are 10 to 14 Years (1,344 | 8.7%) for men and 10 to 14 Years (1,412 | 9.6%) for women.
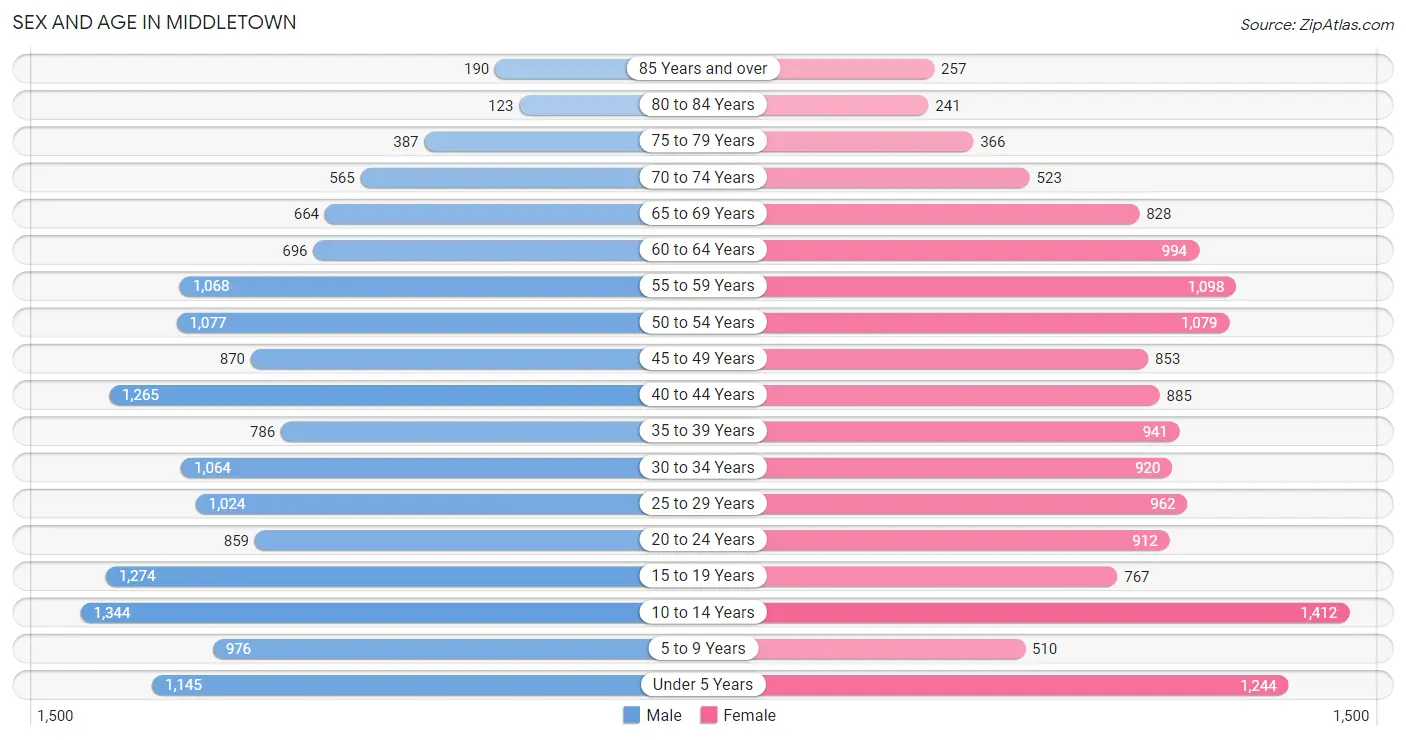
| Age Bracket | Male | Female |
| Under 5 Years | 1,145 (7.4%) | 1,244 (8.4%) |
| 5 to 9 Years | 976 (6.4%) | 510 (3.5%) |
| 10 to 14 Years | 1,344 (8.7%) | 1,412 (9.6%) |
| 15 to 19 Years | 1,274 (8.3%) | 767 (5.2%) |
| 20 to 24 Years | 859 (5.6%) | 912 (6.2%) |
| 25 to 29 Years | 1,024 (6.7%) | 962 (6.5%) |
| 30 to 34 Years | 1,064 (6.9%) | 920 (6.2%) |
| 35 to 39 Years | 786 (5.1%) | 941 (6.4%) |
| 40 to 44 Years | 1,265 (8.2%) | 885 (6.0%) |
| 45 to 49 Years | 870 (5.7%) | 853 (5.8%) |
| 50 to 54 Years | 1,077 (7.0%) | 1,079 (7.3%) |
| 55 to 59 Years | 1,068 (7.0%) | 1,098 (7.4%) |
| 60 to 64 Years | 696 (4.5%) | 994 (6.7%) |
| 65 to 69 Years | 664 (4.3%) | 828 (5.6%) |
| 70 to 74 Years | 565 (3.7%) | 523 (3.5%) |
| 75 to 79 Years | 387 (2.5%) | 366 (2.5%) |
| 80 to 84 Years | 123 (0.8%) | 241 (1.6%) |
| 85 Years and over | 190 (1.2%) | 257 (1.7%) |
| Total | 15,377 (100.0%) | 14,792 (100.0%) |
Families and Households in Middletown
Median Family Size in Middletown
The median family size in Middletown is 3.60 persons per family, with single female/mother families (1,419 | 20.8%) accounting for the largest median family size of 3.85 persons per family. On the other hand, single male/father families (683 | 10.0%) represent the smallest median family size with 3.34 persons per family.
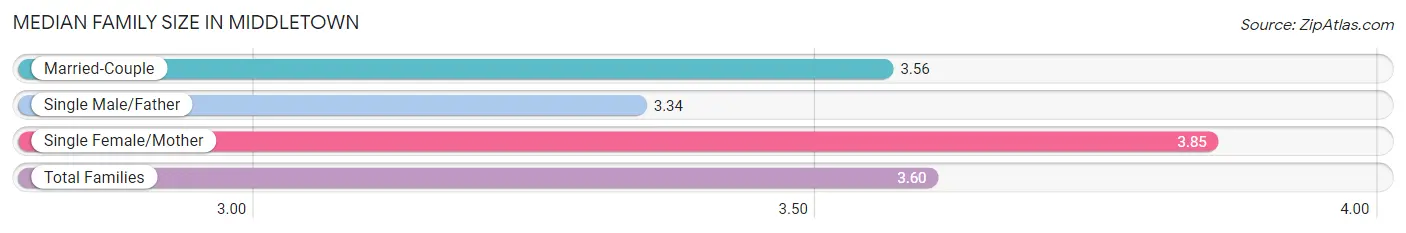
| Family Type | # Families | Family Size |
| Married-Couple | 4,725 (69.2%) | 3.56 |
| Single Male/Father | 683 (10.0%) | 3.34 |
| Single Female/Mother | 1,419 (20.8%) | 3.85 |
| Total Families | 6,827 (100.0%) | 3.60 |
Median Household Size in Middletown
The median household size in Middletown is 2.93 persons per household, with single female/mother households (1,419 | 14.0%) accounting for the largest median household size of 4.45 persons per household. non-family households (3,284 | 32.5%) represent the smallest median household size with 1.13 persons per household.
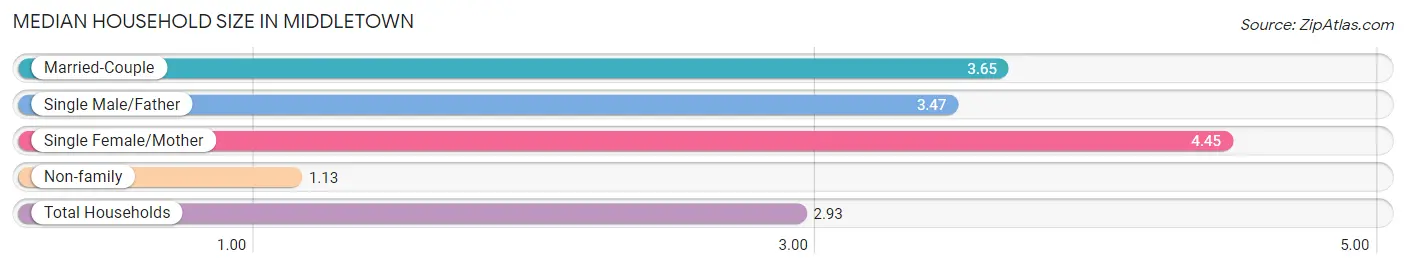
| Household Type | # Households | Household Size |
| Married-Couple | 4,725 (46.7%) | 3.65 |
| Single Male/Father | 683 (6.8%) | 3.47 |
| Single Female/Mother | 1,419 (14.0%) | 4.45 |
| Non-family | 3,284 (32.5%) | 1.13 |
| Total Households | 10,111 (100.0%) | 2.93 |
Household Size by Marriage Status in Middletown
Out of a total of 10,111 households in Middletown, 6,827 (67.5%) are family households, while 3,284 (32.5%) are nonfamily households. The most numerous type of family households are 2-person households, comprising 2,364, and the most common type of nonfamily households are 1-person households, comprising 2,944.
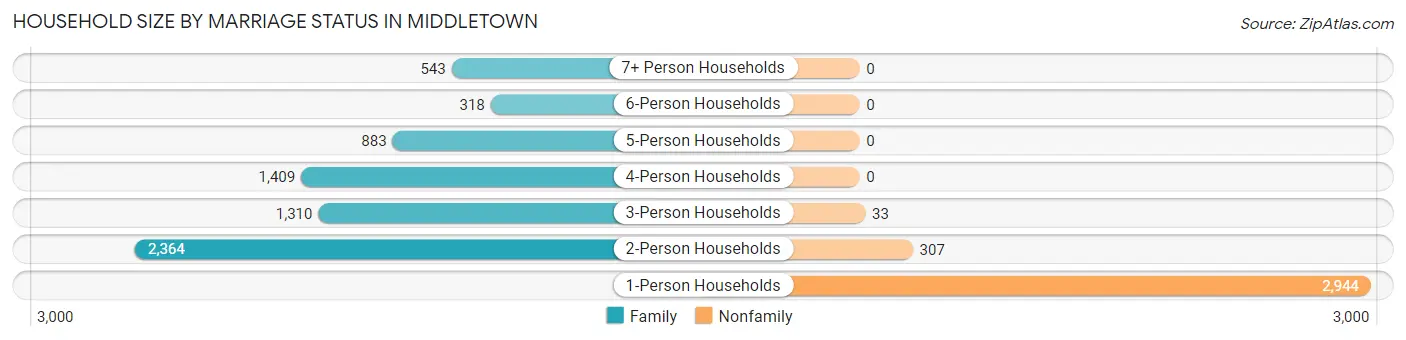
| Household Size | Family Households | Nonfamily Households |
| 1-Person Households | - | 2,944 (29.1%) |
| 2-Person Households | 2,364 (23.4%) | 307 (3.0%) |
| 3-Person Households | 1,310 (13.0%) | 33 (0.3%) |
| 4-Person Households | 1,409 (13.9%) | 0 (0.0%) |
| 5-Person Households | 883 (8.7%) | 0 (0.0%) |
| 6-Person Households | 318 (3.2%) | 0 (0.0%) |
| 7+ Person Households | 543 (5.4%) | 0 (0.0%) |
| Total | 6,827 (67.5%) | 3,284 (32.5%) |
Female Fertility in Middletown
Fertility by Age in Middletown
Average fertility rate in Middletown is 53.0 births per 1,000 women. Women in the age bracket of 15 to 19 years have the highest fertility rate with 85.0 births per 1,000 women. Women in the age bracket of 20 to 34 years acount for 64.8% of all women with births.
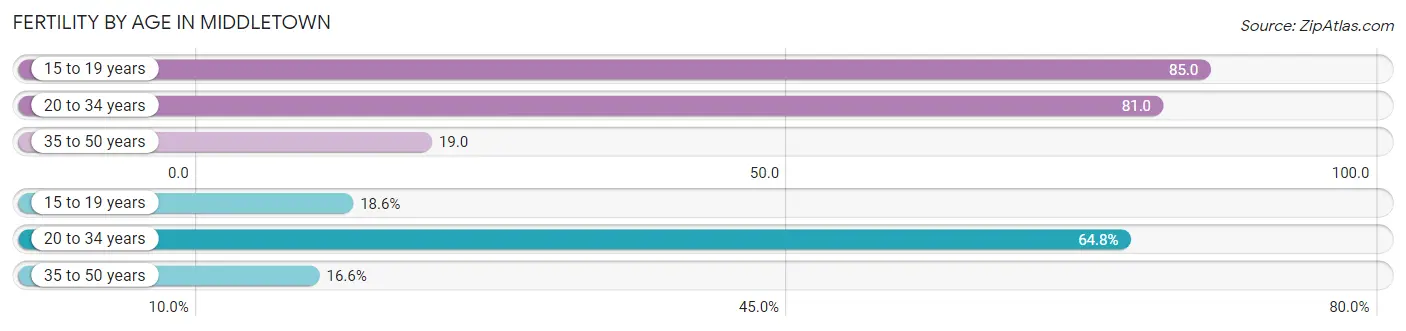
| Age Bracket | Women with Births | Births / 1,000 Women |
| 15 to 19 years | 65 (18.6%) | 85.0 |
| 20 to 34 years | 226 (64.8%) | 81.0 |
| 35 to 50 years | 58 (16.6%) | 19.0 |
| Total | 349 (100.0%) | 53.0 |
Fertility by Age by Marriage Status in Middletown
50.4% of women with births (349) in Middletown are married. The highest percentage of unmarried women with births falls into 15 to 19 years age bracket with 100.0% of them unmarried at the time of birth, while the lowest percentage of unmarried women with births belong to 35 to 50 years age bracket with 0.0% of them unmarried.
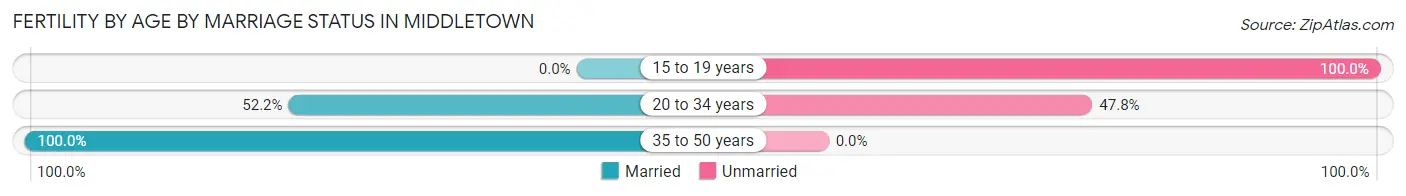
| Age Bracket | Married | Unmarried |
| 15 to 19 years | 0 (0.0%) | 65 (100.0%) |
| 20 to 34 years | 118 (52.2%) | 108 (47.8%) |
| 35 to 50 years | 58 (100.0%) | 0 (0.0%) |
| Total | 176 (50.4%) | 173 (49.6%) |
Fertility by Education in Middletown
Average fertility rate in Middletown is 53.0 births per 1,000 women. Women with the education attainment of high school diploma have the highest fertility rate of 73.0 births per 1,000 women, while women with the education attainment of less than high school have the lowest fertility at 32.0 births per 1,000 women. Women with the education attainment of high school diploma represent 39.5% of all women with births.
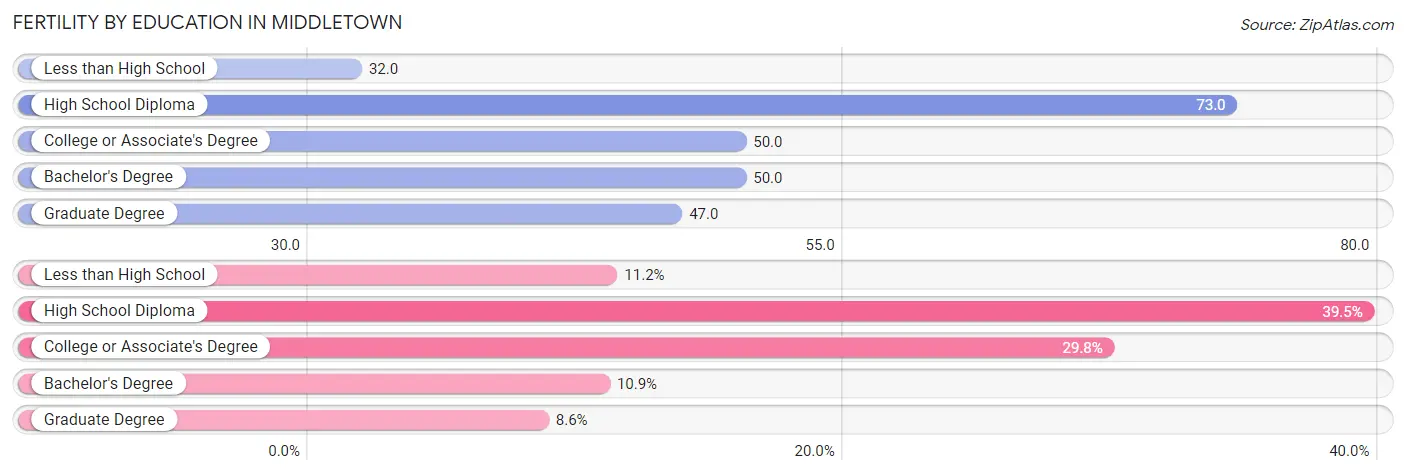
| Educational Attainment | Women with Births | Births / 1,000 Women |
| Less than High School | 39 (11.2%) | 32.0 |
| High School Diploma | 138 (39.5%) | 73.0 |
| College or Associate's Degree | 104 (29.8%) | 50.0 |
| Bachelor's Degree | 38 (10.9%) | 50.0 |
| Graduate Degree | 30 (8.6%) | 47.0 |
| Total | 349 (100.0%) | 53.0 |
Fertility by Education by Marriage Status in Middletown
49.6% of women with births in Middletown are unmarried. Women with the educational attainment of graduate degree are most likely to be married with 100.0% of them married at childbirth, while women with the educational attainment of less than high school are least likely to be married with 100.0% of them unmarried at childbirth.
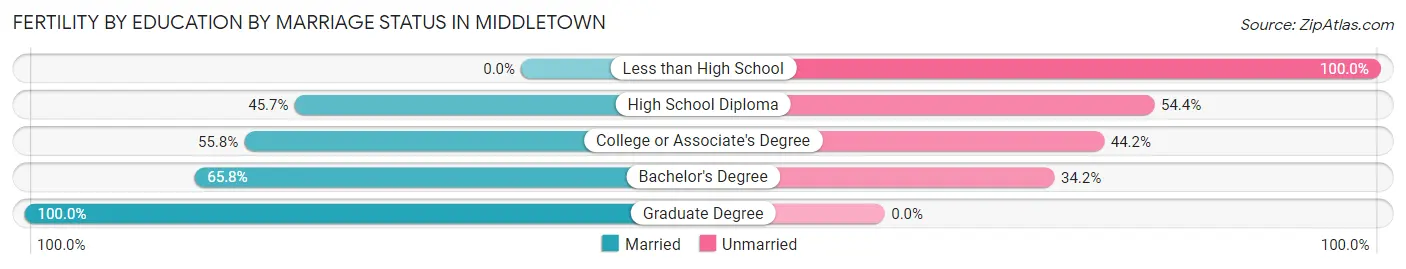
| Educational Attainment | Married | Unmarried |
| Less than High School | 0 (0.0%) | 39 (100.0%) |
| High School Diploma | 63 (45.7%) | 75 (54.3%) |
| College or Associate's Degree | 58 (55.8%) | 46 (44.2%) |
| Bachelor's Degree | 25 (65.8%) | 13 (34.2%) |
| Graduate Degree | 30 (100.0%) | 0 (0.0%) |
| Total | 176 (50.4%) | 173 (49.6%) |
Employment Characteristics in Middletown
Employment by Class of Employer in Middletown
Among the 13,201 employed individuals in Middletown, private company employees (8,328 | 63.1%), not-for-profit organizations (1,703 | 12.9%), and local government employees (1,225 | 9.3%) make up the most common classes of employment.
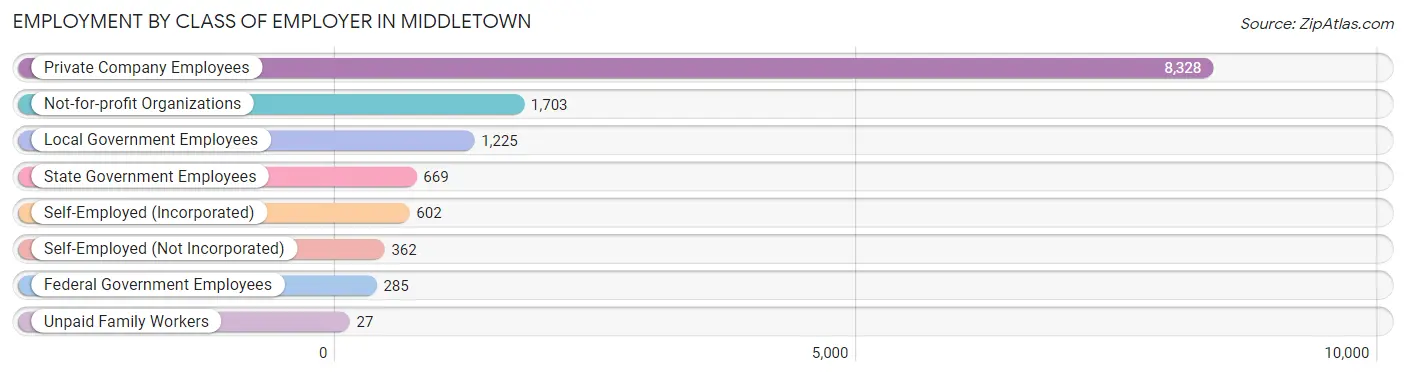
| Employer Class | # Employees | % Employees |
| Private Company Employees | 8,328 | 63.1% |
| Self-Employed (Incorporated) | 602 | 4.6% |
| Self-Employed (Not Incorporated) | 362 | 2.7% |
| Not-for-profit Organizations | 1,703 | 12.9% |
| Local Government Employees | 1,225 | 9.3% |
| State Government Employees | 669 | 5.1% |
| Federal Government Employees | 285 | 2.2% |
| Unpaid Family Workers | 27 | 0.2% |
| Total | 13,201 | 100.0% |
Employment Status by Age in Middletown
According to the labor force statistics for Middletown, out of the total population over 16 years of age (23,182), 61.7% or 14,303 individuals are in the labor force, with 4.9% or 701 of them unemployed. The age group with the highest labor force participation rate is 30 to 34 years, with 86.6% or 1,718 individuals in the labor force. Within the labor force, the 16 to 19 years age range has the highest percentage of unemployed individuals, with 36.4% or 172 of them being unemployed.
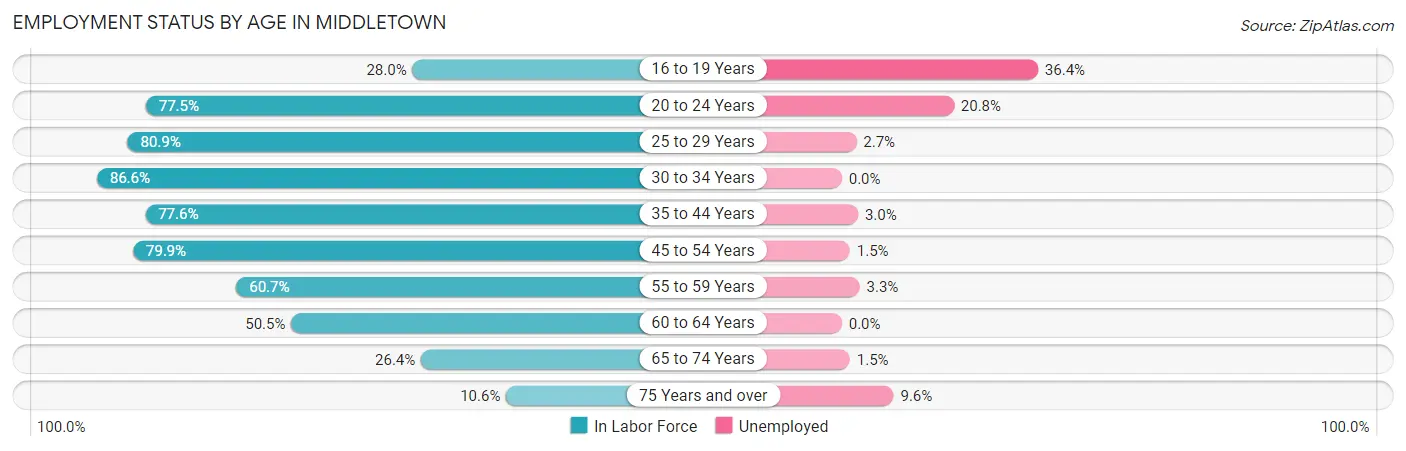
| Age Bracket | In Labor Force | Unemployed |
| 16 to 19 Years | 472 (28.0%) | 172 (36.4%) |
| 20 to 24 Years | 1,373 (77.5%) | 286 (20.8%) |
| 25 to 29 Years | 1,607 (80.9%) | 43 (2.7%) |
| 30 to 34 Years | 1,718 (86.6%) | 0 (0.0%) |
| 35 to 44 Years | 3,009 (77.6%) | 90 (3.0%) |
| 45 to 54 Years | 3,099 (79.9%) | 46 (1.5%) |
| 55 to 59 Years | 1,315 (60.7%) | 43 (3.3%) |
| 60 to 64 Years | 853 (50.5%) | 0 (0.0%) |
| 65 to 74 Years | 681 (26.4%) | 10 (1.5%) |
| 75 Years and over | 166 (10.6%) | 16 (9.6%) |
| Total | 14,303 (61.7%) | 701 (4.9%) |
Employment Status by Educational Attainment in Middletown
According to labor force statistics for Middletown, 74.5% of individuals (11,609) out of the total population between 25 and 64 years of age (15,582) are in the labor force, with 1.9% or 221 of them being unemployed. The group with the highest labor force participation rate are those with the educational attainment of bachelor's degree or higher, with 83.3% or 2,497 individuals in the labor force. Within the labor force, individuals with bachelor's degree or higher education have the highest percentage of unemployment, with 3.0% or 75 of them being unemployed.
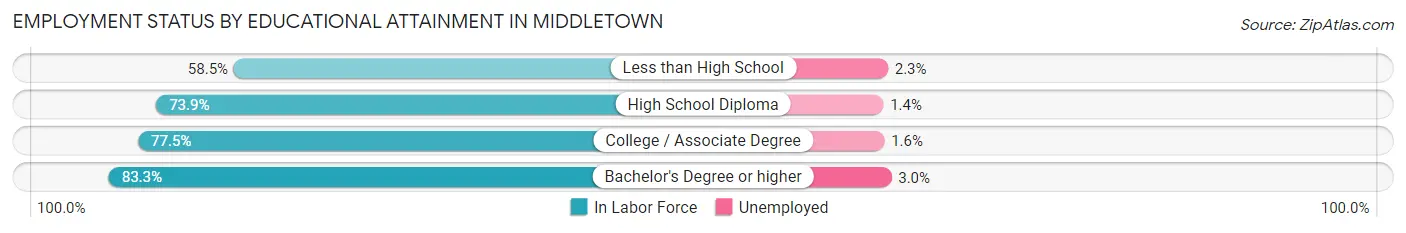
| Educational Attainment | In Labor Force | Unemployed |
| Less than High School | 1,433 (58.5%) | 56 (2.3%) |
| High School Diploma | 3,600 (73.9%) | 68 (1.4%) |
| College / Associate Degree | 4,080 (77.5%) | 84 (1.6%) |
| Bachelor's Degree or higher | 2,497 (83.3%) | 90 (3.0%) |
| Total | 11,609 (74.5%) | 296 (1.9%) |
Employment Occupations by Sex in Middletown
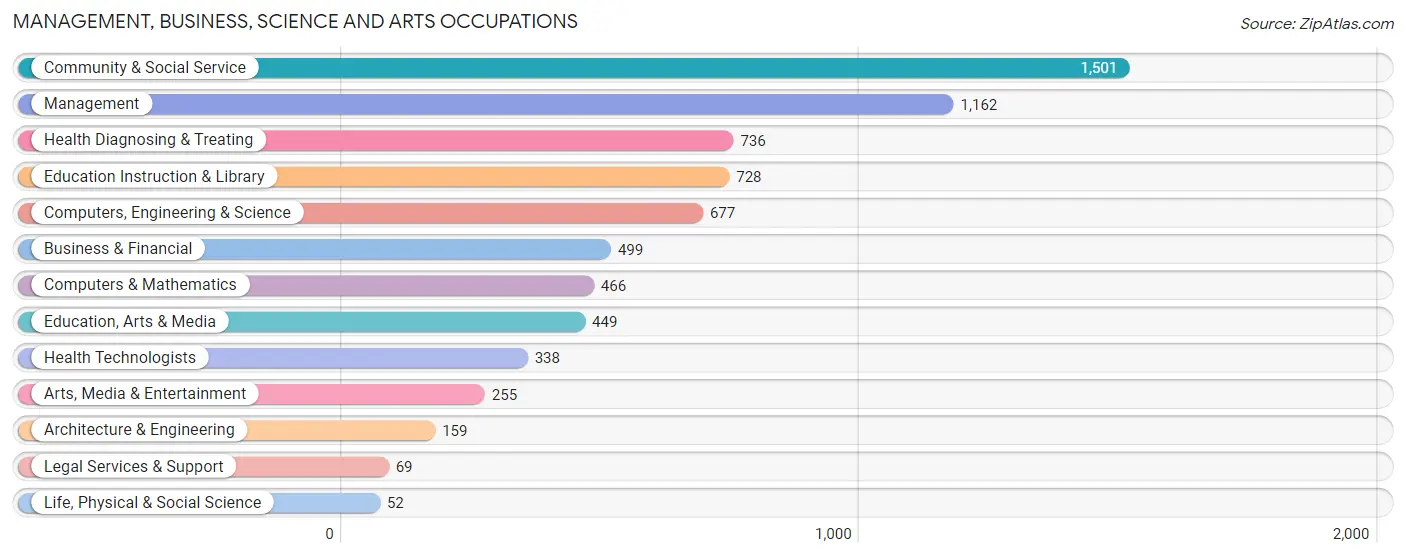
Management, Business, Science and Arts Occupations
The most common Management, Business, Science and Arts occupations in Middletown are Community & Social Service (1,501 | 11.1%), Management (1,162 | 8.6%), Health Diagnosing & Treating (736 | 5.4%), Education Instruction & Library (728 | 5.4%), and Computers, Engineering & Science (677 | 5.0%).
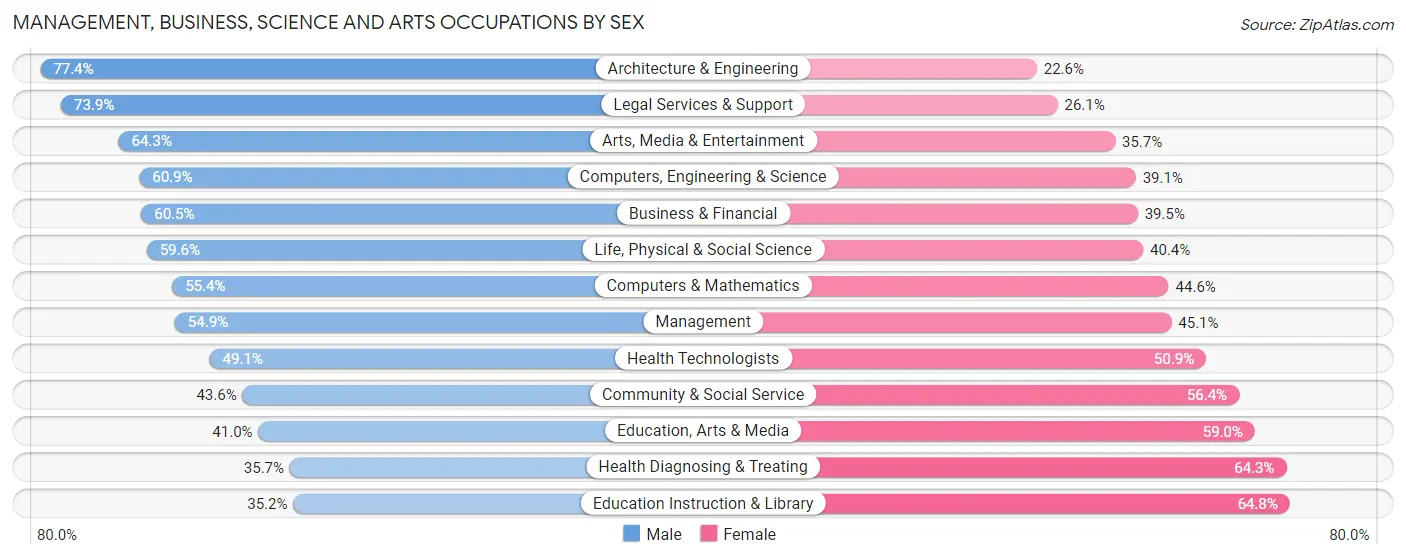
Management, Business, Science and Arts Occupations by Sex
Within the Management, Business, Science and Arts occupations in Middletown, the most male-oriented occupations are Architecture & Engineering (77.4%), Legal Services & Support (73.9%), and Arts, Media & Entertainment (64.3%), while the most female-oriented occupations are Education Instruction & Library (64.8%), Health Diagnosing & Treating (64.3%), and Education, Arts & Media (59.0%).
| Occupation | Male | Female |
| Management | 638 (54.9%) | 524 (45.1%) |
| Business & Financial | 302 (60.5%) | 197 (39.5%) |
| Computers, Engineering & Science | 412 (60.9%) | 265 (39.1%) |
| Computers & Mathematics | 258 (55.4%) | 208 (44.6%) |
| Architecture & Engineering | 123 (77.4%) | 36 (22.6%) |
| Life, Physical & Social Science | 31 (59.6%) | 21 (40.4%) |
| Community & Social Service | 655 (43.6%) | 846 (56.4%) |
| Education, Arts & Media | 184 (41.0%) | 265 (59.0%) |
| Legal Services & Support | 51 (73.9%) | 18 (26.1%) |
| Education Instruction & Library | 256 (35.2%) | 472 (64.8%) |
| Arts, Media & Entertainment | 164 (64.3%) | 91 (35.7%) |
| Health Diagnosing & Treating | 263 (35.7%) | 473 (64.3%) |
| Health Technologists | 166 (49.1%) | 172 (50.9%) |
| Total (Category) | 2,270 (49.6%) | 2,305 (50.4%) |
| Total (Overall) | 6,988 (51.5%) | 6,592 (48.5%) |
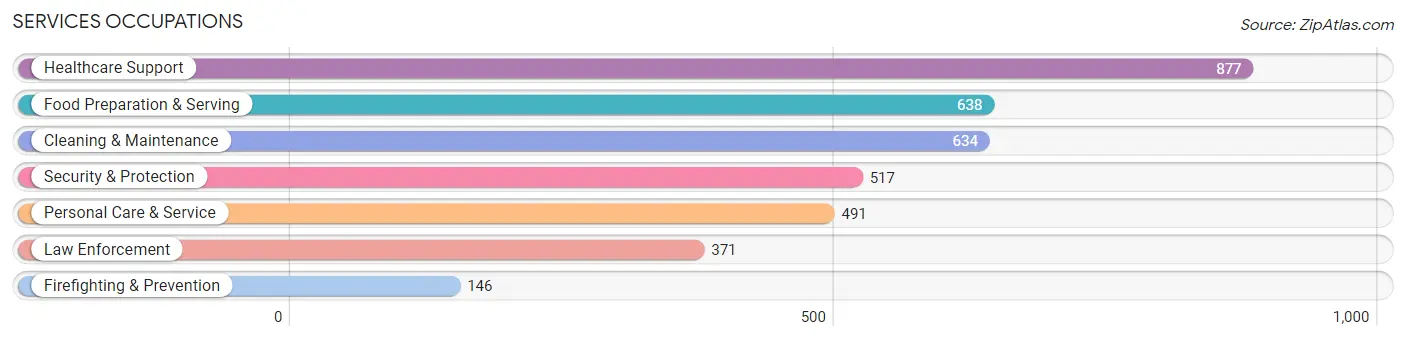
Services Occupations
The most common Services occupations in Middletown are Healthcare Support (877 | 6.5%), Food Preparation & Serving (638 | 4.7%), Cleaning & Maintenance (634 | 4.7%), Security & Protection (517 | 3.8%), and Personal Care & Service (491 | 3.6%).
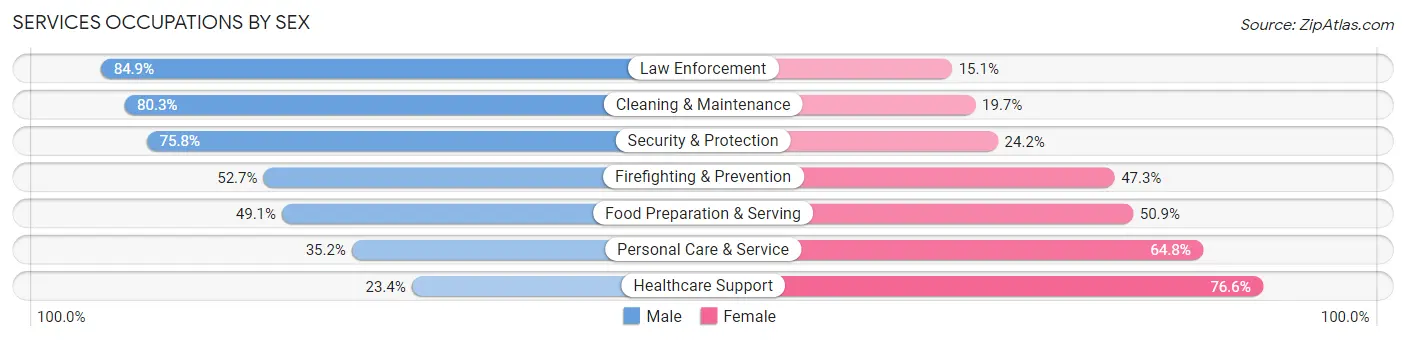
Services Occupations by Sex
Within the Services occupations in Middletown, the most male-oriented occupations are Law Enforcement (84.9%), Cleaning & Maintenance (80.3%), and Security & Protection (75.8%), while the most female-oriented occupations are Healthcare Support (76.6%), Personal Care & Service (64.8%), and Food Preparation & Serving (50.9%).
| Occupation | Male | Female |
| Healthcare Support | 205 (23.4%) | 672 (76.6%) |
| Security & Protection | 392 (75.8%) | 125 (24.2%) |
| Firefighting & Prevention | 77 (52.7%) | 69 (47.3%) |
| Law Enforcement | 315 (84.9%) | 56 (15.1%) |
| Food Preparation & Serving | 313 (49.1%) | 325 (50.9%) |
| Cleaning & Maintenance | 509 (80.3%) | 125 (19.7%) |
| Personal Care & Service | 173 (35.2%) | 318 (64.8%) |
| Total (Category) | 1,592 (50.4%) | 1,565 (49.6%) |
| Total (Overall) | 6,988 (51.5%) | 6,592 (48.5%) |
Sales and Office Occupations
The most common Sales and Office occupations in Middletown are Office & Administration (1,843 | 13.6%), and Sales & Related (1,223 | 9.0%).
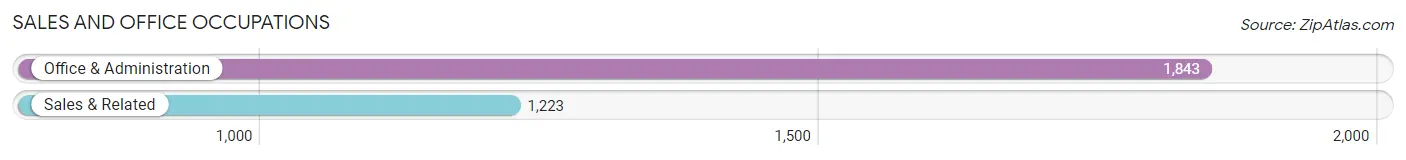
Sales and Office Occupations by Sex
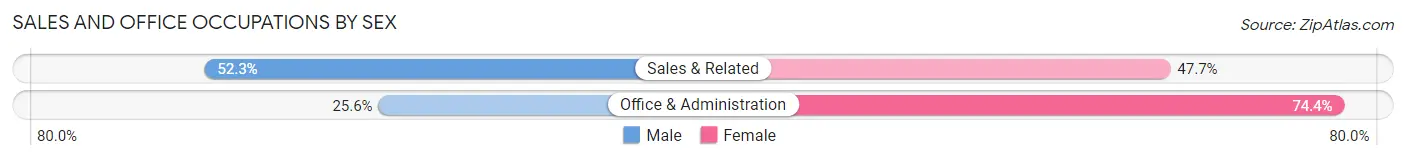
| Occupation | Male | Female |
| Sales & Related | 640 (52.3%) | 583 (47.7%) |
| Office & Administration | 471 (25.6%) | 1,372 (74.4%) |
| Total (Category) | 1,111 (36.2%) | 1,955 (63.8%) |
| Total (Overall) | 6,988 (51.5%) | 6,592 (48.5%) |
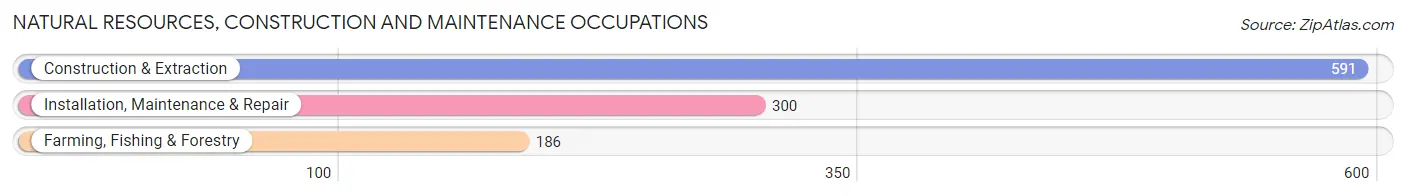
Natural Resources, Construction and Maintenance Occupations
The most common Natural Resources, Construction and Maintenance occupations in Middletown are Construction & Extraction (591 | 4.3%), Installation, Maintenance & Repair (300 | 2.2%), and Farming, Fishing & Forestry (186 | 1.4%).
Natural Resources, Construction and Maintenance Occupations by Sex
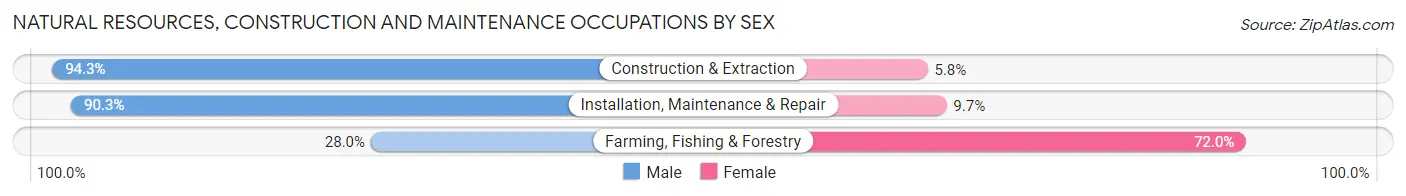
| Occupation | Male | Female |
| Farming, Fishing & Forestry | 52 (28.0%) | 134 (72.0%) |
| Construction & Extraction | 557 (94.3%) | 34 (5.8%) |
| Installation, Maintenance & Repair | 271 (90.3%) | 29 (9.7%) |
| Total (Category) | 880 (81.7%) | 197 (18.3%) |
| Total (Overall) | 6,988 (51.5%) | 6,592 (48.5%) |
Production, Transportation and Moving Occupations
The most common Production, Transportation and Moving occupations in Middletown are Production (818 | 6.0%), Transportation (491 | 3.6%), and Material Moving (396 | 2.9%).
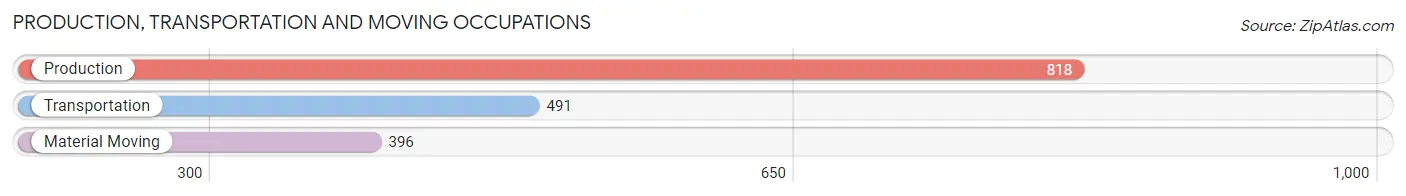
Production, Transportation and Moving Occupations by Sex
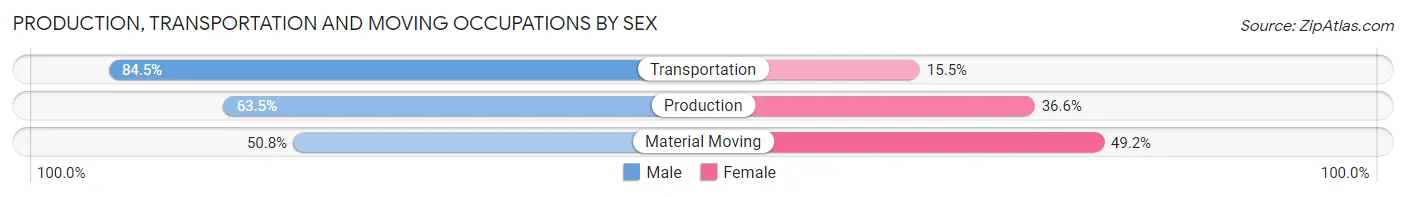
| Occupation | Male | Female |
| Production | 519 (63.4%) | 299 (36.5%) |
| Transportation | 415 (84.5%) | 76 (15.5%) |
| Material Moving | 201 (50.8%) | 195 (49.2%) |
| Total (Category) | 1,135 (66.6%) | 570 (33.4%) |
| Total (Overall) | 6,988 (51.5%) | 6,592 (48.5%) |
Employment Industries by Sex in Middletown
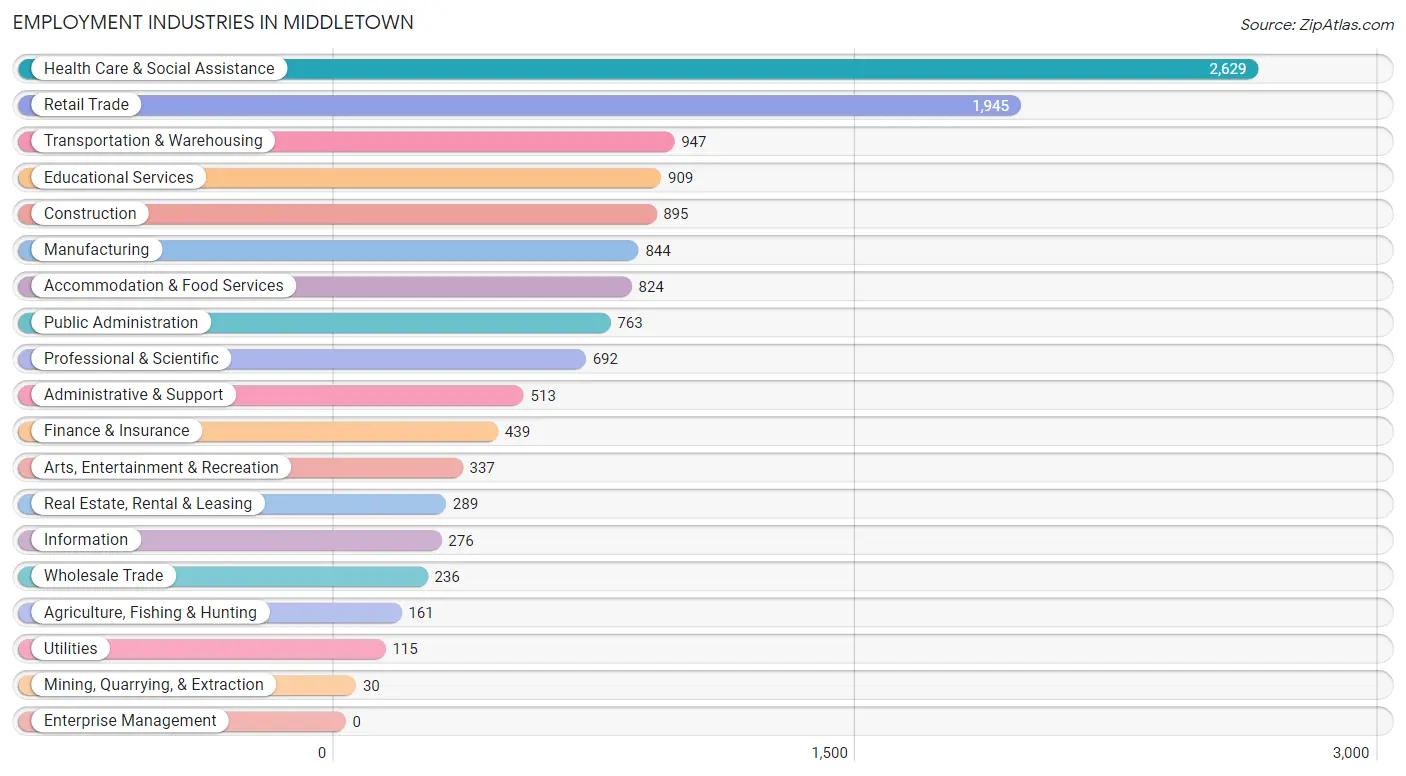
Employment Industries in Middletown
The major employment industries in Middletown include Health Care & Social Assistance (2,629 | 19.4%), Retail Trade (1,945 | 14.3%), Transportation & Warehousing (947 | 7.0%), Educational Services (909 | 6.7%), and Construction (895 | 6.6%).
Employment Industries by Sex in Middletown
The Middletown industries that see more men than women are Utilities (100.0%), Construction (87.6%), and Administrative & Support (79.3%), whereas the industries that tend to have a higher number of women are Mining, Quarrying, & Extraction (100.0%), Health Care & Social Assistance (72.7%), and Educational Services (66.4%).
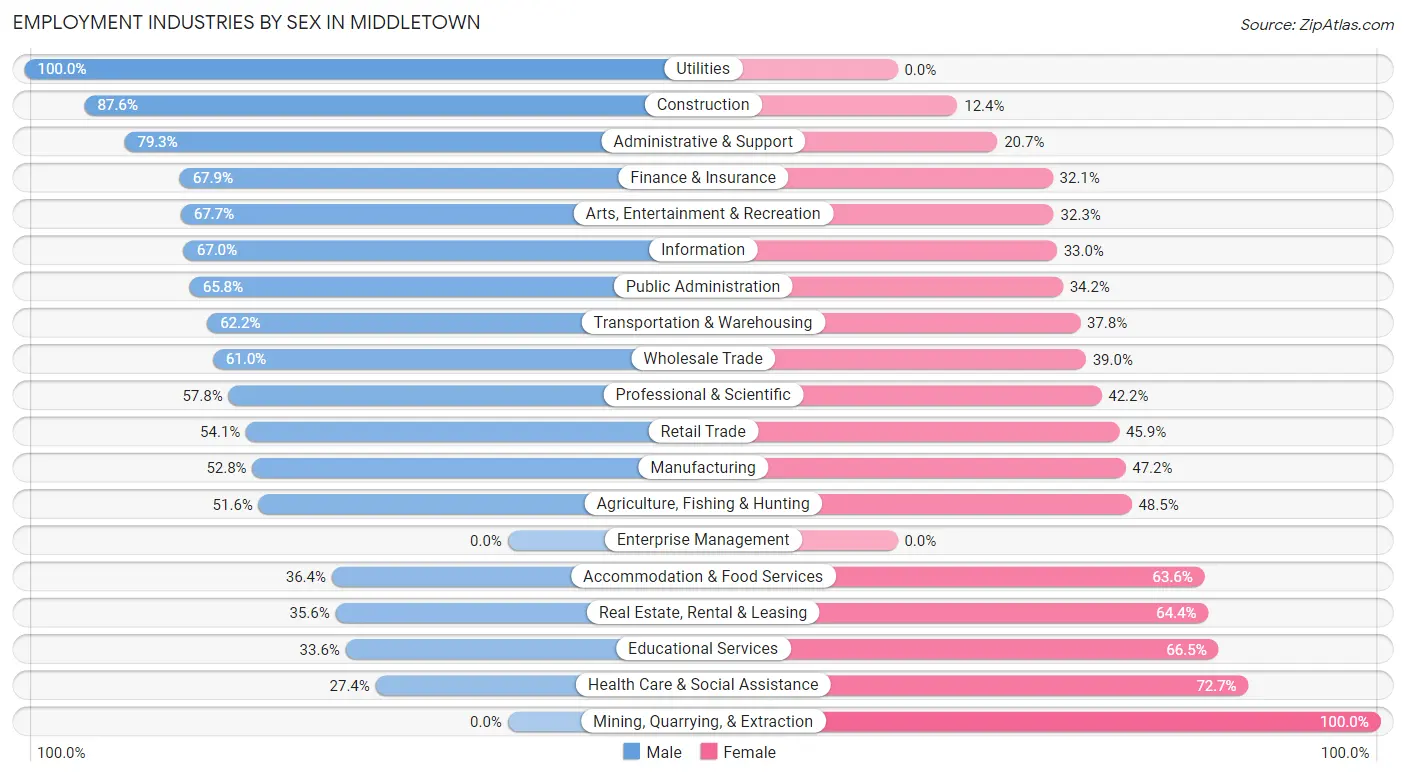
| Industry | Male | Female |
| Agriculture, Fishing & Hunting | 83 (51.5%) | 78 (48.4%) |
| Mining, Quarrying, & Extraction | 0 (0.0%) | 30 (100.0%) |
| Construction | 784 (87.6%) | 111 (12.4%) |
| Manufacturing | 446 (52.8%) | 398 (47.2%) |
| Wholesale Trade | 144 (61.0%) | 92 (39.0%) |
| Retail Trade | 1,053 (54.1%) | 892 (45.9%) |
| Transportation & Warehousing | 589 (62.2%) | 358 (37.8%) |
| Utilities | 115 (100.0%) | 0 (0.0%) |
| Information | 185 (67.0%) | 91 (33.0%) |
| Finance & Insurance | 298 (67.9%) | 141 (32.1%) |
| Real Estate, Rental & Leasing | 103 (35.6%) | 186 (64.4%) |
| Professional & Scientific | 400 (57.8%) | 292 (42.2%) |
| Enterprise Management | 0 (0.0%) | 0 (0.0%) |
| Administrative & Support | 407 (79.3%) | 106 (20.7%) |
| Educational Services | 305 (33.6%) | 604 (66.4%) |
| Health Care & Social Assistance | 719 (27.4%) | 1,910 (72.7%) |
| Arts, Entertainment & Recreation | 228 (67.7%) | 109 (32.3%) |
| Accommodation & Food Services | 300 (36.4%) | 524 (63.6%) |
| Public Administration | 502 (65.8%) | 261 (34.2%) |
| Total | 6,988 (51.5%) | 6,592 (48.5%) |
Education in Middletown
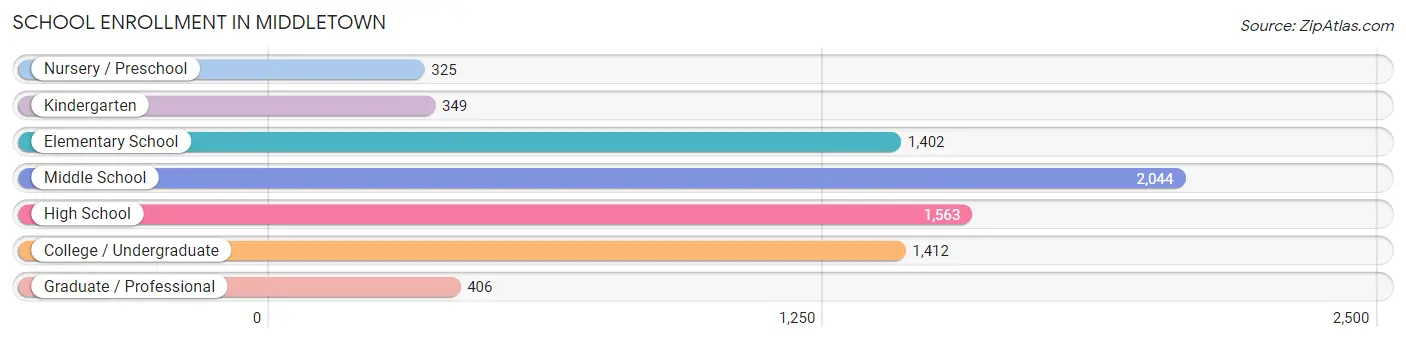
School Enrollment in Middletown
The most common levels of schooling among the 7,501 students in Middletown are middle school (2,044 | 27.3%), high school (1,563 | 20.8%), and college / undergraduate (1,412 | 18.8%).
| School Level | # Students | % Students |
| Nursery / Preschool | 325 | 4.3% |
| Kindergarten | 349 | 4.6% |
| Elementary School | 1,402 | 18.7% |
| Middle School | 2,044 | 27.3% |
| High School | 1,563 | 20.8% |
| College / Undergraduate | 1,412 | 18.8% |
| Graduate / Professional | 406 | 5.4% |
| Total | 7,501 | 100.0% |
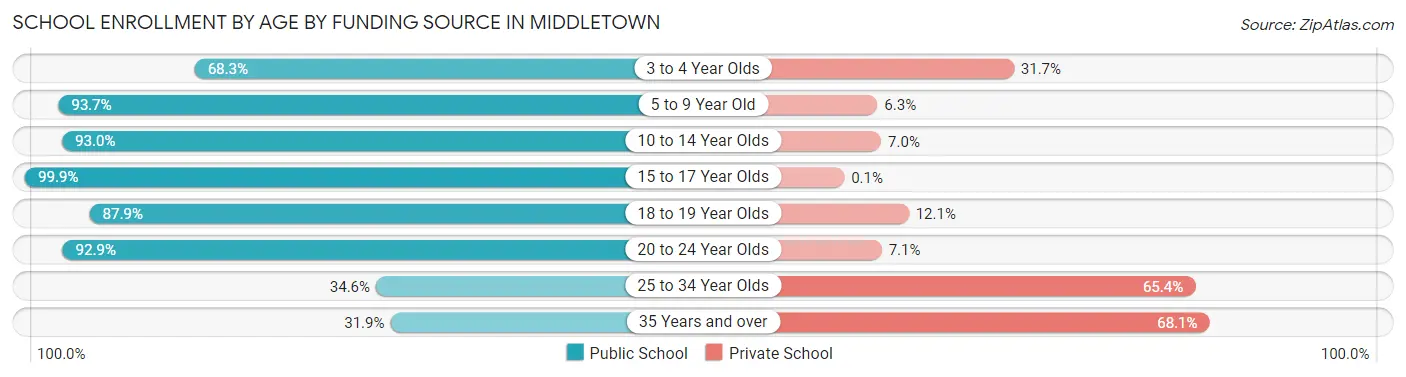
School Enrollment by Age by Funding Source in Middletown
Out of a total of 7,501 students who are enrolled in schools in Middletown, 1,260 (16.8%) attend a private institution, while the remaining 6,241 (83.2%) are enrolled in public schools. The age group of 35 years and over has the highest likelihood of being enrolled in private schools, with 346 (68.1% in the age bracket) enrolled. Conversely, the age group of 15 to 17 year olds has the lowest likelihood of being enrolled in a private school, with 1,015 (99.9% in the age bracket) attending a public institution.
| Age Bracket | Public School | Private School |
| 3 to 4 Year Olds | 237 (68.3%) | 110 (31.7%) |
| 5 to 9 Year Old | 1,358 (93.7%) | 91 (6.3%) |
| 10 to 14 Year Olds | 2,465 (93.0%) | 185 (7.0%) |
| 15 to 17 Year Olds | 1,015 (99.9%) | 1 (0.1%) |
| 18 to 19 Year Olds | 406 (87.9%) | 56 (12.1%) |
| 20 to 24 Year Olds | 367 (92.9%) | 28 (7.1%) |
| 25 to 34 Year Olds | 233 (34.6%) | 441 (65.4%) |
| 35 Years and over | 162 (31.9%) | 346 (68.1%) |
| Total | 6,241 (83.2%) | 1,260 (16.8%) |
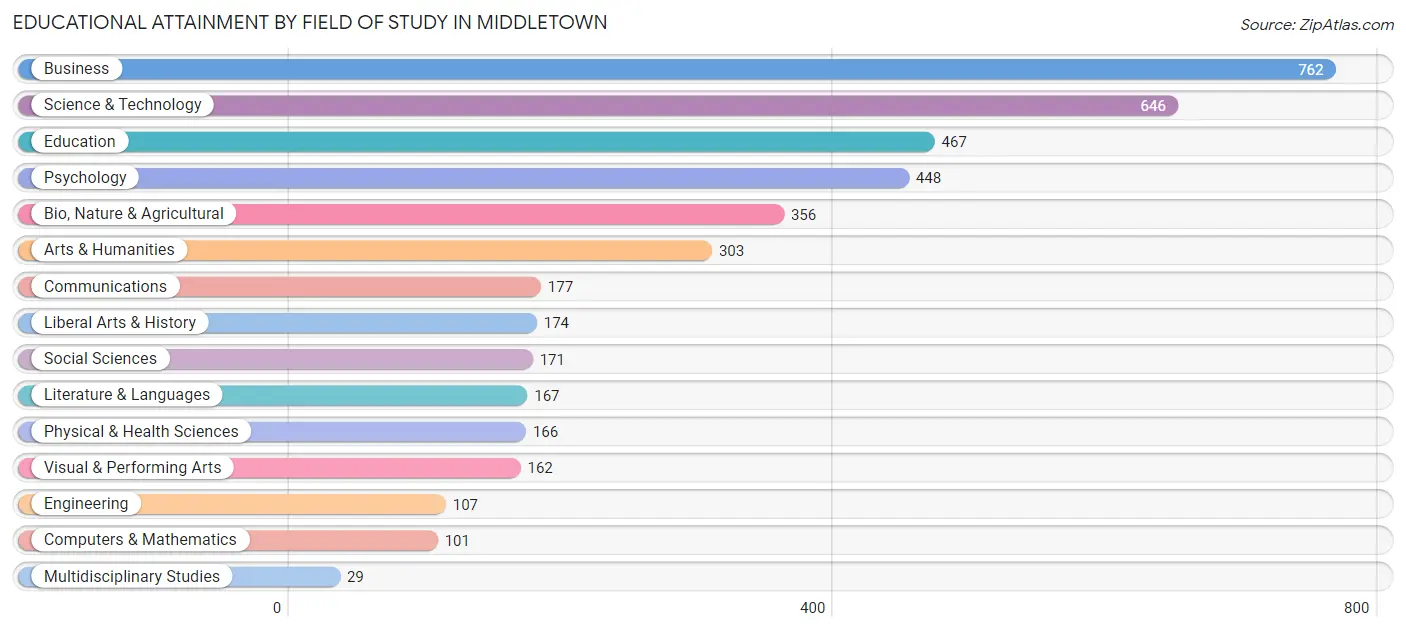
Educational Attainment by Field of Study in Middletown
Business (762 | 18.0%), science & technology (646 | 15.2%), education (467 | 11.0%), psychology (448 | 10.6%), and bio, nature & agricultural (356 | 8.4%) are the most common fields of study among 4,236 individuals in Middletown who have obtained a bachelor's degree or higher.
| Field of Study | # Graduates | % Graduates |
| Computers & Mathematics | 101 | 2.4% |
| Bio, Nature & Agricultural | 356 | 8.4% |
| Physical & Health Sciences | 166 | 3.9% |
| Psychology | 448 | 10.6% |
| Social Sciences | 171 | 4.0% |
| Engineering | 107 | 2.5% |
| Multidisciplinary Studies | 29 | 0.7% |
| Science & Technology | 646 | 15.2% |
| Business | 762 | 18.0% |
| Education | 467 | 11.0% |
| Literature & Languages | 167 | 3.9% |
| Liberal Arts & History | 174 | 4.1% |
| Visual & Performing Arts | 162 | 3.8% |
| Communications | 177 | 4.2% |
| Arts & Humanities | 303 | 7.1% |
| Total | 4,236 | 100.0% |
Transportation & Commute in Middletown
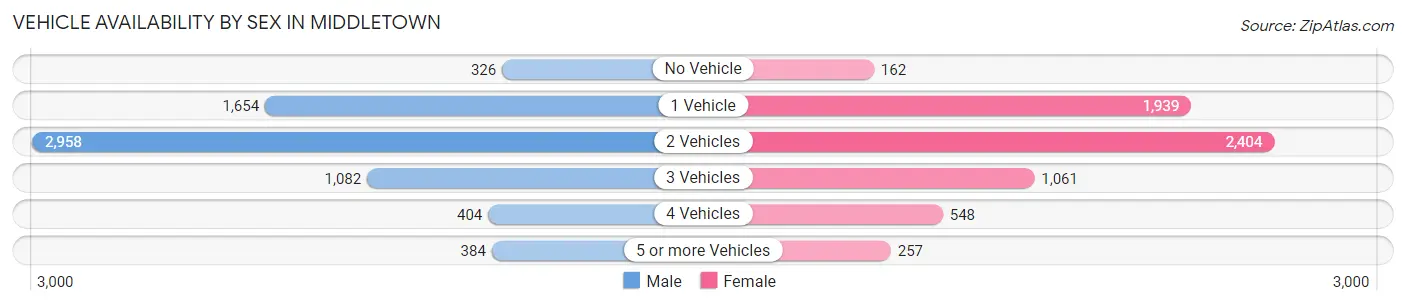
Vehicle Availability by Sex in Middletown
The most prevalent vehicle ownership categories in Middletown are males with 2 vehicles (2,958, accounting for 43.4%) and females with 2 vehicles (2,404, making up 46.4%).
| Vehicles Available | Male | Female |
| No Vehicle | 326 (4.8%) | 162 (2.5%) |
| 1 Vehicle | 1,654 (24.3%) | 1,939 (30.4%) |
| 2 Vehicles | 2,958 (43.4%) | 2,404 (37.7%) |
| 3 Vehicles | 1,082 (15.9%) | 1,061 (16.7%) |
| 4 Vehicles | 404 (5.9%) | 548 (8.6%) |
| 5 or more Vehicles | 384 (5.6%) | 257 (4.0%) |
| Total | 6,808 (100.0%) | 6,371 (100.0%) |
Commute Time in Middletown
The most frequently occuring commute durations in Middletown are 10 to 14 minutes (1,872 commuters, 14.9%), 15 to 19 minutes (1,771 commuters, 14.1%), and 5 to 9 minutes (1,602 commuters, 12.8%).
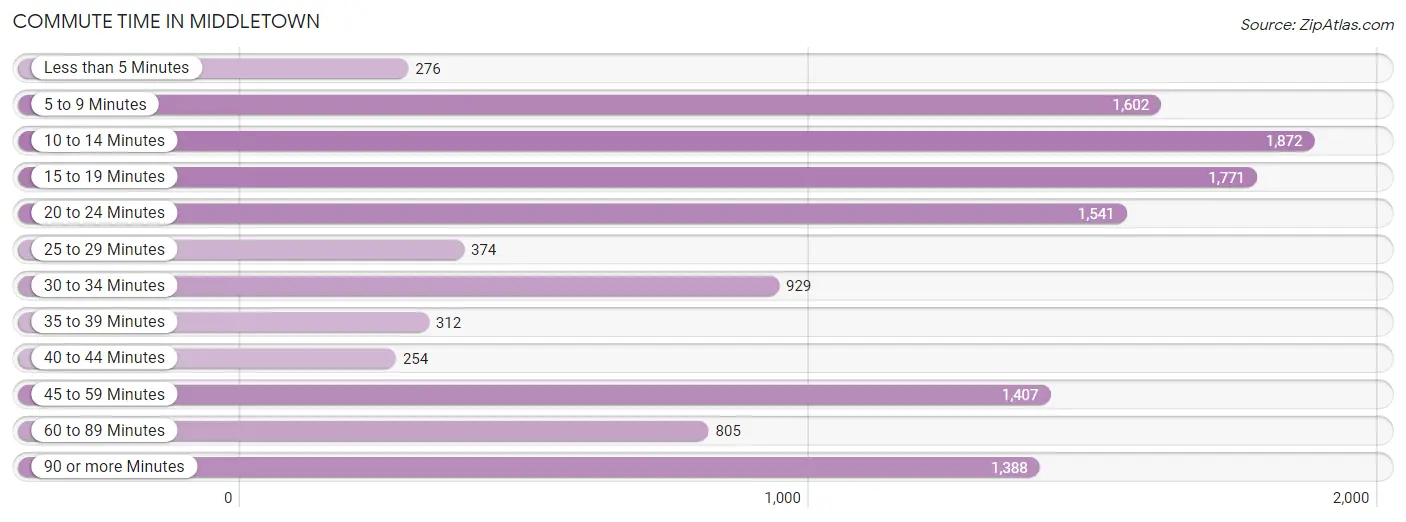
| Commute Time | # Commuters | % Commuters |
| Less than 5 Minutes | 276 | 2.2% |
| 5 to 9 Minutes | 1,602 | 12.8% |
| 10 to 14 Minutes | 1,872 | 14.9% |
| 15 to 19 Minutes | 1,771 | 14.1% |
| 20 to 24 Minutes | 1,541 | 12.3% |
| 25 to 29 Minutes | 374 | 3.0% |
| 30 to 34 Minutes | 929 | 7.4% |
| 35 to 39 Minutes | 312 | 2.5% |
| 40 to 44 Minutes | 254 | 2.0% |
| 45 to 59 Minutes | 1,407 | 11.2% |
| 60 to 89 Minutes | 805 | 6.4% |
| 90 or more Minutes | 1,388 | 11.1% |
Commute Time by Sex in Middletown
The most common commute times in Middletown are 45 to 59 minutes (1,030 commuters, 15.8%) for males and 10 to 14 minutes (1,080 commuters, 18.0%) for females.
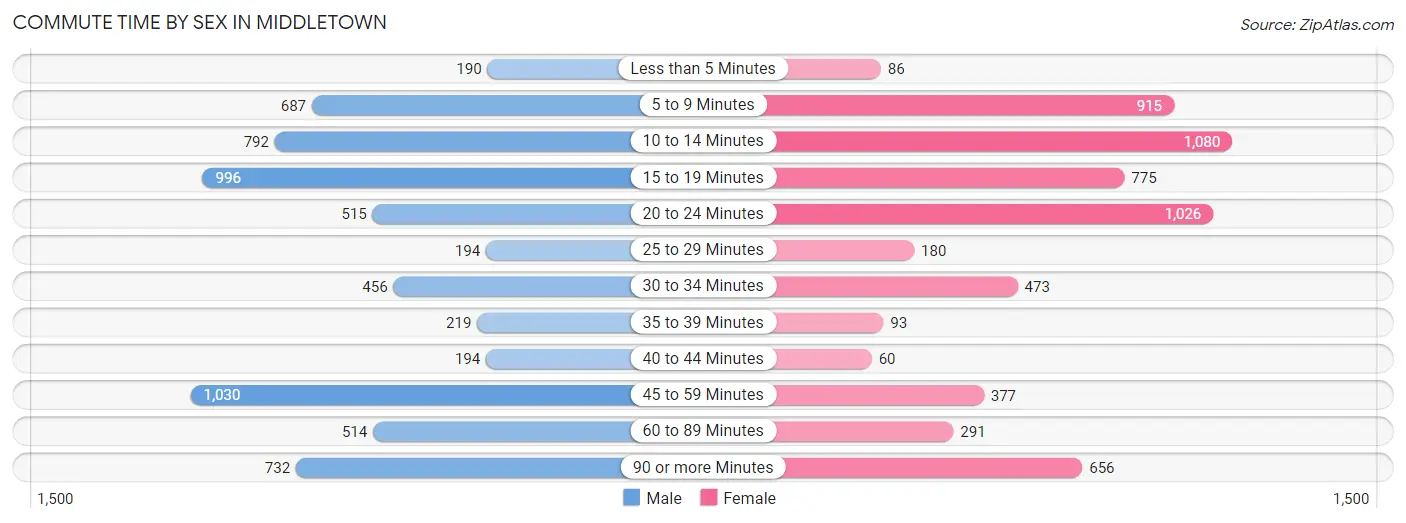
| Commute Time | Male | Female |
| Less than 5 Minutes | 190 (2.9%) | 86 (1.4%) |
| 5 to 9 Minutes | 687 (10.5%) | 915 (15.2%) |
| 10 to 14 Minutes | 792 (12.1%) | 1,080 (18.0%) |
| 15 to 19 Minutes | 996 (15.3%) | 775 (12.9%) |
| 20 to 24 Minutes | 515 (7.9%) | 1,026 (17.1%) |
| 25 to 29 Minutes | 194 (3.0%) | 180 (3.0%) |
| 30 to 34 Minutes | 456 (7.0%) | 473 (7.9%) |
| 35 to 39 Minutes | 219 (3.4%) | 93 (1.5%) |
| 40 to 44 Minutes | 194 (3.0%) | 60 (1.0%) |
| 45 to 59 Minutes | 1,030 (15.8%) | 377 (6.3%) |
| 60 to 89 Minutes | 514 (7.9%) | 291 (4.8%) |
| 90 or more Minutes | 732 (11.2%) | 656 (10.9%) |
Time of Departure to Work by Sex in Middletown
The most frequent times of departure to work in Middletown are 7:30 AM to 7:59 AM (793, 12.2%) for males and 7:30 AM to 7:59 AM (780, 13.0%) for females.
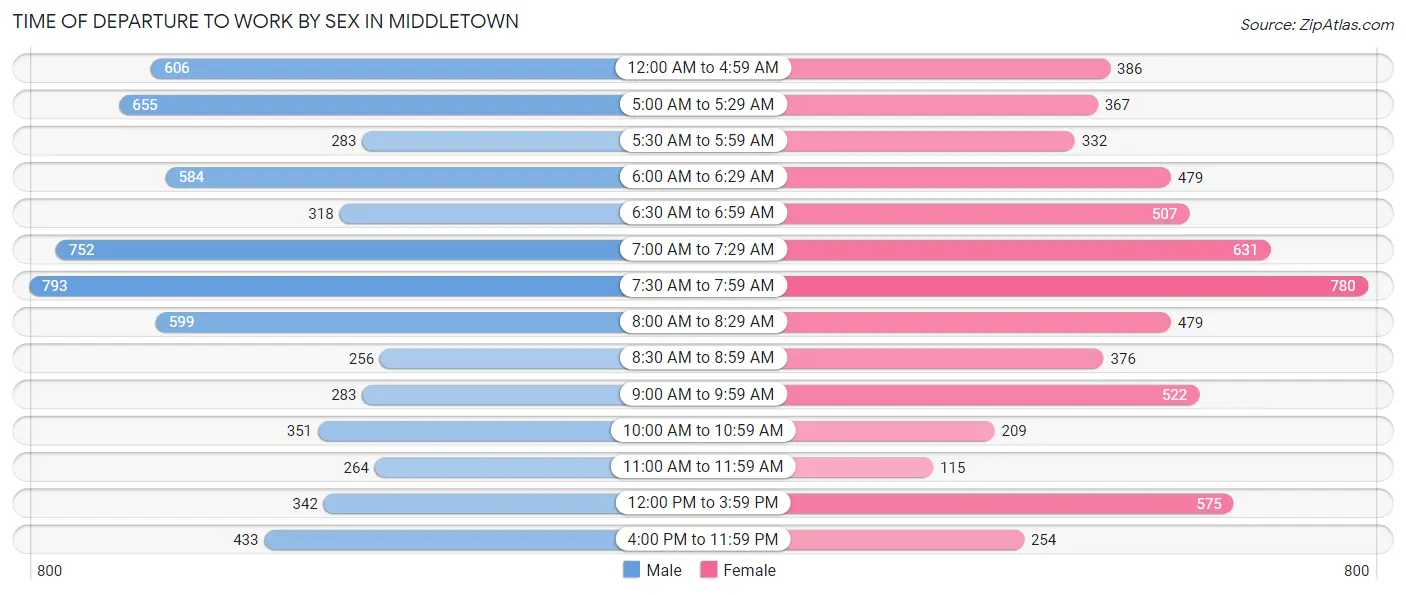
| Time of Departure | Male | Female |
| 12:00 AM to 4:59 AM | 606 (9.3%) | 386 (6.4%) |
| 5:00 AM to 5:29 AM | 655 (10.1%) | 367 (6.1%) |
| 5:30 AM to 5:59 AM | 283 (4.3%) | 332 (5.5%) |
| 6:00 AM to 6:29 AM | 584 (9.0%) | 479 (8.0%) |
| 6:30 AM to 6:59 AM | 318 (4.9%) | 507 (8.4%) |
| 7:00 AM to 7:29 AM | 752 (11.5%) | 631 (10.5%) |
| 7:30 AM to 7:59 AM | 793 (12.2%) | 780 (13.0%) |
| 8:00 AM to 8:29 AM | 599 (9.2%) | 479 (8.0%) |
| 8:30 AM to 8:59 AM | 256 (3.9%) | 376 (6.2%) |
| 9:00 AM to 9:59 AM | 283 (4.3%) | 522 (8.7%) |
| 10:00 AM to 10:59 AM | 351 (5.4%) | 209 (3.5%) |
| 11:00 AM to 11:59 AM | 264 (4.1%) | 115 (1.9%) |
| 12:00 PM to 3:59 PM | 342 (5.2%) | 575 (9.6%) |
| 4:00 PM to 11:59 PM | 433 (6.6%) | 254 (4.2%) |
| Total | 6,519 (100.0%) | 6,012 (100.0%) |
Housing Occupancy in Middletown
Occupancy by Ownership in Middletown
Of the total 10,111 dwellings in Middletown, owner-occupied units account for 5,391 (53.3%), while renter-occupied units make up 4,720 (46.7%).
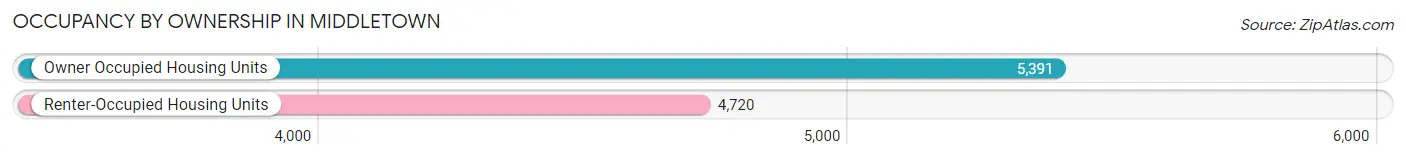
| Occupancy | # Housing Units | % Housing Units |
| Owner Occupied Housing Units | 5,391 | 53.3% |
| Renter-Occupied Housing Units | 4,720 | 46.7% |
| Total Occupied Housing Units | 10,111 | 100.0% |
Occupancy by Household Size in Middletown
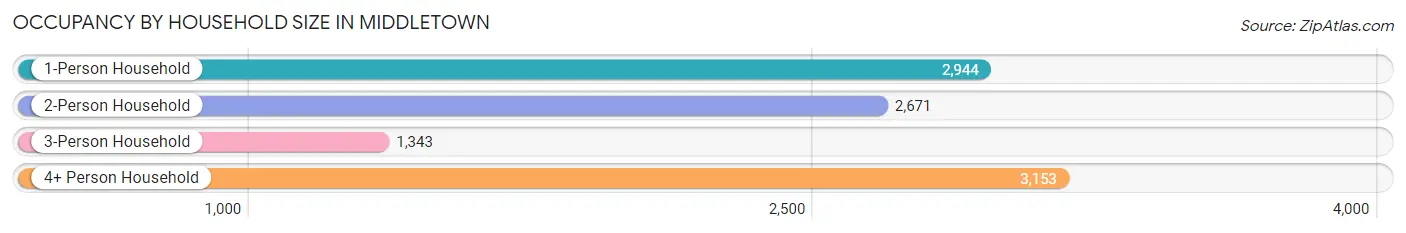
| Household Size | # Housing Units | % Housing Units |
| 1-Person Household | 2,944 | 29.1% |
| 2-Person Household | 2,671 | 26.4% |
| 3-Person Household | 1,343 | 13.3% |
| 4+ Person Household | 3,153 | 31.2% |
| Total Housing Units | 10,111 | 100.0% |
Occupancy by Ownership by Household Size in Middletown
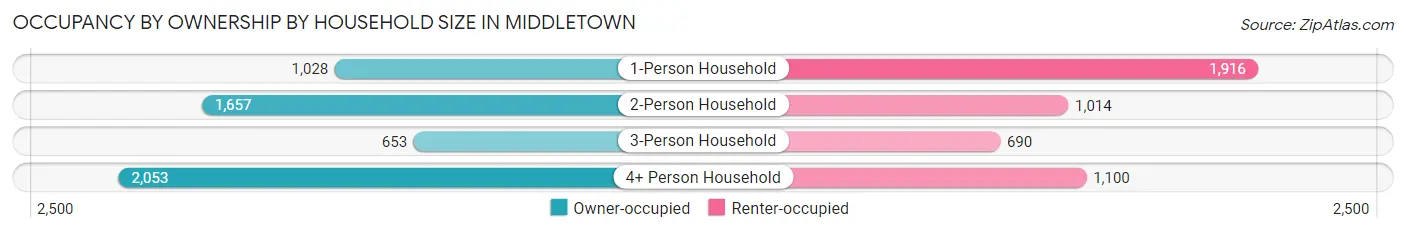
| Household Size | Owner-occupied | Renter-occupied |
| 1-Person Household | 1,028 (34.9%) | 1,916 (65.1%) |
| 2-Person Household | 1,657 (62.0%) | 1,014 (38.0%) |
| 3-Person Household | 653 (48.6%) | 690 (51.4%) |
| 4+ Person Household | 2,053 (65.1%) | 1,100 (34.9%) |
| Total Housing Units | 5,391 (53.3%) | 4,720 (46.7%) |
Occupancy by Educational Attainment in Middletown
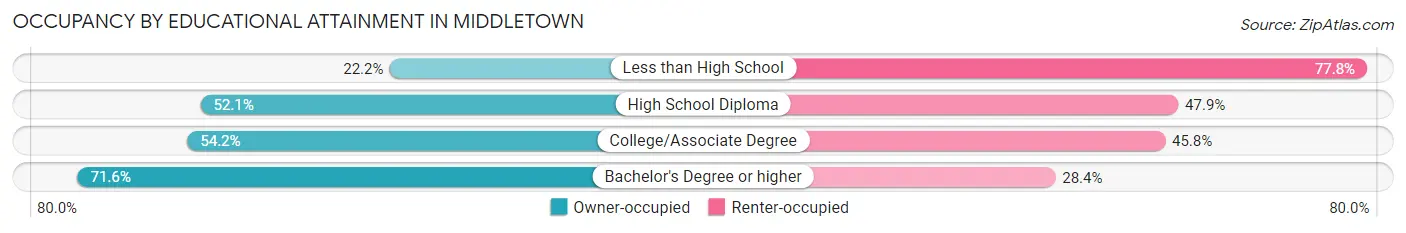
| Household Size | Owner-occupied | Renter-occupied |
| Less than High School | 285 (22.2%) | 1,001 (77.8%) |
| High School Diploma | 1,491 (52.1%) | 1,371 (47.9%) |
| College/Associate Degree | 2,035 (54.2%) | 1,721 (45.8%) |
| Bachelor's Degree or higher | 1,580 (71.6%) | 627 (28.4%) |
Occupancy by Age of Householder in Middletown
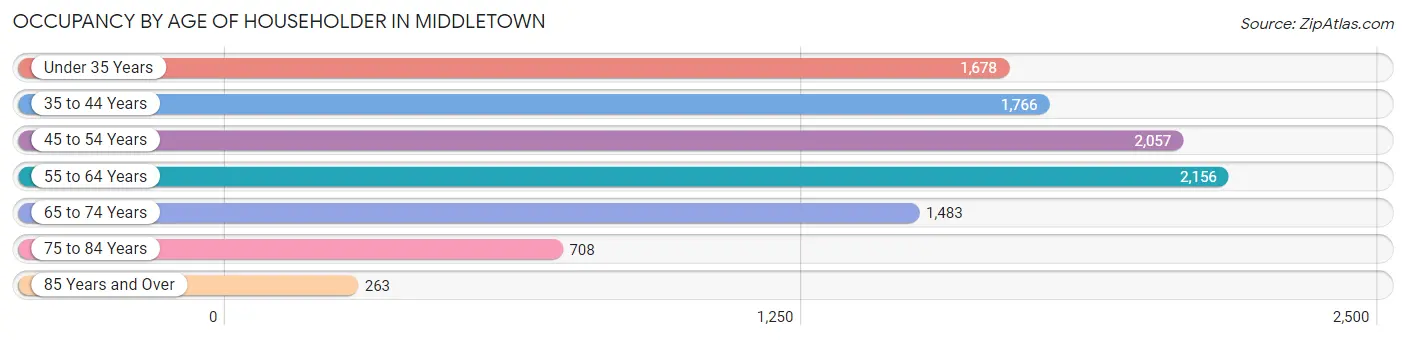
| Age Bracket | # Households | % Households |
| Under 35 Years | 1,678 | 16.6% |
| 35 to 44 Years | 1,766 | 17.5% |
| 45 to 54 Years | 2,057 | 20.3% |
| 55 to 64 Years | 2,156 | 21.3% |
| 65 to 74 Years | 1,483 | 14.7% |
| 75 to 84 Years | 708 | 7.0% |
| 85 Years and Over | 263 | 2.6% |
| Total | 10,111 | 100.0% |
Housing Finances in Middletown
Median Income by Occupancy in Middletown
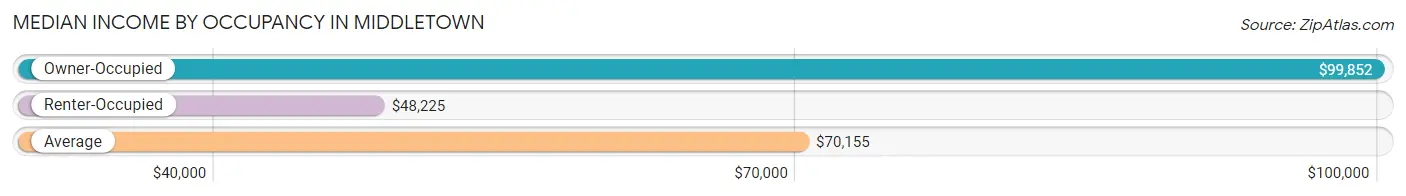
| Occupancy Type | # Households | Median Income |
| Owner-Occupied | 5,391 (53.3%) | $99,852 |
| Renter-Occupied | 4,720 (46.7%) | $48,225 |
| Average | 10,111 (100.0%) | $70,155 |
Occupancy by Householder Income Bracket in Middletown
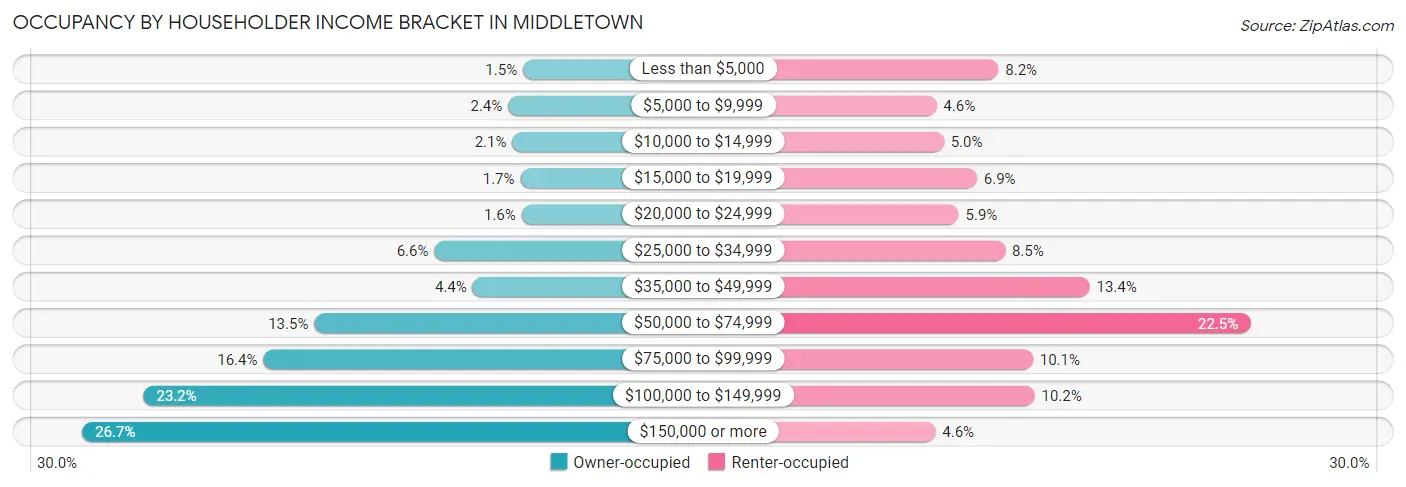
| Income Bracket | Owner-occupied | Renter-occupied |
| Less than $5,000 | 82 (1.5%) | 385 (8.2%) |
| $5,000 to $9,999 | 128 (2.4%) | 218 (4.6%) |
| $10,000 to $14,999 | 115 (2.1%) | 238 (5.0%) |
| $15,000 to $19,999 | 90 (1.7%) | 327 (6.9%) |
| $20,000 to $24,999 | 86 (1.6%) | 278 (5.9%) |
| $25,000 to $34,999 | 355 (6.6%) | 403 (8.5%) |
| $35,000 to $49,999 | 237 (4.4%) | 631 (13.4%) |
| $50,000 to $74,999 | 725 (13.5%) | 1,064 (22.5%) |
| $75,000 to $99,999 | 882 (16.4%) | 478 (10.1%) |
| $100,000 to $149,999 | 1,251 (23.2%) | 483 (10.2%) |
| $150,000 or more | 1,440 (26.7%) | 215 (4.6%) |
| Total | 5,391 (100.0%) | 4,720 (100.0%) |
Monthly Housing Cost Tiers in Middletown
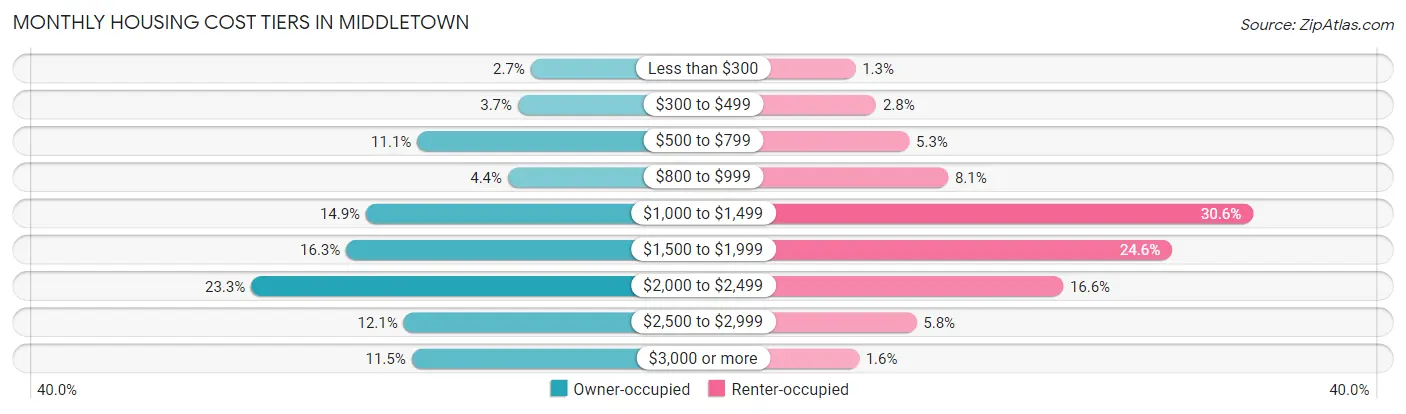
| Monthly Cost | Owner-occupied | Renter-occupied |
| Less than $300 | 147 (2.7%) | 62 (1.3%) |
| $300 to $499 | 198 (3.7%) | 134 (2.8%) |
| $500 to $799 | 598 (11.1%) | 249 (5.3%) |
| $800 to $999 | 238 (4.4%) | 384 (8.1%) |
| $1,000 to $1,499 | 801 (14.9%) | 1,445 (30.6%) |
| $1,500 to $1,999 | 880 (16.3%) | 1,163 (24.6%) |
| $2,000 to $2,499 | 1,257 (23.3%) | 784 (16.6%) |
| $2,500 to $2,999 | 652 (12.1%) | 274 (5.8%) |
| $3,000 or more | 620 (11.5%) | 74 (1.6%) |
| Total | 5,391 (100.0%) | 4,720 (100.0%) |
Physical Housing Characteristics in Middletown
Housing Structures in Middletown
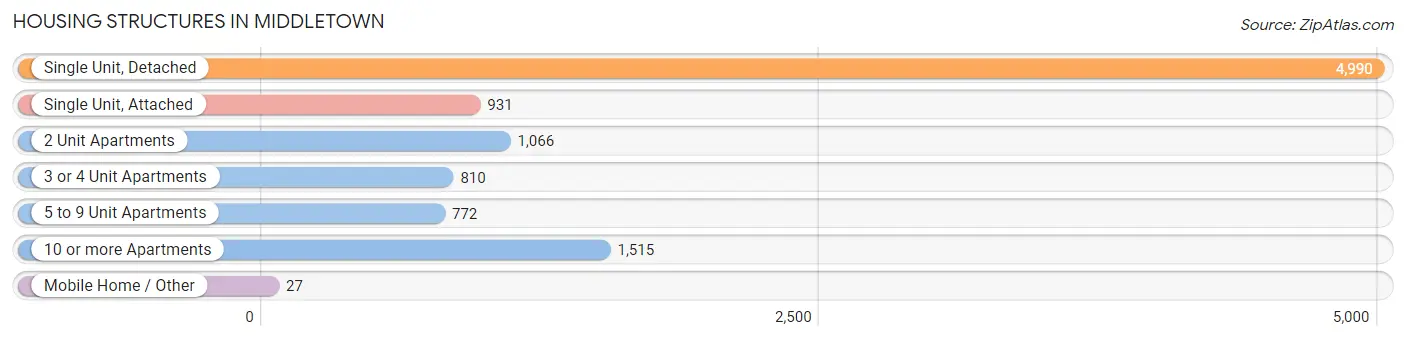
| Structure Type | # Housing Units | % Housing Units |
| Single Unit, Detached | 4,990 | 49.3% |
| Single Unit, Attached | 931 | 9.2% |
| 2 Unit Apartments | 1,066 | 10.5% |
| 3 or 4 Unit Apartments | 810 | 8.0% |
| 5 to 9 Unit Apartments | 772 | 7.6% |
| 10 or more Apartments | 1,515 | 15.0% |
| Mobile Home / Other | 27 | 0.3% |
| Total | 10,111 | 100.0% |
Housing Structures by Occupancy in Middletown
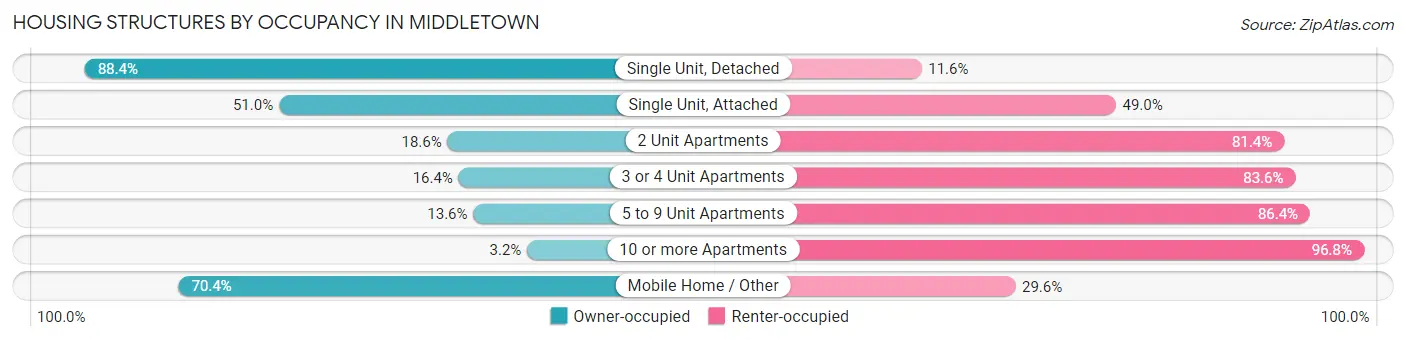
| Structure Type | Owner-occupied | Renter-occupied |
| Single Unit, Detached | 4,412 (88.4%) | 578 (11.6%) |
| Single Unit, Attached | 475 (51.0%) | 456 (49.0%) |
| 2 Unit Apartments | 198 (18.6%) | 868 (81.4%) |
| 3 or 4 Unit Apartments | 133 (16.4%) | 677 (83.6%) |
| 5 to 9 Unit Apartments | 105 (13.6%) | 667 (86.4%) |
| 10 or more Apartments | 49 (3.2%) | 1,466 (96.8%) |
| Mobile Home / Other | 19 (70.4%) | 8 (29.6%) |
| Total | 5,391 (53.3%) | 4,720 (46.7%) |
Housing Structures by Number of Rooms in Middletown
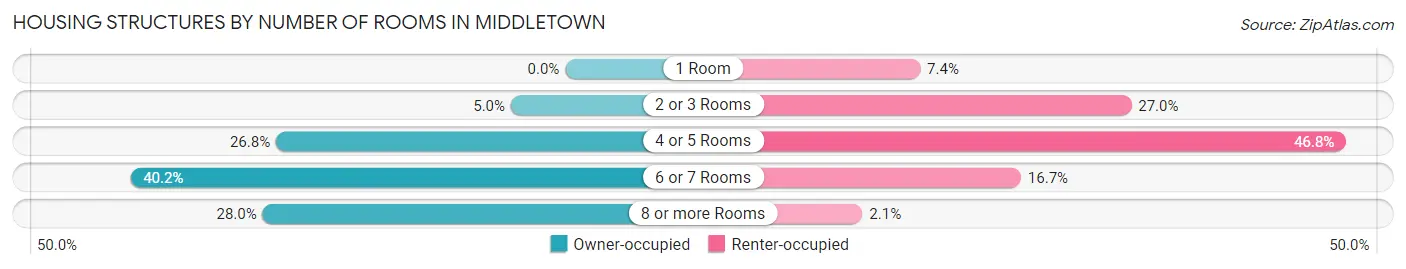
| Number of Rooms | Owner-occupied | Renter-occupied |
| 1 Room | 0 (0.0%) | 350 (7.4%) |
| 2 or 3 Rooms | 271 (5.0%) | 1,272 (27.0%) |
| 4 or 5 Rooms | 1,442 (26.8%) | 2,210 (46.8%) |
| 6 or 7 Rooms | 2,169 (40.2%) | 790 (16.7%) |
| 8 or more Rooms | 1,509 (28.0%) | 98 (2.1%) |
| Total | 5,391 (100.0%) | 4,720 (100.0%) |
Housing Structure by Heating Type in Middletown
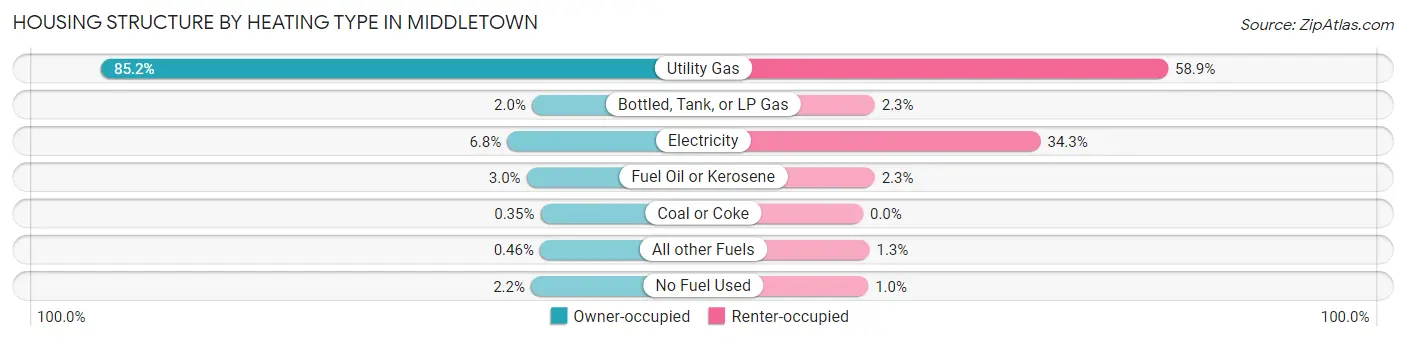
| Heating Type | Owner-occupied | Renter-occupied |
| Utility Gas | 4,593 (85.2%) | 2,782 (58.9%) |
| Bottled, Tank, or LP Gas | 108 (2.0%) | 107 (2.3%) |
| Electricity | 365 (6.8%) | 1,619 (34.3%) |
| Fuel Oil or Kerosene | 163 (3.0%) | 106 (2.2%) |
| Coal or Coke | 19 (0.4%) | 0 (0.0%) |
| All other Fuels | 25 (0.5%) | 59 (1.3%) |
| No Fuel Used | 118 (2.2%) | 47 (1.0%) |
| Total | 5,391 (100.0%) | 4,720 (100.0%) |
Household Vehicle Usage in Middletown
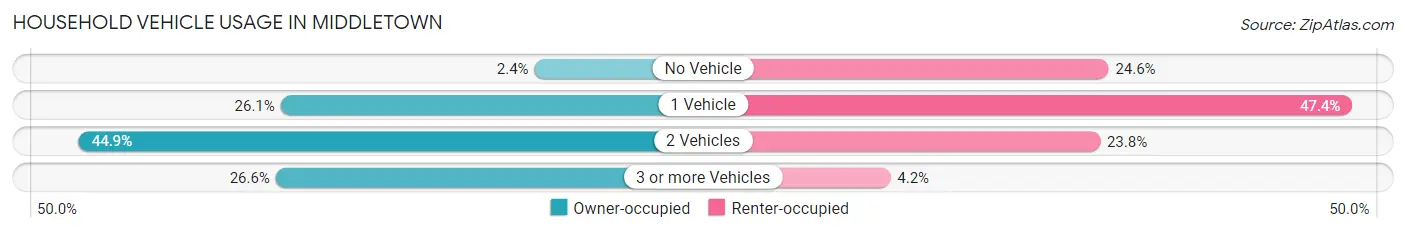
| Vehicles per Household | Owner-occupied | Renter-occupied |
| No Vehicle | 130 (2.4%) | 1,161 (24.6%) |
| 1 Vehicle | 1,407 (26.1%) | 2,235 (47.3%) |
| 2 Vehicles | 2,422 (44.9%) | 1,124 (23.8%) |
| 3 or more Vehicles | 1,432 (26.6%) | 200 (4.2%) |
| Total | 5,391 (100.0%) | 4,720 (100.0%) |
Real Estate & Mortgages in Middletown
Real Estate and Mortgage Overview in Middletown
| Characteristic | Without Mortgage | With Mortgage |
| Housing Units | 1,716 | 3,675 |
| Median Property Value | $204,900 | $252,100 |
| Median Household Income | $84,167 | $1,090 |
| Monthly Housing Costs | $762 | $602 |
| Real Estate Taxes | $4,544 | $67 |
Property Value by Mortgage Status in Middletown
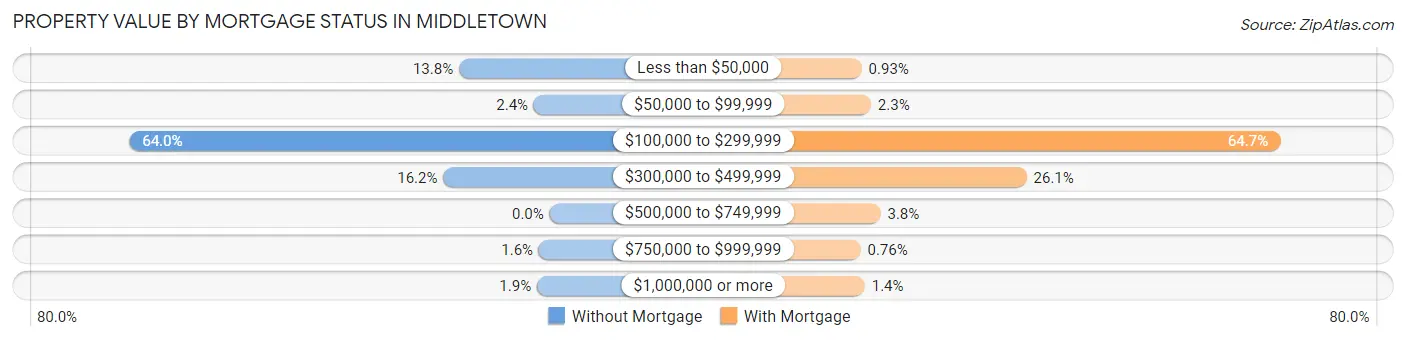
| Property Value | Without Mortgage | With Mortgage |
| Less than $50,000 | 237 (13.8%) | 34 (0.9%) |
| $50,000 to $99,999 | 41 (2.4%) | 86 (2.3%) |
| $100,000 to $299,999 | 1,099 (64.0%) | 2,377 (64.7%) |
| $300,000 to $499,999 | 278 (16.2%) | 958 (26.1%) |
| $500,000 to $749,999 | 0 (0.0%) | 140 (3.8%) |
| $750,000 to $999,999 | 28 (1.6%) | 28 (0.8%) |
| $1,000,000 or more | 33 (1.9%) | 52 (1.4%) |
| Total | 1,716 (100.0%) | 3,675 (100.0%) |
Household Income by Mortgage Status in Middletown
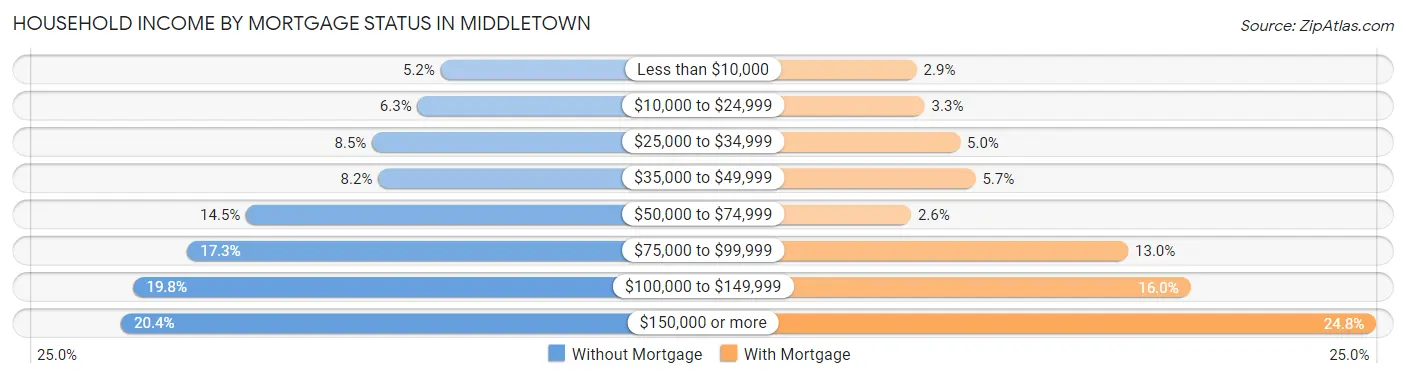
| Household Income | Without Mortgage | With Mortgage |
| Less than $10,000 | 89 (5.2%) | 107 (2.9%) |
| $10,000 to $24,999 | 108 (6.3%) | 121 (3.3%) |
| $25,000 to $34,999 | 145 (8.5%) | 183 (5.0%) |
| $35,000 to $49,999 | 140 (8.2%) | 210 (5.7%) |
| $50,000 to $74,999 | 248 (14.4%) | 97 (2.6%) |
| $75,000 to $99,999 | 296 (17.2%) | 477 (13.0%) |
| $100,000 to $149,999 | 340 (19.8%) | 586 (16.0%) |
| $150,000 or more | 350 (20.4%) | 911 (24.8%) |
| Total | 1,716 (100.0%) | 3,675 (100.0%) |
Property Value to Household Income Ratio in Middletown
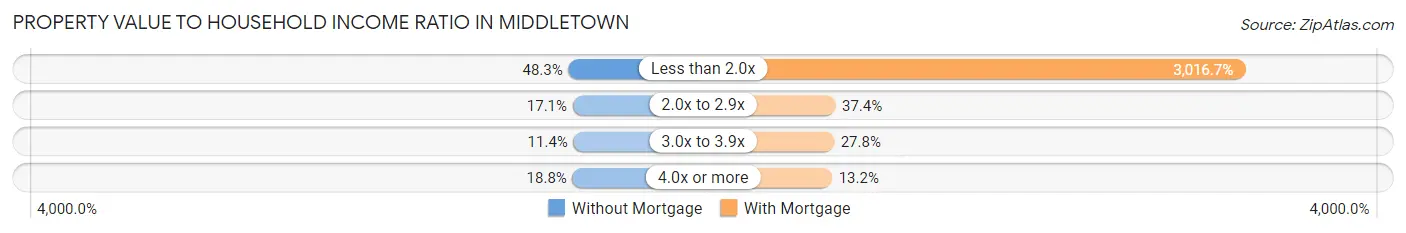
| Value-to-Income Ratio | Without Mortgage | With Mortgage |
| Less than 2.0x | 829 (48.3%) | 110,865 (3,016.7%) |
| 2.0x to 2.9x | 294 (17.1%) | 1,375 (37.4%) |
| 3.0x to 3.9x | 196 (11.4%) | 1,021 (27.8%) |
| 4.0x or more | 323 (18.8%) | 484 (13.2%) |
| Total | 1,716 (100.0%) | 3,675 (100.0%) |
Real Estate Taxes by Mortgage Status in Middletown
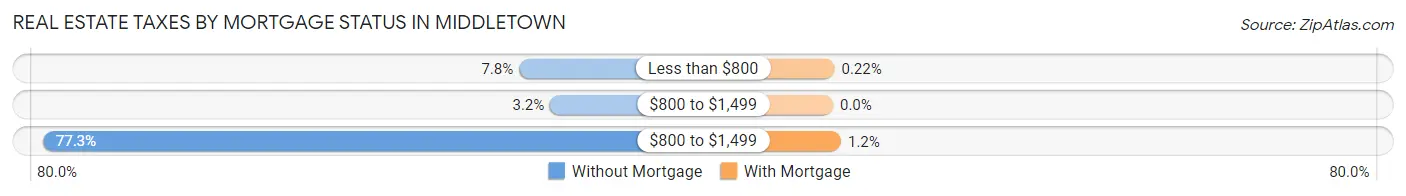
| Property Taxes | Without Mortgage | With Mortgage |
| Less than $800 | 133 (7.7%) | 8 (0.2%) |
| $800 to $1,499 | 55 (3.2%) | 0 (0.0%) |
| $800 to $1,499 | 1,327 (77.3%) | 43 (1.2%) |
| Total | 1,716 (100.0%) | 3,675 (100.0%) |
Health & Disability in Middletown
Health Insurance Coverage by Age in Middletown
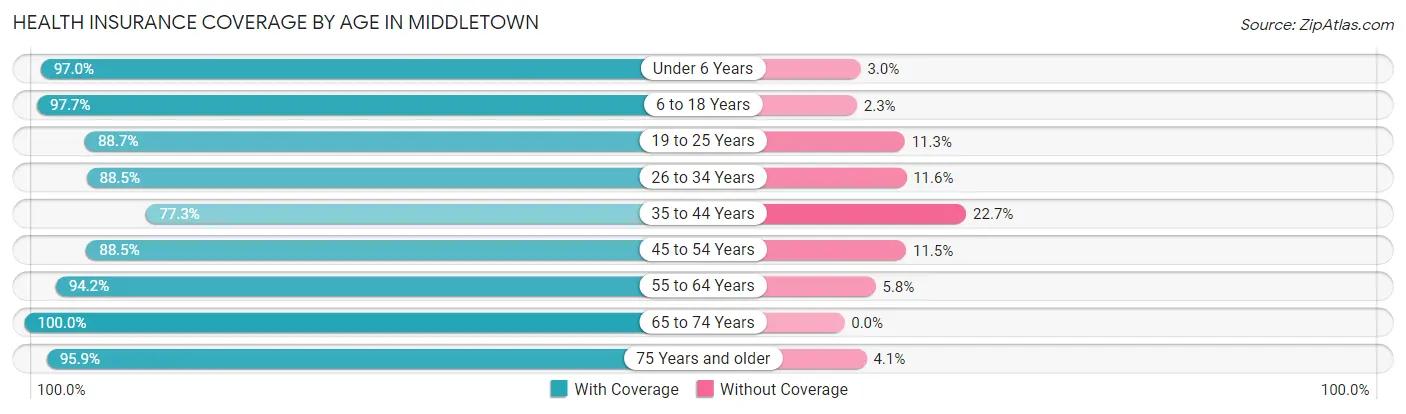
| Age Bracket | With Coverage | Without Coverage |
| Under 6 Years | 2,608 (97.0%) | 81 (3.0%) |
| 6 to 18 Years | 5,307 (97.7%) | 127 (2.3%) |
| 19 to 25 Years | 2,259 (88.7%) | 287 (11.3%) |
| 26 to 34 Years | 3,309 (88.4%) | 432 (11.6%) |
| 35 to 44 Years | 2,987 (77.3%) | 878 (22.7%) |
| 45 to 54 Years | 3,430 (88.5%) | 446 (11.5%) |
| 55 to 64 Years | 3,583 (94.2%) | 222 (5.8%) |
| 65 to 74 Years | 2,566 (100.0%) | 0 (0.0%) |
| 75 Years and older | 1,394 (95.9%) | 60 (4.1%) |
| Total | 27,443 (91.5%) | 2,533 (8.5%) |
Health Insurance Coverage by Citizenship Status in Middletown
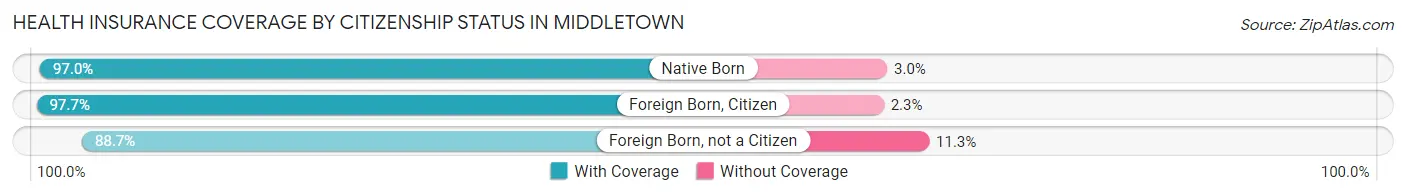
| Citizenship Status | With Coverage | Without Coverage |
| Native Born | 2,608 (97.0%) | 81 (3.0%) |
| Foreign Born, Citizen | 5,307 (97.7%) | 127 (2.3%) |
| Foreign Born, not a Citizen | 2,259 (88.7%) | 287 (11.3%) |
Health Insurance Coverage by Household Income in Middletown
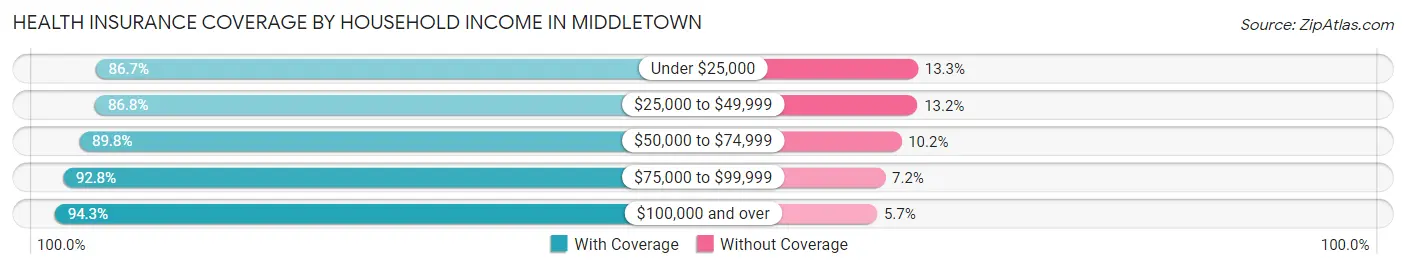
| Household Income | With Coverage | Without Coverage |
| Under $25,000 | 2,940 (86.7%) | 451 (13.3%) |
| $25,000 to $49,999 | 3,055 (86.8%) | 464 (13.2%) |
| $50,000 to $74,999 | 5,484 (89.8%) | 623 (10.2%) |
| $75,000 to $99,999 | 3,390 (92.8%) | 262 (7.2%) |
| $100,000 and over | 12,226 (94.3%) | 733 (5.7%) |
Public vs Private Health Insurance Coverage by Age in Middletown
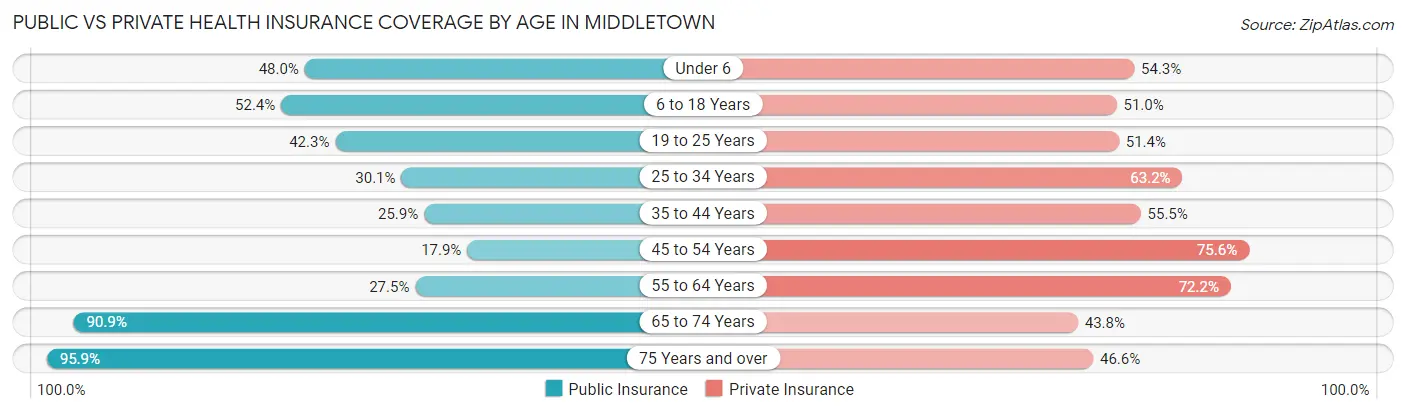
| Age Bracket | Public Insurance | Private Insurance |
| Under 6 | 1,291 (48.0%) | 1,459 (54.3%) |
| 6 to 18 Years | 2,847 (52.4%) | 2,771 (51.0%) |
| 19 to 25 Years | 1,078 (42.3%) | 1,309 (51.4%) |
| 25 to 34 Years | 1,125 (30.1%) | 2,365 (63.2%) |
| 35 to 44 Years | 999 (25.9%) | 2,144 (55.5%) |
| 45 to 54 Years | 692 (17.8%) | 2,929 (75.6%) |
| 55 to 64 Years | 1,046 (27.5%) | 2,747 (72.2%) |
| 65 to 74 Years | 2,333 (90.9%) | 1,124 (43.8%) |
| 75 Years and over | 1,394 (95.9%) | 678 (46.6%) |
| Total | 12,805 (42.7%) | 17,526 (58.5%) |
Disability Status by Sex by Age in Middletown
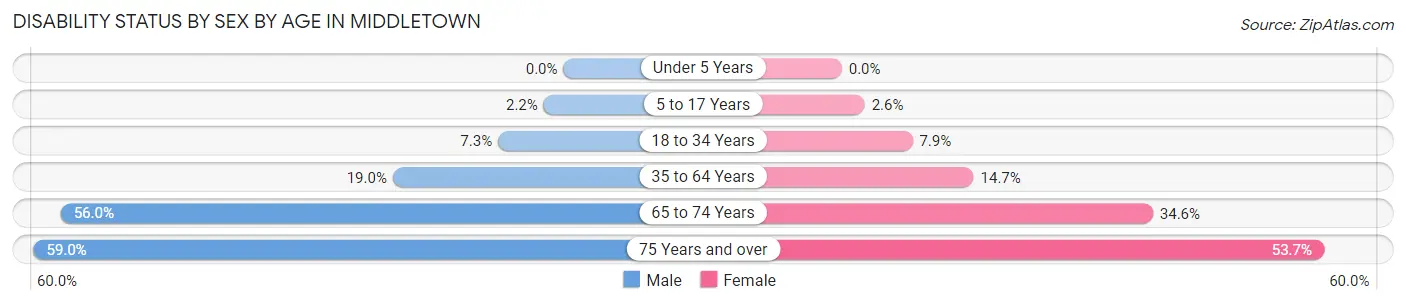
| Age Bracket | Male | Female |
| Under 5 Years | 0 (0.0%) | 0 (0.0%) |
| 5 to 17 Years | 67 (2.2%) | 61 (2.5%) |
| 18 to 34 Years | 254 (7.3%) | 243 (7.9%) |
| 35 to 64 Years | 1,090 (19.0%) | 853 (14.7%) |
| 65 to 74 Years | 680 (56.0%) | 468 (34.6%) |
| 75 Years and over | 393 (59.0%) | 423 (53.7%) |
Disability Class by Sex by Age in Middletown
Disability Class: Hearing Difficulty
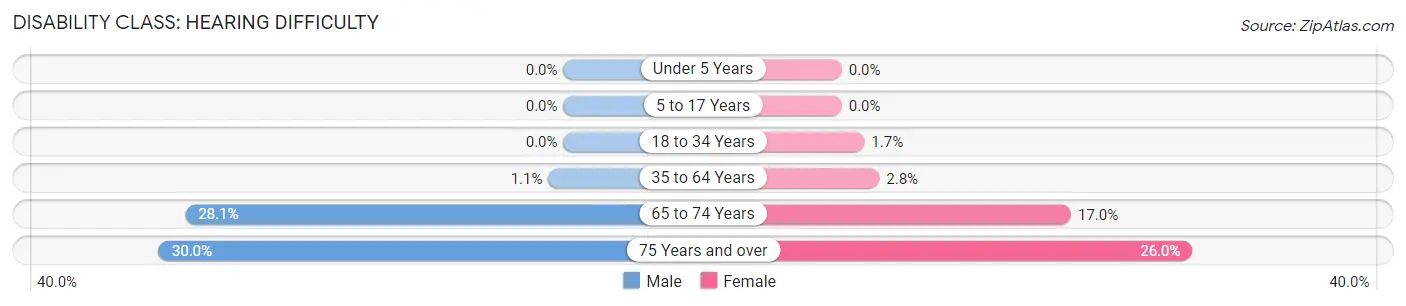
| Age Bracket | Male | Female |
| Under 5 Years | 0 (0.0%) | 0 (0.0%) |
| 5 to 17 Years | 0 (0.0%) | 0 (0.0%) |
| 18 to 34 Years | 0 (0.0%) | 52 (1.7%) |
| 35 to 64 Years | 64 (1.1%) | 162 (2.8%) |
| 65 to 74 Years | 341 (28.1%) | 230 (17.0%) |
| 75 Years and over | 200 (30.0%) | 205 (26.0%) |
Disability Class: Vision Difficulty
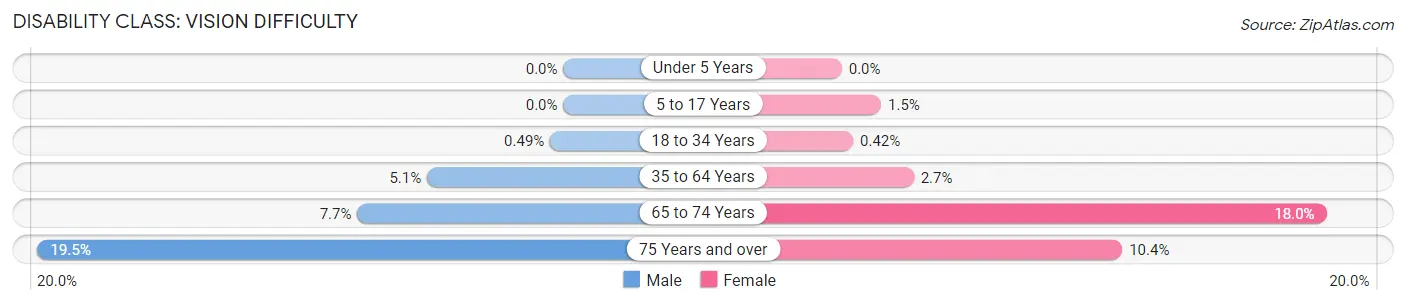
| Age Bracket | Male | Female |
| Under 5 Years | 0 (0.0%) | 0 (0.0%) |
| 5 to 17 Years | 0 (0.0%) | 35 (1.5%) |
| 18 to 34 Years | 17 (0.5%) | 13 (0.4%) |
| 35 to 64 Years | 290 (5.1%) | 155 (2.7%) |
| 65 to 74 Years | 93 (7.6%) | 243 (18.0%) |
| 75 Years and over | 130 (19.5%) | 82 (10.4%) |
Disability Class: Cognitive Difficulty
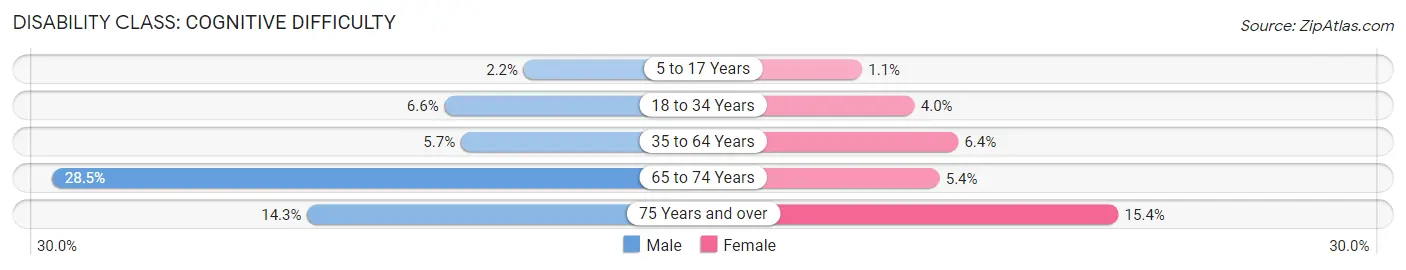
| Age Bracket | Male | Female |
| 5 to 17 Years | 67 (2.2%) | 26 (1.1%) |
| 18 to 34 Years | 231 (6.6%) | 124 (4.0%) |
| 35 to 64 Years | 327 (5.7%) | 374 (6.4%) |
| 65 to 74 Years | 346 (28.5%) | 73 (5.4%) |
| 75 Years and over | 95 (14.3%) | 121 (15.4%) |
Disability Class: Ambulatory Difficulty
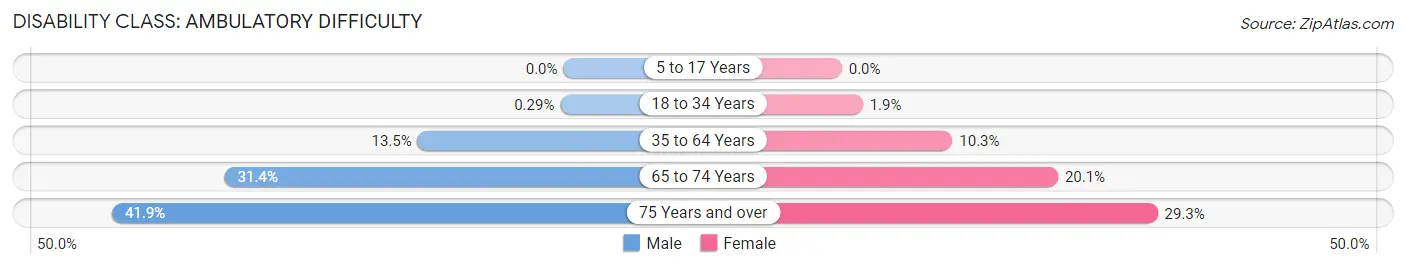
| Age Bracket | Male | Female |
| 5 to 17 Years | 0 (0.0%) | 0 (0.0%) |
| 18 to 34 Years | 10 (0.3%) | 60 (1.9%) |
| 35 to 64 Years | 776 (13.5%) | 596 (10.3%) |
| 65 to 74 Years | 382 (31.4%) | 271 (20.1%) |
| 75 Years and over | 279 (41.9%) | 231 (29.3%) |
Disability Class: Self-Care Difficulty
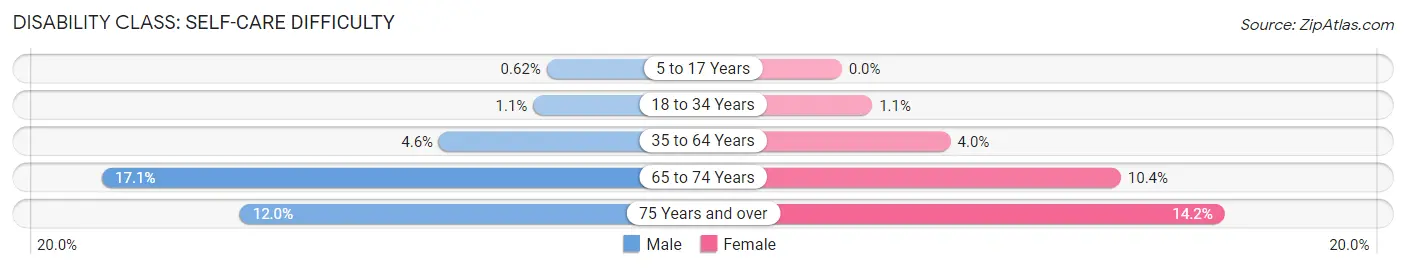
| Age Bracket | Male | Female |
| 5 to 17 Years | 19 (0.6%) | 0 (0.0%) |
| 18 to 34 Years | 39 (1.1%) | 35 (1.1%) |
| 35 to 64 Years | 265 (4.6%) | 235 (4.0%) |
| 65 to 74 Years | 208 (17.1%) | 140 (10.4%) |
| 75 Years and over | 80 (12.0%) | 112 (14.2%) |
Technology Access in Middletown
Computing Device Access in Middletown
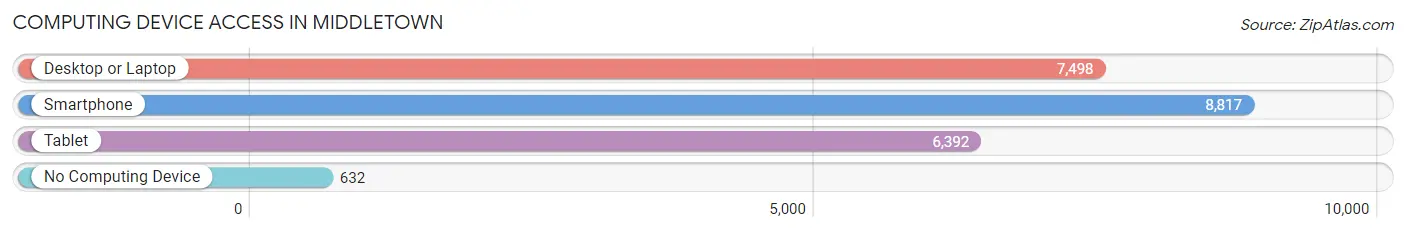
| Device Type | # Households | % Households |
| Desktop or Laptop | 7,498 | 74.2% |
| Smartphone | 8,817 | 87.2% |
| Tablet | 6,392 | 63.2% |
| No Computing Device | 632 | 6.2% |
| Total | 10,111 | 100.0% |
Internet Access in Middletown
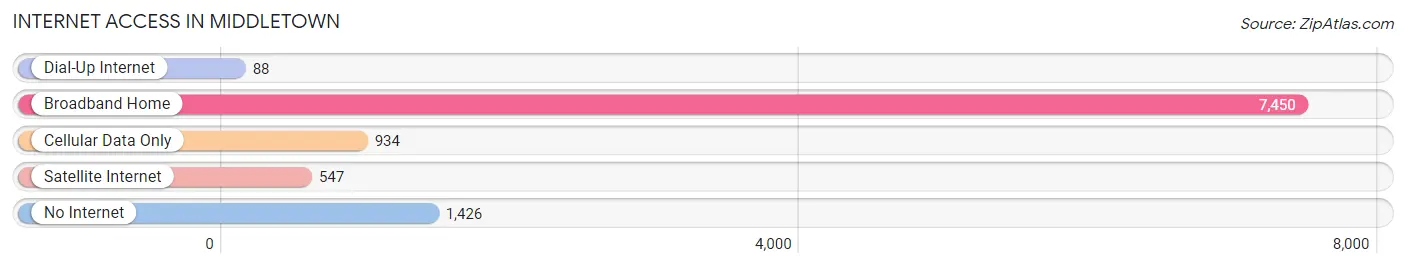
| Internet Type | # Households | % Households |
| Dial-Up Internet | 88 | 0.9% |
| Broadband Home | 7,450 | 73.7% |
| Cellular Data Only | 934 | 9.2% |
| Satellite Internet | 547 | 5.4% |
| No Internet | 1,426 | 14.1% |
| Total | 10,111 | 100.0% |
Middletown Summary
Middletown, New York is a city located in Orange County, New York, United States. It is situated in the Hudson Valley region, approximately 70 miles north of New York City. The city has a population of approximately 28,086 people, according to the 2010 census.
History
Middletown was first settled in 1764 by a group of Dutch and English settlers. The city was originally known as Smith’s Clove, named after the nearby mountain pass. The city was officially incorporated in 1788 and was renamed Middletown in 1848.
Middletown was an important industrial center during the 19th century. It was home to several factories, including a paper mill, a cotton mill, and a tannery. The city was also a major transportation hub, with several railroads and the Delaware and Hudson Canal passing through it.
Geography
Middletown is located in the Hudson Valley region of New York. It is situated in the foothills of the Shawangunk Mountains, approximately 70 miles north of New York City. The city is bordered by the towns of Wallkill to the north, Mount Hope to the east, and Wawayanda to the south.
The city has a total area of 8.3 square miles, of which 8.2 square miles is land and 0.1 square miles is water. The Wallkill River runs through the city, and the city is home to several parks, including Fancher-Davidge Park, Maple Hill Park, and Twin Towers Park.
Economy
Middletown’s economy is largely based on manufacturing and healthcare. The city is home to several large employers, including Orange Regional Medical Center, Middletown Psychiatric Center, and Orange County Community College.
The city is also home to several small businesses, including restaurants, retail stores, and professional services. The city is also home to several large shopping centers, including the Galleria at Crystal Run and the Orange Plaza Shopping Center.
Demographics
According to the 2010 census, Middletown has a population of 28,086 people. The city has a median household income of $45,837 and a median age of 38.7 years. The city is predominantly white (83.3%), with smaller percentages of African Americans (7.2%), Hispanics (5.3%), and Asians (2.7%).
Middletown is a diverse city, with a variety of religious affiliations. The largest religious group is Catholic (30.3%), followed by Protestant (19.2%), and Jewish (2.2%).
Conclusion
Middletown, New York is a city located in Orange County, New York, United States. It is situated in the Hudson Valley region, approximately 70 miles north of New York City. The city has a population of approximately 28,086 people, according to the 2010 census. Middletown was an important industrial center during the 19th century and is now home to several large employers, including Orange Regional Medical Center, Middletown Psychiatric Center, and Orange County Community College. The city is predominantly white (83.3%), with smaller percentages of African Americans (7.2%), Hispanics (5.3%), and Asians (2.7%). The largest religious group is Catholic (30.3%), followed by Protestant (19.2%), and Jewish (2.2%).
Common Questions
What is Per Capita Income in Middletown?
Per Capita income in Middletown is $31,484.
What is the Median Family Income in Middletown?
Median Family Income in Middletown is $89,636.
What is the Median Household income in Middletown?
Median Household Income in Middletown is $70,155.
What is Income or Wage Gap in Middletown?
Income or Wage Gap in Middletown is 24.5%.
Women in Middletown earn 75.5 cents for every dollar earned by a man.
What is Inequality or Gini Index in Middletown?
Inequality or Gini Index in Middletown is 0.44.
What is the Total Population of Middletown?
Total Population of Middletown is 30,169.
What is the Total Male Population of Middletown?
Total Male Population of Middletown is 15,377.
What is the Total Female Population of Middletown?
Total Female Population of Middletown is 14,792.
What is the Ratio of Males per 100 Females in Middletown?
There are 103.95 Males per 100 Females in Middletown.
What is the Ratio of Females per 100 Males in Middletown?
There are 96.20 Females per 100 Males in Middletown.
What is the Median Population Age in Middletown?
Median Population Age in Middletown is 37.0 Years.
What is the Average Family Size in Middletown
Average Family Size in Middletown is 3.6 People.
What is the Average Household Size in Middletown
Average Household Size in Middletown is 2.9 People.
How Large is the Labor Force in Middletown?
There are 14,303 People in the Labor Forcein in Middletown.
What is the Percentage of People in the Labor Force in Middletown?
61.7% of People are in the Labor Force in Middletown.
What is the Unemployment Rate in Middletown?
Unemployment Rate in Middletown is 4.9%.