Vero Beach South, FL Map & Demographics
Vero Beach South Map
Vero Beach South Overview
$37,734
PER CAPITA INCOME
$83,287
AVG FAMILY INCOME
$70,252
AVG HOUSEHOLD INCOME
17.7%
WAGE / INCOME GAP [ % ]
82.3¢/ $1
WAGE / INCOME GAP [ $ ]
0.43
INEQUALITY / GINI INDEX
29,965
TOTAL POPULATION
14,429
MALE POPULATION
15,536
FEMALE POPULATION
92.87
MALES / 100 FEMALES
107.67
FEMALES / 100 MALES
48.8
MEDIAN AGE
3.2
AVG FAMILY SIZE
2.6
AVG HOUSEHOLD SIZE
14,528
LABOR FORCE [ PEOPLE ]
55.7%
PERCENT IN LABOR FORCE
4.6%
UNEMPLOYMENT RATE
Income in Vero Beach South
Income Overview in Vero Beach South
Per Capita Income in Vero Beach South is $37,734, while median incomes of families and households are $83,287 and $70,252 respectively.
| Characteristic | Number | Measure |
| Per Capita Income | 29,965 | $37,734 |
| Median Family Income | 7,406 | $83,287 |
| Mean Family Income | 7,406 | $105,326 |
| Median Household Income | 11,568 | $70,252 |
| Mean Household Income | 11,568 | $89,662 |
| Income Deficit | 7,406 | $0 |
| Wage / Income Gap (%) | 29,965 | 17.71% |
| Wage / Income Gap ($) | 29,965 | 82.29¢ per $1 |
| Gini / Inequality Index | 29,965 | 0.43 |
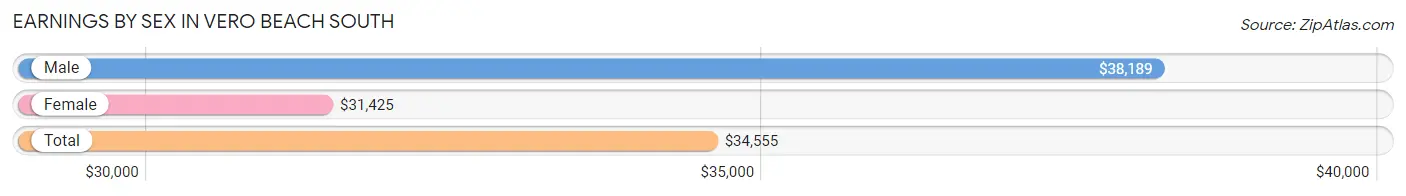
Earnings by Sex in Vero Beach South
Average Earnings in Vero Beach South are $34,555, $38,189 for men and $31,425 for women, a difference of 17.7%.
| Sex | Number | Average Earnings |
| Male | 7,960 (51.1%) | $38,189 |
| Female | 7,604 (48.9%) | $31,425 |
| Total | 15,564 (100.0%) | $34,555 |
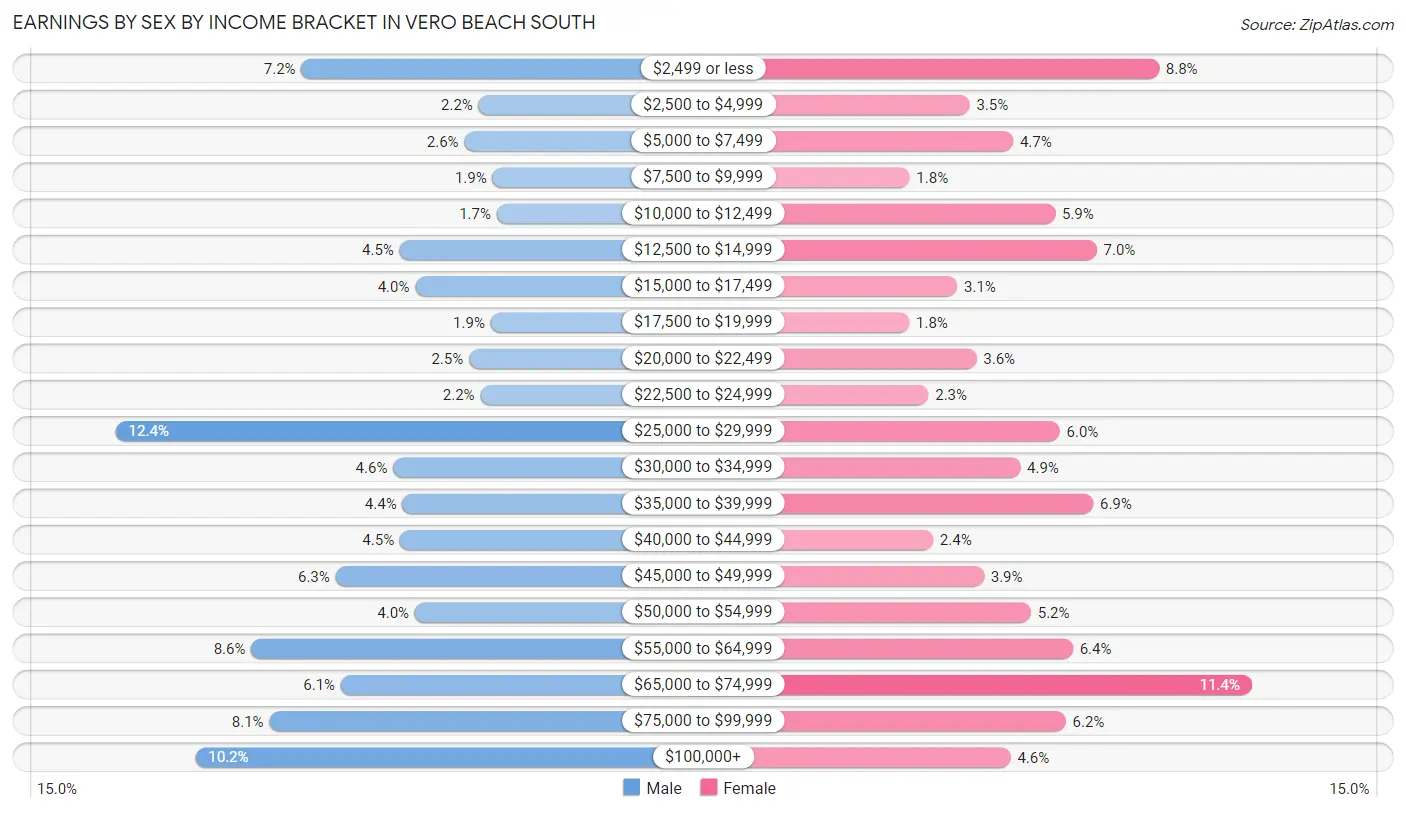
Earnings by Sex by Income Bracket in Vero Beach South
The most common earnings brackets in Vero Beach South are $25,000 to $29,999 for men (990 | 12.4%) and $65,000 to $74,999 for women (865 | 11.4%).
| Income | Male | Female |
| $2,499 or less | 575 (7.2%) | 667 (8.8%) |
| $2,500 to $4,999 | 178 (2.2%) | 262 (3.5%) |
| $5,000 to $7,499 | 210 (2.6%) | 355 (4.7%) |
| $7,500 to $9,999 | 147 (1.8%) | 134 (1.8%) |
| $10,000 to $12,499 | 138 (1.7%) | 445 (5.9%) |
| $12,500 to $14,999 | 355 (4.5%) | 534 (7.0%) |
| $15,000 to $17,499 | 320 (4.0%) | 236 (3.1%) |
| $17,500 to $19,999 | 151 (1.9%) | 133 (1.8%) |
| $20,000 to $22,499 | 200 (2.5%) | 277 (3.6%) |
| $22,500 to $24,999 | 174 (2.2%) | 174 (2.3%) |
| $25,000 to $29,999 | 990 (12.4%) | 455 (6.0%) |
| $30,000 to $34,999 | 369 (4.6%) | 370 (4.9%) |
| $35,000 to $39,999 | 349 (4.4%) | 526 (6.9%) |
| $40,000 to $44,999 | 354 (4.4%) | 184 (2.4%) |
| $45,000 to $49,999 | 498 (6.3%) | 293 (3.8%) |
| $50,000 to $54,999 | 321 (4.0%) | 393 (5.2%) |
| $55,000 to $64,999 | 687 (8.6%) | 483 (6.4%) |
| $65,000 to $74,999 | 486 (6.1%) | 865 (11.4%) |
| $75,000 to $99,999 | 646 (8.1%) | 468 (6.1%) |
| $100,000+ | 812 (10.2%) | 350 (4.6%) |
| Total | 7,960 (100.0%) | 7,604 (100.0%) |
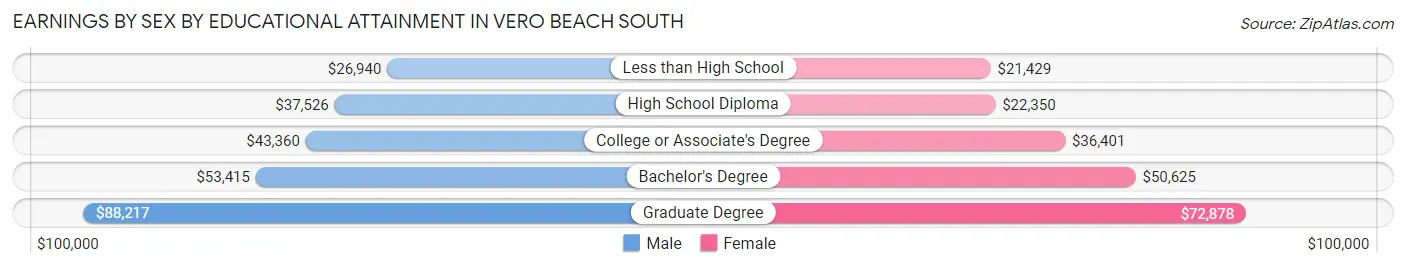
Earnings by Sex by Educational Attainment in Vero Beach South
Average earnings in Vero Beach South are $44,945 for men and $36,794 for women, a difference of 18.1%. Men with an educational attainment of graduate degree enjoy the highest average annual earnings of $88,217, while those with less than high school education earn the least with $26,940. Women with an educational attainment of graduate degree earn the most with the average annual earnings of $72,878, while those with less than high school education have the smallest earnings of $21,429.
| Educational Attainment | Male Income | Female Income |
| Less than High School | $26,940 | $21,429 |
| High School Diploma | $37,526 | $22,350 |
| College or Associate's Degree | $43,360 | $36,401 |
| Bachelor's Degree | $53,415 | $50,625 |
| Graduate Degree | $88,217 | $72,878 |
| Total | $44,945 | $36,794 |
Family Income in Vero Beach South
Family Income Brackets in Vero Beach South
According to the Vero Beach South family income data, there are 1,570 families falling into the $50,000 to $74,999 income range, which is the most common income bracket and makes up 21.2% of all families. Conversely, the $10,000 to $14,999 income bracket is the least frequent group with only 104 families (1.4%) belonging to this category.
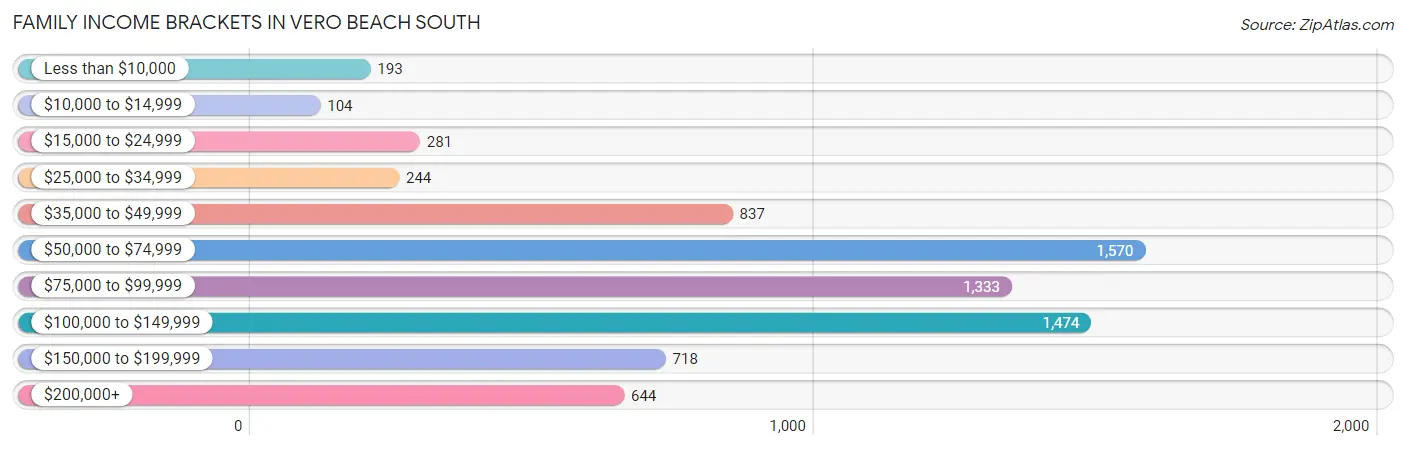
| Income Bracket | # Families | % Families |
| Less than $10,000 | 193 | 2.6% |
| $10,000 to $14,999 | 104 | 1.4% |
| $15,000 to $24,999 | 281 | 3.8% |
| $25,000 to $34,999 | 244 | 3.3% |
| $35,000 to $49,999 | 837 | 11.3% |
| $50,000 to $74,999 | 1,570 | 21.2% |
| $75,000 to $99,999 | 1,333 | 18.0% |
| $100,000 to $149,999 | 1,474 | 19.9% |
| $150,000 to $199,999 | 718 | 9.7% |
| $200,000+ | 644 | 8.7% |
Family Income by Famaliy Size in Vero Beach South
4-person families (956 | 12.9%) account for the highest median family income in Vero Beach South with $120,593 per family, while 2-person families (4,573 | 61.8%) have the highest median income of $36,238 per family member.
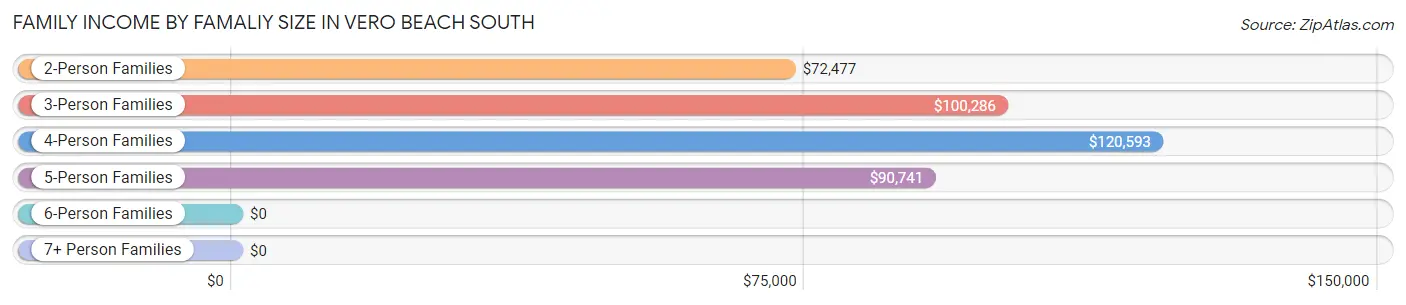
| Income Bracket | # Families | Median Income |
| 2-Person Families | 4,573 (61.8%) | $72,477 |
| 3-Person Families | 1,324 (17.9%) | $100,286 |
| 4-Person Families | 956 (12.9%) | $120,593 |
| 5-Person Families | 434 (5.9%) | $90,741 |
| 6-Person Families | 65 (0.9%) | $0 |
| 7+ Person Families | 54 (0.7%) | $0 |
| Total | 7,406 (100.0%) | $83,287 |
Family Income by Number of Earners in Vero Beach South
The median family income in Vero Beach South is $83,287, with families comprising 3+ earners (796) having the highest median family income of $150,987, while families with 1 earner (2,281) have the lowest median family income of $66,866, accounting for 10.7% and 30.8% of families, respectively.
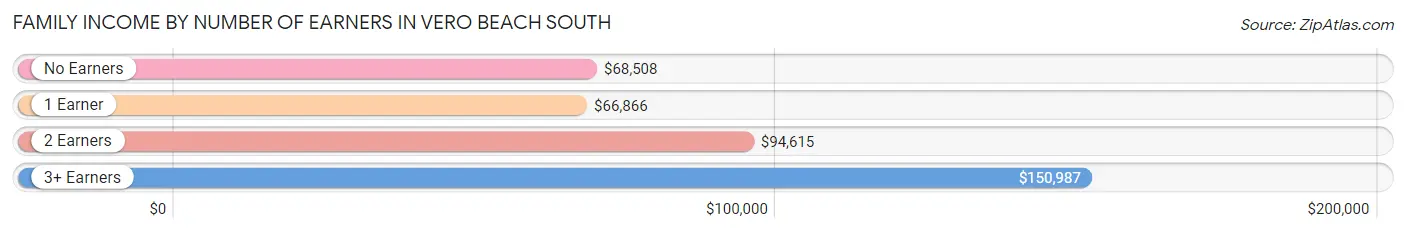
| Number of Earners | # Families | Median Income |
| No Earners | 1,753 (23.7%) | $68,508 |
| 1 Earner | 2,281 (30.8%) | $66,866 |
| 2 Earners | 2,576 (34.8%) | $94,615 |
| 3+ Earners | 796 (10.7%) | $150,987 |
| Total | 7,406 (100.0%) | $83,287 |
Household Income in Vero Beach South
Household Income Brackets in Vero Beach South
With 2,140 households falling in the category, the $50,000 to $74,999 income range is the most frequent in Vero Beach South, accounting for 18.5% of all households. In contrast, only 451 households (3.9%) fall into the $10,000 to $14,999 income bracket, making it the least populous group.
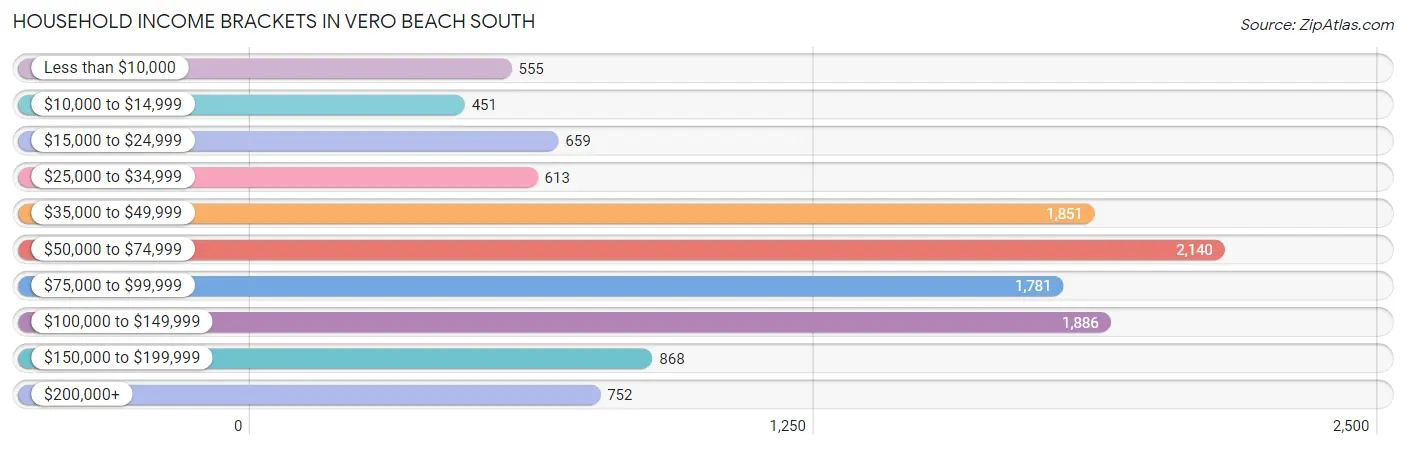
| Income Bracket | # Households | % Households |
| Less than $10,000 | 555 | 4.8% |
| $10,000 to $14,999 | 451 | 3.9% |
| $15,000 to $24,999 | 659 | 5.7% |
| $25,000 to $34,999 | 613 | 5.3% |
| $35,000 to $49,999 | 1,851 | 16.0% |
| $50,000 to $74,999 | 2,140 | 18.5% |
| $75,000 to $99,999 | 1,781 | 15.4% |
| $100,000 to $149,999 | 1,886 | 16.3% |
| $150,000 to $199,999 | 868 | 7.5% |
| $200,000+ | 752 | 6.5% |
Household Income by Householder Age in Vero Beach South
The median household income in Vero Beach South is $70,252, with the highest median household income of $80,917 found in the 45 to 64 years age bracket for the primary householder. A total of 4,172 households (36.1%) fall into this category. Meanwhile, the 15 to 24 years age bracket for the primary householder has the lowest median household income of $50,504, with 141 households (1.2%) in this group.
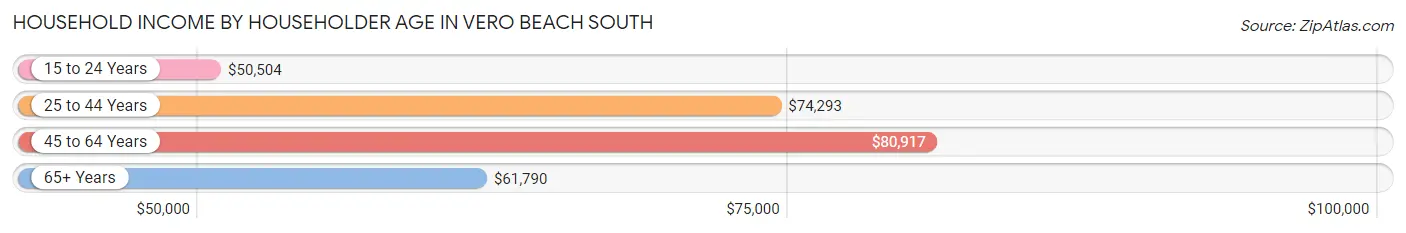
| Income Bracket | # Households | Median Income |
| 15 to 24 Years | 141 (1.2%) | $50,504 |
| 25 to 44 Years | 2,422 (20.9%) | $74,293 |
| 45 to 64 Years | 4,172 (36.1%) | $80,917 |
| 65+ Years | 4,833 (41.8%) | $61,790 |
| Total | 11,568 (100.0%) | $70,252 |
Poverty in Vero Beach South
Income Below Poverty by Sex and Age in Vero Beach South
With 9.9% poverty level for males and 8.0% for females among the residents of Vero Beach South, 6 to 11 year old males and 35 to 44 year old females are the most vulnerable to poverty, with 107 males (18.2%) and 239 females (13.6%) in their respective age groups living below the poverty level.
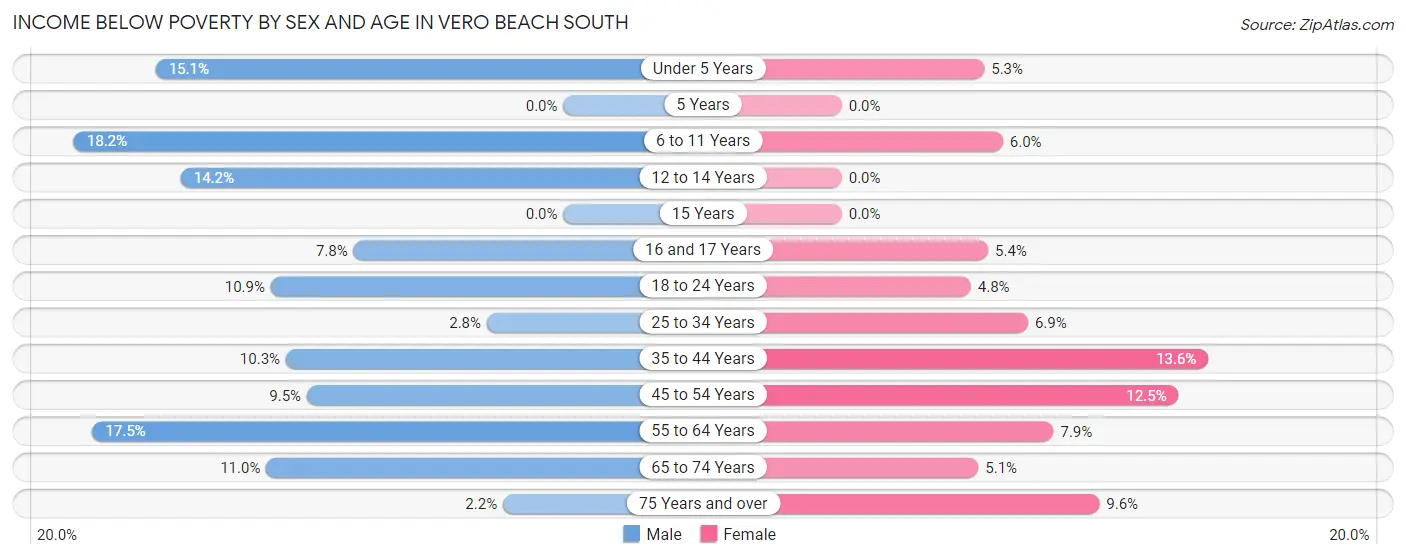
| Age Bracket | Male | Female |
| Under 5 Years | 102 (15.1%) | 20 (5.3%) |
| 5 Years | 0 (0.0%) | 0 (0.0%) |
| 6 to 11 Years | 107 (18.2%) | 54 (6.0%) |
| 12 to 14 Years | 72 (14.2%) | 0 (0.0%) |
| 15 Years | 0 (0.0%) | 0 (0.0%) |
| 16 and 17 Years | 36 (7.8%) | 14 (5.4%) |
| 18 to 24 Years | 115 (10.9%) | 43 (4.8%) |
| 25 to 34 Years | 54 (2.8%) | 110 (6.9%) |
| 35 to 44 Years | 177 (10.3%) | 239 (13.6%) |
| 45 to 54 Years | 165 (9.5%) | 215 (12.5%) |
| 55 to 64 Years | 322 (17.5%) | 215 (7.9%) |
| 65 to 74 Years | 234 (11.0%) | 129 (5.1%) |
| 75 Years and over | 36 (2.2%) | 202 (9.6%) |
| Total | 1,420 (9.9%) | 1,241 (8.0%) |
Income Above Poverty by Sex and Age in Vero Beach South
According to the poverty statistics in Vero Beach South, males aged 5 years and females aged 5 years are the age groups that are most secure financially, with 100.0% of males and 100.0% of females in these age groups living above the poverty line.
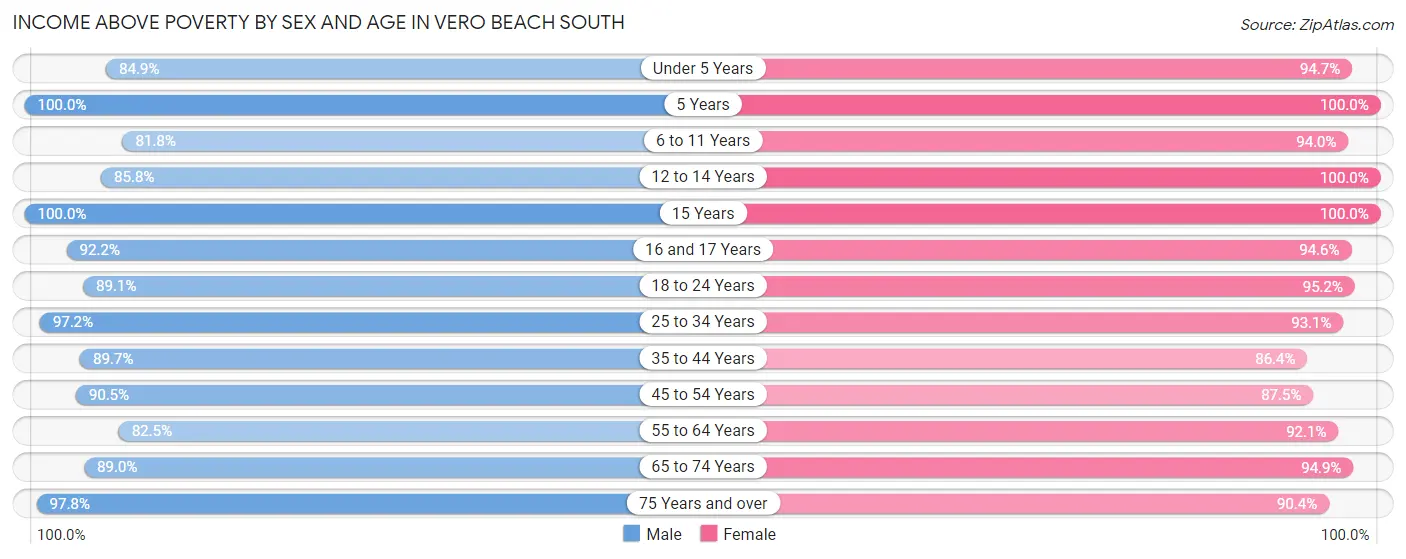
| Age Bracket | Male | Female |
| Under 5 Years | 572 (84.9%) | 358 (94.7%) |
| 5 Years | 187 (100.0%) | 270 (100.0%) |
| 6 to 11 Years | 482 (81.8%) | 849 (94.0%) |
| 12 to 14 Years | 435 (85.8%) | 297 (100.0%) |
| 15 Years | 13 (100.0%) | 53 (100.0%) |
| 16 and 17 Years | 426 (92.2%) | 244 (94.6%) |
| 18 to 24 Years | 944 (89.1%) | 855 (95.2%) |
| 25 to 34 Years | 1,849 (97.2%) | 1,481 (93.1%) |
| 35 to 44 Years | 1,542 (89.7%) | 1,518 (86.4%) |
| 45 to 54 Years | 1,569 (90.5%) | 1,505 (87.5%) |
| 55 to 64 Years | 1,520 (82.5%) | 2,520 (92.1%) |
| 65 to 74 Years | 1,887 (89.0%) | 2,414 (94.9%) |
| 75 Years and over | 1,573 (97.8%) | 1,912 (90.4%) |
| Total | 12,999 (90.1%) | 14,276 (92.0%) |
Income Below Poverty Among Married-Couple Families in Vero Beach South
The poverty statistics for married-couple families in Vero Beach South show that 2.6% or 156 of the total 5,892 families live below the poverty line. Families with 3 or 4 children have the highest poverty rate of 11.6%, comprising of 26 families. On the other hand, families with 1 or 2 children have the lowest poverty rate of 0.5%, which includes 6 families.
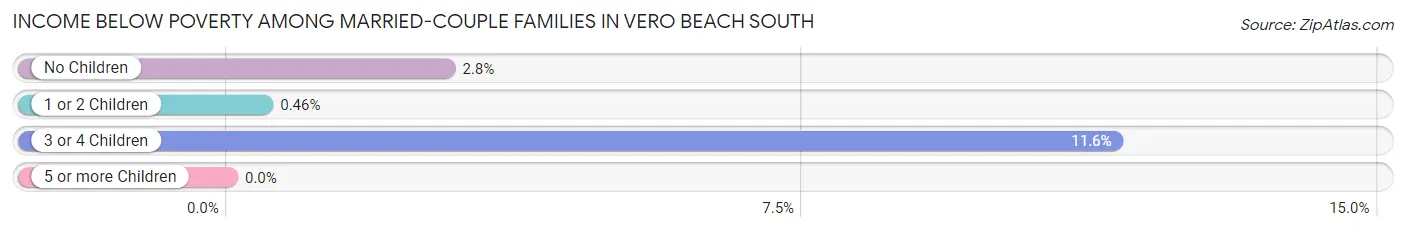
| Children | Above Poverty | Below Poverty |
| No Children | 4,235 (97.2%) | 124 (2.8%) |
| 1 or 2 Children | 1,302 (99.5%) | 6 (0.5%) |
| 3 or 4 Children | 199 (88.4%) | 26 (11.6%) |
| 5 or more Children | 0 (0.0%) | 0 (0.0%) |
| Total | 5,736 (97.4%) | 156 (2.6%) |
Income Below Poverty Among Single-Parent Households in Vero Beach South
According to the poverty data in Vero Beach South, 7.0% or 23 single-father households and 16.2% or 191 single-mother households are living below the poverty line. Among single-father households, those with 1 or 2 children have the highest poverty rate, with 23 households (11.6%) experiencing poverty. Likewise, among single-mother households, those with 3 or 4 children have the highest poverty rate, with 20 households (41.7%) falling below the poverty line.
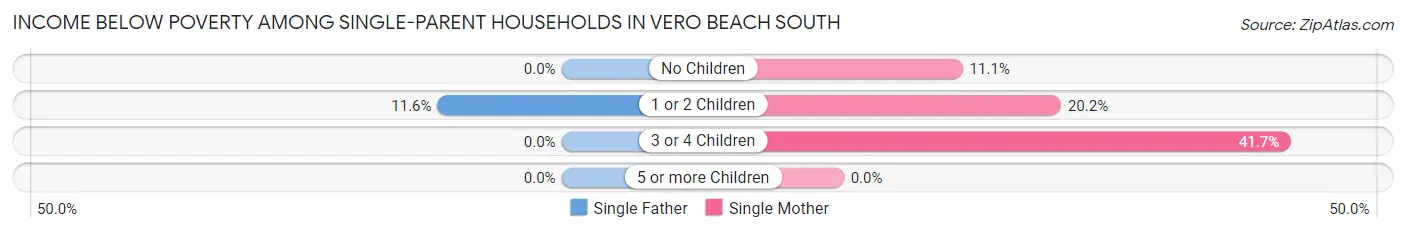
| Children | Single Father | Single Mother |
| No Children | 0 (0.0%) | 71 (11.1%) |
| 1 or 2 Children | 23 (11.6%) | 100 (20.2%) |
| 3 or 4 Children | 0 (0.0%) | 20 (41.7%) |
| 5 or more Children | 0 (0.0%) | 0 (0.0%) |
| Total | 23 (7.0%) | 191 (16.2%) |
Income Below Poverty Among Married-Couple vs Single-Parent Households in Vero Beach South
The poverty data for Vero Beach South shows that 156 of the married-couple family households (2.6%) and 214 of the single-parent households (14.1%) are living below the poverty level. Within the married-couple family households, those with 3 or 4 children have the highest poverty rate, with 26 households (11.6%) falling below the poverty line. Among the single-parent households, those with 3 or 4 children have the highest poverty rate, with 20 household (30.3%) living below poverty.
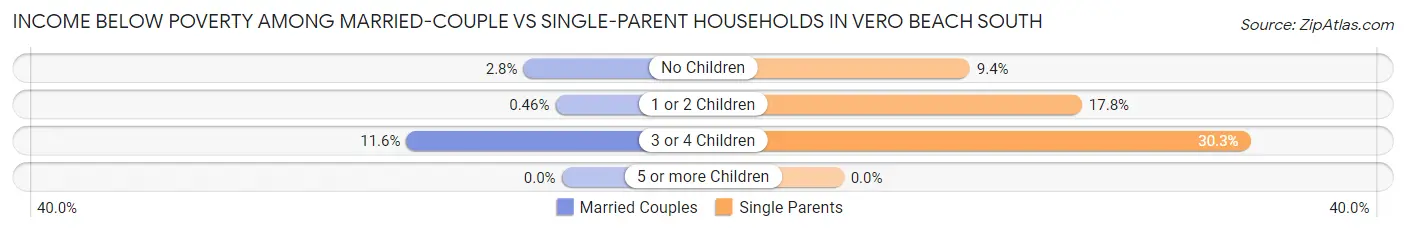
| Children | Married-Couple Families | Single-Parent Households |
| No Children | 124 (2.8%) | 71 (9.4%) |
| 1 or 2 Children | 6 (0.5%) | 123 (17.7%) |
| 3 or 4 Children | 26 (11.6%) | 20 (30.3%) |
| 5 or more Children | 0 (0.0%) | 0 (0.0%) |
| Total | 156 (2.6%) | 214 (14.1%) |
Race in Vero Beach South
The most populous races in Vero Beach South are White / Caucasian (24,418 | 81.5%), Hispanic or Latino (4,205 | 14.0%), and Two or more Races (2,455 | 8.2%).
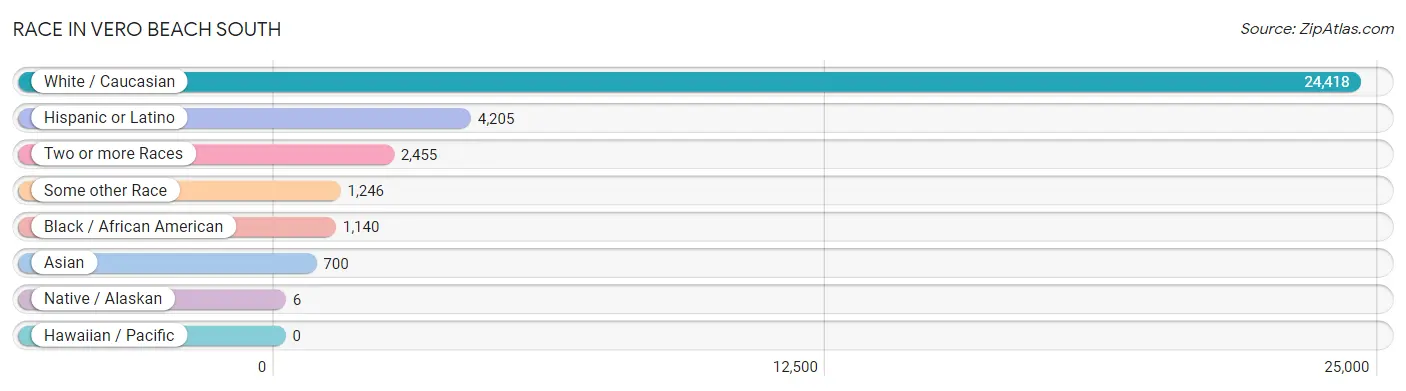
| Race | # Population | % Population |
| Asian | 700 | 2.3% |
| Black / African American | 1,140 | 3.8% |
| Hawaiian / Pacific | 0 | 0.0% |
| Hispanic or Latino | 4,205 | 14.0% |
| Native / Alaskan | 6 | 0.0% |
| White / Caucasian | 24,418 | 81.5% |
| Two or more Races | 2,455 | 8.2% |
| Some other Race | 1,246 | 4.2% |
| Total | 29,965 | 100.0% |
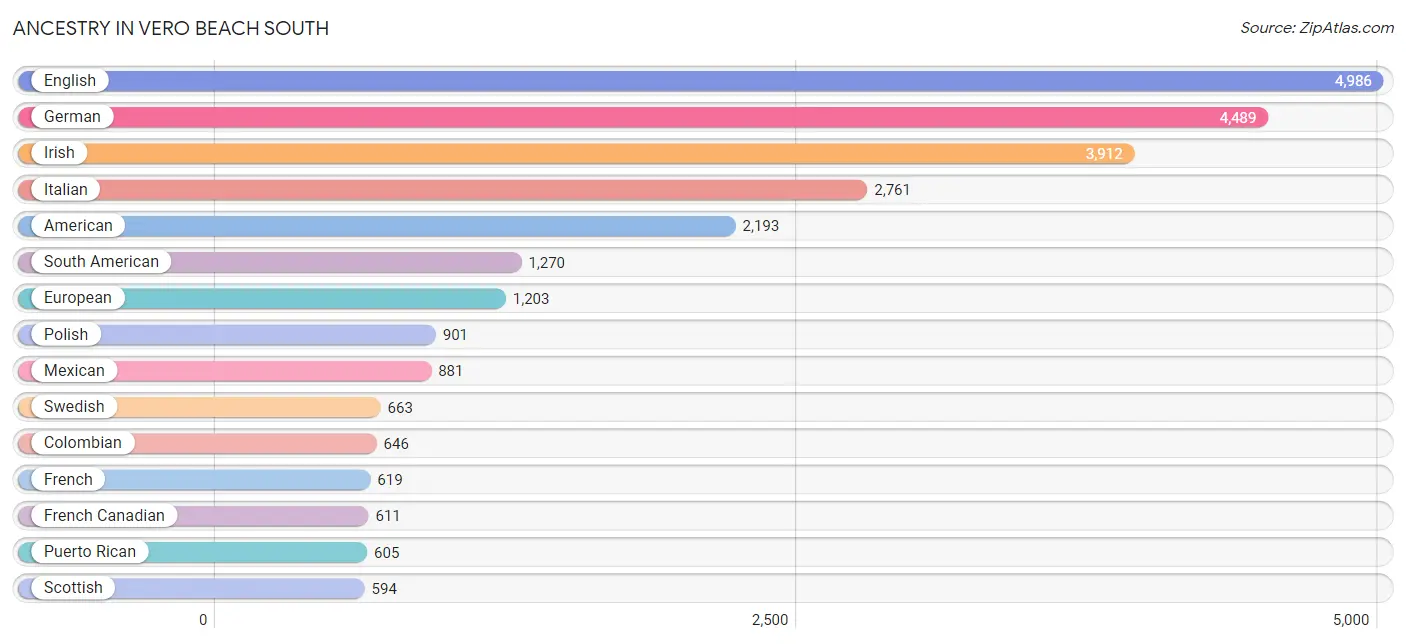
Ancestry in Vero Beach South
The most populous ancestries reported in Vero Beach South are English (4,986 | 16.6%), German (4,489 | 15.0%), Irish (3,912 | 13.1%), Italian (2,761 | 9.2%), and American (2,193 | 7.3%), together accounting for 61.2% of all Vero Beach South residents.
| Ancestry | # Population | % Population |
| African | 20 | 0.1% |
| Albanian | 58 | 0.2% |
| American | 2,193 | 7.3% |
| Arab | 58 | 0.2% |
| Argentinean | 5 | 0.0% |
| Armenian | 24 | 0.1% |
| Austrian | 103 | 0.3% |
| Belgian | 8 | 0.0% |
| Bhutanese | 78 | 0.3% |
| Brazilian | 366 | 1.2% |
| British | 225 | 0.7% |
| Canadian | 69 | 0.2% |
| Cape Verdean | 19 | 0.1% |
| Celtic | 19 | 0.1% |
| Central American | 411 | 1.4% |
| Cherokee | 15 | 0.1% |
| Chilean | 72 | 0.2% |
| Colombian | 646 | 2.2% |
| Costa Rican | 79 | 0.3% |
| Croatian | 21 | 0.1% |
| Cuban | 506 | 1.7% |
| Czech | 173 | 0.6% |
| Czechoslovakian | 29 | 0.1% |
| Danish | 56 | 0.2% |
| Dominican | 34 | 0.1% |
| Dutch | 335 | 1.1% |
| Eastern European | 112 | 0.4% |
| Ecuadorian | 27 | 0.1% |
| English | 4,986 | 16.6% |
| European | 1,203 | 4.0% |
| Finnish | 47 | 0.2% |
| French | 619 | 2.1% |
| French Canadian | 611 | 2.0% |
| German | 4,489 | 15.0% |
| Greek | 234 | 0.8% |
| Haitian | 169 | 0.6% |
| Hungarian | 117 | 0.4% |
| Indian (Asian) | 275 | 0.9% |
| Irish | 3,912 | 13.1% |
| Israeli | 43 | 0.1% |
| Italian | 2,761 | 9.2% |
| Jamaican | 104 | 0.4% |
| Korean | 170 | 0.6% |
| Lebanese | 25 | 0.1% |
| Lithuanian | 51 | 0.2% |
| Mexican | 881 | 2.9% |
| Nicaraguan | 162 | 0.5% |
| Northern European | 143 | 0.5% |
| Norwegian | 99 | 0.3% |
| Pakistani | 56 | 0.2% |
| Panamanian | 170 | 0.6% |
| Pennsylvania German | 7 | 0.0% |
| Peruvian | 54 | 0.2% |
| Polish | 901 | 3.0% |
| Portuguese | 105 | 0.4% |
| Puerto Rican | 605 | 2.0% |
| Romanian | 20 | 0.1% |
| Russian | 374 | 1.3% |
| Scandinavian | 69 | 0.2% |
| Scotch-Irish | 263 | 0.9% |
| Scottish | 594 | 2.0% |
| Slovak | 43 | 0.1% |
| Slovene | 15 | 0.1% |
| South American | 1,270 | 4.2% |
| South American Indian | 10 | 0.0% |
| Spaniard | 47 | 0.2% |
| Spanish | 337 | 1.1% |
| Sri Lankan | 357 | 1.2% |
| Subsaharan African | 39 | 0.1% |
| Swedish | 663 | 2.2% |
| Swiss | 38 | 0.1% |
| Syrian | 27 | 0.1% |
| Thai | 73 | 0.2% |
| Ukrainian | 106 | 0.4% |
| Uruguayan | 64 | 0.2% |
| Venezuelan | 305 | 1.0% |
| Welsh | 26 | 0.1% |
| West Indian | 28 | 0.1% | View All 78 Rows |
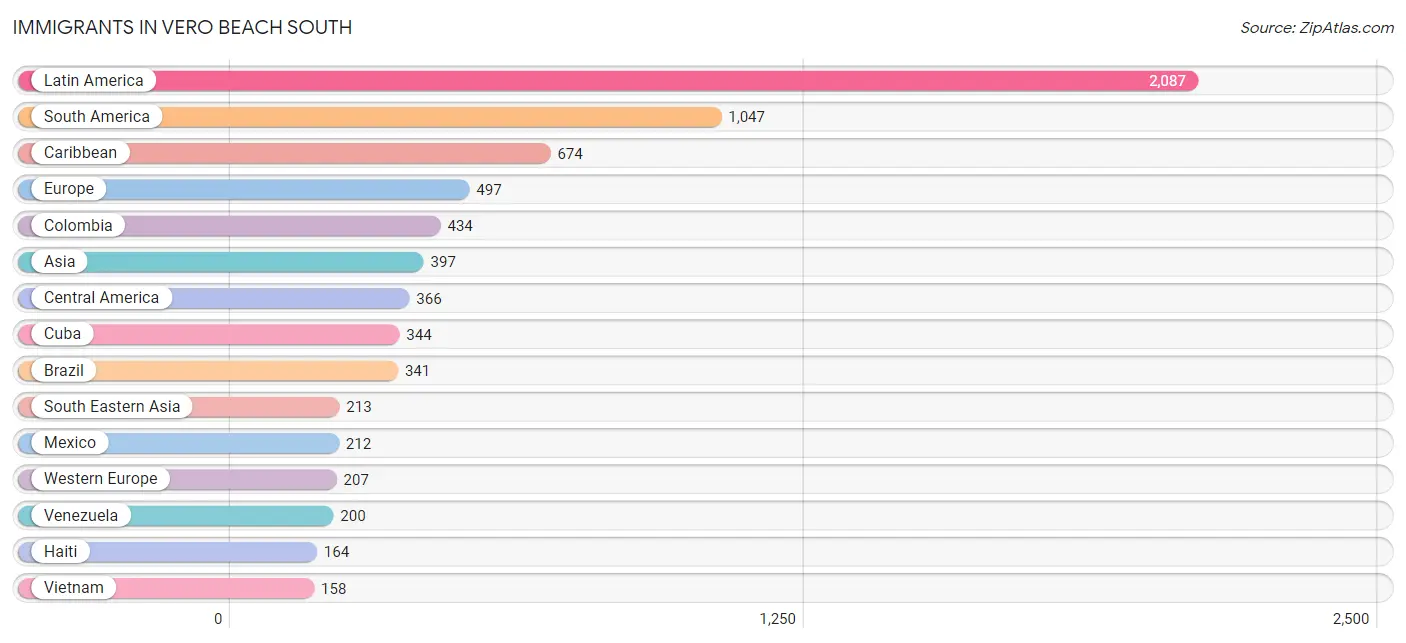
Immigrants in Vero Beach South
The most numerous immigrant groups reported in Vero Beach South came from Latin America (2,087 | 7.0%), South America (1,047 | 3.5%), Caribbean (674 | 2.2%), Europe (497 | 1.7%), and Colombia (434 | 1.5%), together accounting for 15.8% of all Vero Beach South residents.
| Immigration Origin | # Population | % Population |
| Africa | 40 | 0.1% |
| Asia | 397 | 1.3% |
| Austria | 55 | 0.2% |
| Brazil | 341 | 1.1% |
| Canada | 78 | 0.3% |
| Caribbean | 674 | 2.2% |
| Central America | 366 | 1.2% |
| Chile | 39 | 0.1% |
| China | 71 | 0.2% |
| Colombia | 434 | 1.5% |
| Cuba | 344 | 1.1% |
| Denmark | 22 | 0.1% |
| Dominican Republic | 23 | 0.1% |
| Eastern Africa | 29 | 0.1% |
| Eastern Asia | 107 | 0.4% |
| Eastern Europe | 99 | 0.3% |
| Egypt | 6 | 0.0% |
| England | 31 | 0.1% |
| Europe | 497 | 1.7% |
| France | 26 | 0.1% |
| Germany | 44 | 0.2% |
| Haiti | 164 | 0.5% |
| Hungary | 46 | 0.2% |
| India | 26 | 0.1% |
| Ireland | 32 | 0.1% |
| Israel | 51 | 0.2% |
| Italy | 48 | 0.2% |
| Jamaica | 104 | 0.4% |
| Japan | 36 | 0.1% |
| Latin America | 2,087 | 7.0% |
| Mexico | 212 | 0.7% |
| Netherlands | 82 | 0.3% |
| Nicaragua | 126 | 0.4% |
| Northern Africa | 11 | 0.0% |
| Northern Europe | 143 | 0.5% |
| Panama | 28 | 0.1% |
| Peru | 33 | 0.1% |
| Philippines | 28 | 0.1% |
| Poland | 26 | 0.1% |
| Russia | 17 | 0.1% |
| South America | 1,047 | 3.5% |
| South Central Asia | 26 | 0.1% |
| South Eastern Asia | 213 | 0.7% |
| Southern Europe | 48 | 0.2% |
| St. Vincent and the Grenadines | 39 | 0.1% |
| Sweden | 27 | 0.1% |
| Taiwan | 16 | 0.1% |
| Thailand | 27 | 0.1% |
| Ukraine | 10 | 0.0% |
| Venezuela | 200 | 0.7% |
| Vietnam | 158 | 0.5% |
| Western Asia | 51 | 0.2% |
| Western Europe | 207 | 0.7% |
| Zimbabwe | 29 | 0.1% | View All 54 Rows |
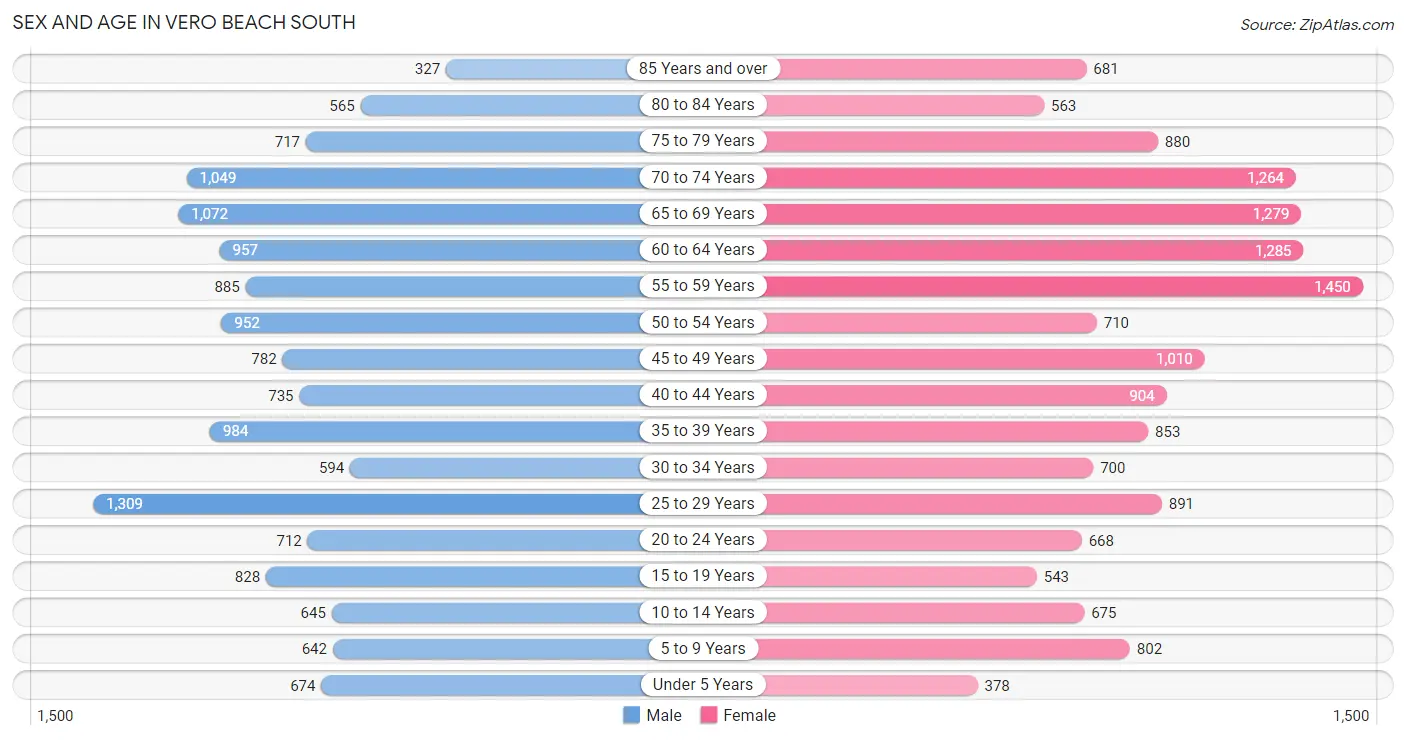
Sex and Age in Vero Beach South
Sex and Age in Vero Beach South
The most populous age groups in Vero Beach South are 25 to 29 Years (1,309 | 9.1%) for men and 55 to 59 Years (1,450 | 9.3%) for women.
| Age Bracket | Male | Female |
| Under 5 Years | 674 (4.7%) | 378 (2.4%) |
| 5 to 9 Years | 642 (4.4%) | 802 (5.2%) |
| 10 to 14 Years | 645 (4.5%) | 675 (4.3%) |
| 15 to 19 Years | 828 (5.7%) | 543 (3.5%) |
| 20 to 24 Years | 712 (4.9%) | 668 (4.3%) |
| 25 to 29 Years | 1,309 (9.1%) | 891 (5.7%) |
| 30 to 34 Years | 594 (4.1%) | 700 (4.5%) |
| 35 to 39 Years | 984 (6.8%) | 853 (5.5%) |
| 40 to 44 Years | 735 (5.1%) | 904 (5.8%) |
| 45 to 49 Years | 782 (5.4%) | 1,010 (6.5%) |
| 50 to 54 Years | 952 (6.6%) | 710 (4.6%) |
| 55 to 59 Years | 885 (6.1%) | 1,450 (9.3%) |
| 60 to 64 Years | 957 (6.6%) | 1,285 (8.3%) |
| 65 to 69 Years | 1,072 (7.4%) | 1,279 (8.2%) |
| 70 to 74 Years | 1,049 (7.3%) | 1,264 (8.1%) |
| 75 to 79 Years | 717 (5.0%) | 880 (5.7%) |
| 80 to 84 Years | 565 (3.9%) | 563 (3.6%) |
| 85 Years and over | 327 (2.3%) | 681 (4.4%) |
| Total | 14,429 (100.0%) | 15,536 (100.0%) |
Families and Households in Vero Beach South
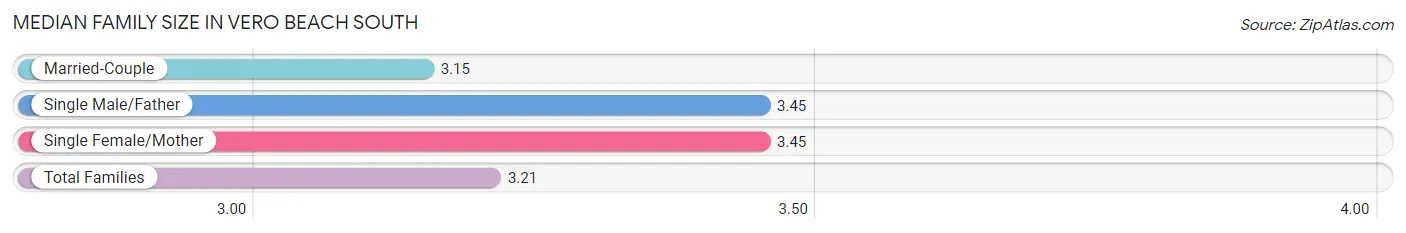
Median Family Size in Vero Beach South
The median family size in Vero Beach South is 3.21 persons per family, with single male/father families (331 | 4.5%) accounting for the largest median family size of 3.45 persons per family. On the other hand, married-couple families (5,892 | 79.6%) represent the smallest median family size with 3.15 persons per family.
| Family Type | # Families | Family Size |
| Married-Couple | 5,892 (79.6%) | 3.15 |
| Single Male/Father | 331 (4.5%) | 3.45 |
| Single Female/Mother | 1,183 (16.0%) | 3.45 |
| Total Families | 7,406 (100.0%) | 3.21 |
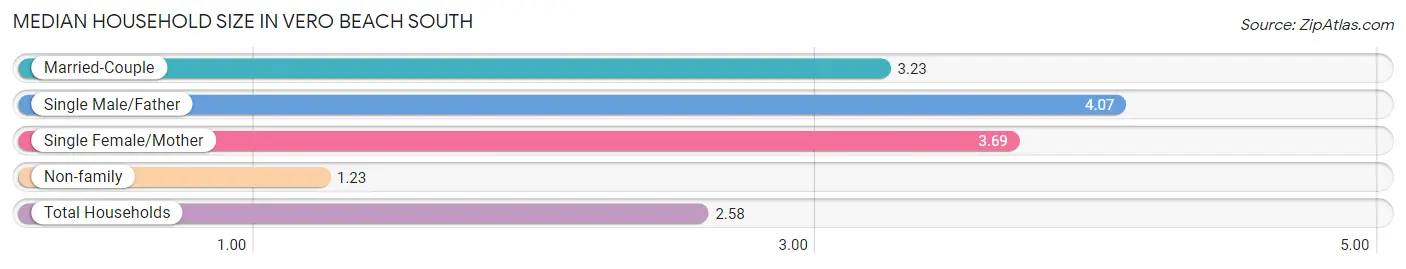
Median Household Size in Vero Beach South
The median household size in Vero Beach South is 2.58 persons per household, with single male/father households (331 | 2.9%) accounting for the largest median household size of 4.07 persons per household. non-family households (4,162 | 36.0%) represent the smallest median household size with 1.23 persons per household.
| Household Type | # Households | Household Size |
| Married-Couple | 5,892 (50.9%) | 3.23 |
| Single Male/Father | 331 (2.9%) | 4.07 |
| Single Female/Mother | 1,183 (10.2%) | 3.69 |
| Non-family | 4,162 (36.0%) | 1.23 |
| Total Households | 11,568 (100.0%) | 2.58 |
Household Size by Marriage Status in Vero Beach South
Out of a total of 11,568 households in Vero Beach South, 7,406 (64.0%) are family households, while 4,162 (36.0%) are nonfamily households. The most numerous type of family households are 2-person households, comprising 4,108, and the most common type of nonfamily households are 1-person households, comprising 3,641.
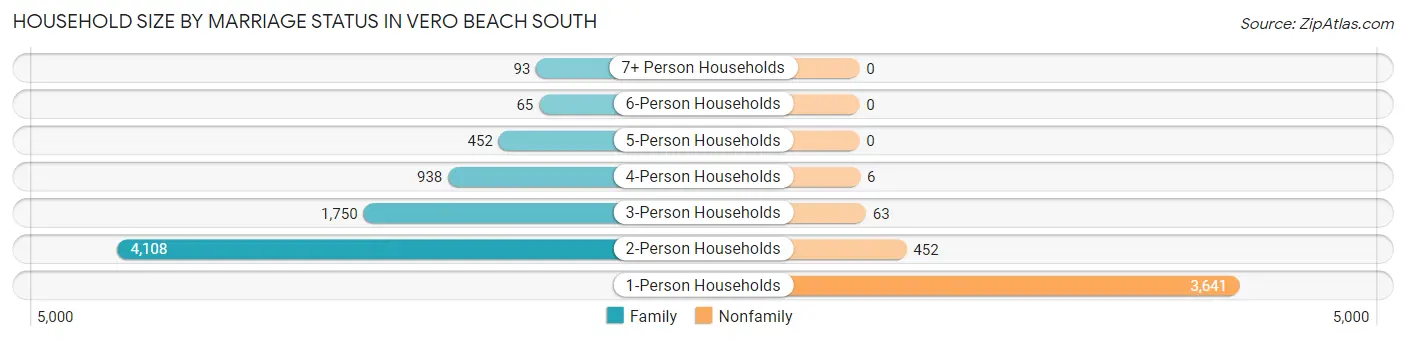
| Household Size | Family Households | Nonfamily Households |
| 1-Person Households | - | 3,641 (31.5%) |
| 2-Person Households | 4,108 (35.5%) | 452 (3.9%) |
| 3-Person Households | 1,750 (15.1%) | 63 (0.5%) |
| 4-Person Households | 938 (8.1%) | 6 (0.1%) |
| 5-Person Households | 452 (3.9%) | 0 (0.0%) |
| 6-Person Households | 65 (0.6%) | 0 (0.0%) |
| 7+ Person Households | 93 (0.8%) | 0 (0.0%) |
| Total | 7,406 (64.0%) | 4,162 (36.0%) |
Female Fertility in Vero Beach South
Fertility by Age in Vero Beach South
Average fertility rate in Vero Beach South is 60.0 births per 1,000 women. Women in the age bracket of 20 to 34 years have the highest fertility rate with 71.0 births per 1,000 women. Women in the age bracket of 35 to 50 years acount for 53.3% of all women with births.
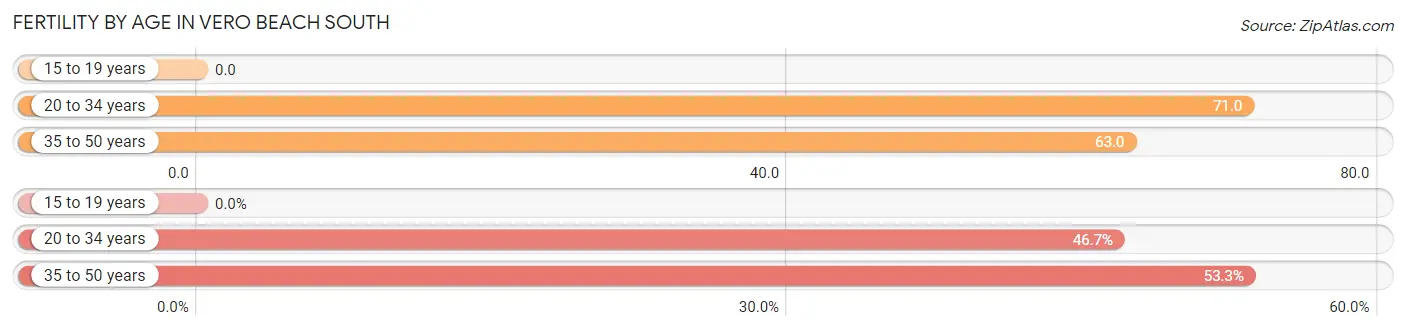
| Age Bracket | Women with Births | Births / 1,000 Women |
| 15 to 19 years | 0 (0.0%) | 0.0 |
| 20 to 34 years | 161 (46.7%) | 71.0 |
| 35 to 50 years | 184 (53.3%) | 63.0 |
| Total | 345 (100.0%) | 60.0 |
Fertility by Age by Marriage Status in Vero Beach South
87.8% of women with births (345) in Vero Beach South are married. The highest percentage of unmarried women with births falls into 35 to 50 years age bracket with 12.5% of them unmarried at the time of birth, while the lowest percentage of unmarried women with births belong to 20 to 34 years age bracket with 11.8% of them unmarried.
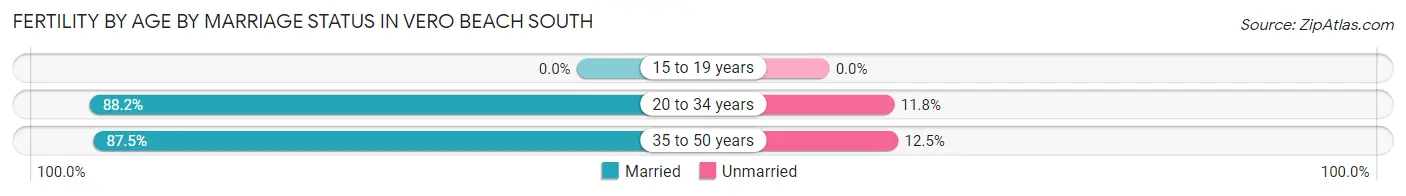
| Age Bracket | Married | Unmarried |
| 15 to 19 years | 0 (0.0%) | 0 (0.0%) |
| 20 to 34 years | 142 (88.2%) | 19 (11.8%) |
| 35 to 50 years | 161 (87.5%) | 23 (12.5%) |
| Total | 303 (87.8%) | 42 (12.2%) |
Fertility by Education in Vero Beach South
Average fertility rate in Vero Beach South is 60.0 births per 1,000 women. Women with the education attainment of graduate degree have the highest fertility rate of 96.0 births per 1,000 women, while women with the education attainment of less than high school have the lowest fertility at 36.0 births per 1,000 women. Women with the education attainment of college or associate's degree represent 42.0% of all women with births.
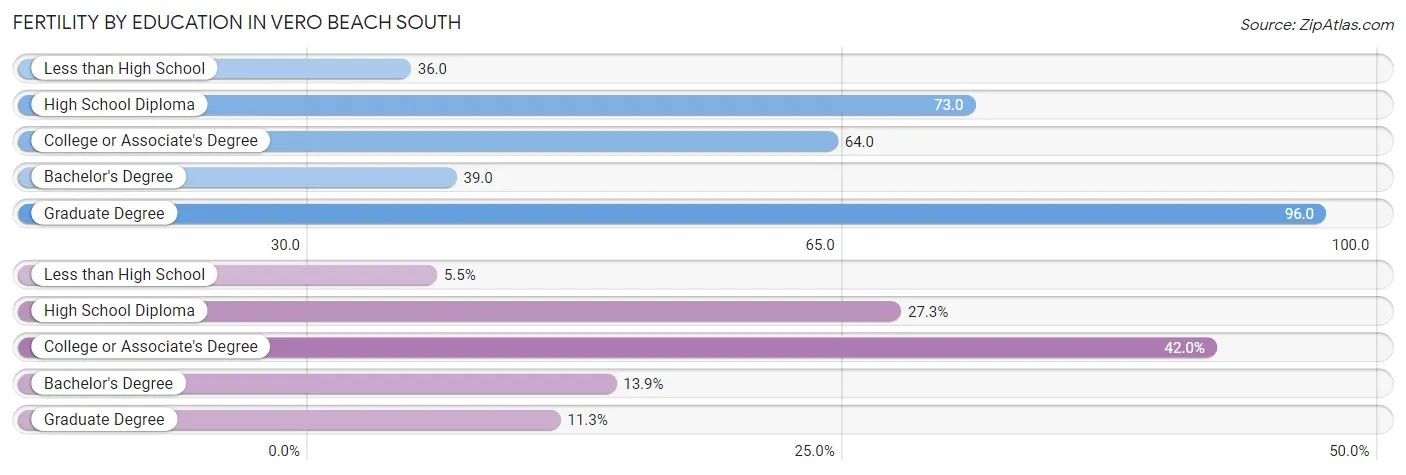
| Educational Attainment | Women with Births | Births / 1,000 Women |
| Less than High School | 19 (5.5%) | 36.0 |
| High School Diploma | 94 (27.3%) | 73.0 |
| College or Associate's Degree | 145 (42.0%) | 64.0 |
| Bachelor's Degree | 48 (13.9%) | 39.0 |
| Graduate Degree | 39 (11.3%) | 96.0 |
| Total | 345 (100.0%) | 60.0 |
Fertility by Education by Marriage Status in Vero Beach South
12.2% of women with births in Vero Beach South are unmarried. Women with the educational attainment of college or associate's degree are most likely to be married with 100.0% of them married at childbirth, while women with the educational attainment of less than high school are least likely to be married with 100.0% of them unmarried at childbirth.
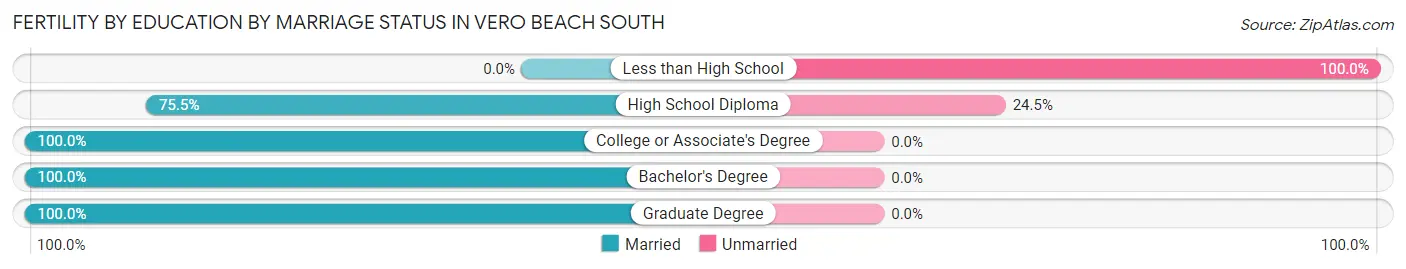
| Educational Attainment | Married | Unmarried |
| Less than High School | 0 (0.0%) | 19 (100.0%) |
| High School Diploma | 71 (75.5%) | 23 (24.5%) |
| College or Associate's Degree | 145 (100.0%) | 0 (0.0%) |
| Bachelor's Degree | 48 (100.0%) | 0 (0.0%) |
| Graduate Degree | 39 (100.0%) | 0 (0.0%) |
| Total | 303 (87.8%) | 42 (12.2%) |
Employment Characteristics in Vero Beach South
Employment by Class of Employer in Vero Beach South
Among the 13,226 employed individuals in Vero Beach South, private company employees (9,203 | 69.6%), not-for-profit organizations (1,068 | 8.1%), and self-employed (not incorporated) (893 | 6.8%) make up the most common classes of employment.
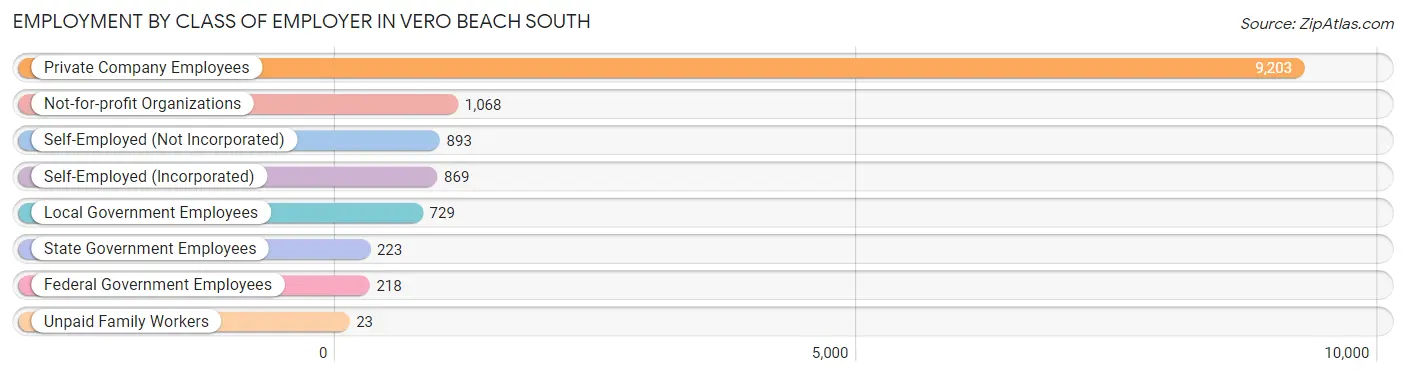
| Employer Class | # Employees | % Employees |
| Private Company Employees | 9,203 | 69.6% |
| Self-Employed (Incorporated) | 869 | 6.6% |
| Self-Employed (Not Incorporated) | 893 | 6.8% |
| Not-for-profit Organizations | 1,068 | 8.1% |
| Local Government Employees | 729 | 5.5% |
| State Government Employees | 223 | 1.7% |
| Federal Government Employees | 218 | 1.7% |
| Unpaid Family Workers | 23 | 0.2% |
| Total | 13,226 | 100.0% |
Employment Status by Age in Vero Beach South
According to the labor force statistics for Vero Beach South, out of the total population over 16 years of age (26,083), 55.7% or 14,528 individuals are in the labor force, with 4.6% or 668 of them unemployed. The age group with the highest labor force participation rate is 30 to 34 years, with 92.3% or 1,194 individuals in the labor force. Within the labor force, the 20 to 24 years age range has the highest percentage of unemployed individuals, with 19.9% or 238 of them being unemployed.
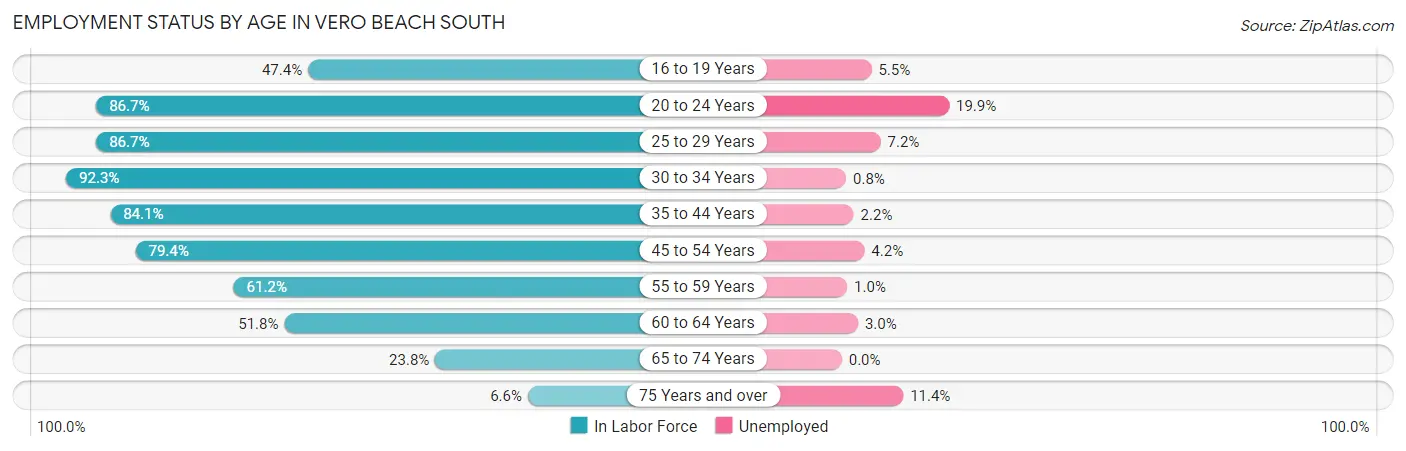
| Age Bracket | In Labor Force | Unemployed |
| 16 to 19 Years | 619 (47.4%) | 34 (5.5%) |
| 20 to 24 Years | 1,196 (86.7%) | 238 (19.9%) |
| 25 to 29 Years | 1,907 (86.7%) | 137 (7.2%) |
| 30 to 34 Years | 1,194 (92.3%) | 10 (0.8%) |
| 35 to 44 Years | 2,923 (84.1%) | 64 (2.2%) |
| 45 to 54 Years | 2,742 (79.4%) | 115 (4.2%) |
| 55 to 59 Years | 1,429 (61.2%) | 14 (1.0%) |
| 60 to 64 Years | 1,161 (51.8%) | 35 (3.0%) |
| 65 to 74 Years | 1,110 (23.8%) | 0 (0.0%) |
| 75 Years and over | 246 (6.6%) | 28 (11.4%) |
| Total | 14,528 (55.7%) | 668 (4.6%) |
Employment Status by Educational Attainment in Vero Beach South
According to labor force statistics for Vero Beach South, 75.7% of individuals (11,356) out of the total population between 25 and 64 years of age (15,001) are in the labor force, with 3.3% or 375 of them being unemployed. The group with the highest labor force participation rate are those with the educational attainment of bachelor's degree or higher, with 80.3% or 3,548 individuals in the labor force. Within the labor force, individuals with high school diploma education have the highest percentage of unemployment, with 4.1% or 124 of them being unemployed.
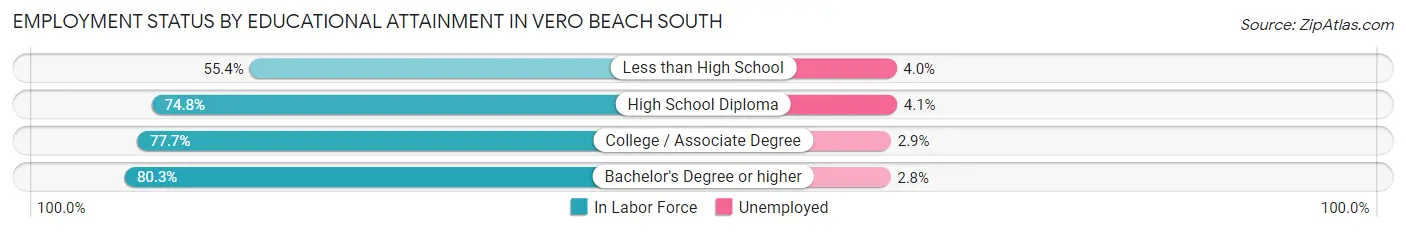
| Educational Attainment | In Labor Force | Unemployed |
| Less than High School | 730 (55.4%) | 53 (4.0%) |
| High School Diploma | 3,021 (74.8%) | 166 (4.1%) |
| College / Associate Degree | 4,061 (77.7%) | 152 (2.9%) |
| Bachelor's Degree or higher | 3,548 (80.3%) | 124 (2.8%) |
| Total | 11,356 (75.7%) | 495 (3.3%) |
Employment Occupations by Sex in Vero Beach South
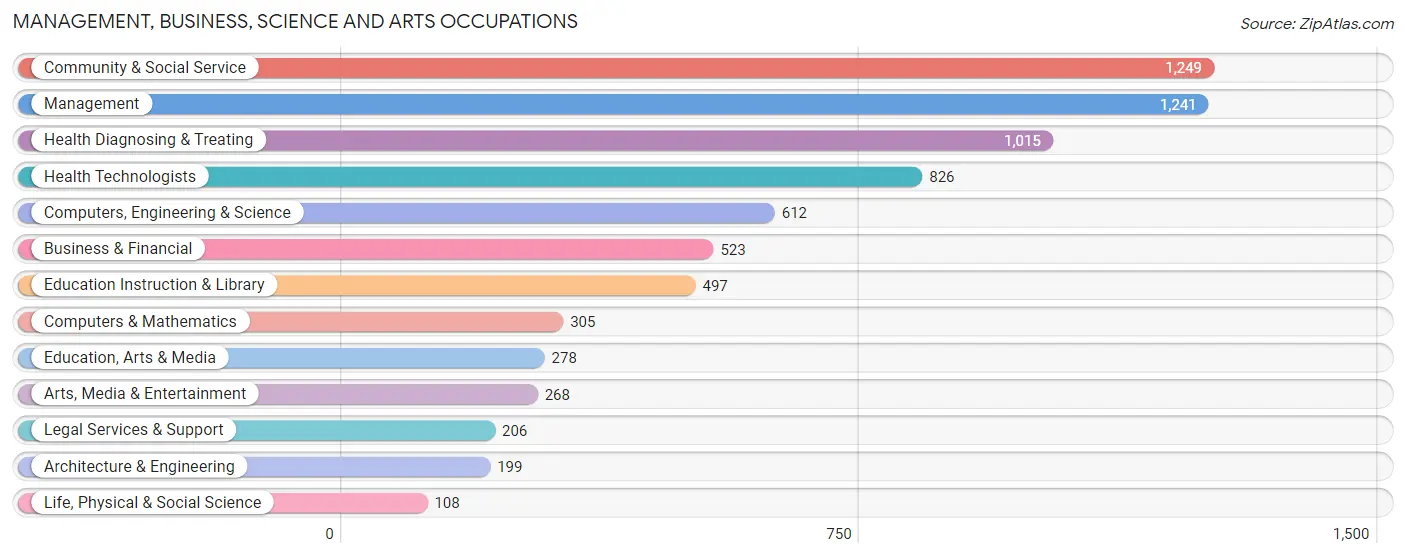
Management, Business, Science and Arts Occupations
The most common Management, Business, Science and Arts occupations in Vero Beach South are Community & Social Service (1,249 | 9.0%), Management (1,241 | 9.0%), Health Diagnosing & Treating (1,015 | 7.3%), Health Technologists (826 | 6.0%), and Computers, Engineering & Science (612 | 4.4%).
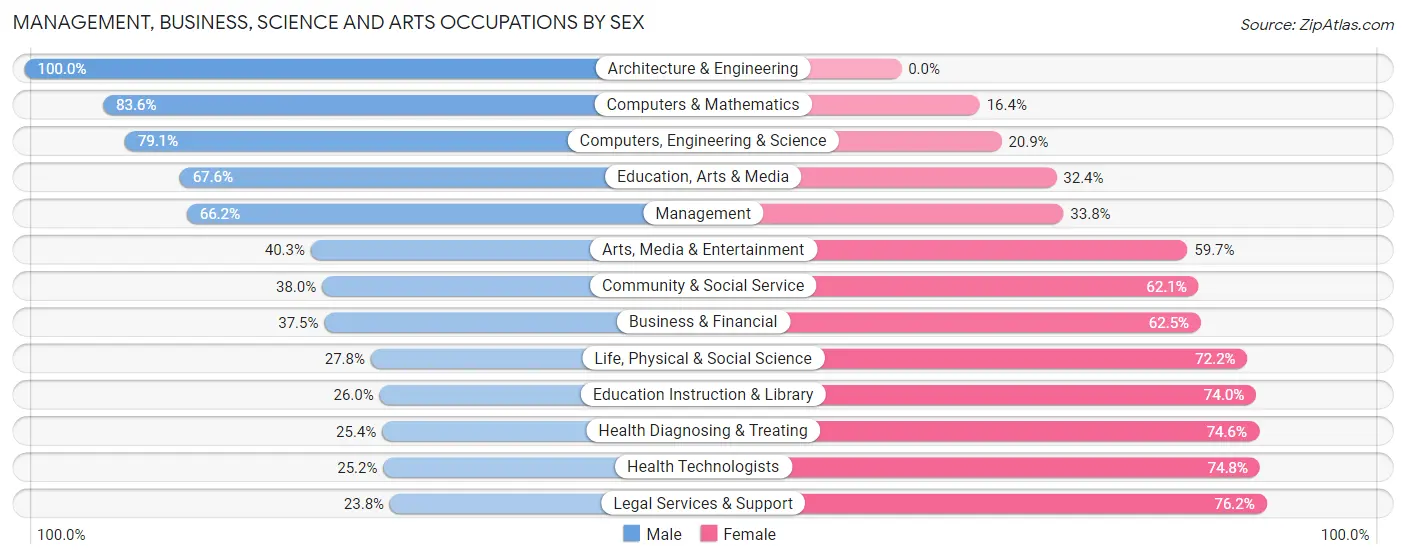
Management, Business, Science and Arts Occupations by Sex
Within the Management, Business, Science and Arts occupations in Vero Beach South, the most male-oriented occupations are Architecture & Engineering (100.0%), Computers & Mathematics (83.6%), and Computers, Engineering & Science (79.1%), while the most female-oriented occupations are Legal Services & Support (76.2%), Health Technologists (74.8%), and Health Diagnosing & Treating (74.6%).
| Occupation | Male | Female |
| Management | 821 (66.2%) | 420 (33.8%) |
| Business & Financial | 196 (37.5%) | 327 (62.5%) |
| Computers, Engineering & Science | 484 (79.1%) | 128 (20.9%) |
| Computers & Mathematics | 255 (83.6%) | 50 (16.4%) |
| Architecture & Engineering | 199 (100.0%) | 0 (0.0%) |
| Life, Physical & Social Science | 30 (27.8%) | 78 (72.2%) |
| Community & Social Service | 474 (38.0%) | 775 (62.1%) |
| Education, Arts & Media | 188 (67.6%) | 90 (32.4%) |
| Legal Services & Support | 49 (23.8%) | 157 (76.2%) |
| Education Instruction & Library | 129 (26.0%) | 368 (74.0%) |
| Arts, Media & Entertainment | 108 (40.3%) | 160 (59.7%) |
| Health Diagnosing & Treating | 258 (25.4%) | 757 (74.6%) |
| Health Technologists | 208 (25.2%) | 618 (74.8%) |
| Total (Category) | 2,233 (48.1%) | 2,407 (51.9%) |
| Total (Overall) | 7,005 (50.6%) | 6,850 (49.4%) |
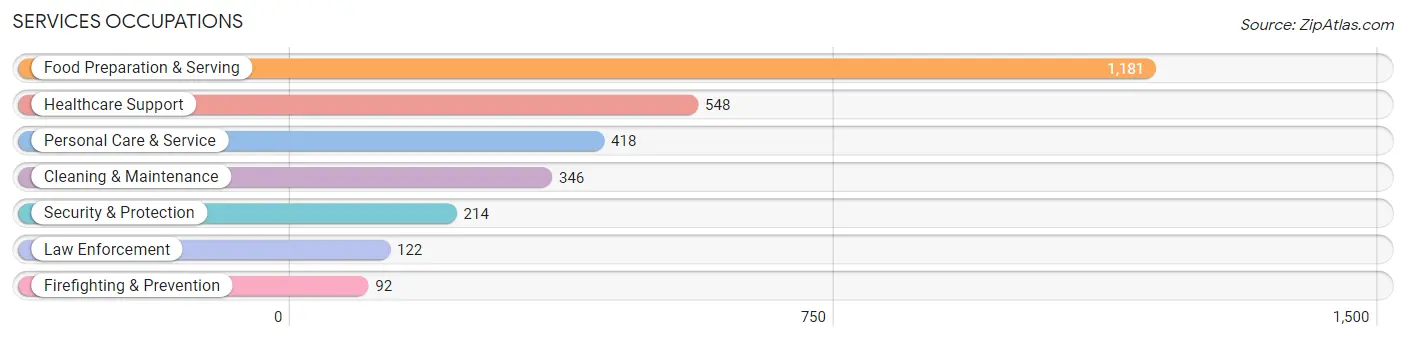
Services Occupations
The most common Services occupations in Vero Beach South are Food Preparation & Serving (1,181 | 8.5%), Healthcare Support (548 | 4.0%), Personal Care & Service (418 | 3.0%), Cleaning & Maintenance (346 | 2.5%), and Security & Protection (214 | 1.5%).
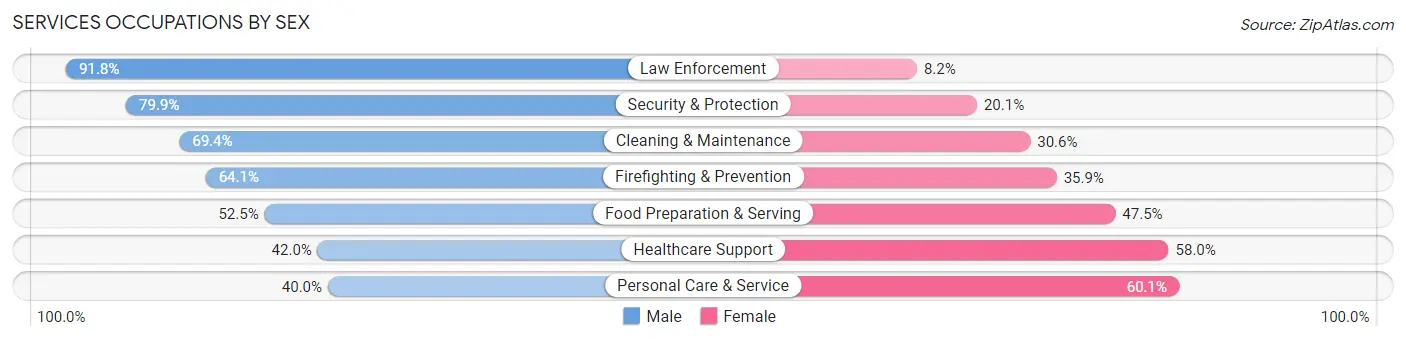
Services Occupations by Sex
Within the Services occupations in Vero Beach South, the most male-oriented occupations are Law Enforcement (91.8%), Security & Protection (79.9%), and Cleaning & Maintenance (69.4%), while the most female-oriented occupations are Personal Care & Service (60.1%), Healthcare Support (58.0%), and Food Preparation & Serving (47.5%).
| Occupation | Male | Female |
| Healthcare Support | 230 (42.0%) | 318 (58.0%) |
| Security & Protection | 171 (79.9%) | 43 (20.1%) |
| Firefighting & Prevention | 59 (64.1%) | 33 (35.9%) |
| Law Enforcement | 112 (91.8%) | 10 (8.2%) |
| Food Preparation & Serving | 620 (52.5%) | 561 (47.5%) |
| Cleaning & Maintenance | 240 (69.4%) | 106 (30.6%) |
| Personal Care & Service | 167 (40.0%) | 251 (60.1%) |
| Total (Category) | 1,428 (52.7%) | 1,279 (47.2%) |
| Total (Overall) | 7,005 (50.6%) | 6,850 (49.4%) |
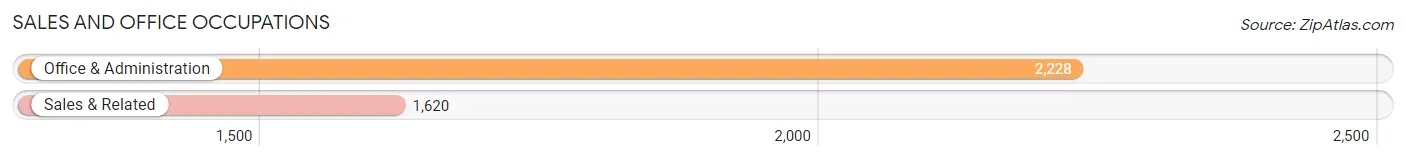
Sales and Office Occupations
The most common Sales and Office occupations in Vero Beach South are Office & Administration (2,228 | 16.1%), and Sales & Related (1,620 | 11.7%).
Sales and Office Occupations by Sex
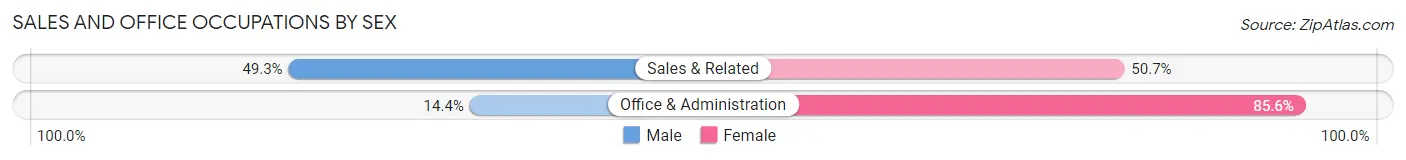
| Occupation | Male | Female |
| Sales & Related | 798 (49.3%) | 822 (50.7%) |
| Office & Administration | 321 (14.4%) | 1,907 (85.6%) |
| Total (Category) | 1,119 (29.1%) | 2,729 (70.9%) |
| Total (Overall) | 7,005 (50.6%) | 6,850 (49.4%) |
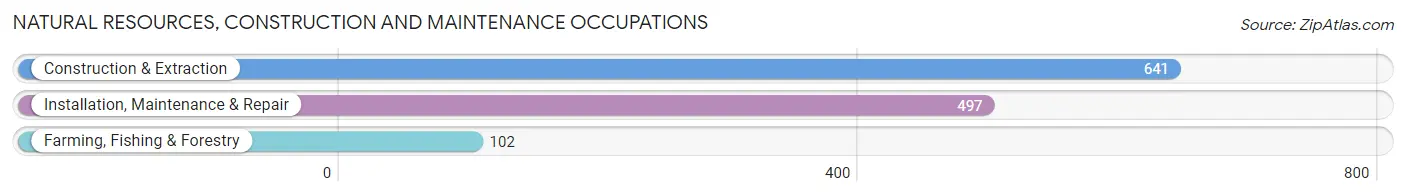
Natural Resources, Construction and Maintenance Occupations
The most common Natural Resources, Construction and Maintenance occupations in Vero Beach South are Construction & Extraction (641 | 4.6%), Installation, Maintenance & Repair (497 | 3.6%), and Farming, Fishing & Forestry (102 | 0.7%).
Natural Resources, Construction and Maintenance Occupations by Sex
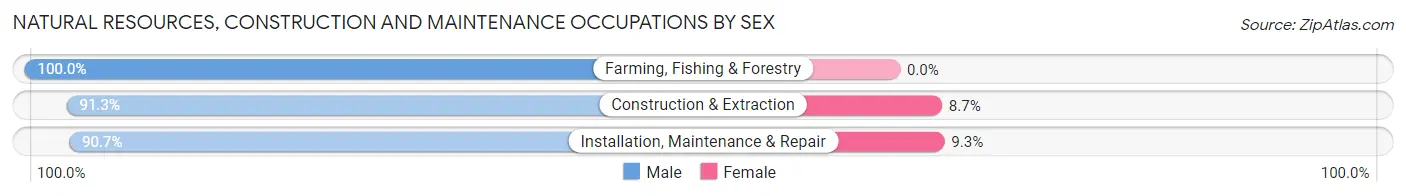
| Occupation | Male | Female |
| Farming, Fishing & Forestry | 102 (100.0%) | 0 (0.0%) |
| Construction & Extraction | 585 (91.3%) | 56 (8.7%) |
| Installation, Maintenance & Repair | 451 (90.7%) | 46 (9.3%) |
| Total (Category) | 1,138 (91.8%) | 102 (8.2%) |
| Total (Overall) | 7,005 (50.6%) | 6,850 (49.4%) |
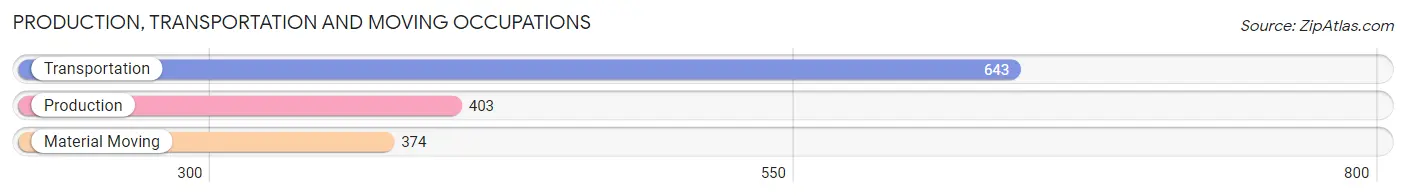
Production, Transportation and Moving Occupations
The most common Production, Transportation and Moving occupations in Vero Beach South are Transportation (643 | 4.6%), Production (403 | 2.9%), and Material Moving (374 | 2.7%).
Production, Transportation and Moving Occupations by Sex
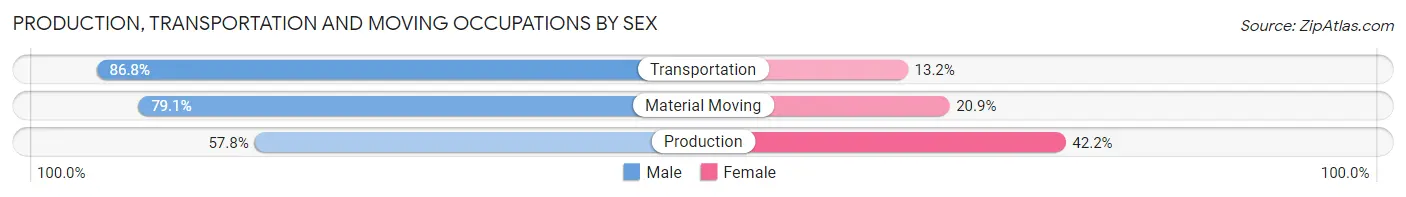
| Occupation | Male | Female |
| Production | 233 (57.8%) | 170 (42.2%) |
| Transportation | 558 (86.8%) | 85 (13.2%) |
| Material Moving | 296 (79.1%) | 78 (20.9%) |
| Total (Category) | 1,087 (76.5%) | 333 (23.4%) |
| Total (Overall) | 7,005 (50.6%) | 6,850 (49.4%) |
Employment Industries by Sex in Vero Beach South
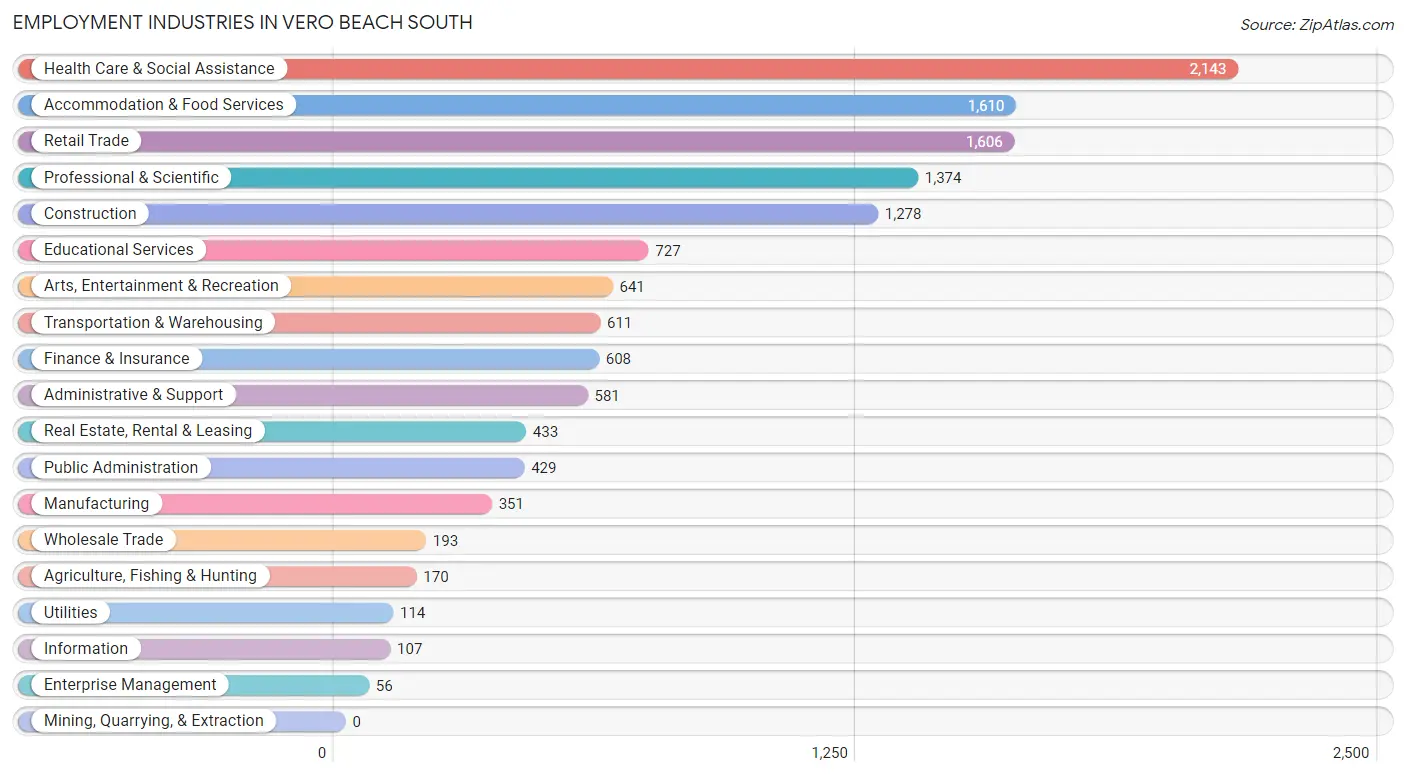
Employment Industries in Vero Beach South
The major employment industries in Vero Beach South include Health Care & Social Assistance (2,143 | 15.5%), Accommodation & Food Services (1,610 | 11.6%), Retail Trade (1,606 | 11.6%), Professional & Scientific (1,374 | 9.9%), and Construction (1,278 | 9.2%).
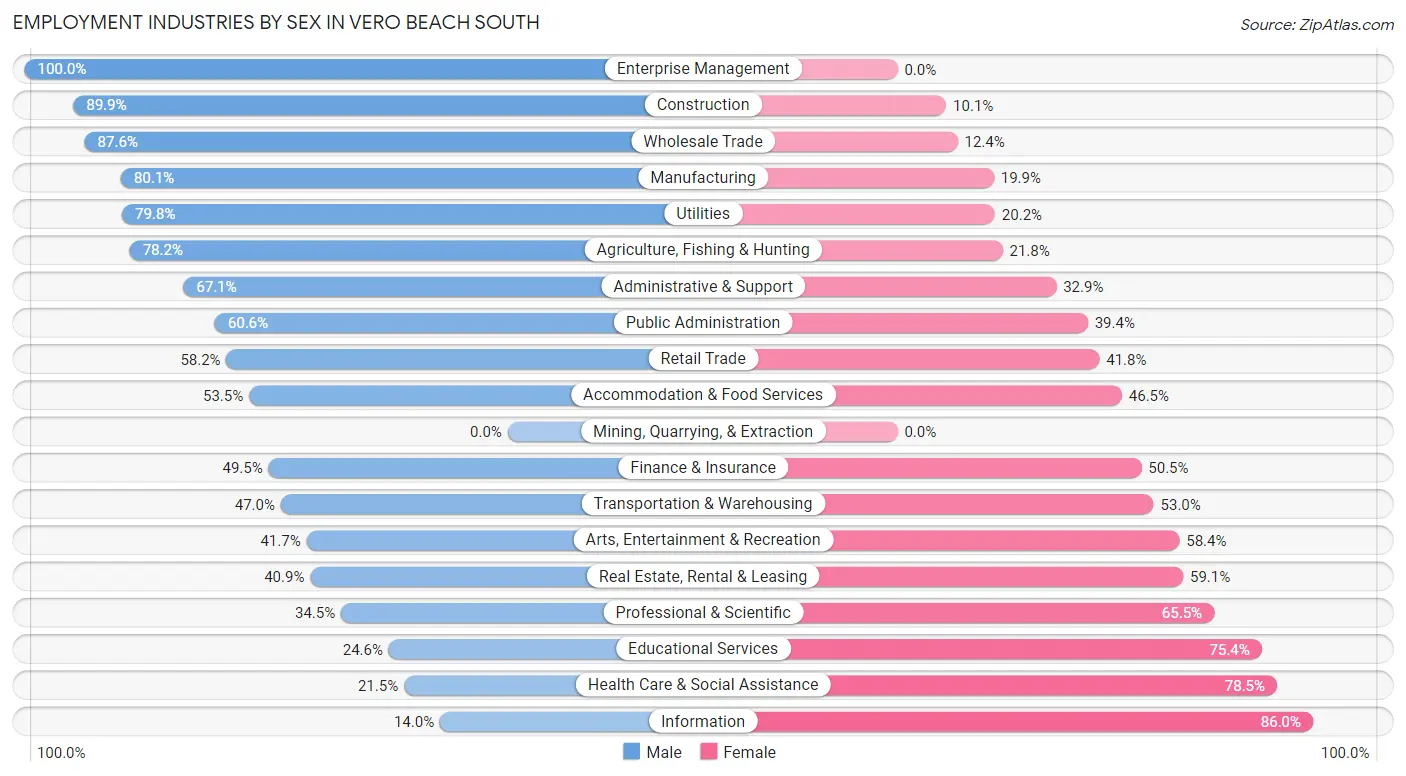
Employment Industries by Sex in Vero Beach South
The Vero Beach South industries that see more men than women are Enterprise Management (100.0%), Construction (89.9%), and Wholesale Trade (87.6%), whereas the industries that tend to have a higher number of women are Information (86.0%), Health Care & Social Assistance (78.5%), and Educational Services (75.4%).
| Industry | Male | Female |
| Agriculture, Fishing & Hunting | 133 (78.2%) | 37 (21.8%) |
| Mining, Quarrying, & Extraction | 0 (0.0%) | 0 (0.0%) |
| Construction | 1,149 (89.9%) | 129 (10.1%) |
| Manufacturing | 281 (80.1%) | 70 (19.9%) |
| Wholesale Trade | 169 (87.6%) | 24 (12.4%) |
| Retail Trade | 935 (58.2%) | 671 (41.8%) |
| Transportation & Warehousing | 287 (47.0%) | 324 (53.0%) |
| Utilities | 91 (79.8%) | 23 (20.2%) |
| Information | 15 (14.0%) | 92 (86.0%) |
| Finance & Insurance | 301 (49.5%) | 307 (50.5%) |
| Real Estate, Rental & Leasing | 177 (40.9%) | 256 (59.1%) |
| Professional & Scientific | 474 (34.5%) | 900 (65.5%) |
| Enterprise Management | 56 (100.0%) | 0 (0.0%) |
| Administrative & Support | 390 (67.1%) | 191 (32.9%) |
| Educational Services | 179 (24.6%) | 548 (75.4%) |
| Health Care & Social Assistance | 460 (21.5%) | 1,683 (78.5%) |
| Arts, Entertainment & Recreation | 267 (41.6%) | 374 (58.4%) |
| Accommodation & Food Services | 862 (53.5%) | 748 (46.5%) |
| Public Administration | 260 (60.6%) | 169 (39.4%) |
| Total | 7,005 (50.6%) | 6,850 (49.4%) |
Education in Vero Beach South
School Enrollment in Vero Beach South
The most common levels of schooling among the 5,448 students in Vero Beach South are college / undergraduate (1,353 | 24.8%), high school (1,127 | 20.7%), and middle school (1,019 | 18.7%).
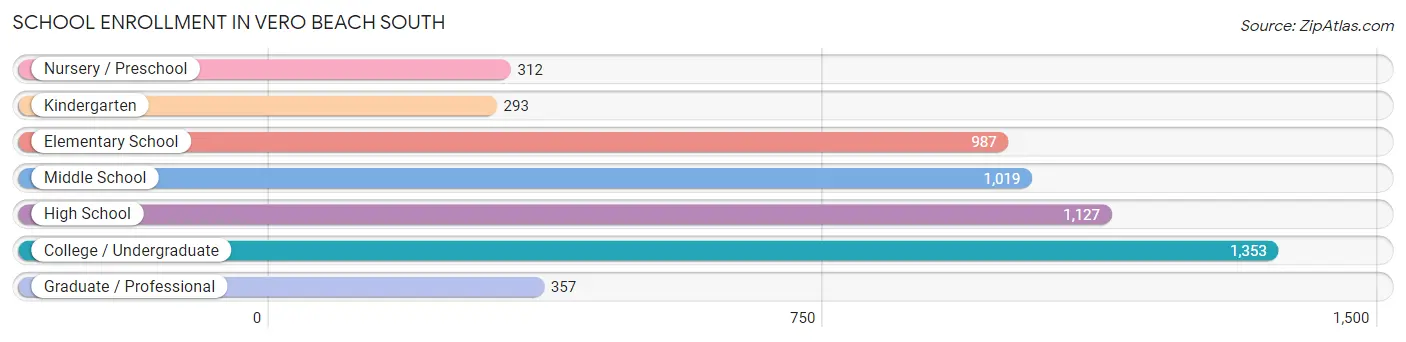
| School Level | # Students | % Students |
| Nursery / Preschool | 312 | 5.7% |
| Kindergarten | 293 | 5.4% |
| Elementary School | 987 | 18.1% |
| Middle School | 1,019 | 18.7% |
| High School | 1,127 | 20.7% |
| College / Undergraduate | 1,353 | 24.8% |
| Graduate / Professional | 357 | 6.6% |
| Total | 5,448 | 100.0% |
School Enrollment by Age by Funding Source in Vero Beach South
Out of a total of 5,448 students who are enrolled in schools in Vero Beach South, 1,574 (28.9%) attend a private institution, while the remaining 3,874 (71.1%) are enrolled in public schools. The age group of 25 to 34 year olds has the highest likelihood of being enrolled in private schools, with 276 (52.6% in the age bracket) enrolled. Conversely, the age group of 3 to 4 year olds has the lowest likelihood of being enrolled in a private school, with 184 (91.1% in the age bracket) attending a public institution.
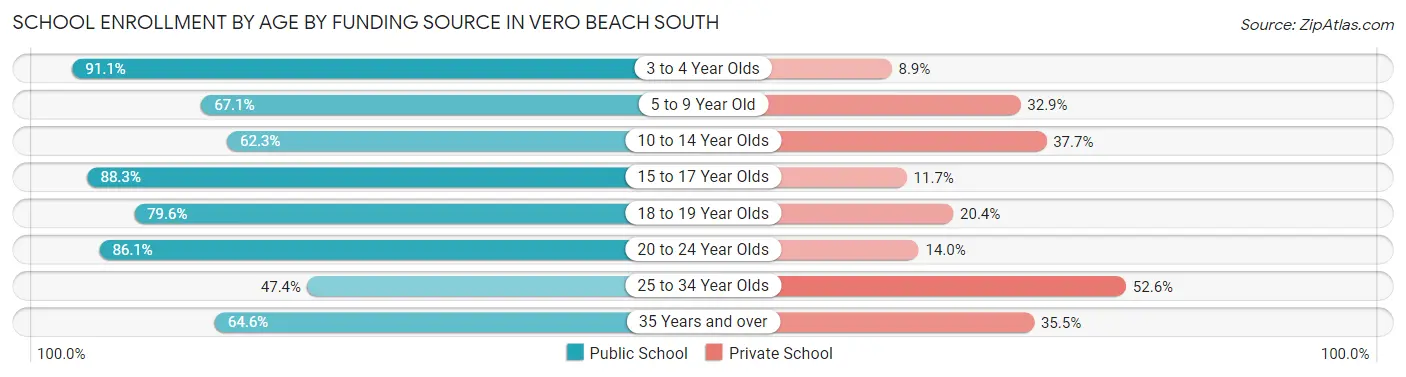
| Age Bracket | Public School | Private School |
| 3 to 4 Year Olds | 184 (91.1%) | 18 (8.9%) |
| 5 to 9 Year Old | 787 (67.1%) | 386 (32.9%) |
| 10 to 14 Year Olds | 822 (62.3%) | 498 (37.7%) |
| 15 to 17 Year Olds | 685 (88.3%) | 91 (11.7%) |
| 18 to 19 Year Olds | 332 (79.6%) | 85 (20.4%) |
| 20 to 24 Year Olds | 592 (86.1%) | 96 (14.0%) |
| 25 to 34 Year Olds | 249 (47.4%) | 276 (52.6%) |
| 35 Years and over | 224 (64.5%) | 123 (35.4%) |
| Total | 3,874 (71.1%) | 1,574 (28.9%) |
Educational Attainment by Field of Study in Vero Beach South
Business (1,372 | 19.0%), education (978 | 13.6%), social sciences (700 | 9.7%), science & technology (650 | 9.0%), and arts & humanities (513 | 7.1%) are the most common fields of study among 7,214 individuals in Vero Beach South who have obtained a bachelor's degree or higher.
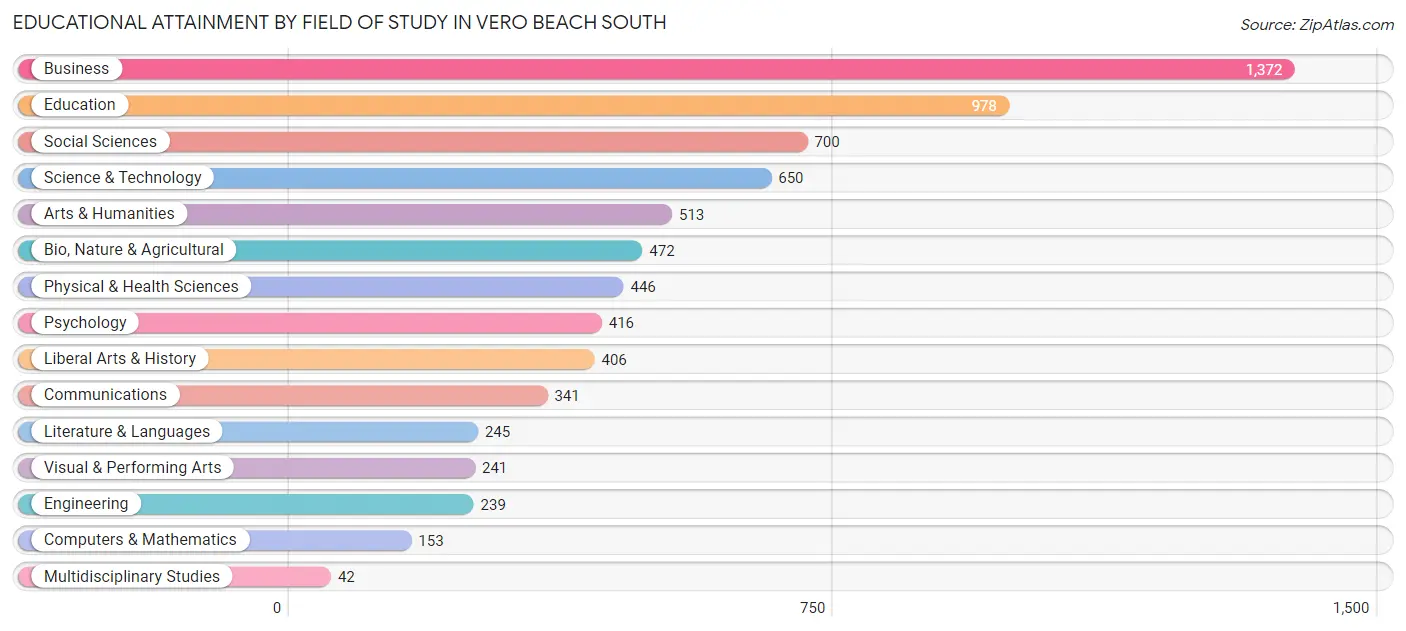
| Field of Study | # Graduates | % Graduates |
| Computers & Mathematics | 153 | 2.1% |
| Bio, Nature & Agricultural | 472 | 6.5% |
| Physical & Health Sciences | 446 | 6.2% |
| Psychology | 416 | 5.8% |
| Social Sciences | 700 | 9.7% |
| Engineering | 239 | 3.3% |
| Multidisciplinary Studies | 42 | 0.6% |
| Science & Technology | 650 | 9.0% |
| Business | 1,372 | 19.0% |
| Education | 978 | 13.6% |
| Literature & Languages | 245 | 3.4% |
| Liberal Arts & History | 406 | 5.6% |
| Visual & Performing Arts | 241 | 3.3% |
| Communications | 341 | 4.7% |
| Arts & Humanities | 513 | 7.1% |
| Total | 7,214 | 100.0% |
Transportation & Commute in Vero Beach South
Vehicle Availability by Sex in Vero Beach South
The most prevalent vehicle ownership categories in Vero Beach South are males with 2 vehicles (3,068, accounting for 46.8%) and females with 2 vehicles (2,890, making up 46.1%).
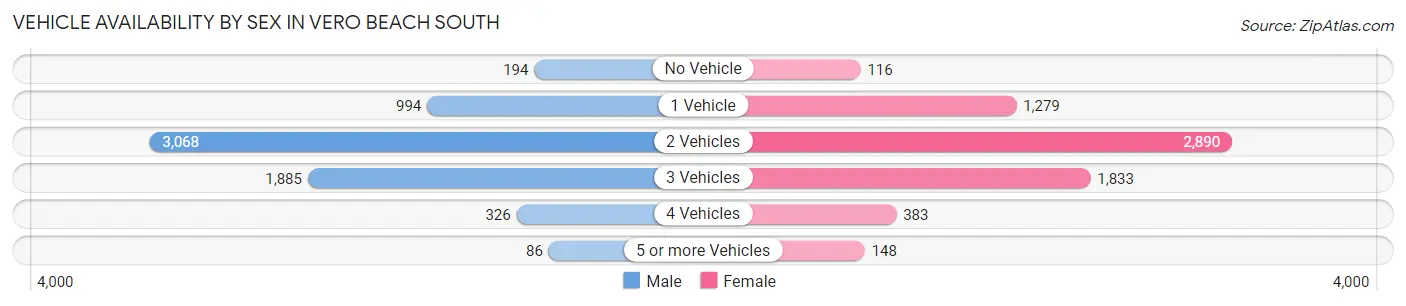
| Vehicles Available | Male | Female |
| No Vehicle | 194 (3.0%) | 116 (1.7%) |
| 1 Vehicle | 994 (15.2%) | 1,279 (19.2%) |
| 2 Vehicles | 3,068 (46.8%) | 2,890 (43.5%) |
| 3 Vehicles | 1,885 (28.8%) | 1,833 (27.6%) |
| 4 Vehicles | 326 (5.0%) | 383 (5.8%) |
| 5 or more Vehicles | 86 (1.3%) | 148 (2.2%) |
| Total | 6,553 (100.0%) | 6,649 (100.0%) |
Commute Time in Vero Beach South
The most frequently occuring commute durations in Vero Beach South are 10 to 14 minutes (3,596 commuters, 30.5%), 15 to 19 minutes (2,720 commuters, 23.1%), and 5 to 9 minutes (1,532 commuters, 13.0%).
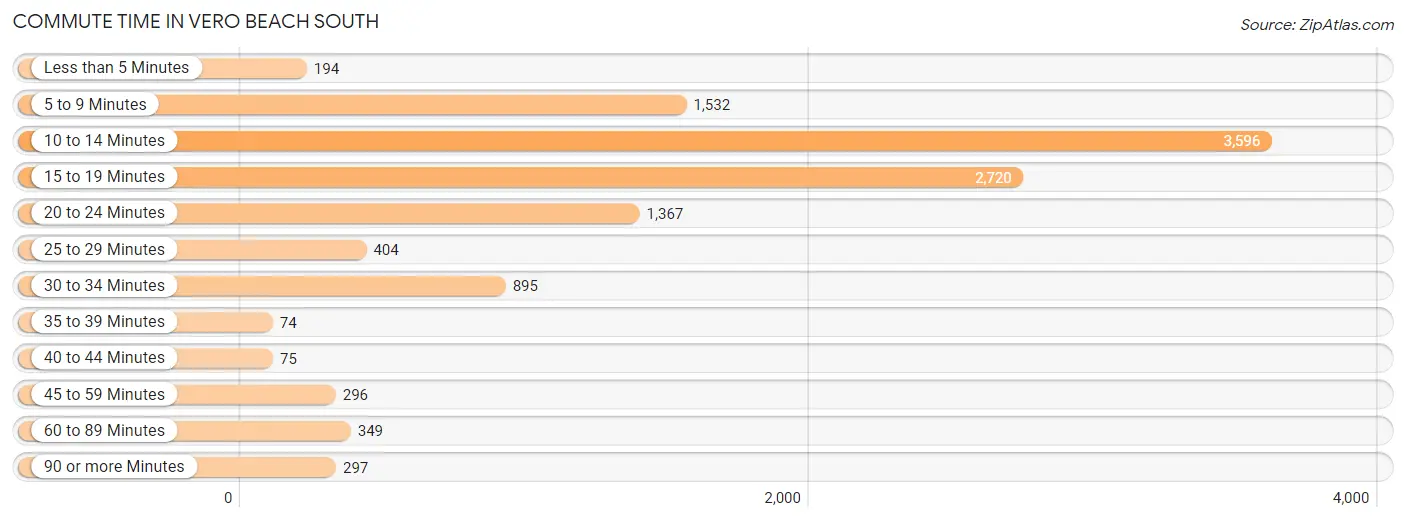
| Commute Time | # Commuters | % Commuters |
| Less than 5 Minutes | 194 | 1.6% |
| 5 to 9 Minutes | 1,532 | 13.0% |
| 10 to 14 Minutes | 3,596 | 30.5% |
| 15 to 19 Minutes | 2,720 | 23.1% |
| 20 to 24 Minutes | 1,367 | 11.6% |
| 25 to 29 Minutes | 404 | 3.4% |
| 30 to 34 Minutes | 895 | 7.6% |
| 35 to 39 Minutes | 74 | 0.6% |
| 40 to 44 Minutes | 75 | 0.6% |
| 45 to 59 Minutes | 296 | 2.5% |
| 60 to 89 Minutes | 349 | 3.0% |
| 90 or more Minutes | 297 | 2.5% |
Commute Time by Sex in Vero Beach South
The most common commute times in Vero Beach South are 10 to 14 minutes (1,884 commuters, 31.3%) for males and 10 to 14 minutes (1,712 commuters, 29.6%) for females.
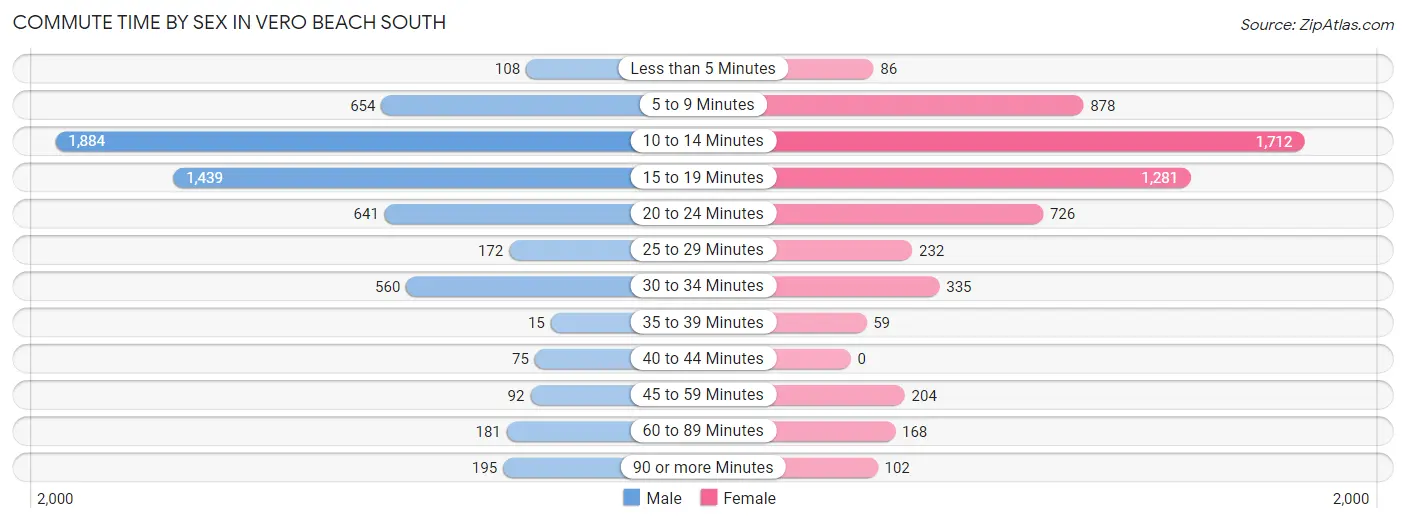
| Commute Time | Male | Female |
| Less than 5 Minutes | 108 (1.8%) | 86 (1.5%) |
| 5 to 9 Minutes | 654 (10.9%) | 878 (15.2%) |
| 10 to 14 Minutes | 1,884 (31.3%) | 1,712 (29.6%) |
| 15 to 19 Minutes | 1,439 (23.9%) | 1,281 (22.2%) |
| 20 to 24 Minutes | 641 (10.6%) | 726 (12.6%) |
| 25 to 29 Minutes | 172 (2.9%) | 232 (4.0%) |
| 30 to 34 Minutes | 560 (9.3%) | 335 (5.8%) |
| 35 to 39 Minutes | 15 (0.3%) | 59 (1.0%) |
| 40 to 44 Minutes | 75 (1.3%) | 0 (0.0%) |
| 45 to 59 Minutes | 92 (1.5%) | 204 (3.5%) |
| 60 to 89 Minutes | 181 (3.0%) | 168 (2.9%) |
| 90 or more Minutes | 195 (3.2%) | 102 (1.8%) |
Time of Departure to Work by Sex in Vero Beach South
The most frequent times of departure to work in Vero Beach South are 7:00 AM to 7:29 AM (934, 15.5%) for males and 7:30 AM to 7:59 AM (1,057, 18.3%) for females.
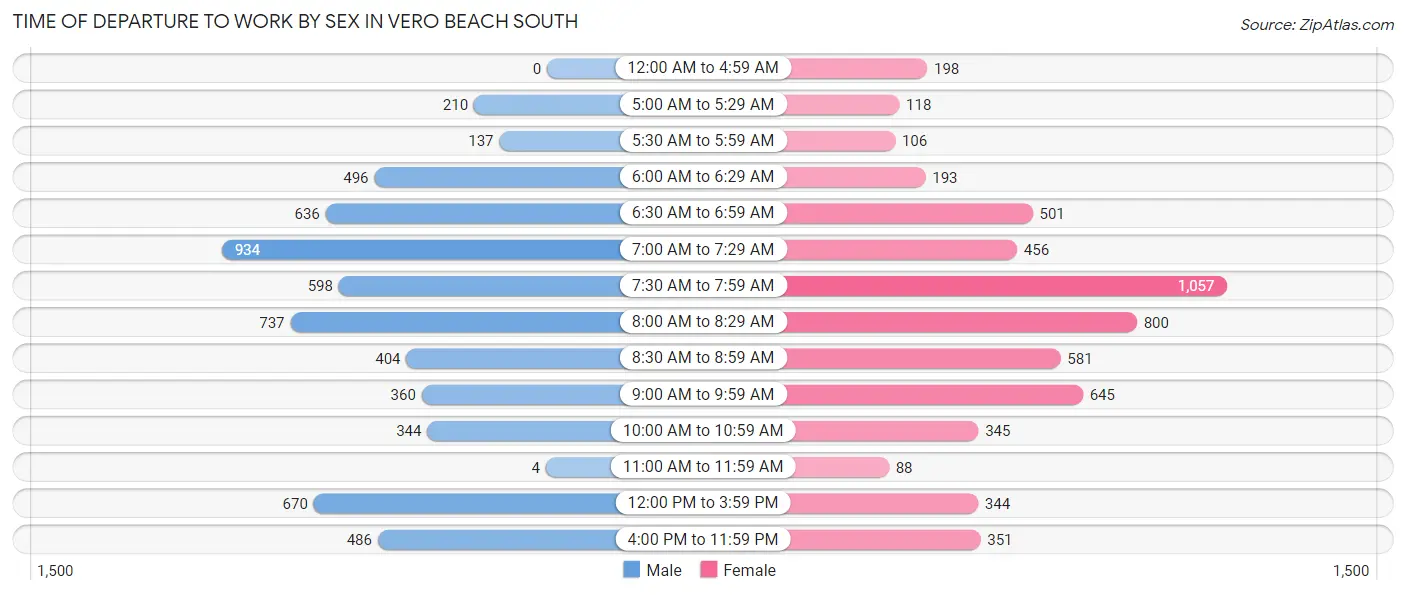
| Time of Departure | Male | Female |
| 12:00 AM to 4:59 AM | 0 (0.0%) | 198 (3.4%) |
| 5:00 AM to 5:29 AM | 210 (3.5%) | 118 (2.0%) |
| 5:30 AM to 5:59 AM | 137 (2.3%) | 106 (1.8%) |
| 6:00 AM to 6:29 AM | 496 (8.2%) | 193 (3.3%) |
| 6:30 AM to 6:59 AM | 636 (10.6%) | 501 (8.7%) |
| 7:00 AM to 7:29 AM | 934 (15.5%) | 456 (7.9%) |
| 7:30 AM to 7:59 AM | 598 (9.9%) | 1,057 (18.3%) |
| 8:00 AM to 8:29 AM | 737 (12.2%) | 800 (13.8%) |
| 8:30 AM to 8:59 AM | 404 (6.7%) | 581 (10.1%) |
| 9:00 AM to 9:59 AM | 360 (6.0%) | 645 (11.2%) |
| 10:00 AM to 10:59 AM | 344 (5.7%) | 345 (6.0%) |
| 11:00 AM to 11:59 AM | 4 (0.1%) | 88 (1.5%) |
| 12:00 PM to 3:59 PM | 670 (11.1%) | 344 (5.9%) |
| 4:00 PM to 11:59 PM | 486 (8.1%) | 351 (6.1%) |
| Total | 6,016 (100.0%) | 5,783 (100.0%) |
Housing Occupancy in Vero Beach South
Occupancy by Ownership in Vero Beach South
Of the total 11,568 dwellings in Vero Beach South, owner-occupied units account for 9,221 (79.7%), while renter-occupied units make up 2,347 (20.3%).
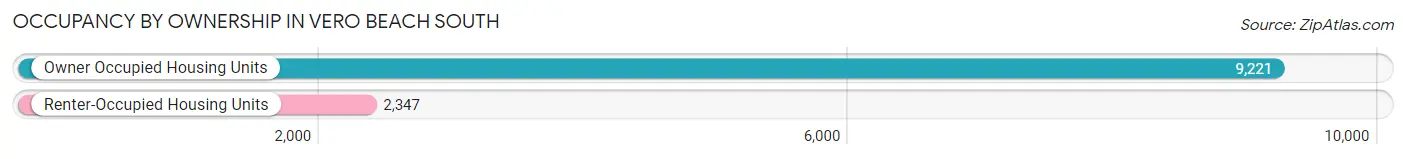
| Occupancy | # Housing Units | % Housing Units |
| Owner Occupied Housing Units | 9,221 | 79.7% |
| Renter-Occupied Housing Units | 2,347 | 20.3% |
| Total Occupied Housing Units | 11,568 | 100.0% |
Occupancy by Household Size in Vero Beach South
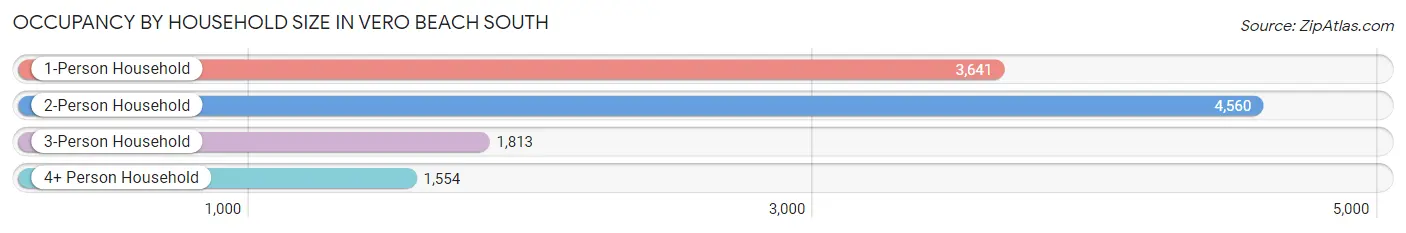
| Household Size | # Housing Units | % Housing Units |
| 1-Person Household | 3,641 | 31.5% |
| 2-Person Household | 4,560 | 39.4% |
| 3-Person Household | 1,813 | 15.7% |
| 4+ Person Household | 1,554 | 13.4% |
| Total Housing Units | 11,568 | 100.0% |
Occupancy by Ownership by Household Size in Vero Beach South
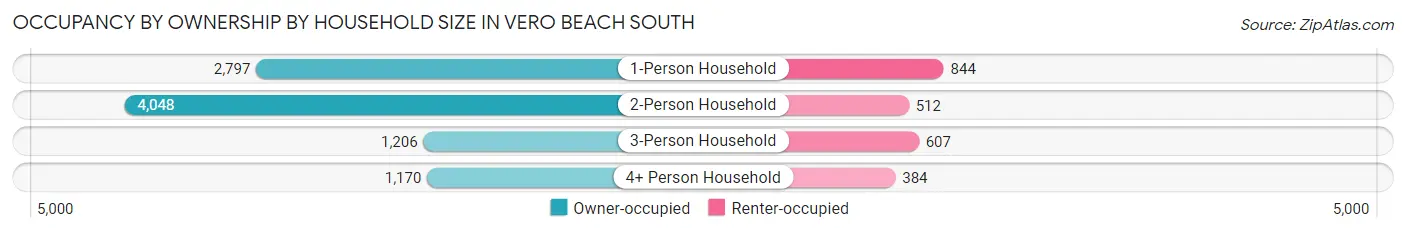
| Household Size | Owner-occupied | Renter-occupied |
| 1-Person Household | 2,797 (76.8%) | 844 (23.2%) |
| 2-Person Household | 4,048 (88.8%) | 512 (11.2%) |
| 3-Person Household | 1,206 (66.5%) | 607 (33.5%) |
| 4+ Person Household | 1,170 (75.3%) | 384 (24.7%) |
| Total Housing Units | 9,221 (79.7%) | 2,347 (20.3%) |
Occupancy by Educational Attainment in Vero Beach South
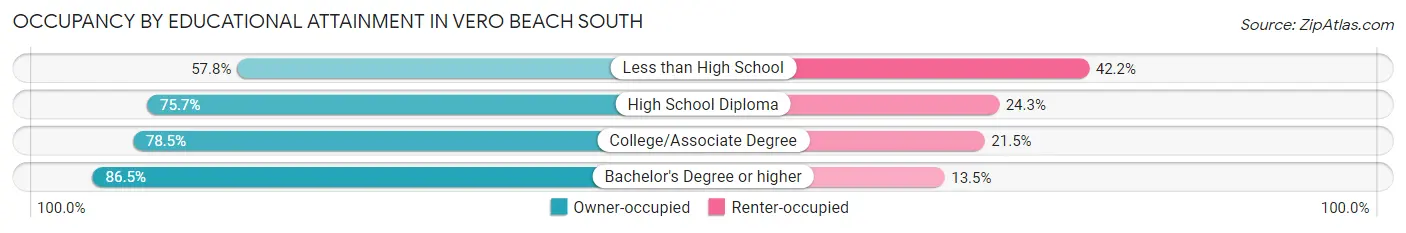
| Household Size | Owner-occupied | Renter-occupied |
| Less than High School | 273 (57.8%) | 199 (42.2%) |
| High School Diploma | 2,125 (75.7%) | 682 (24.3%) |
| College/Associate Degree | 3,421 (78.5%) | 935 (21.5%) |
| Bachelor's Degree or higher | 3,402 (86.5%) | 531 (13.5%) |
Occupancy by Age of Householder in Vero Beach South
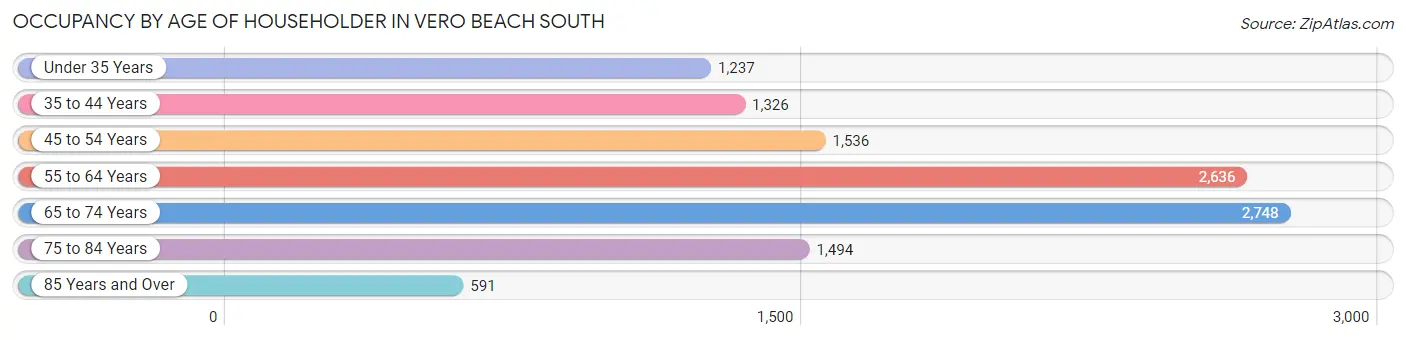
| Age Bracket | # Households | % Households |
| Under 35 Years | 1,237 | 10.7% |
| 35 to 44 Years | 1,326 | 11.5% |
| 45 to 54 Years | 1,536 | 13.3% |
| 55 to 64 Years | 2,636 | 22.8% |
| 65 to 74 Years | 2,748 | 23.8% |
| 75 to 84 Years | 1,494 | 12.9% |
| 85 Years and Over | 591 | 5.1% |
| Total | 11,568 | 100.0% |
Housing Finances in Vero Beach South
Median Income by Occupancy in Vero Beach South
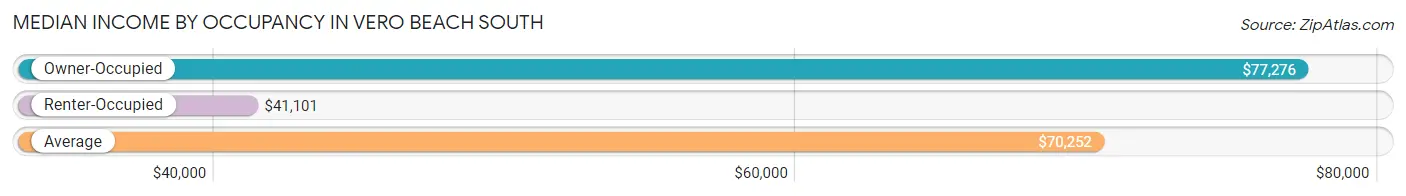
| Occupancy Type | # Households | Median Income |
| Owner-Occupied | 9,221 (79.7%) | $77,276 |
| Renter-Occupied | 2,347 (20.3%) | $41,101 |
| Average | 11,568 (100.0%) | $70,252 |
Occupancy by Householder Income Bracket in Vero Beach South
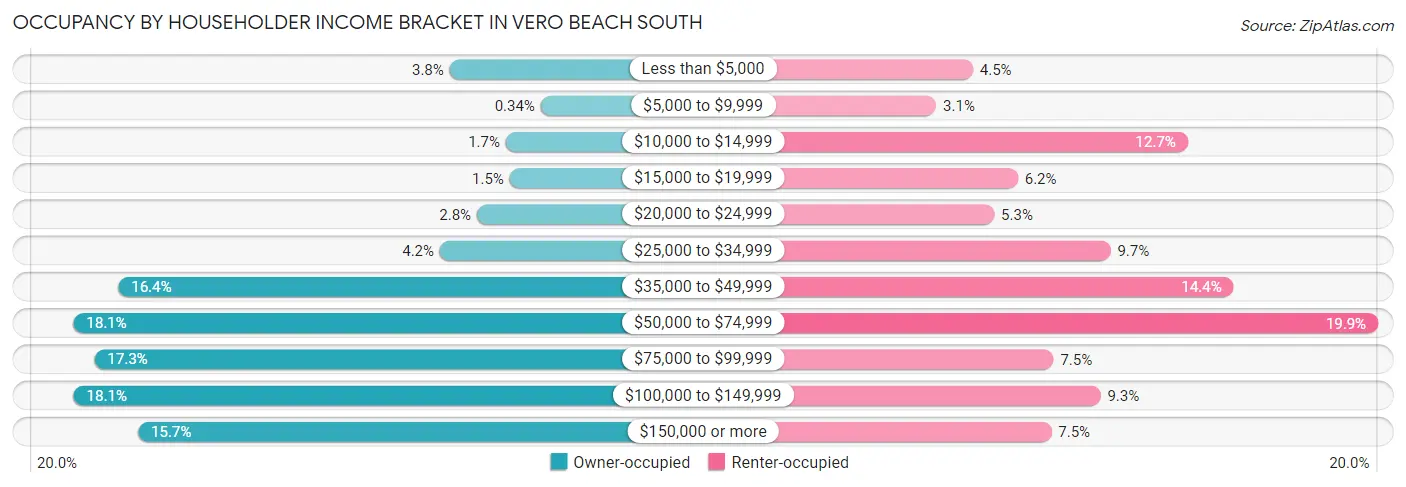
| Income Bracket | Owner-occupied | Renter-occupied |
| Less than $5,000 | 351 (3.8%) | 105 (4.5%) |
| $5,000 to $9,999 | 31 (0.3%) | 72 (3.1%) |
| $10,000 to $14,999 | 154 (1.7%) | 297 (12.7%) |
| $15,000 to $19,999 | 140 (1.5%) | 145 (6.2%) |
| $20,000 to $24,999 | 255 (2.8%) | 124 (5.3%) |
| $25,000 to $34,999 | 385 (4.2%) | 228 (9.7%) |
| $35,000 to $49,999 | 1,515 (16.4%) | 338 (14.4%) |
| $50,000 to $74,999 | 1,673 (18.1%) | 467 (19.9%) |
| $75,000 to $99,999 | 1,599 (17.3%) | 177 (7.5%) |
| $100,000 to $149,999 | 1,672 (18.1%) | 219 (9.3%) |
| $150,000 or more | 1,446 (15.7%) | 175 (7.5%) |
| Total | 9,221 (100.0%) | 2,347 (100.0%) |
Monthly Housing Cost Tiers in Vero Beach South
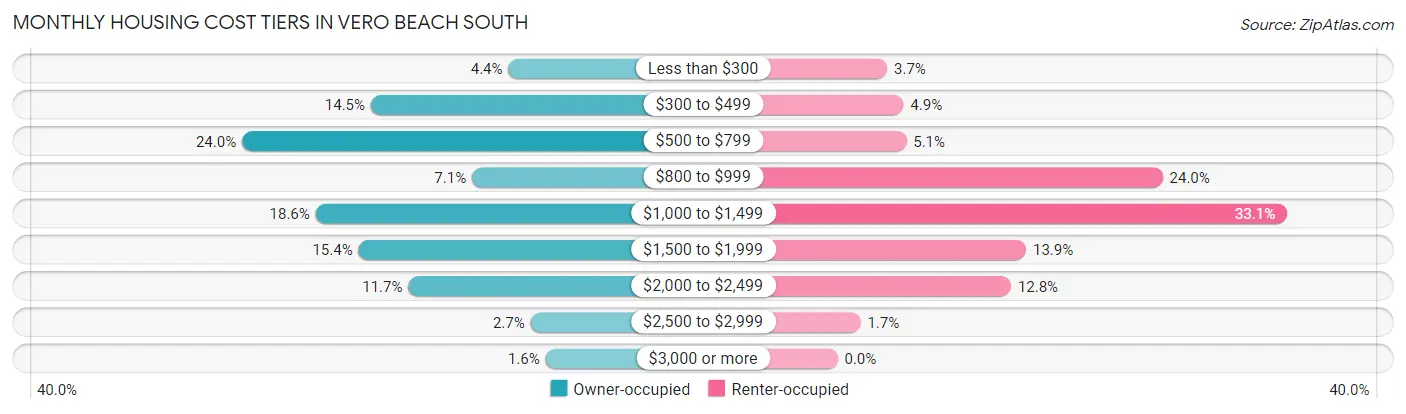
| Monthly Cost | Owner-occupied | Renter-occupied |
| Less than $300 | 403 (4.4%) | 86 (3.7%) |
| $300 to $499 | 1,337 (14.5%) | 114 (4.9%) |
| $500 to $799 | 2,212 (24.0%) | 119 (5.1%) |
| $800 to $999 | 650 (7.0%) | 562 (23.9%) |
| $1,000 to $1,499 | 1,712 (18.6%) | 777 (33.1%) |
| $1,500 to $1,999 | 1,421 (15.4%) | 326 (13.9%) |
| $2,000 to $2,499 | 1,083 (11.7%) | 300 (12.8%) |
| $2,500 to $2,999 | 253 (2.7%) | 40 (1.7%) |
| $3,000 or more | 150 (1.6%) | 0 (0.0%) |
| Total | 9,221 (100.0%) | 2,347 (100.0%) |
Physical Housing Characteristics in Vero Beach South
Housing Structures in Vero Beach South
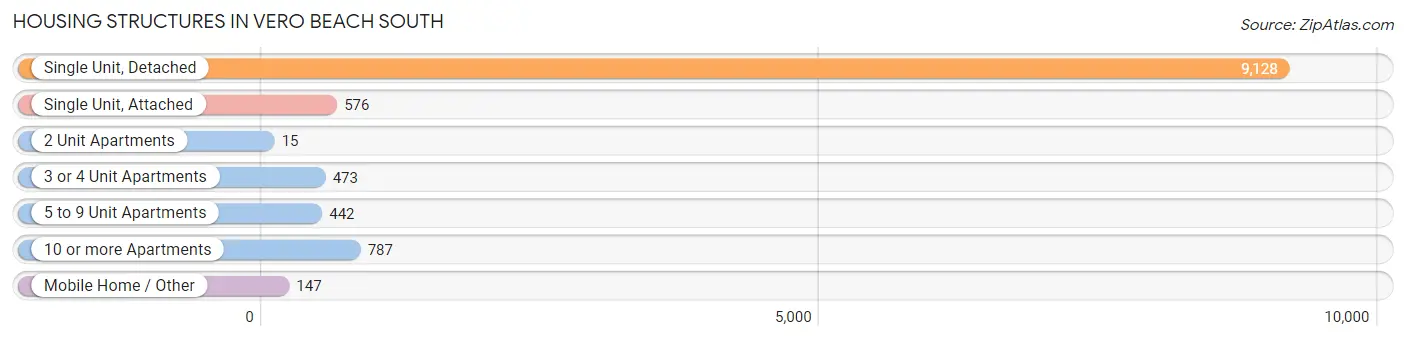
| Structure Type | # Housing Units | % Housing Units |
| Single Unit, Detached | 9,128 | 78.9% |
| Single Unit, Attached | 576 | 5.0% |
| 2 Unit Apartments | 15 | 0.1% |
| 3 or 4 Unit Apartments | 473 | 4.1% |
| 5 to 9 Unit Apartments | 442 | 3.8% |
| 10 or more Apartments | 787 | 6.8% |
| Mobile Home / Other | 147 | 1.3% |
| Total | 11,568 | 100.0% |
Housing Structures by Occupancy in Vero Beach South
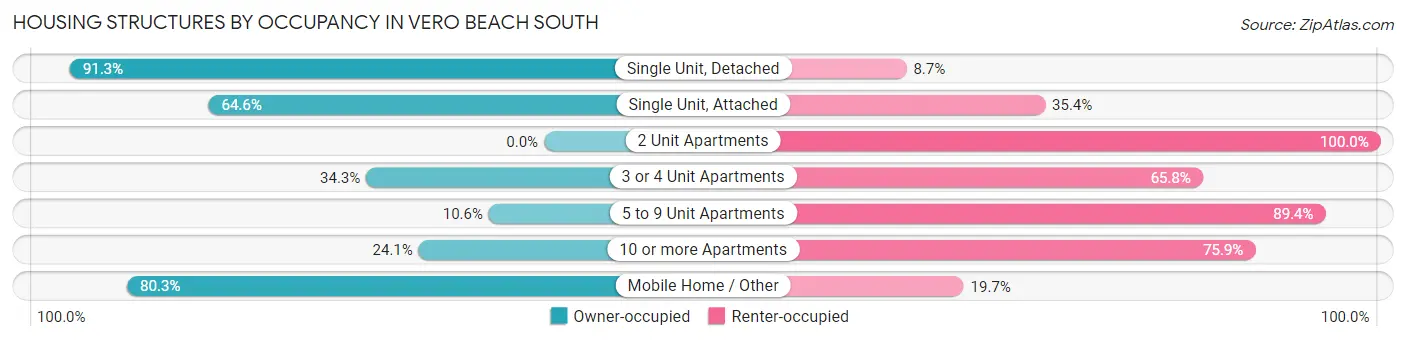
| Structure Type | Owner-occupied | Renter-occupied |
| Single Unit, Detached | 8,332 (91.3%) | 796 (8.7%) |
| Single Unit, Attached | 372 (64.6%) | 204 (35.4%) |
| 2 Unit Apartments | 0 (0.0%) | 15 (100.0%) |
| 3 or 4 Unit Apartments | 162 (34.3%) | 311 (65.7%) |
| 5 to 9 Unit Apartments | 47 (10.6%) | 395 (89.4%) |
| 10 or more Apartments | 190 (24.1%) | 597 (75.9%) |
| Mobile Home / Other | 118 (80.3%) | 29 (19.7%) |
| Total | 9,221 (79.7%) | 2,347 (20.3%) |
Housing Structures by Number of Rooms in Vero Beach South
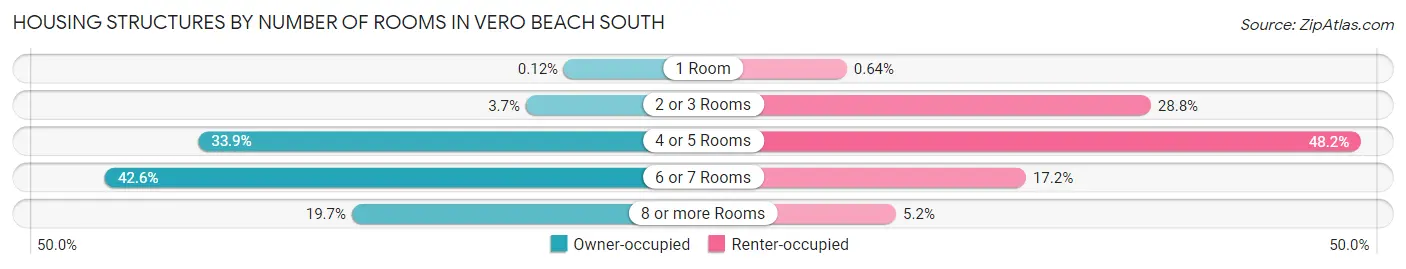
| Number of Rooms | Owner-occupied | Renter-occupied |
| 1 Room | 11 (0.1%) | 15 (0.6%) |
| 2 or 3 Rooms | 337 (3.6%) | 675 (28.8%) |
| 4 or 5 Rooms | 3,129 (33.9%) | 1,131 (48.2%) |
| 6 or 7 Rooms | 3,924 (42.6%) | 404 (17.2%) |
| 8 or more Rooms | 1,820 (19.7%) | 122 (5.2%) |
| Total | 9,221 (100.0%) | 2,347 (100.0%) |
Housing Structure by Heating Type in Vero Beach South
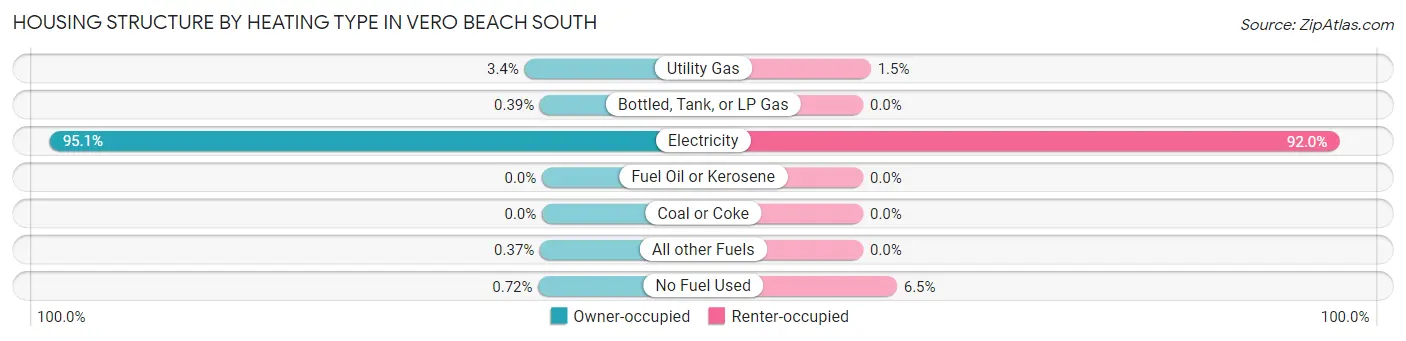
| Heating Type | Owner-occupied | Renter-occupied |
| Utility Gas | 312 (3.4%) | 35 (1.5%) |
| Bottled, Tank, or LP Gas | 36 (0.4%) | 0 (0.0%) |
| Electricity | 8,773 (95.1%) | 2,159 (92.0%) |
| Fuel Oil or Kerosene | 0 (0.0%) | 0 (0.0%) |
| Coal or Coke | 0 (0.0%) | 0 (0.0%) |
| All other Fuels | 34 (0.4%) | 0 (0.0%) |
| No Fuel Used | 66 (0.7%) | 153 (6.5%) |
| Total | 9,221 (100.0%) | 2,347 (100.0%) |
Household Vehicle Usage in Vero Beach South
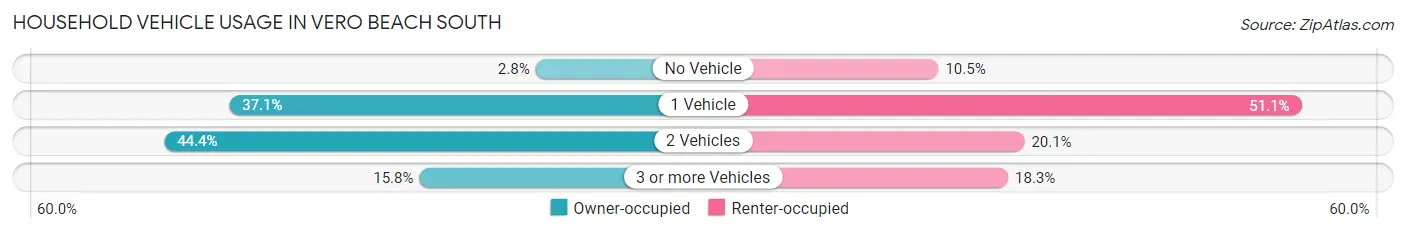
| Vehicles per Household | Owner-occupied | Renter-occupied |
| No Vehicle | 255 (2.8%) | 246 (10.5%) |
| 1 Vehicle | 3,420 (37.1%) | 1,200 (51.1%) |
| 2 Vehicles | 4,090 (44.4%) | 472 (20.1%) |
| 3 or more Vehicles | 1,456 (15.8%) | 429 (18.3%) |
| Total | 9,221 (100.0%) | 2,347 (100.0%) |
Real Estate & Mortgages in Vero Beach South
Real Estate and Mortgage Overview in Vero Beach South
| Characteristic | Without Mortgage | With Mortgage |
| Housing Units | 3,991 | 5,230 |
| Median Property Value | $271,500 | $280,900 |
| Median Household Income | $61,804 | $1,084 |
| Monthly Housing Costs | $534 | $113 |
| Real Estate Taxes | $1,729 | $45 |
Property Value by Mortgage Status in Vero Beach South
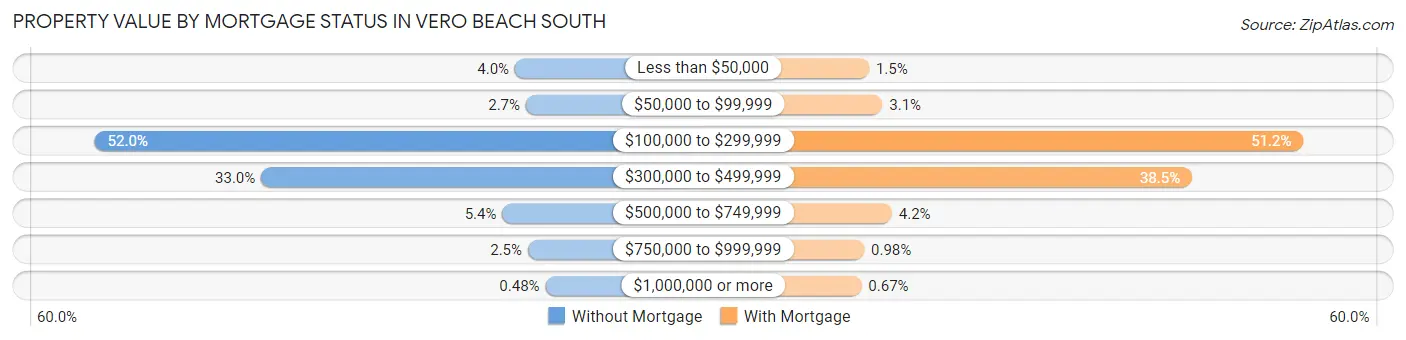
| Property Value | Without Mortgage | With Mortgage |
| Less than $50,000 | 158 (4.0%) | 80 (1.5%) |
| $50,000 to $99,999 | 108 (2.7%) | 160 (3.1%) |
| $100,000 to $299,999 | 2,075 (52.0%) | 2,676 (51.2%) |
| $300,000 to $499,999 | 1,316 (33.0%) | 2,011 (38.5%) |
| $500,000 to $749,999 | 216 (5.4%) | 217 (4.2%) |
| $750,000 to $999,999 | 99 (2.5%) | 51 (1.0%) |
| $1,000,000 or more | 19 (0.5%) | 35 (0.7%) |
| Total | 3,991 (100.0%) | 5,230 (100.0%) |
Household Income by Mortgage Status in Vero Beach South
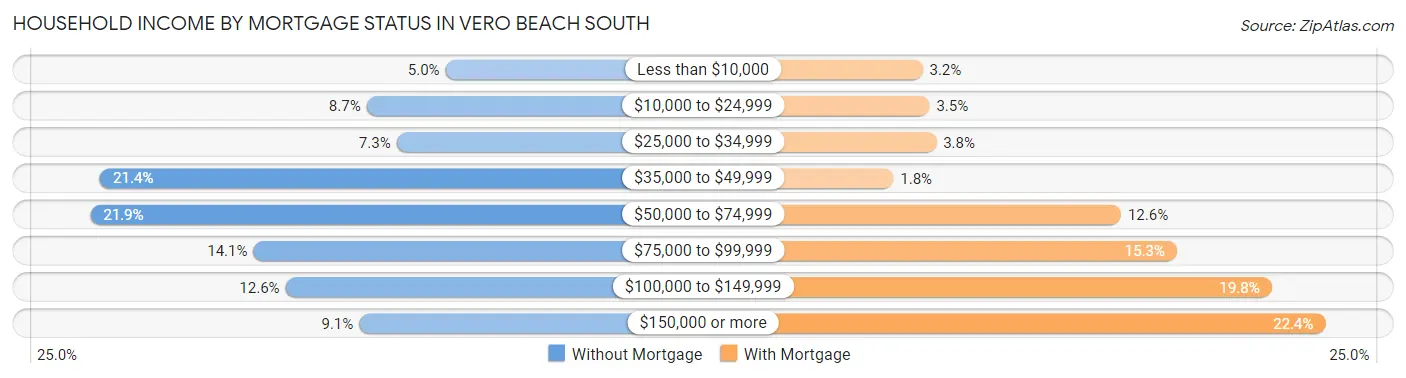
| Household Income | Without Mortgage | With Mortgage |
| Less than $10,000 | 198 (5.0%) | 167 (3.2%) |
| $10,000 to $24,999 | 348 (8.7%) | 184 (3.5%) |
| $25,000 to $34,999 | 291 (7.3%) | 201 (3.8%) |
| $35,000 to $49,999 | 854 (21.4%) | 94 (1.8%) |
| $50,000 to $74,999 | 873 (21.9%) | 661 (12.6%) |
| $75,000 to $99,999 | 563 (14.1%) | 800 (15.3%) |
| $100,000 to $149,999 | 502 (12.6%) | 1,036 (19.8%) |
| $150,000 or more | 362 (9.1%) | 1,170 (22.4%) |
| Total | 3,991 (100.0%) | 5,230 (100.0%) |
Property Value to Household Income Ratio in Vero Beach South
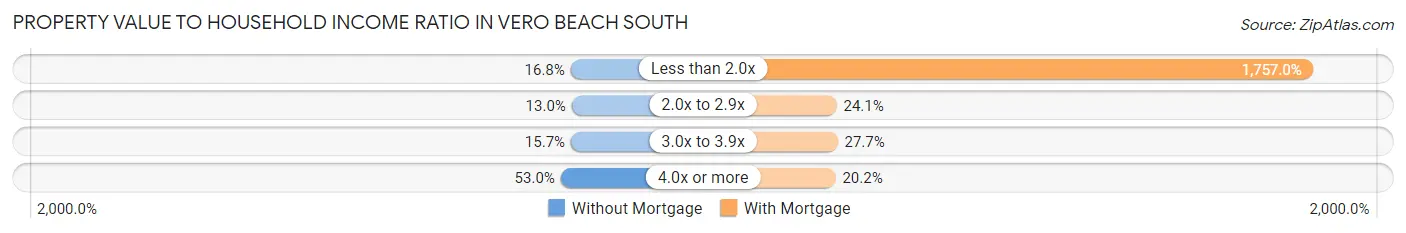
| Value-to-Income Ratio | Without Mortgage | With Mortgage |
| Less than 2.0x | 671 (16.8%) | 91,891 (1,757.0%) |
| 2.0x to 2.9x | 520 (13.0%) | 1,261 (24.1%) |
| 3.0x to 3.9x | 626 (15.7%) | 1,450 (27.7%) |
| 4.0x or more | 2,115 (53.0%) | 1,054 (20.2%) |
| Total | 3,991 (100.0%) | 5,230 (100.0%) |
Real Estate Taxes by Mortgage Status in Vero Beach South
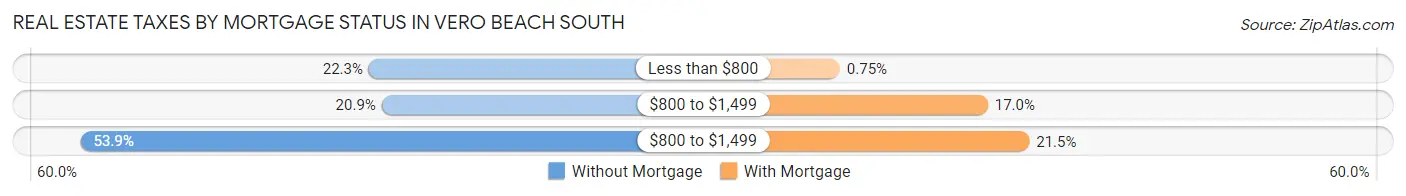
| Property Taxes | Without Mortgage | With Mortgage |
| Less than $800 | 889 (22.3%) | 39 (0.7%) |
| $800 to $1,499 | 833 (20.9%) | 887 (17.0%) |
| $800 to $1,499 | 2,150 (53.9%) | 1,125 (21.5%) |
| Total | 3,991 (100.0%) | 5,230 (100.0%) |
Health & Disability in Vero Beach South
Health Insurance Coverage by Age in Vero Beach South
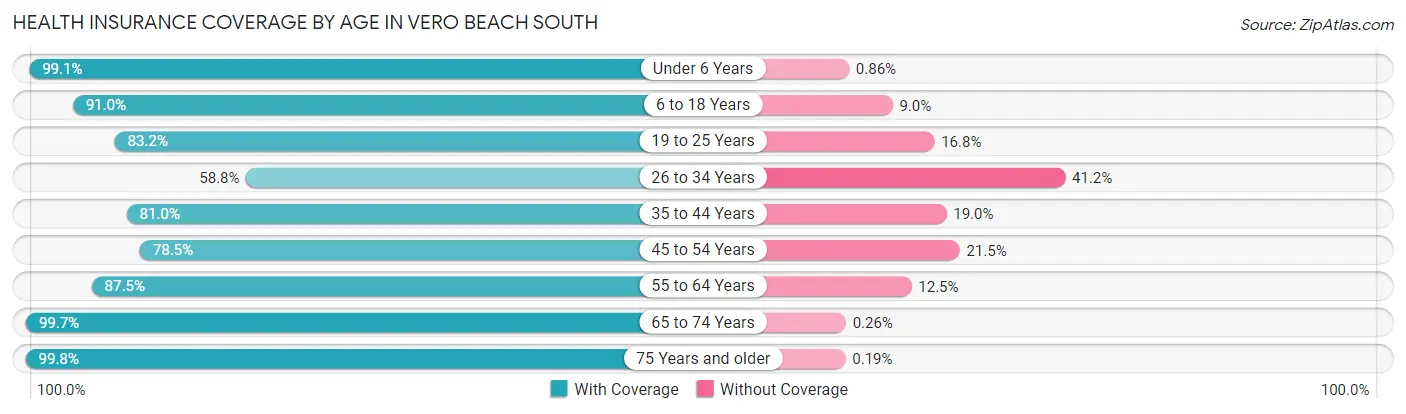
| Age Bracket | With Coverage | Without Coverage |
| Under 6 Years | 1,496 (99.1%) | 13 (0.9%) |
| 6 to 18 Years | 3,050 (91.0%) | 301 (9.0%) |
| 19 to 25 Years | 1,891 (83.2%) | 381 (16.8%) |
| 26 to 34 Years | 1,712 (58.8%) | 1,198 (41.2%) |
| 35 to 44 Years | 2,815 (81.0%) | 661 (19.0%) |
| 45 to 54 Years | 2,709 (78.5%) | 742 (21.5%) |
| 55 to 64 Years | 4,005 (87.5%) | 572 (12.5%) |
| 65 to 74 Years | 4,652 (99.7%) | 12 (0.3%) |
| 75 Years and older | 3,716 (99.8%) | 7 (0.2%) |
| Total | 26,046 (87.0%) | 3,887 (13.0%) |
Health Insurance Coverage by Citizenship Status in Vero Beach South
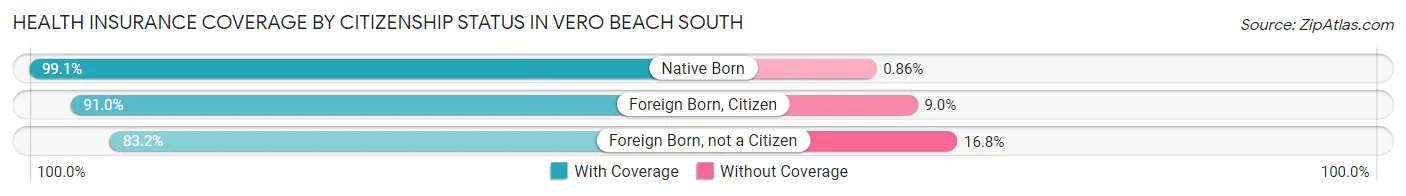
| Citizenship Status | With Coverage | Without Coverage |
| Native Born | 1,496 (99.1%) | 13 (0.9%) |
| Foreign Born, Citizen | 3,050 (91.0%) | 301 (9.0%) |
| Foreign Born, not a Citizen | 1,891 (83.2%) | 381 (16.8%) |
Health Insurance Coverage by Household Income in Vero Beach South
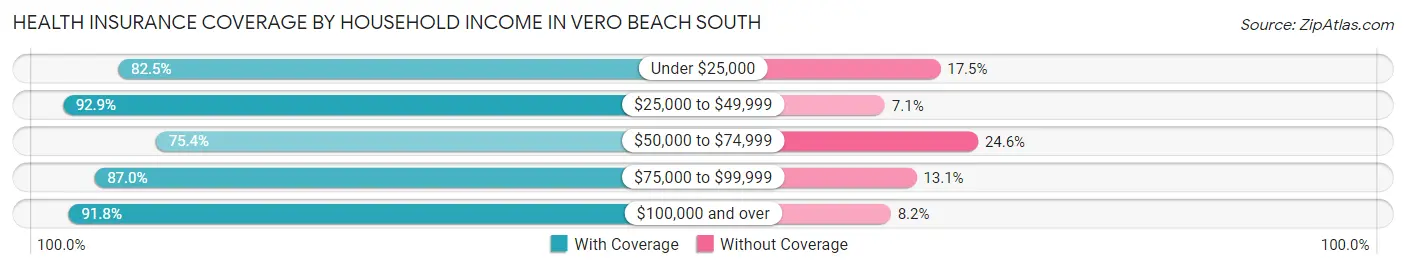
| Household Income | With Coverage | Without Coverage |
| Under $25,000 | 2,271 (82.5%) | 482 (17.5%) |
| $25,000 to $49,999 | 4,164 (92.9%) | 320 (7.1%) |
| $50,000 to $74,999 | 4,509 (75.4%) | 1,469 (24.6%) |
| $75,000 to $99,999 | 4,026 (87.0%) | 604 (13.1%) |
| $100,000 and over | 11,017 (91.8%) | 988 (8.2%) |
Public vs Private Health Insurance Coverage by Age in Vero Beach South
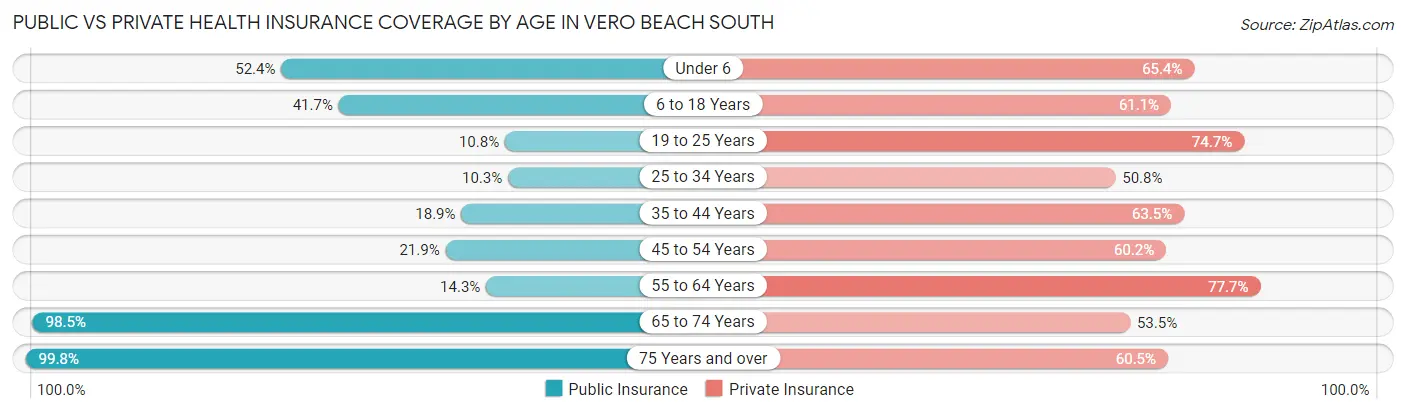
| Age Bracket | Public Insurance | Private Insurance |
| Under 6 | 790 (52.3%) | 987 (65.4%) |
| 6 to 18 Years | 1,397 (41.7%) | 2,047 (61.1%) |
| 19 to 25 Years | 246 (10.8%) | 1,696 (74.7%) |
| 25 to 34 Years | 299 (10.3%) | 1,477 (50.8%) |
| 35 to 44 Years | 658 (18.9%) | 2,208 (63.5%) |
| 45 to 54 Years | 755 (21.9%) | 2,077 (60.2%) |
| 55 to 64 Years | 656 (14.3%) | 3,555 (77.7%) |
| 65 to 74 Years | 4,594 (98.5%) | 2,495 (53.5%) |
| 75 Years and over | 3,716 (99.8%) | 2,253 (60.5%) |
| Total | 13,111 (43.8%) | 18,795 (62.8%) |
Disability Status by Sex by Age in Vero Beach South
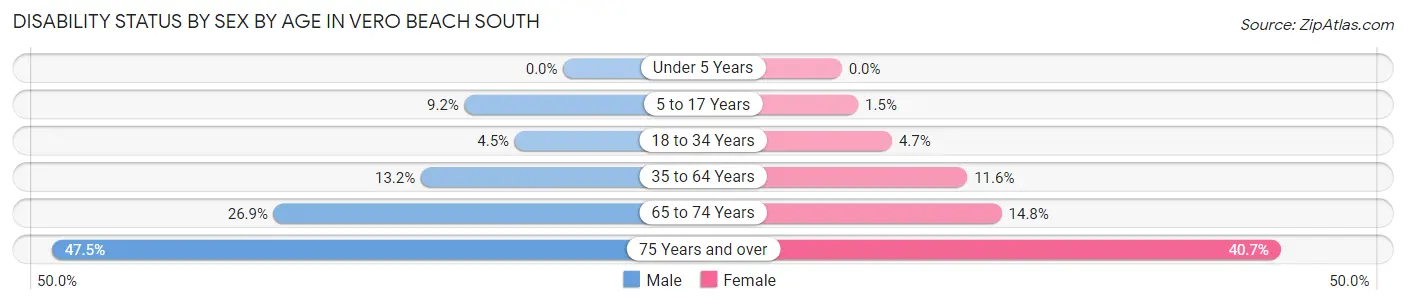
| Age Bracket | Male | Female |
| Under 5 Years | 0 (0.0%) | 0 (0.0%) |
| 5 to 17 Years | 161 (9.2%) | 27 (1.5%) |
| 18 to 34 Years | 133 (4.5%) | 116 (4.7%) |
| 35 to 64 Years | 699 (13.2%) | 723 (11.6%) |
| 65 to 74 Years | 570 (26.9%) | 377 (14.8%) |
| 75 Years and over | 764 (47.5%) | 861 (40.7%) |
Disability Class by Sex by Age in Vero Beach South
Disability Class: Hearing Difficulty
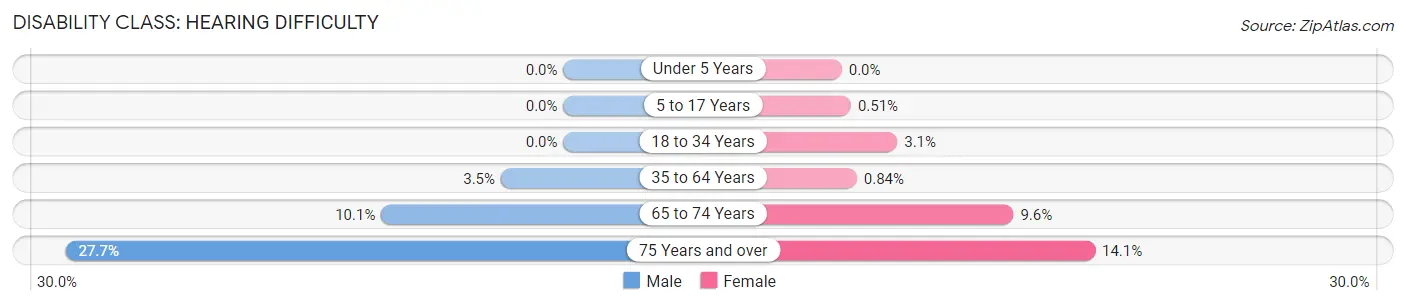
| Age Bracket | Male | Female |
| Under 5 Years | 0 (0.0%) | 0 (0.0%) |
| 5 to 17 Years | 0 (0.0%) | 9 (0.5%) |
| 18 to 34 Years | 0 (0.0%) | 77 (3.1%) |
| 35 to 64 Years | 184 (3.5%) | 52 (0.8%) |
| 65 to 74 Years | 215 (10.1%) | 243 (9.6%) |
| 75 Years and over | 446 (27.7%) | 298 (14.1%) |
Disability Class: Vision Difficulty
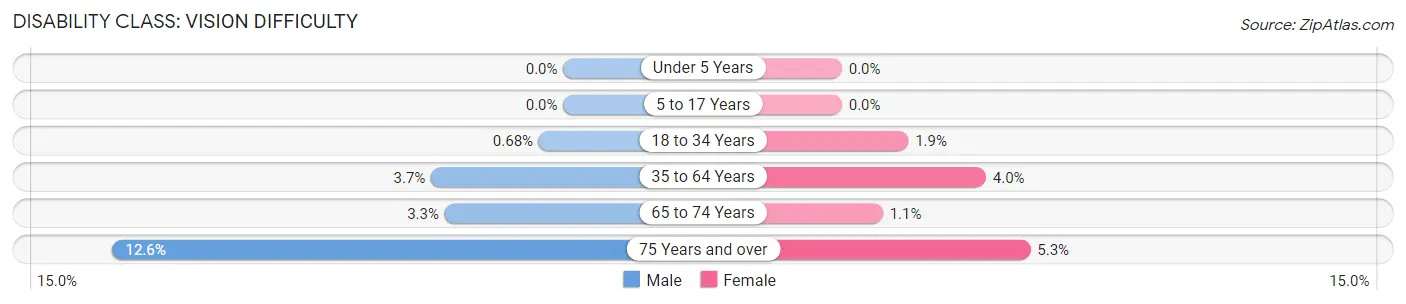
| Age Bracket | Male | Female |
| Under 5 Years | 0 (0.0%) | 0 (0.0%) |
| 5 to 17 Years | 0 (0.0%) | 0 (0.0%) |
| 18 to 34 Years | 20 (0.7%) | 46 (1.8%) |
| 35 to 64 Years | 195 (3.7%) | 249 (4.0%) |
| 65 to 74 Years | 70 (3.3%) | 29 (1.1%) |
| 75 Years and over | 202 (12.6%) | 111 (5.2%) |
Disability Class: Cognitive Difficulty
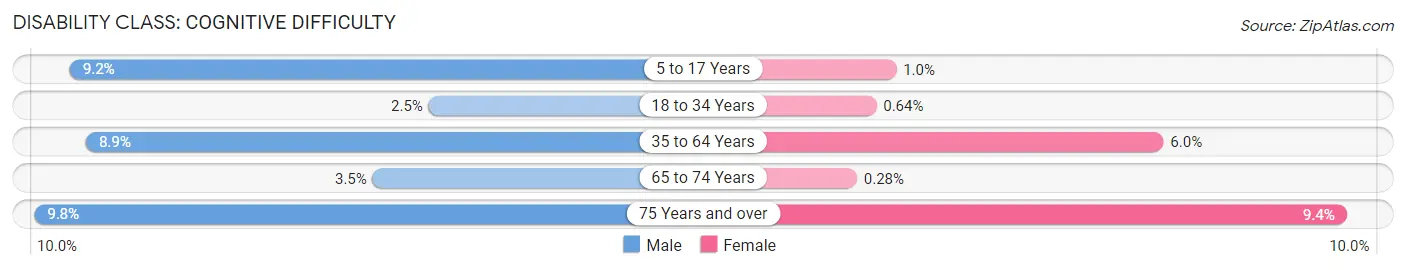
| Age Bracket | Male | Female |
| 5 to 17 Years | 161 (9.2%) | 18 (1.0%) |
| 18 to 34 Years | 74 (2.5%) | 16 (0.6%) |
| 35 to 64 Years | 469 (8.9%) | 371 (6.0%) |
| 65 to 74 Years | 75 (3.5%) | 7 (0.3%) |
| 75 Years and over | 158 (9.8%) | 198 (9.4%) |
Disability Class: Ambulatory Difficulty
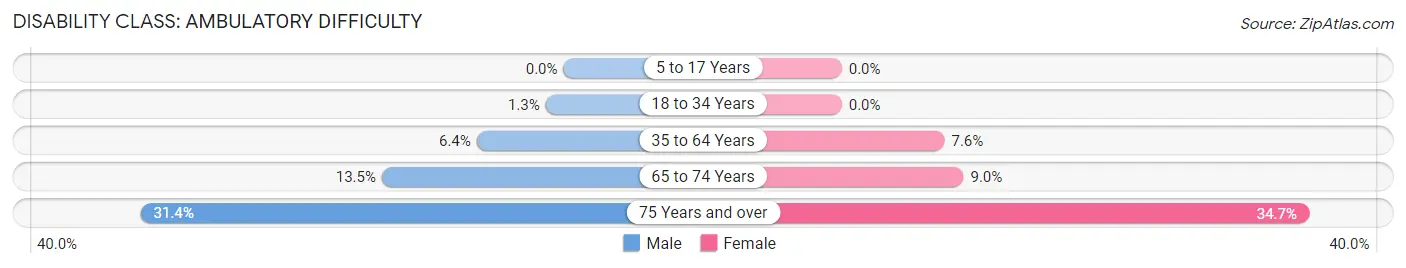
| Age Bracket | Male | Female |
| 5 to 17 Years | 0 (0.0%) | 0 (0.0%) |
| 18 to 34 Years | 39 (1.3%) | 0 (0.0%) |
| 35 to 64 Years | 341 (6.4%) | 474 (7.6%) |
| 65 to 74 Years | 286 (13.5%) | 230 (9.0%) |
| 75 Years and over | 505 (31.4%) | 733 (34.7%) |
Disability Class: Self-Care Difficulty
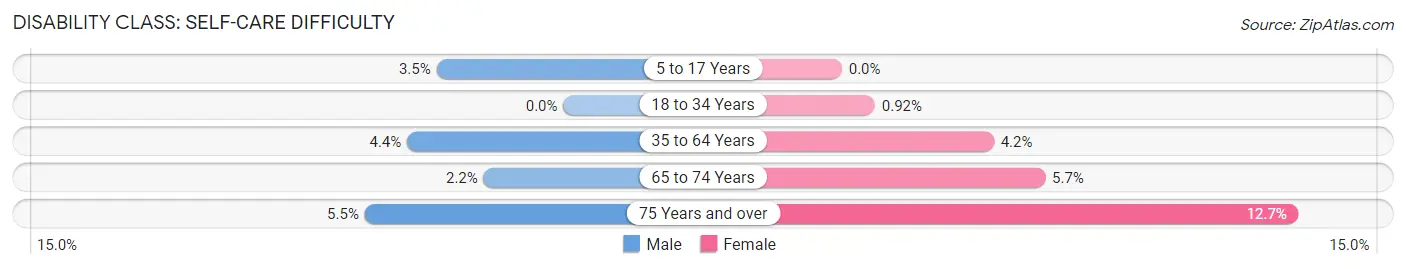
| Age Bracket | Male | Female |
| 5 to 17 Years | 62 (3.5%) | 0 (0.0%) |
| 18 to 34 Years | 0 (0.0%) | 23 (0.9%) |
| 35 to 64 Years | 230 (4.3%) | 263 (4.2%) |
| 65 to 74 Years | 47 (2.2%) | 144 (5.7%) |
| 75 Years and over | 89 (5.5%) | 269 (12.7%) |
Technology Access in Vero Beach South
Computing Device Access in Vero Beach South
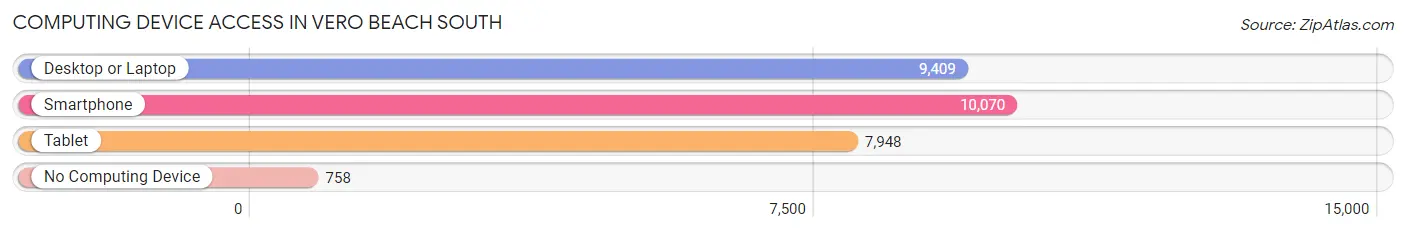
| Device Type | # Households | % Households |
| Desktop or Laptop | 9,409 | 81.3% |
| Smartphone | 10,070 | 87.1% |
| Tablet | 7,948 | 68.7% |
| No Computing Device | 758 | 6.6% |
| Total | 11,568 | 100.0% |
Internet Access in Vero Beach South
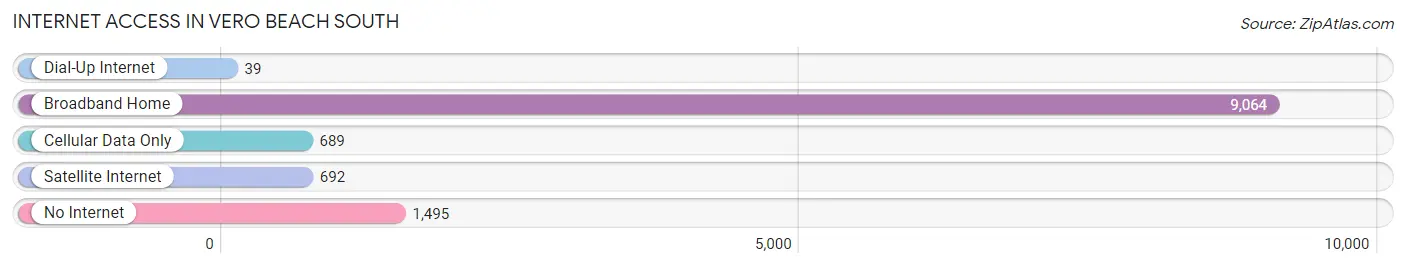
| Internet Type | # Households | % Households |
| Dial-Up Internet | 39 | 0.3% |
| Broadband Home | 9,064 | 78.3% |
| Cellular Data Only | 689 | 6.0% |
| Satellite Internet | 692 | 6.0% |
| No Internet | 1,495 | 12.9% |
| Total | 11,568 | 100.0% |
Vero Beach South Summary
Vero Beach South, Florida is a small city located in Indian River County, on the east coast of the state. It is part of the larger metropolitan area of Vero Beach, which is located on the Treasure Coast of Florida. The city has a population of approximately 15,000 people and is known for its beautiful beaches, lush vegetation, and laid-back atmosphere.
Geography
Vero Beach South is located on the east coast of Florida, approximately halfway between Miami and Jacksonville. It is situated on the Indian River Lagoon, which is part of the Intracoastal Waterway. The city is bordered by the Atlantic Ocean to the east and the Indian River to the west. The city is also home to several small islands, including Pelican Island, which is a National Wildlife Refuge. The city is located in a humid subtropical climate zone, with hot, humid summers and mild winters.
Economy
Vero Beach South is a popular tourist destination, and the city’s economy is largely based on tourism. The city is home to several resorts and hotels, as well as a variety of restaurants and shops. The city is also home to several marinas, which provide access to the Intracoastal Waterway and the Atlantic Ocean. The city is also home to several manufacturing and industrial businesses, as well as a variety of retail stores.
Demographics
As of the 2010 census, Vero Beach South had a population of 15,220 people. The racial makeup of the city was 87.3% White, 8.2% African American, 0.4% Native American, 0.9% Asian, 0.1% Pacific Islander, 1.3% from other races, and 1.8% from two or more races. Hispanic or Latino of any race were 5.2% of the population.
The median income for a household in the city was $41,945, and the median income for a family was $50,945. The per capita income for the city was $25,945. About 8.2% of families and 10.3% of the population were below the poverty line, including 14.2% of those under age 18 and 6.2% of those age 65 or over.
History
Vero Beach South was first settled in the late 19th century by settlers from the Bahamas. The city was incorporated in 1925 and was originally known as Vero Beach South. The city was named after the nearby Indian River, which was named by Spanish explorers in the 16th century. The city was a popular tourist destination in the early 20th century, and it was home to several resorts and hotels. The city was also home to a number of citrus groves, which provided employment for many of the city’s residents.
In the late 20th century, the city experienced a period of rapid growth, as new businesses and residential developments were built. The city is now home to a variety of businesses, including retail stores, restaurants, and hotels. The city is also home to several marinas, which provide access to the Intracoastal Waterway and the Atlantic Ocean. The city is also home to several parks and recreational areas, including the Vero Beach South Beach Park.
Common Questions
What is Per Capita Income in Vero Beach South?
Per Capita income in Vero Beach South is $37,734.
What is the Median Family Income in Vero Beach South?
Median Family Income in Vero Beach South is $83,287.
What is the Median Household income in Vero Beach South?
Median Household Income in Vero Beach South is $70,252.
What is Income or Wage Gap in Vero Beach South?
Income or Wage Gap in Vero Beach South is 17.7%.
Women in Vero Beach South earn 82.3 cents for every dollar earned by a man.
What is Inequality or Gini Index in Vero Beach South?
Inequality or Gini Index in Vero Beach South is 0.43.
What is the Total Population of Vero Beach South?
Total Population of Vero Beach South is 29,965.
What is the Total Male Population of Vero Beach South?
Total Male Population of Vero Beach South is 14,429.
What is the Total Female Population of Vero Beach South?
Total Female Population of Vero Beach South is 15,536.
What is the Ratio of Males per 100 Females in Vero Beach South?
There are 92.87 Males per 100 Females in Vero Beach South.
What is the Ratio of Females per 100 Males in Vero Beach South?
There are 107.67 Females per 100 Males in Vero Beach South.
What is the Median Population Age in Vero Beach South?
Median Population Age in Vero Beach South is 48.8 Years.
What is the Average Family Size in Vero Beach South
Average Family Size in Vero Beach South is 3.2 People.
What is the Average Household Size in Vero Beach South
Average Household Size in Vero Beach South is 2.6 People.
How Large is the Labor Force in Vero Beach South?
There are 14,528 People in the Labor Forcein in Vero Beach South.
What is the Percentage of People in the Labor Force in Vero Beach South?
55.7% of People are in the Labor Force in Vero Beach South.
What is the Unemployment Rate in Vero Beach South?
Unemployment Rate in Vero Beach South is 4.6%.