Union City, GA Map & Demographics
Union City Map
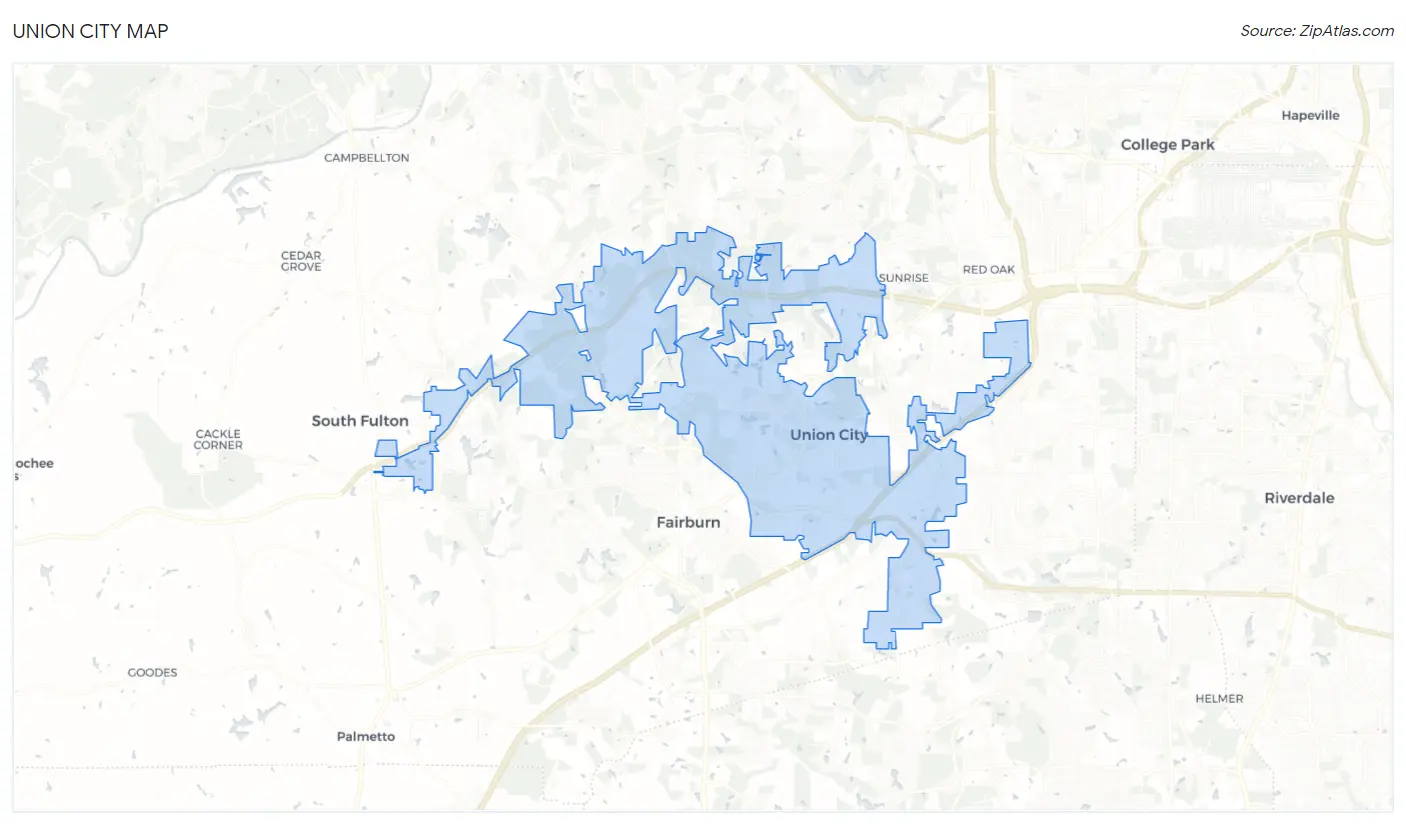
Union City Overview
$26,549
PER CAPITA INCOME
$66,176
AVG FAMILY INCOME
$46,696
AVG HOUSEHOLD INCOME
15.9%
WAGE / INCOME GAP [ % ]
84.1¢/ $1
WAGE / INCOME GAP [ $ ]
$8,075
FAMILY INCOME DEFICIT
0.40
INEQUALITY / GINI INDEX
26,869
TOTAL POPULATION
12,073
MALE POPULATION
14,796
FEMALE POPULATION
81.60
MALES / 100 FEMALES
122.55
FEMALES / 100 MALES
32.7
MEDIAN AGE
3.3
AVG FAMILY SIZE
2.4
AVG HOUSEHOLD SIZE
13,979
LABOR FORCE [ PEOPLE ]
69.1%
PERCENT IN LABOR FORCE
4.6%
UNEMPLOYMENT RATE
Union City Zip Codes
Union City Area Codes
Income in Union City
Income Overview in Union City
Per Capita Income in Union City is $26,549, while median incomes of families and households are $66,176 and $46,696 respectively.
| Characteristic | Number | Measure |
| Per Capita Income | 26,869 | $26,549 |
| Median Family Income | 6,289 | $66,176 |
| Mean Family Income | 6,289 | $72,945 |
| Median Household Income | 11,311 | $46,696 |
| Mean Household Income | 11,311 | $61,403 |
| Income Deficit | 6,289 | $8,075 |
| Wage / Income Gap (%) | 26,869 | 15.86% |
| Wage / Income Gap ($) | 26,869 | 84.14¢ per $1 |
| Gini / Inequality Index | 26,869 | 0.40 |
Earnings by Sex in Union City
Average Earnings in Union City are $38,405, $43,985 for men and $37,010 for women, a difference of 15.9%.
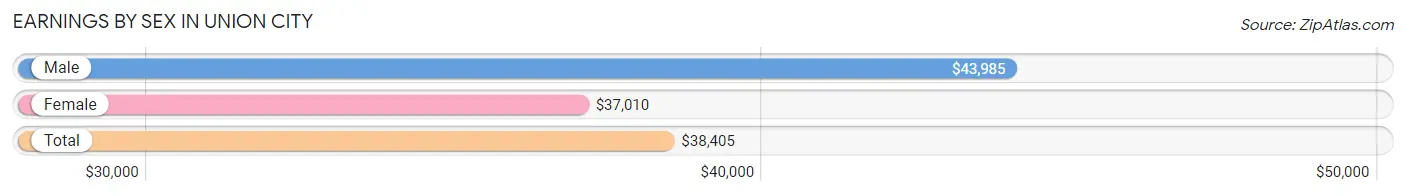
| Sex | Number | Average Earnings |
| Male | 5,830 (40.9%) | $43,985 |
| Female | 8,425 (59.1%) | $37,010 |
| Total | 14,255 (100.0%) | $38,405 |
Earnings by Sex by Income Bracket in Union City
The most common earnings brackets in Union City are $45,000 to $49,999 for men (802 | 13.8%) and $35,000 to $39,999 for women (958 | 11.4%).
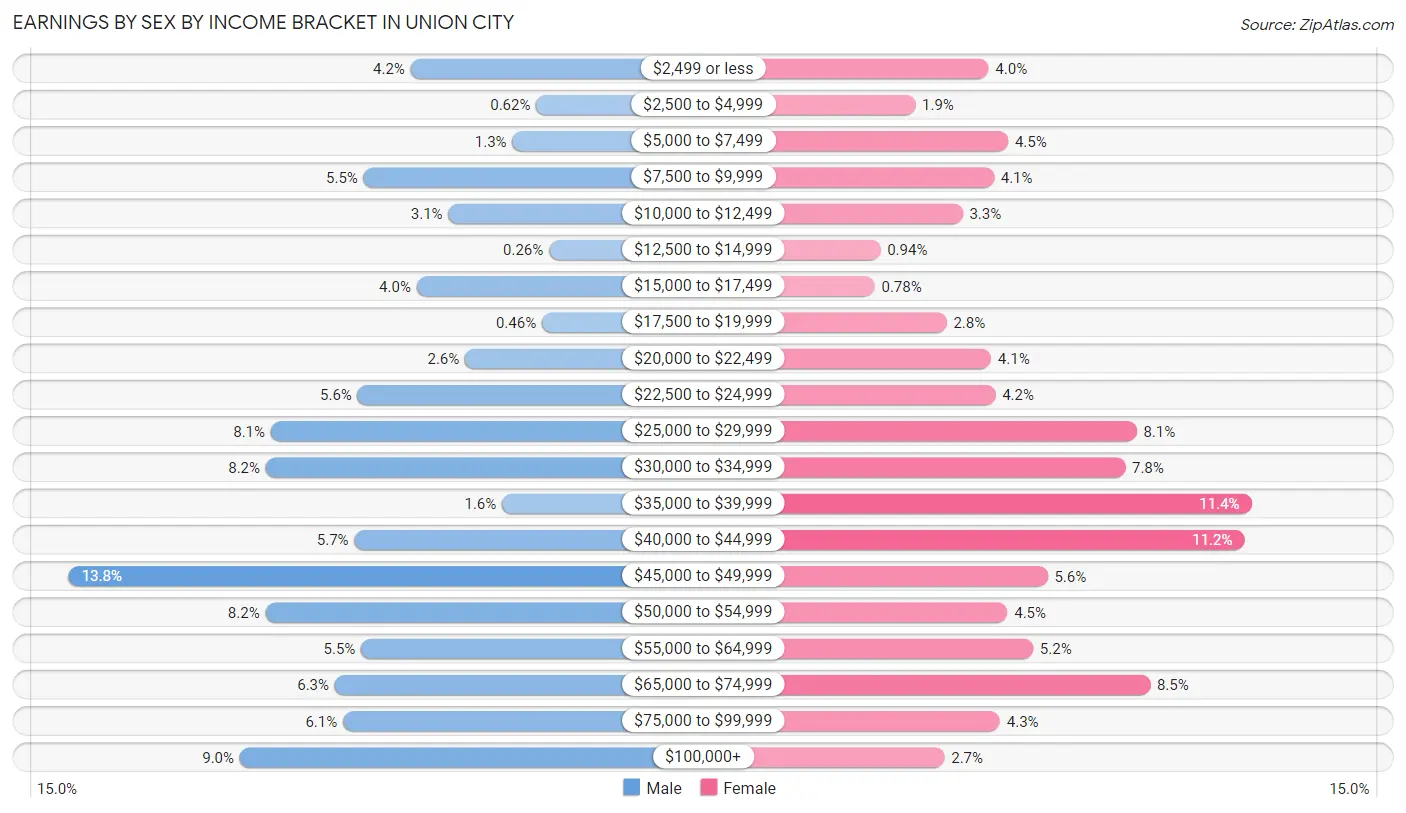
| Income | Male | Female |
| $2,499 or less | 242 (4.2%) | 335 (4.0%) |
| $2,500 to $4,999 | 36 (0.6%) | 162 (1.9%) |
| $5,000 to $7,499 | 75 (1.3%) | 382 (4.5%) |
| $7,500 to $9,999 | 319 (5.5%) | 348 (4.1%) |
| $10,000 to $12,499 | 180 (3.1%) | 274 (3.3%) |
| $12,500 to $14,999 | 15 (0.3%) | 79 (0.9%) |
| $15,000 to $17,499 | 232 (4.0%) | 66 (0.8%) |
| $17,500 to $19,999 | 27 (0.5%) | 236 (2.8%) |
| $20,000 to $22,499 | 153 (2.6%) | 341 (4.1%) |
| $22,500 to $24,999 | 329 (5.6%) | 351 (4.2%) |
| $25,000 to $29,999 | 471 (8.1%) | 686 (8.1%) |
| $30,000 to $34,999 | 479 (8.2%) | 659 (7.8%) |
| $35,000 to $39,999 | 92 (1.6%) | 958 (11.4%) |
| $40,000 to $44,999 | 334 (5.7%) | 941 (11.2%) |
| $45,000 to $49,999 | 802 (13.8%) | 475 (5.6%) |
| $50,000 to $54,999 | 480 (8.2%) | 380 (4.5%) |
| $55,000 to $64,999 | 323 (5.5%) | 441 (5.2%) |
| $65,000 to $74,999 | 366 (6.3%) | 718 (8.5%) |
| $75,000 to $99,999 | 353 (6.0%) | 362 (4.3%) |
| $100,000+ | 522 (8.9%) | 231 (2.7%) |
| Total | 5,830 (100.0%) | 8,425 (100.0%) |
Earnings by Sex by Educational Attainment in Union City
Average earnings in Union City are $46,541 for men and $39,007 for women, a difference of 16.2%. Men with an educational attainment of graduate degree enjoy the highest average annual earnings of $53,117, while those with high school diploma education earn the least with $44,824. Women with an educational attainment of graduate degree earn the most with the average annual earnings of $61,841, while those with less than high school education have the smallest earnings of $28,670.
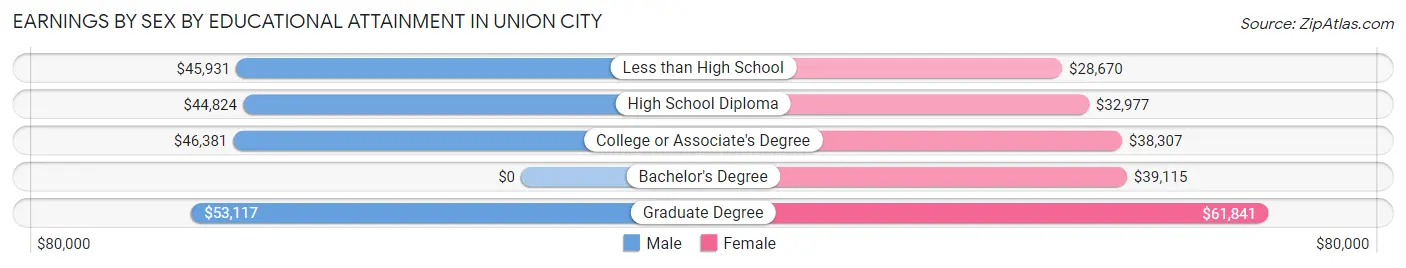
| Educational Attainment | Male Income | Female Income |
| Less than High School | $45,931 | $28,670 |
| High School Diploma | $44,824 | $32,977 |
| College or Associate's Degree | $46,381 | $38,307 |
| Bachelor's Degree | - | - |
| Graduate Degree | $53,117 | $61,841 |
| Total | $46,541 | $39,007 |
Family Income in Union City
Family Income Brackets in Union City
According to the Union City family income data, there are 1,176 families falling into the $100,000 to $149,999 income range, which is the most common income bracket and makes up 18.7% of all families. Conversely, the $10,000 to $14,999 income bracket is the least frequent group with only 119 families (1.9%) belonging to this category.
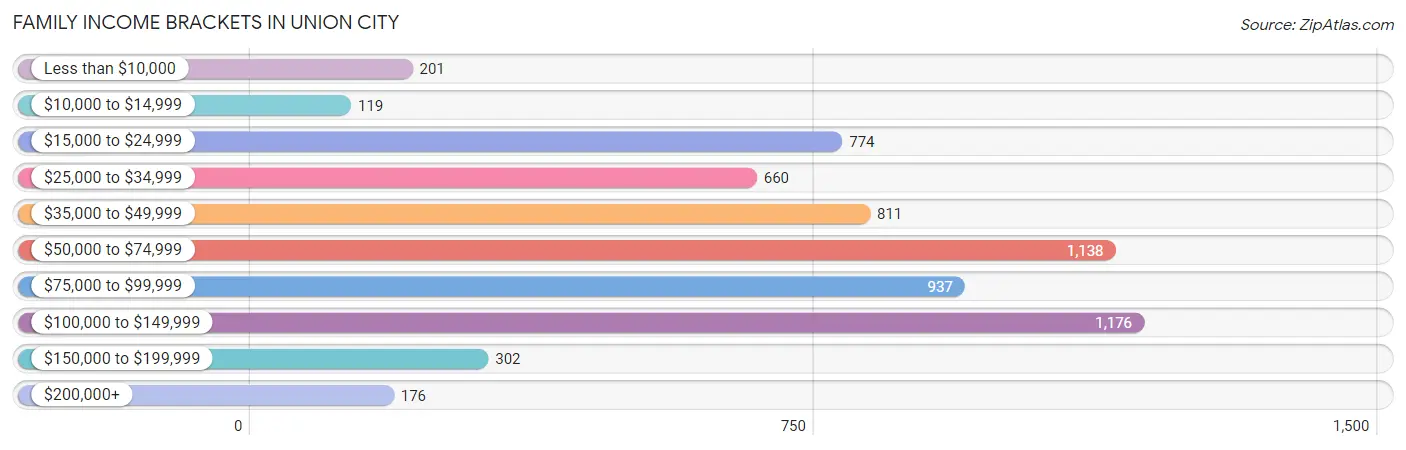
| Income Bracket | # Families | % Families |
| Less than $10,000 | 201 | 3.2% |
| $10,000 to $14,999 | 119 | 1.9% |
| $15,000 to $24,999 | 774 | 12.3% |
| $25,000 to $34,999 | 660 | 10.5% |
| $35,000 to $49,999 | 811 | 12.9% |
| $50,000 to $74,999 | 1,138 | 18.1% |
| $75,000 to $99,999 | 937 | 14.9% |
| $100,000 to $149,999 | 1,176 | 18.7% |
| $150,000 to $199,999 | 302 | 4.8% |
| $200,000+ | 176 | 2.8% |
Family Income by Famaliy Size in Union City
7+ person families (107 | 1.7%) account for the highest median family income in Union City with $122,019 per family, while 4-person families (1,020 | 16.2%) have the highest median income of $27,627 per family member.
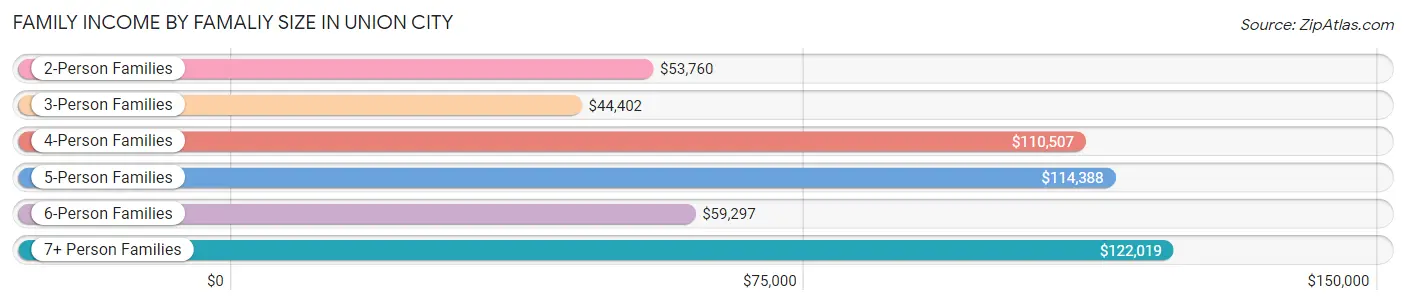
| Income Bracket | # Families | Median Income |
| 2-Person Families | 3,061 (48.7%) | $53,760 |
| 3-Person Families | 1,380 (21.9%) | $44,402 |
| 4-Person Families | 1,020 (16.2%) | $110,507 |
| 5-Person Families | 637 (10.1%) | $114,388 |
| 6-Person Families | 84 (1.3%) | $59,297 |
| 7+ Person Families | 107 (1.7%) | $122,019 |
| Total | 6,289 (100.0%) | $66,176 |
Family Income by Number of Earners in Union City
The median family income in Union City is $66,176, with families comprising 3+ earners (363) having the highest median family income of $122,083, while families with no earners (793) have the lowest median family income of $18,736, accounting for 5.8% and 12.6% of families, respectively.
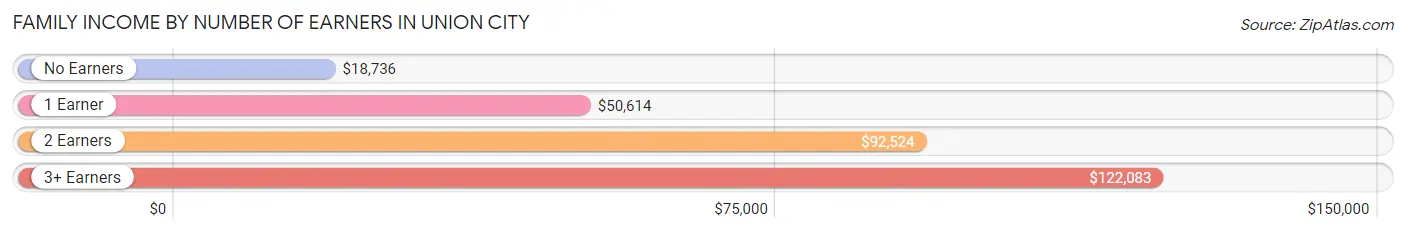
| Number of Earners | # Families | Median Income |
| No Earners | 793 (12.6%) | $18,736 |
| 1 Earner | 2,620 (41.7%) | $50,614 |
| 2 Earners | 2,513 (40.0%) | $92,524 |
| 3+ Earners | 363 (5.8%) | $122,083 |
| Total | 6,289 (100.0%) | $66,176 |
Household Income in Union City
Household Income Brackets in Union City
With 2,093 households falling in the category, the $35,000 to $49,999 income range is the most frequent in Union City, accounting for 18.5% of all households. In contrast, only 170 households (1.5%) fall into the $200,000+ income bracket, making it the least populous group.
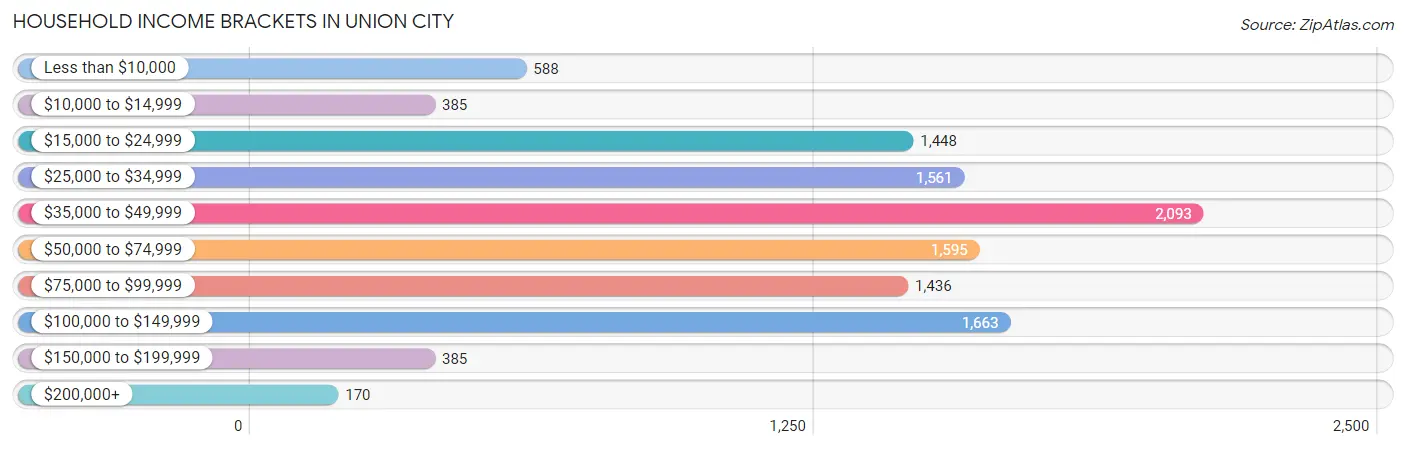
| Income Bracket | # Households | % Households |
| Less than $10,000 | 588 | 5.2% |
| $10,000 to $14,999 | 385 | 3.4% |
| $15,000 to $24,999 | 1,448 | 12.8% |
| $25,000 to $34,999 | 1,561 | 13.8% |
| $35,000 to $49,999 | 2,093 | 18.5% |
| $50,000 to $74,999 | 1,595 | 14.1% |
| $75,000 to $99,999 | 1,436 | 12.7% |
| $100,000 to $149,999 | 1,663 | 14.7% |
| $150,000 to $199,999 | 385 | 3.4% |
| $200,000+ | 170 | 1.5% |
Household Income by Householder Age in Union City
The median household income in Union City is $46,696, with the highest median household income of $67,550 found in the 25 to 44 years age bracket for the primary householder. A total of 4,693 households (41.5%) fall into this category. Meanwhile, the 65+ years age bracket for the primary householder has the lowest median household income of $24,742, with 2,194 households (19.4%) in this group.
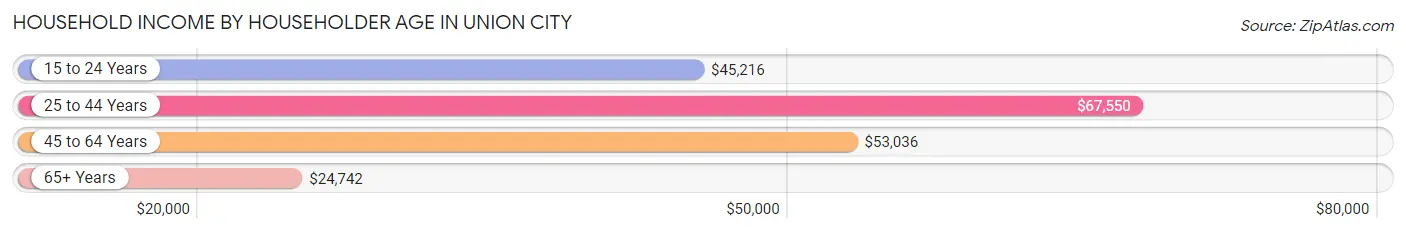
| Income Bracket | # Households | Median Income |
| 15 to 24 Years | 817 (7.2%) | $45,216 |
| 25 to 44 Years | 4,693 (41.5%) | $67,550 |
| 45 to 64 Years | 3,607 (31.9%) | $53,036 |
| 65+ Years | 2,194 (19.4%) | $24,742 |
| Total | 11,311 (100.0%) | $46,696 |
Poverty in Union City
Income Below Poverty by Sex and Age in Union City
With 10.1% poverty level for males and 14.3% for females among the residents of Union City, 16 and 17 year old males and 75 year old and over females are the most vulnerable to poverty, with 61 males (22.9%) and 217 females (32.0%) in their respective age groups living below the poverty level.
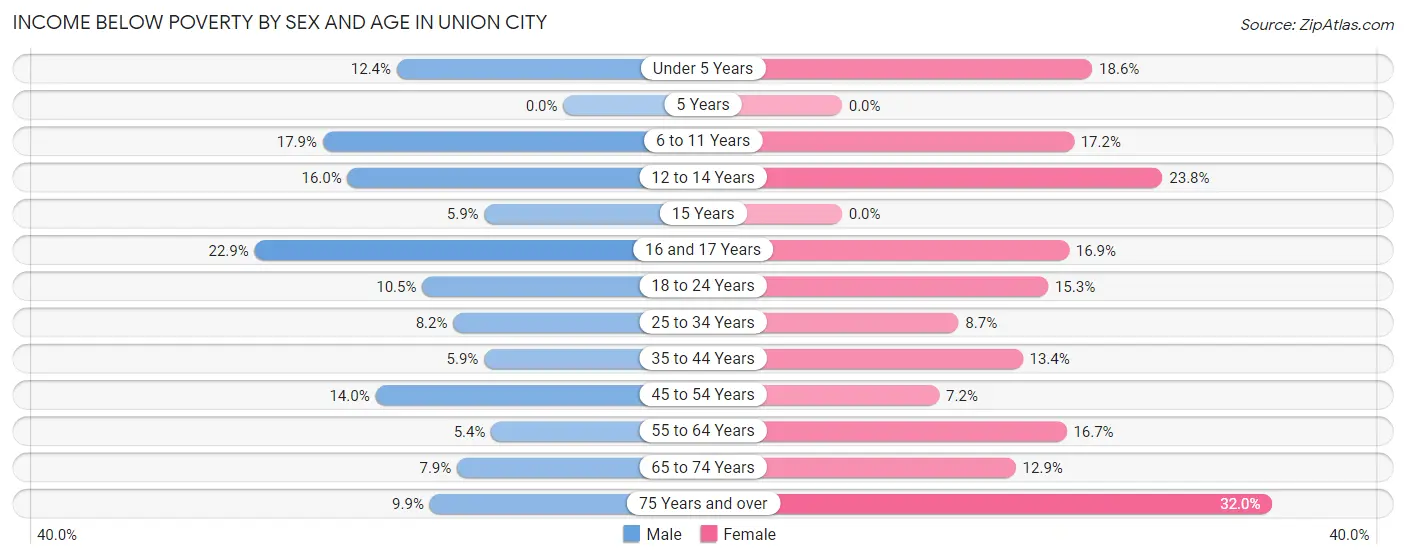
| Age Bracket | Male | Female |
| Under 5 Years | 91 (12.4%) | 137 (18.6%) |
| 5 Years | 0 (0.0%) | 0 (0.0%) |
| 6 to 11 Years | 240 (17.9%) | 203 (17.2%) |
| 12 to 14 Years | 103 (16.0%) | 179 (23.8%) |
| 15 Years | 26 (5.9%) | 0 (0.0%) |
| 16 and 17 Years | 61 (22.9%) | 58 (16.9%) |
| 18 to 24 Years | 146 (10.5%) | 233 (15.3%) |
| 25 to 34 Years | 155 (8.2%) | 221 (8.7%) |
| 35 to 44 Years | 125 (5.9%) | 285 (13.4%) |
| 45 to 54 Years | 147 (14.0%) | 106 (7.2%) |
| 55 to 64 Years | 32 (5.3%) | 316 (16.7%) |
| 65 to 74 Years | 56 (7.9%) | 151 (12.9%) |
| 75 Years and over | 25 (9.9%) | 217 (32.0%) |
| Total | 1,207 (10.1%) | 2,106 (14.3%) |
Income Above Poverty by Sex and Age in Union City
According to the poverty statistics in Union City, males aged 5 years and females aged 5 years are the age groups that are most secure financially, with 100.0% of males and 100.0% of females in these age groups living above the poverty line.
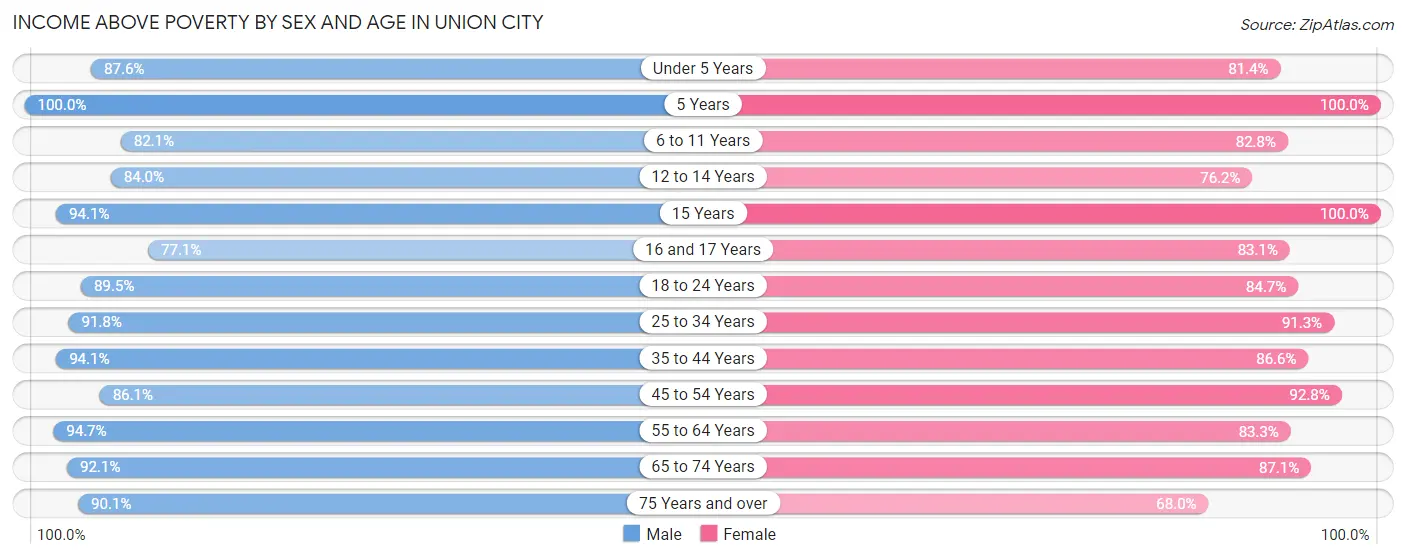
| Age Bracket | Male | Female |
| Under 5 Years | 645 (87.6%) | 600 (81.4%) |
| 5 Years | 470 (100.0%) | 160 (100.0%) |
| 6 to 11 Years | 1,104 (82.1%) | 976 (82.8%) |
| 12 to 14 Years | 540 (84.0%) | 573 (76.2%) |
| 15 Years | 418 (94.1%) | 114 (100.0%) |
| 16 and 17 Years | 205 (77.1%) | 286 (83.1%) |
| 18 to 24 Years | 1,249 (89.5%) | 1,289 (84.7%) |
| 25 to 34 Years | 1,742 (91.8%) | 2,331 (91.3%) |
| 35 to 44 Years | 2,002 (94.1%) | 1,839 (86.6%) |
| 45 to 54 Years | 907 (86.1%) | 1,361 (92.8%) |
| 55 to 64 Years | 566 (94.7%) | 1,579 (83.3%) |
| 65 to 74 Years | 654 (92.1%) | 1,019 (87.1%) |
| 75 Years and over | 227 (90.1%) | 462 (68.0%) |
| Total | 10,729 (89.9%) | 12,589 (85.7%) |
Income Below Poverty Among Married-Couple Families in Union City
The poverty statistics for married-couple families in Union City show that 4.7% or 105 of the total 2,228 families live below the poverty line. Families with no children have the highest poverty rate of 6.5%, comprising of 57 families. On the other hand, families with 3 or 4 children have the lowest poverty rate of 0.0%, which includes 0 families.
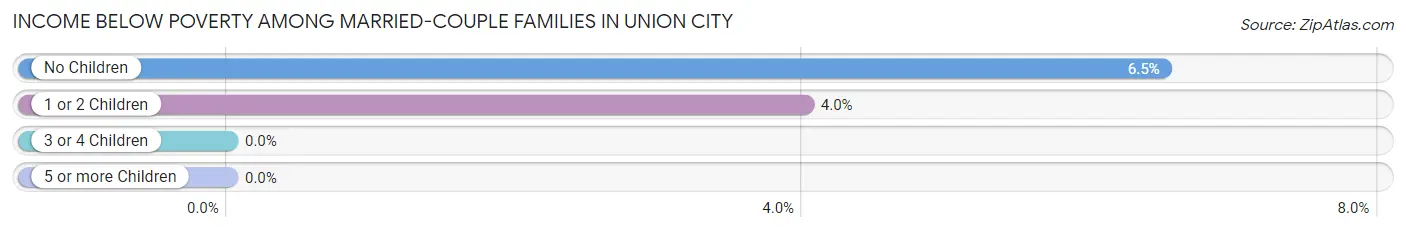
| Children | Above Poverty | Below Poverty |
| No Children | 820 (93.5%) | 57 (6.5%) |
| 1 or 2 Children | 1,150 (96.0%) | 48 (4.0%) |
| 3 or 4 Children | 153 (100.0%) | 0 (0.0%) |
| 5 or more Children | 0 (0.0%) | 0 (0.0%) |
| Total | 2,123 (95.3%) | 105 (4.7%) |
Income Below Poverty Among Single-Parent Households in Union City
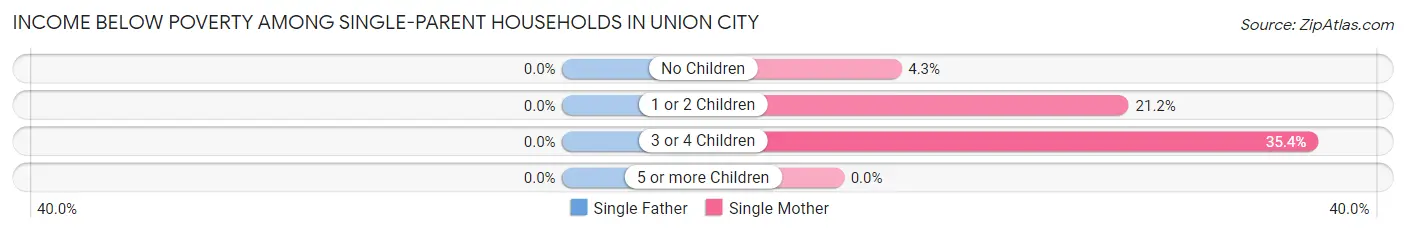
| Children | Single Father | Single Mother |
| No Children | 0 (0.0%) | 46 (4.3%) |
| 1 or 2 Children | 0 (0.0%) | 360 (21.2%) |
| 3 or 4 Children | 0 (0.0%) | 158 (35.3%) |
| 5 or more Children | 0 (0.0%) | 0 (0.0%) |
| Total | 0 (0.0%) | 564 (17.4%) |
Income Below Poverty Among Married-Couple vs Single-Parent Households in Union City
The poverty data for Union City shows that 105 of the married-couple family households (4.7%) and 564 of the single-parent households (13.9%) are living below the poverty level. Within the married-couple family households, those with no children have the highest poverty rate, with 57 households (6.5%) falling below the poverty line. Among the single-parent households, those with 3 or 4 children have the highest poverty rate, with 158 household (33.3%) living below poverty.
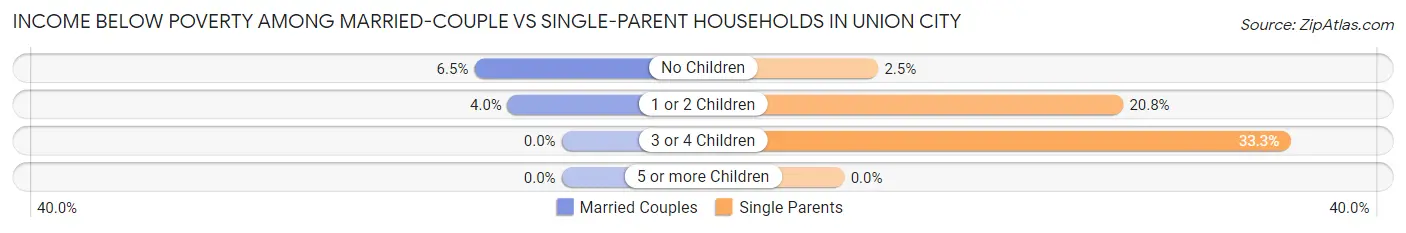
| Children | Married-Couple Families | Single-Parent Households |
| No Children | 57 (6.5%) | 46 (2.5%) |
| 1 or 2 Children | 48 (4.0%) | 360 (20.8%) |
| 3 or 4 Children | 0 (0.0%) | 158 (33.3%) |
| 5 or more Children | 0 (0.0%) | 0 (0.0%) |
| Total | 105 (4.7%) | 564 (13.9%) |
Race in Union City
The most populous races in Union City are Black / African American (23,725 | 88.3%), Hispanic or Latino (1,324 | 4.9%), and Two or more Races (1,194 | 4.4%).
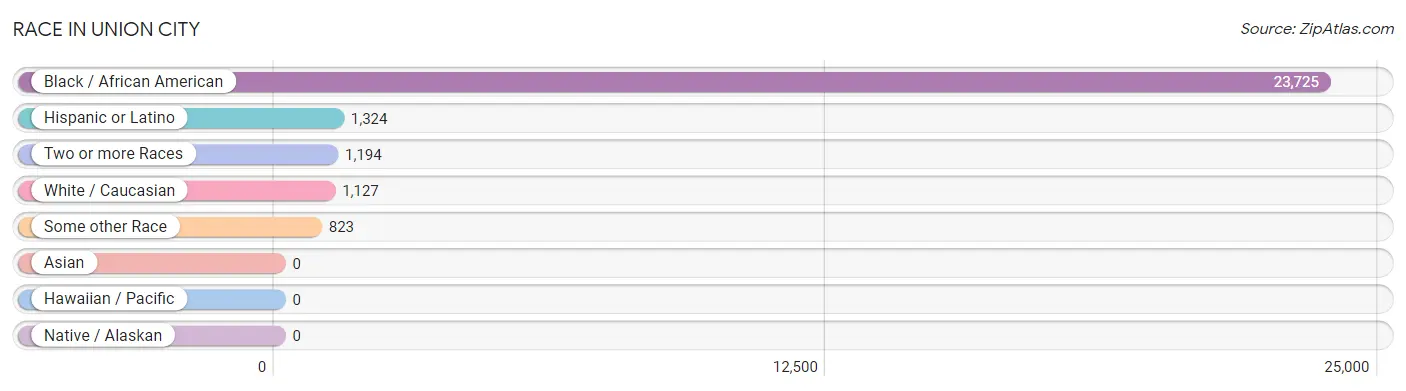
| Race | # Population | % Population |
| Asian | 0 | 0.0% |
| Black / African American | 23,725 | 88.3% |
| Hawaiian / Pacific | 0 | 0.0% |
| Hispanic or Latino | 1,324 | 4.9% |
| Native / Alaskan | 0 | 0.0% |
| White / Caucasian | 1,127 | 4.2% |
| Two or more Races | 1,194 | 4.4% |
| Some other Race | 823 | 3.1% |
| Total | 26,869 | 100.0% |
Ancestry in Union City
The most populous ancestries reported in Union City are Subsaharan African (1,128 | 4.2%), American (1,036 | 3.9%), African (834 | 3.1%), Mexican (529 | 2.0%), and Central American (513 | 1.9%), together accounting for 15.0% of all Union City residents.
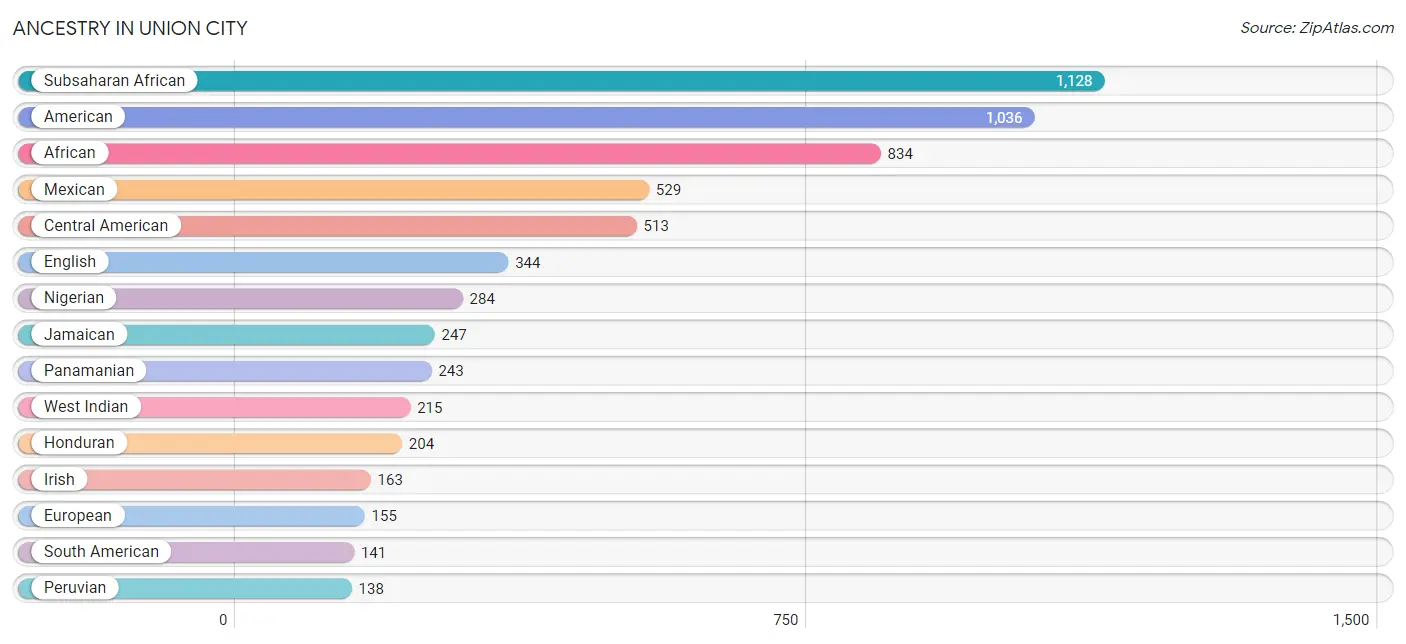
| Ancestry | # Population | % Population |
| African | 834 | 3.1% |
| American | 1,036 | 3.9% |
| Arab | 68 | 0.3% |
| Brazilian | 100 | 0.4% |
| British | 81 | 0.3% |
| Canadian | 39 | 0.2% |
| Central American | 513 | 1.9% |
| Cherokee | 27 | 0.1% |
| Colombian | 3 | 0.0% |
| Dominican | 54 | 0.2% |
| English | 344 | 1.3% |
| European | 155 | 0.6% |
| French | 32 | 0.1% |
| German | 135 | 0.5% |
| Ghanaian | 10 | 0.0% |
| Guatemalan | 66 | 0.3% |
| Haitian | 112 | 0.4% |
| Honduran | 204 | 0.8% |
| Indian (Asian) | 87 | 0.3% |
| Irish | 163 | 0.6% |
| Jamaican | 247 | 0.9% |
| Mexican | 529 | 2.0% |
| Nigerian | 284 | 1.1% |
| Norwegian | 16 | 0.1% |
| Panamanian | 243 | 0.9% |
| Peruvian | 138 | 0.5% |
| Portuguese | 47 | 0.2% |
| Puerto Rican | 68 | 0.3% |
| Romanian | 5 | 0.0% |
| Russian | 5 | 0.0% |
| Scandinavian | 17 | 0.1% |
| Scotch-Irish | 106 | 0.4% |
| Scottish | 16 | 0.1% |
| South American | 141 | 0.5% |
| Subsaharan African | 1,128 | 4.2% |
| West Indian | 215 | 0.8% | View All 36 Rows |
Immigrants in Union City
The most numerous immigrant groups reported in Union City came from Latin America (955 | 3.5%), Central America (474 | 1.8%), Caribbean (422 | 1.6%), Africa (330 | 1.2%), and Jamaica (310 | 1.1%), together accounting for 9.3% of all Union City residents.
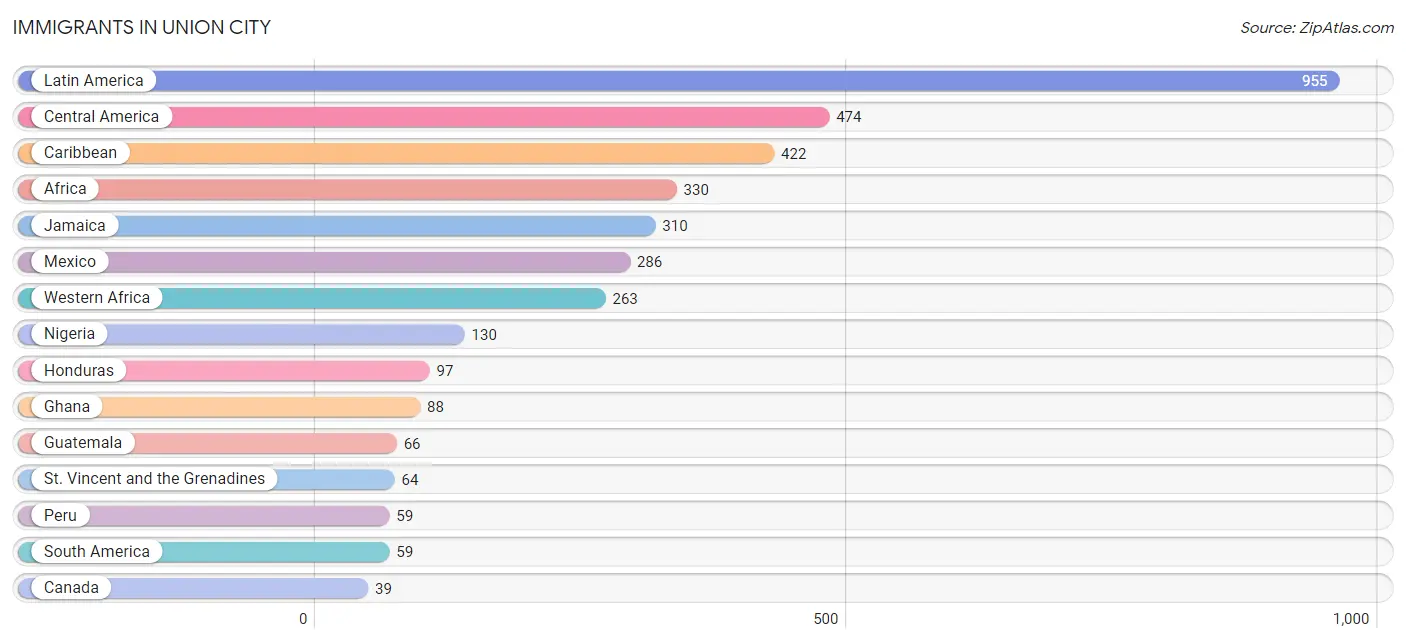
| Immigration Origin | # Population | % Population |
| Africa | 330 | 1.2% |
| Asia | 11 | 0.0% |
| Canada | 39 | 0.2% |
| Caribbean | 422 | 1.6% |
| Central America | 474 | 1.8% |
| Eastern Africa | 35 | 0.1% |
| Ethiopia | 35 | 0.1% |
| Ghana | 88 | 0.3% |
| Guatemala | 66 | 0.3% |
| Haiti | 22 | 0.1% |
| Honduras | 97 | 0.4% |
| India | 11 | 0.0% |
| Jamaica | 310 | 1.1% |
| Latin America | 955 | 3.5% |
| Mexico | 286 | 1.1% |
| Nigeria | 130 | 0.5% |
| Panama | 25 | 0.1% |
| Peru | 59 | 0.2% |
| South America | 59 | 0.2% |
| South Central Asia | 11 | 0.0% |
| St. Vincent and the Grenadines | 64 | 0.2% |
| Trinidad and Tobago | 26 | 0.1% |
| Western Africa | 263 | 1.0% | View All 23 Rows |
Sex and Age in Union City
Sex and Age in Union City
The most populous age groups in Union City are 5 to 9 Years (1,559 | 12.9%) for men and 30 to 34 Years (1,524 | 10.3%) for women.
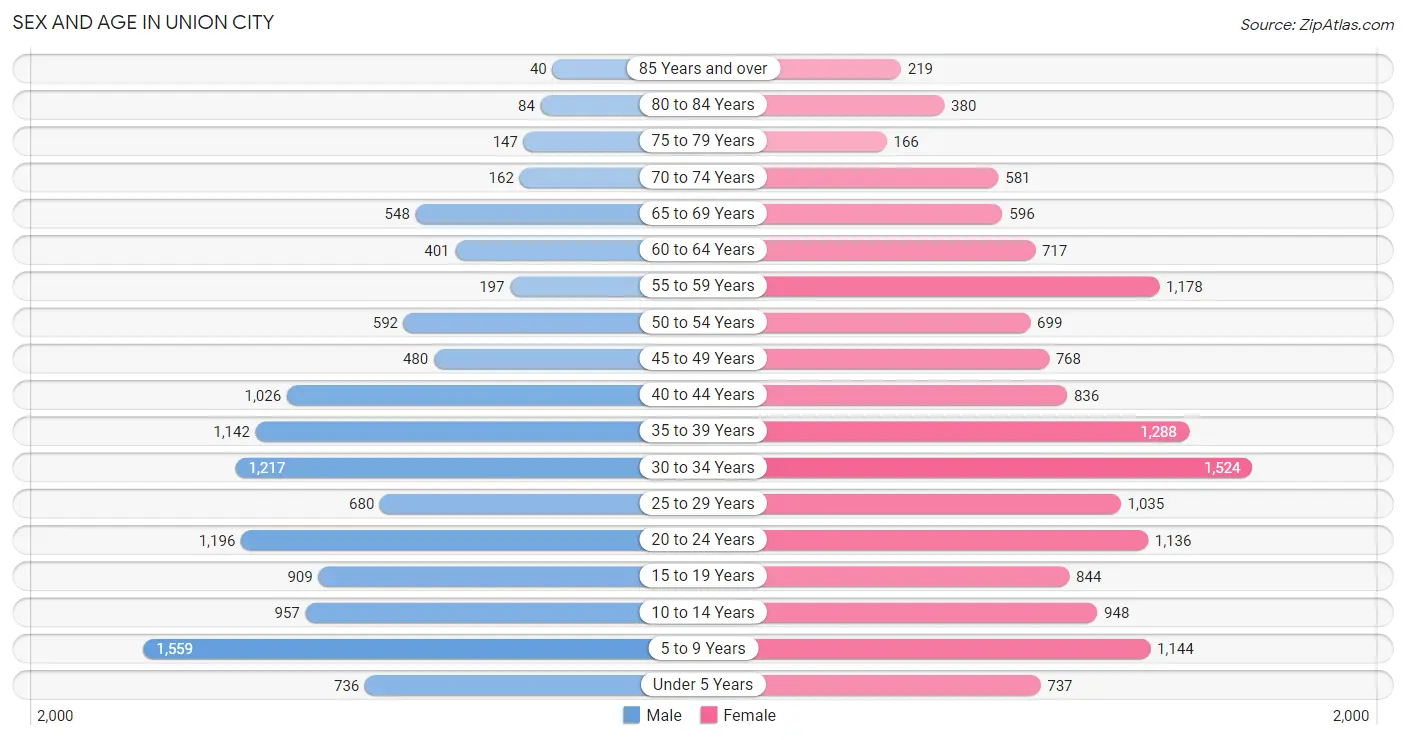
| Age Bracket | Male | Female |
| Under 5 Years | 736 (6.1%) | 737 (5.0%) |
| 5 to 9 Years | 1,559 (12.9%) | 1,144 (7.7%) |
| 10 to 14 Years | 957 (7.9%) | 948 (6.4%) |
| 15 to 19 Years | 909 (7.5%) | 844 (5.7%) |
| 20 to 24 Years | 1,196 (9.9%) | 1,136 (7.7%) |
| 25 to 29 Years | 680 (5.6%) | 1,035 (7.0%) |
| 30 to 34 Years | 1,217 (10.1%) | 1,524 (10.3%) |
| 35 to 39 Years | 1,142 (9.5%) | 1,288 (8.7%) |
| 40 to 44 Years | 1,026 (8.5%) | 836 (5.7%) |
| 45 to 49 Years | 480 (4.0%) | 768 (5.2%) |
| 50 to 54 Years | 592 (4.9%) | 699 (4.7%) |
| 55 to 59 Years | 197 (1.6%) | 1,178 (8.0%) |
| 60 to 64 Years | 401 (3.3%) | 717 (4.9%) |
| 65 to 69 Years | 548 (4.5%) | 596 (4.0%) |
| 70 to 74 Years | 162 (1.3%) | 581 (3.9%) |
| 75 to 79 Years | 147 (1.2%) | 166 (1.1%) |
| 80 to 84 Years | 84 (0.7%) | 380 (2.6%) |
| 85 Years and over | 40 (0.3%) | 219 (1.5%) |
| Total | 12,073 (100.0%) | 14,796 (100.0%) |
Families and Households in Union City
Median Family Size in Union City
The median family size in Union City is 3.26 persons per family, with married-couple families (2,228 | 35.4%) accounting for the largest median family size of 3.45 persons per family. On the other hand, single male/father families (814 | 12.9%) represent the smallest median family size with 2.46 persons per family.
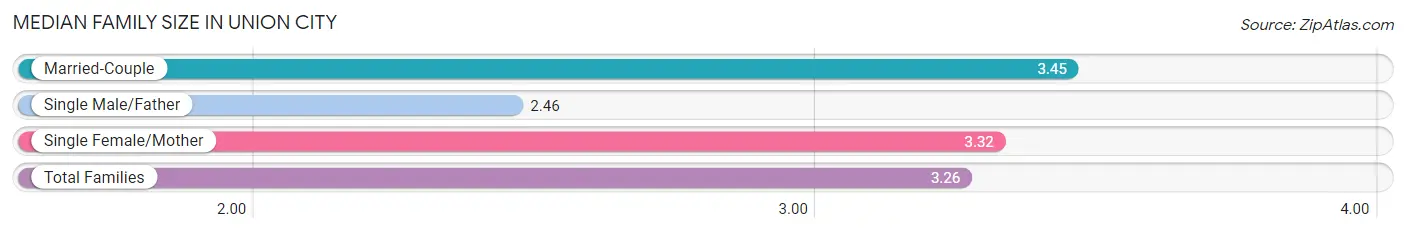
| Family Type | # Families | Family Size |
| Married-Couple | 2,228 (35.4%) | 3.45 |
| Single Male/Father | 814 (12.9%) | 2.46 |
| Single Female/Mother | 3,247 (51.6%) | 3.32 |
| Total Families | 6,289 (100.0%) | 3.26 |
Median Household Size in Union City
The median household size in Union City is 2.36 persons per household, with single female/mother households (3,247 | 28.7%) accounting for the largest median household size of 3.48 persons per household. non-family households (5,022 | 44.4%) represent the smallest median household size with 1.12 persons per household.
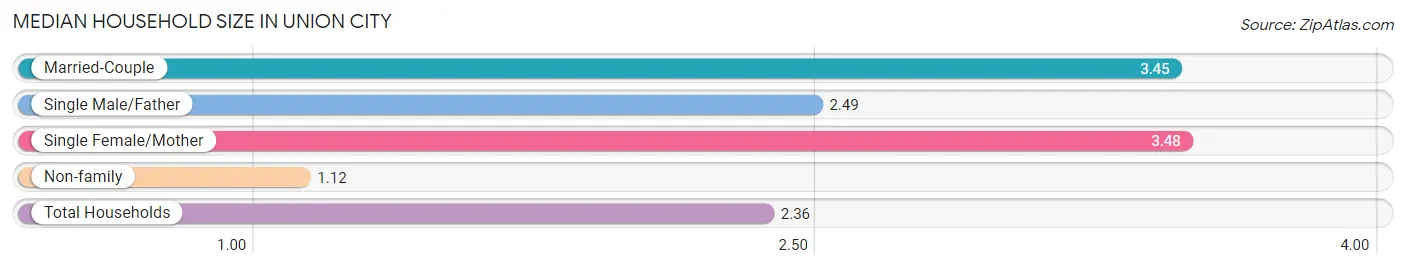
| Household Type | # Households | Household Size |
| Married-Couple | 2,228 (19.7%) | 3.45 |
| Single Male/Father | 814 (7.2%) | 2.49 |
| Single Female/Mother | 3,247 (28.7%) | 3.48 |
| Non-family | 5,022 (44.4%) | 1.12 |
| Total Households | 11,311 (100.0%) | 2.36 |
Household Size by Marriage Status in Union City
Out of a total of 11,311 households in Union City, 6,289 (55.6%) are family households, while 5,022 (44.4%) are nonfamily households. The most numerous type of family households are 2-person households, comprising 2,845, and the most common type of nonfamily households are 1-person households, comprising 4,512.
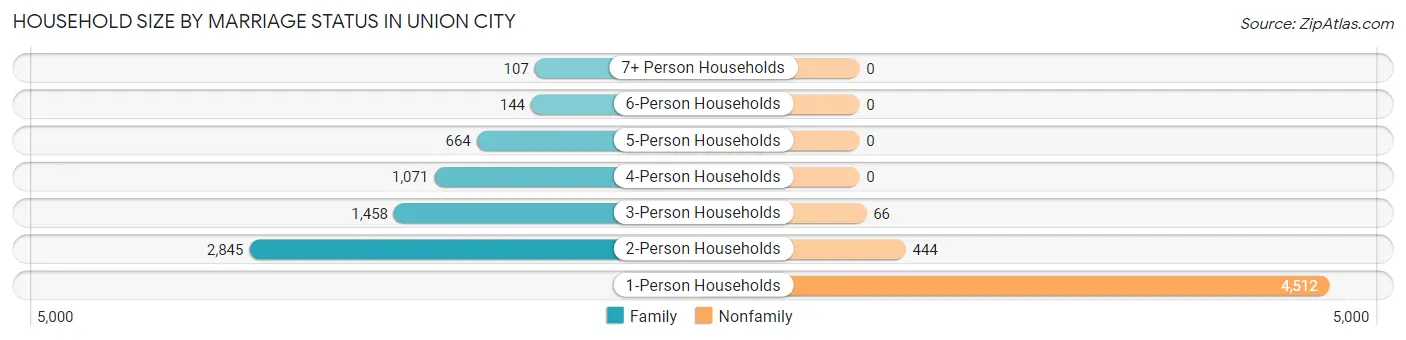
| Household Size | Family Households | Nonfamily Households |
| 1-Person Households | - | 4,512 (39.9%) |
| 2-Person Households | 2,845 (25.2%) | 444 (3.9%) |
| 3-Person Households | 1,458 (12.9%) | 66 (0.6%) |
| 4-Person Households | 1,071 (9.5%) | 0 (0.0%) |
| 5-Person Households | 664 (5.9%) | 0 (0.0%) |
| 6-Person Households | 144 (1.3%) | 0 (0.0%) |
| 7+ Person Households | 107 (0.9%) | 0 (0.0%) |
| Total | 6,289 (55.6%) | 5,022 (44.4%) |
Female Fertility in Union City
Fertility by Age in Union City
Average fertility rate in Union City is 59.0 births per 1,000 women. Women in the age bracket of 35 to 50 years have the highest fertility rate with 77.0 births per 1,000 women. Women in the age bracket of 35 to 50 years acount for 53.7% of all women with births.
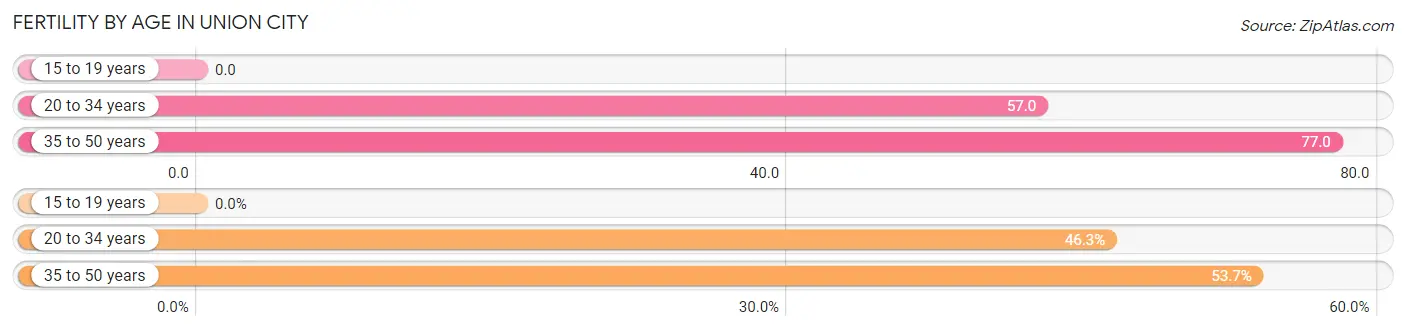
| Age Bracket | Women with Births | Births / 1,000 Women |
| 15 to 19 years | 0 (0.0%) | 0.0 |
| 20 to 34 years | 211 (46.3%) | 57.0 |
| 35 to 50 years | 245 (53.7%) | 77.0 |
| Total | 456 (100.0%) | 59.0 |
Fertility by Age by Marriage Status in Union City
57.2% of women with births (456) in Union City are married. The highest percentage of unmarried women with births falls into 35 to 50 years age bracket with 42.9% of them unmarried at the time of birth, while the lowest percentage of unmarried women with births belong to 20 to 34 years age bracket with 42.6% of them unmarried.
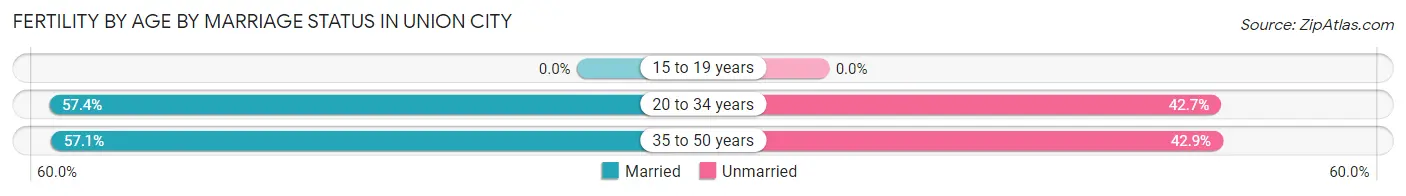
| Age Bracket | Married | Unmarried |
| 15 to 19 years | 0 (0.0%) | 0 (0.0%) |
| 20 to 34 years | 121 (57.4%) | 90 (42.6%) |
| 35 to 50 years | 140 (57.1%) | 105 (42.9%) |
| Total | 261 (57.2%) | 195 (42.8%) |
Fertility by Education in Union City
Average fertility rate in Union City is 59.0 births per 1,000 women. Women with the education attainment of graduate degree have the highest fertility rate of 90.0 births per 1,000 women, while women with the education attainment of less than high school have the lowest fertility at 15.0 births per 1,000 women. Women with the education attainment of college or associate's degree represent 53.1% of all women with births.
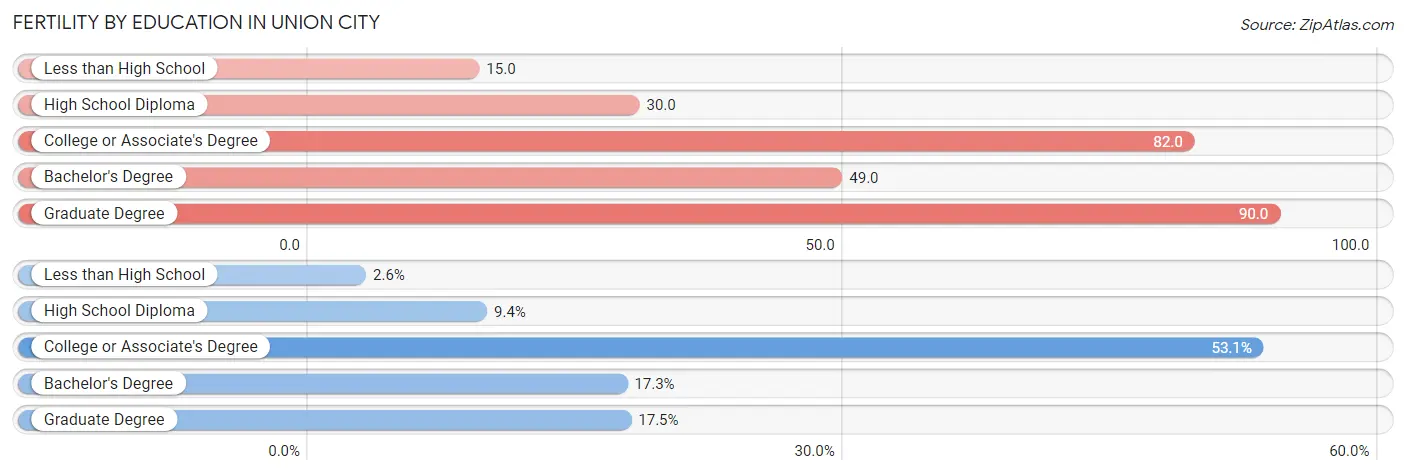
| Educational Attainment | Women with Births | Births / 1,000 Women |
| Less than High School | 12 (2.6%) | 15.0 |
| High School Diploma | 43 (9.4%) | 30.0 |
| College or Associate's Degree | 242 (53.1%) | 82.0 |
| Bachelor's Degree | 79 (17.3%) | 49.0 |
| Graduate Degree | 80 (17.5%) | 90.0 |
| Total | 456 (100.0%) | 59.0 |
Fertility by Education by Marriage Status in Union City
42.8% of women with births in Union City are unmarried. Women with the educational attainment of high school diploma are most likely to be married with 100.0% of them married at childbirth, while women with the educational attainment of less than high school are least likely to be married with 100.0% of them unmarried at childbirth.
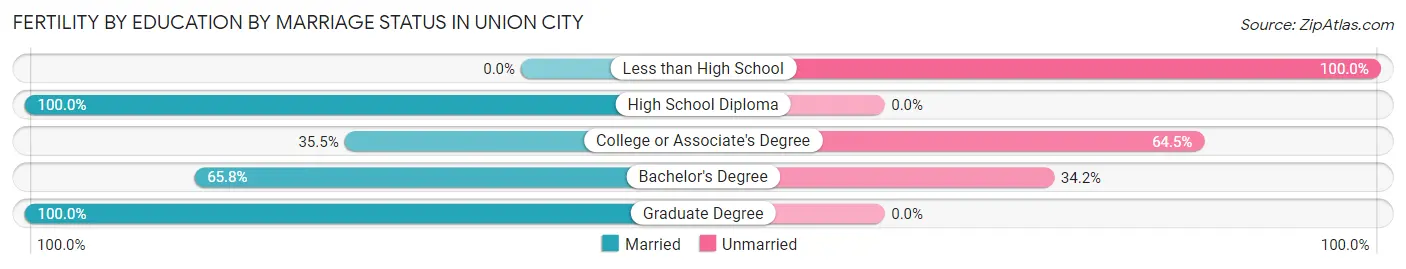
| Educational Attainment | Married | Unmarried |
| Less than High School | 0 (0.0%) | 12 (100.0%) |
| High School Diploma | 43 (100.0%) | 0 (0.0%) |
| College or Associate's Degree | 86 (35.5%) | 156 (64.5%) |
| Bachelor's Degree | 52 (65.8%) | 27 (34.2%) |
| Graduate Degree | 80 (100.0%) | 0 (0.0%) |
| Total | 261 (57.2%) | 195 (42.8%) |
Employment Characteristics in Union City
Employment by Class of Employer in Union City
Among the 12,887 employed individuals in Union City, private company employees (8,368 | 64.9%), self-employed (not incorporated) (1,037 | 8.1%), and local government employees (939 | 7.3%) make up the most common classes of employment.
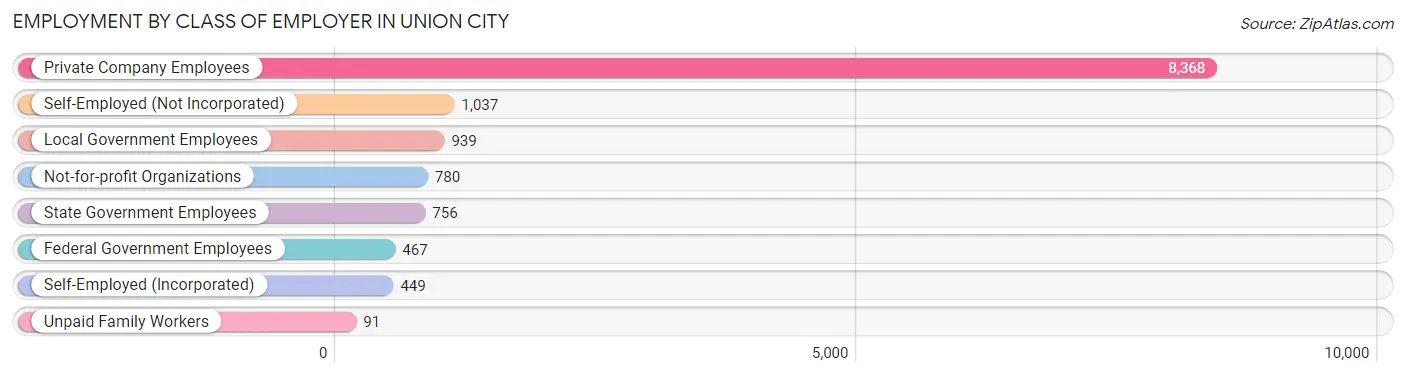
| Employer Class | # Employees | % Employees |
| Private Company Employees | 8,368 | 64.9% |
| Self-Employed (Incorporated) | 449 | 3.5% |
| Self-Employed (Not Incorporated) | 1,037 | 8.1% |
| Not-for-profit Organizations | 780 | 6.0% |
| Local Government Employees | 939 | 7.3% |
| State Government Employees | 756 | 5.9% |
| Federal Government Employees | 467 | 3.6% |
| Unpaid Family Workers | 91 | 0.7% |
| Total | 12,887 | 100.0% |
Employment Status by Age in Union City
According to the labor force statistics for Union City, out of the total population over 16 years of age (20,230), 69.1% or 13,979 individuals are in the labor force, with 4.6% or 643 of them unemployed. The age group with the highest labor force participation rate is 30 to 34 years, with 89.8% or 2,461 individuals in the labor force. Within the labor force, the 16 to 19 years age range has the highest percentage of unemployed individuals, with 27.2% or 182 of them being unemployed.
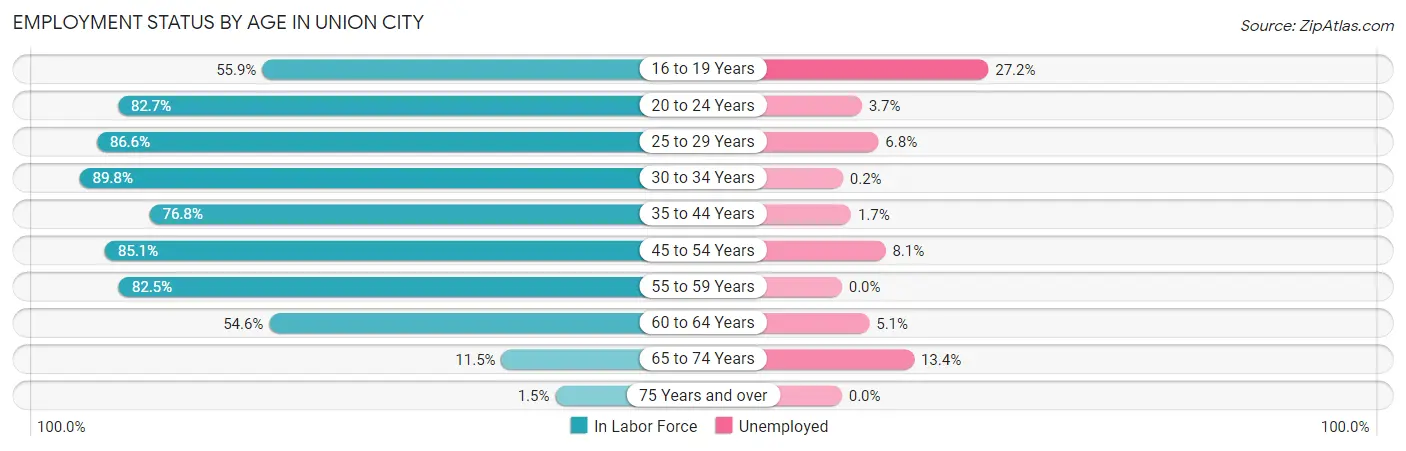
| Age Bracket | In Labor Force | Unemployed |
| 16 to 19 Years | 668 (55.9%) | 182 (27.2%) |
| 20 to 24 Years | 1,929 (82.7%) | 71 (3.7%) |
| 25 to 29 Years | 1,485 (86.6%) | 101 (6.8%) |
| 30 to 34 Years | 2,461 (89.8%) | 5 (0.2%) |
| 35 to 44 Years | 3,296 (76.8%) | 56 (1.7%) |
| 45 to 54 Years | 2,161 (85.1%) | 175 (8.1%) |
| 55 to 59 Years | 1,134 (82.5%) | 0 (0.0%) |
| 60 to 64 Years | 610 (54.6%) | 31 (5.1%) |
| 65 to 74 Years | 217 (11.5%) | 29 (13.4%) |
| 75 Years and over | 16 (1.5%) | 0 (0.0%) |
| Total | 13,979 (69.1%) | 643 (4.6%) |
Employment Status by Educational Attainment in Union City
According to labor force statistics for Union City, 80.9% of individuals (11,148) out of the total population between 25 and 64 years of age (13,780) are in the labor force, with 3.3% or 368 of them being unemployed. The group with the highest labor force participation rate are those with the educational attainment of bachelor's degree or higher, with 95.2% or 3,925 individuals in the labor force. Within the labor force, individuals with high school diploma education have the highest percentage of unemployment, with 4.9% or 123 of them being unemployed.
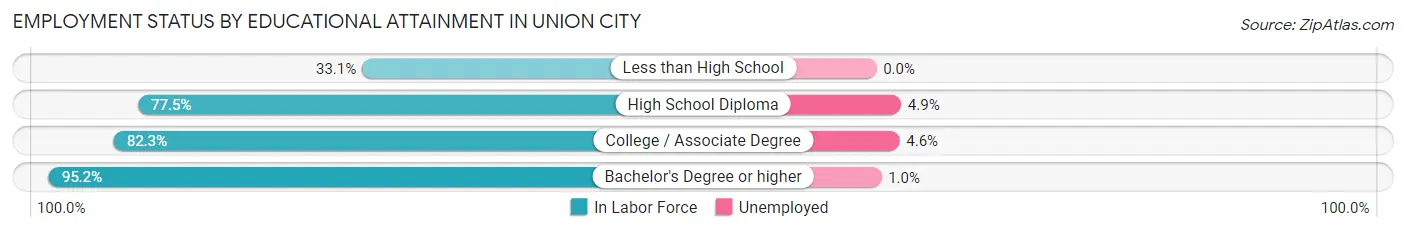
| Educational Attainment | In Labor Force | Unemployed |
| Less than High School | 383 (33.1%) | 0 (0.0%) |
| High School Diploma | 2,502 (77.5%) | 158 (4.9%) |
| College / Associate Degree | 4,338 (82.3%) | 242 (4.6%) |
| Bachelor's Degree or higher | 3,925 (95.2%) | 41 (1.0%) |
| Total | 11,148 (80.9%) | 455 (3.3%) |
Employment Occupations by Sex in Union City
Management, Business, Science and Arts Occupations
The most common Management, Business, Science and Arts occupations in Union City are Community & Social Service (1,986 | 15.0%), Management (1,104 | 8.4%), Education Instruction & Library (1,007 | 7.6%), Legal Services & Support (592 | 4.5%), and Business & Financial (555 | 4.2%).
Management, Business, Science and Arts Occupations by Sex
Within the Management, Business, Science and Arts occupations in Union City, the most male-oriented occupations are Computers & Mathematics (100.0%), Arts, Media & Entertainment (75.0%), and Computers, Engineering & Science (66.0%), while the most female-oriented occupations are Architecture & Engineering (100.0%), Health Diagnosing & Treating (100.0%), and Health Technologists (100.0%).
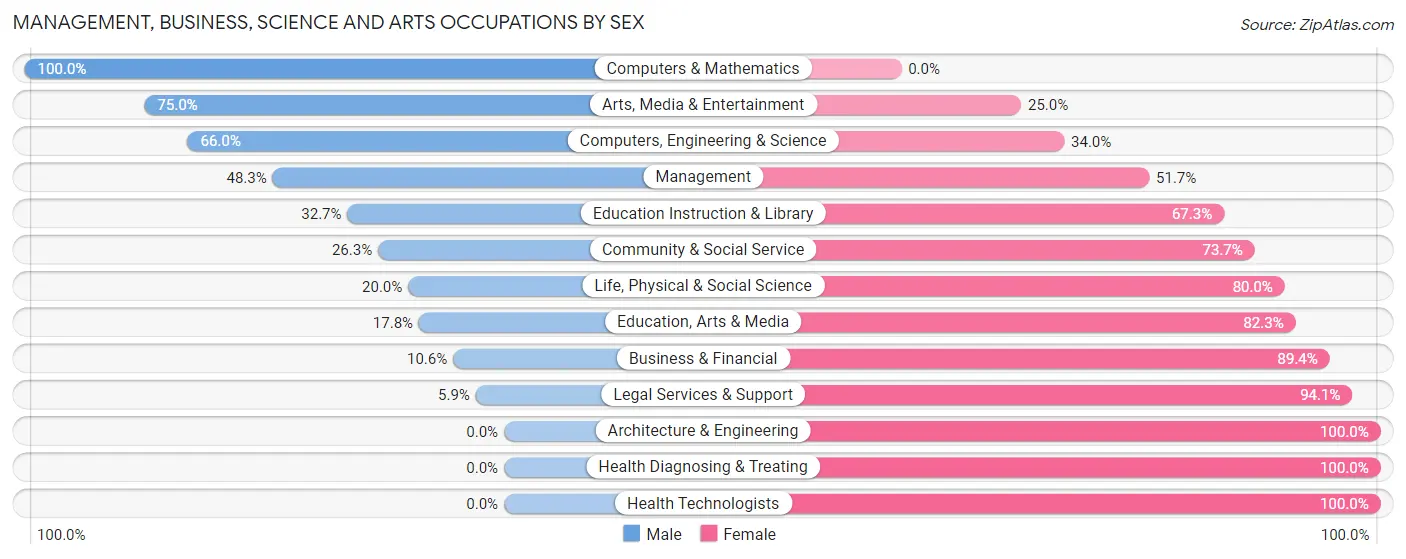
| Occupation | Male | Female |
| Management | 533 (48.3%) | 571 (51.7%) |
| Business & Financial | 59 (10.6%) | 496 (89.4%) |
| Computers, Engineering & Science | 233 (66.0%) | 120 (34.0%) |
| Computers & Mathematics | 213 (100.0%) | 0 (0.0%) |
| Architecture & Engineering | 0 (0.0%) | 40 (100.0%) |
| Life, Physical & Social Science | 20 (20.0%) | 80 (80.0%) |
| Community & Social Service | 522 (26.3%) | 1,464 (73.7%) |
| Education, Arts & Media | 41 (17.7%) | 190 (82.3%) |
| Legal Services & Support | 35 (5.9%) | 557 (94.1%) |
| Education Instruction & Library | 329 (32.7%) | 678 (67.3%) |
| Arts, Media & Entertainment | 117 (75.0%) | 39 (25.0%) |
| Health Diagnosing & Treating | 0 (0.0%) | 502 (100.0%) |
| Health Technologists | 0 (0.0%) | 210 (100.0%) |
| Total (Category) | 1,347 (29.9%) | 3,153 (70.1%) |
| Total (Overall) | 5,205 (39.4%) | 8,024 (60.7%) |
Services Occupations
The most common Services occupations in Union City are Food Preparation & Serving (596 | 4.5%), Healthcare Support (526 | 4.0%), Personal Care & Service (357 | 2.7%), Cleaning & Maintenance (355 | 2.7%), and Security & Protection (221 | 1.7%).
Services Occupations by Sex
Within the Services occupations in Union City, the most male-oriented occupations are Cleaning & Maintenance (74.9%), Personal Care & Service (68.9%), and Healthcare Support (32.7%), while the most female-oriented occupations are Security & Protection (100.0%), Firefighting & Prevention (100.0%), and Law Enforcement (100.0%).
| Occupation | Male | Female |
| Healthcare Support | 172 (32.7%) | 354 (67.3%) |
| Security & Protection | 0 (0.0%) | 221 (100.0%) |
| Firefighting & Prevention | 0 (0.0%) | 186 (100.0%) |
| Law Enforcement | 0 (0.0%) | 35 (100.0%) |
| Food Preparation & Serving | 148 (24.8%) | 448 (75.2%) |
| Cleaning & Maintenance | 266 (74.9%) | 89 (25.1%) |
| Personal Care & Service | 246 (68.9%) | 111 (31.1%) |
| Total (Category) | 832 (40.5%) | 1,223 (59.5%) |
| Total (Overall) | 5,205 (39.4%) | 8,024 (60.7%) |
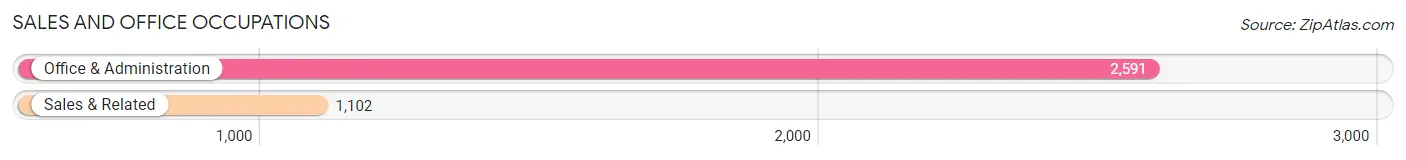
Sales and Office Occupations
The most common Sales and Office occupations in Union City are Office & Administration (2,591 | 19.6%), and Sales & Related (1,102 | 8.3%).
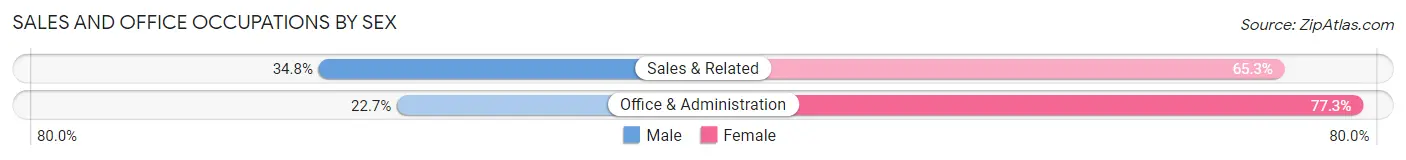
Sales and Office Occupations by Sex
| Occupation | Male | Female |
| Sales & Related | 383 (34.7%) | 719 (65.2%) |
| Office & Administration | 588 (22.7%) | 2,003 (77.3%) |
| Total (Category) | 971 (26.3%) | 2,722 (73.7%) |
| Total (Overall) | 5,205 (39.4%) | 8,024 (60.7%) |
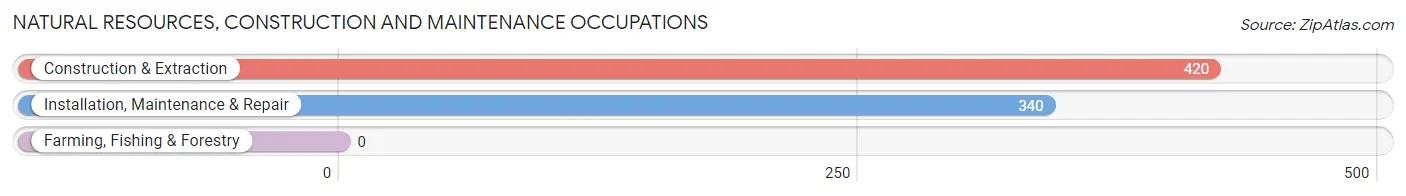
Natural Resources, Construction and Maintenance Occupations
The most common Natural Resources, Construction and Maintenance occupations in Union City are Construction & Extraction (420 | 3.2%), and Installation, Maintenance & Repair (340 | 2.6%).
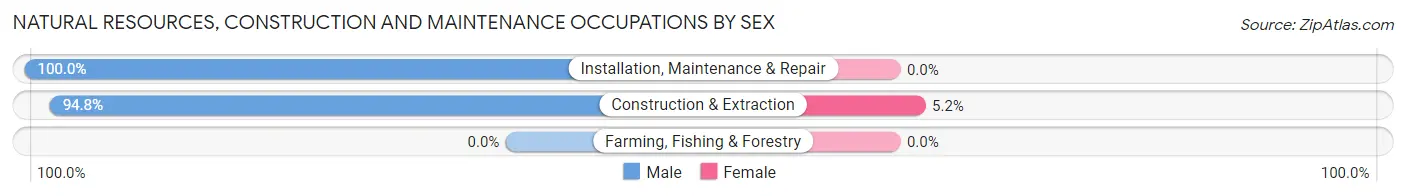
Natural Resources, Construction and Maintenance Occupations by Sex
| Occupation | Male | Female |
| Farming, Fishing & Forestry | 0 (0.0%) | 0 (0.0%) |
| Construction & Extraction | 398 (94.8%) | 22 (5.2%) |
| Installation, Maintenance & Repair | 340 (100.0%) | 0 (0.0%) |
| Total (Category) | 738 (97.1%) | 22 (2.9%) |
| Total (Overall) | 5,205 (39.4%) | 8,024 (60.7%) |
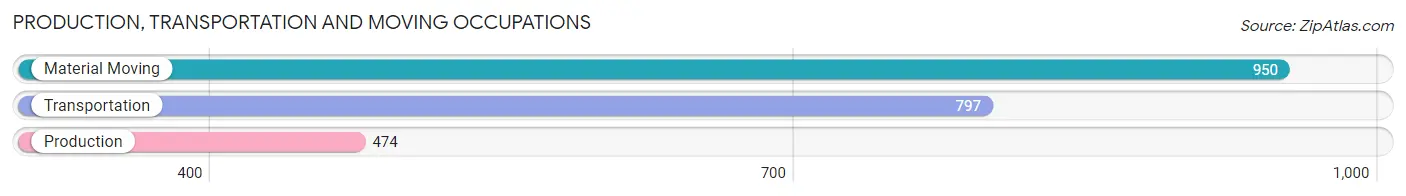
Production, Transportation and Moving Occupations
The most common Production, Transportation and Moving occupations in Union City are Material Moving (950 | 7.2%), Transportation (797 | 6.0%), and Production (474 | 3.6%).
Production, Transportation and Moving Occupations by Sex
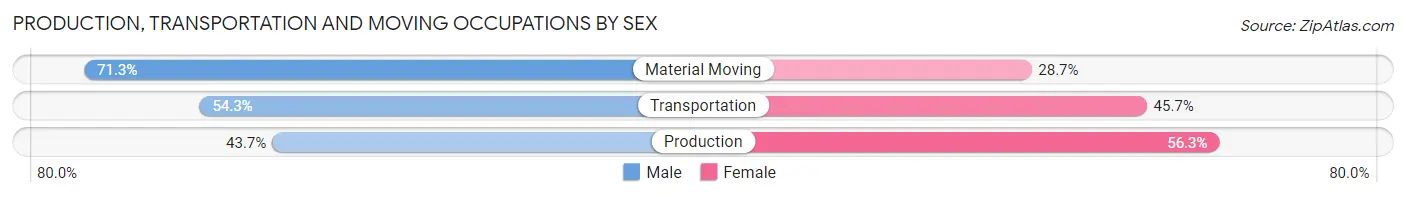
| Occupation | Male | Female |
| Production | 207 (43.7%) | 267 (56.3%) |
| Transportation | 433 (54.3%) | 364 (45.7%) |
| Material Moving | 677 (71.3%) | 273 (28.7%) |
| Total (Category) | 1,317 (59.3%) | 904 (40.7%) |
| Total (Overall) | 5,205 (39.4%) | 8,024 (60.7%) |
Employment Industries by Sex in Union City
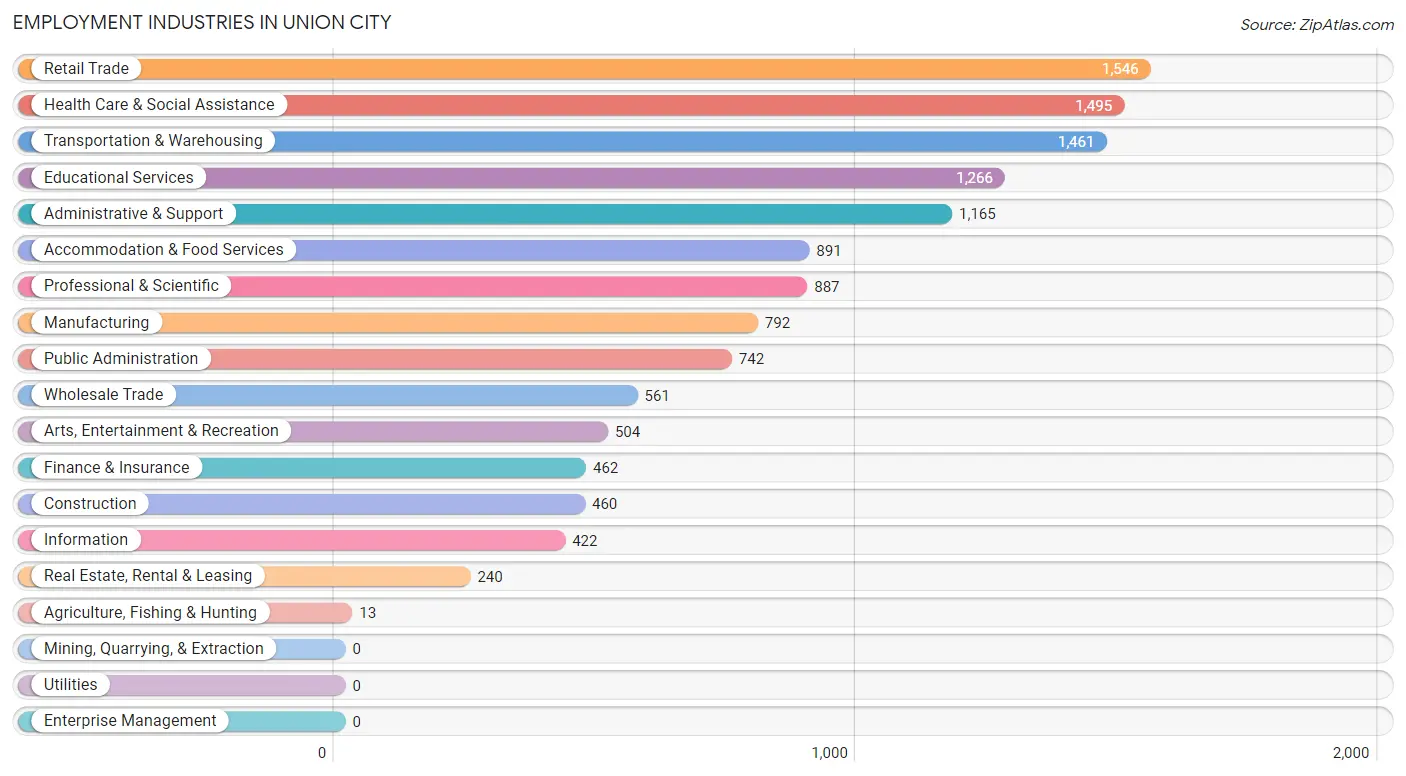
Employment Industries in Union City
The major employment industries in Union City include Retail Trade (1,546 | 11.7%), Health Care & Social Assistance (1,495 | 11.3%), Transportation & Warehousing (1,461 | 11.0%), Educational Services (1,266 | 9.6%), and Administrative & Support (1,165 | 8.8%).
Employment Industries by Sex in Union City
The Union City industries that see more men than women are Construction (98.0%), Wholesale Trade (90.5%), and Manufacturing (74.2%), whereas the industries that tend to have a higher number of women are Agriculture, Fishing & Hunting (100.0%), Real Estate, Rental & Leasing (100.0%), and Public Administration (95.3%).
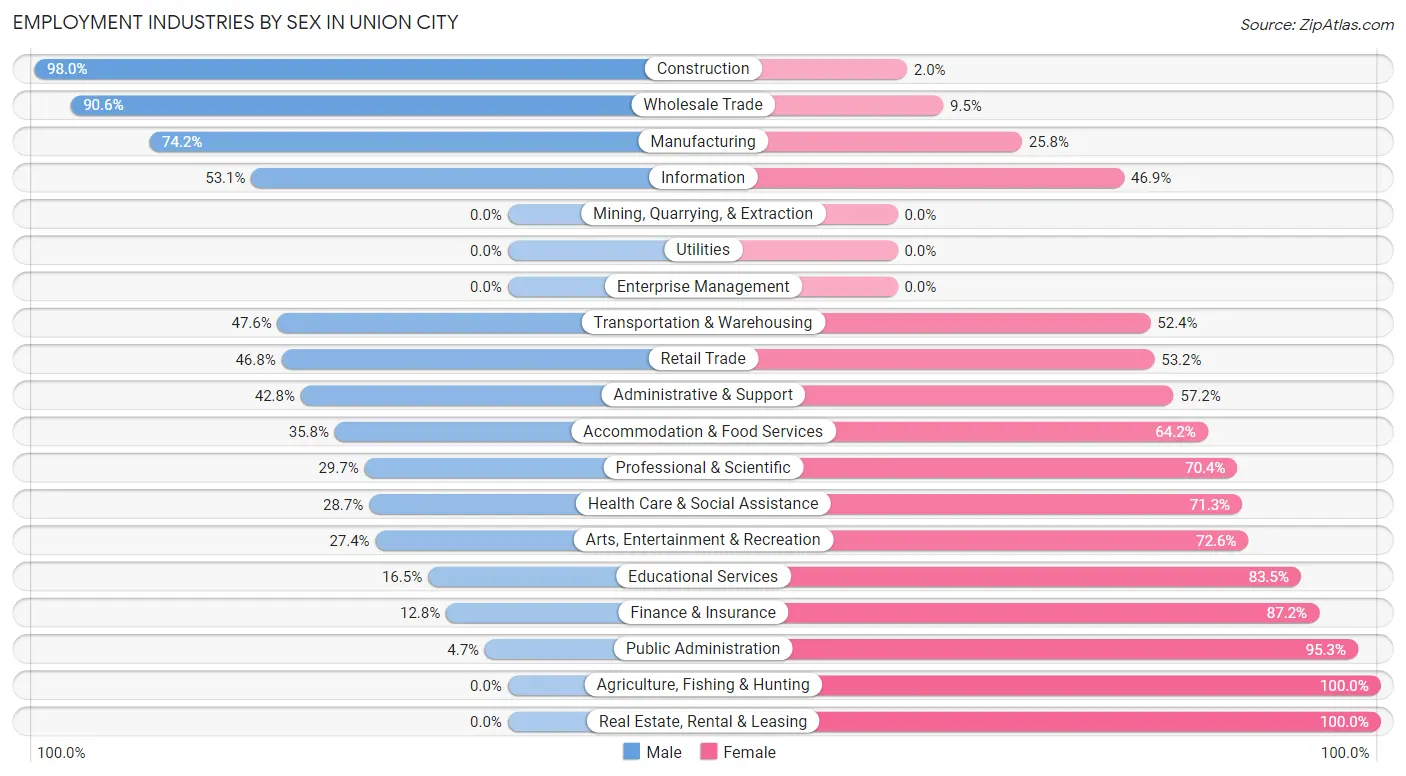
| Industry | Male | Female |
| Agriculture, Fishing & Hunting | 0 (0.0%) | 13 (100.0%) |
| Mining, Quarrying, & Extraction | 0 (0.0%) | 0 (0.0%) |
| Construction | 451 (98.0%) | 9 (2.0%) |
| Manufacturing | 588 (74.2%) | 204 (25.8%) |
| Wholesale Trade | 508 (90.5%) | 53 (9.5%) |
| Retail Trade | 724 (46.8%) | 822 (53.2%) |
| Transportation & Warehousing | 696 (47.6%) | 765 (52.4%) |
| Utilities | 0 (0.0%) | 0 (0.0%) |
| Information | 224 (53.1%) | 198 (46.9%) |
| Finance & Insurance | 59 (12.8%) | 403 (87.2%) |
| Real Estate, Rental & Leasing | 0 (0.0%) | 240 (100.0%) |
| Professional & Scientific | 263 (29.6%) | 624 (70.4%) |
| Enterprise Management | 0 (0.0%) | 0 (0.0%) |
| Administrative & Support | 499 (42.8%) | 666 (57.2%) |
| Educational Services | 209 (16.5%) | 1,057 (83.5%) |
| Health Care & Social Assistance | 429 (28.7%) | 1,066 (71.3%) |
| Arts, Entertainment & Recreation | 138 (27.4%) | 366 (72.6%) |
| Accommodation & Food Services | 319 (35.8%) | 572 (64.2%) |
| Public Administration | 35 (4.7%) | 707 (95.3%) |
| Total | 5,205 (39.4%) | 8,024 (60.7%) |
Education in Union City
School Enrollment in Union City
The most common levels of schooling among the 7,321 students in Union City are elementary school (1,886 | 25.8%), high school (1,727 | 23.6%), and middle school (1,403 | 19.2%).
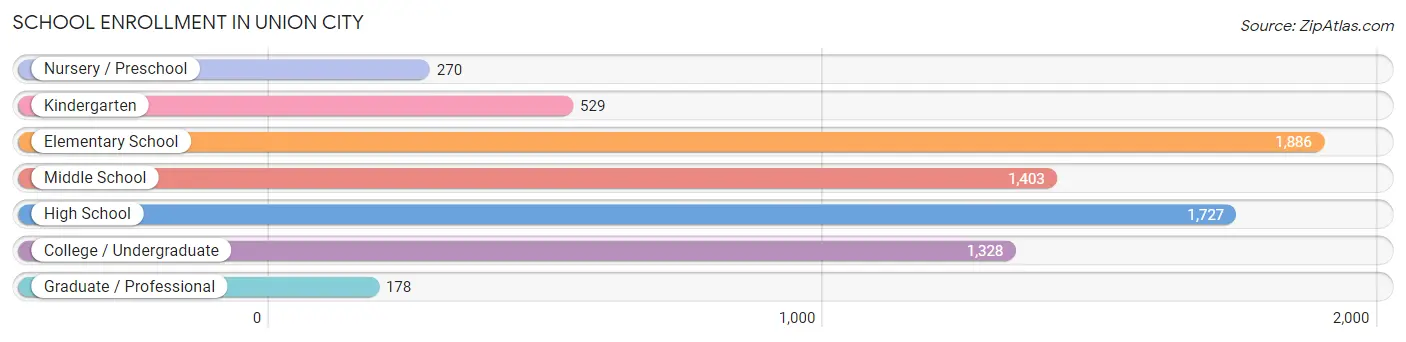
| School Level | # Students | % Students |
| Nursery / Preschool | 270 | 3.7% |
| Kindergarten | 529 | 7.2% |
| Elementary School | 1,886 | 25.8% |
| Middle School | 1,403 | 19.2% |
| High School | 1,727 | 23.6% |
| College / Undergraduate | 1,328 | 18.1% |
| Graduate / Professional | 178 | 2.4% |
| Total | 7,321 | 100.0% |
School Enrollment by Age by Funding Source in Union City
Out of a total of 7,321 students who are enrolled in schools in Union City, 549 (7.5%) attend a private institution, while the remaining 6,772 (92.5%) are enrolled in public schools. The age group of 3 to 4 year olds has the highest likelihood of being enrolled in private schools, with 49 (46.7% in the age bracket) enrolled. Conversely, the age group of 15 to 17 year olds has the lowest likelihood of being enrolled in a private school, with 1,168 (100.0% in the age bracket) attending a public institution.
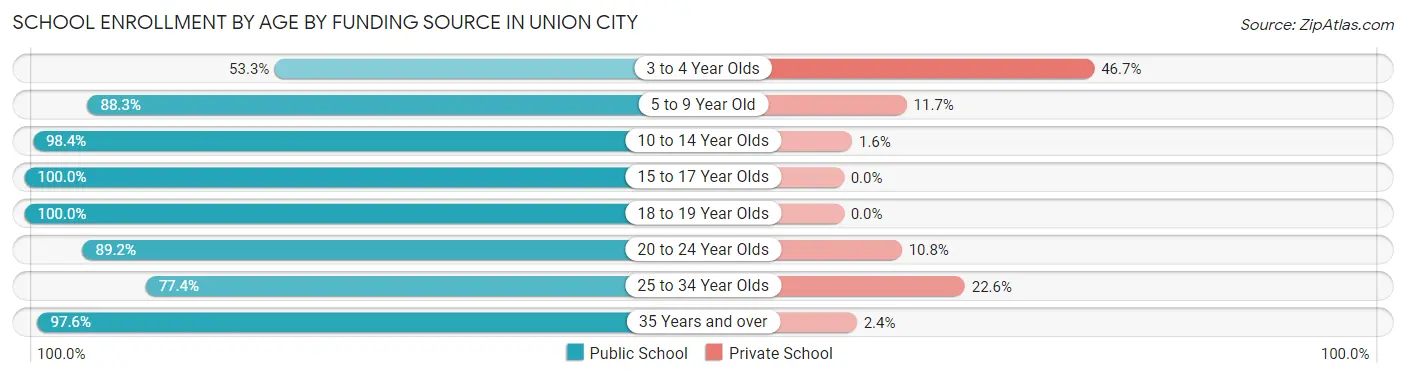
| Age Bracket | Public School | Private School |
| 3 to 4 Year Olds | 56 (53.3%) | 49 (46.7%) |
| 5 to 9 Year Old | 2,266 (88.3%) | 301 (11.7%) |
| 10 to 14 Year Olds | 1,827 (98.4%) | 29 (1.6%) |
| 15 to 17 Year Olds | 1,168 (100.0%) | 0 (0.0%) |
| 18 to 19 Year Olds | 275 (100.0%) | 0 (0.0%) |
| 20 to 24 Year Olds | 462 (89.2%) | 56 (10.8%) |
| 25 to 34 Year Olds | 357 (77.4%) | 104 (22.6%) |
| 35 Years and over | 362 (97.6%) | 9 (2.4%) |
| Total | 6,772 (92.5%) | 549 (7.5%) |
Educational Attainment by Field of Study in Union City
Business (998 | 20.1%), education (909 | 18.3%), arts & humanities (803 | 16.2%), psychology (467 | 9.4%), and science & technology (302 | 6.1%) are the most common fields of study among 4,961 individuals in Union City who have obtained a bachelor's degree or higher.
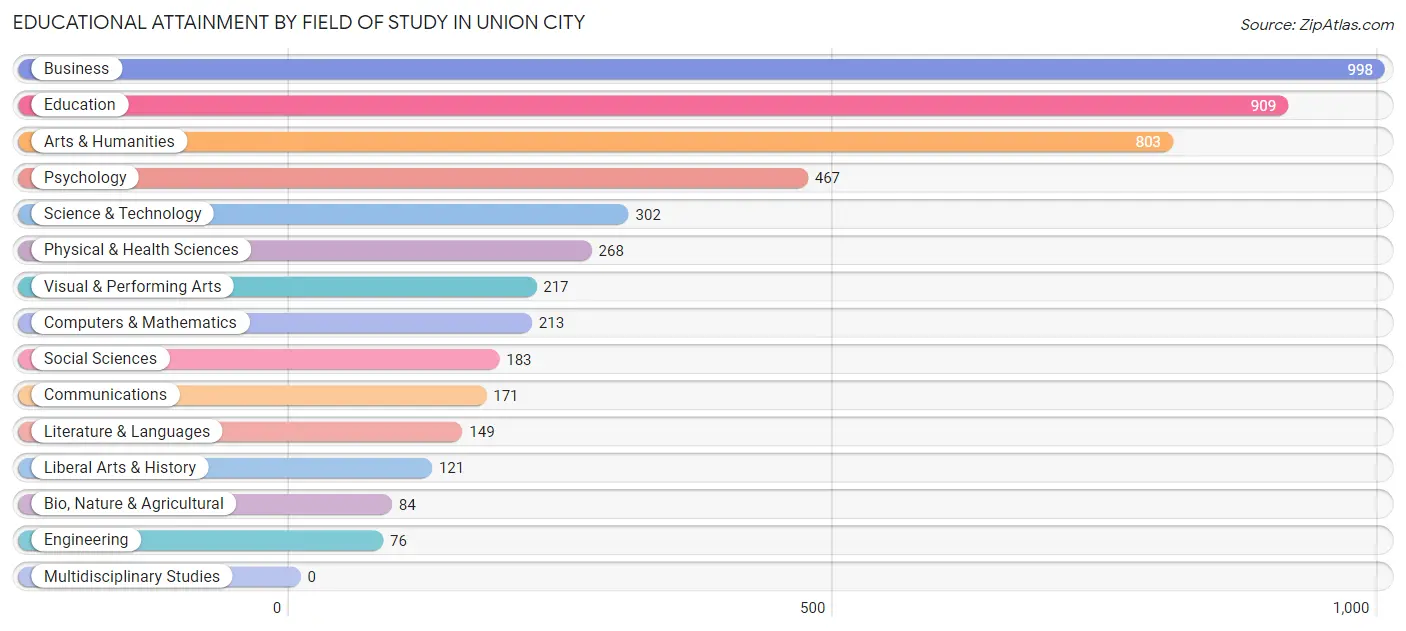
| Field of Study | # Graduates | % Graduates |
| Computers & Mathematics | 213 | 4.3% |
| Bio, Nature & Agricultural | 84 | 1.7% |
| Physical & Health Sciences | 268 | 5.4% |
| Psychology | 467 | 9.4% |
| Social Sciences | 183 | 3.7% |
| Engineering | 76 | 1.5% |
| Multidisciplinary Studies | 0 | 0.0% |
| Science & Technology | 302 | 6.1% |
| Business | 998 | 20.1% |
| Education | 909 | 18.3% |
| Literature & Languages | 149 | 3.0% |
| Liberal Arts & History | 121 | 2.4% |
| Visual & Performing Arts | 217 | 4.4% |
| Communications | 171 | 3.5% |
| Arts & Humanities | 803 | 16.2% |
| Total | 4,961 | 100.0% |
Transportation & Commute in Union City
Vehicle Availability by Sex in Union City
The most prevalent vehicle ownership categories in Union City are males with 2 vehicles (2,368, accounting for 45.2%) and females with 2 vehicles (2,422, making up 31.0%).
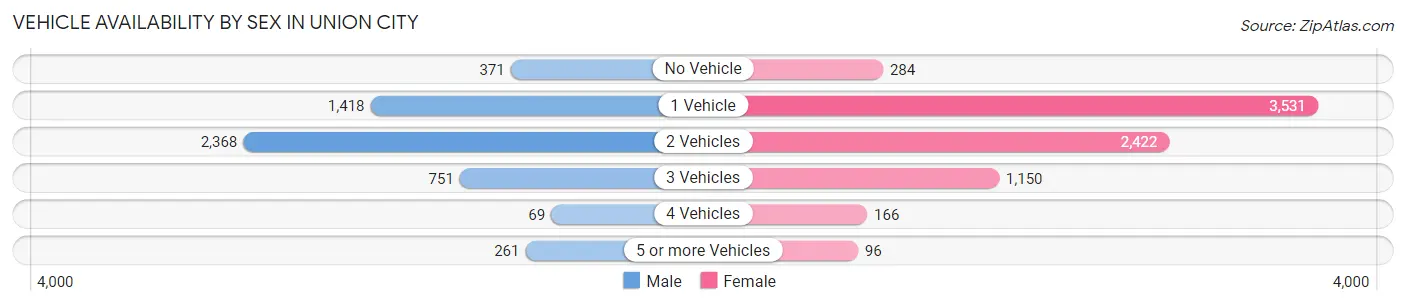
| Vehicles Available | Male | Female |
| No Vehicle | 371 (7.1%) | 284 (3.7%) |
| 1 Vehicle | 1,418 (27.1%) | 3,531 (46.2%) |
| 2 Vehicles | 2,368 (45.2%) | 2,422 (31.7%) |
| 3 Vehicles | 751 (14.3%) | 1,150 (15.0%) |
| 4 Vehicles | 69 (1.3%) | 166 (2.2%) |
| 5 or more Vehicles | 261 (5.0%) | 96 (1.3%) |
| Total | 5,238 (100.0%) | 7,649 (100.0%) |
Commute Time in Union City
The most frequently occuring commute durations in Union City are 30 to 34 minutes (2,454 commuters, 21.0%), 15 to 19 minutes (1,637 commuters, 14.0%), and 20 to 24 minutes (1,501 commuters, 12.9%).
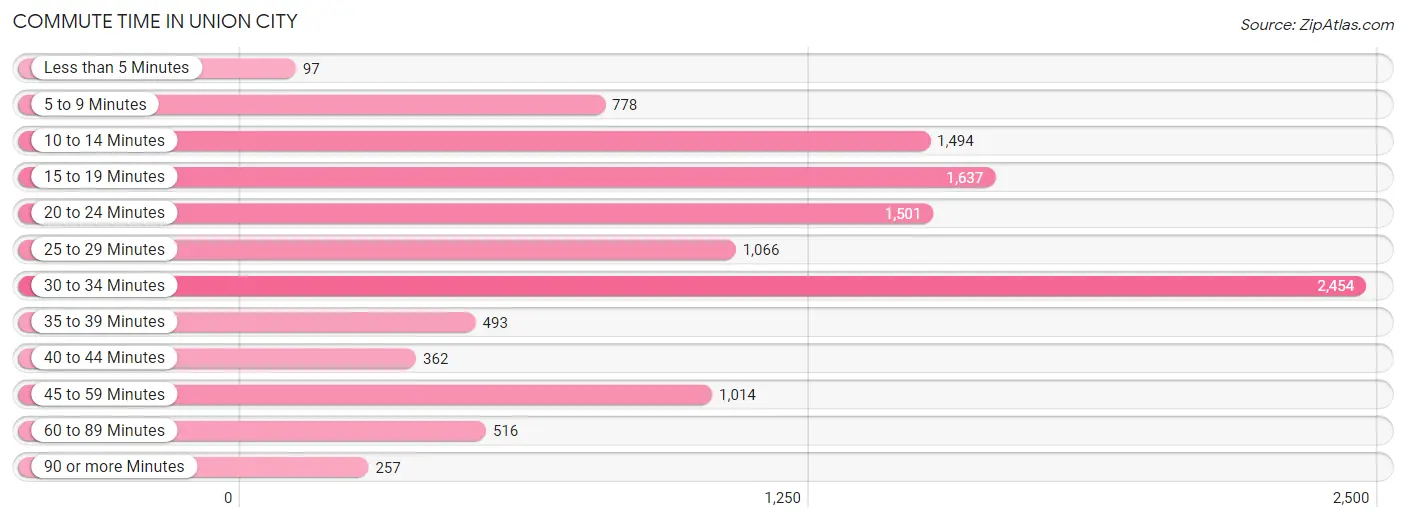
| Commute Time | # Commuters | % Commuters |
| Less than 5 Minutes | 97 | 0.8% |
| 5 to 9 Minutes | 778 | 6.7% |
| 10 to 14 Minutes | 1,494 | 12.8% |
| 15 to 19 Minutes | 1,637 | 14.0% |
| 20 to 24 Minutes | 1,501 | 12.9% |
| 25 to 29 Minutes | 1,066 | 9.1% |
| 30 to 34 Minutes | 2,454 | 21.0% |
| 35 to 39 Minutes | 493 | 4.2% |
| 40 to 44 Minutes | 362 | 3.1% |
| 45 to 59 Minutes | 1,014 | 8.7% |
| 60 to 89 Minutes | 516 | 4.4% |
| 90 or more Minutes | 257 | 2.2% |
Commute Time by Sex in Union City
The most common commute times in Union City are 30 to 34 minutes (1,572 commuters, 32.6%) for males and 10 to 14 minutes (1,347 commuters, 19.7%) for females.
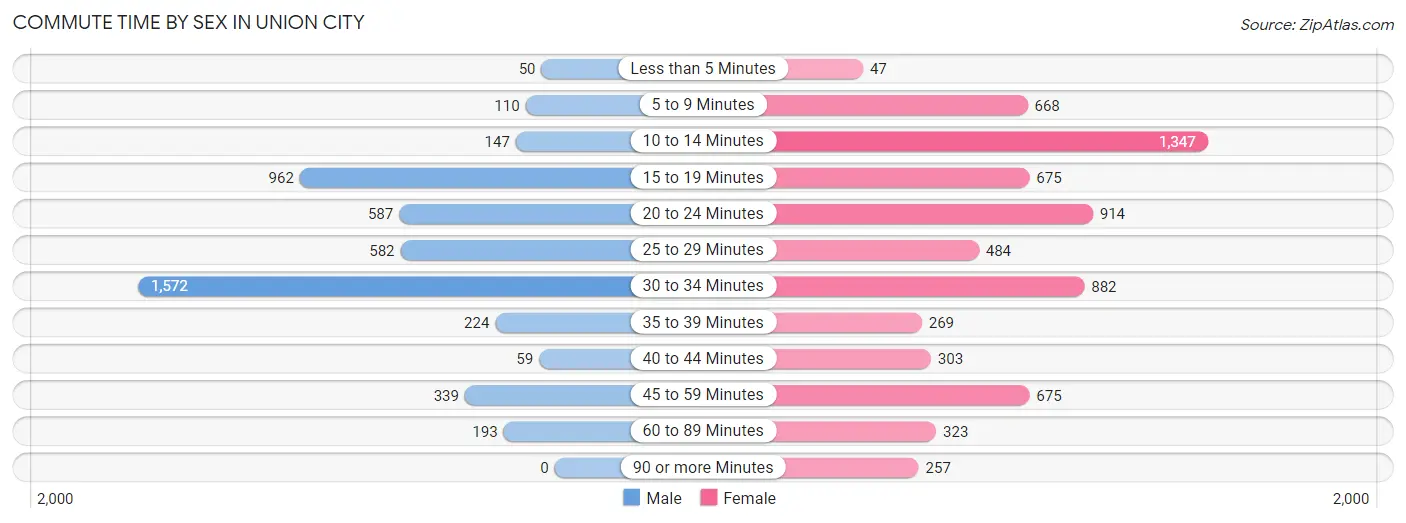
| Commute Time | Male | Female |
| Less than 5 Minutes | 50 (1.0%) | 47 (0.7%) |
| 5 to 9 Minutes | 110 (2.3%) | 668 (9.8%) |
| 10 to 14 Minutes | 147 (3.0%) | 1,347 (19.7%) |
| 15 to 19 Minutes | 962 (19.9%) | 675 (9.9%) |
| 20 to 24 Minutes | 587 (12.2%) | 914 (13.4%) |
| 25 to 29 Minutes | 582 (12.1%) | 484 (7.1%) |
| 30 to 34 Minutes | 1,572 (32.6%) | 882 (12.9%) |
| 35 to 39 Minutes | 224 (4.6%) | 269 (3.9%) |
| 40 to 44 Minutes | 59 (1.2%) | 303 (4.4%) |
| 45 to 59 Minutes | 339 (7.0%) | 675 (9.9%) |
| 60 to 89 Minutes | 193 (4.0%) | 323 (4.7%) |
| 90 or more Minutes | 0 (0.0%) | 257 (3.8%) |
Time of Departure to Work by Sex in Union City
The most frequent times of departure to work in Union City are 6:30 AM to 6:59 AM (674, 14.0%) for males and 12:00 PM to 3:59 PM (1,266, 18.5%) for females.
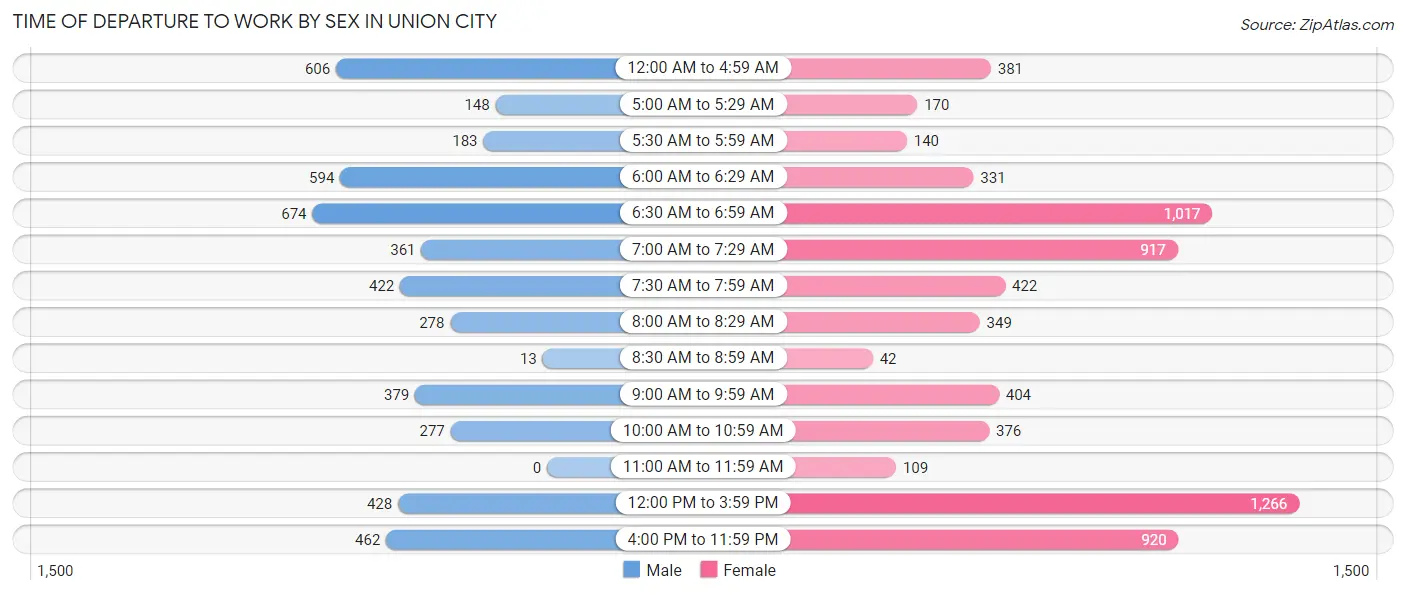
| Time of Departure | Male | Female |
| 12:00 AM to 4:59 AM | 606 (12.6%) | 381 (5.6%) |
| 5:00 AM to 5:29 AM | 148 (3.1%) | 170 (2.5%) |
| 5:30 AM to 5:59 AM | 183 (3.8%) | 140 (2.1%) |
| 6:00 AM to 6:29 AM | 594 (12.3%) | 331 (4.8%) |
| 6:30 AM to 6:59 AM | 674 (14.0%) | 1,017 (14.9%) |
| 7:00 AM to 7:29 AM | 361 (7.5%) | 917 (13.4%) |
| 7:30 AM to 7:59 AM | 422 (8.7%) | 422 (6.2%) |
| 8:00 AM to 8:29 AM | 278 (5.8%) | 349 (5.1%) |
| 8:30 AM to 8:59 AM | 13 (0.3%) | 42 (0.6%) |
| 9:00 AM to 9:59 AM | 379 (7.9%) | 404 (5.9%) |
| 10:00 AM to 10:59 AM | 277 (5.7%) | 376 (5.5%) |
| 11:00 AM to 11:59 AM | 0 (0.0%) | 109 (1.6%) |
| 12:00 PM to 3:59 PM | 428 (8.9%) | 1,266 (18.5%) |
| 4:00 PM to 11:59 PM | 462 (9.6%) | 920 (13.4%) |
| Total | 4,825 (100.0%) | 6,844 (100.0%) |
Housing Occupancy in Union City
Occupancy by Ownership in Union City
Of the total 11,311 dwellings in Union City, owner-occupied units account for 4,709 (41.6%), while renter-occupied units make up 6,602 (58.4%).
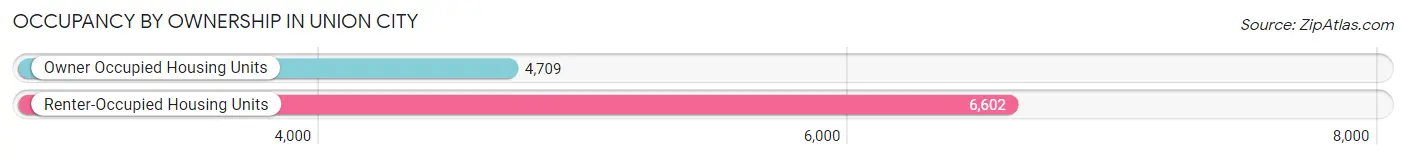
| Occupancy | # Housing Units | % Housing Units |
| Owner Occupied Housing Units | 4,709 | 41.6% |
| Renter-Occupied Housing Units | 6,602 | 58.4% |
| Total Occupied Housing Units | 11,311 | 100.0% |
Occupancy by Household Size in Union City
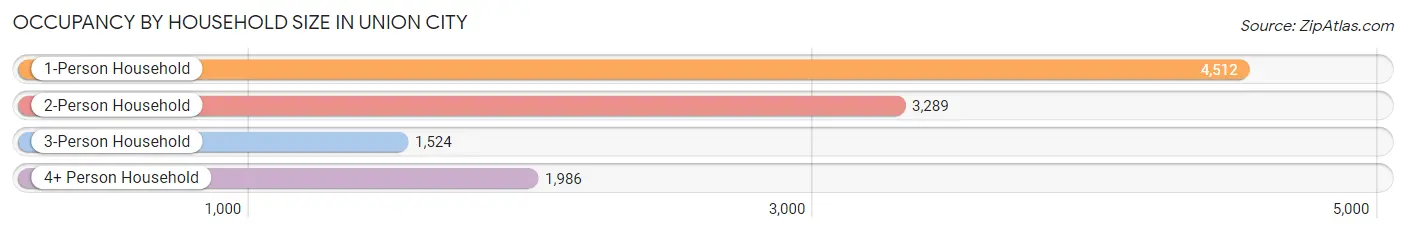
| Household Size | # Housing Units | % Housing Units |
| 1-Person Household | 4,512 | 39.9% |
| 2-Person Household | 3,289 | 29.1% |
| 3-Person Household | 1,524 | 13.5% |
| 4+ Person Household | 1,986 | 17.6% |
| Total Housing Units | 11,311 | 100.0% |
Occupancy by Ownership by Household Size in Union City
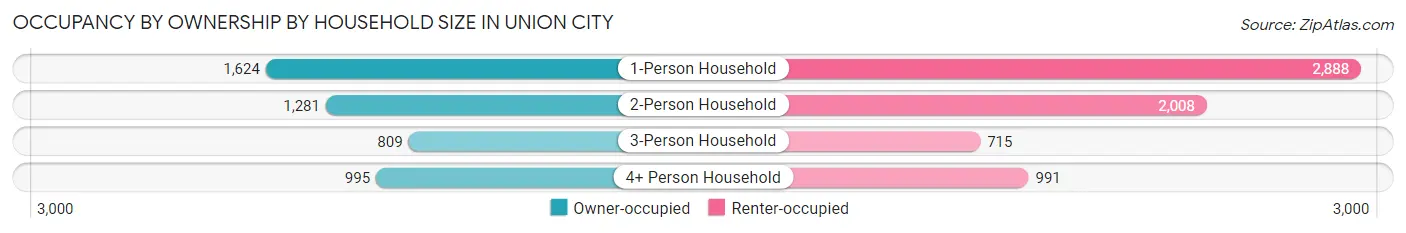
| Household Size | Owner-occupied | Renter-occupied |
| 1-Person Household | 1,624 (36.0%) | 2,888 (64.0%) |
| 2-Person Household | 1,281 (39.0%) | 2,008 (61.1%) |
| 3-Person Household | 809 (53.1%) | 715 (46.9%) |
| 4+ Person Household | 995 (50.1%) | 991 (49.9%) |
| Total Housing Units | 4,709 (41.6%) | 6,602 (58.4%) |
Occupancy by Educational Attainment in Union City
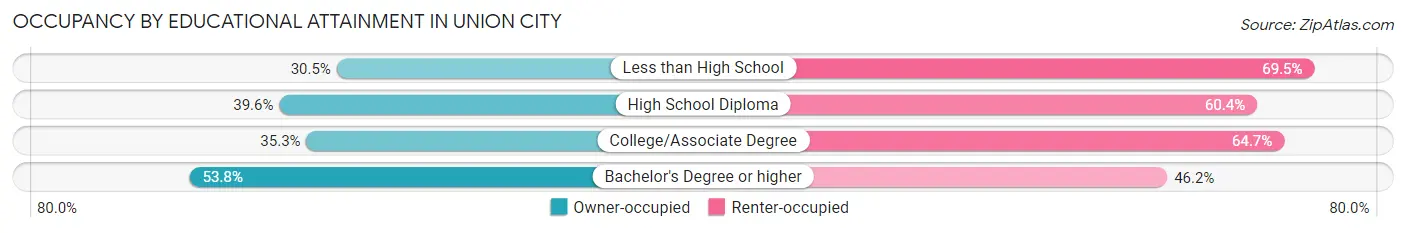
| Household Size | Owner-occupied | Renter-occupied |
| Less than High School | 251 (30.5%) | 572 (69.5%) |
| High School Diploma | 942 (39.6%) | 1,437 (60.4%) |
| College/Associate Degree | 1,618 (35.3%) | 2,966 (64.7%) |
| Bachelor's Degree or higher | 1,898 (53.8%) | 1,627 (46.2%) |
Occupancy by Age of Householder in Union City
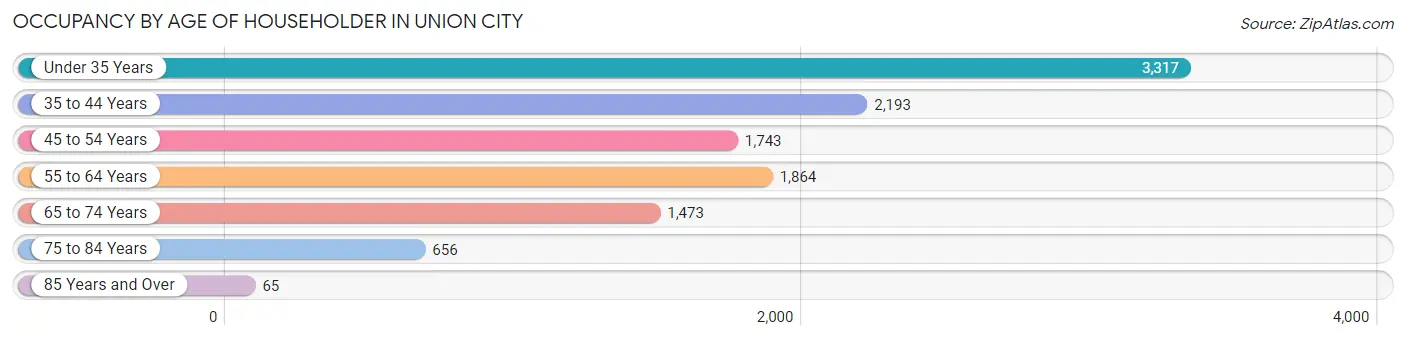
| Age Bracket | # Households | % Households |
| Under 35 Years | 3,317 | 29.3% |
| 35 to 44 Years | 2,193 | 19.4% |
| 45 to 54 Years | 1,743 | 15.4% |
| 55 to 64 Years | 1,864 | 16.5% |
| 65 to 74 Years | 1,473 | 13.0% |
| 75 to 84 Years | 656 | 5.8% |
| 85 Years and Over | 65 | 0.6% |
| Total | 11,311 | 100.0% |
Housing Finances in Union City
Median Income by Occupancy in Union City
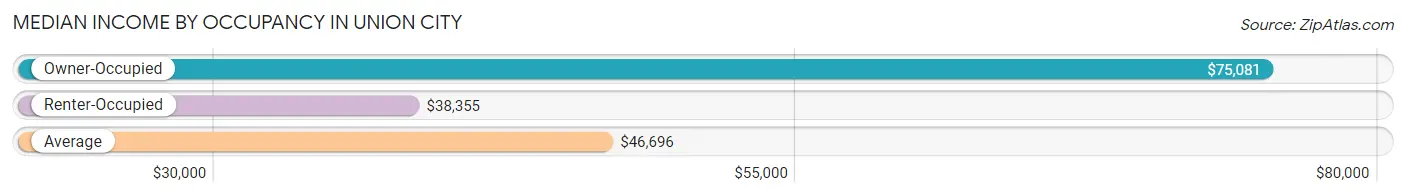
| Occupancy Type | # Households | Median Income |
| Owner-Occupied | 4,709 (41.6%) | $75,081 |
| Renter-Occupied | 6,602 (58.4%) | $38,355 |
| Average | 11,311 (100.0%) | $46,696 |
Occupancy by Householder Income Bracket in Union City
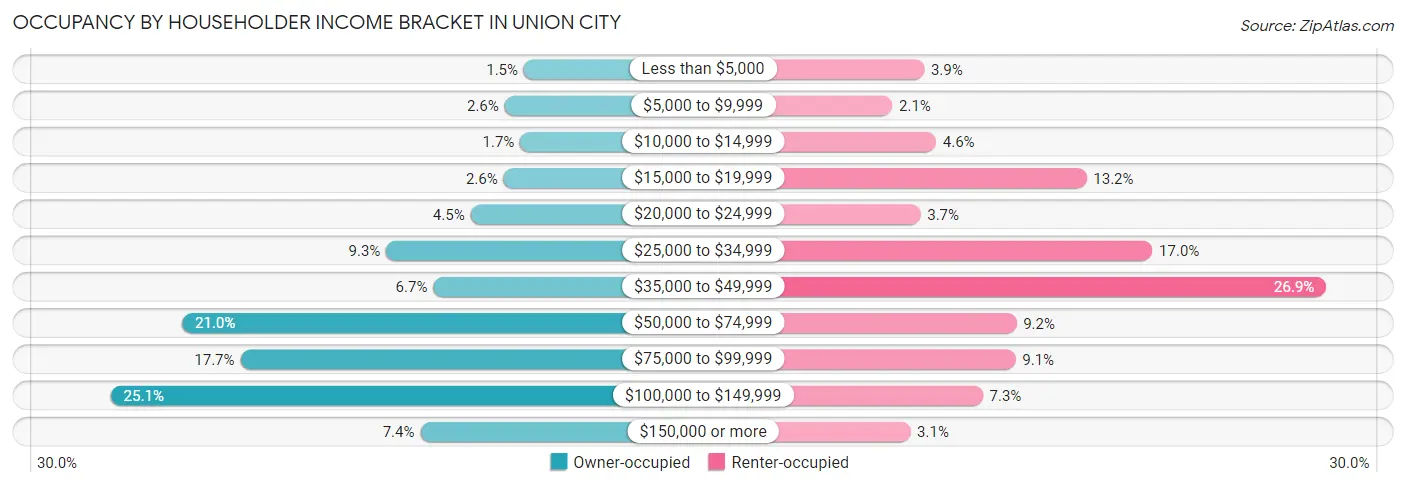
| Income Bracket | Owner-occupied | Renter-occupied |
| Less than $5,000 | 69 (1.5%) | 258 (3.9%) |
| $5,000 to $9,999 | 121 (2.6%) | 138 (2.1%) |
| $10,000 to $14,999 | 79 (1.7%) | 303 (4.6%) |
| $15,000 to $19,999 | 124 (2.6%) | 871 (13.2%) |
| $20,000 to $24,999 | 213 (4.5%) | 244 (3.7%) |
| $25,000 to $34,999 | 440 (9.3%) | 1,119 (17.0%) |
| $35,000 to $49,999 | 313 (6.7%) | 1,775 (26.9%) |
| $50,000 to $74,999 | 989 (21.0%) | 606 (9.2%) |
| $75,000 to $99,999 | 832 (17.7%) | 603 (9.1%) |
| $100,000 to $149,999 | 1,181 (25.1%) | 479 (7.3%) |
| $150,000 or more | 348 (7.4%) | 206 (3.1%) |
| Total | 4,709 (100.0%) | 6,602 (100.0%) |
Monthly Housing Cost Tiers in Union City
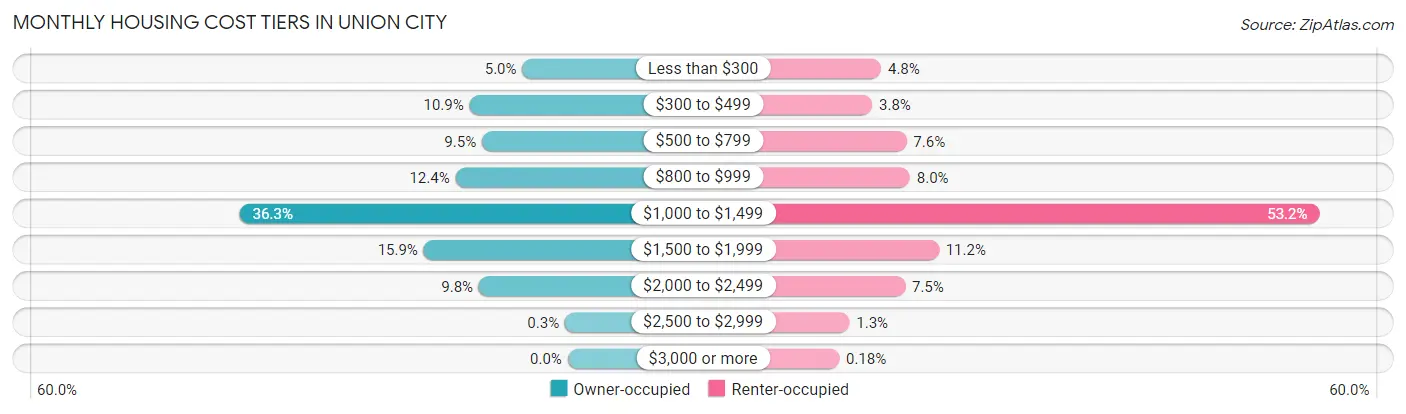
| Monthly Cost | Owner-occupied | Renter-occupied |
| Less than $300 | 236 (5.0%) | 318 (4.8%) |
| $300 to $499 | 511 (10.8%) | 253 (3.8%) |
| $500 to $799 | 446 (9.5%) | 503 (7.6%) |
| $800 to $999 | 584 (12.4%) | 528 (8.0%) |
| $1,000 to $1,499 | 1,707 (36.2%) | 3,514 (53.2%) |
| $1,500 to $1,999 | 749 (15.9%) | 739 (11.2%) |
| $2,000 to $2,499 | 462 (9.8%) | 493 (7.5%) |
| $2,500 to $2,999 | 14 (0.3%) | 87 (1.3%) |
| $3,000 or more | 0 (0.0%) | 12 (0.2%) |
| Total | 4,709 (100.0%) | 6,602 (100.0%) |
Physical Housing Characteristics in Union City
Housing Structures in Union City
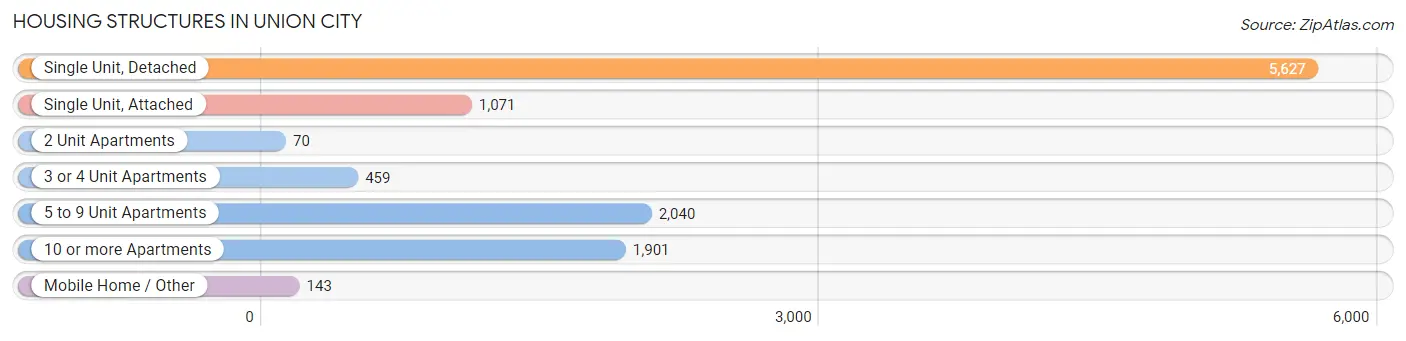
| Structure Type | # Housing Units | % Housing Units |
| Single Unit, Detached | 5,627 | 49.7% |
| Single Unit, Attached | 1,071 | 9.5% |
| 2 Unit Apartments | 70 | 0.6% |
| 3 or 4 Unit Apartments | 459 | 4.1% |
| 5 to 9 Unit Apartments | 2,040 | 18.0% |
| 10 or more Apartments | 1,901 | 16.8% |
| Mobile Home / Other | 143 | 1.3% |
| Total | 11,311 | 100.0% |
Housing Structures by Occupancy in Union City
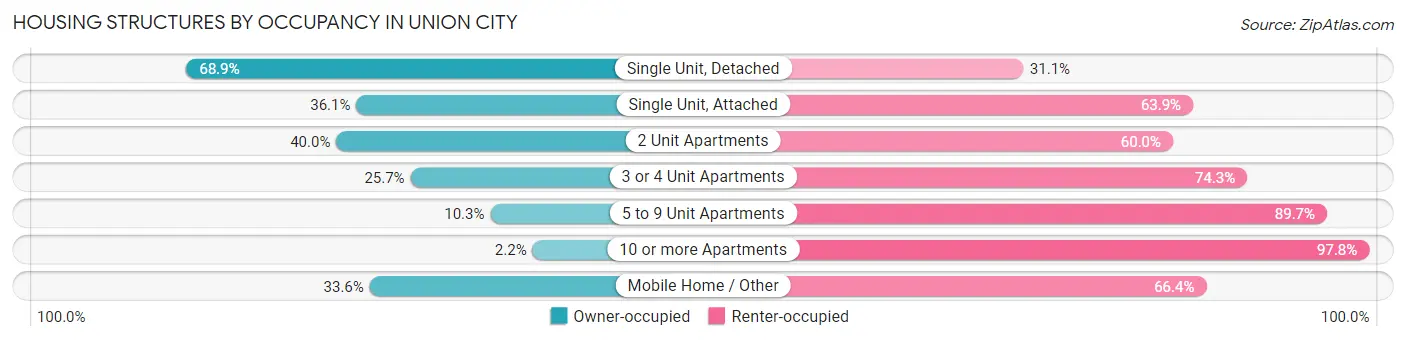
| Structure Type | Owner-occupied | Renter-occupied |
| Single Unit, Detached | 3,875 (68.9%) | 1,752 (31.1%) |
| Single Unit, Attached | 387 (36.1%) | 684 (63.9%) |
| 2 Unit Apartments | 28 (40.0%) | 42 (60.0%) |
| 3 or 4 Unit Apartments | 118 (25.7%) | 341 (74.3%) |
| 5 to 9 Unit Apartments | 211 (10.3%) | 1,829 (89.7%) |
| 10 or more Apartments | 42 (2.2%) | 1,859 (97.8%) |
| Mobile Home / Other | 48 (33.6%) | 95 (66.4%) |
| Total | 4,709 (41.6%) | 6,602 (58.4%) |
Housing Structures by Number of Rooms in Union City
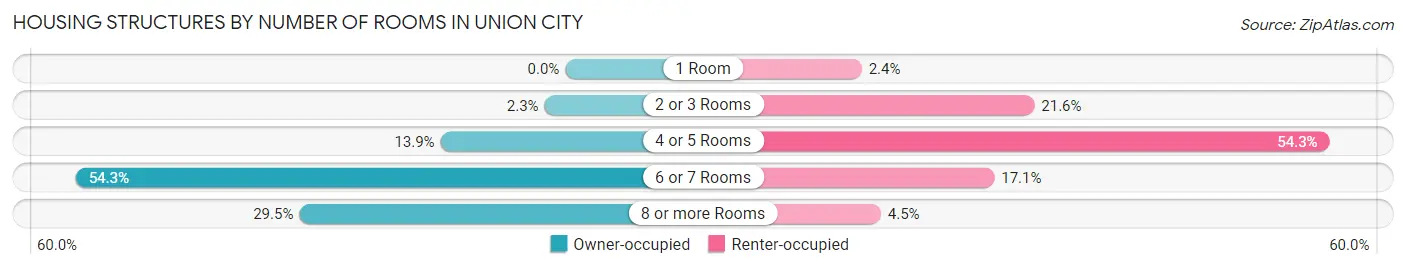
| Number of Rooms | Owner-occupied | Renter-occupied |
| 1 Room | 0 (0.0%) | 160 (2.4%) |
| 2 or 3 Rooms | 109 (2.3%) | 1,425 (21.6%) |
| 4 or 5 Rooms | 652 (13.9%) | 3,586 (54.3%) |
| 6 or 7 Rooms | 2,558 (54.3%) | 1,131 (17.1%) |
| 8 or more Rooms | 1,390 (29.5%) | 300 (4.5%) |
| Total | 4,709 (100.0%) | 6,602 (100.0%) |
Housing Structure by Heating Type in Union City
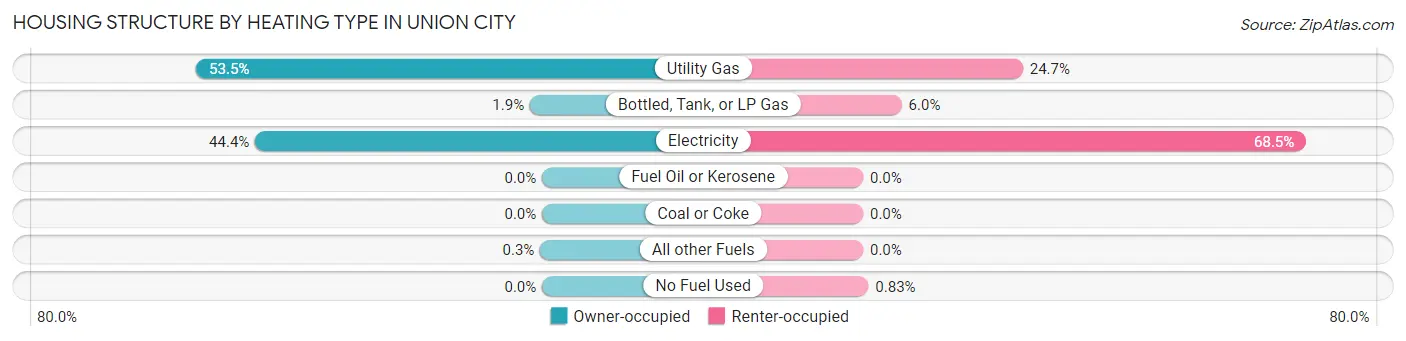
| Heating Type | Owner-occupied | Renter-occupied |
| Utility Gas | 2,518 (53.5%) | 1,631 (24.7%) |
| Bottled, Tank, or LP Gas | 88 (1.9%) | 394 (6.0%) |
| Electricity | 2,089 (44.4%) | 4,522 (68.5%) |
| Fuel Oil or Kerosene | 0 (0.0%) | 0 (0.0%) |
| Coal or Coke | 0 (0.0%) | 0 (0.0%) |
| All other Fuels | 14 (0.3%) | 0 (0.0%) |
| No Fuel Used | 0 (0.0%) | 55 (0.8%) |
| Total | 4,709 (100.0%) | 6,602 (100.0%) |
Household Vehicle Usage in Union City
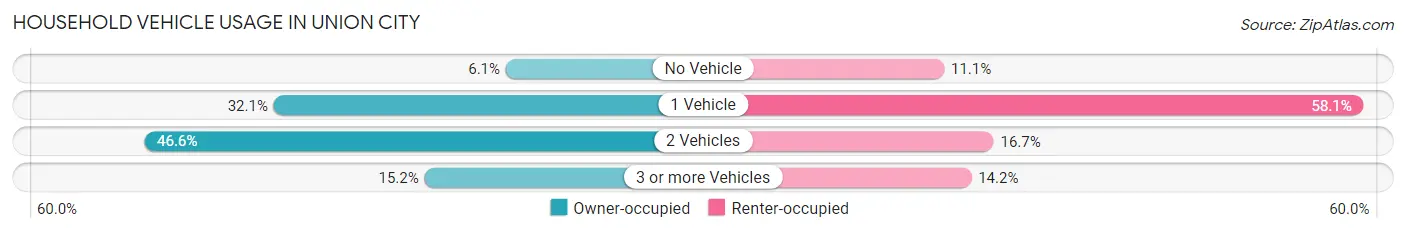
| Vehicles per Household | Owner-occupied | Renter-occupied |
| No Vehicle | 287 (6.1%) | 733 (11.1%) |
| 1 Vehicle | 1,511 (32.1%) | 3,836 (58.1%) |
| 2 Vehicles | 2,195 (46.6%) | 1,099 (16.7%) |
| 3 or more Vehicles | 716 (15.2%) | 934 (14.1%) |
| Total | 4,709 (100.0%) | 6,602 (100.0%) |
Real Estate & Mortgages in Union City
Real Estate and Mortgage Overview in Union City
| Characteristic | Without Mortgage | With Mortgage |
| Housing Units | 1,157 | 3,552 |
| Median Property Value | $164,900 | $209,000 |
| Median Household Income | $56,158 | $247 |
| Monthly Housing Costs | $442 | $0 |
| Real Estate Taxes | $865 | $156 |
Property Value by Mortgage Status in Union City
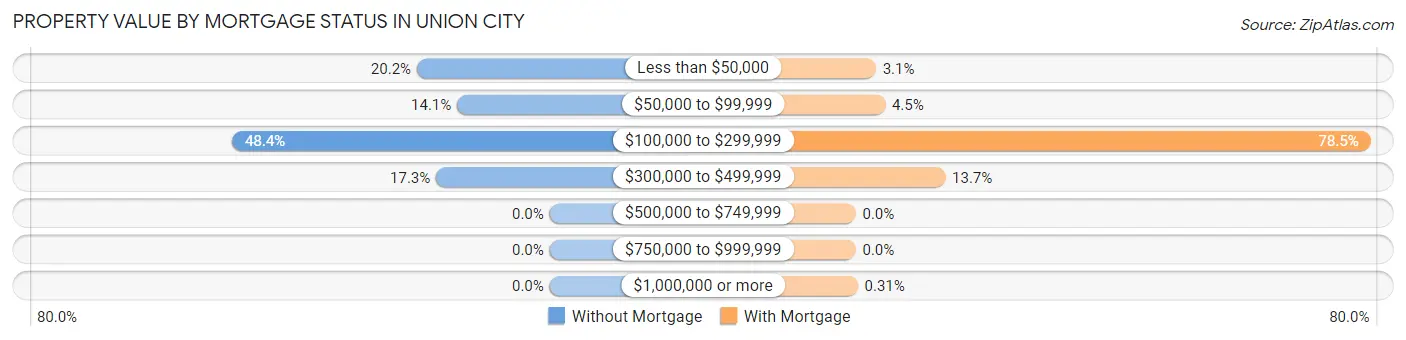
| Property Value | Without Mortgage | With Mortgage |
| Less than $50,000 | 234 (20.2%) | 109 (3.1%) |
| $50,000 to $99,999 | 163 (14.1%) | 159 (4.5%) |
| $100,000 to $299,999 | 560 (48.4%) | 2,788 (78.5%) |
| $300,000 to $499,999 | 200 (17.3%) | 485 (13.7%) |
| $500,000 to $749,999 | 0 (0.0%) | 0 (0.0%) |
| $750,000 to $999,999 | 0 (0.0%) | 0 (0.0%) |
| $1,000,000 or more | 0 (0.0%) | 11 (0.3%) |
| Total | 1,157 (100.0%) | 3,552 (100.0%) |
Household Income by Mortgage Status in Union City
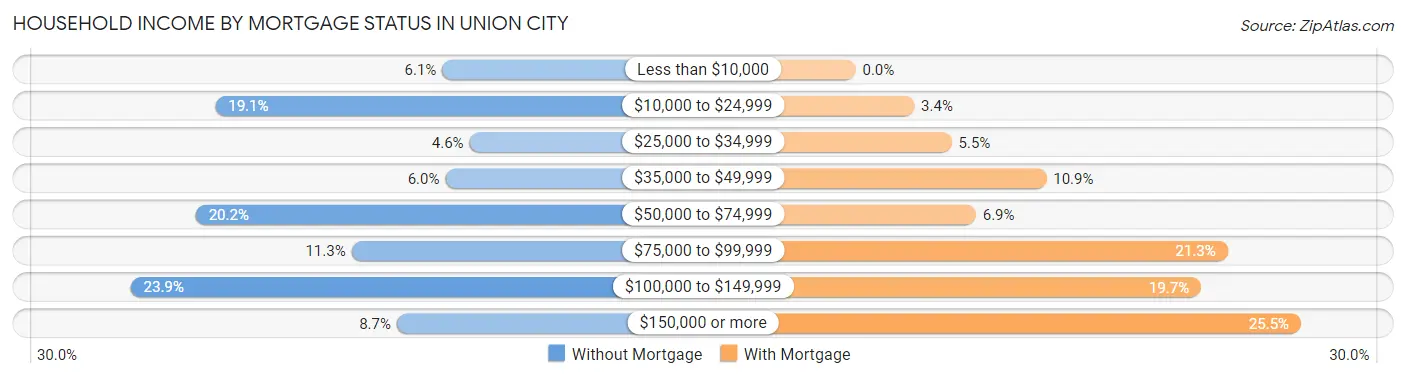
| Household Income | Without Mortgage | With Mortgage |
| Less than $10,000 | 71 (6.1%) | 0 (0.0%) |
| $10,000 to $24,999 | 221 (19.1%) | 119 (3.4%) |
| $25,000 to $34,999 | 53 (4.6%) | 195 (5.5%) |
| $35,000 to $49,999 | 69 (6.0%) | 387 (10.9%) |
| $50,000 to $74,999 | 234 (20.2%) | 244 (6.9%) |
| $75,000 to $99,999 | 131 (11.3%) | 755 (21.3%) |
| $100,000 to $149,999 | 277 (23.9%) | 701 (19.7%) |
| $150,000 or more | 101 (8.7%) | 904 (25.5%) |
| Total | 1,157 (100.0%) | 3,552 (100.0%) |
Property Value to Household Income Ratio in Union City
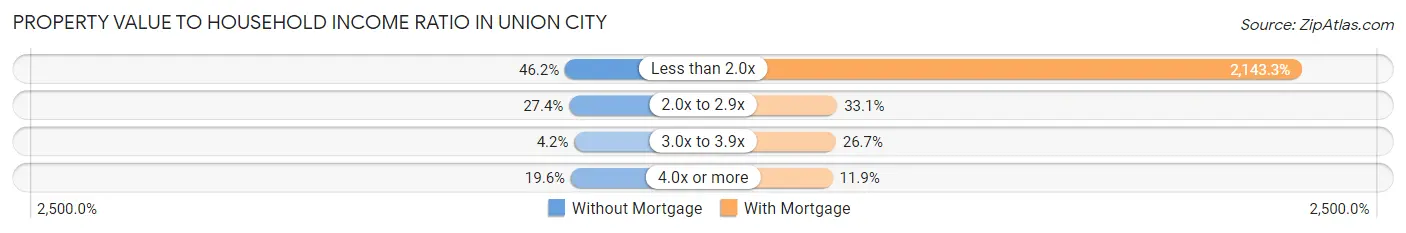
| Value-to-Income Ratio | Without Mortgage | With Mortgage |
| Less than 2.0x | 534 (46.2%) | 76,131 (2,143.3%) |
| 2.0x to 2.9x | 317 (27.4%) | 1,176 (33.1%) |
| 3.0x to 3.9x | 49 (4.2%) | 948 (26.7%) |
| 4.0x or more | 227 (19.6%) | 423 (11.9%) |
| Total | 1,157 (100.0%) | 3,552 (100.0%) |
Real Estate Taxes by Mortgage Status in Union City
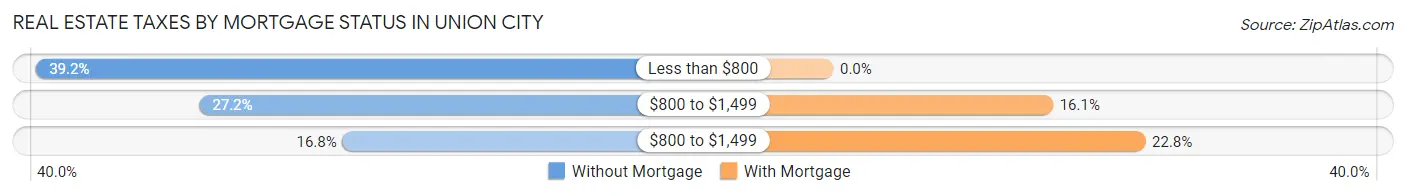
| Property Taxes | Without Mortgage | With Mortgage |
| Less than $800 | 453 (39.2%) | 0 (0.0%) |
| $800 to $1,499 | 315 (27.2%) | 570 (16.1%) |
| $800 to $1,499 | 194 (16.8%) | 810 (22.8%) |
| Total | 1,157 (100.0%) | 3,552 (100.0%) |
Health & Disability in Union City
Health Insurance Coverage by Age in Union City
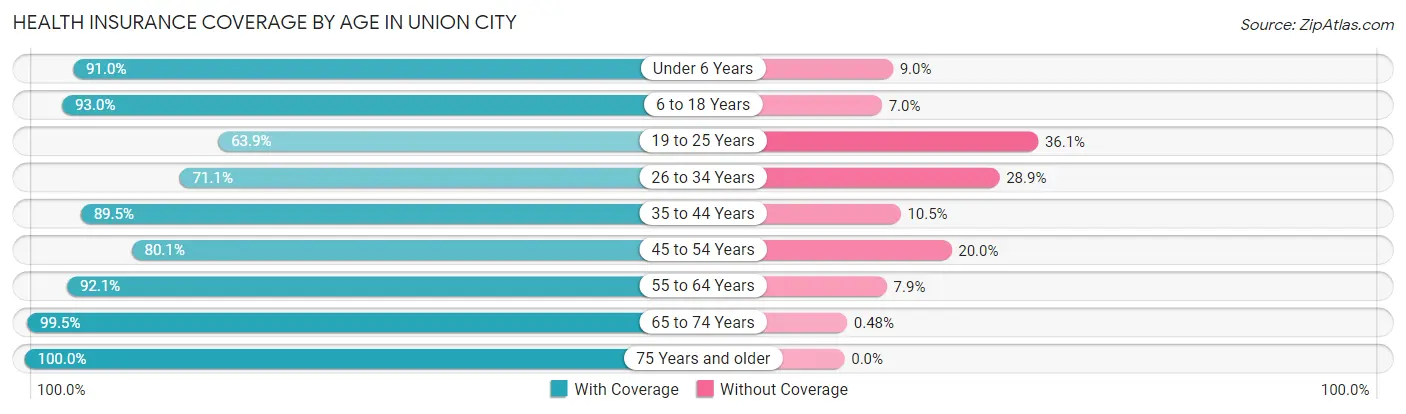
| Age Bracket | With Coverage | Without Coverage |
| Under 6 Years | 1,913 (91.0%) | 190 (9.0%) |
| 6 to 18 Years | 4,916 (93.0%) | 369 (7.0%) |
| 19 to 25 Years | 1,973 (63.9%) | 1,115 (36.1%) |
| 26 to 34 Years | 2,894 (71.1%) | 1,176 (28.9%) |
| 35 to 44 Years | 3,770 (89.5%) | 441 (10.5%) |
| 45 to 54 Years | 2,018 (80.0%) | 503 (20.0%) |
| 55 to 64 Years | 2,296 (92.1%) | 197 (7.9%) |
| 65 to 74 Years | 1,871 (99.5%) | 9 (0.5%) |
| 75 Years and older | 931 (100.0%) | 0 (0.0%) |
| Total | 22,582 (85.0%) | 4,000 (15.0%) |
Health Insurance Coverage by Citizenship Status in Union City
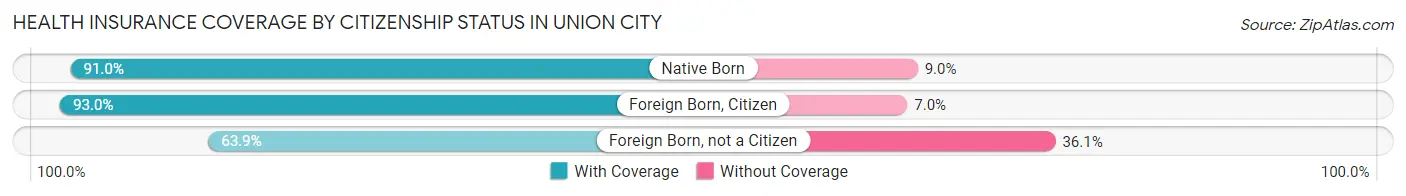
| Citizenship Status | With Coverage | Without Coverage |
| Native Born | 1,913 (91.0%) | 190 (9.0%) |
| Foreign Born, Citizen | 4,916 (93.0%) | 369 (7.0%) |
| Foreign Born, not a Citizen | 1,973 (63.9%) | 1,115 (36.1%) |
Health Insurance Coverage by Household Income in Union City
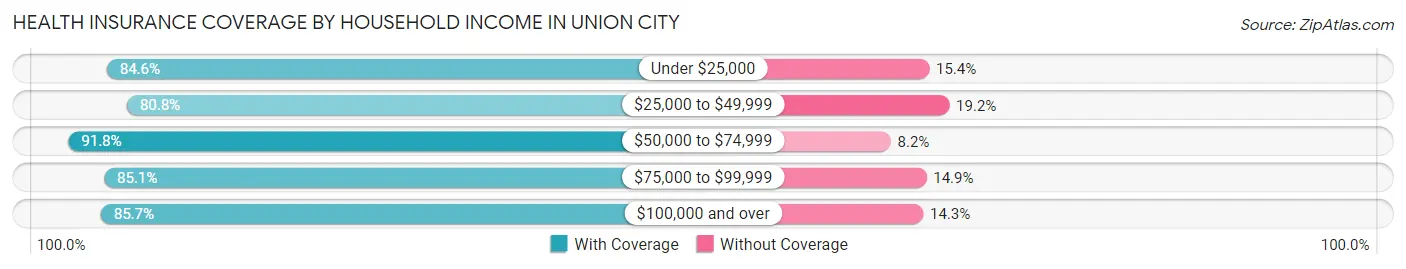
| Household Income | With Coverage | Without Coverage |
| Under $25,000 | 3,349 (84.6%) | 610 (15.4%) |
| $25,000 to $49,999 | 5,993 (80.8%) | 1,422 (19.2%) |
| $50,000 to $74,999 | 3,454 (91.8%) | 309 (8.2%) |
| $75,000 to $99,999 | 3,278 (85.1%) | 574 (14.9%) |
| $100,000 and over | 6,490 (85.7%) | 1,081 (14.3%) |
Public vs Private Health Insurance Coverage by Age in Union City
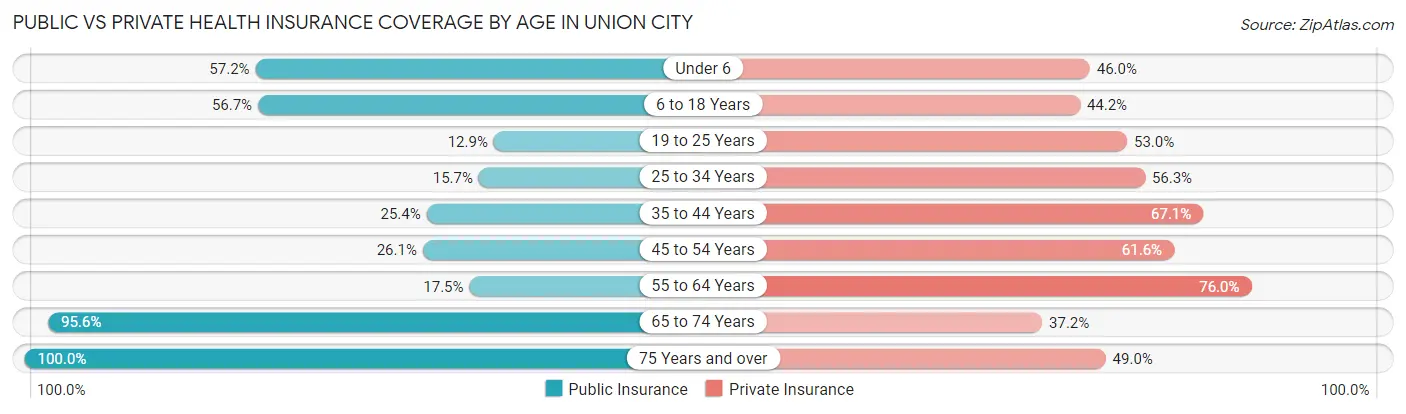
| Age Bracket | Public Insurance | Private Insurance |
| Under 6 | 1,202 (57.2%) | 968 (46.0%) |
| 6 to 18 Years | 2,996 (56.7%) | 2,336 (44.2%) |
| 19 to 25 Years | 399 (12.9%) | 1,635 (52.9%) |
| 25 to 34 Years | 639 (15.7%) | 2,290 (56.3%) |
| 35 to 44 Years | 1,069 (25.4%) | 2,824 (67.1%) |
| 45 to 54 Years | 658 (26.1%) | 1,554 (61.6%) |
| 55 to 64 Years | 435 (17.4%) | 1,895 (76.0%) |
| 65 to 74 Years | 1,798 (95.6%) | 699 (37.2%) |
| 75 Years and over | 931 (100.0%) | 456 (49.0%) |
| Total | 10,127 (38.1%) | 14,657 (55.1%) |
Disability Status by Sex by Age in Union City
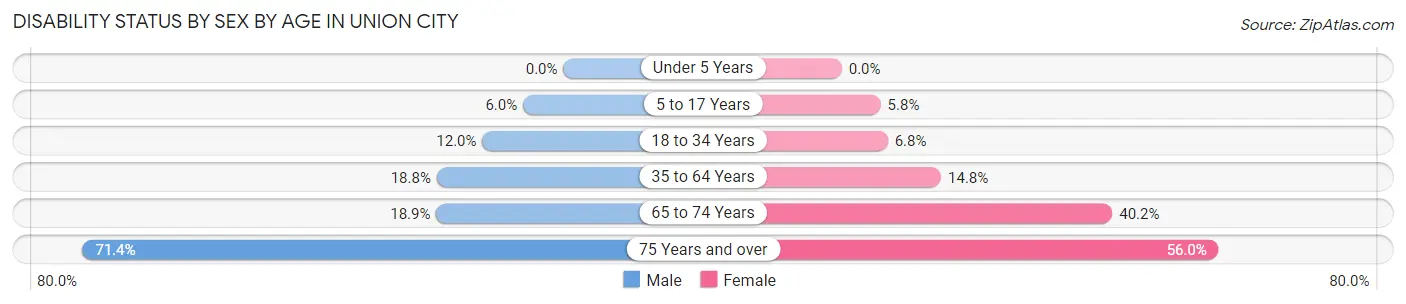
| Age Bracket | Male | Female |
| Under 5 Years | 0 (0.0%) | 0 (0.0%) |
| 5 to 17 Years | 193 (6.0%) | 147 (5.8%) |
| 18 to 34 Years | 388 (12.0%) | 278 (6.8%) |
| 35 to 64 Years | 703 (18.8%) | 809 (14.7%) |
| 65 to 74 Years | 134 (18.9%) | 470 (40.2%) |
| 75 Years and over | 180 (71.4%) | 380 (56.0%) |
Disability Class by Sex by Age in Union City
Disability Class: Hearing Difficulty
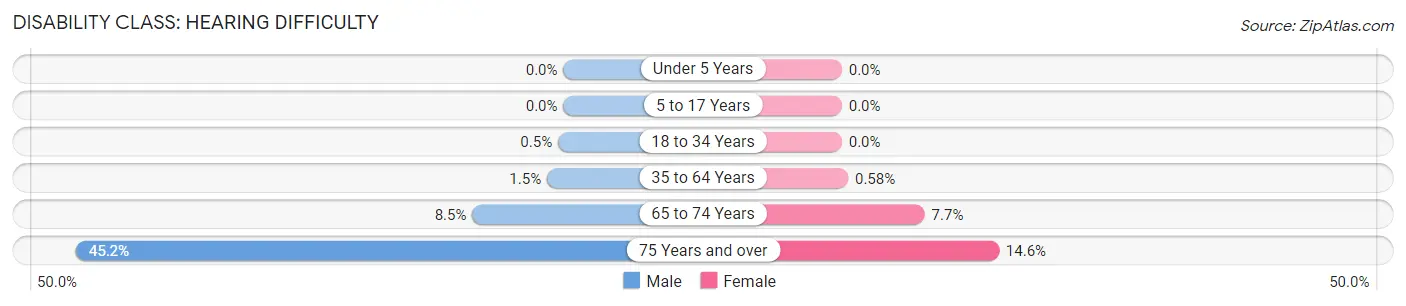
| Age Bracket | Male | Female |
| Under 5 Years | 0 (0.0%) | 0 (0.0%) |
| 5 to 17 Years | 0 (0.0%) | 0 (0.0%) |
| 18 to 34 Years | 16 (0.5%) | 0 (0.0%) |
| 35 to 64 Years | 57 (1.5%) | 32 (0.6%) |
| 65 to 74 Years | 60 (8.5%) | 90 (7.7%) |
| 75 Years and over | 114 (45.2%) | 99 (14.6%) |
Disability Class: Vision Difficulty
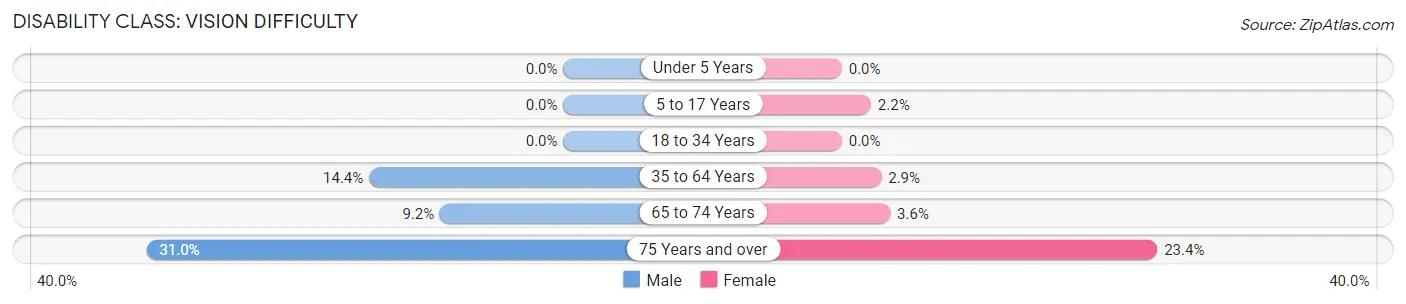
| Age Bracket | Male | Female |
| Under 5 Years | 0 (0.0%) | 0 (0.0%) |
| 5 to 17 Years | 0 (0.0%) | 55 (2.2%) |
| 18 to 34 Years | 0 (0.0%) | 0 (0.0%) |
| 35 to 64 Years | 539 (14.4%) | 161 (2.9%) |
| 65 to 74 Years | 65 (9.1%) | 42 (3.6%) |
| 75 Years and over | 78 (30.9%) | 159 (23.4%) |
Disability Class: Cognitive Difficulty
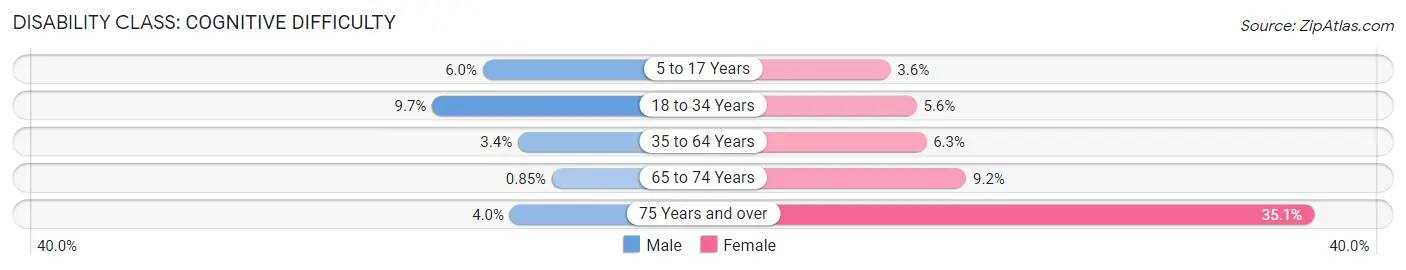
| Age Bracket | Male | Female |
| 5 to 17 Years | 193 (6.0%) | 92 (3.6%) |
| 18 to 34 Years | 314 (9.7%) | 226 (5.6%) |
| 35 to 64 Years | 126 (3.4%) | 344 (6.3%) |
| 65 to 74 Years | 6 (0.9%) | 108 (9.2%) |
| 75 Years and over | 10 (4.0%) | 238 (35.0%) |
Disability Class: Ambulatory Difficulty
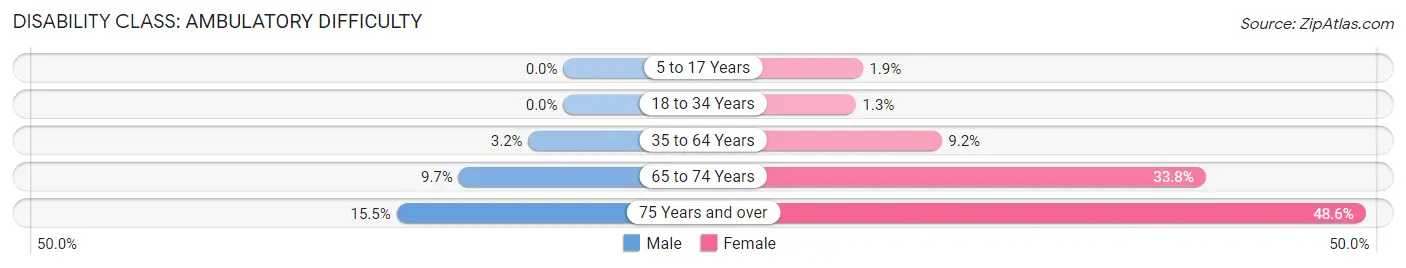
| Age Bracket | Male | Female |
| 5 to 17 Years | 0 (0.0%) | 49 (1.9%) |
| 18 to 34 Years | 0 (0.0%) | 52 (1.3%) |
| 35 to 64 Years | 121 (3.2%) | 507 (9.2%) |
| 65 to 74 Years | 69 (9.7%) | 395 (33.8%) |
| 75 Years and over | 39 (15.5%) | 330 (48.6%) |
Disability Class: Self-Care Difficulty
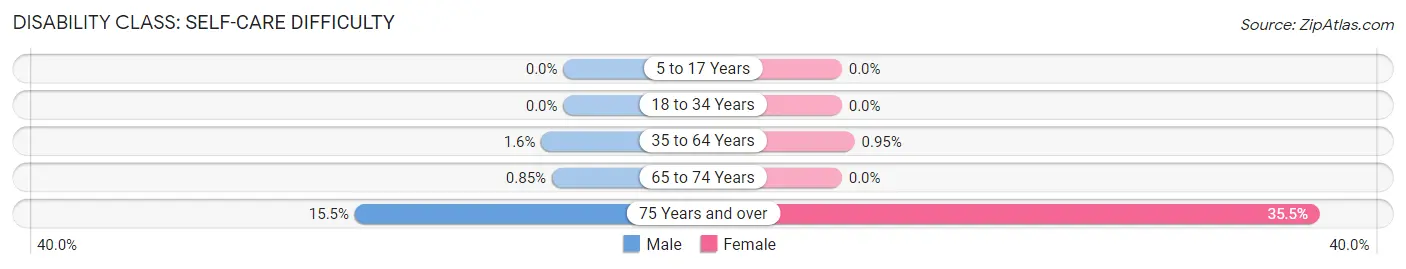
| Age Bracket | Male | Female |
| 5 to 17 Years | 0 (0.0%) | 0 (0.0%) |
| 18 to 34 Years | 0 (0.0%) | 0 (0.0%) |
| 35 to 64 Years | 61 (1.6%) | 52 (0.9%) |
| 65 to 74 Years | 6 (0.9%) | 0 (0.0%) |
| 75 Years and over | 39 (15.5%) | 241 (35.5%) |
Technology Access in Union City
Computing Device Access in Union City
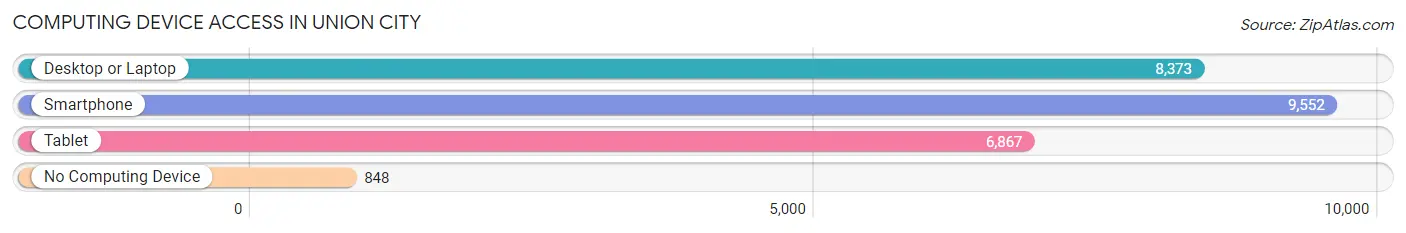
| Device Type | # Households | % Households |
| Desktop or Laptop | 8,373 | 74.0% |
| Smartphone | 9,552 | 84.5% |
| Tablet | 6,867 | 60.7% |
| No Computing Device | 848 | 7.5% |
| Total | 11,311 | 100.0% |
Internet Access in Union City
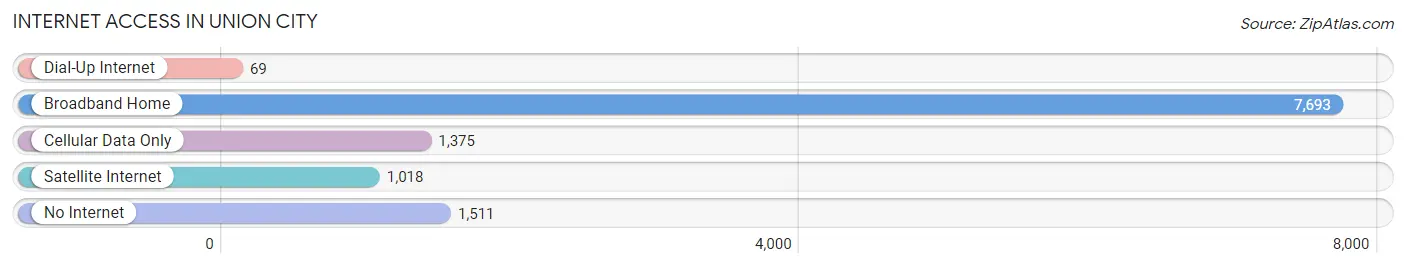
| Internet Type | # Households | % Households |
| Dial-Up Internet | 69 | 0.6% |
| Broadband Home | 7,693 | 68.0% |
| Cellular Data Only | 1,375 | 12.2% |
| Satellite Internet | 1,018 | 9.0% |
| No Internet | 1,511 | 13.4% |
| Total | 11,311 | 100.0% |
Union City Summary
Introduction
Union City is a city located in Fulton County, Georgia, United States. It is part of the Atlanta metropolitan area and is located approximately 20 miles south of downtown Atlanta. The city has a population of 19,456 as of the 2010 census. Union City is a diverse community with a rich history and a vibrant economy.
History
Union City was founded in 1854 by the Georgia General Assembly as a railroad town. The town was named after the Union Army, which had recently won the Civil War. The town was originally known as Union Station, but the name was changed to Union City in 1871. The town was incorporated in 1908.
In the early 20th century, Union City was a thriving agricultural community. The town was home to several cotton mills and other industries. The town was also home to a large African American population, many of whom worked in the cotton mills.
In the 1950s, Union City began to experience rapid growth as the city became a popular suburb of Atlanta. The city was home to several large shopping centers and other businesses. The city also experienced a large influx of African American residents, many of whom were attracted by the city’s affordable housing and proximity to Atlanta.
Geography
Union City is located in the southern part of Fulton County, Georgia. The city is situated on the Chattahoochee River and is bordered by the cities of Fairburn, Palmetto, and College Park. The city covers an area of 8.3 square miles and has a population density of 2,323 people per square mile.
The city has a humid subtropical climate, with hot, humid summers and mild winters. The average annual temperature is 61 degrees Fahrenheit, with an average high of 79 degrees in the summer and an average low of 43 degrees in the winter. The average annual precipitation is 48 inches.
Economy
Union City’s economy is largely based on retail, manufacturing, and services. The city is home to several large shopping centers, including the Union City Mall and the Union City Marketplace. The city is also home to several manufacturing companies, including the Union City Manufacturing Company and the Union City Textile Company.
The city is also home to several service-based businesses, including medical centers, banks, and restaurants. The city is also home to several government offices, including the Union City Police Department and the Union City Fire Department.
Demographics
As of the 2010 census, Union City had a population of 19,456. The racial makeup of the city was 57.3% African American, 33.2% White, 4.2% Hispanic or Latino, 2.2% Asian, and 0.3% Native American. The median household income was $37,845, and the median family income was $45,845.
Conclusion
Union City is a diverse city with a rich history and a vibrant economy. The city is home to several large shopping centers, manufacturing companies, and service-based businesses. The city also has a diverse population, with a majority of African American residents. Union City is a great place to live, work, and play.
Common Questions
What is Per Capita Income in Union City?
Per Capita income in Union City is $26,549.
What is the Median Family Income in Union City?
Median Family Income in Union City is $66,176.
What is the Median Household income in Union City?
Median Household Income in Union City is $46,696.
What is Income or Wage Gap in Union City?
Income or Wage Gap in Union City is 15.9%.
Women in Union City earn 84.1 cents for every dollar earned by a man.
What is Family Income Deficit in Union City?
Family Income Deficit in Union City is $8,075.
Families that are below poverty line in Union City earn $8,075 less on average than the poverty threshold level.
What is Inequality or Gini Index in Union City?
Inequality or Gini Index in Union City is 0.40.
What is the Total Population of Union City?
Total Population of Union City is 26,869.
What is the Total Male Population of Union City?
Total Male Population of Union City is 12,073.
What is the Total Female Population of Union City?
Total Female Population of Union City is 14,796.
What is the Ratio of Males per 100 Females in Union City?
There are 81.60 Males per 100 Females in Union City.
What is the Ratio of Females per 100 Males in Union City?
There are 122.55 Females per 100 Males in Union City.
What is the Median Population Age in Union City?
Median Population Age in Union City is 32.7 Years.
What is the Average Family Size in Union City
Average Family Size in Union City is 3.3 People.
What is the Average Household Size in Union City
Average Household Size in Union City is 2.4 People.
How Large is the Labor Force in Union City?
There are 13,979 People in the Labor Forcein in Union City.
What is the Percentage of People in the Labor Force in Union City?
69.1% of People are in the Labor Force in Union City.
What is the Unemployment Rate in Union City?
Unemployment Rate in Union City is 4.6%.