Budd Lake, NJ Map & Demographics
Budd Lake Map
Budd Lake Overview
$47,099
PER CAPITA INCOME
$114,036
AVG FAMILY INCOME
$99,303
AVG HOUSEHOLD INCOME
49.0%
WAGE / INCOME GAP [ % ]
51.0¢/ $1
WAGE / INCOME GAP [ $ ]
0.38
INEQUALITY / GINI INDEX
9,983
TOTAL POPULATION
5,311
MALE POPULATION
4,672
FEMALE POPULATION
113.68
MALES / 100 FEMALES
87.97
FEMALES / 100 MALES
37.3
MEDIAN AGE
3.1
AVG FAMILY SIZE
2.8
AVG HOUSEHOLD SIZE
5,718
LABOR FORCE [ PEOPLE ]
75.3%
PERCENT IN LABOR FORCE
5.7%
UNEMPLOYMENT RATE
Budd Lake Zip Codes
Income in Budd Lake
Income Overview in Budd Lake
Per Capita Income in Budd Lake is $47,099, while median incomes of families and households are $114,036 and $99,303 respectively.
| Characteristic | Number | Measure |
| Per Capita Income | 9,983 | $47,099 |
| Median Family Income | 2,777 | $114,036 |
| Mean Family Income | 2,777 | $145,983 |
| Median Household Income | 3,549 | $99,303 |
| Mean Household Income | 3,549 | $131,571 |
| Income Deficit | 2,777 | $0 |
| Wage / Income Gap (%) | 9,983 | 49.01% |
| Wage / Income Gap ($) | 9,983 | 50.99¢ per $1 |
| Gini / Inequality Index | 9,983 | 0.38 |
Earnings by Sex in Budd Lake
Average Earnings in Budd Lake are $53,852, $68,032 for men and $34,688 for women, a difference of 49.0%.
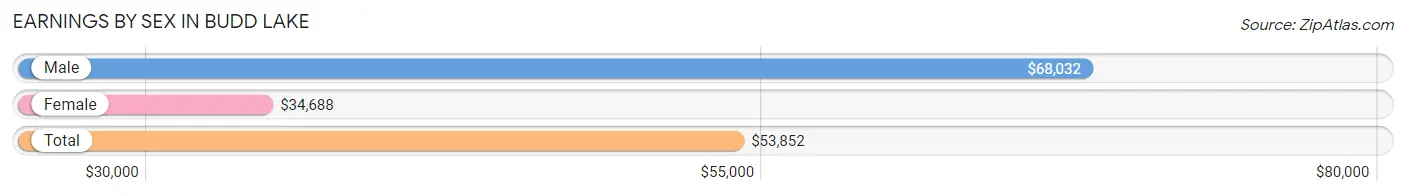
| Sex | Number | Average Earnings |
| Male | 3,206 (54.2%) | $68,032 |
| Female | 2,714 (45.8%) | $34,688 |
| Total | 5,920 (100.0%) | $53,852 |
Earnings by Sex by Income Bracket in Budd Lake
The most common earnings brackets in Budd Lake are $100,000+ for men (711 | 22.2%) and $100,000+ for women (412 | 15.2%).
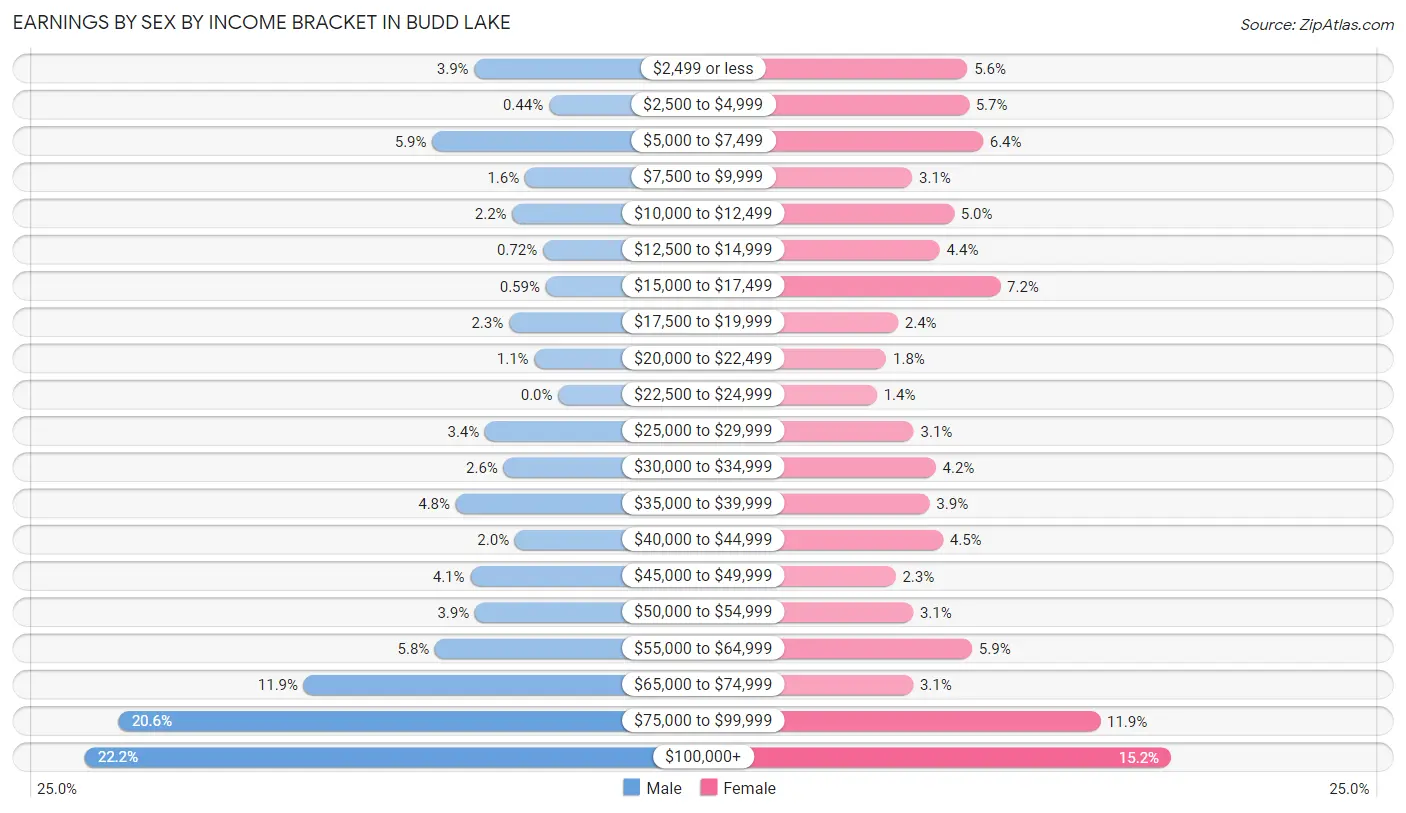
| Income | Male | Female |
| $2,499 or less | 126 (3.9%) | 153 (5.6%) |
| $2,500 to $4,999 | 14 (0.4%) | 155 (5.7%) |
| $5,000 to $7,499 | 189 (5.9%) | 173 (6.4%) |
| $7,500 to $9,999 | 50 (1.6%) | 83 (3.1%) |
| $10,000 to $12,499 | 69 (2.1%) | 136 (5.0%) |
| $12,500 to $14,999 | 23 (0.7%) | 118 (4.3%) |
| $15,000 to $17,499 | 19 (0.6%) | 195 (7.2%) |
| $17,500 to $19,999 | 74 (2.3%) | 65 (2.4%) |
| $20,000 to $22,499 | 36 (1.1%) | 50 (1.8%) |
| $22,500 to $24,999 | 0 (0.0%) | 38 (1.4%) |
| $25,000 to $29,999 | 110 (3.4%) | 85 (3.1%) |
| $30,000 to $34,999 | 82 (2.6%) | 113 (4.2%) |
| $35,000 to $39,999 | 154 (4.8%) | 105 (3.9%) |
| $40,000 to $44,999 | 65 (2.0%) | 122 (4.5%) |
| $45,000 to $49,999 | 132 (4.1%) | 62 (2.3%) |
| $50,000 to $54,999 | 125 (3.9%) | 84 (3.1%) |
| $55,000 to $64,999 | 185 (5.8%) | 159 (5.9%) |
| $65,000 to $74,999 | 382 (11.9%) | 84 (3.1%) |
| $75,000 to $99,999 | 660 (20.6%) | 322 (11.9%) |
| $100,000+ | 711 (22.2%) | 412 (15.2%) |
| Total | 3,206 (100.0%) | 2,714 (100.0%) |
Earnings by Sex by Educational Attainment in Budd Lake
Average earnings in Budd Lake are $69,734 for men and $39,613 for women, a difference of 43.2%. Men with an educational attainment of graduate degree enjoy the highest average annual earnings of $105,850, while those with high school diploma education earn the least with $58,509. Women with an educational attainment of college or associate's degree earn the most with the average annual earnings of $59,427, while those with high school diploma education have the smallest earnings of $26,000.
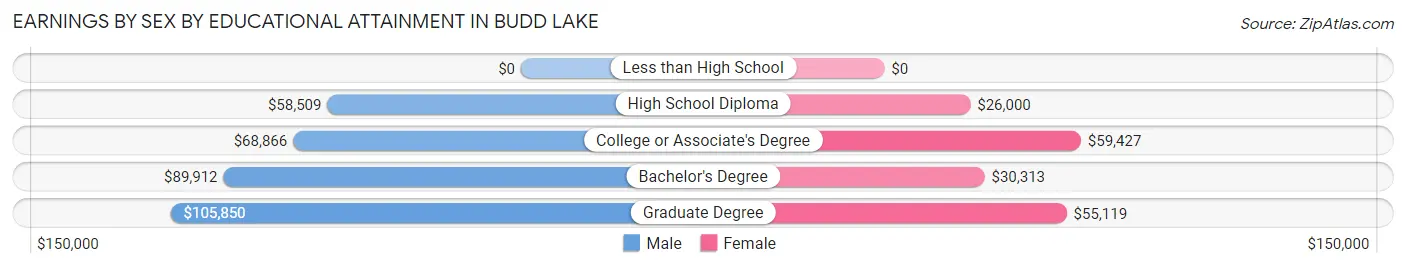
| Educational Attainment | Male Income | Female Income |
| Less than High School | - | - |
| High School Diploma | $58,509 | $26,000 |
| College or Associate's Degree | $68,866 | $59,427 |
| Bachelor's Degree | $89,912 | $30,313 |
| Graduate Degree | $105,850 | $55,119 |
| Total | $69,734 | $39,613 |
Family Income in Budd Lake
Family Income Brackets in Budd Lake
According to the Budd Lake family income data, there are 611 families falling into the $200,000+ income range, which is the most common income bracket and makes up 22.0% of all families. Conversely, the less than $10,000 income bracket is the least frequent group with only 17 families (0.6%) belonging to this category.
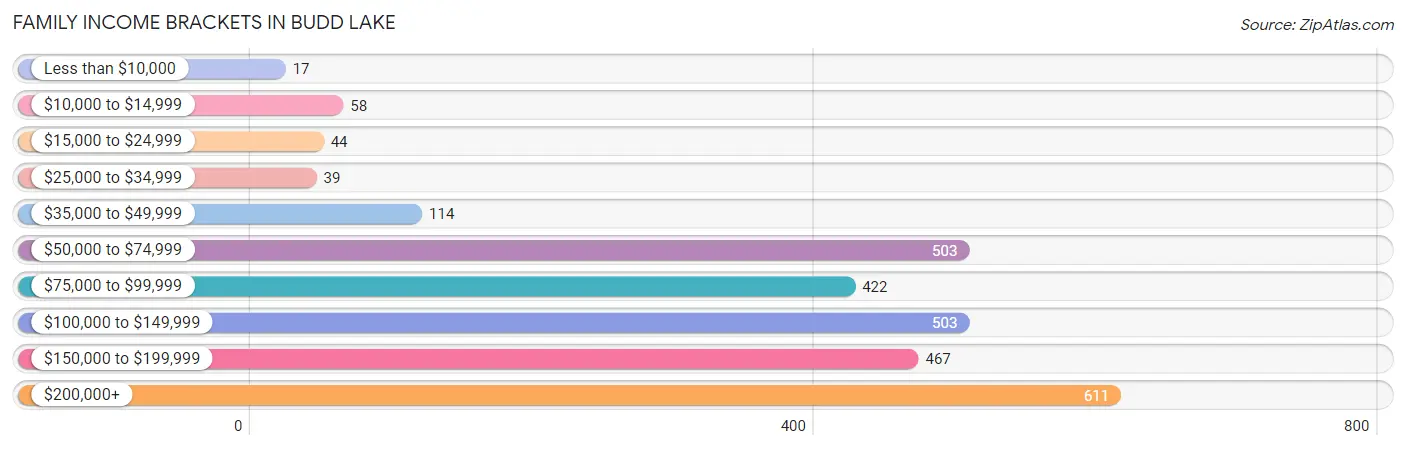
| Income Bracket | # Families | % Families |
| Less than $10,000 | 17 | 0.6% |
| $10,000 to $14,999 | 58 | 2.1% |
| $15,000 to $24,999 | 44 | 1.6% |
| $25,000 to $34,999 | 39 | 1.4% |
| $35,000 to $49,999 | 114 | 4.1% |
| $50,000 to $74,999 | 503 | 18.1% |
| $75,000 to $99,999 | 422 | 15.2% |
| $100,000 to $149,999 | 503 | 18.1% |
| $150,000 to $199,999 | 467 | 16.8% |
| $200,000+ | 611 | 22.0% |
Family Income by Famaliy Size in Budd Lake
6-person families (78 | 2.8%) account for the highest median family income in Budd Lake with $185,732 per family, while 3-person families (835 | 30.1%) have the highest median income of $47,410 per family member.
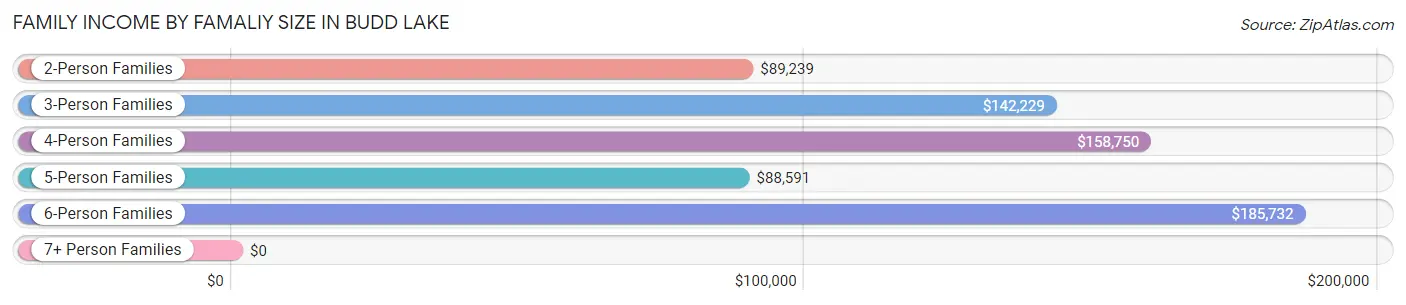
| Income Bracket | # Families | Median Income |
| 2-Person Families | 1,140 (41.0%) | $89,239 |
| 3-Person Families | 835 (30.1%) | $142,229 |
| 4-Person Families | 444 (16.0%) | $158,750 |
| 5-Person Families | 244 (8.8%) | $88,591 |
| 6-Person Families | 78 (2.8%) | $185,732 |
| 7+ Person Families | 36 (1.3%) | $0 |
| Total | 2,777 (100.0%) | $114,036 |
Family Income by Number of Earners in Budd Lake
The median family income in Budd Lake is $114,036, with families comprising 3+ earners (238) having the highest median family income of $185,278, while families with 1 earner (1,001) have the lowest median family income of $69,646, accounting for 8.6% and 36.0% of families, respectively.
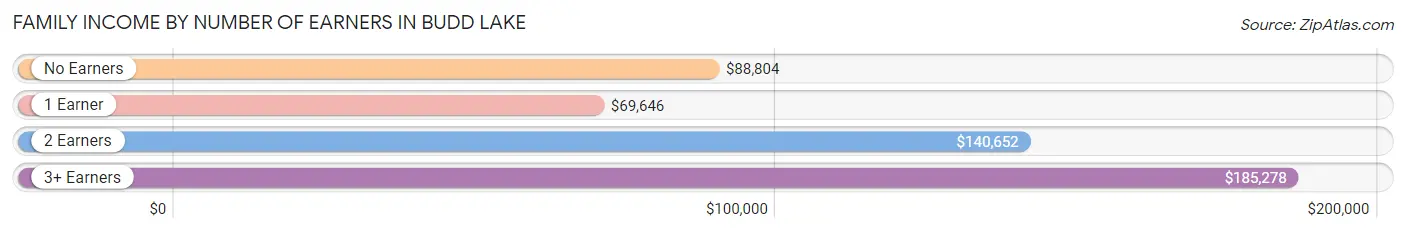
| Number of Earners | # Families | Median Income |
| No Earners | 122 (4.4%) | $88,804 |
| 1 Earner | 1,001 (36.0%) | $69,646 |
| 2 Earners | 1,416 (51.0%) | $140,652 |
| 3+ Earners | 238 (8.6%) | $185,278 |
| Total | 2,777 (100.0%) | $114,036 |
Household Income in Budd Lake
Household Income Brackets in Budd Lake
With 699 households falling in the category, the $50,000 to $74,999 income range is the most frequent in Budd Lake, accounting for 19.7% of all households. In contrast, only 43 households (1.2%) fall into the less than $10,000 income bracket, making it the least populous group.
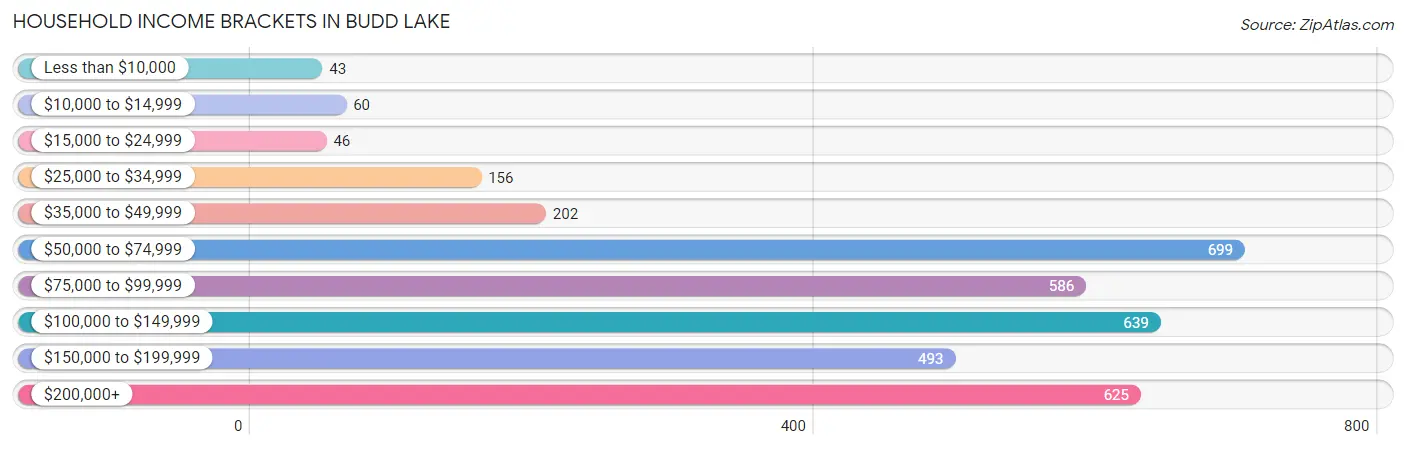
| Income Bracket | # Households | % Households |
| Less than $10,000 | 43 | 1.2% |
| $10,000 to $14,999 | 60 | 1.7% |
| $15,000 to $24,999 | 46 | 1.3% |
| $25,000 to $34,999 | 156 | 4.4% |
| $35,000 to $49,999 | 202 | 5.7% |
| $50,000 to $74,999 | 699 | 19.7% |
| $75,000 to $99,999 | 586 | 16.5% |
| $100,000 to $149,999 | 639 | 18.0% |
| $150,000 to $199,999 | 493 | 13.9% |
| $200,000+ | 625 | 17.6% |
Household Income by Householder Age in Budd Lake
The median household income in Budd Lake is $99,303, with the highest median household income of $120,524 found in the 45 to 64 years age bracket for the primary householder. A total of 1,451 households (40.9%) fall into this category. Meanwhile, the 15 to 24 years age bracket for the primary householder has the lowest median household income of $0, with 47 households (1.3%) in this group.
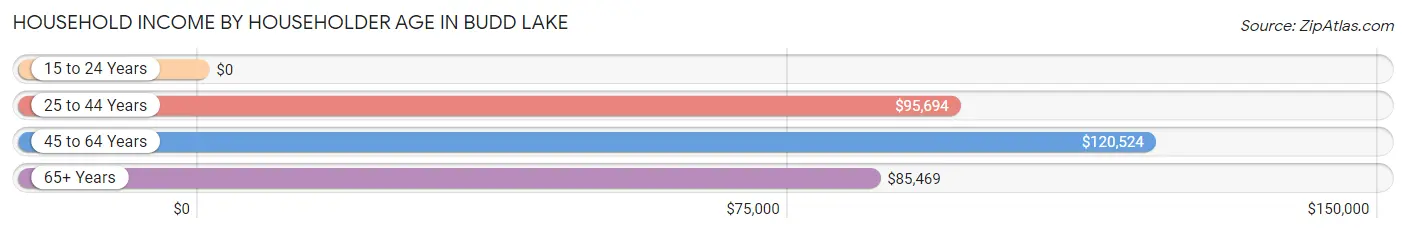
| Income Bracket | # Households | Median Income |
| 15 to 24 Years | 47 (1.3%) | $0 |
| 25 to 44 Years | 1,442 (40.6%) | $95,694 |
| 45 to 64 Years | 1,451 (40.9%) | $120,524 |
| 65+ Years | 609 (17.2%) | $85,469 |
| Total | 3,549 (100.0%) | $99,303 |
Poverty in Budd Lake
Income Below Poverty by Sex and Age in Budd Lake
With 3.5% poverty level for males and 8.3% for females among the residents of Budd Lake, under 5 year old males and 16 and 17 year old females are the most vulnerable to poverty, with 67 males (15.3%) and 25 females (22.7%) in their respective age groups living below the poverty level.
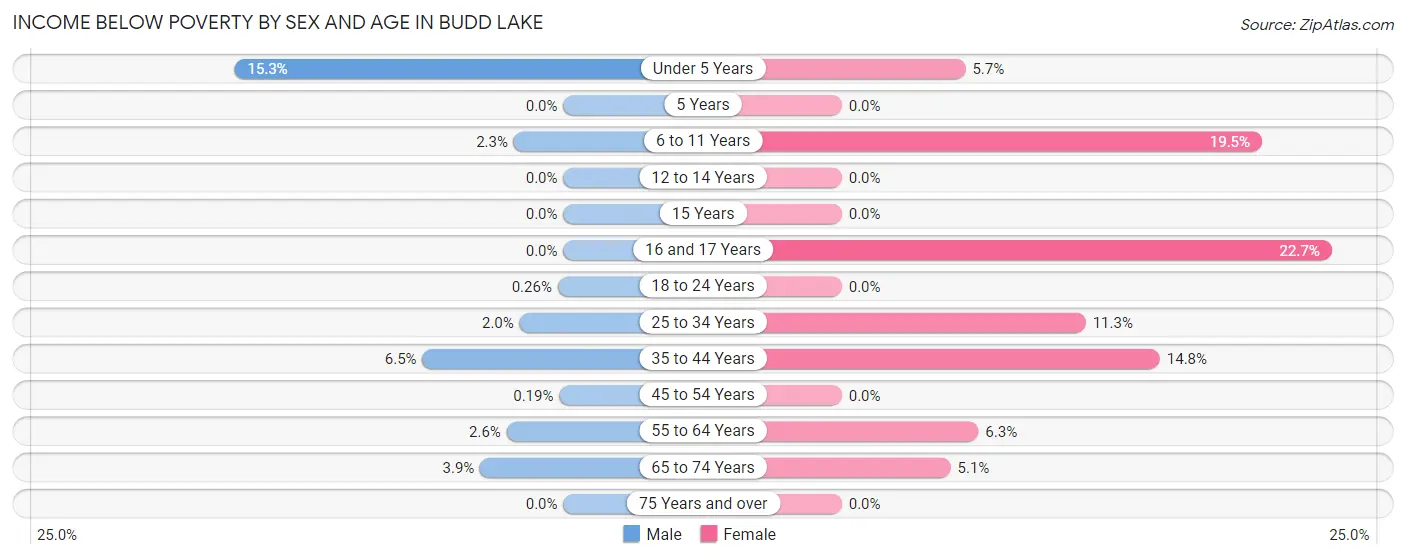
| Age Bracket | Male | Female |
| Under 5 Years | 67 (15.3%) | 26 (5.7%) |
| 5 Years | 0 (0.0%) | 0 (0.0%) |
| 6 to 11 Years | 13 (2.3%) | 69 (19.5%) |
| 12 to 14 Years | 0 (0.0%) | 0 (0.0%) |
| 15 Years | 0 (0.0%) | 0 (0.0%) |
| 16 and 17 Years | 0 (0.0%) | 25 (22.7%) |
| 18 to 24 Years | 1 (0.3%) | 0 (0.0%) |
| 25 to 34 Years | 14 (2.0%) | 90 (11.3%) |
| 35 to 44 Years | 56 (6.5%) | 111 (14.8%) |
| 45 to 54 Years | 1 (0.2%) | 0 (0.0%) |
| 55 to 64 Years | 21 (2.6%) | 43 (6.3%) |
| 65 to 74 Years | 15 (3.9%) | 23 (5.1%) |
| 75 Years and over | 0 (0.0%) | 0 (0.0%) |
| Total | 188 (3.5%) | 387 (8.3%) |
Income Above Poverty by Sex and Age in Budd Lake
According to the poverty statistics in Budd Lake, males aged 5 years and females aged 12 to 14 years are the age groups that are most secure financially, with 100.0% of males and 100.0% of females in these age groups living above the poverty line.
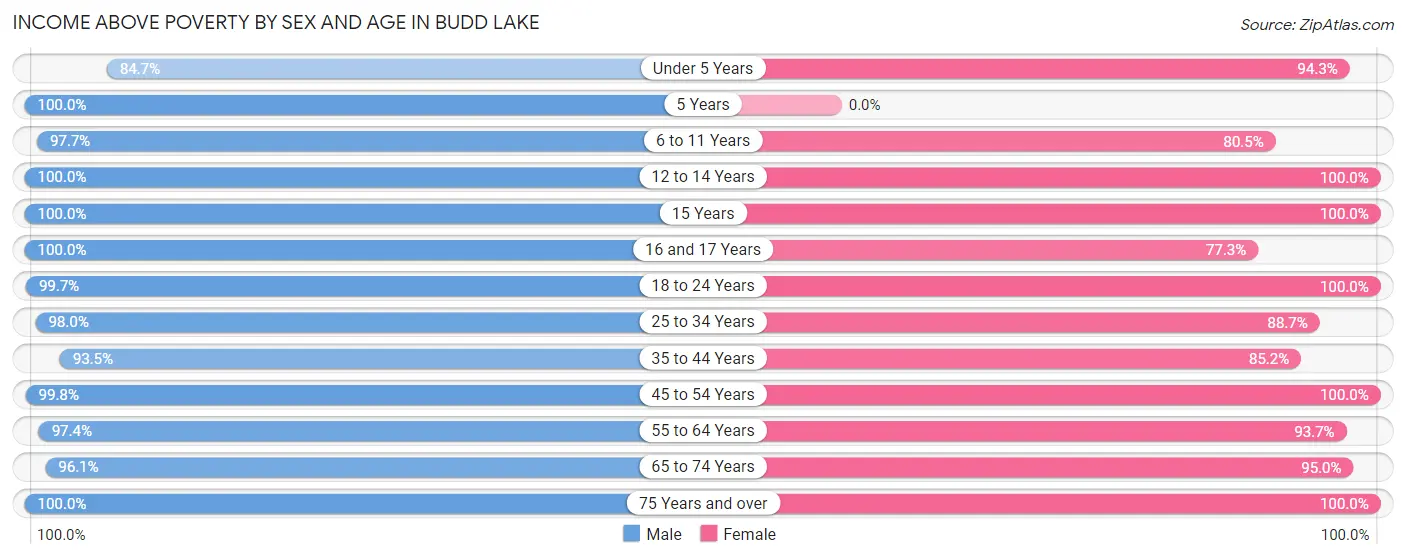
| Age Bracket | Male | Female |
| Under 5 Years | 372 (84.7%) | 427 (94.3%) |
| 5 Years | 76 (100.0%) | 0 (0.0%) |
| 6 to 11 Years | 551 (97.7%) | 285 (80.5%) |
| 12 to 14 Years | 203 (100.0%) | 132 (100.0%) |
| 15 Years | 86 (100.0%) | 83 (100.0%) |
| 16 and 17 Years | 120 (100.0%) | 85 (77.3%) |
| 18 to 24 Years | 381 (99.7%) | 208 (100.0%) |
| 25 to 34 Years | 675 (98.0%) | 705 (88.7%) |
| 35 to 44 Years | 800 (93.5%) | 641 (85.2%) |
| 45 to 54 Years | 532 (99.8%) | 524 (100.0%) |
| 55 to 64 Years | 776 (97.4%) | 635 (93.7%) |
| 65 to 74 Years | 374 (96.1%) | 432 (95.0%) |
| 75 Years and over | 177 (100.0%) | 128 (100.0%) |
| Total | 5,123 (96.5%) | 4,285 (91.7%) |
Income Below Poverty Among Married-Couple Families in Budd Lake
The poverty statistics for married-couple families in Budd Lake show that 0.7% or 14 of the total 1,981 families live below the poverty line. Families with no children have the highest poverty rate of 1.5%, comprising of 14 families. On the other hand, families with 1 or 2 children have the lowest poverty rate of 0.0%, which includes 0 families.
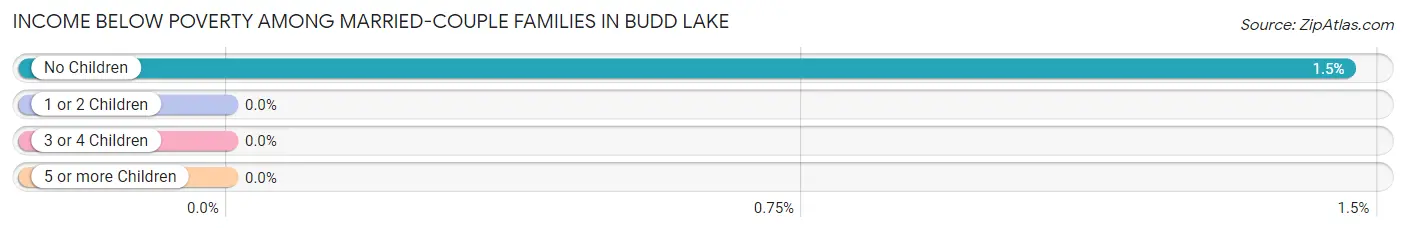
| Children | Above Poverty | Below Poverty |
| No Children | 943 (98.5%) | 14 (1.5%) |
| 1 or 2 Children | 727 (100.0%) | 0 (0.0%) |
| 3 or 4 Children | 268 (100.0%) | 0 (0.0%) |
| 5 or more Children | 29 (100.0%) | 0 (0.0%) |
| Total | 1,967 (99.3%) | 14 (0.7%) |
Income Below Poverty Among Single-Parent Households in Budd Lake
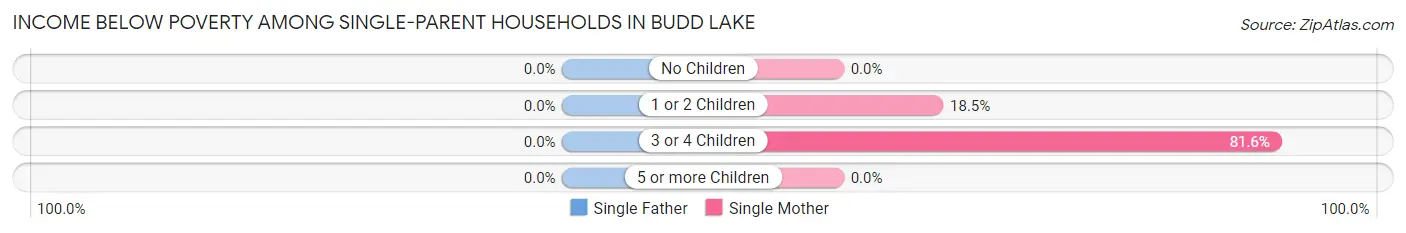
| Children | Single Father | Single Mother |
| No Children | 0 (0.0%) | 0 (0.0%) |
| 1 or 2 Children | 0 (0.0%) | 60 (18.5%) |
| 3 or 4 Children | 0 (0.0%) | 31 (81.6%) |
| 5 or more Children | 0 (0.0%) | 0 (0.0%) |
| Total | 0 (0.0%) | 91 (19.2%) |
Income Below Poverty Among Married-Couple vs Single-Parent Households in Budd Lake
The poverty data for Budd Lake shows that 14 of the married-couple family households (0.7%) and 91 of the single-parent households (11.4%) are living below the poverty level. Within the married-couple family households, those with no children have the highest poverty rate, with 14 households (1.5%) falling below the poverty line. Among the single-parent households, those with 3 or 4 children have the highest poverty rate, with 31 household (81.6%) living below poverty.
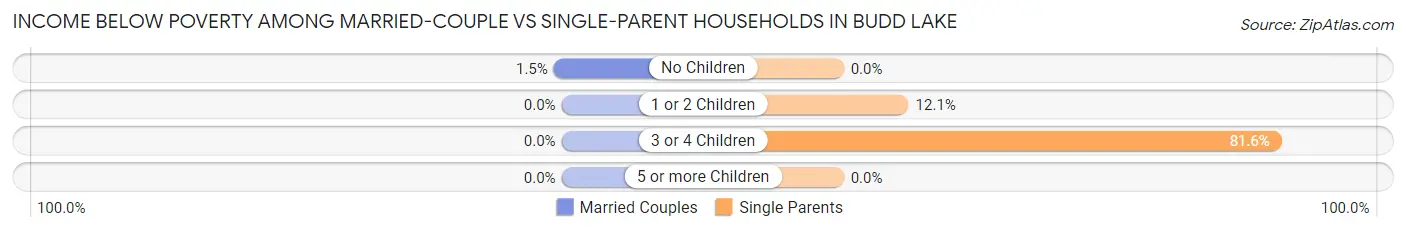
| Children | Married-Couple Families | Single-Parent Households |
| No Children | 14 (1.5%) | 0 (0.0%) |
| 1 or 2 Children | 0 (0.0%) | 60 (12.1%) |
| 3 or 4 Children | 0 (0.0%) | 31 (81.6%) |
| 5 or more Children | 0 (0.0%) | 0 (0.0%) |
| Total | 14 (0.7%) | 91 (11.4%) |
Race in Budd Lake
The most populous races in Budd Lake are White / Caucasian (6,902 | 69.1%), Hispanic or Latino (2,153 | 21.6%), and Black / African American (891 | 8.9%).
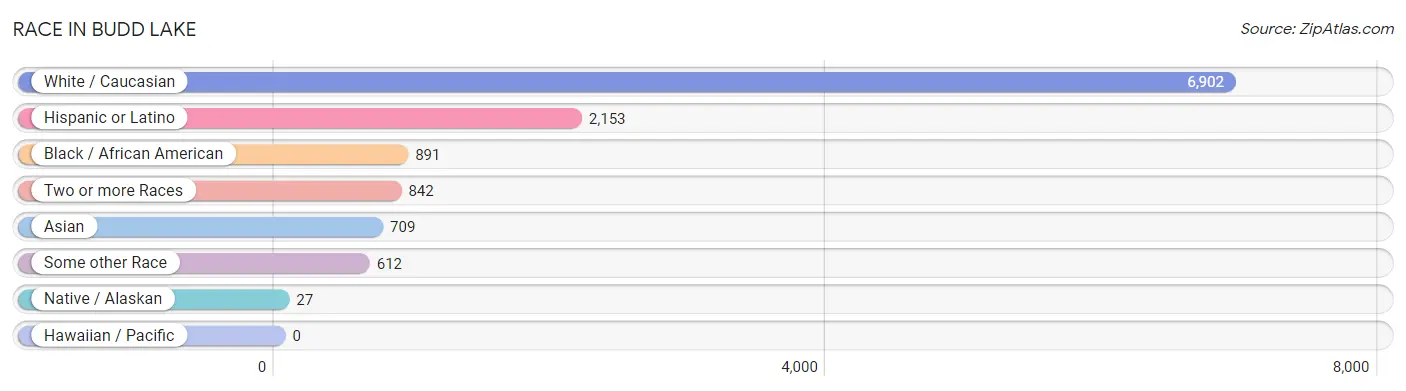
| Race | # Population | % Population |
| Asian | 709 | 7.1% |
| Black / African American | 891 | 8.9% |
| Hawaiian / Pacific | 0 | 0.0% |
| Hispanic or Latino | 2,153 | 21.6% |
| Native / Alaskan | 27 | 0.3% |
| White / Caucasian | 6,902 | 69.1% |
| Two or more Races | 842 | 8.4% |
| Some other Race | 612 | 6.1% |
| Total | 9,983 | 100.0% |
Ancestry in Budd Lake
The most populous ancestries reported in Budd Lake are German (1,591 | 15.9%), Italian (1,437 | 14.4%), Irish (1,119 | 11.2%), English (656 | 6.6%), and Puerto Rican (633 | 6.3%), together accounting for 54.4% of all Budd Lake residents.
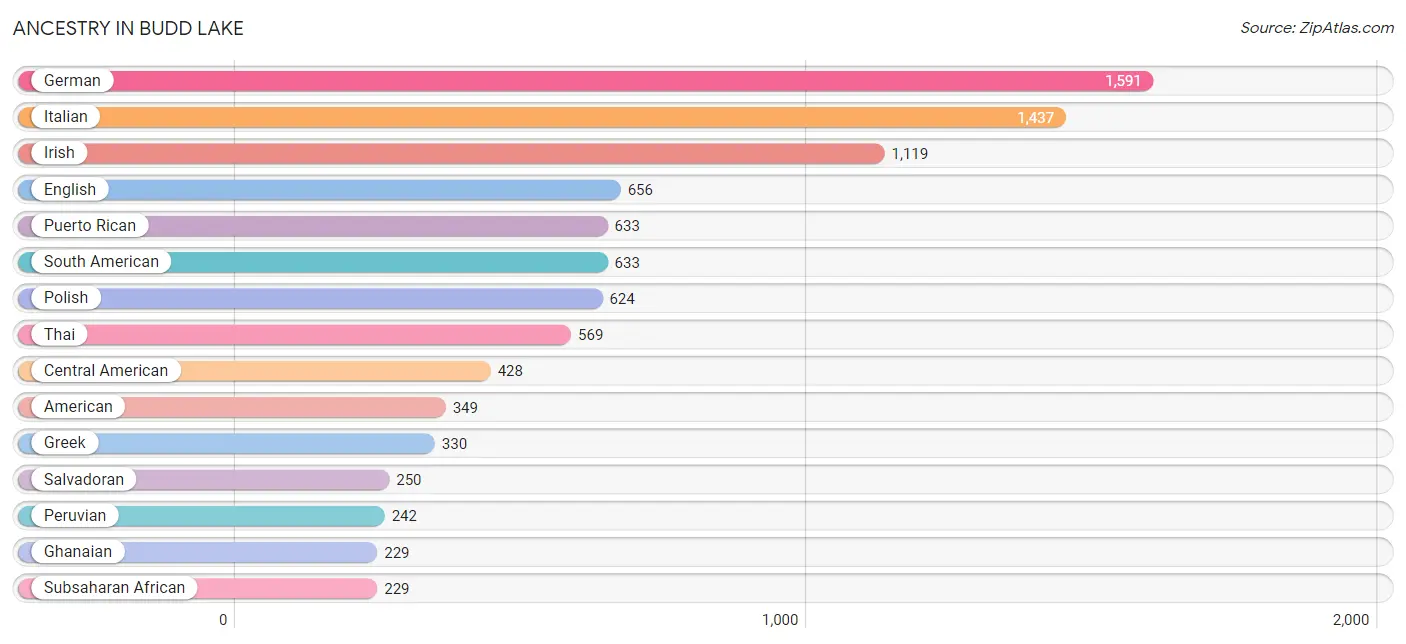
| Ancestry | # Population | % Population |
| American | 349 | 3.5% |
| Arab | 77 | 0.8% |
| Argentinean | 34 | 0.3% |
| Brazilian | 62 | 0.6% |
| British | 16 | 0.2% |
| British West Indian | 86 | 0.9% |
| Burmese | 33 | 0.3% |
| Canadian | 15 | 0.2% |
| Central American | 428 | 4.3% |
| Cherokee | 13 | 0.1% |
| Chilean | 35 | 0.4% |
| Colombian | 181 | 1.8% |
| Costa Rican | 11 | 0.1% |
| Croatian | 12 | 0.1% |
| Cuban | 99 | 1.0% |
| Dominican | 69 | 0.7% |
| Dutch | 135 | 1.3% |
| Eastern European | 27 | 0.3% |
| Ecuadorian | 46 | 0.5% |
| Egyptian | 17 | 0.2% |
| English | 656 | 6.6% |
| European | 86 | 0.9% |
| French | 164 | 1.6% |
| French American Indian | 4 | 0.0% |
| French Canadian | 74 | 0.7% |
| German | 1,591 | 15.9% |
| Ghanaian | 229 | 2.3% |
| Greek | 330 | 3.3% |
| Guatemalan | 52 | 0.5% |
| Honduran | 115 | 1.1% |
| Hungarian | 93 | 0.9% |
| Indian (Asian) | 103 | 1.0% |
| Irish | 1,119 | 11.2% |
| Italian | 1,437 | 14.4% |
| Jamaican | 120 | 1.2% |
| Jordanian | 9 | 0.1% |
| Korean | 55 | 0.5% |
| Latvian | 16 | 0.2% |
| Lithuanian | 9 | 0.1% |
| Mexican | 84 | 0.8% |
| Norwegian | 153 | 1.5% |
| Pennsylvania German | 8 | 0.1% |
| Peruvian | 242 | 2.4% |
| Polish | 624 | 6.2% |
| Portuguese | 8 | 0.1% |
| Puerto Rican | 633 | 6.3% |
| Russian | 119 | 1.2% |
| Salvadoran | 250 | 2.5% |
| Scotch-Irish | 93 | 0.9% |
| Scottish | 109 | 1.1% |
| Slovak | 26 | 0.3% |
| South American | 633 | 6.3% |
| Spaniard | 138 | 1.4% |
| Spanish | 35 | 0.4% |
| Subsaharan African | 229 | 2.3% |
| Swedish | 13 | 0.1% |
| Swiss | 26 | 0.3% |
| Thai | 569 | 5.7% |
| Trinidadian and Tobagonian | 13 | 0.1% |
| Ukrainian | 64 | 0.6% |
| Uruguayan | 32 | 0.3% |
| Venezuelan | 63 | 0.6% |
| Welsh | 22 | 0.2% |
| Yugoslavian | 91 | 0.9% | View All 64 Rows |
Immigrants in Budd Lake
The most numerous immigrant groups reported in Budd Lake came from Latin America (879 | 8.8%), Asia (497 | 5.0%), South Central Asia (386 | 3.9%), South America (378 | 3.8%), and India (377 | 3.8%), together accounting for 25.2% of all Budd Lake residents.
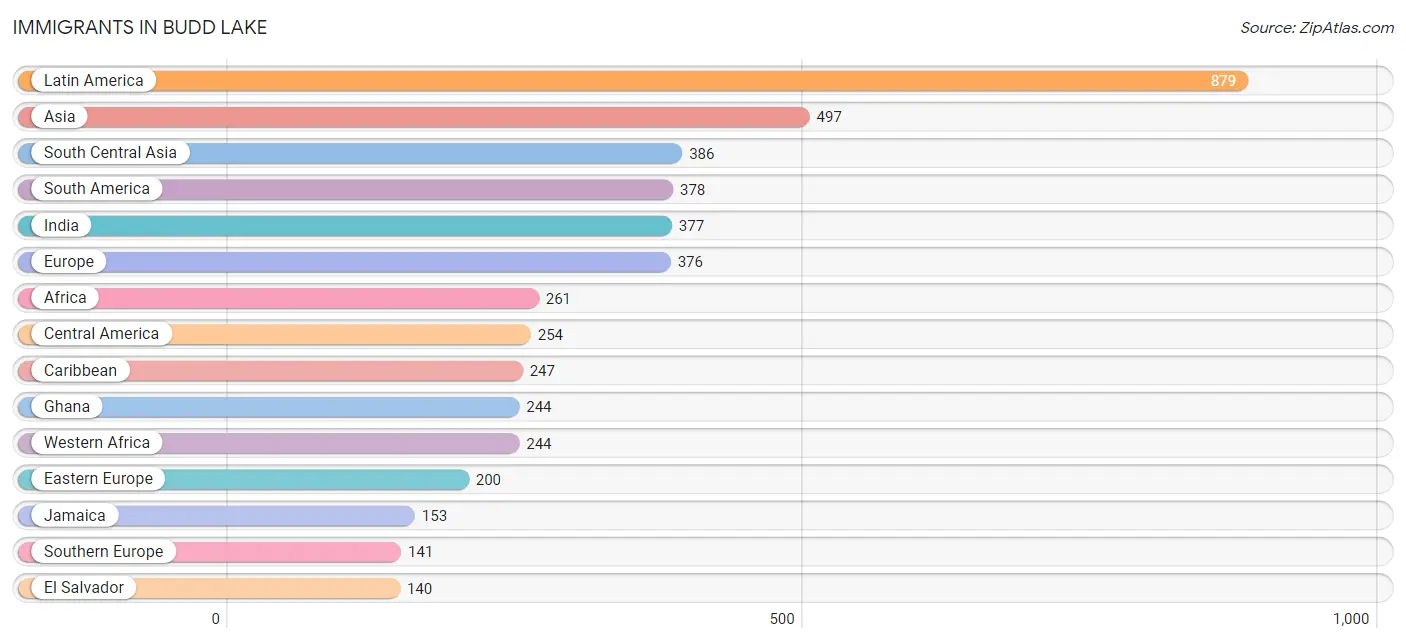
| Immigration Origin | # Population | % Population |
| Africa | 261 | 2.6% |
| Argentina | 25 | 0.3% |
| Asia | 497 | 5.0% |
| Belarus | 5 | 0.1% |
| Bosnia and Herzegovina | 91 | 0.9% |
| Brazil | 34 | 0.3% |
| Canada | 4 | 0.0% |
| Caribbean | 247 | 2.5% |
| Central America | 254 | 2.5% |
| Chile | 35 | 0.4% |
| China | 72 | 0.7% |
| Colombia | 121 | 1.2% |
| Cuba | 12 | 0.1% |
| Dominican Republic | 69 | 0.7% |
| Eastern Asia | 72 | 0.7% |
| Eastern Europe | 200 | 2.0% |
| Ecuador | 46 | 0.5% |
| Egypt | 17 | 0.2% |
| El Salvador | 140 | 1.4% |
| Europe | 376 | 3.8% |
| France | 6 | 0.1% |
| Germany | 3 | 0.0% |
| Ghana | 244 | 2.4% |
| Greece | 125 | 1.3% |
| Guatemala | 25 | 0.3% |
| Honduras | 88 | 0.9% |
| India | 377 | 3.8% |
| Italy | 16 | 0.2% |
| Jamaica | 153 | 1.5% |
| Jordan | 9 | 0.1% |
| Latin America | 879 | 8.8% |
| Mexico | 1 | 0.0% |
| Netherlands | 12 | 0.1% |
| Northern Africa | 17 | 0.2% |
| Northern Europe | 14 | 0.1% |
| Pakistan | 9 | 0.1% |
| Peru | 22 | 0.2% |
| Philippines | 30 | 0.3% |
| Poland | 93 | 0.9% |
| Russia | 11 | 0.1% |
| South America | 378 | 3.8% |
| South Central Asia | 386 | 3.9% |
| South Eastern Asia | 30 | 0.3% |
| Southern Europe | 141 | 1.4% |
| Trinidad and Tobago | 13 | 0.1% |
| Uruguay | 32 | 0.3% |
| Venezuela | 63 | 0.6% |
| Western Africa | 244 | 2.4% |
| Western Asia | 9 | 0.1% |
| Western Europe | 21 | 0.2% | View All 50 Rows |
Sex and Age in Budd Lake
Sex and Age in Budd Lake
The most populous age groups in Budd Lake are 35 to 39 Years (543 | 10.2%) for men and 35 to 39 Years (575 | 12.3%) for women.
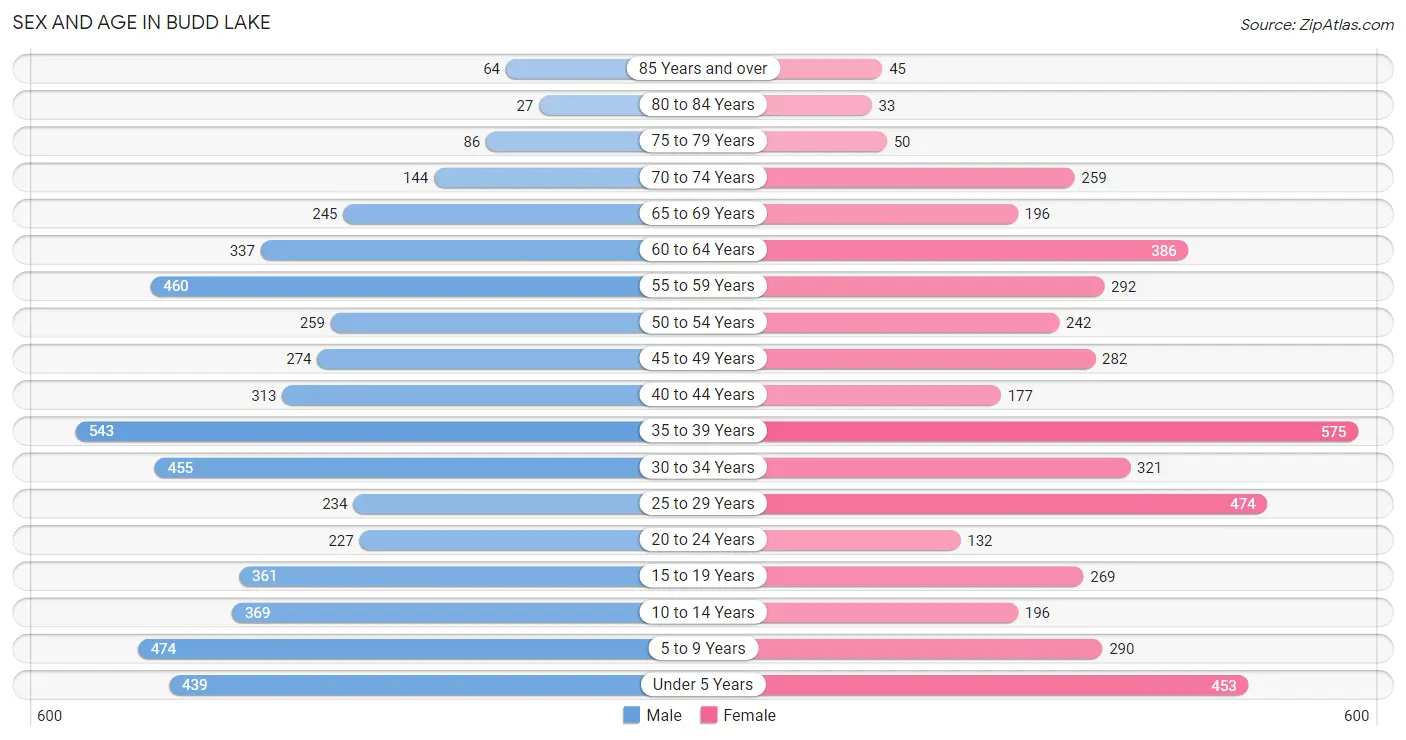
| Age Bracket | Male | Female |
| Under 5 Years | 439 (8.3%) | 453 (9.7%) |
| 5 to 9 Years | 474 (8.9%) | 290 (6.2%) |
| 10 to 14 Years | 369 (7.0%) | 196 (4.2%) |
| 15 to 19 Years | 361 (6.8%) | 269 (5.8%) |
| 20 to 24 Years | 227 (4.3%) | 132 (2.8%) |
| 25 to 29 Years | 234 (4.4%) | 474 (10.2%) |
| 30 to 34 Years | 455 (8.6%) | 321 (6.9%) |
| 35 to 39 Years | 543 (10.2%) | 575 (12.3%) |
| 40 to 44 Years | 313 (5.9%) | 177 (3.8%) |
| 45 to 49 Years | 274 (5.2%) | 282 (6.0%) |
| 50 to 54 Years | 259 (4.9%) | 242 (5.2%) |
| 55 to 59 Years | 460 (8.7%) | 292 (6.2%) |
| 60 to 64 Years | 337 (6.4%) | 386 (8.3%) |
| 65 to 69 Years | 245 (4.6%) | 196 (4.2%) |
| 70 to 74 Years | 144 (2.7%) | 259 (5.5%) |
| 75 to 79 Years | 86 (1.6%) | 50 (1.1%) |
| 80 to 84 Years | 27 (0.5%) | 33 (0.7%) |
| 85 Years and over | 64 (1.2%) | 45 (1.0%) |
| Total | 5,311 (100.0%) | 4,672 (100.0%) |
Families and Households in Budd Lake
Median Family Size in Budd Lake
The median family size in Budd Lake is 3.08 persons per family, with married-couple families (1,981 | 71.3%) accounting for the largest median family size of 3.34 persons per family. On the other hand, single male/father families (321 | 11.6%) represent the smallest median family size with 2.02 persons per family.
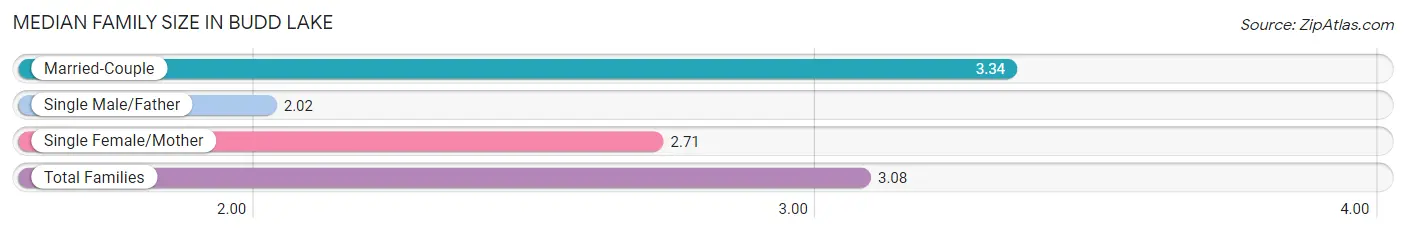
| Family Type | # Families | Family Size |
| Married-Couple | 1,981 (71.3%) | 3.34 |
| Single Male/Father | 321 (11.6%) | 2.02 |
| Single Female/Mother | 475 (17.1%) | 2.71 |
| Total Families | 2,777 (100.0%) | 3.08 |
Median Household Size in Budd Lake
The median household size in Budd Lake is 2.81 persons per household, with married-couple households (1,981 | 55.8%) accounting for the largest median household size of 3.35 persons per household. non-family households (772 | 21.7%) represent the smallest median household size with 1.38 persons per household.
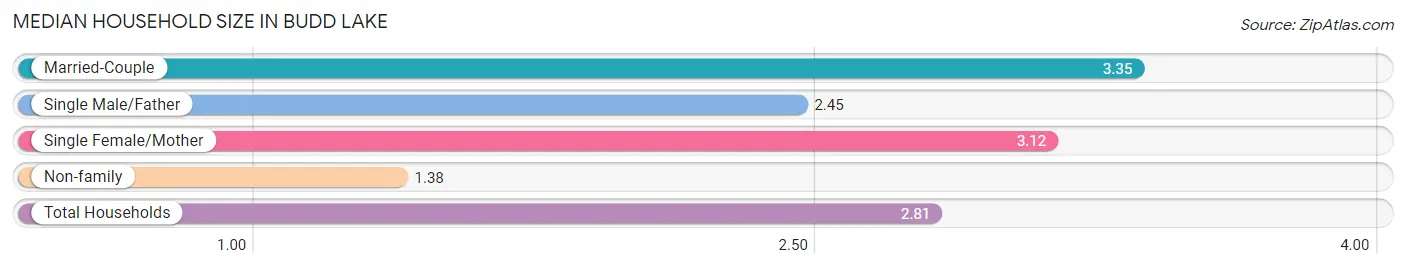
| Household Type | # Households | Household Size |
| Married-Couple | 1,981 (55.8%) | 3.35 |
| Single Male/Father | 321 (9.0%) | 2.45 |
| Single Female/Mother | 475 (13.4%) | 3.12 |
| Non-family | 772 (21.7%) | 1.38 |
| Total Households | 3,549 (100.0%) | 2.81 |
Household Size by Marriage Status in Budd Lake
Out of a total of 3,549 households in Budd Lake, 2,777 (78.2%) are family households, while 772 (21.7%) are nonfamily households. The most numerous type of family households are 3-person households, comprising 929, and the most common type of nonfamily households are 1-person households, comprising 544.
| Household Size | Family Households | Nonfamily Households |
| 1-Person Households | - | 544 (15.3%) |
| 2-Person Households | 907 (25.6%) | 186 (5.2%) |
| 3-Person Households | 929 (26.2%) | 42 (1.2%) |
| 4-Person Households | 563 (15.9%) | 0 (0.0%) |
| 5-Person Households | 264 (7.4%) | 0 (0.0%) |
| 6-Person Households | 78 (2.2%) | 0 (0.0%) |
| 7+ Person Households | 36 (1.0%) | 0 (0.0%) |
| Total | 2,777 (78.2%) | 772 (21.7%) |
Female Fertility in Budd Lake
Fertility by Age in Budd Lake
Average fertility rate in Budd Lake is 118.0 births per 1,000 women. Women in the age bracket of 20 to 34 years have the highest fertility rate with 186.0 births per 1,000 women. Women in the age bracket of 20 to 34 years acount for 62.8% of all women with births.
| Age Bracket | Women with Births | Births / 1,000 Women |
| 15 to 19 years | 0 (0.0%) | 0.0 |
| 20 to 34 years | 172 (62.8%) | 186.0 |
| 35 to 50 years | 102 (37.2%) | 91.0 |
| Total | 274 (100.0%) | 118.0 |
Fertility by Age by Marriage Status in Budd Lake
40.5% of women with births (274) in Budd Lake are married. The highest percentage of unmarried women with births falls into 35 to 50 years age bracket with 61.8% of them unmarried at the time of birth, while the lowest percentage of unmarried women with births belong to 20 to 34 years age bracket with 58.1% of them unmarried.
| Age Bracket | Married | Unmarried |
| 15 to 19 years | 0 (0.0%) | 0 (0.0%) |
| 20 to 34 years | 72 (41.9%) | 100 (58.1%) |
| 35 to 50 years | 39 (38.2%) | 63 (61.8%) |
| Total | 111 (40.5%) | 163 (59.5%) |
Fertility by Education in Budd Lake
| Educational Attainment | Women with Births | Births / 1,000 Women |
| Less than High School | 0 (0.0%) | 0.0 |
| High School Diploma | 105 (38.3%) | 256.0 |
| College or Associate's Degree | 14 (5.1%) | 40.0 |
| Bachelor's Degree | 97 (35.4%) | 143.0 |
| Graduate Degree | 58 (21.2%) | 97.0 |
| Total | 274 (100.0%) | 118.0 |
Fertility by Education by Marriage Status in Budd Lake
59.5% of women with births in Budd Lake are unmarried. Women with the educational attainment of graduate degree are most likely to be married with 100.0% of them married at childbirth, while women with the educational attainment of high school diploma are least likely to be married with 100.0% of them unmarried at childbirth.
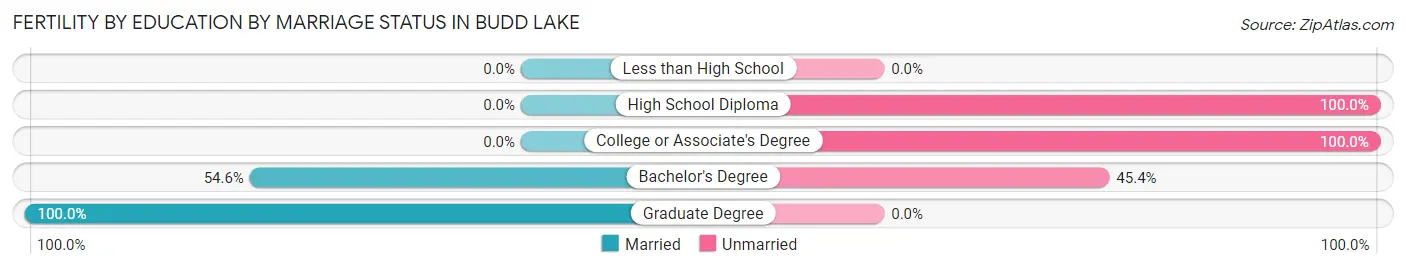
| Educational Attainment | Married | Unmarried |
| Less than High School | 0 (0.0%) | 0 (0.0%) |
| High School Diploma | 0 (0.0%) | 105 (100.0%) |
| College or Associate's Degree | 0 (0.0%) | 14 (100.0%) |
| Bachelor's Degree | 53 (54.6%) | 44 (45.4%) |
| Graduate Degree | 58 (100.0%) | 0 (0.0%) |
| Total | 111 (40.5%) | 163 (59.5%) |
Employment Characteristics in Budd Lake
Employment by Class of Employer in Budd Lake
Among the 5,332 employed individuals in Budd Lake, private company employees (3,480 | 65.3%), local government employees (638 | 12.0%), and self-employed (incorporated) (403 | 7.6%) make up the most common classes of employment.
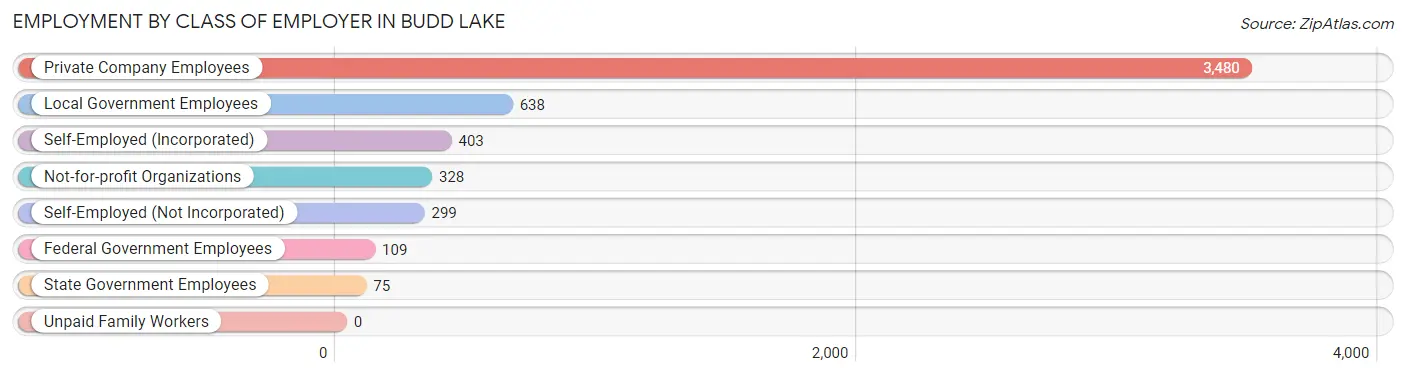
| Employer Class | # Employees | % Employees |
| Private Company Employees | 3,480 | 65.3% |
| Self-Employed (Incorporated) | 403 | 7.6% |
| Self-Employed (Not Incorporated) | 299 | 5.6% |
| Not-for-profit Organizations | 328 | 6.1% |
| Local Government Employees | 638 | 12.0% |
| State Government Employees | 75 | 1.4% |
| Federal Government Employees | 109 | 2.0% |
| Unpaid Family Workers | 0 | 0.0% |
| Total | 5,332 | 100.0% |
Employment Status by Age in Budd Lake
According to the labor force statistics for Budd Lake, out of the total population over 16 years of age (7,593), 75.3% or 5,718 individuals are in the labor force, with 5.7% or 326 of them unemployed. The age group with the highest labor force participation rate is 25 to 29 years, with 98.4% or 697 individuals in the labor force. Within the labor force, the 20 to 24 years age range has the highest percentage of unemployed individuals, with 23.7% or 71 of them being unemployed.
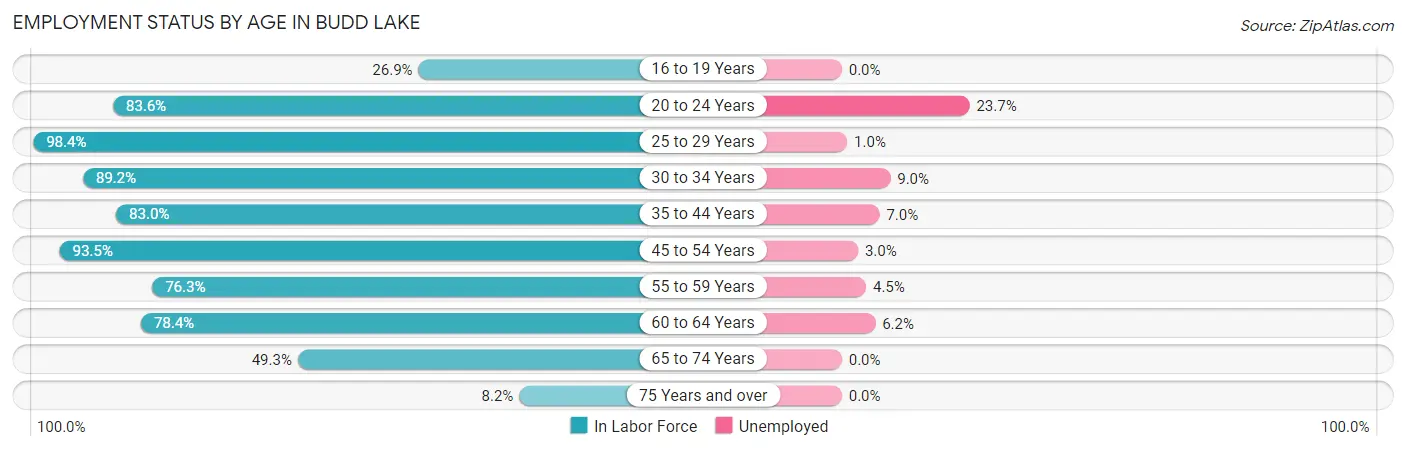
| Age Bracket | In Labor Force | Unemployed |
| 16 to 19 Years | 124 (26.9%) | 0 (0.0%) |
| 20 to 24 Years | 300 (83.6%) | 71 (23.7%) |
| 25 to 29 Years | 697 (98.4%) | 7 (1.0%) |
| 30 to 34 Years | 692 (89.2%) | 62 (9.0%) |
| 35 to 44 Years | 1,335 (83.0%) | 93 (7.0%) |
| 45 to 54 Years | 988 (93.5%) | 30 (3.0%) |
| 55 to 59 Years | 574 (76.3%) | 26 (4.5%) |
| 60 to 64 Years | 567 (78.4%) | 35 (6.2%) |
| 65 to 74 Years | 416 (49.3%) | 0 (0.0%) |
| 75 Years and over | 25 (8.2%) | 0 (0.0%) |
| Total | 5,718 (75.3%) | 326 (5.7%) |
Employment Status by Educational Attainment in Budd Lake
According to labor force statistics for Budd Lake, 86.3% of individuals (4,854) out of the total population between 25 and 64 years of age (5,624) are in the labor force, with 5.2% or 252 of them being unemployed. The group with the highest labor force participation rate are those with the educational attainment of high school diploma, with 89.1% or 1,334 individuals in the labor force. Within the labor force, individuals with college / associate degree education have the highest percentage of unemployment, with 10.9% or 104 of them being unemployed.
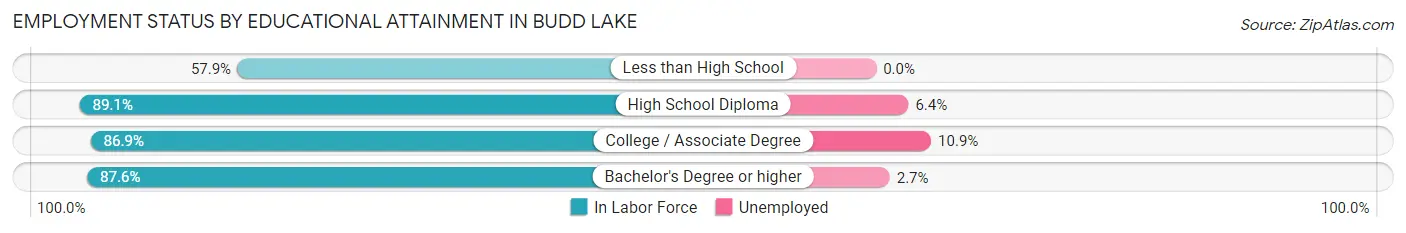
| Educational Attainment | In Labor Force | Unemployed |
| Less than High School | 173 (57.9%) | 0 (0.0%) |
| High School Diploma | 1,334 (89.1%) | 96 (6.4%) |
| College / Associate Degree | 956 (86.9%) | 120 (10.9%) |
| Bachelor's Degree or higher | 2,390 (87.6%) | 74 (2.7%) |
| Total | 4,854 (86.3%) | 292 (5.2%) |
Employment Occupations by Sex in Budd Lake
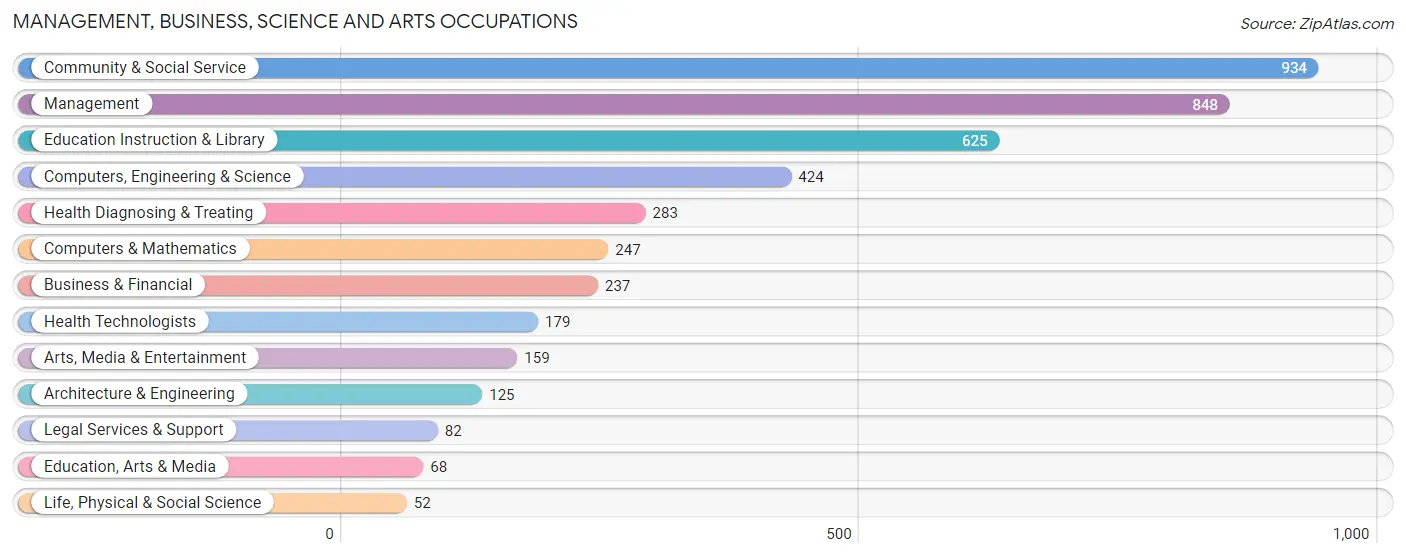
Management, Business, Science and Arts Occupations
The most common Management, Business, Science and Arts occupations in Budd Lake are Community & Social Service (934 | 17.3%), Management (848 | 15.7%), Education Instruction & Library (625 | 11.6%), Computers, Engineering & Science (424 | 7.9%), and Health Diagnosing & Treating (283 | 5.2%).
Management, Business, Science and Arts Occupations by Sex
Within the Management, Business, Science and Arts occupations in Budd Lake, the most male-oriented occupations are Architecture & Engineering (100.0%), Computers, Engineering & Science (80.7%), and Computers & Mathematics (75.7%), while the most female-oriented occupations are Legal Services & Support (100.0%), Education Instruction & Library (80.6%), and Community & Social Service (79.0%).
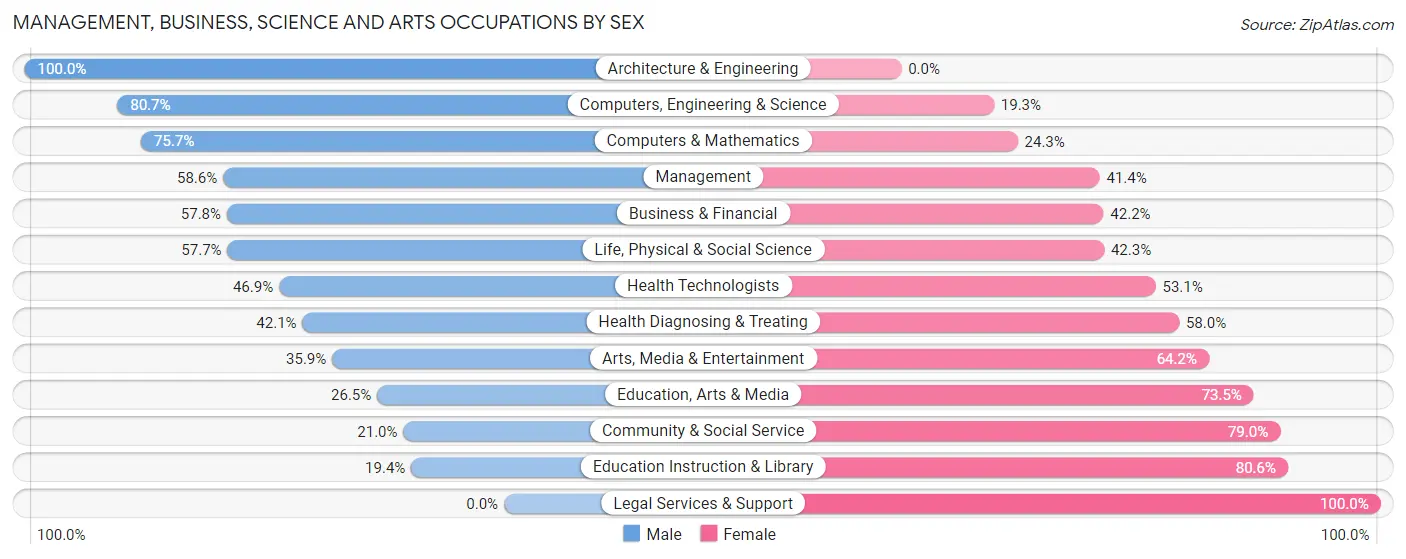
| Occupation | Male | Female |
| Management | 497 (58.6%) | 351 (41.4%) |
| Business & Financial | 137 (57.8%) | 100 (42.2%) |
| Computers, Engineering & Science | 342 (80.7%) | 82 (19.3%) |
| Computers & Mathematics | 187 (75.7%) | 60 (24.3%) |
| Architecture & Engineering | 125 (100.0%) | 0 (0.0%) |
| Life, Physical & Social Science | 30 (57.7%) | 22 (42.3%) |
| Community & Social Service | 196 (21.0%) | 738 (79.0%) |
| Education, Arts & Media | 18 (26.5%) | 50 (73.5%) |
| Legal Services & Support | 0 (0.0%) | 82 (100.0%) |
| Education Instruction & Library | 121 (19.4%) | 504 (80.6%) |
| Arts, Media & Entertainment | 57 (35.8%) | 102 (64.1%) |
| Health Diagnosing & Treating | 119 (42.0%) | 164 (58.0%) |
| Health Technologists | 84 (46.9%) | 95 (53.1%) |
| Total (Category) | 1,291 (47.4%) | 1,435 (52.6%) |
| Total (Overall) | 2,955 (54.8%) | 2,438 (45.2%) |
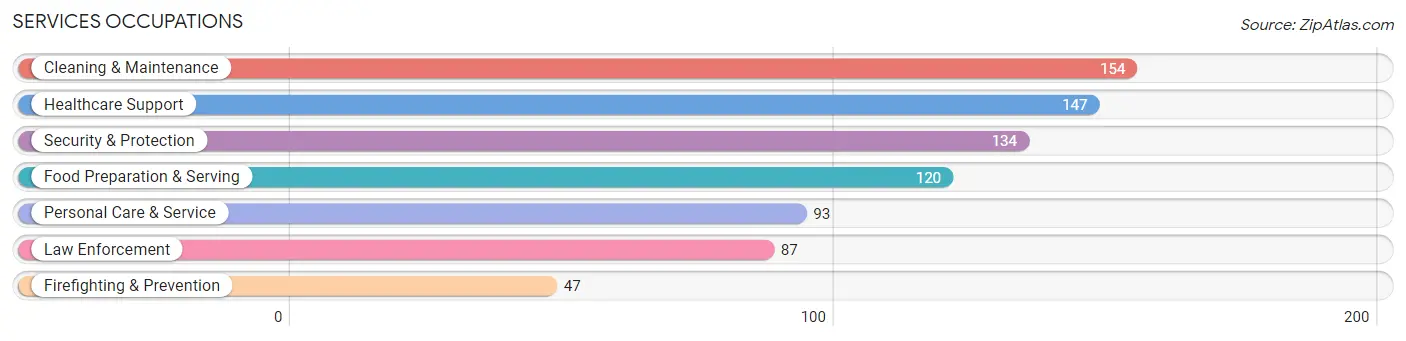
Services Occupations
The most common Services occupations in Budd Lake are Cleaning & Maintenance (154 | 2.9%), Healthcare Support (147 | 2.7%), Security & Protection (134 | 2.5%), Food Preparation & Serving (120 | 2.2%), and Personal Care & Service (93 | 1.7%).
Services Occupations by Sex
Within the Services occupations in Budd Lake, the most male-oriented occupations are Firefighting & Prevention (100.0%), Security & Protection (97.8%), and Law Enforcement (96.6%), while the most female-oriented occupations are Personal Care & Service (100.0%), Healthcare Support (87.1%), and Cleaning & Maintenance (13.6%).
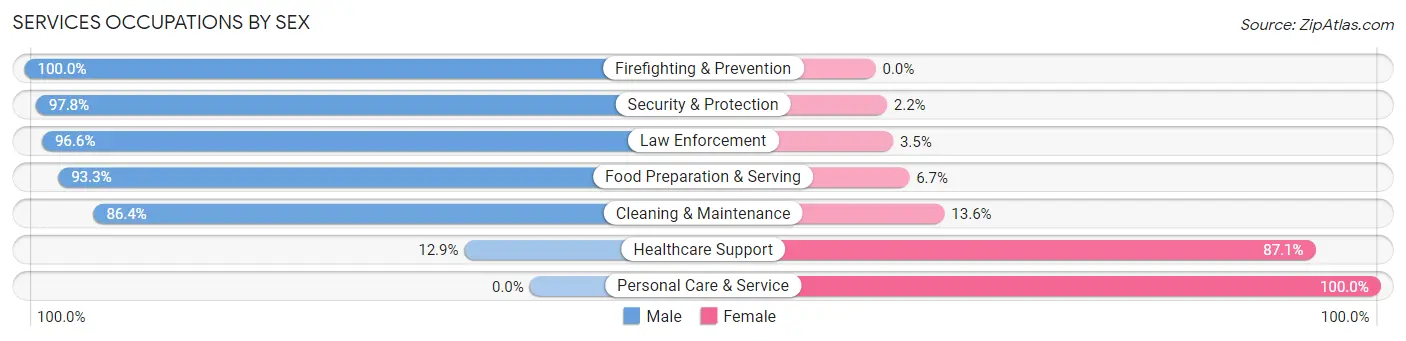
| Occupation | Male | Female |
| Healthcare Support | 19 (12.9%) | 128 (87.1%) |
| Security & Protection | 131 (97.8%) | 3 (2.2%) |
| Firefighting & Prevention | 47 (100.0%) | 0 (0.0%) |
| Law Enforcement | 84 (96.6%) | 3 (3.5%) |
| Food Preparation & Serving | 112 (93.3%) | 8 (6.7%) |
| Cleaning & Maintenance | 133 (86.4%) | 21 (13.6%) |
| Personal Care & Service | 0 (0.0%) | 93 (100.0%) |
| Total (Category) | 395 (61.0%) | 253 (39.0%) |
| Total (Overall) | 2,955 (54.8%) | 2,438 (45.2%) |
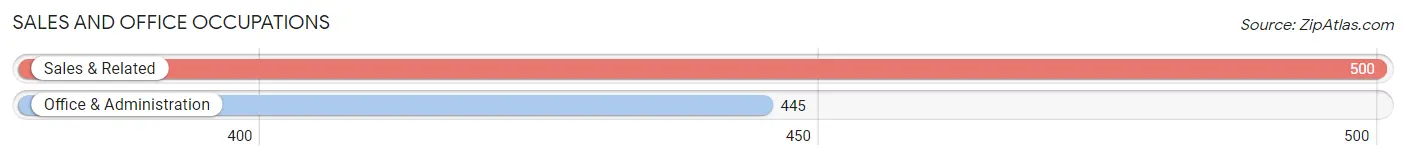
Sales and Office Occupations
The most common Sales and Office occupations in Budd Lake are Sales & Related (500 | 9.3%), and Office & Administration (445 | 8.3%).
Sales and Office Occupations by Sex
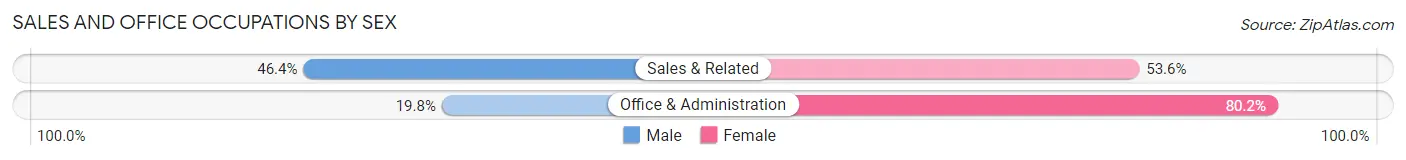
| Occupation | Male | Female |
| Sales & Related | 232 (46.4%) | 268 (53.6%) |
| Office & Administration | 88 (19.8%) | 357 (80.2%) |
| Total (Category) | 320 (33.9%) | 625 (66.1%) |
| Total (Overall) | 2,955 (54.8%) | 2,438 (45.2%) |
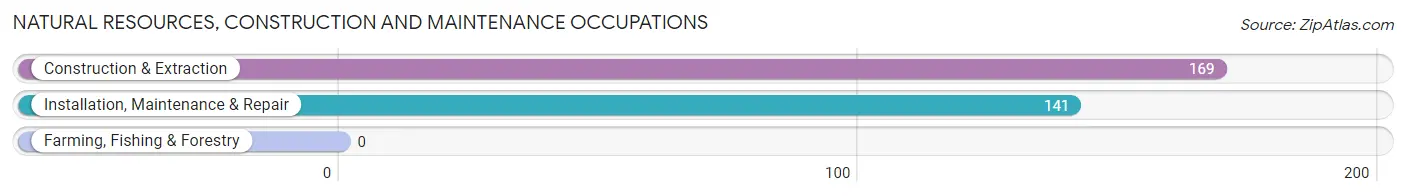
Natural Resources, Construction and Maintenance Occupations
The most common Natural Resources, Construction and Maintenance occupations in Budd Lake are Construction & Extraction (169 | 3.1%), and Installation, Maintenance & Repair (141 | 2.6%).
Natural Resources, Construction and Maintenance Occupations by Sex
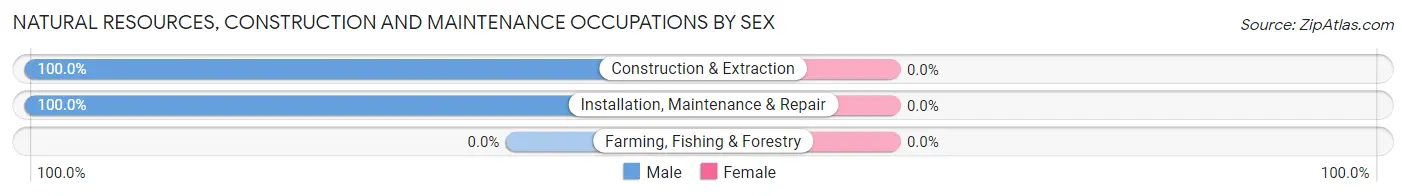
| Occupation | Male | Female |
| Farming, Fishing & Forestry | 0 (0.0%) | 0 (0.0%) |
| Construction & Extraction | 169 (100.0%) | 0 (0.0%) |
| Installation, Maintenance & Repair | 141 (100.0%) | 0 (0.0%) |
| Total (Category) | 310 (100.0%) | 0 (0.0%) |
| Total (Overall) | 2,955 (54.8%) | 2,438 (45.2%) |
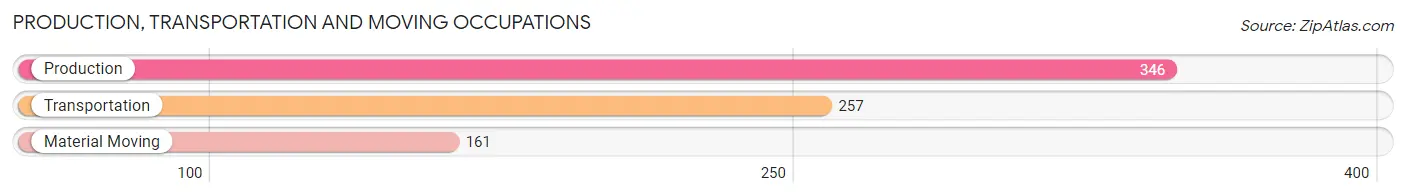
Production, Transportation and Moving Occupations
The most common Production, Transportation and Moving occupations in Budd Lake are Production (346 | 6.4%), Transportation (257 | 4.8%), and Material Moving (161 | 3.0%).
Production, Transportation and Moving Occupations by Sex
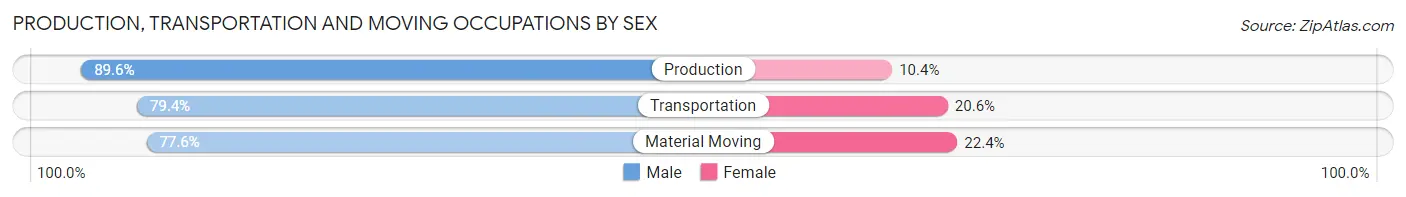
| Occupation | Male | Female |
| Production | 310 (89.6%) | 36 (10.4%) |
| Transportation | 204 (79.4%) | 53 (20.6%) |
| Material Moving | 125 (77.6%) | 36 (22.4%) |
| Total (Category) | 639 (83.6%) | 125 (16.4%) |
| Total (Overall) | 2,955 (54.8%) | 2,438 (45.2%) |
Employment Industries by Sex in Budd Lake
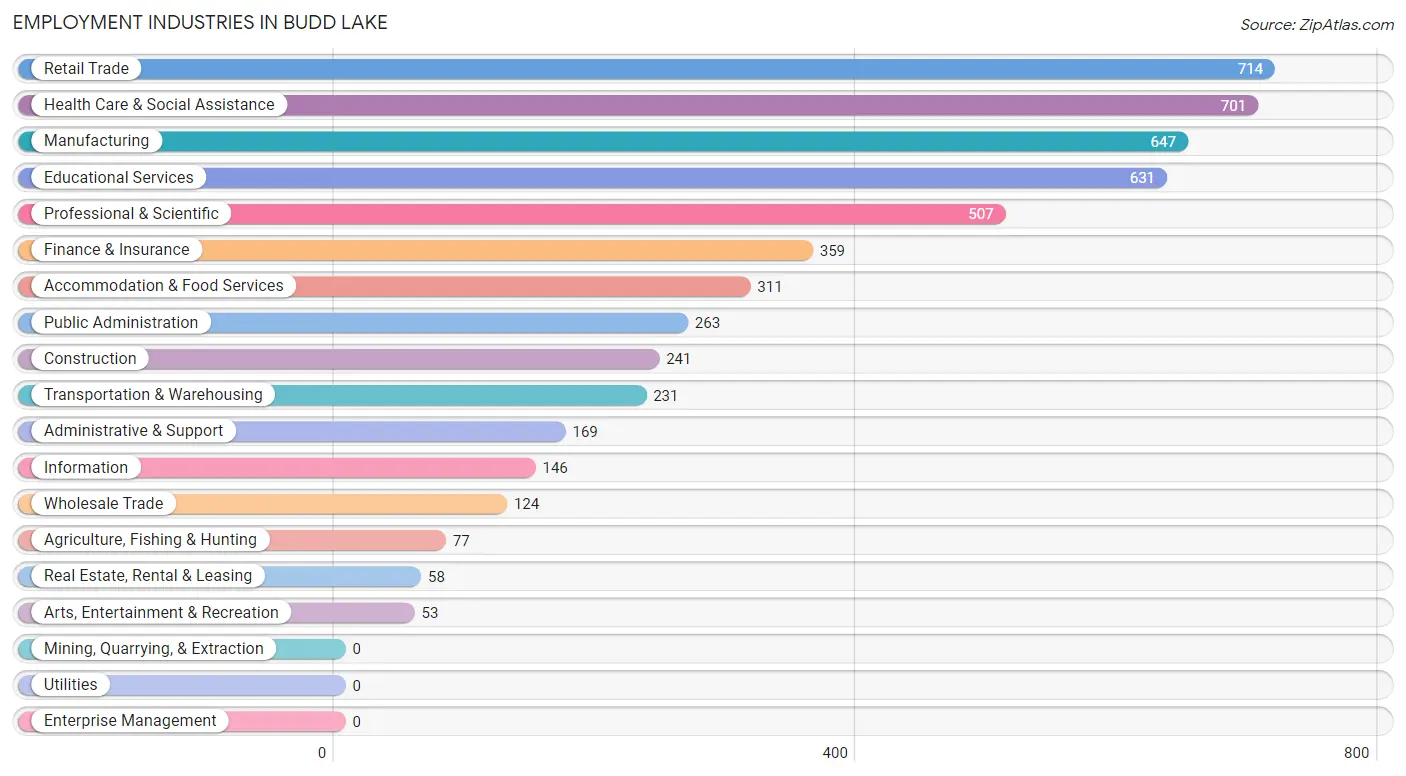
Employment Industries in Budd Lake
The major employment industries in Budd Lake include Retail Trade (714 | 13.2%), Health Care & Social Assistance (701 | 13.0%), Manufacturing (647 | 12.0%), Educational Services (631 | 11.7%), and Professional & Scientific (507 | 9.4%).
Employment Industries by Sex in Budd Lake
The Budd Lake industries that see more men than women are Agriculture, Fishing & Hunting (100.0%), Construction (100.0%), and Arts, Entertainment & Recreation (100.0%), whereas the industries that tend to have a higher number of women are Information (89.0%), Educational Services (69.9%), and Health Care & Social Assistance (69.0%).
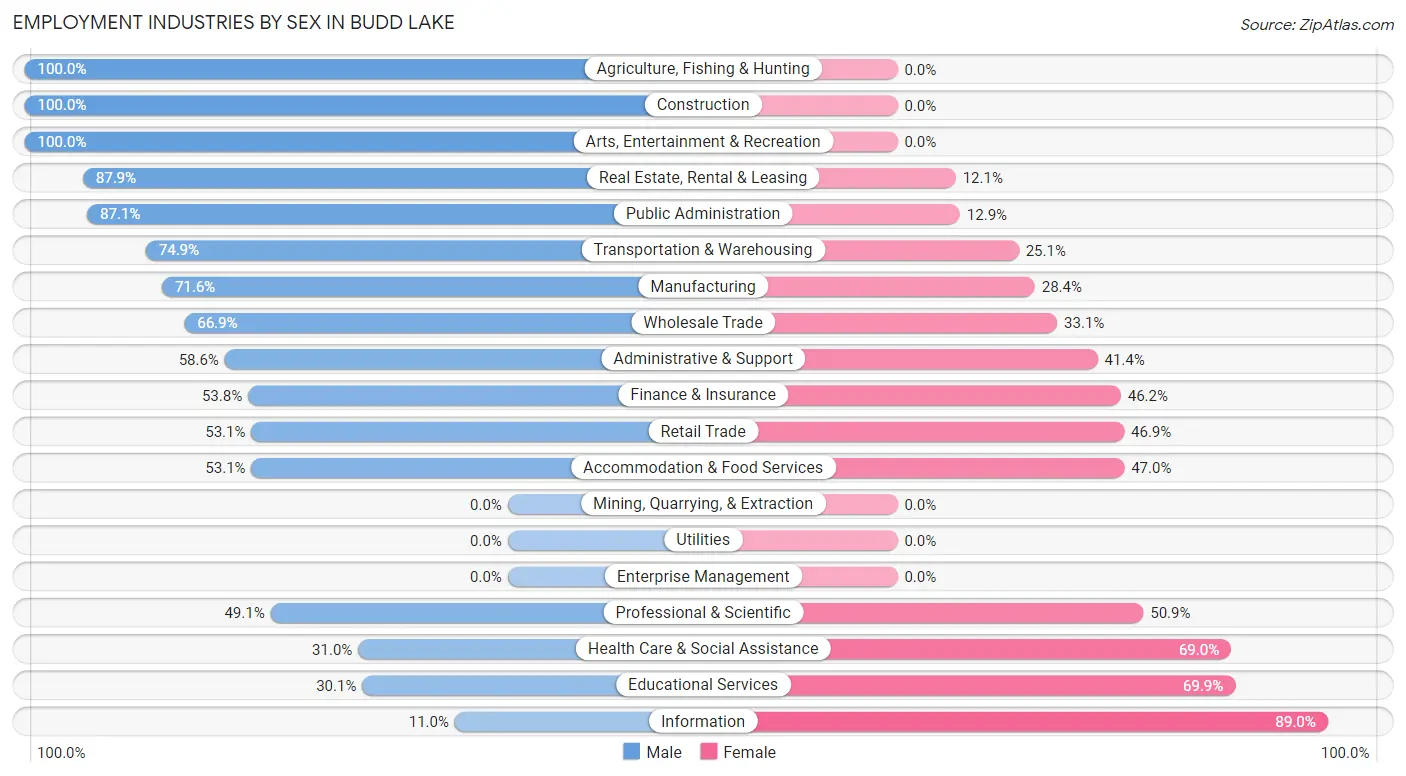
| Industry | Male | Female |
| Agriculture, Fishing & Hunting | 77 (100.0%) | 0 (0.0%) |
| Mining, Quarrying, & Extraction | 0 (0.0%) | 0 (0.0%) |
| Construction | 241 (100.0%) | 0 (0.0%) |
| Manufacturing | 463 (71.6%) | 184 (28.4%) |
| Wholesale Trade | 83 (66.9%) | 41 (33.1%) |
| Retail Trade | 379 (53.1%) | 335 (46.9%) |
| Transportation & Warehousing | 173 (74.9%) | 58 (25.1%) |
| Utilities | 0 (0.0%) | 0 (0.0%) |
| Information | 16 (11.0%) | 130 (89.0%) |
| Finance & Insurance | 193 (53.8%) | 166 (46.2%) |
| Real Estate, Rental & Leasing | 51 (87.9%) | 7 (12.1%) |
| Professional & Scientific | 249 (49.1%) | 258 (50.9%) |
| Enterprise Management | 0 (0.0%) | 0 (0.0%) |
| Administrative & Support | 99 (58.6%) | 70 (41.4%) |
| Educational Services | 190 (30.1%) | 441 (69.9%) |
| Health Care & Social Assistance | 217 (31.0%) | 484 (69.0%) |
| Arts, Entertainment & Recreation | 53 (100.0%) | 0 (0.0%) |
| Accommodation & Food Services | 165 (53.0%) | 146 (46.9%) |
| Public Administration | 229 (87.1%) | 34 (12.9%) |
| Total | 2,955 (54.8%) | 2,438 (45.2%) |
Education in Budd Lake
School Enrollment in Budd Lake
The most common levels of schooling among the 2,743 students in Budd Lake are elementary school (662 | 24.1%), high school (543 | 19.8%), and college / undergraduate (387 | 14.1%).
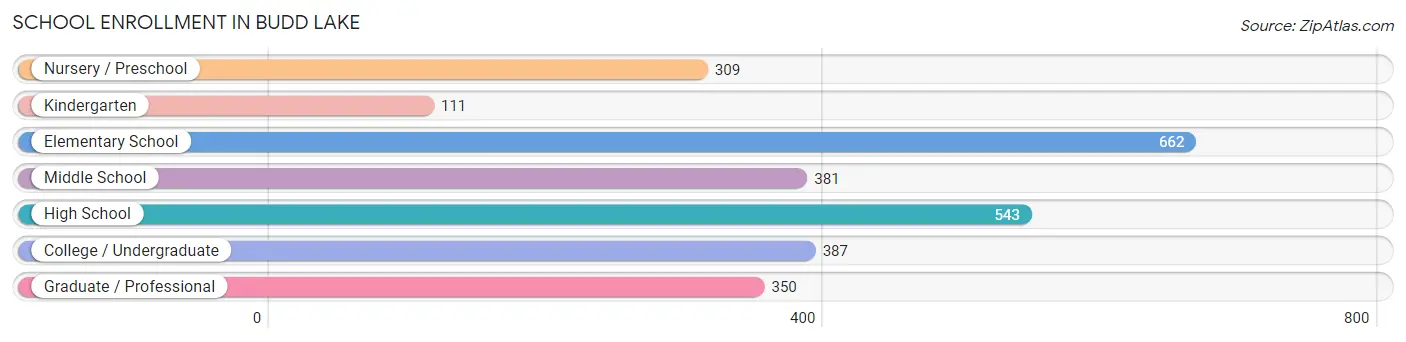
| School Level | # Students | % Students |
| Nursery / Preschool | 309 | 11.3% |
| Kindergarten | 111 | 4.1% |
| Elementary School | 662 | 24.1% |
| Middle School | 381 | 13.9% |
| High School | 543 | 19.8% |
| College / Undergraduate | 387 | 14.1% |
| Graduate / Professional | 350 | 12.8% |
| Total | 2,743 | 100.0% |
School Enrollment by Age by Funding Source in Budd Lake
Out of a total of 2,743 students who are enrolled in schools in Budd Lake, 373 (13.6%) attend a private institution, while the remaining 2,370 (86.4%) are enrolled in public schools. The age group of 3 to 4 year olds has the highest likelihood of being enrolled in private schools, with 211 (79.3% in the age bracket) enrolled. Conversely, the age group of 15 to 17 year olds has the lowest likelihood of being enrolled in a private school, with 399 (100.0% in the age bracket) attending a public institution.
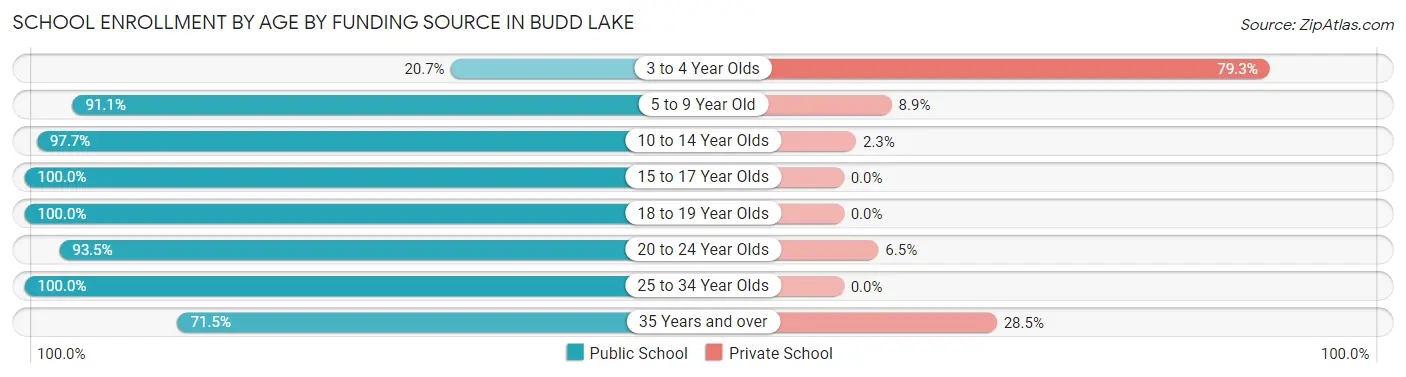
| Age Bracket | Public School | Private School |
| 3 to 4 Year Olds | 55 (20.7%) | 211 (79.3%) |
| 5 to 9 Year Old | 672 (91.1%) | 66 (8.9%) |
| 10 to 14 Year Olds | 552 (97.7%) | 13 (2.3%) |
| 15 to 17 Year Olds | 399 (100.0%) | 0 (0.0%) |
| 18 to 19 Year Olds | 205 (100.0%) | 0 (0.0%) |
| 20 to 24 Year Olds | 217 (93.5%) | 15 (6.5%) |
| 25 to 34 Year Olds | 96 (100.0%) | 0 (0.0%) |
| 35 Years and over | 173 (71.5%) | 69 (28.5%) |
| Total | 2,370 (86.4%) | 373 (13.6%) |
Educational Attainment by Field of Study in Budd Lake
Business (764 | 22.6%), education (369 | 10.9%), engineering (293 | 8.6%), psychology (261 | 7.7%), and social sciences (232 | 6.9%) are the most common fields of study among 3,388 individuals in Budd Lake who have obtained a bachelor's degree or higher.
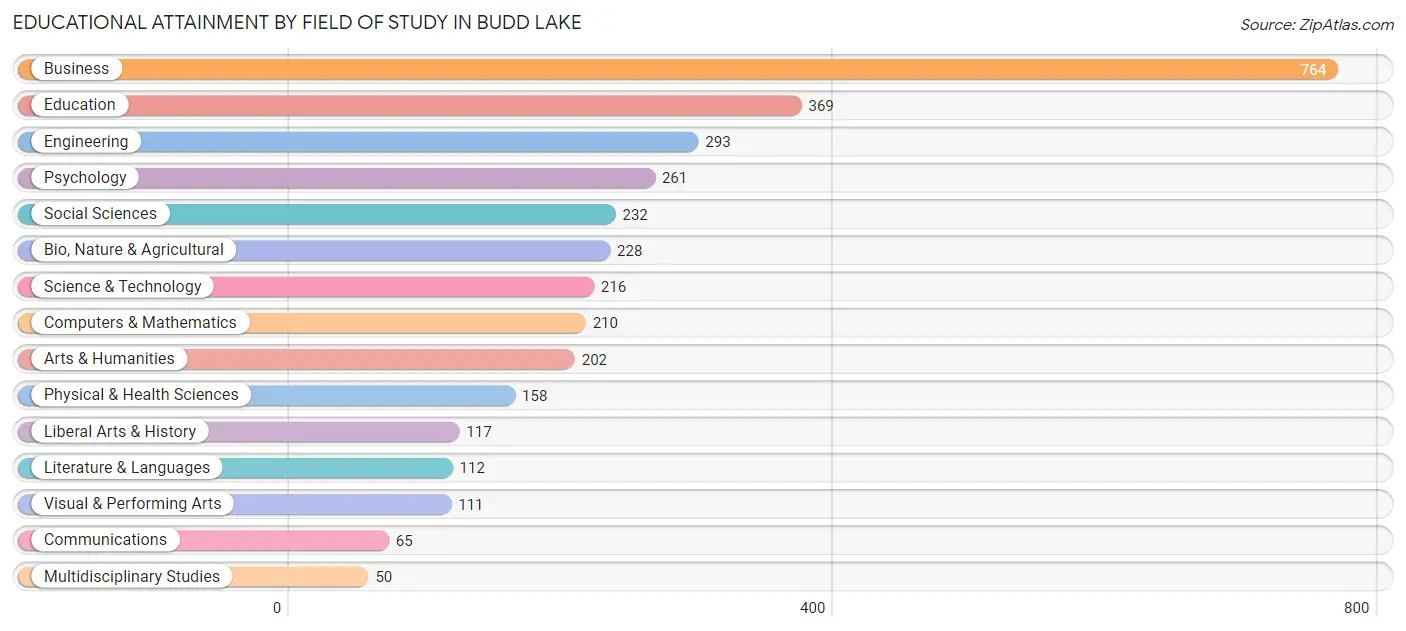
| Field of Study | # Graduates | % Graduates |
| Computers & Mathematics | 210 | 6.2% |
| Bio, Nature & Agricultural | 228 | 6.7% |
| Physical & Health Sciences | 158 | 4.7% |
| Psychology | 261 | 7.7% |
| Social Sciences | 232 | 6.9% |
| Engineering | 293 | 8.6% |
| Multidisciplinary Studies | 50 | 1.5% |
| Science & Technology | 216 | 6.4% |
| Business | 764 | 22.6% |
| Education | 369 | 10.9% |
| Literature & Languages | 112 | 3.3% |
| Liberal Arts & History | 117 | 3.5% |
| Visual & Performing Arts | 111 | 3.3% |
| Communications | 65 | 1.9% |
| Arts & Humanities | 202 | 6.0% |
| Total | 3,388 | 100.0% |
Transportation & Commute in Budd Lake
Vehicle Availability by Sex in Budd Lake
The most prevalent vehicle ownership categories in Budd Lake are males with 2 vehicles (1,671, accounting for 56.9%) and females with 2 vehicles (1,197, making up 69.9%).
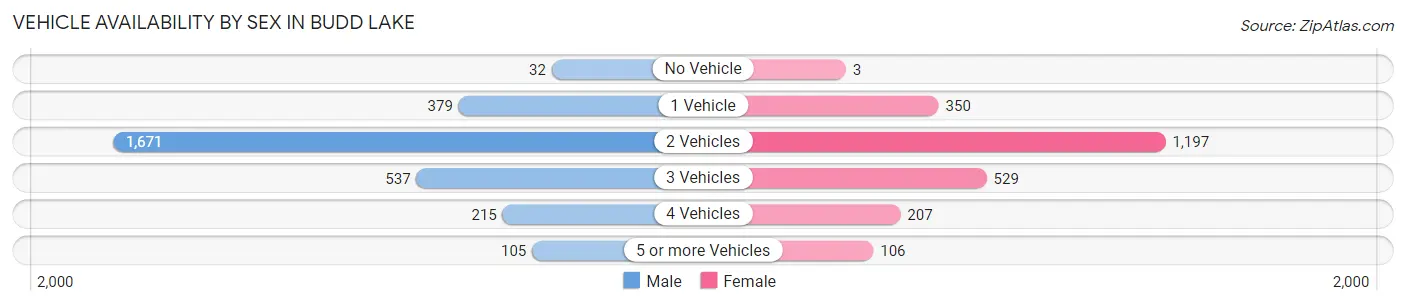
| Vehicles Available | Male | Female |
| No Vehicle | 32 (1.1%) | 3 (0.1%) |
| 1 Vehicle | 379 (12.9%) | 350 (14.6%) |
| 2 Vehicles | 1,671 (56.9%) | 1,197 (50.0%) |
| 3 Vehicles | 537 (18.3%) | 529 (22.1%) |
| 4 Vehicles | 215 (7.3%) | 207 (8.6%) |
| 5 or more Vehicles | 105 (3.6%) | 106 (4.4%) |
| Total | 2,939 (100.0%) | 2,392 (100.0%) |
Commute Time in Budd Lake
The most frequently occuring commute durations in Budd Lake are 45 to 59 minutes (759 commuters, 16.8%), 15 to 19 minutes (542 commuters, 12.0%), and 10 to 14 minutes (478 commuters, 10.6%).
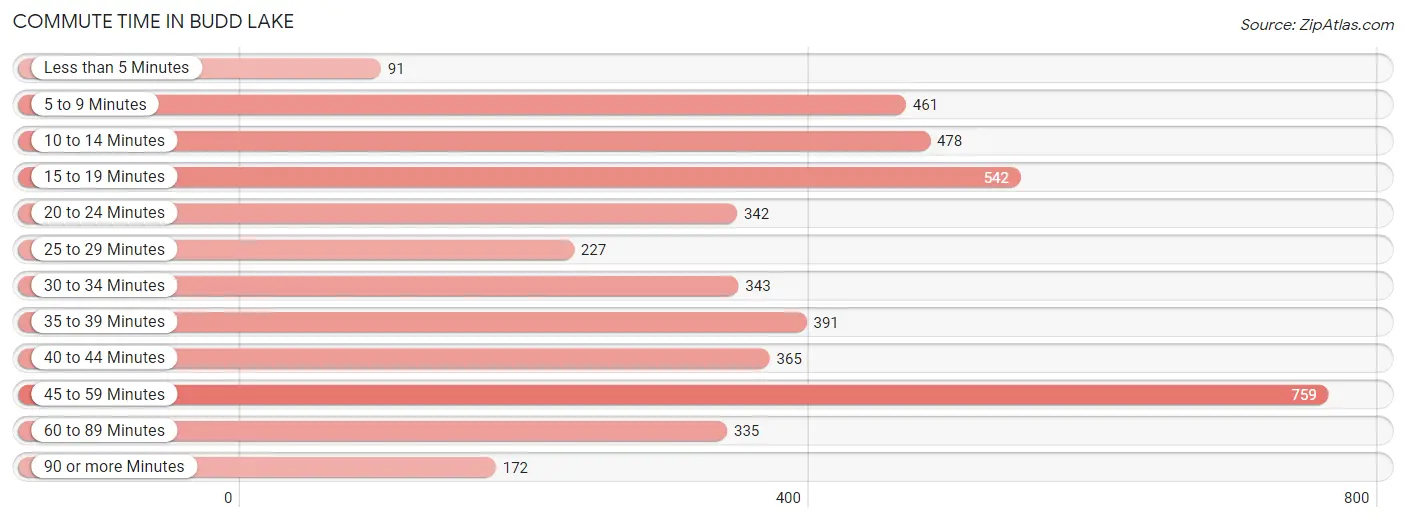
| Commute Time | # Commuters | % Commuters |
| Less than 5 Minutes | 91 | 2.0% |
| 5 to 9 Minutes | 461 | 10.2% |
| 10 to 14 Minutes | 478 | 10.6% |
| 15 to 19 Minutes | 542 | 12.0% |
| 20 to 24 Minutes | 342 | 7.6% |
| 25 to 29 Minutes | 227 | 5.0% |
| 30 to 34 Minutes | 343 | 7.6% |
| 35 to 39 Minutes | 391 | 8.7% |
| 40 to 44 Minutes | 365 | 8.1% |
| 45 to 59 Minutes | 759 | 16.8% |
| 60 to 89 Minutes | 335 | 7.4% |
| 90 or more Minutes | 172 | 3.8% |
Commute Time by Sex in Budd Lake
The most common commute times in Budd Lake are 45 to 59 minutes (450 commuters, 17.8%) for males and 45 to 59 minutes (309 commuters, 15.7%) for females.
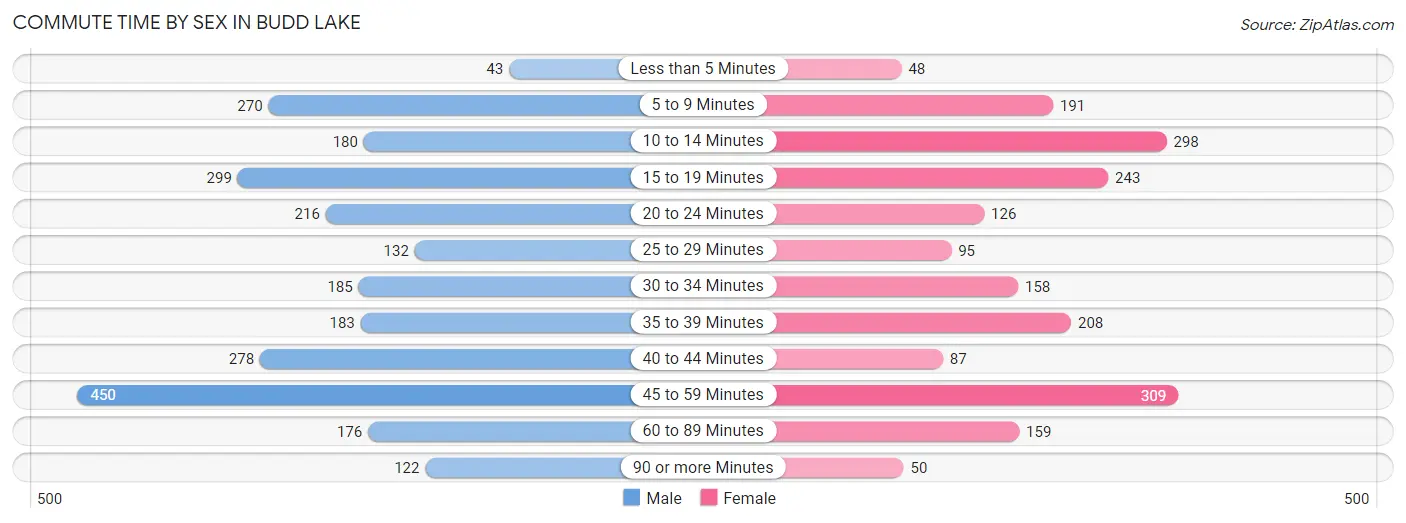
| Commute Time | Male | Female |
| Less than 5 Minutes | 43 (1.7%) | 48 (2.4%) |
| 5 to 9 Minutes | 270 (10.7%) | 191 (9.7%) |
| 10 to 14 Minutes | 180 (7.1%) | 298 (15.1%) |
| 15 to 19 Minutes | 299 (11.8%) | 243 (12.3%) |
| 20 to 24 Minutes | 216 (8.5%) | 126 (6.4%) |
| 25 to 29 Minutes | 132 (5.2%) | 95 (4.8%) |
| 30 to 34 Minutes | 185 (7.3%) | 158 (8.0%) |
| 35 to 39 Minutes | 183 (7.2%) | 208 (10.5%) |
| 40 to 44 Minutes | 278 (11.0%) | 87 (4.4%) |
| 45 to 59 Minutes | 450 (17.8%) | 309 (15.7%) |
| 60 to 89 Minutes | 176 (7.0%) | 159 (8.1%) |
| 90 or more Minutes | 122 (4.8%) | 50 (2.5%) |
Time of Departure to Work by Sex in Budd Lake
The most frequent times of departure to work in Budd Lake are 6:00 AM to 6:29 AM (311, 12.3%) for males and 7:00 AM to 7:29 AM (323, 16.4%) for females.
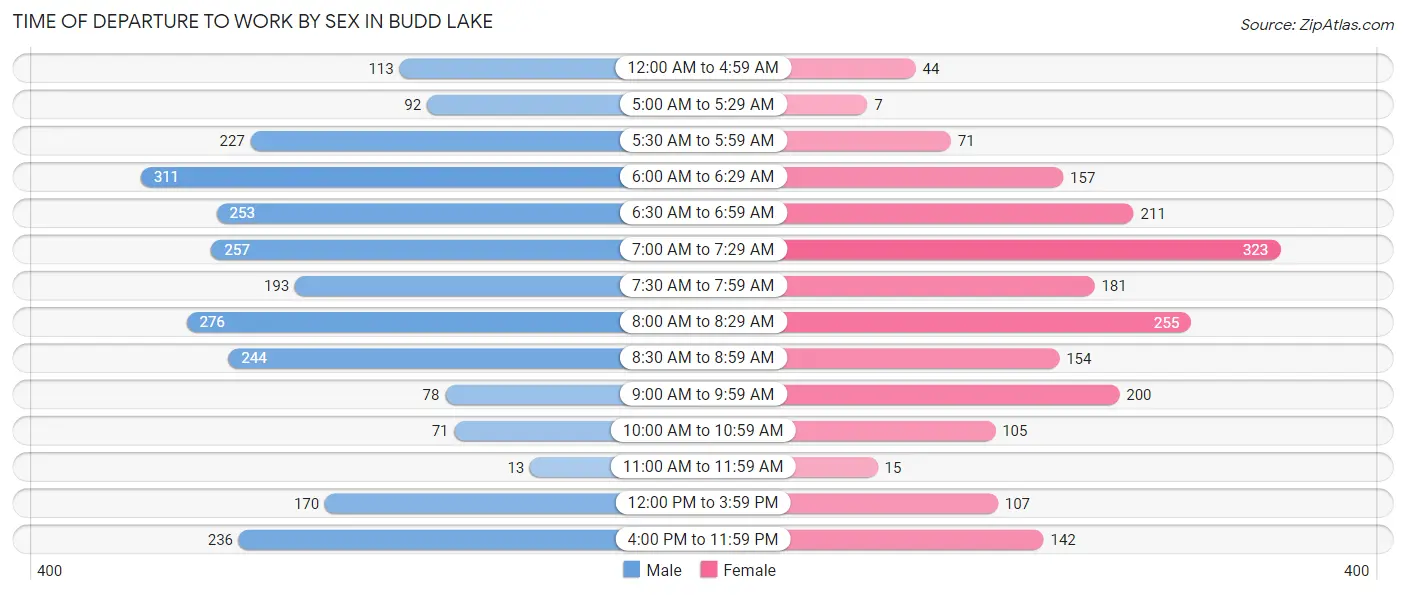
| Time of Departure | Male | Female |
| 12:00 AM to 4:59 AM | 113 (4.5%) | 44 (2.2%) |
| 5:00 AM to 5:29 AM | 92 (3.6%) | 7 (0.4%) |
| 5:30 AM to 5:59 AM | 227 (9.0%) | 71 (3.6%) |
| 6:00 AM to 6:29 AM | 311 (12.3%) | 157 (8.0%) |
| 6:30 AM to 6:59 AM | 253 (10.0%) | 211 (10.7%) |
| 7:00 AM to 7:29 AM | 257 (10.1%) | 323 (16.4%) |
| 7:30 AM to 7:59 AM | 193 (7.6%) | 181 (9.2%) |
| 8:00 AM to 8:29 AM | 276 (10.9%) | 255 (12.9%) |
| 8:30 AM to 8:59 AM | 244 (9.6%) | 154 (7.8%) |
| 9:00 AM to 9:59 AM | 78 (3.1%) | 200 (10.1%) |
| 10:00 AM to 10:59 AM | 71 (2.8%) | 105 (5.3%) |
| 11:00 AM to 11:59 AM | 13 (0.5%) | 15 (0.8%) |
| 12:00 PM to 3:59 PM | 170 (6.7%) | 107 (5.4%) |
| 4:00 PM to 11:59 PM | 236 (9.3%) | 142 (7.2%) |
| Total | 2,534 (100.0%) | 1,972 (100.0%) |
Housing Occupancy in Budd Lake
Occupancy by Ownership in Budd Lake
Of the total 3,549 dwellings in Budd Lake, owner-occupied units account for 2,664 (75.1%), while renter-occupied units make up 885 (24.9%).
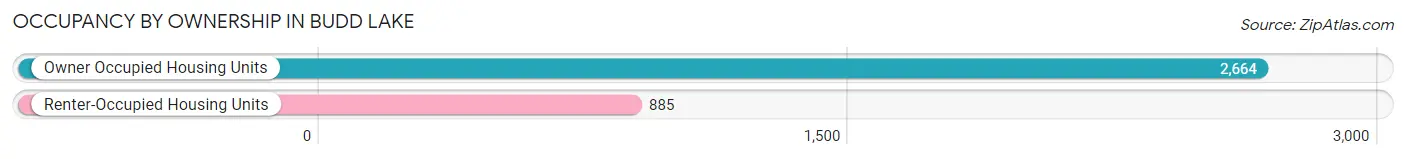
| Occupancy | # Housing Units | % Housing Units |
| Owner Occupied Housing Units | 2,664 | 75.1% |
| Renter-Occupied Housing Units | 885 | 24.9% |
| Total Occupied Housing Units | 3,549 | 100.0% |
Occupancy by Household Size in Budd Lake
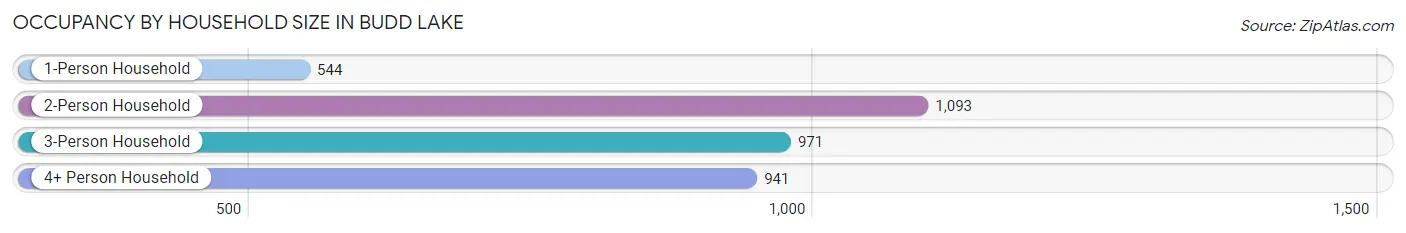
| Household Size | # Housing Units | % Housing Units |
| 1-Person Household | 544 | 15.3% |
| 2-Person Household | 1,093 | 30.8% |
| 3-Person Household | 971 | 27.4% |
| 4+ Person Household | 941 | 26.5% |
| Total Housing Units | 3,549 | 100.0% |
Occupancy by Ownership by Household Size in Budd Lake
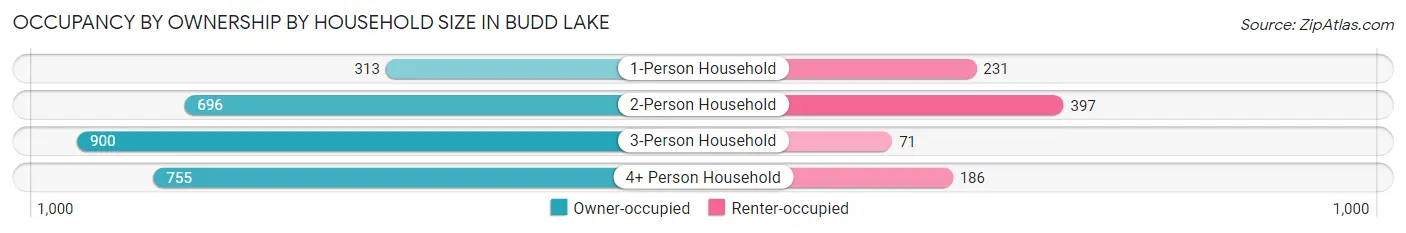
| Household Size | Owner-occupied | Renter-occupied |
| 1-Person Household | 313 (57.5%) | 231 (42.5%) |
| 2-Person Household | 696 (63.7%) | 397 (36.3%) |
| 3-Person Household | 900 (92.7%) | 71 (7.3%) |
| 4+ Person Household | 755 (80.2%) | 186 (19.8%) |
| Total Housing Units | 2,664 (75.1%) | 885 (24.9%) |
Occupancy by Educational Attainment in Budd Lake
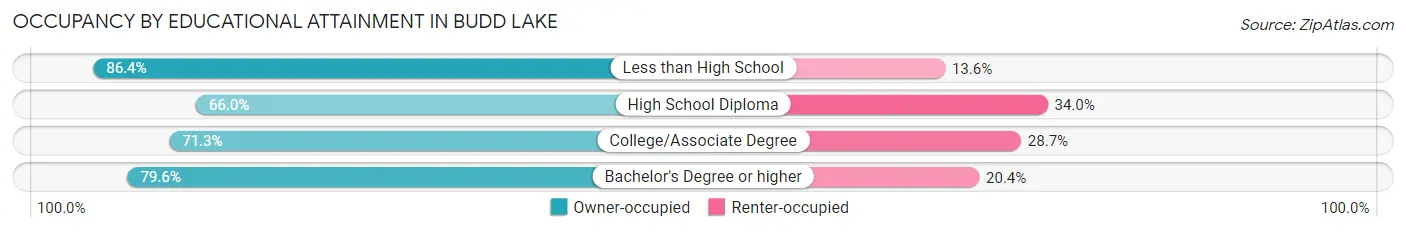
| Household Size | Owner-occupied | Renter-occupied |
| Less than High School | 171 (86.4%) | 27 (13.6%) |
| High School Diploma | 536 (66.0%) | 276 (34.0%) |
| College/Associate Degree | 549 (71.3%) | 221 (28.7%) |
| Bachelor's Degree or higher | 1,408 (79.6%) | 361 (20.4%) |
Occupancy by Age of Householder in Budd Lake
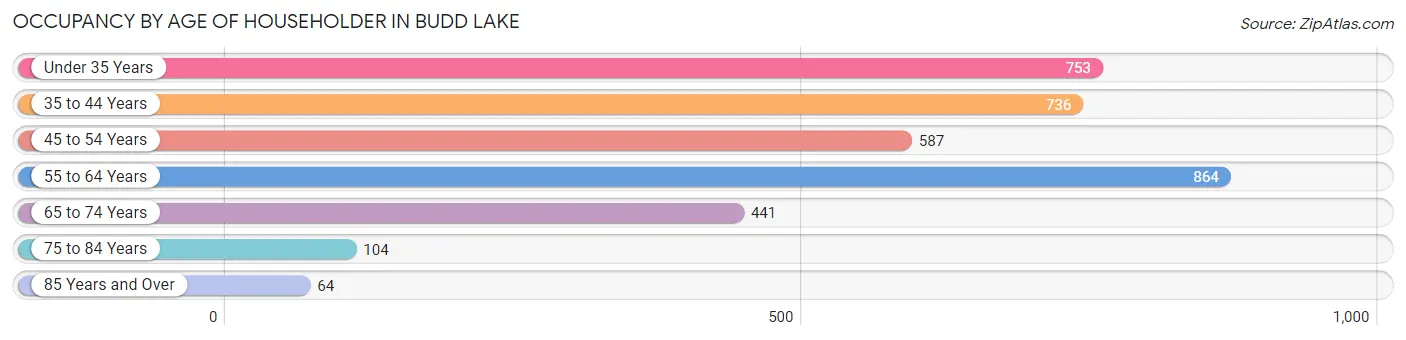
| Age Bracket | # Households | % Households |
| Under 35 Years | 753 | 21.2% |
| 35 to 44 Years | 736 | 20.7% |
| 45 to 54 Years | 587 | 16.5% |
| 55 to 64 Years | 864 | 24.3% |
| 65 to 74 Years | 441 | 12.4% |
| 75 to 84 Years | 104 | 2.9% |
| 85 Years and Over | 64 | 1.8% |
| Total | 3,549 | 100.0% |
Housing Finances in Budd Lake
Median Income by Occupancy in Budd Lake
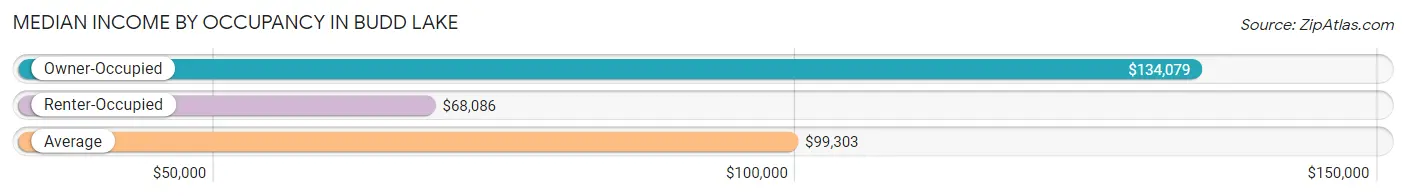
| Occupancy Type | # Households | Median Income |
| Owner-Occupied | 2,664 (75.1%) | $134,079 |
| Renter-Occupied | 885 (24.9%) | $68,086 |
| Average | 3,549 (100.0%) | $99,303 |
Occupancy by Householder Income Bracket in Budd Lake
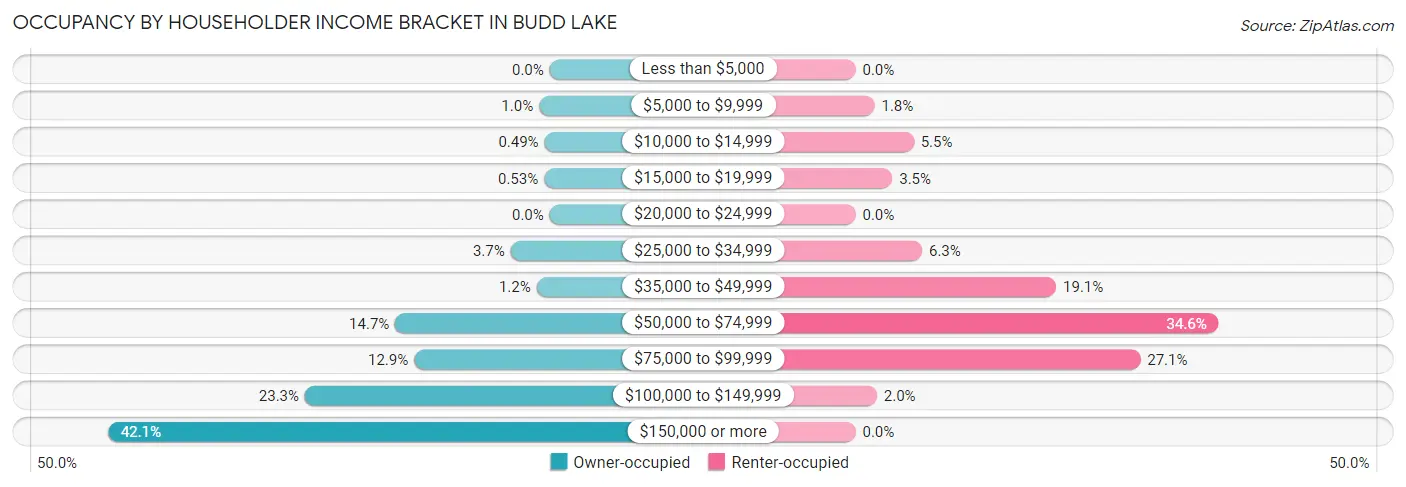
| Income Bracket | Owner-occupied | Renter-occupied |
| Less than $5,000 | 0 (0.0%) | 0 (0.0%) |
| $5,000 to $9,999 | 27 (1.0%) | 16 (1.8%) |
| $10,000 to $14,999 | 13 (0.5%) | 49 (5.5%) |
| $15,000 to $19,999 | 14 (0.5%) | 31 (3.5%) |
| $20,000 to $24,999 | 0 (0.0%) | 0 (0.0%) |
| $25,000 to $34,999 | 99 (3.7%) | 56 (6.3%) |
| $35,000 to $49,999 | 33 (1.2%) | 169 (19.1%) |
| $50,000 to $74,999 | 392 (14.7%) | 306 (34.6%) |
| $75,000 to $99,999 | 344 (12.9%) | 240 (27.1%) |
| $100,000 to $149,999 | 621 (23.3%) | 18 (2.0%) |
| $150,000 or more | 1,121 (42.1%) | 0 (0.0%) |
| Total | 2,664 (100.0%) | 885 (100.0%) |
Monthly Housing Cost Tiers in Budd Lake
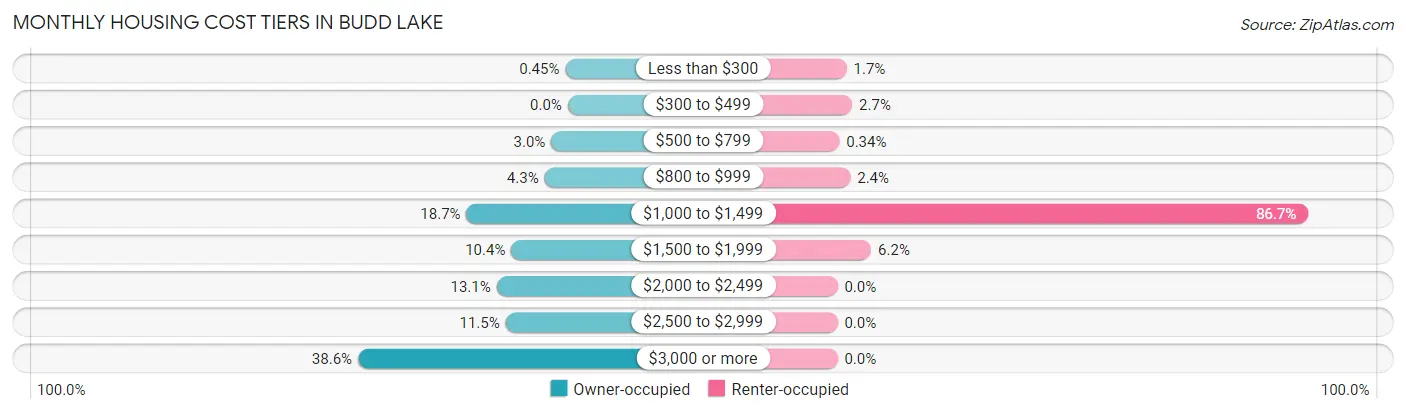
| Monthly Cost | Owner-occupied | Renter-occupied |
| Less than $300 | 12 (0.4%) | 15 (1.7%) |
| $300 to $499 | 0 (0.0%) | 24 (2.7%) |
| $500 to $799 | 81 (3.0%) | 3 (0.3%) |
| $800 to $999 | 114 (4.3%) | 21 (2.4%) |
| $1,000 to $1,499 | 497 (18.7%) | 767 (86.7%) |
| $1,500 to $1,999 | 277 (10.4%) | 55 (6.2%) |
| $2,000 to $2,499 | 349 (13.1%) | 0 (0.0%) |
| $2,500 to $2,999 | 305 (11.5%) | 0 (0.0%) |
| $3,000 or more | 1,029 (38.6%) | 0 (0.0%) |
| Total | 2,664 (100.0%) | 885 (100.0%) |
Physical Housing Characteristics in Budd Lake
Housing Structures in Budd Lake
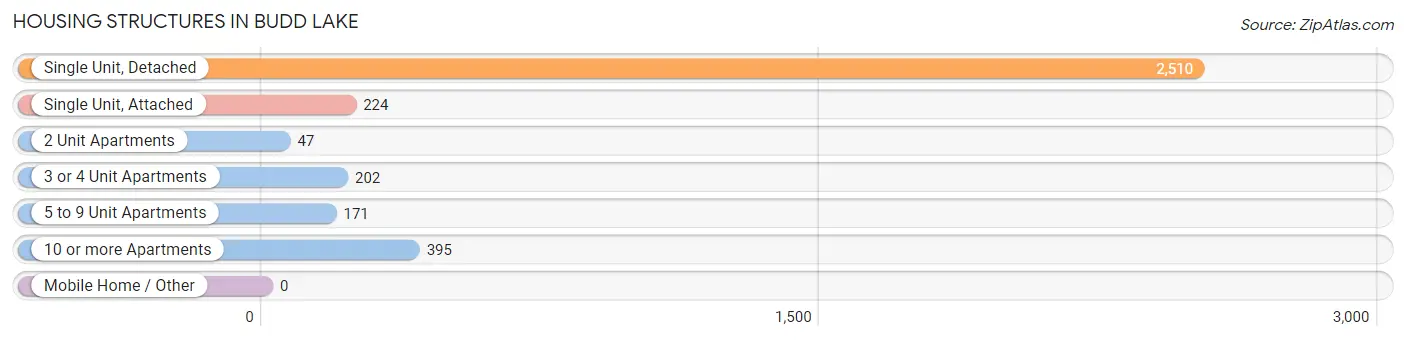
| Structure Type | # Housing Units | % Housing Units |
| Single Unit, Detached | 2,510 | 70.7% |
| Single Unit, Attached | 224 | 6.3% |
| 2 Unit Apartments | 47 | 1.3% |
| 3 or 4 Unit Apartments | 202 | 5.7% |
| 5 to 9 Unit Apartments | 171 | 4.8% |
| 10 or more Apartments | 395 | 11.1% |
| Mobile Home / Other | 0 | 0.0% |
| Total | 3,549 | 100.0% |
Housing Structures by Occupancy in Budd Lake
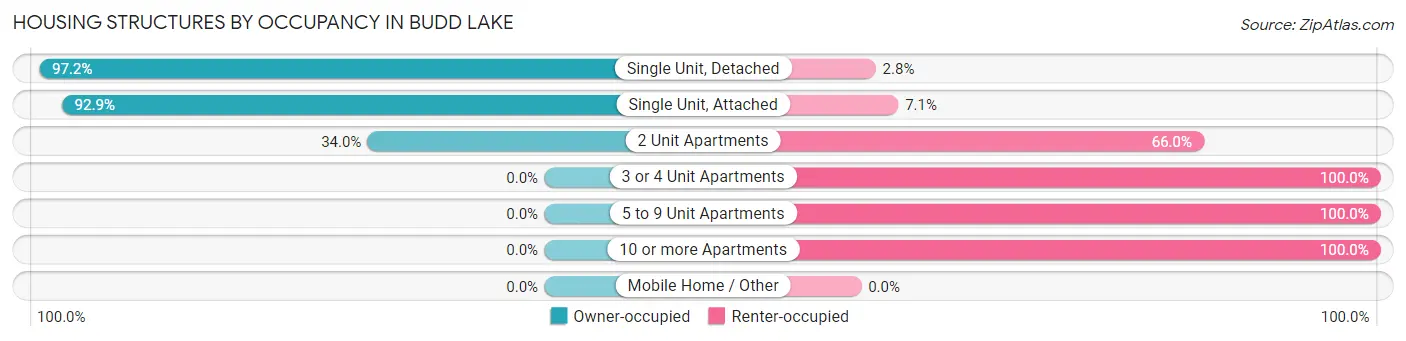
| Structure Type | Owner-occupied | Renter-occupied |
| Single Unit, Detached | 2,440 (97.2%) | 70 (2.8%) |
| Single Unit, Attached | 208 (92.9%) | 16 (7.1%) |
| 2 Unit Apartments | 16 (34.0%) | 31 (66.0%) |
| 3 or 4 Unit Apartments | 0 (0.0%) | 202 (100.0%) |
| 5 to 9 Unit Apartments | 0 (0.0%) | 171 (100.0%) |
| 10 or more Apartments | 0 (0.0%) | 395 (100.0%) |
| Mobile Home / Other | 0 (0.0%) | 0 (0.0%) |
| Total | 2,664 (75.1%) | 885 (24.9%) |
Housing Structures by Number of Rooms in Budd Lake
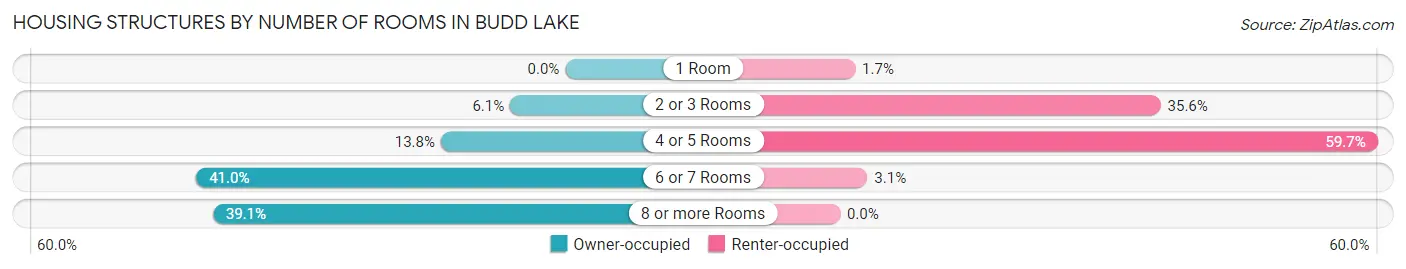
| Number of Rooms | Owner-occupied | Renter-occupied |
| 1 Room | 0 (0.0%) | 15 (1.7%) |
| 2 or 3 Rooms | 163 (6.1%) | 315 (35.6%) |
| 4 or 5 Rooms | 368 (13.8%) | 528 (59.7%) |
| 6 or 7 Rooms | 1,091 (40.9%) | 27 (3.0%) |
| 8 or more Rooms | 1,042 (39.1%) | 0 (0.0%) |
| Total | 2,664 (100.0%) | 885 (100.0%) |
Housing Structure by Heating Type in Budd Lake
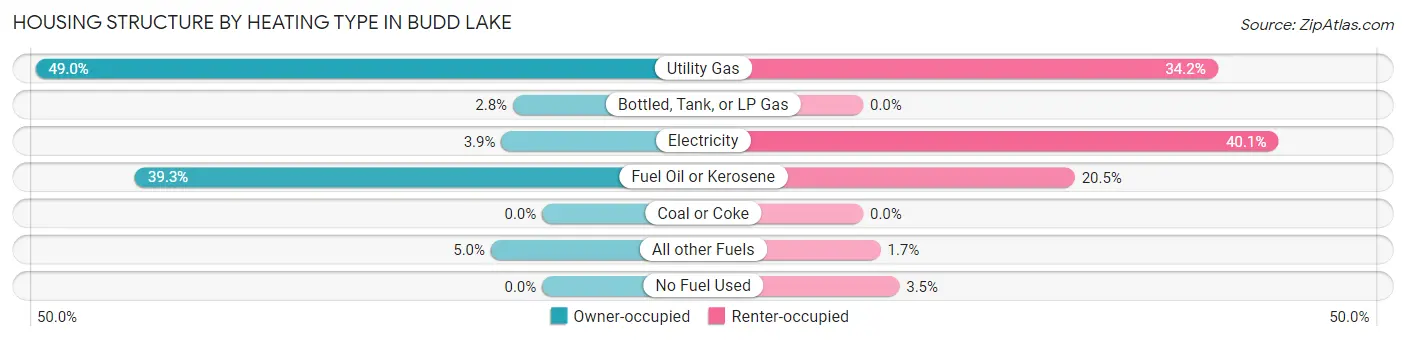
| Heating Type | Owner-occupied | Renter-occupied |
| Utility Gas | 1,304 (48.9%) | 303 (34.2%) |
| Bottled, Tank, or LP Gas | 75 (2.8%) | 0 (0.0%) |
| Electricity | 105 (3.9%) | 355 (40.1%) |
| Fuel Oil or Kerosene | 1,048 (39.3%) | 181 (20.4%) |
| Coal or Coke | 0 (0.0%) | 0 (0.0%) |
| All other Fuels | 132 (5.0%) | 15 (1.7%) |
| No Fuel Used | 0 (0.0%) | 31 (3.5%) |
| Total | 2,664 (100.0%) | 885 (100.0%) |
Household Vehicle Usage in Budd Lake
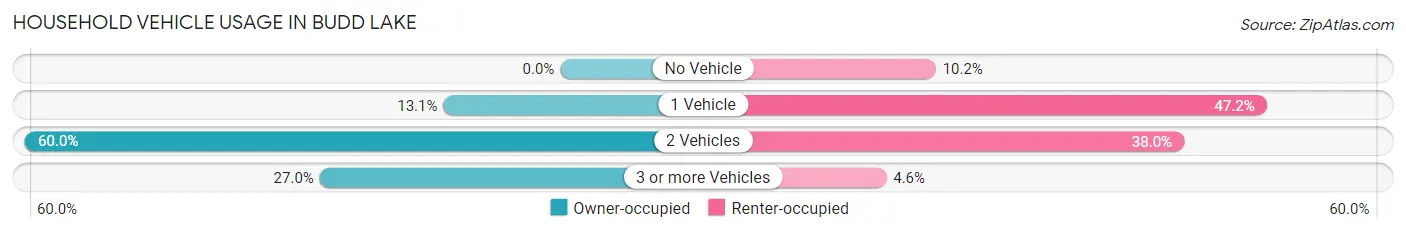
| Vehicles per Household | Owner-occupied | Renter-occupied |
| No Vehicle | 0 (0.0%) | 90 (10.2%) |
| 1 Vehicle | 349 (13.1%) | 418 (47.2%) |
| 2 Vehicles | 1,597 (60.0%) | 336 (38.0%) |
| 3 or more Vehicles | 718 (27.0%) | 41 (4.6%) |
| Total | 2,664 (100.0%) | 885 (100.0%) |
Real Estate & Mortgages in Budd Lake
Real Estate and Mortgage Overview in Budd Lake
| Characteristic | Without Mortgage | With Mortgage |
| Housing Units | 722 | 1,942 |
| Median Property Value | $329,600 | $422,300 |
| Median Household Income | $96,827 | $927 |
| Monthly Housing Costs | $1,171 | $1,029 |
| Real Estate Taxes | $9,033 | $19 |
Property Value by Mortgage Status in Budd Lake
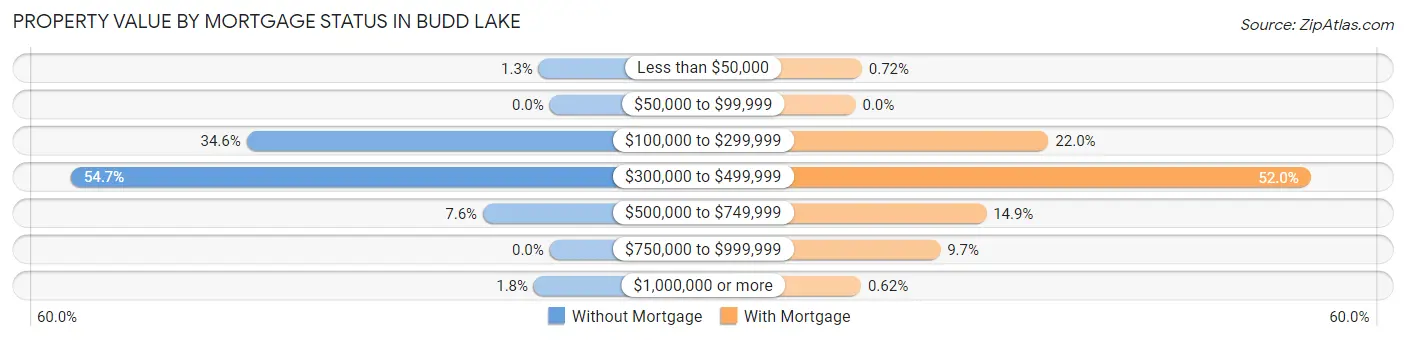
| Property Value | Without Mortgage | With Mortgage |
| Less than $50,000 | 9 (1.3%) | 14 (0.7%) |
| $50,000 to $99,999 | 0 (0.0%) | 0 (0.0%) |
| $100,000 to $299,999 | 250 (34.6%) | 428 (22.0%) |
| $300,000 to $499,999 | 395 (54.7%) | 1,010 (52.0%) |
| $500,000 to $749,999 | 55 (7.6%) | 290 (14.9%) |
| $750,000 to $999,999 | 0 (0.0%) | 188 (9.7%) |
| $1,000,000 or more | 13 (1.8%) | 12 (0.6%) |
| Total | 722 (100.0%) | 1,942 (100.0%) |
Household Income by Mortgage Status in Budd Lake
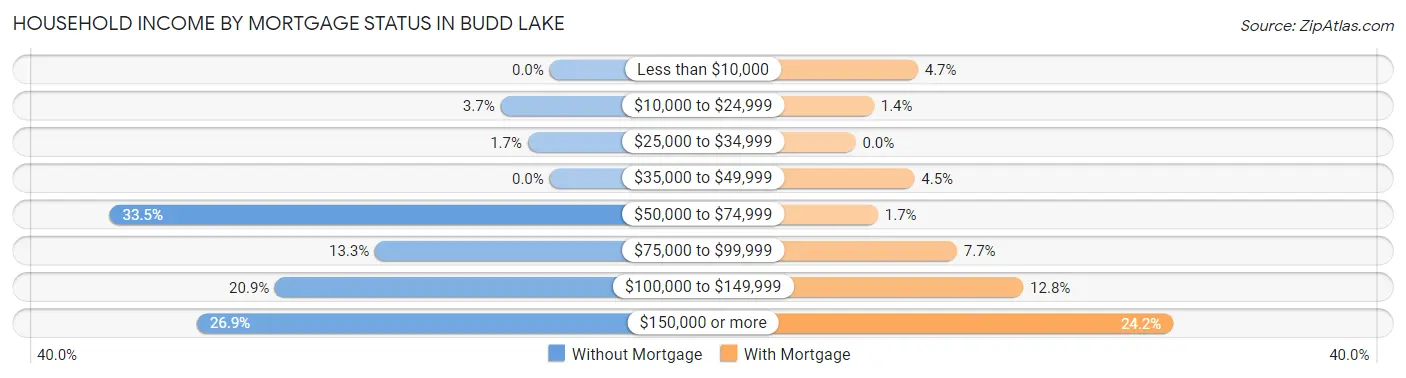
| Household Income | Without Mortgage | With Mortgage |
| Less than $10,000 | 0 (0.0%) | 92 (4.7%) |
| $10,000 to $24,999 | 27 (3.7%) | 27 (1.4%) |
| $25,000 to $34,999 | 12 (1.7%) | 0 (0.0%) |
| $35,000 to $49,999 | 0 (0.0%) | 87 (4.5%) |
| $50,000 to $74,999 | 242 (33.5%) | 33 (1.7%) |
| $75,000 to $99,999 | 96 (13.3%) | 150 (7.7%) |
| $100,000 to $149,999 | 151 (20.9%) | 248 (12.8%) |
| $150,000 or more | 194 (26.9%) | 470 (24.2%) |
| Total | 722 (100.0%) | 1,942 (100.0%) |
Property Value to Household Income Ratio in Budd Lake
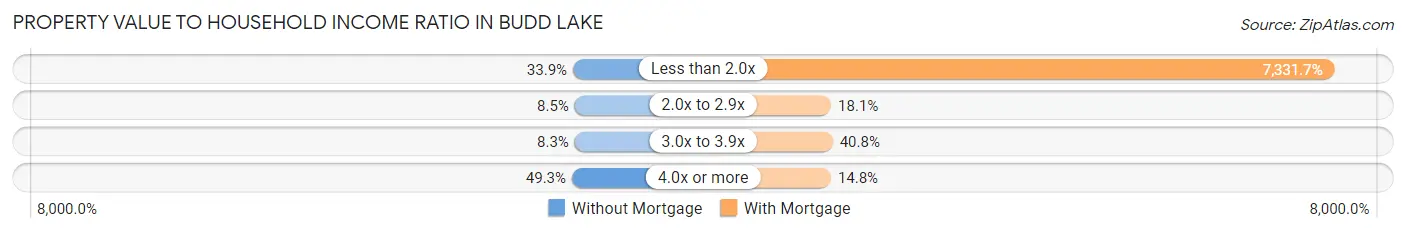
| Value-to-Income Ratio | Without Mortgage | With Mortgage |
| Less than 2.0x | 245 (33.9%) | 142,381 (7,331.7%) |
| 2.0x to 2.9x | 61 (8.5%) | 352 (18.1%) |
| 3.0x to 3.9x | 60 (8.3%) | 792 (40.8%) |
| 4.0x or more | 356 (49.3%) | 288 (14.8%) |
| Total | 722 (100.0%) | 1,942 (100.0%) |
Real Estate Taxes by Mortgage Status in Budd Lake
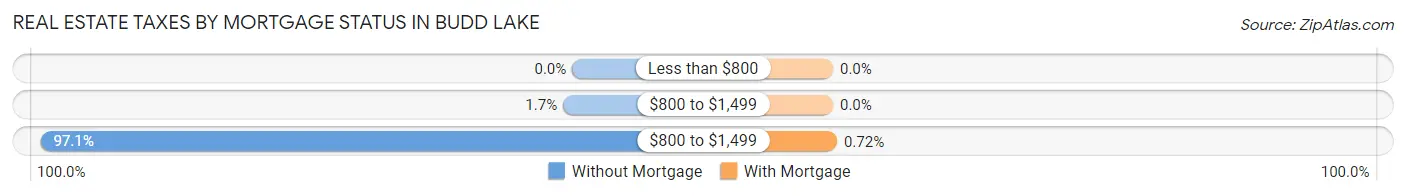
| Property Taxes | Without Mortgage | With Mortgage |
| Less than $800 | 0 (0.0%) | 0 (0.0%) |
| $800 to $1,499 | 12 (1.7%) | 0 (0.0%) |
| $800 to $1,499 | 701 (97.1%) | 14 (0.7%) |
| Total | 722 (100.0%) | 1,942 (100.0%) |
Health & Disability in Budd Lake
Health Insurance Coverage by Age in Budd Lake
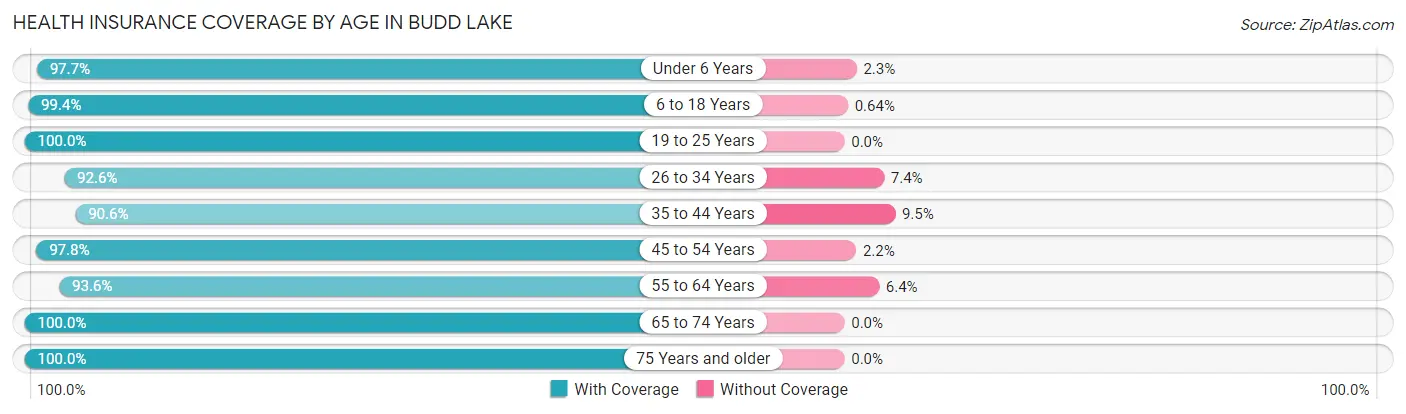
| Age Bracket | With Coverage | Without Coverage |
| Under 6 Years | 946 (97.7%) | 22 (2.3%) |
| 6 to 18 Years | 1,718 (99.4%) | 11 (0.6%) |
| 19 to 25 Years | 521 (100.0%) | 0 (0.0%) |
| 26 to 34 Years | 1,367 (92.6%) | 109 (7.4%) |
| 35 to 44 Years | 1,456 (90.5%) | 152 (9.5%) |
| 45 to 54 Years | 1,034 (97.8%) | 23 (2.2%) |
| 55 to 64 Years | 1,380 (93.6%) | 95 (6.4%) |
| 65 to 74 Years | 844 (100.0%) | 0 (0.0%) |
| 75 Years and older | 305 (100.0%) | 0 (0.0%) |
| Total | 9,571 (95.9%) | 412 (4.1%) |
Health Insurance Coverage by Citizenship Status in Budd Lake
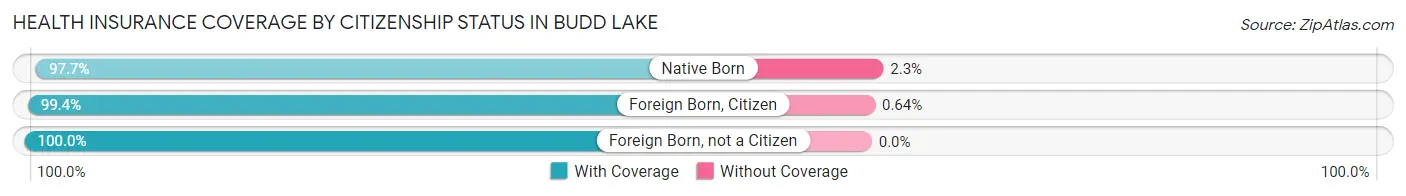
| Citizenship Status | With Coverage | Without Coverage |
| Native Born | 946 (97.7%) | 22 (2.3%) |
| Foreign Born, Citizen | 1,718 (99.4%) | 11 (0.6%) |
| Foreign Born, not a Citizen | 521 (100.0%) | 0 (0.0%) |
Health Insurance Coverage by Household Income in Budd Lake
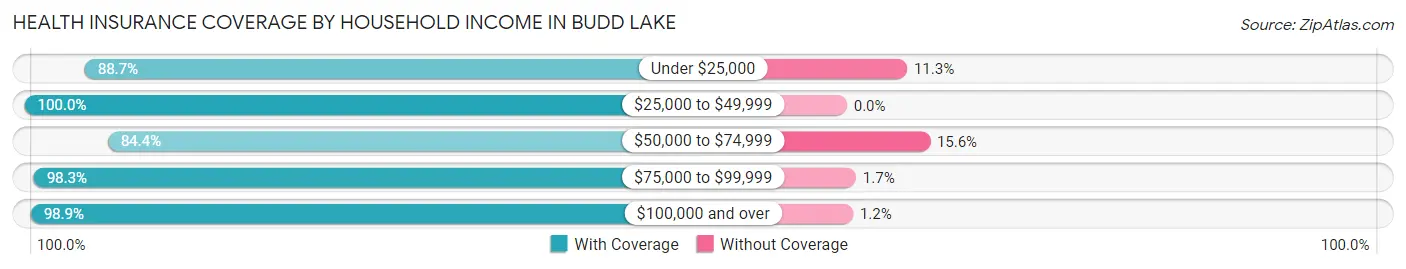
| Household Income | With Coverage | Without Coverage |
| Under $25,000 | 236 (88.7%) | 30 (11.3%) |
| $25,000 to $49,999 | 552 (100.0%) | 0 (0.0%) |
| $50,000 to $74,999 | 1,566 (84.4%) | 289 (15.6%) |
| $75,000 to $99,999 | 1,607 (98.3%) | 28 (1.7%) |
| $100,000 and over | 5,601 (98.9%) | 65 (1.1%) |
Public vs Private Health Insurance Coverage by Age in Budd Lake
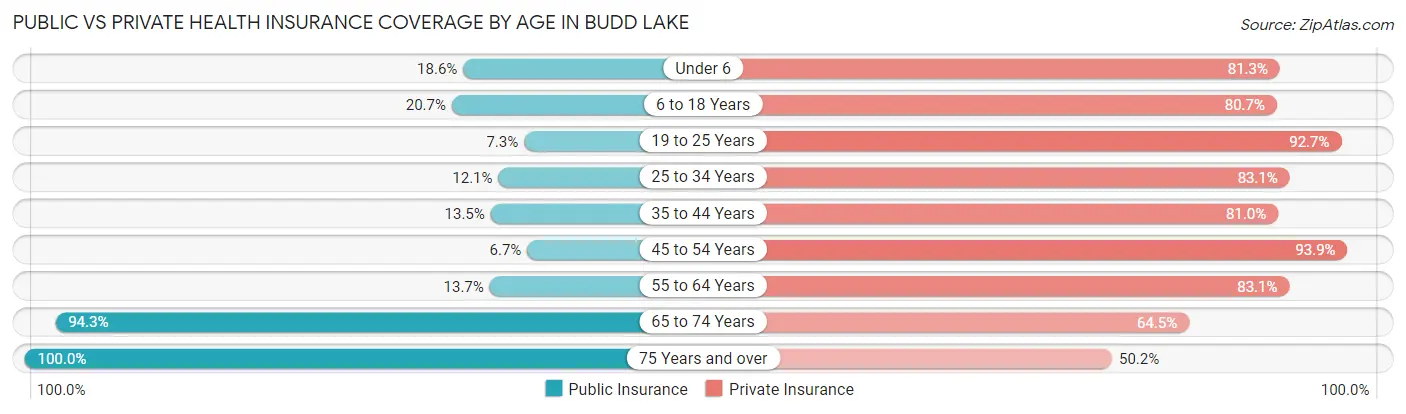
| Age Bracket | Public Insurance | Private Insurance |
| Under 6 | 180 (18.6%) | 787 (81.3%) |
| 6 to 18 Years | 358 (20.7%) | 1,396 (80.7%) |
| 19 to 25 Years | 38 (7.3%) | 483 (92.7%) |
| 25 to 34 Years | 178 (12.1%) | 1,227 (83.1%) |
| 35 to 44 Years | 217 (13.5%) | 1,302 (81.0%) |
| 45 to 54 Years | 71 (6.7%) | 992 (93.9%) |
| 55 to 64 Years | 202 (13.7%) | 1,225 (83.1%) |
| 65 to 74 Years | 796 (94.3%) | 544 (64.4%) |
| 75 Years and over | 305 (100.0%) | 153 (50.2%) |
| Total | 2,345 (23.5%) | 8,109 (81.2%) |
Disability Status by Sex by Age in Budd Lake
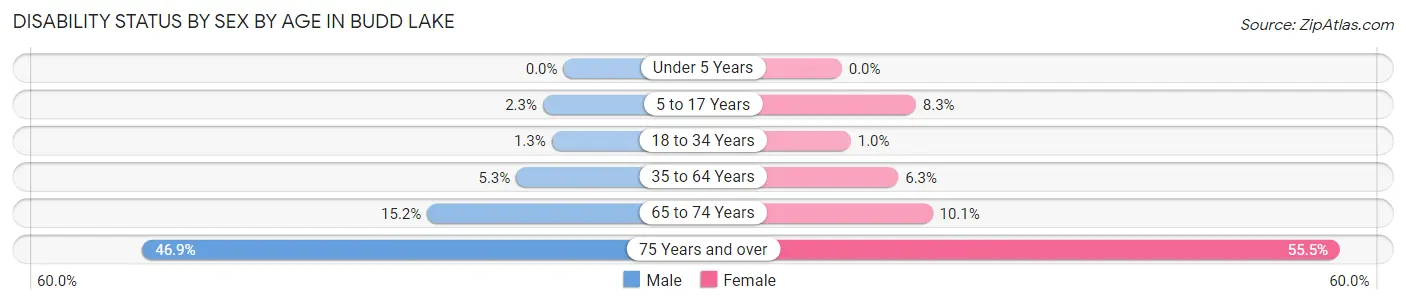
| Age Bracket | Male | Female |
| Under 5 Years | 0 (0.0%) | 0 (0.0%) |
| 5 to 17 Years | 24 (2.3%) | 56 (8.3%) |
| 18 to 34 Years | 14 (1.3%) | 10 (1.0%) |
| 35 to 64 Years | 115 (5.3%) | 123 (6.3%) |
| 65 to 74 Years | 59 (15.2%) | 46 (10.1%) |
| 75 Years and over | 83 (46.9%) | 71 (55.5%) |
Disability Class by Sex by Age in Budd Lake
Disability Class: Hearing Difficulty
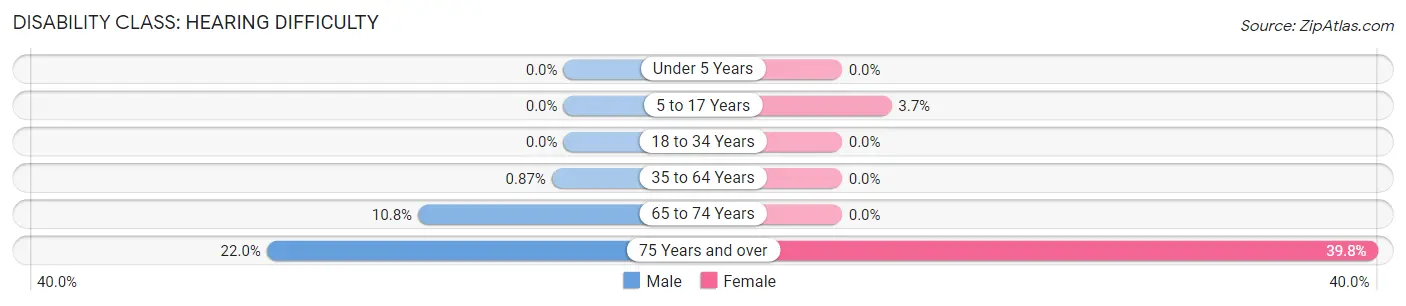
| Age Bracket | Male | Female |
| Under 5 Years | 0 (0.0%) | 0 (0.0%) |
| 5 to 17 Years | 0 (0.0%) | 25 (3.7%) |
| 18 to 34 Years | 0 (0.0%) | 0 (0.0%) |
| 35 to 64 Years | 19 (0.9%) | 0 (0.0%) |
| 65 to 74 Years | 42 (10.8%) | 0 (0.0%) |
| 75 Years and over | 39 (22.0%) | 51 (39.8%) |
Disability Class: Vision Difficulty
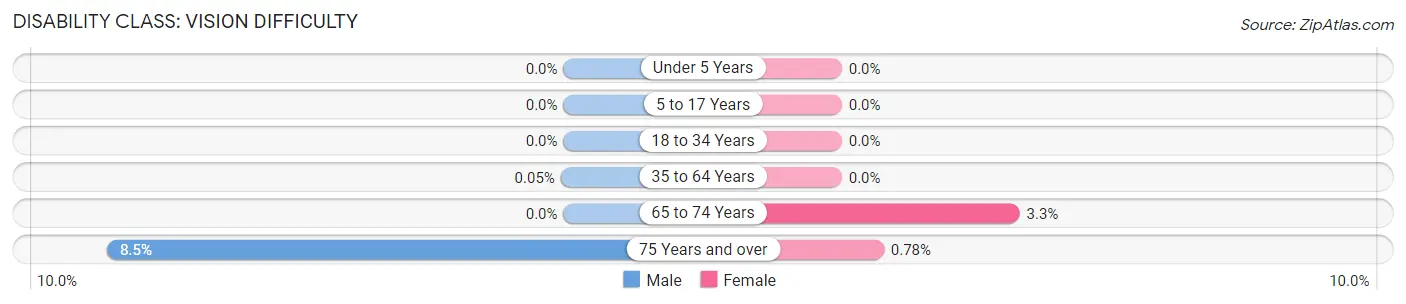
| Age Bracket | Male | Female |
| Under 5 Years | 0 (0.0%) | 0 (0.0%) |
| 5 to 17 Years | 0 (0.0%) | 0 (0.0%) |
| 18 to 34 Years | 0 (0.0%) | 0 (0.0%) |
| 35 to 64 Years | 1 (0.1%) | 0 (0.0%) |
| 65 to 74 Years | 0 (0.0%) | 15 (3.3%) |
| 75 Years and over | 15 (8.5%) | 1 (0.8%) |
Disability Class: Cognitive Difficulty
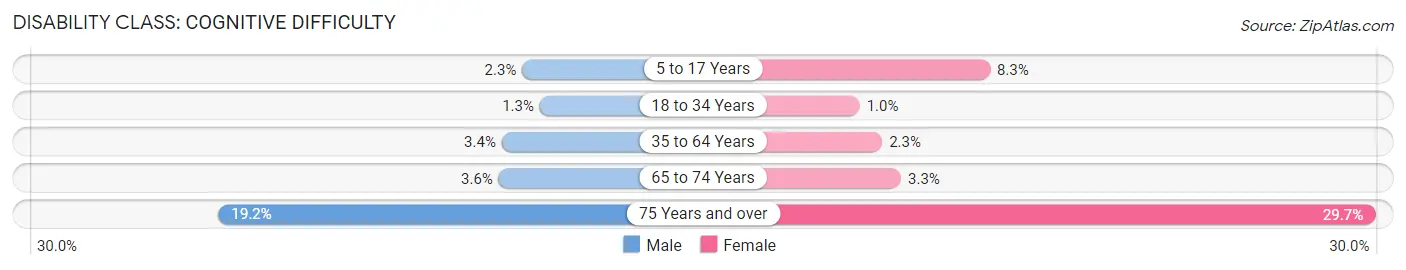
| Age Bracket | Male | Female |
| 5 to 17 Years | 24 (2.3%) | 56 (8.3%) |
| 18 to 34 Years | 14 (1.3%) | 10 (1.0%) |
| 35 to 64 Years | 75 (3.4%) | 44 (2.2%) |
| 65 to 74 Years | 14 (3.6%) | 15 (3.3%) |
| 75 Years and over | 34 (19.2%) | 38 (29.7%) |
Disability Class: Ambulatory Difficulty
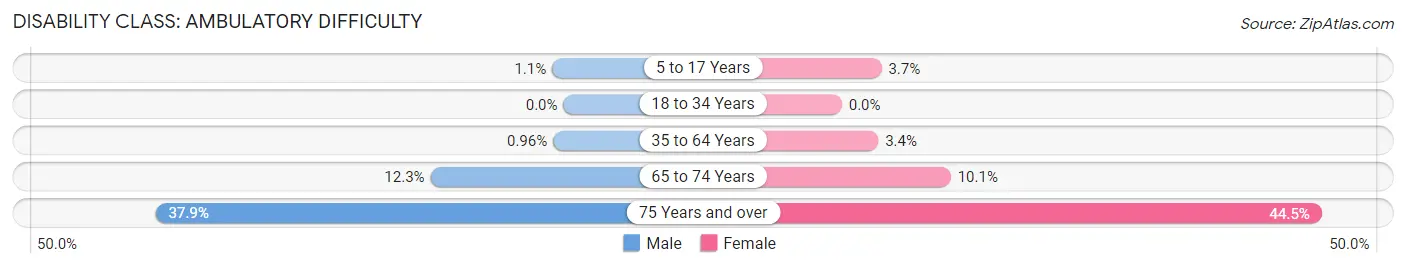
| Age Bracket | Male | Female |
| 5 to 17 Years | 11 (1.1%) | 25 (3.7%) |
| 18 to 34 Years | 0 (0.0%) | 0 (0.0%) |
| 35 to 64 Years | 21 (1.0%) | 66 (3.4%) |
| 65 to 74 Years | 48 (12.3%) | 46 (10.1%) |
| 75 Years and over | 67 (37.9%) | 57 (44.5%) |
Disability Class: Self-Care Difficulty
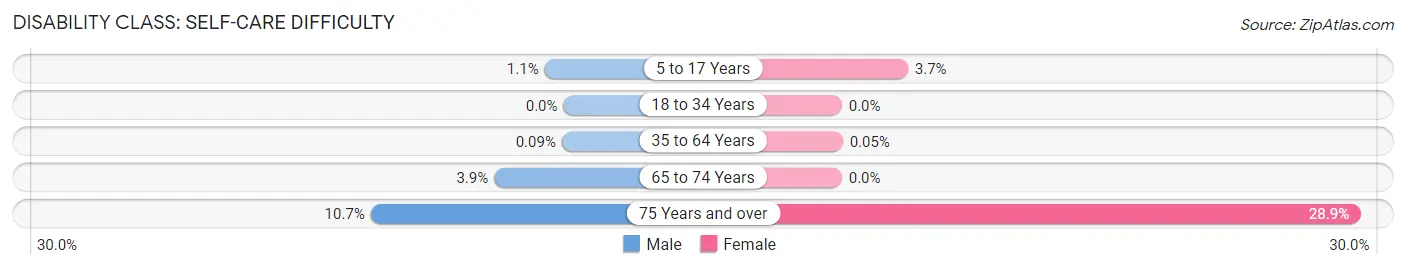
| Age Bracket | Male | Female |
| 5 to 17 Years | 11 (1.1%) | 25 (3.7%) |
| 18 to 34 Years | 0 (0.0%) | 0 (0.0%) |
| 35 to 64 Years | 2 (0.1%) | 1 (0.1%) |
| 65 to 74 Years | 15 (3.9%) | 0 (0.0%) |
| 75 Years and over | 19 (10.7%) | 37 (28.9%) |
Technology Access in Budd Lake
Computing Device Access in Budd Lake
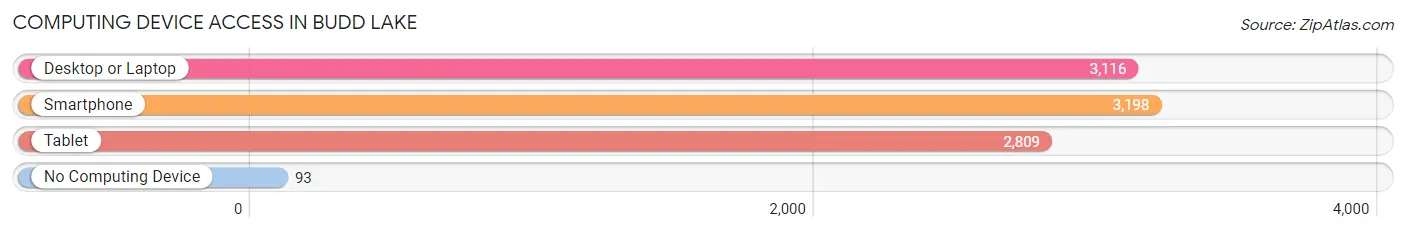
| Device Type | # Households | % Households |
| Desktop or Laptop | 3,116 | 87.8% |
| Smartphone | 3,198 | 90.1% |
| Tablet | 2,809 | 79.1% |
| No Computing Device | 93 | 2.6% |
| Total | 3,549 | 100.0% |
Internet Access in Budd Lake
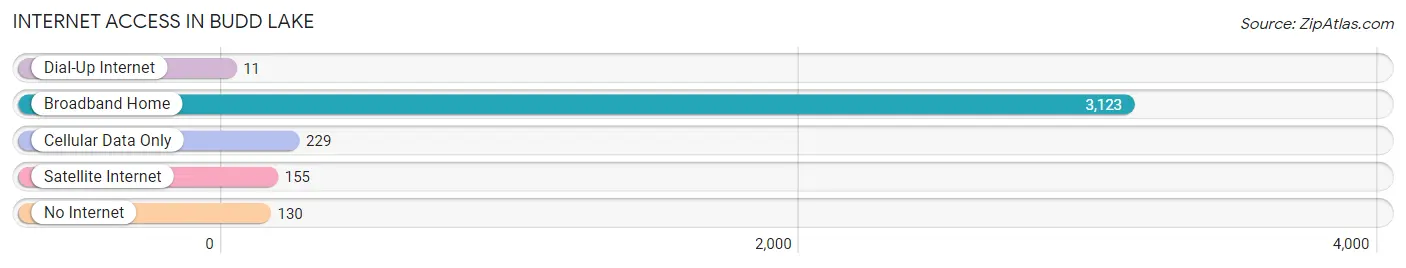
| Internet Type | # Households | % Households |
| Dial-Up Internet | 11 | 0.3% |
| Broadband Home | 3,123 | 88.0% |
| Cellular Data Only | 229 | 6.5% |
| Satellite Internet | 155 | 4.4% |
| No Internet | 130 | 3.7% |
| Total | 3,549 | 100.0% |
Budd Lake Summary
Budd Lake is a small unincorporated community located in Mount Olive Township, Morris County, New Jersey. It is situated in the northern part of the state, approximately 40 miles west of New York City. The community is named after Budd Lake, a natural lake located in the center of the town.
History
The area that is now Budd Lake was originally inhabited by the Lenape Native Americans. The first European settlers arrived in the area in the late 17th century. The first permanent settlement was established in 1740 by John Budd, who purchased land from the Lenape and built a log cabin on the shore of the lake. The lake was then named after him.
In the 19th century, the area began to develop as a farming community. The first school was built in 1820 and the first church was established in 1825. The community was officially incorporated as a township in 1866.
In the early 20th century, the area began to develop as a resort destination. The first hotel was built in 1910 and the first golf course was established in 1912. The area also became a popular destination for fishing and boating.
Geography
Budd Lake is located in the northern part of New Jersey, approximately 40 miles west of New York City. The community is situated in the foothills of the Kittatinny Mountains and is surrounded by rolling hills and forests. The lake itself is approximately 1.5 miles long and 0.5 miles wide.
The climate in Budd Lake is typical of the northeastern United States, with cold winters and warm summers. The average annual temperature is around 50°F (10°C). The average annual precipitation is around 40 inches (101 cm).
Economy
The economy of Budd Lake is largely based on tourism and recreation. The area is a popular destination for fishing, boating, and other outdoor activities. There are several hotels and resorts in the area, as well as several golf courses.
The area is also home to several small businesses, including restaurants, retail stores, and professional services. The largest employer in the area is the Budd Lake School District, which employs over 500 people.
Demographics
As of the 2010 census, the population of Budd Lake was 5,097. The racial makeup of the town was 94.3% White, 1.7% African American, 0.3% Native American, 1.2% Asian, 0.1% Pacific Islander, and 2.4% from other races. Hispanic or Latino of any race were 5.3% of the population.
The median household income in Budd Lake was $76,944, and the median family income was $87,813. The per capita income was $32,945. About 4.2% of families and 5.7% of the population were below the poverty line.
Common Questions
What is Per Capita Income in Budd Lake?
Per Capita income in Budd Lake is $47,099.
What is the Median Family Income in Budd Lake?
Median Family Income in Budd Lake is $114,036.
What is the Median Household income in Budd Lake?
Median Household Income in Budd Lake is $99,303.
What is Income or Wage Gap in Budd Lake?
Income or Wage Gap in Budd Lake is 49.0%.
Women in Budd Lake earn 51.0 cents for every dollar earned by a man.
What is Inequality or Gini Index in Budd Lake?
Inequality or Gini Index in Budd Lake is 0.38.
What is the Total Population of Budd Lake?
Total Population of Budd Lake is 9,983.
What is the Total Male Population of Budd Lake?
Total Male Population of Budd Lake is 5,311.
What is the Total Female Population of Budd Lake?
Total Female Population of Budd Lake is 4,672.
What is the Ratio of Males per 100 Females in Budd Lake?
There are 113.68 Males per 100 Females in Budd Lake.
What is the Ratio of Females per 100 Males in Budd Lake?
There are 87.97 Females per 100 Males in Budd Lake.
What is the Median Population Age in Budd Lake?
Median Population Age in Budd Lake is 37.3 Years.
What is the Average Family Size in Budd Lake
Average Family Size in Budd Lake is 3.1 People.
What is the Average Household Size in Budd Lake
Average Household Size in Budd Lake is 2.8 People.
How Large is the Labor Force in Budd Lake?
There are 5,718 People in the Labor Forcein in Budd Lake.
What is the Percentage of People in the Labor Force in Budd Lake?
75.3% of People are in the Labor Force in Budd Lake.
What is the Unemployment Rate in Budd Lake?
Unemployment Rate in Budd Lake is 5.7%.