Delshire, OH Map & Demographics
Delshire Map
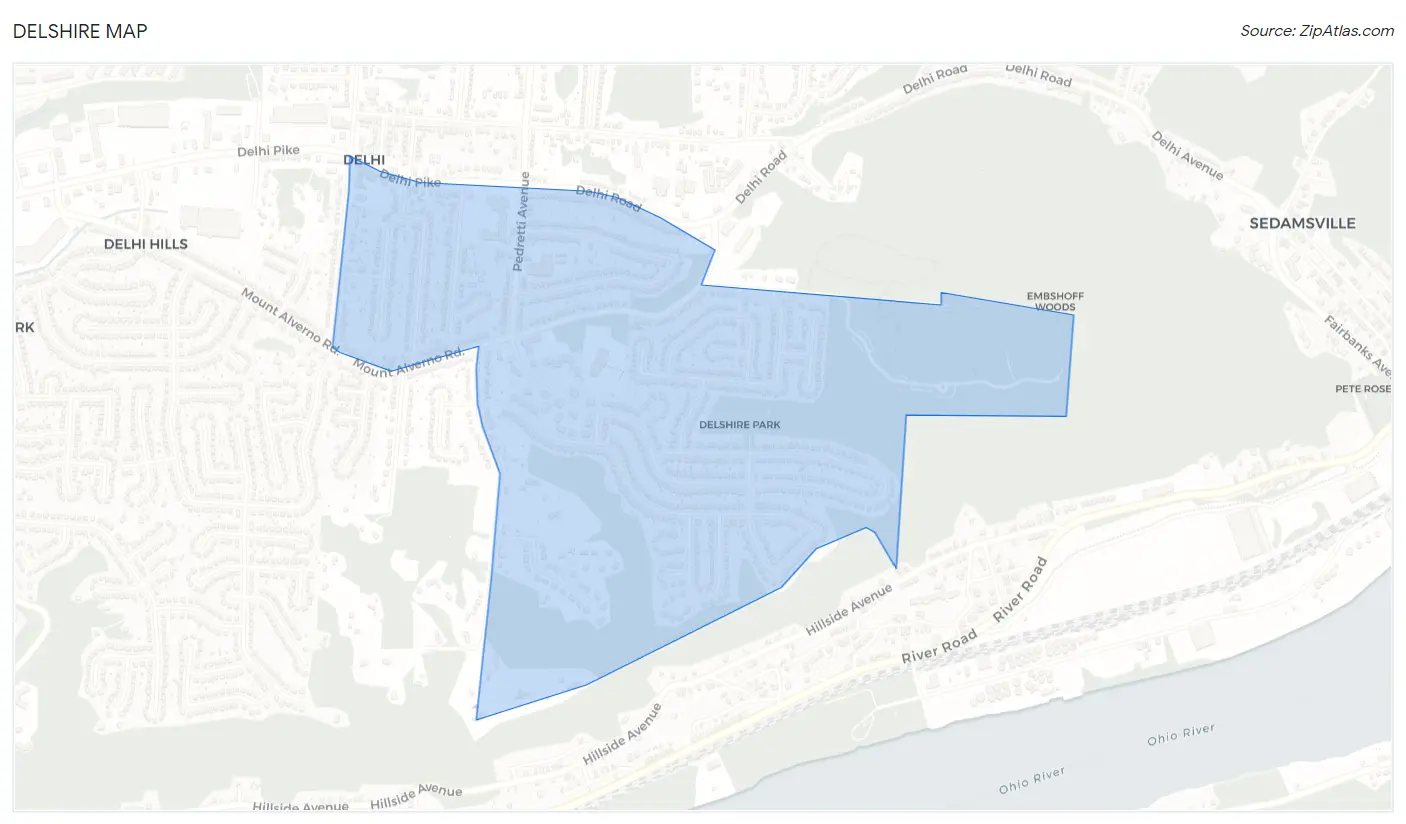
Delshire Overview
$31,315
PER CAPITA INCOME
$63,676
AVG FAMILY INCOME
$73,269
AVG HOUSEHOLD INCOME
14.6%
WAGE / INCOME GAP [ % ]
85.4¢/ $1
WAGE / INCOME GAP [ $ ]
0.40
INEQUALITY / GINI INDEX
3,575
TOTAL POPULATION
1,874
MALE POPULATION
1,701
FEMALE POPULATION
110.17
MALES / 100 FEMALES
90.77
FEMALES / 100 MALES
33.1
MEDIAN AGE
3.1
AVG FAMILY SIZE
2.8
AVG HOUSEHOLD SIZE
1,850
LABOR FORCE [ PEOPLE ]
71.4%
PERCENT IN LABOR FORCE
11.0%
UNEMPLOYMENT RATE
Income in Delshire
Income Overview in Delshire
Per Capita Income in Delshire is $31,315, while median incomes of families and households are $63,676 and $73,269 respectively.
| Characteristic | Number | Measure |
| Per Capita Income | 3,575 | $31,315 |
| Median Family Income | 970 | $63,676 |
| Mean Family Income | 970 | $86,537 |
| Median Household Income | 1,282 | $73,269 |
| Mean Household Income | 1,282 | $87,393 |
| Income Deficit | 970 | $0 |
| Wage / Income Gap (%) | 3,575 | 14.64% |
| Wage / Income Gap ($) | 3,575 | 85.36¢ per $1 |
| Gini / Inequality Index | 3,575 | 0.40 |
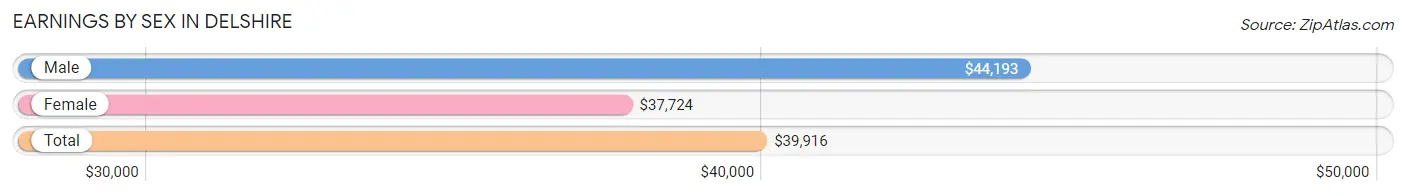
Earnings by Sex in Delshire
Average Earnings in Delshire are $39,916, $44,193 for men and $37,724 for women, a difference of 14.6%.
| Sex | Number | Average Earnings |
| Male | 1,013 (54.0%) | $44,193 |
| Female | 864 (46.0%) | $37,724 |
| Total | 1,877 (100.0%) | $39,916 |
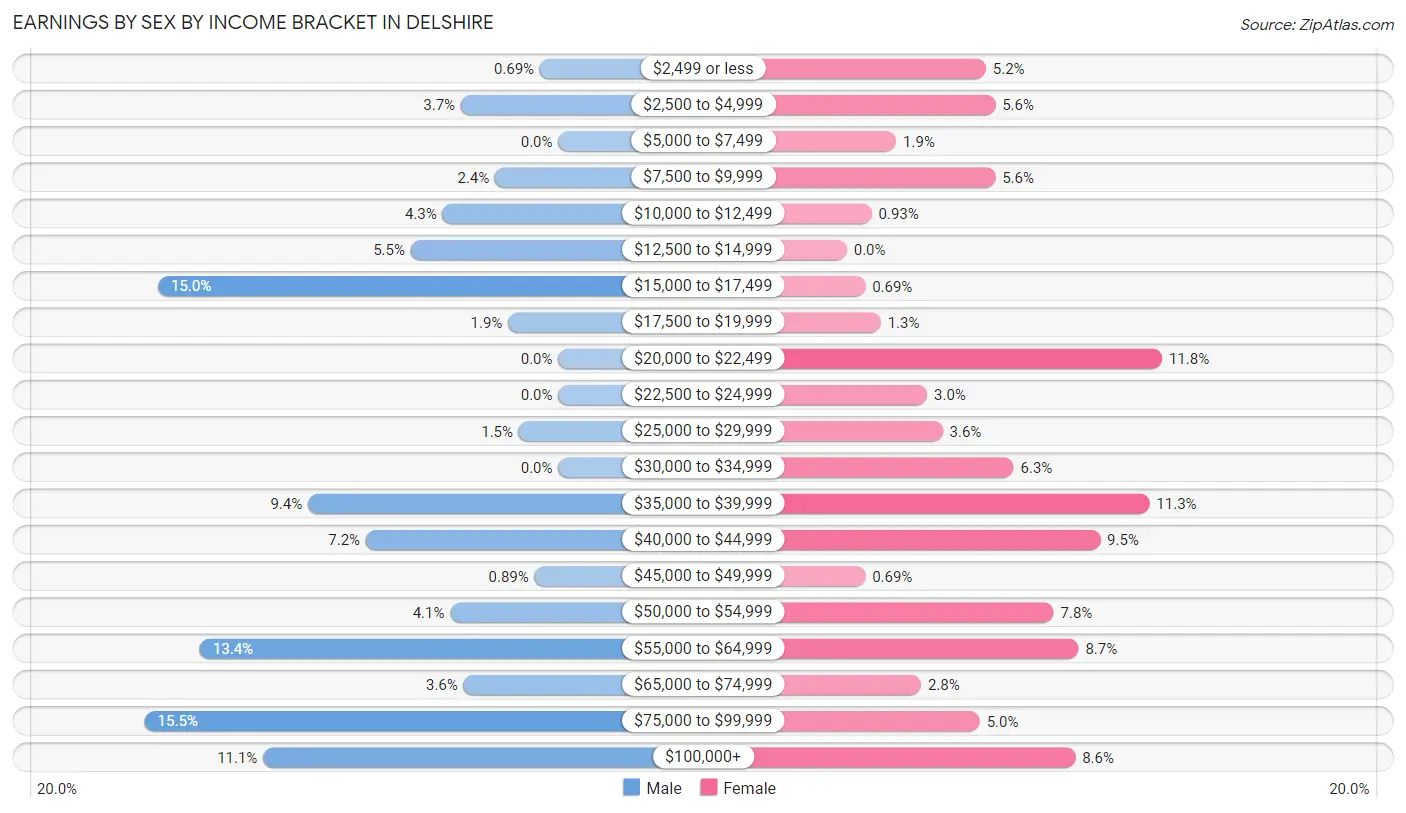
Earnings by Sex by Income Bracket in Delshire
The most common earnings brackets in Delshire are $75,000 to $99,999 for men (157 | 15.5%) and $20,000 to $22,499 for women (102 | 11.8%).
| Income | Male | Female |
| $2,499 or less | 7 (0.7%) | 45 (5.2%) |
| $2,500 to $4,999 | 37 (3.6%) | 48 (5.6%) |
| $5,000 to $7,499 | 0 (0.0%) | 16 (1.8%) |
| $7,500 to $9,999 | 24 (2.4%) | 48 (5.6%) |
| $10,000 to $12,499 | 44 (4.3%) | 8 (0.9%) |
| $12,500 to $14,999 | 56 (5.5%) | 0 (0.0%) |
| $15,000 to $17,499 | 152 (15.0%) | 6 (0.7%) |
| $17,500 to $19,999 | 19 (1.9%) | 11 (1.3%) |
| $20,000 to $22,499 | 0 (0.0%) | 102 (11.8%) |
| $22,500 to $24,999 | 0 (0.0%) | 26 (3.0%) |
| $25,000 to $29,999 | 15 (1.5%) | 31 (3.6%) |
| $30,000 to $34,999 | 0 (0.0%) | 54 (6.2%) |
| $35,000 to $39,999 | 95 (9.4%) | 98 (11.3%) |
| $40,000 to $44,999 | 73 (7.2%) | 82 (9.5%) |
| $45,000 to $49,999 | 9 (0.9%) | 6 (0.7%) |
| $50,000 to $54,999 | 41 (4.1%) | 67 (7.7%) |
| $55,000 to $64,999 | 136 (13.4%) | 75 (8.7%) |
| $65,000 to $74,999 | 36 (3.5%) | 24 (2.8%) |
| $75,000 to $99,999 | 157 (15.5%) | 43 (5.0%) |
| $100,000+ | 112 (11.1%) | 74 (8.6%) |
| Total | 1,013 (100.0%) | 864 (100.0%) |
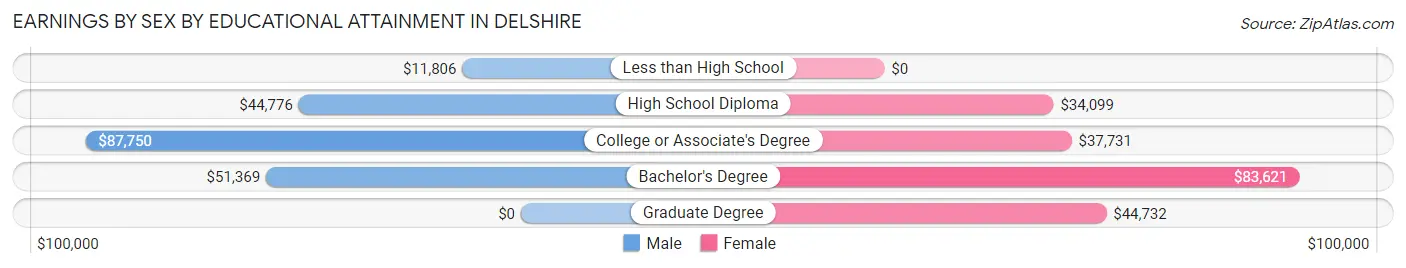
Earnings by Sex by Educational Attainment in Delshire
Average earnings in Delshire are $51,280 for men and $38,657 for women, a difference of 24.6%. Men with an educational attainment of college or associate's degree enjoy the highest average annual earnings of $87,750, while those with less than high school education earn the least with $11,806. Women with an educational attainment of bachelor's degree earn the most with the average annual earnings of $83,621, while those with high school diploma education have the smallest earnings of $34,099.
| Educational Attainment | Male Income | Female Income |
| Less than High School | $11,806 | $0 |
| High School Diploma | $44,776 | $34,099 |
| College or Associate's Degree | $87,750 | $37,731 |
| Bachelor's Degree | $51,369 | $83,621 |
| Graduate Degree | - | - |
| Total | $51,280 | $38,657 |
Family Income in Delshire
Family Income Brackets in Delshire
According to the Delshire family income data, there are 227 families falling into the $50,000 to $74,999 income range, which is the most common income bracket and makes up 23.4% of all families. Conversely, the $25,000 to $34,999 income bracket is the least frequent group with only 13 families (1.3%) belonging to this category.
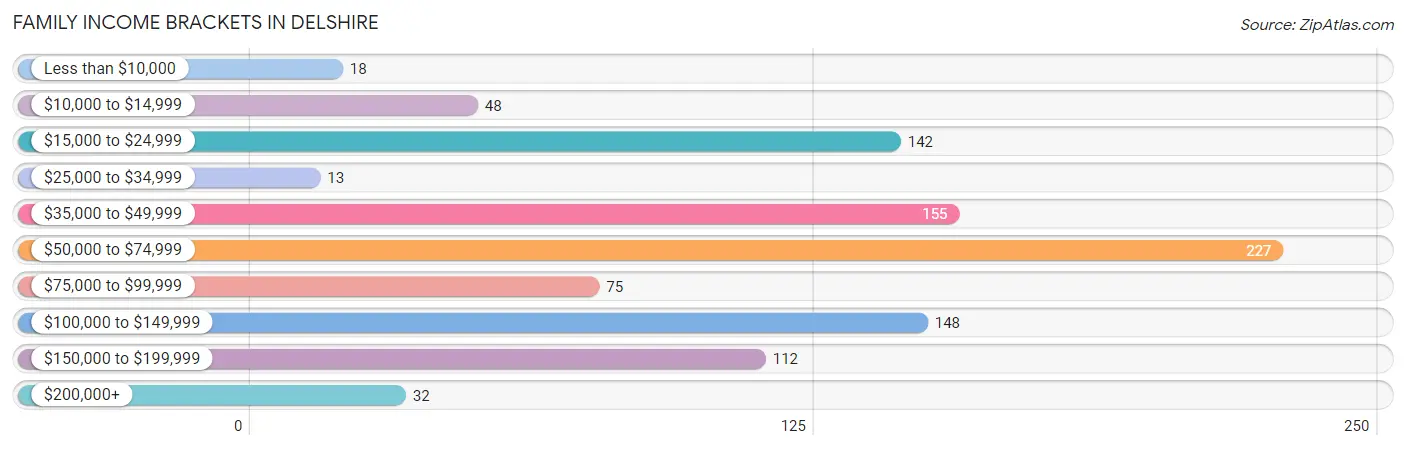
| Income Bracket | # Families | % Families |
| Less than $10,000 | 18 | 1.9% |
| $10,000 to $14,999 | 48 | 4.9% |
| $15,000 to $24,999 | 142 | 14.6% |
| $25,000 to $34,999 | 13 | 1.3% |
| $35,000 to $49,999 | 155 | 16.0% |
| $50,000 to $74,999 | 227 | 23.4% |
| $75,000 to $99,999 | 75 | 7.7% |
| $100,000 to $149,999 | 148 | 15.3% |
| $150,000 to $199,999 | 112 | 11.5% |
| $200,000+ | 32 | 3.3% |
Family Income by Famaliy Size in Delshire
4-person families (234 | 24.1%) account for the highest median family income in Delshire with $145,152 per family, while 4-person families (234 | 24.1%) have the highest median income of $36,288 per family member.
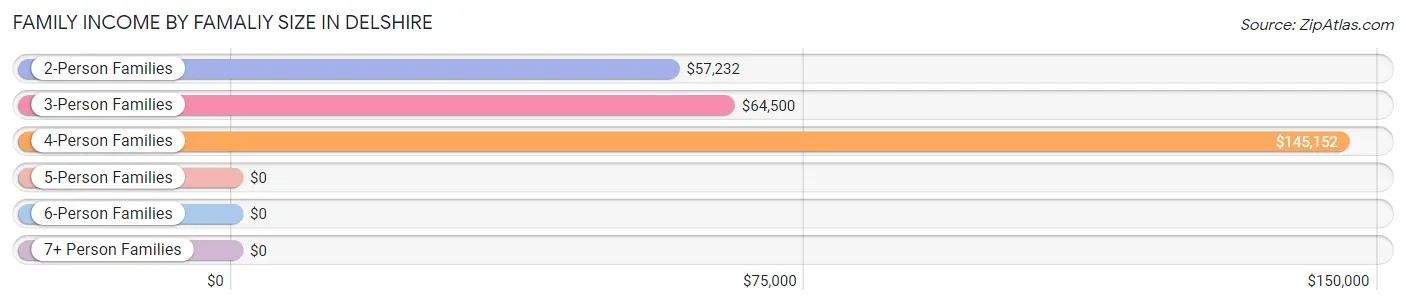
| Income Bracket | # Families | Median Income |
| 2-Person Families | 374 (38.6%) | $57,232 |
| 3-Person Families | 224 (23.1%) | $64,500 |
| 4-Person Families | 234 (24.1%) | $145,152 |
| 5-Person Families | 76 (7.8%) | $0 |
| 6-Person Families | 23 (2.4%) | $0 |
| 7+ Person Families | 39 (4.0%) | $0 |
| Total | 970 (100.0%) | $63,676 |
Family Income by Number of Earners in Delshire
The median family income in Delshire is $63,676, with families comprising 3+ earners (151) having the highest median family income of $170,907, while families with 1 earner (399) have the lowest median family income of $36,343, accounting for 15.6% and 41.1% of families, respectively.
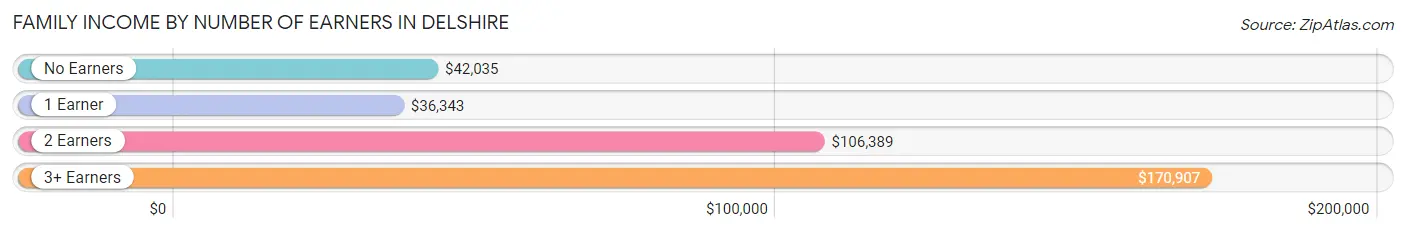
| Number of Earners | # Families | Median Income |
| No Earners | 142 (14.6%) | $42,035 |
| 1 Earner | 399 (41.1%) | $36,343 |
| 2 Earners | 278 (28.7%) | $106,389 |
| 3+ Earners | 151 (15.6%) | $170,907 |
| Total | 970 (100.0%) | $63,676 |
Household Income in Delshire
Household Income Brackets in Delshire
With 297 households falling in the category, the $100,000 to $149,999 income range is the most frequent in Delshire, accounting for 23.2% of all households. In contrast, only 23 households (1.8%) fall into the $25,000 to $34,999 income bracket, making it the least populous group.
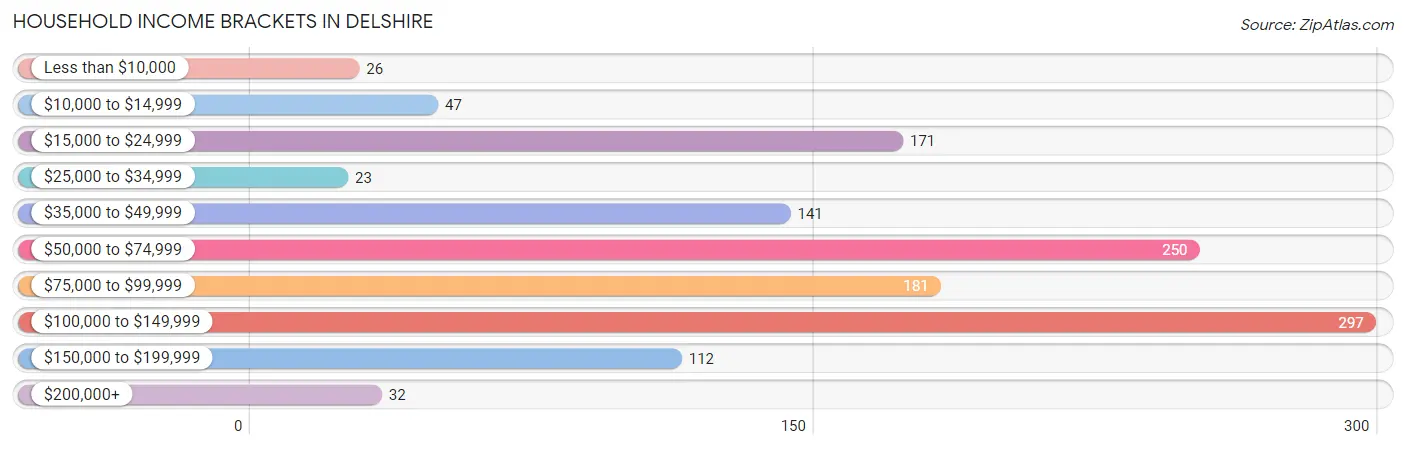
| Income Bracket | # Households | % Households |
| Less than $10,000 | 26 | 2.0% |
| $10,000 to $14,999 | 47 | 3.7% |
| $15,000 to $24,999 | 171 | 13.3% |
| $25,000 to $34,999 | 23 | 1.8% |
| $35,000 to $49,999 | 141 | 11.0% |
| $50,000 to $74,999 | 250 | 19.5% |
| $75,000 to $99,999 | 181 | 14.1% |
| $100,000 to $149,999 | 297 | 23.2% |
| $150,000 to $199,999 | 112 | 8.7% |
| $200,000+ | 32 | 2.5% |
Household Income by Householder Age in Delshire
The median household income in Delshire is $73,269, with the highest median household income of $79,643 found in the 45 to 64 years age bracket for the primary householder. A total of 472 households (36.8%) fall into this category. Meanwhile, the 15 to 24 years age bracket for the primary householder has the lowest median household income of $0, with 106 households (8.3%) in this group.
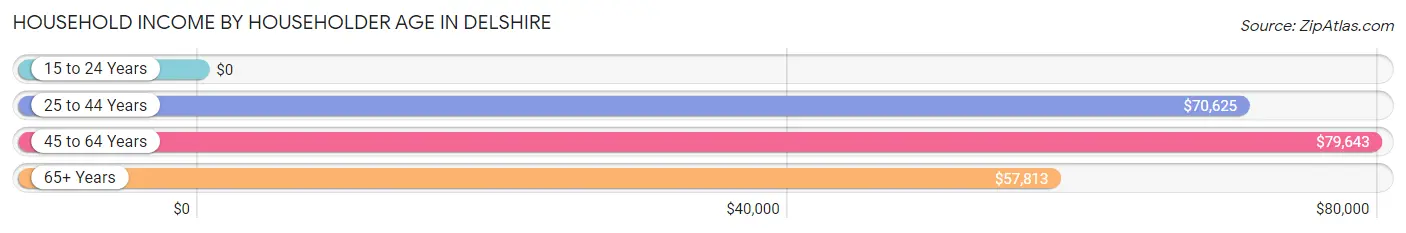
| Income Bracket | # Households | Median Income |
| 15 to 24 Years | 106 (8.3%) | $0 |
| 25 to 44 Years | 399 (31.1%) | $70,625 |
| 45 to 64 Years | 472 (36.8%) | $79,643 |
| 65+ Years | 305 (23.8%) | $57,813 |
| Total | 1,282 (100.0%) | $73,269 |
Poverty in Delshire
Income Below Poverty by Sex and Age in Delshire
With 25.1% poverty level for males and 24.1% for females among the residents of Delshire, under 5 year old males and 18 to 24 year old females are the most vulnerable to poverty, with 117 males (57.9%) and 15 females (62.5%) in their respective age groups living below the poverty level.
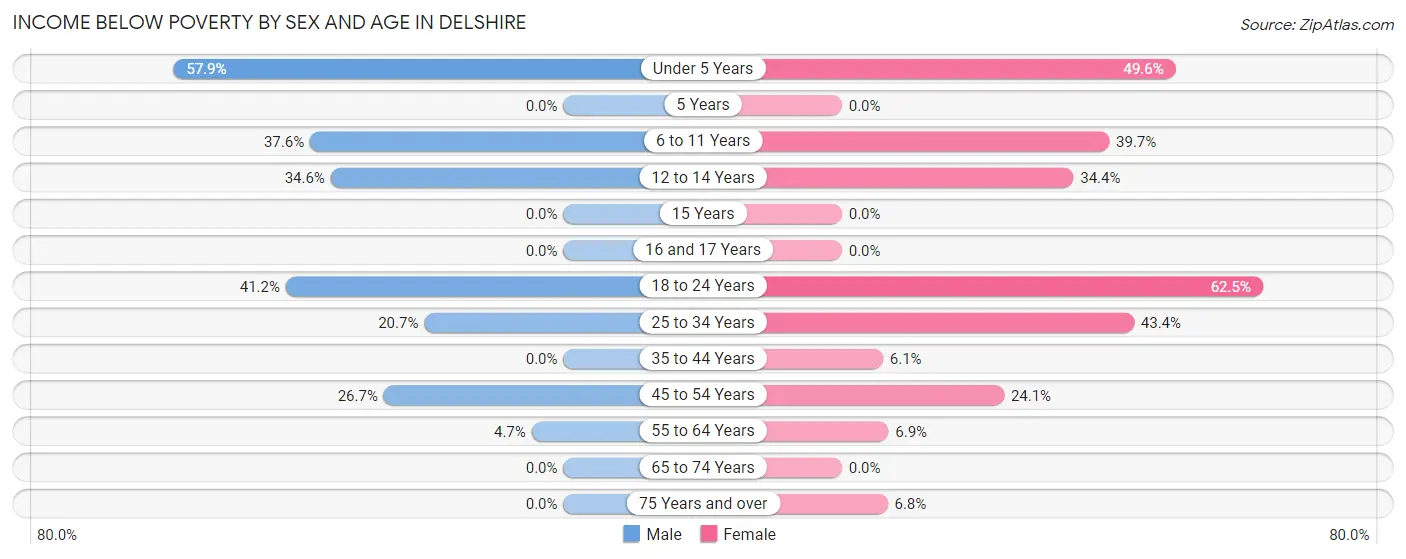
| Age Bracket | Male | Female |
| Under 5 Years | 117 (57.9%) | 55 (49.5%) |
| 5 Years | 0 (0.0%) | 0 (0.0%) |
| 6 to 11 Years | 76 (37.6%) | 77 (39.7%) |
| 12 to 14 Years | 38 (34.5%) | 11 (34.4%) |
| 15 Years | 0 (0.0%) | 0 (0.0%) |
| 16 and 17 Years | 0 (0.0%) | 0 (0.0%) |
| 18 to 24 Years | 129 (41.2%) | 15 (62.5%) |
| 25 to 34 Years | 50 (20.7%) | 157 (43.4%) |
| 35 to 44 Years | 0 (0.0%) | 10 (6.1%) |
| 45 to 54 Years | 52 (26.7%) | 59 (24.1%) |
| 55 to 64 Years | 8 (4.7%) | 13 (6.9%) |
| 65 to 74 Years | 0 (0.0%) | 0 (0.0%) |
| 75 Years and over | 0 (0.0%) | 11 (6.8%) |
| Total | 470 (25.1%) | 408 (24.1%) |
Income Above Poverty by Sex and Age in Delshire
According to the poverty statistics in Delshire, males aged 5 years and females aged 5 years are the age groups that are most secure financially, with 100.0% of males and 100.0% of females in these age groups living above the poverty line.
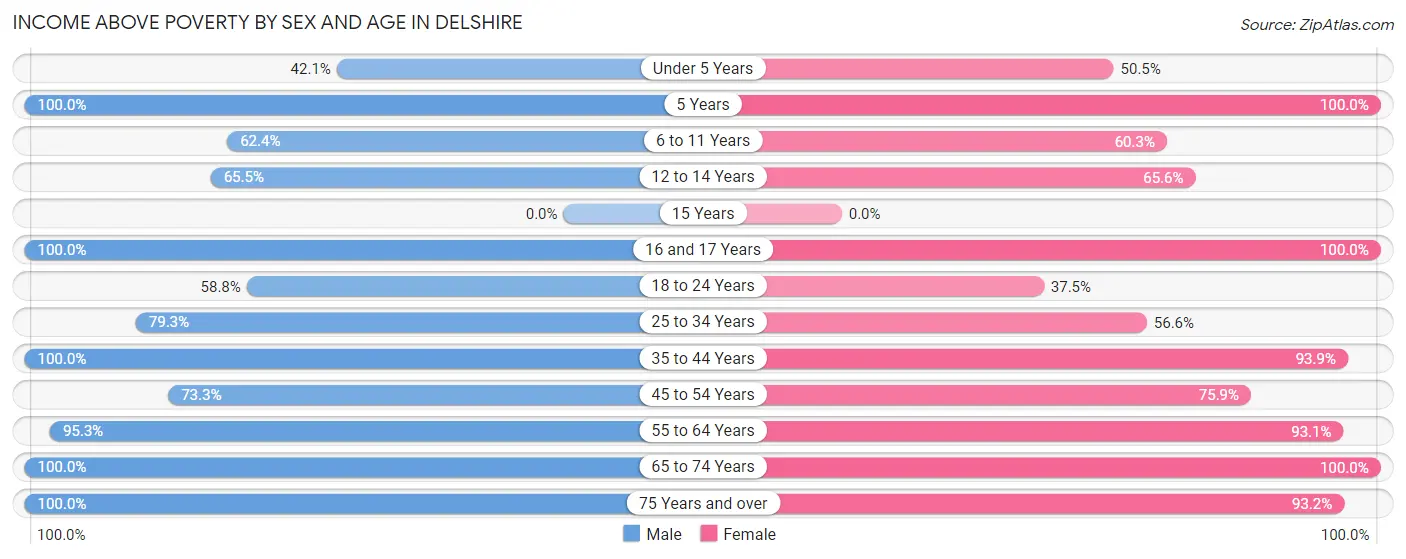
| Age Bracket | Male | Female |
| Under 5 Years | 85 (42.1%) | 56 (50.4%) |
| 5 Years | 64 (100.0%) | 59 (100.0%) |
| 6 to 11 Years | 126 (62.4%) | 117 (60.3%) |
| 12 to 14 Years | 72 (65.4%) | 21 (65.6%) |
| 15 Years | 0 (0.0%) | 0 (0.0%) |
| 16 and 17 Years | 19 (100.0%) | 50 (100.0%) |
| 18 to 24 Years | 184 (58.8%) | 9 (37.5%) |
| 25 to 34 Years | 192 (79.3%) | 205 (56.6%) |
| 35 to 44 Years | 148 (100.0%) | 154 (93.9%) |
| 45 to 54 Years | 143 (73.3%) | 186 (75.9%) |
| 55 to 64 Years | 162 (95.3%) | 175 (93.1%) |
| 65 to 74 Years | 100 (100.0%) | 100 (100.0%) |
| 75 Years and over | 109 (100.0%) | 151 (93.2%) |
| Total | 1,404 (74.9%) | 1,283 (75.9%) |
Income Below Poverty Among Married-Couple Families in Delshire
The poverty statistics for married-couple families in Delshire show that 10.7% or 75 of the total 700 families live below the poverty line. Families with 5 or more children have the highest poverty rate of 100.0%, comprising of 39 families. On the other hand, families with no children have the lowest poverty rate of 0.0%, which includes 0 families.
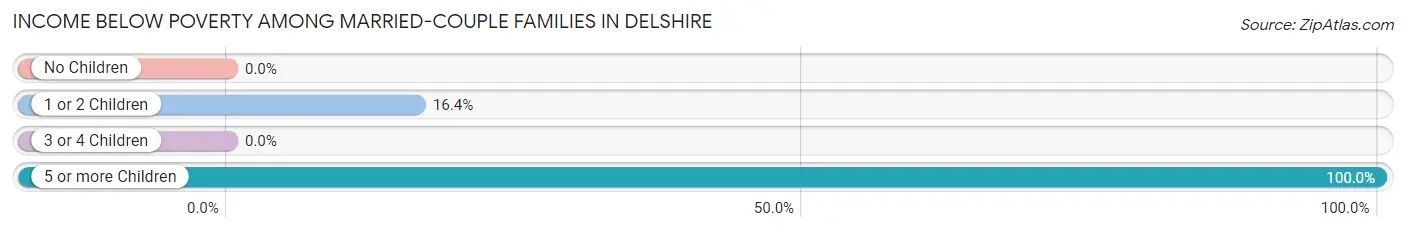
| Children | Above Poverty | Below Poverty |
| No Children | 388 (100.0%) | 0 (0.0%) |
| 1 or 2 Children | 184 (83.6%) | 36 (16.4%) |
| 3 or 4 Children | 53 (100.0%) | 0 (0.0%) |
| 5 or more Children | 0 (0.0%) | 39 (100.0%) |
| Total | 625 (89.3%) | 75 (10.7%) |
Income Below Poverty Among Single-Parent Households in Delshire
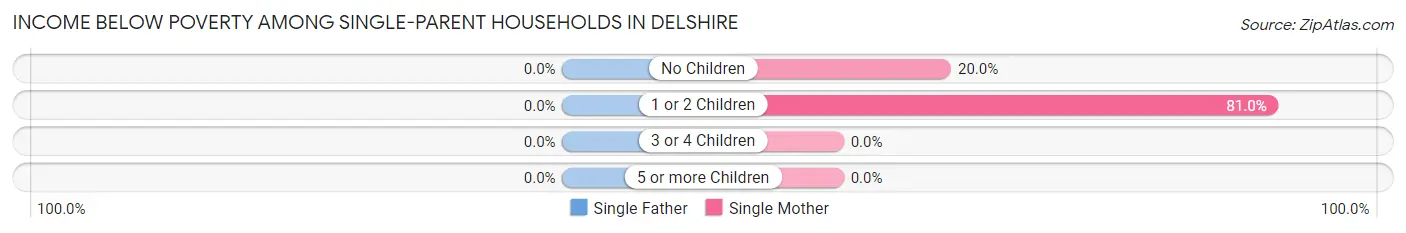
| Children | Single Father | Single Mother |
| No Children | 0 (0.0%) | 11 (20.0%) |
| 1 or 2 Children | 0 (0.0%) | 111 (81.0%) |
| 3 or 4 Children | 0 (0.0%) | 0 (0.0%) |
| 5 or more Children | 0 (0.0%) | 0 (0.0%) |
| Total | 0 (0.0%) | 122 (52.6%) |
Income Below Poverty Among Married-Couple vs Single-Parent Households in Delshire
The poverty data for Delshire shows that 75 of the married-couple family households (10.7%) and 122 of the single-parent households (45.2%) are living below the poverty level. Within the married-couple family households, those with 5 or more children have the highest poverty rate, with 39 households (100.0%) falling below the poverty line. Among the single-parent households, those with 1 or 2 children have the highest poverty rate, with 111 household (76.5%) living below poverty.
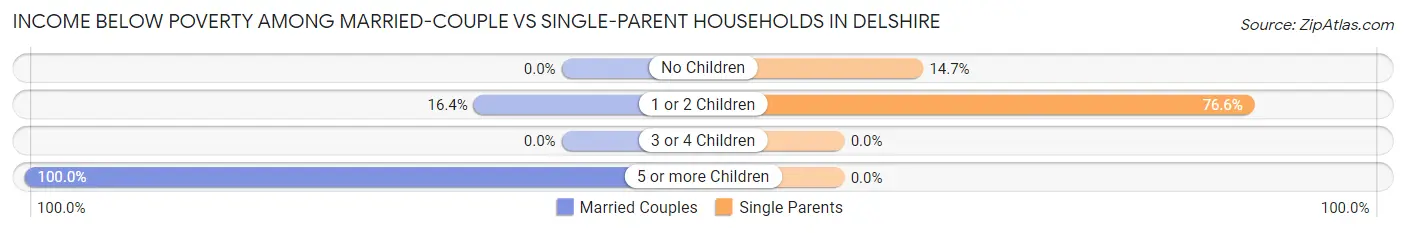
| Children | Married-Couple Families | Single-Parent Households |
| No Children | 0 (0.0%) | 11 (14.7%) |
| 1 or 2 Children | 36 (16.4%) | 111 (76.5%) |
| 3 or 4 Children | 0 (0.0%) | 0 (0.0%) |
| 5 or more Children | 39 (100.0%) | 0 (0.0%) |
| Total | 75 (10.7%) | 122 (45.2%) |
Race in Delshire
The most populous races in Delshire are White / Caucasian (2,605 | 72.9%), Black / African American (579 | 16.2%), and Asian (189 | 5.3%).
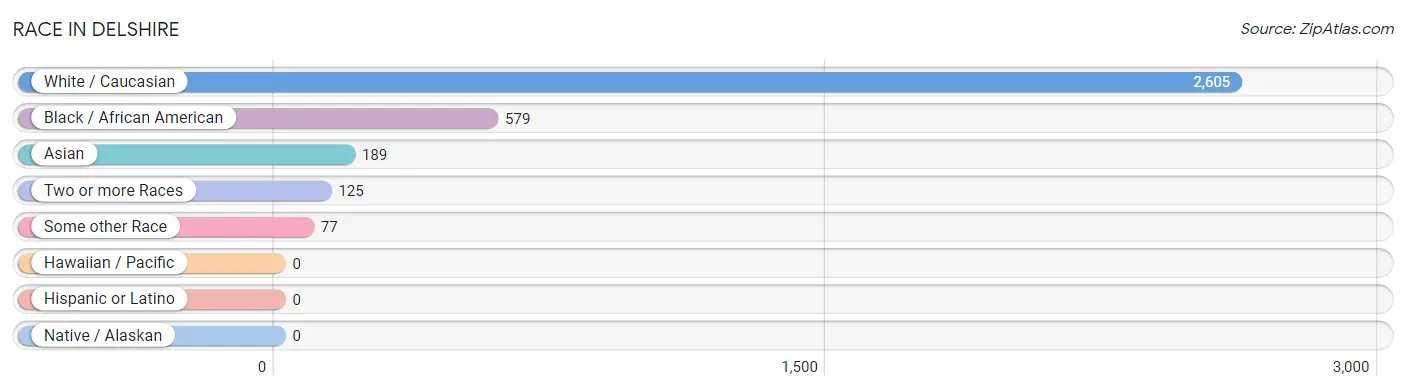
| Race | # Population | % Population |
| Asian | 189 | 5.3% |
| Black / African American | 579 | 16.2% |
| Hawaiian / Pacific | 0 | 0.0% |
| Hispanic or Latino | 0 | 0.0% |
| Native / Alaskan | 0 | 0.0% |
| White / Caucasian | 2,605 | 72.9% |
| Two or more Races | 125 | 3.5% |
| Some other Race | 77 | 2.1% |
| Total | 3,575 | 100.0% |
Ancestry in Delshire
The most populous ancestries reported in Delshire are German (1,129 | 31.6%), Irish (708 | 19.8%), Subsaharan African (376 | 10.5%), English (309 | 8.6%), and Ghanaian (258 | 7.2%), together accounting for 77.8% of all Delshire residents.
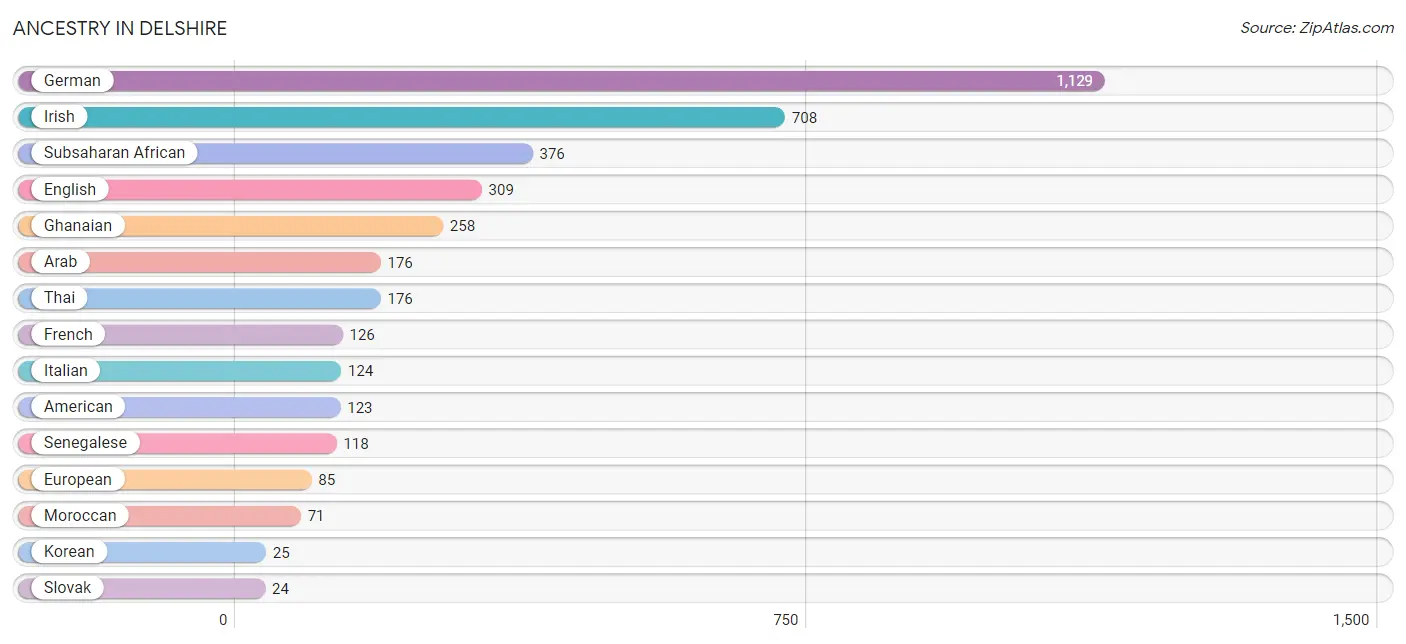
| Ancestry | # Population | % Population |
| American | 123 | 3.4% |
| Arab | 176 | 4.9% |
| Brazilian | 10 | 0.3% |
| British | 7 | 0.2% |
| Cherokee | 8 | 0.2% |
| Danish | 6 | 0.2% |
| Dutch | 11 | 0.3% |
| English | 309 | 8.6% |
| European | 85 | 2.4% |
| French | 126 | 3.5% |
| German | 1,129 | 31.6% |
| Ghanaian | 258 | 7.2% |
| Greek | 14 | 0.4% |
| Hungarian | 15 | 0.4% |
| Irish | 708 | 19.8% |
| Italian | 124 | 3.5% |
| Korean | 25 | 0.7% |
| Moroccan | 71 | 2.0% |
| Russian | 8 | 0.2% |
| Scottish | 15 | 0.4% |
| Senegalese | 118 | 3.3% |
| Slovak | 24 | 0.7% |
| Subsaharan African | 376 | 10.5% |
| Thai | 176 | 4.9% |
| Welsh | 7 | 0.2% |
| Yugoslavian | 11 | 0.3% | View All 26 Rows |
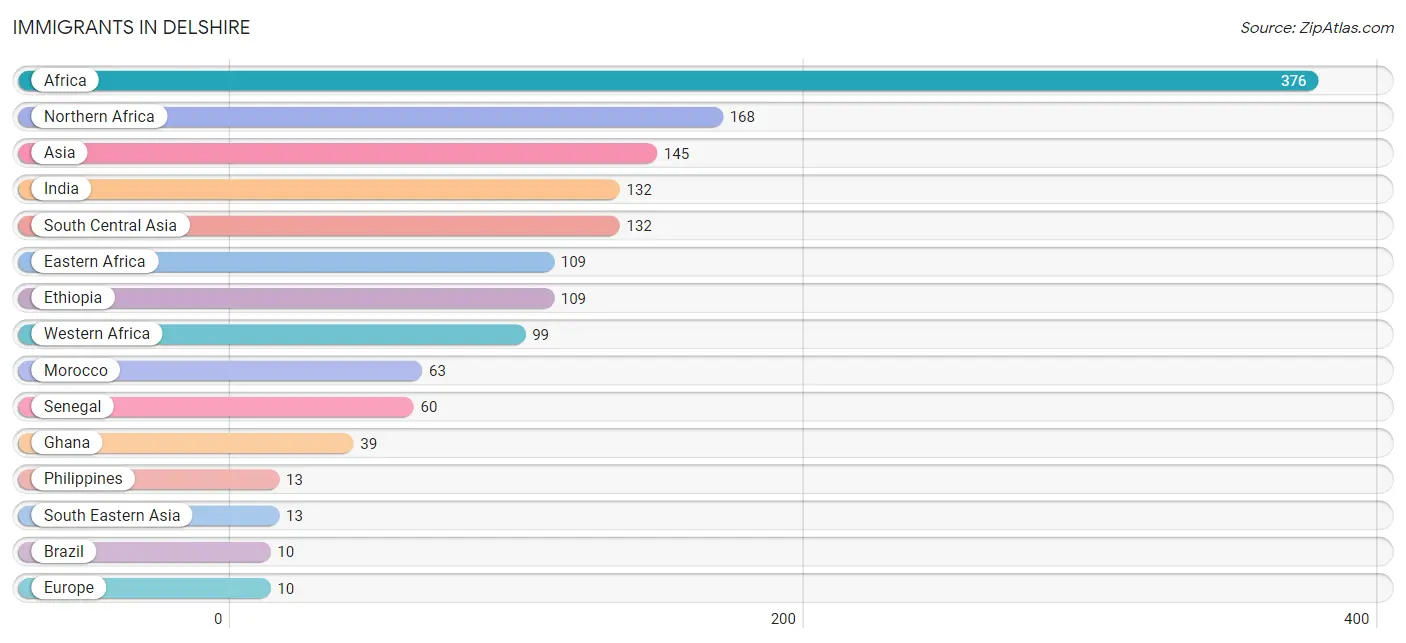
Immigrants in Delshire
The most numerous immigrant groups reported in Delshire came from Africa (376 | 10.5%), Northern Africa (168 | 4.7%), Asia (145 | 4.1%), India (132 | 3.7%), and South Central Asia (132 | 3.7%), together accounting for 26.7% of all Delshire residents.
| Immigration Origin | # Population | % Population |
| Africa | 376 | 10.5% |
| Asia | 145 | 4.1% |
| Brazil | 10 | 0.3% |
| Eastern Africa | 109 | 3.0% |
| Ethiopia | 109 | 3.0% |
| Europe | 10 | 0.3% |
| France | 10 | 0.3% |
| Ghana | 39 | 1.1% |
| India | 132 | 3.7% |
| Latin America | 10 | 0.3% |
| Morocco | 63 | 1.8% |
| Northern Africa | 168 | 4.7% |
| Philippines | 13 | 0.4% |
| Senegal | 60 | 1.7% |
| South America | 10 | 0.3% |
| South Central Asia | 132 | 3.7% |
| South Eastern Asia | 13 | 0.4% |
| Western Africa | 99 | 2.8% |
| Western Europe | 10 | 0.3% | View All 19 Rows |
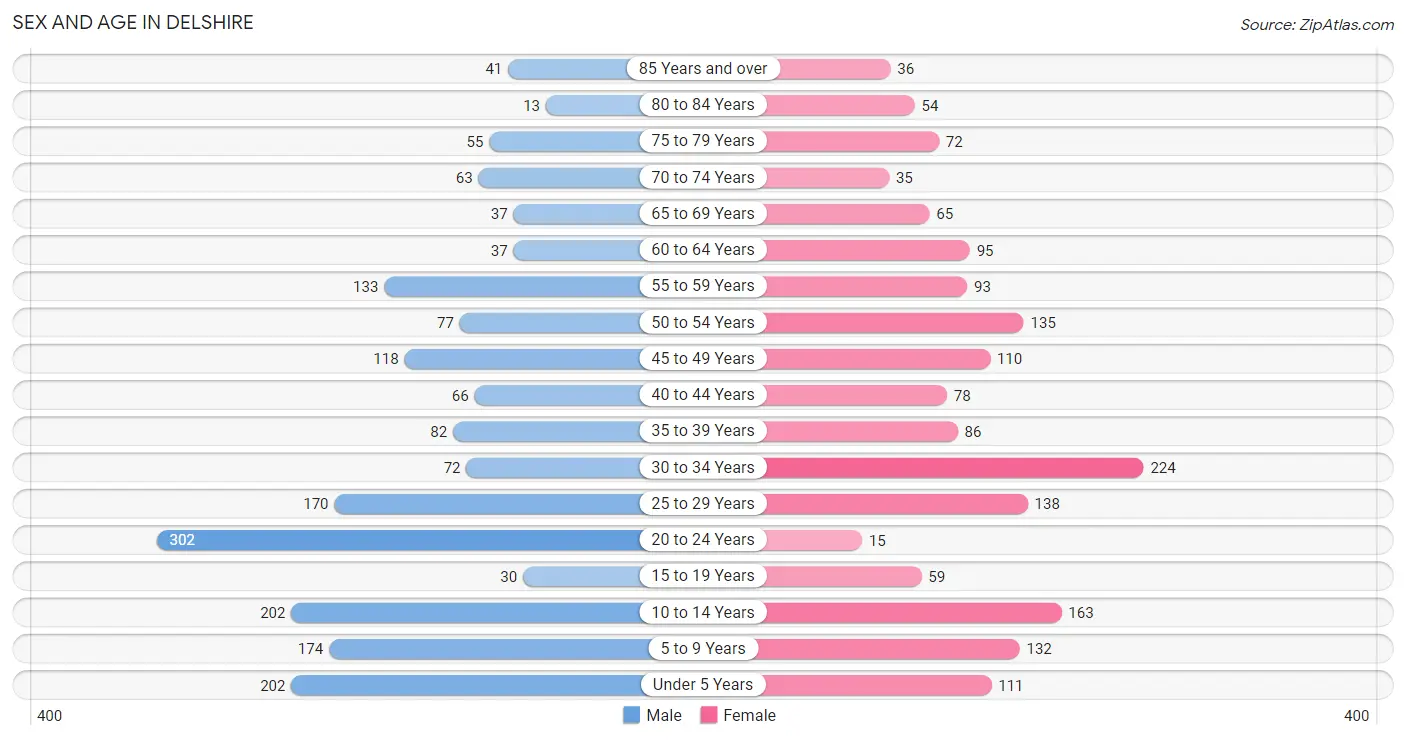
Sex and Age in Delshire
Sex and Age in Delshire
The most populous age groups in Delshire are 20 to 24 Years (302 | 16.1%) for men and 30 to 34 Years (224 | 13.2%) for women.
| Age Bracket | Male | Female |
| Under 5 Years | 202 (10.8%) | 111 (6.5%) |
| 5 to 9 Years | 174 (9.3%) | 132 (7.8%) |
| 10 to 14 Years | 202 (10.8%) | 163 (9.6%) |
| 15 to 19 Years | 30 (1.6%) | 59 (3.5%) |
| 20 to 24 Years | 302 (16.1%) | 15 (0.9%) |
| 25 to 29 Years | 170 (9.1%) | 138 (8.1%) |
| 30 to 34 Years | 72 (3.8%) | 224 (13.2%) |
| 35 to 39 Years | 82 (4.4%) | 86 (5.1%) |
| 40 to 44 Years | 66 (3.5%) | 78 (4.6%) |
| 45 to 49 Years | 118 (6.3%) | 110 (6.5%) |
| 50 to 54 Years | 77 (4.1%) | 135 (7.9%) |
| 55 to 59 Years | 133 (7.1%) | 93 (5.5%) |
| 60 to 64 Years | 37 (2.0%) | 95 (5.6%) |
| 65 to 69 Years | 37 (2.0%) | 65 (3.8%) |
| 70 to 74 Years | 63 (3.4%) | 35 (2.1%) |
| 75 to 79 Years | 55 (2.9%) | 72 (4.2%) |
| 80 to 84 Years | 13 (0.7%) | 54 (3.2%) |
| 85 Years and over | 41 (2.2%) | 36 (2.1%) |
| Total | 1,874 (100.0%) | 1,701 (100.0%) |
Families and Households in Delshire
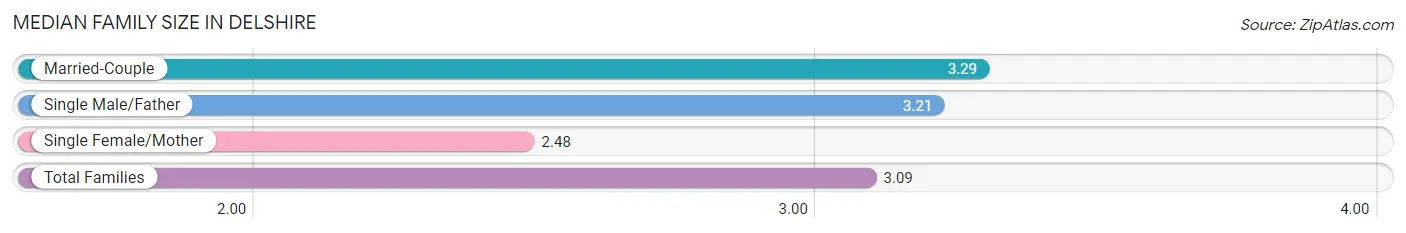
Median Family Size in Delshire
The median family size in Delshire is 3.09 persons per family, with married-couple families (700 | 72.2%) accounting for the largest median family size of 3.29 persons per family. On the other hand, single female/mother families (232 | 23.9%) represent the smallest median family size with 2.48 persons per family.
| Family Type | # Families | Family Size |
| Married-Couple | 700 (72.2%) | 3.29 |
| Single Male/Father | 38 (3.9%) | 3.21 |
| Single Female/Mother | 232 (23.9%) | 2.48 |
| Total Families | 970 (100.0%) | 3.09 |
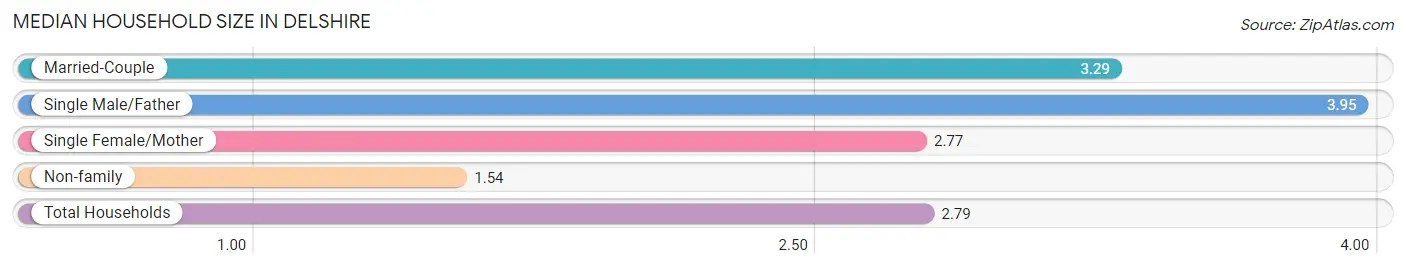
Median Household Size in Delshire
The median household size in Delshire is 2.79 persons per household, with single male/father households (38 | 3.0%) accounting for the largest median household size of 3.95 persons per household. non-family households (312 | 24.3%) represent the smallest median household size with 1.54 persons per household.
| Household Type | # Households | Household Size |
| Married-Couple | 700 (54.6%) | 3.29 |
| Single Male/Father | 38 (3.0%) | 3.95 |
| Single Female/Mother | 232 (18.1%) | 2.77 |
| Non-family | 312 (24.3%) | 1.54 |
| Total Households | 1,282 (100.0%) | 2.79 |
Household Size by Marriage Status in Delshire
Out of a total of 1,282 households in Delshire, 970 (75.7%) are family households, while 312 (24.3%) are nonfamily households. The most numerous type of family households are 2-person households, comprising 355, and the most common type of nonfamily households are 1-person households, comprising 170.
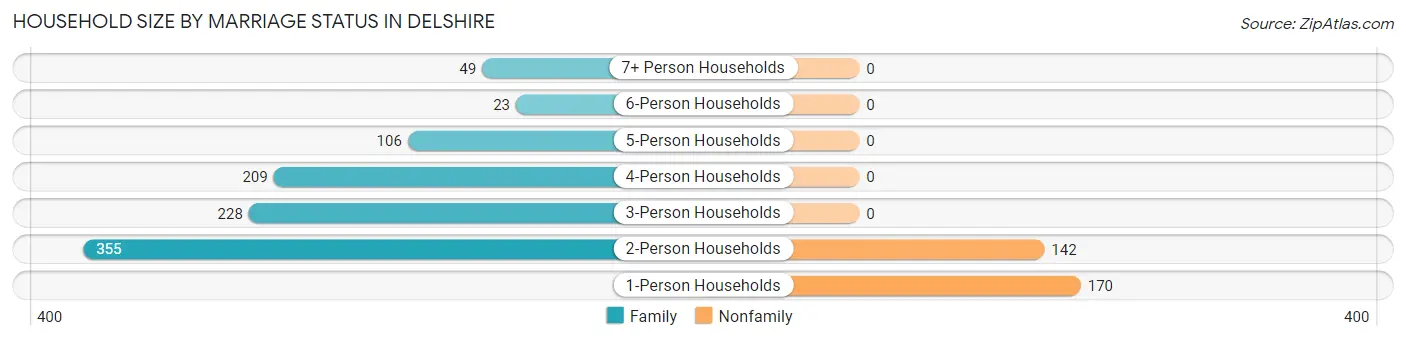
| Household Size | Family Households | Nonfamily Households |
| 1-Person Households | - | 170 (13.3%) |
| 2-Person Households | 355 (27.7%) | 142 (11.1%) |
| 3-Person Households | 228 (17.8%) | 0 (0.0%) |
| 4-Person Households | 209 (16.3%) | 0 (0.0%) |
| 5-Person Households | 106 (8.3%) | 0 (0.0%) |
| 6-Person Households | 23 (1.8%) | 0 (0.0%) |
| 7+ Person Households | 49 (3.8%) | 0 (0.0%) |
| Total | 970 (75.7%) | 312 (24.3%) |
Female Fertility in Delshire
Fertility by Age in Delshire
Average fertility rate in Delshire is 173.0 births per 1,000 women. Women in the age bracket of 20 to 34 years have the highest fertility rate with 326.0 births per 1,000 women. Women in the age bracket of 20 to 34 years acount for 100.0% of all women with births.
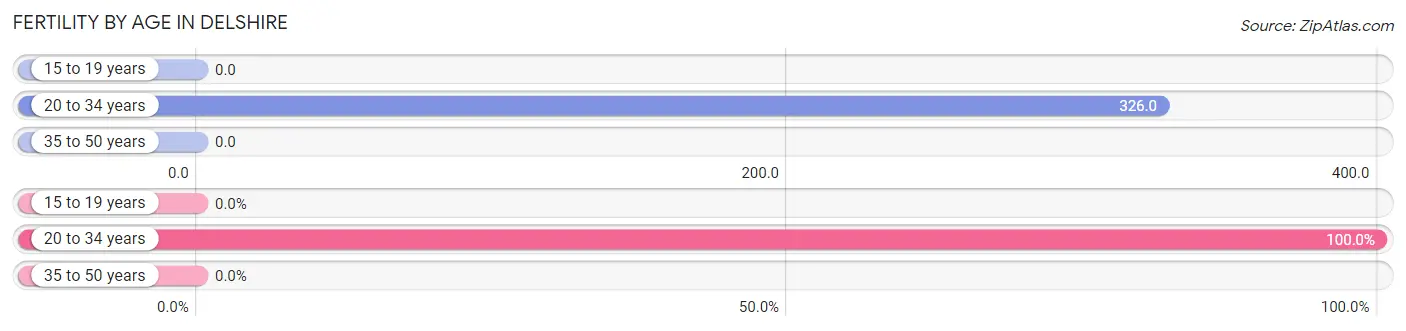
| Age Bracket | Women with Births | Births / 1,000 Women |
| 15 to 19 years | 0 (0.0%) | 0.0 |
| 20 to 34 years | 123 (100.0%) | 326.0 |
| 35 to 50 years | 0 (0.0%) | 0.0 |
| Total | 123 (100.0%) | 173.0 |
Fertility by Age by Marriage Status in Delshire
81.3% of women with births (123) in Delshire are married. The highest percentage of unmarried women with births falls into 20 to 34 years age bracket with 18.7% of them unmarried at the time of birth, while the lowest percentage of unmarried women with births belong to 20 to 34 years age bracket with 18.7% of them unmarried.
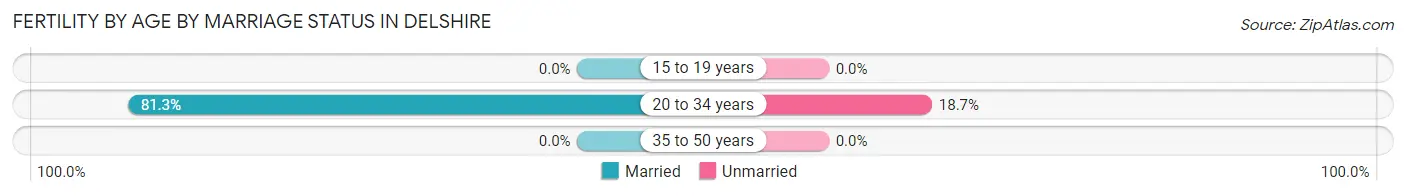
| Age Bracket | Married | Unmarried |
| 15 to 19 years | 0 (0.0%) | 0 (0.0%) |
| 20 to 34 years | 100 (81.3%) | 23 (18.7%) |
| 35 to 50 years | 0 (0.0%) | 0 (0.0%) |
| Total | 100 (81.3%) | 23 (18.7%) |
Fertility by Education in Delshire
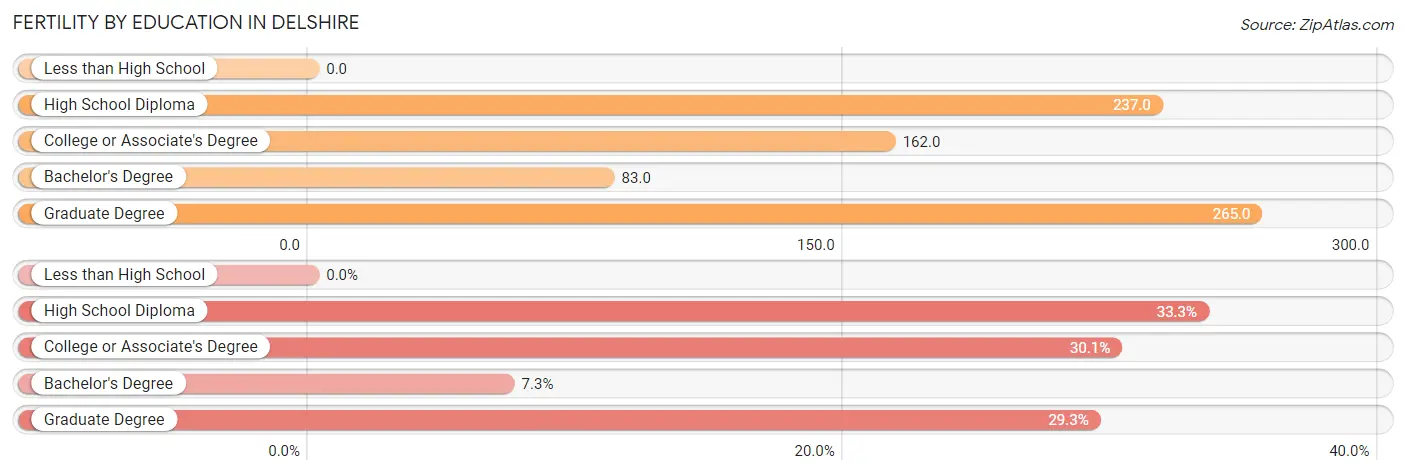
| Educational Attainment | Women with Births | Births / 1,000 Women |
| Less than High School | 0 (0.0%) | 0.0 |
| High School Diploma | 41 (33.3%) | 237.0 |
| College or Associate's Degree | 37 (30.1%) | 162.0 |
| Bachelor's Degree | 9 (7.3%) | 83.0 |
| Graduate Degree | 36 (29.3%) | 265.0 |
| Total | 123 (100.0%) | 173.0 |
Fertility by Education by Marriage Status in Delshire
18.7% of women with births in Delshire are unmarried. Women with the educational attainment of bachelor's degree are most likely to be married with 100.0% of them married at childbirth, while women with the educational attainment of high school diploma are least likely to be married with 36.6% of them unmarried at childbirth.
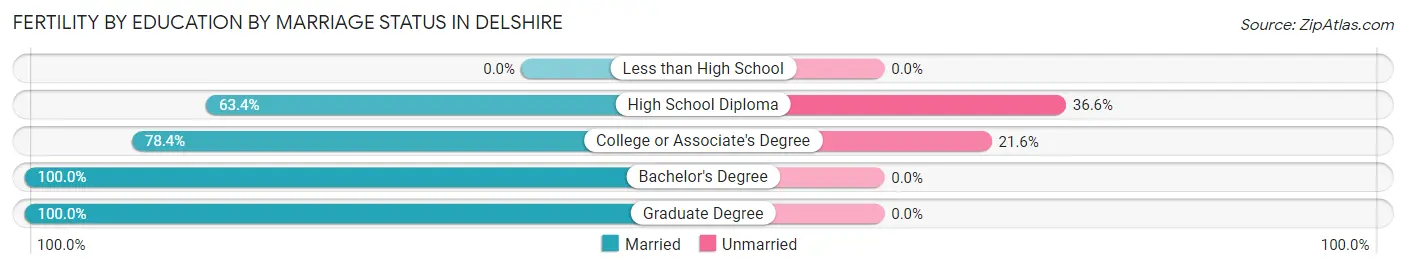
| Educational Attainment | Married | Unmarried |
| Less than High School | 0 (0.0%) | 0 (0.0%) |
| High School Diploma | 26 (63.4%) | 15 (36.6%) |
| College or Associate's Degree | 29 (78.4%) | 8 (21.6%) |
| Bachelor's Degree | 9 (100.0%) | 0 (0.0%) |
| Graduate Degree | 36 (100.0%) | 0 (0.0%) |
| Total | 100 (81.3%) | 23 (18.7%) |
Employment Characteristics in Delshire
Employment by Class of Employer in Delshire
Among the 1,533 employed individuals in Delshire, private company employees (1,114 | 72.7%), not-for-profit organizations (101 | 6.6%), and local government employees (100 | 6.5%) make up the most common classes of employment.
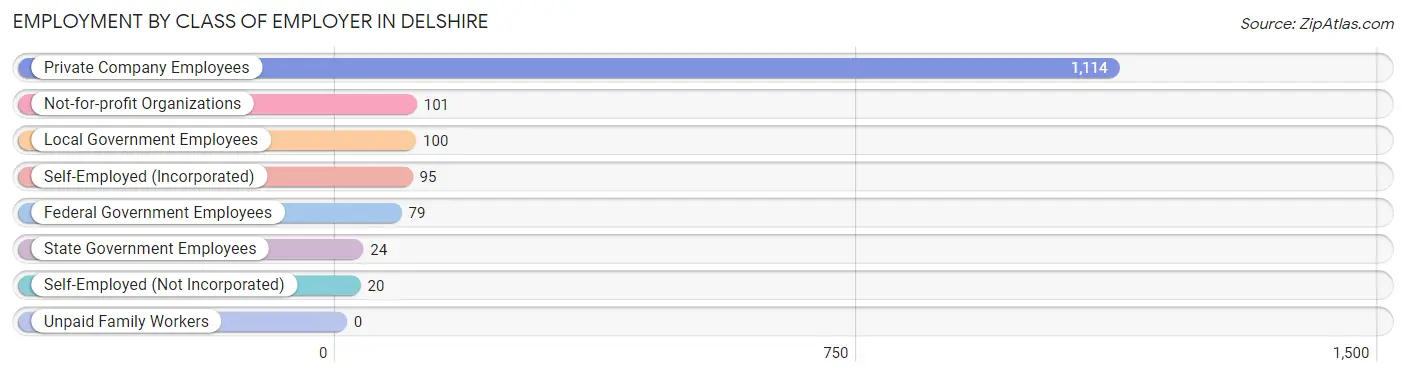
| Employer Class | # Employees | % Employees |
| Private Company Employees | 1,114 | 72.7% |
| Self-Employed (Incorporated) | 95 | 6.2% |
| Self-Employed (Not Incorporated) | 20 | 1.3% |
| Not-for-profit Organizations | 101 | 6.6% |
| Local Government Employees | 100 | 6.5% |
| State Government Employees | 24 | 1.6% |
| Federal Government Employees | 79 | 5.1% |
| Unpaid Family Workers | 0 | 0.0% |
| Total | 1,533 | 100.0% |
Employment Status by Age in Delshire
According to the labor force statistics for Delshire, out of the total population over 16 years of age (2,591), 71.4% or 1,850 individuals are in the labor force, with 11.0% or 204 of them unemployed. The age group with the highest labor force participation rate is 20 to 24 years, with 92.1% or 292 individuals in the labor force. Within the labor force, the 20 to 24 years age range has the highest percentage of unemployed individuals, with 44.2% or 129 of them being unemployed.
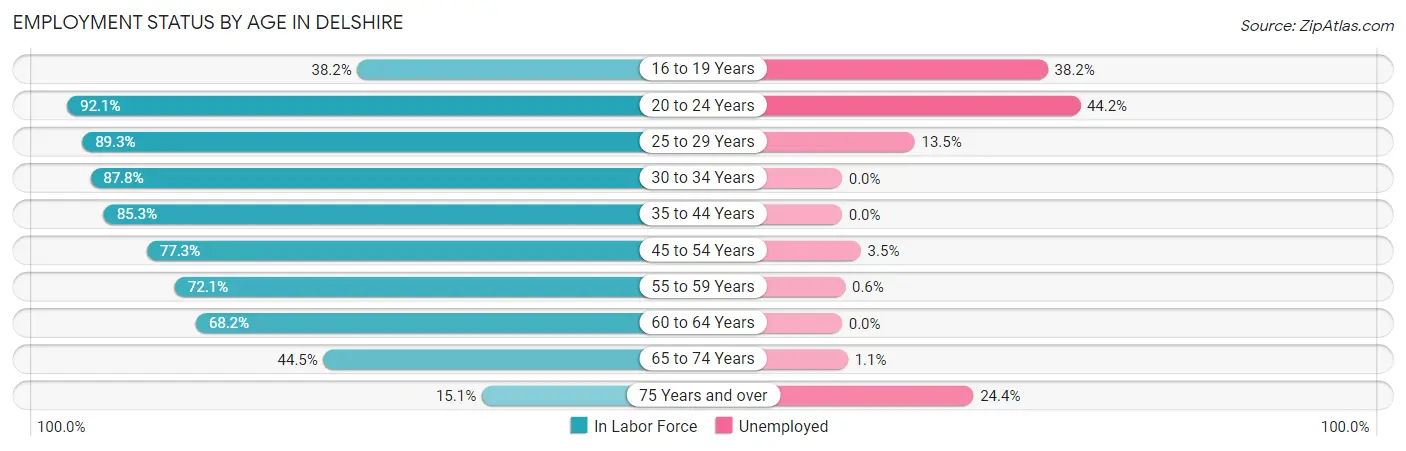
| Age Bracket | In Labor Force | Unemployed |
| 16 to 19 Years | 34 (38.2%) | 13 (38.2%) |
| 20 to 24 Years | 292 (92.1%) | 129 (44.2%) |
| 25 to 29 Years | 275 (89.3%) | 37 (13.5%) |
| 30 to 34 Years | 260 (87.8%) | 0 (0.0%) |
| 35 to 44 Years | 266 (85.3%) | 0 (0.0%) |
| 45 to 54 Years | 340 (77.3%) | 12 (3.5%) |
| 55 to 59 Years | 163 (72.1%) | 1 (0.6%) |
| 60 to 64 Years | 90 (68.2%) | 0 (0.0%) |
| 65 to 74 Years | 89 (44.5%) | 1 (1.1%) |
| 75 Years and over | 41 (15.1%) | 10 (24.4%) |
| Total | 1,850 (71.4%) | 204 (11.0%) |
Employment Status by Educational Attainment in Delshire
According to labor force statistics for Delshire, 81.3% of individuals (1,393) out of the total population between 25 and 64 years of age (1,714) are in the labor force, with 3.6% or 50 of them being unemployed. The group with the highest labor force participation rate are those with the educational attainment of college / associate degree, with 86.8% or 401 individuals in the labor force. Within the labor force, individuals with high school diploma education have the highest percentage of unemployment, with 7.7% or 38 of them being unemployed.
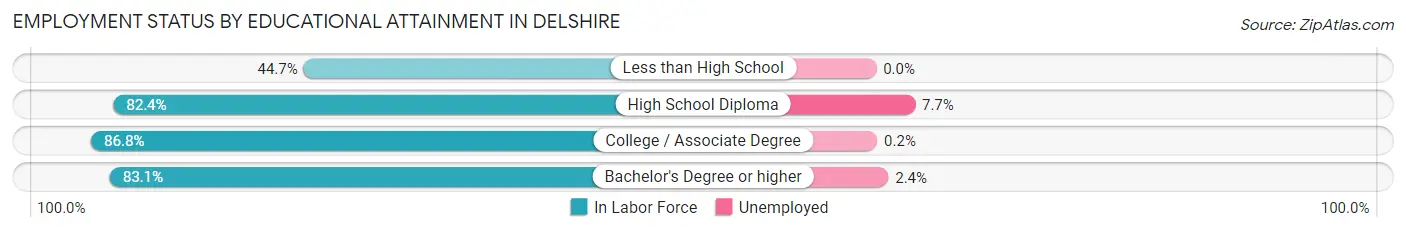
| Educational Attainment | In Labor Force | Unemployed |
| Less than High School | 51 (44.7%) | 0 (0.0%) |
| High School Diploma | 493 (82.4%) | 46 (7.7%) |
| College / Associate Degree | 401 (86.8%) | 1 (0.2%) |
| Bachelor's Degree or higher | 449 (83.1%) | 13 (2.4%) |
| Total | 1,393 (81.3%) | 62 (3.6%) |
Employment Occupations by Sex in Delshire
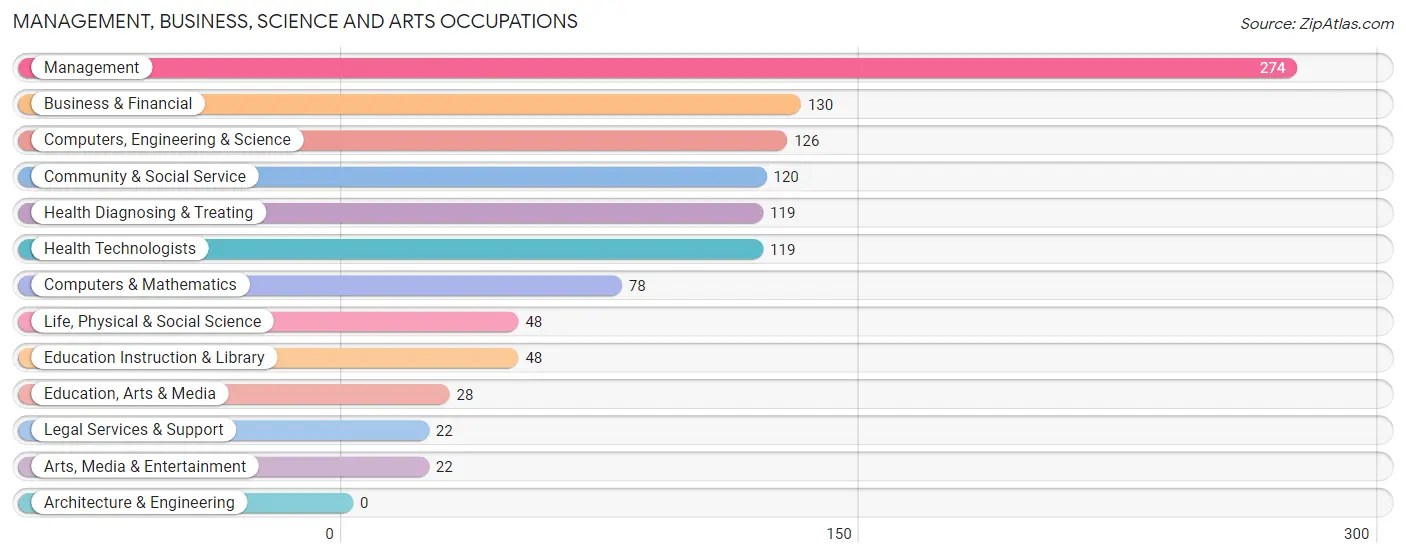
Management, Business, Science and Arts Occupations
The most common Management, Business, Science and Arts occupations in Delshire are Management (274 | 16.6%), Business & Financial (130 | 7.9%), Computers, Engineering & Science (126 | 7.6%), Community & Social Service (120 | 7.3%), and Health Diagnosing & Treating (119 | 7.2%).
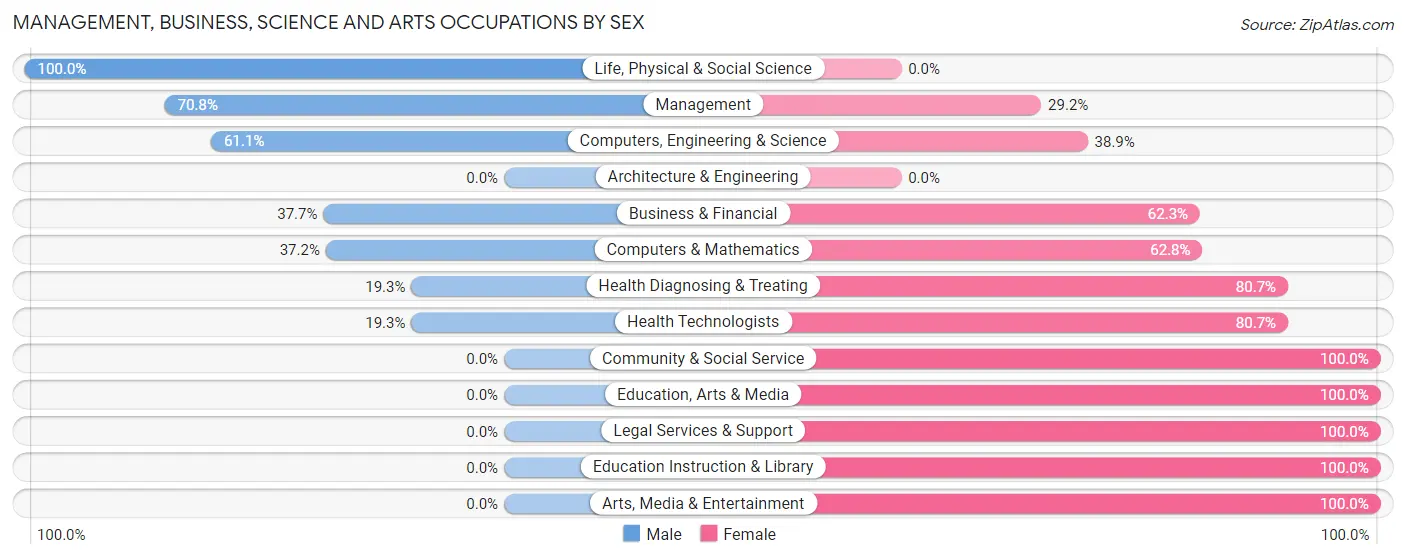
Management, Business, Science and Arts Occupations by Sex
Within the Management, Business, Science and Arts occupations in Delshire, the most male-oriented occupations are Life, Physical & Social Science (100.0%), Management (70.8%), and Computers, Engineering & Science (61.1%), while the most female-oriented occupations are Community & Social Service (100.0%), Education, Arts & Media (100.0%), and Legal Services & Support (100.0%).
| Occupation | Male | Female |
| Management | 194 (70.8%) | 80 (29.2%) |
| Business & Financial | 49 (37.7%) | 81 (62.3%) |
| Computers, Engineering & Science | 77 (61.1%) | 49 (38.9%) |
| Computers & Mathematics | 29 (37.2%) | 49 (62.8%) |
| Architecture & Engineering | 0 (0.0%) | 0 (0.0%) |
| Life, Physical & Social Science | 48 (100.0%) | 0 (0.0%) |
| Community & Social Service | 0 (0.0%) | 120 (100.0%) |
| Education, Arts & Media | 0 (0.0%) | 28 (100.0%) |
| Legal Services & Support | 0 (0.0%) | 22 (100.0%) |
| Education Instruction & Library | 0 (0.0%) | 48 (100.0%) |
| Arts, Media & Entertainment | 0 (0.0%) | 22 (100.0%) |
| Health Diagnosing & Treating | 23 (19.3%) | 96 (80.7%) |
| Health Technologists | 23 (19.3%) | 96 (80.7%) |
| Total (Category) | 343 (44.6%) | 426 (55.4%) |
| Total (Overall) | 876 (53.2%) | 771 (46.8%) |
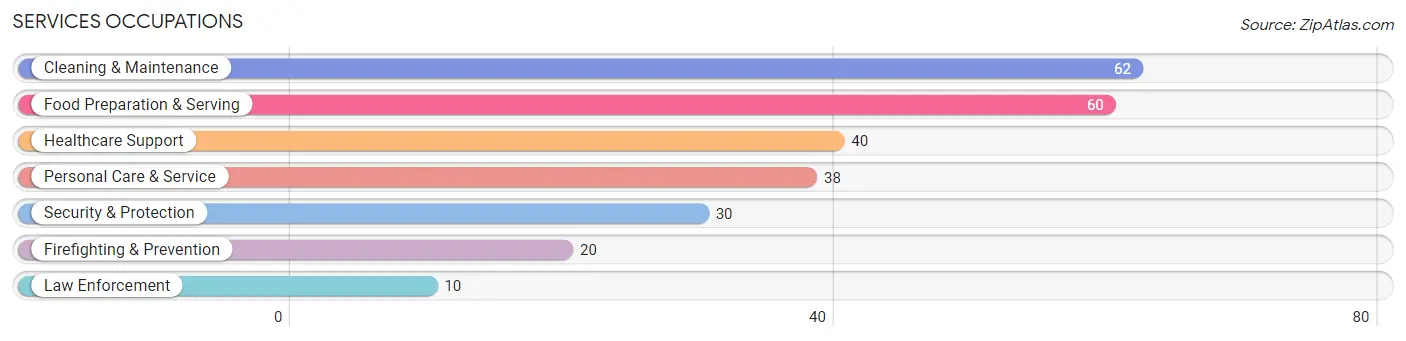
Services Occupations
The most common Services occupations in Delshire are Cleaning & Maintenance (62 | 3.8%), Food Preparation & Serving (60 | 3.6%), Healthcare Support (40 | 2.4%), Personal Care & Service (38 | 2.3%), and Security & Protection (30 | 1.8%).
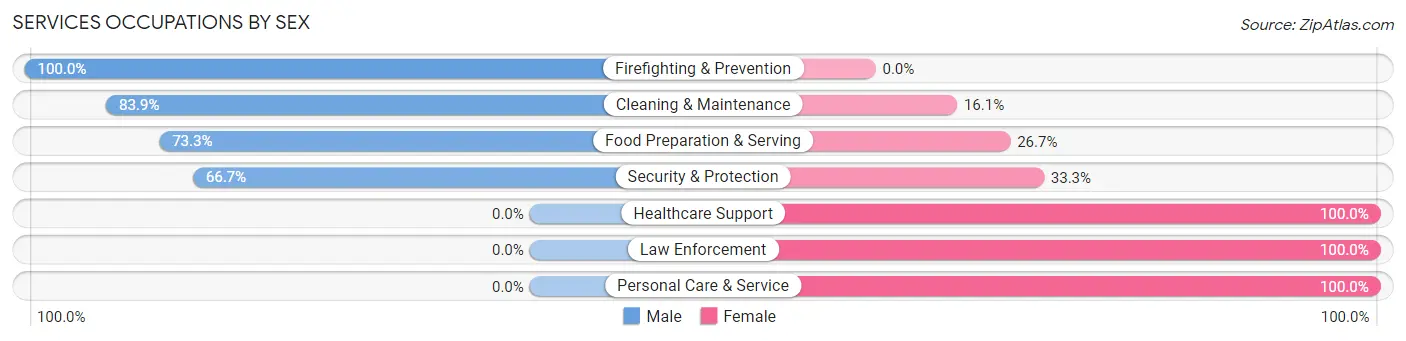
Services Occupations by Sex
Within the Services occupations in Delshire, the most male-oriented occupations are Firefighting & Prevention (100.0%), Cleaning & Maintenance (83.9%), and Food Preparation & Serving (73.3%), while the most female-oriented occupations are Healthcare Support (100.0%), Law Enforcement (100.0%), and Personal Care & Service (100.0%).
| Occupation | Male | Female |
| Healthcare Support | 0 (0.0%) | 40 (100.0%) |
| Security & Protection | 20 (66.7%) | 10 (33.3%) |
| Firefighting & Prevention | 20 (100.0%) | 0 (0.0%) |
| Law Enforcement | 0 (0.0%) | 10 (100.0%) |
| Food Preparation & Serving | 44 (73.3%) | 16 (26.7%) |
| Cleaning & Maintenance | 52 (83.9%) | 10 (16.1%) |
| Personal Care & Service | 0 (0.0%) | 38 (100.0%) |
| Total (Category) | 116 (50.4%) | 114 (49.6%) |
| Total (Overall) | 876 (53.2%) | 771 (46.8%) |
Sales and Office Occupations
The most common Sales and Office occupations in Delshire are Office & Administration (146 | 8.9%), and Sales & Related (84 | 5.1%).

Sales and Office Occupations by Sex

| Occupation | Male | Female |
| Sales & Related | 36 (42.9%) | 48 (57.1%) |
| Office & Administration | 42 (28.8%) | 104 (71.2%) |
| Total (Category) | 78 (33.9%) | 152 (66.1%) |
| Total (Overall) | 876 (53.2%) | 771 (46.8%) |
Natural Resources, Construction and Maintenance Occupations
The most common Natural Resources, Construction and Maintenance occupations in Delshire are Installation, Maintenance & Repair (123 | 7.5%), and Construction & Extraction (58 | 3.5%).

Natural Resources, Construction and Maintenance Occupations by Sex
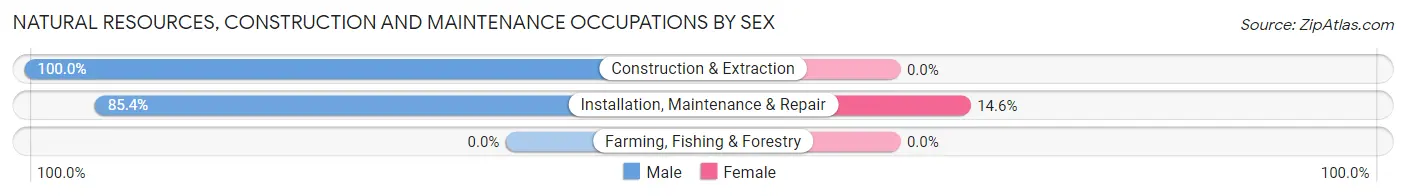
| Occupation | Male | Female |
| Farming, Fishing & Forestry | 0 (0.0%) | 0 (0.0%) |
| Construction & Extraction | 58 (100.0%) | 0 (0.0%) |
| Installation, Maintenance & Repair | 105 (85.4%) | 18 (14.6%) |
| Total (Category) | 163 (90.1%) | 18 (9.9%) |
| Total (Overall) | 876 (53.2%) | 771 (46.8%) |
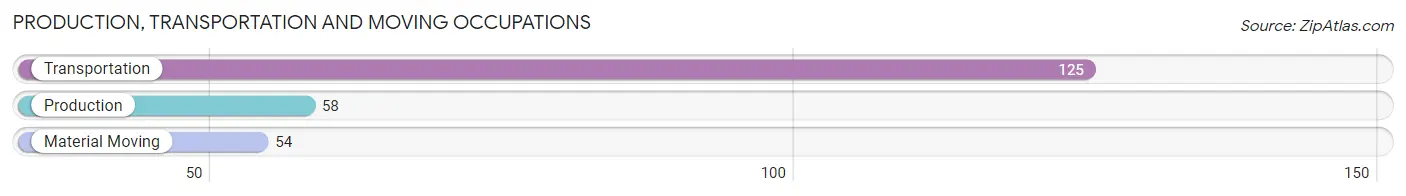
Production, Transportation and Moving Occupations
The most common Production, Transportation and Moving occupations in Delshire are Transportation (125 | 7.6%), Production (58 | 3.5%), and Material Moving (54 | 3.3%).
Production, Transportation and Moving Occupations by Sex
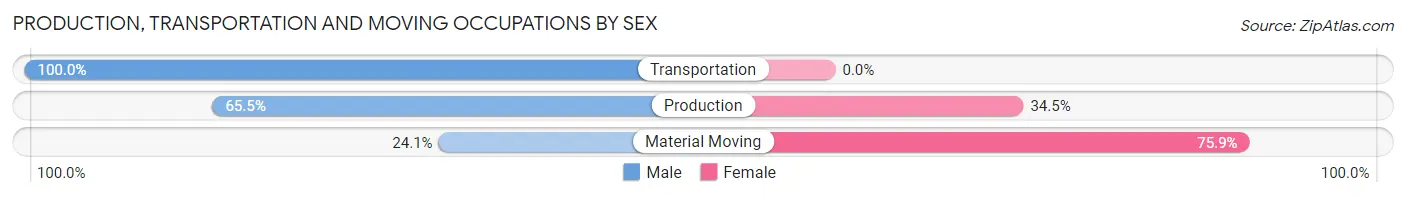
| Occupation | Male | Female |
| Production | 38 (65.5%) | 20 (34.5%) |
| Transportation | 125 (100.0%) | 0 (0.0%) |
| Material Moving | 13 (24.1%) | 41 (75.9%) |
| Total (Category) | 176 (74.3%) | 61 (25.7%) |
| Total (Overall) | 876 (53.2%) | 771 (46.8%) |
Employment Industries by Sex in Delshire
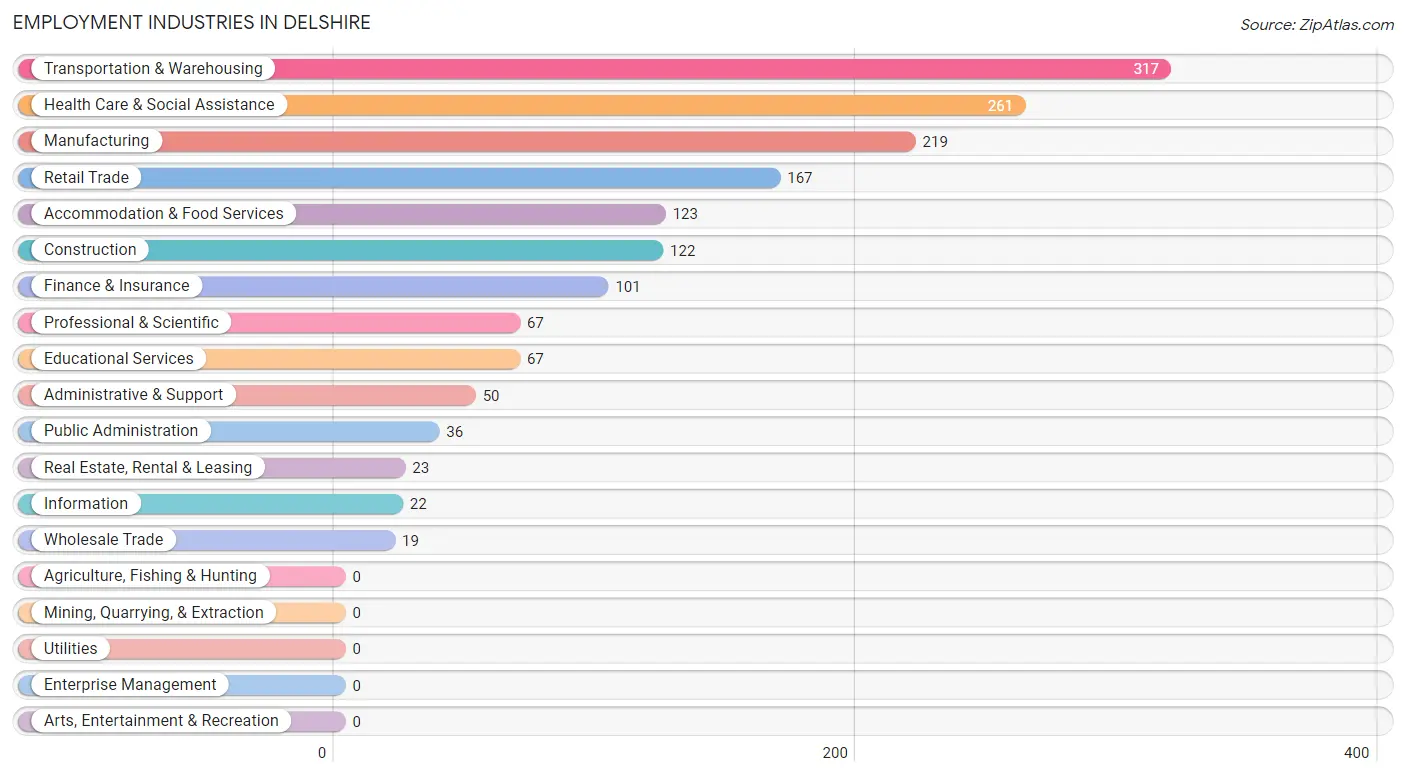
Employment Industries in Delshire
The major employment industries in Delshire include Transportation & Warehousing (317 | 19.3%), Health Care & Social Assistance (261 | 15.9%), Manufacturing (219 | 13.3%), Retail Trade (167 | 10.1%), and Accommodation & Food Services (123 | 7.5%).
Employment Industries by Sex in Delshire
The Delshire industries that see more men than women are Construction (100.0%), Transportation & Warehousing (87.4%), and Administrative & Support (74.0%), whereas the industries that tend to have a higher number of women are Professional & Scientific (76.1%), Educational Services (73.1%), and Finance & Insurance (68.3%).
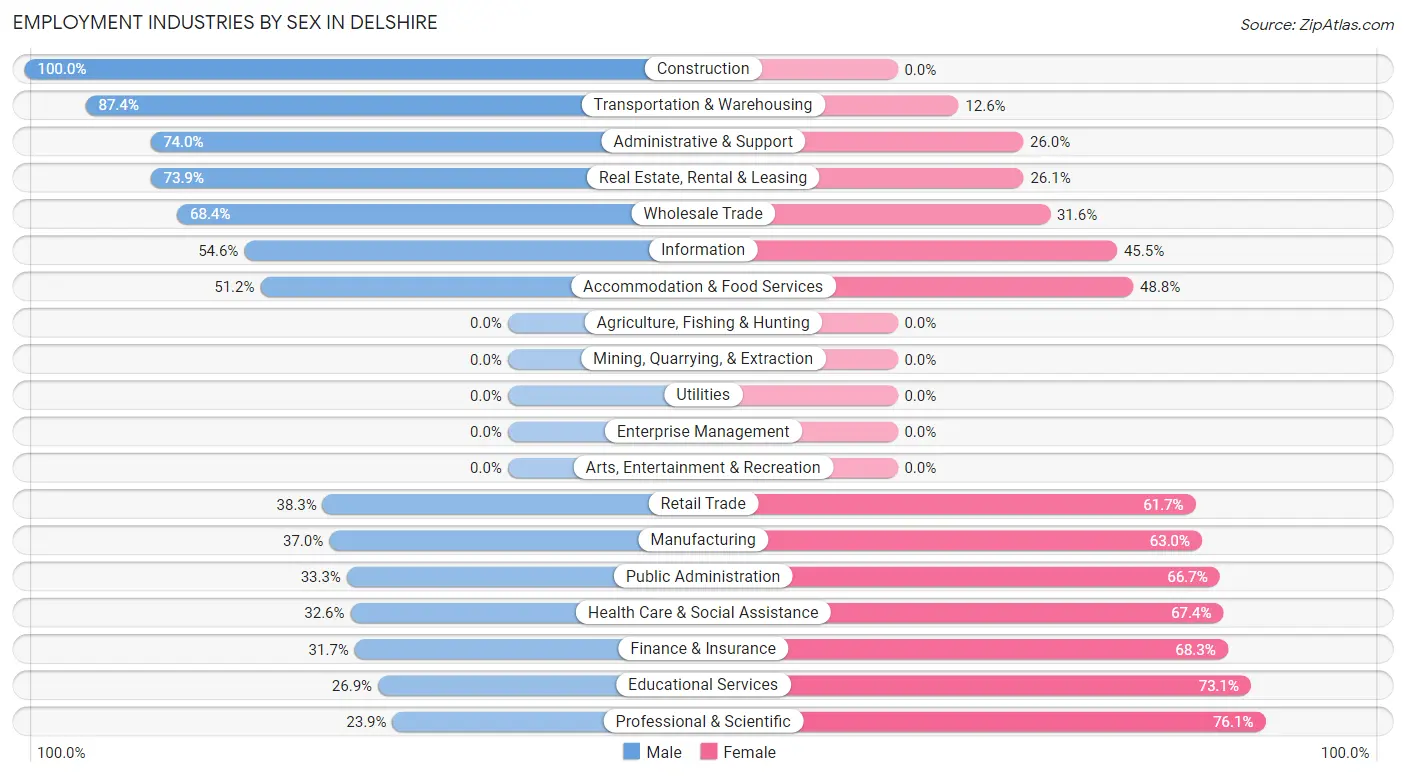
| Industry | Male | Female |
| Agriculture, Fishing & Hunting | 0 (0.0%) | 0 (0.0%) |
| Mining, Quarrying, & Extraction | 0 (0.0%) | 0 (0.0%) |
| Construction | 122 (100.0%) | 0 (0.0%) |
| Manufacturing | 81 (37.0%) | 138 (63.0%) |
| Wholesale Trade | 13 (68.4%) | 6 (31.6%) |
| Retail Trade | 64 (38.3%) | 103 (61.7%) |
| Transportation & Warehousing | 277 (87.4%) | 40 (12.6%) |
| Utilities | 0 (0.0%) | 0 (0.0%) |
| Information | 12 (54.5%) | 10 (45.5%) |
| Finance & Insurance | 32 (31.7%) | 69 (68.3%) |
| Real Estate, Rental & Leasing | 17 (73.9%) | 6 (26.1%) |
| Professional & Scientific | 16 (23.9%) | 51 (76.1%) |
| Enterprise Management | 0 (0.0%) | 0 (0.0%) |
| Administrative & Support | 37 (74.0%) | 13 (26.0%) |
| Educational Services | 18 (26.9%) | 49 (73.1%) |
| Health Care & Social Assistance | 85 (32.6%) | 176 (67.4%) |
| Arts, Entertainment & Recreation | 0 (0.0%) | 0 (0.0%) |
| Accommodation & Food Services | 63 (51.2%) | 60 (48.8%) |
| Public Administration | 12 (33.3%) | 24 (66.7%) |
| Total | 876 (53.2%) | 771 (46.8%) |
Education in Delshire
School Enrollment in Delshire
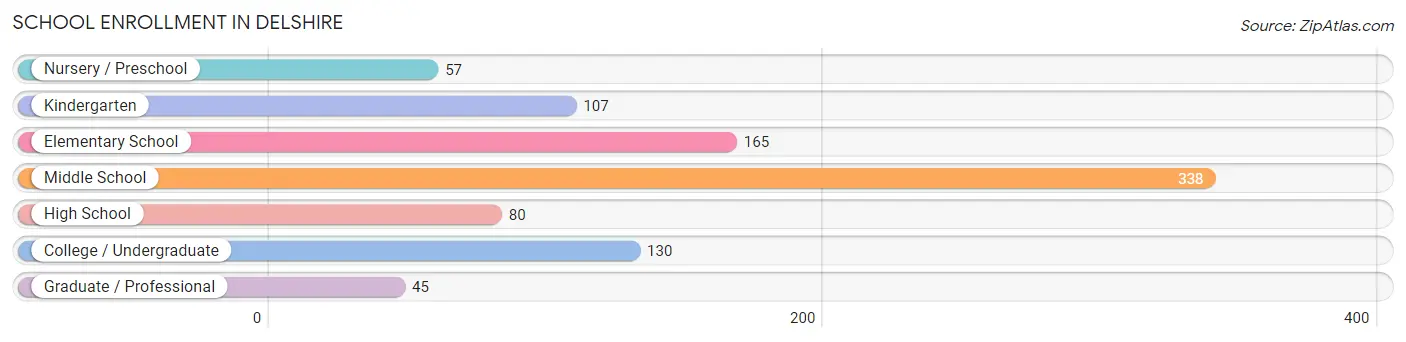
The most common levels of schooling among the 922 students in Delshire are middle school (338 | 36.7%), elementary school (165 | 17.9%), and college / undergraduate (130 | 14.1%).
| School Level | # Students | % Students |
| Nursery / Preschool | 57 | 6.2% |
| Kindergarten | 107 | 11.6% |
| Elementary School | 165 | 17.9% |
| Middle School | 338 | 36.7% |
| High School | 80 | 8.7% |
| College / Undergraduate | 130 | 14.1% |
| Graduate / Professional | 45 | 4.9% |
| Total | 922 | 100.0% |
School Enrollment by Age by Funding Source in Delshire
Out of a total of 922 students who are enrolled in schools in Delshire, 178 (19.3%) attend a private institution, while the remaining 744 (80.7%) are enrolled in public schools. The age group of 25 to 34 year olds has the highest likelihood of being enrolled in private schools, with 37 (60.7% in the age bracket) enrolled. Conversely, the age group of 3 to 4 year olds has the lowest likelihood of being enrolled in a private school, with 16 (100.0% in the age bracket) attending a public institution.
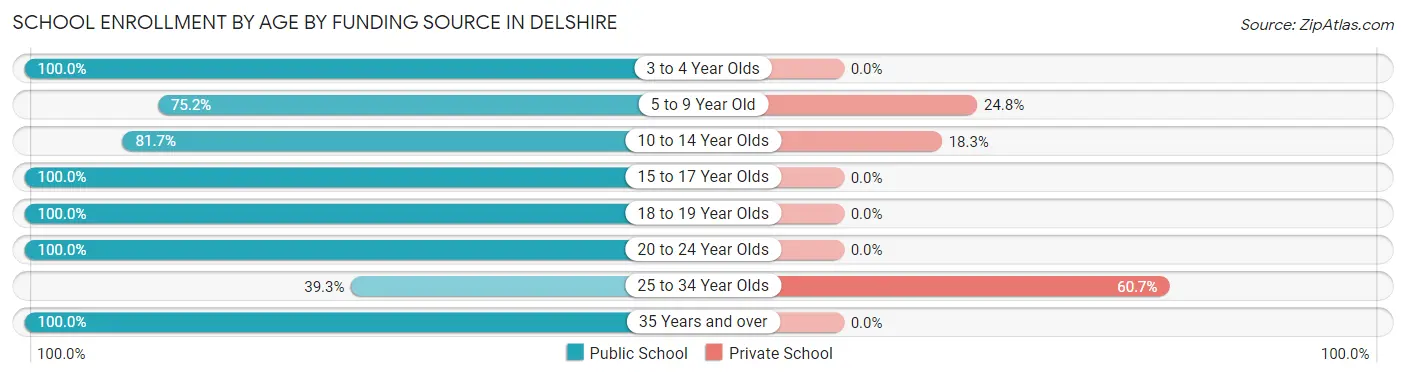
| Age Bracket | Public School | Private School |
| 3 to 4 Year Olds | 16 (100.0%) | 0 (0.0%) |
| 5 to 9 Year Old | 230 (75.2%) | 76 (24.8%) |
| 10 to 14 Year Olds | 291 (81.7%) | 65 (18.3%) |
| 15 to 17 Year Olds | 69 (100.0%) | 0 (0.0%) |
| 18 to 19 Year Olds | 9 (100.0%) | 0 (0.0%) |
| 20 to 24 Year Olds | 34 (100.0%) | 0 (0.0%) |
| 25 to 34 Year Olds | 24 (39.3%) | 37 (60.7%) |
| 35 Years and over | 71 (100.0%) | 0 (0.0%) |
| Total | 744 (80.7%) | 178 (19.3%) |
Educational Attainment by Field of Study in Delshire
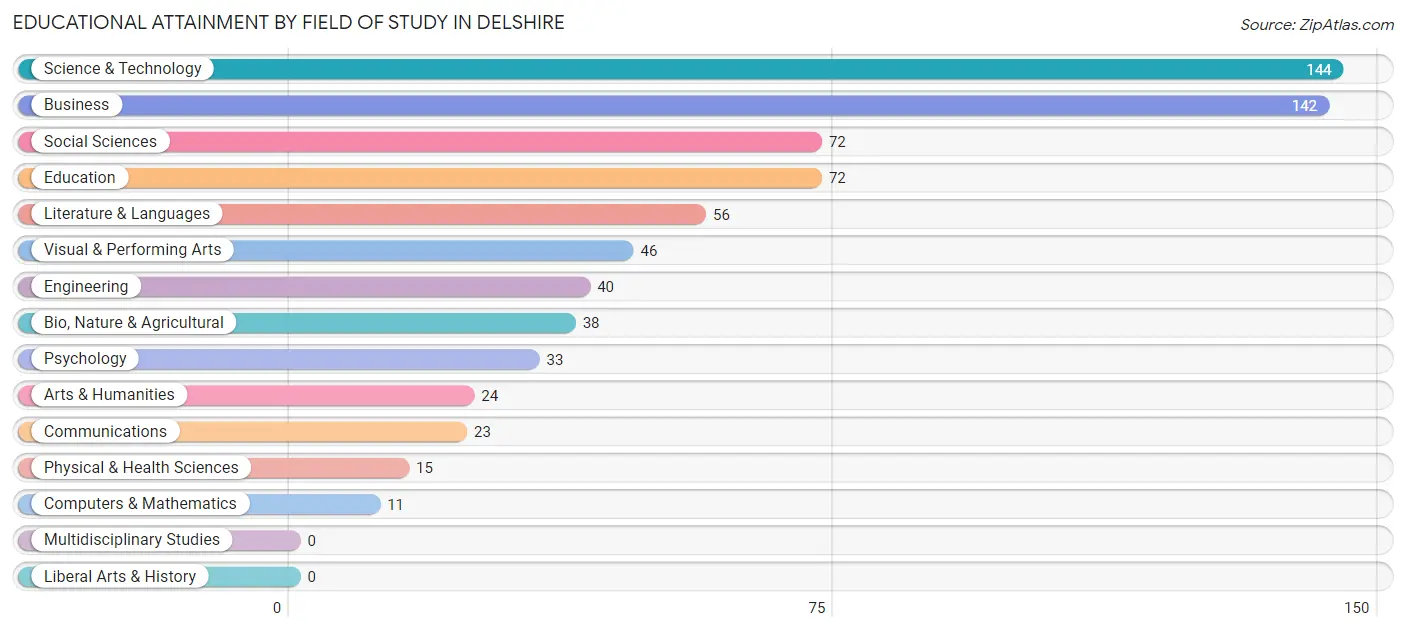
Science & technology (144 | 20.1%), business (142 | 19.8%), social sciences (72 | 10.1%), education (72 | 10.1%), and literature & languages (56 | 7.8%) are the most common fields of study among 716 individuals in Delshire who have obtained a bachelor's degree or higher.
| Field of Study | # Graduates | % Graduates |
| Computers & Mathematics | 11 | 1.5% |
| Bio, Nature & Agricultural | 38 | 5.3% |
| Physical & Health Sciences | 15 | 2.1% |
| Psychology | 33 | 4.6% |
| Social Sciences | 72 | 10.1% |
| Engineering | 40 | 5.6% |
| Multidisciplinary Studies | 0 | 0.0% |
| Science & Technology | 144 | 20.1% |
| Business | 142 | 19.8% |
| Education | 72 | 10.1% |
| Literature & Languages | 56 | 7.8% |
| Liberal Arts & History | 0 | 0.0% |
| Visual & Performing Arts | 46 | 6.4% |
| Communications | 23 | 3.2% |
| Arts & Humanities | 24 | 3.4% |
| Total | 716 | 100.0% |
Transportation & Commute in Delshire
Vehicle Availability by Sex in Delshire
The most prevalent vehicle ownership categories in Delshire are males with 2 vehicles (420, accounting for 50.4%) and females with 2 vehicles (348, making up 60.0%).
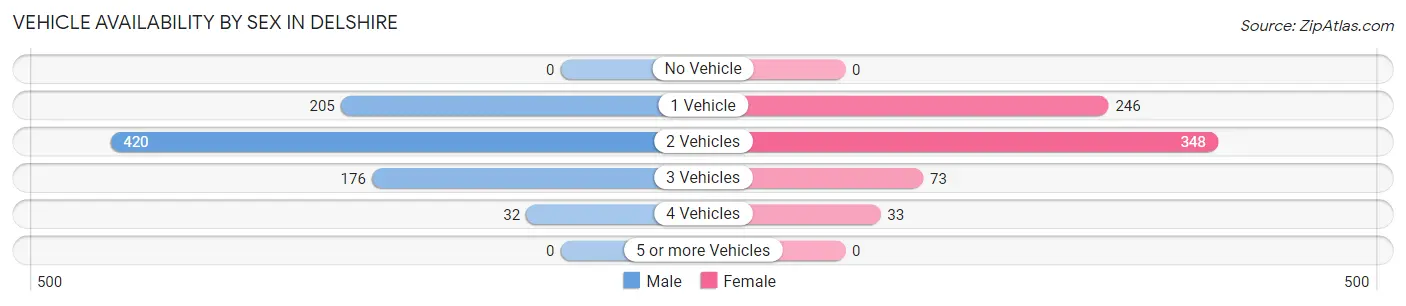
| Vehicles Available | Male | Female |
| No Vehicle | 0 (0.0%) | 0 (0.0%) |
| 1 Vehicle | 205 (24.6%) | 246 (35.1%) |
| 2 Vehicles | 420 (50.4%) | 348 (49.7%) |
| 3 Vehicles | 176 (21.1%) | 73 (10.4%) |
| 4 Vehicles | 32 (3.8%) | 33 (4.7%) |
| 5 or more Vehicles | 0 (0.0%) | 0 (0.0%) |
| Total | 833 (100.0%) | 700 (100.0%) |
Commute Time in Delshire
The most frequently occuring commute durations in Delshire are 30 to 34 minutes (466 commuters, 30.9%), 25 to 29 minutes (209 commuters, 13.9%), and 15 to 19 minutes (179 commuters, 11.9%).
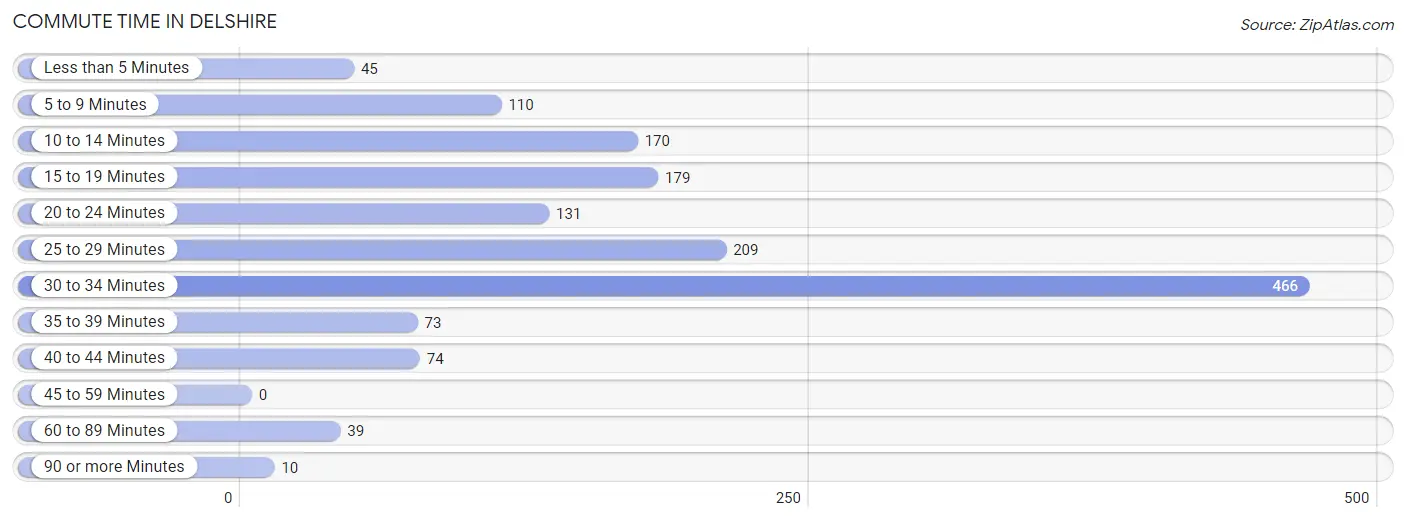
| Commute Time | # Commuters | % Commuters |
| Less than 5 Minutes | 45 | 3.0% |
| 5 to 9 Minutes | 110 | 7.3% |
| 10 to 14 Minutes | 170 | 11.3% |
| 15 to 19 Minutes | 179 | 11.9% |
| 20 to 24 Minutes | 131 | 8.7% |
| 25 to 29 Minutes | 209 | 13.9% |
| 30 to 34 Minutes | 466 | 30.9% |
| 35 to 39 Minutes | 73 | 4.9% |
| 40 to 44 Minutes | 74 | 4.9% |
| 45 to 59 Minutes | 0 | 0.0% |
| 60 to 89 Minutes | 39 | 2.6% |
| 90 or more Minutes | 10 | 0.7% |
Commute Time by Sex in Delshire
The most common commute times in Delshire are 30 to 34 minutes (252 commuters, 30.2%) for males and 30 to 34 minutes (214 commuters, 31.8%) for females.
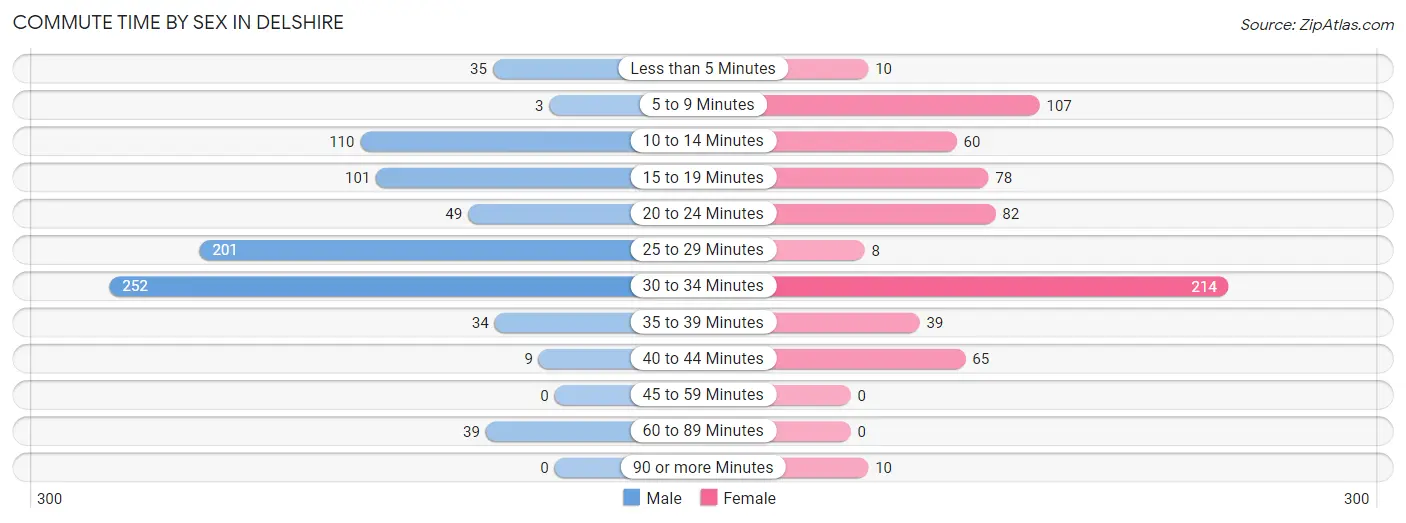
| Commute Time | Male | Female |
| Less than 5 Minutes | 35 (4.2%) | 10 (1.5%) |
| 5 to 9 Minutes | 3 (0.4%) | 107 (15.9%) |
| 10 to 14 Minutes | 110 (13.2%) | 60 (8.9%) |
| 15 to 19 Minutes | 101 (12.1%) | 78 (11.6%) |
| 20 to 24 Minutes | 49 (5.9%) | 82 (12.2%) |
| 25 to 29 Minutes | 201 (24.1%) | 8 (1.2%) |
| 30 to 34 Minutes | 252 (30.2%) | 214 (31.8%) |
| 35 to 39 Minutes | 34 (4.1%) | 39 (5.8%) |
| 40 to 44 Minutes | 9 (1.1%) | 65 (9.7%) |
| 45 to 59 Minutes | 0 (0.0%) | 0 (0.0%) |
| 60 to 89 Minutes | 39 (4.7%) | 0 (0.0%) |
| 90 or more Minutes | 0 (0.0%) | 10 (1.5%) |
Time of Departure to Work by Sex in Delshire
The most frequent times of departure to work in Delshire are 7:00 AM to 7:29 AM (233, 28.0%) for males and 12:00 PM to 3:59 PM (189, 28.1%) for females.
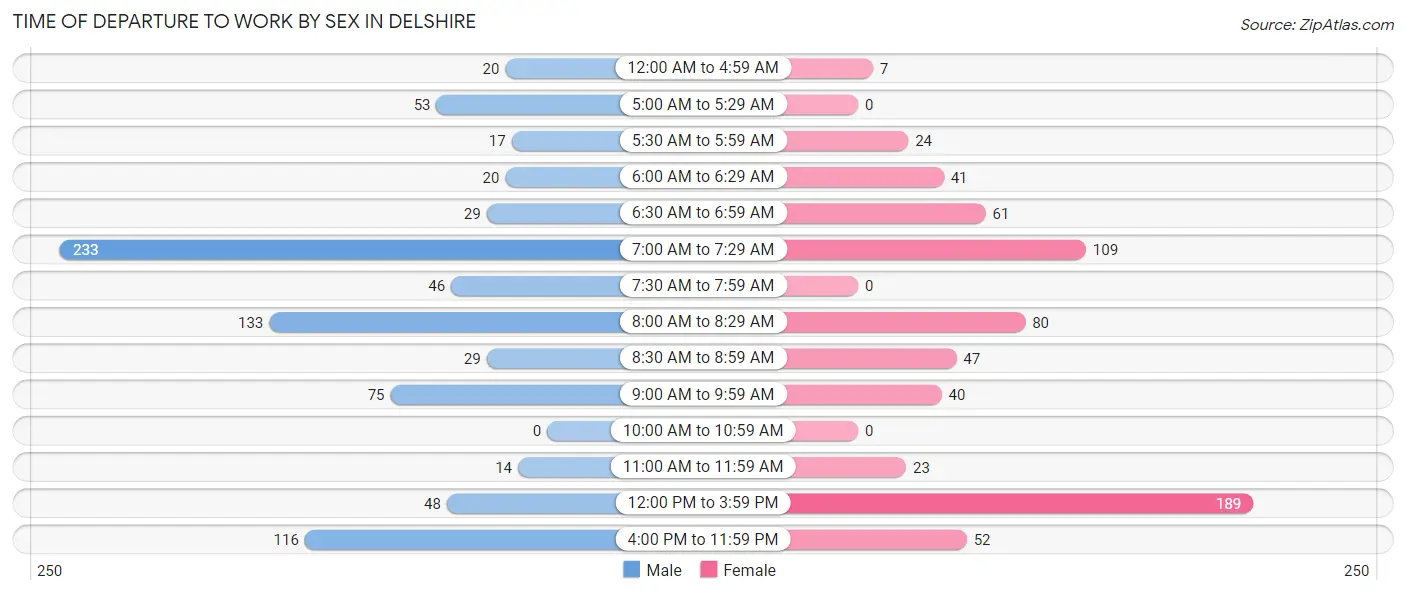
| Time of Departure | Male | Female |
| 12:00 AM to 4:59 AM | 20 (2.4%) | 7 (1.0%) |
| 5:00 AM to 5:29 AM | 53 (6.4%) | 0 (0.0%) |
| 5:30 AM to 5:59 AM | 17 (2.0%) | 24 (3.6%) |
| 6:00 AM to 6:29 AM | 20 (2.4%) | 41 (6.1%) |
| 6:30 AM to 6:59 AM | 29 (3.5%) | 61 (9.1%) |
| 7:00 AM to 7:29 AM | 233 (28.0%) | 109 (16.2%) |
| 7:30 AM to 7:59 AM | 46 (5.5%) | 0 (0.0%) |
| 8:00 AM to 8:29 AM | 133 (16.0%) | 80 (11.9%) |
| 8:30 AM to 8:59 AM | 29 (3.5%) | 47 (7.0%) |
| 9:00 AM to 9:59 AM | 75 (9.0%) | 40 (5.9%) |
| 10:00 AM to 10:59 AM | 0 (0.0%) | 0 (0.0%) |
| 11:00 AM to 11:59 AM | 14 (1.7%) | 23 (3.4%) |
| 12:00 PM to 3:59 PM | 48 (5.8%) | 189 (28.1%) |
| 4:00 PM to 11:59 PM | 116 (13.9%) | 52 (7.7%) |
| Total | 833 (100.0%) | 673 (100.0%) |
Housing Occupancy in Delshire
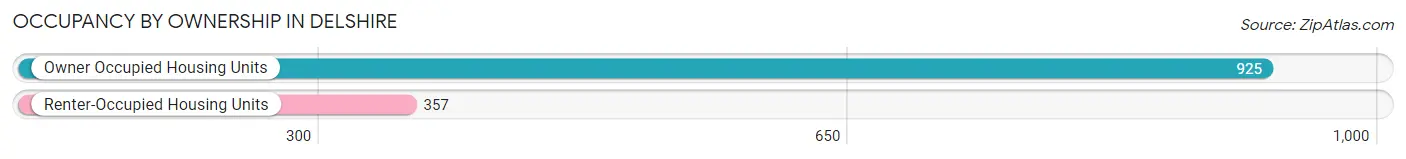
Occupancy by Ownership in Delshire
Of the total 1,282 dwellings in Delshire, owner-occupied units account for 925 (72.2%), while renter-occupied units make up 357 (27.9%).
| Occupancy | # Housing Units | % Housing Units |
| Owner Occupied Housing Units | 925 | 72.2% |
| Renter-Occupied Housing Units | 357 | 27.9% |
| Total Occupied Housing Units | 1,282 | 100.0% |
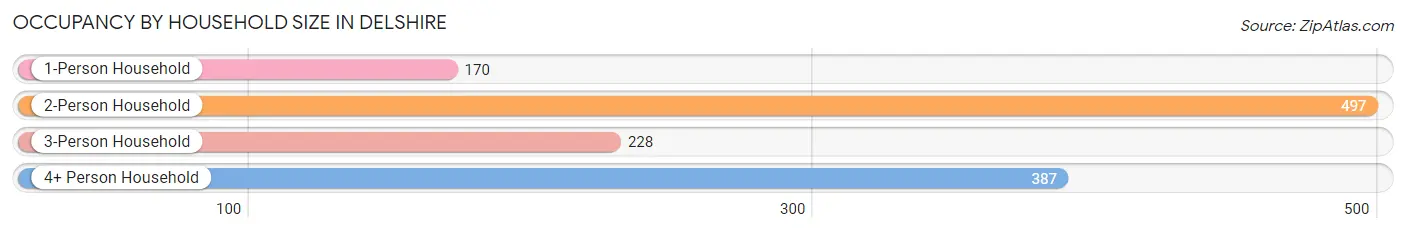
Occupancy by Household Size in Delshire
| Household Size | # Housing Units | % Housing Units |
| 1-Person Household | 170 | 13.3% |
| 2-Person Household | 497 | 38.8% |
| 3-Person Household | 228 | 17.8% |
| 4+ Person Household | 387 | 30.2% |
| Total Housing Units | 1,282 | 100.0% |
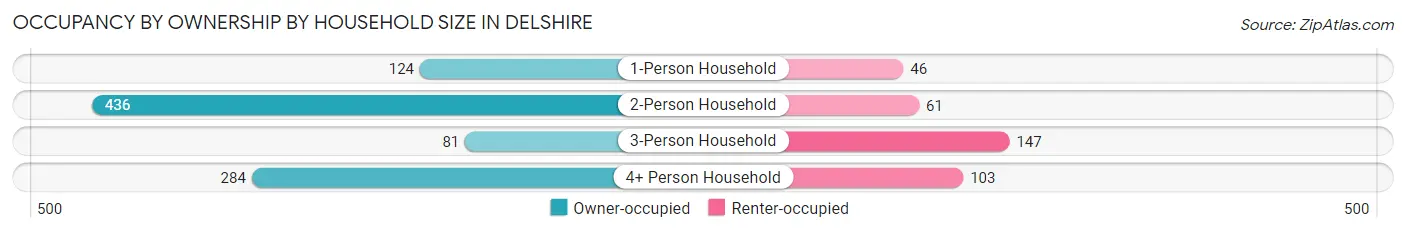
Occupancy by Ownership by Household Size in Delshire
| Household Size | Owner-occupied | Renter-occupied |
| 1-Person Household | 124 (72.9%) | 46 (27.1%) |
| 2-Person Household | 436 (87.7%) | 61 (12.3%) |
| 3-Person Household | 81 (35.5%) | 147 (64.5%) |
| 4+ Person Household | 284 (73.4%) | 103 (26.6%) |
| Total Housing Units | 925 (72.2%) | 357 (27.9%) |
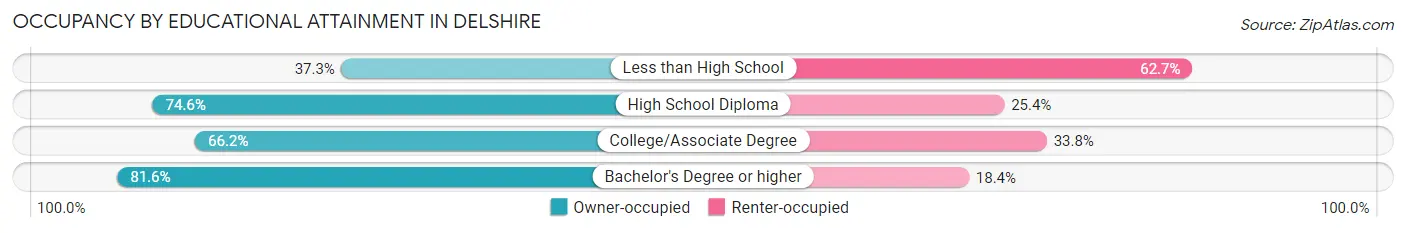
Occupancy by Educational Attainment in Delshire
| Household Size | Owner-occupied | Renter-occupied |
| Less than High School | 28 (37.3%) | 47 (62.7%) |
| High School Diploma | 244 (74.6%) | 83 (25.4%) |
| College/Associate Degree | 280 (66.2%) | 143 (33.8%) |
| Bachelor's Degree or higher | 373 (81.6%) | 84 (18.4%) |
Occupancy by Age of Householder in Delshire
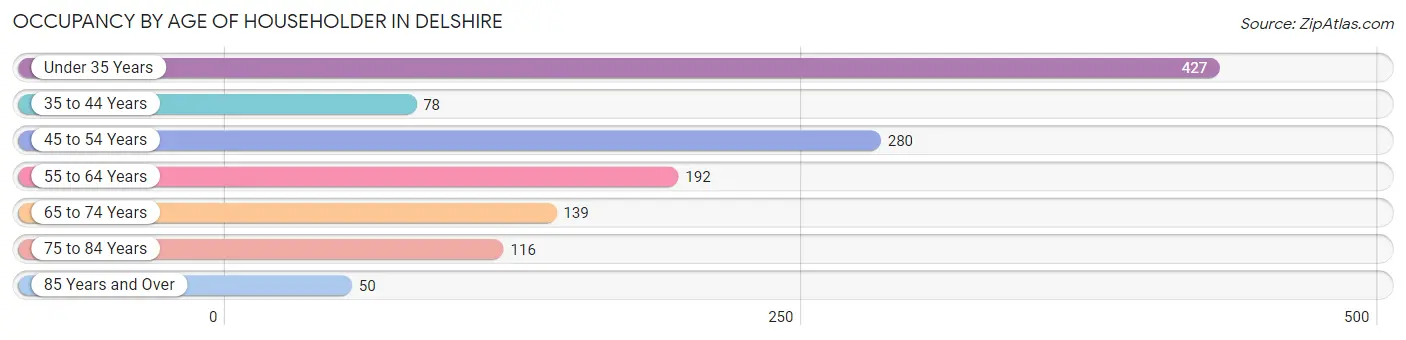
| Age Bracket | # Households | % Households |
| Under 35 Years | 427 | 33.3% |
| 35 to 44 Years | 78 | 6.1% |
| 45 to 54 Years | 280 | 21.8% |
| 55 to 64 Years | 192 | 15.0% |
| 65 to 74 Years | 139 | 10.8% |
| 75 to 84 Years | 116 | 9.0% |
| 85 Years and Over | 50 | 3.9% |
| Total | 1,282 | 100.0% |
Housing Finances in Delshire
Median Income by Occupancy in Delshire
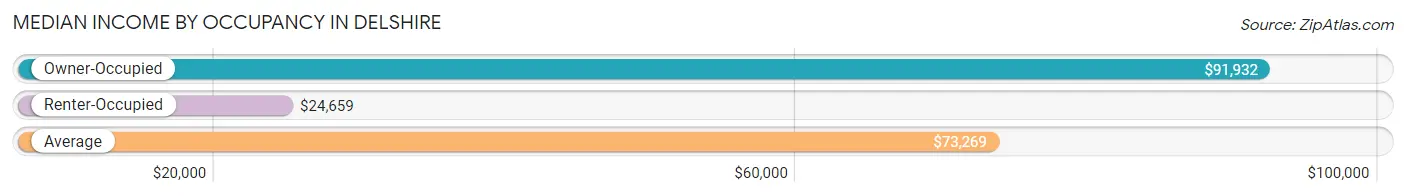
| Occupancy Type | # Households | Median Income |
| Owner-Occupied | 925 (72.2%) | $91,932 |
| Renter-Occupied | 357 (27.9%) | $24,659 |
| Average | 1,282 (100.0%) | $73,269 |
Occupancy by Householder Income Bracket in Delshire
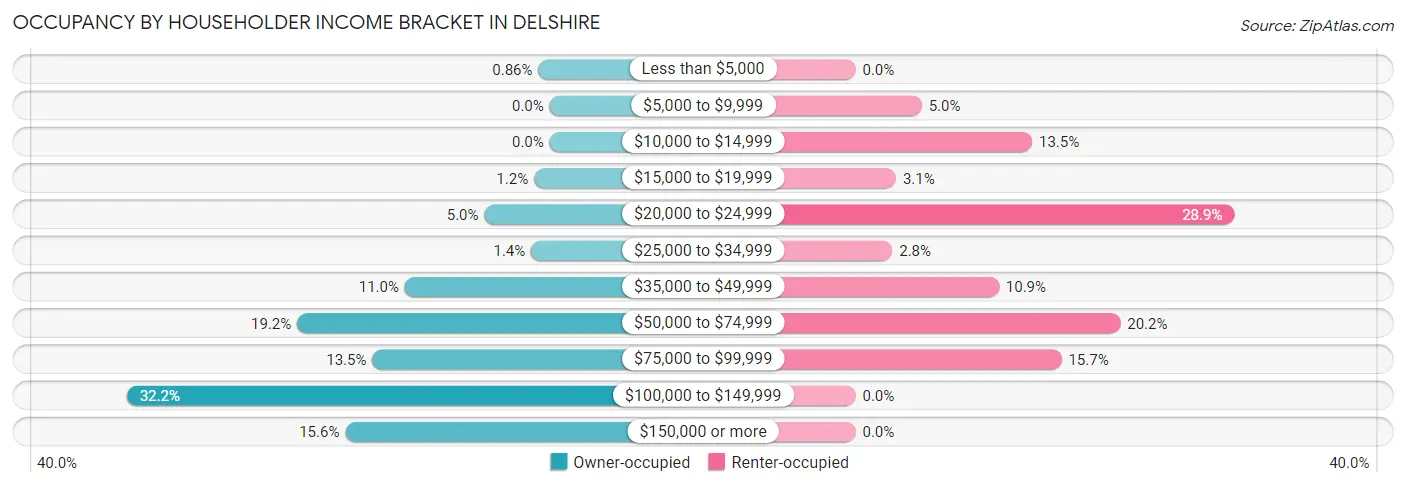
| Income Bracket | Owner-occupied | Renter-occupied |
| Less than $5,000 | 8 (0.9%) | 0 (0.0%) |
| $5,000 to $9,999 | 0 (0.0%) | 18 (5.0%) |
| $10,000 to $14,999 | 0 (0.0%) | 48 (13.5%) |
| $15,000 to $19,999 | 11 (1.2%) | 11 (3.1%) |
| $20,000 to $24,999 | 46 (5.0%) | 103 (28.8%) |
| $25,000 to $34,999 | 13 (1.4%) | 10 (2.8%) |
| $35,000 to $49,999 | 102 (11.0%) | 39 (10.9%) |
| $50,000 to $74,999 | 178 (19.2%) | 72 (20.2%) |
| $75,000 to $99,999 | 125 (13.5%) | 56 (15.7%) |
| $100,000 to $149,999 | 298 (32.2%) | 0 (0.0%) |
| $150,000 or more | 144 (15.6%) | 0 (0.0%) |
| Total | 925 (100.0%) | 357 (100.0%) |
Monthly Housing Cost Tiers in Delshire
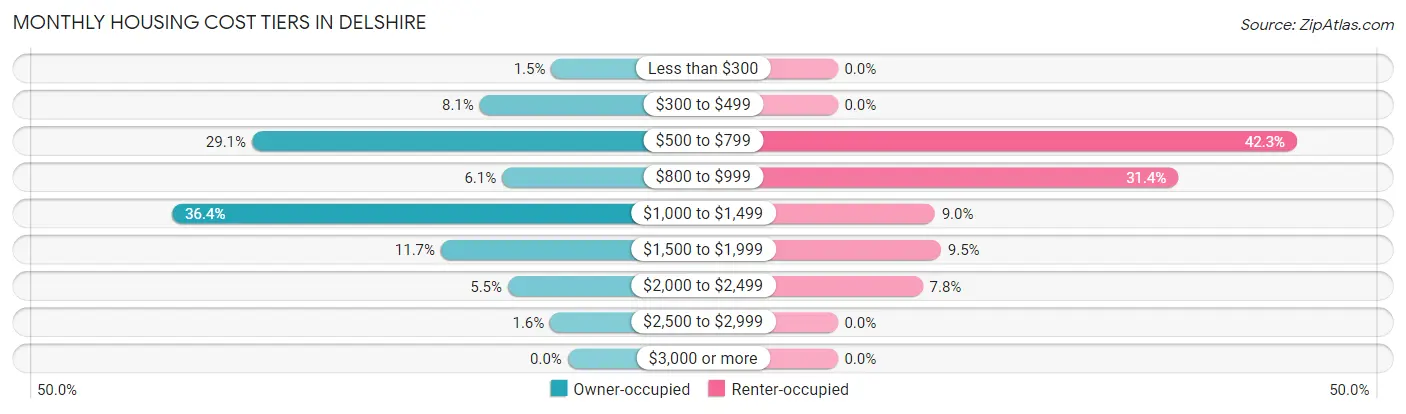
| Monthly Cost | Owner-occupied | Renter-occupied |
| Less than $300 | 14 (1.5%) | 0 (0.0%) |
| $300 to $499 | 75 (8.1%) | 0 (0.0%) |
| $500 to $799 | 269 (29.1%) | 151 (42.3%) |
| $800 to $999 | 56 (6.0%) | 112 (31.4%) |
| $1,000 to $1,499 | 337 (36.4%) | 32 (9.0%) |
| $1,500 to $1,999 | 108 (11.7%) | 34 (9.5%) |
| $2,000 to $2,499 | 51 (5.5%) | 28 (7.8%) |
| $2,500 to $2,999 | 15 (1.6%) | 0 (0.0%) |
| $3,000 or more | 0 (0.0%) | 0 (0.0%) |
| Total | 925 (100.0%) | 357 (100.0%) |
Physical Housing Characteristics in Delshire
Housing Structures in Delshire
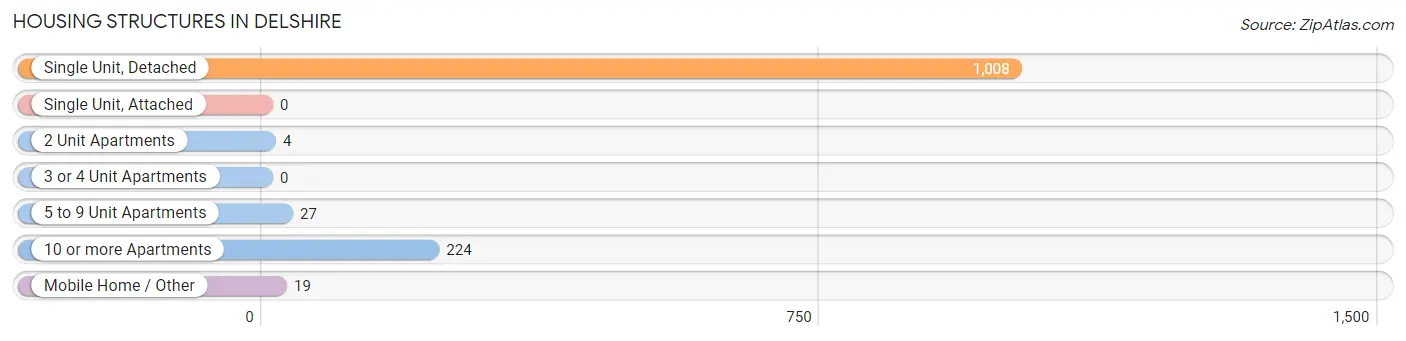
| Structure Type | # Housing Units | % Housing Units |
| Single Unit, Detached | 1,008 | 78.6% |
| Single Unit, Attached | 0 | 0.0% |
| 2 Unit Apartments | 4 | 0.3% |
| 3 or 4 Unit Apartments | 0 | 0.0% |
| 5 to 9 Unit Apartments | 27 | 2.1% |
| 10 or more Apartments | 224 | 17.5% |
| Mobile Home / Other | 19 | 1.5% |
| Total | 1,282 | 100.0% |
Housing Structures by Occupancy in Delshire
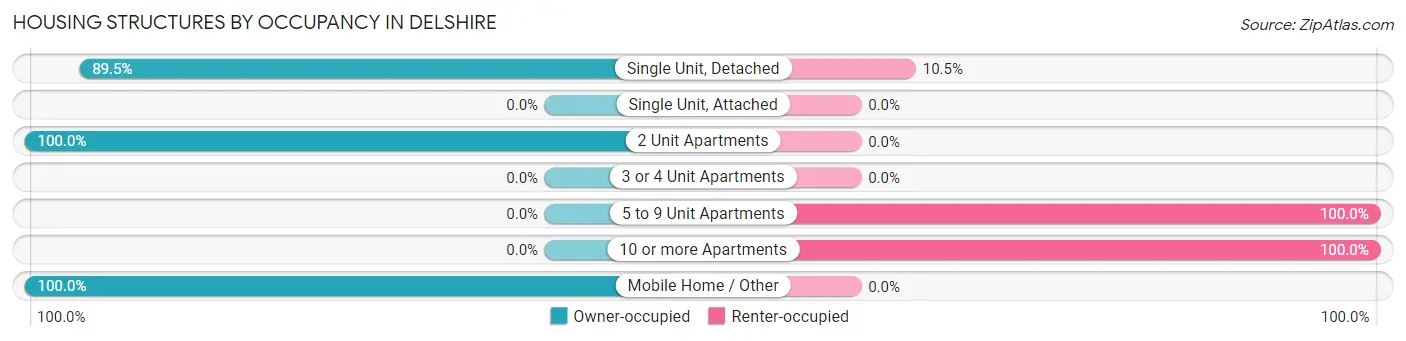
| Structure Type | Owner-occupied | Renter-occupied |
| Single Unit, Detached | 902 (89.5%) | 106 (10.5%) |
| Single Unit, Attached | 0 (0.0%) | 0 (0.0%) |
| 2 Unit Apartments | 4 (100.0%) | 0 (0.0%) |
| 3 or 4 Unit Apartments | 0 (0.0%) | 0 (0.0%) |
| 5 to 9 Unit Apartments | 0 (0.0%) | 27 (100.0%) |
| 10 or more Apartments | 0 (0.0%) | 224 (100.0%) |
| Mobile Home / Other | 19 (100.0%) | 0 (0.0%) |
| Total | 925 (72.2%) | 357 (27.9%) |
Housing Structures by Number of Rooms in Delshire
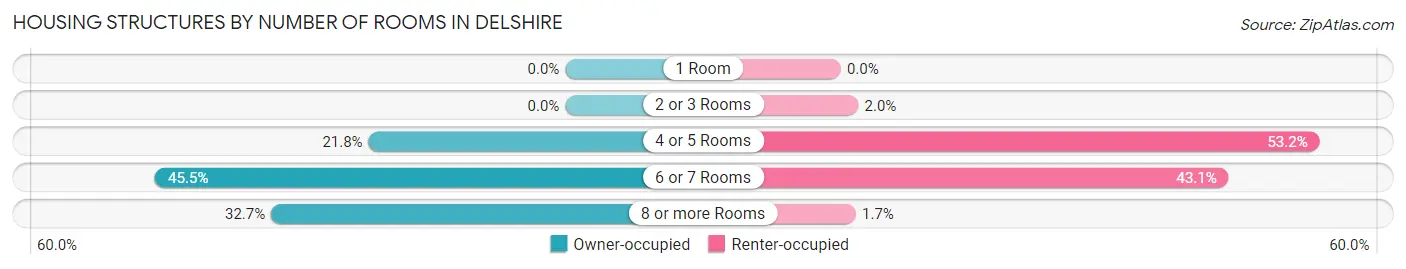
| Number of Rooms | Owner-occupied | Renter-occupied |
| 1 Room | 0 (0.0%) | 0 (0.0%) |
| 2 or 3 Rooms | 0 (0.0%) | 7 (2.0%) |
| 4 or 5 Rooms | 202 (21.8%) | 190 (53.2%) |
| 6 or 7 Rooms | 421 (45.5%) | 154 (43.1%) |
| 8 or more Rooms | 302 (32.7%) | 6 (1.7%) |
| Total | 925 (100.0%) | 357 (100.0%) |
Housing Structure by Heating Type in Delshire
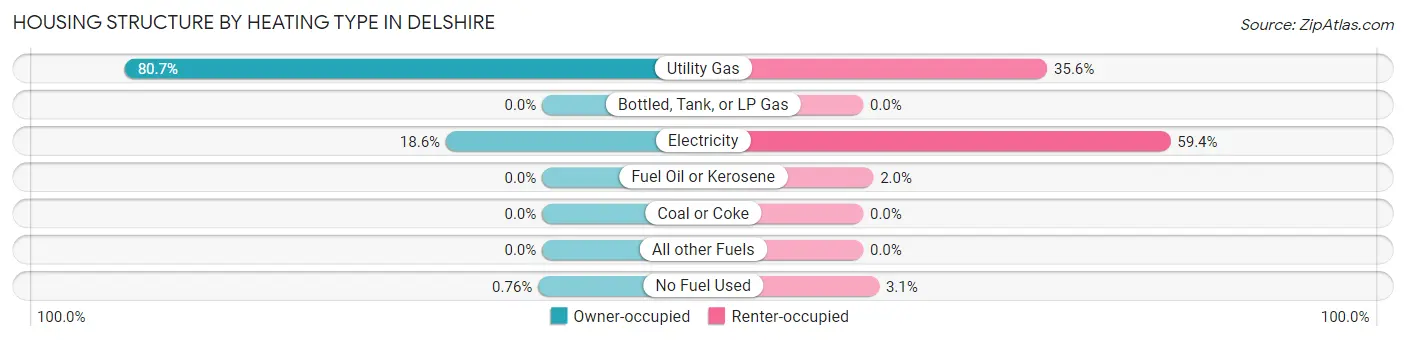
| Heating Type | Owner-occupied | Renter-occupied |
| Utility Gas | 746 (80.6%) | 127 (35.6%) |
| Bottled, Tank, or LP Gas | 0 (0.0%) | 0 (0.0%) |
| Electricity | 172 (18.6%) | 212 (59.4%) |
| Fuel Oil or Kerosene | 0 (0.0%) | 7 (2.0%) |
| Coal or Coke | 0 (0.0%) | 0 (0.0%) |
| All other Fuels | 0 (0.0%) | 0 (0.0%) |
| No Fuel Used | 7 (0.8%) | 11 (3.1%) |
| Total | 925 (100.0%) | 357 (100.0%) |
Household Vehicle Usage in Delshire
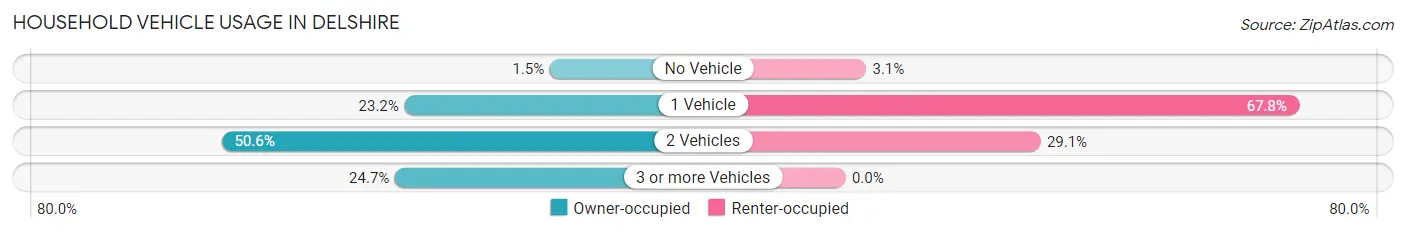
| Vehicles per Household | Owner-occupied | Renter-occupied |
| No Vehicle | 14 (1.5%) | 11 (3.1%) |
| 1 Vehicle | 215 (23.2%) | 242 (67.8%) |
| 2 Vehicles | 468 (50.6%) | 104 (29.1%) |
| 3 or more Vehicles | 228 (24.6%) | 0 (0.0%) |
| Total | 925 (100.0%) | 357 (100.0%) |
Real Estate & Mortgages in Delshire
Real Estate and Mortgage Overview in Delshire
| Characteristic | Without Mortgage | With Mortgage |
| Housing Units | 274 | 651 |
| Median Property Value | $139,200 | $149,500 |
| Median Household Income | $64,231 | $99 |
| Monthly Housing Costs | $588 | $0 |
| Real Estate Taxes | $2,456 | $0 |
Property Value by Mortgage Status in Delshire
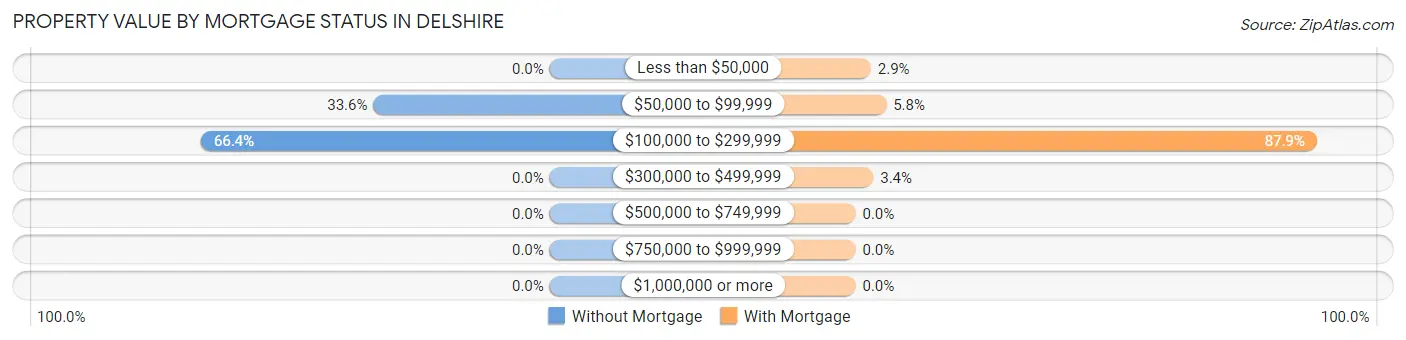
| Property Value | Without Mortgage | With Mortgage |
| Less than $50,000 | 0 (0.0%) | 19 (2.9%) |
| $50,000 to $99,999 | 92 (33.6%) | 38 (5.8%) |
| $100,000 to $299,999 | 182 (66.4%) | 572 (87.9%) |
| $300,000 to $499,999 | 0 (0.0%) | 22 (3.4%) |
| $500,000 to $749,999 | 0 (0.0%) | 0 (0.0%) |
| $750,000 to $999,999 | 0 (0.0%) | 0 (0.0%) |
| $1,000,000 or more | 0 (0.0%) | 0 (0.0%) |
| Total | 274 (100.0%) | 651 (100.0%) |
Household Income by Mortgage Status in Delshire
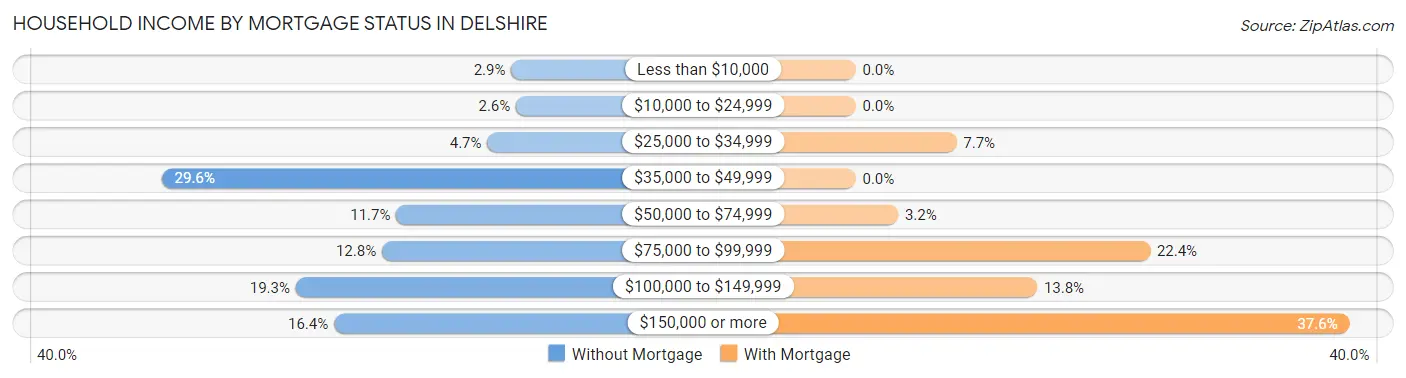
| Household Income | Without Mortgage | With Mortgage |
| Less than $10,000 | 8 (2.9%) | 0 (0.0%) |
| $10,000 to $24,999 | 7 (2.5%) | 0 (0.0%) |
| $25,000 to $34,999 | 13 (4.7%) | 50 (7.7%) |
| $35,000 to $49,999 | 81 (29.6%) | 0 (0.0%) |
| $50,000 to $74,999 | 32 (11.7%) | 21 (3.2%) |
| $75,000 to $99,999 | 35 (12.8%) | 146 (22.4%) |
| $100,000 to $149,999 | 53 (19.3%) | 90 (13.8%) |
| $150,000 or more | 45 (16.4%) | 245 (37.6%) |
| Total | 274 (100.0%) | 651 (100.0%) |
Property Value to Household Income Ratio in Delshire
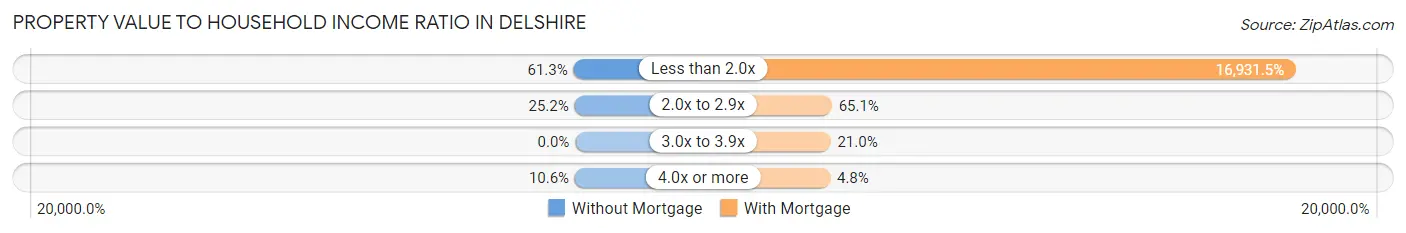
| Value-to-Income Ratio | Without Mortgage | With Mortgage |
| Less than 2.0x | 168 (61.3%) | 110,224 (16,931.5%) |
| 2.0x to 2.9x | 69 (25.2%) | 424 (65.1%) |
| 3.0x to 3.9x | 0 (0.0%) | 137 (21.0%) |
| 4.0x or more | 29 (10.6%) | 31 (4.8%) |
| Total | 274 (100.0%) | 651 (100.0%) |
Real Estate Taxes by Mortgage Status in Delshire
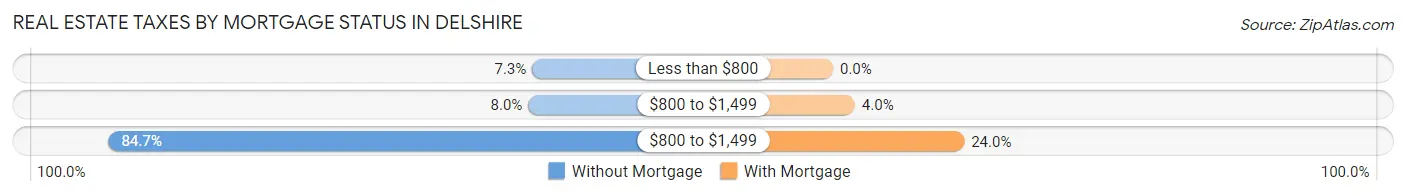
| Property Taxes | Without Mortgage | With Mortgage |
| Less than $800 | 20 (7.3%) | 0 (0.0%) |
| $800 to $1,499 | 22 (8.0%) | 26 (4.0%) |
| $800 to $1,499 | 232 (84.7%) | 156 (24.0%) |
| Total | 274 (100.0%) | 651 (100.0%) |
Health & Disability in Delshire
Health Insurance Coverage by Age in Delshire
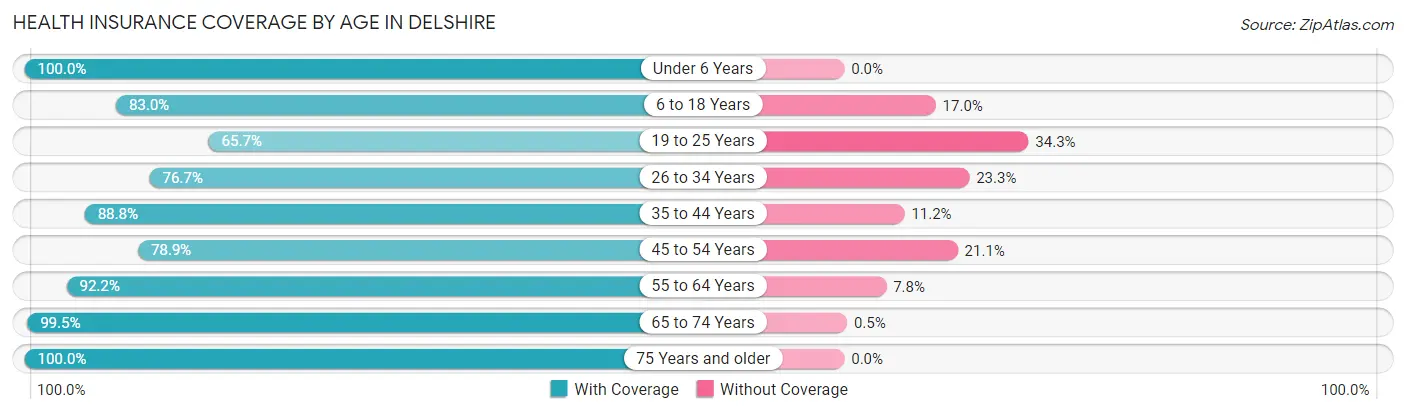
| Age Bracket | With Coverage | Without Coverage |
| Under 6 Years | 436 (100.0%) | 0 (0.0%) |
| 6 to 18 Years | 521 (83.0%) | 107 (17.0%) |
| 19 to 25 Years | 264 (65.7%) | 138 (34.3%) |
| 26 to 34 Years | 405 (76.7%) | 123 (23.3%) |
| 35 to 44 Years | 277 (88.8%) | 35 (11.2%) |
| 45 to 54 Years | 347 (78.9%) | 93 (21.1%) |
| 55 to 64 Years | 330 (92.2%) | 28 (7.8%) |
| 65 to 74 Years | 199 (99.5%) | 1 (0.5%) |
| 75 Years and older | 271 (100.0%) | 0 (0.0%) |
| Total | 3,050 (85.3%) | 525 (14.7%) |
Health Insurance Coverage by Citizenship Status in Delshire

| Citizenship Status | With Coverage | Without Coverage |
| Native Born | 436 (100.0%) | 0 (0.0%) |
| Foreign Born, Citizen | 521 (83.0%) | 107 (17.0%) |
| Foreign Born, not a Citizen | 264 (65.7%) | 138 (34.3%) |
Health Insurance Coverage by Household Income in Delshire
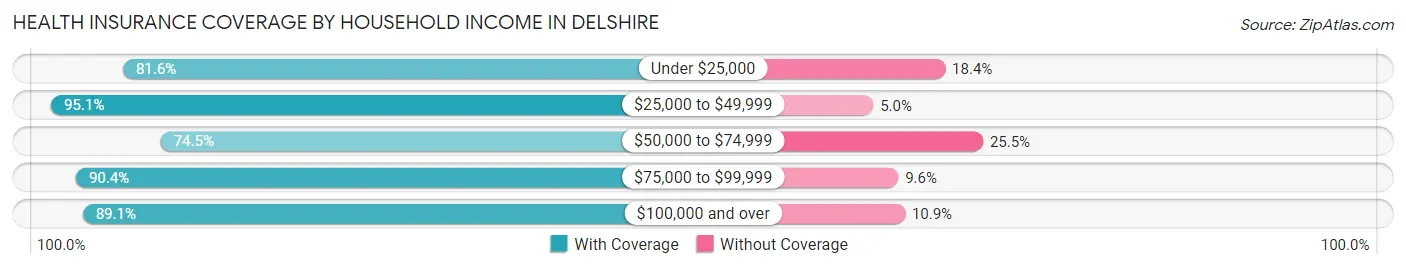
| Household Income | With Coverage | Without Coverage |
| Under $25,000 | 633 (81.6%) | 143 (18.4%) |
| $25,000 to $49,999 | 269 (95.1%) | 14 (5.0%) |
| $50,000 to $74,999 | 514 (74.5%) | 176 (25.5%) |
| $75,000 to $99,999 | 488 (90.4%) | 52 (9.6%) |
| $100,000 and over | 1,146 (89.1%) | 140 (10.9%) |
Public vs Private Health Insurance Coverage by Age in Delshire
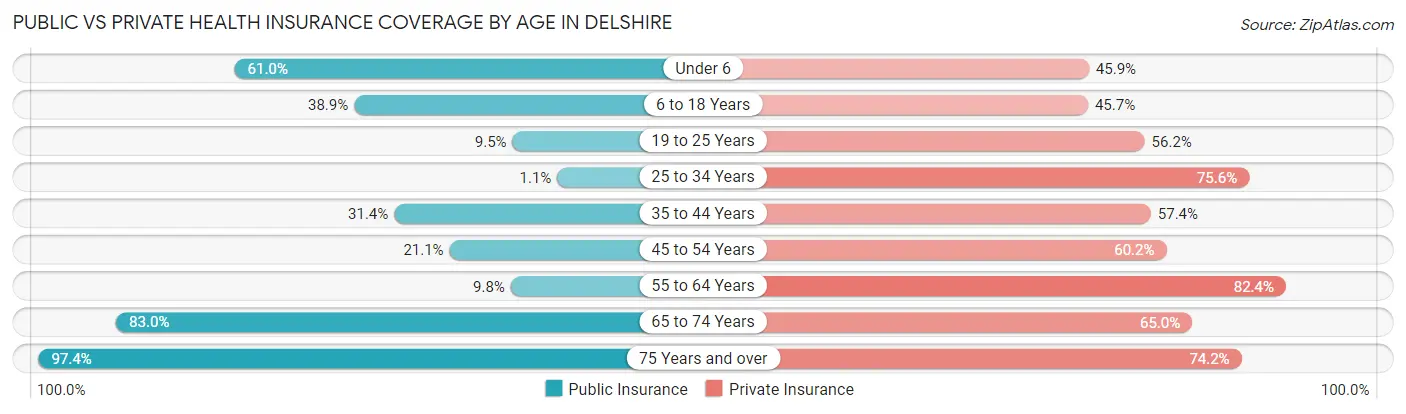
| Age Bracket | Public Insurance | Private Insurance |
| Under 6 | 266 (61.0%) | 200 (45.9%) |
| 6 to 18 Years | 244 (38.9%) | 287 (45.7%) |
| 19 to 25 Years | 38 (9.5%) | 226 (56.2%) |
| 25 to 34 Years | 6 (1.1%) | 399 (75.6%) |
| 35 to 44 Years | 98 (31.4%) | 179 (57.4%) |
| 45 to 54 Years | 93 (21.1%) | 265 (60.2%) |
| 55 to 64 Years | 35 (9.8%) | 295 (82.4%) |
| 65 to 74 Years | 166 (83.0%) | 130 (65.0%) |
| 75 Years and over | 264 (97.4%) | 201 (74.2%) |
| Total | 1,210 (33.9%) | 2,182 (61.0%) |
Disability Status by Sex by Age in Delshire
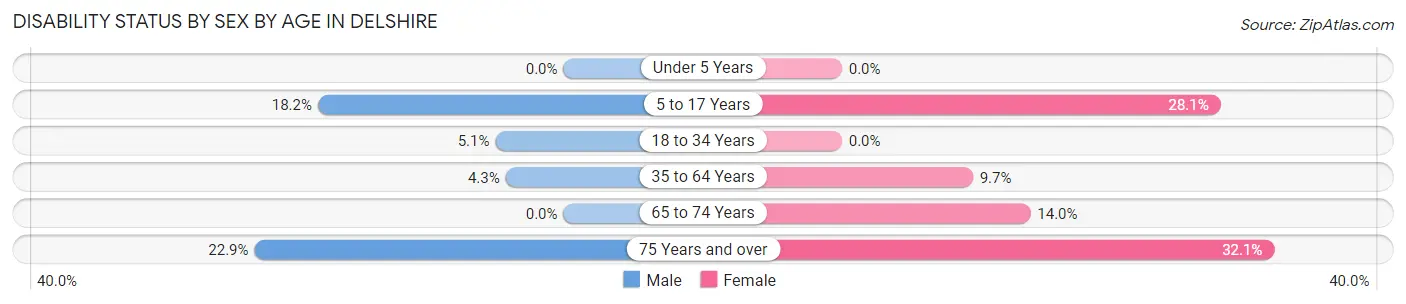
| Age Bracket | Male | Female |
| Under 5 Years | 0 (0.0%) | 0 (0.0%) |
| 5 to 17 Years | 72 (18.2%) | 97 (28.1%) |
| 18 to 34 Years | 28 (5.1%) | 0 (0.0%) |
| 35 to 64 Years | 22 (4.3%) | 58 (9.7%) |
| 65 to 74 Years | 0 (0.0%) | 14 (14.0%) |
| 75 Years and over | 25 (22.9%) | 52 (32.1%) |
Disability Class by Sex by Age in Delshire
Disability Class: Hearing Difficulty
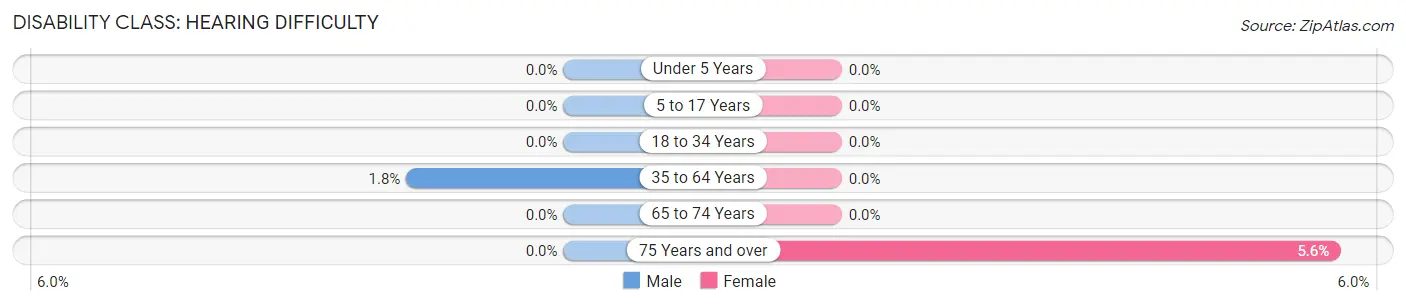
| Age Bracket | Male | Female |
| Under 5 Years | 0 (0.0%) | 0 (0.0%) |
| 5 to 17 Years | 0 (0.0%) | 0 (0.0%) |
| 18 to 34 Years | 0 (0.0%) | 0 (0.0%) |
| 35 to 64 Years | 9 (1.8%) | 0 (0.0%) |
| 65 to 74 Years | 0 (0.0%) | 0 (0.0%) |
| 75 Years and over | 0 (0.0%) | 9 (5.6%) |
Disability Class: Vision Difficulty
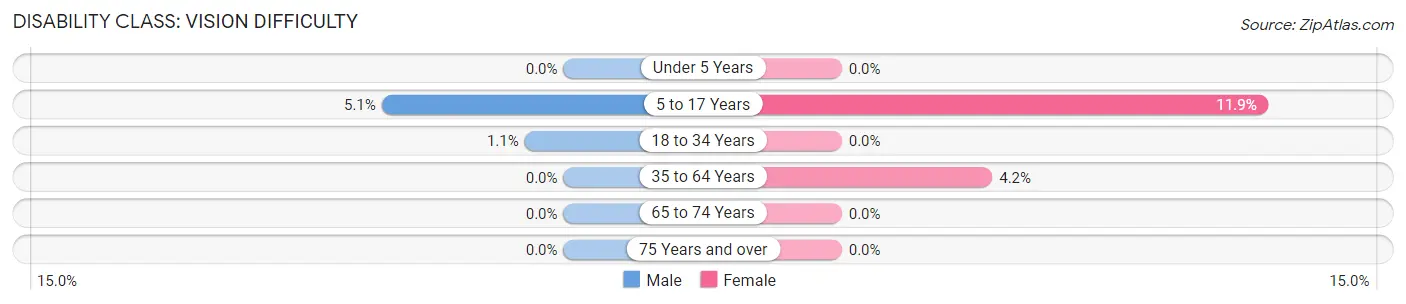
| Age Bracket | Male | Female |
| Under 5 Years | 0 (0.0%) | 0 (0.0%) |
| 5 to 17 Years | 20 (5.1%) | 41 (11.9%) |
| 18 to 34 Years | 6 (1.1%) | 0 (0.0%) |
| 35 to 64 Years | 0 (0.0%) | 25 (4.2%) |
| 65 to 74 Years | 0 (0.0%) | 0 (0.0%) |
| 75 Years and over | 0 (0.0%) | 0 (0.0%) |
Disability Class: Cognitive Difficulty
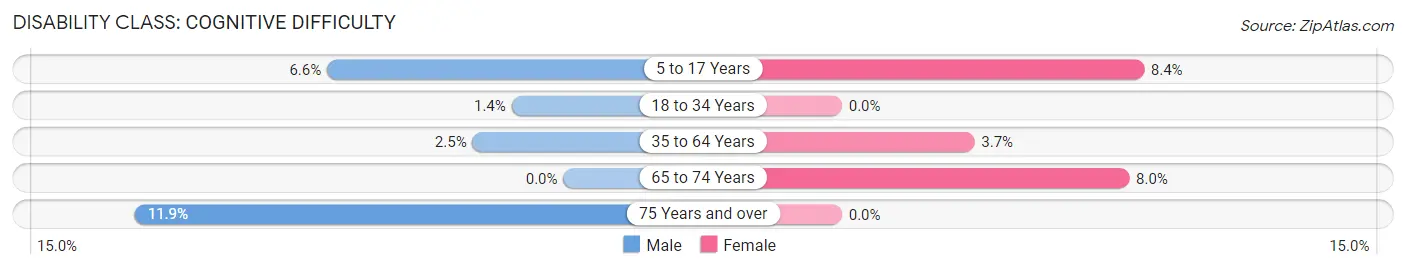
| Age Bracket | Male | Female |
| 5 to 17 Years | 26 (6.6%) | 29 (8.4%) |
| 18 to 34 Years | 8 (1.4%) | 0 (0.0%) |
| 35 to 64 Years | 13 (2.5%) | 22 (3.7%) |
| 65 to 74 Years | 0 (0.0%) | 8 (8.0%) |
| 75 Years and over | 13 (11.9%) | 0 (0.0%) |
Disability Class: Ambulatory Difficulty
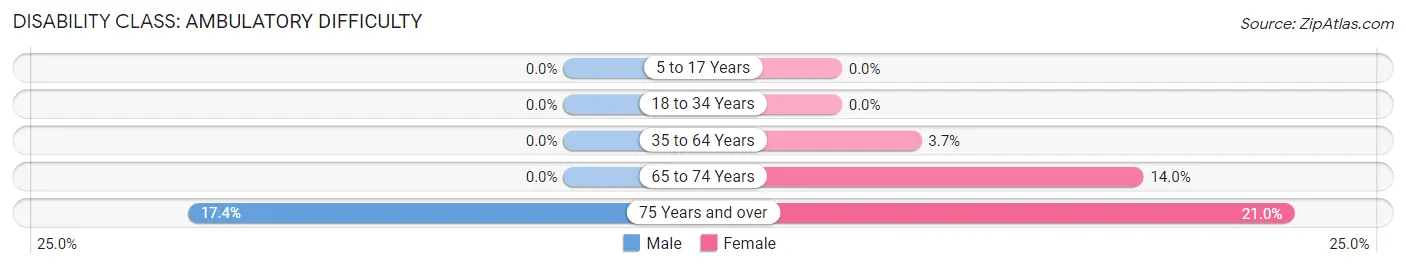
| Age Bracket | Male | Female |
| 5 to 17 Years | 0 (0.0%) | 0 (0.0%) |
| 18 to 34 Years | 0 (0.0%) | 0 (0.0%) |
| 35 to 64 Years | 0 (0.0%) | 22 (3.7%) |
| 65 to 74 Years | 0 (0.0%) | 14 (14.0%) |
| 75 Years and over | 19 (17.4%) | 34 (21.0%) |
Disability Class: Self-Care Difficulty
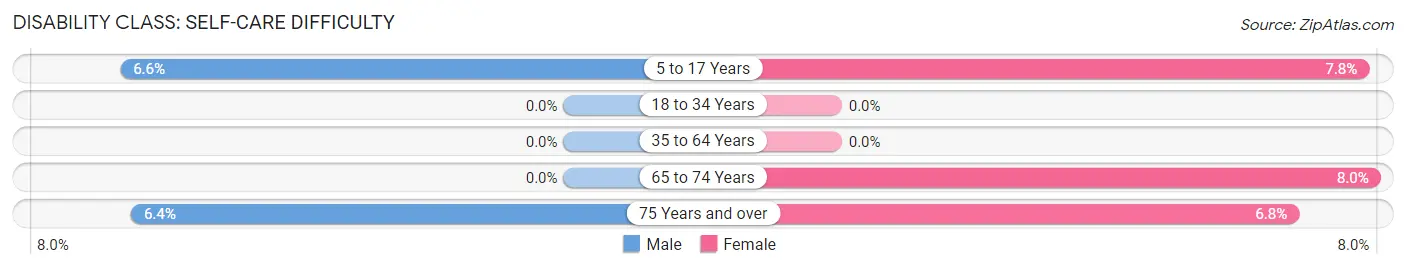
| Age Bracket | Male | Female |
| 5 to 17 Years | 26 (6.6%) | 27 (7.8%) |
| 18 to 34 Years | 0 (0.0%) | 0 (0.0%) |
| 35 to 64 Years | 0 (0.0%) | 0 (0.0%) |
| 65 to 74 Years | 0 (0.0%) | 8 (8.0%) |
| 75 Years and over | 7 (6.4%) | 11 (6.8%) |
Technology Access in Delshire
Computing Device Access in Delshire
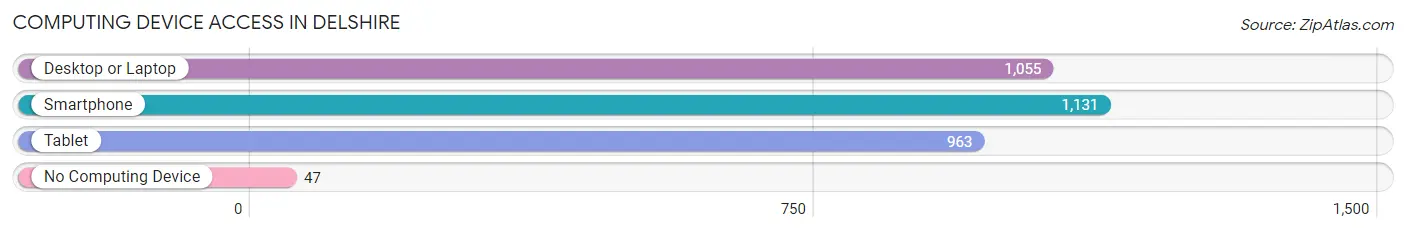
| Device Type | # Households | % Households |
| Desktop or Laptop | 1,055 | 82.3% |
| Smartphone | 1,131 | 88.2% |
| Tablet | 963 | 75.1% |
| No Computing Device | 47 | 3.7% |
| Total | 1,282 | 100.0% |
Internet Access in Delshire
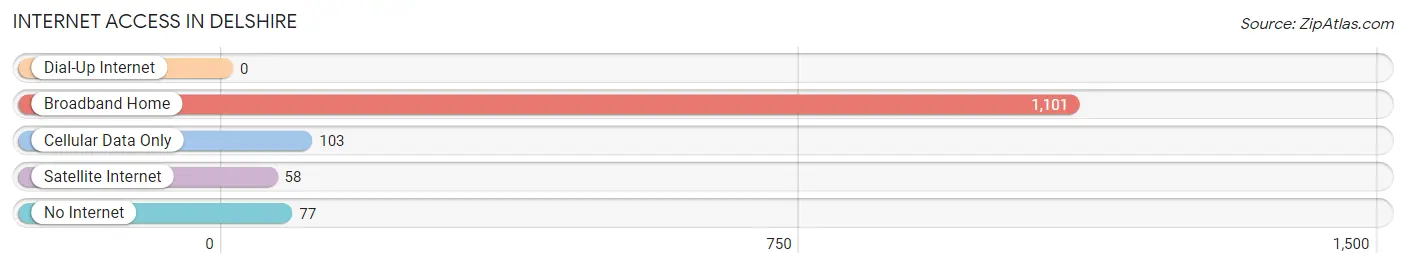
| Internet Type | # Households | % Households |
| Dial-Up Internet | 0 | 0.0% |
| Broadband Home | 1,101 | 85.9% |
| Cellular Data Only | 103 | 8.0% |
| Satellite Internet | 58 | 4.5% |
| No Internet | 77 | 6.0% |
| Total | 1,282 | 100.0% |
Delshire Summary
Delshire, Ohio is a small village located in the southeastern corner of the state, in the Appalachian region. It is situated in the foothills of the Appalachian Mountains, and is surrounded by rolling hills and lush forests. The village is home to approximately 1,000 people, and is part of the larger Athens County.
History
Delshire was founded in 1820 by a group of settlers from Pennsylvania. The settlers were looking for a place to settle and start a new life, and they found it in the hills of southeastern Ohio. The village was named after the nearby Delshire Creek, which was named after a local Native American chief.
The village grew slowly over the years, and by the mid-1800s it had become a thriving community. The village was home to a variety of businesses, including a sawmill, a gristmill, a blacksmith, and a general store. The village also had a school, a church, and a post office.
In the late 1800s, the village began to decline as the railroad bypassed it and the local economy shifted away from agriculture. The population began to decline, and by the early 1900s the village was nearly abandoned.
In the mid-1900s, the village began to experience a resurgence. The population began to grow again, and new businesses began to open. Today, Delshire is a small but vibrant community, with a variety of businesses and services.
Geography
Delshire is located in the southeastern corner of Ohio, in the Appalachian region. The village is situated in the foothills of the Appalachian Mountains, and is surrounded by rolling hills and lush forests. The village is located near the Hocking River, and is about 25 miles from the city of Athens.
The village is located in a temperate climate, with hot summers and cold winters. The average temperature in the summer is around 75 degrees Fahrenheit, and the average temperature in the winter is around 35 degrees Fahrenheit.
Economy
The economy of Delshire is largely based on agriculture and tourism. The village is home to several farms, which produce a variety of crops, including corn, soybeans, and wheat. The village also has several small businesses, including a general store, a hardware store, and a restaurant.
The village is also a popular tourist destination, as it is located near several state parks and recreational areas. The village is home to several bed and breakfasts, as well as a variety of outdoor activities, such as hiking, fishing, and camping.
Demographics
As of the 2010 census, the population of Delshire was 1,000 people. The village is predominantly white, with a small minority population. The median age of the population is 44 years old, and the median household income is $37,000. The village has a low unemployment rate, and the majority of the population is employed in the agricultural and tourism industries.
Common Questions
What is Per Capita Income in Delshire?
Per Capita income in Delshire is $31,315.
What is the Median Family Income in Delshire?
Median Family Income in Delshire is $63,676.
What is the Median Household income in Delshire?
Median Household Income in Delshire is $73,269.
What is Income or Wage Gap in Delshire?
Income or Wage Gap in Delshire is 14.6%.
Women in Delshire earn 85.4 cents for every dollar earned by a man.
What is Inequality or Gini Index in Delshire?
Inequality or Gini Index in Delshire is 0.40.
What is the Total Population of Delshire?
Total Population of Delshire is 3,575.
What is the Total Male Population of Delshire?
Total Male Population of Delshire is 1,874.
What is the Total Female Population of Delshire?
Total Female Population of Delshire is 1,701.
What is the Ratio of Males per 100 Females in Delshire?
There are 110.17 Males per 100 Females in Delshire.
What is the Ratio of Females per 100 Males in Delshire?
There are 90.77 Females per 100 Males in Delshire.
What is the Median Population Age in Delshire?
Median Population Age in Delshire is 33.1 Years.
What is the Average Family Size in Delshire
Average Family Size in Delshire is 3.1 People.
What is the Average Household Size in Delshire
Average Household Size in Delshire is 2.8 People.
How Large is the Labor Force in Delshire?
There are 1,850 People in the Labor Forcein in Delshire.
What is the Percentage of People in the Labor Force in Delshire?
71.4% of People are in the Labor Force in Delshire.
What is the Unemployment Rate in Delshire?
Unemployment Rate in Delshire is 11.0%.