Skillman, NJ Map & Demographics
Skillman Map
Skillman Overview
$59,162
PER CAPITA INCOME
$217,679
AVG FAMILY INCOME
$132,105
AVG HOUSEHOLD INCOME
0.39
INEQUALITY / GINI INDEX
297
TOTAL POPULATION
149
MALE POPULATION
148
FEMALE POPULATION
100.68
MALES / 100 FEMALES
99.33
FEMALES / 100 MALES
35.9
MEDIAN AGE
3.5
AVG FAMILY SIZE
2.6
AVG HOUSEHOLD SIZE
181
LABOR FORCE [ PEOPLE ]
76.1%
PERCENT IN LABOR FORCE
Skillman Zip Codes
Income in Skillman
Income Overview in Skillman
Per Capita Income in Skillman is $59,162, while median incomes of families and households are $217,679 and $132,105 respectively.
| Characteristic | Number | Measure |
| Per Capita Income | 297 | $59,162 |
| Median Family Income | 73 | $217,679 |
| Mean Family Income | 73 | $210,455 |
| Median Household Income | 114 | $132,105 |
| Mean Household Income | 114 | $146,926 |
| Income Deficit | 73 | $0 |
| Wage / Income Gap (%) | 297 | 0.00% |
| Wage / Income Gap ($) | 297 | 100.00¢ per $1 |
| Gini / Inequality Index | 297 | 0.39 |
Earnings by Sex in Skillman
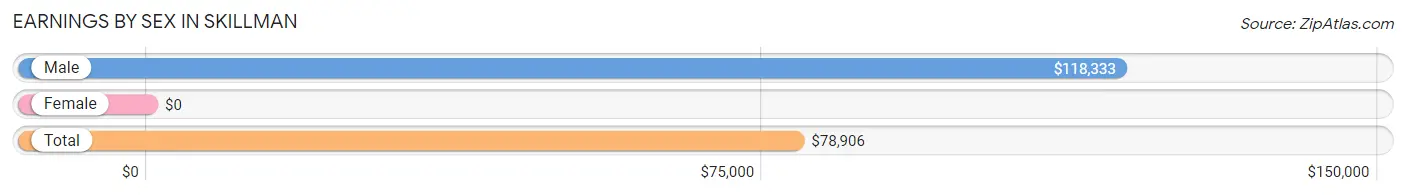
| Sex | Number | Average Earnings |
| Male | 94 (51.9%) | $118,333 |
| Female | 87 (48.1%) | $0 |
| Total | 181 (100.0%) | $78,906 |
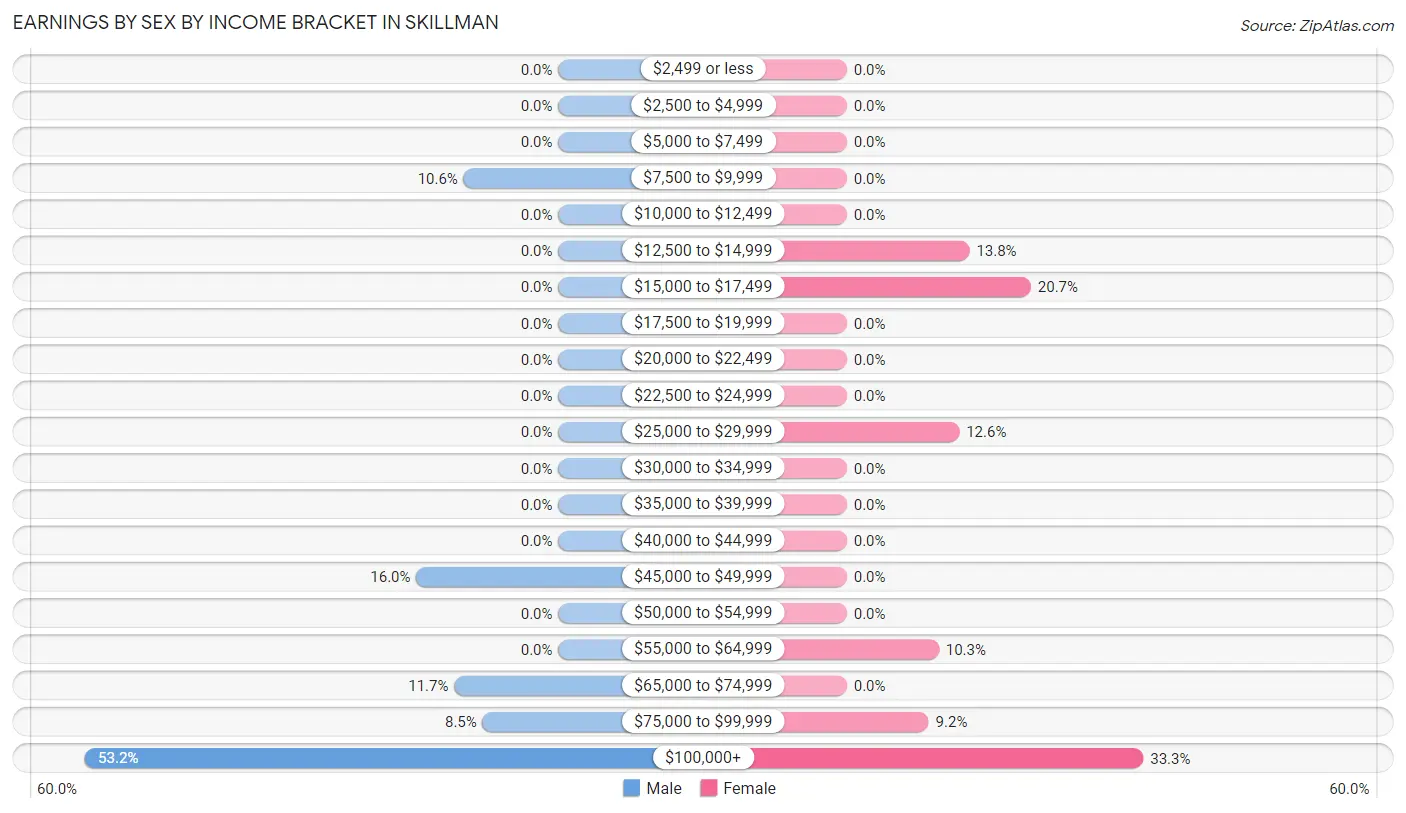
Earnings by Sex by Income Bracket in Skillman
The most common earnings brackets in Skillman are $100,000+ for men (50 | 53.2%) and $100,000+ for women (29 | 33.3%).
| Income | Male | Female |
| $2,499 or less | 0 (0.0%) | 0 (0.0%) |
| $2,500 to $4,999 | 0 (0.0%) | 0 (0.0%) |
| $5,000 to $7,499 | 0 (0.0%) | 0 (0.0%) |
| $7,500 to $9,999 | 10 (10.6%) | 0 (0.0%) |
| $10,000 to $12,499 | 0 (0.0%) | 0 (0.0%) |
| $12,500 to $14,999 | 0 (0.0%) | 12 (13.8%) |
| $15,000 to $17,499 | 0 (0.0%) | 18 (20.7%) |
| $17,500 to $19,999 | 0 (0.0%) | 0 (0.0%) |
| $20,000 to $22,499 | 0 (0.0%) | 0 (0.0%) |
| $22,500 to $24,999 | 0 (0.0%) | 0 (0.0%) |
| $25,000 to $29,999 | 0 (0.0%) | 11 (12.6%) |
| $30,000 to $34,999 | 0 (0.0%) | 0 (0.0%) |
| $35,000 to $39,999 | 0 (0.0%) | 0 (0.0%) |
| $40,000 to $44,999 | 0 (0.0%) | 0 (0.0%) |
| $45,000 to $49,999 | 15 (16.0%) | 0 (0.0%) |
| $50,000 to $54,999 | 0 (0.0%) | 0 (0.0%) |
| $55,000 to $64,999 | 0 (0.0%) | 9 (10.3%) |
| $65,000 to $74,999 | 11 (11.7%) | 0 (0.0%) |
| $75,000 to $99,999 | 8 (8.5%) | 8 (9.2%) |
| $100,000+ | 50 (53.2%) | 29 (33.3%) |
| Total | 94 (100.0%) | 87 (100.0%) |
Earnings by Sex by Educational Attainment in Skillman
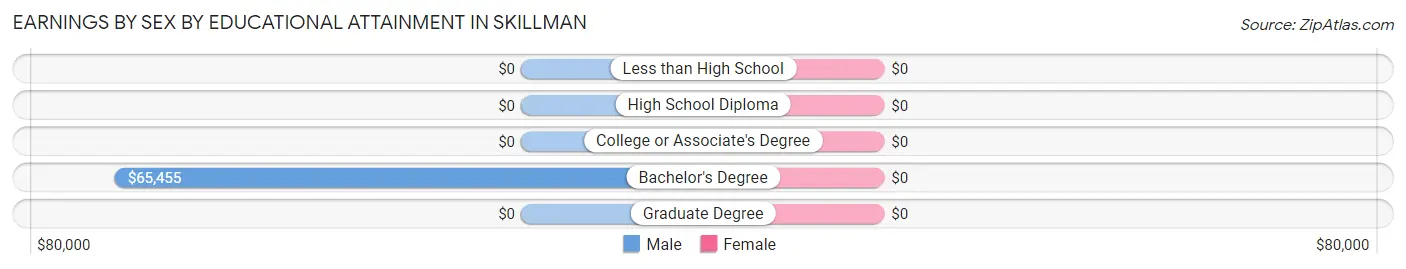
| Educational Attainment | Male Income | Female Income |
| Less than High School | - | - |
| High School Diploma | - | - |
| College or Associate's Degree | - | - |
| Bachelor's Degree | $65,455 | $0 |
| Graduate Degree | - | - |
| Total | $119,722 | $0 |
Family Income in Skillman
Family Income Brackets in Skillman
According to the Skillman family income data, there are 37 families falling into the $200,000+ income range, which is the most common income bracket and makes up 50.7% of all families.
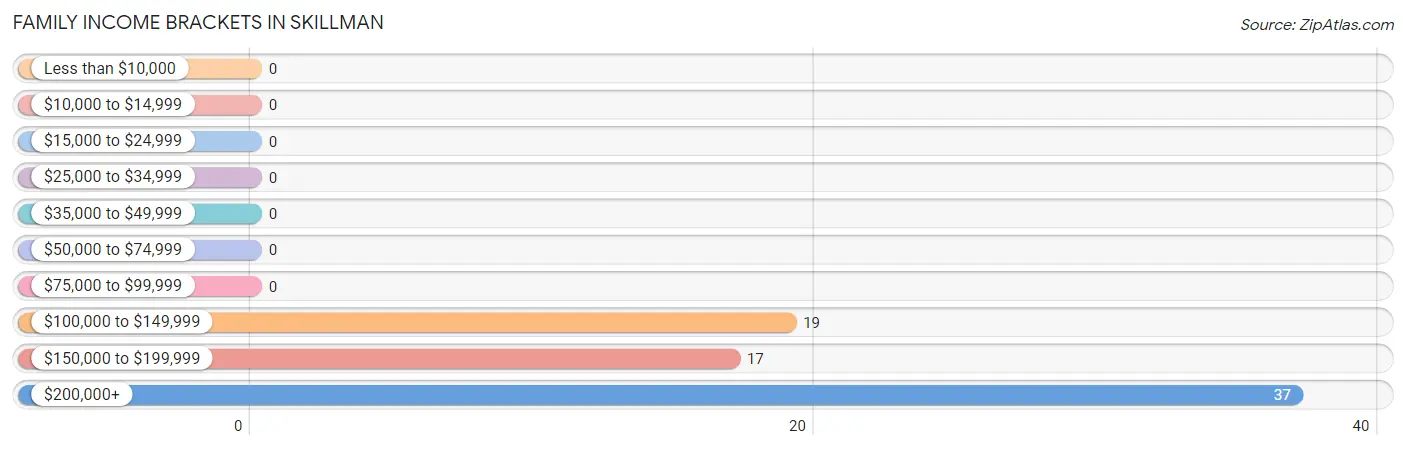
| Income Bracket | # Families | % Families |
| Less than $10,000 | 0 | 0.0% |
| $10,000 to $14,999 | 0 | 0.0% |
| $15,000 to $24,999 | 0 | 0.0% |
| $25,000 to $34,999 | 0 | 0.0% |
| $35,000 to $49,999 | 0 | 0.0% |
| $50,000 to $74,999 | 0 | 0.0% |
| $75,000 to $99,999 | 0 | 0.0% |
| $100,000 to $149,999 | 19 | 26.0% |
| $150,000 to $199,999 | 17 | 23.3% |
| $200,000+ | 37 | 50.7% |
Family Income by Famaliy Size in Skillman
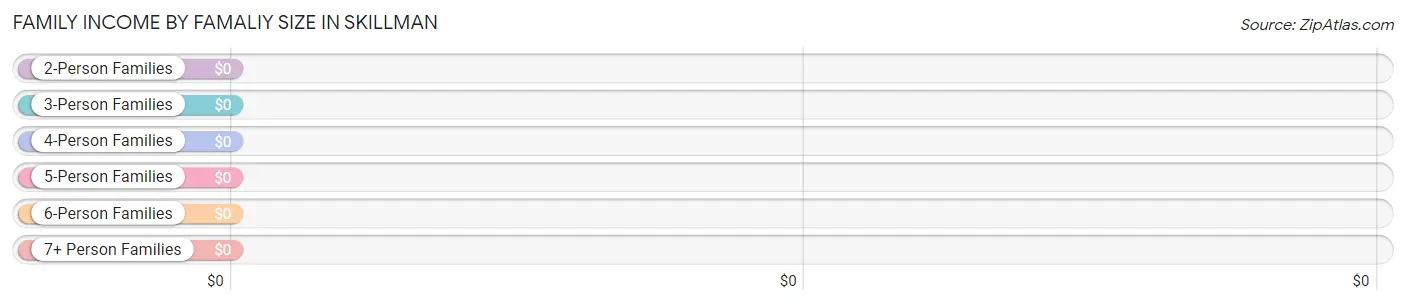
| Income Bracket | # Families | Median Income |
| 2-Person Families | 17 (23.3%) | $0 |
| 3-Person Families | 28 (38.4%) | $0 |
| 4-Person Families | 21 (28.8%) | $0 |
| 5-Person Families | 7 (9.6%) | $0 |
| 6-Person Families | 0 (0.0%) | $0 |
| 7+ Person Families | 0 (0.0%) | $0 |
| Total | 73 (100.0%) | $217,679 |
Family Income by Number of Earners in Skillman
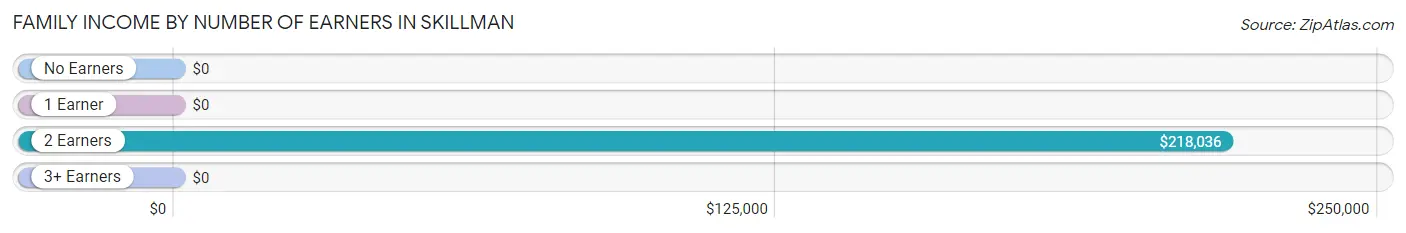
| Number of Earners | # Families | Median Income |
| No Earners | 0 (0.0%) | $0 |
| 1 Earner | 29 (39.7%) | $0 |
| 2 Earners | 37 (50.7%) | $218,036 |
| 3+ Earners | 7 (9.6%) | $0 |
| Total | 73 (100.0%) | $217,679 |
Household Income in Skillman
Household Income Brackets in Skillman
With 37 households falling in the category, the $200,000+ income range is the most frequent in Skillman, accounting for 32.5% of all households.
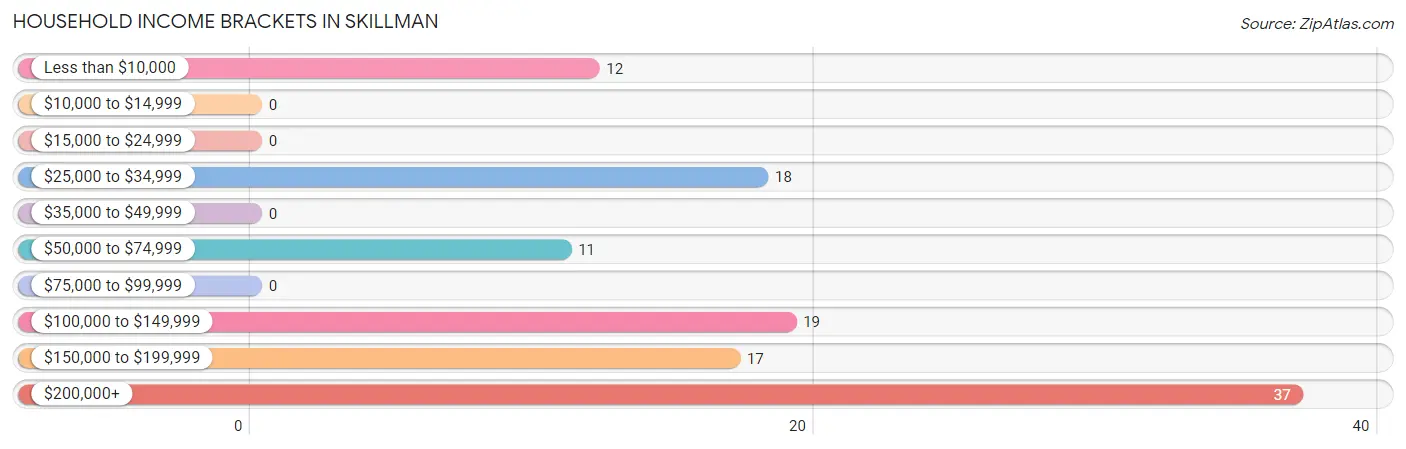
| Income Bracket | # Households | % Households |
| Less than $10,000 | 12 | 10.5% |
| $10,000 to $14,999 | 0 | 0.0% |
| $15,000 to $24,999 | 0 | 0.0% |
| $25,000 to $34,999 | 18 | 15.8% |
| $35,000 to $49,999 | 0 | 0.0% |
| $50,000 to $74,999 | 11 | 9.6% |
| $75,000 to $99,999 | 0 | 0.0% |
| $100,000 to $149,999 | 19 | 16.7% |
| $150,000 to $199,999 | 17 | 14.9% |
| $200,000+ | 37 | 32.5% |
Household Income by Householder Age in Skillman
The median household income in Skillman is $132,105, with the highest median household income of $131,382 found in the 25 to 44 years age bracket for the primary householder. A total of 43 households (37.7%) fall into this category.
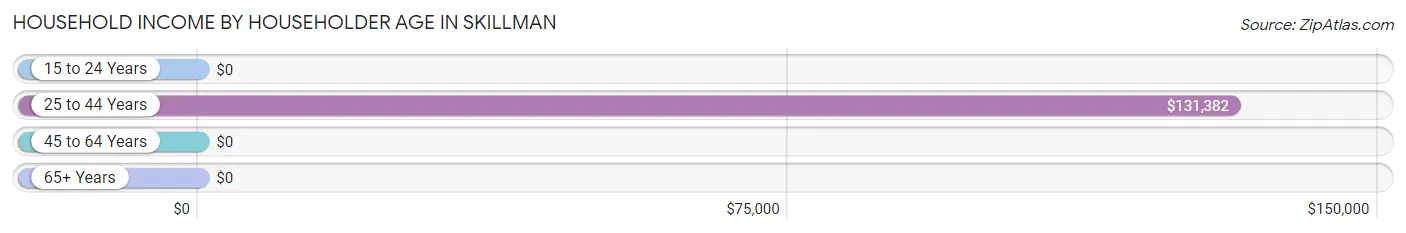
| Income Bracket | # Households | Median Income |
| 15 to 24 Years | 0 (0.0%) | $0 |
| 25 to 44 Years | 43 (37.7%) | $131,382 |
| 45 to 64 Years | 51 (44.7%) | $0 |
| 65+ Years | 20 (17.5%) | $0 |
| Total | 114 (100.0%) | $132,105 |
Poverty in Skillman
Income Below Poverty by Sex and Age in Skillman
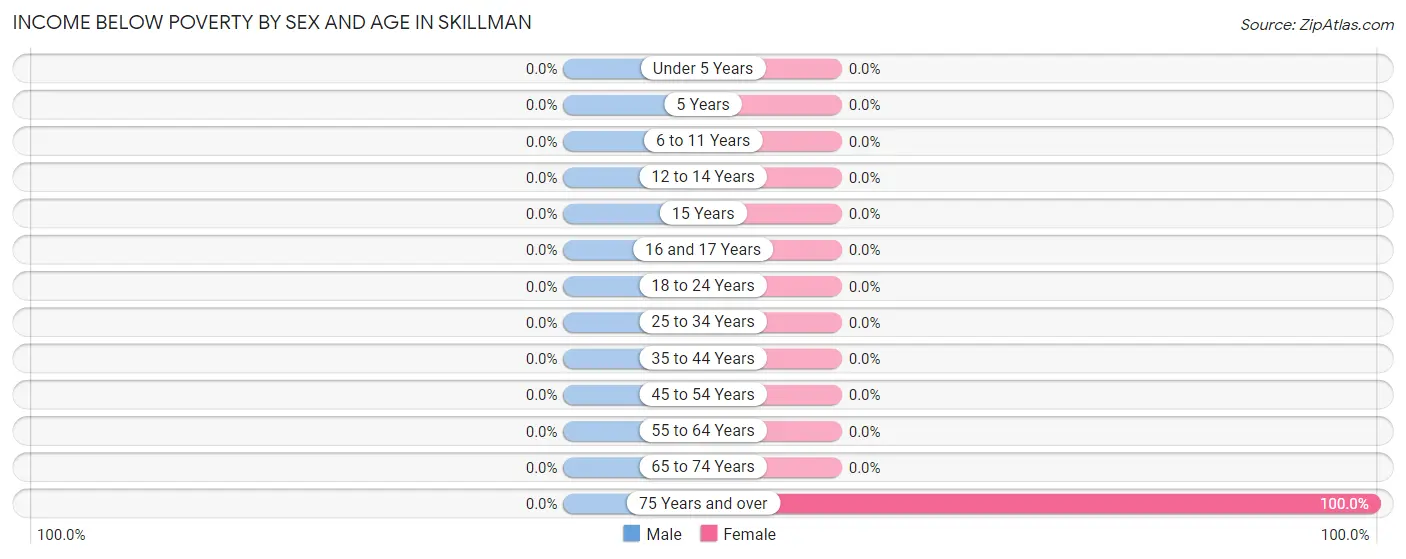
| Age Bracket | Male | Female |
| Under 5 Years | 0 (0.0%) | 0 (0.0%) |
| 5 Years | 0 (0.0%) | 0 (0.0%) |
| 6 to 11 Years | 0 (0.0%) | 0 (0.0%) |
| 12 to 14 Years | 0 (0.0%) | 0 (0.0%) |
| 15 Years | 0 (0.0%) | 0 (0.0%) |
| 16 and 17 Years | 0 (0.0%) | 0 (0.0%) |
| 18 to 24 Years | 0 (0.0%) | 0 (0.0%) |
| 25 to 34 Years | 0 (0.0%) | 0 (0.0%) |
| 35 to 44 Years | 0 (0.0%) | 0 (0.0%) |
| 45 to 54 Years | 0 (0.0%) | 0 (0.0%) |
| 55 to 64 Years | 0 (0.0%) | 0 (0.0%) |
| 65 to 74 Years | 0 (0.0%) | 0 (0.0%) |
| 75 Years and over | 0 (0.0%) | 12 (100.0%) |
| Total | 0 (0.0%) | 12 (8.1%) |
Income Above Poverty by Sex and Age in Skillman
According to the poverty statistics in Skillman, males aged 5 years and females aged under 5 years are the age groups that are most secure financially, with 100.0% of males and 100.0% of females in these age groups living above the poverty line.
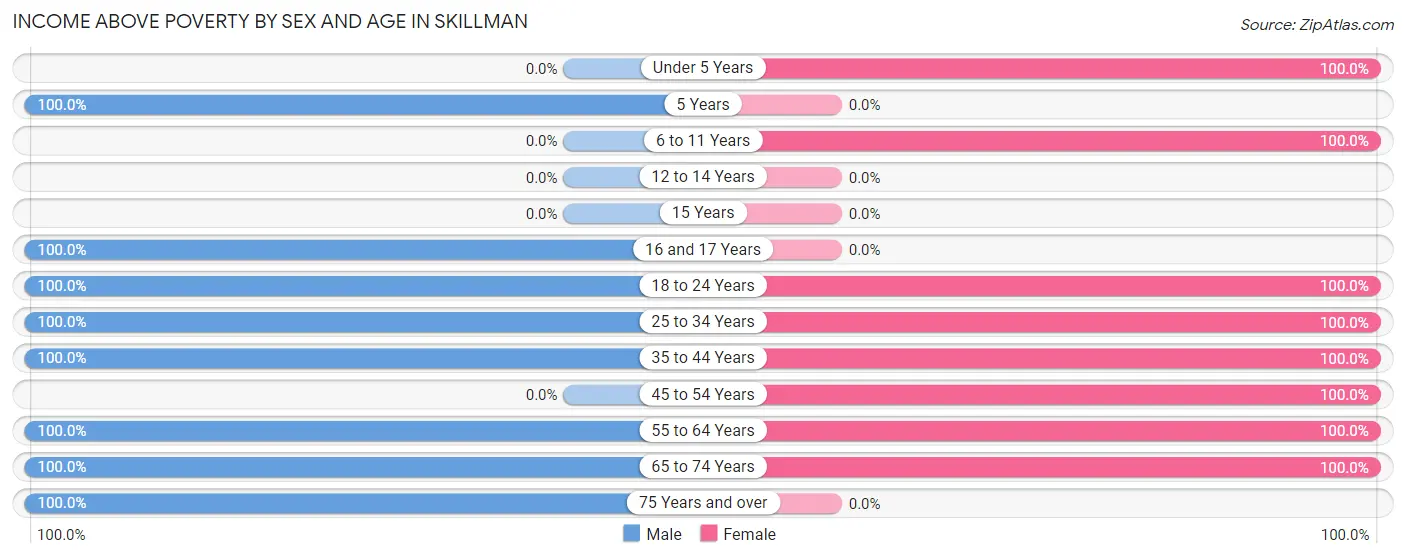
| Age Bracket | Male | Female |
| Under 5 Years | 0 (0.0%) | 16 (100.0%) |
| 5 Years | 19 (100.0%) | 0 (0.0%) |
| 6 to 11 Years | 0 (0.0%) | 24 (100.0%) |
| 12 to 14 Years | 0 (0.0%) | 0 (0.0%) |
| 15 Years | 0 (0.0%) | 0 (0.0%) |
| 16 and 17 Years | 8 (100.0%) | 0 (0.0%) |
| 18 to 24 Years | 10 (100.0%) | 12 (100.0%) |
| 25 to 34 Years | 34 (100.0%) | 8 (100.0%) |
| 35 to 44 Years | 34 (100.0%) | 13 (100.0%) |
| 45 to 54 Years | 0 (0.0%) | 9 (100.0%) |
| 55 to 64 Years | 26 (100.0%) | 43 (100.0%) |
| 65 to 74 Years | 10 (100.0%) | 11 (100.0%) |
| 75 Years and over | 8 (100.0%) | 0 (0.0%) |
| Total | 149 (100.0%) | 136 (91.9%) |
Income Below Poverty Among Married-Couple Families in Skillman
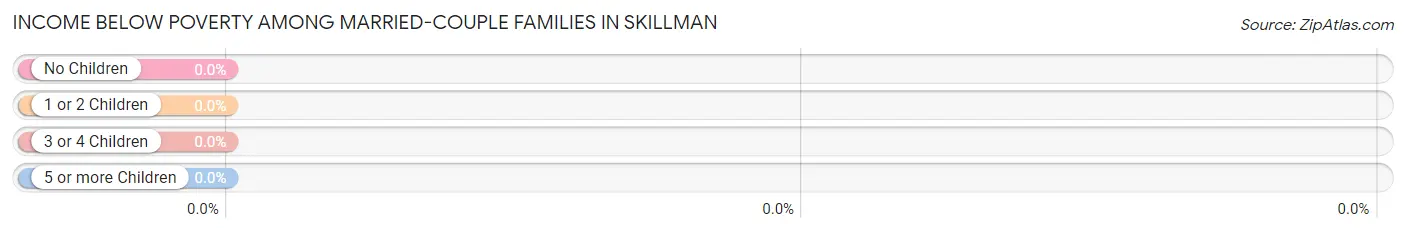
| Children | Above Poverty | Below Poverty |
| No Children | 17 (100.0%) | 0 (0.0%) |
| 1 or 2 Children | 13 (100.0%) | 0 (0.0%) |
| 3 or 4 Children | 0 (0.0%) | 0 (0.0%) |
| 5 or more Children | 0 (0.0%) | 0 (0.0%) |
| Total | 30 (100.0%) | 0 (0.0%) |
Income Below Poverty Among Single-Parent Households in Skillman
| Children | Single Father | Single Mother |
| No Children | 0 (0.0%) | 0 (0.0%) |
| 1 or 2 Children | 0 (0.0%) | 0 (0.0%) |
| 3 or 4 Children | 0 (0.0%) | 0 (0.0%) |
| 5 or more Children | 0 (0.0%) | 0 (0.0%) |
| Total | 0 (0.0%) | 0 (0.0%) |
Income Below Poverty Among Married-Couple vs Single-Parent Households in Skillman
| Children | Married-Couple Families | Single-Parent Households |
| No Children | 0 (0.0%) | 0 (0.0%) |
| 1 or 2 Children | 0 (0.0%) | 0 (0.0%) |
| 3 or 4 Children | 0 (0.0%) | 0 (0.0%) |
| 5 or more Children | 0 (0.0%) | 0 (0.0%) |
| Total | 0 (0.0%) | 0 (0.0%) |
Race in Skillman
The most populous races in Skillman are White / Caucasian (218 | 73.4%), Black / African American (64 | 21.5%), and Hispanic or Latino (38 | 12.8%).
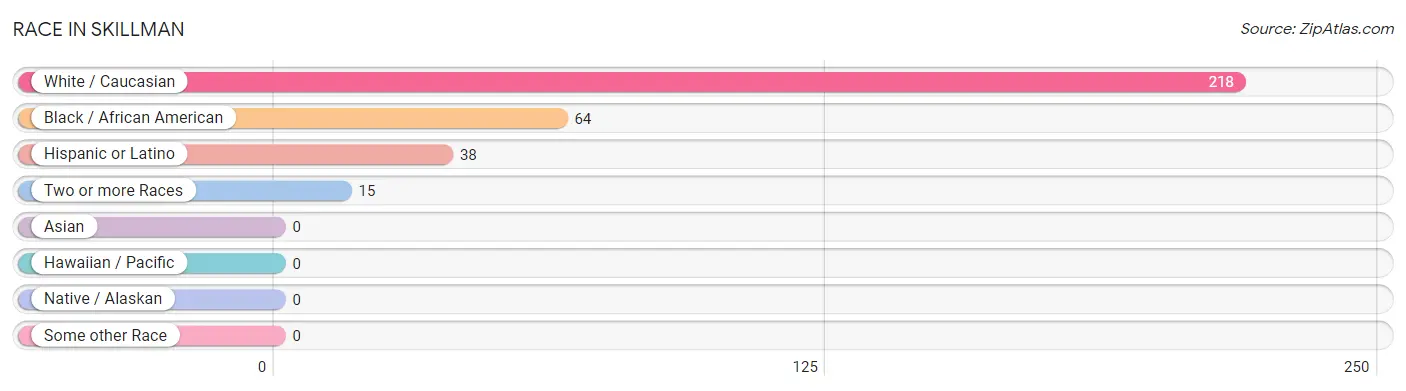
| Race | # Population | % Population |
| Asian | 0 | 0.0% |
| Black / African American | 64 | 21.5% |
| Hawaiian / Pacific | 0 | 0.0% |
| Hispanic or Latino | 38 | 12.8% |
| Native / Alaskan | 0 | 0.0% |
| White / Caucasian | 218 | 73.4% |
| Two or more Races | 15 | 5.1% |
| Some other Race | 0 | 0.0% |
| Total | 297 | 100.0% |
Ancestry in Skillman
The most populous ancestries reported in Skillman are Irish (80 | 26.9%), German (63 | 21.2%), Colombian (30 | 10.1%), South American (30 | 10.1%), and English (28 | 9.4%), together accounting for 77.8% of all Skillman residents.
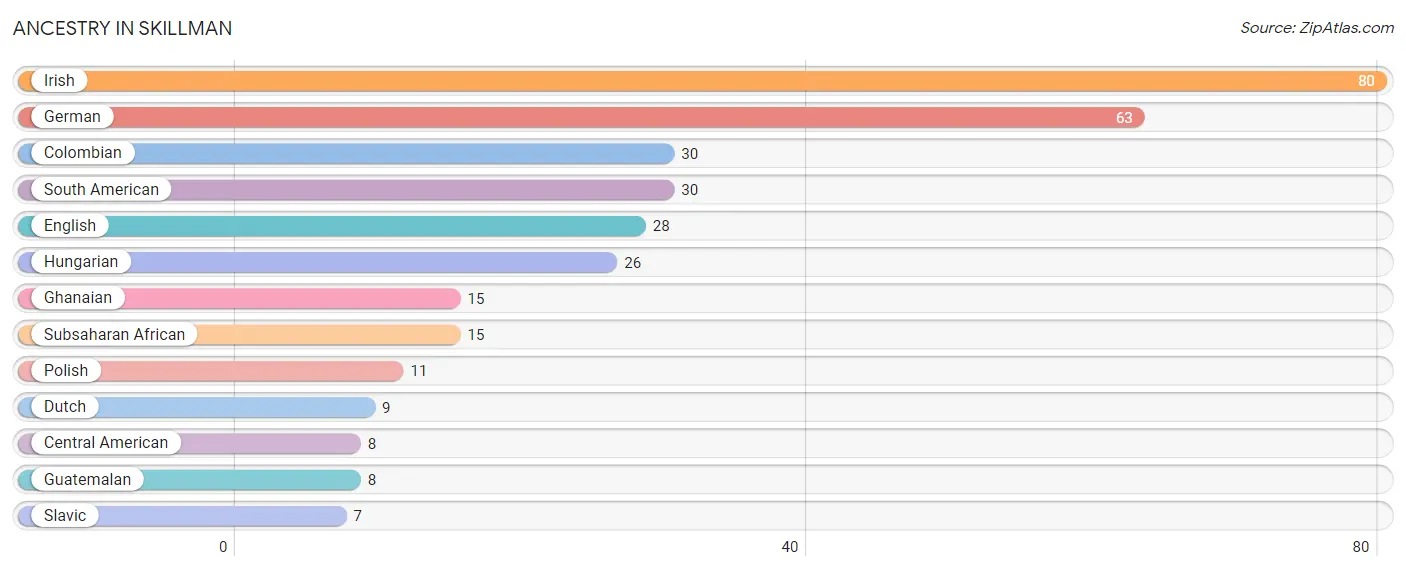
| Ancestry | # Population | % Population |
| Central American | 8 | 2.7% |
| Colombian | 30 | 10.1% |
| Dutch | 9 | 3.0% |
| English | 28 | 9.4% |
| German | 63 | 21.2% |
| Ghanaian | 15 | 5.1% |
| Guatemalan | 8 | 2.7% |
| Hungarian | 26 | 8.7% |
| Irish | 80 | 26.9% |
| Polish | 11 | 3.7% |
| Slavic | 7 | 2.4% |
| South American | 30 | 10.1% |
| Subsaharan African | 15 | 5.1% | View All 13 Rows |
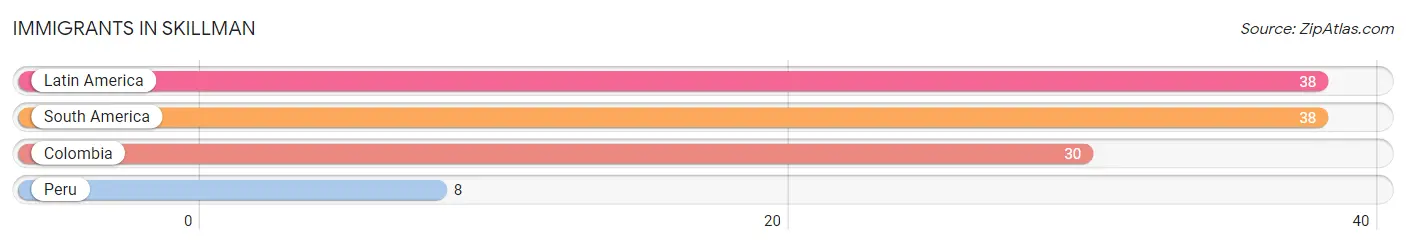
Immigrants in Skillman
The most numerous immigrant groups reported in Skillman came from Latin America (38 | 12.8%), South America (38 | 12.8%), Colombia (30 | 10.1%), and Peru (8 | 2.7%), together accounting for 38.4% of all Skillman residents.
| Immigration Origin | # Population | % Population |
| Colombia | 30 | 10.1% |
| Latin America | 38 | 12.8% |
| Peru | 8 | 2.7% |
| South America | 38 | 12.8% | View All 4 Rows |
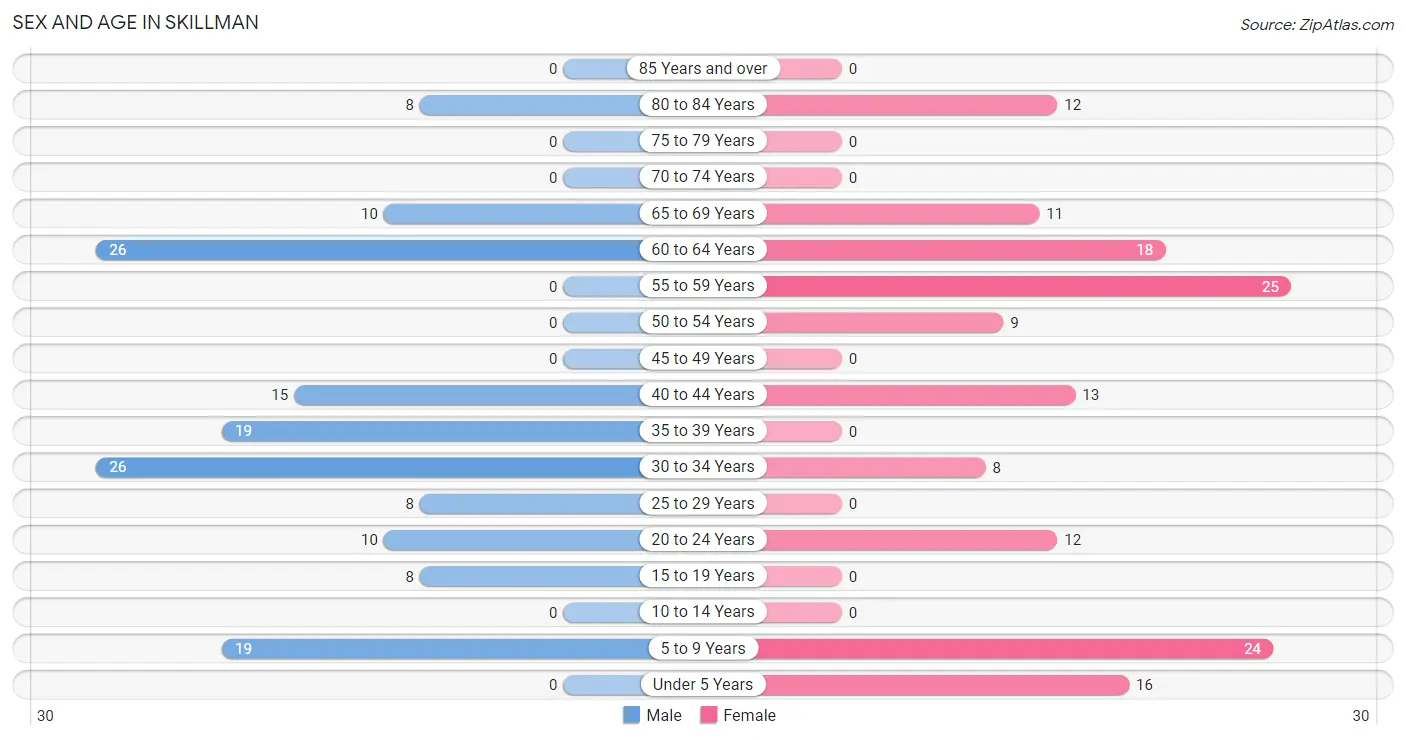
Sex and Age in Skillman
Sex and Age in Skillman
The most populous age groups in Skillman are 30 to 34 Years (26 | 17.4%) for men and 55 to 59 Years (25 | 16.9%) for women.
| Age Bracket | Male | Female |
| Under 5 Years | 0 (0.0%) | 16 (10.8%) |
| 5 to 9 Years | 19 (12.8%) | 24 (16.2%) |
| 10 to 14 Years | 0 (0.0%) | 0 (0.0%) |
| 15 to 19 Years | 8 (5.4%) | 0 (0.0%) |
| 20 to 24 Years | 10 (6.7%) | 12 (8.1%) |
| 25 to 29 Years | 8 (5.4%) | 0 (0.0%) |
| 30 to 34 Years | 26 (17.4%) | 8 (5.4%) |
| 35 to 39 Years | 19 (12.8%) | 0 (0.0%) |
| 40 to 44 Years | 15 (10.1%) | 13 (8.8%) |
| 45 to 49 Years | 0 (0.0%) | 0 (0.0%) |
| 50 to 54 Years | 0 (0.0%) | 9 (6.1%) |
| 55 to 59 Years | 0 (0.0%) | 25 (16.9%) |
| 60 to 64 Years | 26 (17.4%) | 18 (12.2%) |
| 65 to 69 Years | 10 (6.7%) | 11 (7.4%) |
| 70 to 74 Years | 0 (0.0%) | 0 (0.0%) |
| 75 to 79 Years | 0 (0.0%) | 0 (0.0%) |
| 80 to 84 Years | 8 (5.4%) | 12 (8.1%) |
| 85 Years and over | 0 (0.0%) | 0 (0.0%) |
| Total | 149 (100.0%) | 148 (100.0%) |
Families and Households in Skillman
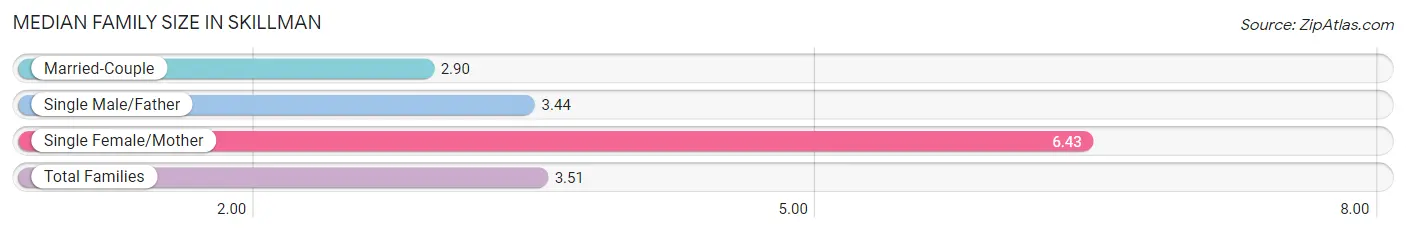
Median Family Size in Skillman
The median family size in Skillman is 3.51 persons per family, with single female/mother families (7 | 9.6%) accounting for the largest median family size of 6.43 persons per family. On the other hand, married-couple families (30 | 41.1%) represent the smallest median family size with 2.90 persons per family.
| Family Type | # Families | Family Size |
| Married-Couple | 30 (41.1%) | 2.90 |
| Single Male/Father | 36 (49.3%) | 3.44 |
| Single Female/Mother | 7 (9.6%) | 6.43 |
| Total Families | 73 (100.0%) | 3.51 |
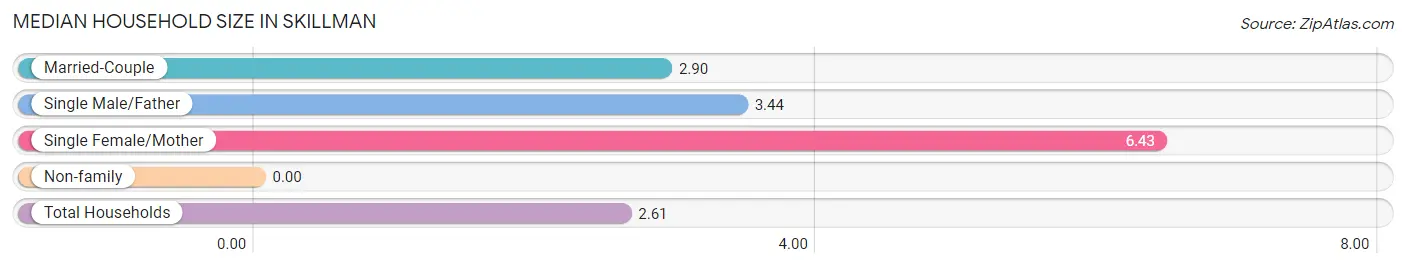
Median Household Size in Skillman
| Household Type | # Households | Household Size |
| Married-Couple | 30 (26.3%) | 2.90 |
| Single Male/Father | 36 (31.6%) | 3.44 |
| Single Female/Mother | 7 (6.1%) | 6.43 |
| Non-family | 41 (36.0%) | - |
| Total Households | 114 (100.0%) | 2.61 |
Household Size by Marriage Status in Skillman
Out of a total of 114 households in Skillman, 73 (64.0%) are family households, while 41 (36.0%) are nonfamily households. The most numerous type of family households are 3-person households, comprising 28, and the most common type of nonfamily households are 1-person households, comprising 41.
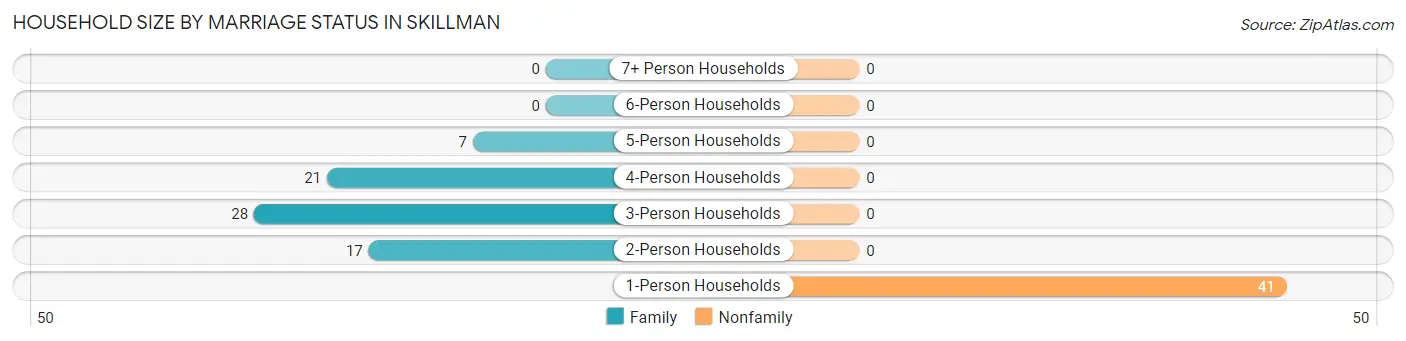
| Household Size | Family Households | Nonfamily Households |
| 1-Person Households | - | 41 (36.0%) |
| 2-Person Households | 17 (14.9%) | 0 (0.0%) |
| 3-Person Households | 28 (24.6%) | 0 (0.0%) |
| 4-Person Households | 21 (18.4%) | 0 (0.0%) |
| 5-Person Households | 7 (6.1%) | 0 (0.0%) |
| 6-Person Households | 0 (0.0%) | 0 (0.0%) |
| 7+ Person Households | 0 (0.0%) | 0 (0.0%) |
| Total | 73 (64.0%) | 41 (36.0%) |
Female Fertility in Skillman
Fertility by Age in Skillman
| Age Bracket | Women with Births | Births / 1,000 Women |
| 15 to 19 years | 0 (0.0%) | 0.0 |
| 20 to 34 years | 0 (0.0%) | 0.0 |
| 35 to 50 years | 0 (0.0%) | 0.0 |
| Total | 0 (0.0%) | 0.0 |
Fertility by Age by Marriage Status in Skillman
| Age Bracket | Married | Unmarried |
| 15 to 19 years | 0 (0.0%) | 0 (0.0%) |
| 20 to 34 years | 0 (0.0%) | 0 (0.0%) |
| 35 to 50 years | 0 (0.0%) | 0 (0.0%) |
| Total | 0 (0.0%) | 0 (0.0%) |
Fertility by Education in Skillman
| Educational Attainment | Women with Births | Births / 1,000 Women |
| Less than High School | 0 (0.0%) | 0.0 |
| High School Diploma | 0 (0.0%) | 0.0 |
| College or Associate's Degree | 0 (0.0%) | 0.0 |
| Bachelor's Degree | 0 (0.0%) | 0.0 |
| Graduate Degree | 0 (0.0%) | 0.0 |
| Total | 0 (0.0%) | 0.0 |
Fertility by Education by Marriage Status in Skillman
| Educational Attainment | Married | Unmarried |
| Less than High School | 0 (0.0%) | 0 (0.0%) |
| High School Diploma | 0 (0.0%) | 0 (0.0%) |
| College or Associate's Degree | 0 (0.0%) | 0 (0.0%) |
| Bachelor's Degree | 0 (0.0%) | 0 (0.0%) |
| Graduate Degree | 0 (0.0%) | 0 (0.0%) |
| Total | 0 (0.0%) | 0 (0.0%) |
Employment Characteristics in Skillman
Employment by Class of Employer in Skillman
Among the 181 employed individuals in Skillman, private company employees (99 | 54.7%), local government employees (30 | 16.6%), and state government employees (30 | 16.6%) make up the most common classes of employment.
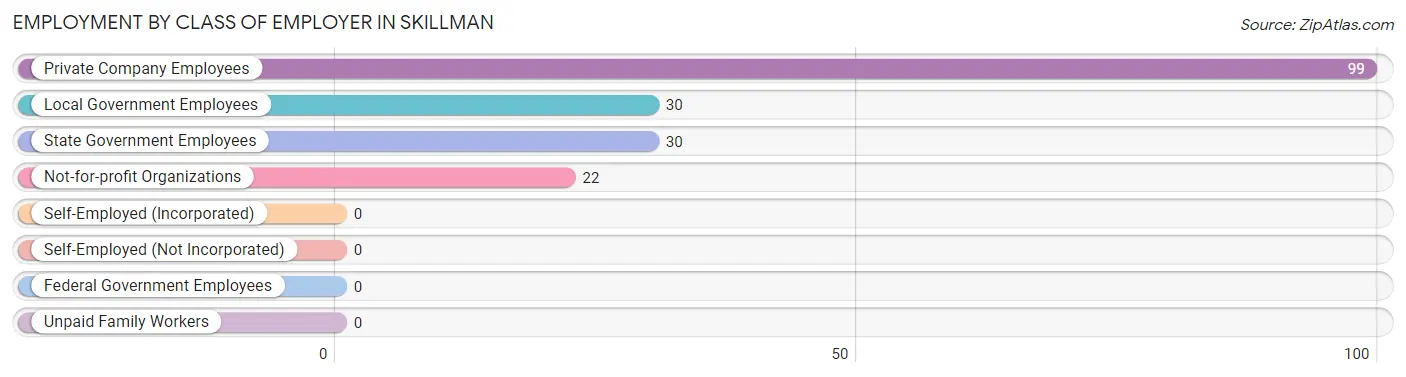
| Employer Class | # Employees | % Employees |
| Private Company Employees | 99 | 54.7% |
| Self-Employed (Incorporated) | 0 | 0.0% |
| Self-Employed (Not Incorporated) | 0 | 0.0% |
| Not-for-profit Organizations | 22 | 12.1% |
| Local Government Employees | 30 | 16.6% |
| State Government Employees | 30 | 16.6% |
| Federal Government Employees | 0 | 0.0% |
| Unpaid Family Workers | 0 | 0.0% |
| Total | 181 | 100.0% |
Employment Status by Age in Skillman
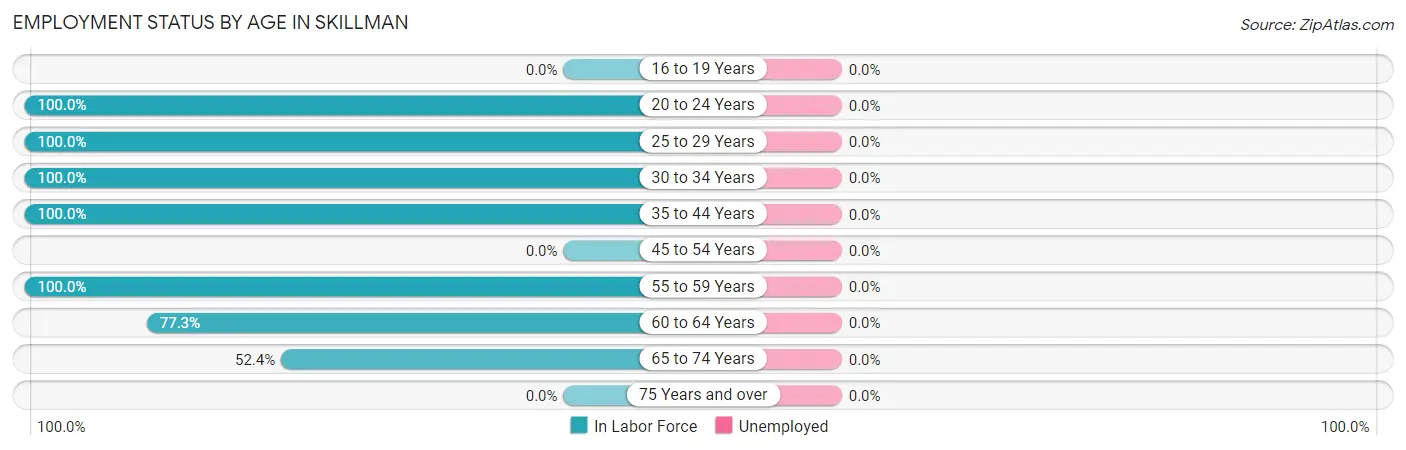
| Age Bracket | In Labor Force | Unemployed |
| 16 to 19 Years | 0 (0.0%) | 0 (0.0%) |
| 20 to 24 Years | 22 (100.0%) | 0 (0.0%) |
| 25 to 29 Years | 8 (100.0%) | 0 (0.0%) |
| 30 to 34 Years | 34 (100.0%) | 0 (0.0%) |
| 35 to 44 Years | 47 (100.0%) | 0 (0.0%) |
| 45 to 54 Years | 0 (0.0%) | 0 (0.0%) |
| 55 to 59 Years | 25 (100.0%) | 0 (0.0%) |
| 60 to 64 Years | 34 (77.3%) | 0 (0.0%) |
| 65 to 74 Years | 11 (52.4%) | 0 (0.0%) |
| 75 Years and over | 0 (0.0%) | 0 (0.0%) |
| Total | 181 (76.1%) | 0 (0.0%) |
Employment Status by Educational Attainment in Skillman
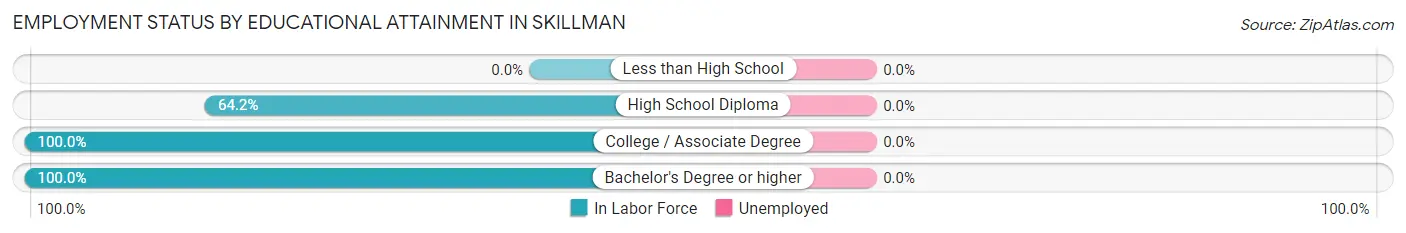
| Educational Attainment | In Labor Force | Unemployed |
| Less than High School | 0 (0.0%) | 0 (0.0%) |
| High School Diploma | 34 (64.2%) | 0 (0.0%) |
| College / Associate Degree | 27 (100.0%) | 0 (0.0%) |
| Bachelor's Degree or higher | 87 (100.0%) | 0 (0.0%) |
| Total | 148 (88.6%) | 0 (0.0%) |
Employment Occupations by Sex in Skillman
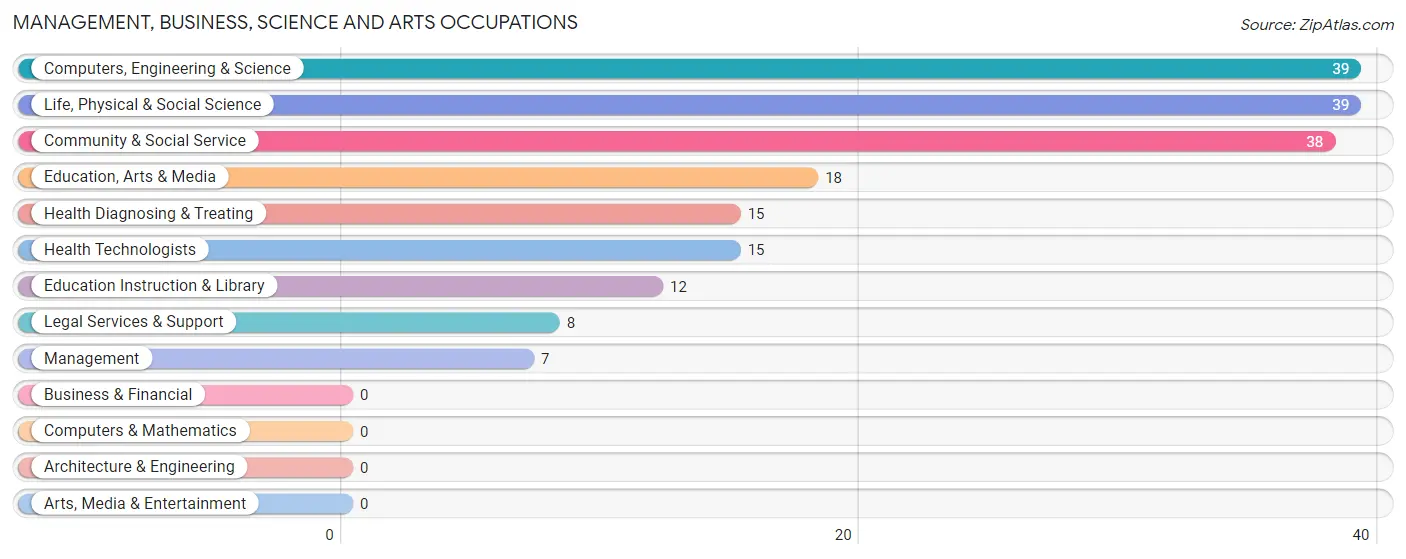
Management, Business, Science and Arts Occupations
The most common Management, Business, Science and Arts occupations in Skillman are Computers, Engineering & Science (39 | 21.5%), Life, Physical & Social Science (39 | 21.5%), Community & Social Service (38 | 21.0%), Education, Arts & Media (18 | 9.9%), and Health Diagnosing & Treating (15 | 8.3%).
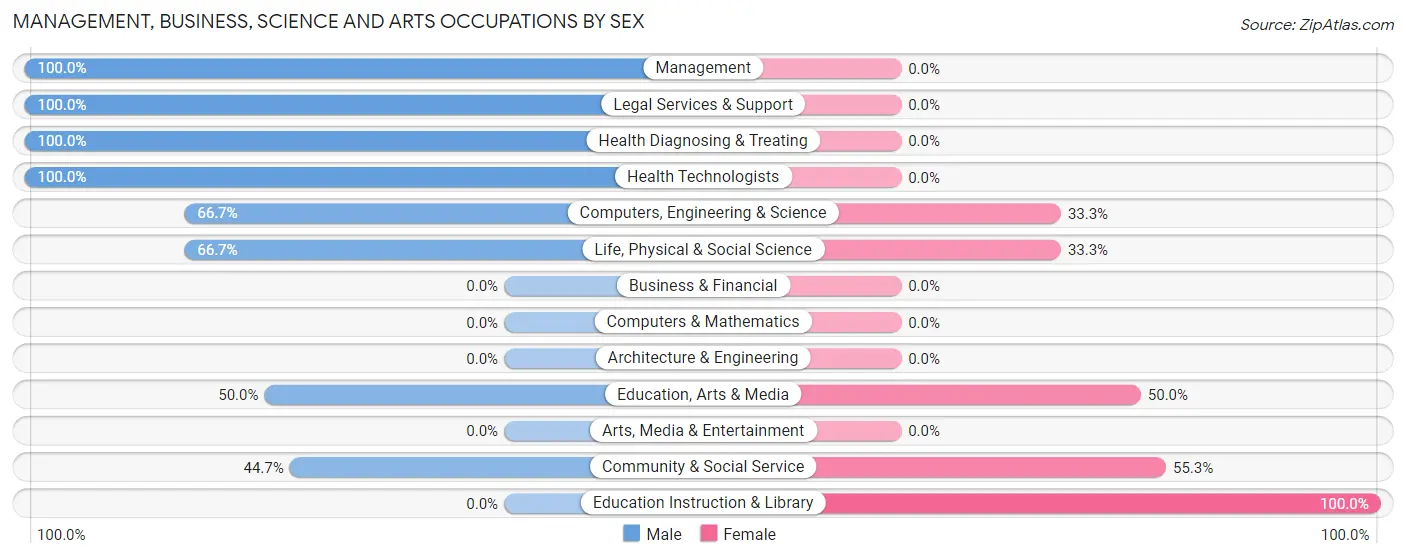
Management, Business, Science and Arts Occupations by Sex
Within the Management, Business, Science and Arts occupations in Skillman, the most male-oriented occupations are Management (100.0%), Legal Services & Support (100.0%), and Health Diagnosing & Treating (100.0%), while the most female-oriented occupations are Education Instruction & Library (100.0%), Community & Social Service (55.3%), and Education, Arts & Media (50.0%).
| Occupation | Male | Female |
| Management | 7 (100.0%) | 0 (0.0%) |
| Business & Financial | 0 (0.0%) | 0 (0.0%) |
| Computers, Engineering & Science | 26 (66.7%) | 13 (33.3%) |
| Computers & Mathematics | 0 (0.0%) | 0 (0.0%) |
| Architecture & Engineering | 0 (0.0%) | 0 (0.0%) |
| Life, Physical & Social Science | 26 (66.7%) | 13 (33.3%) |
| Community & Social Service | 17 (44.7%) | 21 (55.3%) |
| Education, Arts & Media | 9 (50.0%) | 9 (50.0%) |
| Legal Services & Support | 8 (100.0%) | 0 (0.0%) |
| Education Instruction & Library | 0 (0.0%) | 12 (100.0%) |
| Arts, Media & Entertainment | 0 (0.0%) | 0 (0.0%) |
| Health Diagnosing & Treating | 15 (100.0%) | 0 (0.0%) |
| Health Technologists | 15 (100.0%) | 0 (0.0%) |
| Total (Category) | 65 (65.7%) | 34 (34.3%) |
| Total (Overall) | 94 (51.9%) | 87 (48.1%) |
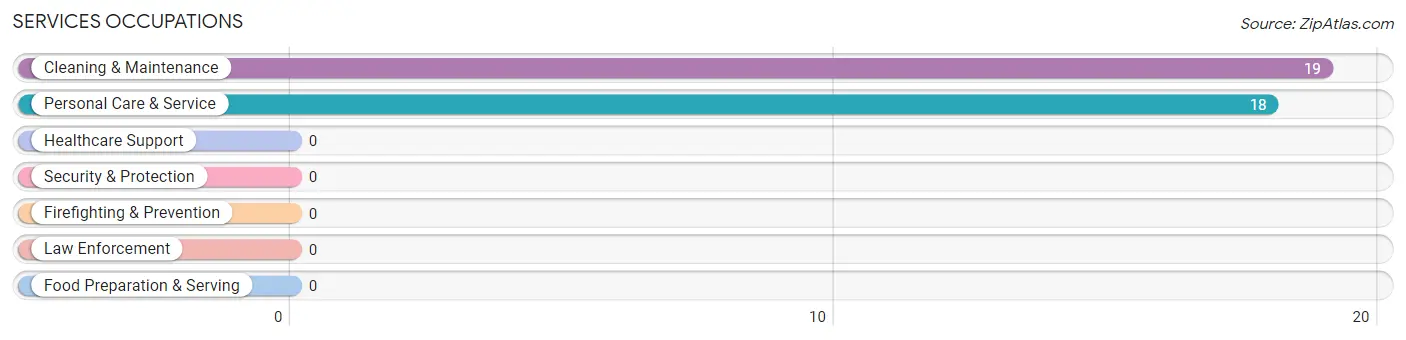
Services Occupations
The most common Services occupations in Skillman are Cleaning & Maintenance (19 | 10.5%), and Personal Care & Service (18 | 9.9%).
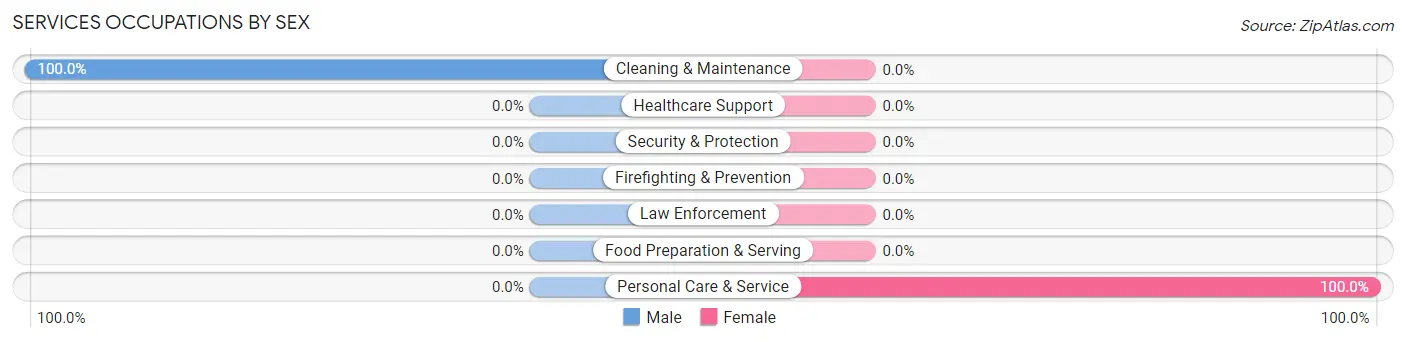
Services Occupations by Sex
| Occupation | Male | Female |
| Healthcare Support | 0 (0.0%) | 0 (0.0%) |
| Security & Protection | 0 (0.0%) | 0 (0.0%) |
| Firefighting & Prevention | 0 (0.0%) | 0 (0.0%) |
| Law Enforcement | 0 (0.0%) | 0 (0.0%) |
| Food Preparation & Serving | 0 (0.0%) | 0 (0.0%) |
| Cleaning & Maintenance | 19 (100.0%) | 0 (0.0%) |
| Personal Care & Service | 0 (0.0%) | 18 (100.0%) |
| Total (Category) | 19 (51.3%) | 18 (48.6%) |
| Total (Overall) | 94 (51.9%) | 87 (48.1%) |
Sales and Office Occupations
The most common Sales and Office occupations in Skillman are Office & Administration (28 | 15.5%), and Sales & Related (7 | 3.9%).
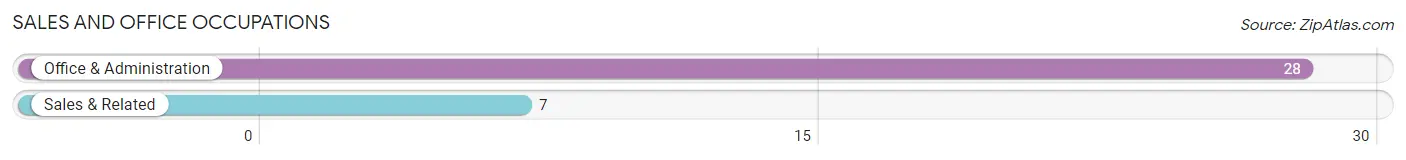
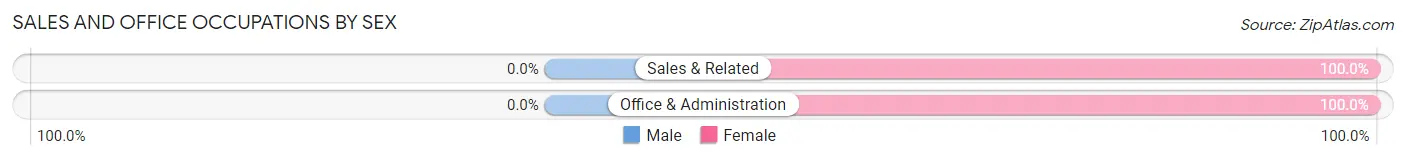
Sales and Office Occupations by Sex
| Occupation | Male | Female |
| Sales & Related | 0 (0.0%) | 7 (100.0%) |
| Office & Administration | 0 (0.0%) | 28 (100.0%) |
| Total (Category) | 0 (0.0%) | 35 (100.0%) |
| Total (Overall) | 94 (51.9%) | 87 (48.1%) |
Natural Resources, Construction and Maintenance Occupations
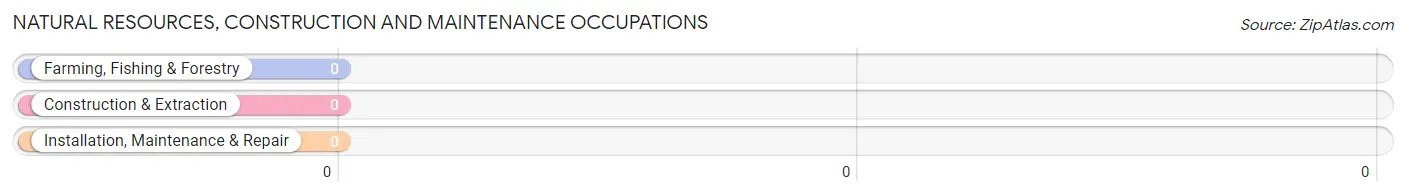
Natural Resources, Construction and Maintenance Occupations by Sex
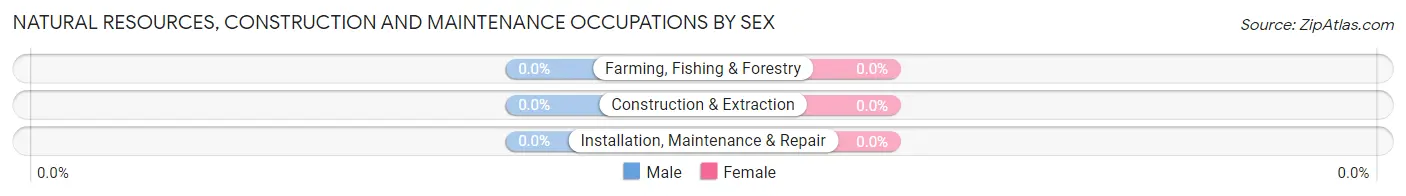
| Occupation | Male | Female |
| Farming, Fishing & Forestry | 0 (0.0%) | 0 (0.0%) |
| Construction & Extraction | 0 (0.0%) | 0 (0.0%) |
| Installation, Maintenance & Repair | 0 (0.0%) | 0 (0.0%) |
| Total (Category) | 0 (0.0%) | 0 (0.0%) |
| Total (Overall) | 94 (51.9%) | 87 (48.1%) |
Production, Transportation and Moving Occupations
The most common Production, Transportation and Moving occupations in Skillman are , and Transportation (10 | 5.5%).
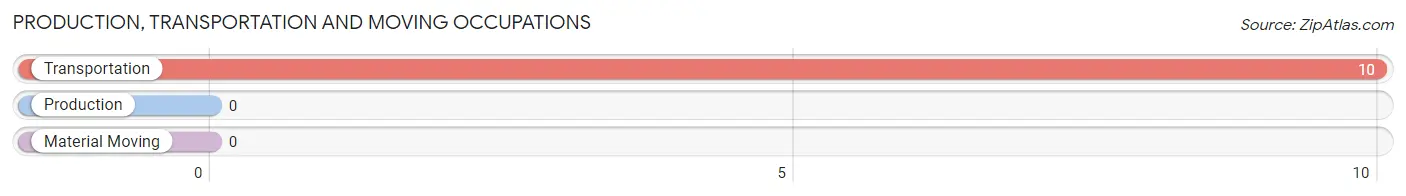
Production, Transportation and Moving Occupations by Sex
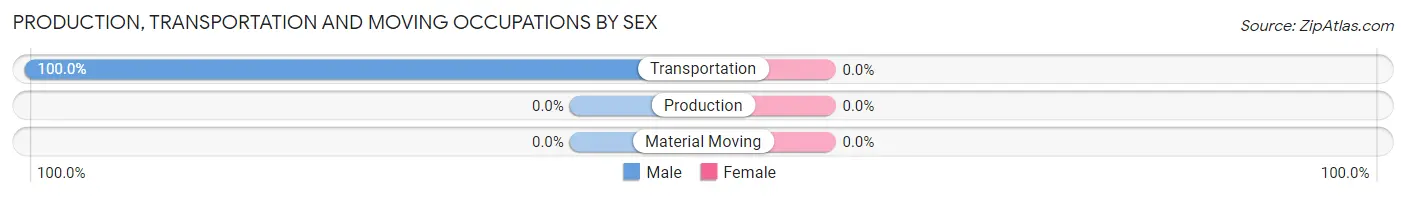
| Occupation | Male | Female |
| Production | 0 (0.0%) | 0 (0.0%) |
| Transportation | 10 (100.0%) | 0 (0.0%) |
| Material Moving | 0 (0.0%) | 0 (0.0%) |
| Total (Category) | 10 (100.0%) | 0 (0.0%) |
| Total (Overall) | 94 (51.9%) | 87 (48.1%) |
Employment Industries by Sex in Skillman
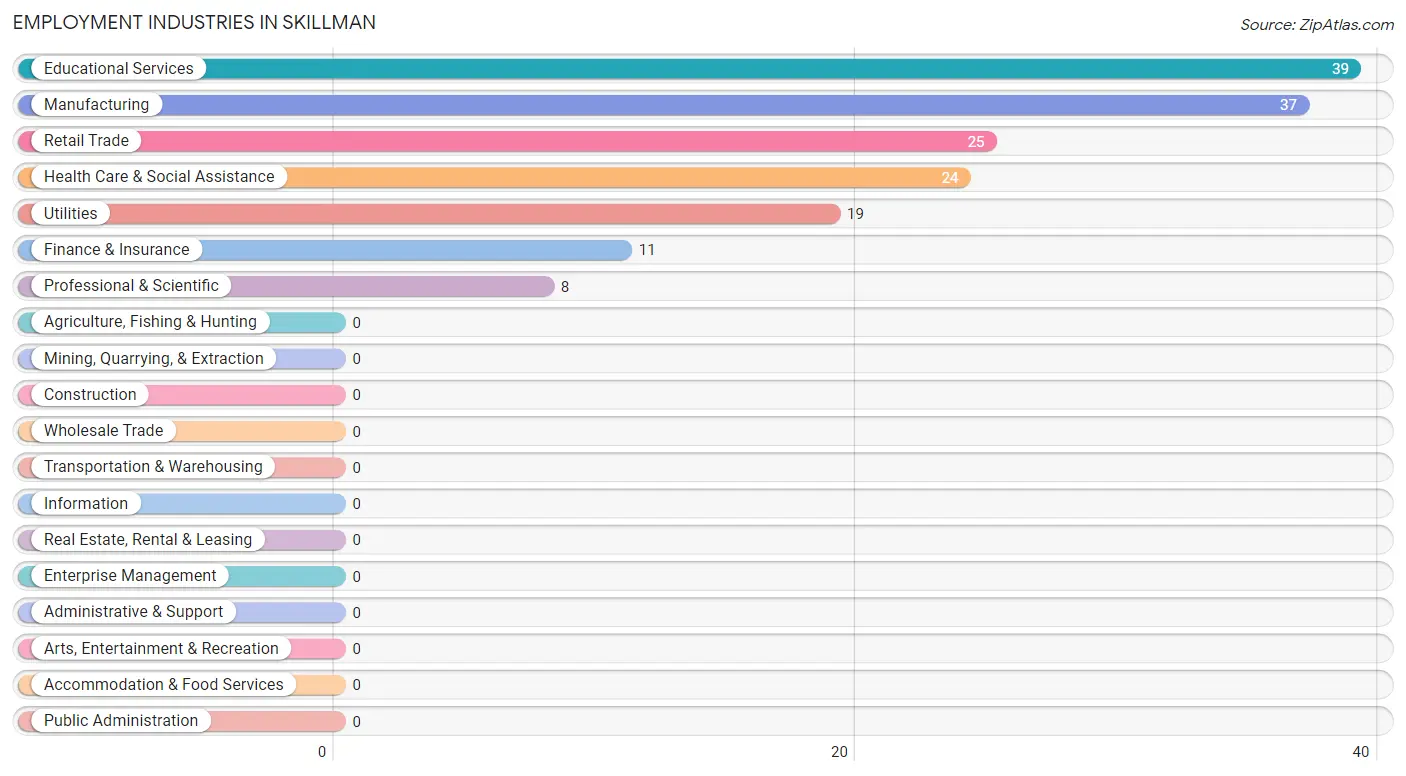
Employment Industries in Skillman
The major employment industries in Skillman include Educational Services (39 | 21.5%), Manufacturing (37 | 20.4%), Retail Trade (25 | 13.8%), Health Care & Social Assistance (24 | 13.3%), and Utilities (19 | 10.5%).
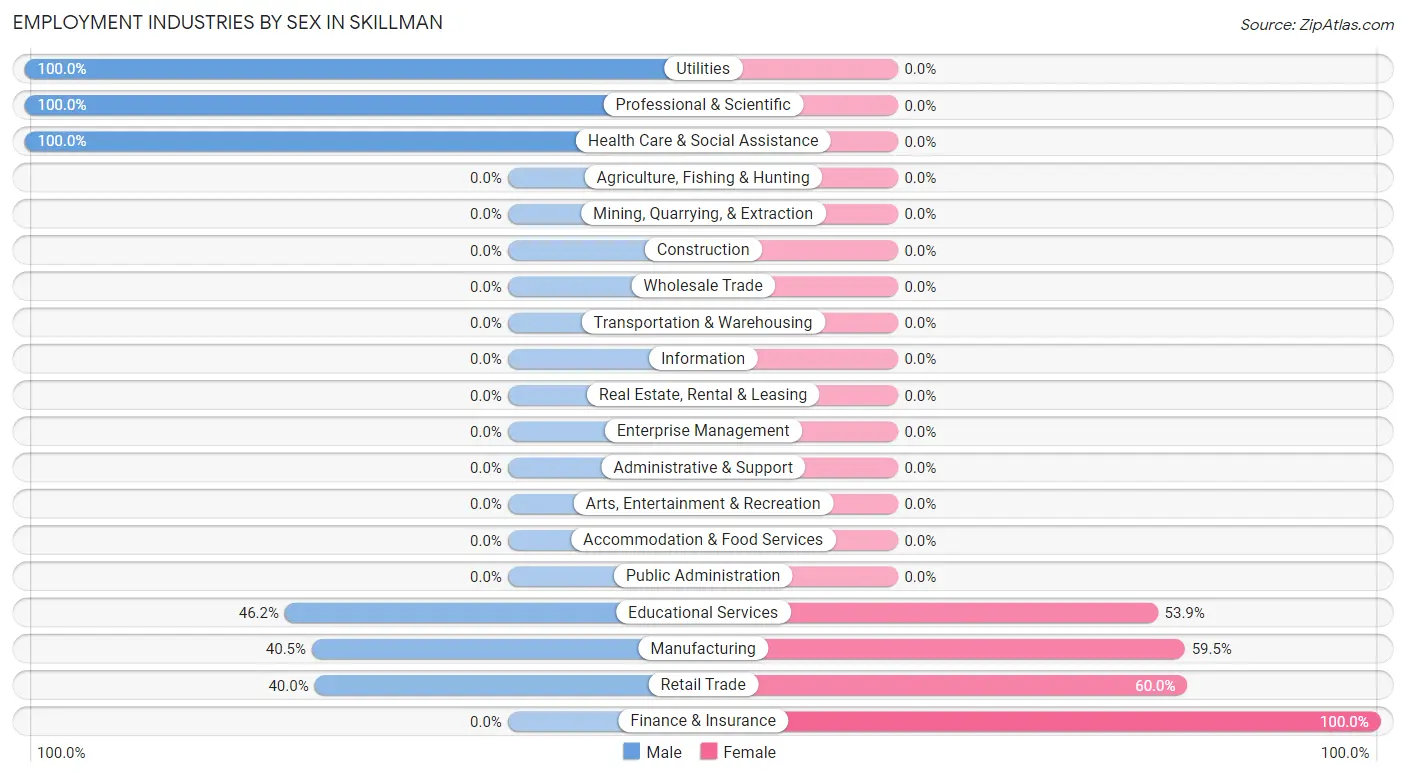
Employment Industries by Sex in Skillman
The Skillman industries that see more men than women are Utilities (100.0%), Professional & Scientific (100.0%), and Health Care & Social Assistance (100.0%), whereas the industries that tend to have a higher number of women are Finance & Insurance (100.0%), Retail Trade (60.0%), and Manufacturing (59.5%).
| Industry | Male | Female |
| Agriculture, Fishing & Hunting | 0 (0.0%) | 0 (0.0%) |
| Mining, Quarrying, & Extraction | 0 (0.0%) | 0 (0.0%) |
| Construction | 0 (0.0%) | 0 (0.0%) |
| Manufacturing | 15 (40.5%) | 22 (59.5%) |
| Wholesale Trade | 0 (0.0%) | 0 (0.0%) |
| Retail Trade | 10 (40.0%) | 15 (60.0%) |
| Transportation & Warehousing | 0 (0.0%) | 0 (0.0%) |
| Utilities | 19 (100.0%) | 0 (0.0%) |
| Information | 0 (0.0%) | 0 (0.0%) |
| Finance & Insurance | 0 (0.0%) | 11 (100.0%) |
| Real Estate, Rental & Leasing | 0 (0.0%) | 0 (0.0%) |
| Professional & Scientific | 8 (100.0%) | 0 (0.0%) |
| Enterprise Management | 0 (0.0%) | 0 (0.0%) |
| Administrative & Support | 0 (0.0%) | 0 (0.0%) |
| Educational Services | 18 (46.2%) | 21 (53.8%) |
| Health Care & Social Assistance | 24 (100.0%) | 0 (0.0%) |
| Arts, Entertainment & Recreation | 0 (0.0%) | 0 (0.0%) |
| Accommodation & Food Services | 0 (0.0%) | 0 (0.0%) |
| Public Administration | 0 (0.0%) | 0 (0.0%) |
| Total | 94 (51.9%) | 87 (48.1%) |
Education in Skillman
School Enrollment in Skillman
The most common levels of schooling among the 77 students in Skillman are elementary school (24 | 31.2%), kindergarten (19 | 24.7%), and nursery / preschool (16 | 20.8%).
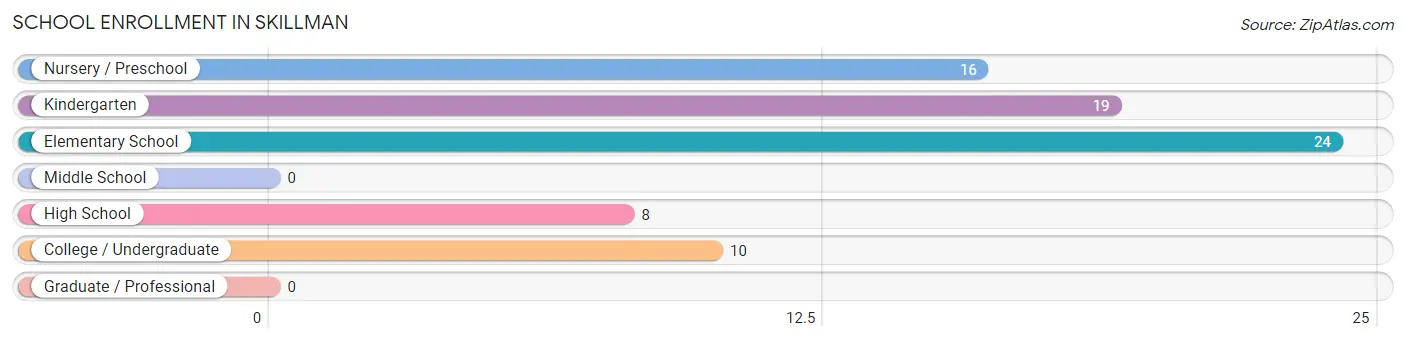
| School Level | # Students | % Students |
| Nursery / Preschool | 16 | 20.8% |
| Kindergarten | 19 | 24.7% |
| Elementary School | 24 | 31.2% |
| Middle School | 0 | 0.0% |
| High School | 8 | 10.4% |
| College / Undergraduate | 10 | 13.0% |
| Graduate / Professional | 0 | 0.0% |
| Total | 77 | 100.0% |
School Enrollment by Age by Funding Source in Skillman
Out of a total of 77 students who are enrolled in schools in Skillman, 10 (13.0%) attend a private institution, while the remaining 67 (87.0%) are enrolled in public schools. The age group of 20 to 24 year olds has the highest likelihood of being enrolled in private schools, with 10 (100.0% in the age bracket) enrolled. Conversely, the age group of 3 to 4 year olds has the lowest likelihood of being enrolled in a private school, with 16 (100.0% in the age bracket) attending a public institution.
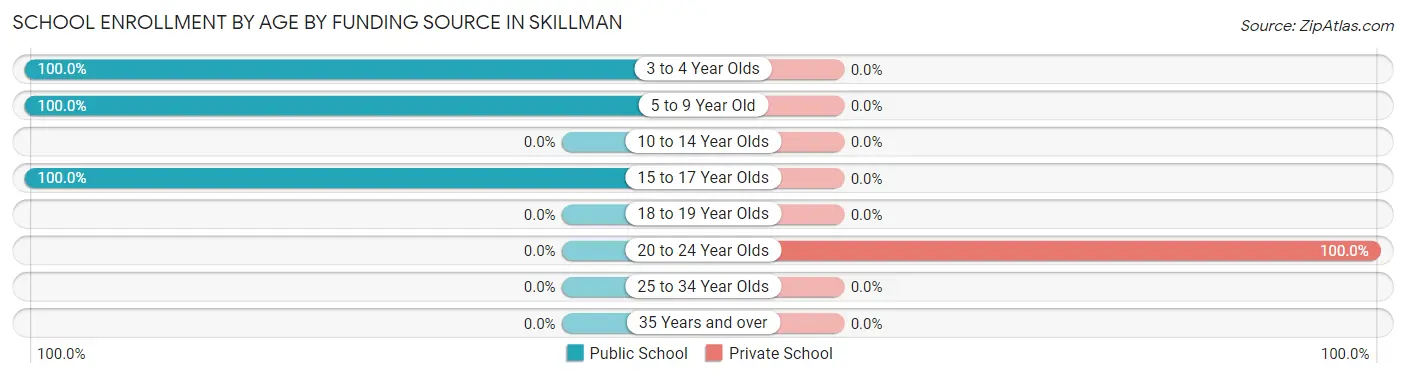
| Age Bracket | Public School | Private School |
| 3 to 4 Year Olds | 16 (100.0%) | 0 (0.0%) |
| 5 to 9 Year Old | 43 (100.0%) | 0 (0.0%) |
| 10 to 14 Year Olds | 0 (0.0%) | 0 (0.0%) |
| 15 to 17 Year Olds | 8 (100.0%) | 0 (0.0%) |
| 18 to 19 Year Olds | 0 (0.0%) | 0 (0.0%) |
| 20 to 24 Year Olds | 0 (0.0%) | 10 (100.0%) |
| 25 to 34 Year Olds | 0 (0.0%) | 0 (0.0%) |
| 35 Years and over | 0 (0.0%) | 0 (0.0%) |
| Total | 67 (87.0%) | 10 (13.0%) |
Educational Attainment by Field of Study in Skillman
Bio, nature & agricultural (39 | 31.2%), business (18 | 14.4%), computers & mathematics (15 | 12.0%), liberal arts & history (15 | 12.0%), and multidisciplinary studies (13 | 10.4%) are the most common fields of study among 125 individuals in Skillman who have obtained a bachelor's degree or higher.
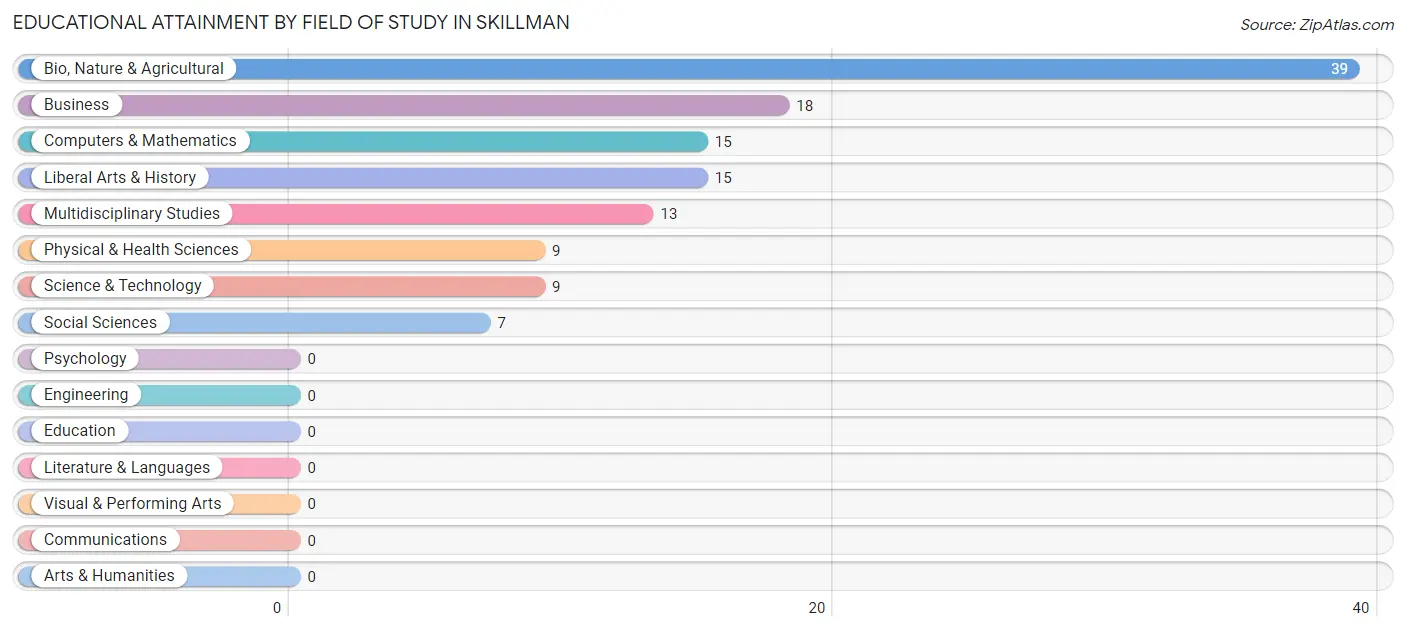
| Field of Study | # Graduates | % Graduates |
| Computers & Mathematics | 15 | 12.0% |
| Bio, Nature & Agricultural | 39 | 31.2% |
| Physical & Health Sciences | 9 | 7.2% |
| Psychology | 0 | 0.0% |
| Social Sciences | 7 | 5.6% |
| Engineering | 0 | 0.0% |
| Multidisciplinary Studies | 13 | 10.4% |
| Science & Technology | 9 | 7.2% |
| Business | 18 | 14.4% |
| Education | 0 | 0.0% |
| Literature & Languages | 0 | 0.0% |
| Liberal Arts & History | 15 | 12.0% |
| Visual & Performing Arts | 0 | 0.0% |
| Communications | 0 | 0.0% |
| Arts & Humanities | 0 | 0.0% |
| Total | 125 | 100.0% |
Transportation & Commute in Skillman
Vehicle Availability by Sex in Skillman
The most prevalent vehicle ownership categories in Skillman are males with 3 vehicles (61, accounting for 64.9%) and females with 3 vehicles (38, making up 70.1%).
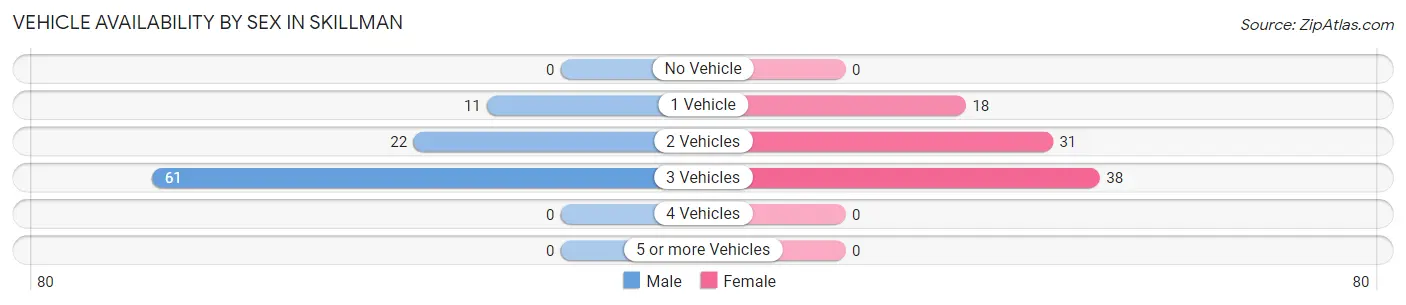
| Vehicles Available | Male | Female |
| No Vehicle | 0 (0.0%) | 0 (0.0%) |
| 1 Vehicle | 11 (11.7%) | 18 (20.7%) |
| 2 Vehicles | 22 (23.4%) | 31 (35.6%) |
| 3 Vehicles | 61 (64.9%) | 38 (43.7%) |
| 4 Vehicles | 0 (0.0%) | 0 (0.0%) |
| 5 or more Vehicles | 0 (0.0%) | 0 (0.0%) |
| Total | 94 (100.0%) | 87 (100.0%) |
Commute Time in Skillman
The most frequently occuring commute durations in Skillman are 30 to 34 minutes (43 commuters, 28.1%), 60 to 89 minutes (34 commuters, 22.2%), and 45 to 59 minutes (33 commuters, 21.6%).
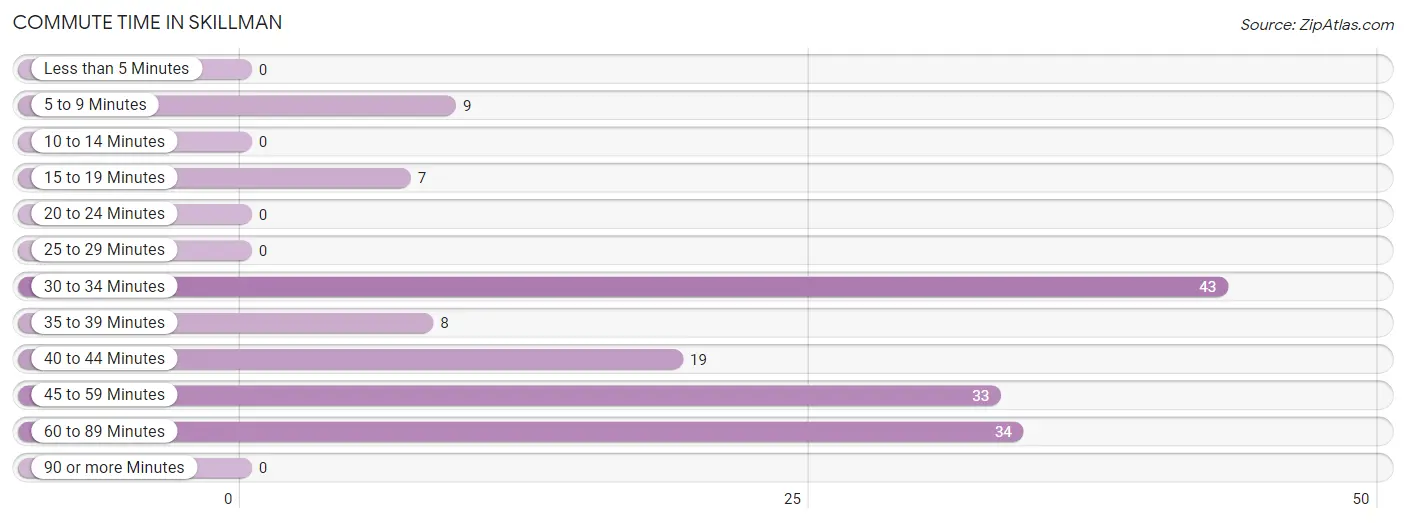
| Commute Time | # Commuters | % Commuters |
| Less than 5 Minutes | 0 | 0.0% |
| 5 to 9 Minutes | 9 | 5.9% |
| 10 to 14 Minutes | 0 | 0.0% |
| 15 to 19 Minutes | 7 | 4.6% |
| 20 to 24 Minutes | 0 | 0.0% |
| 25 to 29 Minutes | 0 | 0.0% |
| 30 to 34 Minutes | 43 | 28.1% |
| 35 to 39 Minutes | 8 | 5.2% |
| 40 to 44 Minutes | 19 | 12.4% |
| 45 to 59 Minutes | 33 | 21.6% |
| 60 to 89 Minutes | 34 | 22.2% |
| 90 or more Minutes | 0 | 0.0% |
Commute Time by Sex in Skillman
The most common commute times in Skillman are 60 to 89 minutes (34 commuters, 36.2%) for males and 30 to 34 minutes (24 commuters, 40.7%) for females.
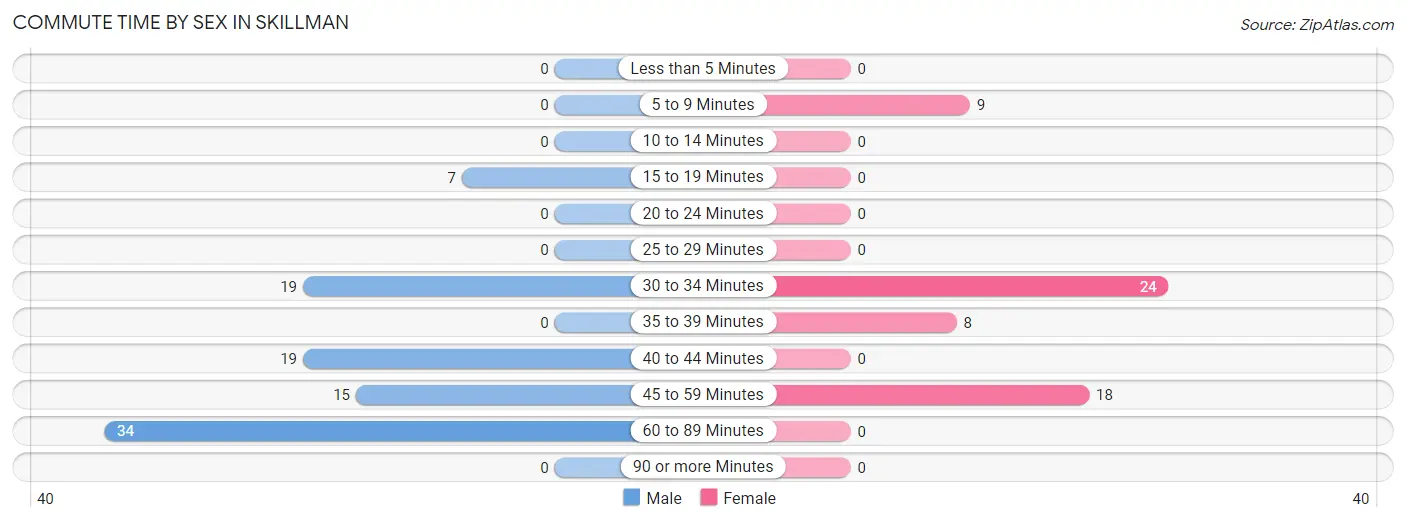
| Commute Time | Male | Female |
| Less than 5 Minutes | 0 (0.0%) | 0 (0.0%) |
| 5 to 9 Minutes | 0 (0.0%) | 9 (15.2%) |
| 10 to 14 Minutes | 0 (0.0%) | 0 (0.0%) |
| 15 to 19 Minutes | 7 (7.4%) | 0 (0.0%) |
| 20 to 24 Minutes | 0 (0.0%) | 0 (0.0%) |
| 25 to 29 Minutes | 0 (0.0%) | 0 (0.0%) |
| 30 to 34 Minutes | 19 (20.2%) | 24 (40.7%) |
| 35 to 39 Minutes | 0 (0.0%) | 8 (13.6%) |
| 40 to 44 Minutes | 19 (20.2%) | 0 (0.0%) |
| 45 to 59 Minutes | 15 (16.0%) | 18 (30.5%) |
| 60 to 89 Minutes | 34 (36.2%) | 0 (0.0%) |
| 90 or more Minutes | 0 (0.0%) | 0 (0.0%) |
Time of Departure to Work by Sex in Skillman
The most frequent times of departure to work in Skillman are 6:00 AM to 6:29 AM (49, 52.1%) for males and 7:00 AM to 7:29 AM (27, 45.8%) for females.
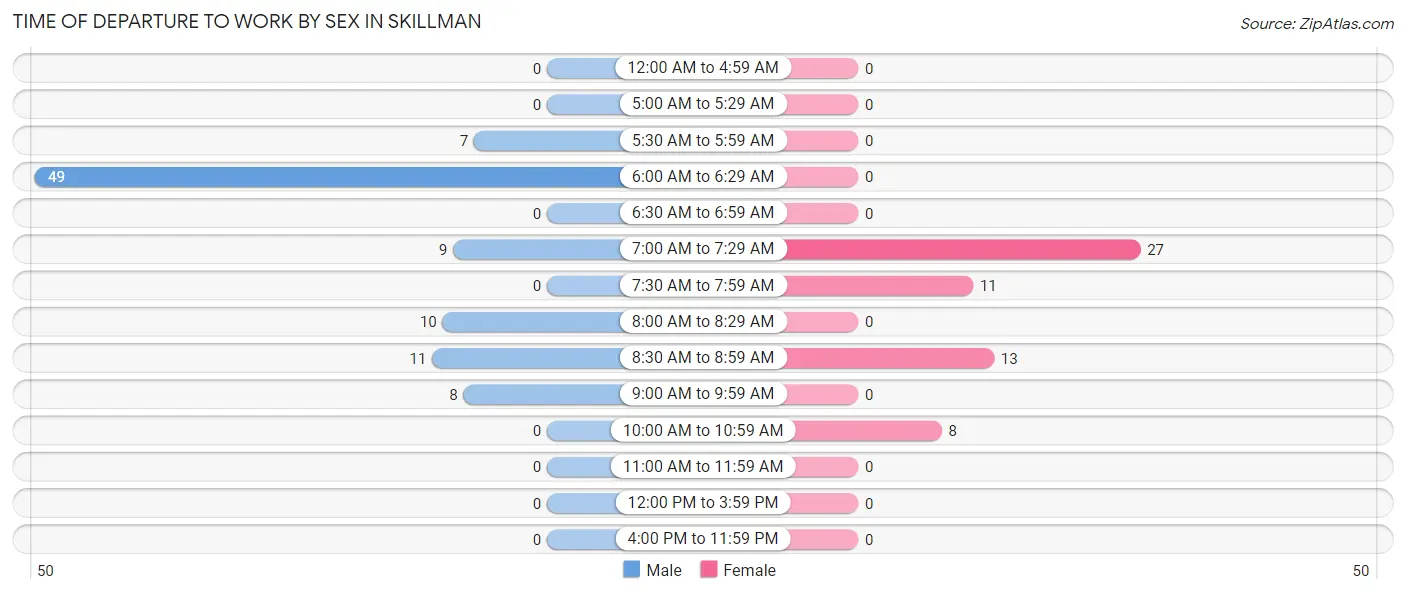
| Time of Departure | Male | Female |
| 12:00 AM to 4:59 AM | 0 (0.0%) | 0 (0.0%) |
| 5:00 AM to 5:29 AM | 0 (0.0%) | 0 (0.0%) |
| 5:30 AM to 5:59 AM | 7 (7.4%) | 0 (0.0%) |
| 6:00 AM to 6:29 AM | 49 (52.1%) | 0 (0.0%) |
| 6:30 AM to 6:59 AM | 0 (0.0%) | 0 (0.0%) |
| 7:00 AM to 7:29 AM | 9 (9.6%) | 27 (45.8%) |
| 7:30 AM to 7:59 AM | 0 (0.0%) | 11 (18.6%) |
| 8:00 AM to 8:29 AM | 10 (10.6%) | 0 (0.0%) |
| 8:30 AM to 8:59 AM | 11 (11.7%) | 13 (22.0%) |
| 9:00 AM to 9:59 AM | 8 (8.5%) | 0 (0.0%) |
| 10:00 AM to 10:59 AM | 0 (0.0%) | 8 (13.6%) |
| 11:00 AM to 11:59 AM | 0 (0.0%) | 0 (0.0%) |
| 12:00 PM to 3:59 PM | 0 (0.0%) | 0 (0.0%) |
| 4:00 PM to 11:59 PM | 0 (0.0%) | 0 (0.0%) |
| Total | 94 (100.0%) | 59 (100.0%) |
Housing Occupancy in Skillman
Occupancy by Ownership in Skillman
Of the total 114 dwellings in Skillman, owner-occupied units account for 89 (78.1%), while renter-occupied units make up 25 (21.9%).
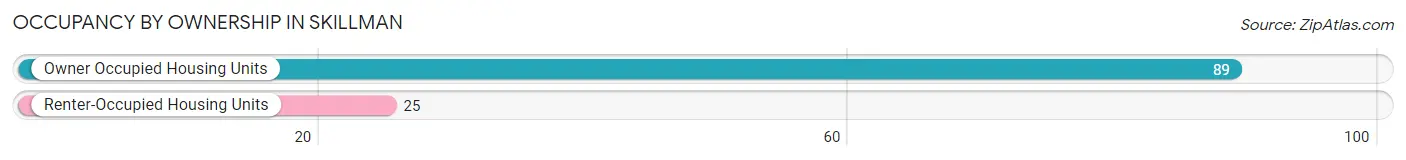
| Occupancy | # Housing Units | % Housing Units |
| Owner Occupied Housing Units | 89 | 78.1% |
| Renter-Occupied Housing Units | 25 | 21.9% |
| Total Occupied Housing Units | 114 | 100.0% |
Occupancy by Household Size in Skillman
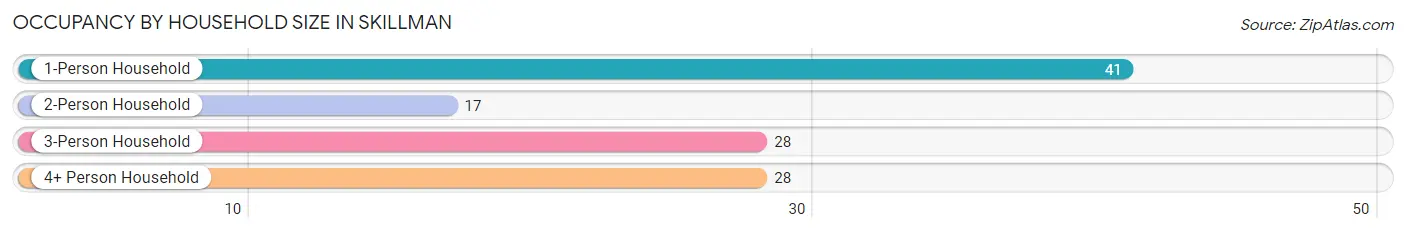
| Household Size | # Housing Units | % Housing Units |
| 1-Person Household | 41 | 36.0% |
| 2-Person Household | 17 | 14.9% |
| 3-Person Household | 28 | 24.6% |
| 4+ Person Household | 28 | 24.6% |
| Total Housing Units | 114 | 100.0% |
Occupancy by Ownership by Household Size in Skillman
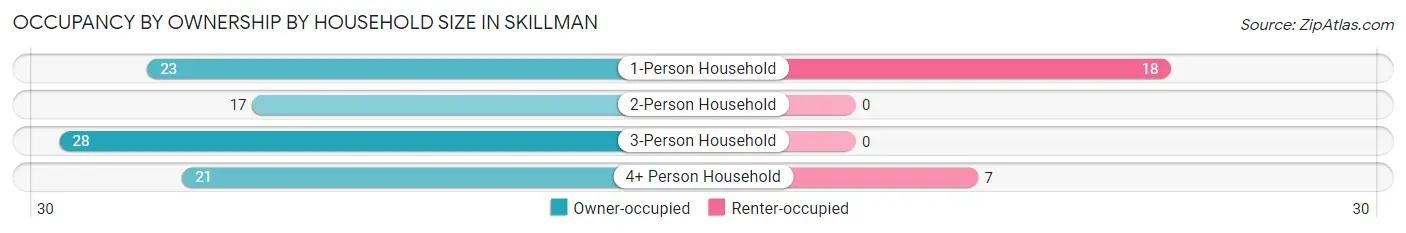
| Household Size | Owner-occupied | Renter-occupied |
| 1-Person Household | 23 (56.1%) | 18 (43.9%) |
| 2-Person Household | 17 (100.0%) | 0 (0.0%) |
| 3-Person Household | 28 (100.0%) | 0 (0.0%) |
| 4+ Person Household | 21 (75.0%) | 7 (25.0%) |
| Total Housing Units | 89 (78.1%) | 25 (21.9%) |
Occupancy by Educational Attainment in Skillman
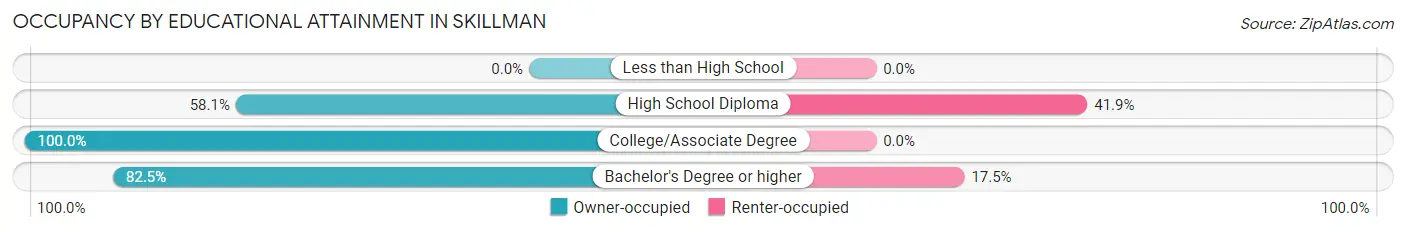
| Household Size | Owner-occupied | Renter-occupied |
| Less than High School | 0 (0.0%) | 0 (0.0%) |
| High School Diploma | 25 (58.1%) | 18 (41.9%) |
| College/Associate Degree | 31 (100.0%) | 0 (0.0%) |
| Bachelor's Degree or higher | 33 (82.5%) | 7 (17.5%) |
Occupancy by Age of Householder in Skillman
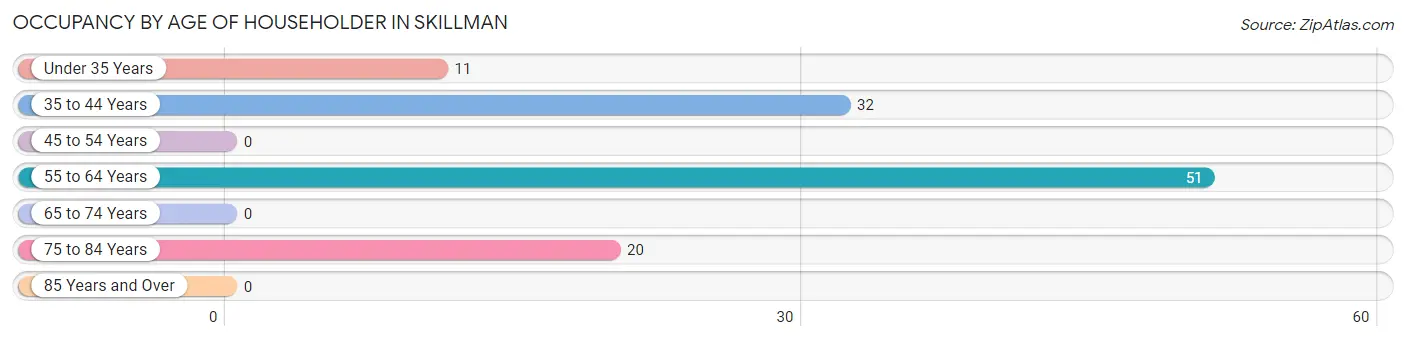
| Age Bracket | # Households | % Households |
| Under 35 Years | 11 | 9.7% |
| 35 to 44 Years | 32 | 28.1% |
| 45 to 54 Years | 0 | 0.0% |
| 55 to 64 Years | 51 | 44.7% |
| 65 to 74 Years | 0 | 0.0% |
| 75 to 84 Years | 20 | 17.5% |
| 85 Years and Over | 0 | 0.0% |
| Total | 114 | 100.0% |
Housing Finances in Skillman
Median Income by Occupancy in Skillman
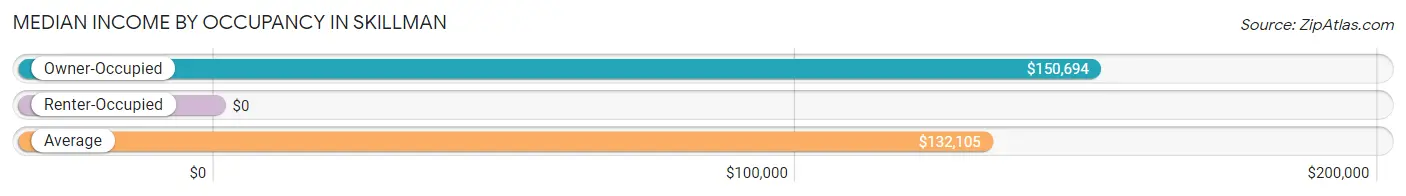
| Occupancy Type | # Households | Median Income |
| Owner-Occupied | 89 (78.1%) | $150,694 |
| Renter-Occupied | 25 (21.9%) | $0 |
| Average | 114 (100.0%) | $132,105 |
Occupancy by Householder Income Bracket in Skillman
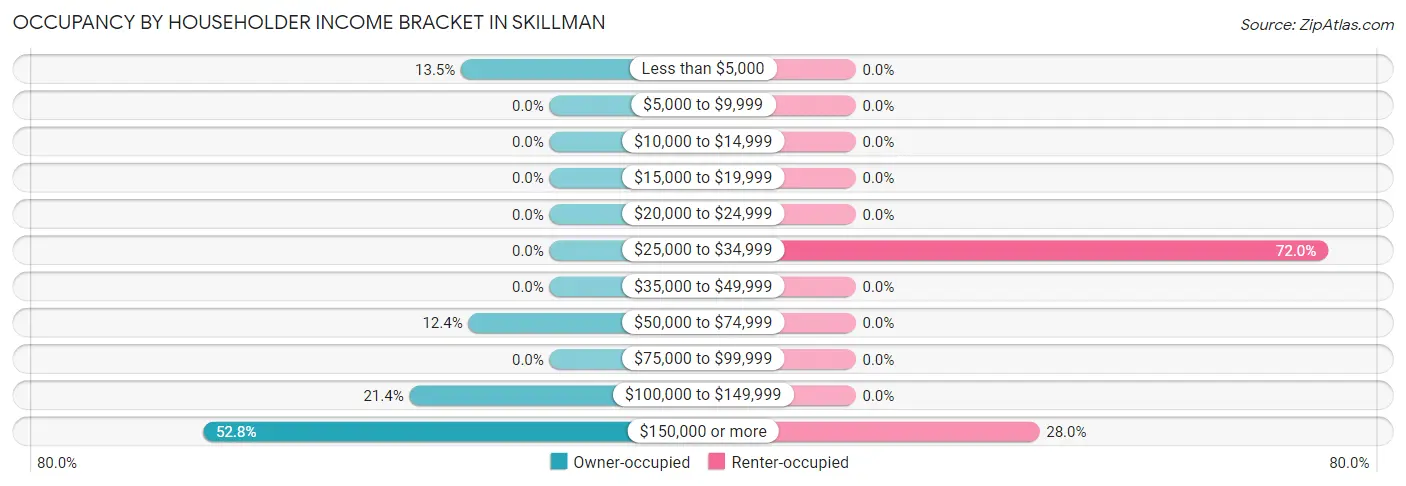
| Income Bracket | Owner-occupied | Renter-occupied |
| Less than $5,000 | 12 (13.5%) | 0 (0.0%) |
| $5,000 to $9,999 | 0 (0.0%) | 0 (0.0%) |
| $10,000 to $14,999 | 0 (0.0%) | 0 (0.0%) |
| $15,000 to $19,999 | 0 (0.0%) | 0 (0.0%) |
| $20,000 to $24,999 | 0 (0.0%) | 0 (0.0%) |
| $25,000 to $34,999 | 0 (0.0%) | 18 (72.0%) |
| $35,000 to $49,999 | 0 (0.0%) | 0 (0.0%) |
| $50,000 to $74,999 | 11 (12.4%) | 0 (0.0%) |
| $75,000 to $99,999 | 0 (0.0%) | 0 (0.0%) |
| $100,000 to $149,999 | 19 (21.3%) | 0 (0.0%) |
| $150,000 or more | 47 (52.8%) | 7 (28.0%) |
| Total | 89 (100.0%) | 25 (100.0%) |
Monthly Housing Cost Tiers in Skillman
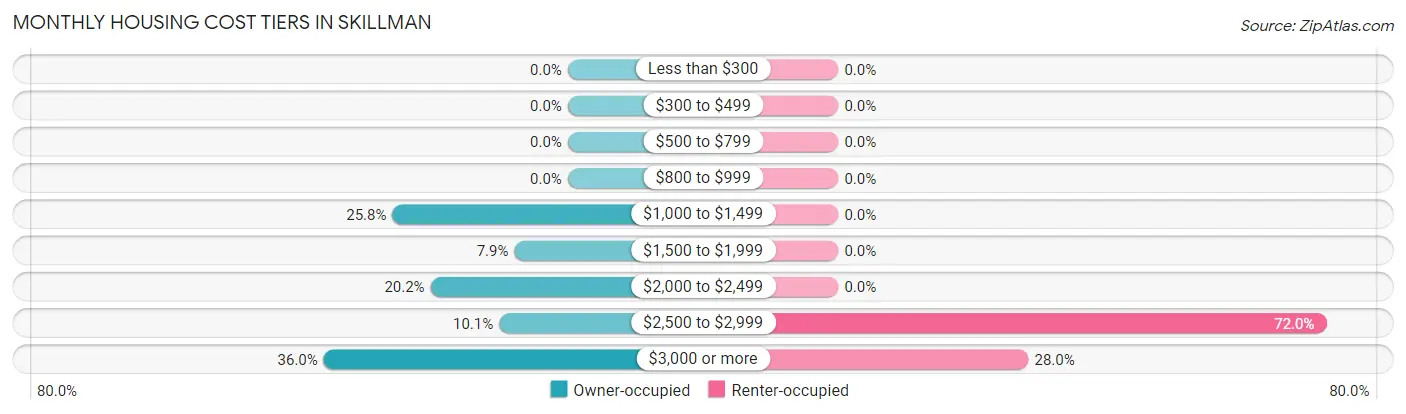
| Monthly Cost | Owner-occupied | Renter-occupied |
| Less than $300 | 0 (0.0%) | 0 (0.0%) |
| $300 to $499 | 0 (0.0%) | 0 (0.0%) |
| $500 to $799 | 0 (0.0%) | 0 (0.0%) |
| $800 to $999 | 0 (0.0%) | 0 (0.0%) |
| $1,000 to $1,499 | 23 (25.8%) | 0 (0.0%) |
| $1,500 to $1,999 | 7 (7.9%) | 0 (0.0%) |
| $2,000 to $2,499 | 18 (20.2%) | 0 (0.0%) |
| $2,500 to $2,999 | 9 (10.1%) | 18 (72.0%) |
| $3,000 or more | 32 (36.0%) | 7 (28.0%) |
| Total | 89 (100.0%) | 25 (100.0%) |
Physical Housing Characteristics in Skillman
Housing Structures in Skillman
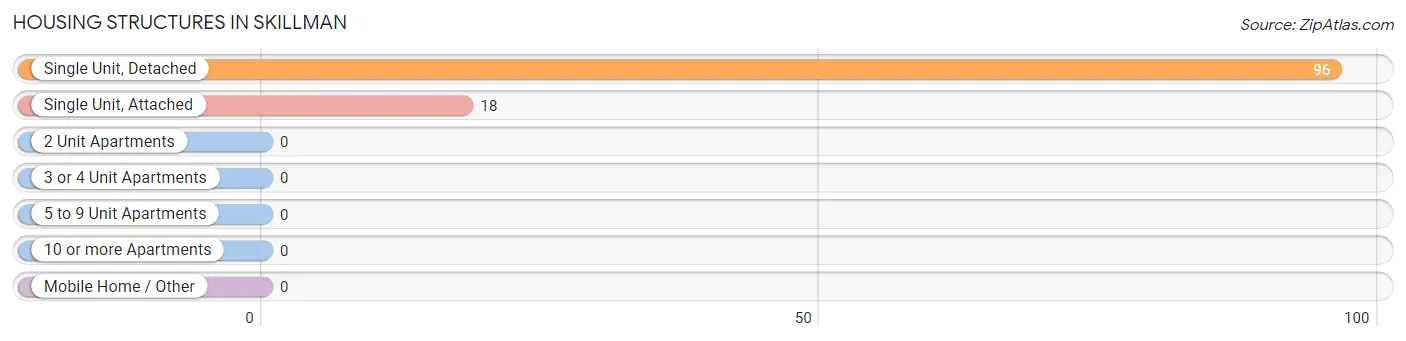
| Structure Type | # Housing Units | % Housing Units |
| Single Unit, Detached | 96 | 84.2% |
| Single Unit, Attached | 18 | 15.8% |
| 2 Unit Apartments | 0 | 0.0% |
| 3 or 4 Unit Apartments | 0 | 0.0% |
| 5 to 9 Unit Apartments | 0 | 0.0% |
| 10 or more Apartments | 0 | 0.0% |
| Mobile Home / Other | 0 | 0.0% |
| Total | 114 | 100.0% |
Housing Structures by Occupancy in Skillman
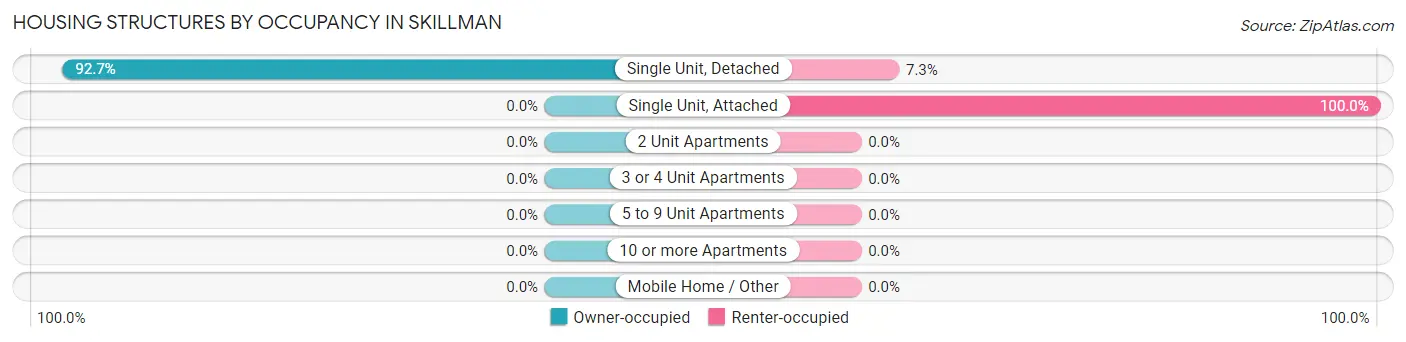
| Structure Type | Owner-occupied | Renter-occupied |
| Single Unit, Detached | 89 (92.7%) | 7 (7.3%) |
| Single Unit, Attached | 0 (0.0%) | 18 (100.0%) |
| 2 Unit Apartments | 0 (0.0%) | 0 (0.0%) |
| 3 or 4 Unit Apartments | 0 (0.0%) | 0 (0.0%) |
| 5 to 9 Unit Apartments | 0 (0.0%) | 0 (0.0%) |
| 10 or more Apartments | 0 (0.0%) | 0 (0.0%) |
| Mobile Home / Other | 0 (0.0%) | 0 (0.0%) |
| Total | 89 (78.1%) | 25 (21.9%) |
Housing Structures by Number of Rooms in Skillman
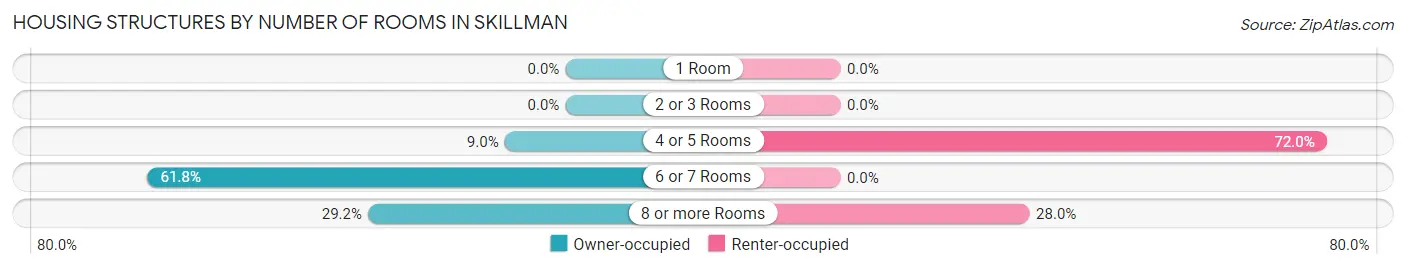
| Number of Rooms | Owner-occupied | Renter-occupied |
| 1 Room | 0 (0.0%) | 0 (0.0%) |
| 2 or 3 Rooms | 0 (0.0%) | 0 (0.0%) |
| 4 or 5 Rooms | 8 (9.0%) | 18 (72.0%) |
| 6 or 7 Rooms | 55 (61.8%) | 0 (0.0%) |
| 8 or more Rooms | 26 (29.2%) | 7 (28.0%) |
| Total | 89 (100.0%) | 25 (100.0%) |
Housing Structure by Heating Type in Skillman
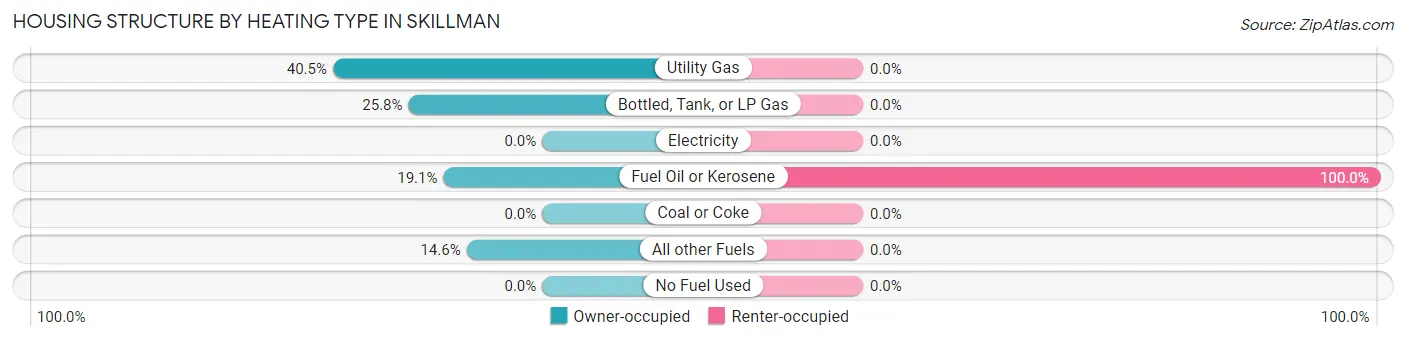
| Heating Type | Owner-occupied | Renter-occupied |
| Utility Gas | 36 (40.5%) | 0 (0.0%) |
| Bottled, Tank, or LP Gas | 23 (25.8%) | 0 (0.0%) |
| Electricity | 0 (0.0%) | 0 (0.0%) |
| Fuel Oil or Kerosene | 17 (19.1%) | 25 (100.0%) |
| Coal or Coke | 0 (0.0%) | 0 (0.0%) |
| All other Fuels | 13 (14.6%) | 0 (0.0%) |
| No Fuel Used | 0 (0.0%) | 0 (0.0%) |
| Total | 89 (100.0%) | 25 (100.0%) |
Household Vehicle Usage in Skillman
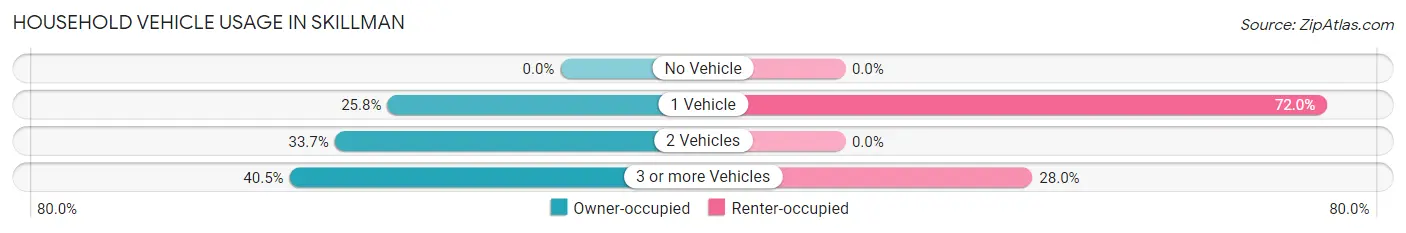
| Vehicles per Household | Owner-occupied | Renter-occupied |
| No Vehicle | 0 (0.0%) | 0 (0.0%) |
| 1 Vehicle | 23 (25.8%) | 18 (72.0%) |
| 2 Vehicles | 30 (33.7%) | 0 (0.0%) |
| 3 or more Vehicles | 36 (40.5%) | 7 (28.0%) |
| Total | 89 (100.0%) | 25 (100.0%) |
Real Estate & Mortgages in Skillman
Real Estate and Mortgage Overview in Skillman
| Characteristic | Without Mortgage | With Mortgage |
| Housing Units | 29 | 60 |
| Median Property Value | $343,800 | $464,300 |
| Median Household Income | $196,094 | $29 |
| Monthly Housing Costs | $1,501 | $32 |
| Real Estate Taxes | $10,001 | $0 |
Property Value by Mortgage Status in Skillman
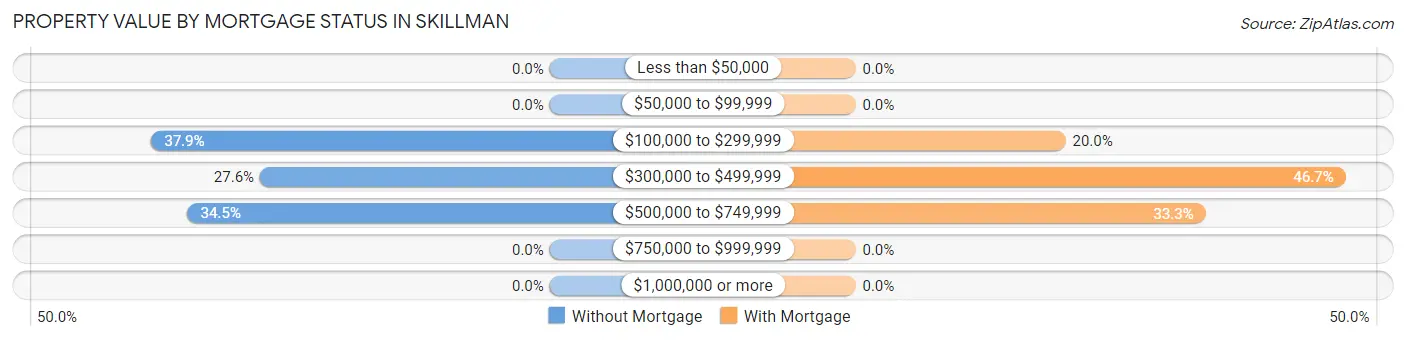
| Property Value | Without Mortgage | With Mortgage |
| Less than $50,000 | 0 (0.0%) | 0 (0.0%) |
| $50,000 to $99,999 | 0 (0.0%) | 0 (0.0%) |
| $100,000 to $299,999 | 11 (37.9%) | 12 (20.0%) |
| $300,000 to $499,999 | 8 (27.6%) | 28 (46.7%) |
| $500,000 to $749,999 | 10 (34.5%) | 20 (33.3%) |
| $750,000 to $999,999 | 0 (0.0%) | 0 (0.0%) |
| $1,000,000 or more | 0 (0.0%) | 0 (0.0%) |
| Total | 29 (100.0%) | 60 (100.0%) |
Household Income by Mortgage Status in Skillman
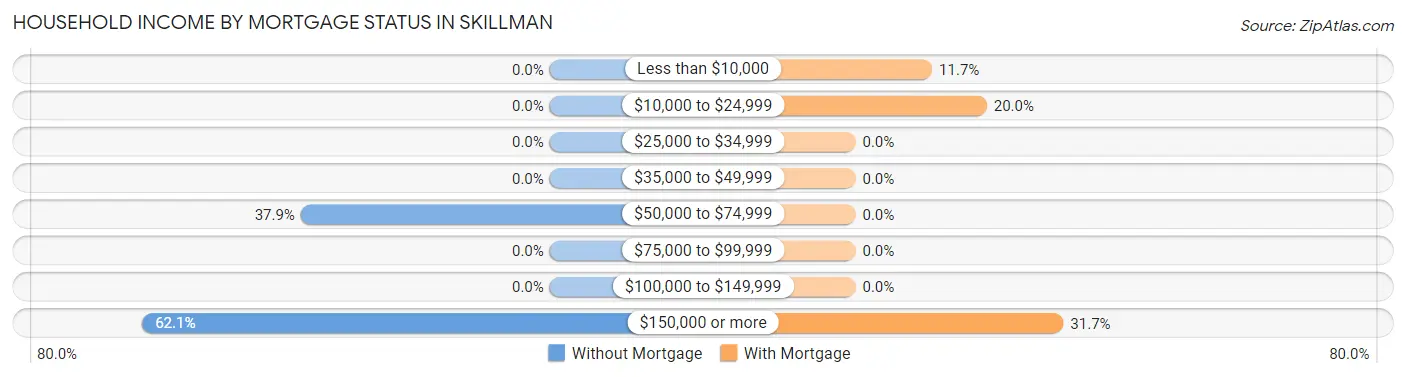
| Household Income | Without Mortgage | With Mortgage |
| Less than $10,000 | 0 (0.0%) | 7 (11.7%) |
| $10,000 to $24,999 | 0 (0.0%) | 12 (20.0%) |
| $25,000 to $34,999 | 0 (0.0%) | 0 (0.0%) |
| $35,000 to $49,999 | 0 (0.0%) | 0 (0.0%) |
| $50,000 to $74,999 | 11 (37.9%) | 0 (0.0%) |
| $75,000 to $99,999 | 0 (0.0%) | 0 (0.0%) |
| $100,000 to $149,999 | 0 (0.0%) | 0 (0.0%) |
| $150,000 or more | 18 (62.1%) | 19 (31.7%) |
| Total | 29 (100.0%) | 60 (100.0%) |
Property Value to Household Income Ratio in Skillman
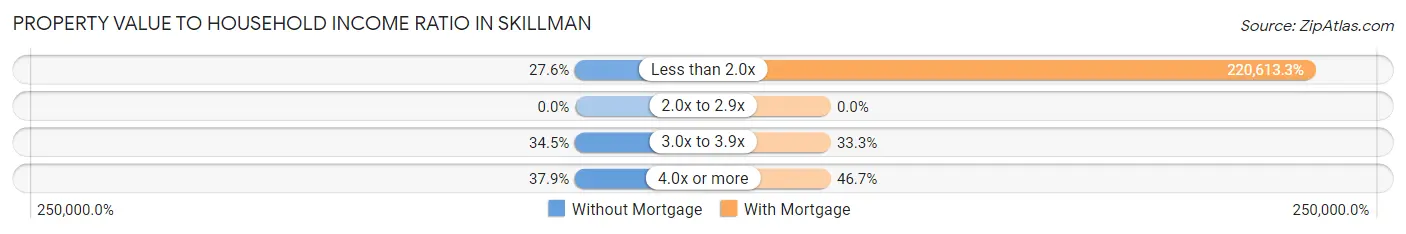
| Value-to-Income Ratio | Without Mortgage | With Mortgage |
| Less than 2.0x | 8 (27.6%) | 132,368 (220,613.3%) |
| 2.0x to 2.9x | 0 (0.0%) | 0 (0.0%) |
| 3.0x to 3.9x | 10 (34.5%) | 20 (33.3%) |
| 4.0x or more | 11 (37.9%) | 28 (46.7%) |
| Total | 29 (100.0%) | 60 (100.0%) |
Real Estate Taxes by Mortgage Status in Skillman
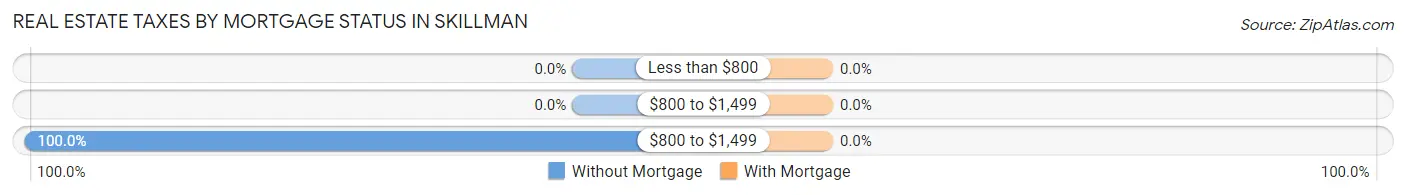
| Property Taxes | Without Mortgage | With Mortgage |
| Less than $800 | 0 (0.0%) | 0 (0.0%) |
| $800 to $1,499 | 0 (0.0%) | 0 (0.0%) |
| $800 to $1,499 | 29 (100.0%) | 0 (0.0%) |
| Total | 29 (100.0%) | 60 (100.0%) |
Health & Disability in Skillman
Health Insurance Coverage by Age in Skillman
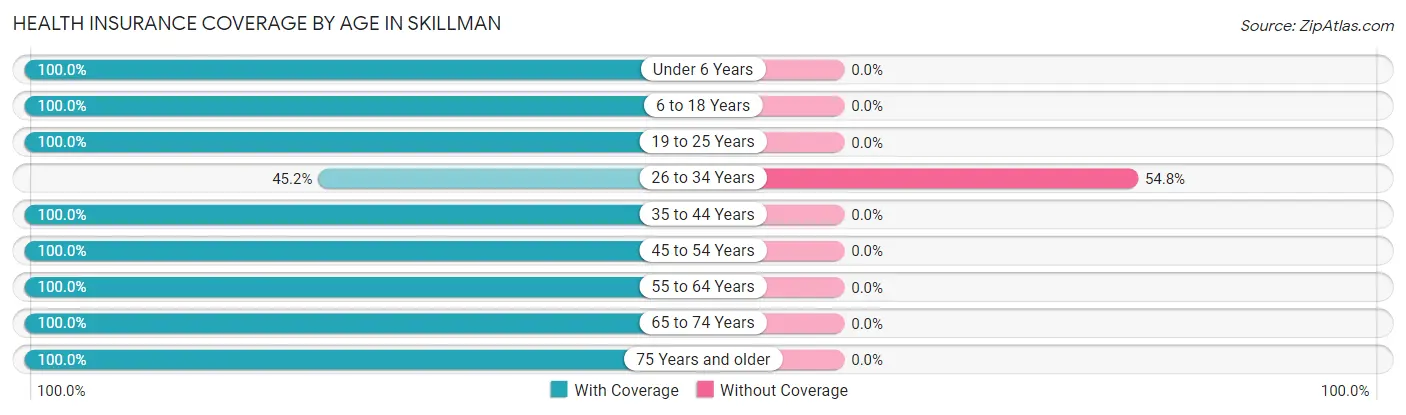
| Age Bracket | With Coverage | Without Coverage |
| Under 6 Years | 35 (100.0%) | 0 (0.0%) |
| 6 to 18 Years | 32 (100.0%) | 0 (0.0%) |
| 19 to 25 Years | 22 (100.0%) | 0 (0.0%) |
| 26 to 34 Years | 19 (45.2%) | 23 (54.8%) |
| 35 to 44 Years | 47 (100.0%) | 0 (0.0%) |
| 45 to 54 Years | 9 (100.0%) | 0 (0.0%) |
| 55 to 64 Years | 69 (100.0%) | 0 (0.0%) |
| 65 to 74 Years | 21 (100.0%) | 0 (0.0%) |
| 75 Years and older | 20 (100.0%) | 0 (0.0%) |
| Total | 274 (92.3%) | 23 (7.7%) |
Health Insurance Coverage by Citizenship Status in Skillman
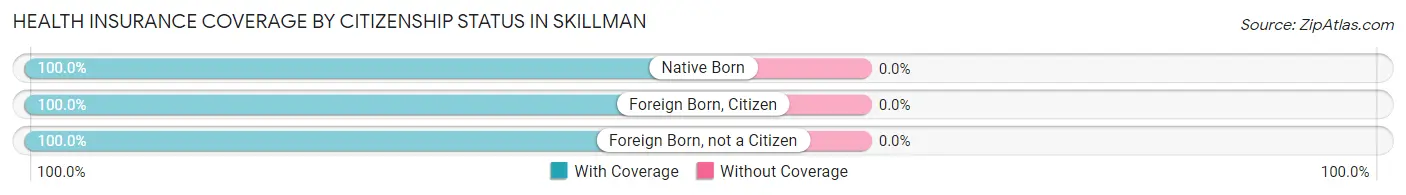
| Citizenship Status | With Coverage | Without Coverage |
| Native Born | 35 (100.0%) | 0 (0.0%) |
| Foreign Born, Citizen | 32 (100.0%) | 0 (0.0%) |
| Foreign Born, not a Citizen | 22 (100.0%) | 0 (0.0%) |
Health Insurance Coverage by Household Income in Skillman
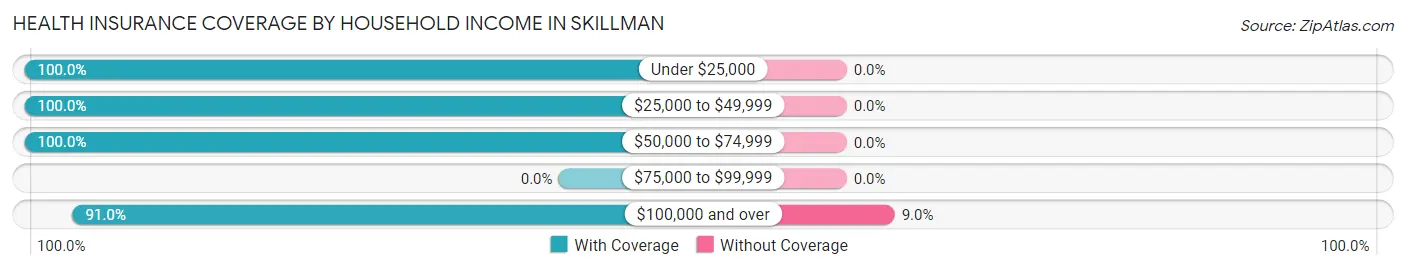
| Household Income | With Coverage | Without Coverage |
| Under $25,000 | 12 (100.0%) | 0 (0.0%) |
| $25,000 to $49,999 | 18 (100.0%) | 0 (0.0%) |
| $50,000 to $74,999 | 11 (100.0%) | 0 (0.0%) |
| $75,000 to $99,999 | 0 (0.0%) | 0 (0.0%) |
| $100,000 and over | 233 (91.0%) | 23 (9.0%) |
Public vs Private Health Insurance Coverage by Age in Skillman
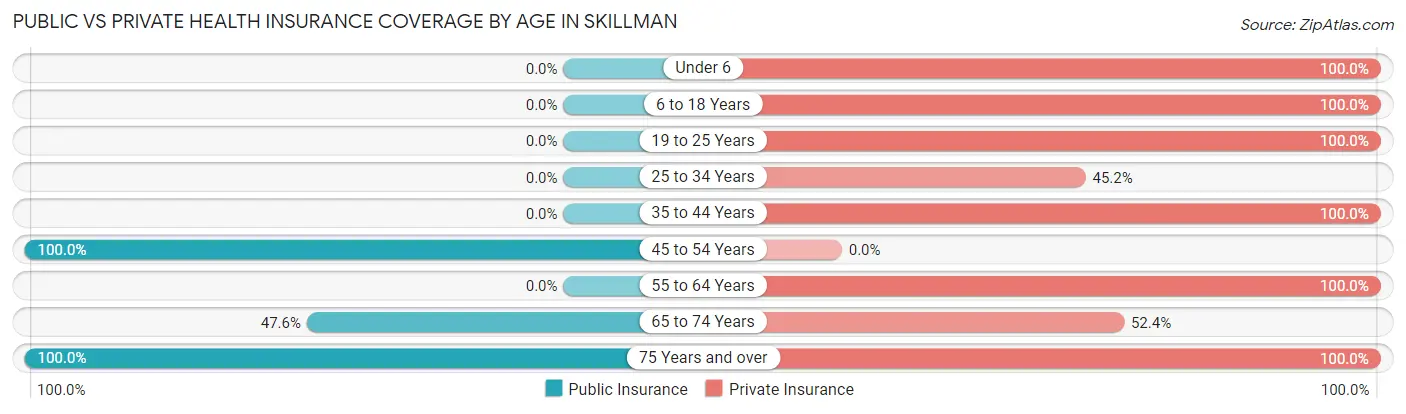
| Age Bracket | Public Insurance | Private Insurance |
| Under 6 | 0 (0.0%) | 35 (100.0%) |
| 6 to 18 Years | 0 (0.0%) | 32 (100.0%) |
| 19 to 25 Years | 0 (0.0%) | 22 (100.0%) |
| 25 to 34 Years | 0 (0.0%) | 19 (45.2%) |
| 35 to 44 Years | 0 (0.0%) | 47 (100.0%) |
| 45 to 54 Years | 9 (100.0%) | 0 (0.0%) |
| 55 to 64 Years | 0 (0.0%) | 69 (100.0%) |
| 65 to 74 Years | 10 (47.6%) | 11 (52.4%) |
| 75 Years and over | 20 (100.0%) | 20 (100.0%) |
| Total | 39 (13.1%) | 255 (85.9%) |
Disability Status by Sex by Age in Skillman
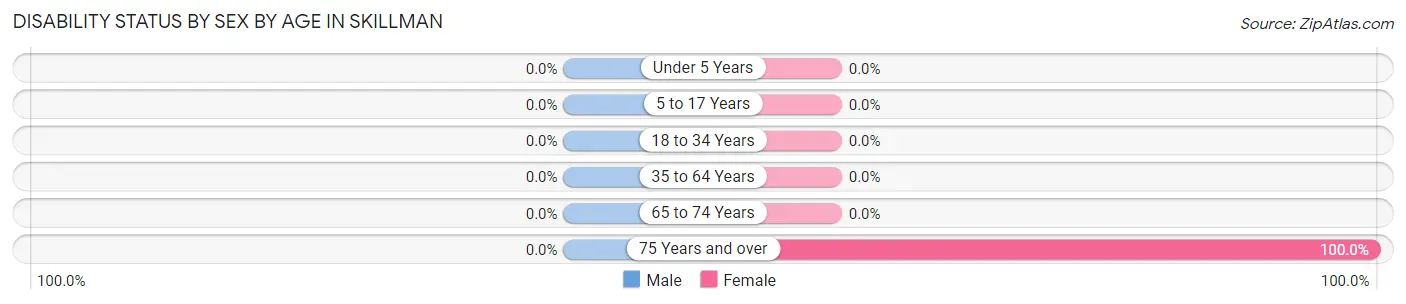
| Age Bracket | Male | Female |
| Under 5 Years | 0 (0.0%) | 0 (0.0%) |
| 5 to 17 Years | 0 (0.0%) | 0 (0.0%) |
| 18 to 34 Years | 0 (0.0%) | 0 (0.0%) |
| 35 to 64 Years | 0 (0.0%) | 0 (0.0%) |
| 65 to 74 Years | 0 (0.0%) | 0 (0.0%) |
| 75 Years and over | 0 (0.0%) | 12 (100.0%) |
Disability Class by Sex by Age in Skillman
Disability Class: Hearing Difficulty
| Age Bracket | Male | Female |
| Under 5 Years | 0 (0.0%) | 0 (0.0%) |
| 5 to 17 Years | 0 (0.0%) | 0 (0.0%) |
| 18 to 34 Years | 0 (0.0%) | 0 (0.0%) |
| 35 to 64 Years | 0 (0.0%) | 0 (0.0%) |
| 65 to 74 Years | 0 (0.0%) | 0 (0.0%) |
| 75 Years and over | 0 (0.0%) | 0 (0.0%) |
Disability Class: Vision Difficulty
| Age Bracket | Male | Female |
| Under 5 Years | 0 (0.0%) | 0 (0.0%) |
| 5 to 17 Years | 0 (0.0%) | 0 (0.0%) |
| 18 to 34 Years | 0 (0.0%) | 0 (0.0%) |
| 35 to 64 Years | 0 (0.0%) | 0 (0.0%) |
| 65 to 74 Years | 0 (0.0%) | 0 (0.0%) |
| 75 Years and over | 0 (0.0%) | 0 (0.0%) |
Disability Class: Cognitive Difficulty
| Age Bracket | Male | Female |
| 5 to 17 Years | 0 (0.0%) | 0 (0.0%) |
| 18 to 34 Years | 0 (0.0%) | 0 (0.0%) |
| 35 to 64 Years | 0 (0.0%) | 0 (0.0%) |
| 65 to 74 Years | 0 (0.0%) | 0 (0.0%) |
| 75 Years and over | 0 (0.0%) | 0 (0.0%) |
Disability Class: Ambulatory Difficulty
| Age Bracket | Male | Female |
| 5 to 17 Years | 0 (0.0%) | 0 (0.0%) |
| 18 to 34 Years | 0 (0.0%) | 0 (0.0%) |
| 35 to 64 Years | 0 (0.0%) | 0 (0.0%) |
| 65 to 74 Years | 0 (0.0%) | 0 (0.0%) |
| 75 Years and over | 0 (0.0%) | 12 (100.0%) |
Disability Class: Self-Care Difficulty
| Age Bracket | Male | Female |
| 5 to 17 Years | 0 (0.0%) | 0 (0.0%) |
| 18 to 34 Years | 0 (0.0%) | 0 (0.0%) |
| 35 to 64 Years | 0 (0.0%) | 0 (0.0%) |
| 65 to 74 Years | 0 (0.0%) | 0 (0.0%) |
| 75 Years and over | 0 (0.0%) | 0 (0.0%) |
Technology Access in Skillman
Computing Device Access in Skillman
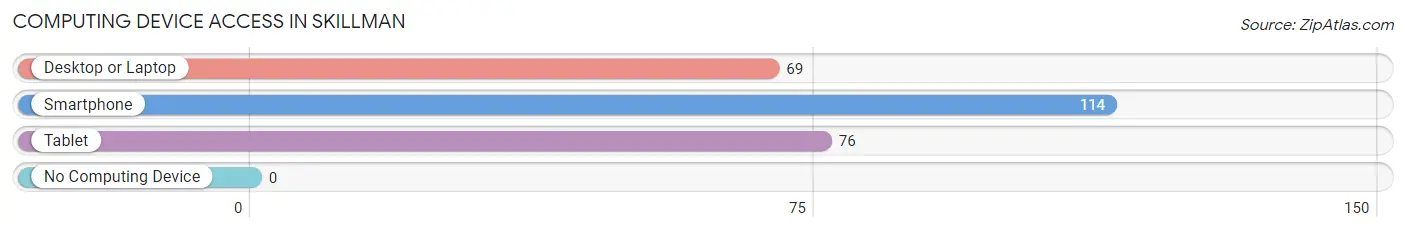
| Device Type | # Households | % Households |
| Desktop or Laptop | 69 | 60.5% |
| Smartphone | 114 | 100.0% |
| Tablet | 76 | 66.7% |
| No Computing Device | 0 | 0.0% |
| Total | 114 | 100.0% |
Internet Access in Skillman
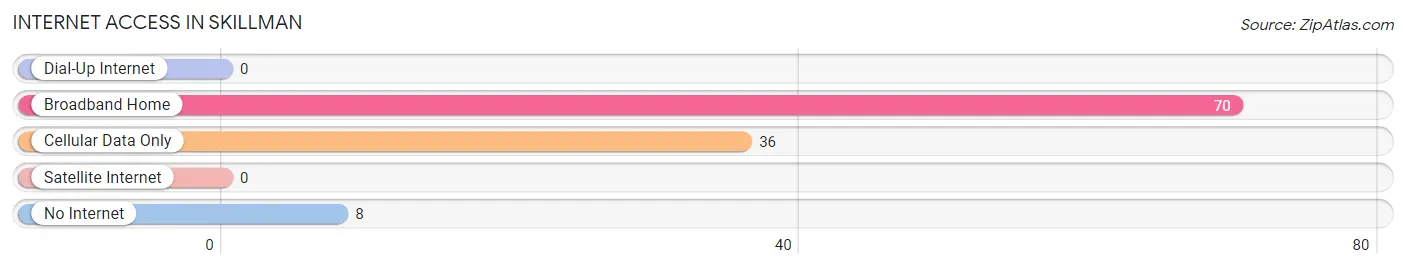
| Internet Type | # Households | % Households |
| Dial-Up Internet | 0 | 0.0% |
| Broadband Home | 70 | 61.4% |
| Cellular Data Only | 36 | 31.6% |
| Satellite Internet | 0 | 0.0% |
| No Internet | 8 | 7.0% |
| Total | 114 | 100.0% |
Skillman Summary
History
The history of Skillman, New Jersey dates back to the early 1700s when the area was first settled by Dutch and English immigrants. The area was originally known as “The Crossroads” due to its location at the intersection of two major roads. In 1778, the area was officially named Skillman after the Skillman family, who had been living in the area since the early 1700s.
The Skillman area was primarily agricultural until the late 1800s when the railroad came through the area. This allowed for the development of small businesses and industries, such as a brickyard, a sawmill, and a gristmill. The area also became a popular summer destination for wealthy New Yorkers, who built large estates in the area.
In the early 1900s, Skillman began to develop into a residential community. The area was home to several large estates, as well as smaller homes for the working class. The area was also home to a number of small businesses, such as a general store, a post office, and a blacksmith shop.
In the 1950s, Skillman began to experience rapid growth as the population of the area increased. This growth was due in part to the development of the nearby Princeton University, which brought many new residents to the area. The population of Skillman continued to grow throughout the 1960s and 1970s, and the area became a popular bedroom community for those working in nearby Princeton and New York City.
Geography
Skillman is located in central New Jersey in the heart of Somerset County. The area is bordered by Montgomery Township to the north, Princeton to the east, Hillsborough Township to the south, and Rocky Hill to the west. The area is mostly flat, with some rolling hills in the northern part of the area.
The climate in Skillman is typical of the northeastern United States, with cold winters and hot, humid summers. The average annual temperature is around 50 degrees Fahrenheit, with an average high of around 70 degrees in the summer and an average low of around 30 degrees in the winter.
Economy
The economy of Skillman is largely based on the nearby Princeton University, which is one of the largest employers in the area. Other major employers in the area include the Princeton Medical Center, the Princeton Plasma Physics Laboratory, and the Institute for Advanced Study.
The area is also home to a number of small businesses, such as restaurants, retail stores, and professional services. The area is also home to a number of technology companies, such as the software company Oracle.
Demographics
As of the 2010 census, the population of Skillman was 8,902. The population is largely white (83.3%), with smaller percentages of African Americans (7.2%), Asians (4.7%), and Hispanics (3.7%). The median household income in Skillman is $112,917, which is significantly higher than the national average of $53,482. The median age in Skillman is 43.7, which is slightly higher than the national average of 37.7.
Common Questions
What is Per Capita Income in Skillman?
Per Capita income in Skillman is $59,162.
What is the Median Family Income in Skillman?
Median Family Income in Skillman is $217,679.
What is the Median Household income in Skillman?
Median Household Income in Skillman is $132,105.
What is Inequality or Gini Index in Skillman?
Inequality or Gini Index in Skillman is 0.39.
What is the Total Population of Skillman?
Total Population of Skillman is 297.
What is the Total Male Population of Skillman?
Total Male Population of Skillman is 149.
What is the Total Female Population of Skillman?
Total Female Population of Skillman is 148.
What is the Ratio of Males per 100 Females in Skillman?
There are 100.68 Males per 100 Females in Skillman.
What is the Ratio of Females per 100 Males in Skillman?
There are 99.33 Females per 100 Males in Skillman.
What is the Median Population Age in Skillman?
Median Population Age in Skillman is 35.9 Years.
What is the Average Family Size in Skillman
Average Family Size in Skillman is 3.5 People.
What is the Average Household Size in Skillman
Average Household Size in Skillman is 2.6 People.
How Large is the Labor Force in Skillman?
There are 181 People in the Labor Forcein in Skillman.
What is the Percentage of People in the Labor Force in Skillman?
76.1% of People are in the Labor Force in Skillman.