Lithia Springs, GA Map & Demographics
Lithia Springs Map
Lithia Springs Overview
$26,844
PER CAPITA INCOME
$61,400
AVG FAMILY INCOME
$50,694
AVG HOUSEHOLD INCOME
24.9%
WAGE / INCOME GAP [ % ]
75.1¢/ $1
WAGE / INCOME GAP [ $ ]
0.41
INEQUALITY / GINI INDEX
16,020
TOTAL POPULATION
7,598
MALE POPULATION
8,422
FEMALE POPULATION
90.22
MALES / 100 FEMALES
110.84
FEMALES / 100 MALES
32.4
MEDIAN AGE
3.1
AVG FAMILY SIZE
2.4
AVG HOUSEHOLD SIZE
8,521
LABOR FORCE [ PEOPLE ]
66.8%
PERCENT IN LABOR FORCE
4.3%
UNEMPLOYMENT RATE
Lithia Springs Zip Codes
Lithia Springs Area Codes
Income in Lithia Springs
Income Overview in Lithia Springs
Per Capita Income in Lithia Springs is $26,844, while median incomes of families and households are $61,400 and $50,694 respectively.
| Characteristic | Number | Measure |
| Per Capita Income | 16,020 | $26,844 |
| Median Family Income | 3,772 | $61,400 |
| Mean Family Income | 3,772 | $74,514 |
| Median Household Income | 6,727 | $50,694 |
| Mean Household Income | 6,727 | $61,198 |
| Income Deficit | 3,772 | $0 |
| Wage / Income Gap (%) | 16,020 | 24.86% |
| Wage / Income Gap ($) | 16,020 | 75.14¢ per $1 |
| Gini / Inequality Index | 16,020 | 0.41 |
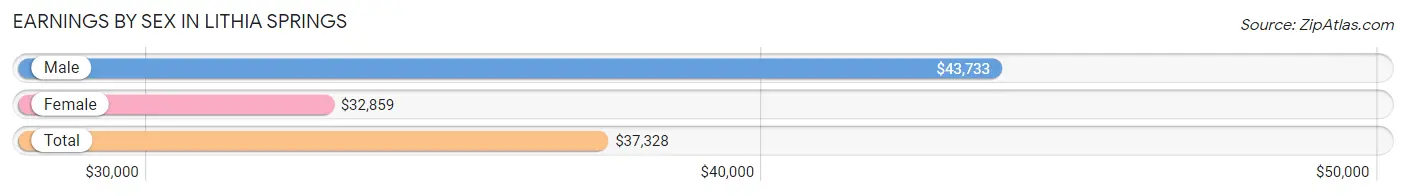
Earnings by Sex in Lithia Springs
Average Earnings in Lithia Springs are $37,328, $43,733 for men and $32,859 for women, a difference of 24.9%.
| Sex | Number | Average Earnings |
| Male | 4,121 (47.5%) | $43,733 |
| Female | 4,546 (52.4%) | $32,859 |
| Total | 8,667 (100.0%) | $37,328 |
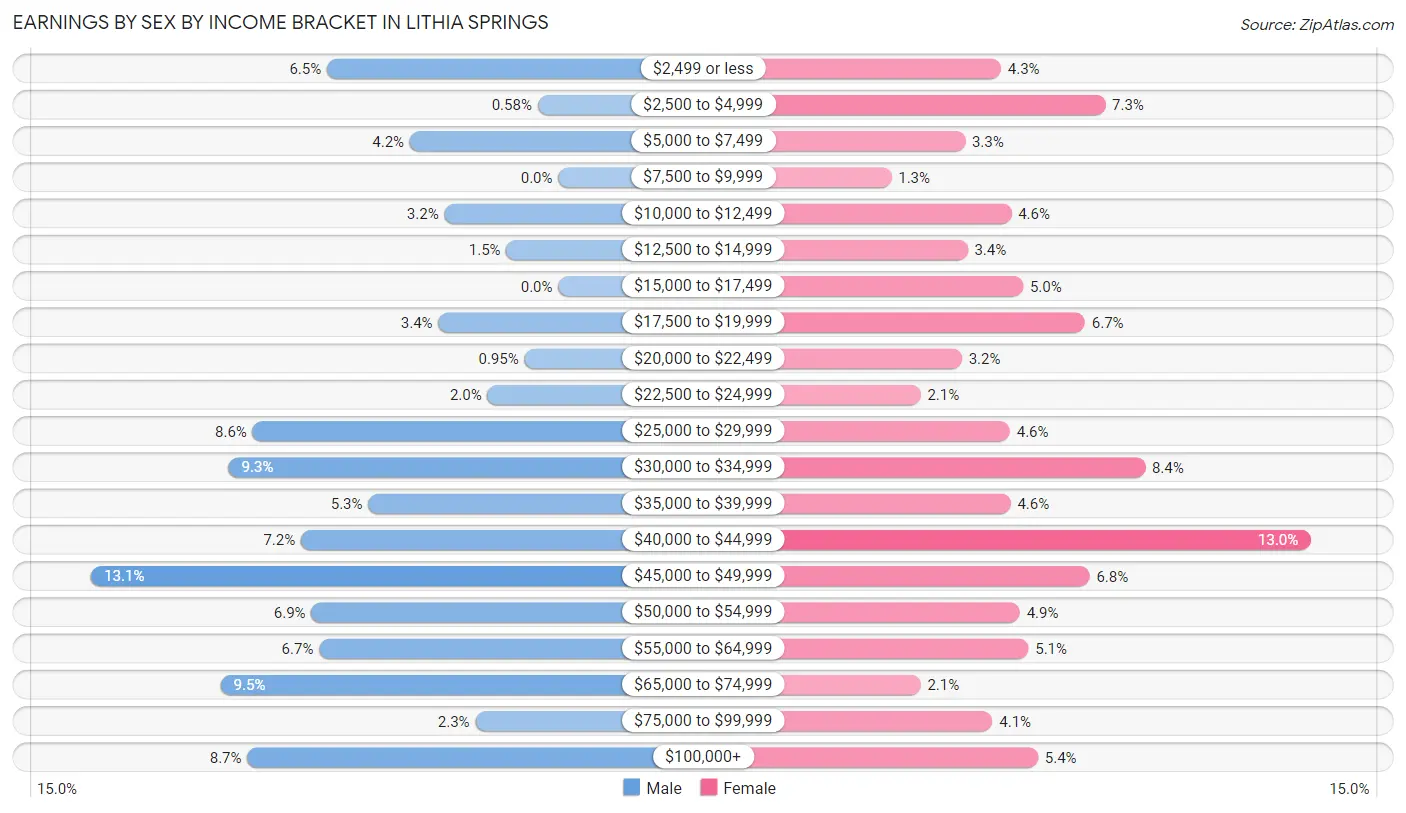
Earnings by Sex by Income Bracket in Lithia Springs
The most common earnings brackets in Lithia Springs are $45,000 to $49,999 for men (541 | 13.1%) and $40,000 to $44,999 for women (592 | 13.0%).
| Income | Male | Female |
| $2,499 or less | 268 (6.5%) | 197 (4.3%) |
| $2,500 to $4,999 | 24 (0.6%) | 330 (7.3%) |
| $5,000 to $7,499 | 172 (4.2%) | 151 (3.3%) |
| $7,500 to $9,999 | 0 (0.0%) | 57 (1.3%) |
| $10,000 to $12,499 | 132 (3.2%) | 210 (4.6%) |
| $12,500 to $14,999 | 60 (1.5%) | 154 (3.4%) |
| $15,000 to $17,499 | 0 (0.0%) | 225 (5.0%) |
| $17,500 to $19,999 | 139 (3.4%) | 304 (6.7%) |
| $20,000 to $22,499 | 39 (0.9%) | 147 (3.2%) |
| $22,500 to $24,999 | 82 (2.0%) | 94 (2.1%) |
| $25,000 to $29,999 | 354 (8.6%) | 208 (4.6%) |
| $30,000 to $34,999 | 382 (9.3%) | 381 (8.4%) |
| $35,000 to $39,999 | 220 (5.3%) | 209 (4.6%) |
| $40,000 to $44,999 | 298 (7.2%) | 592 (13.0%) |
| $45,000 to $49,999 | 541 (13.1%) | 310 (6.8%) |
| $50,000 to $54,999 | 286 (6.9%) | 221 (4.9%) |
| $55,000 to $64,999 | 277 (6.7%) | 232 (5.1%) |
| $65,000 to $74,999 | 391 (9.5%) | 94 (2.1%) |
| $75,000 to $99,999 | 96 (2.3%) | 186 (4.1%) |
| $100,000+ | 360 (8.7%) | 244 (5.4%) |
| Total | 4,121 (100.0%) | 4,546 (100.0%) |
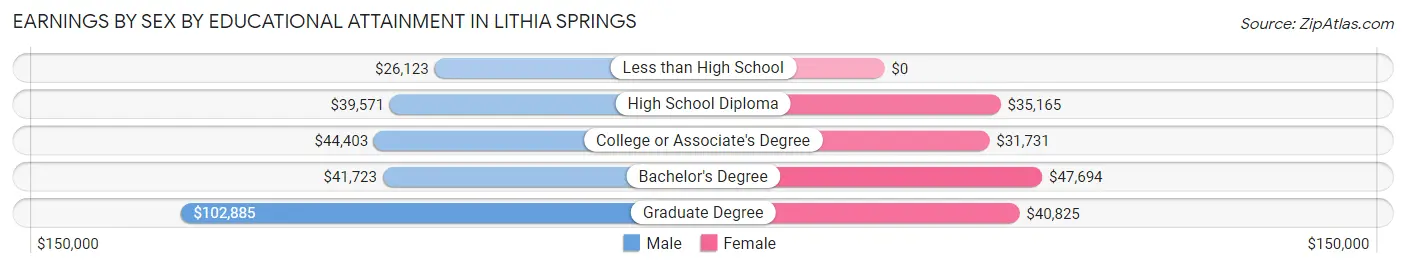
Earnings by Sex by Educational Attainment in Lithia Springs
Average earnings in Lithia Springs are $41,433 for men and $39,203 for women, a difference of 5.4%. Men with an educational attainment of graduate degree enjoy the highest average annual earnings of $102,885, while those with less than high school education earn the least with $26,123. Women with an educational attainment of bachelor's degree earn the most with the average annual earnings of $47,694, while those with college or associate's degree education have the smallest earnings of $31,731.
| Educational Attainment | Male Income | Female Income |
| Less than High School | $26,123 | $0 |
| High School Diploma | $39,571 | $35,165 |
| College or Associate's Degree | $44,403 | $31,731 |
| Bachelor's Degree | $41,723 | $47,694 |
| Graduate Degree | $102,885 | $40,825 |
| Total | $41,433 | $39,203 |
Family Income in Lithia Springs
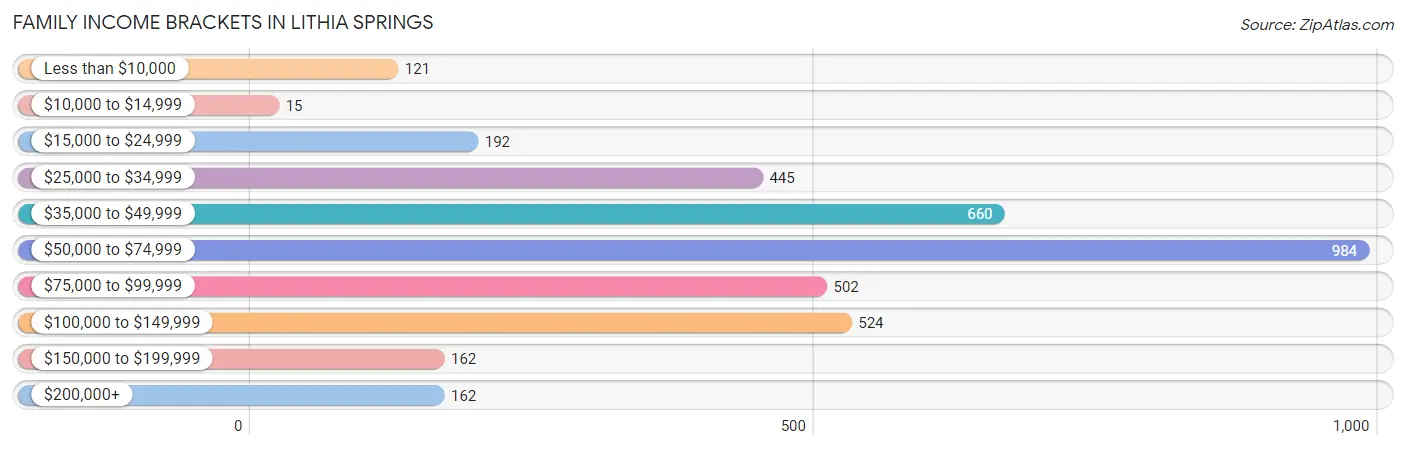
Family Income Brackets in Lithia Springs
According to the Lithia Springs family income data, there are 984 families falling into the $50,000 to $74,999 income range, which is the most common income bracket and makes up 26.1% of all families. Conversely, the $10,000 to $14,999 income bracket is the least frequent group with only 15 families (0.4%) belonging to this category.
| Income Bracket | # Families | % Families |
| Less than $10,000 | 121 | 3.2% |
| $10,000 to $14,999 | 15 | 0.4% |
| $15,000 to $24,999 | 192 | 5.1% |
| $25,000 to $34,999 | 445 | 11.8% |
| $35,000 to $49,999 | 660 | 17.5% |
| $50,000 to $74,999 | 984 | 26.1% |
| $75,000 to $99,999 | 502 | 13.3% |
| $100,000 to $149,999 | 524 | 13.9% |
| $150,000 to $199,999 | 162 | 4.3% |
| $200,000+ | 162 | 4.3% |
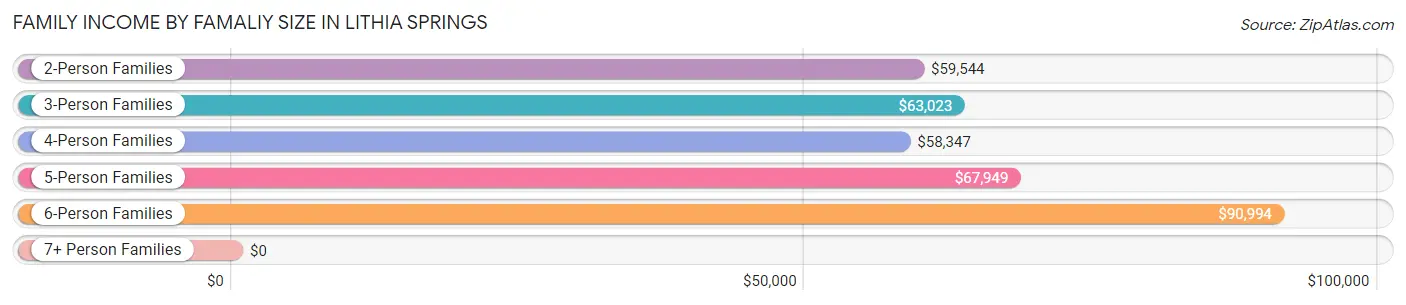
Family Income by Famaliy Size in Lithia Springs
6-person families (106 | 2.8%) account for the highest median family income in Lithia Springs with $90,994 per family, while 2-person families (1,761 | 46.7%) have the highest median income of $29,772 per family member.
| Income Bracket | # Families | Median Income |
| 2-Person Families | 1,761 (46.7%) | $59,544 |
| 3-Person Families | 1,192 (31.6%) | $63,023 |
| 4-Person Families | 423 (11.2%) | $58,347 |
| 5-Person Families | 290 (7.7%) | $67,949 |
| 6-Person Families | 106 (2.8%) | $90,994 |
| 7+ Person Families | 0 (0.0%) | $0 |
| Total | 3,772 (100.0%) | $61,400 |
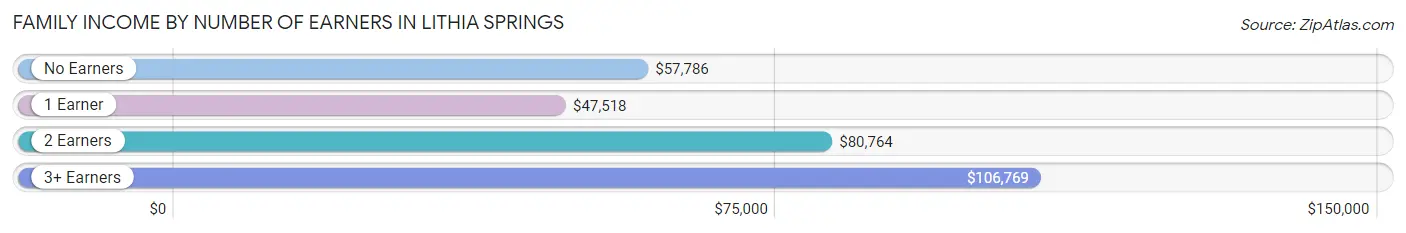
Family Income by Number of Earners in Lithia Springs
The median family income in Lithia Springs is $61,400, with families comprising 3+ earners (305) having the highest median family income of $106,769, while families with 1 earner (1,666) have the lowest median family income of $47,518, accounting for 8.1% and 44.2% of families, respectively.
| Number of Earners | # Families | Median Income |
| No Earners | 316 (8.4%) | $57,786 |
| 1 Earner | 1,666 (44.2%) | $47,518 |
| 2 Earners | 1,485 (39.4%) | $80,764 |
| 3+ Earners | 305 (8.1%) | $106,769 |
| Total | 3,772 (100.0%) | $61,400 |
Household Income in Lithia Springs
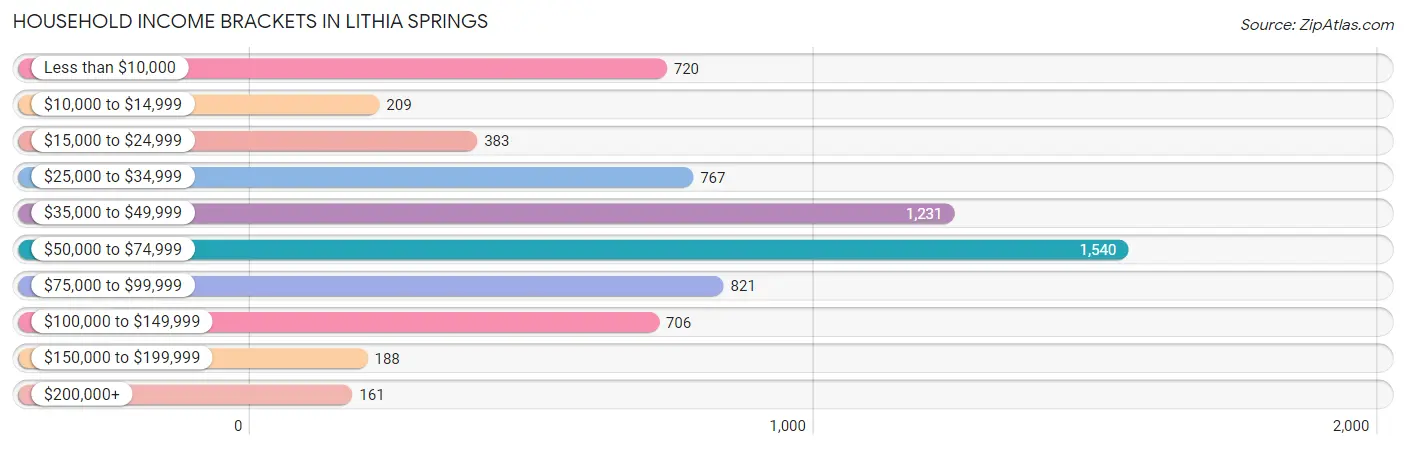
Household Income Brackets in Lithia Springs
With 1,540 households falling in the category, the $50,000 to $74,999 income range is the most frequent in Lithia Springs, accounting for 22.9% of all households. In contrast, only 161 households (2.4%) fall into the $200,000+ income bracket, making it the least populous group.
| Income Bracket | # Households | % Households |
| Less than $10,000 | 720 | 10.7% |
| $10,000 to $14,999 | 209 | 3.1% |
| $15,000 to $24,999 | 383 | 5.7% |
| $25,000 to $34,999 | 767 | 11.4% |
| $35,000 to $49,999 | 1,231 | 18.3% |
| $50,000 to $74,999 | 1,540 | 22.9% |
| $75,000 to $99,999 | 821 | 12.2% |
| $100,000 to $149,999 | 706 | 10.5% |
| $150,000 to $199,999 | 188 | 2.8% |
| $200,000+ | 161 | 2.4% |
Household Income by Householder Age in Lithia Springs
The median household income in Lithia Springs is $50,694, with the highest median household income of $63,091 found in the 25 to 44 years age bracket for the primary householder. A total of 2,503 households (37.2%) fall into this category. Meanwhile, the 15 to 24 years age bracket for the primary householder has the lowest median household income of $2,499, with 803 households (11.9%) in this group.
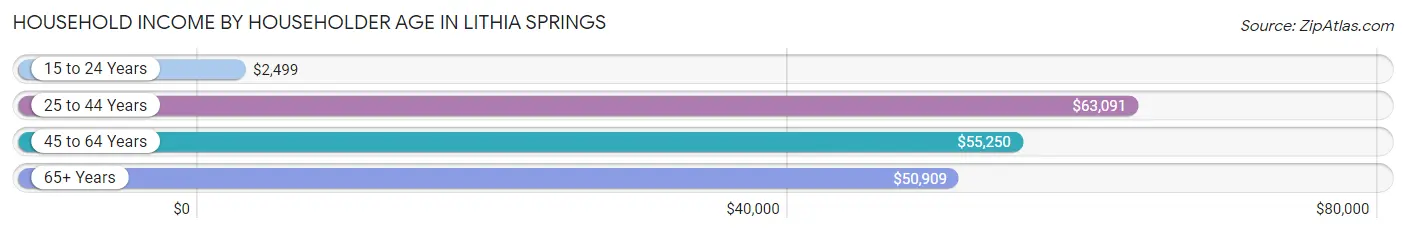
| Income Bracket | # Households | Median Income |
| 15 to 24 Years | 803 (11.9%) | $2,499 |
| 25 to 44 Years | 2,503 (37.2%) | $63,091 |
| 45 to 64 Years | 2,197 (32.7%) | $55,250 |
| 65+ Years | 1,224 (18.2%) | $50,909 |
| Total | 6,727 (100.0%) | $50,694 |
Poverty in Lithia Springs
Income Below Poverty by Sex and Age in Lithia Springs
With 15.6% poverty level for males and 22.6% for females among the residents of Lithia Springs, 18 to 24 year old males and 15 year old females are the most vulnerable to poverty, with 513 males (42.7%) and 20 females (100.0%) in their respective age groups living below the poverty level.
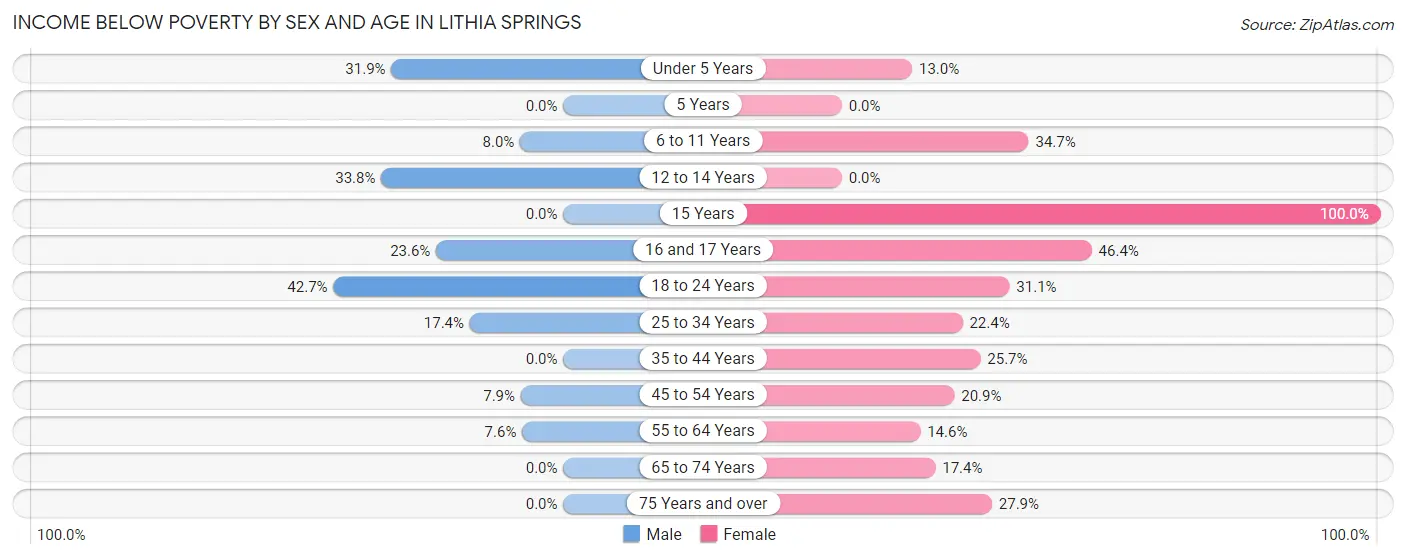
| Age Bracket | Male | Female |
| Under 5 Years | 98 (31.9%) | 63 (13.0%) |
| 5 Years | 0 (0.0%) | 0 (0.0%) |
| 6 to 11 Years | 45 (8.0%) | 174 (34.7%) |
| 12 to 14 Years | 173 (33.8%) | 0 (0.0%) |
| 15 Years | 0 (0.0%) | 20 (100.0%) |
| 16 and 17 Years | 76 (23.6%) | 109 (46.4%) |
| 18 to 24 Years | 513 (42.7%) | 369 (31.1%) |
| 25 to 34 Years | 148 (17.3%) | 288 (22.4%) |
| 35 to 44 Years | 0 (0.0%) | 304 (25.7%) |
| 45 to 54 Years | 69 (7.9%) | 214 (20.9%) |
| 55 to 64 Years | 53 (7.6%) | 135 (14.6%) |
| 65 to 74 Years | 0 (0.0%) | 109 (17.4%) |
| 75 Years and over | 0 (0.0%) | 83 (27.9%) |
| Total | 1,175 (15.6%) | 1,868 (22.6%) |
Income Above Poverty by Sex and Age in Lithia Springs
According to the poverty statistics in Lithia Springs, males aged 5 years and females aged 5 years are the age groups that are most secure financially, with 100.0% of males and 100.0% of females in these age groups living above the poverty line.
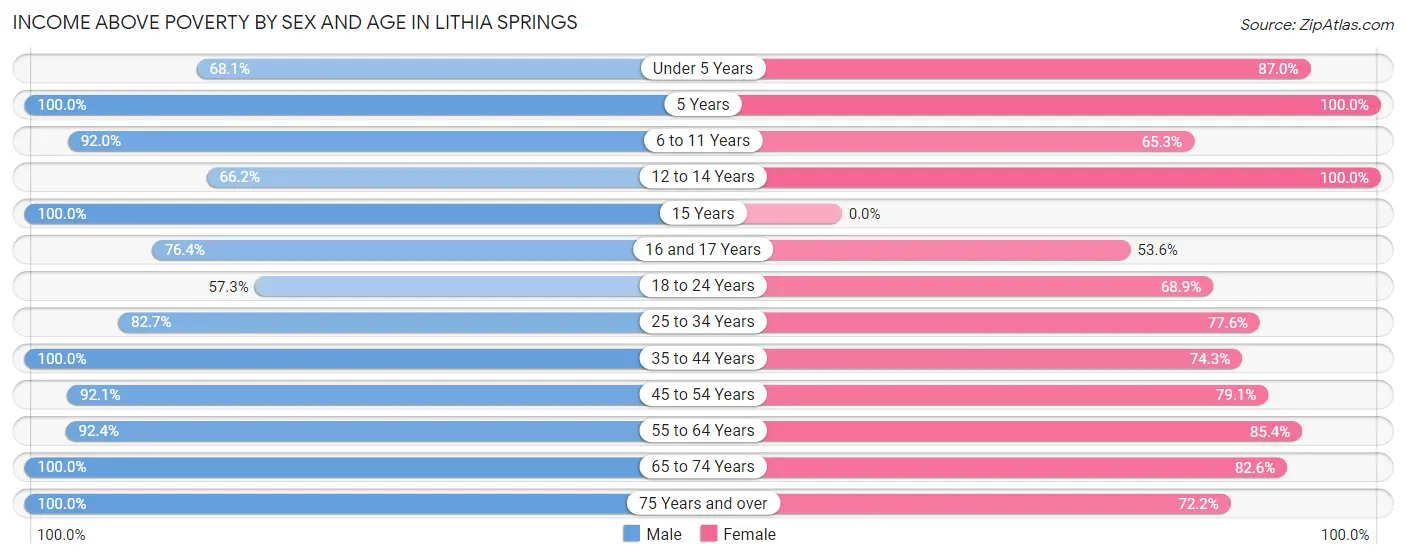
| Age Bracket | Male | Female |
| Under 5 Years | 209 (68.1%) | 420 (87.0%) |
| 5 Years | 43 (100.0%) | 66 (100.0%) |
| 6 to 11 Years | 517 (92.0%) | 328 (65.3%) |
| 12 to 14 Years | 339 (66.2%) | 444 (100.0%) |
| 15 Years | 128 (100.0%) | 0 (0.0%) |
| 16 and 17 Years | 246 (76.4%) | 126 (53.6%) |
| 18 to 24 Years | 689 (57.3%) | 817 (68.9%) |
| 25 to 34 Years | 705 (82.7%) | 998 (77.6%) |
| 35 to 44 Years | 985 (100.0%) | 878 (74.3%) |
| 45 to 54 Years | 805 (92.1%) | 811 (79.1%) |
| 55 to 64 Years | 642 (92.4%) | 792 (85.4%) |
| 65 to 74 Years | 698 (100.0%) | 519 (82.6%) |
| 75 Years and over | 357 (100.0%) | 215 (72.2%) |
| Total | 6,363 (84.4%) | 6,414 (77.4%) |
Income Below Poverty Among Married-Couple Families in Lithia Springs
The poverty statistics for married-couple families in Lithia Springs show that 6.1% or 135 of the total 2,223 families live below the poverty line. Families with 1 or 2 children have the highest poverty rate of 23.4%, comprising of 121 families. On the other hand, families with no children have the lowest poverty rate of 0.0%, which includes 0 families.
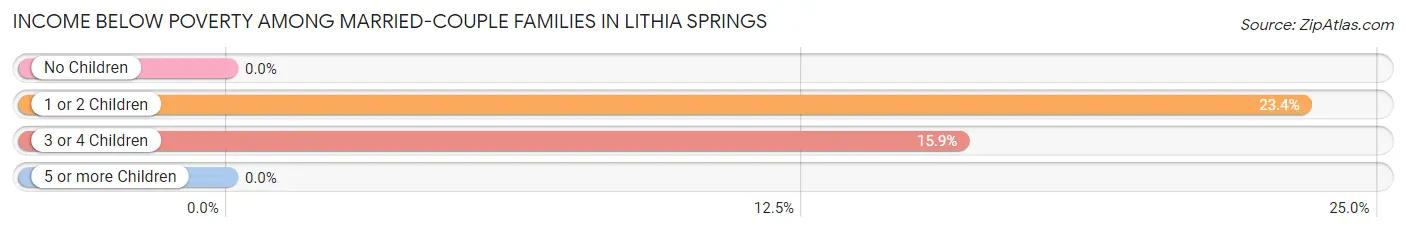
| Children | Above Poverty | Below Poverty |
| No Children | 1,617 (100.0%) | 0 (0.0%) |
| 1 or 2 Children | 397 (76.6%) | 121 (23.4%) |
| 3 or 4 Children | 74 (84.1%) | 14 (15.9%) |
| 5 or more Children | 0 (0.0%) | 0 (0.0%) |
| Total | 2,088 (93.9%) | 135 (6.1%) |
Income Below Poverty Among Single-Parent Households in Lithia Springs
According to the poverty data in Lithia Springs, 6.4% or 30 single-father households and 21.3% or 229 single-mother households are living below the poverty line. Among single-father households, those with no children have the highest poverty rate, with 30 households (21.3%) experiencing poverty. Likewise, among single-mother households, those with 3 or 4 children have the highest poverty rate, with 66 households (100.0%) falling below the poverty line.
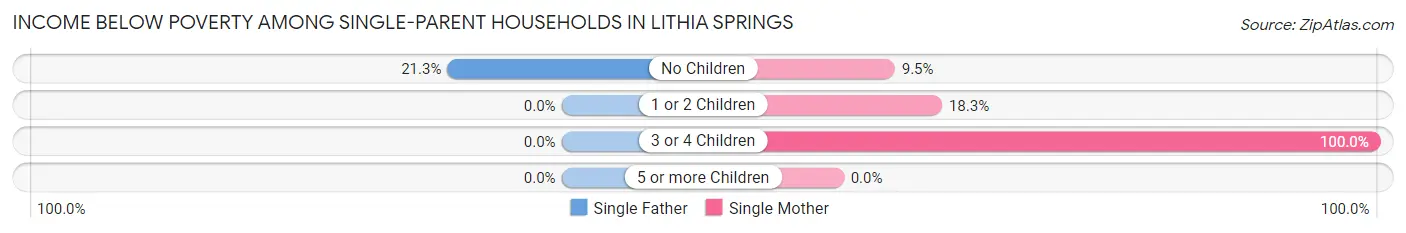
| Children | Single Father | Single Mother |
| No Children | 30 (21.3%) | 24 (9.5%) |
| 1 or 2 Children | 0 (0.0%) | 139 (18.3%) |
| 3 or 4 Children | 0 (0.0%) | 66 (100.0%) |
| 5 or more Children | 0 (0.0%) | 0 (0.0%) |
| Total | 30 (6.4%) | 229 (21.3%) |
Income Below Poverty Among Married-Couple vs Single-Parent Households in Lithia Springs
The poverty data for Lithia Springs shows that 135 of the married-couple family households (6.1%) and 259 of the single-parent households (16.7%) are living below the poverty level. Within the married-couple family households, those with 1 or 2 children have the highest poverty rate, with 121 households (23.4%) falling below the poverty line. Among the single-parent households, those with 3 or 4 children have the highest poverty rate, with 66 household (41.8%) living below poverty.
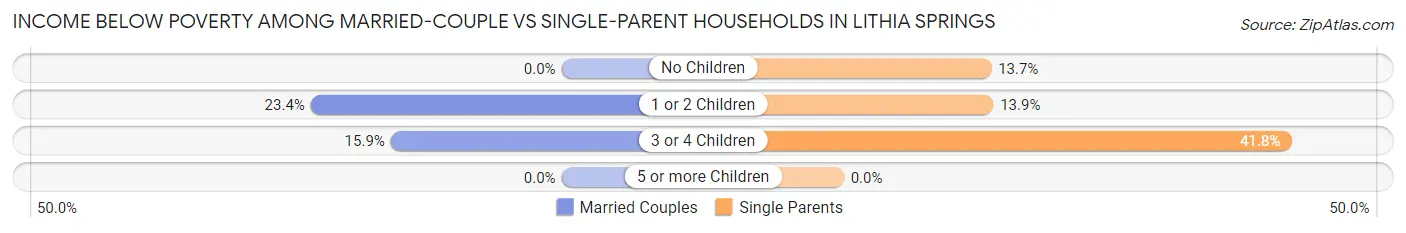
| Children | Married-Couple Families | Single-Parent Households |
| No Children | 0 (0.0%) | 54 (13.7%) |
| 1 or 2 Children | 121 (23.4%) | 139 (13.9%) |
| 3 or 4 Children | 14 (15.9%) | 66 (41.8%) |
| 5 or more Children | 0 (0.0%) | 0 (0.0%) |
| Total | 135 (6.1%) | 259 (16.7%) |
Race in Lithia Springs
The most populous races in Lithia Springs are Black / African American (7,776 | 48.5%), White / Caucasian (5,541 | 34.6%), and Hispanic or Latino (3,690 | 23.0%).
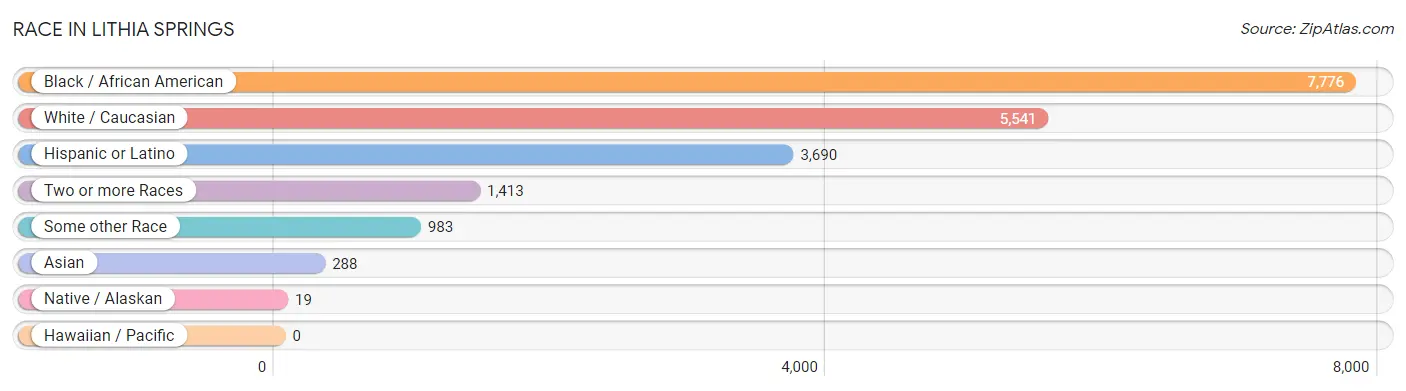
| Race | # Population | % Population |
| Asian | 288 | 1.8% |
| Black / African American | 7,776 | 48.5% |
| Hawaiian / Pacific | 0 | 0.0% |
| Hispanic or Latino | 3,690 | 23.0% |
| Native / Alaskan | 19 | 0.1% |
| White / Caucasian | 5,541 | 34.6% |
| Two or more Races | 1,413 | 8.8% |
| Some other Race | 983 | 6.1% |
| Total | 16,020 | 100.0% |
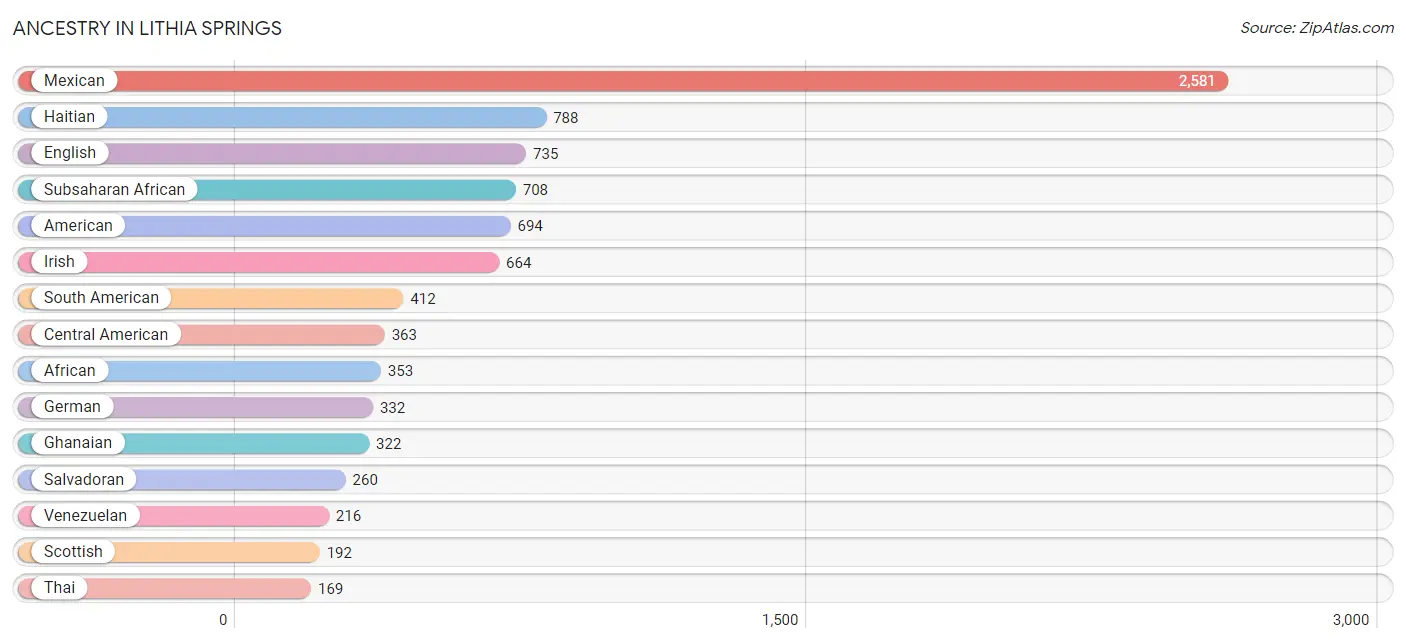
Ancestry in Lithia Springs
The most populous ancestries reported in Lithia Springs are Mexican (2,581 | 16.1%), Haitian (788 | 4.9%), English (735 | 4.6%), Subsaharan African (708 | 4.4%), and American (694 | 4.3%), together accounting for 34.4% of all Lithia Springs residents.
| Ancestry | # Population | % Population |
| African | 353 | 2.2% |
| American | 694 | 4.3% |
| Argentinean | 73 | 0.5% |
| Bhutanese | 120 | 0.7% |
| Blackfeet | 48 | 0.3% |
| Burmese | 19 | 0.1% |
| Central American | 363 | 2.3% |
| Cherokee | 88 | 0.5% |
| Colombian | 98 | 0.6% |
| Croatian | 21 | 0.1% |
| Czech | 38 | 0.2% |
| Czechoslovakian | 1 | 0.0% |
| Dominican | 88 | 0.5% |
| Dutch | 8 | 0.1% |
| Eastern European | 33 | 0.2% |
| English | 735 | 4.6% |
| Ethiopian | 13 | 0.1% |
| European | 42 | 0.3% |
| French | 26 | 0.2% |
| German | 332 | 2.1% |
| Ghanaian | 322 | 2.0% |
| Guatemalan | 41 | 0.3% |
| Haitian | 788 | 4.9% |
| Honduran | 62 | 0.4% |
| Irish | 664 | 4.1% |
| Italian | 121 | 0.8% |
| Jamaican | 137 | 0.9% |
| Lithuanian | 82 | 0.5% |
| Mexican | 2,581 | 16.1% |
| Nigerian | 20 | 0.1% |
| Norwegian | 40 | 0.3% |
| Pakistani | 2 | 0.0% |
| Peruvian | 25 | 0.2% |
| Polish | 64 | 0.4% |
| Puerto Rican | 69 | 0.4% |
| Russian | 33 | 0.2% |
| Salvadoran | 260 | 1.6% |
| Scotch-Irish | 64 | 0.4% |
| Scottish | 192 | 1.2% |
| South American | 412 | 2.6% |
| Subsaharan African | 708 | 4.4% |
| Swedish | 77 | 0.5% |
| Thai | 169 | 1.1% |
| Venezuelan | 216 | 1.3% |
| Welsh | 6 | 0.0% | View All 45 Rows |
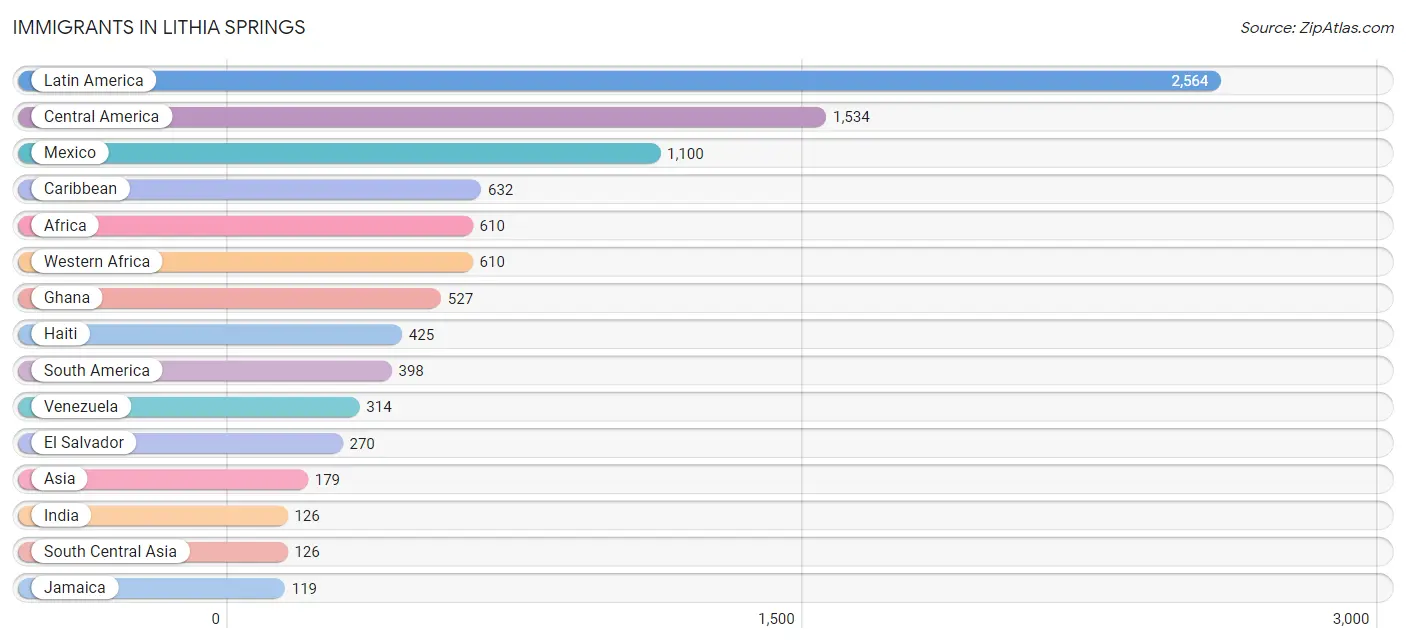
Immigrants in Lithia Springs
The most numerous immigrant groups reported in Lithia Springs came from Latin America (2,564 | 16.0%), Central America (1,534 | 9.6%), Mexico (1,100 | 6.9%), Caribbean (632 | 4.0%), and Africa (610 | 3.8%), together accounting for 40.2% of all Lithia Springs residents.
| Immigration Origin | # Population | % Population |
| Africa | 610 | 3.8% |
| Argentina | 73 | 0.5% |
| Asia | 179 | 1.1% |
| Cambodia | 34 | 0.2% |
| Caribbean | 632 | 4.0% |
| Central America | 1,534 | 9.6% |
| Dominican Republic | 88 | 0.5% |
| Eastern Asia | 19 | 0.1% |
| El Salvador | 270 | 1.7% |
| Europe | 45 | 0.3% |
| Germany | 45 | 0.3% |
| Ghana | 527 | 3.3% |
| Guatemala | 41 | 0.3% |
| Haiti | 425 | 2.6% |
| Honduras | 62 | 0.4% |
| India | 126 | 0.8% |
| Jamaica | 119 | 0.7% |
| Korea | 19 | 0.1% |
| Latin America | 2,564 | 16.0% |
| Mexico | 1,100 | 6.9% |
| Nicaragua | 61 | 0.4% |
| Nigeria | 83 | 0.5% |
| Peru | 11 | 0.1% |
| South America | 398 | 2.5% |
| South Central Asia | 126 | 0.8% |
| South Eastern Asia | 34 | 0.2% |
| Venezuela | 314 | 2.0% |
| Western Africa | 610 | 3.8% |
| Western Europe | 45 | 0.3% | View All 29 Rows |
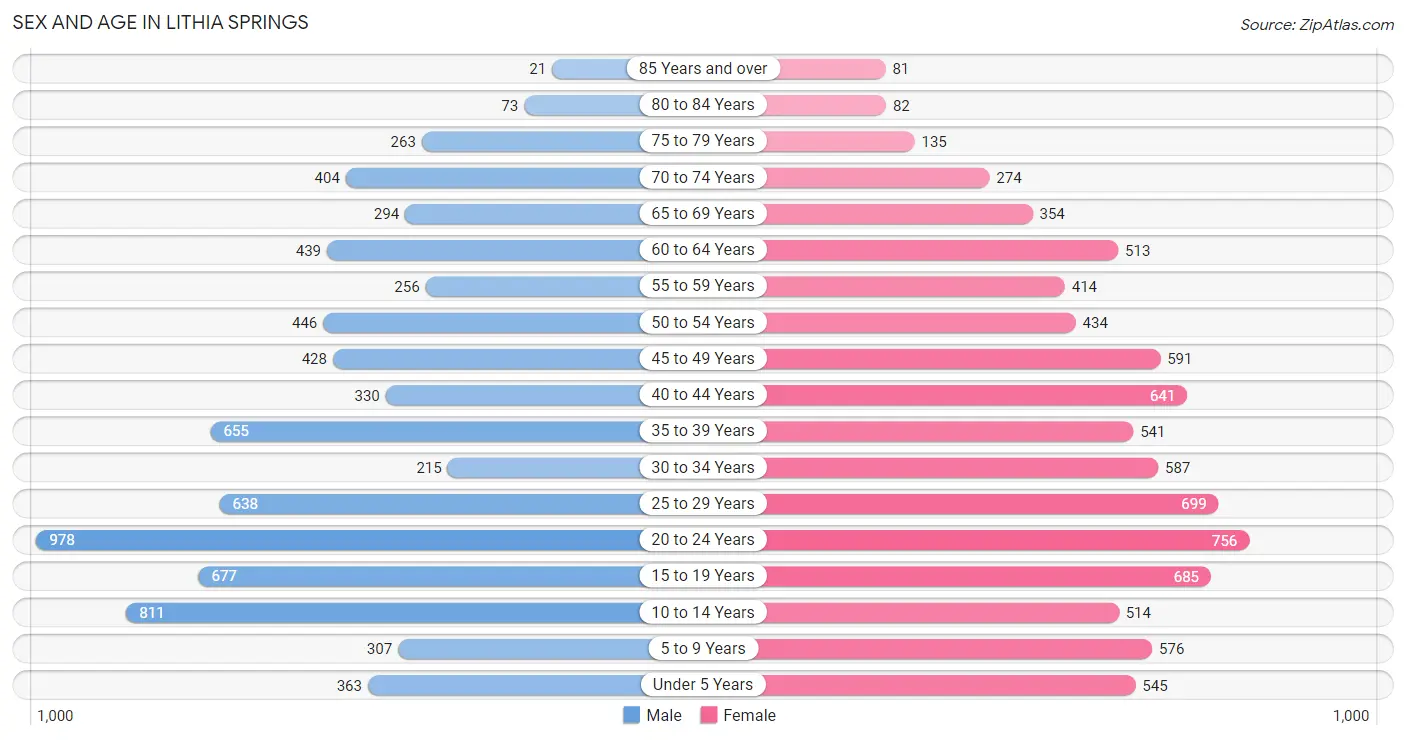
Sex and Age in Lithia Springs
Sex and Age in Lithia Springs
The most populous age groups in Lithia Springs are 20 to 24 Years (978 | 12.9%) for men and 20 to 24 Years (756 | 9.0%) for women.
| Age Bracket | Male | Female |
| Under 5 Years | 363 (4.8%) | 545 (6.5%) |
| 5 to 9 Years | 307 (4.0%) | 576 (6.8%) |
| 10 to 14 Years | 811 (10.7%) | 514 (6.1%) |
| 15 to 19 Years | 677 (8.9%) | 685 (8.1%) |
| 20 to 24 Years | 978 (12.9%) | 756 (9.0%) |
| 25 to 29 Years | 638 (8.4%) | 699 (8.3%) |
| 30 to 34 Years | 215 (2.8%) | 587 (7.0%) |
| 35 to 39 Years | 655 (8.6%) | 541 (6.4%) |
| 40 to 44 Years | 330 (4.3%) | 641 (7.6%) |
| 45 to 49 Years | 428 (5.6%) | 591 (7.0%) |
| 50 to 54 Years | 446 (5.9%) | 434 (5.1%) |
| 55 to 59 Years | 256 (3.4%) | 414 (4.9%) |
| 60 to 64 Years | 439 (5.8%) | 513 (6.1%) |
| 65 to 69 Years | 294 (3.9%) | 354 (4.2%) |
| 70 to 74 Years | 404 (5.3%) | 274 (3.3%) |
| 75 to 79 Years | 263 (3.5%) | 135 (1.6%) |
| 80 to 84 Years | 73 (1.0%) | 82 (1.0%) |
| 85 Years and over | 21 (0.3%) | 81 (1.0%) |
| Total | 7,598 (100.0%) | 8,422 (100.0%) |
Families and Households in Lithia Springs
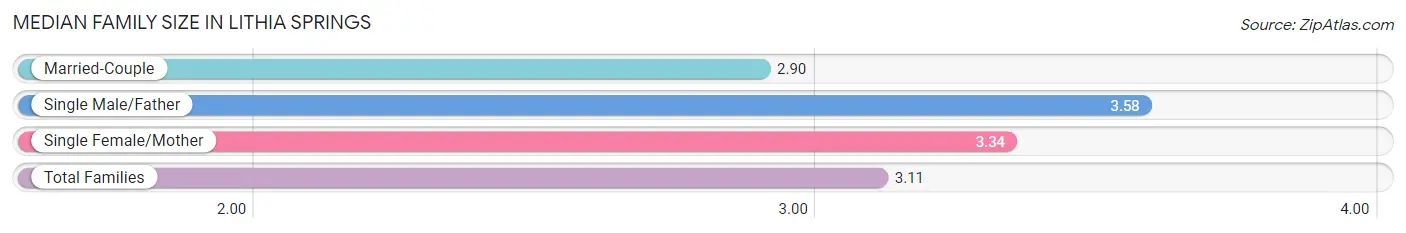
Median Family Size in Lithia Springs
The median family size in Lithia Springs is 3.11 persons per family, with single male/father families (472 | 12.5%) accounting for the largest median family size of 3.58 persons per family. On the other hand, married-couple families (2,223 | 58.9%) represent the smallest median family size with 2.90 persons per family.
| Family Type | # Families | Family Size |
| Married-Couple | 2,223 (58.9%) | 2.90 |
| Single Male/Father | 472 (12.5%) | 3.58 |
| Single Female/Mother | 1,077 (28.5%) | 3.34 |
| Total Families | 3,772 (100.0%) | 3.11 |
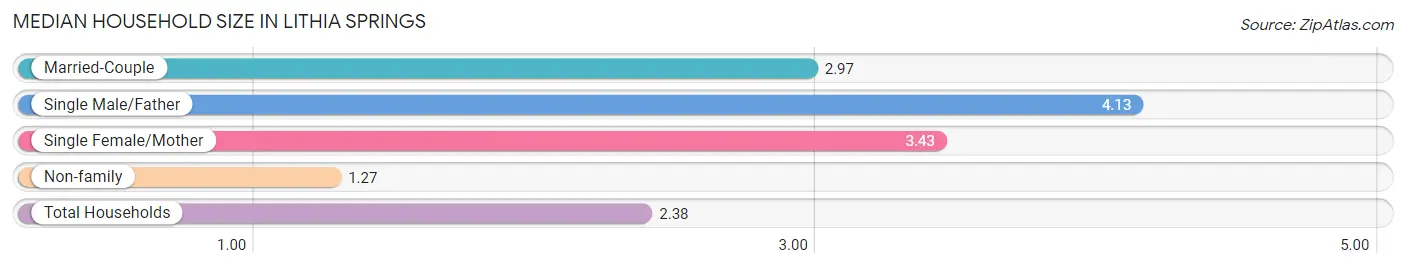
Median Household Size in Lithia Springs
The median household size in Lithia Springs is 2.38 persons per household, with single male/father households (472 | 7.0%) accounting for the largest median household size of 4.13 persons per household. non-family households (2,955 | 43.9%) represent the smallest median household size with 1.27 persons per household.
| Household Type | # Households | Household Size |
| Married-Couple | 2,223 (33.1%) | 2.97 |
| Single Male/Father | 472 (7.0%) | 4.13 |
| Single Female/Mother | 1,077 (16.0%) | 3.43 |
| Non-family | 2,955 (43.9%) | 1.27 |
| Total Households | 6,727 (100.0%) | 2.38 |
Household Size by Marriage Status in Lithia Springs
Out of a total of 6,727 households in Lithia Springs, 3,772 (56.1%) are family households, while 2,955 (43.9%) are nonfamily households. The most numerous type of family households are 2-person households, comprising 1,648, and the most common type of nonfamily households are 1-person households, comprising 2,403.
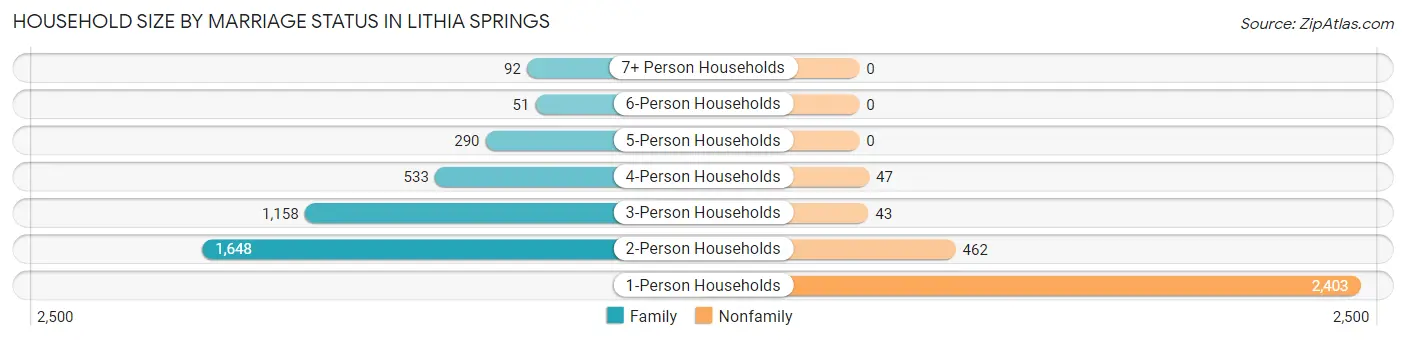
| Household Size | Family Households | Nonfamily Households |
| 1-Person Households | - | 2,403 (35.7%) |
| 2-Person Households | 1,648 (24.5%) | 462 (6.9%) |
| 3-Person Households | 1,158 (17.2%) | 43 (0.6%) |
| 4-Person Households | 533 (7.9%) | 47 (0.7%) |
| 5-Person Households | 290 (4.3%) | 0 (0.0%) |
| 6-Person Households | 51 (0.8%) | 0 (0.0%) |
| 7+ Person Households | 92 (1.4%) | 0 (0.0%) |
| Total | 3,772 (56.1%) | 2,955 (43.9%) |
Female Fertility in Lithia Springs
Fertility by Age in Lithia Springs
Average fertility rate in Lithia Springs is 64.0 births per 1,000 women. Women in the age bracket of 15 to 19 years have the highest fertility rate with 178.0 births per 1,000 women. Women in the age bracket of 15 to 19 years acount for 41.8% of all women with births.
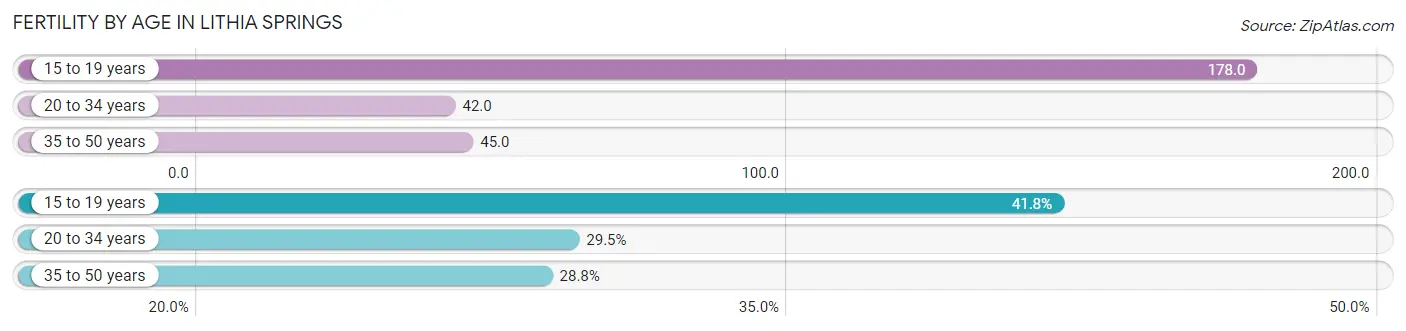
| Age Bracket | Women with Births | Births / 1,000 Women |
| 15 to 19 years | 122 (41.8%) | 178.0 |
| 20 to 34 years | 86 (29.4%) | 42.0 |
| 35 to 50 years | 84 (28.8%) | 45.0 |
| Total | 292 (100.0%) | 64.0 |
Fertility by Age by Marriage Status in Lithia Springs
20.2% of women with births (292) in Lithia Springs are married. The highest percentage of unmarried women with births falls into 15 to 19 years age bracket with 100.0% of them unmarried at the time of birth, while the lowest percentage of unmarried women with births belong to 20 to 34 years age bracket with 31.4% of them unmarried.
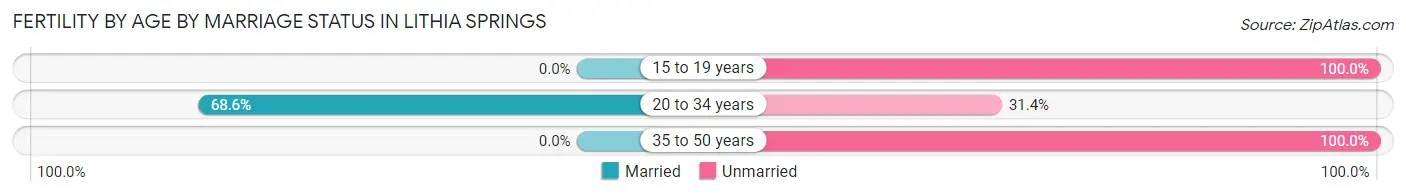
| Age Bracket | Married | Unmarried |
| 15 to 19 years | 0 (0.0%) | 122 (100.0%) |
| 20 to 34 years | 59 (68.6%) | 27 (31.4%) |
| 35 to 50 years | 0 (0.0%) | 84 (100.0%) |
| Total | 59 (20.2%) | 233 (79.8%) |
Fertility by Education in Lithia Springs
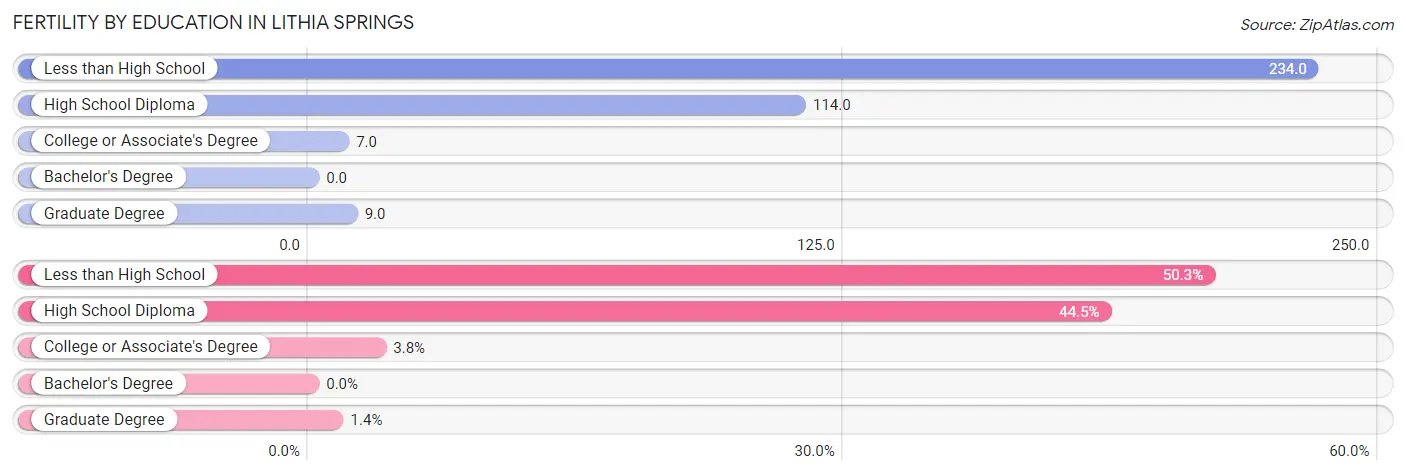
| Educational Attainment | Women with Births | Births / 1,000 Women |
| Less than High School | 147 (50.3%) | 234.0 |
| High School Diploma | 130 (44.5%) | 114.0 |
| College or Associate's Degree | 11 (3.8%) | 7.0 |
| Bachelor's Degree | 0 (0.0%) | 0.0 |
| Graduate Degree | 4 (1.4%) | 9.0 |
| Total | 292 (100.0%) | 64.0 |
Fertility by Education by Marriage Status in Lithia Springs
79.8% of women with births in Lithia Springs are unmarried. Women with the educational attainment of graduate degree are most likely to be married with 100.0% of them married at childbirth, while women with the educational attainment of college or associate's degree are least likely to be married with 100.0% of them unmarried at childbirth.
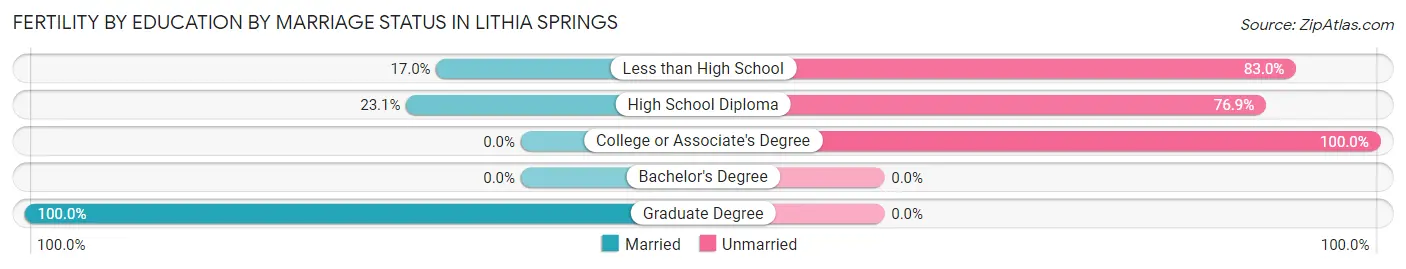
| Educational Attainment | Married | Unmarried |
| Less than High School | 25 (17.0%) | 122 (83.0%) |
| High School Diploma | 30 (23.1%) | 100 (76.9%) |
| College or Associate's Degree | 0 (0.0%) | 11 (100.0%) |
| Bachelor's Degree | 0 (0.0%) | 0 (0.0%) |
| Graduate Degree | 4 (100.0%) | 0 (0.0%) |
| Total | 59 (20.2%) | 233 (79.8%) |
Employment Characteristics in Lithia Springs
Employment by Class of Employer in Lithia Springs
Among the 7,979 employed individuals in Lithia Springs, private company employees (6,016 | 75.4%), not-for-profit organizations (474 | 5.9%), and local government employees (446 | 5.6%) make up the most common classes of employment.
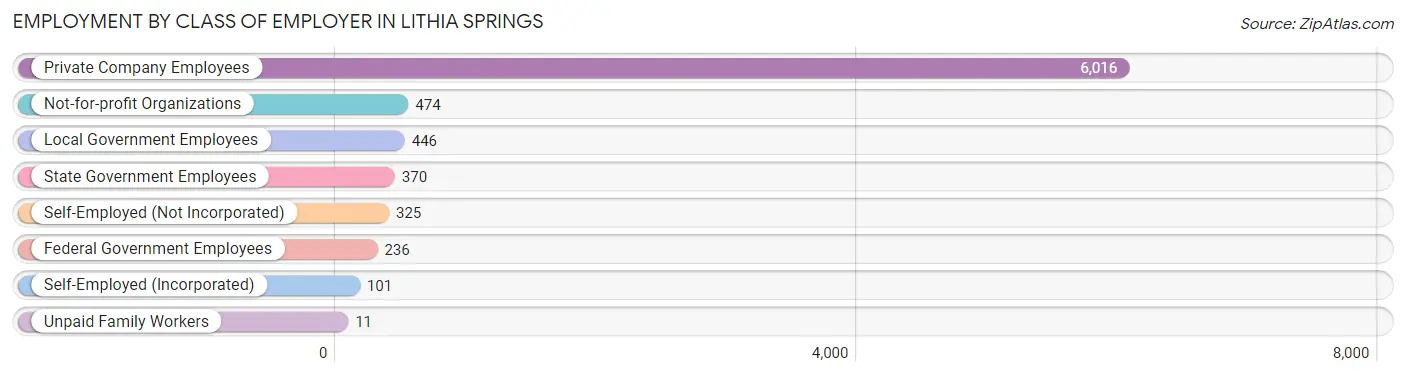
| Employer Class | # Employees | % Employees |
| Private Company Employees | 6,016 | 75.4% |
| Self-Employed (Incorporated) | 101 | 1.3% |
| Self-Employed (Not Incorporated) | 325 | 4.1% |
| Not-for-profit Organizations | 474 | 5.9% |
| Local Government Employees | 446 | 5.6% |
| State Government Employees | 370 | 4.6% |
| Federal Government Employees | 236 | 3.0% |
| Unpaid Family Workers | 11 | 0.1% |
| Total | 7,979 | 100.0% |
Employment Status by Age in Lithia Springs
According to the labor force statistics for Lithia Springs, out of the total population over 16 years of age (12,756), 66.8% or 8,521 individuals are in the labor force, with 4.3% or 366 of them unemployed. The age group with the highest labor force participation rate is 25 to 29 years, with 92.4% or 1,235 individuals in the labor force. Within the labor force, the 20 to 24 years age range has the highest percentage of unemployed individuals, with 14.1% or 149 of them being unemployed.
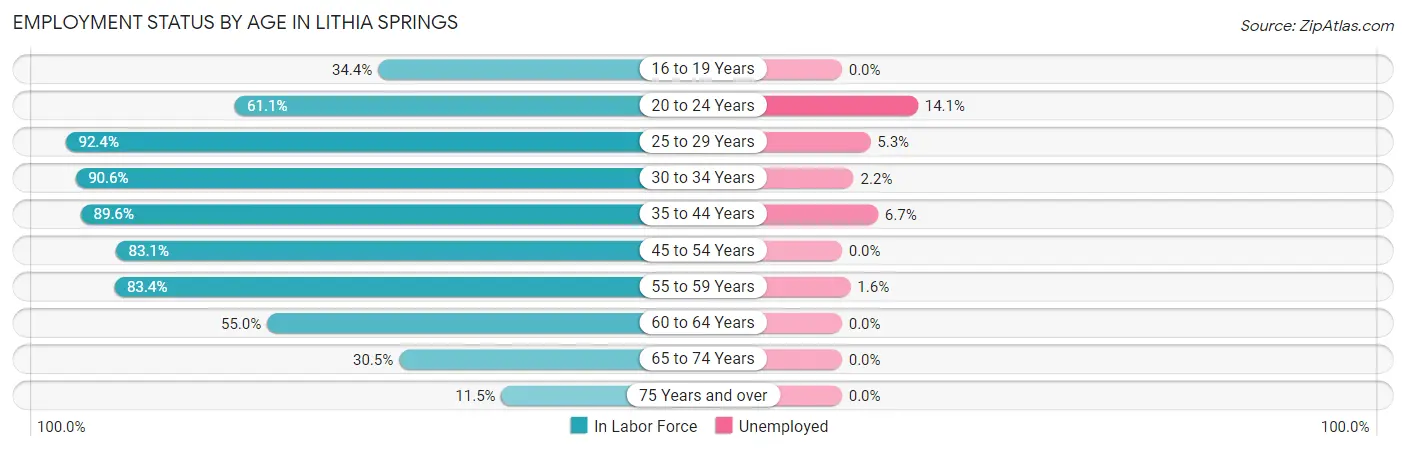
| Age Bracket | In Labor Force | Unemployed |
| 16 to 19 Years | 418 (34.4%) | 0 (0.0%) |
| 20 to 24 Years | 1,059 (61.1%) | 149 (14.1%) |
| 25 to 29 Years | 1,235 (92.4%) | 65 (5.3%) |
| 30 to 34 Years | 727 (90.6%) | 16 (2.2%) |
| 35 to 44 Years | 1,942 (89.6%) | 130 (6.7%) |
| 45 to 54 Years | 1,578 (83.1%) | 0 (0.0%) |
| 55 to 59 Years | 559 (83.4%) | 9 (1.6%) |
| 60 to 64 Years | 524 (55.0%) | 0 (0.0%) |
| 65 to 74 Years | 404 (30.5%) | 0 (0.0%) |
| 75 Years and over | 75 (11.5%) | 0 (0.0%) |
| Total | 8,521 (66.8%) | 366 (4.3%) |
Employment Status by Educational Attainment in Lithia Springs
According to labor force statistics for Lithia Springs, 83.9% of individuals (6,567) out of the total population between 25 and 64 years of age (7,827) are in the labor force, with 3.4% or 223 of them being unemployed. The group with the highest labor force participation rate are those with the educational attainment of bachelor's degree or higher, with 94.6% or 2,204 individuals in the labor force. Within the labor force, individuals with college / associate degree education have the highest percentage of unemployment, with 8.7% or 190 of them being unemployed.
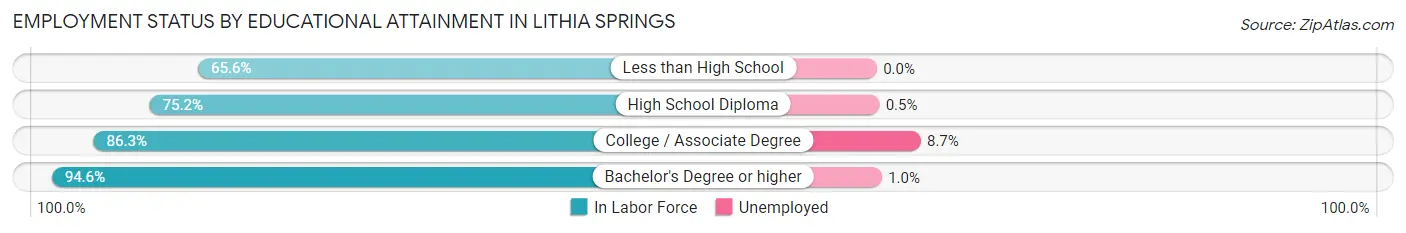
| Educational Attainment | In Labor Force | Unemployed |
| Less than High School | 373 (65.6%) | 0 (0.0%) |
| High School Diploma | 1,803 (75.2%) | 12 (0.5%) |
| College / Associate Degree | 2,184 (86.3%) | 220 (8.7%) |
| Bachelor's Degree or higher | 2,204 (94.6%) | 23 (1.0%) |
| Total | 6,567 (83.9%) | 266 (3.4%) |
Employment Occupations by Sex in Lithia Springs
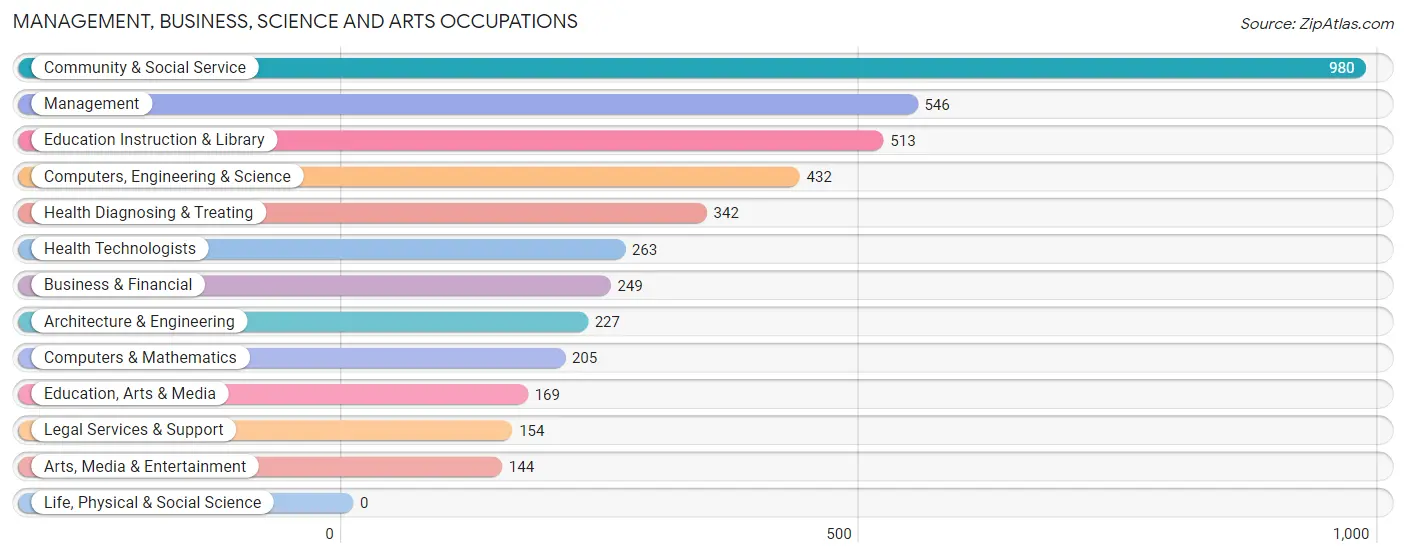
Management, Business, Science and Arts Occupations
The most common Management, Business, Science and Arts occupations in Lithia Springs are Community & Social Service (980 | 12.0%), Management (546 | 6.7%), Education Instruction & Library (513 | 6.3%), Computers, Engineering & Science (432 | 5.3%), and Health Diagnosing & Treating (342 | 4.2%).
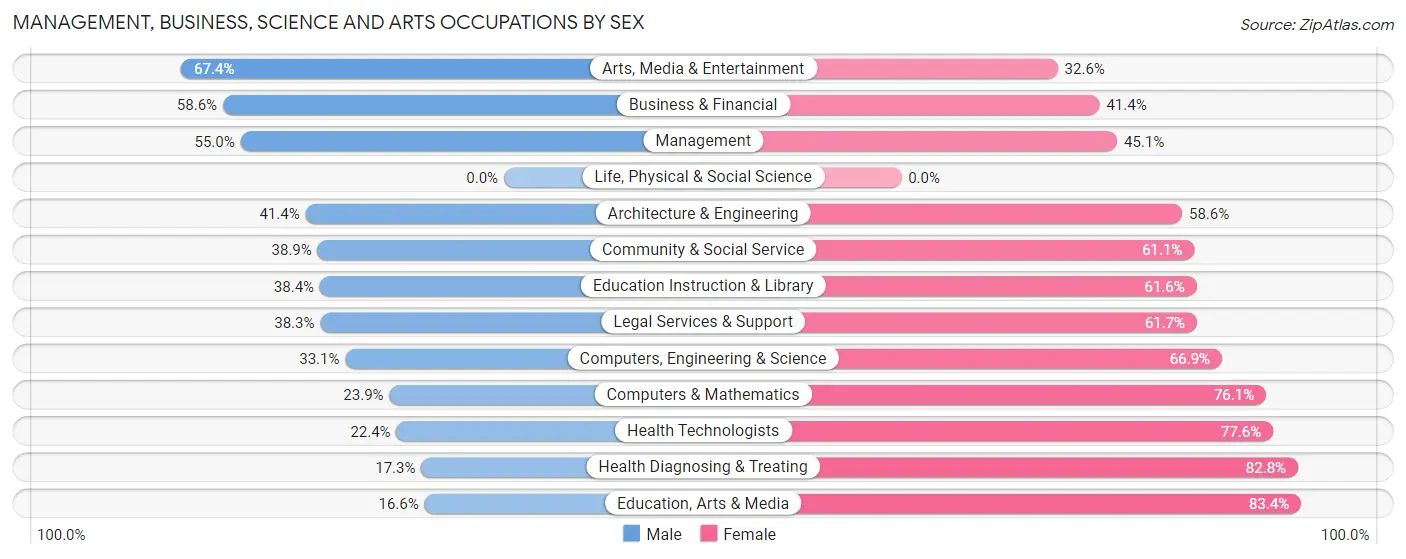
Management, Business, Science and Arts Occupations by Sex
Within the Management, Business, Science and Arts occupations in Lithia Springs, the most male-oriented occupations are Arts, Media & Entertainment (67.4%), Business & Financial (58.6%), and Management (54.9%), while the most female-oriented occupations are Education, Arts & Media (83.4%), Health Diagnosing & Treating (82.8%), and Health Technologists (77.6%).
| Occupation | Male | Female |
| Management | 300 (54.9%) | 246 (45.1%) |
| Business & Financial | 146 (58.6%) | 103 (41.4%) |
| Computers, Engineering & Science | 143 (33.1%) | 289 (66.9%) |
| Computers & Mathematics | 49 (23.9%) | 156 (76.1%) |
| Architecture & Engineering | 94 (41.4%) | 133 (58.6%) |
| Life, Physical & Social Science | 0 (0.0%) | 0 (0.0%) |
| Community & Social Service | 381 (38.9%) | 599 (61.1%) |
| Education, Arts & Media | 28 (16.6%) | 141 (83.4%) |
| Legal Services & Support | 59 (38.3%) | 95 (61.7%) |
| Education Instruction & Library | 197 (38.4%) | 316 (61.6%) |
| Arts, Media & Entertainment | 97 (67.4%) | 47 (32.6%) |
| Health Diagnosing & Treating | 59 (17.2%) | 283 (82.8%) |
| Health Technologists | 59 (22.4%) | 204 (77.6%) |
| Total (Category) | 1,029 (40.4%) | 1,520 (59.6%) |
| Total (Overall) | 4,004 (49.2%) | 4,134 (50.8%) |
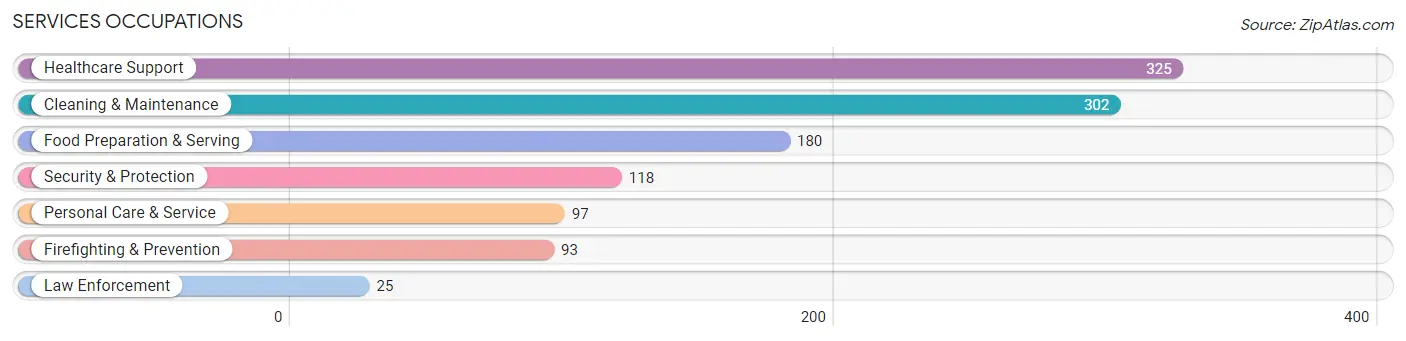
Services Occupations
The most common Services occupations in Lithia Springs are Healthcare Support (325 | 4.0%), Cleaning & Maintenance (302 | 3.7%), Food Preparation & Serving (180 | 2.2%), Security & Protection (118 | 1.5%), and Personal Care & Service (97 | 1.2%).
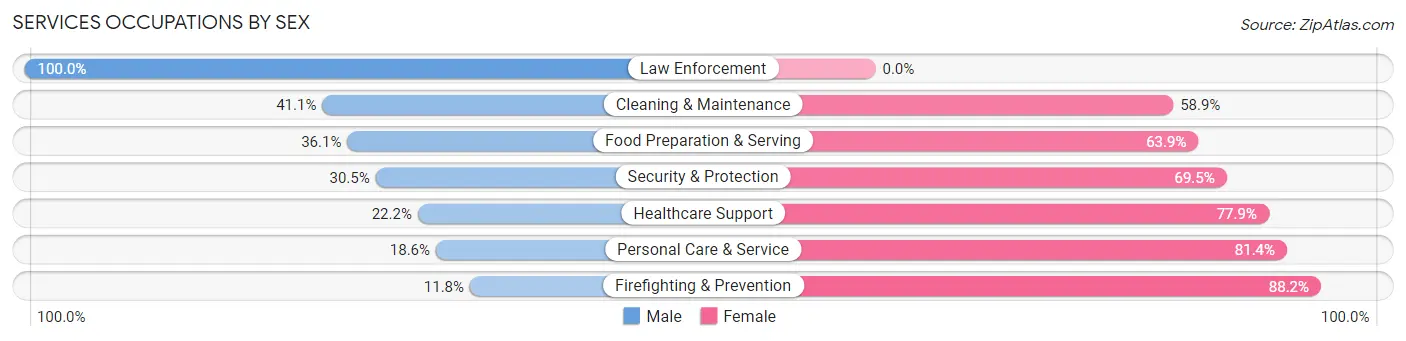
Services Occupations by Sex
Within the Services occupations in Lithia Springs, the most male-oriented occupations are Law Enforcement (100.0%), Cleaning & Maintenance (41.1%), and Food Preparation & Serving (36.1%), while the most female-oriented occupations are Firefighting & Prevention (88.2%), Personal Care & Service (81.4%), and Healthcare Support (77.8%).
| Occupation | Male | Female |
| Healthcare Support | 72 (22.2%) | 253 (77.8%) |
| Security & Protection | 36 (30.5%) | 82 (69.5%) |
| Firefighting & Prevention | 11 (11.8%) | 82 (88.2%) |
| Law Enforcement | 25 (100.0%) | 0 (0.0%) |
| Food Preparation & Serving | 65 (36.1%) | 115 (63.9%) |
| Cleaning & Maintenance | 124 (41.1%) | 178 (58.9%) |
| Personal Care & Service | 18 (18.6%) | 79 (81.4%) |
| Total (Category) | 315 (30.8%) | 707 (69.2%) |
| Total (Overall) | 4,004 (49.2%) | 4,134 (50.8%) |
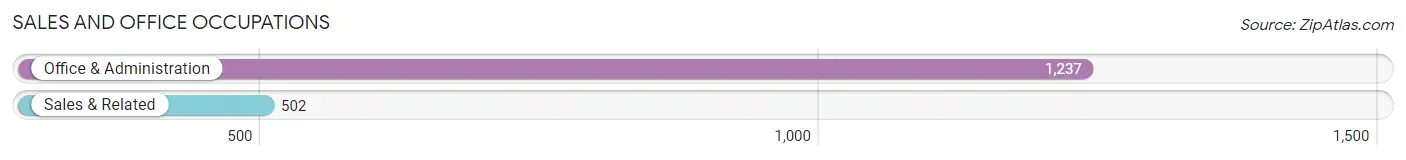
Sales and Office Occupations
The most common Sales and Office occupations in Lithia Springs are Office & Administration (1,237 | 15.2%), and Sales & Related (502 | 6.2%).
Sales and Office Occupations by Sex
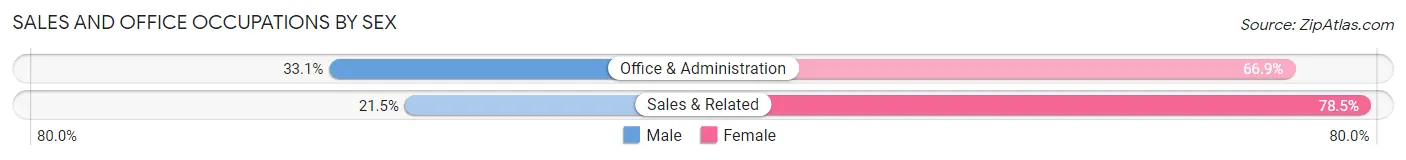
| Occupation | Male | Female |
| Sales & Related | 108 (21.5%) | 394 (78.5%) |
| Office & Administration | 410 (33.1%) | 827 (66.9%) |
| Total (Category) | 518 (29.8%) | 1,221 (70.2%) |
| Total (Overall) | 4,004 (49.2%) | 4,134 (50.8%) |
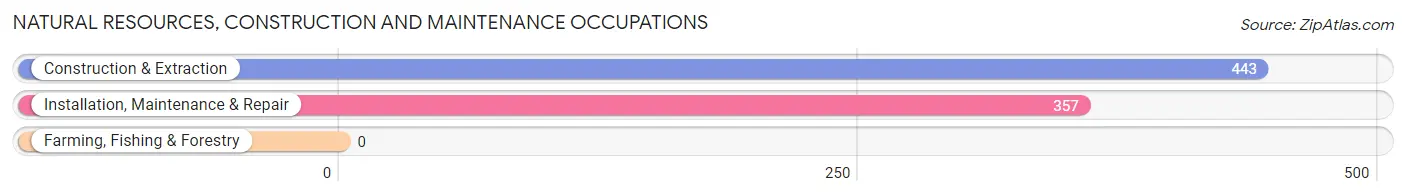
Natural Resources, Construction and Maintenance Occupations
The most common Natural Resources, Construction and Maintenance occupations in Lithia Springs are Construction & Extraction (443 | 5.4%), and Installation, Maintenance & Repair (357 | 4.4%).
Natural Resources, Construction and Maintenance Occupations by Sex
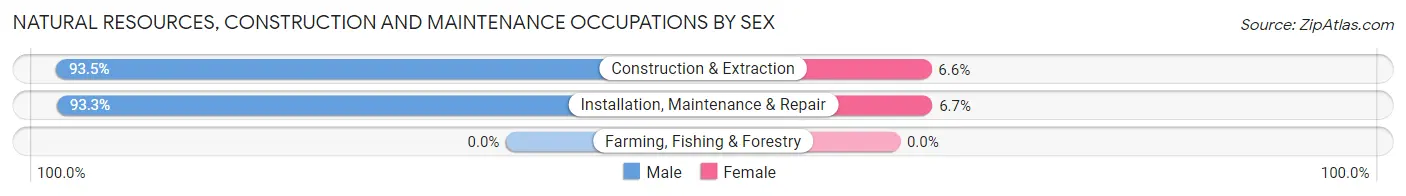
| Occupation | Male | Female |
| Farming, Fishing & Forestry | 0 (0.0%) | 0 (0.0%) |
| Construction & Extraction | 414 (93.4%) | 29 (6.6%) |
| Installation, Maintenance & Repair | 333 (93.3%) | 24 (6.7%) |
| Total (Category) | 747 (93.4%) | 53 (6.6%) |
| Total (Overall) | 4,004 (49.2%) | 4,134 (50.8%) |
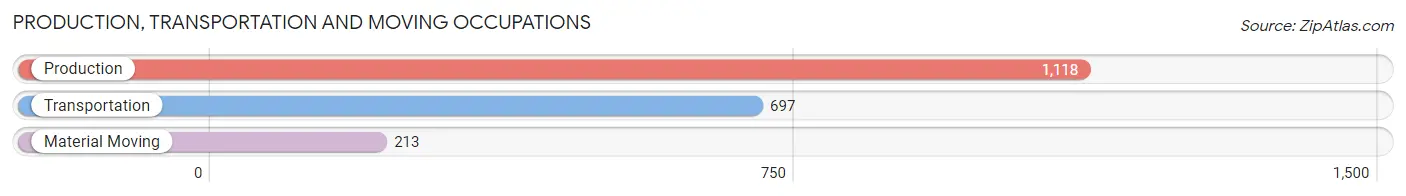
Production, Transportation and Moving Occupations
The most common Production, Transportation and Moving occupations in Lithia Springs are Production (1,118 | 13.7%), Transportation (697 | 8.6%), and Material Moving (213 | 2.6%).
Production, Transportation and Moving Occupations by Sex
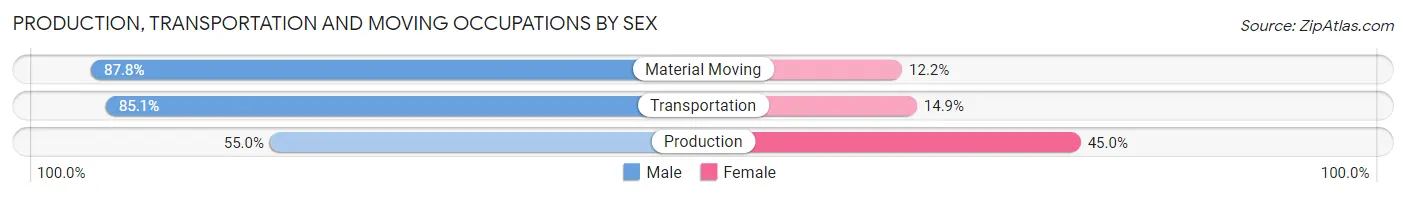
| Occupation | Male | Female |
| Production | 615 (55.0%) | 503 (45.0%) |
| Transportation | 593 (85.1%) | 104 (14.9%) |
| Material Moving | 187 (87.8%) | 26 (12.2%) |
| Total (Category) | 1,395 (68.8%) | 633 (31.2%) |
| Total (Overall) | 4,004 (49.2%) | 4,134 (50.8%) |
Employment Industries by Sex in Lithia Springs
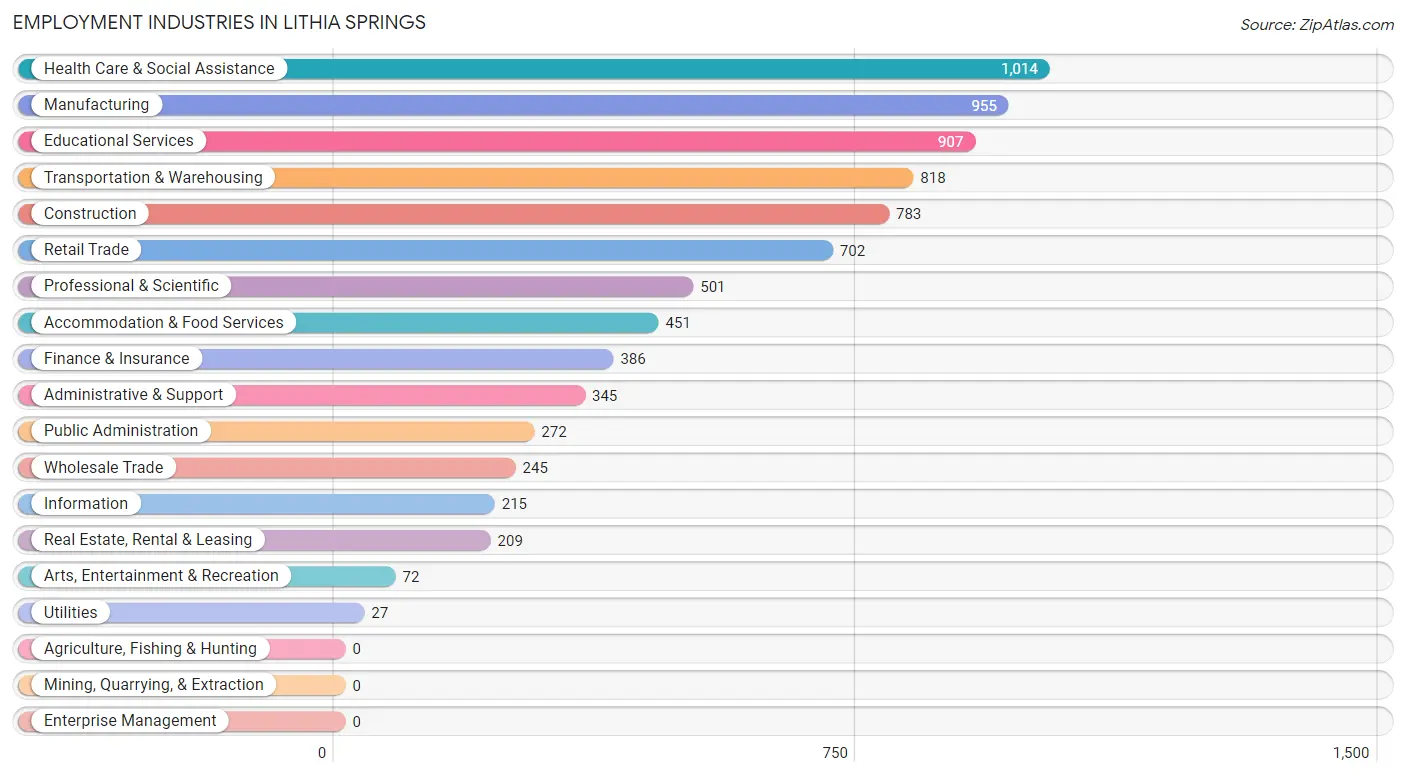
Employment Industries in Lithia Springs
The major employment industries in Lithia Springs include Health Care & Social Assistance (1,014 | 12.5%), Manufacturing (955 | 11.7%), Educational Services (907 | 11.2%), Transportation & Warehousing (818 | 10.1%), and Construction (783 | 9.6%).
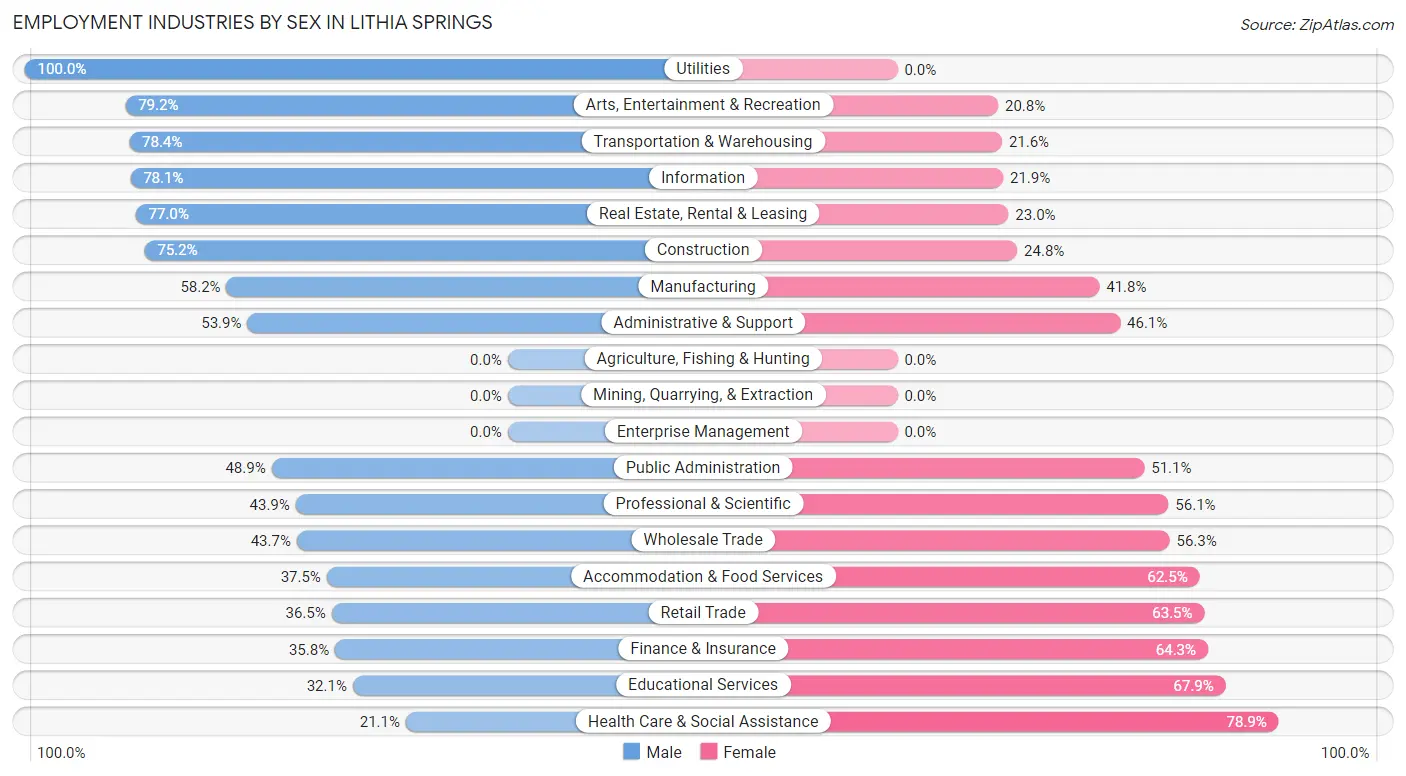
Employment Industries by Sex in Lithia Springs
The Lithia Springs industries that see more men than women are Utilities (100.0%), Arts, Entertainment & Recreation (79.2%), and Transportation & Warehousing (78.4%), whereas the industries that tend to have a higher number of women are Health Care & Social Assistance (78.9%), Educational Services (67.9%), and Finance & Insurance (64.2%).
| Industry | Male | Female |
| Agriculture, Fishing & Hunting | 0 (0.0%) | 0 (0.0%) |
| Mining, Quarrying, & Extraction | 0 (0.0%) | 0 (0.0%) |
| Construction | 589 (75.2%) | 194 (24.8%) |
| Manufacturing | 556 (58.2%) | 399 (41.8%) |
| Wholesale Trade | 107 (43.7%) | 138 (56.3%) |
| Retail Trade | 256 (36.5%) | 446 (63.5%) |
| Transportation & Warehousing | 641 (78.4%) | 177 (21.6%) |
| Utilities | 27 (100.0%) | 0 (0.0%) |
| Information | 168 (78.1%) | 47 (21.9%) |
| Finance & Insurance | 138 (35.7%) | 248 (64.2%) |
| Real Estate, Rental & Leasing | 161 (77.0%) | 48 (23.0%) |
| Professional & Scientific | 220 (43.9%) | 281 (56.1%) |
| Enterprise Management | 0 (0.0%) | 0 (0.0%) |
| Administrative & Support | 186 (53.9%) | 159 (46.1%) |
| Educational Services | 291 (32.1%) | 616 (67.9%) |
| Health Care & Social Assistance | 214 (21.1%) | 800 (78.9%) |
| Arts, Entertainment & Recreation | 57 (79.2%) | 15 (20.8%) |
| Accommodation & Food Services | 169 (37.5%) | 282 (62.5%) |
| Public Administration | 133 (48.9%) | 139 (51.1%) |
| Total | 4,004 (49.2%) | 4,134 (50.8%) |
Education in Lithia Springs
School Enrollment in Lithia Springs
The most common levels of schooling among the 5,109 students in Lithia Springs are college / undergraduate (1,801 | 35.2%), middle school (1,009 | 19.8%), and high school (923 | 18.1%).
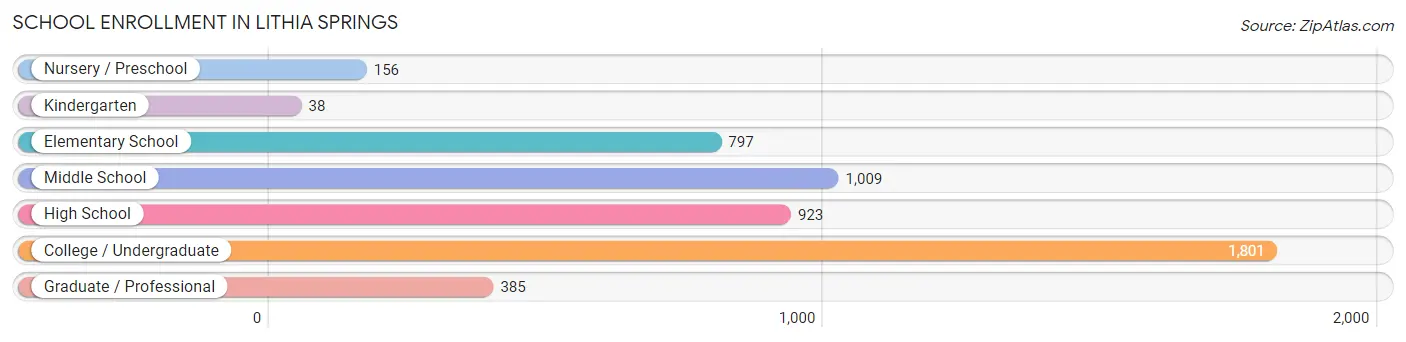
| School Level | # Students | % Students |
| Nursery / Preschool | 156 | 3.0% |
| Kindergarten | 38 | 0.7% |
| Elementary School | 797 | 15.6% |
| Middle School | 1,009 | 19.8% |
| High School | 923 | 18.1% |
| College / Undergraduate | 1,801 | 35.2% |
| Graduate / Professional | 385 | 7.5% |
| Total | 5,109 | 100.0% |
School Enrollment by Age by Funding Source in Lithia Springs
Out of a total of 5,109 students who are enrolled in schools in Lithia Springs, 976 (19.1%) attend a private institution, while the remaining 4,133 (80.9%) are enrolled in public schools. The age group of 20 to 24 year olds has the highest likelihood of being enrolled in private schools, with 600 (65.4% in the age bracket) enrolled. Conversely, the age group of 3 to 4 year olds has the lowest likelihood of being enrolled in a private school, with 156 (100.0% in the age bracket) attending a public institution.
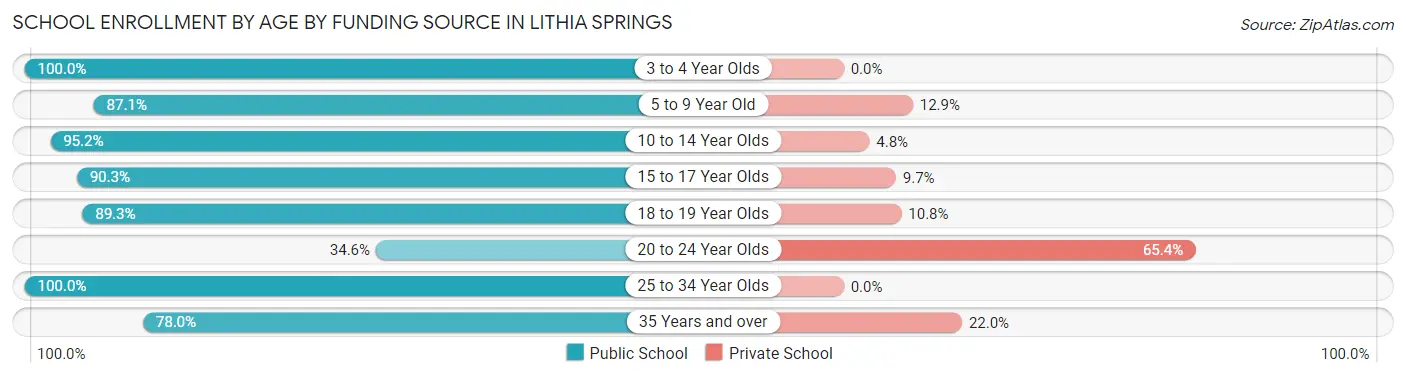
| Age Bracket | Public School | Private School |
| 3 to 4 Year Olds | 156 (100.0%) | 0 (0.0%) |
| 5 to 9 Year Old | 684 (87.1%) | 101 (12.9%) |
| 10 to 14 Year Olds | 1,216 (95.2%) | 61 (4.8%) |
| 15 to 17 Year Olds | 604 (90.3%) | 65 (9.7%) |
| 18 to 19 Year Olds | 299 (89.2%) | 36 (10.7%) |
| 20 to 24 Year Olds | 317 (34.6%) | 600 (65.4%) |
| 25 to 34 Year Olds | 448 (100.0%) | 0 (0.0%) |
| 35 Years and over | 407 (78.0%) | 115 (22.0%) |
| Total | 4,133 (80.9%) | 976 (19.1%) |
Educational Attainment by Field of Study in Lithia Springs
Business (542 | 18.1%), social sciences (411 | 13.7%), engineering (336 | 11.2%), education (298 | 9.9%), and bio, nature & agricultural (287 | 9.6%) are the most common fields of study among 2,998 individuals in Lithia Springs who have obtained a bachelor's degree or higher.
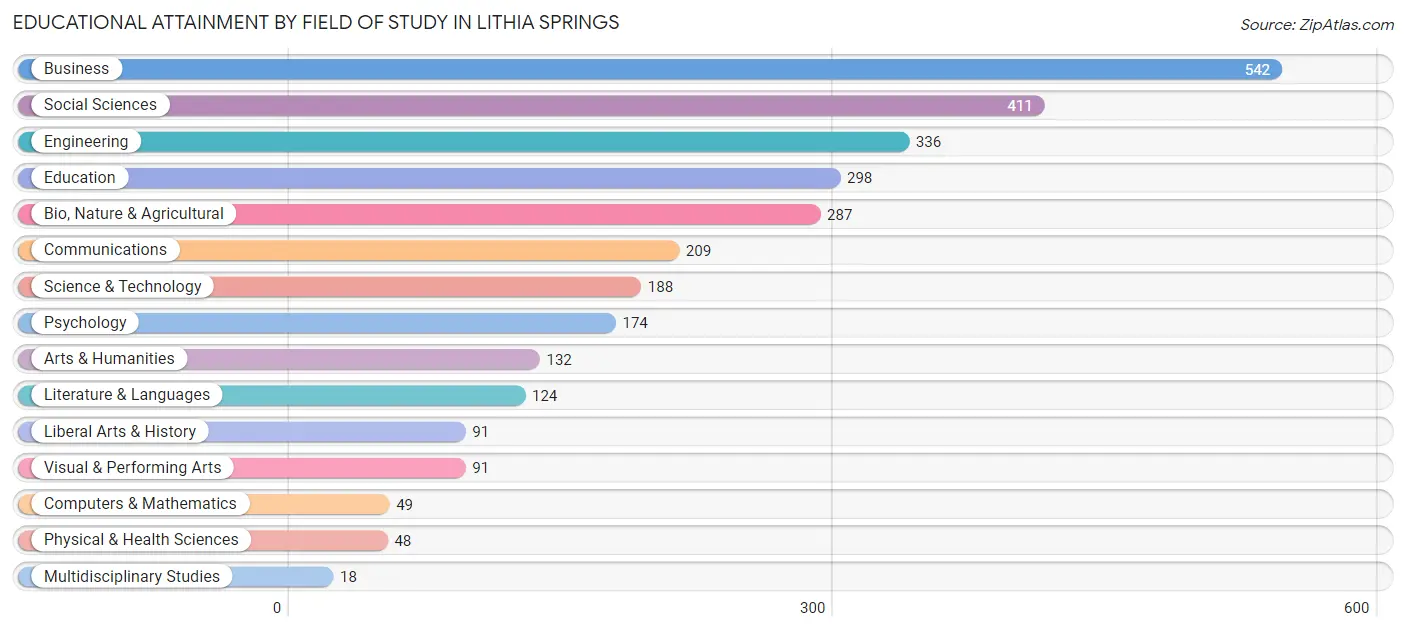
| Field of Study | # Graduates | % Graduates |
| Computers & Mathematics | 49 | 1.6% |
| Bio, Nature & Agricultural | 287 | 9.6% |
| Physical & Health Sciences | 48 | 1.6% |
| Psychology | 174 | 5.8% |
| Social Sciences | 411 | 13.7% |
| Engineering | 336 | 11.2% |
| Multidisciplinary Studies | 18 | 0.6% |
| Science & Technology | 188 | 6.3% |
| Business | 542 | 18.1% |
| Education | 298 | 9.9% |
| Literature & Languages | 124 | 4.1% |
| Liberal Arts & History | 91 | 3.0% |
| Visual & Performing Arts | 91 | 3.0% |
| Communications | 209 | 7.0% |
| Arts & Humanities | 132 | 4.4% |
| Total | 2,998 | 100.0% |
Transportation & Commute in Lithia Springs
Vehicle Availability by Sex in Lithia Springs
The most prevalent vehicle ownership categories in Lithia Springs are males with 2 vehicles (1,667, accounting for 42.6%) and females with 2 vehicles (1,315, making up 41.0%).
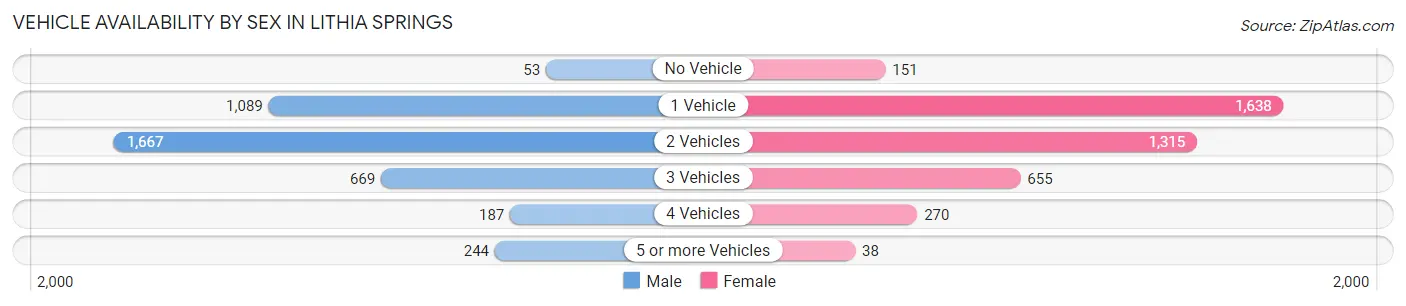
| Vehicles Available | Male | Female |
| No Vehicle | 53 (1.4%) | 151 (3.7%) |
| 1 Vehicle | 1,089 (27.9%) | 1,638 (40.3%) |
| 2 Vehicles | 1,667 (42.6%) | 1,315 (32.3%) |
| 3 Vehicles | 669 (17.1%) | 655 (16.1%) |
| 4 Vehicles | 187 (4.8%) | 270 (6.6%) |
| 5 or more Vehicles | 244 (6.2%) | 38 (0.9%) |
| Total | 3,909 (100.0%) | 4,067 (100.0%) |
Commute Time in Lithia Springs
The most frequently occuring commute durations in Lithia Springs are 30 to 34 minutes (1,056 commuters, 14.7%), 15 to 19 minutes (1,052 commuters, 14.7%), and 10 to 14 minutes (1,047 commuters, 14.6%).
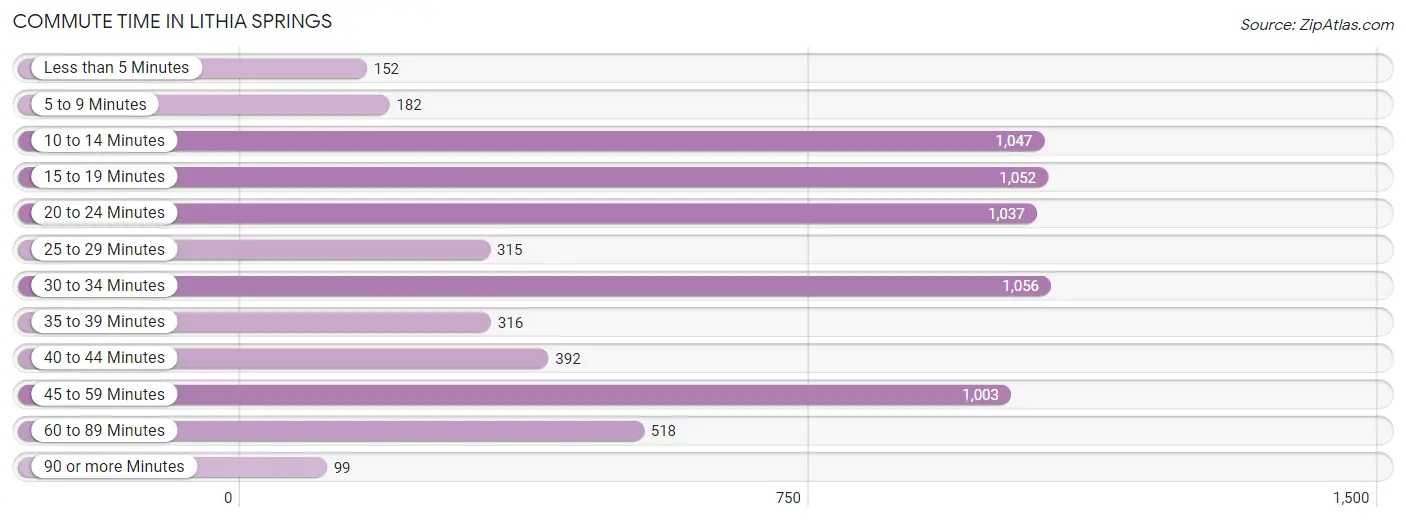
| Commute Time | # Commuters | % Commuters |
| Less than 5 Minutes | 152 | 2.1% |
| 5 to 9 Minutes | 182 | 2.5% |
| 10 to 14 Minutes | 1,047 | 14.6% |
| 15 to 19 Minutes | 1,052 | 14.7% |
| 20 to 24 Minutes | 1,037 | 14.5% |
| 25 to 29 Minutes | 315 | 4.4% |
| 30 to 34 Minutes | 1,056 | 14.7% |
| 35 to 39 Minutes | 316 | 4.4% |
| 40 to 44 Minutes | 392 | 5.5% |
| 45 to 59 Minutes | 1,003 | 14.0% |
| 60 to 89 Minutes | 518 | 7.2% |
| 90 or more Minutes | 99 | 1.4% |
Commute Time by Sex in Lithia Springs
The most common commute times in Lithia Springs are 20 to 24 minutes (677 commuters, 19.2%) for males and 15 to 19 minutes (688 commuters, 18.9%) for females.
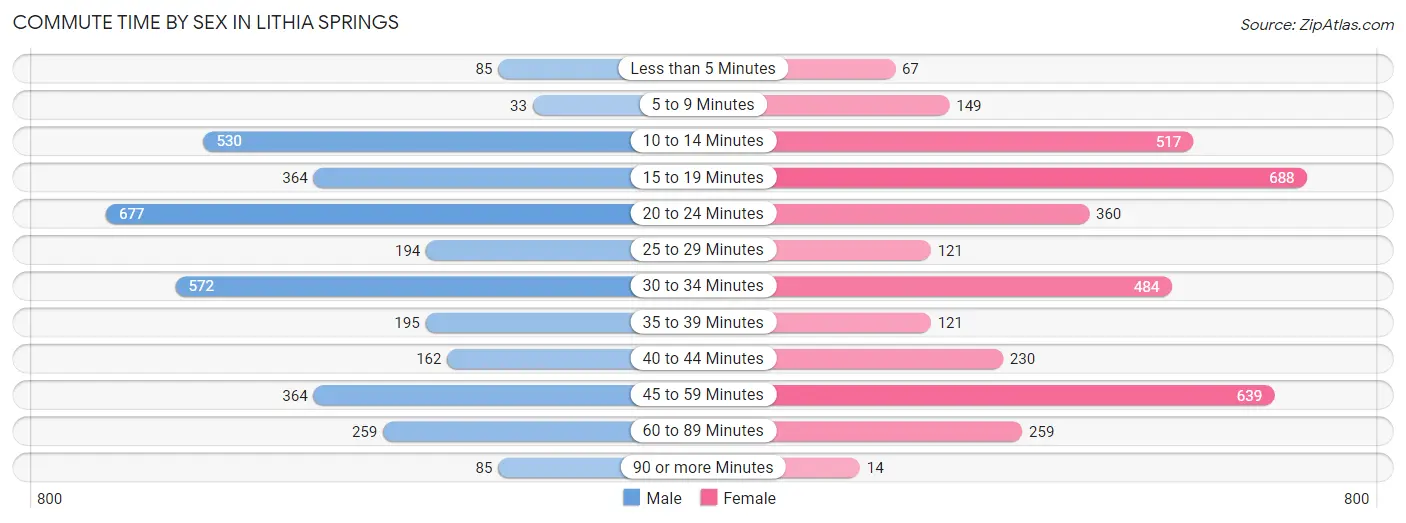
| Commute Time | Male | Female |
| Less than 5 Minutes | 85 (2.4%) | 67 (1.8%) |
| 5 to 9 Minutes | 33 (0.9%) | 149 (4.1%) |
| 10 to 14 Minutes | 530 (15.1%) | 517 (14.2%) |
| 15 to 19 Minutes | 364 (10.3%) | 688 (18.9%) |
| 20 to 24 Minutes | 677 (19.2%) | 360 (9.9%) |
| 25 to 29 Minutes | 194 (5.5%) | 121 (3.3%) |
| 30 to 34 Minutes | 572 (16.3%) | 484 (13.3%) |
| 35 to 39 Minutes | 195 (5.5%) | 121 (3.3%) |
| 40 to 44 Minutes | 162 (4.6%) | 230 (6.3%) |
| 45 to 59 Minutes | 364 (10.3%) | 639 (17.5%) |
| 60 to 89 Minutes | 259 (7.4%) | 259 (7.1%) |
| 90 or more Minutes | 85 (2.4%) | 14 (0.4%) |
Time of Departure to Work by Sex in Lithia Springs
The most frequent times of departure to work in Lithia Springs are 7:00 AM to 7:29 AM (784, 22.3%) for males and 6:00 AM to 6:29 AM (627, 17.2%) for females.
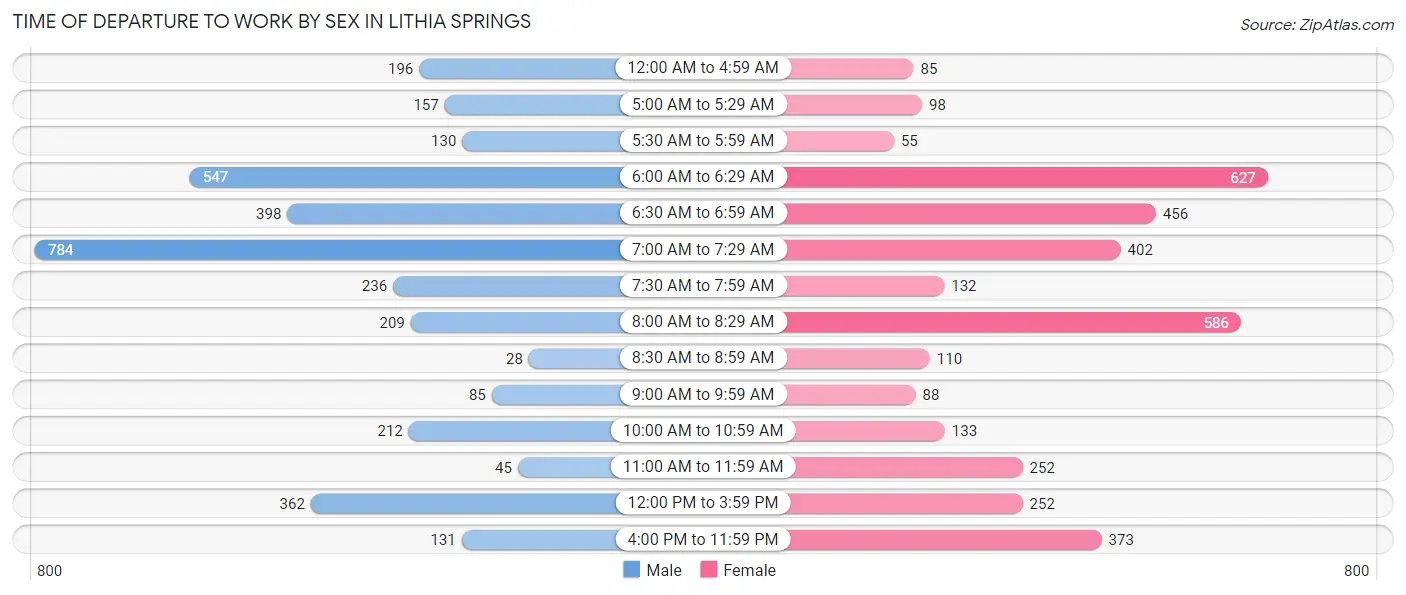
| Time of Departure | Male | Female |
| 12:00 AM to 4:59 AM | 196 (5.6%) | 85 (2.3%) |
| 5:00 AM to 5:29 AM | 157 (4.5%) | 98 (2.7%) |
| 5:30 AM to 5:59 AM | 130 (3.7%) | 55 (1.5%) |
| 6:00 AM to 6:29 AM | 547 (15.5%) | 627 (17.2%) |
| 6:30 AM to 6:59 AM | 398 (11.3%) | 456 (12.5%) |
| 7:00 AM to 7:29 AM | 784 (22.3%) | 402 (11.0%) |
| 7:30 AM to 7:59 AM | 236 (6.7%) | 132 (3.6%) |
| 8:00 AM to 8:29 AM | 209 (5.9%) | 586 (16.1%) |
| 8:30 AM to 8:59 AM | 28 (0.8%) | 110 (3.0%) |
| 9:00 AM to 9:59 AM | 85 (2.4%) | 88 (2.4%) |
| 10:00 AM to 10:59 AM | 212 (6.0%) | 133 (3.6%) |
| 11:00 AM to 11:59 AM | 45 (1.3%) | 252 (6.9%) |
| 12:00 PM to 3:59 PM | 362 (10.3%) | 252 (6.9%) |
| 4:00 PM to 11:59 PM | 131 (3.7%) | 373 (10.2%) |
| Total | 3,520 (100.0%) | 3,649 (100.0%) |
Housing Occupancy in Lithia Springs
Occupancy by Ownership in Lithia Springs
Of the total 6,727 dwellings in Lithia Springs, owner-occupied units account for 2,863 (42.6%), while renter-occupied units make up 3,864 (57.4%).
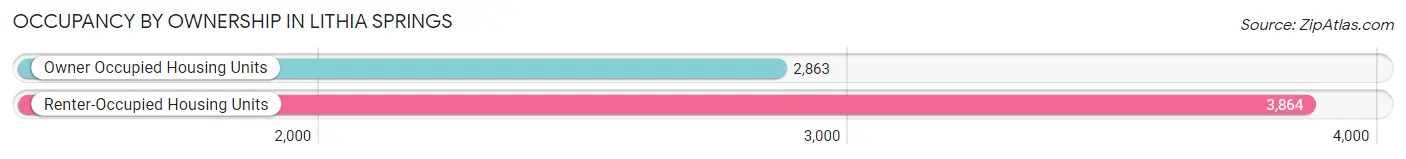
| Occupancy | # Housing Units | % Housing Units |
| Owner Occupied Housing Units | 2,863 | 42.6% |
| Renter-Occupied Housing Units | 3,864 | 57.4% |
| Total Occupied Housing Units | 6,727 | 100.0% |
Occupancy by Household Size in Lithia Springs
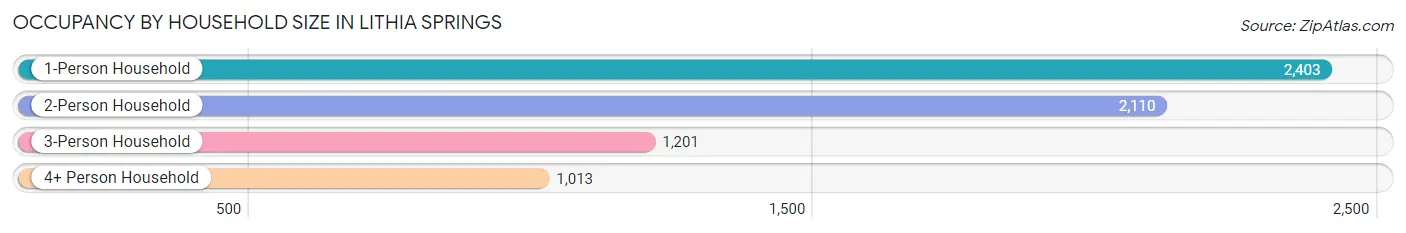
| Household Size | # Housing Units | % Housing Units |
| 1-Person Household | 2,403 | 35.7% |
| 2-Person Household | 2,110 | 31.4% |
| 3-Person Household | 1,201 | 17.8% |
| 4+ Person Household | 1,013 | 15.1% |
| Total Housing Units | 6,727 | 100.0% |
Occupancy by Ownership by Household Size in Lithia Springs
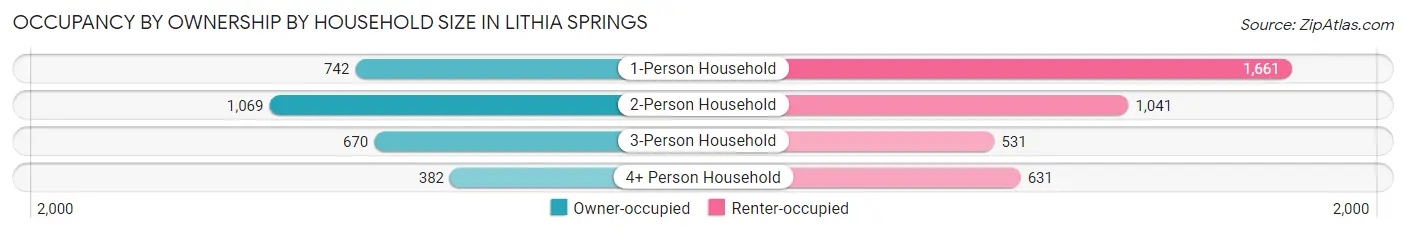
| Household Size | Owner-occupied | Renter-occupied |
| 1-Person Household | 742 (30.9%) | 1,661 (69.1%) |
| 2-Person Household | 1,069 (50.7%) | 1,041 (49.3%) |
| 3-Person Household | 670 (55.8%) | 531 (44.2%) |
| 4+ Person Household | 382 (37.7%) | 631 (62.3%) |
| Total Housing Units | 2,863 (42.6%) | 3,864 (57.4%) |
Occupancy by Educational Attainment in Lithia Springs
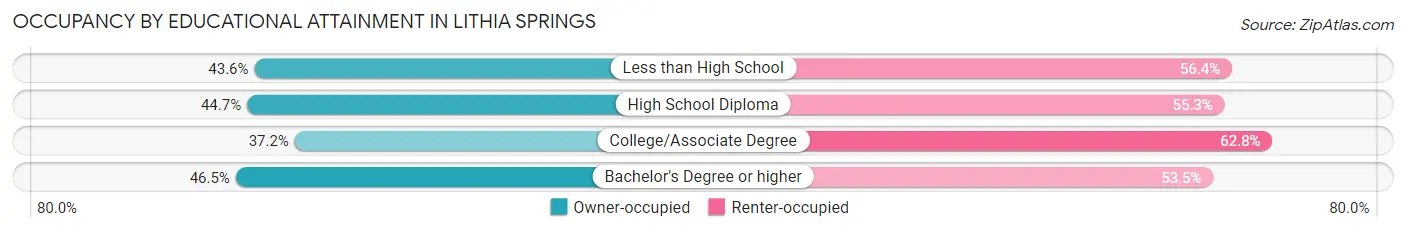
| Household Size | Owner-occupied | Renter-occupied |
| Less than High School | 186 (43.6%) | 241 (56.4%) |
| High School Diploma | 887 (44.7%) | 1,096 (55.3%) |
| College/Associate Degree | 867 (37.2%) | 1,466 (62.8%) |
| Bachelor's Degree or higher | 923 (46.5%) | 1,061 (53.5%) |
Occupancy by Age of Householder in Lithia Springs
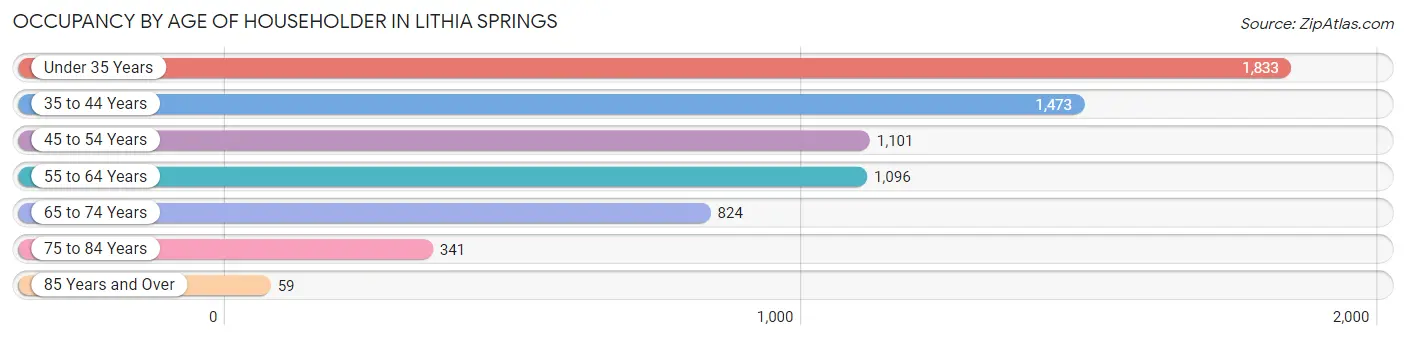
| Age Bracket | # Households | % Households |
| Under 35 Years | 1,833 | 27.3% |
| 35 to 44 Years | 1,473 | 21.9% |
| 45 to 54 Years | 1,101 | 16.4% |
| 55 to 64 Years | 1,096 | 16.3% |
| 65 to 74 Years | 824 | 12.2% |
| 75 to 84 Years | 341 | 5.1% |
| 85 Years and Over | 59 | 0.9% |
| Total | 6,727 | 100.0% |
Housing Finances in Lithia Springs
Median Income by Occupancy in Lithia Springs
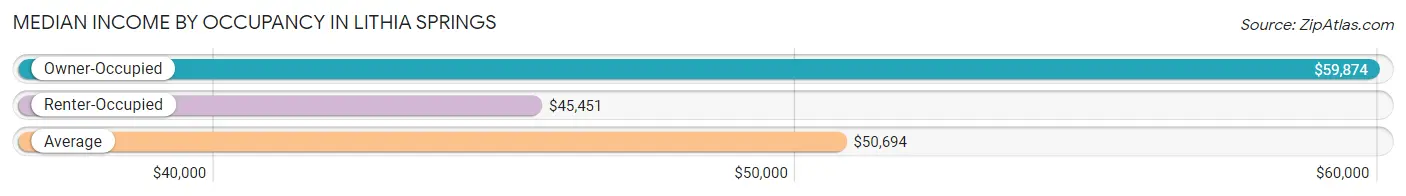
| Occupancy Type | # Households | Median Income |
| Owner-Occupied | 2,863 (42.6%) | $59,874 |
| Renter-Occupied | 3,864 (57.4%) | $45,451 |
| Average | 6,727 (100.0%) | $50,694 |
Occupancy by Householder Income Bracket in Lithia Springs
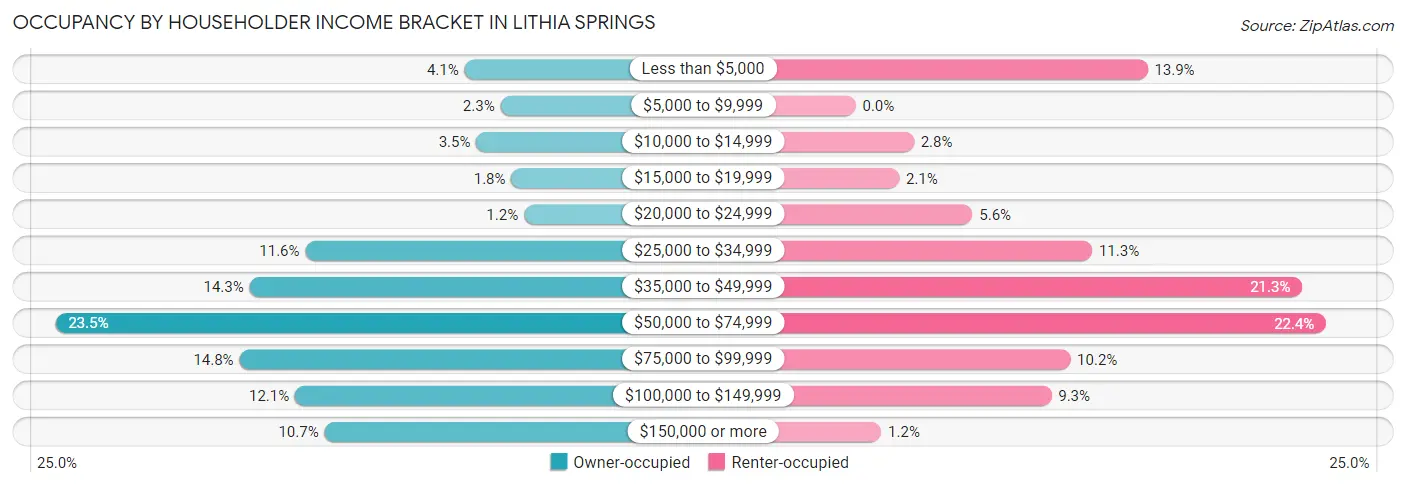
| Income Bracket | Owner-occupied | Renter-occupied |
| Less than $5,000 | 116 (4.1%) | 537 (13.9%) |
| $5,000 to $9,999 | 67 (2.3%) | 0 (0.0%) |
| $10,000 to $14,999 | 100 (3.5%) | 107 (2.8%) |
| $15,000 to $19,999 | 52 (1.8%) | 80 (2.1%) |
| $20,000 to $24,999 | 35 (1.2%) | 215 (5.6%) |
| $25,000 to $34,999 | 333 (11.6%) | 435 (11.3%) |
| $35,000 to $49,999 | 409 (14.3%) | 822 (21.3%) |
| $50,000 to $74,999 | 674 (23.5%) | 866 (22.4%) |
| $75,000 to $99,999 | 423 (14.8%) | 395 (10.2%) |
| $100,000 to $149,999 | 347 (12.1%) | 360 (9.3%) |
| $150,000 or more | 307 (10.7%) | 47 (1.2%) |
| Total | 2,863 (100.0%) | 3,864 (100.0%) |
Monthly Housing Cost Tiers in Lithia Springs
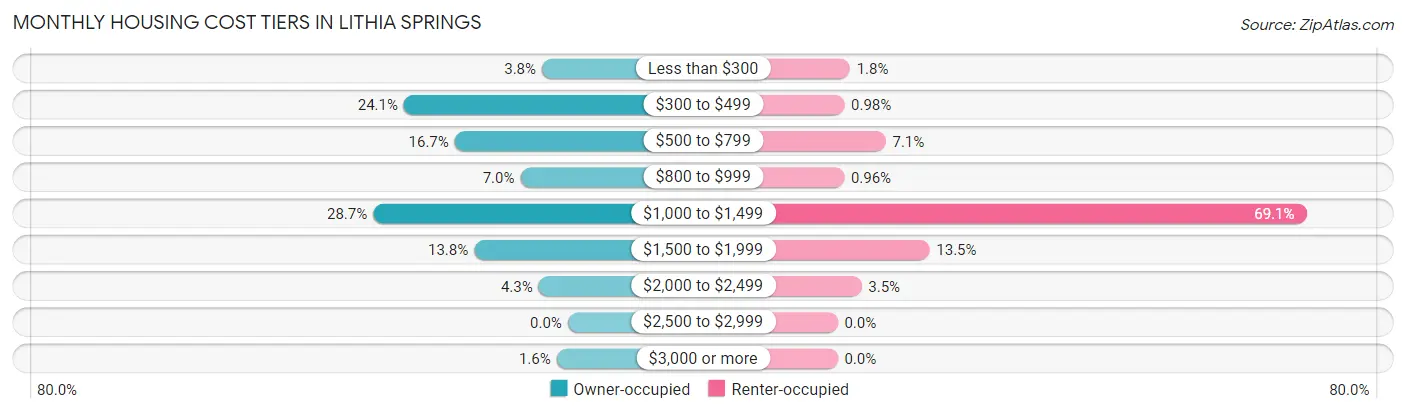
| Monthly Cost | Owner-occupied | Renter-occupied |
| Less than $300 | 109 (3.8%) | 70 (1.8%) |
| $300 to $499 | 691 (24.1%) | 38 (1.0%) |
| $500 to $799 | 477 (16.7%) | 274 (7.1%) |
| $800 to $999 | 200 (7.0%) | 37 (1.0%) |
| $1,000 to $1,499 | 821 (28.7%) | 2,669 (69.1%) |
| $1,500 to $1,999 | 395 (13.8%) | 523 (13.5%) |
| $2,000 to $2,499 | 123 (4.3%) | 136 (3.5%) |
| $2,500 to $2,999 | 0 (0.0%) | 0 (0.0%) |
| $3,000 or more | 47 (1.6%) | 0 (0.0%) |
| Total | 2,863 (100.0%) | 3,864 (100.0%) |
Physical Housing Characteristics in Lithia Springs
Housing Structures in Lithia Springs
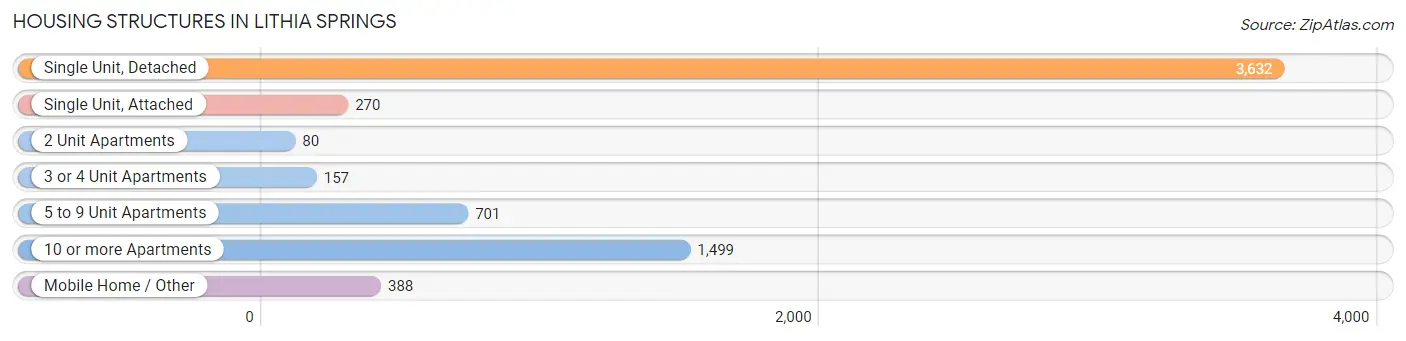
| Structure Type | # Housing Units | % Housing Units |
| Single Unit, Detached | 3,632 | 54.0% |
| Single Unit, Attached | 270 | 4.0% |
| 2 Unit Apartments | 80 | 1.2% |
| 3 or 4 Unit Apartments | 157 | 2.3% |
| 5 to 9 Unit Apartments | 701 | 10.4% |
| 10 or more Apartments | 1,499 | 22.3% |
| Mobile Home / Other | 388 | 5.8% |
| Total | 6,727 | 100.0% |
Housing Structures by Occupancy in Lithia Springs
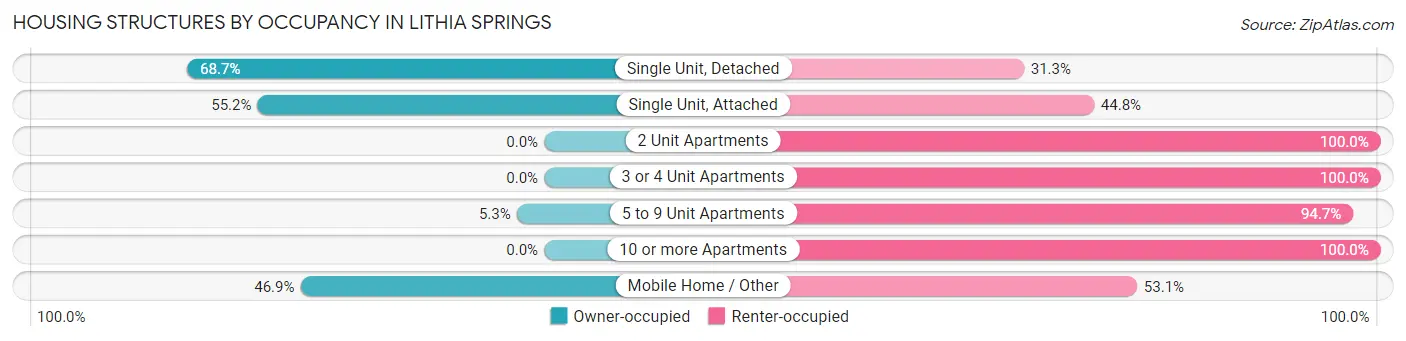
| Structure Type | Owner-occupied | Renter-occupied |
| Single Unit, Detached | 2,495 (68.7%) | 1,137 (31.3%) |
| Single Unit, Attached | 149 (55.2%) | 121 (44.8%) |
| 2 Unit Apartments | 0 (0.0%) | 80 (100.0%) |
| 3 or 4 Unit Apartments | 0 (0.0%) | 157 (100.0%) |
| 5 to 9 Unit Apartments | 37 (5.3%) | 664 (94.7%) |
| 10 or more Apartments | 0 (0.0%) | 1,499 (100.0%) |
| Mobile Home / Other | 182 (46.9%) | 206 (53.1%) |
| Total | 2,863 (42.6%) | 3,864 (57.4%) |
Housing Structures by Number of Rooms in Lithia Springs
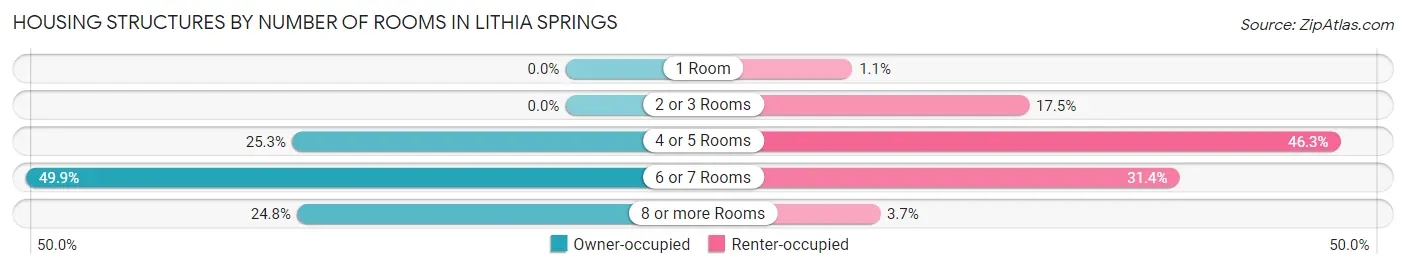
| Number of Rooms | Owner-occupied | Renter-occupied |
| 1 Room | 0 (0.0%) | 44 (1.1%) |
| 2 or 3 Rooms | 0 (0.0%) | 676 (17.5%) |
| 4 or 5 Rooms | 724 (25.3%) | 1,788 (46.3%) |
| 6 or 7 Rooms | 1,428 (49.9%) | 1,213 (31.4%) |
| 8 or more Rooms | 711 (24.8%) | 143 (3.7%) |
| Total | 2,863 (100.0%) | 3,864 (100.0%) |
Housing Structure by Heating Type in Lithia Springs
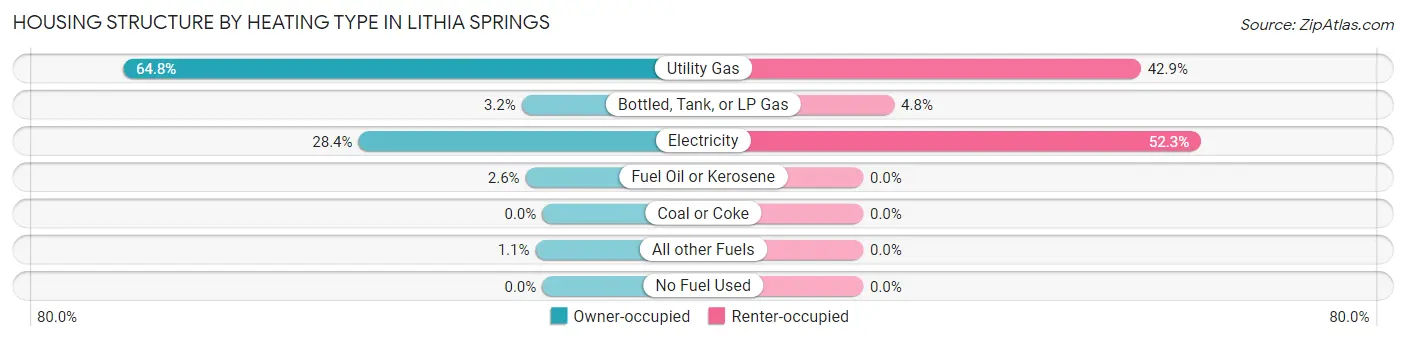
| Heating Type | Owner-occupied | Renter-occupied |
| Utility Gas | 1,855 (64.8%) | 1,659 (42.9%) |
| Bottled, Tank, or LP Gas | 91 (3.2%) | 186 (4.8%) |
| Electricity | 813 (28.4%) | 2,019 (52.2%) |
| Fuel Oil or Kerosene | 74 (2.6%) | 0 (0.0%) |
| Coal or Coke | 0 (0.0%) | 0 (0.0%) |
| All other Fuels | 30 (1.1%) | 0 (0.0%) |
| No Fuel Used | 0 (0.0%) | 0 (0.0%) |
| Total | 2,863 (100.0%) | 3,864 (100.0%) |
Household Vehicle Usage in Lithia Springs
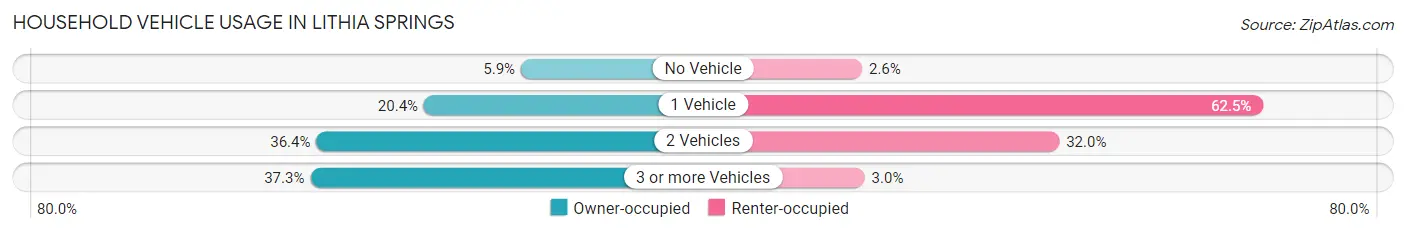
| Vehicles per Household | Owner-occupied | Renter-occupied |
| No Vehicle | 168 (5.9%) | 99 (2.6%) |
| 1 Vehicle | 583 (20.4%) | 2,414 (62.5%) |
| 2 Vehicles | 1,043 (36.4%) | 1,237 (32.0%) |
| 3 or more Vehicles | 1,069 (37.3%) | 114 (2.9%) |
| Total | 2,863 (100.0%) | 3,864 (100.0%) |
Real Estate & Mortgages in Lithia Springs
Real Estate and Mortgage Overview in Lithia Springs
| Characteristic | Without Mortgage | With Mortgage |
| Housing Units | 1,107 | 1,756 |
| Median Property Value | $136,000 | $182,500 |
| Median Household Income | $49,508 | $225 |
| Monthly Housing Costs | $434 | $47 |
| Real Estate Taxes | $708 | $0 |
Property Value by Mortgage Status in Lithia Springs
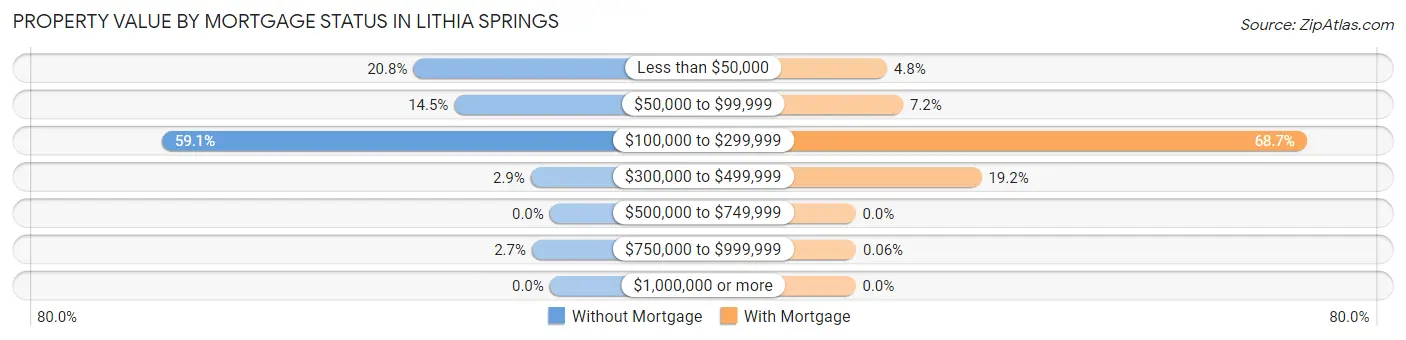
| Property Value | Without Mortgage | With Mortgage |
| Less than $50,000 | 230 (20.8%) | 84 (4.8%) |
| $50,000 to $99,999 | 161 (14.5%) | 127 (7.2%) |
| $100,000 to $299,999 | 654 (59.1%) | 1,207 (68.7%) |
| $300,000 to $499,999 | 32 (2.9%) | 337 (19.2%) |
| $500,000 to $749,999 | 0 (0.0%) | 0 (0.0%) |
| $750,000 to $999,999 | 30 (2.7%) | 1 (0.1%) |
| $1,000,000 or more | 0 (0.0%) | 0 (0.0%) |
| Total | 1,107 (100.0%) | 1,756 (100.0%) |
Household Income by Mortgage Status in Lithia Springs
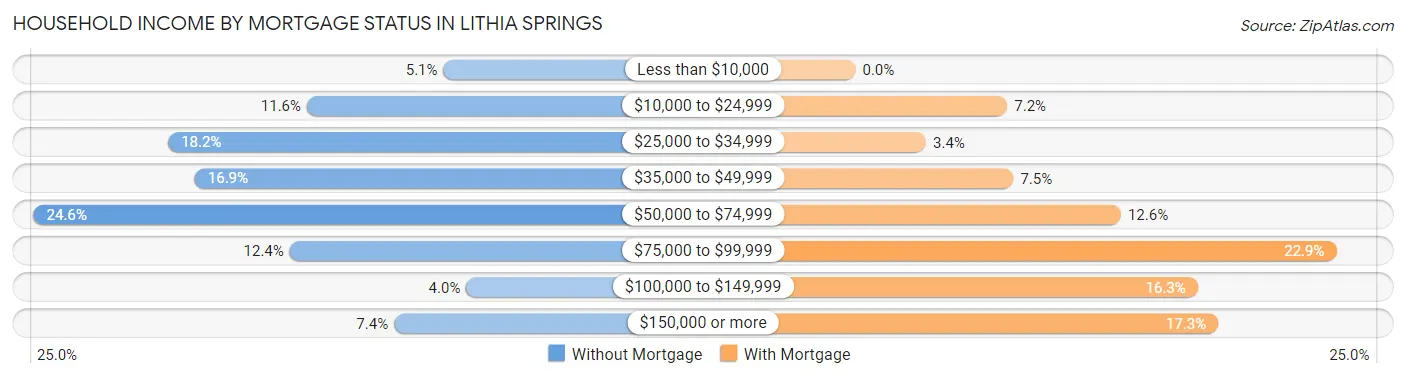
| Household Income | Without Mortgage | With Mortgage |
| Less than $10,000 | 56 (5.1%) | 0 (0.0%) |
| $10,000 to $24,999 | 128 (11.6%) | 127 (7.2%) |
| $25,000 to $34,999 | 201 (18.2%) | 59 (3.4%) |
| $35,000 to $49,999 | 187 (16.9%) | 132 (7.5%) |
| $50,000 to $74,999 | 272 (24.6%) | 222 (12.6%) |
| $75,000 to $99,999 | 137 (12.4%) | 402 (22.9%) |
| $100,000 to $149,999 | 44 (4.0%) | 286 (16.3%) |
| $150,000 or more | 82 (7.4%) | 303 (17.3%) |
| Total | 1,107 (100.0%) | 1,756 (100.0%) |
Property Value to Household Income Ratio in Lithia Springs
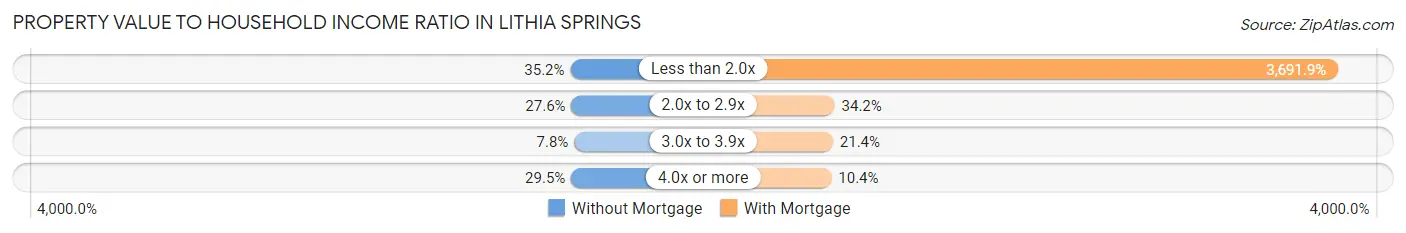
| Value-to-Income Ratio | Without Mortgage | With Mortgage |
| Less than 2.0x | 390 (35.2%) | 64,830 (3,691.9%) |
| 2.0x to 2.9x | 305 (27.6%) | 600 (34.2%) |
| 3.0x to 3.9x | 86 (7.8%) | 375 (21.4%) |
| 4.0x or more | 326 (29.4%) | 182 (10.4%) |
| Total | 1,107 (100.0%) | 1,756 (100.0%) |
Real Estate Taxes by Mortgage Status in Lithia Springs
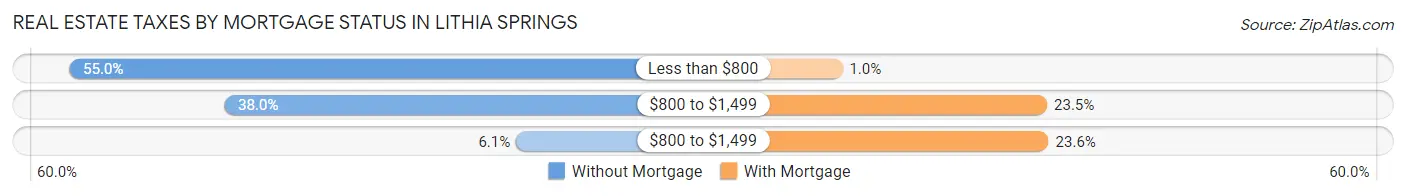
| Property Taxes | Without Mortgage | With Mortgage |
| Less than $800 | 609 (55.0%) | 18 (1.0%) |
| $800 to $1,499 | 421 (38.0%) | 412 (23.5%) |
| $800 to $1,499 | 68 (6.1%) | 415 (23.6%) |
| Total | 1,107 (100.0%) | 1,756 (100.0%) |
Health & Disability in Lithia Springs
Health Insurance Coverage by Age in Lithia Springs
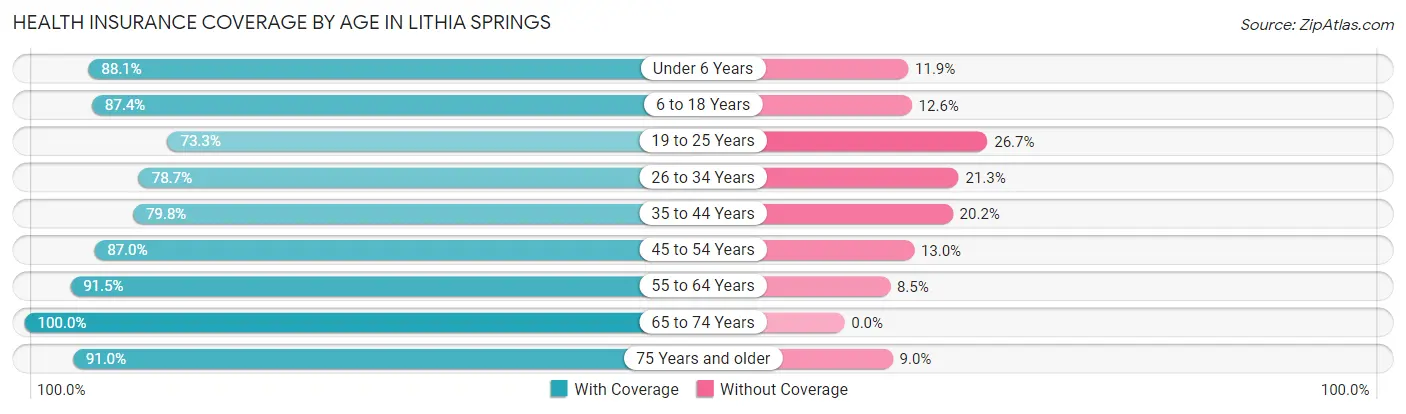
| Age Bracket | With Coverage | Without Coverage |
| Under 6 Years | 896 (88.1%) | 121 (11.9%) |
| 6 to 18 Years | 2,763 (87.4%) | 397 (12.6%) |
| 19 to 25 Years | 1,746 (73.3%) | 635 (26.7%) |
| 26 to 34 Years | 1,408 (78.7%) | 381 (21.3%) |
| 35 to 44 Years | 1,729 (79.8%) | 438 (20.2%) |
| 45 to 54 Years | 1,641 (87.0%) | 245 (13.0%) |
| 55 to 64 Years | 1,484 (91.5%) | 138 (8.5%) |
| 65 to 74 Years | 1,326 (100.0%) | 0 (0.0%) |
| 75 Years and older | 596 (91.0%) | 59 (9.0%) |
| Total | 13,589 (84.9%) | 2,414 (15.1%) |
Health Insurance Coverage by Citizenship Status in Lithia Springs
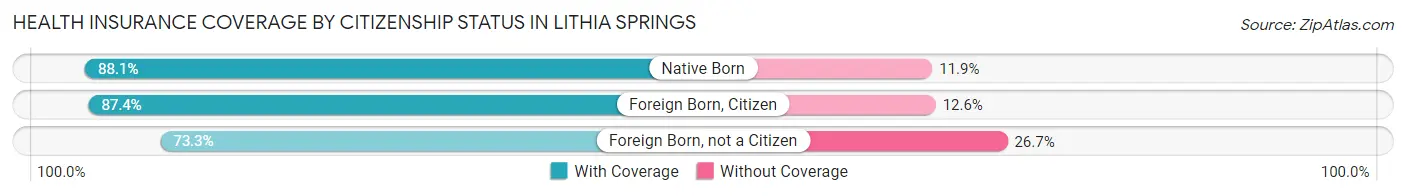
| Citizenship Status | With Coverage | Without Coverage |
| Native Born | 896 (88.1%) | 121 (11.9%) |
| Foreign Born, Citizen | 2,763 (87.4%) | 397 (12.6%) |
| Foreign Born, not a Citizen | 1,746 (73.3%) | 635 (26.7%) |
Health Insurance Coverage by Household Income in Lithia Springs
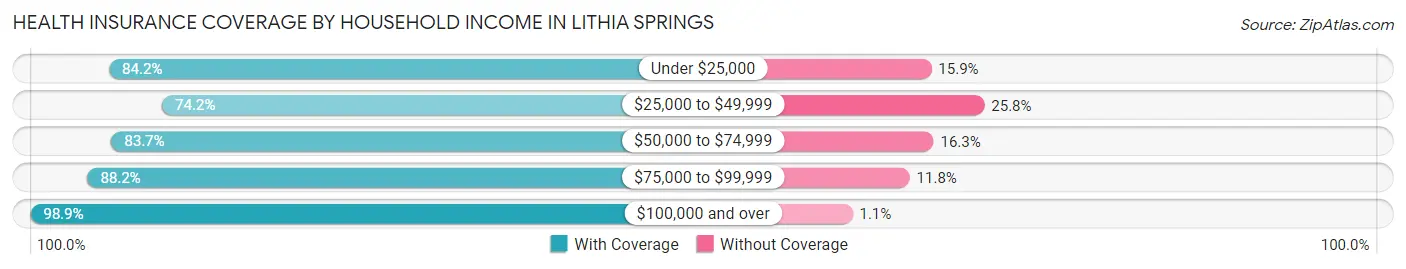
| Household Income | With Coverage | Without Coverage |
| Under $25,000 | 1,742 (84.2%) | 328 (15.9%) |
| $25,000 to $49,999 | 3,214 (74.2%) | 1,116 (25.8%) |
| $50,000 to $74,999 | 3,362 (83.7%) | 653 (16.3%) |
| $75,000 to $99,999 | 2,111 (88.2%) | 282 (11.8%) |
| $100,000 and over | 3,150 (98.9%) | 34 (1.1%) |
Public vs Private Health Insurance Coverage by Age in Lithia Springs
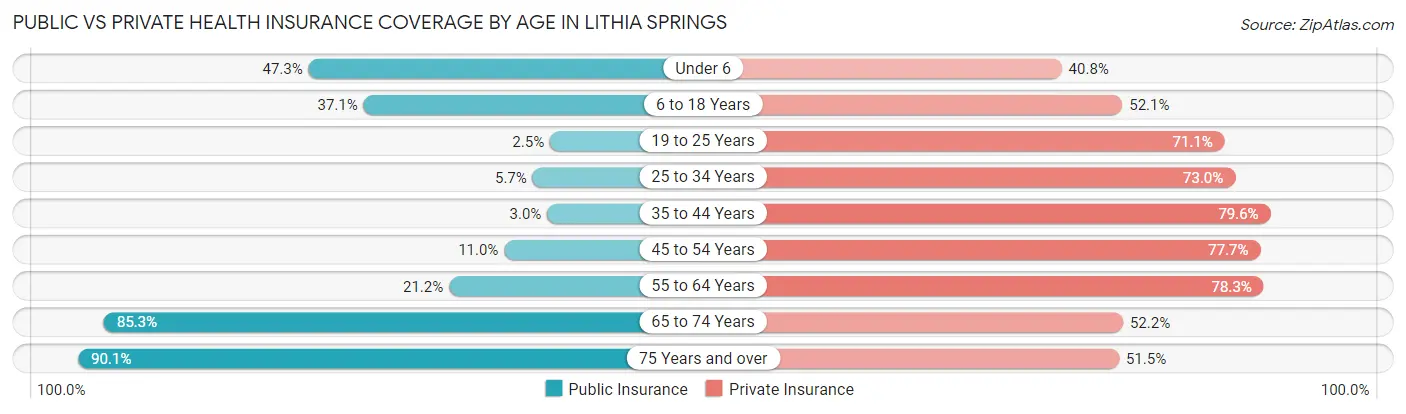
| Age Bracket | Public Insurance | Private Insurance |
| Under 6 | 481 (47.3%) | 415 (40.8%) |
| 6 to 18 Years | 1,172 (37.1%) | 1,645 (52.1%) |
| 19 to 25 Years | 59 (2.5%) | 1,692 (71.1%) |
| 25 to 34 Years | 102 (5.7%) | 1,306 (73.0%) |
| 35 to 44 Years | 65 (3.0%) | 1,724 (79.6%) |
| 45 to 54 Years | 207 (11.0%) | 1,465 (77.7%) |
| 55 to 64 Years | 344 (21.2%) | 1,270 (78.3%) |
| 65 to 74 Years | 1,131 (85.3%) | 692 (52.2%) |
| 75 Years and over | 590 (90.1%) | 337 (51.4%) |
| Total | 4,151 (25.9%) | 10,546 (65.9%) |
Disability Status by Sex by Age in Lithia Springs
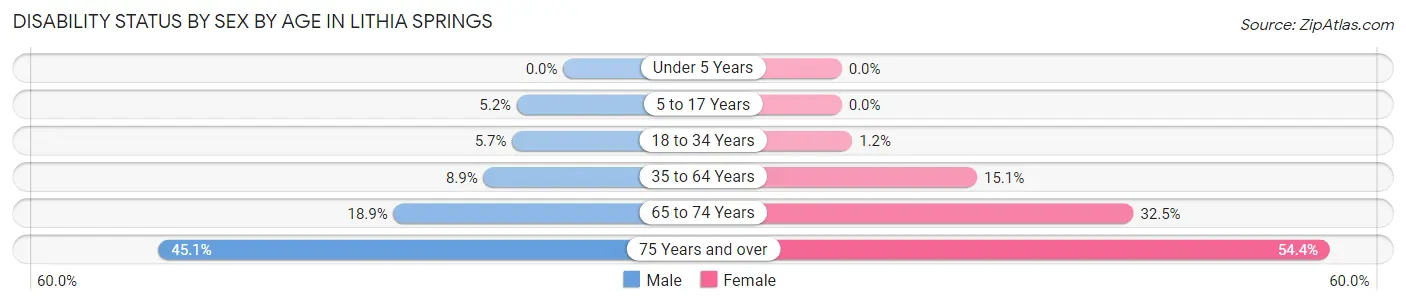
| Age Bracket | Male | Female |
| Under 5 Years | 0 (0.0%) | 0 (0.0%) |
| 5 to 17 Years | 81 (5.2%) | 0 (0.0%) |
| 18 to 34 Years | 117 (5.7%) | 29 (1.2%) |
| 35 to 64 Years | 227 (8.9%) | 470 (15.1%) |
| 65 to 74 Years | 132 (18.9%) | 204 (32.5%) |
| 75 Years and over | 161 (45.1%) | 162 (54.4%) |
Disability Class by Sex by Age in Lithia Springs
Disability Class: Hearing Difficulty
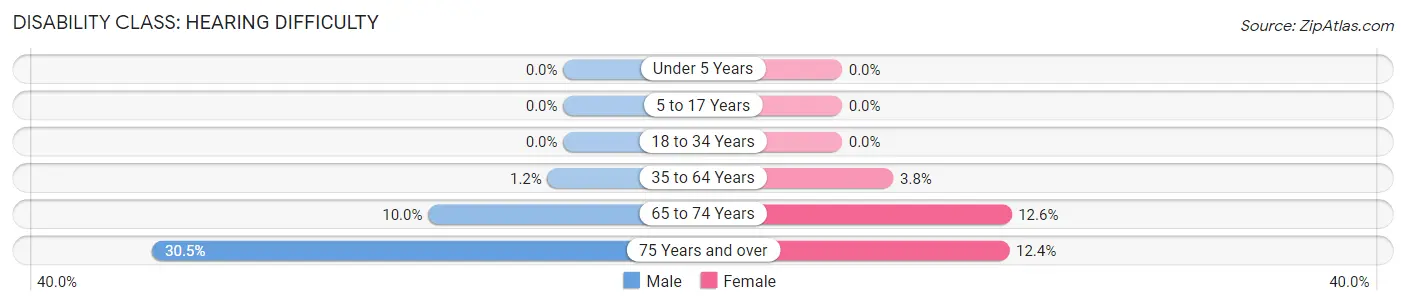
| Age Bracket | Male | Female |
| Under 5 Years | 0 (0.0%) | 0 (0.0%) |
| 5 to 17 Years | 0 (0.0%) | 0 (0.0%) |
| 18 to 34 Years | 0 (0.0%) | 0 (0.0%) |
| 35 to 64 Years | 30 (1.2%) | 119 (3.8%) |
| 65 to 74 Years | 70 (10.0%) | 79 (12.6%) |
| 75 Years and over | 109 (30.5%) | 37 (12.4%) |
Disability Class: Vision Difficulty
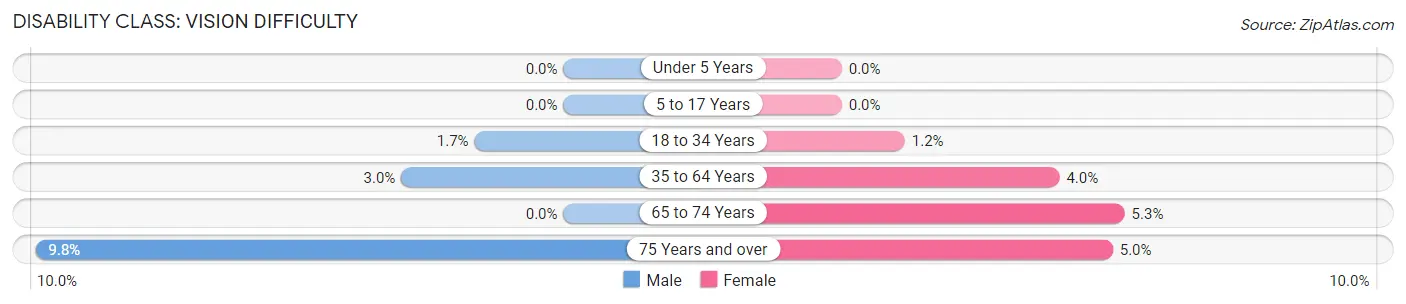
| Age Bracket | Male | Female |
| Under 5 Years | 0 (0.0%) | 0 (0.0%) |
| 5 to 17 Years | 0 (0.0%) | 0 (0.0%) |
| 18 to 34 Years | 34 (1.7%) | 29 (1.2%) |
| 35 to 64 Years | 77 (3.0%) | 126 (4.0%) |
| 65 to 74 Years | 0 (0.0%) | 33 (5.2%) |
| 75 Years and over | 35 (9.8%) | 15 (5.0%) |
Disability Class: Cognitive Difficulty
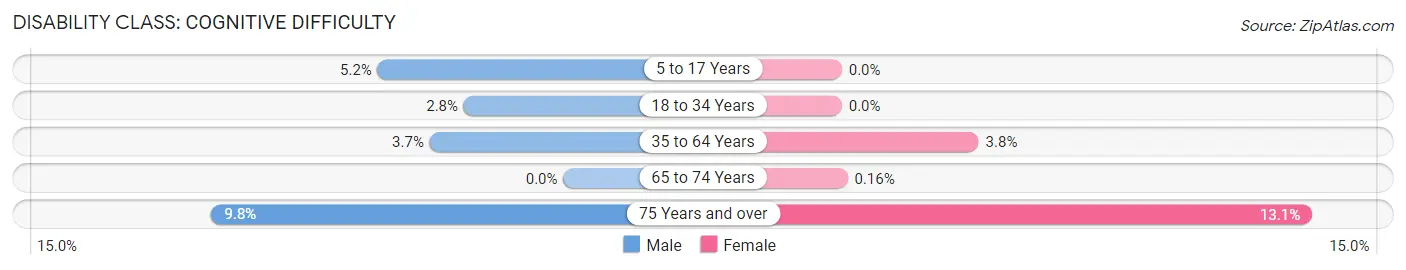
| Age Bracket | Male | Female |
| 5 to 17 Years | 81 (5.2%) | 0 (0.0%) |
| 18 to 34 Years | 57 (2.8%) | 0 (0.0%) |
| 35 to 64 Years | 95 (3.7%) | 119 (3.8%) |
| 65 to 74 Years | 0 (0.0%) | 1 (0.2%) |
| 75 Years and over | 35 (9.8%) | 39 (13.1%) |
Disability Class: Ambulatory Difficulty
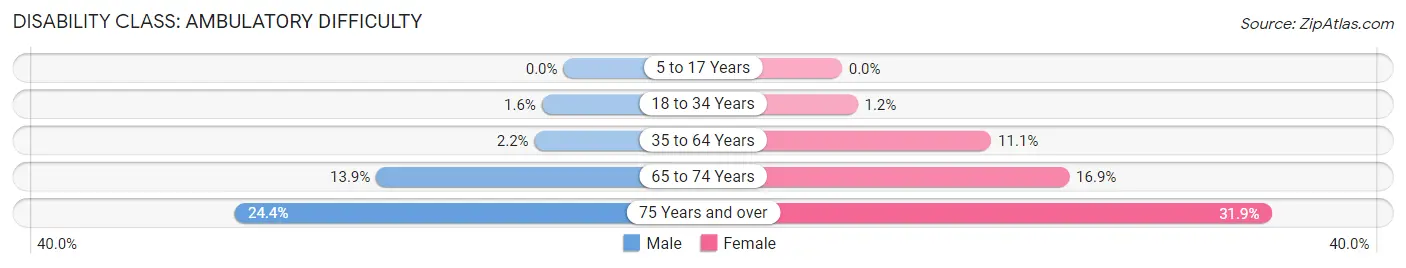
| Age Bracket | Male | Female |
| 5 to 17 Years | 0 (0.0%) | 0 (0.0%) |
| 18 to 34 Years | 33 (1.6%) | 29 (1.2%) |
| 35 to 64 Years | 55 (2.1%) | 346 (11.1%) |
| 65 to 74 Years | 97 (13.9%) | 106 (16.9%) |
| 75 Years and over | 87 (24.4%) | 95 (31.9%) |
Disability Class: Self-Care Difficulty
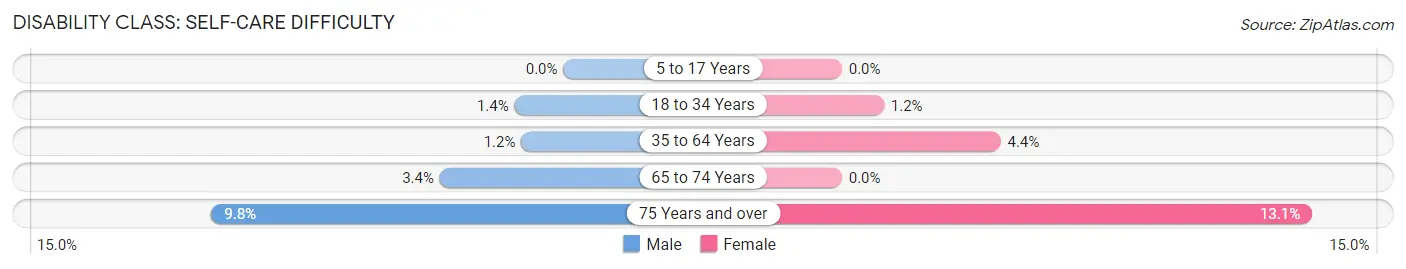
| Age Bracket | Male | Female |
| 5 to 17 Years | 0 (0.0%) | 0 (0.0%) |
| 18 to 34 Years | 28 (1.4%) | 29 (1.2%) |
| 35 to 64 Years | 30 (1.2%) | 138 (4.4%) |
| 65 to 74 Years | 24 (3.4%) | 0 (0.0%) |
| 75 Years and over | 35 (9.8%) | 39 (13.1%) |
Technology Access in Lithia Springs
Computing Device Access in Lithia Springs
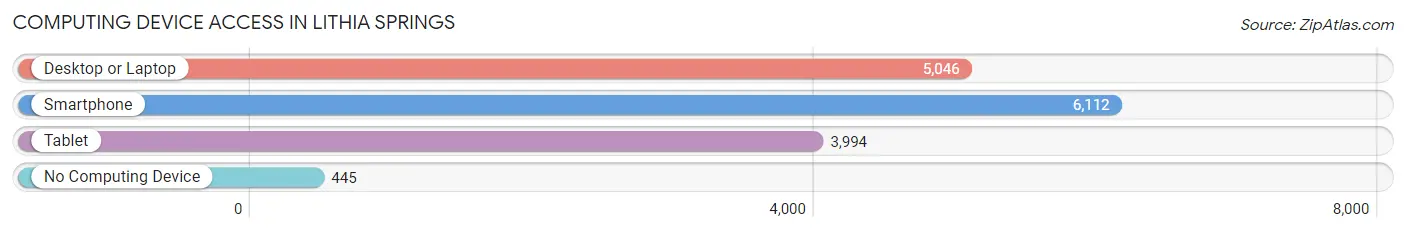
| Device Type | # Households | % Households |
| Desktop or Laptop | 5,046 | 75.0% |
| Smartphone | 6,112 | 90.9% |
| Tablet | 3,994 | 59.4% |
| No Computing Device | 445 | 6.6% |
| Total | 6,727 | 100.0% |
Internet Access in Lithia Springs
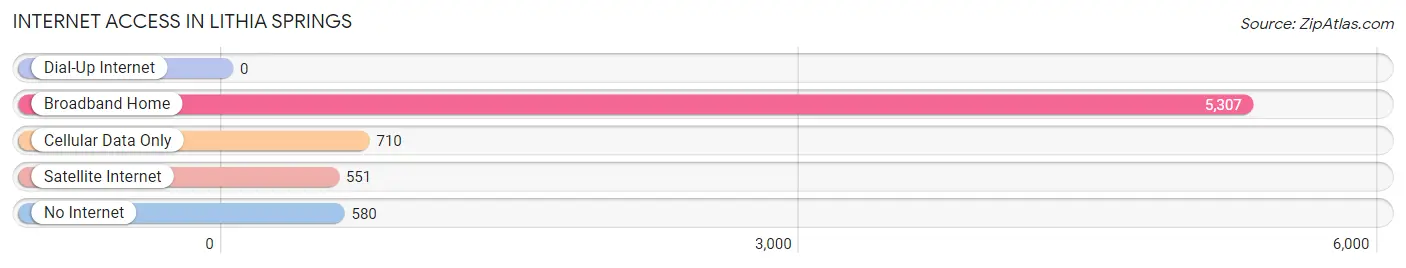
| Internet Type | # Households | % Households |
| Dial-Up Internet | 0 | 0.0% |
| Broadband Home | 5,307 | 78.9% |
| Cellular Data Only | 710 | 10.5% |
| Satellite Internet | 551 | 8.2% |
| No Internet | 580 | 8.6% |
| Total | 6,727 | 100.0% |
Lithia Springs Summary
Lithia Springs is a small city located in Douglas County, Georgia, United States. It is situated approximately 20 miles west of Atlanta and is part of the Atlanta metropolitan area. The city has a population of approximately 15,000 people and covers an area of 4.2 square miles.
History
The area that is now Lithia Springs was originally inhabited by the Creek Indians. The name “Lithia” is derived from the Greek word for “stone” and refers to the abundance of quartz and other stones in the area. The first settlers arrived in the area in the early 1800s and the town was officially incorporated in 1882.
The city was originally known as “Lithia” and was later changed to “Lithia Springs” in 1885. The name was chosen to reflect the presence of several natural springs in the area. The springs were believed to have healing properties and were a popular destination for visitors from all over the country.
In the late 1800s, Lithia Springs became a popular resort destination. The town was home to several hotels and resorts, including the Lithia Springs Hotel, which was built in 1887. The hotel was a popular destination for wealthy visitors from all over the country.
Geography
Lithia Springs is located in the foothills of the Appalachian Mountains. The city is situated at an elevation of 890 feet above sea level. The city is located in the Piedmont region of Georgia and is part of the Atlanta metropolitan area.
The city is bordered by the cities of Austell, Mableton, and Powder Springs. The city is also located near Sweetwater Creek State Park, which is a popular destination for outdoor activities such as hiking, camping, and fishing.
Economy
Lithia Springs is home to several businesses and industries. The city is home to several manufacturing companies, including a Coca-Cola bottling plant and a paper mill. The city is also home to several retail stores, restaurants, and other businesses.
The city is also home to several educational institutions, including the University of West Georgia and the Georgia Institute of Technology.
Demographics
As of the 2010 census, the population of Lithia Springs was 15,491. The racial makeup of the city was 63.3% White, 28.2% African American, 0.3% Native American, 1.7% Asian, 0.1% Pacific Islander, 4.2% from other races, and 2.4% from two or more races. Hispanic or Latino of any race were 8.3% of the population.
The median household income in Lithia Springs was $50,945, and the median family income was $58,945. The per capita income for the city was $22,945. About 11.2% of families and 13.7% of the population were below the poverty line, including 18.2% of those under age 18 and 8.2% of those age 65 or over.
Conclusion
Lithia Springs is a small city located in Douglas County, Georgia, United States. It is situated approximately 20 miles west of Atlanta and is part of the Atlanta metropolitan area. The city has a population of approximately 15,000 people and covers an area of 4.2 square miles. The city was originally inhabited by the Creek Indians and was later settled by European settlers in the early 1800s. The city is home to several businesses and industries, including manufacturing, retail, and educational institutions. The population of Lithia Springs is diverse, with a majority of the population being White, followed by African American, Native American, Asian, and other races. The median household income in Lithia Springs is $50,945, and the median family income is $58,945.
Common Questions
What is Per Capita Income in Lithia Springs?
Per Capita income in Lithia Springs is $26,844.
What is the Median Family Income in Lithia Springs?
Median Family Income in Lithia Springs is $61,400.
What is the Median Household income in Lithia Springs?
Median Household Income in Lithia Springs is $50,694.
What is Income or Wage Gap in Lithia Springs?
Income or Wage Gap in Lithia Springs is 24.9%.
Women in Lithia Springs earn 75.1 cents for every dollar earned by a man.
What is Inequality or Gini Index in Lithia Springs?
Inequality or Gini Index in Lithia Springs is 0.41.
What is the Total Population of Lithia Springs?
Total Population of Lithia Springs is 16,020.
What is the Total Male Population of Lithia Springs?
Total Male Population of Lithia Springs is 7,598.
What is the Total Female Population of Lithia Springs?
Total Female Population of Lithia Springs is 8,422.
What is the Ratio of Males per 100 Females in Lithia Springs?
There are 90.22 Males per 100 Females in Lithia Springs.
What is the Ratio of Females per 100 Males in Lithia Springs?
There are 110.84 Females per 100 Males in Lithia Springs.
What is the Median Population Age in Lithia Springs?
Median Population Age in Lithia Springs is 32.4 Years.
What is the Average Family Size in Lithia Springs
Average Family Size in Lithia Springs is 3.1 People.
What is the Average Household Size in Lithia Springs
Average Household Size in Lithia Springs is 2.4 People.
How Large is the Labor Force in Lithia Springs?
There are 8,521 People in the Labor Forcein in Lithia Springs.
What is the Percentage of People in the Labor Force in Lithia Springs?
66.8% of People are in the Labor Force in Lithia Springs.
What is the Unemployment Rate in Lithia Springs?
Unemployment Rate in Lithia Springs is 4.3%.