Savage, MN Map & Demographics
Savage Map
Savage Overview
$52,266
PER CAPITA INCOME
$141,162
AVG FAMILY INCOME
$123,069
AVG HOUSEHOLD INCOME
25.4%
WAGE / INCOME GAP [ % ]
74.6¢/ $1
WAGE / INCOME GAP [ $ ]
0.37
INEQUALITY / GINI INDEX
32,441
TOTAL POPULATION
16,781
MALE POPULATION
15,660
FEMALE POPULATION
107.16
MALES / 100 FEMALES
93.32
FEMALES / 100 MALES
37.5
MEDIAN AGE
3.2
AVG FAMILY SIZE
2.8
AVG HOUSEHOLD SIZE
19,408
LABOR FORCE [ PEOPLE ]
76.5%
PERCENT IN LABOR FORCE
3.9%
UNEMPLOYMENT RATE
Savage Zip Codes
Savage Area Codes
Income in Savage
Income Overview in Savage
Per Capita Income in Savage is $52,266, while median incomes of families and households are $141,162 and $123,069 respectively.
| Characteristic | Number | Measure |
| Per Capita Income | 32,441 | $52,266 |
| Median Family Income | 9,148 | $141,162 |
| Mean Family Income | 9,148 | $161,413 |
| Median Household Income | 11,582 | $123,069 |
| Mean Household Income | 11,582 | $145,583 |
| Income Deficit | 9,148 | $0 |
| Wage / Income Gap (%) | 32,441 | 25.40% |
| Wage / Income Gap ($) | 32,441 | 74.60¢ per $1 |
| Gini / Inequality Index | 32,441 | 0.37 |
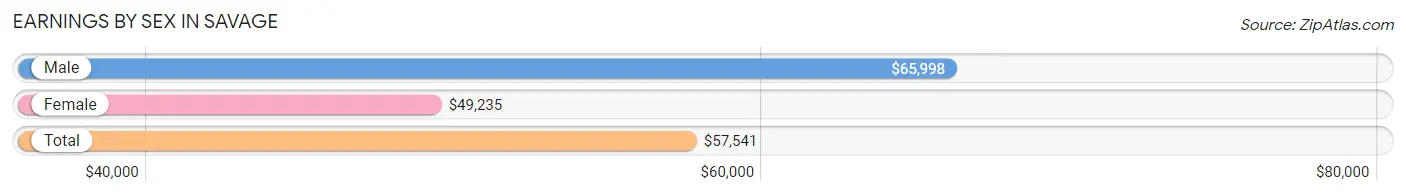
Earnings by Sex in Savage
Average Earnings in Savage are $57,541, $65,998 for men and $49,235 for women, a difference of 25.4%.
| Sex | Number | Average Earnings |
| Male | 11,095 (54.3%) | $65,998 |
| Female | 9,350 (45.7%) | $49,235 |
| Total | 20,445 (100.0%) | $57,541 |
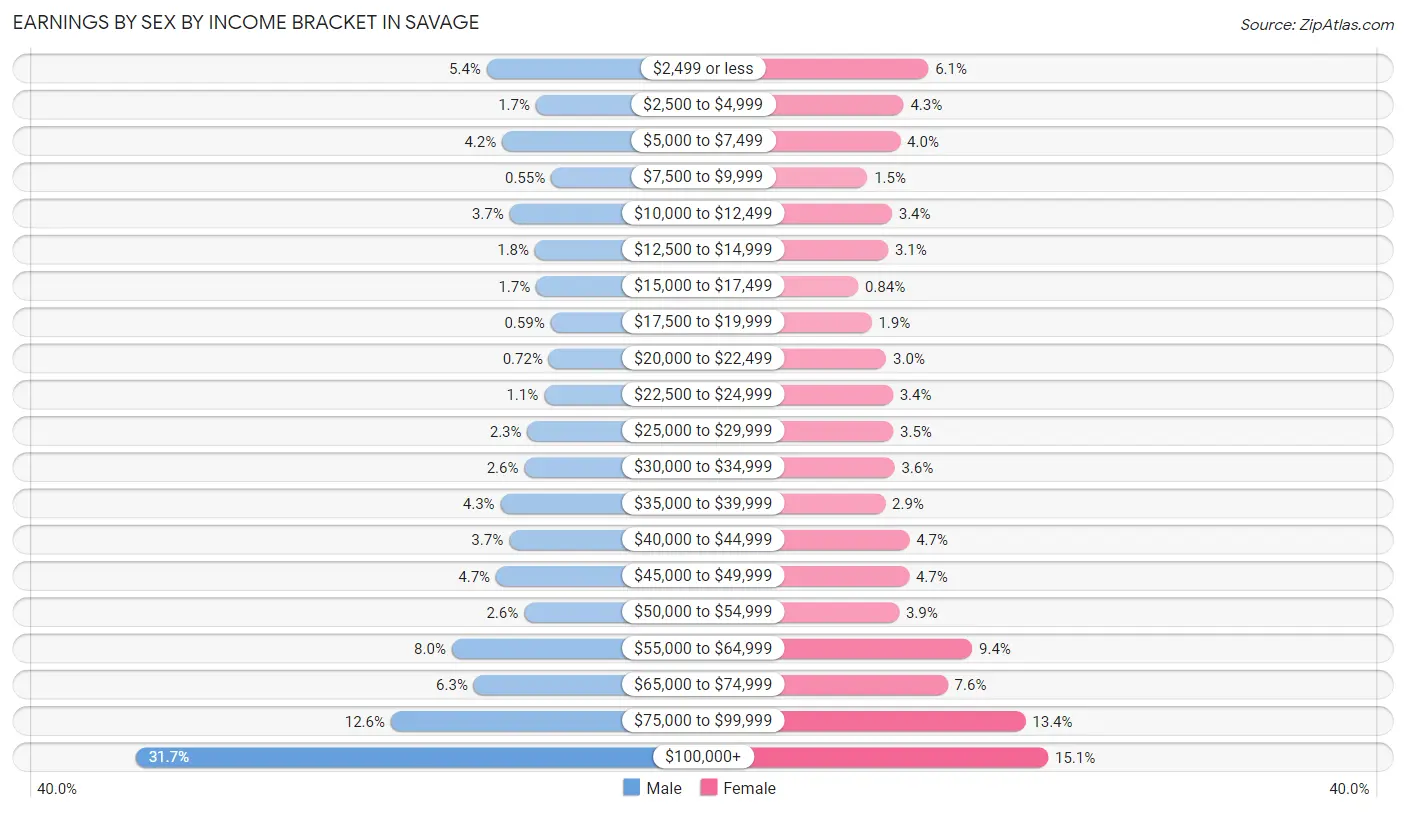
Earnings by Sex by Income Bracket in Savage
The most common earnings brackets in Savage are $100,000+ for men (3,514 | 31.7%) and $100,000+ for women (1,410 | 15.1%).
| Income | Male | Female |
| $2,499 or less | 596 (5.4%) | 570 (6.1%) |
| $2,500 to $4,999 | 187 (1.7%) | 397 (4.3%) |
| $5,000 to $7,499 | 468 (4.2%) | 374 (4.0%) |
| $7,500 to $9,999 | 61 (0.5%) | 143 (1.5%) |
| $10,000 to $12,499 | 406 (3.7%) | 315 (3.4%) |
| $12,500 to $14,999 | 195 (1.8%) | 289 (3.1%) |
| $15,000 to $17,499 | 185 (1.7%) | 79 (0.8%) |
| $17,500 to $19,999 | 65 (0.6%) | 173 (1.8%) |
| $20,000 to $22,499 | 80 (0.7%) | 276 (2.9%) |
| $22,500 to $24,999 | 119 (1.1%) | 322 (3.4%) |
| $25,000 to $29,999 | 257 (2.3%) | 324 (3.5%) |
| $30,000 to $34,999 | 283 (2.5%) | 334 (3.6%) |
| $35,000 to $39,999 | 481 (4.3%) | 268 (2.9%) |
| $40,000 to $44,999 | 410 (3.7%) | 438 (4.7%) |
| $45,000 to $49,999 | 519 (4.7%) | 436 (4.7%) |
| $50,000 to $54,999 | 285 (2.6%) | 366 (3.9%) |
| $55,000 to $64,999 | 887 (8.0%) | 878 (9.4%) |
| $65,000 to $74,999 | 703 (6.3%) | 707 (7.6%) |
| $75,000 to $99,999 | 1,394 (12.6%) | 1,251 (13.4%) |
| $100,000+ | 3,514 (31.7%) | 1,410 (15.1%) |
| Total | 11,095 (100.0%) | 9,350 (100.0%) |
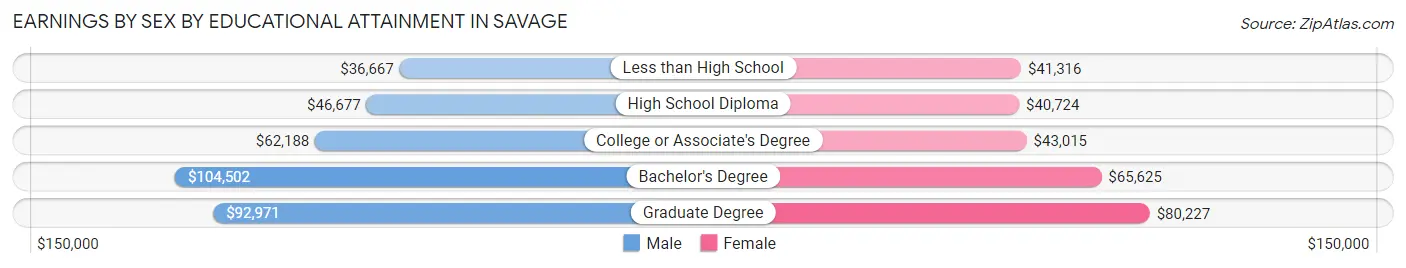
Earnings by Sex by Educational Attainment in Savage
Average earnings in Savage are $77,645 for men and $57,145 for women, a difference of 26.4%. Men with an educational attainment of bachelor's degree enjoy the highest average annual earnings of $104,502, while those with less than high school education earn the least with $36,667. Women with an educational attainment of graduate degree earn the most with the average annual earnings of $80,227, while those with high school diploma education have the smallest earnings of $40,724.
| Educational Attainment | Male Income | Female Income |
| Less than High School | $36,667 | $41,316 |
| High School Diploma | $46,677 | $40,724 |
| College or Associate's Degree | $62,188 | $43,015 |
| Bachelor's Degree | $104,502 | $65,625 |
| Graduate Degree | $92,971 | $80,227 |
| Total | $77,645 | $57,145 |
Family Income in Savage
Family Income Brackets in Savage
According to the Savage family income data, there are 2,607 families falling into the $200,000+ income range, which is the most common income bracket and makes up 28.5% of all families. Conversely, the $10,000 to $14,999 income bracket is the least frequent group with only 101 families (1.1%) belonging to this category.
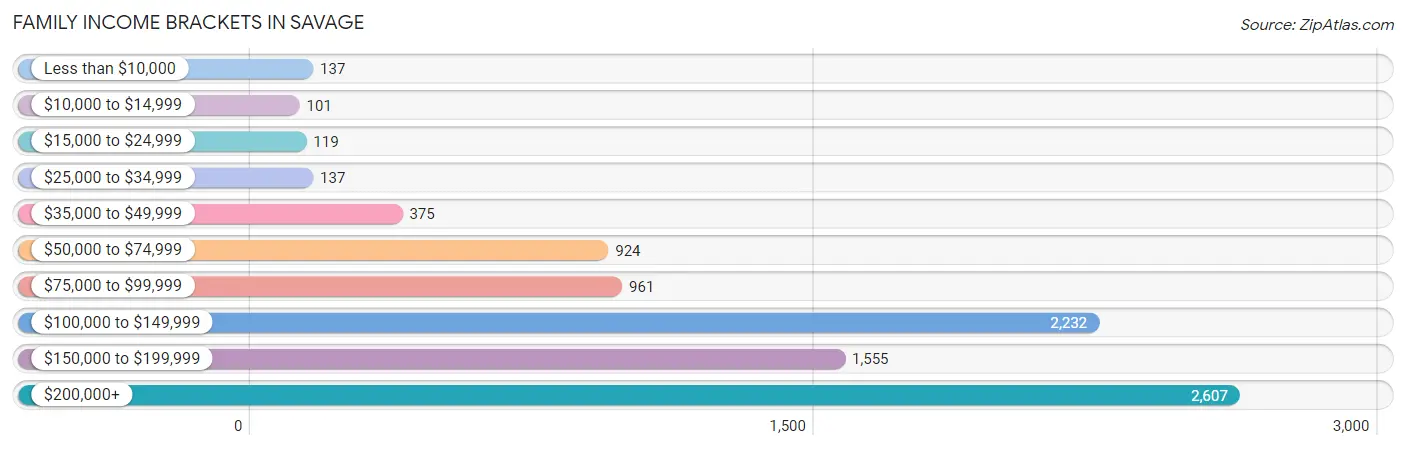
| Income Bracket | # Families | % Families |
| Less than $10,000 | 137 | 1.5% |
| $10,000 to $14,999 | 101 | 1.1% |
| $15,000 to $24,999 | 119 | 1.3% |
| $25,000 to $34,999 | 137 | 1.5% |
| $35,000 to $49,999 | 375 | 4.1% |
| $50,000 to $74,999 | 924 | 10.1% |
| $75,000 to $99,999 | 961 | 10.5% |
| $100,000 to $149,999 | 2,232 | 24.4% |
| $150,000 to $199,999 | 1,555 | 17.0% |
| $200,000+ | 2,607 | 28.5% |
Family Income by Famaliy Size in Savage
5-person families (788 | 8.6%) account for the highest median family income in Savage with $201,111 per family, while 2-person families (3,695 | 40.4%) have the highest median income of $58,282 per family member.
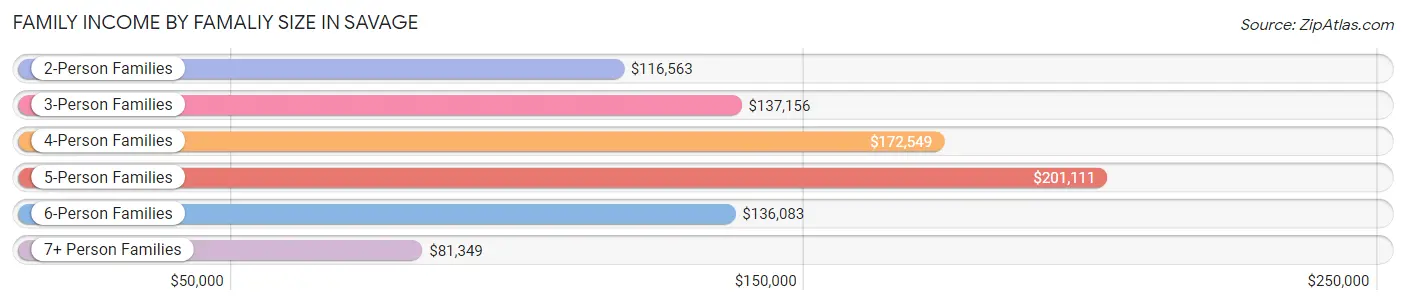
| Income Bracket | # Families | Median Income |
| 2-Person Families | 3,695 (40.4%) | $116,563 |
| 3-Person Families | 2,273 (24.8%) | $137,156 |
| 4-Person Families | 2,052 (22.4%) | $172,549 |
| 5-Person Families | 788 (8.6%) | $201,111 |
| 6-Person Families | 167 (1.8%) | $136,083 |
| 7+ Person Families | 173 (1.9%) | $81,349 |
| Total | 9,148 (100.0%) | $141,162 |
Family Income by Number of Earners in Savage
The median family income in Savage is $141,162, with families comprising 3+ earners (1,666) having the highest median family income of $194,628, while families with no earners (590) have the lowest median family income of $63,714, accounting for 18.2% and 6.5% of families, respectively.
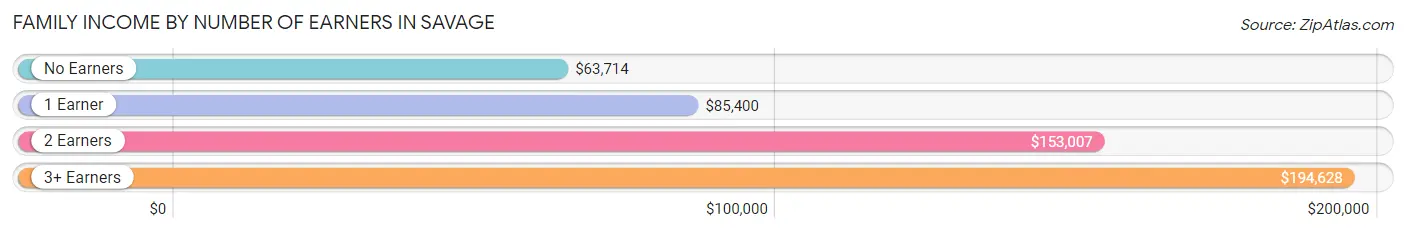
| Number of Earners | # Families | Median Income |
| No Earners | 590 (6.5%) | $63,714 |
| 1 Earner | 2,200 (24.0%) | $85,400 |
| 2 Earners | 4,692 (51.3%) | $153,007 |
| 3+ Earners | 1,666 (18.2%) | $194,628 |
| Total | 9,148 (100.0%) | $141,162 |
Household Income in Savage
Household Income Brackets in Savage
With 2,757 households falling in the category, the $100,000 to $149,999 income range is the most frequent in Savage, accounting for 23.8% of all households. In contrast, only 151 households (1.3%) fall into the $10,000 to $14,999 income bracket, making it the least populous group.
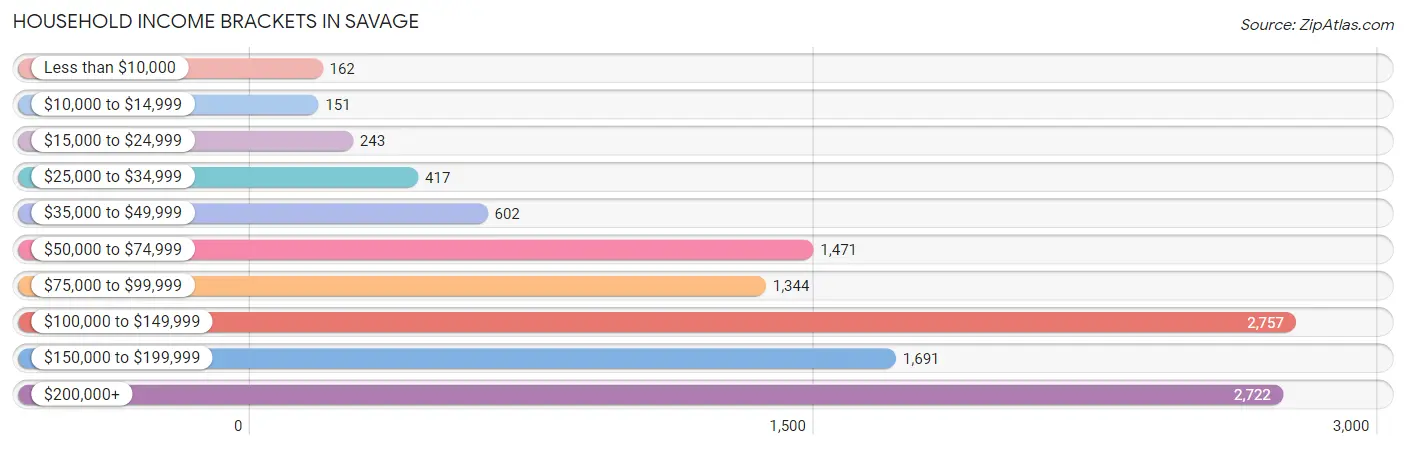
| Income Bracket | # Households | % Households |
| Less than $10,000 | 162 | 1.4% |
| $10,000 to $14,999 | 151 | 1.3% |
| $15,000 to $24,999 | 243 | 2.1% |
| $25,000 to $34,999 | 417 | 3.6% |
| $35,000 to $49,999 | 602 | 5.2% |
| $50,000 to $74,999 | 1,471 | 12.7% |
| $75,000 to $99,999 | 1,344 | 11.6% |
| $100,000 to $149,999 | 2,757 | 23.8% |
| $150,000 to $199,999 | 1,691 | 14.6% |
| $200,000+ | 2,722 | 23.5% |
Household Income by Householder Age in Savage
The median household income in Savage is $123,069, with the highest median household income of $157,613 found in the 45 to 64 years age bracket for the primary householder. A total of 4,766 households (41.1%) fall into this category. Meanwhile, the 15 to 24 years age bracket for the primary householder has the lowest median household income of $0, with 228 households (2.0%) in this group.
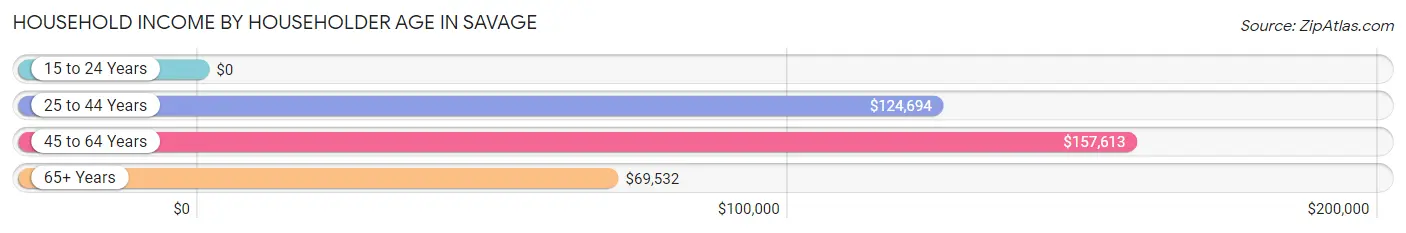
| Income Bracket | # Households | Median Income |
| 15 to 24 Years | 228 (2.0%) | $0 |
| 25 to 44 Years | 4,391 (37.9%) | $124,694 |
| 45 to 64 Years | 4,766 (41.1%) | $157,613 |
| 65+ Years | 2,197 (19.0%) | $69,532 |
| Total | 11,582 (100.0%) | $123,069 |
Poverty in Savage
Income Below Poverty by Sex and Age in Savage
With 5.9% poverty level for males and 6.2% for females among the residents of Savage, 5 year old males and 6 to 11 year old females are the most vulnerable to poverty, with 75 males (31.9%) and 288 females (21.0%) in their respective age groups living below the poverty level.
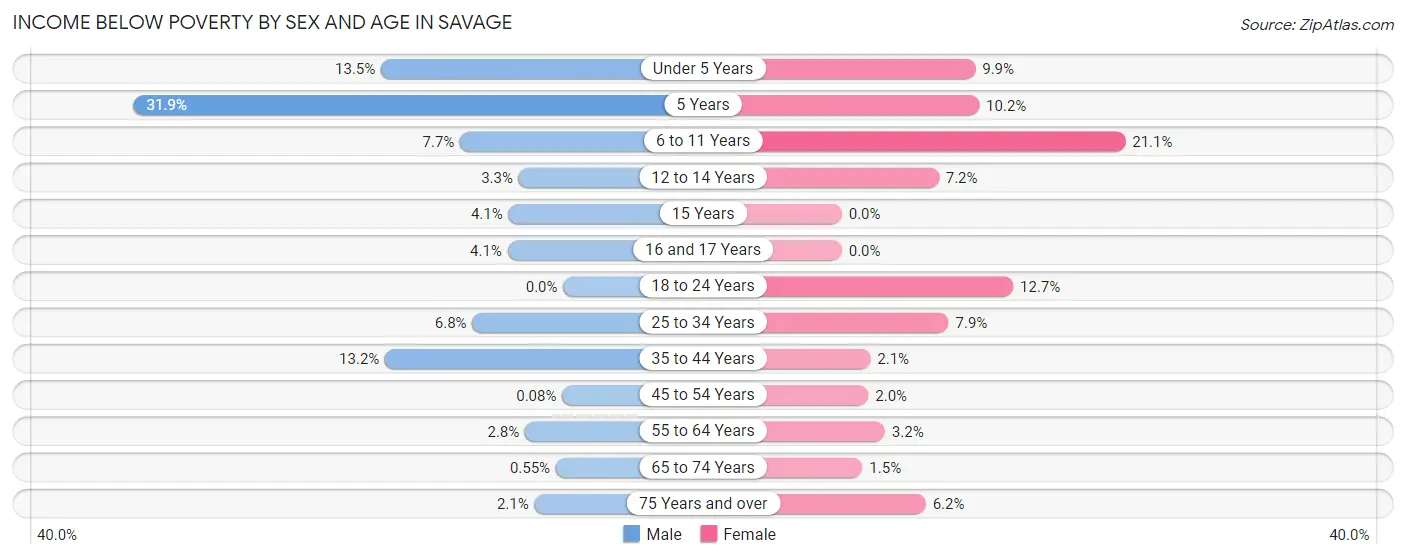
| Age Bracket | Male | Female |
| Under 5 Years | 148 (13.5%) | 97 (9.9%) |
| 5 Years | 75 (31.9%) | 31 (10.2%) |
| 6 to 11 Years | 105 (7.7%) | 288 (21.0%) |
| 12 to 14 Years | 22 (3.3%) | 36 (7.2%) |
| 15 Years | 10 (4.1%) | 0 (0.0%) |
| 16 and 17 Years | 26 (4.1%) | 0 (0.0%) |
| 18 to 24 Years | 0 (0.0%) | 142 (12.7%) |
| 25 to 34 Years | 152 (6.8%) | 149 (7.9%) |
| 35 to 44 Years | 368 (13.2%) | 44 (2.1%) |
| 45 to 54 Years | 2 (0.1%) | 44 (2.0%) |
| 55 to 64 Years | 55 (2.8%) | 74 (3.2%) |
| 65 to 74 Years | 7 (0.5%) | 20 (1.5%) |
| 75 Years and over | 11 (2.1%) | 45 (6.2%) |
| Total | 981 (5.9%) | 970 (6.2%) |
Income Above Poverty by Sex and Age in Savage
According to the poverty statistics in Savage, males aged 18 to 24 years and females aged 15 years are the age groups that are most secure financially, with 100.0% of males and 100.0% of females in these age groups living above the poverty line.
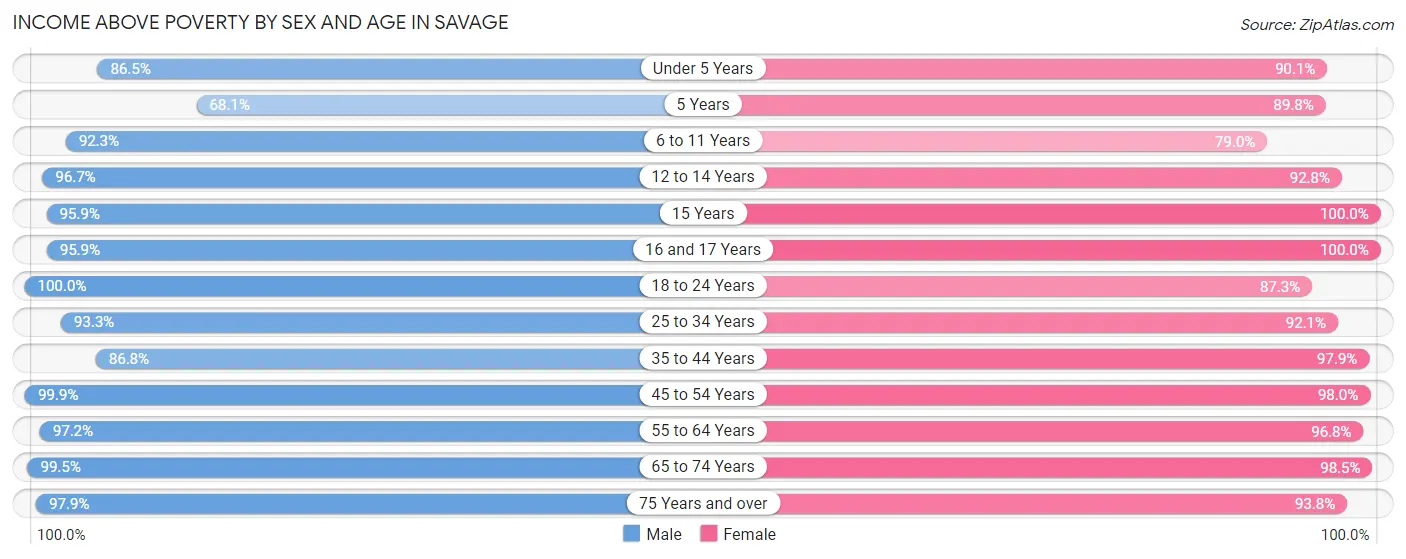
| Age Bracket | Male | Female |
| Under 5 Years | 946 (86.5%) | 882 (90.1%) |
| 5 Years | 160 (68.1%) | 273 (89.8%) |
| 6 to 11 Years | 1,266 (92.3%) | 1,080 (78.9%) |
| 12 to 14 Years | 643 (96.7%) | 464 (92.8%) |
| 15 Years | 236 (95.9%) | 298 (100.0%) |
| 16 and 17 Years | 604 (95.9%) | 561 (100.0%) |
| 18 to 24 Years | 1,345 (100.0%) | 974 (87.3%) |
| 25 to 34 Years | 2,100 (93.2%) | 1,730 (92.1%) |
| 35 to 44 Years | 2,413 (86.8%) | 2,032 (97.9%) |
| 45 to 54 Years | 2,421 (99.9%) | 2,192 (98.0%) |
| 55 to 64 Years | 1,879 (97.2%) | 2,236 (96.8%) |
| 65 to 74 Years | 1,274 (99.5%) | 1,290 (98.5%) |
| 75 Years and over | 502 (97.9%) | 677 (93.8%) |
| Total | 15,789 (94.2%) | 14,689 (93.8%) |
Income Below Poverty Among Married-Couple Families in Savage
The poverty statistics for married-couple families in Savage show that 2.3% or 169 of the total 7,387 families live below the poverty line. Families with 5 or more children have the highest poverty rate of 40.7%, comprising of 66 families. On the other hand, families with no children have the lowest poverty rate of 0.7%, which includes 25 families.
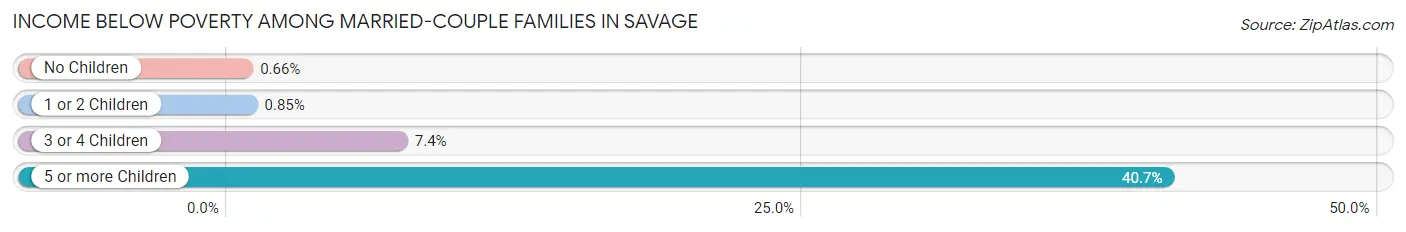
| Children | Above Poverty | Below Poverty |
| No Children | 3,738 (99.3%) | 25 (0.7%) |
| 1 or 2 Children | 2,695 (99.2%) | 23 (0.9%) |
| 3 or 4 Children | 689 (92.6%) | 55 (7.4%) |
| 5 or more Children | 96 (59.3%) | 66 (40.7%) |
| Total | 7,218 (97.7%) | 169 (2.3%) |
Income Below Poverty Among Single-Parent Households in Savage
According to the poverty data in Savage, 15.0% or 81 single-father households and 7.9% or 96 single-mother households are living below the poverty line. Among single-father households, those with 1 or 2 children have the highest poverty rate, with 81 households (28.3%) experiencing poverty. Likewise, among single-mother households, those with 3 or 4 children have the highest poverty rate, with 72 households (58.5%) falling below the poverty line.
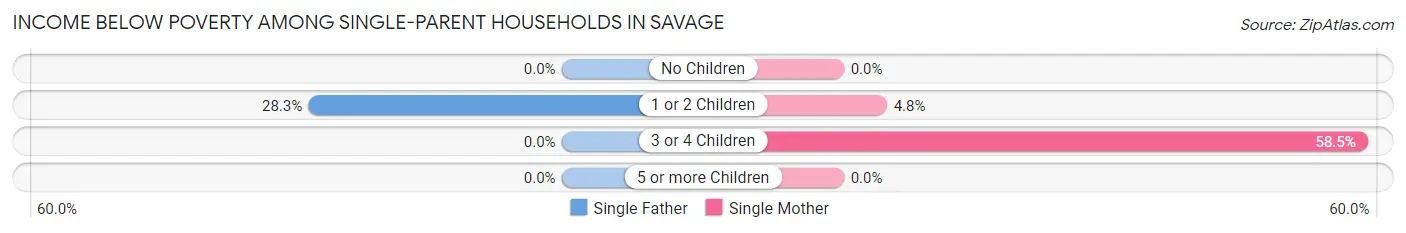
| Children | Single Father | Single Mother |
| No Children | 0 (0.0%) | 0 (0.0%) |
| 1 or 2 Children | 81 (28.3%) | 24 (4.8%) |
| 3 or 4 Children | 0 (0.0%) | 72 (58.5%) |
| 5 or more Children | 0 (0.0%) | 0 (0.0%) |
| Total | 81 (15.0%) | 96 (7.9%) |
Income Below Poverty Among Married-Couple vs Single-Parent Households in Savage
The poverty data for Savage shows that 169 of the married-couple family households (2.3%) and 177 of the single-parent households (10.1%) are living below the poverty level. Within the married-couple family households, those with 5 or more children have the highest poverty rate, with 66 households (40.7%) falling below the poverty line. Among the single-parent households, those with 3 or 4 children have the highest poverty rate, with 72 household (58.5%) living below poverty.
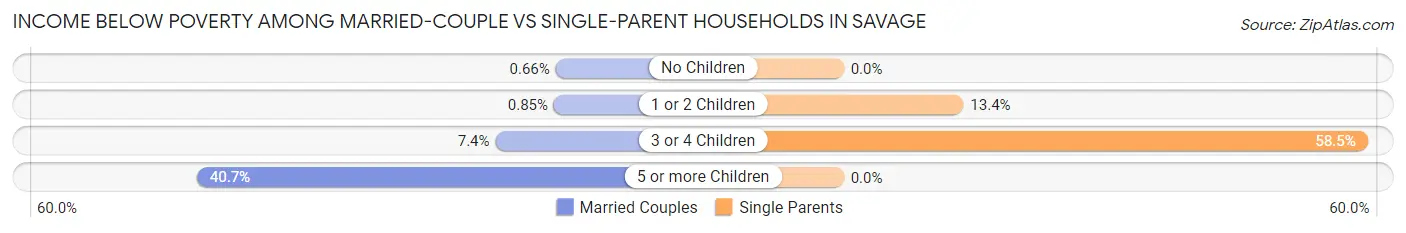
| Children | Married-Couple Families | Single-Parent Households |
| No Children | 25 (0.7%) | 0 (0.0%) |
| 1 or 2 Children | 23 (0.9%) | 105 (13.4%) |
| 3 or 4 Children | 55 (7.4%) | 72 (58.5%) |
| 5 or more Children | 66 (40.7%) | 0 (0.0%) |
| Total | 169 (2.3%) | 177 (10.1%) |
Race in Savage
The most populous races in Savage are White / Caucasian (24,768 | 76.3%), Black / African American (2,948 | 9.1%), and Asian (2,422 | 7.5%).
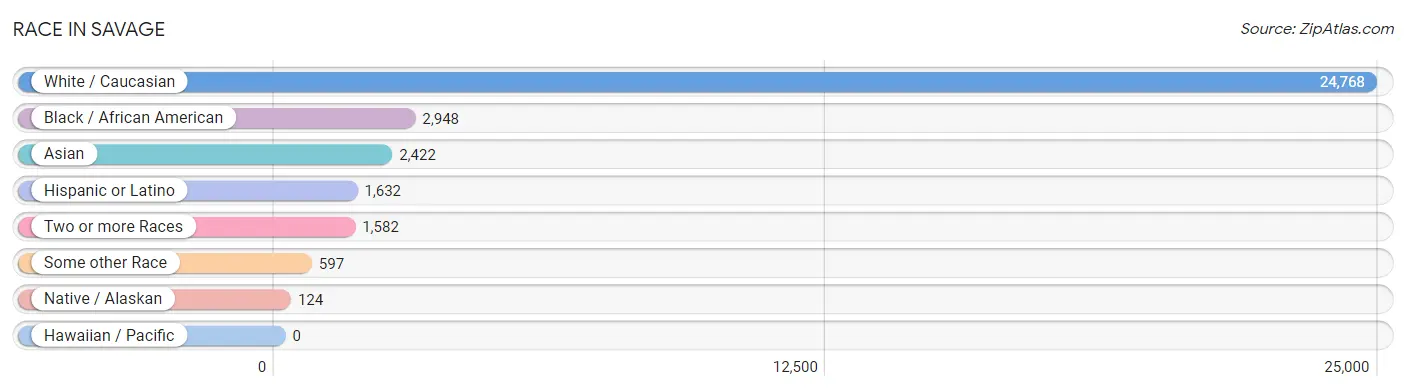
| Race | # Population | % Population |
| Asian | 2,422 | 7.5% |
| Black / African American | 2,948 | 9.1% |
| Hawaiian / Pacific | 0 | 0.0% |
| Hispanic or Latino | 1,632 | 5.0% |
| Native / Alaskan | 124 | 0.4% |
| White / Caucasian | 24,768 | 76.3% |
| Two or more Races | 1,582 | 4.9% |
| Some other Race | 597 | 1.8% |
| Total | 32,441 | 100.0% |
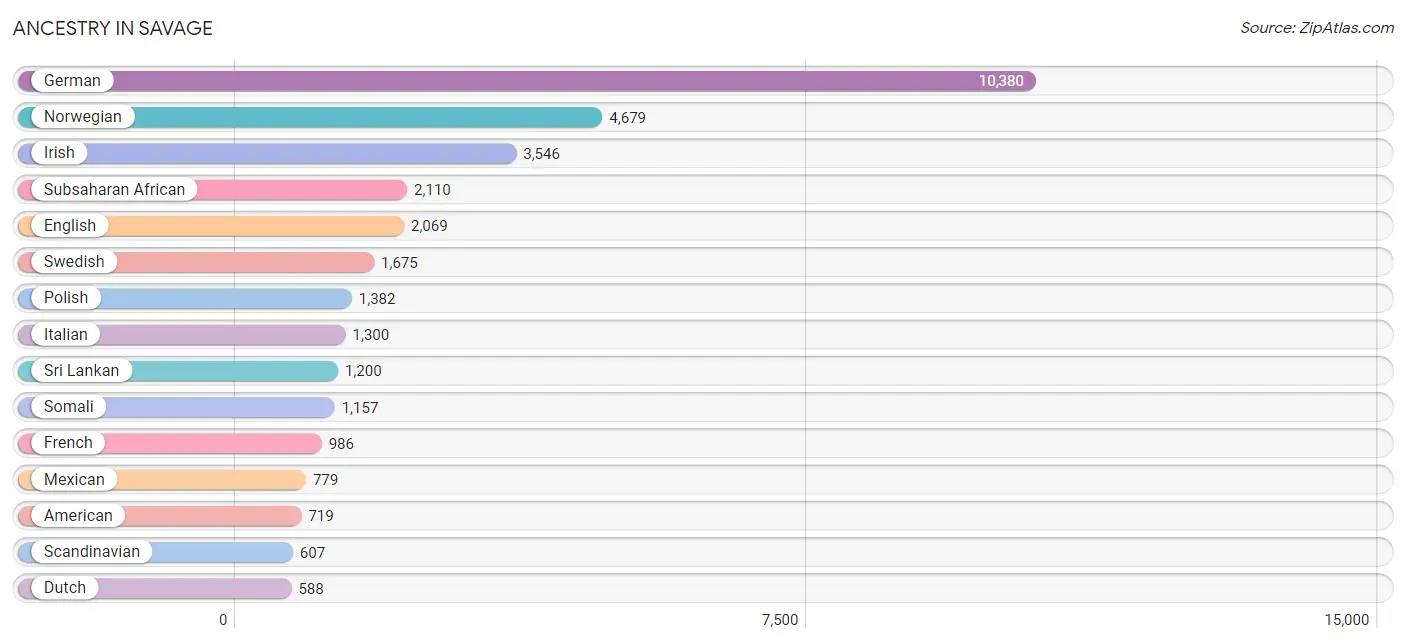
Ancestry in Savage
The most populous ancestries reported in Savage are German (10,380 | 32.0%), Norwegian (4,679 | 14.4%), Irish (3,546 | 10.9%), Subsaharan African (2,110 | 6.5%), and English (2,069 | 6.4%), together accounting for 70.2% of all Savage residents.
| Ancestry | # Population | % Population |
| African | 34 | 0.1% |
| American | 719 | 2.2% |
| Arab | 180 | 0.5% |
| Austrian | 119 | 0.4% |
| Bangladeshi | 95 | 0.3% |
| Belgian | 114 | 0.4% |
| Bhutanese | 35 | 0.1% |
| British | 54 | 0.2% |
| Burmese | 259 | 0.8% |
| Canadian | 178 | 0.5% |
| Central American | 163 | 0.5% |
| Central American Indian | 3 | 0.0% |
| Chilean | 34 | 0.1% |
| Chippewa | 87 | 0.3% |
| Colombian | 60 | 0.2% |
| Costa Rican | 12 | 0.0% |
| Cree | 35 | 0.1% |
| Croatian | 51 | 0.2% |
| Cuban | 42 | 0.1% |
| Czech | 429 | 1.3% |
| Czechoslovakian | 60 | 0.2% |
| Danish | 493 | 1.5% |
| Dominican | 82 | 0.3% |
| Dutch | 588 | 1.8% |
| Eastern European | 91 | 0.3% |
| Ecuadorian | 86 | 0.3% |
| Egyptian | 62 | 0.2% |
| English | 2,069 | 6.4% |
| Estonian | 11 | 0.0% |
| Ethiopian | 62 | 0.2% |
| European | 420 | 1.3% |
| Finnish | 400 | 1.2% |
| French | 986 | 3.0% |
| French Canadian | 247 | 0.8% |
| German | 10,380 | 32.0% |
| Ghanaian | 450 | 1.4% |
| Greek | 202 | 0.6% |
| Guatemalan | 41 | 0.1% |
| Hungarian | 74 | 0.2% |
| Icelander | 15 | 0.1% |
| Indian (Asian) | 314 | 1.0% |
| Irish | 3,546 | 10.9% |
| Italian | 1,300 | 4.0% |
| Japanese | 392 | 1.2% |
| Korean | 247 | 0.8% |
| Latvian | 14 | 0.0% |
| Lebanese | 87 | 0.3% |
| Liberian | 39 | 0.1% |
| Luxembourger | 45 | 0.1% |
| Malaysian | 317 | 1.0% |
| Mexican | 779 | 2.4% |
| Native Hawaiian | 12 | 0.0% |
| Nigerian | 335 | 1.0% |
| Northern European | 52 | 0.2% |
| Norwegian | 4,679 | 14.4% |
| Pakistani | 11 | 0.0% |
| Palestinian | 24 | 0.1% |
| Panamanian | 74 | 0.2% |
| Peruvian | 9 | 0.0% |
| Polish | 1,382 | 4.3% |
| Puerto Rican | 23 | 0.1% |
| Romanian | 15 | 0.1% |
| Russian | 352 | 1.1% |
| Salvadoran | 36 | 0.1% |
| Scandinavian | 607 | 1.9% |
| Scotch-Irish | 48 | 0.2% |
| Scottish | 467 | 1.4% |
| Serbian | 16 | 0.1% |
| Sioux | 74 | 0.2% |
| Slovak | 66 | 0.2% |
| Slovene | 16 | 0.1% |
| Somali | 1,157 | 3.6% |
| South American | 189 | 0.6% |
| Spaniard | 187 | 0.6% |
| Spanish | 15 | 0.1% |
| Sri Lankan | 1,200 | 3.7% |
| Subsaharan African | 2,110 | 6.5% |
| Sudanese | 16 | 0.1% |
| Swedish | 1,675 | 5.2% |
| Swiss | 95 | 0.3% |
| Syrian | 7 | 0.0% |
| Thai | 237 | 0.7% |
| Turkish | 17 | 0.1% |
| Ukrainian | 182 | 0.6% |
| Welsh | 231 | 0.7% |
| West Indian | 112 | 0.4% | View All 86 Rows |
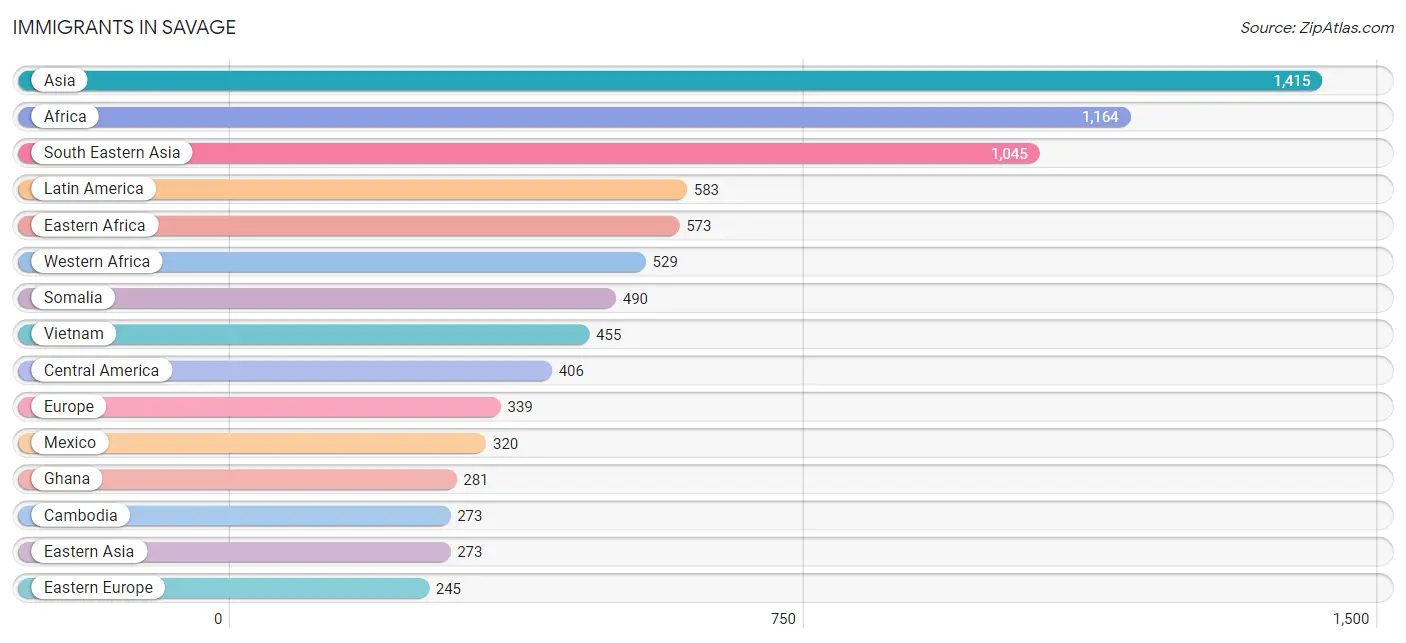
Immigrants in Savage
The most numerous immigrant groups reported in Savage came from Asia (1,415 | 4.4%), Africa (1,164 | 3.6%), South Eastern Asia (1,045 | 3.2%), Latin America (583 | 1.8%), and Eastern Africa (573 | 1.8%), together accounting for 14.7% of all Savage residents.
| Immigration Origin | # Population | % Population |
| Africa | 1,164 | 3.6% |
| Asia | 1,415 | 4.4% |
| Brazil | 6 | 0.0% |
| Cambodia | 273 | 0.8% |
| Canada | 109 | 0.3% |
| Caribbean | 23 | 0.1% |
| Central America | 406 | 1.3% |
| China | 125 | 0.4% |
| Colombia | 23 | 0.1% |
| Cuba | 10 | 0.0% |
| Denmark | 15 | 0.1% |
| Eastern Africa | 573 | 1.8% |
| Eastern Asia | 273 | 0.8% |
| Eastern Europe | 245 | 0.8% |
| Ecuador | 86 | 0.3% |
| Egypt | 46 | 0.1% |
| El Salvador | 45 | 0.1% |
| England | 19 | 0.1% |
| Ethiopia | 66 | 0.2% |
| Europe | 339 | 1.0% |
| France | 16 | 0.1% |
| Germany | 31 | 0.1% |
| Ghana | 281 | 0.9% |
| Guatemala | 41 | 0.1% |
| Guyana | 30 | 0.1% |
| Hong Kong | 26 | 0.1% |
| Hungary | 46 | 0.1% |
| India | 65 | 0.2% |
| Korea | 148 | 0.5% |
| Laos | 207 | 0.6% |
| Latin America | 583 | 1.8% |
| Liberia | 20 | 0.1% |
| Mexico | 320 | 1.0% |
| Netherlands | 7 | 0.0% |
| Nigeria | 228 | 0.7% |
| Northern Africa | 62 | 0.2% |
| Northern Europe | 40 | 0.1% |
| Peru | 9 | 0.0% |
| Philippines | 99 | 0.3% |
| Romania | 15 | 0.1% |
| Russia | 71 | 0.2% |
| Scotland | 6 | 0.0% |
| Somalia | 490 | 1.5% |
| South America | 154 | 0.5% |
| South Central Asia | 75 | 0.2% |
| South Eastern Asia | 1,045 | 3.2% |
| Sudan | 16 | 0.1% |
| Thailand | 11 | 0.0% |
| Trinidad and Tobago | 13 | 0.0% |
| Turkey | 17 | 0.1% |
| Ukraine | 113 | 0.4% |
| Vietnam | 455 | 1.4% |
| Western Africa | 529 | 1.6% |
| Western Asia | 22 | 0.1% |
| Western Europe | 54 | 0.2% | View All 55 Rows |
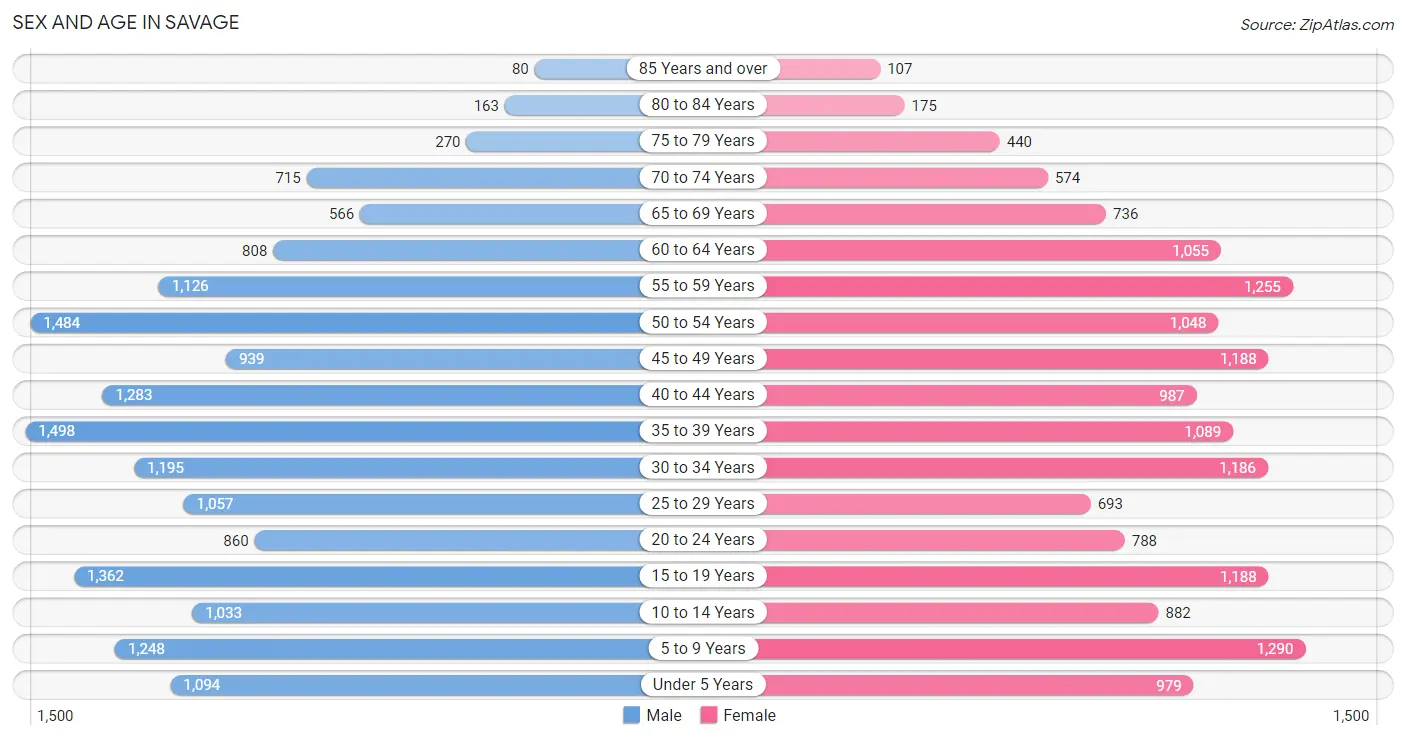
Sex and Age in Savage
Sex and Age in Savage
The most populous age groups in Savage are 35 to 39 Years (1,498 | 8.9%) for men and 5 to 9 Years (1,290 | 8.2%) for women.
| Age Bracket | Male | Female |
| Under 5 Years | 1,094 (6.5%) | 979 (6.2%) |
| 5 to 9 Years | 1,248 (7.4%) | 1,290 (8.2%) |
| 10 to 14 Years | 1,033 (6.2%) | 882 (5.6%) |
| 15 to 19 Years | 1,362 (8.1%) | 1,188 (7.6%) |
| 20 to 24 Years | 860 (5.1%) | 788 (5.0%) |
| 25 to 29 Years | 1,057 (6.3%) | 693 (4.4%) |
| 30 to 34 Years | 1,195 (7.1%) | 1,186 (7.6%) |
| 35 to 39 Years | 1,498 (8.9%) | 1,089 (7.0%) |
| 40 to 44 Years | 1,283 (7.6%) | 987 (6.3%) |
| 45 to 49 Years | 939 (5.6%) | 1,188 (7.6%) |
| 50 to 54 Years | 1,484 (8.8%) | 1,048 (6.7%) |
| 55 to 59 Years | 1,126 (6.7%) | 1,255 (8.0%) |
| 60 to 64 Years | 808 (4.8%) | 1,055 (6.7%) |
| 65 to 69 Years | 566 (3.4%) | 736 (4.7%) |
| 70 to 74 Years | 715 (4.3%) | 574 (3.7%) |
| 75 to 79 Years | 270 (1.6%) | 440 (2.8%) |
| 80 to 84 Years | 163 (1.0%) | 175 (1.1%) |
| 85 Years and over | 80 (0.5%) | 107 (0.7%) |
| Total | 16,781 (100.0%) | 15,660 (100.0%) |
Families and Households in Savage
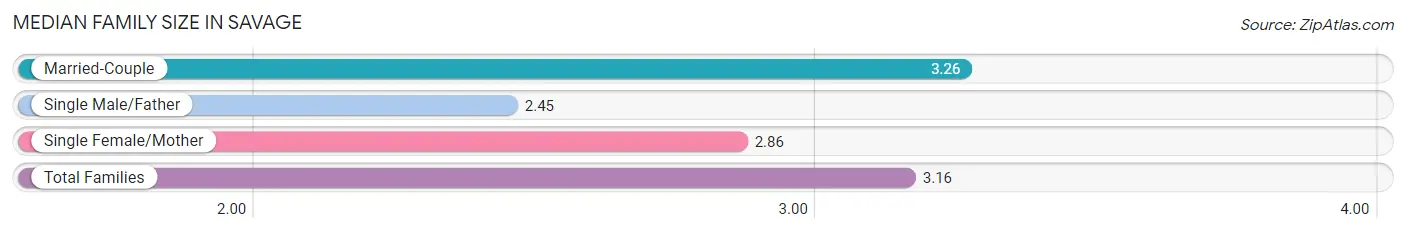
Median Family Size in Savage
The median family size in Savage is 3.16 persons per family, with married-couple families (7,387 | 80.7%) accounting for the largest median family size of 3.26 persons per family. On the other hand, single male/father families (540 | 5.9%) represent the smallest median family size with 2.45 persons per family.
| Family Type | # Families | Family Size |
| Married-Couple | 7,387 (80.7%) | 3.26 |
| Single Male/Father | 540 (5.9%) | 2.45 |
| Single Female/Mother | 1,221 (13.4%) | 2.86 |
| Total Families | 9,148 (100.0%) | 3.16 |
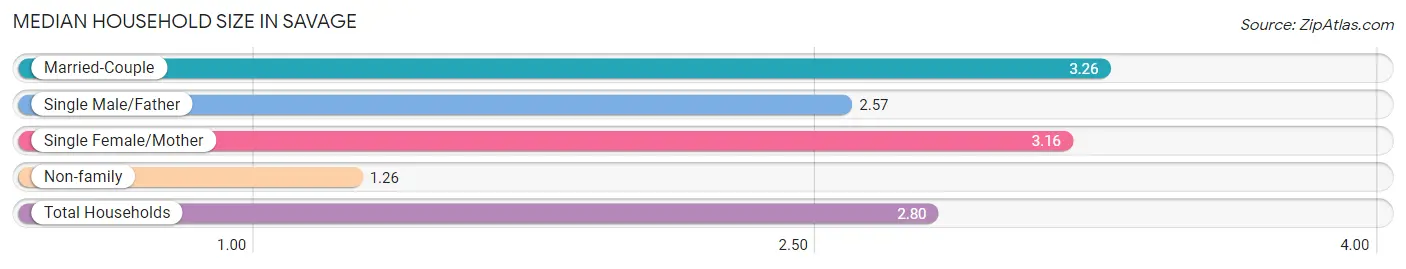
Median Household Size in Savage
The median household size in Savage is 2.80 persons per household, with married-couple households (7,387 | 63.8%) accounting for the largest median household size of 3.26 persons per household. non-family households (2,434 | 21.0%) represent the smallest median household size with 1.26 persons per household.
| Household Type | # Households | Household Size |
| Married-Couple | 7,387 (63.8%) | 3.26 |
| Single Male/Father | 540 (4.7%) | 2.57 |
| Single Female/Mother | 1,221 (10.5%) | 3.16 |
| Non-family | 2,434 (21.0%) | 1.26 |
| Total Households | 11,582 (100.0%) | 2.80 |
Household Size by Marriage Status in Savage
Out of a total of 11,582 households in Savage, 9,148 (79.0%) are family households, while 2,434 (21.0%) are nonfamily households. The most numerous type of family households are 2-person households, comprising 3,542, and the most common type of nonfamily households are 1-person households, comprising 1,790.
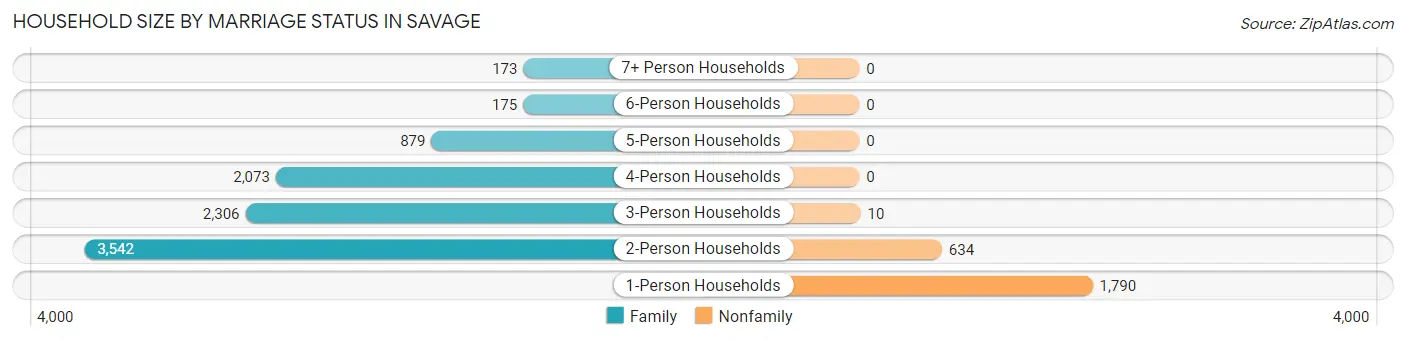
| Household Size | Family Households | Nonfamily Households |
| 1-Person Households | - | 1,790 (15.5%) |
| 2-Person Households | 3,542 (30.6%) | 634 (5.5%) |
| 3-Person Households | 2,306 (19.9%) | 10 (0.1%) |
| 4-Person Households | 2,073 (17.9%) | 0 (0.0%) |
| 5-Person Households | 879 (7.6%) | 0 (0.0%) |
| 6-Person Households | 175 (1.5%) | 0 (0.0%) |
| 7+ Person Households | 173 (1.5%) | 0 (0.0%) |
| Total | 9,148 (79.0%) | 2,434 (21.0%) |
Female Fertility in Savage
Fertility by Age in Savage
Average fertility rate in Savage is 42.0 births per 1,000 women. Women in the age bracket of 20 to 34 years have the highest fertility rate with 82.0 births per 1,000 women. Women in the age bracket of 20 to 34 years acount for 70.5% of all women with births.
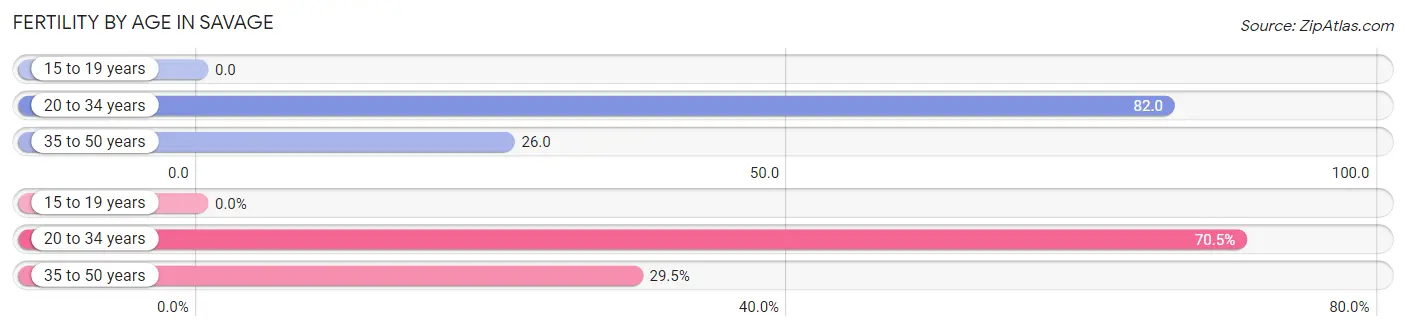
| Age Bracket | Women with Births | Births / 1,000 Women |
| 15 to 19 years | 0 (0.0%) | 0.0 |
| 20 to 34 years | 220 (70.5%) | 82.0 |
| 35 to 50 years | 92 (29.5%) | 26.0 |
| Total | 312 (100.0%) | 42.0 |
Fertility by Age by Marriage Status in Savage
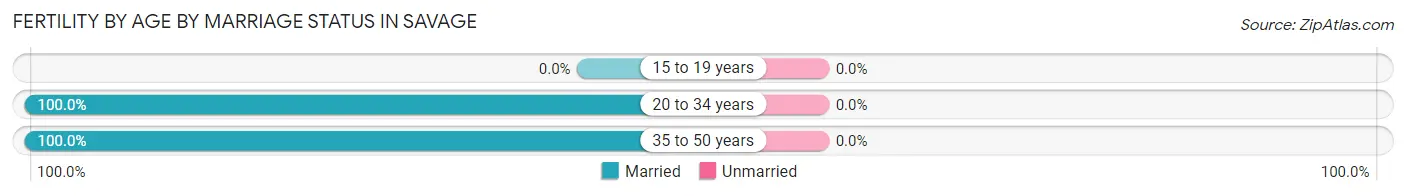
| Age Bracket | Married | Unmarried |
| 15 to 19 years | 0 (0.0%) | 0 (0.0%) |
| 20 to 34 years | 220 (100.0%) | 0 (0.0%) |
| 35 to 50 years | 92 (100.0%) | 0 (0.0%) |
| Total | 312 (100.0%) | 0 (0.0%) |
Fertility by Education in Savage
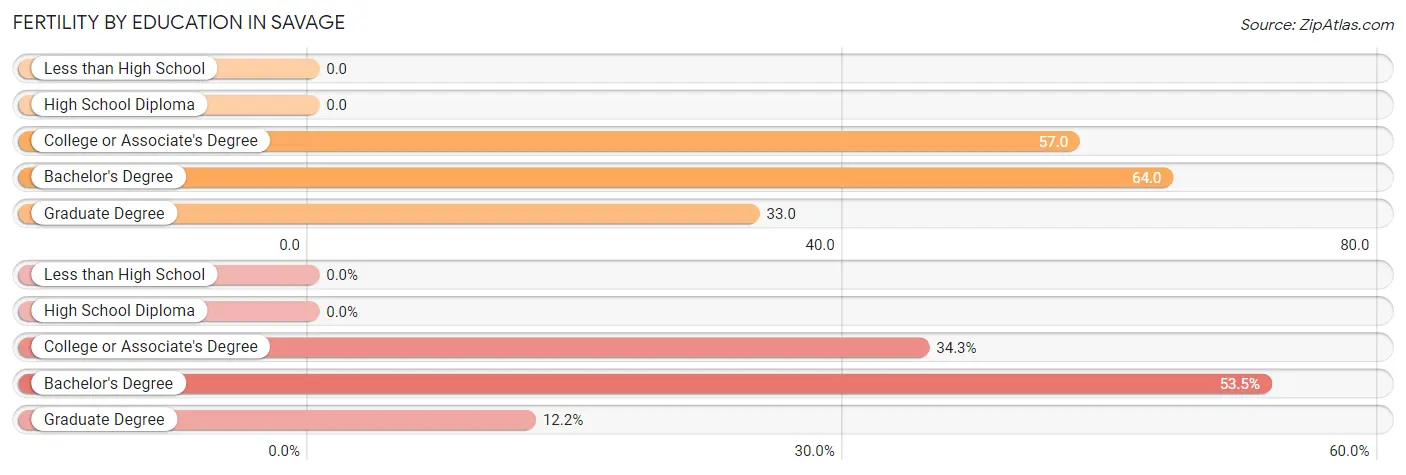
| Educational Attainment | Women with Births | Births / 1,000 Women |
| Less than High School | 0 (0.0%) | 0.0 |
| High School Diploma | 0 (0.0%) | 0.0 |
| College or Associate's Degree | 107 (34.3%) | 57.0 |
| Bachelor's Degree | 167 (53.5%) | 64.0 |
| Graduate Degree | 38 (12.2%) | 33.0 |
| Total | 312 (100.0%) | 42.0 |
Fertility by Education by Marriage Status in Savage
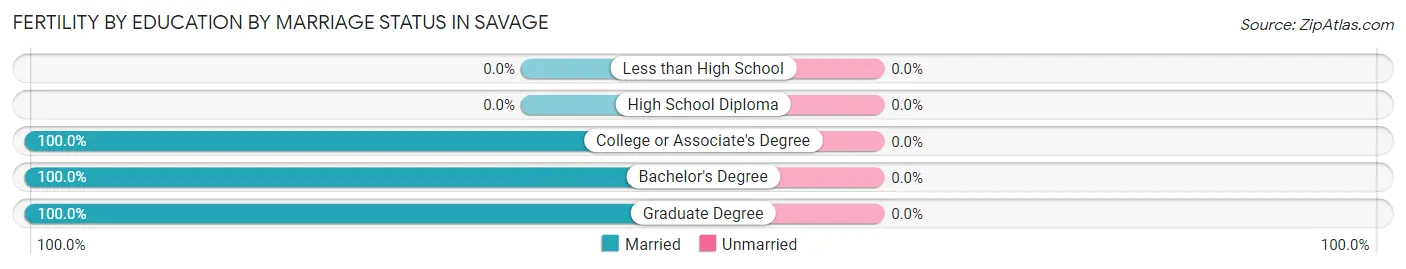
| Educational Attainment | Married | Unmarried |
| Less than High School | 0 (0.0%) | 0 (0.0%) |
| High School Diploma | 0 (0.0%) | 0 (0.0%) |
| College or Associate's Degree | 107 (100.0%) | 0 (0.0%) |
| Bachelor's Degree | 167 (100.0%) | 0 (0.0%) |
| Graduate Degree | 38 (100.0%) | 0 (0.0%) |
| Total | 312 (100.0%) | 0 (0.0%) |
Employment Characteristics in Savage
Employment by Class of Employer in Savage
Among the 18,337 employed individuals in Savage, private company employees (13,339 | 72.7%), not-for-profit organizations (1,585 | 8.6%), and local government employees (1,087 | 5.9%) make up the most common classes of employment.
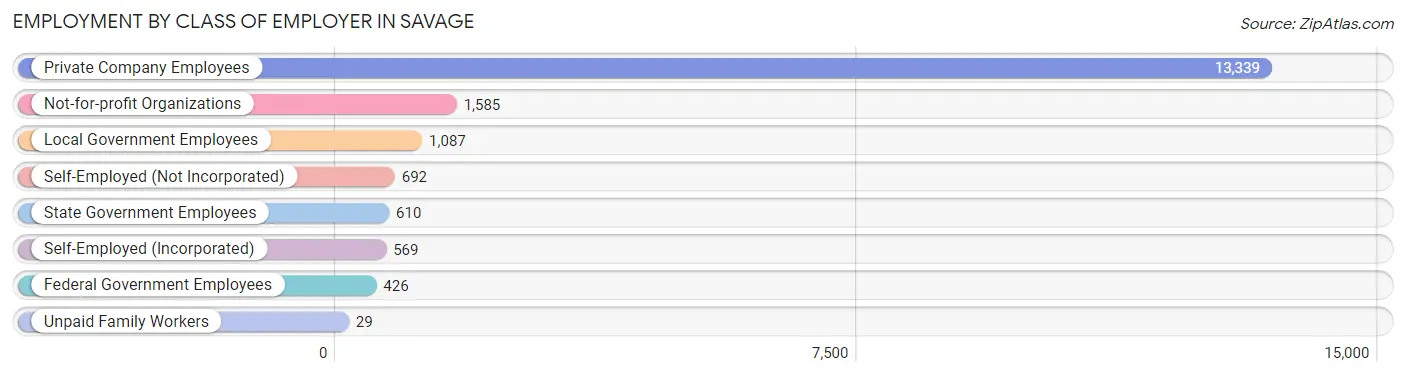
| Employer Class | # Employees | % Employees |
| Private Company Employees | 13,339 | 72.7% |
| Self-Employed (Incorporated) | 569 | 3.1% |
| Self-Employed (Not Incorporated) | 692 | 3.8% |
| Not-for-profit Organizations | 1,585 | 8.6% |
| Local Government Employees | 1,087 | 5.9% |
| State Government Employees | 610 | 3.3% |
| Federal Government Employees | 426 | 2.3% |
| Unpaid Family Workers | 29 | 0.2% |
| Total | 18,337 | 100.0% |
Employment Status by Age in Savage
According to the labor force statistics for Savage, out of the total population over 16 years of age (25,370), 76.5% or 19,408 individuals are in the labor force, with 3.9% or 757 of them unemployed. The age group with the highest labor force participation rate is 20 to 24 years, with 92.8% or 1,529 individuals in the labor force. Within the labor force, the 16 to 19 years age range has the highest percentage of unemployed individuals, with 14.9% or 159 of them being unemployed.
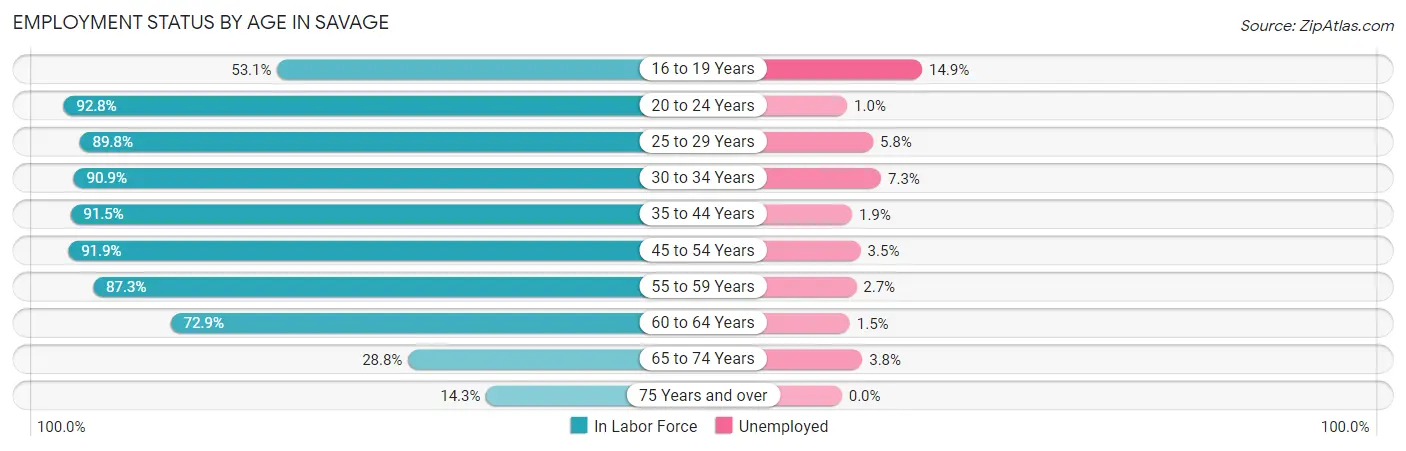
| Age Bracket | In Labor Force | Unemployed |
| 16 to 19 Years | 1,065 (53.1%) | 159 (14.9%) |
| 20 to 24 Years | 1,529 (92.8%) | 15 (1.0%) |
| 25 to 29 Years | 1,572 (89.8%) | 91 (5.8%) |
| 30 to 34 Years | 2,164 (90.9%) | 158 (7.3%) |
| 35 to 44 Years | 4,444 (91.5%) | 84 (1.9%) |
| 45 to 54 Years | 4,282 (91.9%) | 150 (3.5%) |
| 55 to 59 Years | 2,079 (87.3%) | 56 (2.7%) |
| 60 to 64 Years | 1,358 (72.9%) | 20 (1.5%) |
| 65 to 74 Years | 746 (28.8%) | 28 (3.8%) |
| 75 Years and over | 177 (14.3%) | 0 (0.0%) |
| Total | 19,408 (76.5%) | 757 (3.9%) |
Employment Status by Educational Attainment in Savage
According to labor force statistics for Savage, 88.9% of individuals (15,905) out of the total population between 25 and 64 years of age (17,891) are in the labor force, with 3.5% or 557 of them being unemployed. The group with the highest labor force participation rate are those with the educational attainment of bachelor's degree or higher, with 92.2% or 9,298 individuals in the labor force. Within the labor force, individuals with less than high school education have the highest percentage of unemployment, with 18.6% or 77 of them being unemployed.
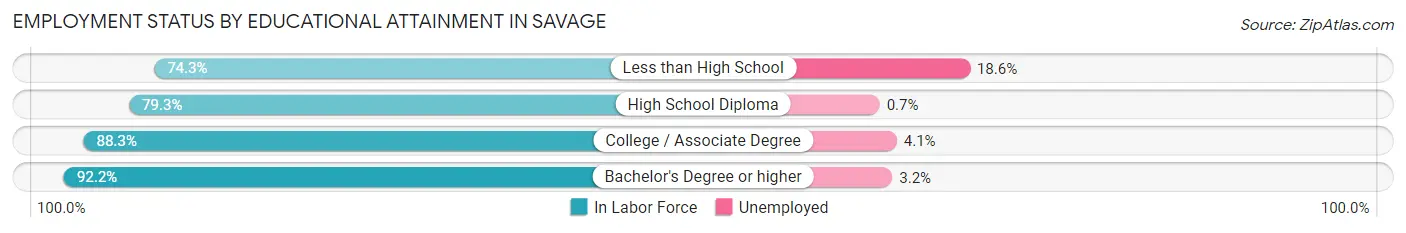
| Educational Attainment | In Labor Force | Unemployed |
| Less than High School | 413 (74.3%) | 103 (18.6%) |
| High School Diploma | 1,912 (79.3%) | 17 (0.7%) |
| College / Associate Degree | 4,273 (88.3%) | 198 (4.1%) |
| Bachelor's Degree or higher | 9,298 (92.2%) | 323 (3.2%) |
| Total | 15,905 (88.9%) | 626 (3.5%) |
Employment Occupations by Sex in Savage
Management, Business, Science and Arts Occupations
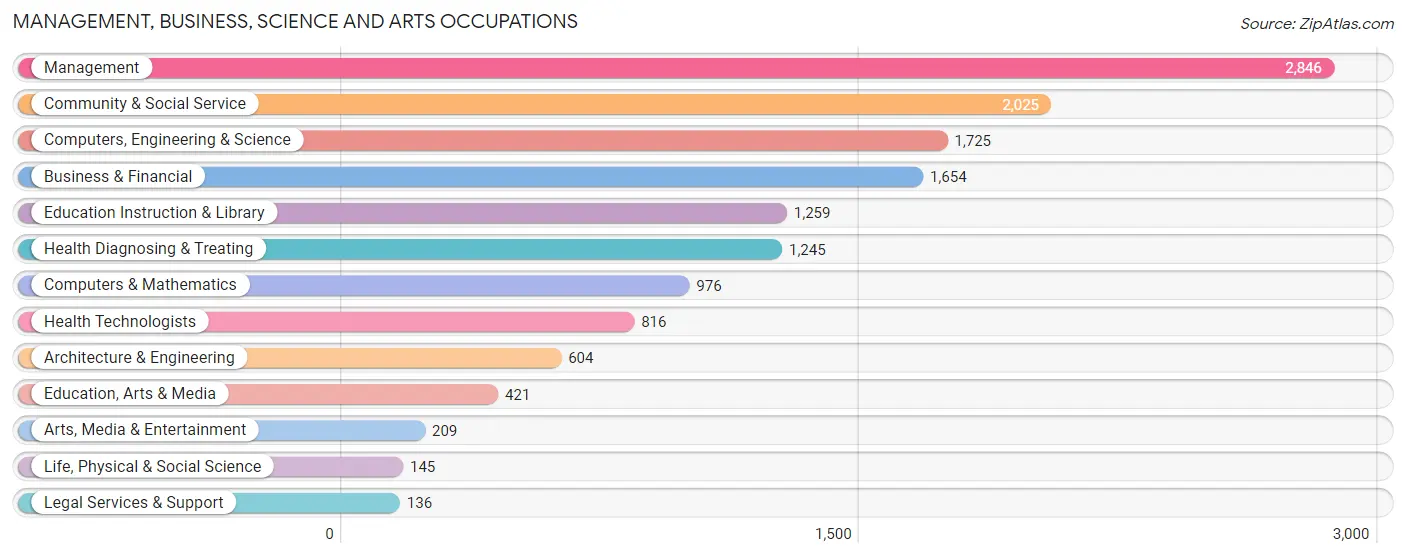
The most common Management, Business, Science and Arts occupations in Savage are Management (2,846 | 15.3%), Community & Social Service (2,025 | 10.9%), Computers, Engineering & Science (1,725 | 9.3%), Business & Financial (1,654 | 8.9%), and Education Instruction & Library (1,259 | 6.8%).
Management, Business, Science and Arts Occupations by Sex
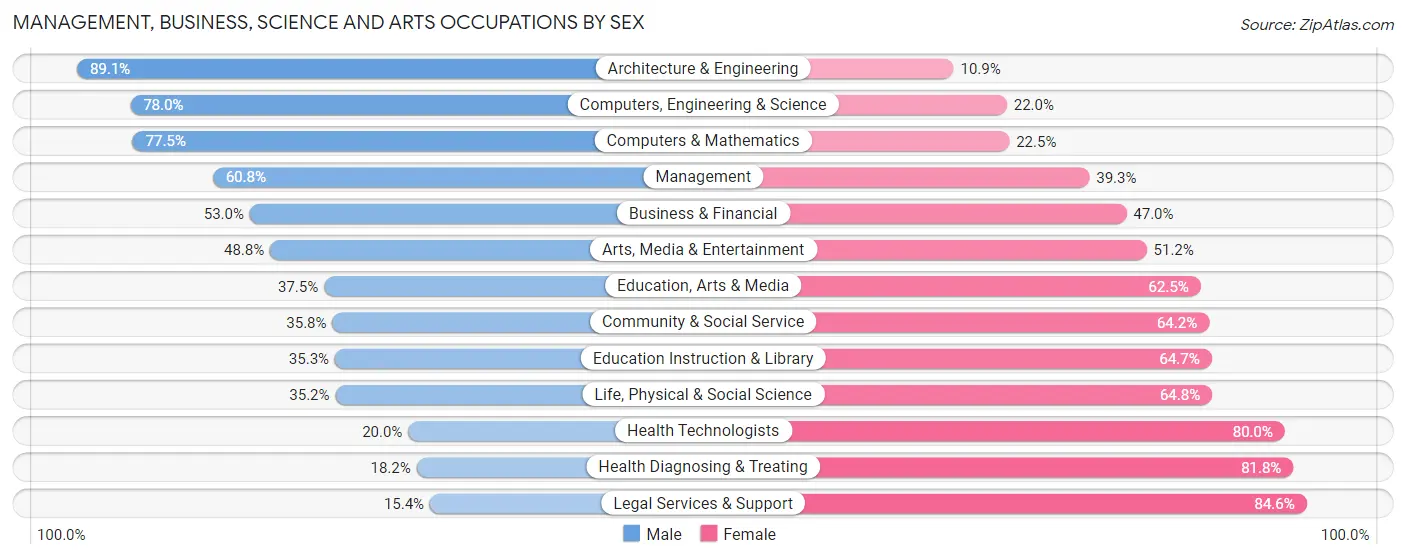
Within the Management, Business, Science and Arts occupations in Savage, the most male-oriented occupations are Architecture & Engineering (89.1%), Computers, Engineering & Science (78.0%), and Computers & Mathematics (77.5%), while the most female-oriented occupations are Legal Services & Support (84.6%), Health Diagnosing & Treating (81.8%), and Health Technologists (80.0%).
| Occupation | Male | Female |
| Management | 1,729 (60.8%) | 1,117 (39.3%) |
| Business & Financial | 877 (53.0%) | 777 (47.0%) |
| Computers, Engineering & Science | 1,345 (78.0%) | 380 (22.0%) |
| Computers & Mathematics | 756 (77.5%) | 220 (22.5%) |
| Architecture & Engineering | 538 (89.1%) | 66 (10.9%) |
| Life, Physical & Social Science | 51 (35.2%) | 94 (64.8%) |
| Community & Social Service | 725 (35.8%) | 1,300 (64.2%) |
| Education, Arts & Media | 158 (37.5%) | 263 (62.5%) |
| Legal Services & Support | 21 (15.4%) | 115 (84.6%) |
| Education Instruction & Library | 444 (35.3%) | 815 (64.7%) |
| Arts, Media & Entertainment | 102 (48.8%) | 107 (51.2%) |
| Health Diagnosing & Treating | 227 (18.2%) | 1,018 (81.8%) |
| Health Technologists | 163 (20.0%) | 653 (80.0%) |
| Total (Category) | 4,903 (51.6%) | 4,592 (48.4%) |
| Total (Overall) | 10,181 (54.6%) | 8,450 (45.4%) |
Services Occupations
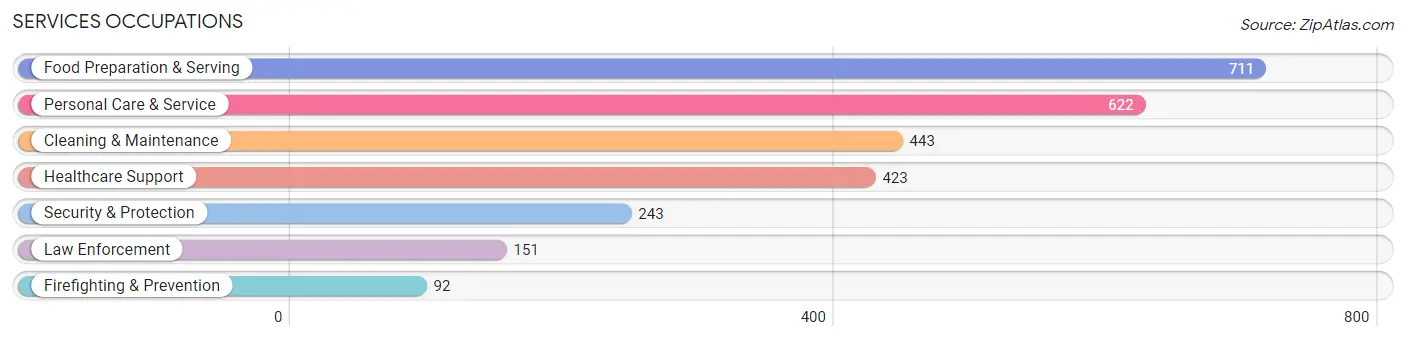
The most common Services occupations in Savage are Food Preparation & Serving (711 | 3.8%), Personal Care & Service (622 | 3.3%), Cleaning & Maintenance (443 | 2.4%), Healthcare Support (423 | 2.3%), and Security & Protection (243 | 1.3%).
Services Occupations by Sex
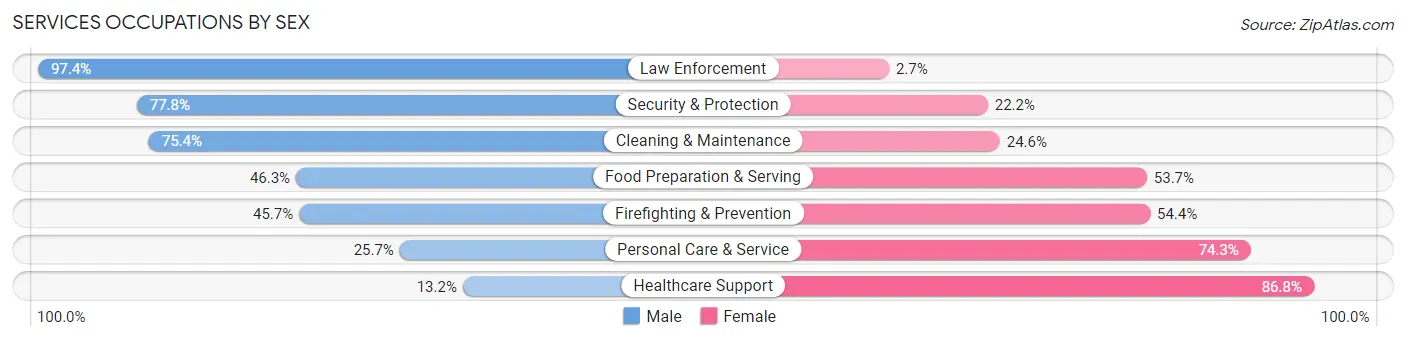
Within the Services occupations in Savage, the most male-oriented occupations are Law Enforcement (97.4%), Security & Protection (77.8%), and Cleaning & Maintenance (75.4%), while the most female-oriented occupations are Healthcare Support (86.8%), Personal Care & Service (74.3%), and Firefighting & Prevention (54.3%).
| Occupation | Male | Female |
| Healthcare Support | 56 (13.2%) | 367 (86.8%) |
| Security & Protection | 189 (77.8%) | 54 (22.2%) |
| Firefighting & Prevention | 42 (45.7%) | 50 (54.3%) |
| Law Enforcement | 147 (97.4%) | 4 (2.6%) |
| Food Preparation & Serving | 329 (46.3%) | 382 (53.7%) |
| Cleaning & Maintenance | 334 (75.4%) | 109 (24.6%) |
| Personal Care & Service | 160 (25.7%) | 462 (74.3%) |
| Total (Category) | 1,068 (43.7%) | 1,374 (56.3%) |
| Total (Overall) | 10,181 (54.6%) | 8,450 (45.4%) |
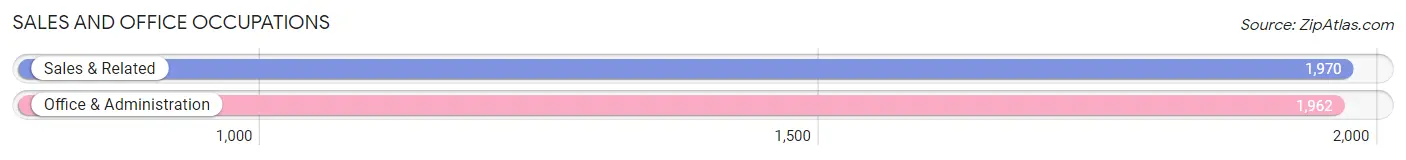
Sales and Office Occupations
The most common Sales and Office occupations in Savage are Sales & Related (1,970 | 10.6%), and Office & Administration (1,962 | 10.5%).
Sales and Office Occupations by Sex
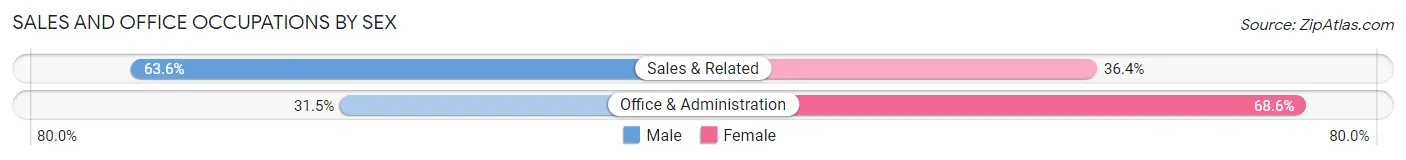
| Occupation | Male | Female |
| Sales & Related | 1,253 (63.6%) | 717 (36.4%) |
| Office & Administration | 617 (31.5%) | 1,345 (68.5%) |
| Total (Category) | 1,870 (47.6%) | 2,062 (52.4%) |
| Total (Overall) | 10,181 (54.6%) | 8,450 (45.4%) |
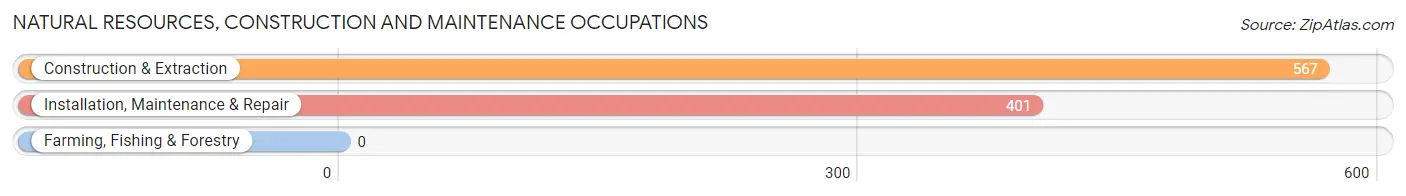
Natural Resources, Construction and Maintenance Occupations
The most common Natural Resources, Construction and Maintenance occupations in Savage are Construction & Extraction (567 | 3.0%), and Installation, Maintenance & Repair (401 | 2.1%).
Natural Resources, Construction and Maintenance Occupations by Sex
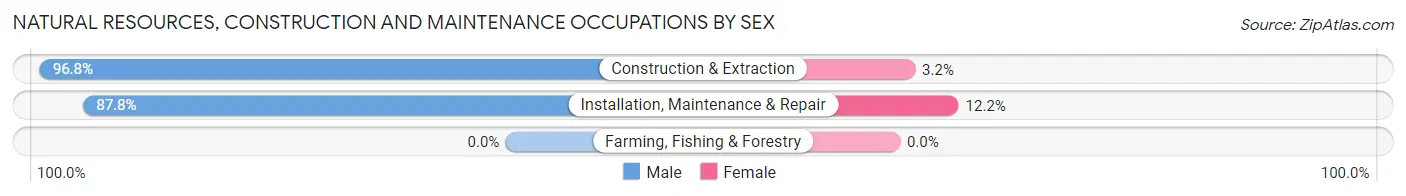
| Occupation | Male | Female |
| Farming, Fishing & Forestry | 0 (0.0%) | 0 (0.0%) |
| Construction & Extraction | 549 (96.8%) | 18 (3.2%) |
| Installation, Maintenance & Repair | 352 (87.8%) | 49 (12.2%) |
| Total (Category) | 901 (93.1%) | 67 (6.9%) |
| Total (Overall) | 10,181 (54.6%) | 8,450 (45.4%) |
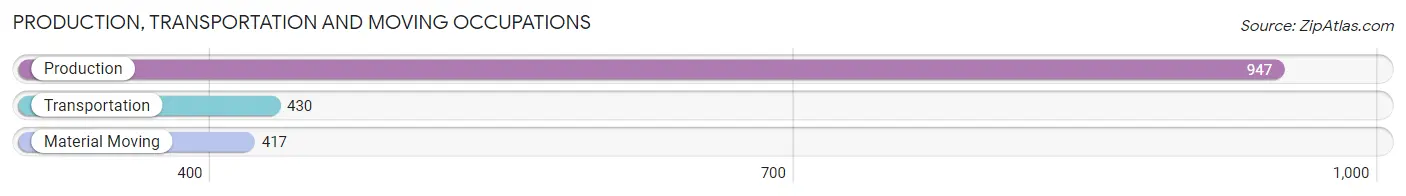
Production, Transportation and Moving Occupations
The most common Production, Transportation and Moving occupations in Savage are Production (947 | 5.1%), Transportation (430 | 2.3%), and Material Moving (417 | 2.2%).
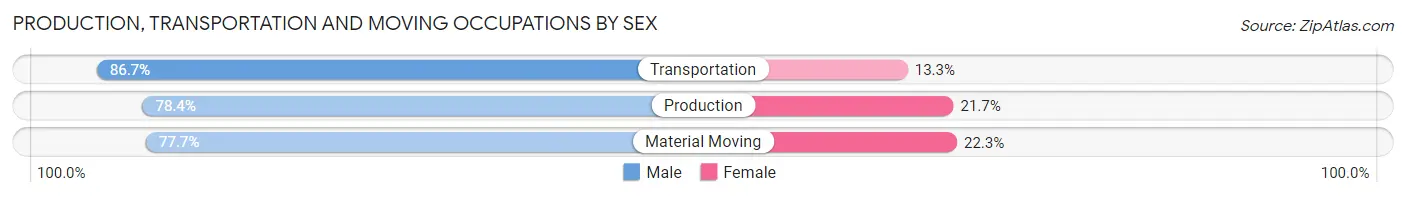
Production, Transportation and Moving Occupations by Sex
| Occupation | Male | Female |
| Production | 742 (78.3%) | 205 (21.6%) |
| Transportation | 373 (86.7%) | 57 (13.3%) |
| Material Moving | 324 (77.7%) | 93 (22.3%) |
| Total (Category) | 1,439 (80.2%) | 355 (19.8%) |
| Total (Overall) | 10,181 (54.6%) | 8,450 (45.4%) |
Employment Industries by Sex in Savage
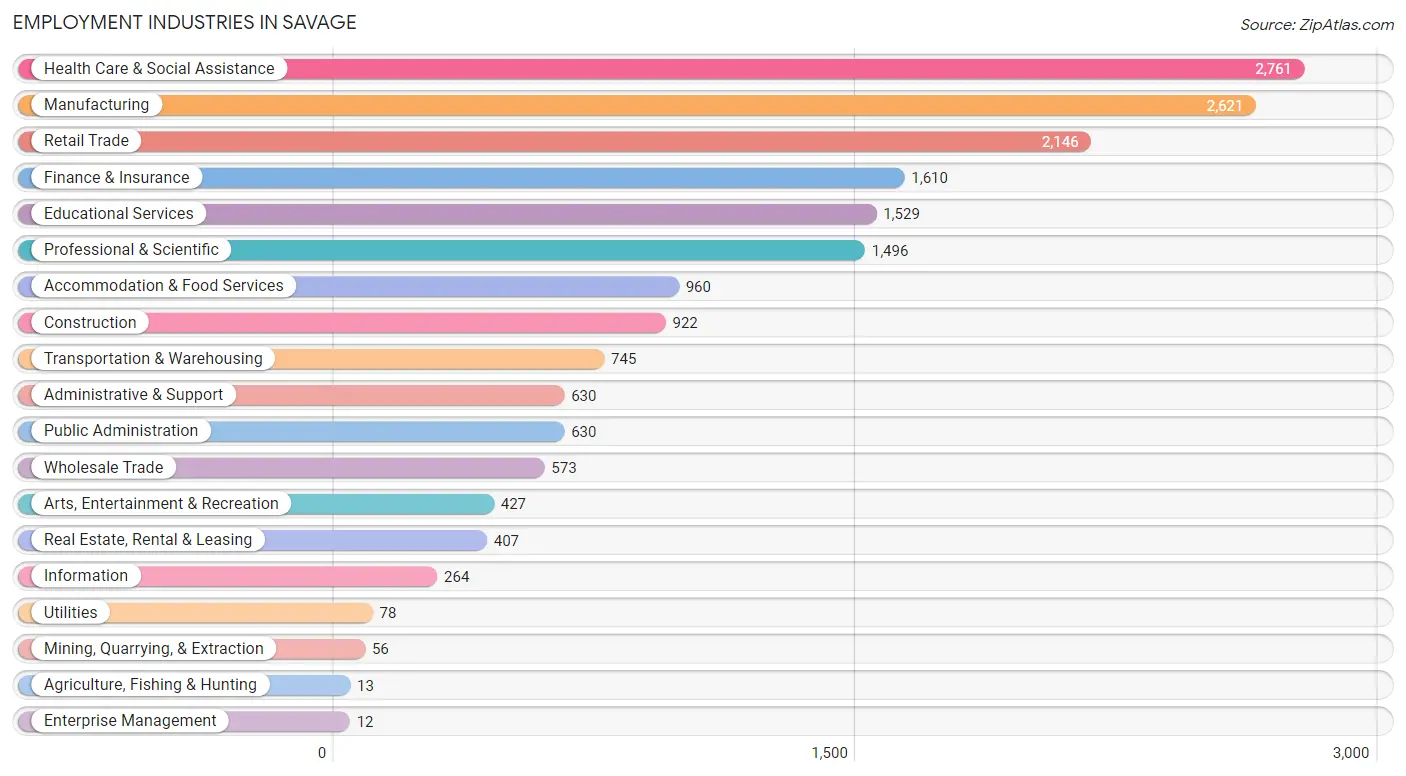
Employment Industries in Savage
The major employment industries in Savage include Health Care & Social Assistance (2,761 | 14.8%), Manufacturing (2,621 | 14.1%), Retail Trade (2,146 | 11.5%), Finance & Insurance (1,610 | 8.6%), and Educational Services (1,529 | 8.2%).
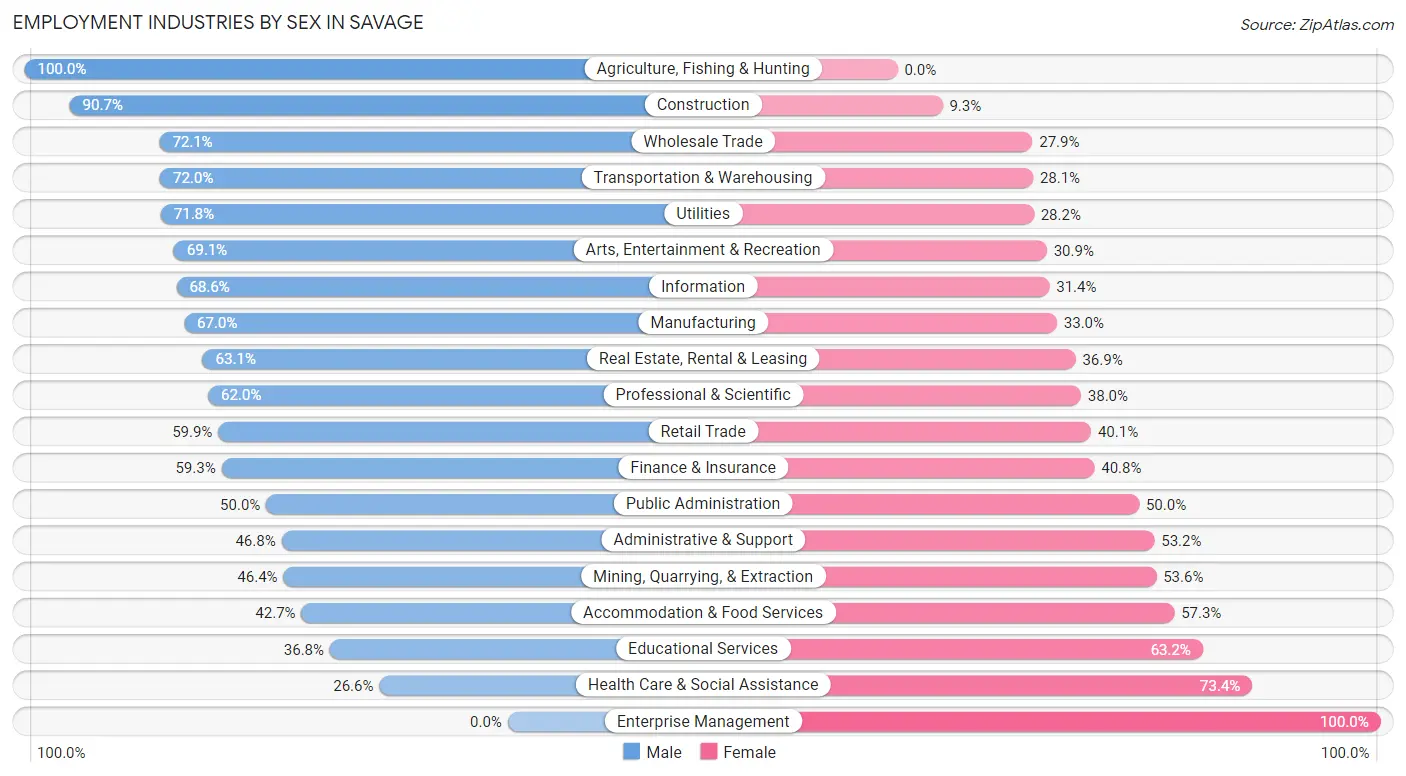
Employment Industries by Sex in Savage
The Savage industries that see more men than women are Agriculture, Fishing & Hunting (100.0%), Construction (90.7%), and Wholesale Trade (72.1%), whereas the industries that tend to have a higher number of women are Enterprise Management (100.0%), Health Care & Social Assistance (73.4%), and Educational Services (63.2%).
| Industry | Male | Female |
| Agriculture, Fishing & Hunting | 13 (100.0%) | 0 (0.0%) |
| Mining, Quarrying, & Extraction | 26 (46.4%) | 30 (53.6%) |
| Construction | 836 (90.7%) | 86 (9.3%) |
| Manufacturing | 1,756 (67.0%) | 865 (33.0%) |
| Wholesale Trade | 413 (72.1%) | 160 (27.9%) |
| Retail Trade | 1,286 (59.9%) | 860 (40.1%) |
| Transportation & Warehousing | 536 (72.0%) | 209 (28.1%) |
| Utilities | 56 (71.8%) | 22 (28.2%) |
| Information | 181 (68.6%) | 83 (31.4%) |
| Finance & Insurance | 954 (59.3%) | 656 (40.7%) |
| Real Estate, Rental & Leasing | 257 (63.1%) | 150 (36.9%) |
| Professional & Scientific | 928 (62.0%) | 568 (38.0%) |
| Enterprise Management | 0 (0.0%) | 12 (100.0%) |
| Administrative & Support | 295 (46.8%) | 335 (53.2%) |
| Educational Services | 563 (36.8%) | 966 (63.2%) |
| Health Care & Social Assistance | 734 (26.6%) | 2,027 (73.4%) |
| Arts, Entertainment & Recreation | 295 (69.1%) | 132 (30.9%) |
| Accommodation & Food Services | 410 (42.7%) | 550 (57.3%) |
| Public Administration | 315 (50.0%) | 315 (50.0%) |
| Total | 10,181 (54.6%) | 8,450 (45.4%) |
Education in Savage
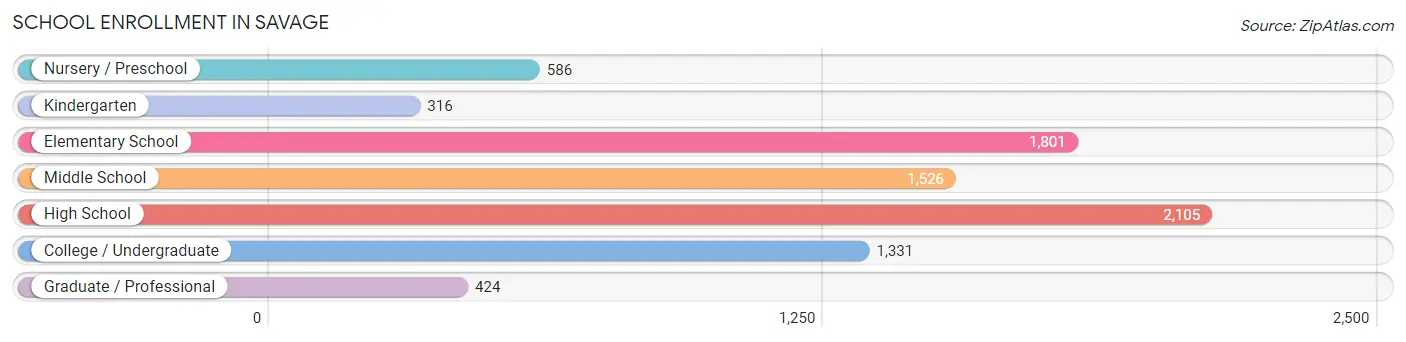
School Enrollment in Savage
The most common levels of schooling among the 8,089 students in Savage are high school (2,105 | 26.0%), elementary school (1,801 | 22.3%), and middle school (1,526 | 18.9%).
| School Level | # Students | % Students |
| Nursery / Preschool | 586 | 7.2% |
| Kindergarten | 316 | 3.9% |
| Elementary School | 1,801 | 22.3% |
| Middle School | 1,526 | 18.9% |
| High School | 2,105 | 26.0% |
| College / Undergraduate | 1,331 | 16.5% |
| Graduate / Professional | 424 | 5.2% |
| Total | 8,089 | 100.0% |
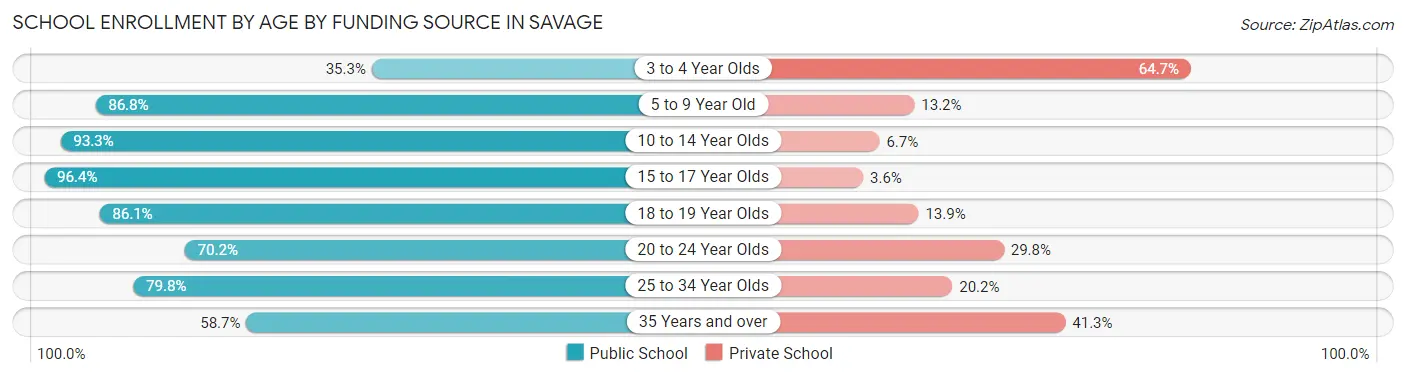
School Enrollment by Age by Funding Source in Savage
Out of a total of 8,089 students who are enrolled in schools in Savage, 1,230 (15.2%) attend a private institution, while the remaining 6,859 (84.8%) are enrolled in public schools. The age group of 3 to 4 year olds has the highest likelihood of being enrolled in private schools, with 225 (64.7% in the age bracket) enrolled. Conversely, the age group of 15 to 17 year olds has the lowest likelihood of being enrolled in a private school, with 1,653 (96.4% in the age bracket) attending a public institution.
| Age Bracket | Public School | Private School |
| 3 to 4 Year Olds | 123 (35.3%) | 225 (64.7%) |
| 5 to 9 Year Old | 1,898 (86.8%) | 288 (13.2%) |
| 10 to 14 Year Olds | 1,666 (93.3%) | 119 (6.7%) |
| 15 to 17 Year Olds | 1,653 (96.4%) | 62 (3.6%) |
| 18 to 19 Year Olds | 562 (86.1%) | 91 (13.9%) |
| 20 to 24 Year Olds | 506 (70.2%) | 215 (29.8%) |
| 25 to 34 Year Olds | 209 (79.8%) | 53 (20.2%) |
| 35 Years and over | 246 (58.7%) | 173 (41.3%) |
| Total | 6,859 (84.8%) | 1,230 (15.2%) |
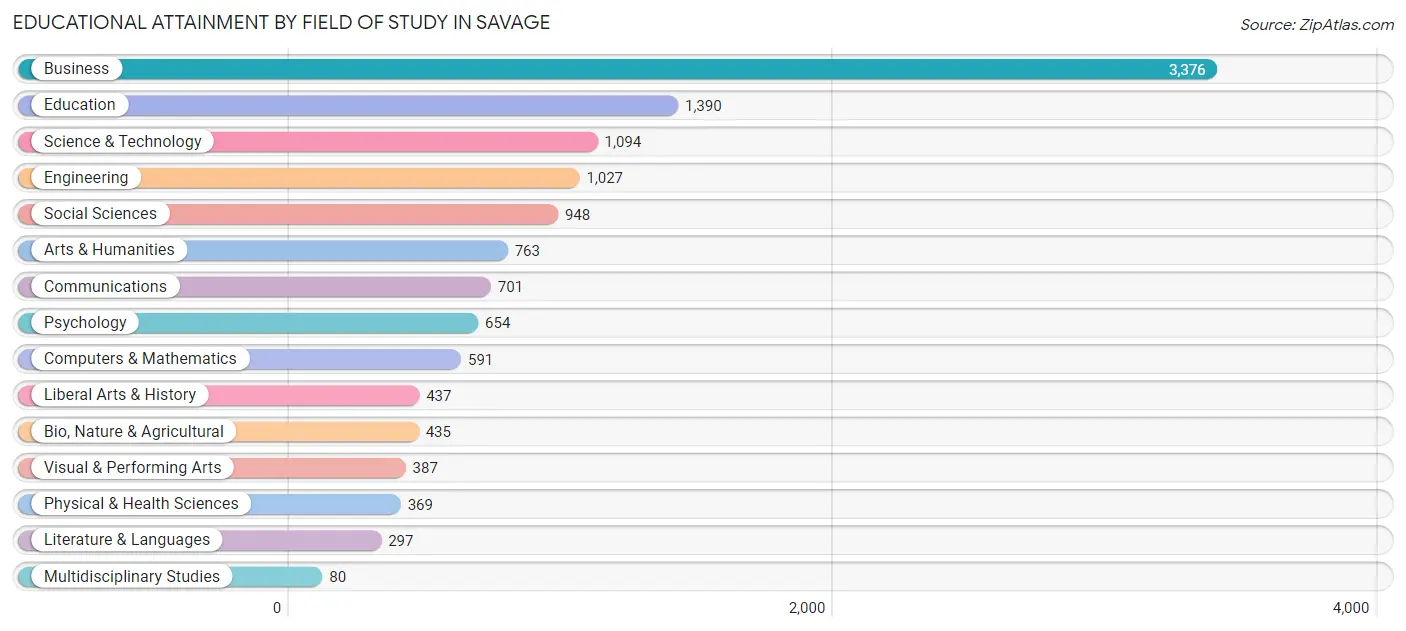
Educational Attainment by Field of Study in Savage
Business (3,376 | 26.9%), education (1,390 | 11.1%), science & technology (1,094 | 8.7%), engineering (1,027 | 8.2%), and social sciences (948 | 7.5%) are the most common fields of study among 12,549 individuals in Savage who have obtained a bachelor's degree or higher.
| Field of Study | # Graduates | % Graduates |
| Computers & Mathematics | 591 | 4.7% |
| Bio, Nature & Agricultural | 435 | 3.5% |
| Physical & Health Sciences | 369 | 2.9% |
| Psychology | 654 | 5.2% |
| Social Sciences | 948 | 7.5% |
| Engineering | 1,027 | 8.2% |
| Multidisciplinary Studies | 80 | 0.6% |
| Science & Technology | 1,094 | 8.7% |
| Business | 3,376 | 26.9% |
| Education | 1,390 | 11.1% |
| Literature & Languages | 297 | 2.4% |
| Liberal Arts & History | 437 | 3.5% |
| Visual & Performing Arts | 387 | 3.1% |
| Communications | 701 | 5.6% |
| Arts & Humanities | 763 | 6.1% |
| Total | 12,549 | 100.0% |
Transportation & Commute in Savage
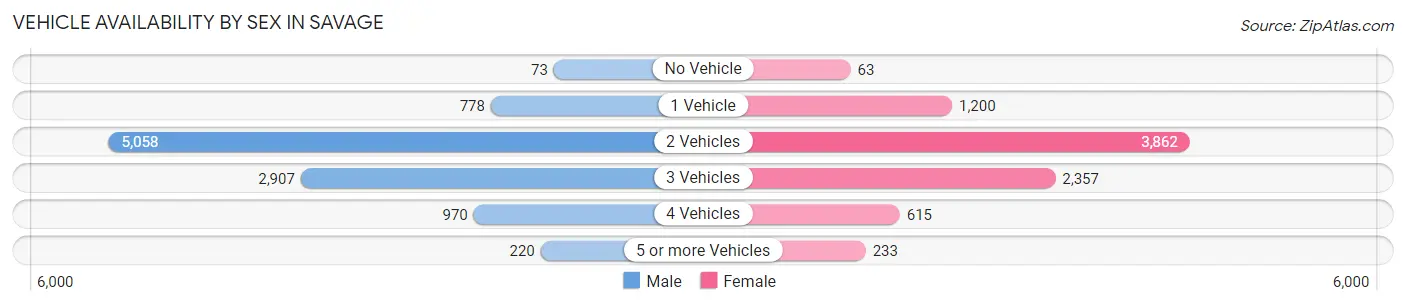
Vehicle Availability by Sex in Savage
The most prevalent vehicle ownership categories in Savage are males with 2 vehicles (5,058, accounting for 50.5%) and females with 2 vehicles (3,862, making up 60.7%).
| Vehicles Available | Male | Female |
| No Vehicle | 73 (0.7%) | 63 (0.8%) |
| 1 Vehicle | 778 (7.8%) | 1,200 (14.4%) |
| 2 Vehicles | 5,058 (50.5%) | 3,862 (46.4%) |
| 3 Vehicles | 2,907 (29.0%) | 2,357 (28.3%) |
| 4 Vehicles | 970 (9.7%) | 615 (7.4%) |
| 5 or more Vehicles | 220 (2.2%) | 233 (2.8%) |
| Total | 10,006 (100.0%) | 8,330 (100.0%) |
Commute Time in Savage
The most frequently occuring commute durations in Savage are 30 to 34 minutes (2,803 commuters, 18.4%), 20 to 24 minutes (2,383 commuters, 15.7%), and 15 to 19 minutes (2,288 commuters, 15.0%).
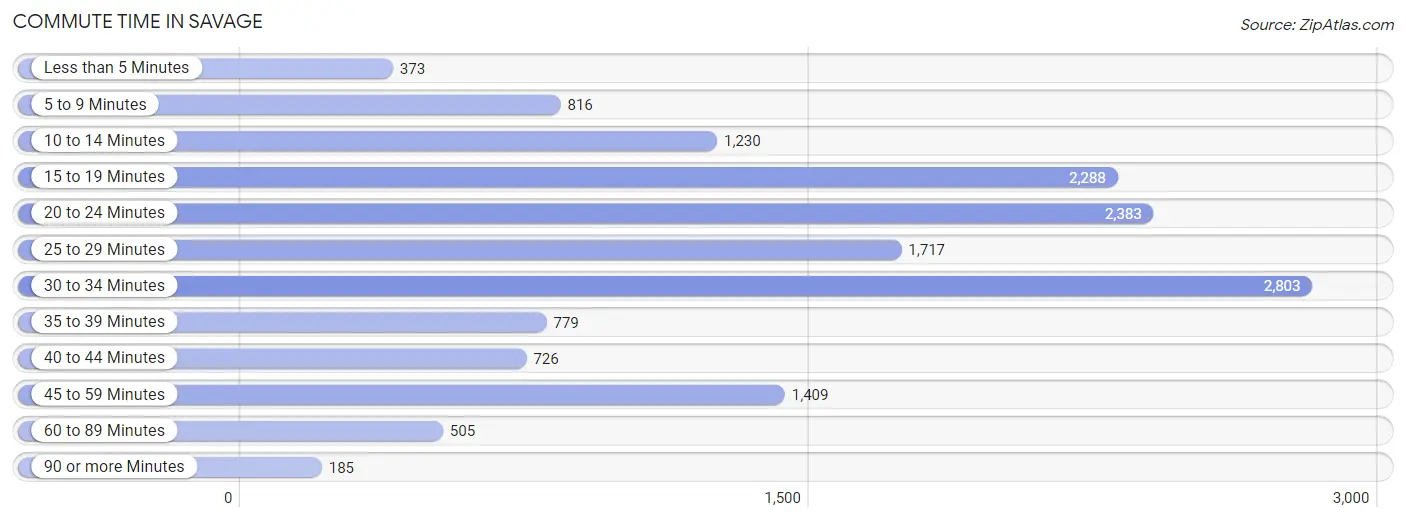
| Commute Time | # Commuters | % Commuters |
| Less than 5 Minutes | 373 | 2.5% |
| 5 to 9 Minutes | 816 | 5.4% |
| 10 to 14 Minutes | 1,230 | 8.1% |
| 15 to 19 Minutes | 2,288 | 15.0% |
| 20 to 24 Minutes | 2,383 | 15.7% |
| 25 to 29 Minutes | 1,717 | 11.3% |
| 30 to 34 Minutes | 2,803 | 18.4% |
| 35 to 39 Minutes | 779 | 5.1% |
| 40 to 44 Minutes | 726 | 4.8% |
| 45 to 59 Minutes | 1,409 | 9.3% |
| 60 to 89 Minutes | 505 | 3.3% |
| 90 or more Minutes | 185 | 1.2% |
Commute Time by Sex in Savage
The most common commute times in Savage are 30 to 34 minutes (1,585 commuters, 18.9%) for males and 15 to 19 minutes (1,225 commuters, 18.0%) for females.
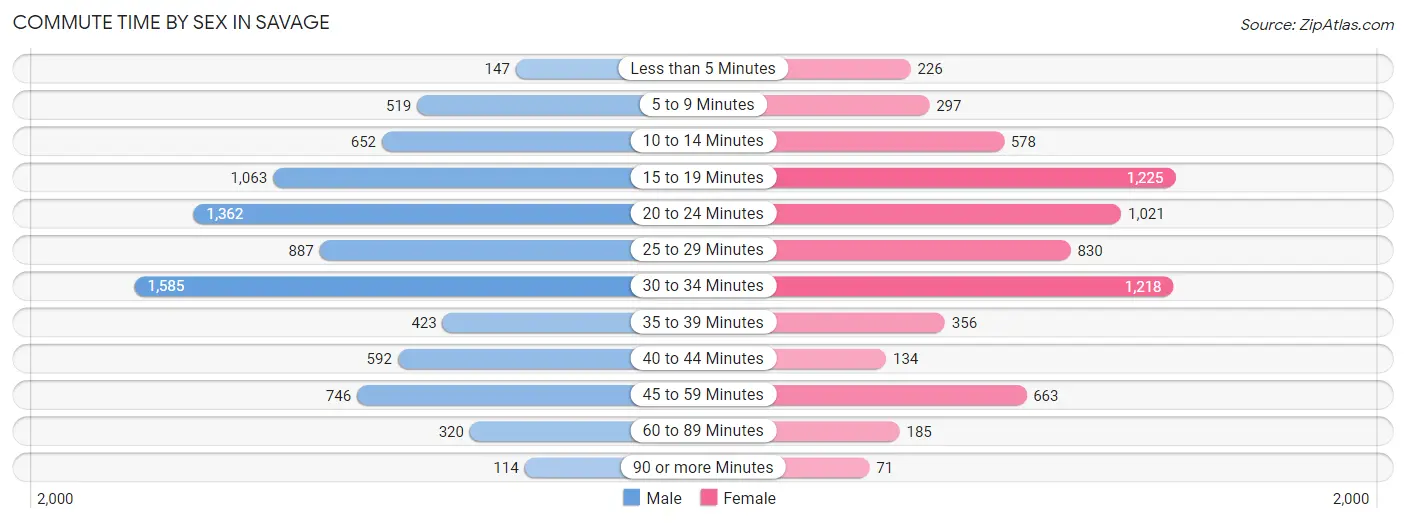
| Commute Time | Male | Female |
| Less than 5 Minutes | 147 (1.8%) | 226 (3.3%) |
| 5 to 9 Minutes | 519 (6.2%) | 297 (4.4%) |
| 10 to 14 Minutes | 652 (7.7%) | 578 (8.5%) |
| 15 to 19 Minutes | 1,063 (12.6%) | 1,225 (18.0%) |
| 20 to 24 Minutes | 1,362 (16.2%) | 1,021 (15.0%) |
| 25 to 29 Minutes | 887 (10.5%) | 830 (12.2%) |
| 30 to 34 Minutes | 1,585 (18.9%) | 1,218 (17.9%) |
| 35 to 39 Minutes | 423 (5.0%) | 356 (5.2%) |
| 40 to 44 Minutes | 592 (7.0%) | 134 (2.0%) |
| 45 to 59 Minutes | 746 (8.9%) | 663 (9.7%) |
| 60 to 89 Minutes | 320 (3.8%) | 185 (2.7%) |
| 90 or more Minutes | 114 (1.4%) | 71 (1.0%) |
Time of Departure to Work by Sex in Savage
The most frequent times of departure to work in Savage are 7:00 AM to 7:29 AM (1,330, 15.8%) for males and 7:30 AM to 7:59 AM (1,097, 16.1%) for females.
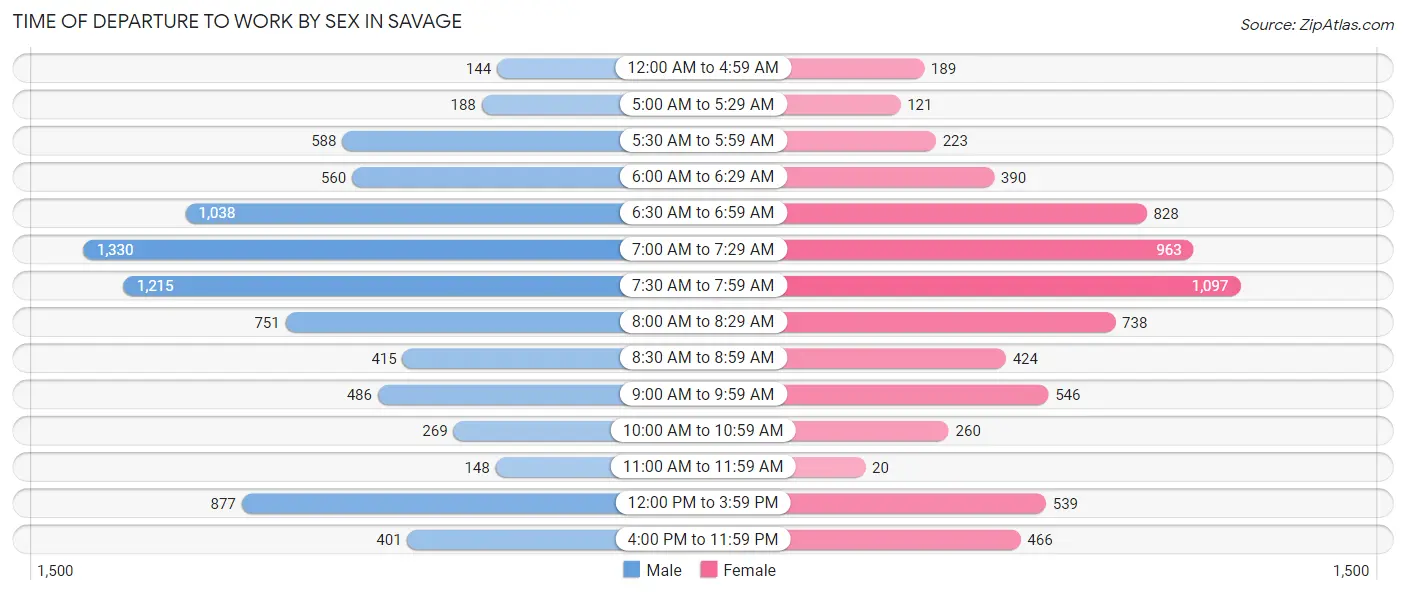
| Time of Departure | Male | Female |
| 12:00 AM to 4:59 AM | 144 (1.7%) | 189 (2.8%) |
| 5:00 AM to 5:29 AM | 188 (2.2%) | 121 (1.8%) |
| 5:30 AM to 5:59 AM | 588 (7.0%) | 223 (3.3%) |
| 6:00 AM to 6:29 AM | 560 (6.7%) | 390 (5.7%) |
| 6:30 AM to 6:59 AM | 1,038 (12.3%) | 828 (12.2%) |
| 7:00 AM to 7:29 AM | 1,330 (15.8%) | 963 (14.1%) |
| 7:30 AM to 7:59 AM | 1,215 (14.4%) | 1,097 (16.1%) |
| 8:00 AM to 8:29 AM | 751 (8.9%) | 738 (10.8%) |
| 8:30 AM to 8:59 AM | 415 (4.9%) | 424 (6.2%) |
| 9:00 AM to 9:59 AM | 486 (5.8%) | 546 (8.0%) |
| 10:00 AM to 10:59 AM | 269 (3.2%) | 260 (3.8%) |
| 11:00 AM to 11:59 AM | 148 (1.8%) | 20 (0.3%) |
| 12:00 PM to 3:59 PM | 877 (10.4%) | 539 (7.9%) |
| 4:00 PM to 11:59 PM | 401 (4.8%) | 466 (6.9%) |
| Total | 8,410 (100.0%) | 6,804 (100.0%) |
Housing Occupancy in Savage
Occupancy by Ownership in Savage
Of the total 11,582 dwellings in Savage, owner-occupied units account for 9,926 (85.7%), while renter-occupied units make up 1,656 (14.3%).
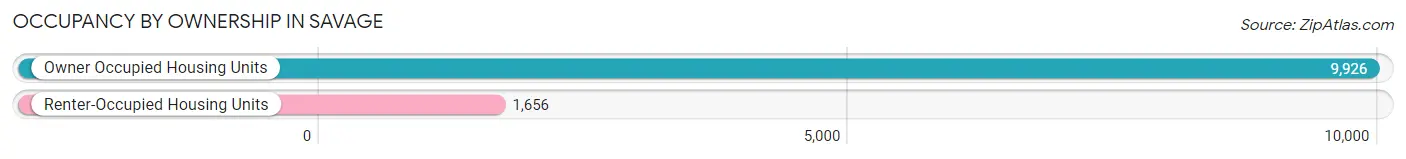
| Occupancy | # Housing Units | % Housing Units |
| Owner Occupied Housing Units | 9,926 | 85.7% |
| Renter-Occupied Housing Units | 1,656 | 14.3% |
| Total Occupied Housing Units | 11,582 | 100.0% |
Occupancy by Household Size in Savage
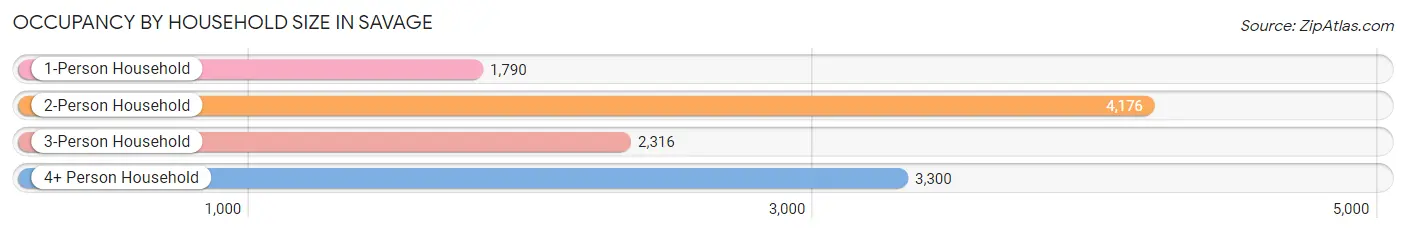
| Household Size | # Housing Units | % Housing Units |
| 1-Person Household | 1,790 | 15.5% |
| 2-Person Household | 4,176 | 36.1% |
| 3-Person Household | 2,316 | 20.0% |
| 4+ Person Household | 3,300 | 28.5% |
| Total Housing Units | 11,582 | 100.0% |
Occupancy by Ownership by Household Size in Savage
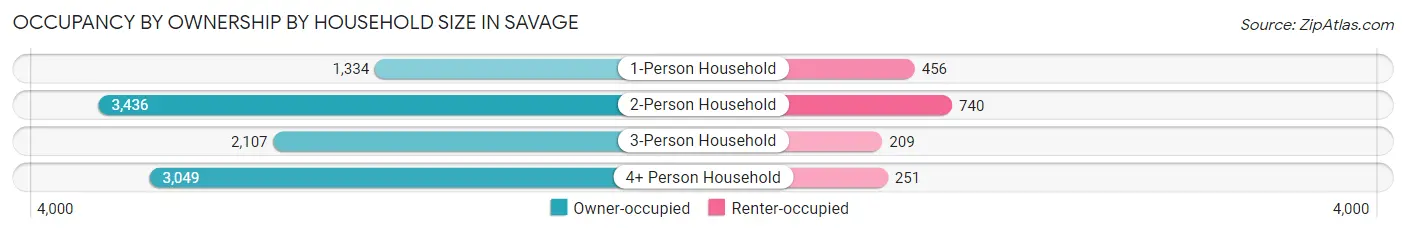
| Household Size | Owner-occupied | Renter-occupied |
| 1-Person Household | 1,334 (74.5%) | 456 (25.5%) |
| 2-Person Household | 3,436 (82.3%) | 740 (17.7%) |
| 3-Person Household | 2,107 (91.0%) | 209 (9.0%) |
| 4+ Person Household | 3,049 (92.4%) | 251 (7.6%) |
| Total Housing Units | 9,926 (85.7%) | 1,656 (14.3%) |
Occupancy by Educational Attainment in Savage
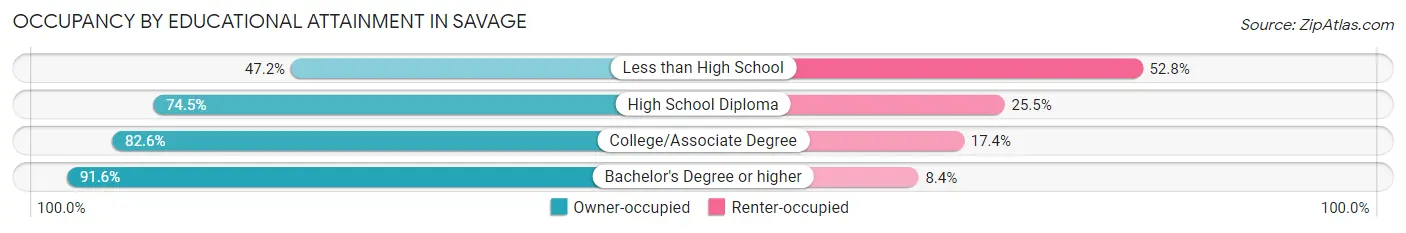
| Household Size | Owner-occupied | Renter-occupied |
| Less than High School | 135 (47.2%) | 151 (52.8%) |
| High School Diploma | 1,089 (74.5%) | 372 (25.5%) |
| College/Associate Degree | 2,831 (82.6%) | 595 (17.4%) |
| Bachelor's Degree or higher | 5,871 (91.6%) | 538 (8.4%) |
Occupancy by Age of Householder in Savage
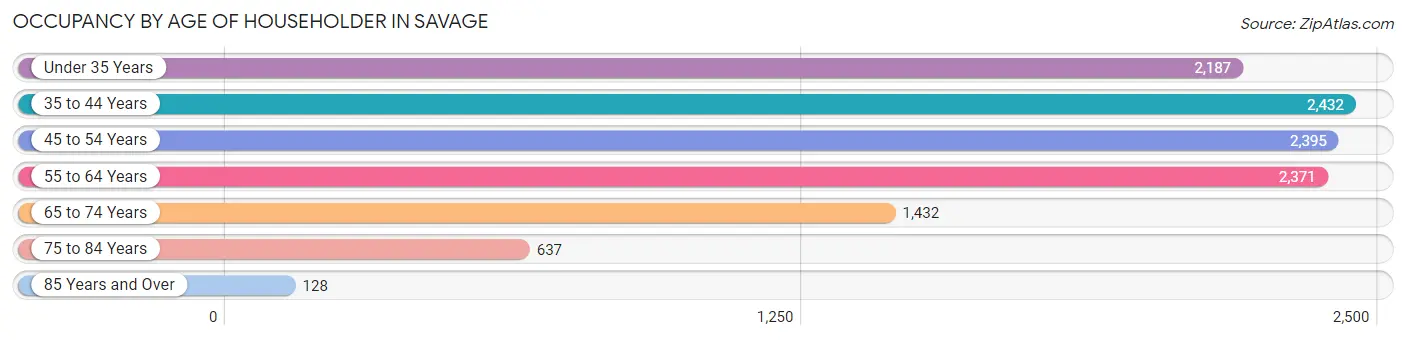
| Age Bracket | # Households | % Households |
| Under 35 Years | 2,187 | 18.9% |
| 35 to 44 Years | 2,432 | 21.0% |
| 45 to 54 Years | 2,395 | 20.7% |
| 55 to 64 Years | 2,371 | 20.5% |
| 65 to 74 Years | 1,432 | 12.4% |
| 75 to 84 Years | 637 | 5.5% |
| 85 Years and Over | 128 | 1.1% |
| Total | 11,582 | 100.0% |
Housing Finances in Savage
Median Income by Occupancy in Savage
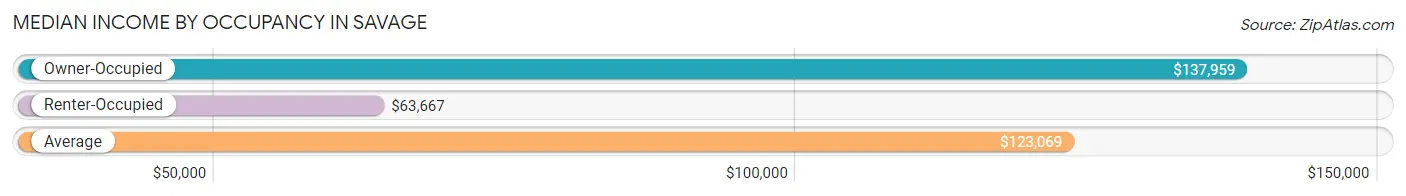
| Occupancy Type | # Households | Median Income |
| Owner-Occupied | 9,926 (85.7%) | $137,959 |
| Renter-Occupied | 1,656 (14.3%) | $63,667 |
| Average | 11,582 (100.0%) | $123,069 |
Occupancy by Householder Income Bracket in Savage
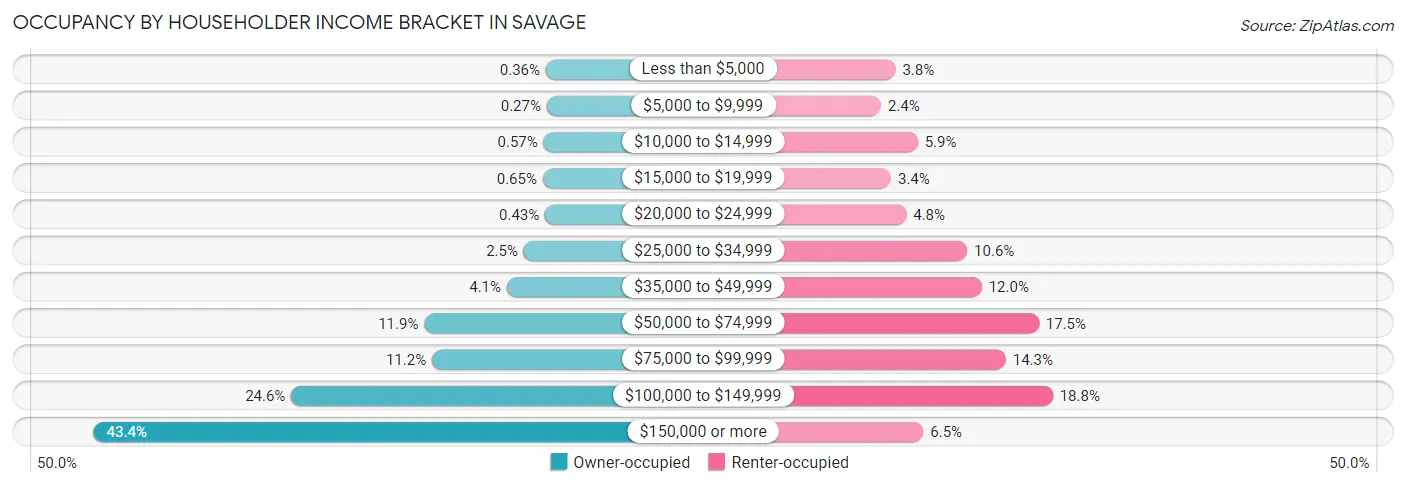
| Income Bracket | Owner-occupied | Renter-occupied |
| Less than $5,000 | 36 (0.4%) | 63 (3.8%) |
| $5,000 to $9,999 | 27 (0.3%) | 40 (2.4%) |
| $10,000 to $14,999 | 57 (0.6%) | 98 (5.9%) |
| $15,000 to $19,999 | 65 (0.6%) | 56 (3.4%) |
| $20,000 to $24,999 | 43 (0.4%) | 80 (4.8%) |
| $25,000 to $34,999 | 244 (2.5%) | 176 (10.6%) |
| $35,000 to $49,999 | 404 (4.1%) | 199 (12.0%) |
| $50,000 to $74,999 | 1,185 (11.9%) | 289 (17.4%) |
| $75,000 to $99,999 | 1,112 (11.2%) | 237 (14.3%) |
| $100,000 to $149,999 | 2,443 (24.6%) | 311 (18.8%) |
| $150,000 or more | 4,310 (43.4%) | 107 (6.5%) |
| Total | 9,926 (100.0%) | 1,656 (100.0%) |
Monthly Housing Cost Tiers in Savage
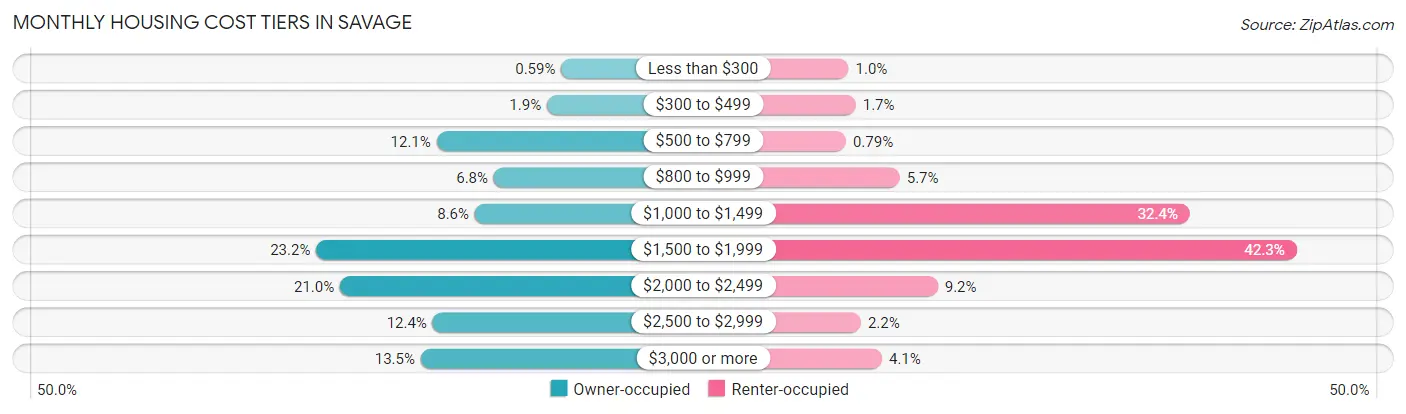
| Monthly Cost | Owner-occupied | Renter-occupied |
| Less than $300 | 59 (0.6%) | 17 (1.0%) |
| $300 to $499 | 190 (1.9%) | 28 (1.7%) |
| $500 to $799 | 1,198 (12.1%) | 13 (0.8%) |
| $800 to $999 | 675 (6.8%) | 95 (5.7%) |
| $1,000 to $1,499 | 849 (8.6%) | 537 (32.4%) |
| $1,500 to $1,999 | 2,298 (23.2%) | 700 (42.3%) |
| $2,000 to $2,499 | 2,080 (21.0%) | 153 (9.2%) |
| $2,500 to $2,999 | 1,234 (12.4%) | 36 (2.2%) |
| $3,000 or more | 1,343 (13.5%) | 68 (4.1%) |
| Total | 9,926 (100.0%) | 1,656 (100.0%) |
Physical Housing Characteristics in Savage
Housing Structures in Savage
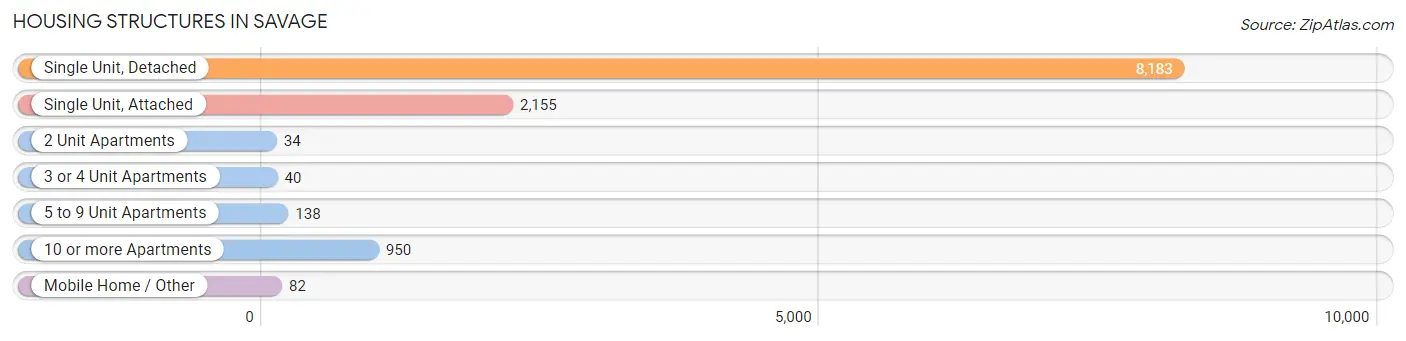
| Structure Type | # Housing Units | % Housing Units |
| Single Unit, Detached | 8,183 | 70.7% |
| Single Unit, Attached | 2,155 | 18.6% |
| 2 Unit Apartments | 34 | 0.3% |
| 3 or 4 Unit Apartments | 40 | 0.4% |
| 5 to 9 Unit Apartments | 138 | 1.2% |
| 10 or more Apartments | 950 | 8.2% |
| Mobile Home / Other | 82 | 0.7% |
| Total | 11,582 | 100.0% |
Housing Structures by Occupancy in Savage
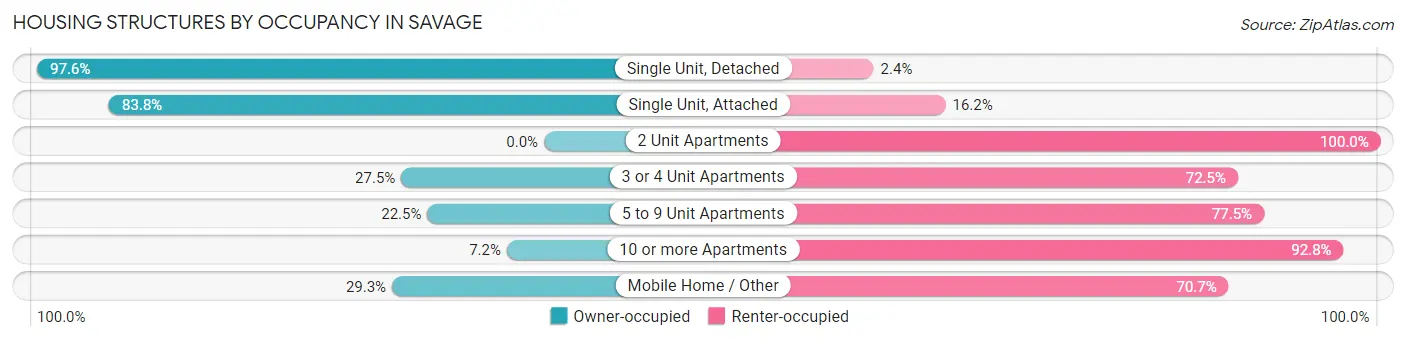
| Structure Type | Owner-occupied | Renter-occupied |
| Single Unit, Detached | 7,987 (97.6%) | 196 (2.4%) |
| Single Unit, Attached | 1,805 (83.8%) | 350 (16.2%) |
| 2 Unit Apartments | 0 (0.0%) | 34 (100.0%) |
| 3 or 4 Unit Apartments | 11 (27.5%) | 29 (72.5%) |
| 5 to 9 Unit Apartments | 31 (22.5%) | 107 (77.5%) |
| 10 or more Apartments | 68 (7.2%) | 882 (92.8%) |
| Mobile Home / Other | 24 (29.3%) | 58 (70.7%) |
| Total | 9,926 (85.7%) | 1,656 (14.3%) |
Housing Structures by Number of Rooms in Savage
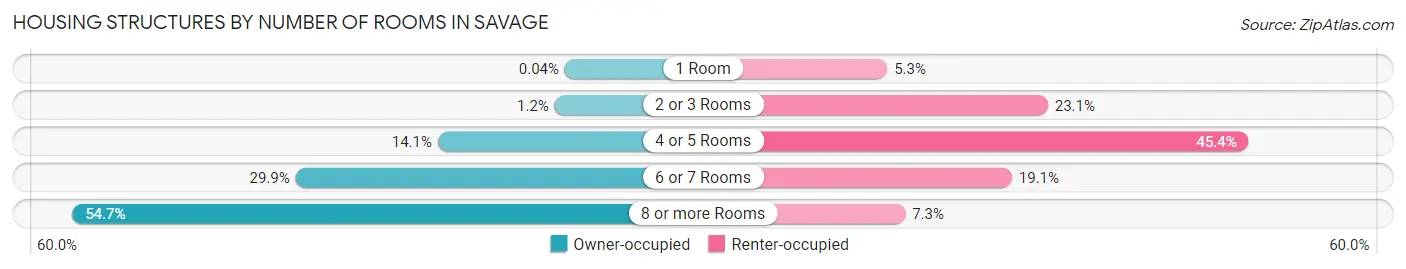
| Number of Rooms | Owner-occupied | Renter-occupied |
| 1 Room | 4 (0.0%) | 87 (5.2%) |
| 2 or 3 Rooms | 116 (1.2%) | 382 (23.1%) |
| 4 or 5 Rooms | 1,404 (14.1%) | 751 (45.4%) |
| 6 or 7 Rooms | 2,971 (29.9%) | 316 (19.1%) |
| 8 or more Rooms | 5,431 (54.7%) | 120 (7.2%) |
| Total | 9,926 (100.0%) | 1,656 (100.0%) |
Housing Structure by Heating Type in Savage
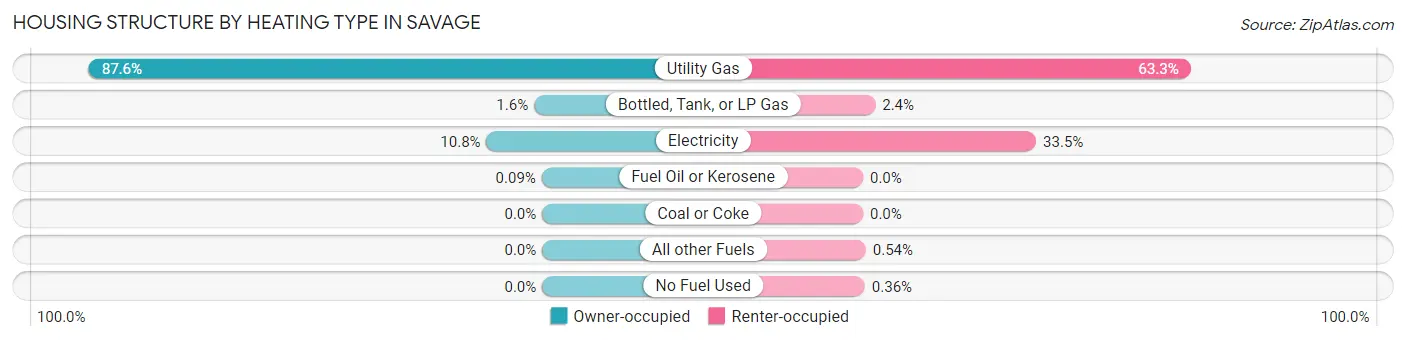
| Heating Type | Owner-occupied | Renter-occupied |
| Utility Gas | 8,693 (87.6%) | 1,048 (63.3%) |
| Bottled, Tank, or LP Gas | 156 (1.6%) | 39 (2.4%) |
| Electricity | 1,068 (10.8%) | 554 (33.5%) |
| Fuel Oil or Kerosene | 9 (0.1%) | 0 (0.0%) |
| Coal or Coke | 0 (0.0%) | 0 (0.0%) |
| All other Fuels | 0 (0.0%) | 9 (0.5%) |
| No Fuel Used | 0 (0.0%) | 6 (0.4%) |
| Total | 9,926 (100.0%) | 1,656 (100.0%) |
Household Vehicle Usage in Savage
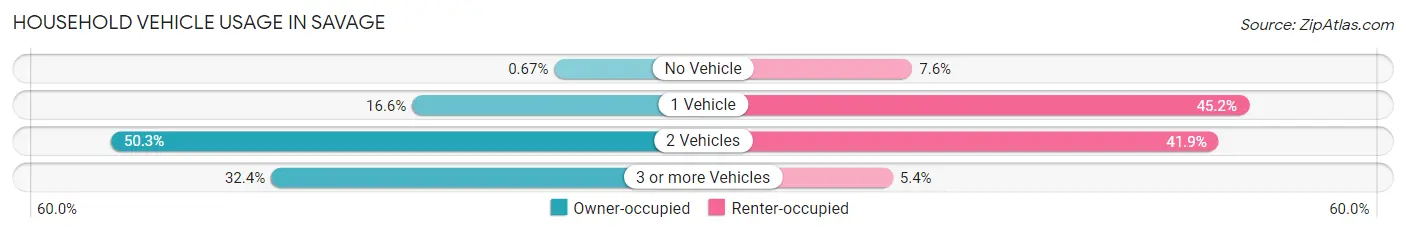
| Vehicles per Household | Owner-occupied | Renter-occupied |
| No Vehicle | 67 (0.7%) | 125 (7.5%) |
| 1 Vehicle | 1,647 (16.6%) | 749 (45.2%) |
| 2 Vehicles | 4,996 (50.3%) | 693 (41.8%) |
| 3 or more Vehicles | 3,216 (32.4%) | 89 (5.4%) |
| Total | 9,926 (100.0%) | 1,656 (100.0%) |
Real Estate & Mortgages in Savage
Real Estate and Mortgage Overview in Savage
| Characteristic | Without Mortgage | With Mortgage |
| Housing Units | 2,288 | 7,638 |
| Median Property Value | $372,400 | $379,200 |
| Median Household Income | $115,263 | $3,492 |
| Monthly Housing Costs | $728 | $1,343 |
| Real Estate Taxes | $4,167 | $72 |
Property Value by Mortgage Status in Savage
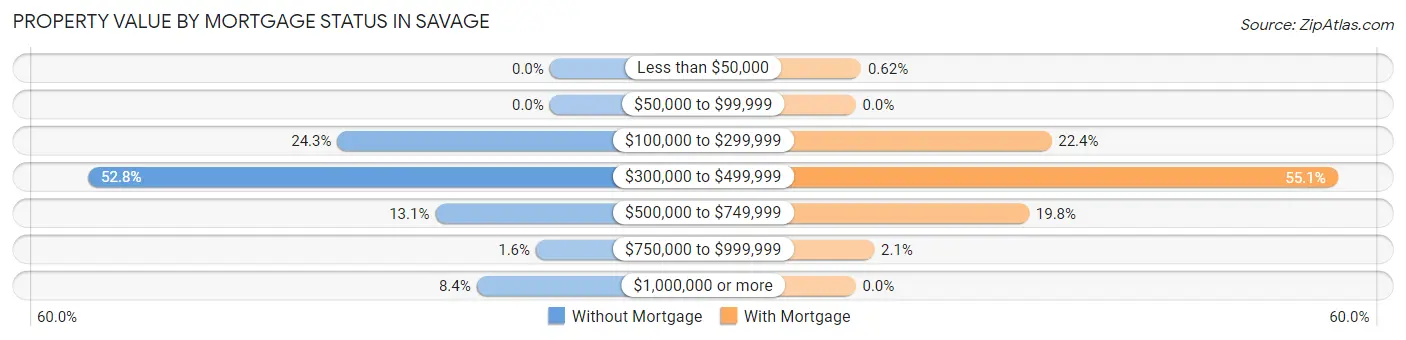
| Property Value | Without Mortgage | With Mortgage |
| Less than $50,000 | 0 (0.0%) | 47 (0.6%) |
| $50,000 to $99,999 | 0 (0.0%) | 0 (0.0%) |
| $100,000 to $299,999 | 555 (24.3%) | 1,709 (22.4%) |
| $300,000 to $499,999 | 1,207 (52.7%) | 4,207 (55.1%) |
| $500,000 to $749,999 | 299 (13.1%) | 1,513 (19.8%) |
| $750,000 to $999,999 | 36 (1.6%) | 162 (2.1%) |
| $1,000,000 or more | 191 (8.4%) | 0 (0.0%) |
| Total | 2,288 (100.0%) | 7,638 (100.0%) |
Household Income by Mortgage Status in Savage
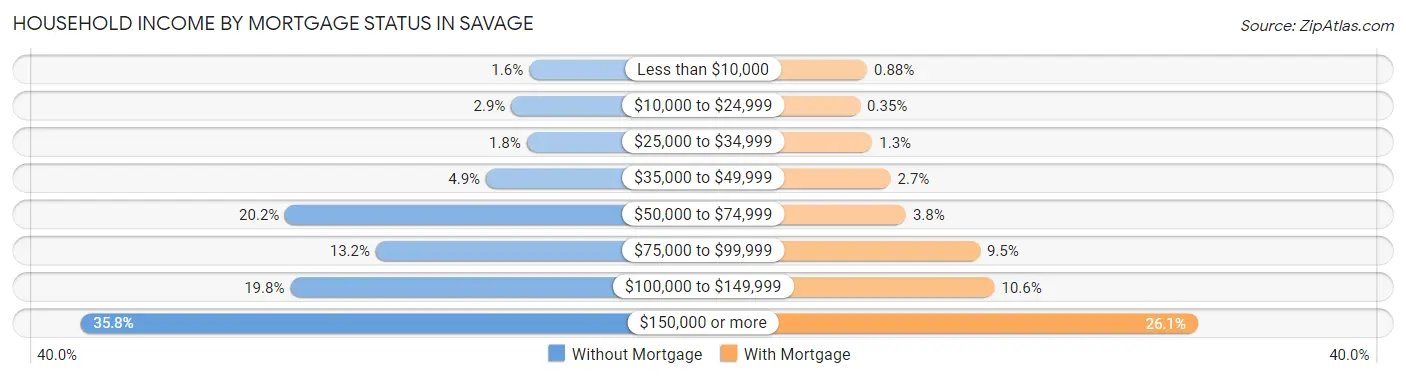
| Household Income | Without Mortgage | With Mortgage |
| Less than $10,000 | 36 (1.6%) | 67 (0.9%) |
| $10,000 to $24,999 | 67 (2.9%) | 27 (0.4%) |
| $25,000 to $34,999 | 40 (1.8%) | 98 (1.3%) |
| $35,000 to $49,999 | 111 (4.9%) | 204 (2.7%) |
| $50,000 to $74,999 | 461 (20.2%) | 293 (3.8%) |
| $75,000 to $99,999 | 303 (13.2%) | 724 (9.5%) |
| $100,000 to $149,999 | 452 (19.8%) | 809 (10.6%) |
| $150,000 or more | 818 (35.7%) | 1,991 (26.1%) |
| Total | 2,288 (100.0%) | 7,638 (100.0%) |
Property Value to Household Income Ratio in Savage
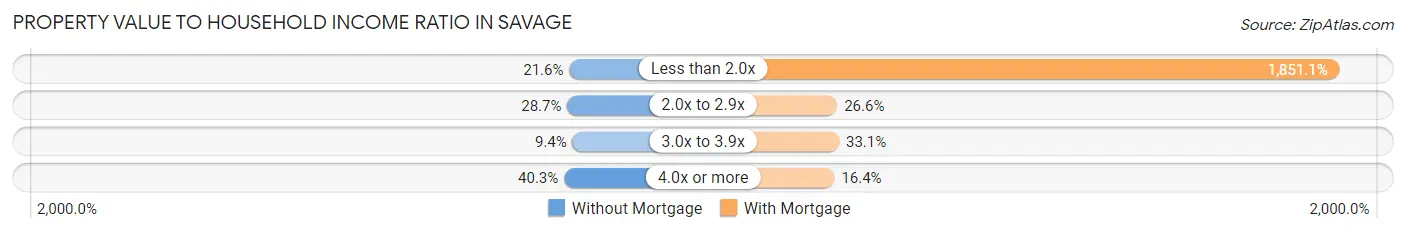
| Value-to-Income Ratio | Without Mortgage | With Mortgage |
| Less than 2.0x | 494 (21.6%) | 141,385 (1,851.1%) |
| 2.0x to 2.9x | 656 (28.7%) | 2,034 (26.6%) |
| 3.0x to 3.9x | 215 (9.4%) | 2,530 (33.1%) |
| 4.0x or more | 923 (40.3%) | 1,255 (16.4%) |
| Total | 2,288 (100.0%) | 7,638 (100.0%) |
Real Estate Taxes by Mortgage Status in Savage
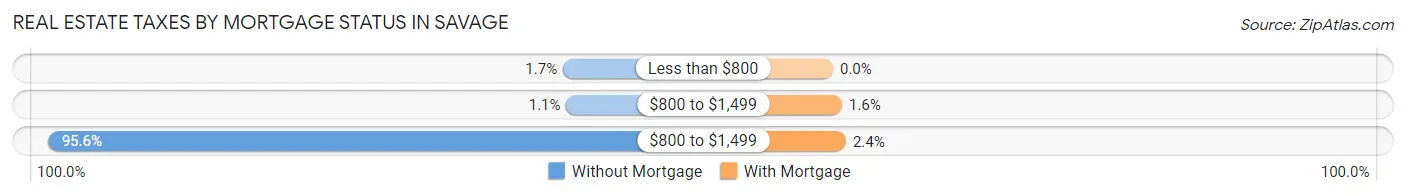
| Property Taxes | Without Mortgage | With Mortgage |
| Less than $800 | 38 (1.7%) | 0 (0.0%) |
| $800 to $1,499 | 24 (1.1%) | 125 (1.6%) |
| $800 to $1,499 | 2,187 (95.6%) | 180 (2.4%) |
| Total | 2,288 (100.0%) | 7,638 (100.0%) |
Health & Disability in Savage
Health Insurance Coverage by Age in Savage
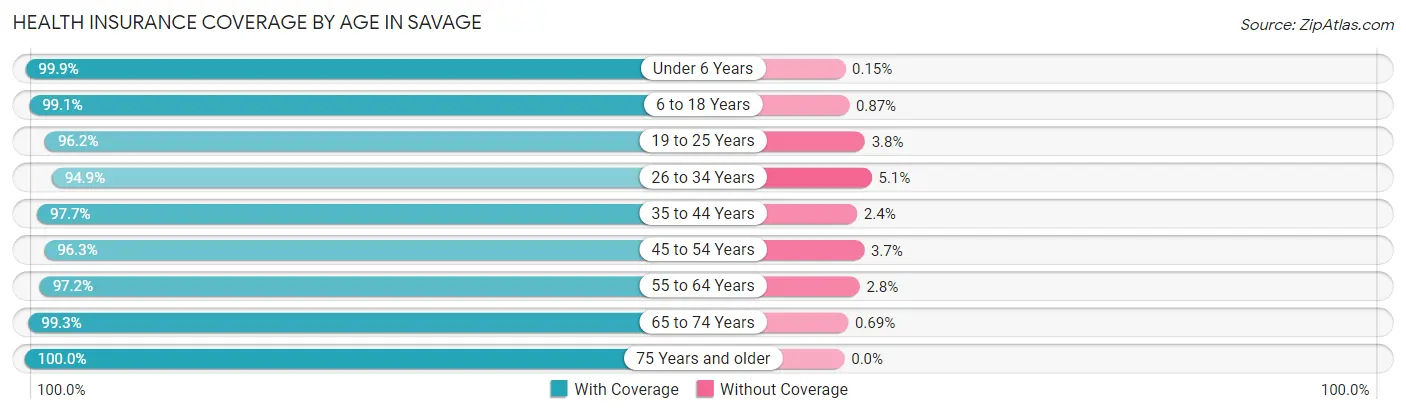
| Age Bracket | With Coverage | Without Coverage |
| Under 6 Years | 2,608 (99.9%) | 4 (0.2%) |
| 6 to 18 Years | 5,952 (99.1%) | 52 (0.9%) |
| 19 to 25 Years | 2,497 (96.2%) | 99 (3.8%) |
| 26 to 34 Years | 3,456 (94.9%) | 185 (5.1%) |
| 35 to 44 Years | 4,743 (97.7%) | 114 (2.4%) |
| 45 to 54 Years | 4,467 (96.3%) | 170 (3.7%) |
| 55 to 64 Years | 4,124 (97.2%) | 120 (2.8%) |
| 65 to 74 Years | 2,573 (99.3%) | 18 (0.7%) |
| 75 Years and older | 1,235 (100.0%) | 0 (0.0%) |
| Total | 31,655 (97.7%) | 762 (2.4%) |
Health Insurance Coverage by Citizenship Status in Savage
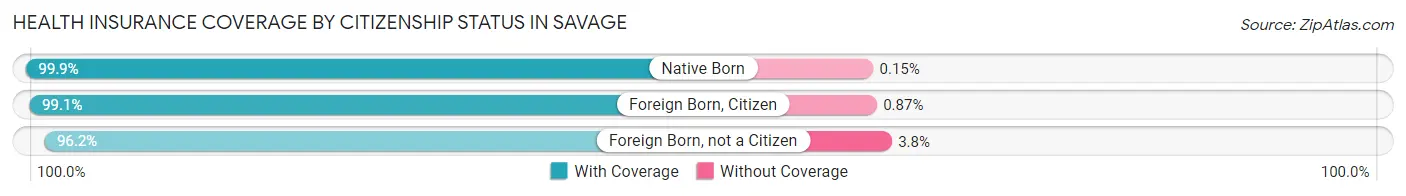
| Citizenship Status | With Coverage | Without Coverage |
| Native Born | 2,608 (99.9%) | 4 (0.2%) |
| Foreign Born, Citizen | 5,952 (99.1%) | 52 (0.9%) |
| Foreign Born, not a Citizen | 2,497 (96.2%) | 99 (3.8%) |
Health Insurance Coverage by Household Income in Savage
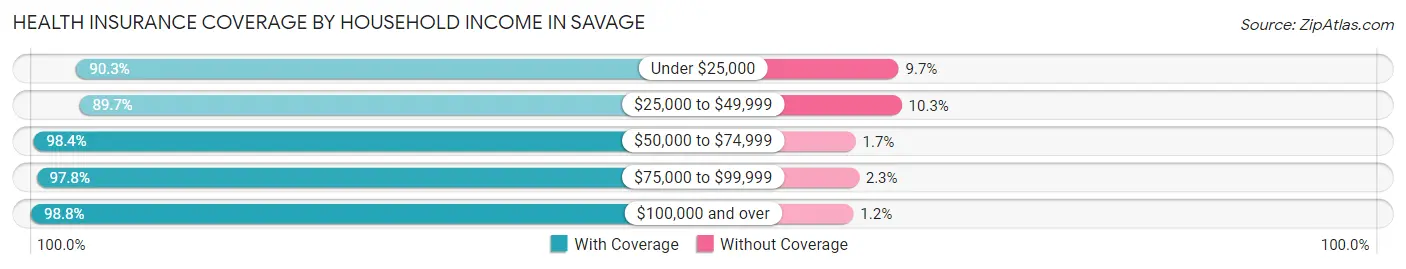
| Household Income | With Coverage | Without Coverage |
| Under $25,000 | 1,079 (90.3%) | 116 (9.7%) |
| $25,000 to $49,999 | 2,087 (89.7%) | 239 (10.3%) |
| $50,000 to $74,999 | 3,221 (98.4%) | 54 (1.7%) |
| $75,000 to $99,999 | 3,350 (97.8%) | 77 (2.2%) |
| $100,000 and over | 21,913 (98.8%) | 276 (1.2%) |
Public vs Private Health Insurance Coverage by Age in Savage
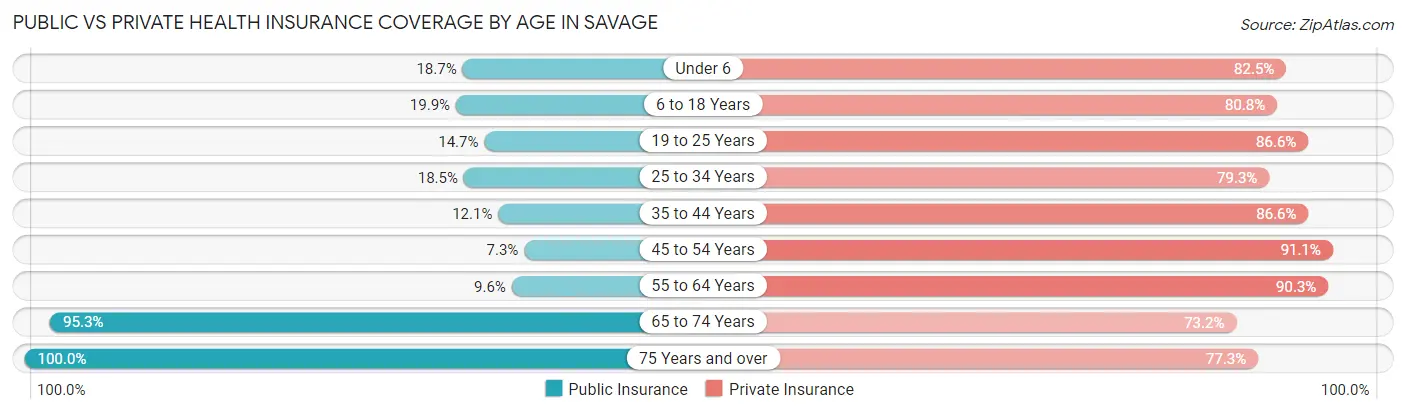
| Age Bracket | Public Insurance | Private Insurance |
| Under 6 | 489 (18.7%) | 2,154 (82.5%) |
| 6 to 18 Years | 1,197 (19.9%) | 4,850 (80.8%) |
| 19 to 25 Years | 381 (14.7%) | 2,247 (86.6%) |
| 25 to 34 Years | 673 (18.5%) | 2,888 (79.3%) |
| 35 to 44 Years | 587 (12.1%) | 4,206 (86.6%) |
| 45 to 54 Years | 337 (7.3%) | 4,225 (91.1%) |
| 55 to 64 Years | 407 (9.6%) | 3,831 (90.3%) |
| 65 to 74 Years | 2,468 (95.3%) | 1,897 (73.2%) |
| 75 Years and over | 1,235 (100.0%) | 954 (77.2%) |
| Total | 7,774 (24.0%) | 27,252 (84.1%) |
Disability Status by Sex by Age in Savage
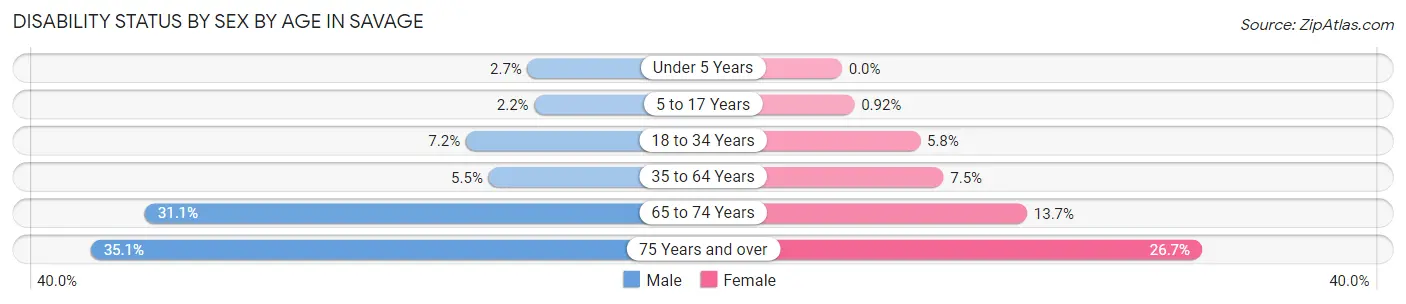
| Age Bracket | Male | Female |
| Under 5 Years | 29 (2.6%) | 0 (0.0%) |
| 5 to 17 Years | 68 (2.1%) | 28 (0.9%) |
| 18 to 34 Years | 260 (7.2%) | 174 (5.8%) |
| 35 to 64 Years | 394 (5.5%) | 499 (7.5%) |
| 65 to 74 Years | 398 (31.1%) | 180 (13.7%) |
| 75 Years and over | 180 (35.1%) | 193 (26.7%) |
Disability Class by Sex by Age in Savage
Disability Class: Hearing Difficulty
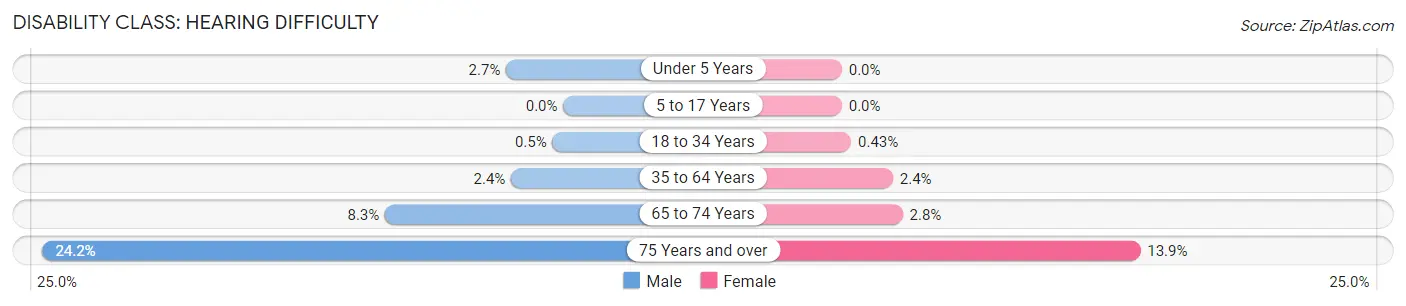
| Age Bracket | Male | Female |
| Under 5 Years | 29 (2.6%) | 0 (0.0%) |
| 5 to 17 Years | 0 (0.0%) | 0 (0.0%) |
| 18 to 34 Years | 18 (0.5%) | 13 (0.4%) |
| 35 to 64 Years | 172 (2.4%) | 157 (2.4%) |
| 65 to 74 Years | 106 (8.3%) | 37 (2.8%) |
| 75 Years and over | 124 (24.2%) | 100 (13.9%) |
Disability Class: Vision Difficulty
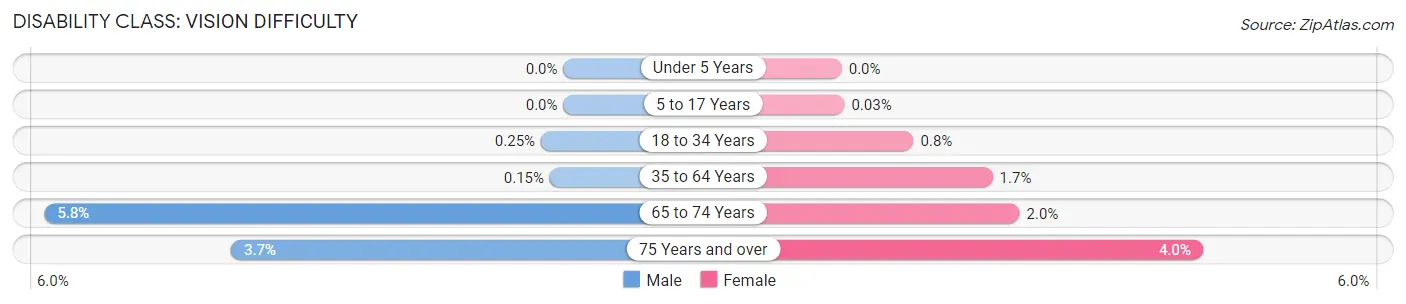
| Age Bracket | Male | Female |
| Under 5 Years | 0 (0.0%) | 0 (0.0%) |
| 5 to 17 Years | 0 (0.0%) | 1 (0.0%) |
| 18 to 34 Years | 9 (0.3%) | 24 (0.8%) |
| 35 to 64 Years | 11 (0.2%) | 111 (1.7%) |
| 65 to 74 Years | 74 (5.8%) | 26 (2.0%) |
| 75 Years and over | 19 (3.7%) | 29 (4.0%) |
Disability Class: Cognitive Difficulty
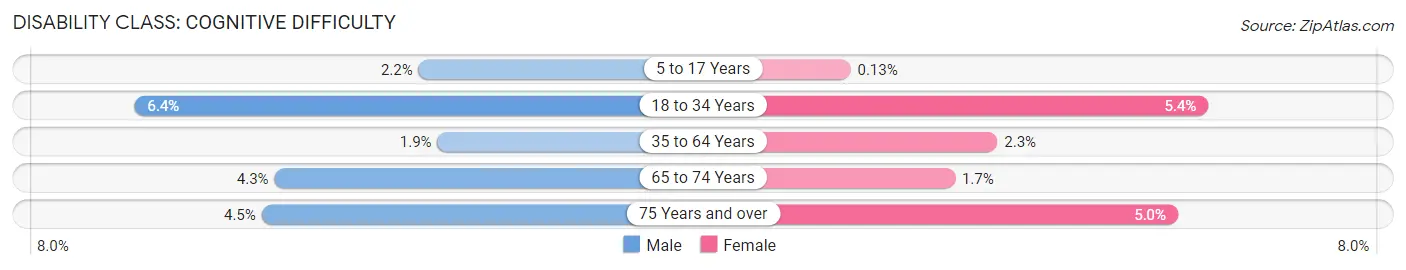
| Age Bracket | Male | Female |
| 5 to 17 Years | 68 (2.1%) | 4 (0.1%) |
| 18 to 34 Years | 229 (6.4%) | 163 (5.4%) |
| 35 to 64 Years | 133 (1.9%) | 153 (2.3%) |
| 65 to 74 Years | 55 (4.3%) | 22 (1.7%) |
| 75 Years and over | 23 (4.5%) | 36 (5.0%) |
Disability Class: Ambulatory Difficulty
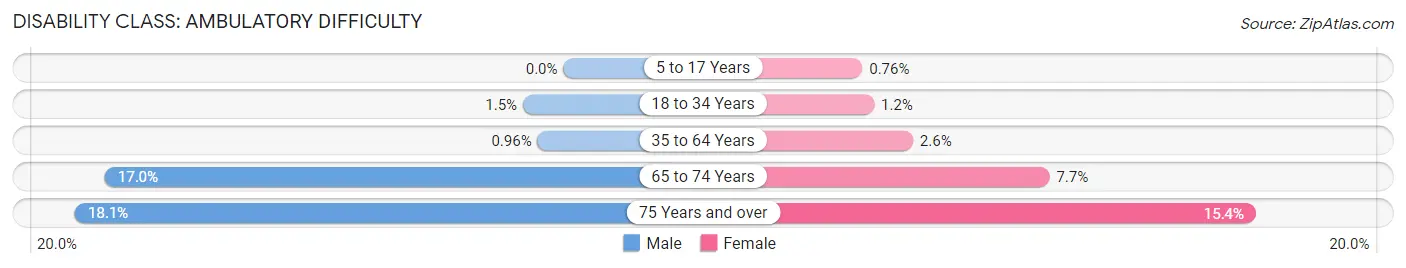
| Age Bracket | Male | Female |
| 5 to 17 Years | 0 (0.0%) | 23 (0.8%) |
| 18 to 34 Years | 54 (1.5%) | 36 (1.2%) |
| 35 to 64 Years | 68 (1.0%) | 175 (2.6%) |
| 65 to 74 Years | 218 (17.0%) | 101 (7.7%) |
| 75 Years and over | 93 (18.1%) | 111 (15.4%) |
Disability Class: Self-Care Difficulty
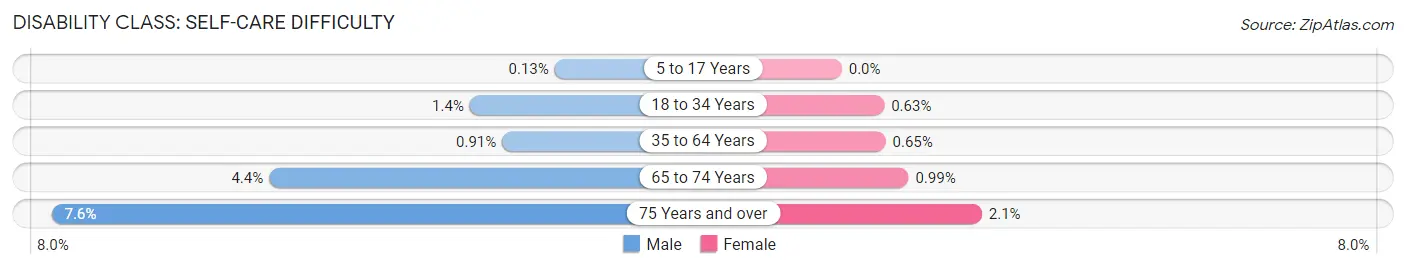
| Age Bracket | Male | Female |
| 5 to 17 Years | 4 (0.1%) | 0 (0.0%) |
| 18 to 34 Years | 50 (1.4%) | 19 (0.6%) |
| 35 to 64 Years | 65 (0.9%) | 43 (0.6%) |
| 65 to 74 Years | 56 (4.4%) | 13 (1.0%) |
| 75 Years and over | 39 (7.6%) | 15 (2.1%) |
Technology Access in Savage
Computing Device Access in Savage
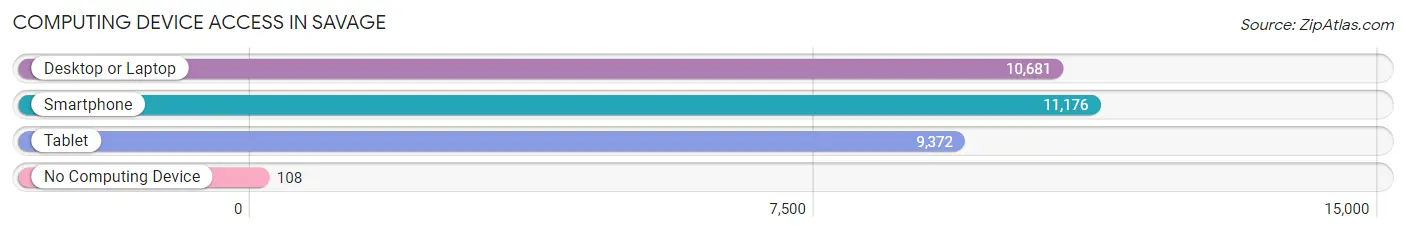
| Device Type | # Households | % Households |
| Desktop or Laptop | 10,681 | 92.2% |
| Smartphone | 11,176 | 96.5% |
| Tablet | 9,372 | 80.9% |
| No Computing Device | 108 | 0.9% |
| Total | 11,582 | 100.0% |
Internet Access in Savage
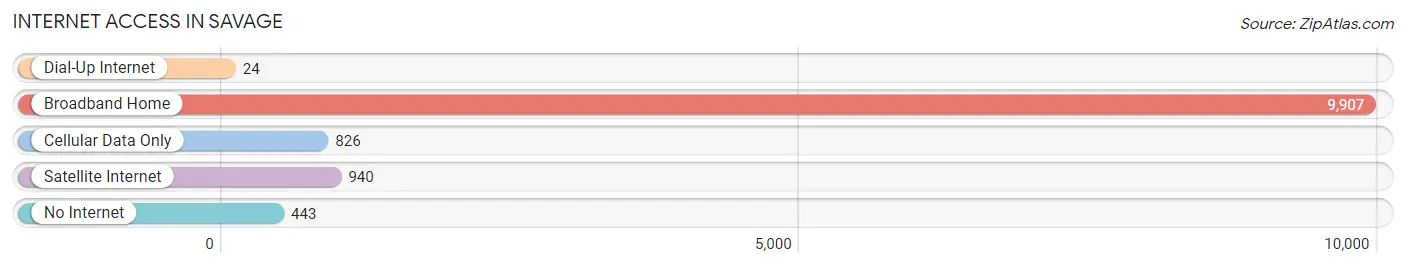
| Internet Type | # Households | % Households |
| Dial-Up Internet | 24 | 0.2% |
| Broadband Home | 9,907 | 85.5% |
| Cellular Data Only | 826 | 7.1% |
| Satellite Internet | 940 | 8.1% |
| No Internet | 443 | 3.8% |
| Total | 11,582 | 100.0% |
Savage Summary
Savage, Minnesota is a small city located in the Twin Cities metropolitan area of Minnesota. It is located in Scott County and is part of the Minneapolis-St. Paul-Bloomington Metropolitan Statistical Area. The city has a population of 26,911 as of the 2010 census.
Geography
Savage is located in the southwestern corner of Scott County, Minnesota. It is bordered by the cities of Prior Lake to the north, Burnsville to the east, and Shakopee to the south. The Minnesota River forms the western border of the city. The city has a total area of 11.2 square miles, of which 11.1 square miles is land and 0.1 square miles is water.
History
Savage was first settled in 1853 by a group of settlers from New York. The city was named after Marion W. Savage, a prominent businessman and philanthropist who was instrumental in the development of the city. The city was incorporated in 1885 and has grown steadily since then.
Economy
Savage is home to several large employers, including the Minnesota Valley Transit Authority, the Minnesota Valley National Wildlife Refuge, and the Minnesota Zoo. The city also has a number of small businesses, including restaurants, retail stores, and professional services.
The city's economy is largely based on the service industry, with many residents employed in healthcare, education, and retail. The city also has a number of manufacturing and technology companies, including 3M, Medtronic, and Cargill.
Demographics
As of the 2010 census, the population of Savage was 26,911. The racial makeup of the city was 87.3% White, 5.2% African American, 0.5% Native American, 3.2% Asian, 0.1% Pacific Islander, 1.3% from other races, and 2.5% from two or more races. Hispanic or Latino of any race were 4.2% of the population.
The median income for a household in the city was $68,945, and the median income for a family was $77,945. The per capita income for the city was $30,945. About 4.2% of families and 5.7% of the population were below the poverty line, including 8.2% of those under age 18 and 4.2% of those age 65 or over.
Savage is a diverse city with a variety of cultures and backgrounds. The city is home to a large Somali population, as well as a growing Hispanic population. The city also has a large number of immigrants from other countries, including India, China, and Vietnam.
Common Questions
What is Per Capita Income in Savage?
Per Capita income in Savage is $52,266.
What is the Median Family Income in Savage?
Median Family Income in Savage is $141,162.
What is the Median Household income in Savage?
Median Household Income in Savage is $123,069.
What is Income or Wage Gap in Savage?
Income or Wage Gap in Savage is 25.4%.
Women in Savage earn 74.6 cents for every dollar earned by a man.
What is Inequality or Gini Index in Savage?
Inequality or Gini Index in Savage is 0.37.
What is the Total Population of Savage?
Total Population of Savage is 32,441.
What is the Total Male Population of Savage?
Total Male Population of Savage is 16,781.
What is the Total Female Population of Savage?
Total Female Population of Savage is 15,660.
What is the Ratio of Males per 100 Females in Savage?
There are 107.16 Males per 100 Females in Savage.
What is the Ratio of Females per 100 Males in Savage?
There are 93.32 Females per 100 Males in Savage.
What is the Median Population Age in Savage?
Median Population Age in Savage is 37.5 Years.
What is the Average Family Size in Savage
Average Family Size in Savage is 3.2 People.
What is the Average Household Size in Savage
Average Household Size in Savage is 2.8 People.
How Large is the Labor Force in Savage?
There are 19,408 People in the Labor Forcein in Savage.
What is the Percentage of People in the Labor Force in Savage?
76.5% of People are in the Labor Force in Savage.
What is the Unemployment Rate in Savage?
Unemployment Rate in Savage is 3.9%.