South Boston, VA Map & Demographics
South Boston Map
South Boston Overview
$23,663
PER CAPITA INCOME
$51,622
AVG FAMILY INCOME
$49,654
AVG HOUSEHOLD INCOME
17.0%
WAGE / INCOME GAP [ % ]
83.0¢/ $1
WAGE / INCOME GAP [ $ ]
0.45
INEQUALITY / GINI INDEX
7,942
TOTAL POPULATION
3,384
MALE POPULATION
4,558
FEMALE POPULATION
74.24
MALES / 100 FEMALES
134.69
FEMALES / 100 MALES
41.6
MEDIAN AGE
3.4
AVG FAMILY SIZE
2.5
AVG HOUSEHOLD SIZE
3,026
LABOR FORCE [ PEOPLE ]
48.5%
PERCENT IN LABOR FORCE
4.3%
UNEMPLOYMENT RATE
South Boston Zip Codes
South Boston Area Codes
Income in South Boston
Income Overview in South Boston
Per Capita Income in South Boston is $23,663, while median incomes of families and households are $51,622 and $49,654 respectively.
| Characteristic | Number | Measure |
| Per Capita Income | 7,942 | $23,663 |
| Median Family Income | 1,654 | $51,622 |
| Mean Family Income | 1,654 | $66,783 |
| Median Household Income | 2,936 | $49,654 |
| Mean Household Income | 2,936 | $61,127 |
| Income Deficit | 1,654 | $0 |
| Wage / Income Gap (%) | 7,942 | 17.01% |
| Wage / Income Gap ($) | 7,942 | 82.99¢ per $1 |
| Gini / Inequality Index | 7,942 | 0.45 |
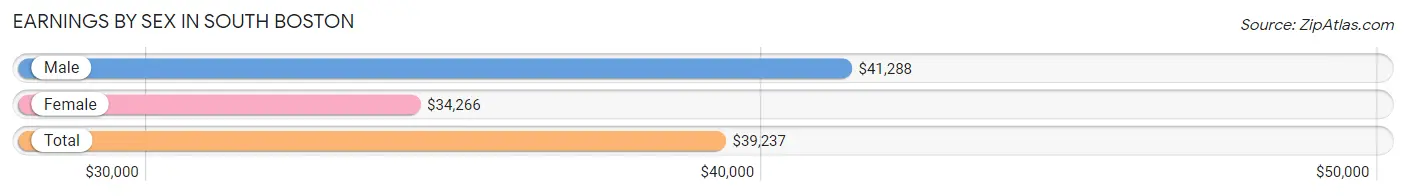
Earnings by Sex in South Boston
Average Earnings in South Boston are $39,237, $41,288 for men and $34,266 for women, a difference of 17.0%.
| Sex | Number | Average Earnings |
| Male | 1,352 (43.3%) | $41,288 |
| Female | 1,768 (56.7%) | $34,266 |
| Total | 3,120 (100.0%) | $39,237 |
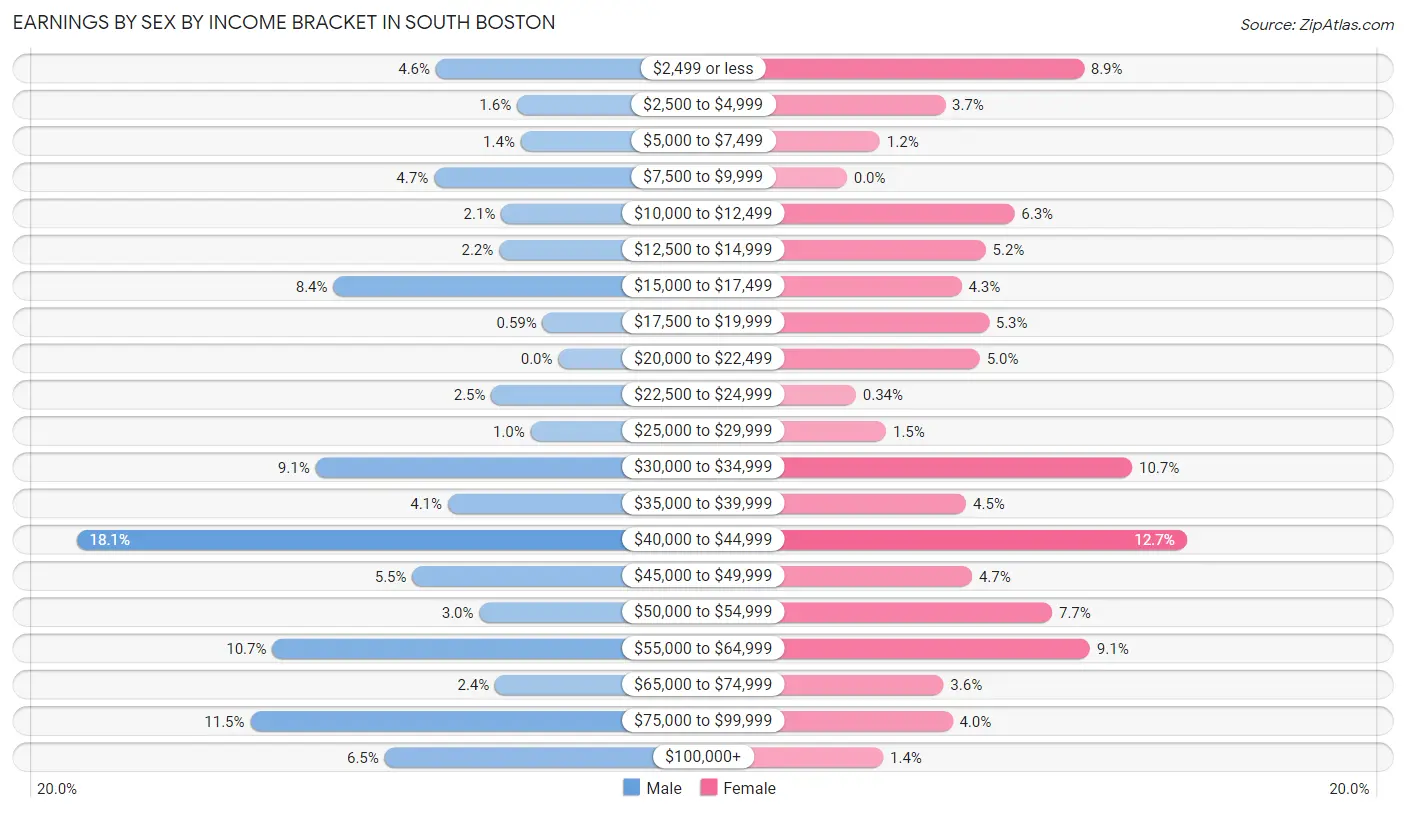
Earnings by Sex by Income Bracket in South Boston
The most common earnings brackets in South Boston are $40,000 to $44,999 for men (244 | 18.0%) and $40,000 to $44,999 for women (225 | 12.7%).
| Income | Male | Female |
| $2,499 or less | 62 (4.6%) | 157 (8.9%) |
| $2,500 to $4,999 | 21 (1.5%) | 65 (3.7%) |
| $5,000 to $7,499 | 19 (1.4%) | 22 (1.2%) |
| $7,500 to $9,999 | 63 (4.7%) | 0 (0.0%) |
| $10,000 to $12,499 | 29 (2.1%) | 111 (6.3%) |
| $12,500 to $14,999 | 30 (2.2%) | 92 (5.2%) |
| $15,000 to $17,499 | 114 (8.4%) | 76 (4.3%) |
| $17,500 to $19,999 | 8 (0.6%) | 94 (5.3%) |
| $20,000 to $22,499 | 0 (0.0%) | 88 (5.0%) |
| $22,500 to $24,999 | 34 (2.5%) | 6 (0.3%) |
| $25,000 to $29,999 | 14 (1.0%) | 26 (1.5%) |
| $30,000 to $34,999 | 123 (9.1%) | 189 (10.7%) |
| $35,000 to $39,999 | 56 (4.1%) | 79 (4.5%) |
| $40,000 to $44,999 | 244 (18.0%) | 225 (12.7%) |
| $45,000 to $49,999 | 74 (5.5%) | 83 (4.7%) |
| $50,000 to $54,999 | 40 (3.0%) | 136 (7.7%) |
| $55,000 to $64,999 | 145 (10.7%) | 161 (9.1%) |
| $65,000 to $74,999 | 32 (2.4%) | 64 (3.6%) |
| $75,000 to $99,999 | 156 (11.5%) | 70 (4.0%) |
| $100,000+ | 88 (6.5%) | 24 (1.4%) |
| Total | 1,352 (100.0%) | 1,768 (100.0%) |
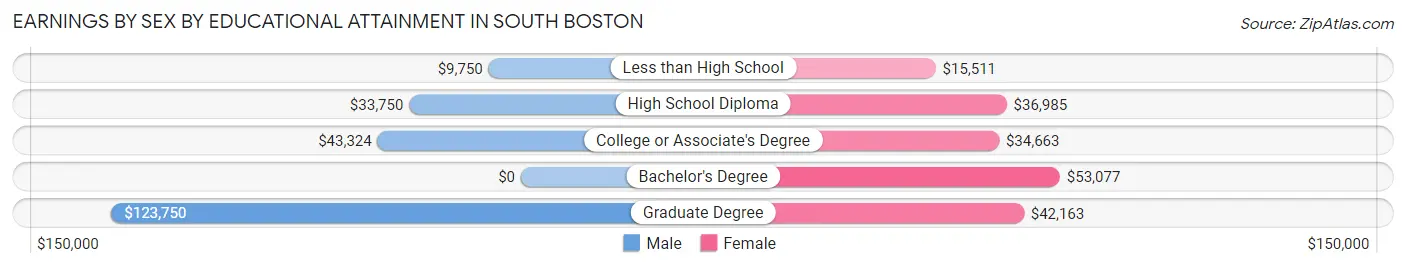
Earnings by Sex by Educational Attainment in South Boston
Average earnings in South Boston are $42,032 for men and $37,419 for women, a difference of 11.0%. Men with an educational attainment of graduate degree enjoy the highest average annual earnings of $123,750, while those with less than high school education earn the least with $9,750. Women with an educational attainment of bachelor's degree earn the most with the average annual earnings of $53,077, while those with less than high school education have the smallest earnings of $15,511.
| Educational Attainment | Male Income | Female Income |
| Less than High School | $9,750 | $15,511 |
| High School Diploma | $33,750 | $36,985 |
| College or Associate's Degree | $43,324 | $34,663 |
| Bachelor's Degree | - | - |
| Graduate Degree | $123,750 | $42,163 |
| Total | $42,032 | $37,419 |
Family Income in South Boston
Family Income Brackets in South Boston
According to the South Boston family income data, there are 349 families falling into the $35,000 to $49,999 income range, which is the most common income bracket and makes up 21.1% of all families. Conversely, the $10,000 to $14,999 income bracket is the least frequent group with only 36 families (2.2%) belonging to this category.
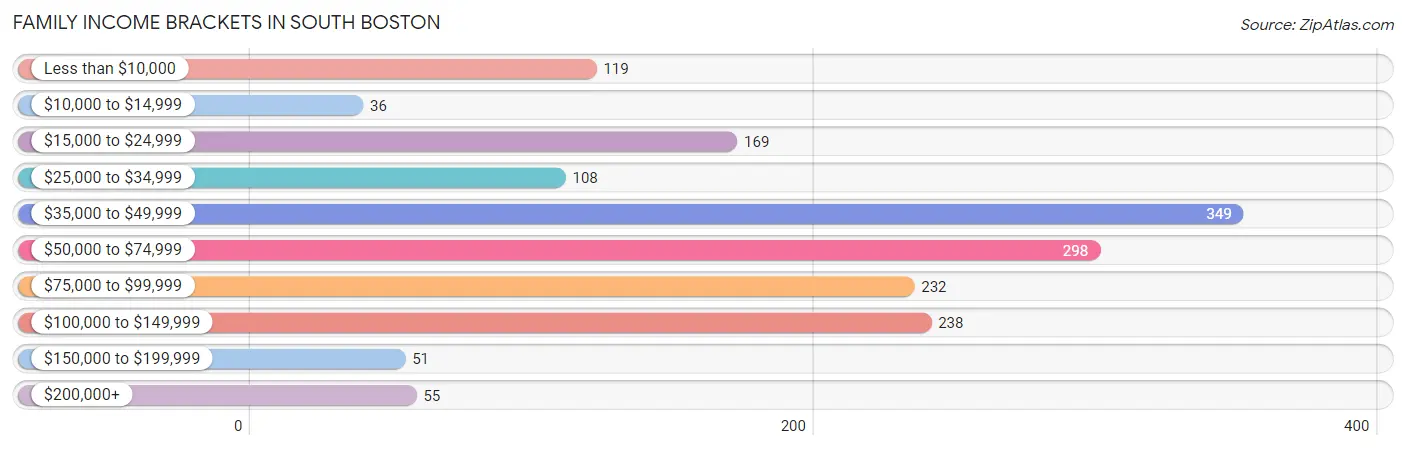
| Income Bracket | # Families | % Families |
| Less than $10,000 | 119 | 7.2% |
| $10,000 to $14,999 | 36 | 2.2% |
| $15,000 to $24,999 | 169 | 10.2% |
| $25,000 to $34,999 | 108 | 6.5% |
| $35,000 to $49,999 | 349 | 21.1% |
| $50,000 to $74,999 | 298 | 18.0% |
| $75,000 to $99,999 | 232 | 14.0% |
| $100,000 to $149,999 | 238 | 14.4% |
| $150,000 to $199,999 | 51 | 3.1% |
| $200,000+ | 55 | 3.3% |
Family Income by Famaliy Size in South Boston
4-person families (276 | 16.7%) account for the highest median family income in South Boston with $60,167 per family, while 2-person families (915 | 55.3%) have the highest median income of $24,896 per family member.
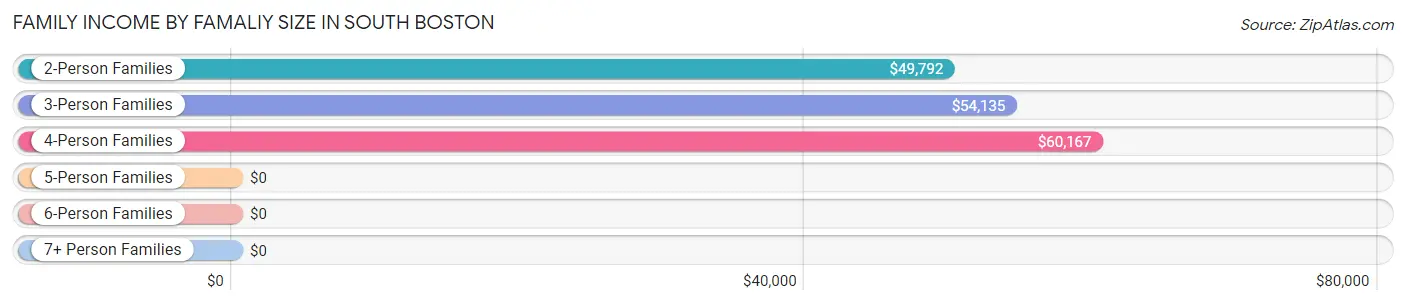
| Income Bracket | # Families | Median Income |
| 2-Person Families | 915 (55.3%) | $49,792 |
| 3-Person Families | 383 (23.2%) | $54,135 |
| 4-Person Families | 276 (16.7%) | $60,167 |
| 5-Person Families | 61 (3.7%) | $0 |
| 6-Person Families | 13 (0.8%) | $0 |
| 7+ Person Families | 6 (0.4%) | $0 |
| Total | 1,654 (100.0%) | $51,622 |
Family Income by Number of Earners in South Boston
The median family income in South Boston is $51,622, with families comprising 2 earners (546) having the highest median family income of $94,531, while families with 1 earner (787) have the lowest median family income of $40,584, accounting for 33.0% and 47.6% of families, respectively.
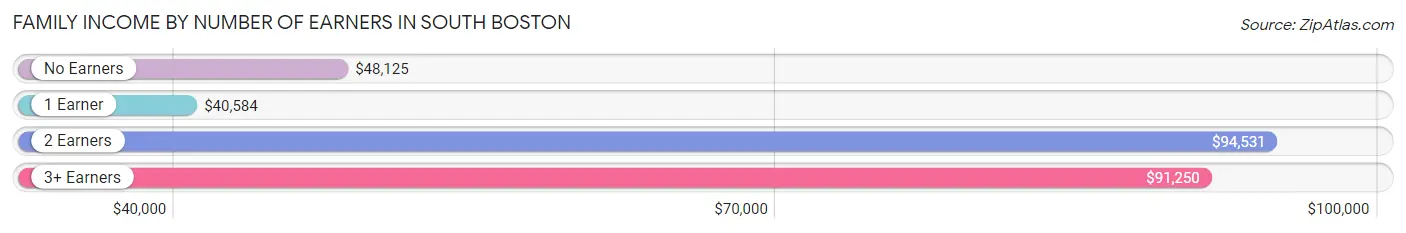
| Number of Earners | # Families | Median Income |
| No Earners | 279 (16.9%) | $48,125 |
| 1 Earner | 787 (47.6%) | $40,584 |
| 2 Earners | 546 (33.0%) | $94,531 |
| 3+ Earners | 42 (2.5%) | $91,250 |
| Total | 1,654 (100.0%) | $51,622 |
Household Income in South Boston
Household Income Brackets in South Boston
With 531 households falling in the category, the $75,000 to $99,999 income range is the most frequent in South Boston, accounting for 18.1% of all households. In contrast, only 56 households (1.9%) fall into the $150,000 to $199,999 income bracket, making it the least populous group.
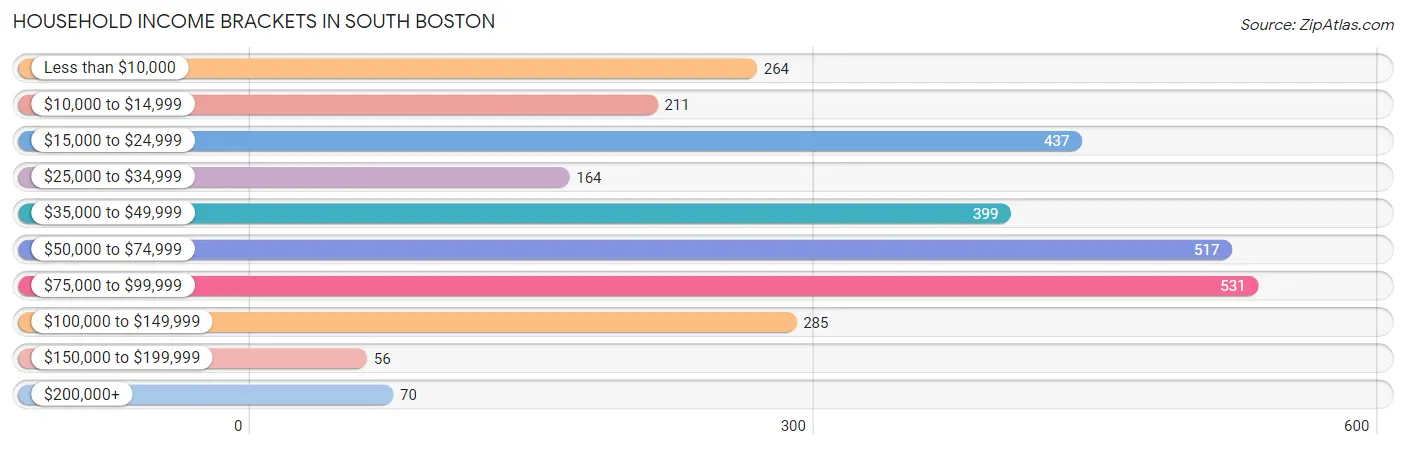
| Income Bracket | # Households | % Households |
| Less than $10,000 | 264 | 9.0% |
| $10,000 to $14,999 | 211 | 7.2% |
| $15,000 to $24,999 | 437 | 14.9% |
| $25,000 to $34,999 | 164 | 5.6% |
| $35,000 to $49,999 | 399 | 13.6% |
| $50,000 to $74,999 | 517 | 17.6% |
| $75,000 to $99,999 | 531 | 18.1% |
| $100,000 to $149,999 | 285 | 9.7% |
| $150,000 to $199,999 | 56 | 1.9% |
| $200,000+ | 70 | 2.4% |
Household Income by Householder Age in South Boston
The median household income in South Boston is $49,654, with the highest median household income of $59,953 found in the 45 to 64 years age bracket for the primary householder. A total of 1,043 households (35.5%) fall into this category. Meanwhile, the 65+ years age bracket for the primary householder has the lowest median household income of $33,589, with 993 households (33.8%) in this group.
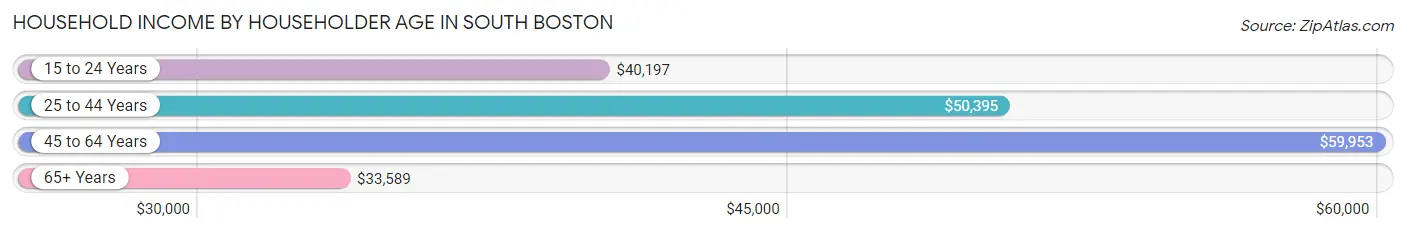
| Income Bracket | # Households | Median Income |
| 15 to 24 Years | 70 (2.4%) | $40,197 |
| 25 to 44 Years | 830 (28.3%) | $50,395 |
| 45 to 64 Years | 1,043 (35.5%) | $59,953 |
| 65+ Years | 993 (33.8%) | $33,589 |
| Total | 2,936 (100.0%) | $49,654 |
Poverty in South Boston
Income Below Poverty by Sex and Age in South Boston
With 12.9% poverty level for males and 25.7% for females among the residents of South Boston, under 5 year old males and 5 year old females are the most vulnerable to poverty, with 93 males (27.5%) and 52 females (57.8%) in their respective age groups living below the poverty level.
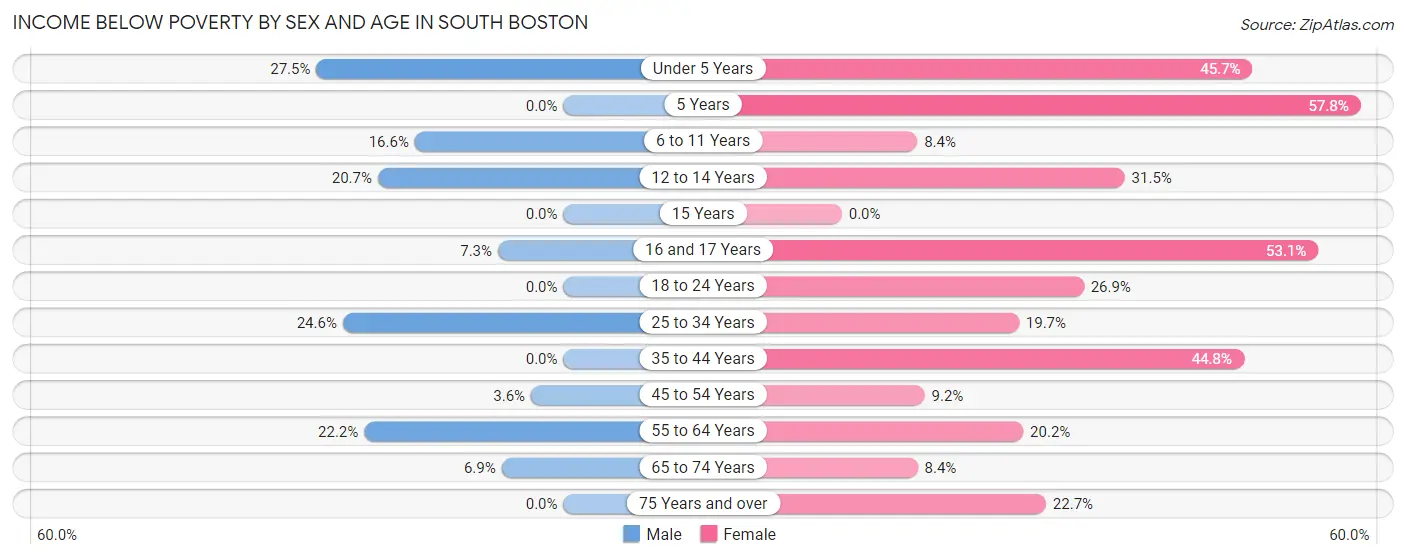
| Age Bracket | Male | Female |
| Under 5 Years | 93 (27.5%) | 182 (45.7%) |
| 5 Years | 0 (0.0%) | 52 (57.8%) |
| 6 to 11 Years | 46 (16.6%) | 22 (8.4%) |
| 12 to 14 Years | 25 (20.7%) | 40 (31.5%) |
| 15 Years | 0 (0.0%) | 0 (0.0%) |
| 16 and 17 Years | 7 (7.3%) | 148 (53.0%) |
| 18 to 24 Years | 0 (0.0%) | 73 (26.9%) |
| 25 to 34 Years | 101 (24.6%) | 100 (19.7%) |
| 35 to 44 Years | 0 (0.0%) | 167 (44.8%) |
| 45 to 54 Years | 15 (3.6%) | 40 (9.2%) |
| 55 to 64 Years | 77 (22.2%) | 80 (20.2%) |
| 65 to 74 Years | 24 (6.9%) | 38 (8.4%) |
| 75 Years and over | 0 (0.0%) | 143 (22.7%) |
| Total | 388 (12.9%) | 1,085 (25.7%) |
Income Above Poverty by Sex and Age in South Boston
According to the poverty statistics in South Boston, males aged 5 years and females aged 6 to 11 years are the age groups that are most secure financially, with 100.0% of males and 91.6% of females in these age groups living above the poverty line.
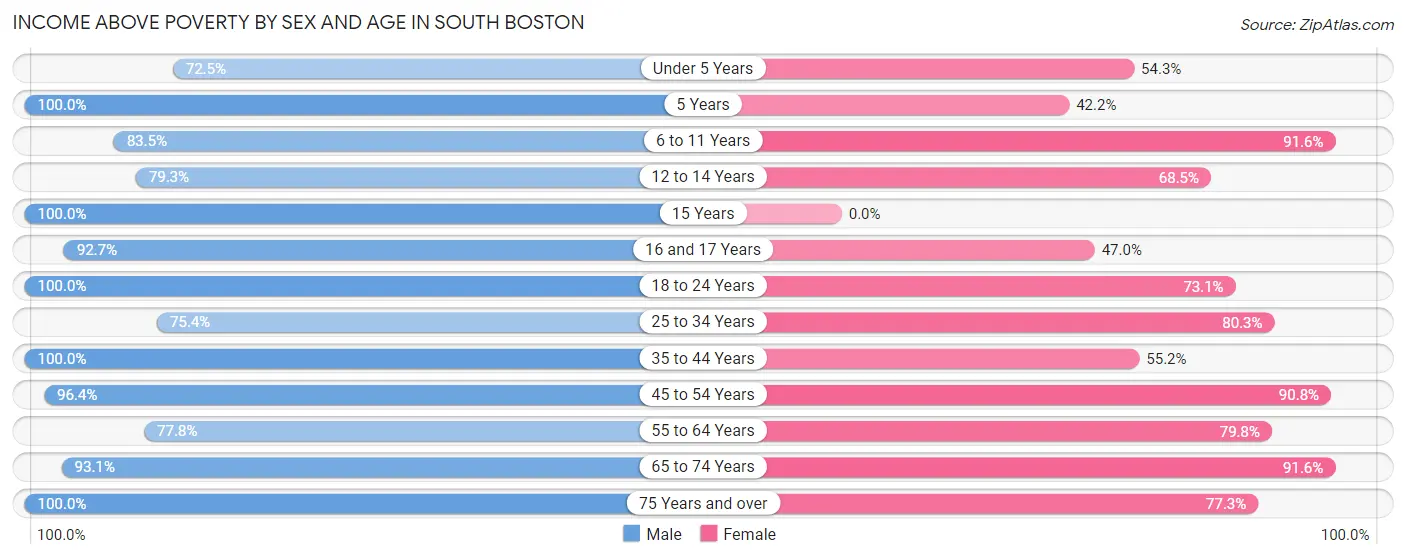
| Age Bracket | Male | Female |
| Under 5 Years | 245 (72.5%) | 216 (54.3%) |
| 5 Years | 57 (100.0%) | 38 (42.2%) |
| 6 to 11 Years | 232 (83.5%) | 240 (91.6%) |
| 12 to 14 Years | 96 (79.3%) | 87 (68.5%) |
| 15 Years | 32 (100.0%) | 0 (0.0%) |
| 16 and 17 Years | 89 (92.7%) | 131 (46.9%) |
| 18 to 24 Years | 204 (100.0%) | 198 (73.1%) |
| 25 to 34 Years | 310 (75.4%) | 407 (80.3%) |
| 35 to 44 Years | 280 (100.0%) | 206 (55.2%) |
| 45 to 54 Years | 401 (96.4%) | 394 (90.8%) |
| 55 to 64 Years | 270 (77.8%) | 316 (79.8%) |
| 65 to 74 Years | 325 (93.1%) | 412 (91.6%) |
| 75 Years and over | 80 (100.0%) | 486 (77.3%) |
| Total | 2,621 (87.1%) | 3,131 (74.3%) |
Income Below Poverty Among Married-Couple Families in South Boston
The poverty statistics for married-couple families in South Boston show that 5.8% or 46 of the total 790 families live below the poverty line. Families with 3 or 4 children have the highest poverty rate of 56.7%, comprising of 17 families. On the other hand, families with 1 or 2 children have the lowest poverty rate of 0.0%, which includes 0 families.
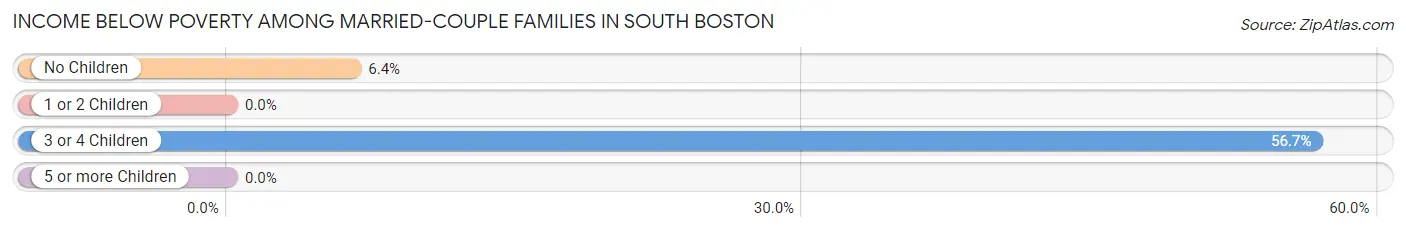
| Children | Above Poverty | Below Poverty |
| No Children | 421 (93.6%) | 29 (6.4%) |
| 1 or 2 Children | 310 (100.0%) | 0 (0.0%) |
| 3 or 4 Children | 13 (43.3%) | 17 (56.7%) |
| 5 or more Children | 0 (0.0%) | 0 (0.0%) |
| Total | 744 (94.2%) | 46 (5.8%) |
Income Below Poverty Among Single-Parent Households in South Boston
According to the poverty data in South Boston, 9.4% or 11 single-father households and 27.3% or 204 single-mother households are living below the poverty line. Among single-father households, those with 1 or 2 children have the highest poverty rate, with 11 households (33.3%) experiencing poverty. Likewise, among single-mother households, those with 1 or 2 children have the highest poverty rate, with 187 households (37.7%) falling below the poverty line.
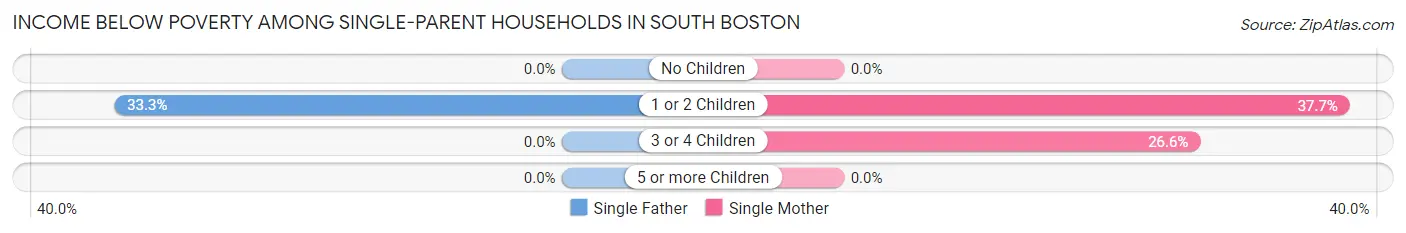
| Children | Single Father | Single Mother |
| No Children | 0 (0.0%) | 0 (0.0%) |
| 1 or 2 Children | 11 (33.3%) | 187 (37.7%) |
| 3 or 4 Children | 0 (0.0%) | 17 (26.6%) |
| 5 or more Children | 0 (0.0%) | 0 (0.0%) |
| Total | 11 (9.4%) | 204 (27.3%) |
Income Below Poverty Among Married-Couple vs Single-Parent Households in South Boston
The poverty data for South Boston shows that 46 of the married-couple family households (5.8%) and 215 of the single-parent households (24.9%) are living below the poverty level. Within the married-couple family households, those with 3 or 4 children have the highest poverty rate, with 17 households (56.7%) falling below the poverty line. Among the single-parent households, those with 1 or 2 children have the highest poverty rate, with 198 household (37.4%) living below poverty.
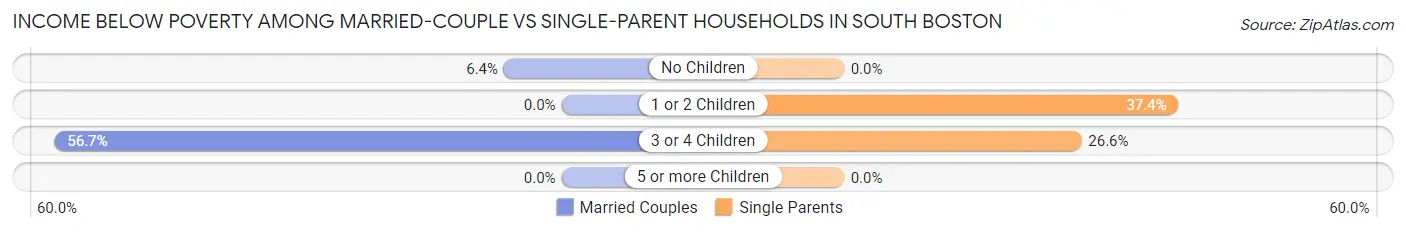
| Children | Married-Couple Families | Single-Parent Households |
| No Children | 29 (6.4%) | 0 (0.0%) |
| 1 or 2 Children | 0 (0.0%) | 198 (37.4%) |
| 3 or 4 Children | 17 (56.7%) | 17 (26.6%) |
| 5 or more Children | 0 (0.0%) | 0 (0.0%) |
| Total | 46 (5.8%) | 215 (24.9%) |
Race in South Boston
The most populous races in South Boston are Black / African American (4,214 | 53.1%), White / Caucasian (3,577 | 45.0%), and Hispanic or Latino (149 | 1.9%).
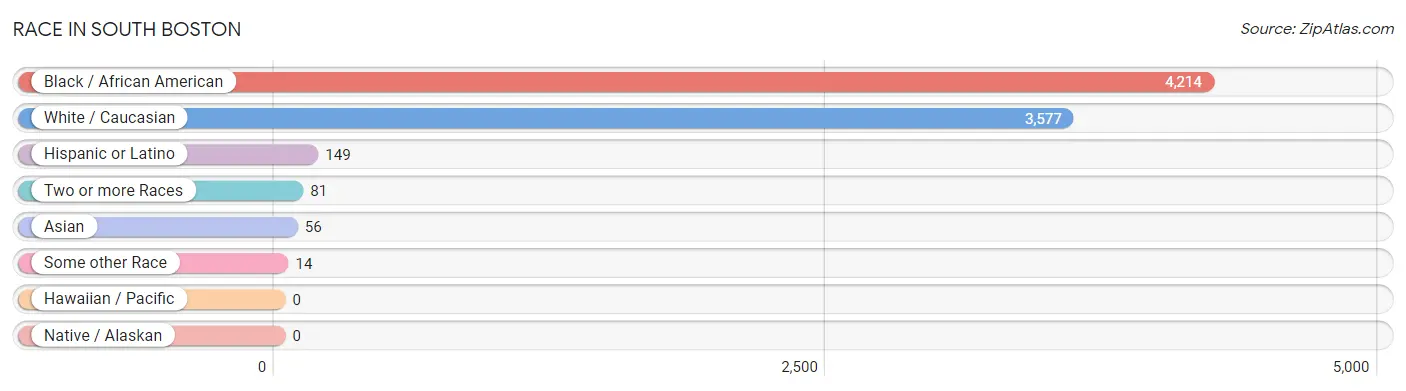
| Race | # Population | % Population |
| Asian | 56 | 0.7% |
| Black / African American | 4,214 | 53.1% |
| Hawaiian / Pacific | 0 | 0.0% |
| Hispanic or Latino | 149 | 1.9% |
| Native / Alaskan | 0 | 0.0% |
| White / Caucasian | 3,577 | 45.0% |
| Two or more Races | 81 | 1.0% |
| Some other Race | 14 | 0.2% |
| Total | 7,942 | 100.0% |
Ancestry in South Boston
The most populous ancestries reported in South Boston are American (1,052 | 13.3%), Subsaharan African (580 | 7.3%), German (512 | 6.5%), English (445 | 5.6%), and African (421 | 5.3%), together accounting for 37.9% of all South Boston residents.
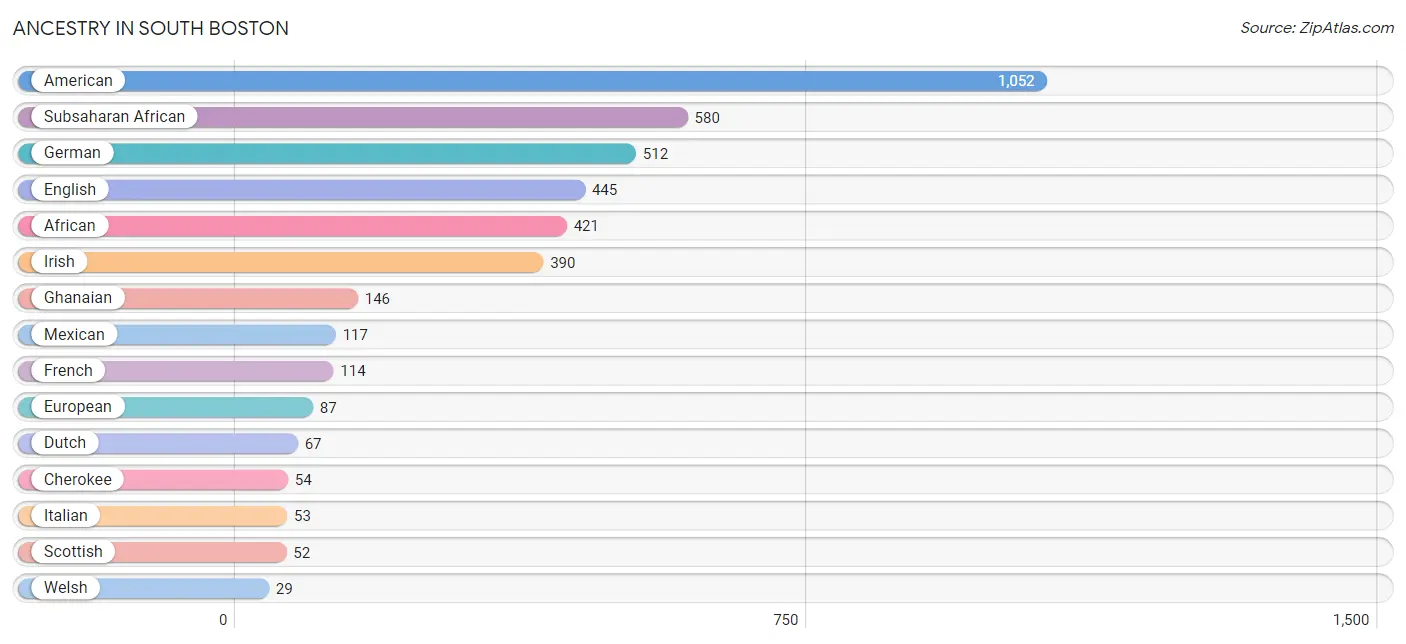
| Ancestry | # Population | % Population |
| African | 421 | 5.3% |
| American | 1,052 | 13.3% |
| Arab | 17 | 0.2% |
| British | 13 | 0.2% |
| Burmese | 15 | 0.2% |
| Cherokee | 54 | 0.7% |
| Colombian | 14 | 0.2% |
| Dutch | 67 | 0.8% |
| Eastern European | 25 | 0.3% |
| English | 445 | 5.6% |
| European | 87 | 1.1% |
| French | 114 | 1.4% |
| German | 512 | 6.5% |
| Ghanaian | 146 | 1.8% |
| Irish | 390 | 4.9% |
| Italian | 53 | 0.7% |
| Korean | 27 | 0.3% |
| Lebanese | 8 | 0.1% |
| Mexican | 117 | 1.5% |
| Moroccan | 9 | 0.1% |
| Polish | 27 | 0.3% |
| Puerto Rican | 18 | 0.2% |
| Scotch-Irish | 27 | 0.3% |
| Scottish | 52 | 0.6% |
| South American | 14 | 0.2% |
| Sri Lankan | 14 | 0.2% |
| Subsaharan African | 580 | 7.3% |
| Swedish | 26 | 0.3% |
| Swiss | 17 | 0.2% |
| Welsh | 29 | 0.4% | View All 30 Rows |
Immigrants in South Boston
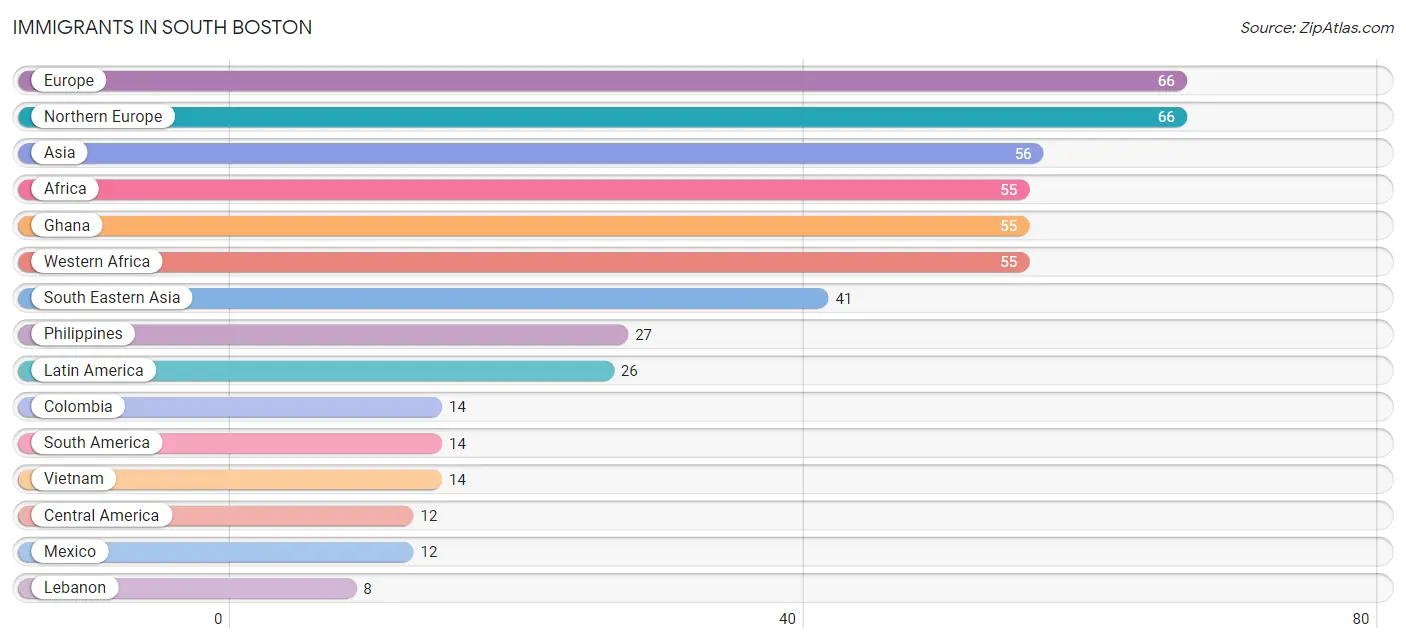
The most numerous immigrant groups reported in South Boston came from Europe (66 | 0.8%), Northern Europe (66 | 0.8%), Asia (56 | 0.7%), Africa (55 | 0.7%), and Ghana (55 | 0.7%), together accounting for 3.7% of all South Boston residents.
| Immigration Origin | # Population | % Population |
| Africa | 55 | 0.7% |
| Asia | 56 | 0.7% |
| Central America | 12 | 0.2% |
| Colombia | 14 | 0.2% |
| Eastern Asia | 7 | 0.1% |
| England | 2 | 0.0% |
| Europe | 66 | 0.8% |
| Ghana | 55 | 0.7% |
| Korea | 7 | 0.1% |
| Latin America | 26 | 0.3% |
| Lebanon | 8 | 0.1% |
| Mexico | 12 | 0.2% |
| Northern Europe | 66 | 0.8% |
| Philippines | 27 | 0.3% |
| South America | 14 | 0.2% |
| South Eastern Asia | 41 | 0.5% |
| Vietnam | 14 | 0.2% |
| Western Africa | 55 | 0.7% |
| Western Asia | 8 | 0.1% | View All 19 Rows |
Sex and Age in South Boston
Sex and Age in South Boston
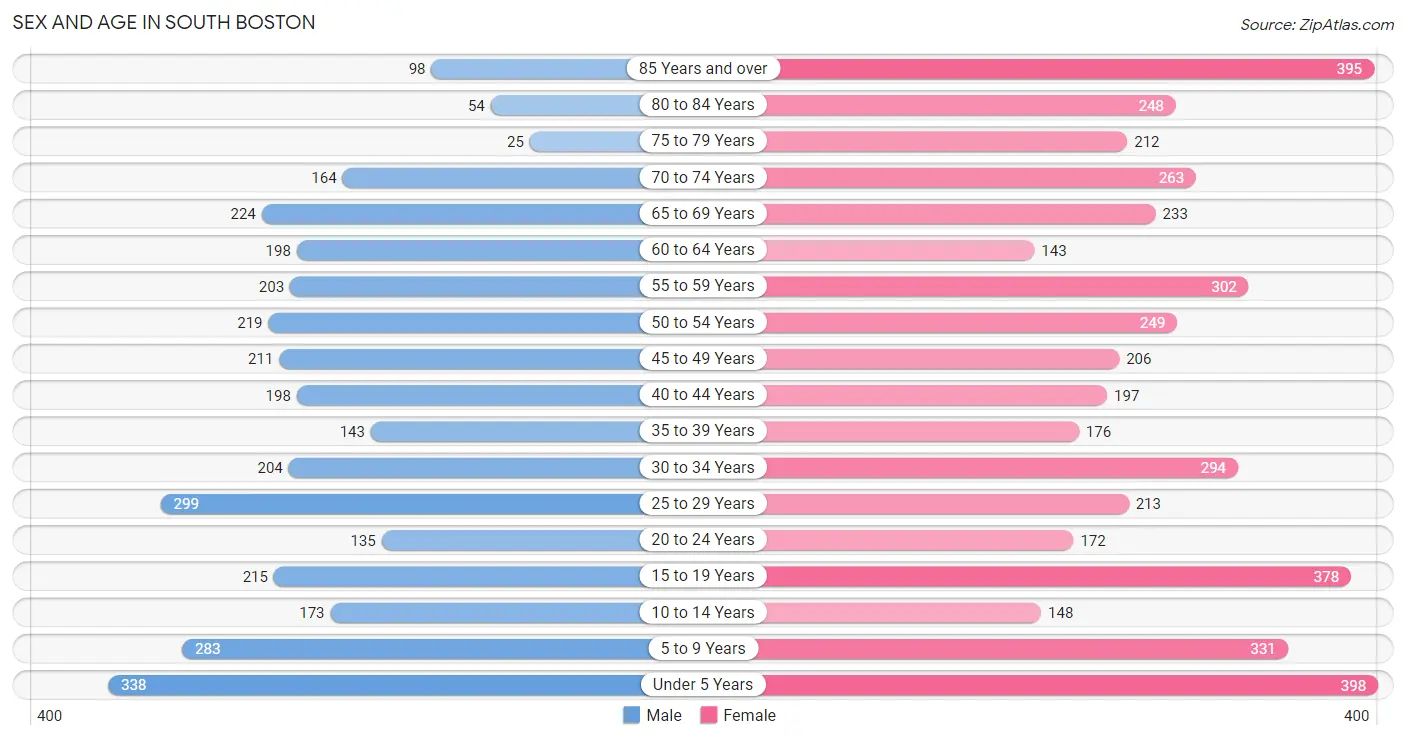
The most populous age groups in South Boston are Under 5 Years (338 | 10.0%) for men and Under 5 Years (398 | 8.7%) for women.
| Age Bracket | Male | Female |
| Under 5 Years | 338 (10.0%) | 398 (8.7%) |
| 5 to 9 Years | 283 (8.4%) | 331 (7.3%) |
| 10 to 14 Years | 173 (5.1%) | 148 (3.3%) |
| 15 to 19 Years | 215 (6.4%) | 378 (8.3%) |
| 20 to 24 Years | 135 (4.0%) | 172 (3.8%) |
| 25 to 29 Years | 299 (8.8%) | 213 (4.7%) |
| 30 to 34 Years | 204 (6.0%) | 294 (6.5%) |
| 35 to 39 Years | 143 (4.2%) | 176 (3.9%) |
| 40 to 44 Years | 198 (5.9%) | 197 (4.3%) |
| 45 to 49 Years | 211 (6.2%) | 206 (4.5%) |
| 50 to 54 Years | 219 (6.5%) | 249 (5.5%) |
| 55 to 59 Years | 203 (6.0%) | 302 (6.6%) |
| 60 to 64 Years | 198 (5.9%) | 143 (3.1%) |
| 65 to 69 Years | 224 (6.6%) | 233 (5.1%) |
| 70 to 74 Years | 164 (4.9%) | 263 (5.8%) |
| 75 to 79 Years | 25 (0.7%) | 212 (4.6%) |
| 80 to 84 Years | 54 (1.6%) | 248 (5.4%) |
| 85 Years and over | 98 (2.9%) | 395 (8.7%) |
| Total | 3,384 (100.0%) | 4,558 (100.0%) |
Families and Households in South Boston
Median Family Size in South Boston
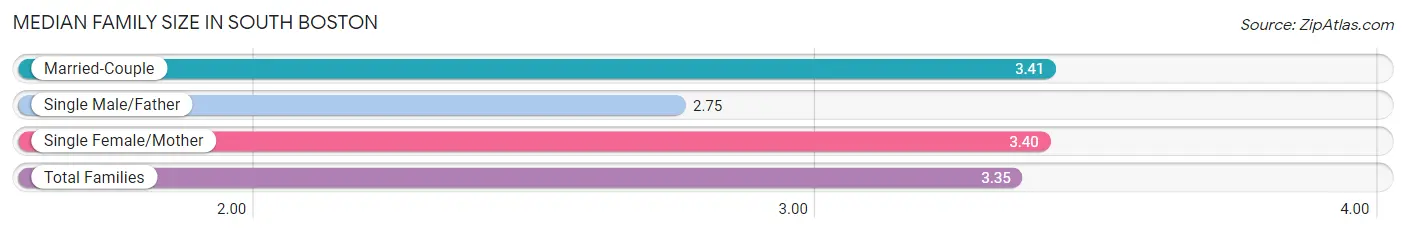
The median family size in South Boston is 3.35 persons per family, with married-couple families (790 | 47.8%) accounting for the largest median family size of 3.41 persons per family. On the other hand, single male/father families (117 | 7.1%) represent the smallest median family size with 2.75 persons per family.
| Family Type | # Families | Family Size |
| Married-Couple | 790 (47.8%) | 3.41 |
| Single Male/Father | 117 (7.1%) | 2.75 |
| Single Female/Mother | 747 (45.2%) | 3.40 |
| Total Families | 1,654 (100.0%) | 3.35 |
Median Household Size in South Boston
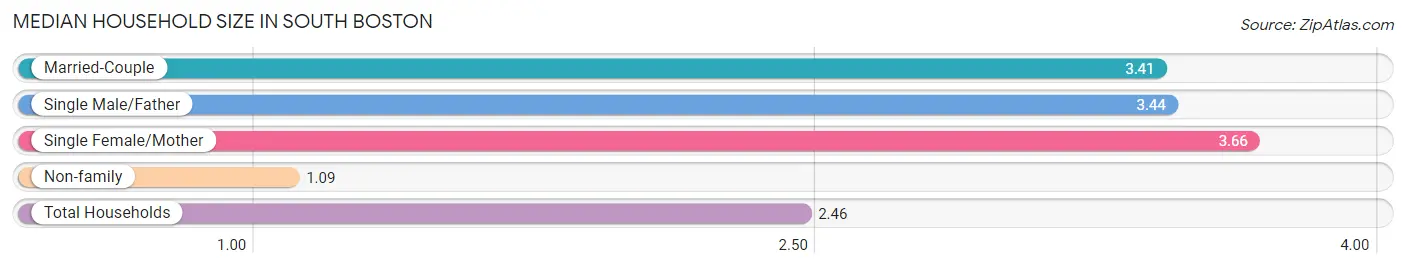
The median household size in South Boston is 2.46 persons per household, with single female/mother households (747 | 25.4%) accounting for the largest median household size of 3.66 persons per household. non-family households (1,282 | 43.7%) represent the smallest median household size with 1.09 persons per household.
| Household Type | # Households | Household Size |
| Married-Couple | 790 (26.9%) | 3.41 |
| Single Male/Father | 117 (4.0%) | 3.44 |
| Single Female/Mother | 747 (25.4%) | 3.66 |
| Non-family | 1,282 (43.7%) | 1.09 |
| Total Households | 2,936 (100.0%) | 2.46 |
Household Size by Marriage Status in South Boston
Out of a total of 2,936 households in South Boston, 1,654 (56.3%) are family households, while 1,282 (43.7%) are nonfamily households. The most numerous type of family households are 2-person households, comprising 772, and the most common type of nonfamily households are 1-person households, comprising 1,182.
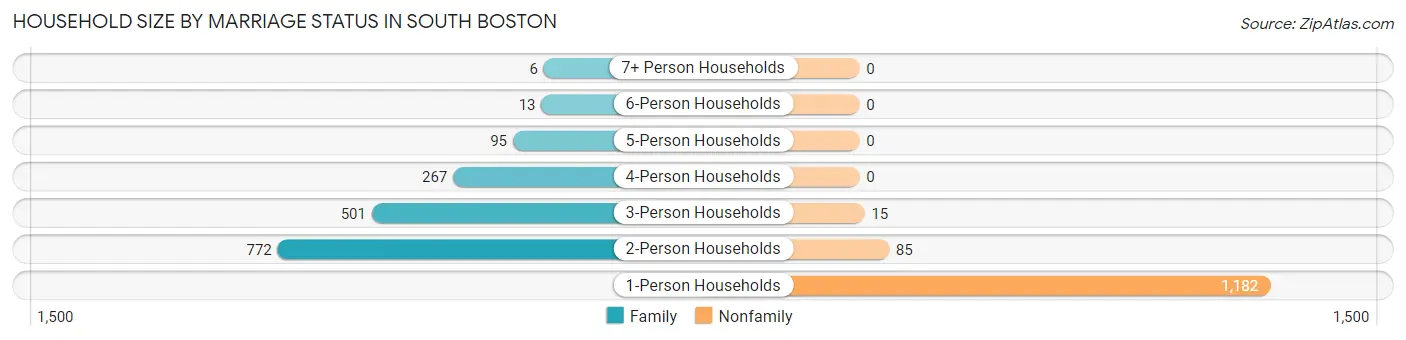
| Household Size | Family Households | Nonfamily Households |
| 1-Person Households | - | 1,182 (40.3%) |
| 2-Person Households | 772 (26.3%) | 85 (2.9%) |
| 3-Person Households | 501 (17.1%) | 15 (0.5%) |
| 4-Person Households | 267 (9.1%) | 0 (0.0%) |
| 5-Person Households | 95 (3.2%) | 0 (0.0%) |
| 6-Person Households | 13 (0.4%) | 0 (0.0%) |
| 7+ Person Households | 6 (0.2%) | 0 (0.0%) |
| Total | 1,654 (56.3%) | 1,282 (43.7%) |
Female Fertility in South Boston
Fertility by Age in South Boston
Average fertility rate in South Boston is 53.0 births per 1,000 women. Women in the age bracket of 20 to 34 years have the highest fertility rate with 119.0 births per 1,000 women. Women in the age bracket of 20 to 34 years acount for 92.0% of all women with births.
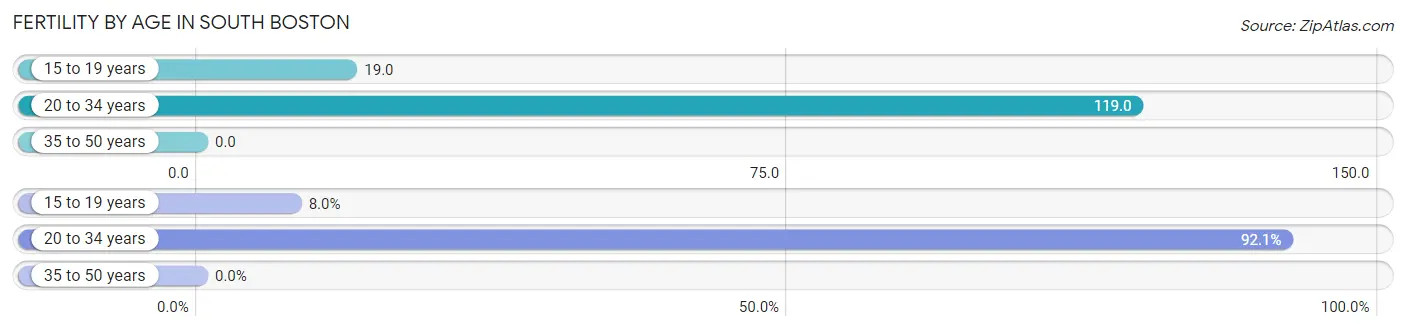
| Age Bracket | Women with Births | Births / 1,000 Women |
| 15 to 19 years | 7 (8.0%) | 19.0 |
| 20 to 34 years | 81 (92.0%) | 119.0 |
| 35 to 50 years | 0 (0.0%) | 0.0 |
| Total | 88 (100.0%) | 53.0 |
Fertility by Age by Marriage Status in South Boston
11.4% of women with births (88) in South Boston are married. The highest percentage of unmarried women with births falls into 15 to 19 years age bracket with 100.0% of them unmarried at the time of birth, while the lowest percentage of unmarried women with births belong to 20 to 34 years age bracket with 87.7% of them unmarried.
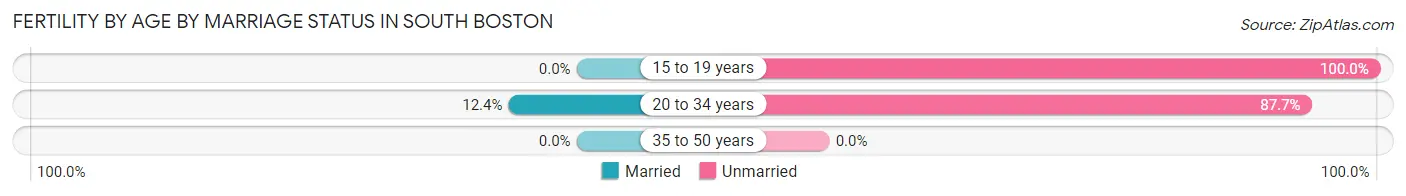
| Age Bracket | Married | Unmarried |
| 15 to 19 years | 0 (0.0%) | 7 (100.0%) |
| 20 to 34 years | 10 (12.3%) | 71 (87.6%) |
| 35 to 50 years | 0 (0.0%) | 0 (0.0%) |
| Total | 10 (11.4%) | 78 (88.6%) |
Fertility by Education in South Boston
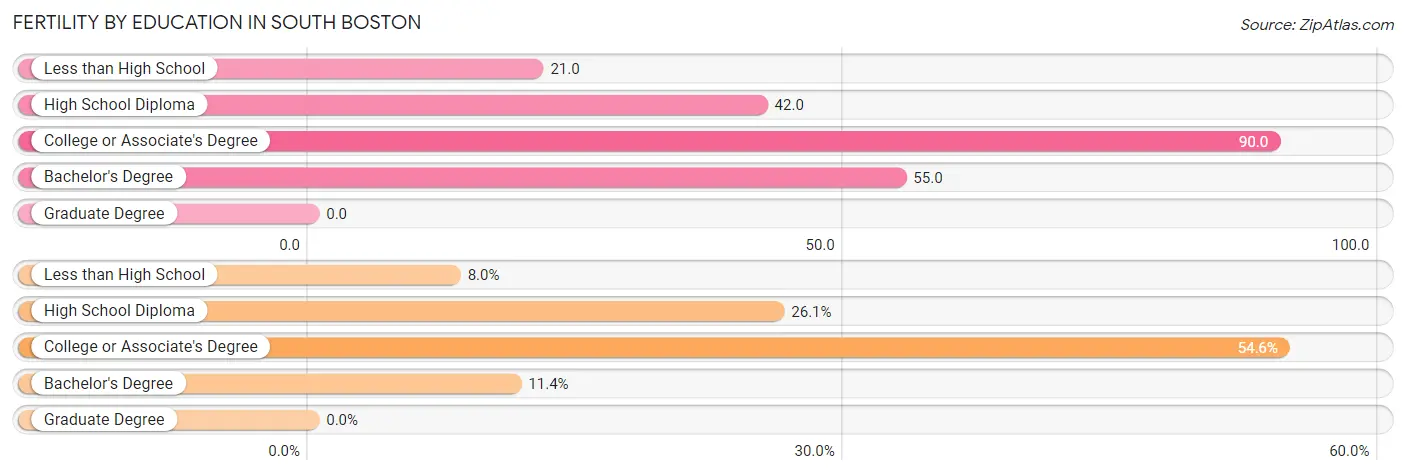
| Educational Attainment | Women with Births | Births / 1,000 Women |
| Less than High School | 7 (8.0%) | 21.0 |
| High School Diploma | 23 (26.1%) | 42.0 |
| College or Associate's Degree | 48 (54.5%) | 90.0 |
| Bachelor's Degree | 10 (11.4%) | 55.0 |
| Graduate Degree | 0 (0.0%) | 0.0 |
| Total | 88 (100.0%) | 53.0 |
Fertility by Education by Marriage Status in South Boston
88.6% of women with births in South Boston are unmarried. Women with the educational attainment of bachelor's degree are most likely to be married with 100.0% of them married at childbirth, while women with the educational attainment of less than high school are least likely to be married with 100.0% of them unmarried at childbirth.
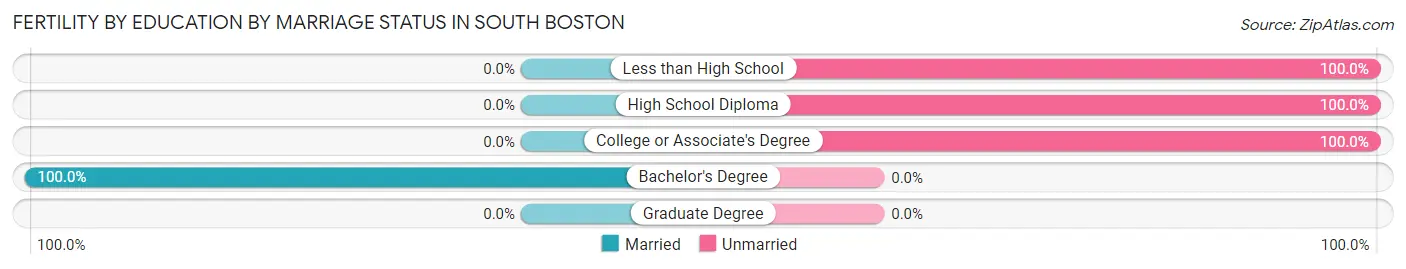
| Educational Attainment | Married | Unmarried |
| Less than High School | 0 (0.0%) | 7 (100.0%) |
| High School Diploma | 0 (0.0%) | 23 (100.0%) |
| College or Associate's Degree | 0 (0.0%) | 48 (100.0%) |
| Bachelor's Degree | 10 (100.0%) | 0 (0.0%) |
| Graduate Degree | 0 (0.0%) | 0 (0.0%) |
| Total | 10 (11.4%) | 78 (88.6%) |
Employment Characteristics in South Boston
Employment by Class of Employer in South Boston
Among the 2,796 employed individuals in South Boston, private company employees (1,886 | 67.4%), local government employees (287 | 10.3%), and not-for-profit organizations (272 | 9.7%) make up the most common classes of employment.
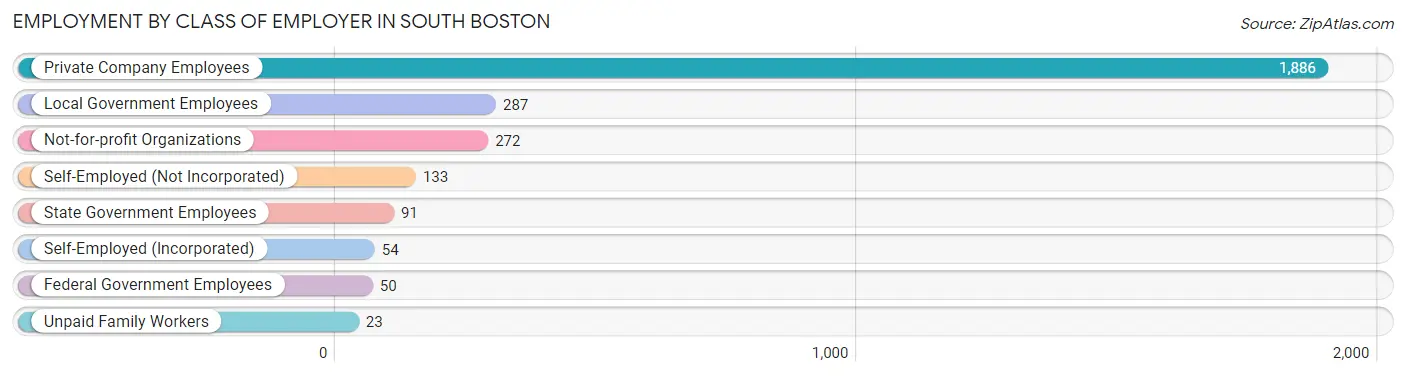
| Employer Class | # Employees | % Employees |
| Private Company Employees | 1,886 | 67.4% |
| Self-Employed (Incorporated) | 54 | 1.9% |
| Self-Employed (Not Incorporated) | 133 | 4.8% |
| Not-for-profit Organizations | 272 | 9.7% |
| Local Government Employees | 287 | 10.3% |
| State Government Employees | 91 | 3.3% |
| Federal Government Employees | 50 | 1.8% |
| Unpaid Family Workers | 23 | 0.8% |
| Total | 2,796 | 100.0% |
Employment Status by Age in South Boston
According to the labor force statistics for South Boston, out of the total population over 16 years of age (6,239), 48.5% or 3,026 individuals are in the labor force, with 4.3% or 130 of them unemployed. The age group with the highest labor force participation rate is 25 to 29 years, with 84.4% or 432 individuals in the labor force. Within the labor force, the 30 to 34 years age range has the highest percentage of unemployed individuals, with 16.0% or 61 of them being unemployed.
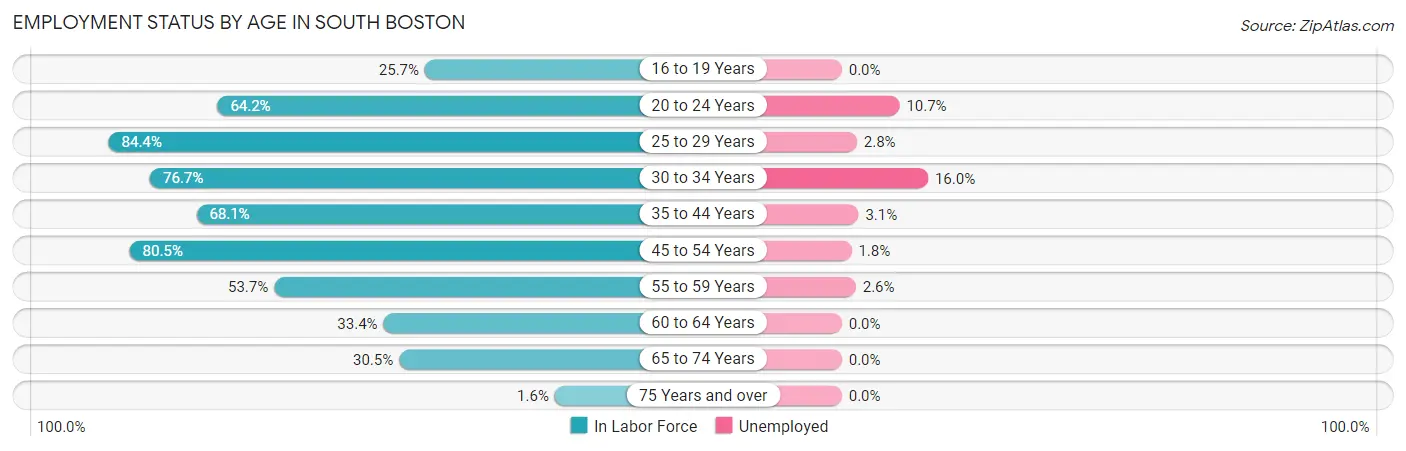
| Age Bracket | In Labor Force | Unemployed |
| 16 to 19 Years | 144 (25.7%) | 0 (0.0%) |
| 20 to 24 Years | 197 (64.2%) | 21 (10.7%) |
| 25 to 29 Years | 432 (84.4%) | 12 (2.8%) |
| 30 to 34 Years | 382 (76.7%) | 61 (16.0%) |
| 35 to 44 Years | 486 (68.1%) | 15 (3.1%) |
| 45 to 54 Years | 712 (80.5%) | 13 (1.8%) |
| 55 to 59 Years | 271 (53.7%) | 7 (2.6%) |
| 60 to 64 Years | 114 (33.4%) | 0 (0.0%) |
| 65 to 74 Years | 270 (30.5%) | 0 (0.0%) |
| 75 Years and over | 17 (1.6%) | 0 (0.0%) |
| Total | 3,026 (48.5%) | 130 (4.3%) |
Employment Status by Educational Attainment in South Boston
According to labor force statistics for South Boston, 69.4% of individuals (2,398) out of the total population between 25 and 64 years of age (3,455) are in the labor force, with 4.5% or 108 of them being unemployed. The group with the highest labor force participation rate are those with the educational attainment of bachelor's degree or higher, with 83.5% or 652 individuals in the labor force. Within the labor force, individuals with less than high school education have the highest percentage of unemployment, with 17.6% or 15 of them being unemployed.
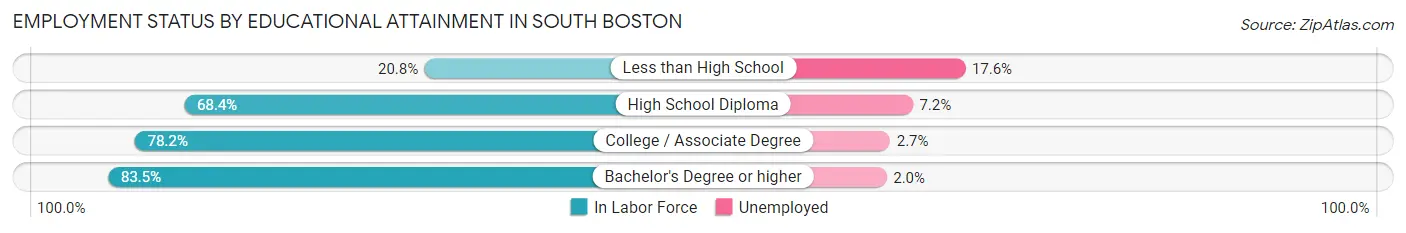
| Educational Attainment | In Labor Force | Unemployed |
| Less than High School | 85 (20.8%) | 72 (17.6%) |
| High School Diploma | 780 (68.4%) | 82 (7.2%) |
| College / Associate Degree | 881 (78.2%) | 30 (2.7%) |
| Bachelor's Degree or higher | 652 (83.5%) | 16 (2.0%) |
| Total | 2,398 (69.4%) | 155 (4.5%) |
Employment Occupations by Sex in South Boston
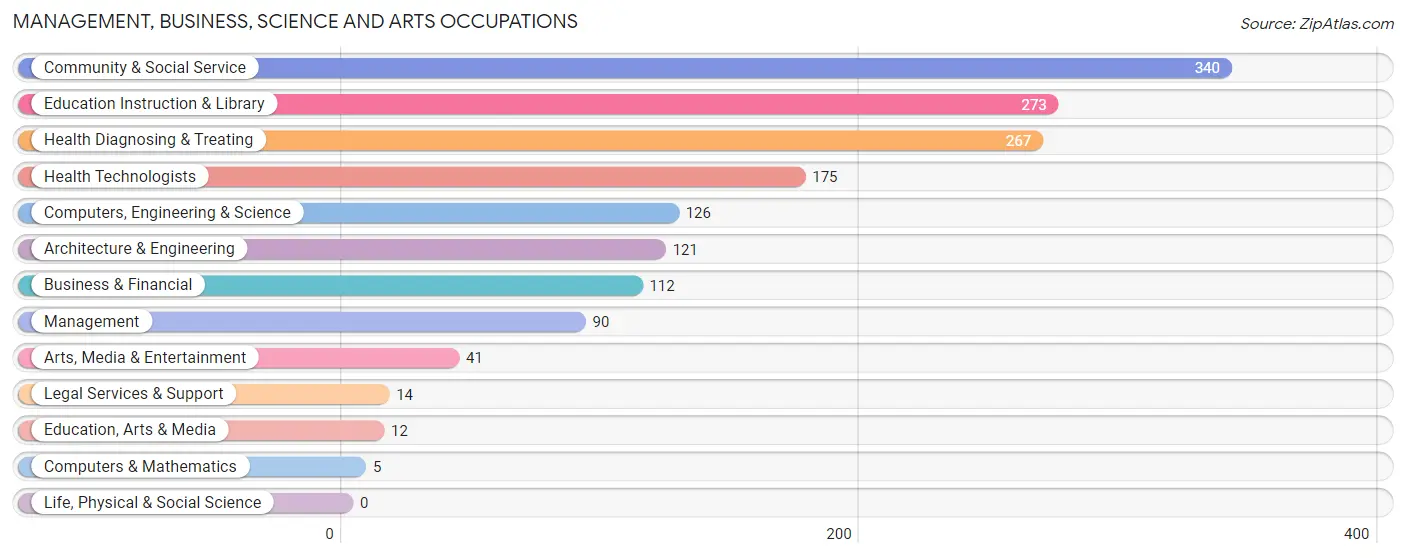
Management, Business, Science and Arts Occupations
The most common Management, Business, Science and Arts occupations in South Boston are Community & Social Service (340 | 11.7%), Education Instruction & Library (273 | 9.4%), Health Diagnosing & Treating (267 | 9.2%), Health Technologists (175 | 6.0%), and Computers, Engineering & Science (126 | 4.3%).
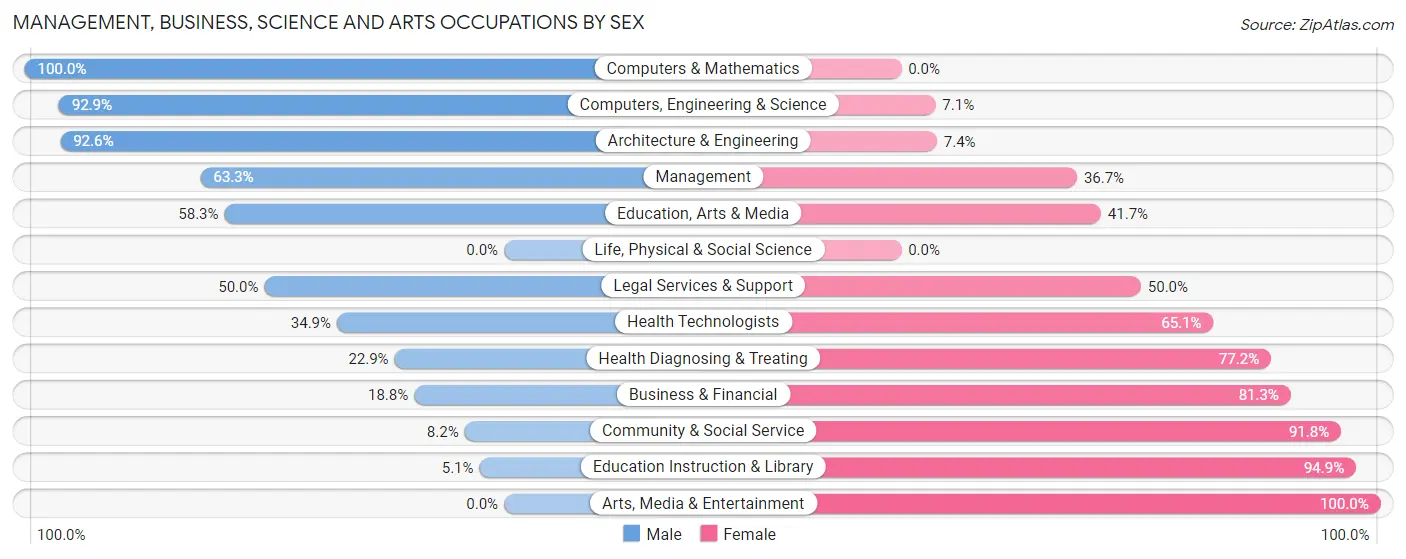
Management, Business, Science and Arts Occupations by Sex
Within the Management, Business, Science and Arts occupations in South Boston, the most male-oriented occupations are Computers & Mathematics (100.0%), Computers, Engineering & Science (92.9%), and Architecture & Engineering (92.6%), while the most female-oriented occupations are Arts, Media & Entertainment (100.0%), Education Instruction & Library (94.9%), and Community & Social Service (91.8%).
| Occupation | Male | Female |
| Management | 57 (63.3%) | 33 (36.7%) |
| Business & Financial | 21 (18.8%) | 91 (81.2%) |
| Computers, Engineering & Science | 117 (92.9%) | 9 (7.1%) |
| Computers & Mathematics | 5 (100.0%) | 0 (0.0%) |
| Architecture & Engineering | 112 (92.6%) | 9 (7.4%) |
| Life, Physical & Social Science | 0 (0.0%) | 0 (0.0%) |
| Community & Social Service | 28 (8.2%) | 312 (91.8%) |
| Education, Arts & Media | 7 (58.3%) | 5 (41.7%) |
| Legal Services & Support | 7 (50.0%) | 7 (50.0%) |
| Education Instruction & Library | 14 (5.1%) | 259 (94.9%) |
| Arts, Media & Entertainment | 0 (0.0%) | 41 (100.0%) |
| Health Diagnosing & Treating | 61 (22.9%) | 206 (77.1%) |
| Health Technologists | 61 (34.9%) | 114 (65.1%) |
| Total (Category) | 284 (30.4%) | 651 (69.6%) |
| Total (Overall) | 1,222 (42.2%) | 1,674 (57.8%) |
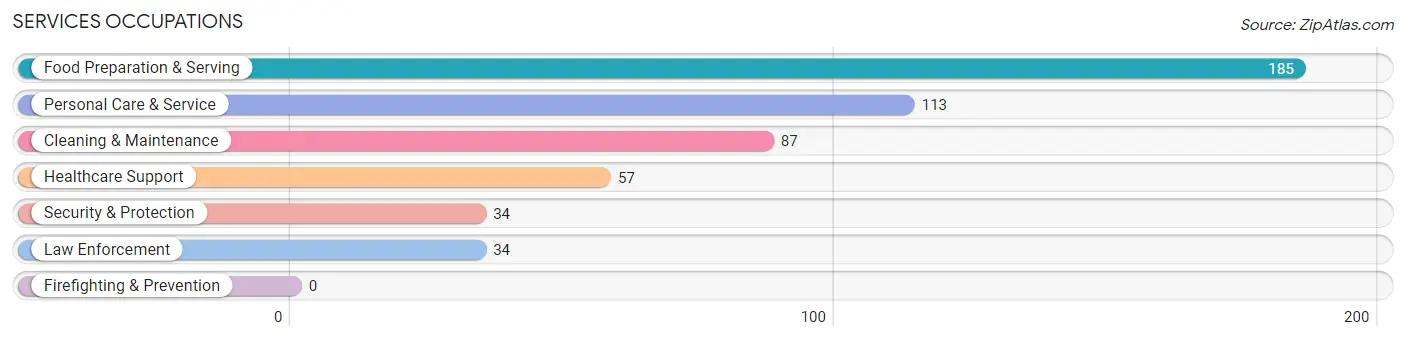
Services Occupations
The most common Services occupations in South Boston are Food Preparation & Serving (185 | 6.4%), Personal Care & Service (113 | 3.9%), Cleaning & Maintenance (87 | 3.0%), Healthcare Support (57 | 2.0%), and Security & Protection (34 | 1.2%).
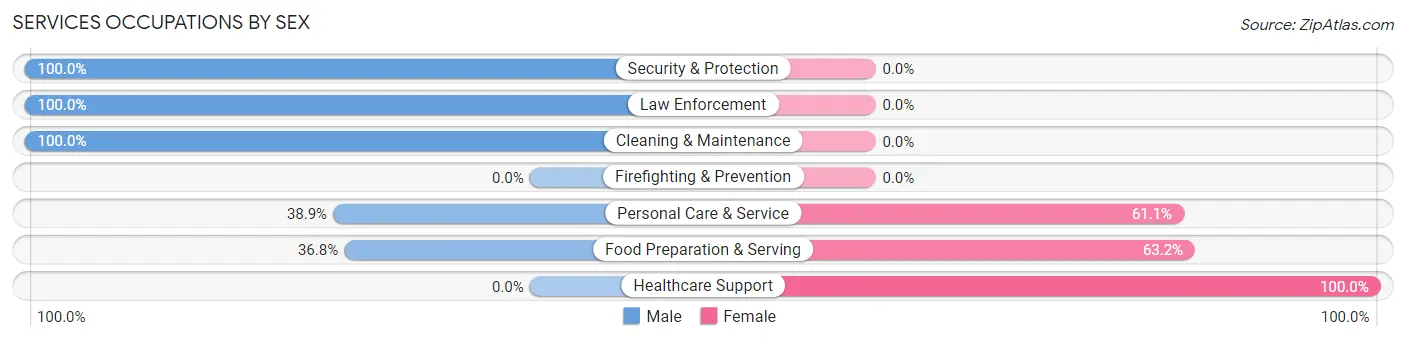
Services Occupations by Sex
Within the Services occupations in South Boston, the most male-oriented occupations are Security & Protection (100.0%), Law Enforcement (100.0%), and Cleaning & Maintenance (100.0%), while the most female-oriented occupations are Healthcare Support (100.0%), Food Preparation & Serving (63.2%), and Personal Care & Service (61.1%).
| Occupation | Male | Female |
| Healthcare Support | 0 (0.0%) | 57 (100.0%) |
| Security & Protection | 34 (100.0%) | 0 (0.0%) |
| Firefighting & Prevention | 0 (0.0%) | 0 (0.0%) |
| Law Enforcement | 34 (100.0%) | 0 (0.0%) |
| Food Preparation & Serving | 68 (36.8%) | 117 (63.2%) |
| Cleaning & Maintenance | 87 (100.0%) | 0 (0.0%) |
| Personal Care & Service | 44 (38.9%) | 69 (61.1%) |
| Total (Category) | 233 (48.9%) | 243 (51.0%) |
| Total (Overall) | 1,222 (42.2%) | 1,674 (57.8%) |
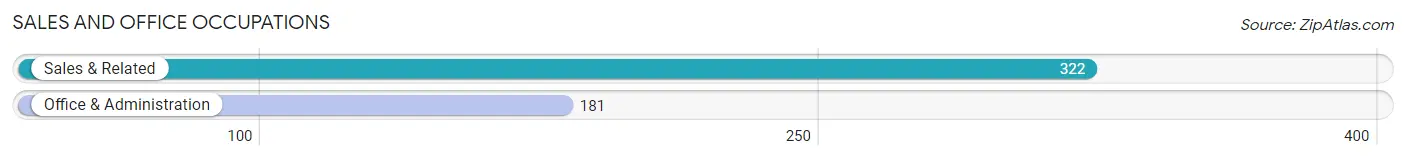
Sales and Office Occupations
The most common Sales and Office occupations in South Boston are Sales & Related (322 | 11.1%), and Office & Administration (181 | 6.2%).
Sales and Office Occupations by Sex
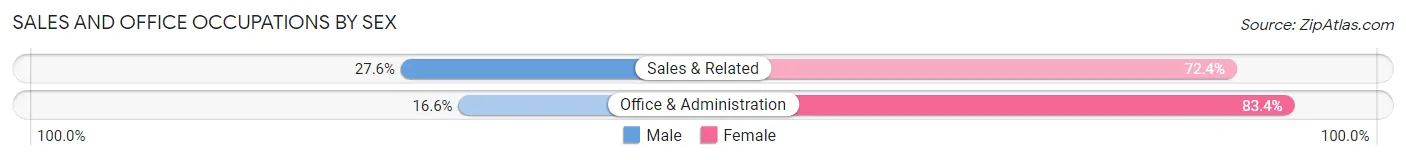
| Occupation | Male | Female |
| Sales & Related | 89 (27.6%) | 233 (72.4%) |
| Office & Administration | 30 (16.6%) | 151 (83.4%) |
| Total (Category) | 119 (23.7%) | 384 (76.3%) |
| Total (Overall) | 1,222 (42.2%) | 1,674 (57.8%) |
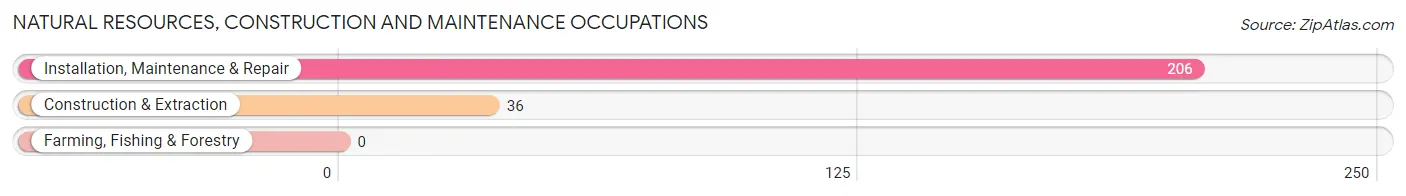
Natural Resources, Construction and Maintenance Occupations
The most common Natural Resources, Construction and Maintenance occupations in South Boston are Installation, Maintenance & Repair (206 | 7.1%), and Construction & Extraction (36 | 1.2%).
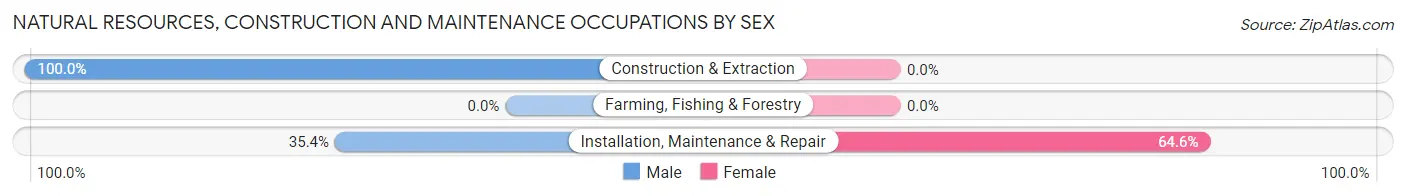
Natural Resources, Construction and Maintenance Occupations by Sex
| Occupation | Male | Female |
| Farming, Fishing & Forestry | 0 (0.0%) | 0 (0.0%) |
| Construction & Extraction | 36 (100.0%) | 0 (0.0%) |
| Installation, Maintenance & Repair | 73 (35.4%) | 133 (64.6%) |
| Total (Category) | 109 (45.0%) | 133 (55.0%) |
| Total (Overall) | 1,222 (42.2%) | 1,674 (57.8%) |
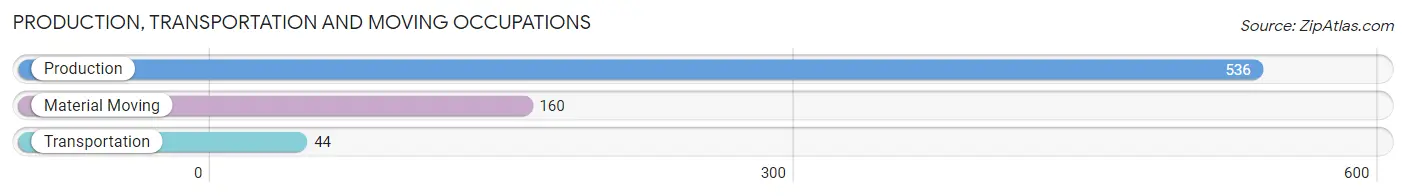
Production, Transportation and Moving Occupations
The most common Production, Transportation and Moving occupations in South Boston are Production (536 | 18.5%), Material Moving (160 | 5.5%), and Transportation (44 | 1.5%).
Production, Transportation and Moving Occupations by Sex
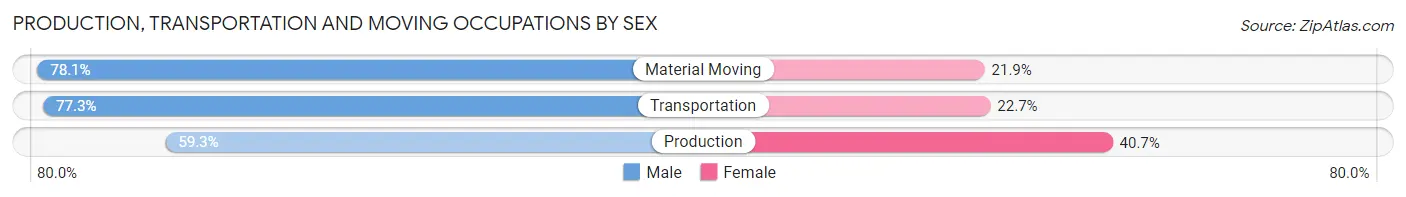
| Occupation | Male | Female |
| Production | 318 (59.3%) | 218 (40.7%) |
| Transportation | 34 (77.3%) | 10 (22.7%) |
| Material Moving | 125 (78.1%) | 35 (21.9%) |
| Total (Category) | 477 (64.5%) | 263 (35.5%) |
| Total (Overall) | 1,222 (42.2%) | 1,674 (57.8%) |
Employment Industries by Sex in South Boston
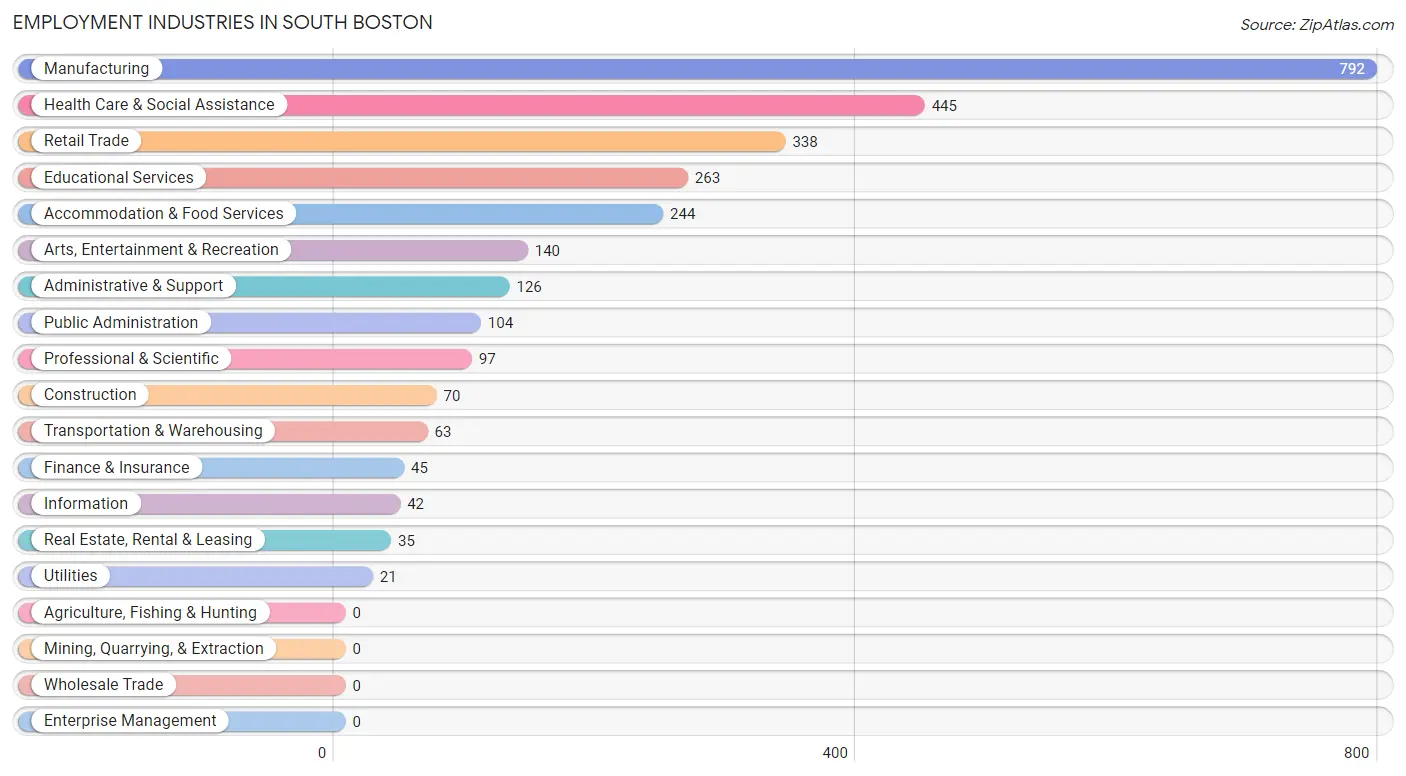
Employment Industries in South Boston
The major employment industries in South Boston include Manufacturing (792 | 27.4%), Health Care & Social Assistance (445 | 15.4%), Retail Trade (338 | 11.7%), Educational Services (263 | 9.1%), and Accommodation & Food Services (244 | 8.4%).
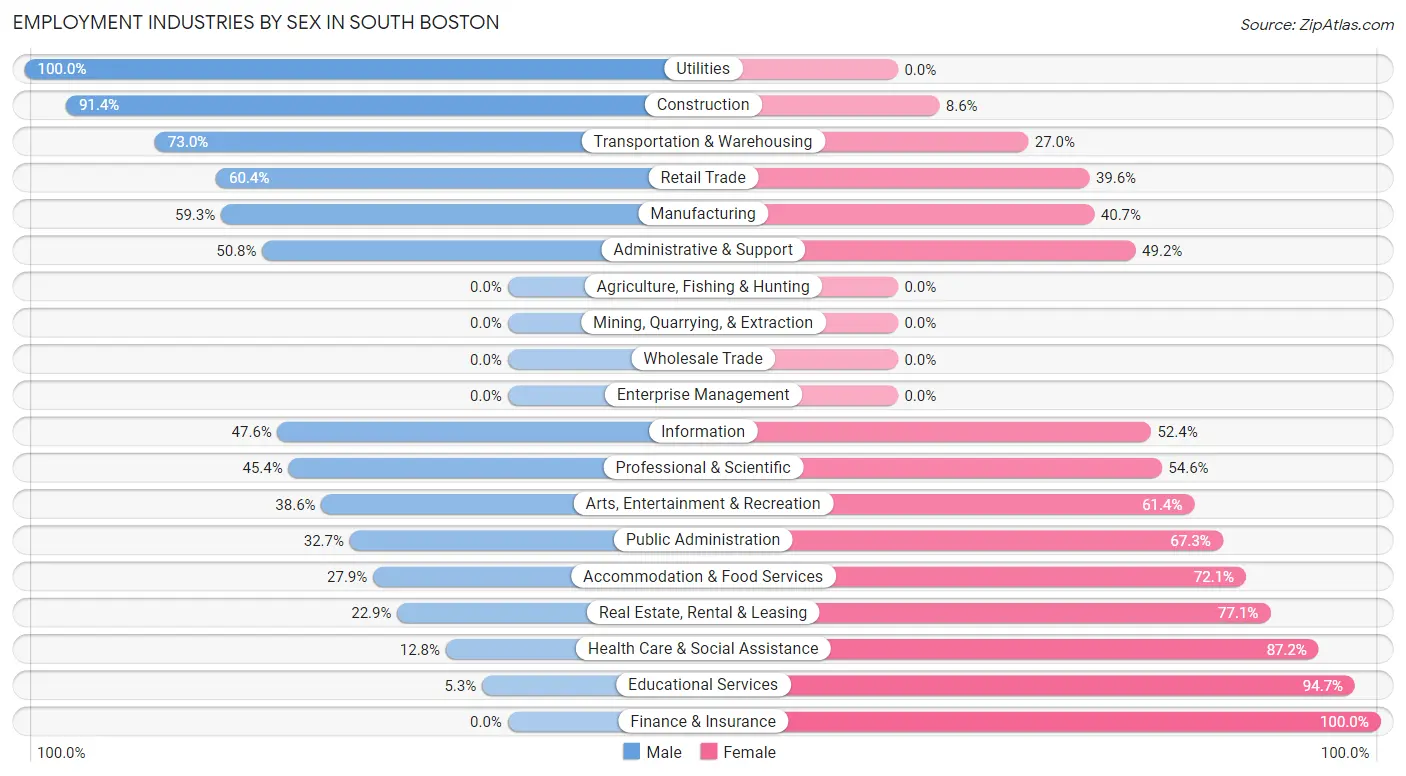
Employment Industries by Sex in South Boston
The South Boston industries that see more men than women are Utilities (100.0%), Construction (91.4%), and Transportation & Warehousing (73.0%), whereas the industries that tend to have a higher number of women are Finance & Insurance (100.0%), Educational Services (94.7%), and Health Care & Social Assistance (87.2%).
| Industry | Male | Female |
| Agriculture, Fishing & Hunting | 0 (0.0%) | 0 (0.0%) |
| Mining, Quarrying, & Extraction | 0 (0.0%) | 0 (0.0%) |
| Construction | 64 (91.4%) | 6 (8.6%) |
| Manufacturing | 470 (59.3%) | 322 (40.7%) |
| Wholesale Trade | 0 (0.0%) | 0 (0.0%) |
| Retail Trade | 204 (60.4%) | 134 (39.6%) |
| Transportation & Warehousing | 46 (73.0%) | 17 (27.0%) |
| Utilities | 21 (100.0%) | 0 (0.0%) |
| Information | 20 (47.6%) | 22 (52.4%) |
| Finance & Insurance | 0 (0.0%) | 45 (100.0%) |
| Real Estate, Rental & Leasing | 8 (22.9%) | 27 (77.1%) |
| Professional & Scientific | 44 (45.4%) | 53 (54.6%) |
| Enterprise Management | 0 (0.0%) | 0 (0.0%) |
| Administrative & Support | 64 (50.8%) | 62 (49.2%) |
| Educational Services | 14 (5.3%) | 249 (94.7%) |
| Health Care & Social Assistance | 57 (12.8%) | 388 (87.2%) |
| Arts, Entertainment & Recreation | 54 (38.6%) | 86 (61.4%) |
| Accommodation & Food Services | 68 (27.9%) | 176 (72.1%) |
| Public Administration | 34 (32.7%) | 70 (67.3%) |
| Total | 1,222 (42.2%) | 1,674 (57.8%) |
Education in South Boston
School Enrollment in South Boston
The most common levels of schooling among the 1,665 students in South Boston are high school (594 | 35.7%), elementary school (388 | 23.3%), and kindergarten (299 | 18.0%).
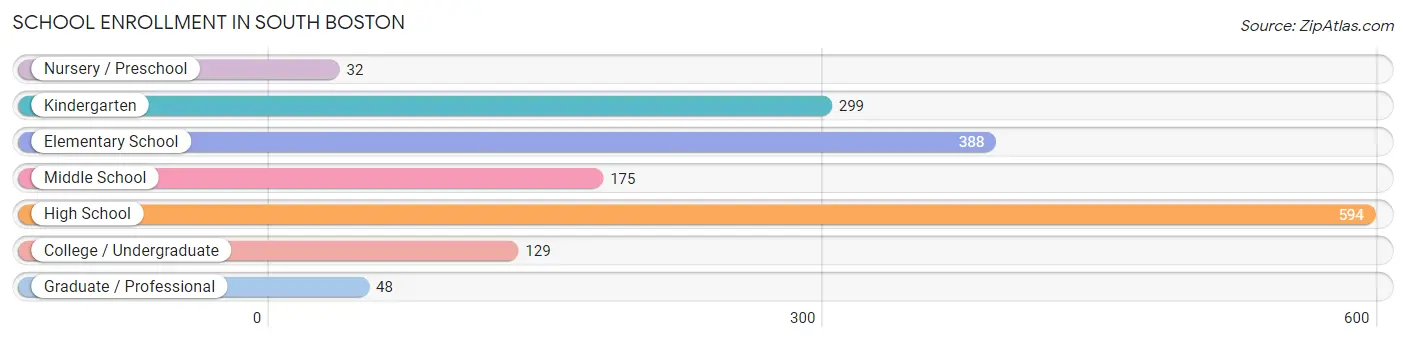
| School Level | # Students | % Students |
| Nursery / Preschool | 32 | 1.9% |
| Kindergarten | 299 | 18.0% |
| Elementary School | 388 | 23.3% |
| Middle School | 175 | 10.5% |
| High School | 594 | 35.7% |
| College / Undergraduate | 129 | 7.7% |
| Graduate / Professional | 48 | 2.9% |
| Total | 1,665 | 100.0% |
School Enrollment by Age by Funding Source in South Boston
Out of a total of 1,665 students who are enrolled in schools in South Boston, 148 (8.9%) attend a private institution, while the remaining 1,517 (91.1%) are enrolled in public schools. The age group of 18 to 19 year olds has the highest likelihood of being enrolled in private schools, with 67 (72.0% in the age bracket) enrolled. Conversely, the age group of 3 to 4 year olds has the lowest likelihood of being enrolled in a private school, with 66 (100.0% in the age bracket) attending a public institution.
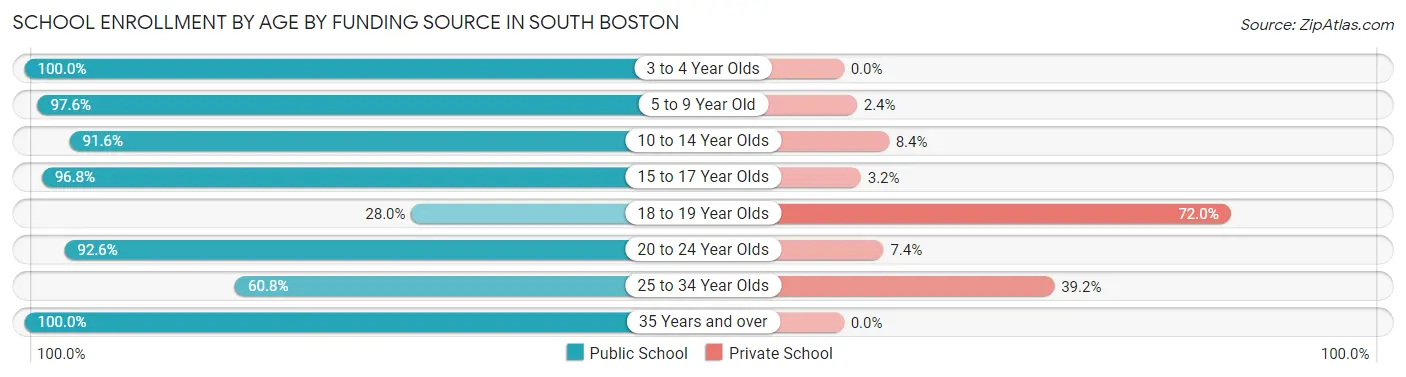
| Age Bracket | Public School | Private School |
| 3 to 4 Year Olds | 66 (100.0%) | 0 (0.0%) |
| 5 to 9 Year Old | 599 (97.6%) | 15 (2.4%) |
| 10 to 14 Year Olds | 273 (91.6%) | 25 (8.4%) |
| 15 to 17 Year Olds | 394 (96.8%) | 13 (3.2%) |
| 18 to 19 Year Olds | 26 (28.0%) | 67 (72.0%) |
| 20 to 24 Year Olds | 100 (92.6%) | 8 (7.4%) |
| 25 to 34 Year Olds | 31 (60.8%) | 20 (39.2%) |
| 35 Years and over | 28 (100.0%) | 0 (0.0%) |
| Total | 1,517 (91.1%) | 148 (8.9%) |
Educational Attainment by Field of Study in South Boston
Business (302 | 26.7%), education (160 | 14.1%), science & technology (158 | 14.0%), social sciences (92 | 8.1%), and psychology (66 | 5.8%) are the most common fields of study among 1,132 individuals in South Boston who have obtained a bachelor's degree or higher.
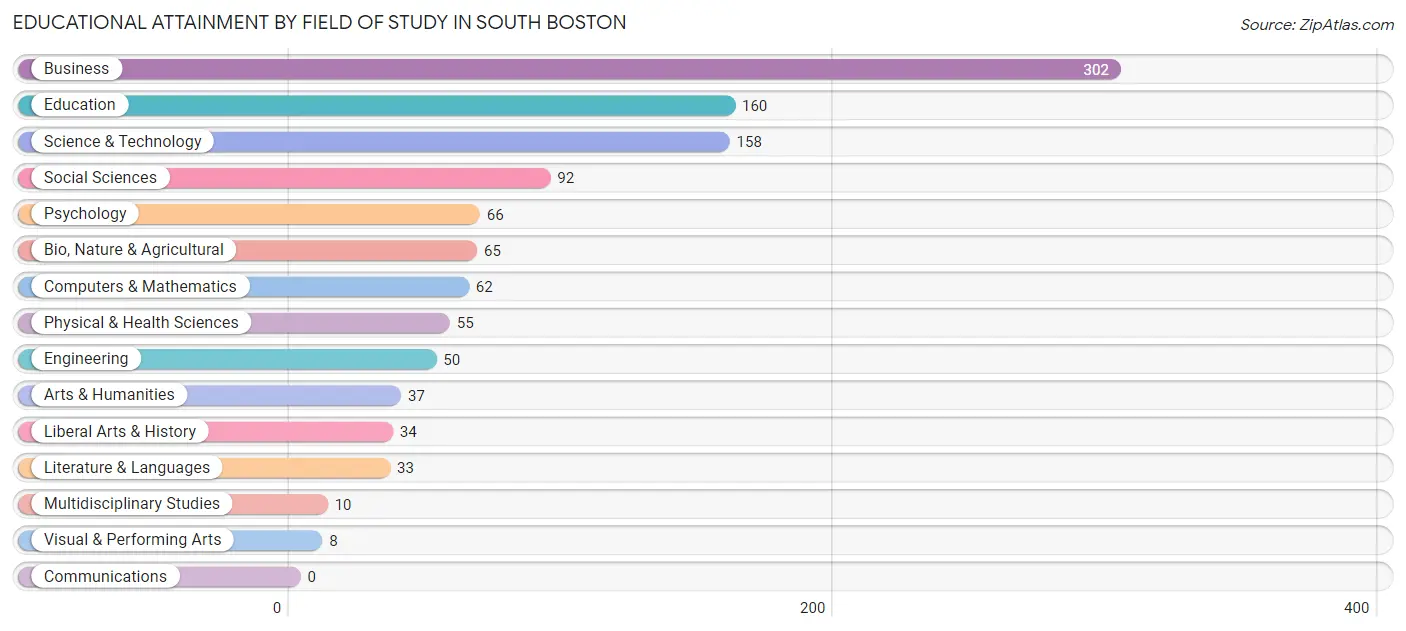
| Field of Study | # Graduates | % Graduates |
| Computers & Mathematics | 62 | 5.5% |
| Bio, Nature & Agricultural | 65 | 5.7% |
| Physical & Health Sciences | 55 | 4.9% |
| Psychology | 66 | 5.8% |
| Social Sciences | 92 | 8.1% |
| Engineering | 50 | 4.4% |
| Multidisciplinary Studies | 10 | 0.9% |
| Science & Technology | 158 | 14.0% |
| Business | 302 | 26.7% |
| Education | 160 | 14.1% |
| Literature & Languages | 33 | 2.9% |
| Liberal Arts & History | 34 | 3.0% |
| Visual & Performing Arts | 8 | 0.7% |
| Communications | 0 | 0.0% |
| Arts & Humanities | 37 | 3.3% |
| Total | 1,132 | 100.0% |
Transportation & Commute in South Boston
Vehicle Availability by Sex in South Boston
The most prevalent vehicle ownership categories in South Boston are males with 2 vehicles (486, accounting for 41.1%) and females with 2 vehicles (546, making up 30.2%).
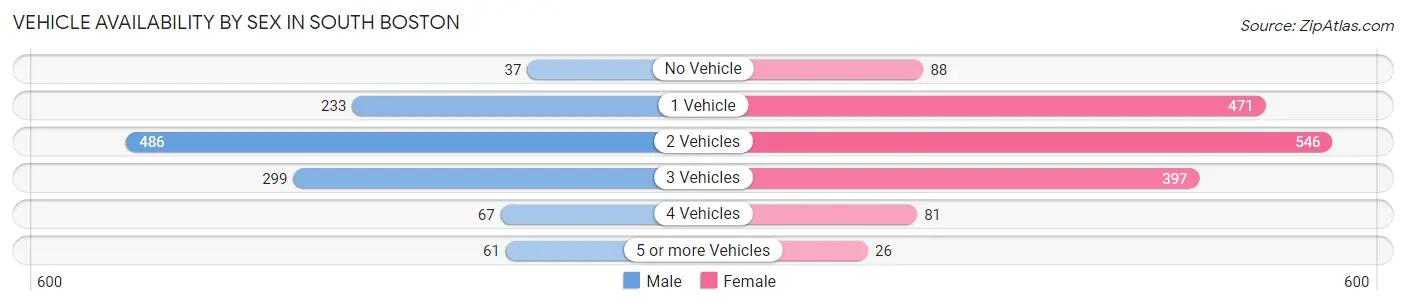
| Vehicles Available | Male | Female |
| No Vehicle | 37 (3.1%) | 88 (5.5%) |
| 1 Vehicle | 233 (19.7%) | 471 (29.3%) |
| 2 Vehicles | 486 (41.1%) | 546 (33.9%) |
| 3 Vehicles | 299 (25.3%) | 397 (24.7%) |
| 4 Vehicles | 67 (5.7%) | 81 (5.0%) |
| 5 or more Vehicles | 61 (5.2%) | 26 (1.6%) |
| Total | 1,183 (100.0%) | 1,609 (100.0%) |
Commute Time in South Boston
The most frequently occuring commute durations in South Boston are 10 to 14 minutes (920 commuters, 34.3%), 5 to 9 minutes (729 commuters, 27.2%), and less than 5 minutes (288 commuters, 10.7%).
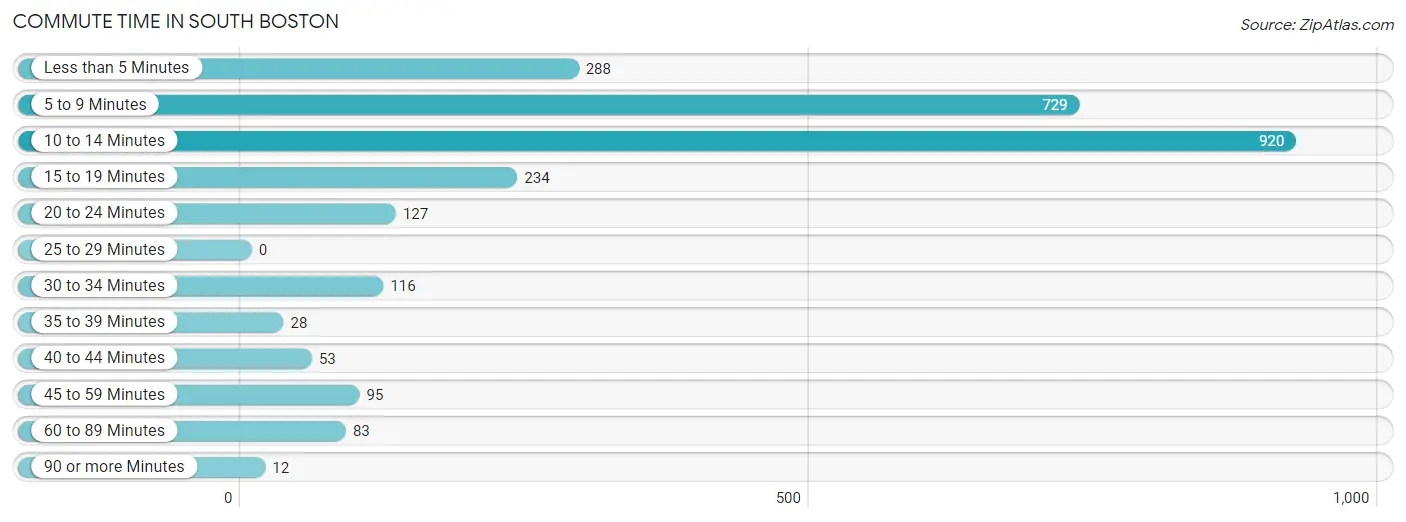
| Commute Time | # Commuters | % Commuters |
| Less than 5 Minutes | 288 | 10.7% |
| 5 to 9 Minutes | 729 | 27.2% |
| 10 to 14 Minutes | 920 | 34.3% |
| 15 to 19 Minutes | 234 | 8.7% |
| 20 to 24 Minutes | 127 | 4.7% |
| 25 to 29 Minutes | 0 | 0.0% |
| 30 to 34 Minutes | 116 | 4.3% |
| 35 to 39 Minutes | 28 | 1.0% |
| 40 to 44 Minutes | 53 | 2.0% |
| 45 to 59 Minutes | 95 | 3.5% |
| 60 to 89 Minutes | 83 | 3.1% |
| 90 or more Minutes | 12 | 0.4% |
Commute Time by Sex in South Boston
The most common commute times in South Boston are 10 to 14 minutes (461 commuters, 39.3%) for males and 5 to 9 minutes (463 commuters, 30.6%) for females.
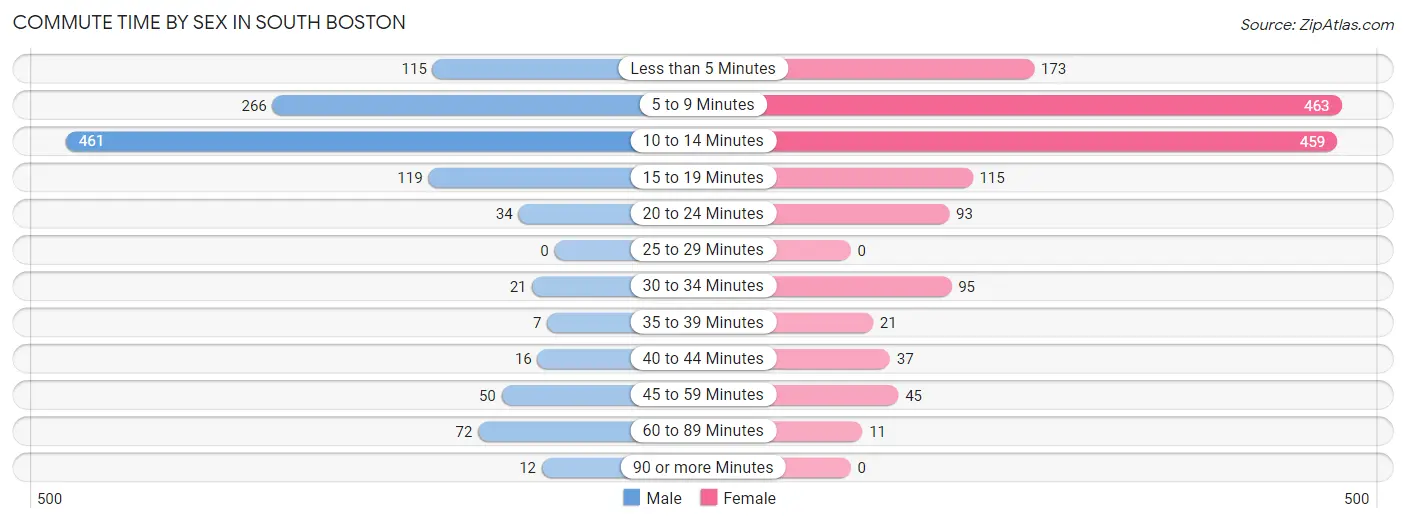
| Commute Time | Male | Female |
| Less than 5 Minutes | 115 (9.8%) | 173 (11.4%) |
| 5 to 9 Minutes | 266 (22.7%) | 463 (30.6%) |
| 10 to 14 Minutes | 461 (39.3%) | 459 (30.4%) |
| 15 to 19 Minutes | 119 (10.1%) | 115 (7.6%) |
| 20 to 24 Minutes | 34 (2.9%) | 93 (6.1%) |
| 25 to 29 Minutes | 0 (0.0%) | 0 (0.0%) |
| 30 to 34 Minutes | 21 (1.8%) | 95 (6.3%) |
| 35 to 39 Minutes | 7 (0.6%) | 21 (1.4%) |
| 40 to 44 Minutes | 16 (1.4%) | 37 (2.5%) |
| 45 to 59 Minutes | 50 (4.3%) | 45 (3.0%) |
| 60 to 89 Minutes | 72 (6.1%) | 11 (0.7%) |
| 90 or more Minutes | 12 (1.0%) | 0 (0.0%) |
Time of Departure to Work by Sex in South Boston
The most frequent times of departure to work in South Boston are 7:00 AM to 7:29 AM (285, 24.3%) for males and 7:30 AM to 7:59 AM (224, 14.8%) for females.
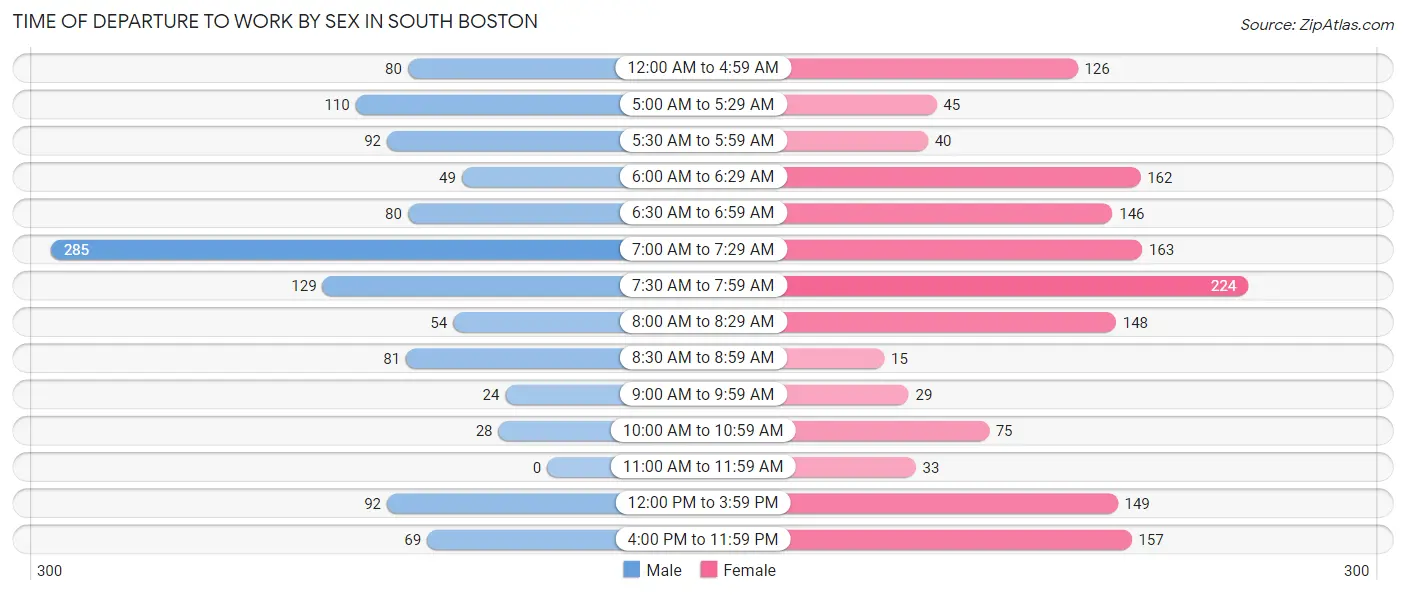
| Time of Departure | Male | Female |
| 12:00 AM to 4:59 AM | 80 (6.8%) | 126 (8.3%) |
| 5:00 AM to 5:29 AM | 110 (9.4%) | 45 (3.0%) |
| 5:30 AM to 5:59 AM | 92 (7.8%) | 40 (2.6%) |
| 6:00 AM to 6:29 AM | 49 (4.2%) | 162 (10.7%) |
| 6:30 AM to 6:59 AM | 80 (6.8%) | 146 (9.7%) |
| 7:00 AM to 7:29 AM | 285 (24.3%) | 163 (10.8%) |
| 7:30 AM to 7:59 AM | 129 (11.0%) | 224 (14.8%) |
| 8:00 AM to 8:29 AM | 54 (4.6%) | 148 (9.8%) |
| 8:30 AM to 8:59 AM | 81 (6.9%) | 15 (1.0%) |
| 9:00 AM to 9:59 AM | 24 (2.1%) | 29 (1.9%) |
| 10:00 AM to 10:59 AM | 28 (2.4%) | 75 (5.0%) |
| 11:00 AM to 11:59 AM | 0 (0.0%) | 33 (2.2%) |
| 12:00 PM to 3:59 PM | 92 (7.8%) | 149 (9.9%) |
| 4:00 PM to 11:59 PM | 69 (5.9%) | 157 (10.4%) |
| Total | 1,173 (100.0%) | 1,512 (100.0%) |
Housing Occupancy in South Boston
Occupancy by Ownership in South Boston
Of the total 2,936 dwellings in South Boston, owner-occupied units account for 1,558 (53.1%), while renter-occupied units make up 1,378 (46.9%).
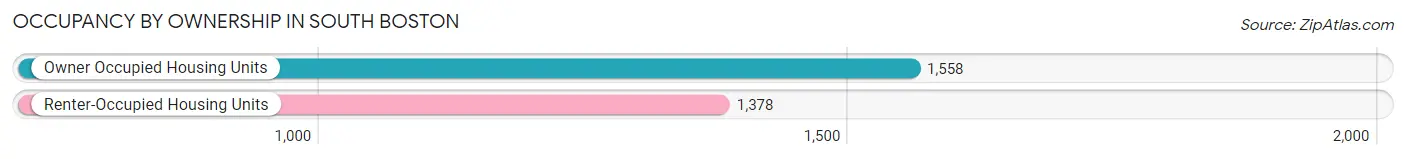
| Occupancy | # Housing Units | % Housing Units |
| Owner Occupied Housing Units | 1,558 | 53.1% |
| Renter-Occupied Housing Units | 1,378 | 46.9% |
| Total Occupied Housing Units | 2,936 | 100.0% |
Occupancy by Household Size in South Boston
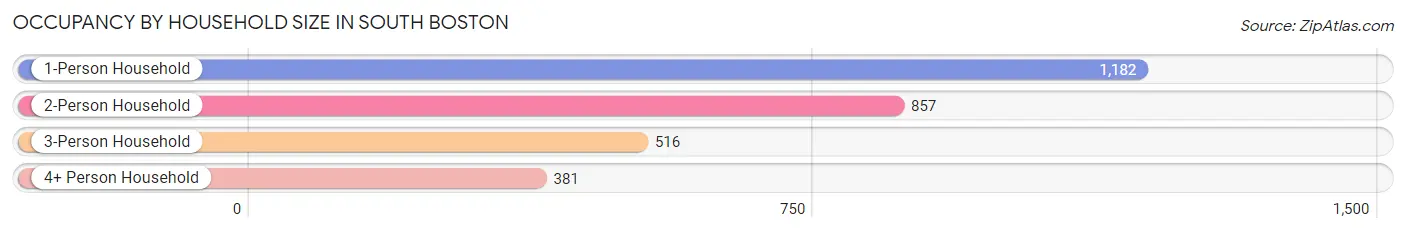
| Household Size | # Housing Units | % Housing Units |
| 1-Person Household | 1,182 | 40.3% |
| 2-Person Household | 857 | 29.2% |
| 3-Person Household | 516 | 17.6% |
| 4+ Person Household | 381 | 13.0% |
| Total Housing Units | 2,936 | 100.0% |
Occupancy by Ownership by Household Size in South Boston
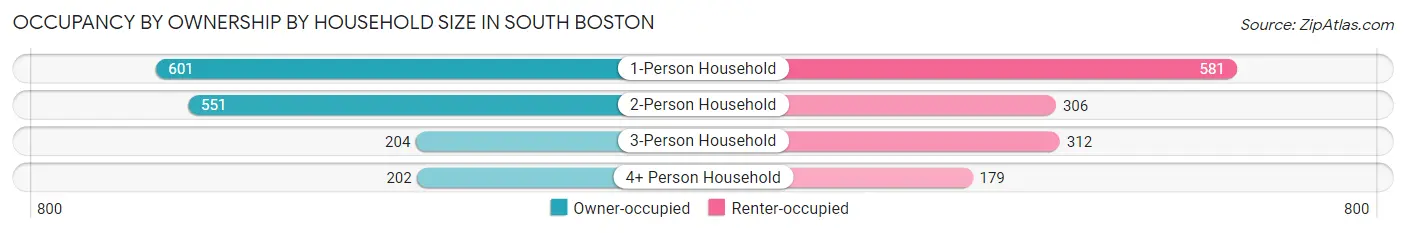
| Household Size | Owner-occupied | Renter-occupied |
| 1-Person Household | 601 (50.8%) | 581 (49.1%) |
| 2-Person Household | 551 (64.3%) | 306 (35.7%) |
| 3-Person Household | 204 (39.5%) | 312 (60.5%) |
| 4+ Person Household | 202 (53.0%) | 179 (47.0%) |
| Total Housing Units | 1,558 (53.1%) | 1,378 (46.9%) |
Occupancy by Educational Attainment in South Boston
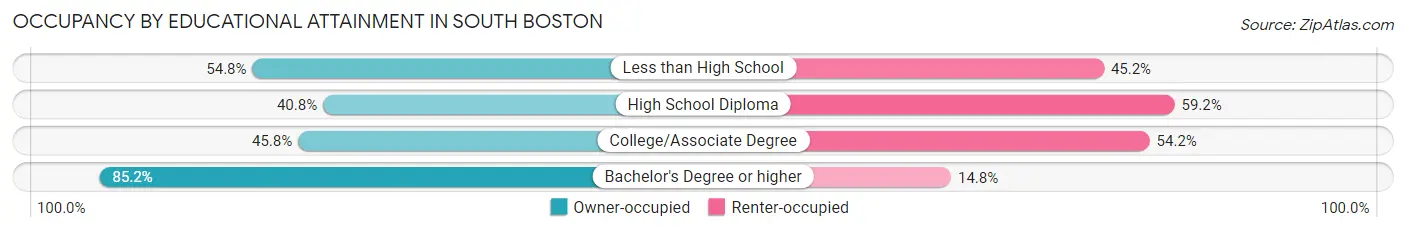
| Household Size | Owner-occupied | Renter-occupied |
| Less than High School | 102 (54.8%) | 84 (45.2%) |
| High School Diploma | 455 (40.8%) | 659 (59.2%) |
| College/Associate Degree | 456 (45.8%) | 540 (54.2%) |
| Bachelor's Degree or higher | 545 (85.2%) | 95 (14.8%) |
Occupancy by Age of Householder in South Boston
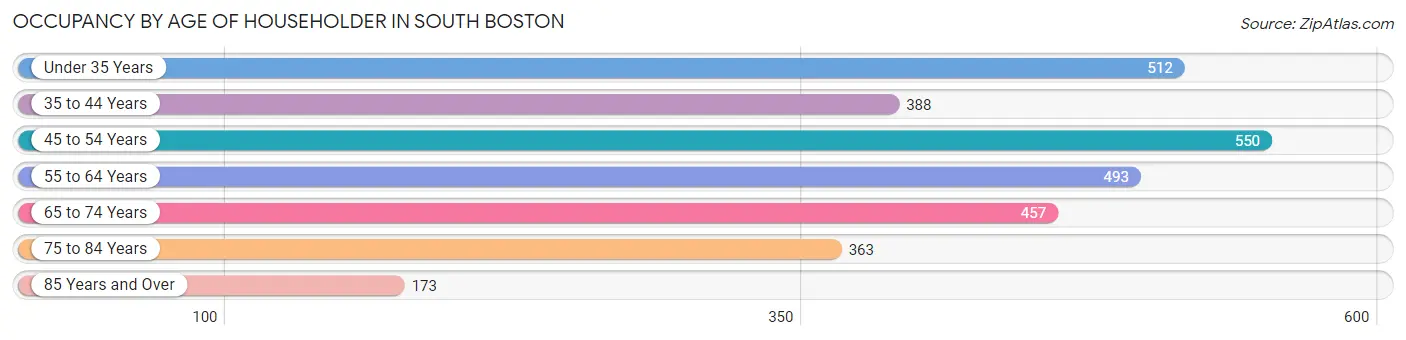
| Age Bracket | # Households | % Households |
| Under 35 Years | 512 | 17.4% |
| 35 to 44 Years | 388 | 13.2% |
| 45 to 54 Years | 550 | 18.7% |
| 55 to 64 Years | 493 | 16.8% |
| 65 to 74 Years | 457 | 15.6% |
| 75 to 84 Years | 363 | 12.4% |
| 85 Years and Over | 173 | 5.9% |
| Total | 2,936 | 100.0% |
Housing Finances in South Boston
Median Income by Occupancy in South Boston
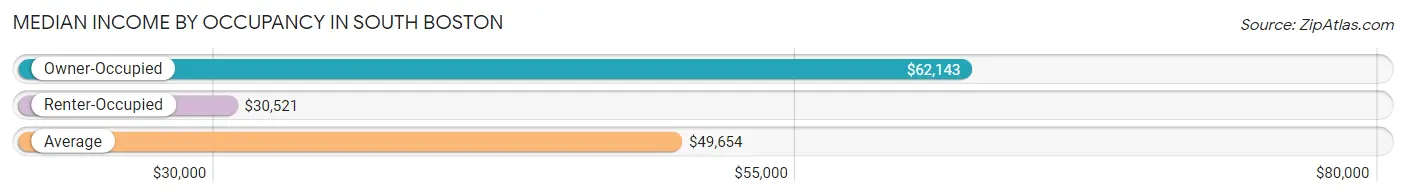
| Occupancy Type | # Households | Median Income |
| Owner-Occupied | 1,558 (53.1%) | $62,143 |
| Renter-Occupied | 1,378 (46.9%) | $30,521 |
| Average | 2,936 (100.0%) | $49,654 |
Occupancy by Householder Income Bracket in South Boston
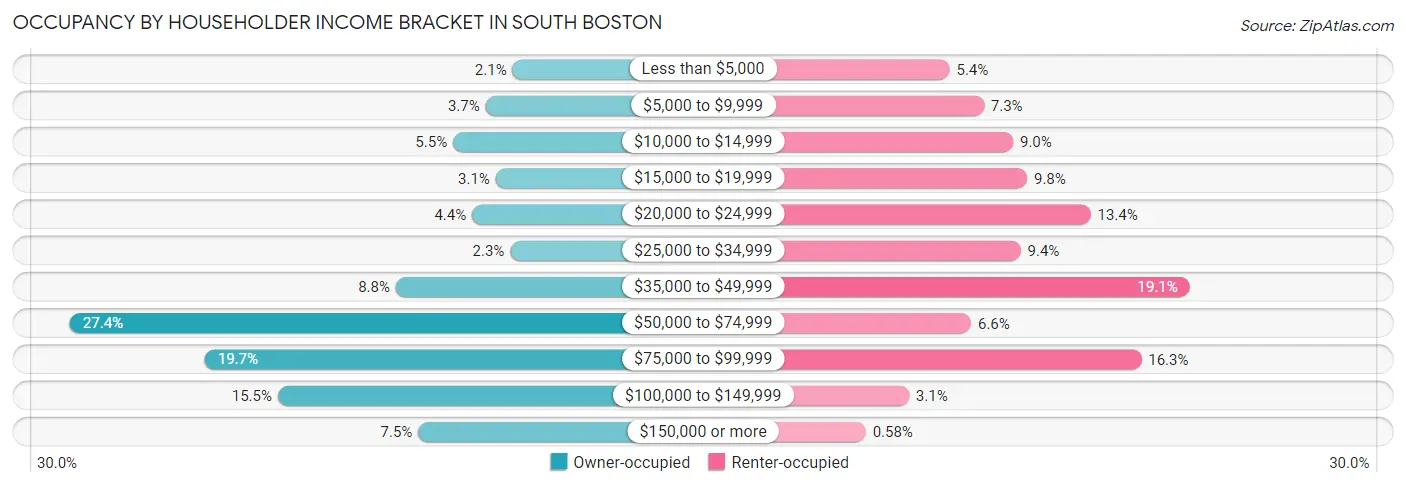
| Income Bracket | Owner-occupied | Renter-occupied |
| Less than $5,000 | 33 (2.1%) | 74 (5.4%) |
| $5,000 to $9,999 | 57 (3.7%) | 101 (7.3%) |
| $10,000 to $14,999 | 86 (5.5%) | 124 (9.0%) |
| $15,000 to $19,999 | 48 (3.1%) | 135 (9.8%) |
| $20,000 to $24,999 | 69 (4.4%) | 185 (13.4%) |
| $25,000 to $34,999 | 35 (2.2%) | 130 (9.4%) |
| $35,000 to $49,999 | 137 (8.8%) | 263 (19.1%) |
| $50,000 to $74,999 | 427 (27.4%) | 91 (6.6%) |
| $75,000 to $99,999 | 307 (19.7%) | 225 (16.3%) |
| $100,000 to $149,999 | 242 (15.5%) | 42 (3.0%) |
| $150,000 or more | 117 (7.5%) | 8 (0.6%) |
| Total | 1,558 (100.0%) | 1,378 (100.0%) |
Monthly Housing Cost Tiers in South Boston
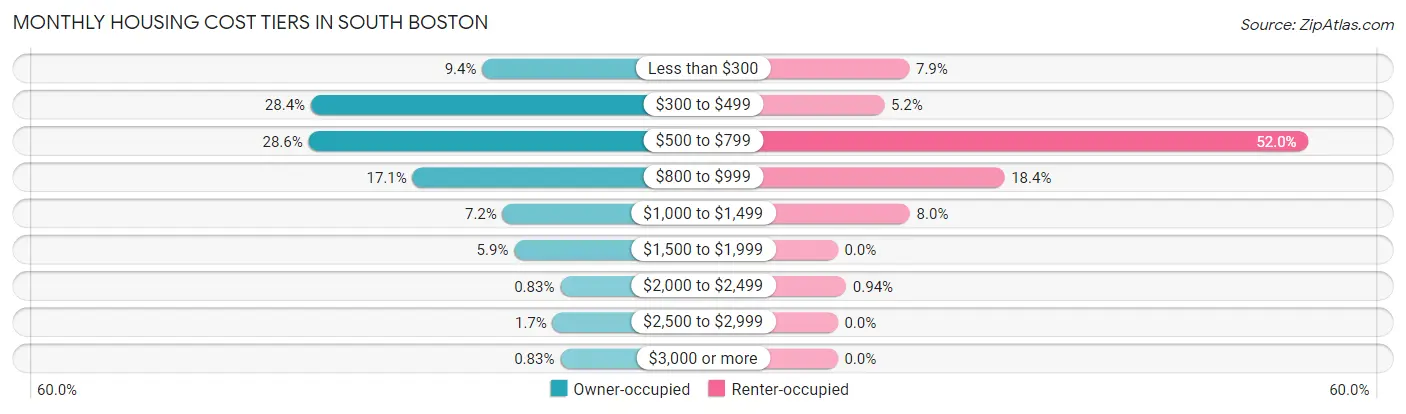
| Monthly Cost | Owner-occupied | Renter-occupied |
| Less than $300 | 147 (9.4%) | 109 (7.9%) |
| $300 to $499 | 442 (28.4%) | 71 (5.1%) |
| $500 to $799 | 446 (28.6%) | 717 (52.0%) |
| $800 to $999 | 267 (17.1%) | 254 (18.4%) |
| $1,000 to $1,499 | 112 (7.2%) | 110 (8.0%) |
| $1,500 to $1,999 | 92 (5.9%) | 0 (0.0%) |
| $2,000 to $2,499 | 13 (0.8%) | 13 (0.9%) |
| $2,500 to $2,999 | 26 (1.7%) | 0 (0.0%) |
| $3,000 or more | 13 (0.8%) | 0 (0.0%) |
| Total | 1,558 (100.0%) | 1,378 (100.0%) |
Physical Housing Characteristics in South Boston
Housing Structures in South Boston
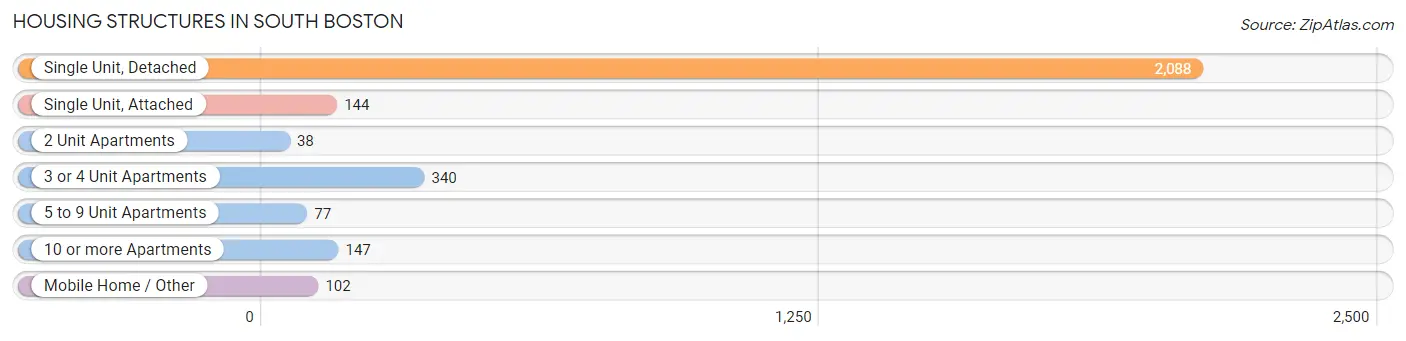
| Structure Type | # Housing Units | % Housing Units |
| Single Unit, Detached | 2,088 | 71.1% |
| Single Unit, Attached | 144 | 4.9% |
| 2 Unit Apartments | 38 | 1.3% |
| 3 or 4 Unit Apartments | 340 | 11.6% |
| 5 to 9 Unit Apartments | 77 | 2.6% |
| 10 or more Apartments | 147 | 5.0% |
| Mobile Home / Other | 102 | 3.5% |
| Total | 2,936 | 100.0% |
Housing Structures by Occupancy in South Boston
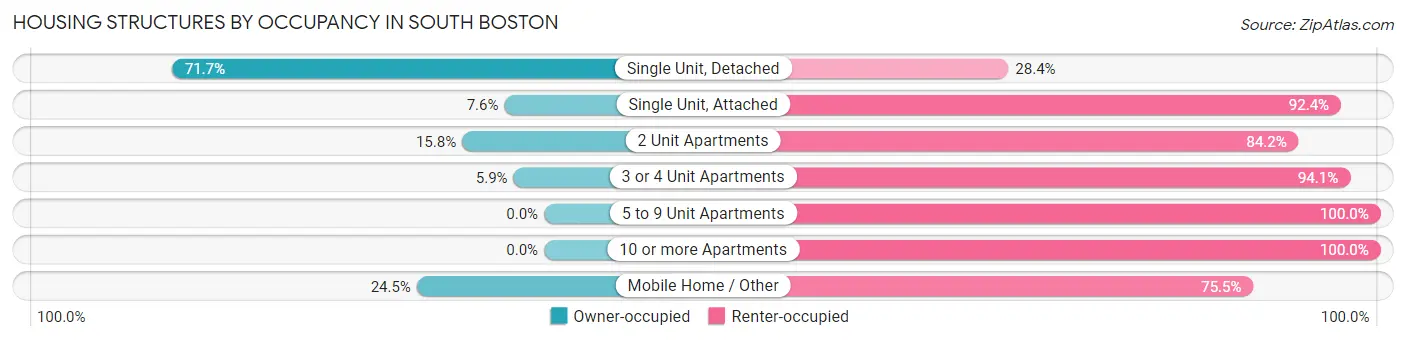
| Structure Type | Owner-occupied | Renter-occupied |
| Single Unit, Detached | 1,496 (71.7%) | 592 (28.3%) |
| Single Unit, Attached | 11 (7.6%) | 133 (92.4%) |
| 2 Unit Apartments | 6 (15.8%) | 32 (84.2%) |
| 3 or 4 Unit Apartments | 20 (5.9%) | 320 (94.1%) |
| 5 to 9 Unit Apartments | 0 (0.0%) | 77 (100.0%) |
| 10 or more Apartments | 0 (0.0%) | 147 (100.0%) |
| Mobile Home / Other | 25 (24.5%) | 77 (75.5%) |
| Total | 1,558 (53.1%) | 1,378 (46.9%) |
Housing Structures by Number of Rooms in South Boston
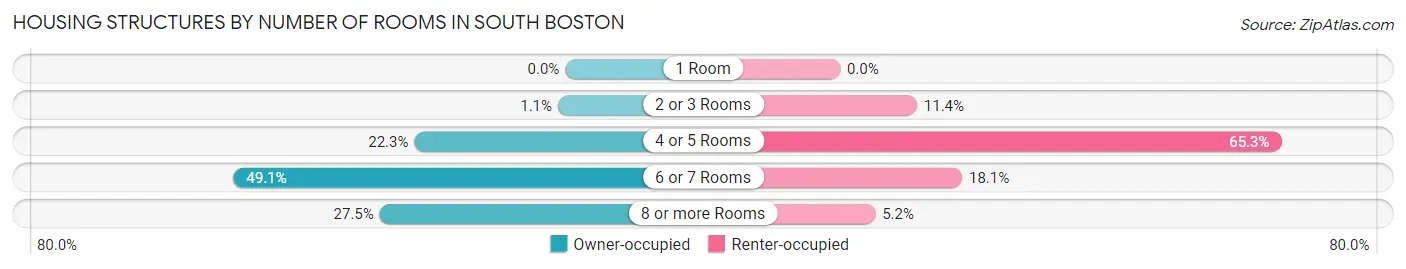
| Number of Rooms | Owner-occupied | Renter-occupied |
| 1 Room | 0 (0.0%) | 0 (0.0%) |
| 2 or 3 Rooms | 17 (1.1%) | 157 (11.4%) |
| 4 or 5 Rooms | 348 (22.3%) | 900 (65.3%) |
| 6 or 7 Rooms | 765 (49.1%) | 249 (18.1%) |
| 8 or more Rooms | 428 (27.5%) | 72 (5.2%) |
| Total | 1,558 (100.0%) | 1,378 (100.0%) |
Housing Structure by Heating Type in South Boston
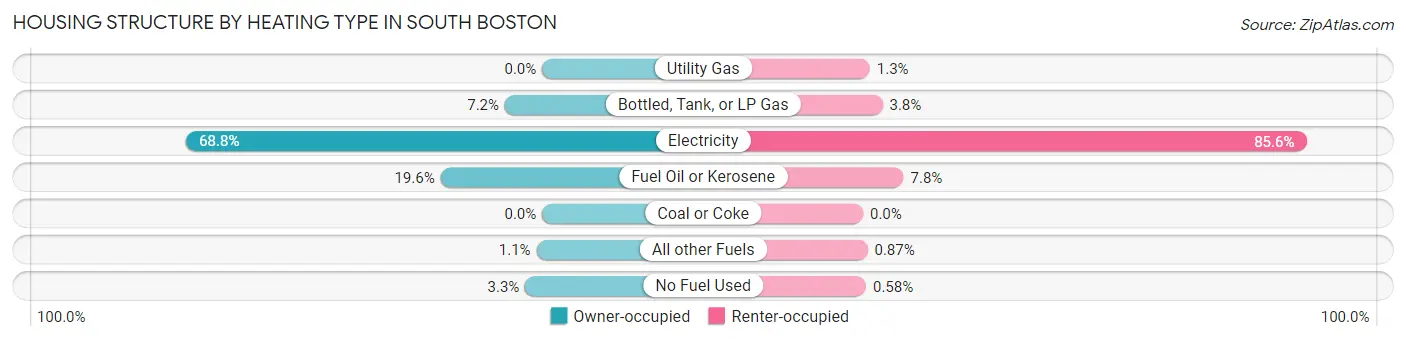
| Heating Type | Owner-occupied | Renter-occupied |
| Utility Gas | 0 (0.0%) | 18 (1.3%) |
| Bottled, Tank, or LP Gas | 112 (7.2%) | 52 (3.8%) |
| Electricity | 1,072 (68.8%) | 1,180 (85.6%) |
| Fuel Oil or Kerosene | 306 (19.6%) | 108 (7.8%) |
| Coal or Coke | 0 (0.0%) | 0 (0.0%) |
| All other Fuels | 17 (1.1%) | 12 (0.9%) |
| No Fuel Used | 51 (3.3%) | 8 (0.6%) |
| Total | 1,558 (100.0%) | 1,378 (100.0%) |
Household Vehicle Usage in South Boston
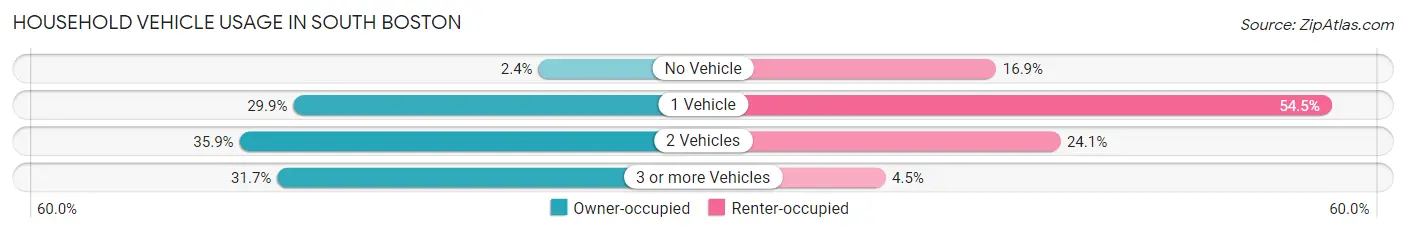
| Vehicles per Household | Owner-occupied | Renter-occupied |
| No Vehicle | 38 (2.4%) | 233 (16.9%) |
| 1 Vehicle | 466 (29.9%) | 751 (54.5%) |
| 2 Vehicles | 560 (35.9%) | 332 (24.1%) |
| 3 or more Vehicles | 494 (31.7%) | 62 (4.5%) |
| Total | 1,558 (100.0%) | 1,378 (100.0%) |
Real Estate & Mortgages in South Boston
Real Estate and Mortgage Overview in South Boston
| Characteristic | Without Mortgage | With Mortgage |
| Housing Units | 911 | 647 |
| Median Property Value | $156,600 | $127,400 |
| Median Household Income | $59,219 | $75 |
| Monthly Housing Costs | $431 | $13 |
| Real Estate Taxes | $904 | $0 |
Property Value by Mortgage Status in South Boston
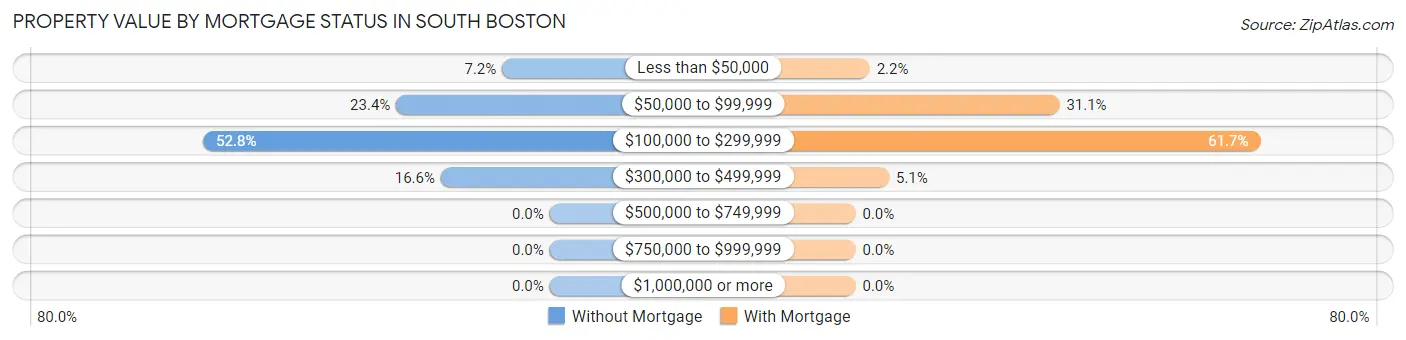
| Property Value | Without Mortgage | With Mortgage |
| Less than $50,000 | 66 (7.2%) | 14 (2.2%) |
| $50,000 to $99,999 | 213 (23.4%) | 201 (31.1%) |
| $100,000 to $299,999 | 481 (52.8%) | 399 (61.7%) |
| $300,000 to $499,999 | 151 (16.6%) | 33 (5.1%) |
| $500,000 to $749,999 | 0 (0.0%) | 0 (0.0%) |
| $750,000 to $999,999 | 0 (0.0%) | 0 (0.0%) |
| $1,000,000 or more | 0 (0.0%) | 0 (0.0%) |
| Total | 911 (100.0%) | 647 (100.0%) |
Household Income by Mortgage Status in South Boston
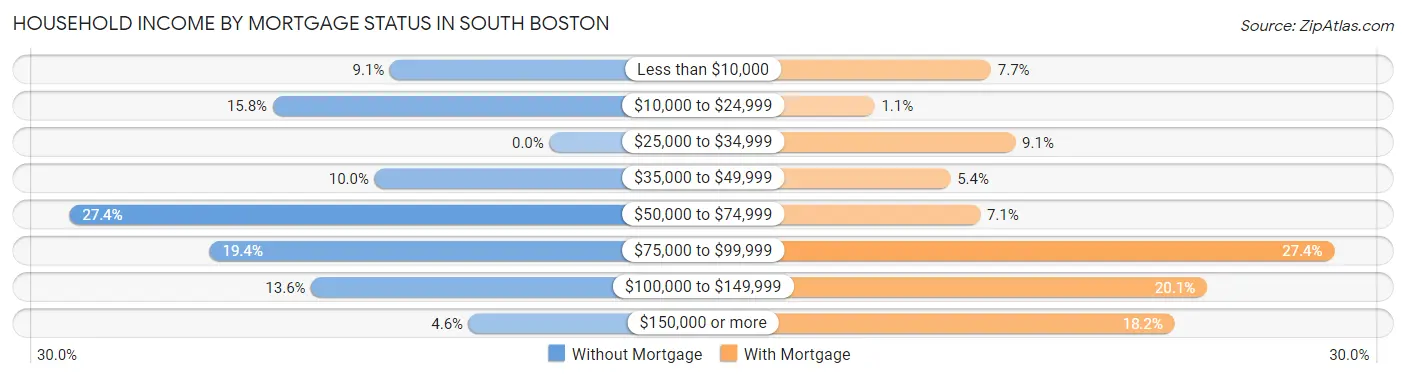
| Household Income | Without Mortgage | With Mortgage |
| Less than $10,000 | 83 (9.1%) | 50 (7.7%) |
| $10,000 to $24,999 | 144 (15.8%) | 7 (1.1%) |
| $25,000 to $34,999 | 0 (0.0%) | 59 (9.1%) |
| $35,000 to $49,999 | 91 (10.0%) | 35 (5.4%) |
| $50,000 to $74,999 | 250 (27.4%) | 46 (7.1%) |
| $75,000 to $99,999 | 177 (19.4%) | 177 (27.4%) |
| $100,000 to $149,999 | 124 (13.6%) | 130 (20.1%) |
| $150,000 or more | 42 (4.6%) | 118 (18.2%) |
| Total | 911 (100.0%) | 647 (100.0%) |
Property Value to Household Income Ratio in South Boston
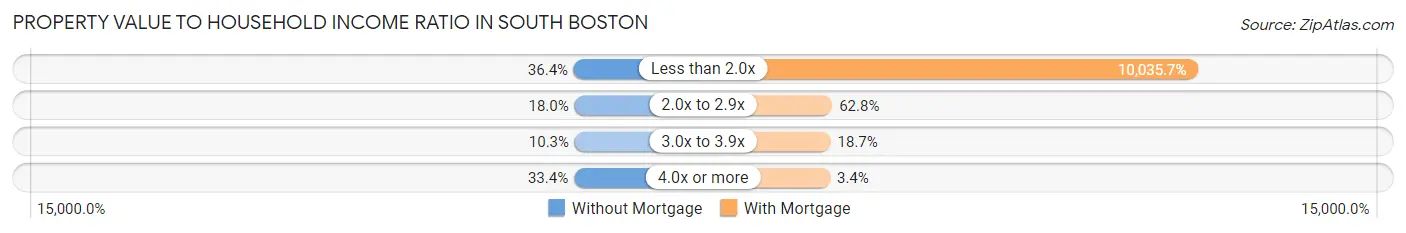
| Value-to-Income Ratio | Without Mortgage | With Mortgage |
| Less than 2.0x | 332 (36.4%) | 64,931 (10,035.7%) |
| 2.0x to 2.9x | 164 (18.0%) | 406 (62.7%) |
| 3.0x to 3.9x | 94 (10.3%) | 121 (18.7%) |
| 4.0x or more | 304 (33.4%) | 22 (3.4%) |
| Total | 911 (100.0%) | 647 (100.0%) |
Real Estate Taxes by Mortgage Status in South Boston
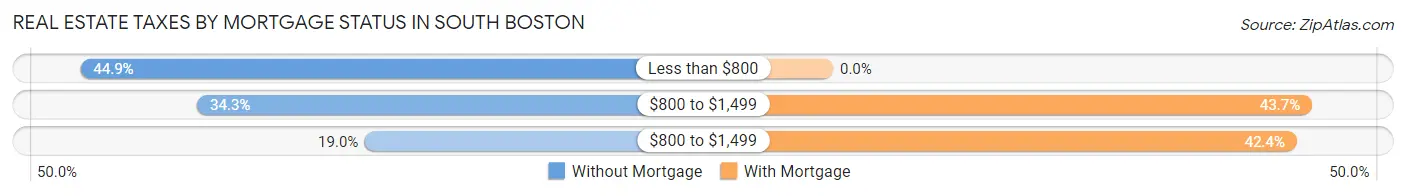
| Property Taxes | Without Mortgage | With Mortgage |
| Less than $800 | 409 (44.9%) | 0 (0.0%) |
| $800 to $1,499 | 312 (34.3%) | 283 (43.7%) |
| $800 to $1,499 | 173 (19.0%) | 274 (42.3%) |
| Total | 911 (100.0%) | 647 (100.0%) |
Health & Disability in South Boston
Health Insurance Coverage by Age in South Boston
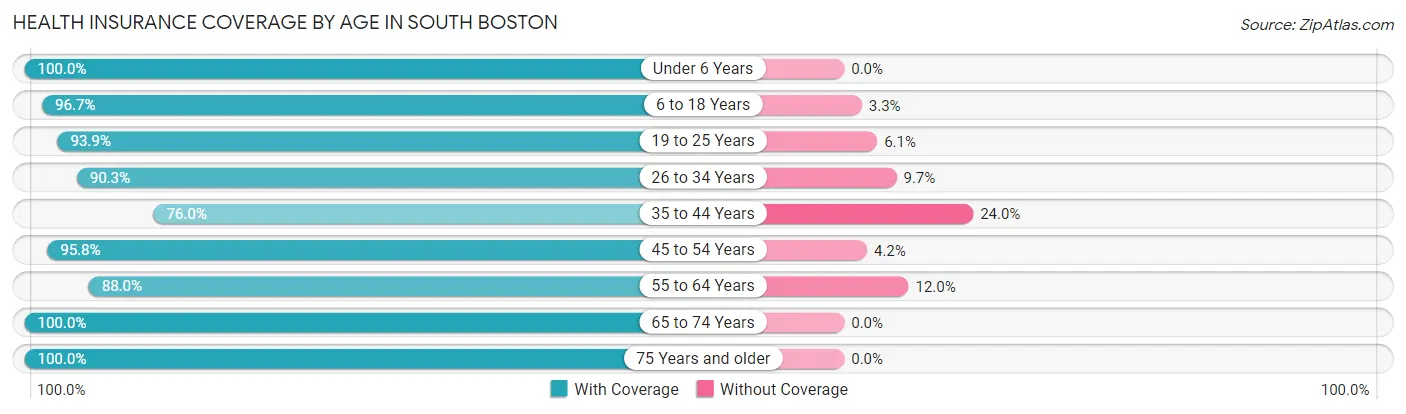
| Age Bracket | With Coverage | Without Coverage |
| Under 6 Years | 883 (100.0%) | 0 (0.0%) |
| 6 to 18 Years | 1,328 (96.7%) | 45 (3.3%) |
| 19 to 25 Years | 321 (93.9%) | 21 (6.1%) |
| 26 to 34 Years | 788 (90.3%) | 85 (9.7%) |
| 35 to 44 Years | 496 (76.0%) | 157 (24.0%) |
| 45 to 54 Years | 814 (95.8%) | 36 (4.2%) |
| 55 to 64 Years | 654 (88.0%) | 89 (12.0%) |
| 65 to 74 Years | 799 (100.0%) | 0 (0.0%) |
| 75 Years and older | 709 (100.0%) | 0 (0.0%) |
| Total | 6,792 (94.0%) | 433 (6.0%) |
Health Insurance Coverage by Citizenship Status in South Boston
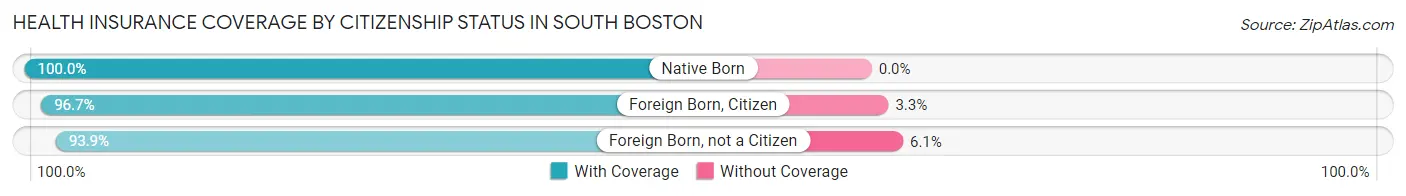
| Citizenship Status | With Coverage | Without Coverage |
| Native Born | 883 (100.0%) | 0 (0.0%) |
| Foreign Born, Citizen | 1,328 (96.7%) | 45 (3.3%) |
| Foreign Born, not a Citizen | 321 (93.9%) | 21 (6.1%) |
Health Insurance Coverage by Household Income in South Boston
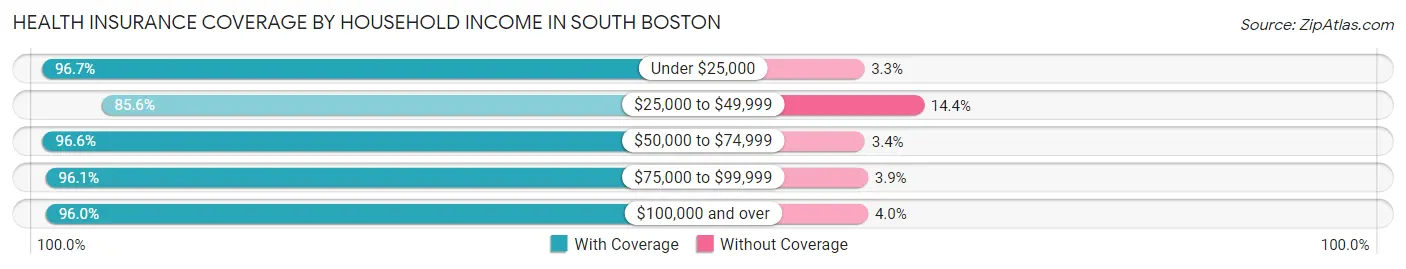
| Household Income | With Coverage | Without Coverage |
| Under $25,000 | 1,690 (96.7%) | 57 (3.3%) |
| $25,000 to $49,999 | 1,358 (85.6%) | 229 (14.4%) |
| $50,000 to $74,999 | 1,145 (96.6%) | 40 (3.4%) |
| $75,000 to $99,999 | 1,242 (96.1%) | 51 (3.9%) |
| $100,000 and over | 1,353 (96.0%) | 56 (4.0%) |
Public vs Private Health Insurance Coverage by Age in South Boston
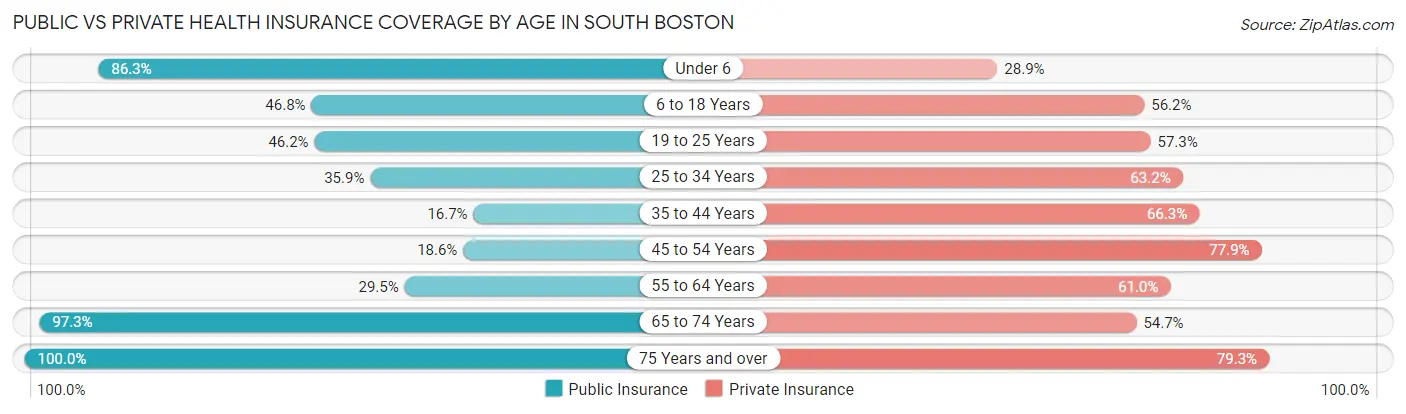
| Age Bracket | Public Insurance | Private Insurance |
| Under 6 | 762 (86.3%) | 255 (28.9%) |
| 6 to 18 Years | 642 (46.8%) | 771 (56.1%) |
| 19 to 25 Years | 158 (46.2%) | 196 (57.3%) |
| 25 to 34 Years | 313 (35.8%) | 552 (63.2%) |
| 35 to 44 Years | 109 (16.7%) | 433 (66.3%) |
| 45 to 54 Years | 158 (18.6%) | 662 (77.9%) |
| 55 to 64 Years | 219 (29.5%) | 453 (61.0%) |
| 65 to 74 Years | 777 (97.3%) | 437 (54.7%) |
| 75 Years and over | 709 (100.0%) | 562 (79.3%) |
| Total | 3,847 (53.2%) | 4,321 (59.8%) |
Disability Status by Sex by Age in South Boston
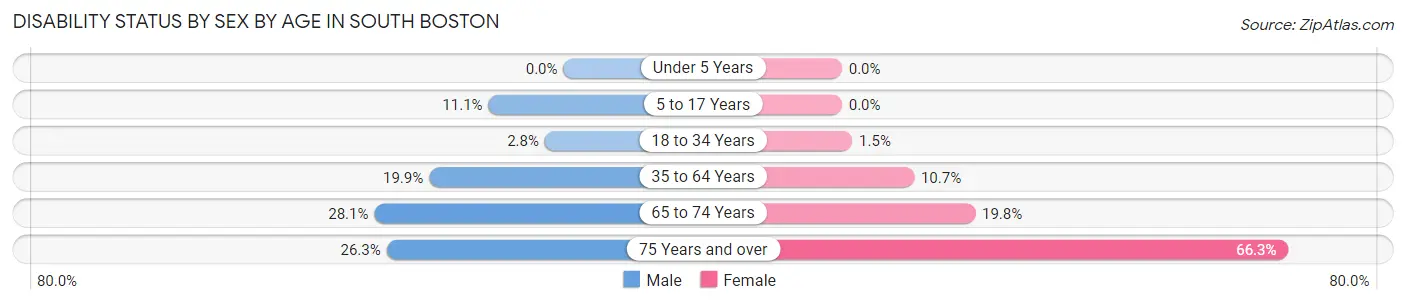
| Age Bracket | Male | Female |
| Under 5 Years | 0 (0.0%) | 0 (0.0%) |
| 5 to 17 Years | 65 (11.1%) | 0 (0.0%) |
| 18 to 34 Years | 17 (2.8%) | 12 (1.5%) |
| 35 to 64 Years | 208 (19.9%) | 129 (10.7%) |
| 65 to 74 Years | 98 (28.1%) | 89 (19.8%) |
| 75 Years and over | 21 (26.3%) | 417 (66.3%) |
Disability Class by Sex by Age in South Boston
Disability Class: Hearing Difficulty
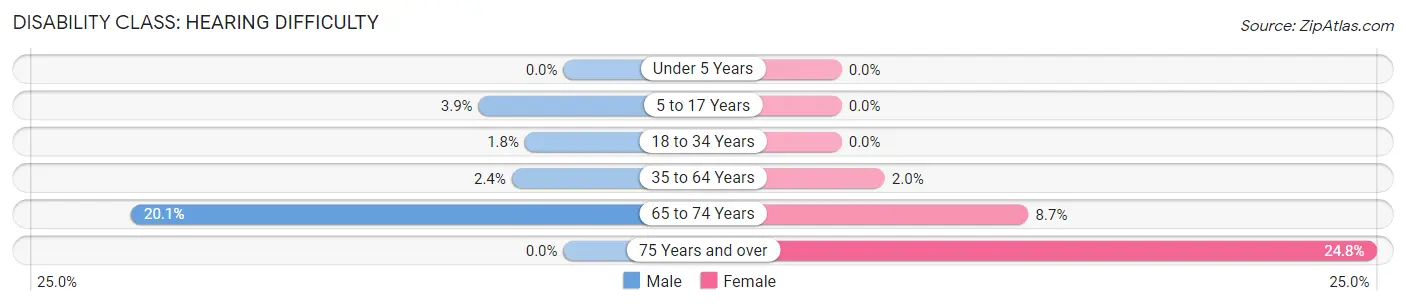
| Age Bracket | Male | Female |
| Under 5 Years | 0 (0.0%) | 0 (0.0%) |
| 5 to 17 Years | 23 (3.9%) | 0 (0.0%) |
| 18 to 34 Years | 11 (1.8%) | 0 (0.0%) |
| 35 to 64 Years | 25 (2.4%) | 24 (2.0%) |
| 65 to 74 Years | 70 (20.1%) | 39 (8.7%) |
| 75 Years and over | 0 (0.0%) | 156 (24.8%) |
Disability Class: Vision Difficulty
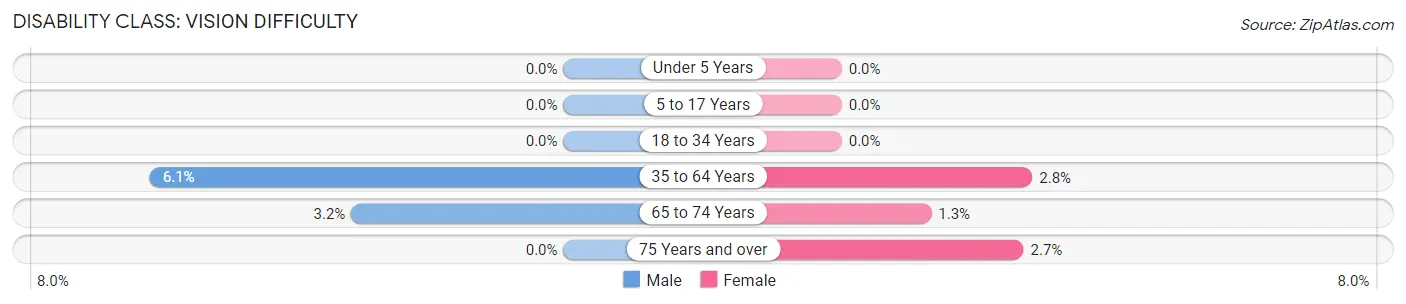
| Age Bracket | Male | Female |
| Under 5 Years | 0 (0.0%) | 0 (0.0%) |
| 5 to 17 Years | 0 (0.0%) | 0 (0.0%) |
| 18 to 34 Years | 0 (0.0%) | 0 (0.0%) |
| 35 to 64 Years | 64 (6.1%) | 34 (2.8%) |
| 65 to 74 Years | 11 (3.2%) | 6 (1.3%) |
| 75 Years and over | 0 (0.0%) | 17 (2.7%) |
Disability Class: Cognitive Difficulty
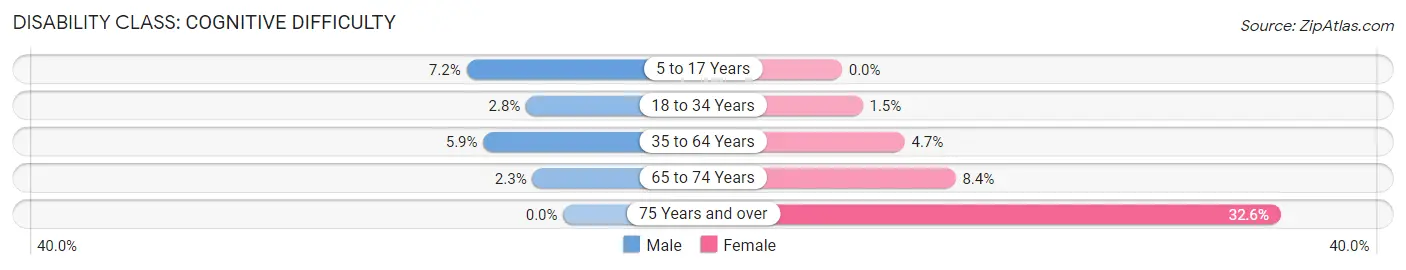
| Age Bracket | Male | Female |
| 5 to 17 Years | 42 (7.2%) | 0 (0.0%) |
| 18 to 34 Years | 17 (2.8%) | 12 (1.5%) |
| 35 to 64 Years | 62 (5.9%) | 56 (4.7%) |
| 65 to 74 Years | 8 (2.3%) | 38 (8.4%) |
| 75 Years and over | 0 (0.0%) | 205 (32.6%) |
Disability Class: Ambulatory Difficulty
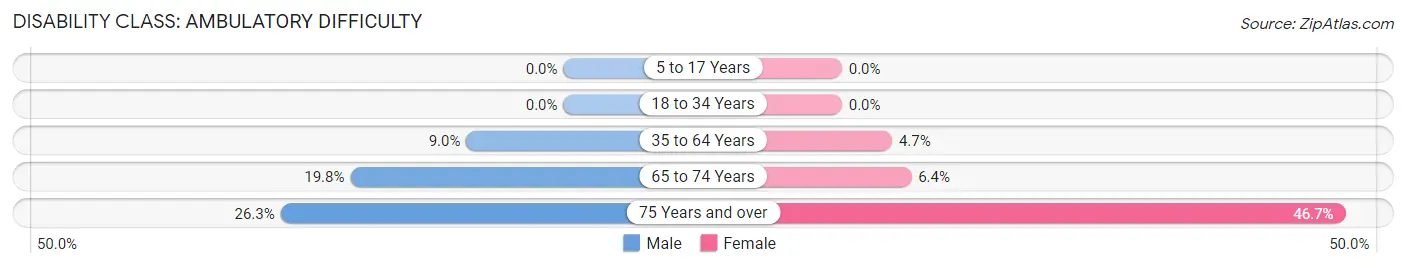
| Age Bracket | Male | Female |
| 5 to 17 Years | 0 (0.0%) | 0 (0.0%) |
| 18 to 34 Years | 0 (0.0%) | 0 (0.0%) |
| 35 to 64 Years | 94 (9.0%) | 56 (4.7%) |
| 65 to 74 Years | 69 (19.8%) | 29 (6.4%) |
| 75 Years and over | 21 (26.3%) | 294 (46.7%) |
Disability Class: Self-Care Difficulty
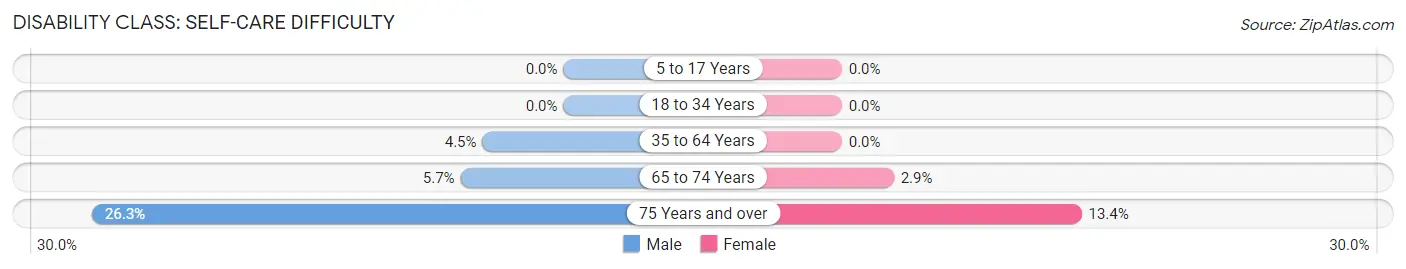
| Age Bracket | Male | Female |
| 5 to 17 Years | 0 (0.0%) | 0 (0.0%) |
| 18 to 34 Years | 0 (0.0%) | 0 (0.0%) |
| 35 to 64 Years | 47 (4.5%) | 0 (0.0%) |
| 65 to 74 Years | 20 (5.7%) | 13 (2.9%) |
| 75 Years and over | 21 (26.3%) | 84 (13.4%) |
Technology Access in South Boston
Computing Device Access in South Boston
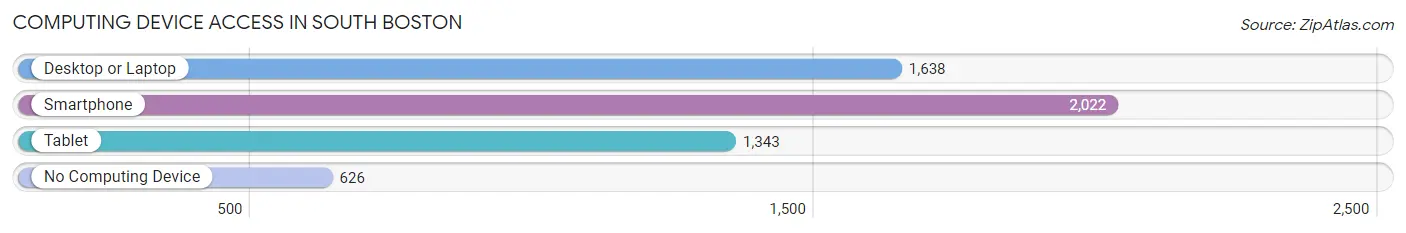
| Device Type | # Households | % Households |
| Desktop or Laptop | 1,638 | 55.8% |
| Smartphone | 2,022 | 68.9% |
| Tablet | 1,343 | 45.7% |
| No Computing Device | 626 | 21.3% |
| Total | 2,936 | 100.0% |
Internet Access in South Boston
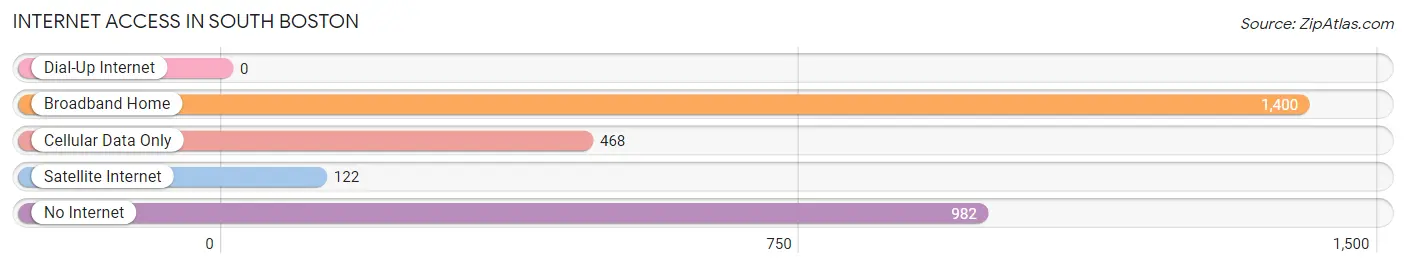
| Internet Type | # Households | % Households |
| Dial-Up Internet | 0 | 0.0% |
| Broadband Home | 1,400 | 47.7% |
| Cellular Data Only | 468 | 15.9% |
| Satellite Internet | 122 | 4.2% |
| No Internet | 982 | 33.5% |
| Total | 2,936 | 100.0% |
South Boston Summary
Boston, Virginia is a small town located in Halifax County, Virginia. It is situated on the banks of the Dan River and is part of the Danville, Virginia Metropolitan Statistical Area. The town has a population of approximately 2,000 people and is known for its rich history and culture.
History
The area that is now South Boston was first settled in the late 1700s by a group of settlers from Scotland. The town was originally known as Scotland Neck and was later renamed South Boston. The town was officially incorporated in 1845 and was named after the city of Boston, Massachusetts.
The town was an important stop on the Southside Railroad, which connected Richmond to Danville. The railroad was a major factor in the town’s growth and development. The town was also home to several tobacco warehouses and factories, which helped to fuel the local economy.
During the Civil War, South Boston was the site of several battles, including the Battle of Staunton River Bridge. The town was also the site of the Battle of South Boston, which was the last major battle of the war.
Geography
South Boston is located in Halifax County, Virginia. It is situated on the banks of the Dan River and is part of the Danville, Virginia Metropolitan Statistical Area. The town has a total area of 2.2 square miles, all of which is land.
The town is located in the Piedmont region of Virginia and is surrounded by rolling hills and forests. The town is located near the North Carolina border and is approximately 50 miles from the state capital of Richmond.
Economy
The economy of South Boston is largely based on agriculture and manufacturing. The town is home to several tobacco warehouses and factories, which help to fuel the local economy. The town is also home to several small businesses, including restaurants, retail stores, and service providers.
The town is also home to several large employers, including the South Boston Industrial Park, which is home to several manufacturing and distribution companies. The town is also home to several educational institutions, including South Boston High School and South Boston Community College.
Demographics
As of the 2010 census, South Boston had a population of 2,000 people. The racial makeup of the town was 79.2% White, 17.2% African American, 0.5% Native American, 0.5% Asian, 0.1% Pacific Islander, and 2.5% from other races. Hispanic or Latino of any race were 2.5% of the population.
The median income for a household in the town was $30,000, and the median income for a family was $35,000. The per capita income for the town was $15,000. About 17.2% of families and 20.2% of the population were below the poverty line, including 28.2% of those under age 18 and 10.2% of those age 65 or over.
South Boston is a small town with a rich history and culture. The town is home to several large employers and educational institutions, which help to fuel the local economy. The town is also home to a diverse population, with a variety of racial and ethnic backgrounds.
Common Questions
What is Per Capita Income in South Boston?
Per Capita income in South Boston is $23,663.
What is the Median Family Income in South Boston?
Median Family Income in South Boston is $51,622.
What is the Median Household income in South Boston?
Median Household Income in South Boston is $49,654.
What is Income or Wage Gap in South Boston?
Income or Wage Gap in South Boston is 17.0%.
Women in South Boston earn 83.0 cents for every dollar earned by a man.
What is Inequality or Gini Index in South Boston?
Inequality or Gini Index in South Boston is 0.45.
What is the Total Population of South Boston?
Total Population of South Boston is 7,942.
What is the Total Male Population of South Boston?
Total Male Population of South Boston is 3,384.
What is the Total Female Population of South Boston?
Total Female Population of South Boston is 4,558.
What is the Ratio of Males per 100 Females in South Boston?
There are 74.24 Males per 100 Females in South Boston.
What is the Ratio of Females per 100 Males in South Boston?
There are 134.69 Females per 100 Males in South Boston.
What is the Median Population Age in South Boston?
Median Population Age in South Boston is 41.6 Years.
What is the Average Family Size in South Boston
Average Family Size in South Boston is 3.4 People.
What is the Average Household Size in South Boston
Average Household Size in South Boston is 2.5 People.
How Large is the Labor Force in South Boston?
There are 3,026 People in the Labor Forcein in South Boston.
What is the Percentage of People in the Labor Force in South Boston?
48.5% of People are in the Labor Force in South Boston.
What is the Unemployment Rate in South Boston?
Unemployment Rate in South Boston is 4.3%.