Piermont, NY Map & Demographics
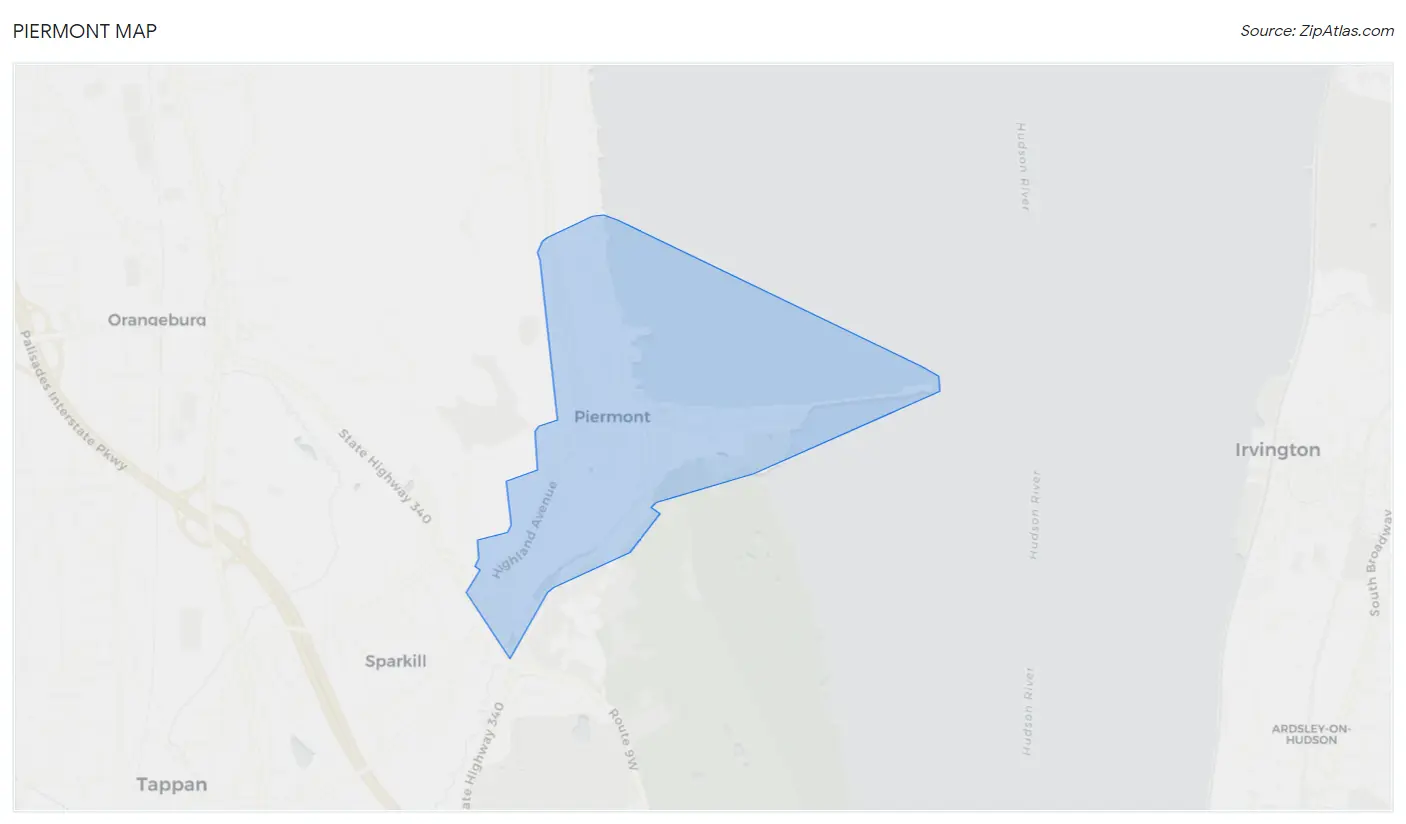
Piermont Map
Piermont Overview
$79,967
PER CAPITA INCOME
$173,600
AVG FAMILY INCOME
$131,458
AVG HOUSEHOLD INCOME
4.0%
WAGE / INCOME GAP [ % ]
96.0¢/ $1
WAGE / INCOME GAP [ $ ]
0.41
INEQUALITY / GINI INDEX
2,507
TOTAL POPULATION
1,337
MALE POPULATION
1,170
FEMALE POPULATION
114.27
MALES / 100 FEMALES
87.51
FEMALES / 100 MALES
50.5
MEDIAN AGE
3.0
AVG FAMILY SIZE
2.0
AVG HOUSEHOLD SIZE
1,637
LABOR FORCE [ PEOPLE ]
73.2%
PERCENT IN LABOR FORCE
3.5%
UNEMPLOYMENT RATE
Piermont Zip Codes
Income in Piermont
Income Overview in Piermont
Per Capita Income in Piermont is $79,967, while median incomes of families and households are $173,600 and $131,458 respectively.
| Characteristic | Number | Measure |
| Per Capita Income | 2,507 | $79,967 |
| Median Family Income | 602 | $173,600 |
| Mean Family Income | 602 | $224,134 |
| Median Household Income | 1,232 | $131,458 |
| Mean Household Income | 1,232 | $163,985 |
| Income Deficit | 602 | $0 |
| Wage / Income Gap (%) | 2,507 | 4.00% |
| Wage / Income Gap ($) | 2,507 | 96.00¢ per $1 |
| Gini / Inequality Index | 2,507 | 0.41 |
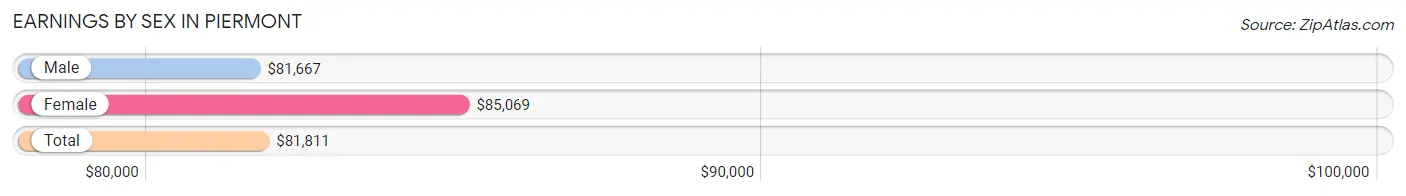
Earnings by Sex in Piermont
Average Earnings in Piermont are $81,811, $81,667 for men and $85,069 for women, a difference of 4.0%.
| Sex | Number | Average Earnings |
| Male | 1,000 (59.6%) | $81,667 |
| Female | 677 (40.4%) | $85,069 |
| Total | 1,677 (100.0%) | $81,811 |
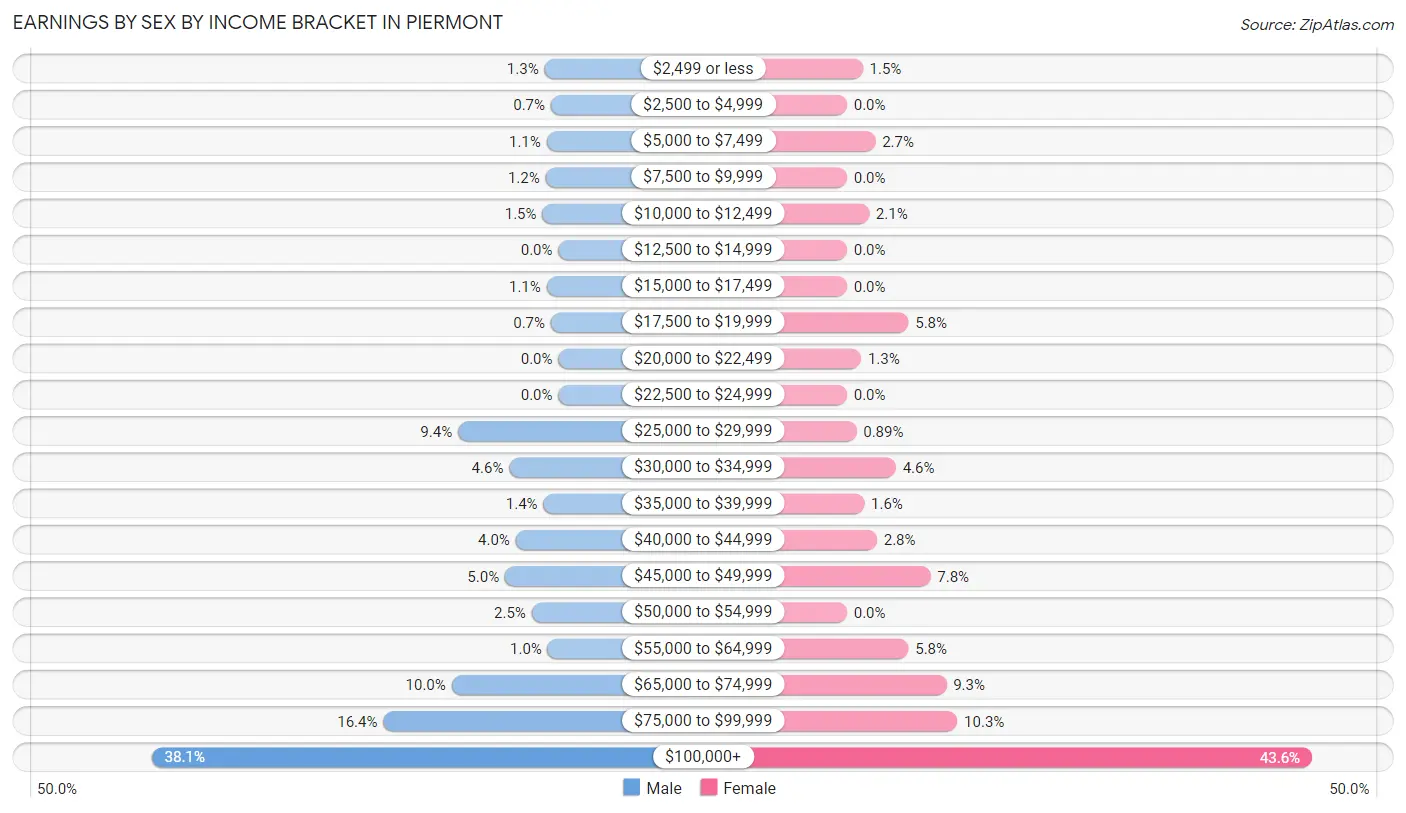
Earnings by Sex by Income Bracket in Piermont
The most common earnings brackets in Piermont are $100,000+ for men (381 | 38.1%) and $100,000+ for women (295 | 43.6%).
| Income | Male | Female |
| $2,499 or less | 13 (1.3%) | 10 (1.5%) |
| $2,500 to $4,999 | 7 (0.7%) | 0 (0.0%) |
| $5,000 to $7,499 | 11 (1.1%) | 18 (2.7%) |
| $7,500 to $9,999 | 12 (1.2%) | 0 (0.0%) |
| $10,000 to $12,499 | 15 (1.5%) | 14 (2.1%) |
| $12,500 to $14,999 | 0 (0.0%) | 0 (0.0%) |
| $15,000 to $17,499 | 11 (1.1%) | 0 (0.0%) |
| $17,500 to $19,999 | 7 (0.7%) | 39 (5.8%) |
| $20,000 to $22,499 | 0 (0.0%) | 9 (1.3%) |
| $22,500 to $24,999 | 0 (0.0%) | 0 (0.0%) |
| $25,000 to $29,999 | 94 (9.4%) | 6 (0.9%) |
| $30,000 to $34,999 | 46 (4.6%) | 31 (4.6%) |
| $35,000 to $39,999 | 14 (1.4%) | 11 (1.6%) |
| $40,000 to $44,999 | 40 (4.0%) | 19 (2.8%) |
| $45,000 to $49,999 | 50 (5.0%) | 53 (7.8%) |
| $50,000 to $54,999 | 25 (2.5%) | 0 (0.0%) |
| $55,000 to $64,999 | 10 (1.0%) | 39 (5.8%) |
| $65,000 to $74,999 | 100 (10.0%) | 63 (9.3%) |
| $75,000 to $99,999 | 164 (16.4%) | 70 (10.3%) |
| $100,000+ | 381 (38.1%) | 295 (43.6%) |
| Total | 1,000 (100.0%) | 677 (100.0%) |
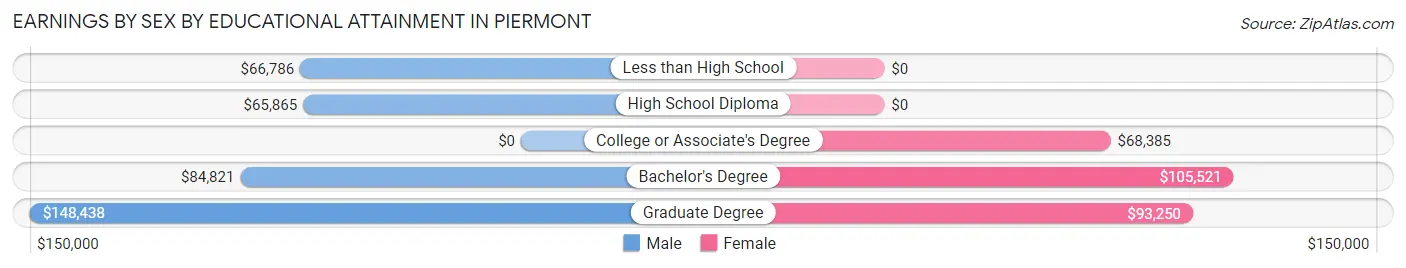
Earnings by Sex by Educational Attainment in Piermont
Average earnings in Piermont are $83,179 for men and $86,042 for women, a difference of 3.3%. Men with an educational attainment of graduate degree enjoy the highest average annual earnings of $148,438, while those with high school diploma education earn the least with $65,865. Women with an educational attainment of bachelor's degree earn the most with the average annual earnings of $105,521, while those with college or associate's degree education have the smallest earnings of $68,385.
| Educational Attainment | Male Income | Female Income |
| Less than High School | $66,786 | $0 |
| High School Diploma | $65,865 | $0 |
| College or Associate's Degree | - | - |
| Bachelor's Degree | $84,821 | $105,521 |
| Graduate Degree | $148,438 | $93,250 |
| Total | $83,179 | $86,042 |
Family Income in Piermont
Family Income Brackets in Piermont
According to the Piermont family income data, there are 271 families falling into the $200,000+ income range, which is the most common income bracket and makes up 45.0% of all families.
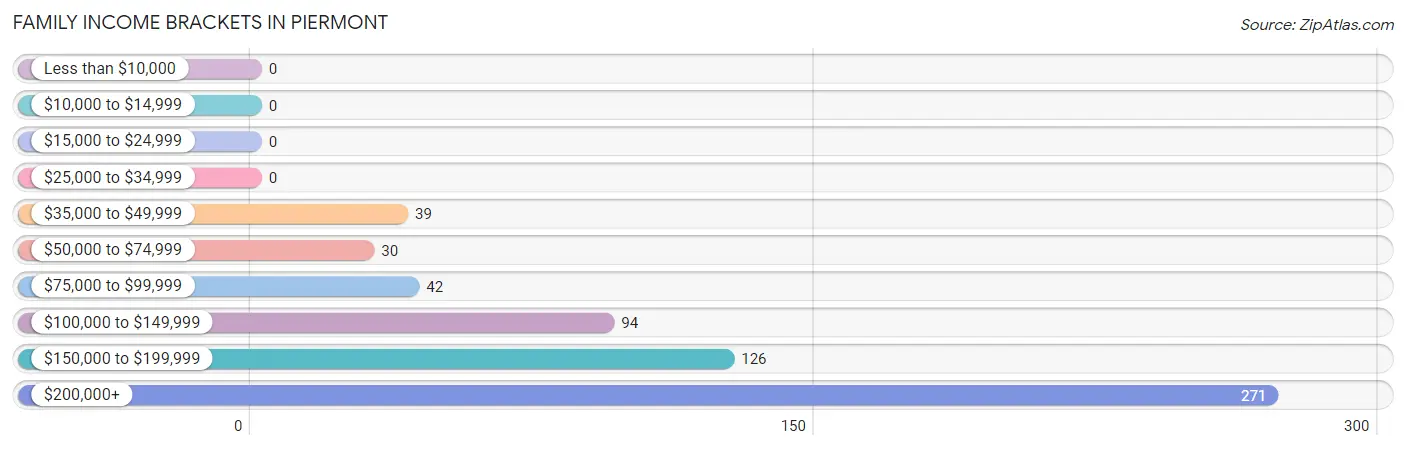
| Income Bracket | # Families | % Families |
| Less than $10,000 | 0 | 0.0% |
| $10,000 to $14,999 | 0 | 0.0% |
| $15,000 to $24,999 | 0 | 0.0% |
| $25,000 to $34,999 | 0 | 0.0% |
| $35,000 to $49,999 | 39 | 6.5% |
| $50,000 to $74,999 | 30 | 5.0% |
| $75,000 to $99,999 | 42 | 7.0% |
| $100,000 to $149,999 | 94 | 15.6% |
| $150,000 to $199,999 | 126 | 20.9% |
| $200,000+ | 271 | 45.0% |
Family Income by Famaliy Size in Piermont
4-person families (130 | 21.6%) account for the highest median family income in Piermont with $250,001 per family, while 2-person families (234 | 38.9%) have the highest median income of $72,600 per family member.
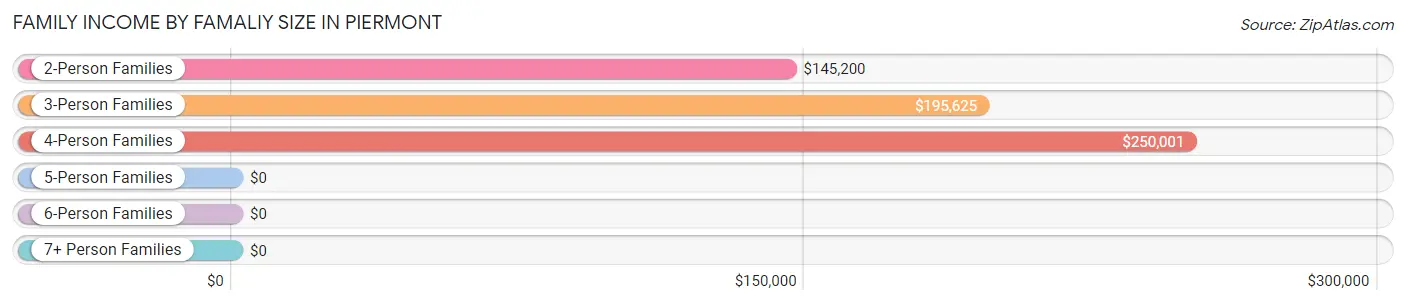
| Income Bracket | # Families | Median Income |
| 2-Person Families | 234 (38.9%) | $145,200 |
| 3-Person Families | 185 (30.7%) | $195,625 |
| 4-Person Families | 130 (21.6%) | $250,001 |
| 5-Person Families | 53 (8.8%) | $0 |
| 6-Person Families | 0 (0.0%) | $0 |
| 7+ Person Families | 0 (0.0%) | $0 |
| Total | 602 (100.0%) | $173,600 |
Family Income by Number of Earners in Piermont
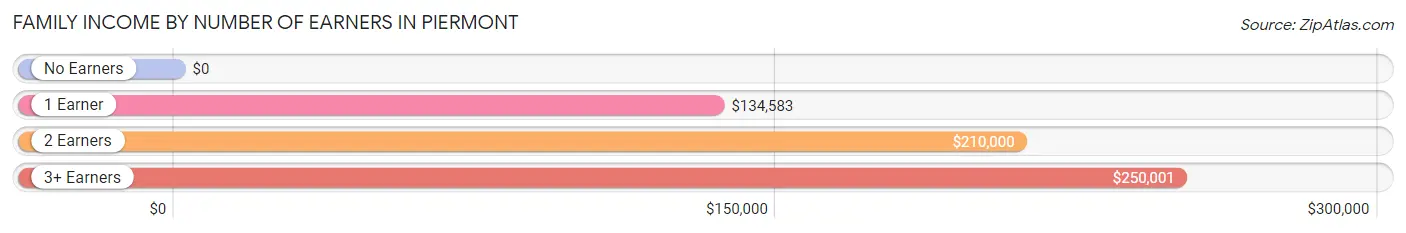
| Number of Earners | # Families | Median Income |
| No Earners | 41 (6.8%) | $0 |
| 1 Earner | 160 (26.6%) | $134,583 |
| 2 Earners | 316 (52.5%) | $210,000 |
| 3+ Earners | 85 (14.1%) | $250,001 |
| Total | 602 (100.0%) | $173,600 |
Household Income in Piermont
Household Income Brackets in Piermont
With 345 households falling in the category, the $200,000+ income range is the most frequent in Piermont, accounting for 28.0% of all households.
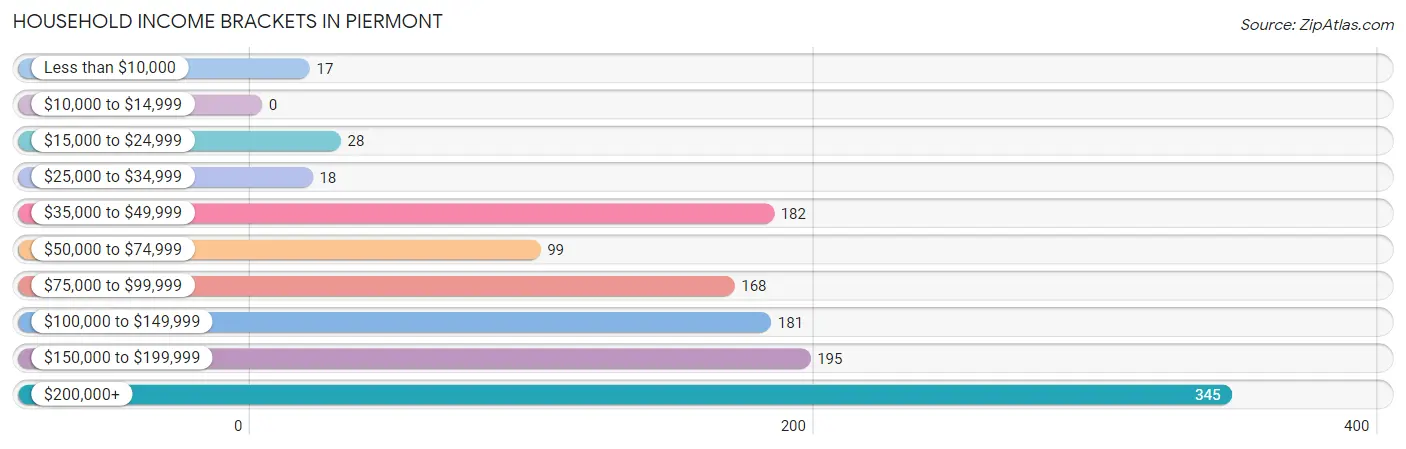
| Income Bracket | # Households | % Households |
| Less than $10,000 | 17 | 1.4% |
| $10,000 to $14,999 | 0 | 0.0% |
| $15,000 to $24,999 | 28 | 2.3% |
| $25,000 to $34,999 | 18 | 1.5% |
| $35,000 to $49,999 | 182 | 14.8% |
| $50,000 to $74,999 | 99 | 8.0% |
| $75,000 to $99,999 | 168 | 13.6% |
| $100,000 to $149,999 | 181 | 14.7% |
| $150,000 to $199,999 | 195 | 15.8% |
| $200,000+ | 345 | 28.0% |
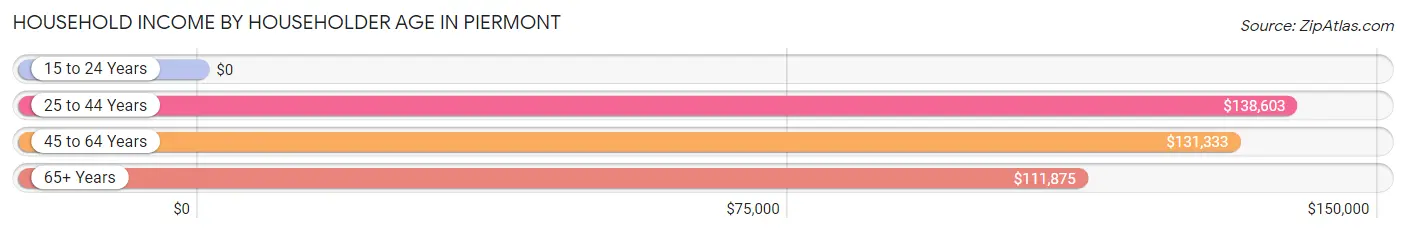
Household Income by Householder Age in Piermont
The median household income in Piermont is $131,458, with the highest median household income of $138,603 found in the 25 to 44 years age bracket for the primary householder. A total of 303 households (24.6%) fall into this category.
| Income Bracket | # Households | Median Income |
| 15 to 24 Years | 0 (0.0%) | $0 |
| 25 to 44 Years | 303 (24.6%) | $138,603 |
| 45 to 64 Years | 516 (41.9%) | $131,333 |
| 65+ Years | 413 (33.5%) | $111,875 |
| Total | 1,232 (100.0%) | $131,458 |
Poverty in Piermont
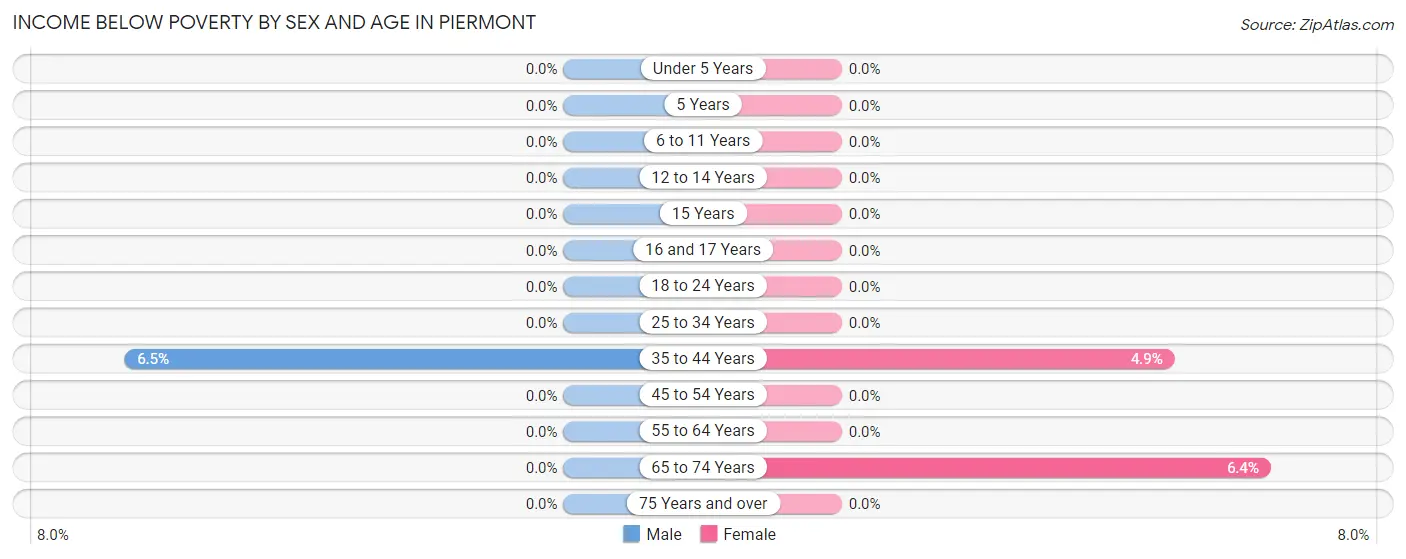
Income Below Poverty by Sex and Age in Piermont
With 0.7% poverty level for males and 1.5% for females among the residents of Piermont, 35 to 44 year old males and 65 to 74 year old females are the most vulnerable to poverty, with 9 males (6.5%) and 10 females (6.4%) in their respective age groups living below the poverty level.
| Age Bracket | Male | Female |
| Under 5 Years | 0 (0.0%) | 0 (0.0%) |
| 5 Years | 0 (0.0%) | 0 (0.0%) |
| 6 to 11 Years | 0 (0.0%) | 0 (0.0%) |
| 12 to 14 Years | 0 (0.0%) | 0 (0.0%) |
| 15 Years | 0 (0.0%) | 0 (0.0%) |
| 16 and 17 Years | 0 (0.0%) | 0 (0.0%) |
| 18 to 24 Years | 0 (0.0%) | 0 (0.0%) |
| 25 to 34 Years | 0 (0.0%) | 0 (0.0%) |
| 35 to 44 Years | 9 (6.5%) | 8 (4.9%) |
| 45 to 54 Years | 0 (0.0%) | 0 (0.0%) |
| 55 to 64 Years | 0 (0.0%) | 0 (0.0%) |
| 65 to 74 Years | 0 (0.0%) | 10 (6.4%) |
| 75 Years and over | 0 (0.0%) | 0 (0.0%) |
| Total | 9 (0.7%) | 18 (1.5%) |
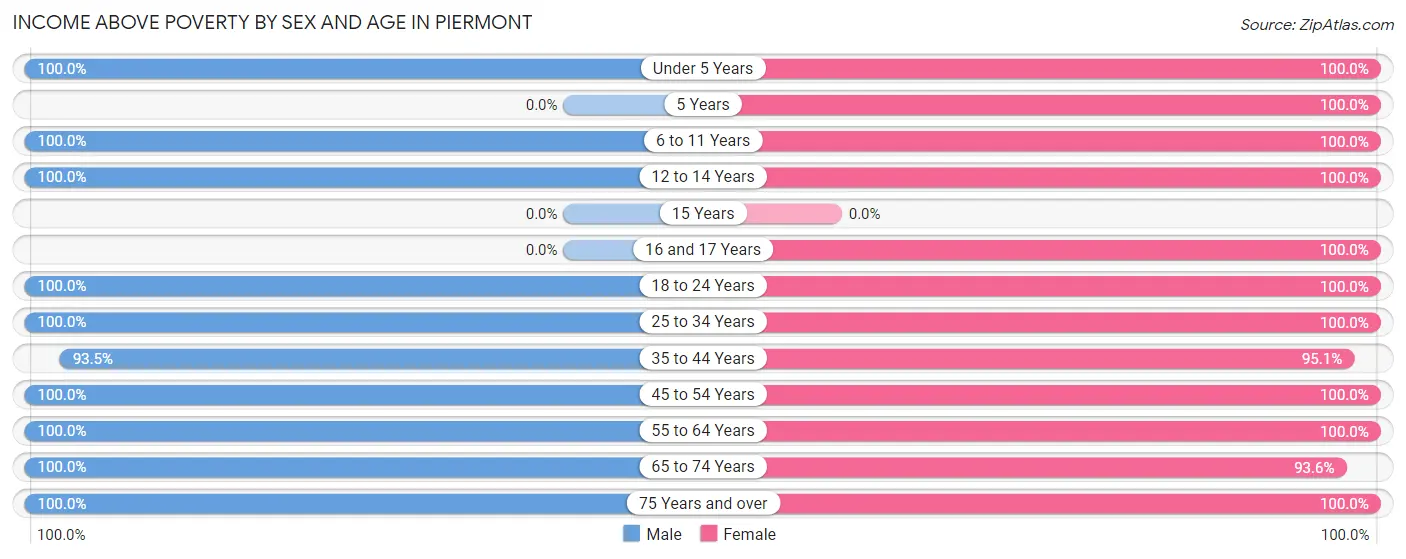
Income Above Poverty by Sex and Age in Piermont
According to the poverty statistics in Piermont, males aged under 5 years and females aged under 5 years are the age groups that are most secure financially, with 100.0% of males and 100.0% of females in these age groups living above the poverty line.
| Age Bracket | Male | Female |
| Under 5 Years | 100 (100.0%) | 67 (100.0%) |
| 5 Years | 0 (0.0%) | 14 (100.0%) |
| 6 to 11 Years | 20 (100.0%) | 36 (100.0%) |
| 12 to 14 Years | 6 (100.0%) | 27 (100.0%) |
| 15 Years | 0 (0.0%) | 0 (0.0%) |
| 16 and 17 Years | 0 (0.0%) | 62 (100.0%) |
| 18 to 24 Years | 69 (100.0%) | 14 (100.0%) |
| 25 to 34 Years | 193 (100.0%) | 141 (100.0%) |
| 35 to 44 Years | 129 (93.5%) | 154 (95.1%) |
| 45 to 54 Years | 254 (100.0%) | 167 (100.0%) |
| 55 to 64 Years | 230 (100.0%) | 192 (100.0%) |
| 65 to 74 Years | 235 (100.0%) | 147 (93.6%) |
| 75 Years and over | 91 (100.0%) | 131 (100.0%) |
| Total | 1,327 (99.3%) | 1,152 (98.5%) |
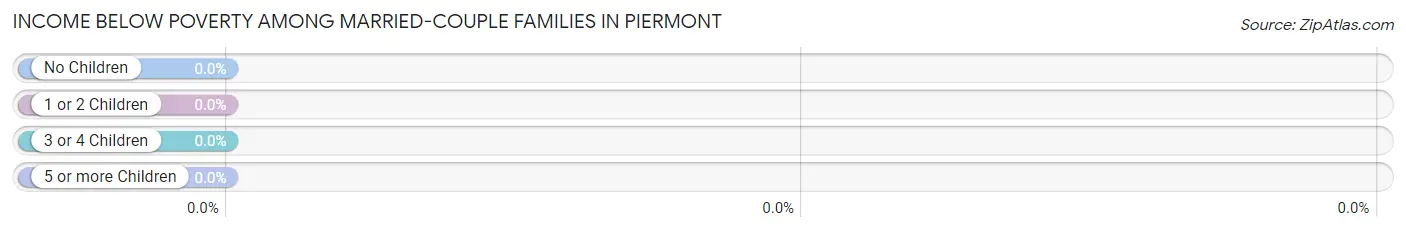
Income Below Poverty Among Married-Couple Families in Piermont
| Children | Above Poverty | Below Poverty |
| No Children | 348 (100.0%) | 0 (0.0%) |
| 1 or 2 Children | 177 (100.0%) | 0 (0.0%) |
| 3 or 4 Children | 0 (0.0%) | 0 (0.0%) |
| 5 or more Children | 0 (0.0%) | 0 (0.0%) |
| Total | 525 (100.0%) | 0 (0.0%) |
Income Below Poverty Among Single-Parent Households in Piermont
| Children | Single Father | Single Mother |
| No Children | 0 (0.0%) | 0 (0.0%) |
| 1 or 2 Children | 0 (0.0%) | 0 (0.0%) |
| 3 or 4 Children | 0 (0.0%) | 0 (0.0%) |
| 5 or more Children | 0 (0.0%) | 0 (0.0%) |
| Total | 0 (0.0%) | 0 (0.0%) |
Income Below Poverty Among Married-Couple vs Single-Parent Households in Piermont
| Children | Married-Couple Families | Single-Parent Households |
| No Children | 0 (0.0%) | 0 (0.0%) |
| 1 or 2 Children | 0 (0.0%) | 0 (0.0%) |
| 3 or 4 Children | 0 (0.0%) | 0 (0.0%) |
| 5 or more Children | 0 (0.0%) | 0 (0.0%) |
| Total | 0 (0.0%) | 0 (0.0%) |
Race in Piermont
The most populous races in Piermont are White / Caucasian (1,987 | 79.3%), Asian (229 | 9.1%), and Black / African American (208 | 8.3%).
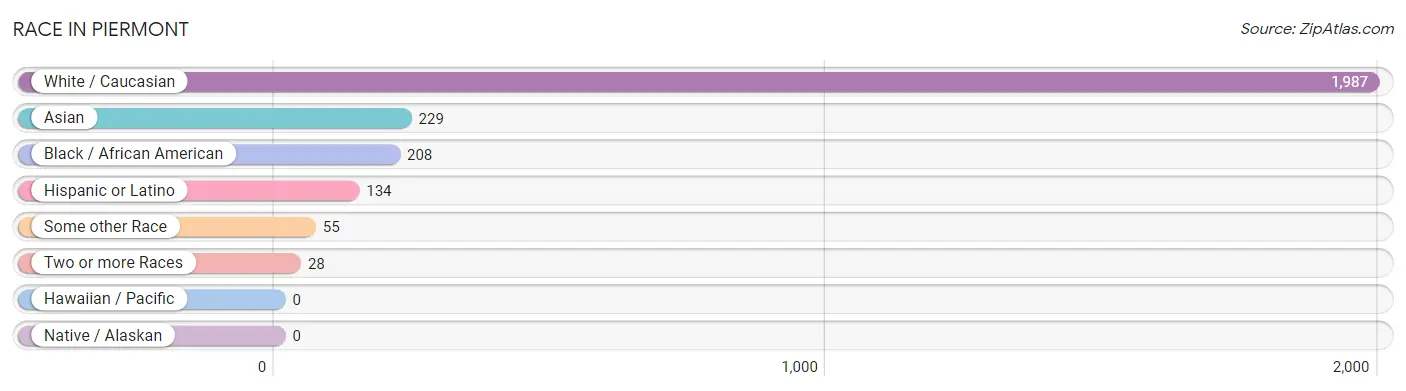
| Race | # Population | % Population |
| Asian | 229 | 9.1% |
| Black / African American | 208 | 8.3% |
| Hawaiian / Pacific | 0 | 0.0% |
| Hispanic or Latino | 134 | 5.3% |
| Native / Alaskan | 0 | 0.0% |
| White / Caucasian | 1,987 | 79.3% |
| Two or more Races | 28 | 1.1% |
| Some other Race | 55 | 2.2% |
| Total | 2,507 | 100.0% |
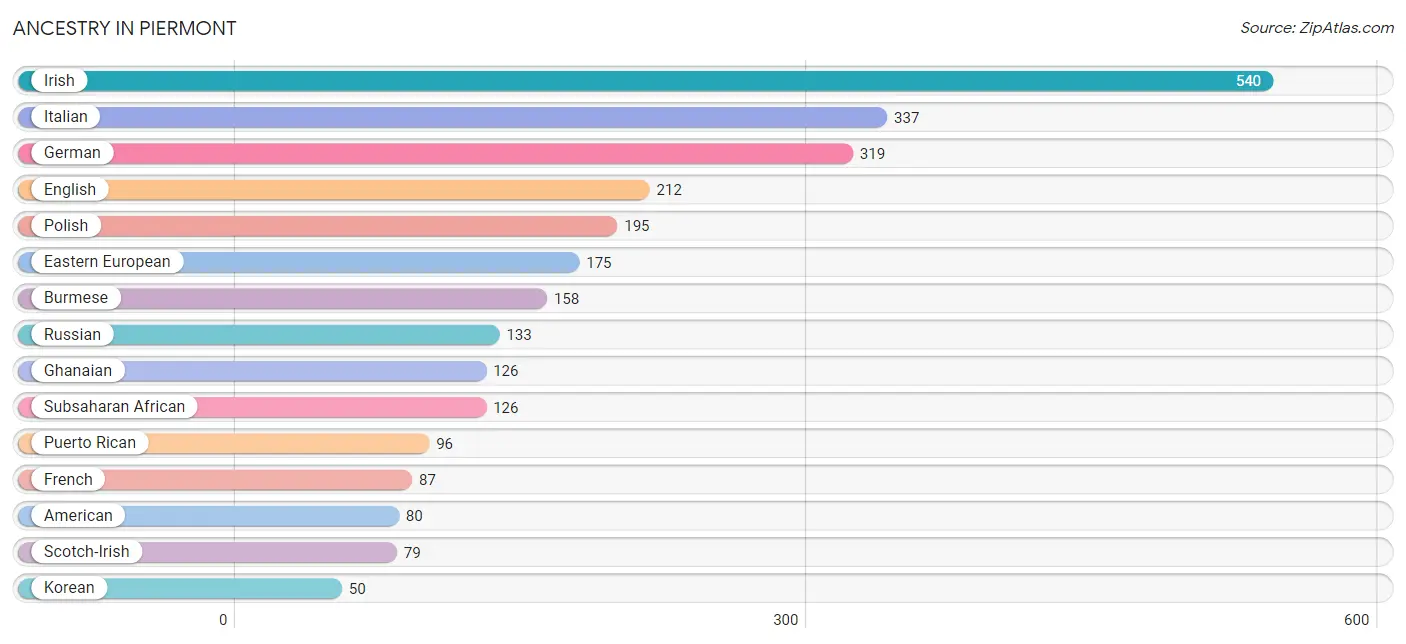
Ancestry in Piermont
The most populous ancestries reported in Piermont are Irish (540 | 21.5%), Italian (337 | 13.4%), German (319 | 12.7%), English (212 | 8.5%), and Polish (195 | 7.8%), together accounting for 63.9% of all Piermont residents.
| Ancestry | # Population | % Population |
| Afghan | 6 | 0.2% |
| American | 80 | 3.2% |
| Arab | 10 | 0.4% |
| Austrian | 12 | 0.5% |
| Bhutanese | 2 | 0.1% |
| Bulgarian | 25 | 1.0% |
| Burmese | 158 | 6.3% |
| Czech | 49 | 1.9% |
| Czechoslovakian | 20 | 0.8% |
| Dutch | 48 | 1.9% |
| Eastern European | 175 | 7.0% |
| Ecuadorian | 24 | 1.0% |
| English | 212 | 8.5% |
| European | 41 | 1.6% |
| French | 87 | 3.5% |
| French Canadian | 48 | 1.9% |
| German | 319 | 12.7% |
| Ghanaian | 126 | 5.0% |
| Greek | 37 | 1.5% |
| Hungarian | 13 | 0.5% |
| Indian (Asian) | 12 | 0.5% |
| Irish | 540 | 21.5% |
| Italian | 337 | 13.4% |
| Korean | 50 | 2.0% |
| Lithuanian | 6 | 0.2% |
| Norwegian | 9 | 0.4% |
| Polish | 195 | 7.8% |
| Puerto Rican | 96 | 3.8% |
| Russian | 133 | 5.3% |
| Scotch-Irish | 79 | 3.2% |
| Scottish | 21 | 0.8% |
| Slovak | 6 | 0.2% |
| South American | 24 | 1.0% |
| Spanish | 14 | 0.6% |
| Subsaharan African | 126 | 5.0% |
| Swedish | 22 | 0.9% |
| Swiss | 10 | 0.4% |
| Syrian | 10 | 0.4% |
| Thai | 1 | 0.0% |
| Turkish | 15 | 0.6% |
| Ukrainian | 29 | 1.2% | View All 41 Rows |
Immigrants in Piermont
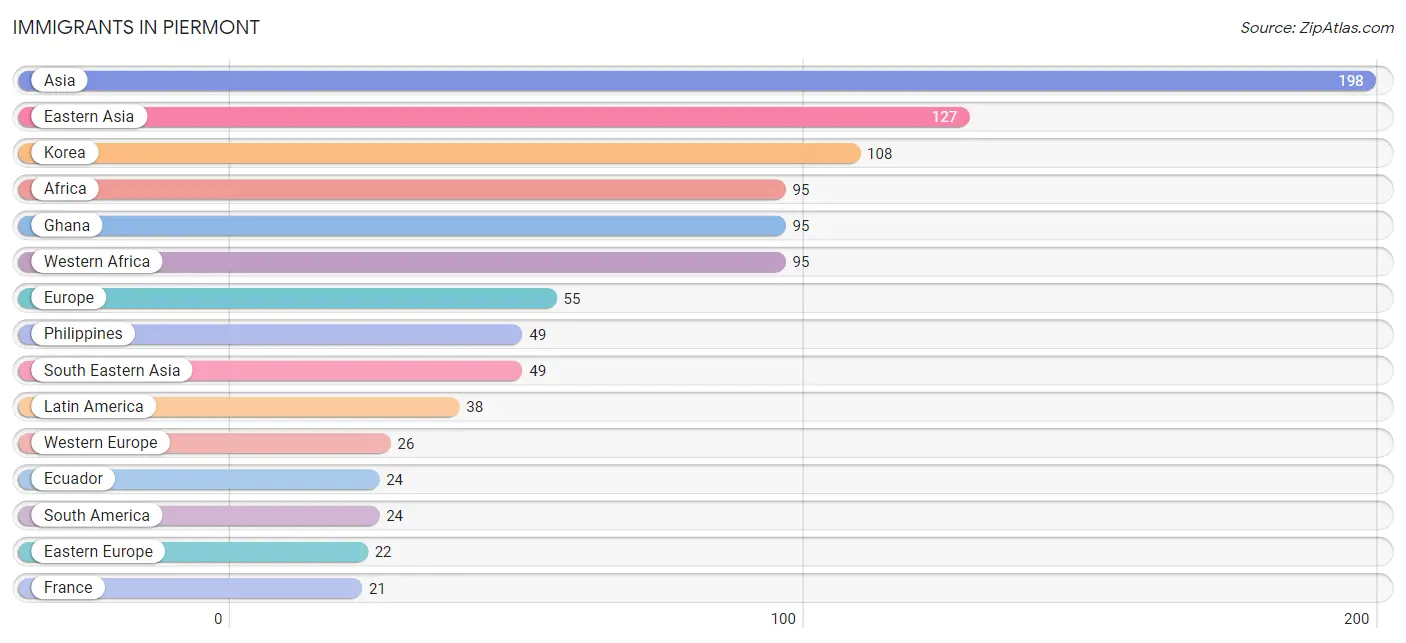
The most numerous immigrant groups reported in Piermont came from Asia (198 | 7.9%), Eastern Asia (127 | 5.1%), Korea (108 | 4.3%), Africa (95 | 3.8%), and Ghana (95 | 3.8%), together accounting for 24.9% of all Piermont residents.
| Immigration Origin | # Population | % Population |
| Afghanistan | 6 | 0.2% |
| Africa | 95 | 3.8% |
| Asia | 198 | 7.9% |
| Bulgaria | 12 | 0.5% |
| Central America | 14 | 0.6% |
| China | 17 | 0.7% |
| Czechoslovakia | 10 | 0.4% |
| Eastern Asia | 127 | 5.1% |
| Eastern Europe | 22 | 0.9% |
| Ecuador | 24 | 1.0% |
| El Salvador | 14 | 0.6% |
| Europe | 55 | 2.2% |
| France | 21 | 0.8% |
| Germany | 5 | 0.2% |
| Ghana | 95 | 3.8% |
| India | 1 | 0.0% |
| Japan | 2 | 0.1% |
| Korea | 108 | 4.3% |
| Latin America | 38 | 1.5% |
| Northern Europe | 7 | 0.3% |
| Philippines | 49 | 1.9% |
| South America | 24 | 1.0% |
| South Central Asia | 7 | 0.3% |
| South Eastern Asia | 49 | 1.9% |
| Turkey | 15 | 0.6% |
| Western Africa | 95 | 3.8% |
| Western Asia | 15 | 0.6% |
| Western Europe | 26 | 1.0% | View All 28 Rows |
Sex and Age in Piermont
Sex and Age in Piermont
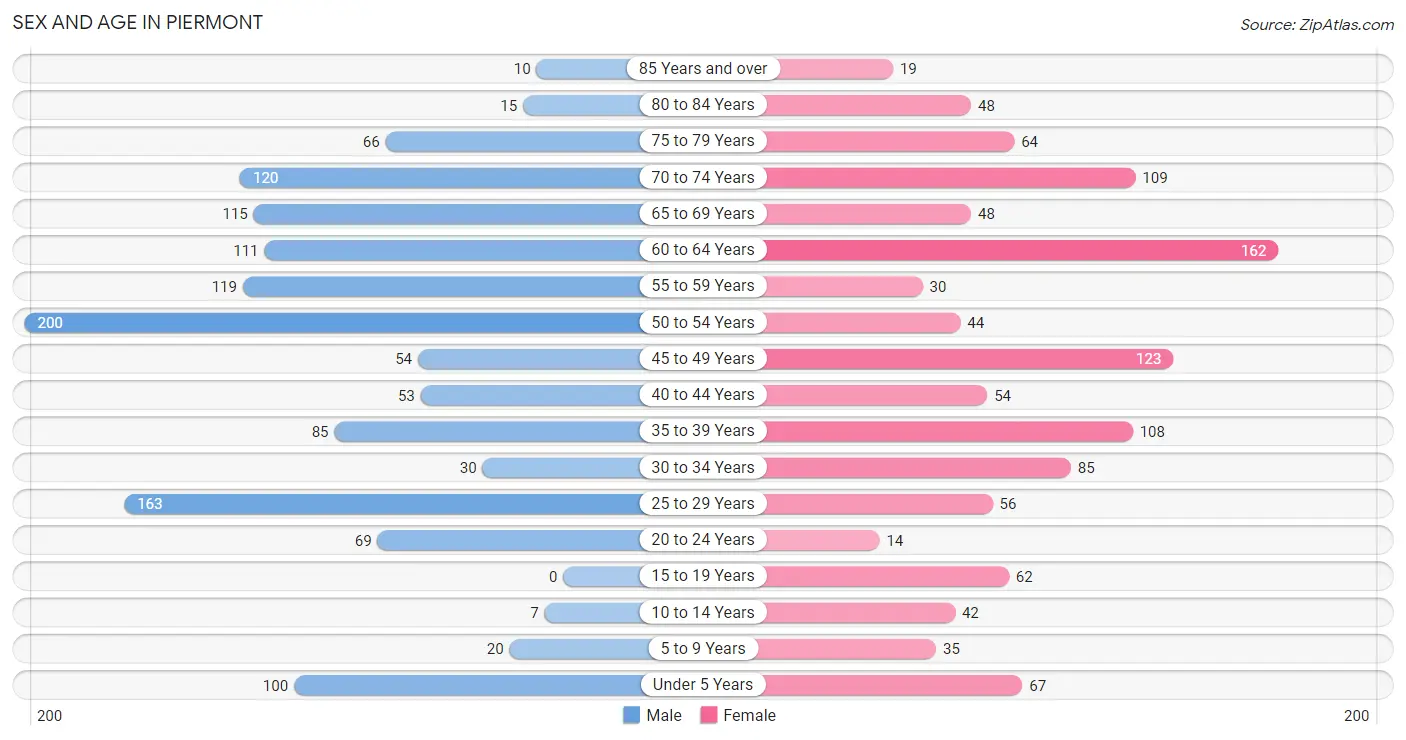
The most populous age groups in Piermont are 50 to 54 Years (200 | 15.0%) for men and 60 to 64 Years (162 | 13.9%) for women.
| Age Bracket | Male | Female |
| Under 5 Years | 100 (7.5%) | 67 (5.7%) |
| 5 to 9 Years | 20 (1.5%) | 35 (3.0%) |
| 10 to 14 Years | 7 (0.5%) | 42 (3.6%) |
| 15 to 19 Years | 0 (0.0%) | 62 (5.3%) |
| 20 to 24 Years | 69 (5.2%) | 14 (1.2%) |
| 25 to 29 Years | 163 (12.2%) | 56 (4.8%) |
| 30 to 34 Years | 30 (2.2%) | 85 (7.3%) |
| 35 to 39 Years | 85 (6.4%) | 108 (9.2%) |
| 40 to 44 Years | 53 (4.0%) | 54 (4.6%) |
| 45 to 49 Years | 54 (4.0%) | 123 (10.5%) |
| 50 to 54 Years | 200 (15.0%) | 44 (3.8%) |
| 55 to 59 Years | 119 (8.9%) | 30 (2.6%) |
| 60 to 64 Years | 111 (8.3%) | 162 (13.9%) |
| 65 to 69 Years | 115 (8.6%) | 48 (4.1%) |
| 70 to 74 Years | 120 (9.0%) | 109 (9.3%) |
| 75 to 79 Years | 66 (4.9%) | 64 (5.5%) |
| 80 to 84 Years | 15 (1.1%) | 48 (4.1%) |
| 85 Years and over | 10 (0.7%) | 19 (1.6%) |
| Total | 1,337 (100.0%) | 1,170 (100.0%) |
Families and Households in Piermont
Median Family Size in Piermont
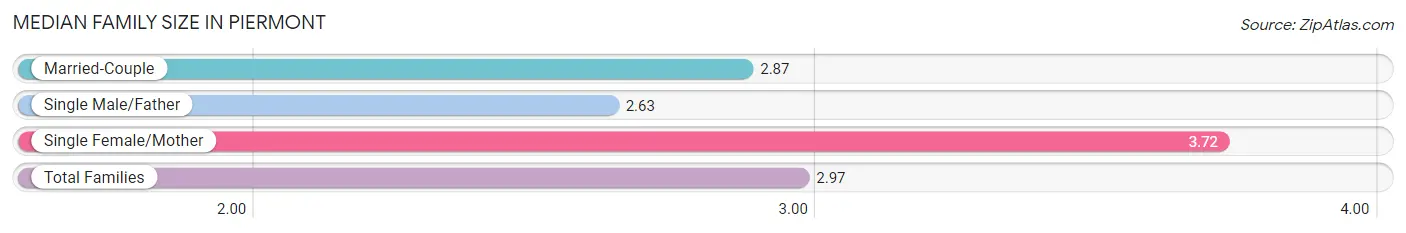
The median family size in Piermont is 2.97 persons per family, with single female/mother families (69 | 11.5%) accounting for the largest median family size of 3.72 persons per family. On the other hand, single male/father families (8 | 1.3%) represent the smallest median family size with 2.63 persons per family.
| Family Type | # Families | Family Size |
| Married-Couple | 525 (87.2%) | 2.87 |
| Single Male/Father | 8 (1.3%) | 2.63 |
| Single Female/Mother | 69 (11.5%) | 3.72 |
| Total Families | 602 (100.0%) | 2.97 |
Median Household Size in Piermont
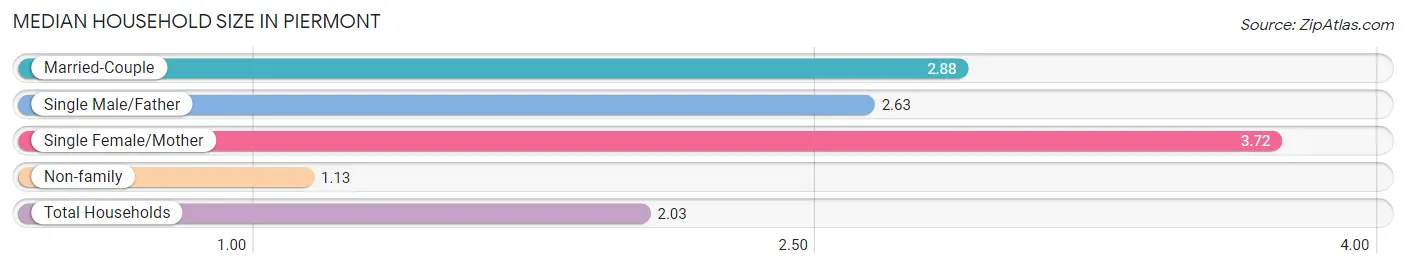
The median household size in Piermont is 2.03 persons per household, with single female/mother households (69 | 5.6%) accounting for the largest median household size of 3.72 persons per household. non-family households (630 | 51.1%) represent the smallest median household size with 1.13 persons per household.
| Household Type | # Households | Household Size |
| Married-Couple | 525 (42.6%) | 2.88 |
| Single Male/Father | 8 (0.6%) | 2.63 |
| Single Female/Mother | 69 (5.6%) | 3.72 |
| Non-family | 630 (51.1%) | 1.13 |
| Total Households | 1,232 (100.0%) | 2.03 |
Household Size by Marriage Status in Piermont
Out of a total of 1,232 households in Piermont, 602 (48.9%) are family households, while 630 (51.1%) are nonfamily households. The most numerous type of family households are 2-person households, comprising 228, and the most common type of nonfamily households are 1-person households, comprising 552.
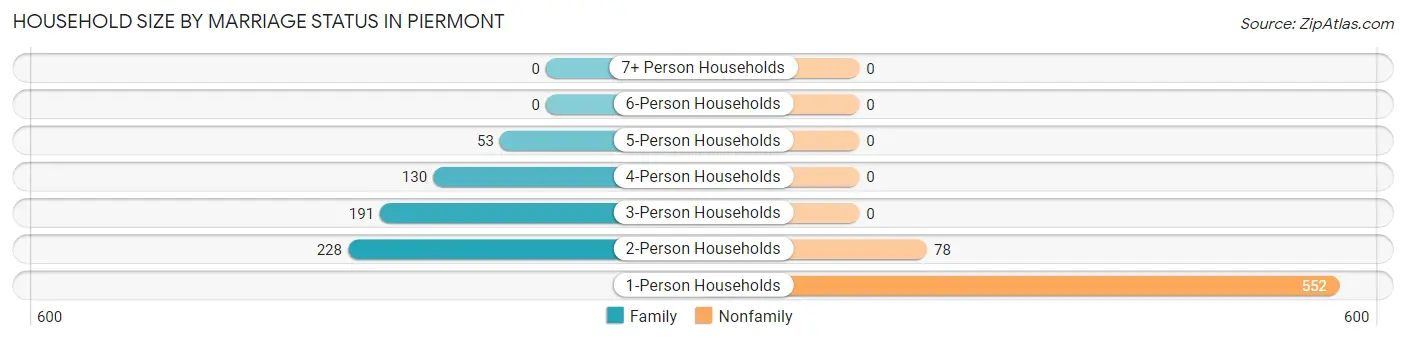
| Household Size | Family Households | Nonfamily Households |
| 1-Person Households | - | 552 (44.8%) |
| 2-Person Households | 228 (18.5%) | 78 (6.3%) |
| 3-Person Households | 191 (15.5%) | 0 (0.0%) |
| 4-Person Households | 130 (10.5%) | 0 (0.0%) |
| 5-Person Households | 53 (4.3%) | 0 (0.0%) |
| 6-Person Households | 0 (0.0%) | 0 (0.0%) |
| 7+ Person Households | 0 (0.0%) | 0 (0.0%) |
| Total | 602 (48.9%) | 630 (51.1%) |
Female Fertility in Piermont
Fertility by Age in Piermont
Average fertility rate in Piermont is 84.0 births per 1,000 women. Women in the age bracket of 35 to 50 years have the highest fertility rate with 146.0 births per 1,000 women. Women in the age bracket of 35 to 50 years acount for 100.0% of all women with births.
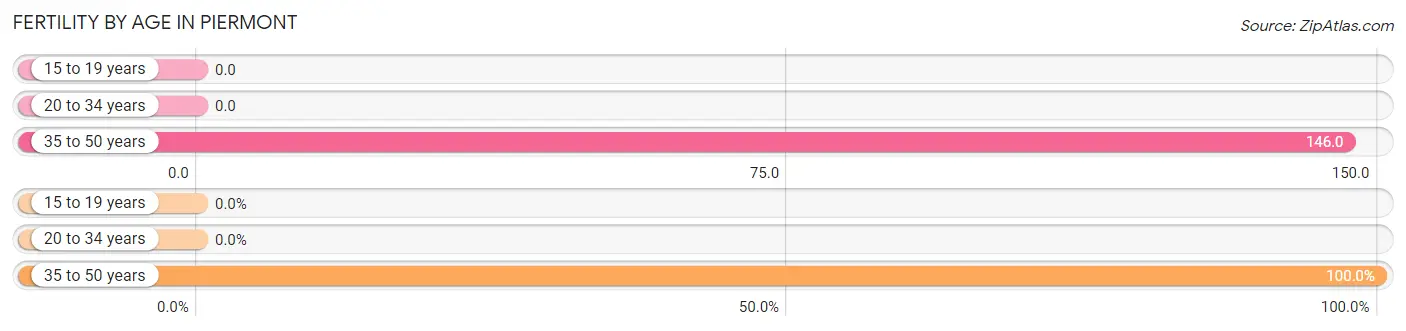
| Age Bracket | Women with Births | Births / 1,000 Women |
| 15 to 19 years | 0 (0.0%) | 0.0 |
| 20 to 34 years | 0 (0.0%) | 0.0 |
| 35 to 50 years | 43 (100.0%) | 146.0 |
| Total | 43 (100.0%) | 84.0 |
Fertility by Age by Marriage Status in Piermont
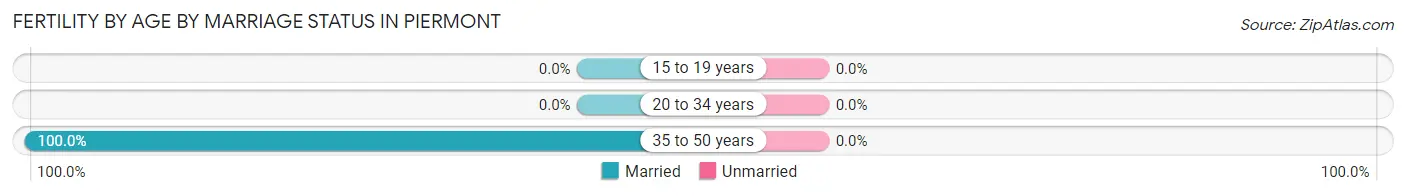
| Age Bracket | Married | Unmarried |
| 15 to 19 years | 0 (0.0%) | 0 (0.0%) |
| 20 to 34 years | 0 (0.0%) | 0 (0.0%) |
| 35 to 50 years | 43 (100.0%) | 0 (0.0%) |
| Total | 43 (100.0%) | 0 (0.0%) |
Fertility by Education in Piermont
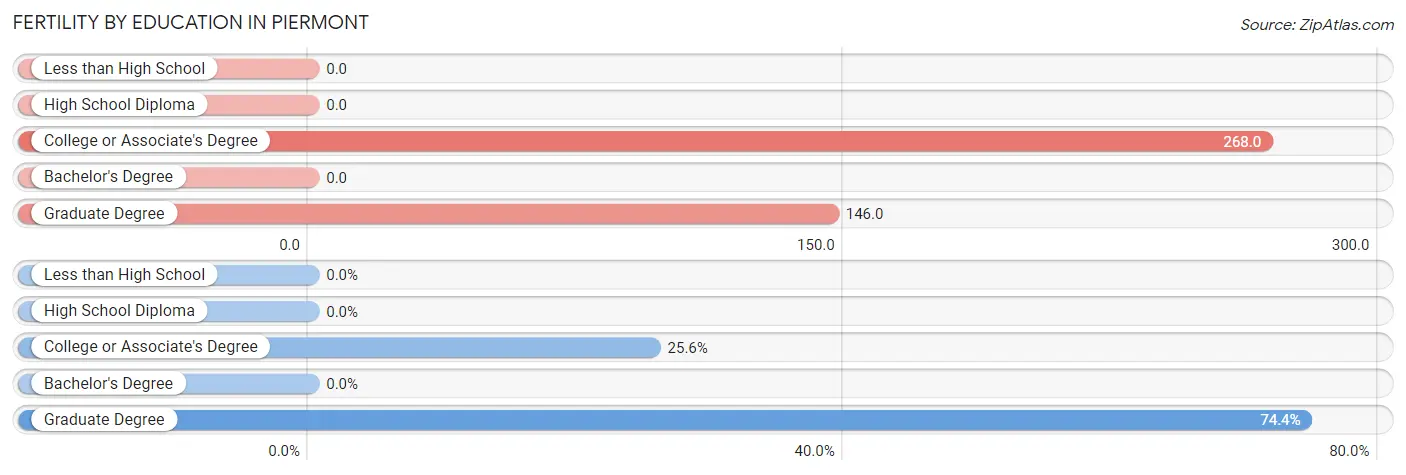
| Educational Attainment | Women with Births | Births / 1,000 Women |
| Less than High School | 0 (0.0%) | 0.0 |
| High School Diploma | 0 (0.0%) | 0.0 |
| College or Associate's Degree | 11 (25.6%) | 268.0 |
| Bachelor's Degree | 0 (0.0%) | 0.0 |
| Graduate Degree | 32 (74.4%) | 146.0 |
| Total | 43 (100.0%) | 84.0 |
Fertility by Education by Marriage Status in Piermont
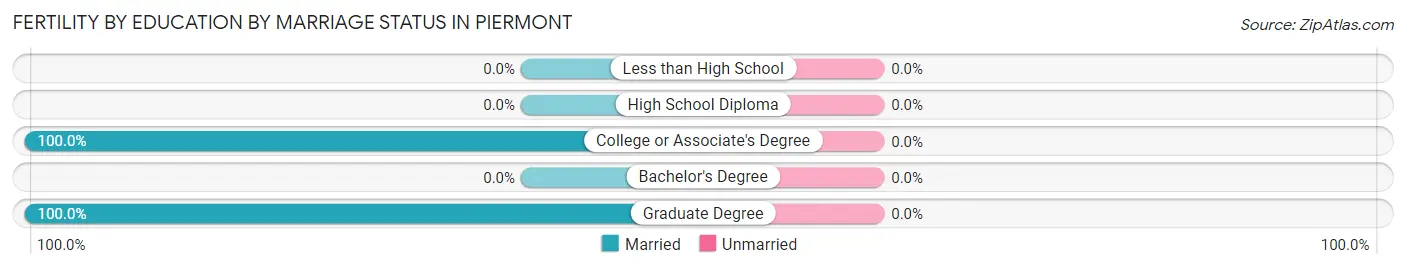
| Educational Attainment | Married | Unmarried |
| Less than High School | 0 (0.0%) | 0 (0.0%) |
| High School Diploma | 0 (0.0%) | 0 (0.0%) |
| College or Associate's Degree | 11 (100.0%) | 0 (0.0%) |
| Bachelor's Degree | 0 (0.0%) | 0 (0.0%) |
| Graduate Degree | 32 (100.0%) | 0 (0.0%) |
| Total | 43 (100.0%) | 0 (0.0%) |
Employment Characteristics in Piermont
Employment by Class of Employer in Piermont
Among the 1,577 employed individuals in Piermont, private company employees (876 | 55.5%), not-for-profit organizations (286 | 18.1%), and self-employed (not incorporated) (166 | 10.5%) make up the most common classes of employment.
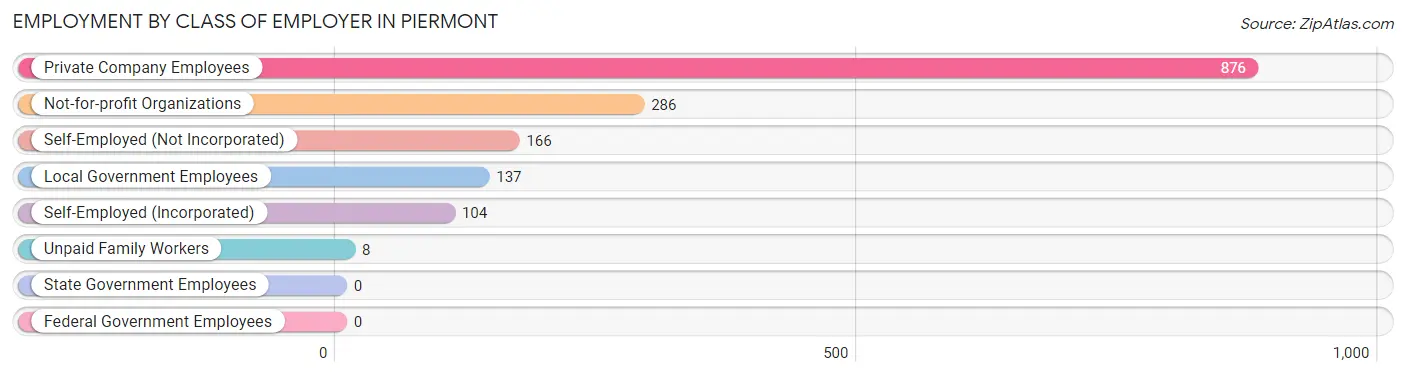
| Employer Class | # Employees | % Employees |
| Private Company Employees | 876 | 55.5% |
| Self-Employed (Incorporated) | 104 | 6.6% |
| Self-Employed (Not Incorporated) | 166 | 10.5% |
| Not-for-profit Organizations | 286 | 18.1% |
| Local Government Employees | 137 | 8.7% |
| State Government Employees | 0 | 0.0% |
| Federal Government Employees | 0 | 0.0% |
| Unpaid Family Workers | 8 | 0.5% |
| Total | 1,577 | 100.0% |
Employment Status by Age in Piermont
According to the labor force statistics for Piermont, out of the total population over 16 years of age (2,236), 73.2% or 1,637 individuals are in the labor force, with 3.5% or 57 of them unemployed. The age group with the highest labor force participation rate is 25 to 29 years, with 100.0% or 219 individuals in the labor force. Within the labor force, the 20 to 24 years age range has the highest percentage of unemployed individuals, with 18.0% or 11 of them being unemployed.
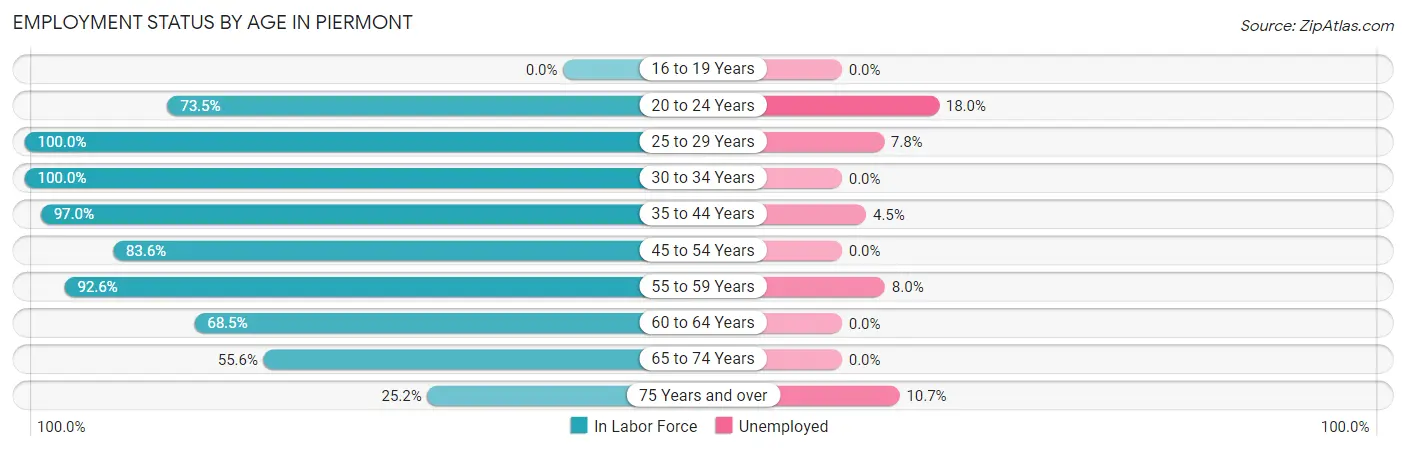
| Age Bracket | In Labor Force | Unemployed |
| 16 to 19 Years | 0 (0.0%) | 0 (0.0%) |
| 20 to 24 Years | 61 (73.5%) | 11 (18.0%) |
| 25 to 29 Years | 219 (100.0%) | 17 (7.8%) |
| 30 to 34 Years | 115 (100.0%) | 0 (0.0%) |
| 35 to 44 Years | 291 (97.0%) | 13 (4.5%) |
| 45 to 54 Years | 352 (83.6%) | 0 (0.0%) |
| 55 to 59 Years | 138 (92.6%) | 11 (8.0%) |
| 60 to 64 Years | 187 (68.5%) | 0 (0.0%) |
| 65 to 74 Years | 218 (55.6%) | 0 (0.0%) |
| 75 Years and over | 56 (25.2%) | 6 (10.7%) |
| Total | 1,637 (73.2%) | 57 (3.5%) |
Employment Status by Educational Attainment in Piermont
According to labor force statistics for Piermont, 88.2% of individuals (1,303) out of the total population between 25 and 64 years of age (1,477) are in the labor force, with 3.1% or 40 of them being unemployed. The group with the highest labor force participation rate are those with the educational attainment of bachelor's degree or higher, with 92.2% or 963 individuals in the labor force. Within the labor force, individuals with high school diploma education have the highest percentage of unemployment, with 11.6% or 11 of them being unemployed.
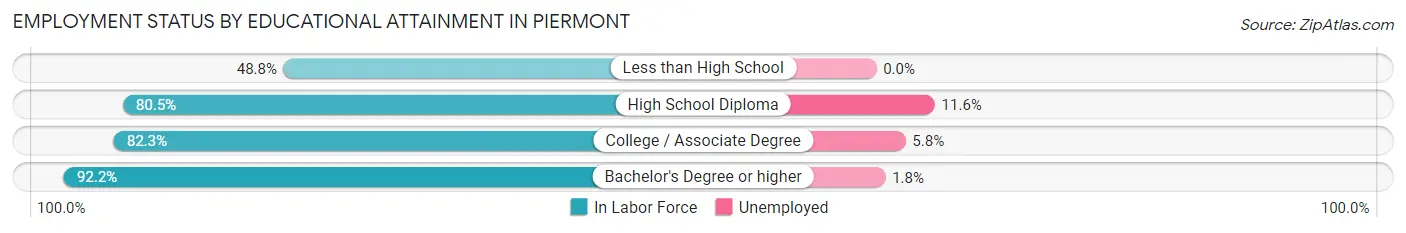
| Educational Attainment | In Labor Force | Unemployed |
| Less than High School | 21 (48.8%) | 0 (0.0%) |
| High School Diploma | 95 (80.5%) | 14 (11.6%) |
| College / Associate Degree | 223 (82.3%) | 16 (5.8%) |
| Bachelor's Degree or higher | 963 (92.2%) | 19 (1.8%) |
| Total | 1,303 (88.2%) | 46 (3.1%) |
Employment Occupations by Sex in Piermont
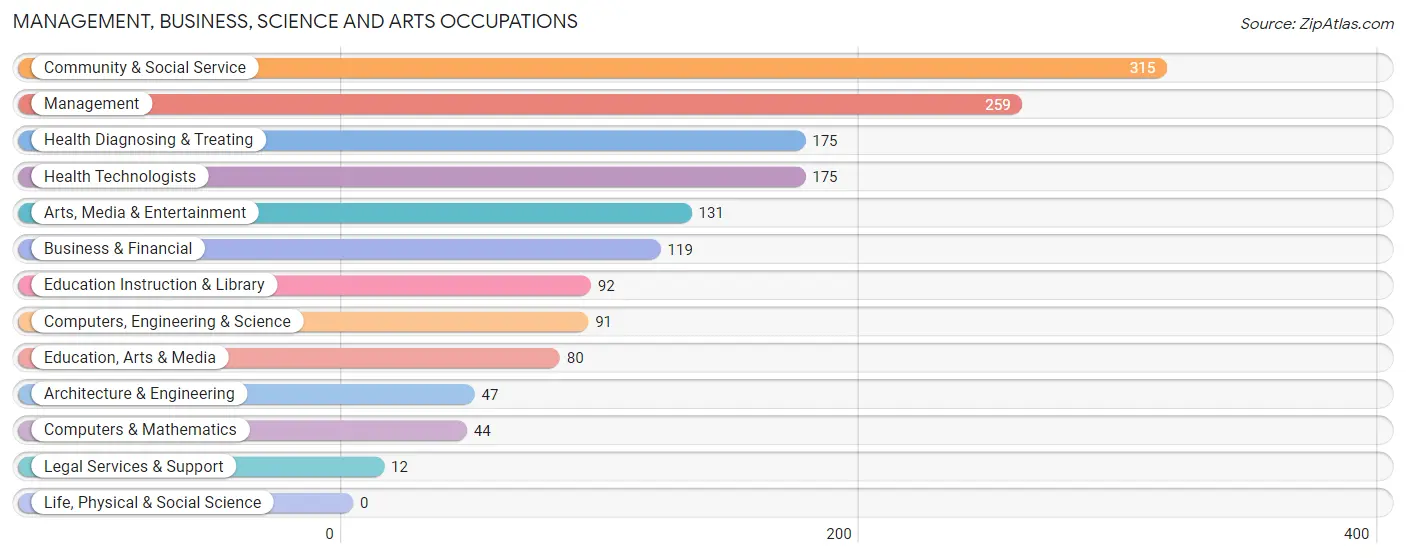
Management, Business, Science and Arts Occupations
The most common Management, Business, Science and Arts occupations in Piermont are Community & Social Service (315 | 20.0%), Management (259 | 16.4%), Health Diagnosing & Treating (175 | 11.1%), Health Technologists (175 | 11.1%), and Arts, Media & Entertainment (131 | 8.3%).
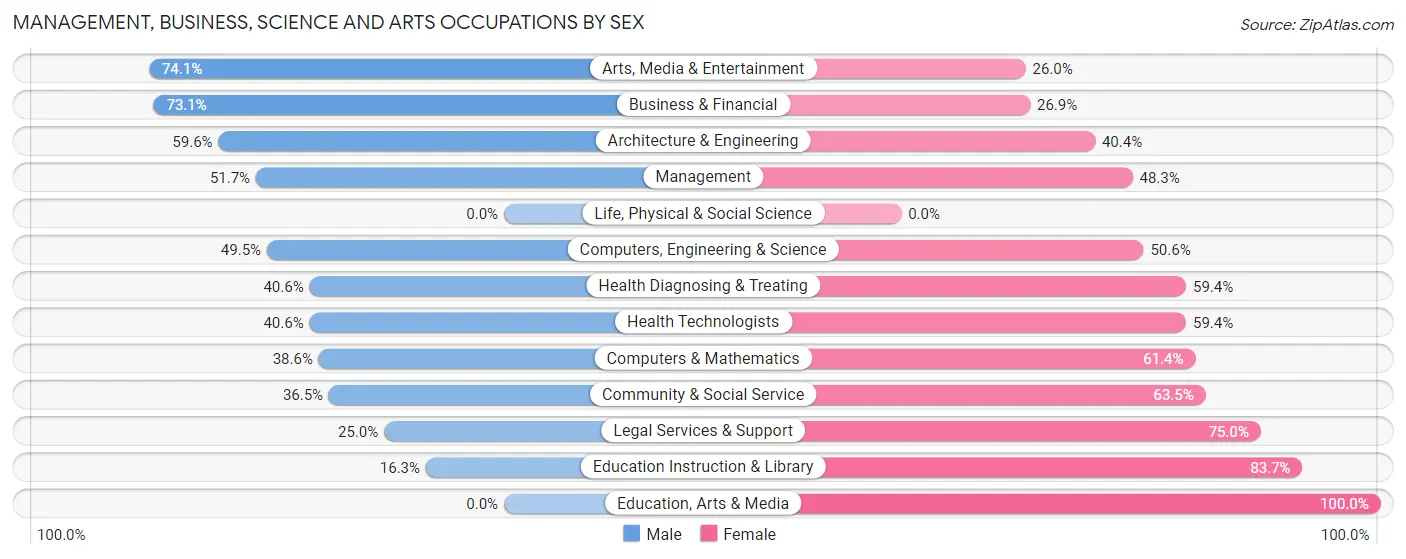
Management, Business, Science and Arts Occupations by Sex
Within the Management, Business, Science and Arts occupations in Piermont, the most male-oriented occupations are Arts, Media & Entertainment (74.1%), Business & Financial (73.1%), and Architecture & Engineering (59.6%), while the most female-oriented occupations are Education, Arts & Media (100.0%), Education Instruction & Library (83.7%), and Legal Services & Support (75.0%).
| Occupation | Male | Female |
| Management | 134 (51.7%) | 125 (48.3%) |
| Business & Financial | 87 (73.1%) | 32 (26.9%) |
| Computers, Engineering & Science | 45 (49.4%) | 46 (50.5%) |
| Computers & Mathematics | 17 (38.6%) | 27 (61.4%) |
| Architecture & Engineering | 28 (59.6%) | 19 (40.4%) |
| Life, Physical & Social Science | 0 (0.0%) | 0 (0.0%) |
| Community & Social Service | 115 (36.5%) | 200 (63.5%) |
| Education, Arts & Media | 0 (0.0%) | 80 (100.0%) |
| Legal Services & Support | 3 (25.0%) | 9 (75.0%) |
| Education Instruction & Library | 15 (16.3%) | 77 (83.7%) |
| Arts, Media & Entertainment | 97 (74.1%) | 34 (26.0%) |
| Health Diagnosing & Treating | 71 (40.6%) | 104 (59.4%) |
| Health Technologists | 71 (40.6%) | 104 (59.4%) |
| Total (Category) | 452 (47.1%) | 507 (52.9%) |
| Total (Overall) | 942 (59.7%) | 637 (40.3%) |
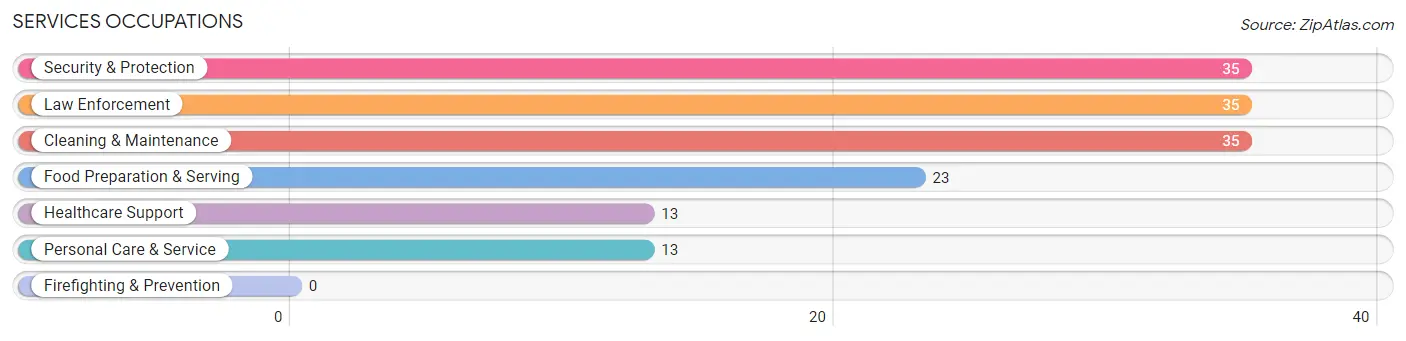
Services Occupations
The most common Services occupations in Piermont are Security & Protection (35 | 2.2%), Law Enforcement (35 | 2.2%), Cleaning & Maintenance (35 | 2.2%), Food Preparation & Serving (23 | 1.5%), and Healthcare Support (13 | 0.8%).
Services Occupations by Sex
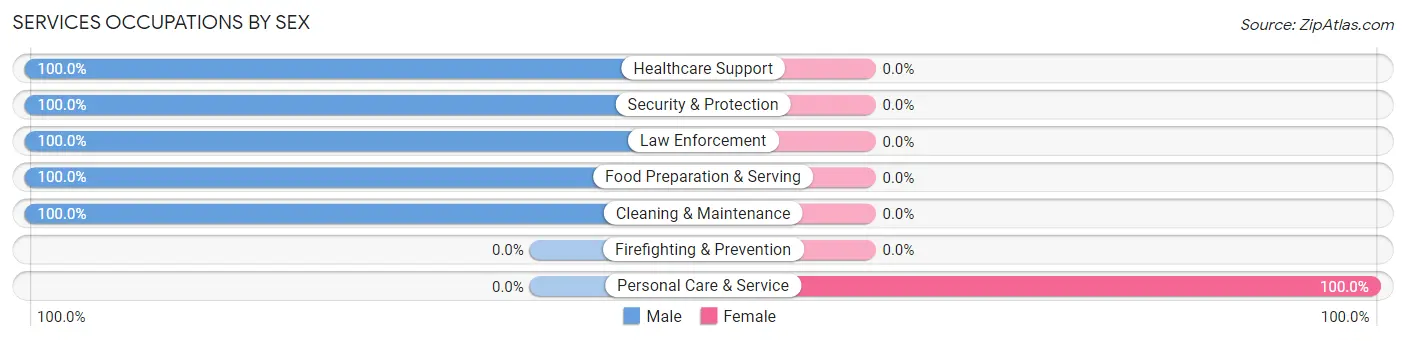
| Occupation | Male | Female |
| Healthcare Support | 13 (100.0%) | 0 (0.0%) |
| Security & Protection | 35 (100.0%) | 0 (0.0%) |
| Firefighting & Prevention | 0 (0.0%) | 0 (0.0%) |
| Law Enforcement | 35 (100.0%) | 0 (0.0%) |
| Food Preparation & Serving | 23 (100.0%) | 0 (0.0%) |
| Cleaning & Maintenance | 35 (100.0%) | 0 (0.0%) |
| Personal Care & Service | 0 (0.0%) | 13 (100.0%) |
| Total (Category) | 106 (89.1%) | 13 (10.9%) |
| Total (Overall) | 942 (59.7%) | 637 (40.3%) |
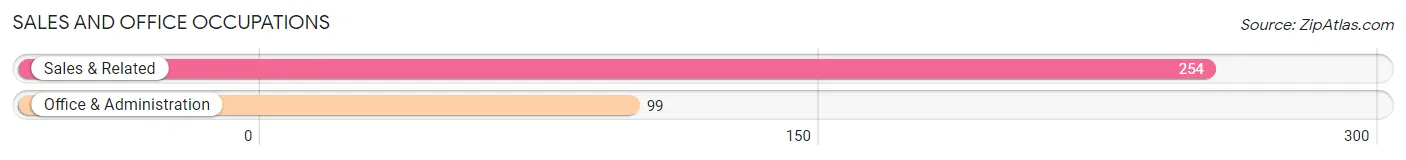
Sales and Office Occupations
The most common Sales and Office occupations in Piermont are Sales & Related (254 | 16.1%), and Office & Administration (99 | 6.3%).
Sales and Office Occupations by Sex
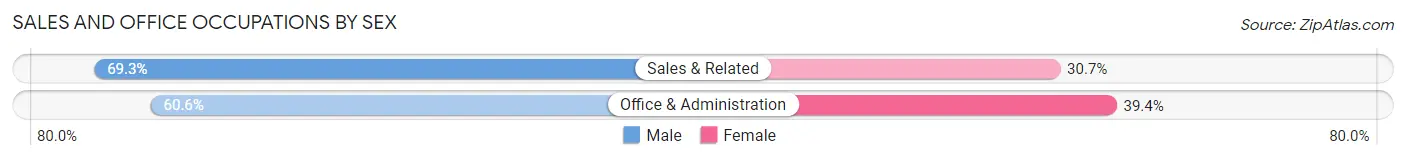
| Occupation | Male | Female |
| Sales & Related | 176 (69.3%) | 78 (30.7%) |
| Office & Administration | 60 (60.6%) | 39 (39.4%) |
| Total (Category) | 236 (66.9%) | 117 (33.1%) |
| Total (Overall) | 942 (59.7%) | 637 (40.3%) |
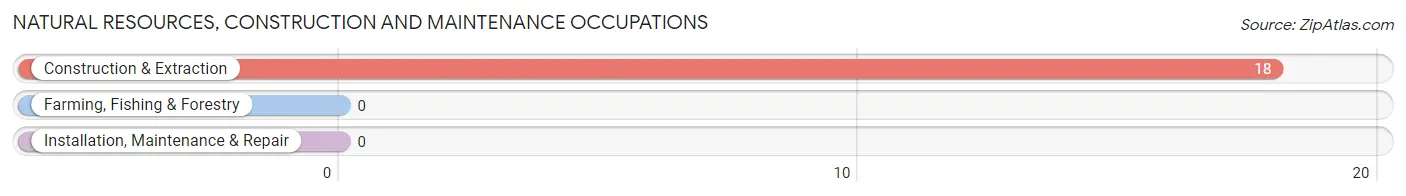
Natural Resources, Construction and Maintenance Occupations
The most common Natural Resources, Construction and Maintenance occupations in Piermont are , and Construction & Extraction (18 | 1.1%).
Natural Resources, Construction and Maintenance Occupations by Sex
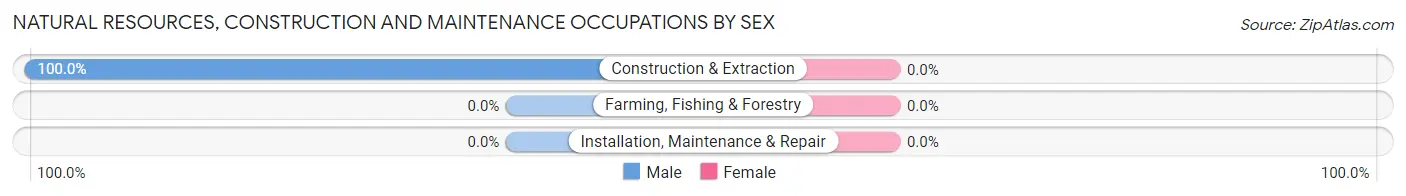
| Occupation | Male | Female |
| Farming, Fishing & Forestry | 0 (0.0%) | 0 (0.0%) |
| Construction & Extraction | 18 (100.0%) | 0 (0.0%) |
| Installation, Maintenance & Repair | 0 (0.0%) | 0 (0.0%) |
| Total (Category) | 18 (100.0%) | 0 (0.0%) |
| Total (Overall) | 942 (59.7%) | 637 (40.3%) |
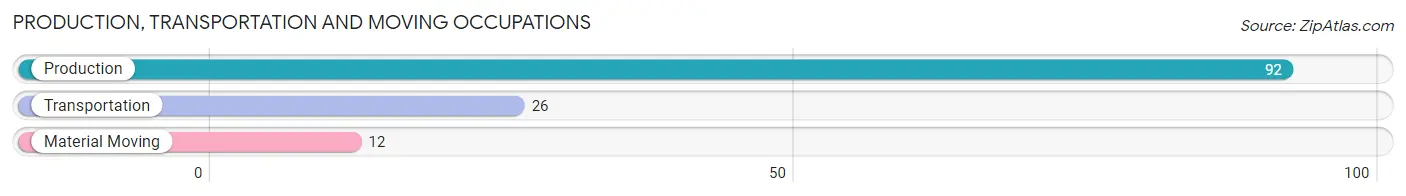
Production, Transportation and Moving Occupations
The most common Production, Transportation and Moving occupations in Piermont are Production (92 | 5.8%), Transportation (26 | 1.7%), and Material Moving (12 | 0.8%).
Production, Transportation and Moving Occupations by Sex
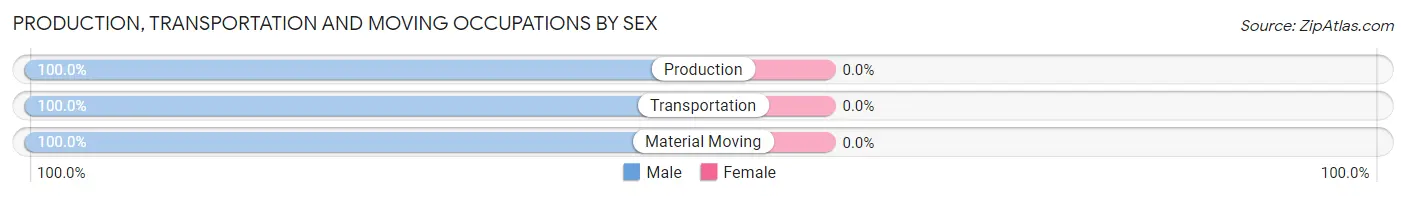
| Occupation | Male | Female |
| Production | 92 (100.0%) | 0 (0.0%) |
| Transportation | 26 (100.0%) | 0 (0.0%) |
| Material Moving | 12 (100.0%) | 0 (0.0%) |
| Total (Category) | 130 (100.0%) | 0 (0.0%) |
| Total (Overall) | 942 (59.7%) | 637 (40.3%) |
Employment Industries by Sex in Piermont
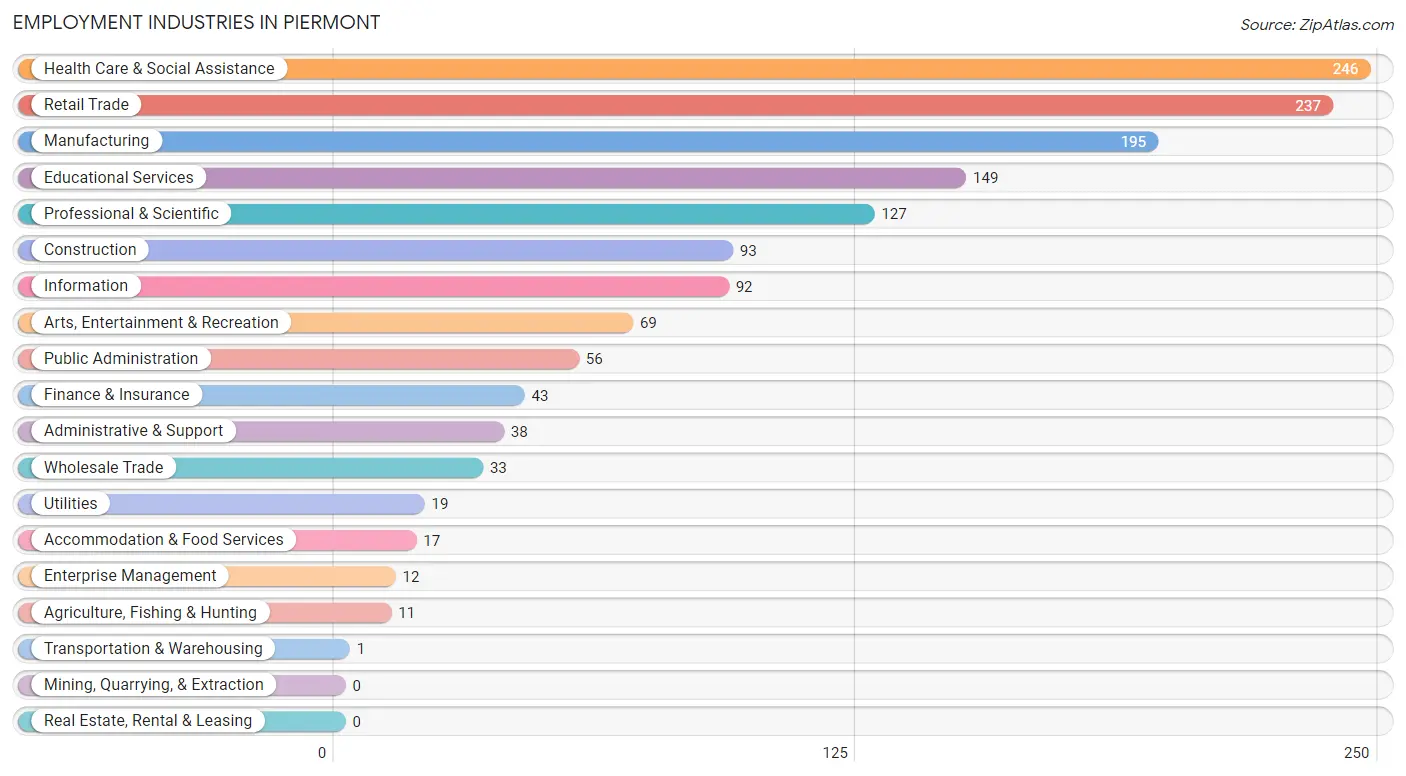
Employment Industries in Piermont
The major employment industries in Piermont include Health Care & Social Assistance (246 | 15.6%), Retail Trade (237 | 15.0%), Manufacturing (195 | 12.3%), Educational Services (149 | 9.4%), and Professional & Scientific (127 | 8.0%).
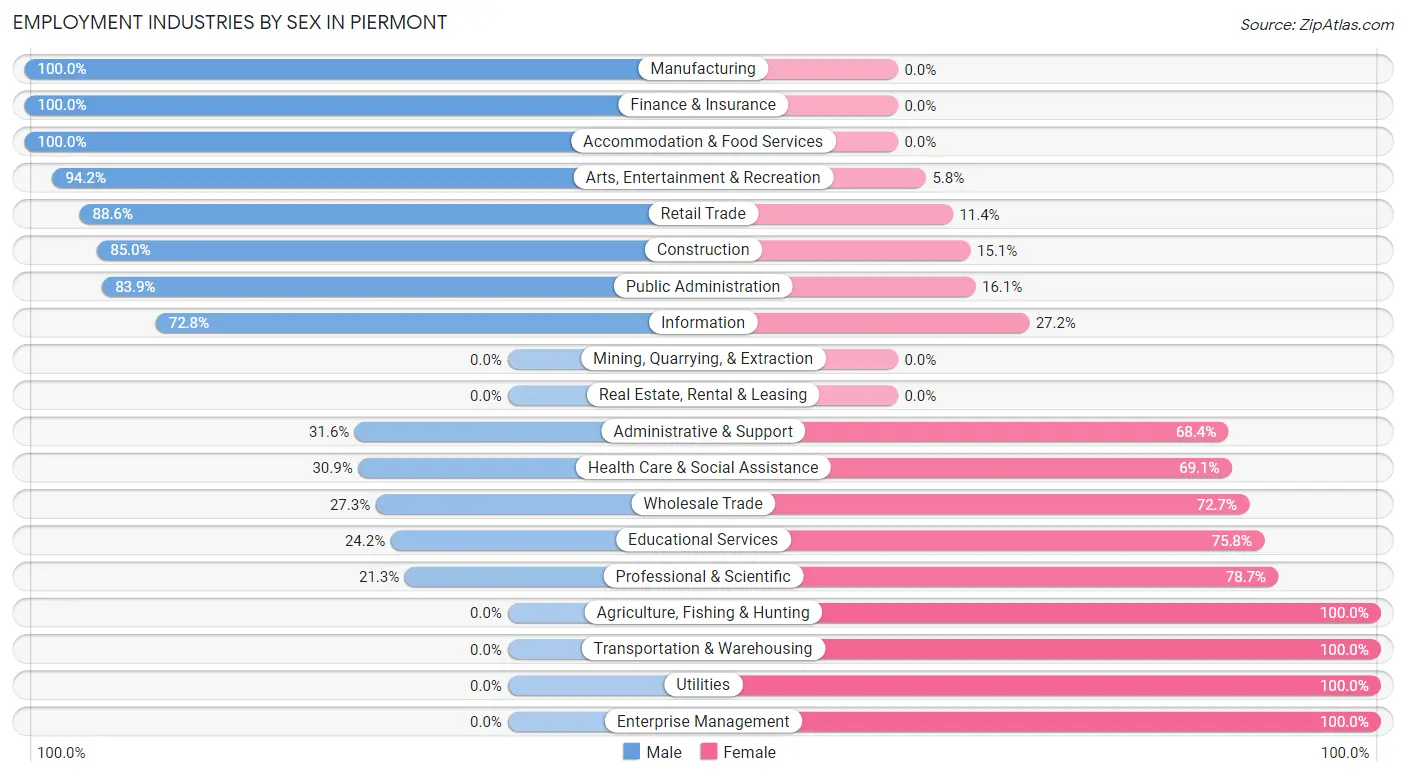
Employment Industries by Sex in Piermont
The Piermont industries that see more men than women are Manufacturing (100.0%), Finance & Insurance (100.0%), and Accommodation & Food Services (100.0%), whereas the industries that tend to have a higher number of women are Agriculture, Fishing & Hunting (100.0%), Transportation & Warehousing (100.0%), and Utilities (100.0%).
| Industry | Male | Female |
| Agriculture, Fishing & Hunting | 0 (0.0%) | 11 (100.0%) |
| Mining, Quarrying, & Extraction | 0 (0.0%) | 0 (0.0%) |
| Construction | 79 (85.0%) | 14 (15.0%) |
| Manufacturing | 195 (100.0%) | 0 (0.0%) |
| Wholesale Trade | 9 (27.3%) | 24 (72.7%) |
| Retail Trade | 210 (88.6%) | 27 (11.4%) |
| Transportation & Warehousing | 0 (0.0%) | 1 (100.0%) |
| Utilities | 0 (0.0%) | 19 (100.0%) |
| Information | 67 (72.8%) | 25 (27.2%) |
| Finance & Insurance | 43 (100.0%) | 0 (0.0%) |
| Real Estate, Rental & Leasing | 0 (0.0%) | 0 (0.0%) |
| Professional & Scientific | 27 (21.3%) | 100 (78.7%) |
| Enterprise Management | 0 (0.0%) | 12 (100.0%) |
| Administrative & Support | 12 (31.6%) | 26 (68.4%) |
| Educational Services | 36 (24.2%) | 113 (75.8%) |
| Health Care & Social Assistance | 76 (30.9%) | 170 (69.1%) |
| Arts, Entertainment & Recreation | 65 (94.2%) | 4 (5.8%) |
| Accommodation & Food Services | 17 (100.0%) | 0 (0.0%) |
| Public Administration | 47 (83.9%) | 9 (16.1%) |
| Total | 942 (59.7%) | 637 (40.3%) |
Education in Piermont
School Enrollment in Piermont
The most common levels of schooling among the 385 students in Piermont are college / undergraduate (83 | 21.6%), graduate / professional (82 | 21.3%), and high school (68 | 17.7%).
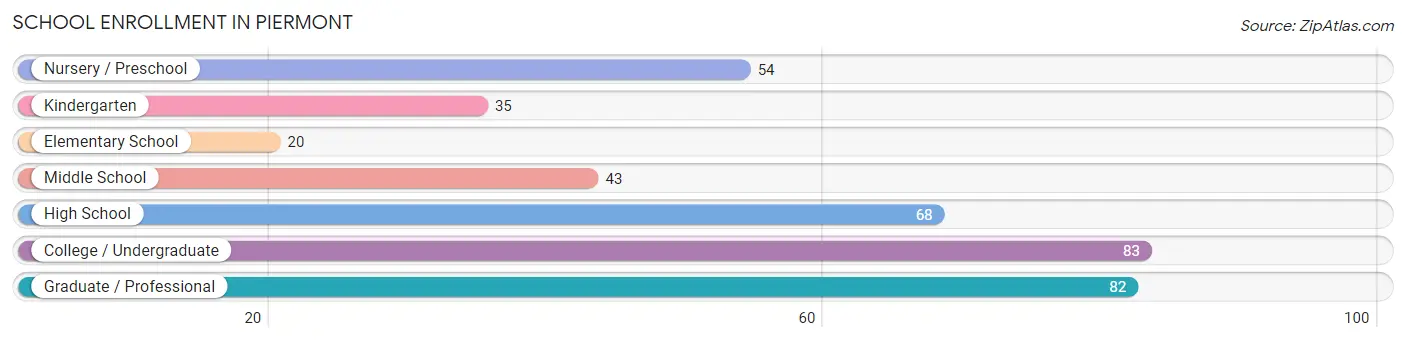
| School Level | # Students | % Students |
| Nursery / Preschool | 54 | 14.0% |
| Kindergarten | 35 | 9.1% |
| Elementary School | 20 | 5.2% |
| Middle School | 43 | 11.2% |
| High School | 68 | 17.7% |
| College / Undergraduate | 83 | 21.6% |
| Graduate / Professional | 82 | 21.3% |
| Total | 385 | 100.0% |
School Enrollment by Age by Funding Source in Piermont
Out of a total of 385 students who are enrolled in schools in Piermont, 181 (47.0%) attend a private institution, while the remaining 204 (53.0%) are enrolled in public schools. The age group of 3 to 4 year olds has the highest likelihood of being enrolled in private schools, with 54 (100.0% in the age bracket) enrolled. Conversely, the age group of 5 to 9 year old has the lowest likelihood of being enrolled in a private school, with 55 (100.0% in the age bracket) attending a public institution.
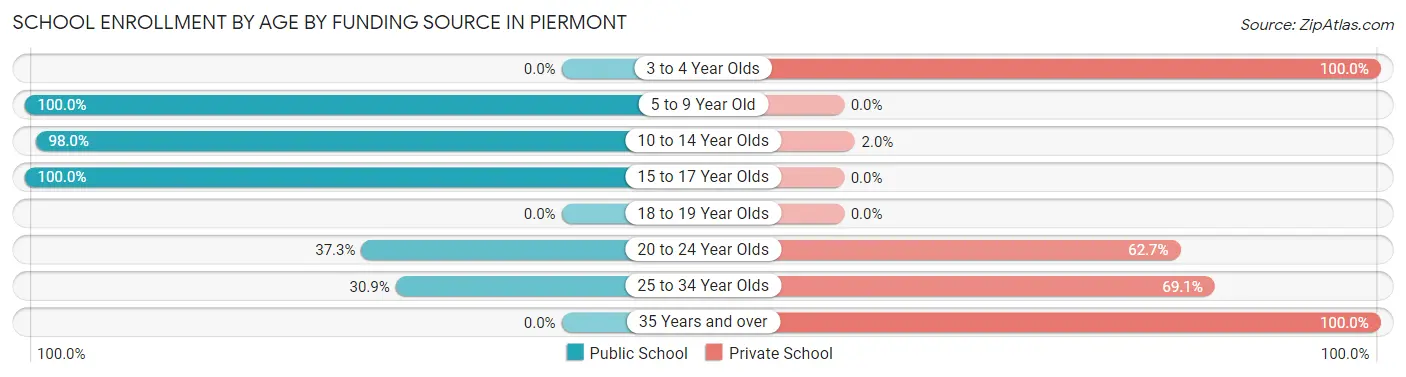
| Age Bracket | Public School | Private School |
| 3 to 4 Year Olds | 0 (0.0%) | 54 (100.0%) |
| 5 to 9 Year Old | 55 (100.0%) | 0 (0.0%) |
| 10 to 14 Year Olds | 48 (98.0%) | 1 (2.0%) |
| 15 to 17 Year Olds | 62 (100.0%) | 0 (0.0%) |
| 18 to 19 Year Olds | 0 (0.0%) | 0 (0.0%) |
| 20 to 24 Year Olds | 22 (37.3%) | 37 (62.7%) |
| 25 to 34 Year Olds | 17 (30.9%) | 38 (69.1%) |
| 35 Years and over | 0 (0.0%) | 51 (100.0%) |
| Total | 204 (53.0%) | 181 (47.0%) |
Educational Attainment by Field of Study in Piermont
Business (263 | 17.3%), social sciences (174 | 11.5%), education (140 | 9.2%), science & technology (134 | 8.8%), and engineering (130 | 8.6%) are the most common fields of study among 1,520 individuals in Piermont who have obtained a bachelor's degree or higher.
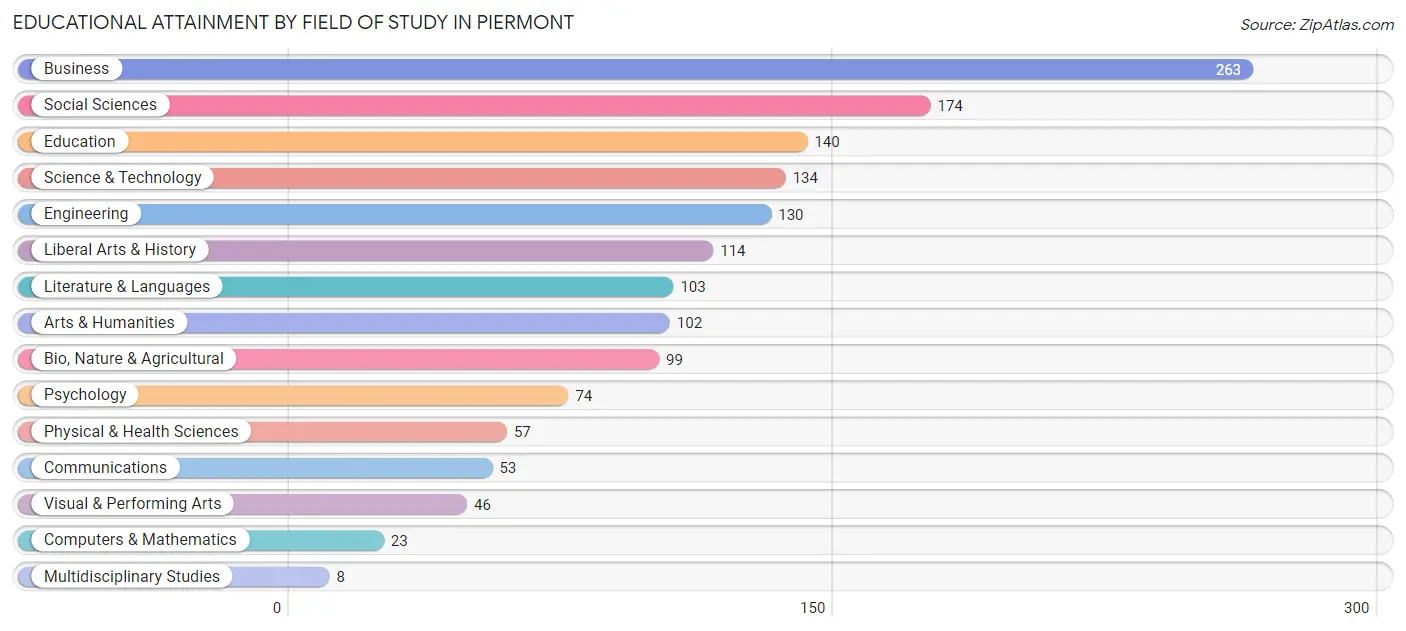
| Field of Study | # Graduates | % Graduates |
| Computers & Mathematics | 23 | 1.5% |
| Bio, Nature & Agricultural | 99 | 6.5% |
| Physical & Health Sciences | 57 | 3.7% |
| Psychology | 74 | 4.9% |
| Social Sciences | 174 | 11.5% |
| Engineering | 130 | 8.6% |
| Multidisciplinary Studies | 8 | 0.5% |
| Science & Technology | 134 | 8.8% |
| Business | 263 | 17.3% |
| Education | 140 | 9.2% |
| Literature & Languages | 103 | 6.8% |
| Liberal Arts & History | 114 | 7.5% |
| Visual & Performing Arts | 46 | 3.0% |
| Communications | 53 | 3.5% |
| Arts & Humanities | 102 | 6.7% |
| Total | 1,520 | 100.0% |
Transportation & Commute in Piermont
Vehicle Availability by Sex in Piermont
The most prevalent vehicle ownership categories in Piermont are males with 2 vehicles (455, accounting for 48.3%) and females with 2 vehicles (351, making up 71.7%).
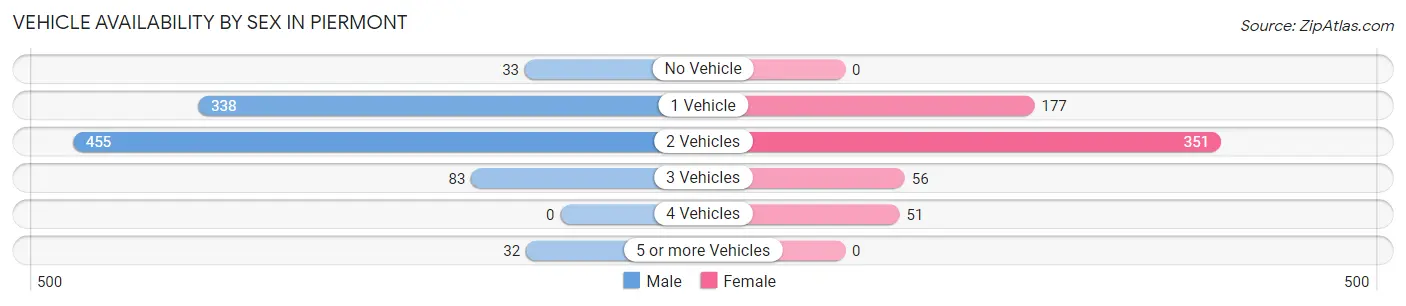
| Vehicles Available | Male | Female |
| No Vehicle | 33 (3.5%) | 0 (0.0%) |
| 1 Vehicle | 338 (35.9%) | 177 (27.9%) |
| 2 Vehicles | 455 (48.3%) | 351 (55.3%) |
| 3 Vehicles | 83 (8.8%) | 56 (8.8%) |
| 4 Vehicles | 0 (0.0%) | 51 (8.0%) |
| 5 or more Vehicles | 32 (3.4%) | 0 (0.0%) |
| Total | 941 (100.0%) | 635 (100.0%) |
Commute Time in Piermont
The most frequently occuring commute durations in Piermont are 60 to 89 minutes (176 commuters, 13.2%), 90 or more minutes (163 commuters, 12.2%), and 10 to 14 minutes (152 commuters, 11.4%).
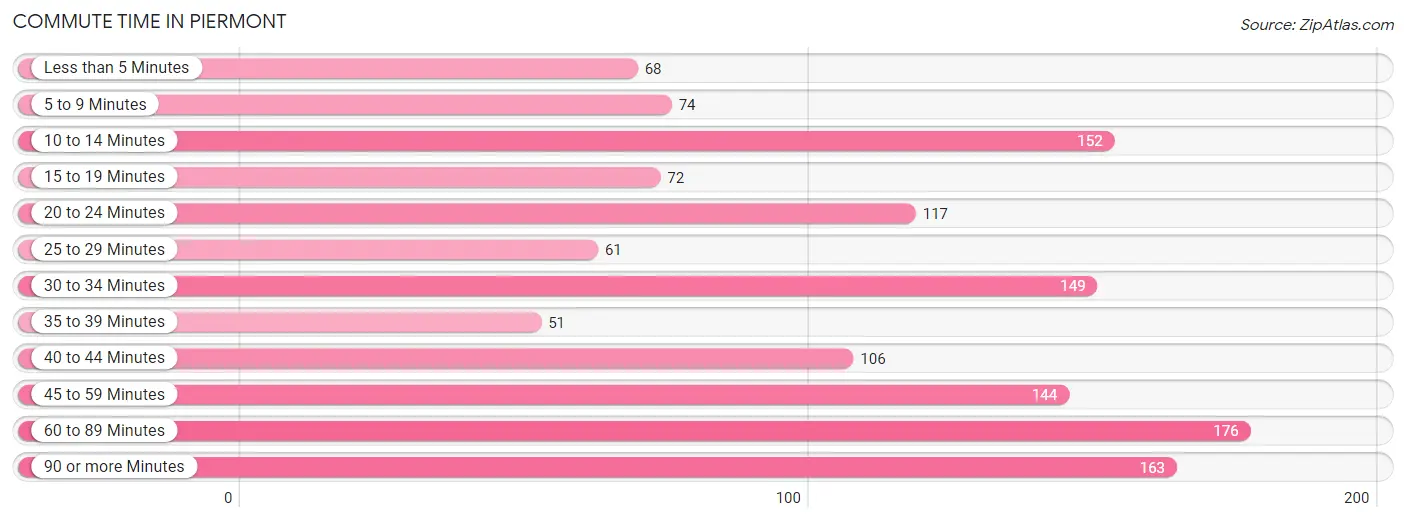
| Commute Time | # Commuters | % Commuters |
| Less than 5 Minutes | 68 | 5.1% |
| 5 to 9 Minutes | 74 | 5.6% |
| 10 to 14 Minutes | 152 | 11.4% |
| 15 to 19 Minutes | 72 | 5.4% |
| 20 to 24 Minutes | 117 | 8.8% |
| 25 to 29 Minutes | 61 | 4.6% |
| 30 to 34 Minutes | 149 | 11.2% |
| 35 to 39 Minutes | 51 | 3.8% |
| 40 to 44 Minutes | 106 | 8.0% |
| 45 to 59 Minutes | 144 | 10.8% |
| 60 to 89 Minutes | 176 | 13.2% |
| 90 or more Minutes | 163 | 12.2% |
Commute Time by Sex in Piermont
The most common commute times in Piermont are 10 to 14 minutes (130 commuters, 16.0%) for males and 60 to 89 minutes (96 commuters, 18.4%) for females.
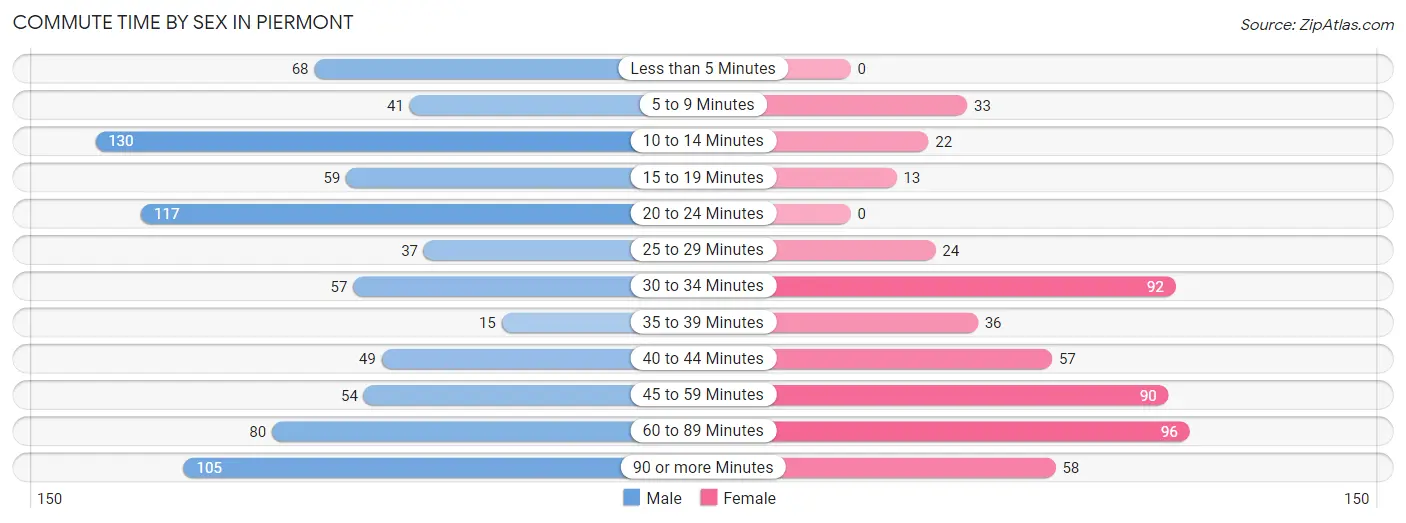
| Commute Time | Male | Female |
| Less than 5 Minutes | 68 (8.4%) | 0 (0.0%) |
| 5 to 9 Minutes | 41 (5.1%) | 33 (6.3%) |
| 10 to 14 Minutes | 130 (16.0%) | 22 (4.2%) |
| 15 to 19 Minutes | 59 (7.3%) | 13 (2.5%) |
| 20 to 24 Minutes | 117 (14.4%) | 0 (0.0%) |
| 25 to 29 Minutes | 37 (4.6%) | 24 (4.6%) |
| 30 to 34 Minutes | 57 (7.0%) | 92 (17.7%) |
| 35 to 39 Minutes | 15 (1.8%) | 36 (6.9%) |
| 40 to 44 Minutes | 49 (6.0%) | 57 (10.9%) |
| 45 to 59 Minutes | 54 (6.7%) | 90 (17.3%) |
| 60 to 89 Minutes | 80 (9.9%) | 96 (18.4%) |
| 90 or more Minutes | 105 (12.9%) | 58 (11.1%) |
Time of Departure to Work by Sex in Piermont
The most frequent times of departure to work in Piermont are 7:30 AM to 7:59 AM (152, 18.7%) for males and 9:00 AM to 9:59 AM (110, 21.1%) for females.
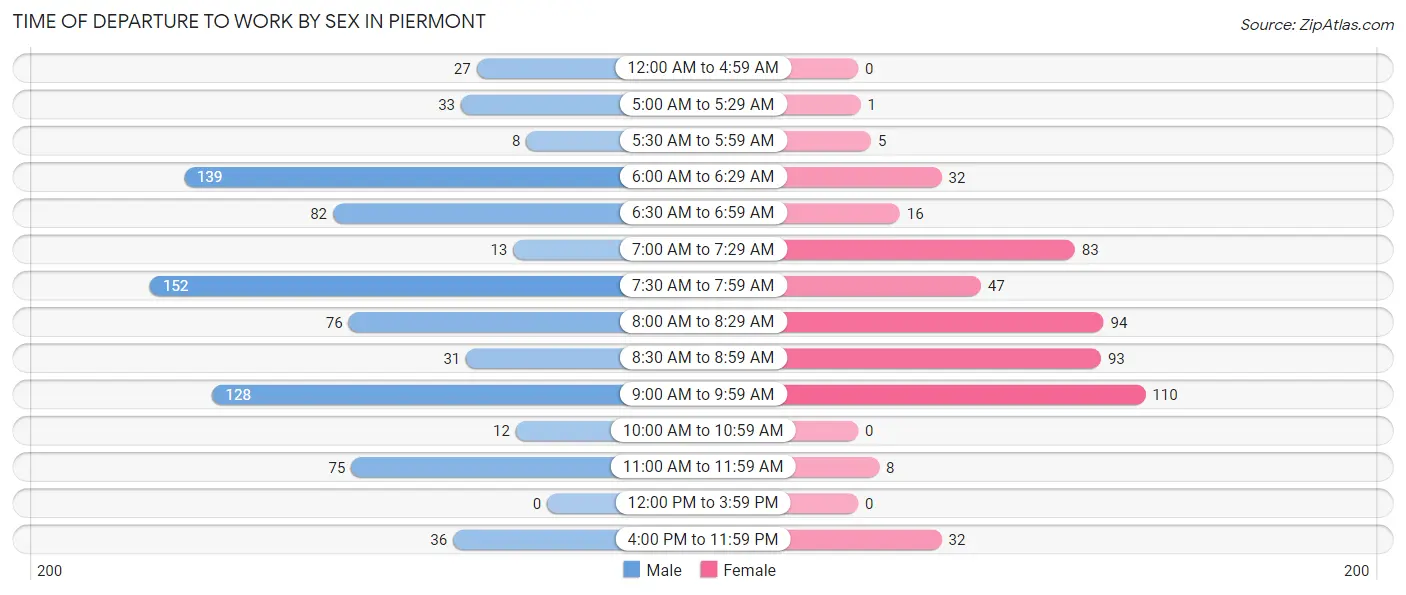
| Time of Departure | Male | Female |
| 12:00 AM to 4:59 AM | 27 (3.3%) | 0 (0.0%) |
| 5:00 AM to 5:29 AM | 33 (4.1%) | 1 (0.2%) |
| 5:30 AM to 5:59 AM | 8 (1.0%) | 5 (1.0%) |
| 6:00 AM to 6:29 AM | 139 (17.1%) | 32 (6.1%) |
| 6:30 AM to 6:59 AM | 82 (10.1%) | 16 (3.1%) |
| 7:00 AM to 7:29 AM | 13 (1.6%) | 83 (15.9%) |
| 7:30 AM to 7:59 AM | 152 (18.7%) | 47 (9.0%) |
| 8:00 AM to 8:29 AM | 76 (9.4%) | 94 (18.0%) |
| 8:30 AM to 8:59 AM | 31 (3.8%) | 93 (17.8%) |
| 9:00 AM to 9:59 AM | 128 (15.8%) | 110 (21.1%) |
| 10:00 AM to 10:59 AM | 12 (1.5%) | 0 (0.0%) |
| 11:00 AM to 11:59 AM | 75 (9.2%) | 8 (1.5%) |
| 12:00 PM to 3:59 PM | 0 (0.0%) | 0 (0.0%) |
| 4:00 PM to 11:59 PM | 36 (4.4%) | 32 (6.1%) |
| Total | 812 (100.0%) | 521 (100.0%) |
Housing Occupancy in Piermont
Occupancy by Ownership in Piermont
Of the total 1,232 dwellings in Piermont, owner-occupied units account for 731 (59.3%), while renter-occupied units make up 501 (40.7%).
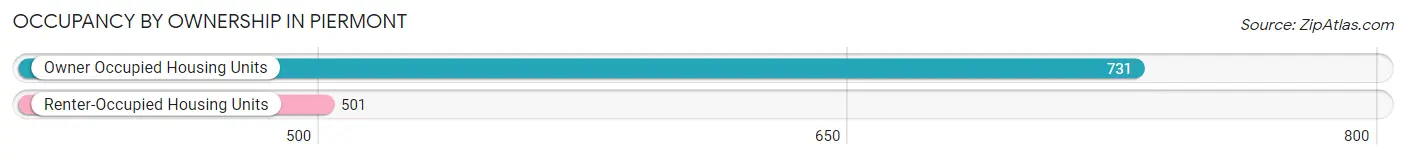
| Occupancy | # Housing Units | % Housing Units |
| Owner Occupied Housing Units | 731 | 59.3% |
| Renter-Occupied Housing Units | 501 | 40.7% |
| Total Occupied Housing Units | 1,232 | 100.0% |
Occupancy by Household Size in Piermont
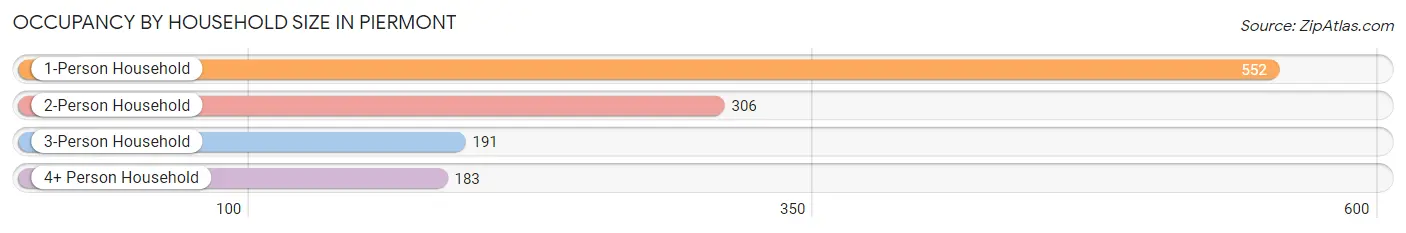
| Household Size | # Housing Units | % Housing Units |
| 1-Person Household | 552 | 44.8% |
| 2-Person Household | 306 | 24.8% |
| 3-Person Household | 191 | 15.5% |
| 4+ Person Household | 183 | 14.8% |
| Total Housing Units | 1,232 | 100.0% |
Occupancy by Ownership by Household Size in Piermont
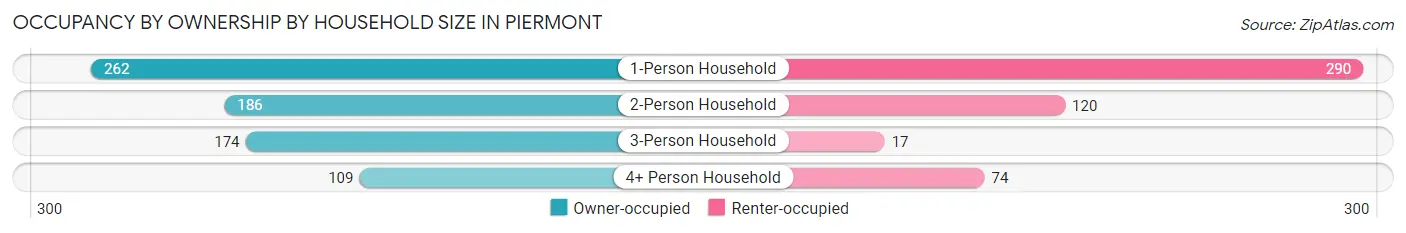
| Household Size | Owner-occupied | Renter-occupied |
| 1-Person Household | 262 (47.5%) | 290 (52.5%) |
| 2-Person Household | 186 (60.8%) | 120 (39.2%) |
| 3-Person Household | 174 (91.1%) | 17 (8.9%) |
| 4+ Person Household | 109 (59.6%) | 74 (40.4%) |
| Total Housing Units | 731 (59.3%) | 501 (40.7%) |
Occupancy by Educational Attainment in Piermont
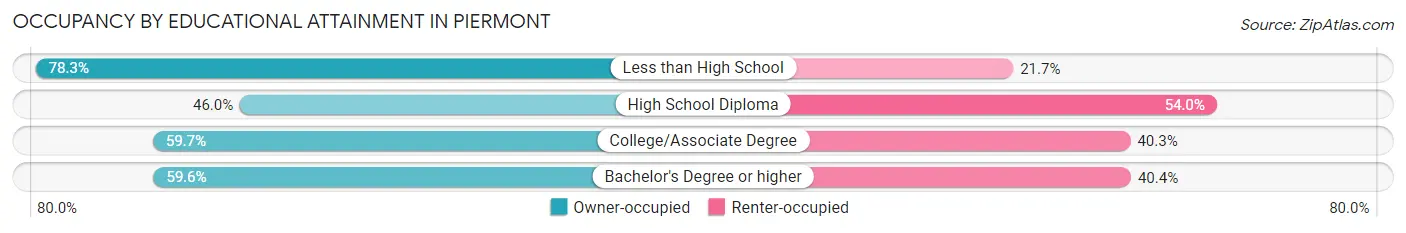
| Household Size | Owner-occupied | Renter-occupied |
| Less than High School | 36 (78.3%) | 10 (21.7%) |
| High School Diploma | 40 (46.0%) | 47 (54.0%) |
| College/Associate Degree | 173 (59.7%) | 117 (40.3%) |
| Bachelor's Degree or higher | 482 (59.6%) | 327 (40.4%) |
Occupancy by Age of Householder in Piermont
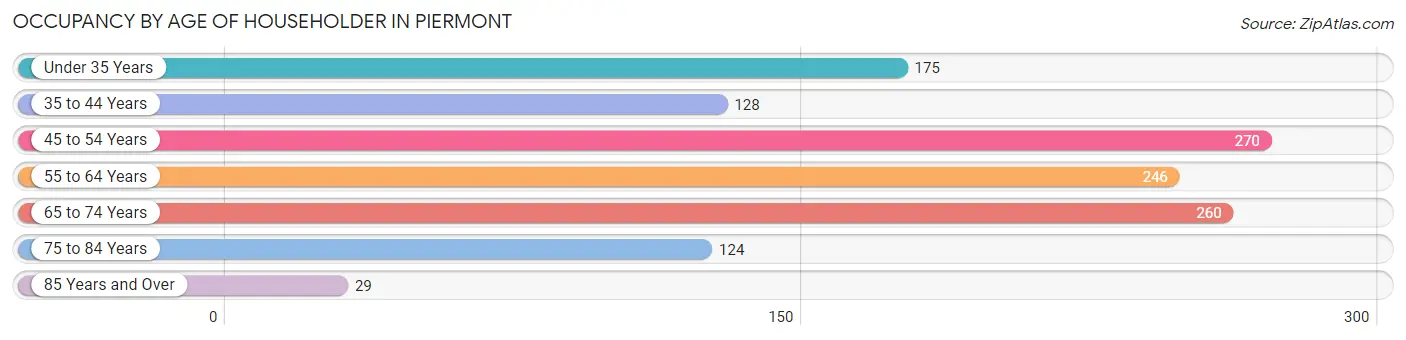
| Age Bracket | # Households | % Households |
| Under 35 Years | 175 | 14.2% |
| 35 to 44 Years | 128 | 10.4% |
| 45 to 54 Years | 270 | 21.9% |
| 55 to 64 Years | 246 | 20.0% |
| 65 to 74 Years | 260 | 21.1% |
| 75 to 84 Years | 124 | 10.1% |
| 85 Years and Over | 29 | 2.4% |
| Total | 1,232 | 100.0% |
Housing Finances in Piermont
Median Income by Occupancy in Piermont
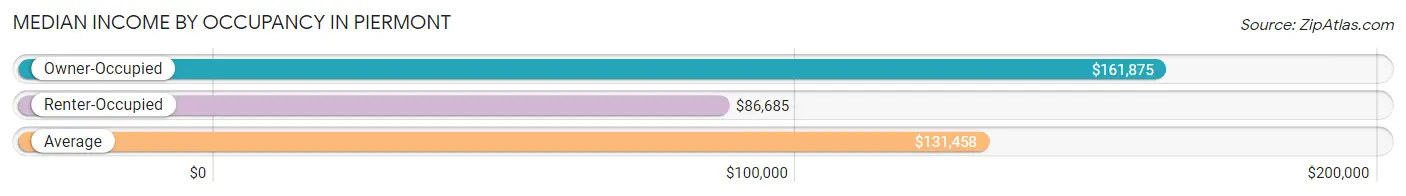
| Occupancy Type | # Households | Median Income |
| Owner-Occupied | 731 (59.3%) | $161,875 |
| Renter-Occupied | 501 (40.7%) | $86,685 |
| Average | 1,232 (100.0%) | $131,458 |
Occupancy by Householder Income Bracket in Piermont
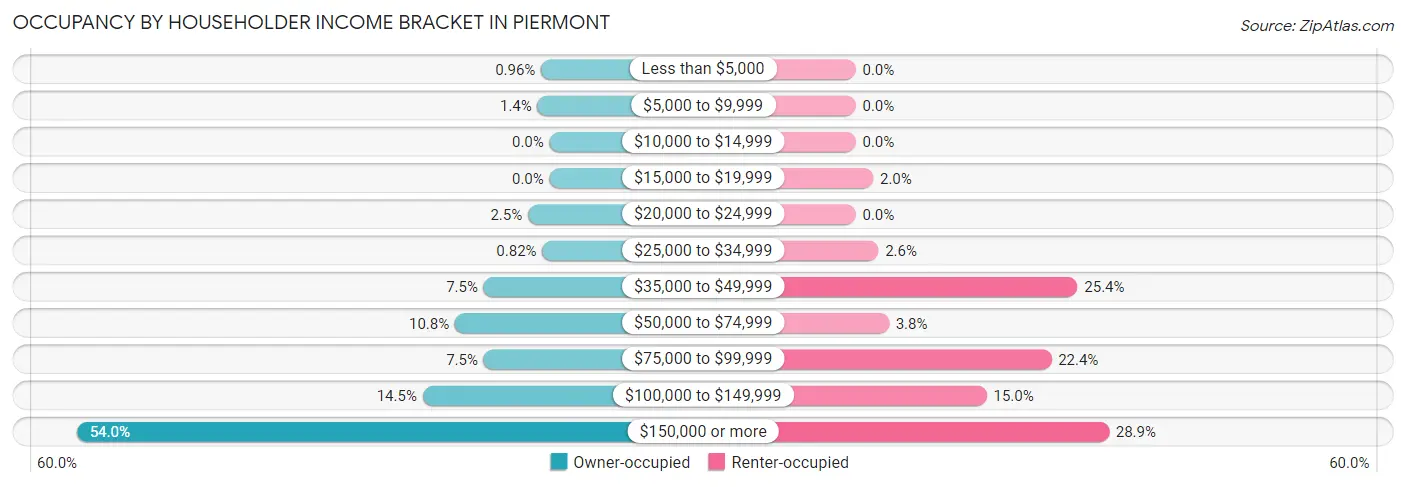
| Income Bracket | Owner-occupied | Renter-occupied |
| Less than $5,000 | 7 (1.0%) | 0 (0.0%) |
| $5,000 to $9,999 | 10 (1.4%) | 0 (0.0%) |
| $10,000 to $14,999 | 0 (0.0%) | 0 (0.0%) |
| $15,000 to $19,999 | 0 (0.0%) | 10 (2.0%) |
| $20,000 to $24,999 | 18 (2.5%) | 0 (0.0%) |
| $25,000 to $34,999 | 6 (0.8%) | 13 (2.6%) |
| $35,000 to $49,999 | 55 (7.5%) | 127 (25.4%) |
| $50,000 to $74,999 | 79 (10.8%) | 19 (3.8%) |
| $75,000 to $99,999 | 55 (7.5%) | 112 (22.4%) |
| $100,000 to $149,999 | 106 (14.5%) | 75 (15.0%) |
| $150,000 or more | 395 (54.0%) | 145 (28.9%) |
| Total | 731 (100.0%) | 501 (100.0%) |
Monthly Housing Cost Tiers in Piermont
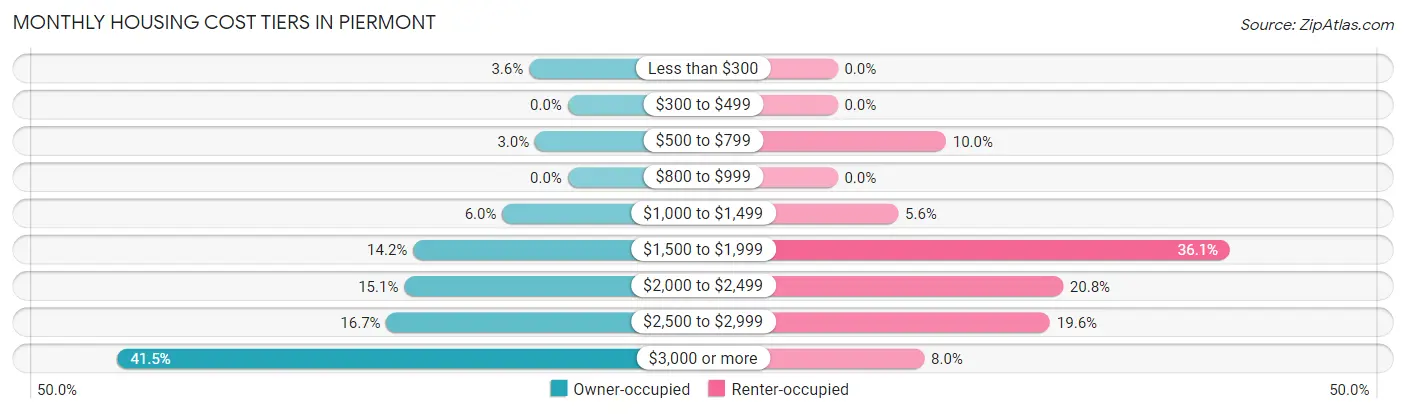
| Monthly Cost | Owner-occupied | Renter-occupied |
| Less than $300 | 26 (3.6%) | 0 (0.0%) |
| $300 to $499 | 0 (0.0%) | 0 (0.0%) |
| $500 to $799 | 22 (3.0%) | 50 (10.0%) |
| $800 to $999 | 0 (0.0%) | 0 (0.0%) |
| $1,000 to $1,499 | 44 (6.0%) | 28 (5.6%) |
| $1,500 to $1,999 | 104 (14.2%) | 181 (36.1%) |
| $2,000 to $2,499 | 110 (15.0%) | 104 (20.8%) |
| $2,500 to $2,999 | 122 (16.7%) | 98 (19.6%) |
| $3,000 or more | 303 (41.4%) | 40 (8.0%) |
| Total | 731 (100.0%) | 501 (100.0%) |
Physical Housing Characteristics in Piermont
Housing Structures in Piermont
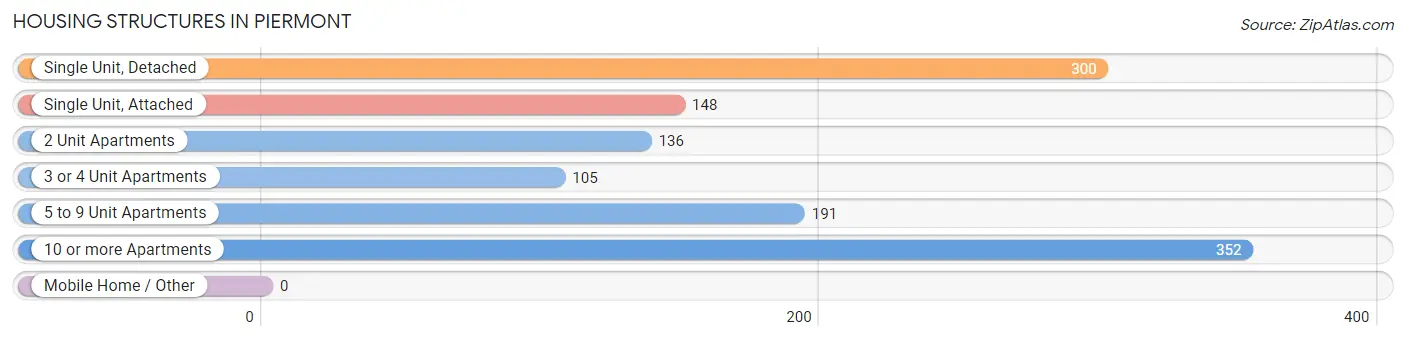
| Structure Type | # Housing Units | % Housing Units |
| Single Unit, Detached | 300 | 24.3% |
| Single Unit, Attached | 148 | 12.0% |
| 2 Unit Apartments | 136 | 11.0% |
| 3 or 4 Unit Apartments | 105 | 8.5% |
| 5 to 9 Unit Apartments | 191 | 15.5% |
| 10 or more Apartments | 352 | 28.6% |
| Mobile Home / Other | 0 | 0.0% |
| Total | 1,232 | 100.0% |
Housing Structures by Occupancy in Piermont
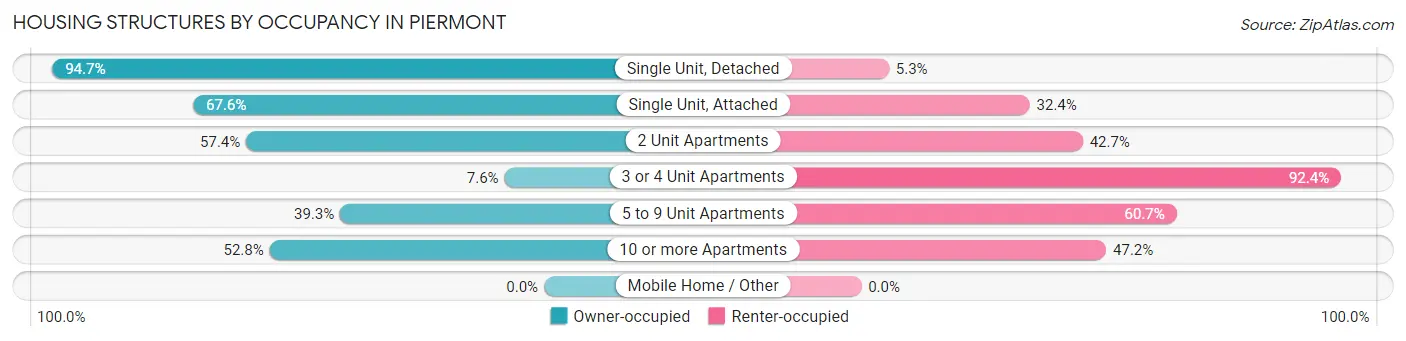
| Structure Type | Owner-occupied | Renter-occupied |
| Single Unit, Detached | 284 (94.7%) | 16 (5.3%) |
| Single Unit, Attached | 100 (67.6%) | 48 (32.4%) |
| 2 Unit Apartments | 78 (57.4%) | 58 (42.6%) |
| 3 or 4 Unit Apartments | 8 (7.6%) | 97 (92.4%) |
| 5 to 9 Unit Apartments | 75 (39.3%) | 116 (60.7%) |
| 10 or more Apartments | 186 (52.8%) | 166 (47.2%) |
| Mobile Home / Other | 0 (0.0%) | 0 (0.0%) |
| Total | 731 (59.3%) | 501 (40.7%) |
Housing Structures by Number of Rooms in Piermont
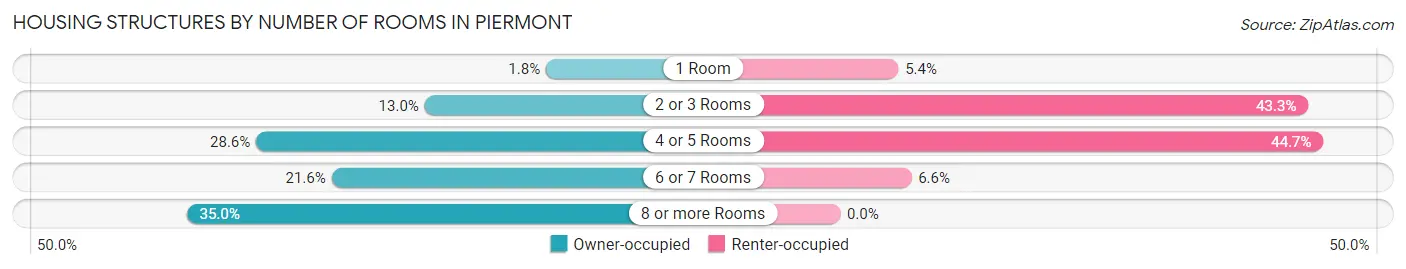
| Number of Rooms | Owner-occupied | Renter-occupied |
| 1 Room | 13 (1.8%) | 27 (5.4%) |
| 2 or 3 Rooms | 95 (13.0%) | 217 (43.3%) |
| 4 or 5 Rooms | 209 (28.6%) | 224 (44.7%) |
| 6 or 7 Rooms | 158 (21.6%) | 33 (6.6%) |
| 8 or more Rooms | 256 (35.0%) | 0 (0.0%) |
| Total | 731 (100.0%) | 501 (100.0%) |
Housing Structure by Heating Type in Piermont
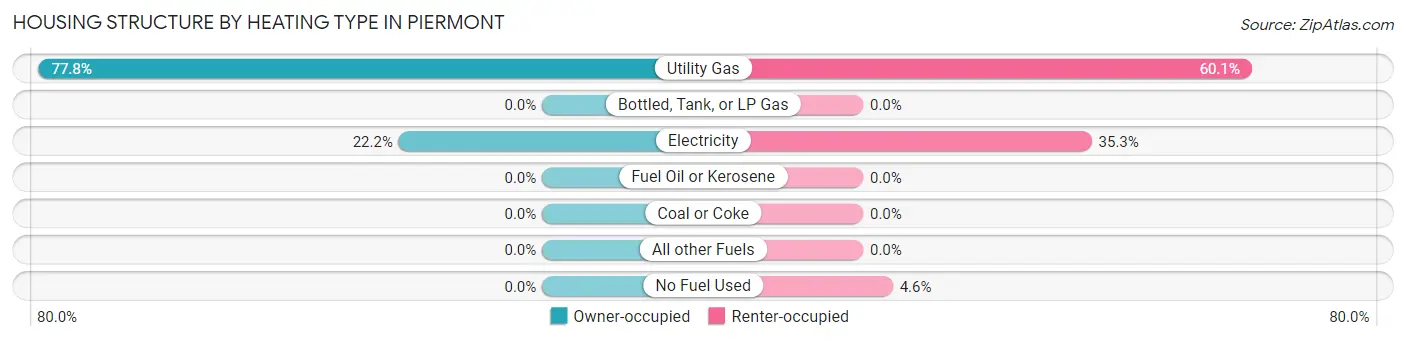
| Heating Type | Owner-occupied | Renter-occupied |
| Utility Gas | 569 (77.8%) | 301 (60.1%) |
| Bottled, Tank, or LP Gas | 0 (0.0%) | 0 (0.0%) |
| Electricity | 162 (22.2%) | 177 (35.3%) |
| Fuel Oil or Kerosene | 0 (0.0%) | 0 (0.0%) |
| Coal or Coke | 0 (0.0%) | 0 (0.0%) |
| All other Fuels | 0 (0.0%) | 0 (0.0%) |
| No Fuel Used | 0 (0.0%) | 23 (4.6%) |
| Total | 731 (100.0%) | 501 (100.0%) |
Household Vehicle Usage in Piermont
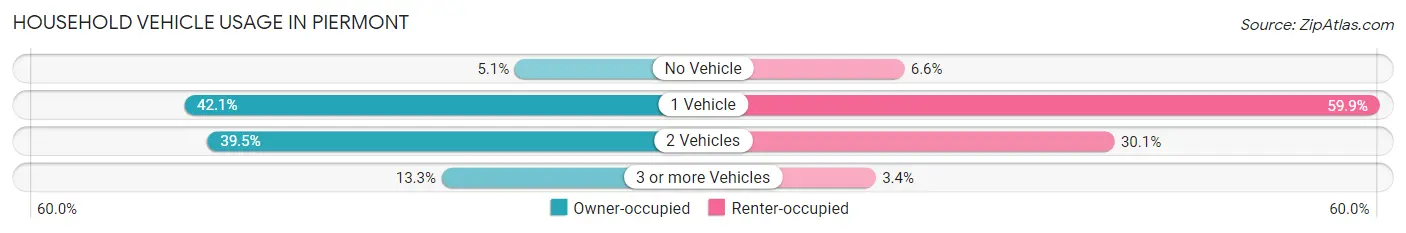
| Vehicles per Household | Owner-occupied | Renter-occupied |
| No Vehicle | 37 (5.1%) | 33 (6.6%) |
| 1 Vehicle | 308 (42.1%) | 300 (59.9%) |
| 2 Vehicles | 289 (39.5%) | 151 (30.1%) |
| 3 or more Vehicles | 97 (13.3%) | 17 (3.4%) |
| Total | 731 (100.0%) | 501 (100.0%) |
Real Estate & Mortgages in Piermont
Real Estate and Mortgage Overview in Piermont
| Characteristic | Without Mortgage | With Mortgage |
| Housing Units | 293 | 438 |
| Median Property Value | $698,100 | $693,700 |
| Median Household Income | $111,875 | $271 |
| Monthly Housing Costs | $1,501 | $262 |
| Real Estate Taxes | $10,001 | $0 |
Property Value by Mortgage Status in Piermont
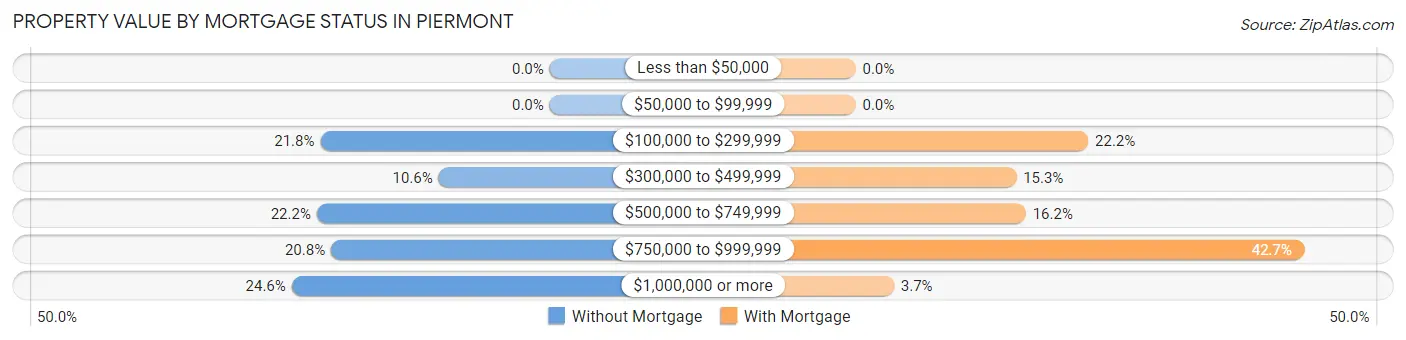
| Property Value | Without Mortgage | With Mortgage |
| Less than $50,000 | 0 (0.0%) | 0 (0.0%) |
| $50,000 to $99,999 | 0 (0.0%) | 0 (0.0%) |
| $100,000 to $299,999 | 64 (21.8%) | 97 (22.2%) |
| $300,000 to $499,999 | 31 (10.6%) | 67 (15.3%) |
| $500,000 to $749,999 | 65 (22.2%) | 71 (16.2%) |
| $750,000 to $999,999 | 61 (20.8%) | 187 (42.7%) |
| $1,000,000 or more | 72 (24.6%) | 16 (3.6%) |
| Total | 293 (100.0%) | 438 (100.0%) |
Household Income by Mortgage Status in Piermont
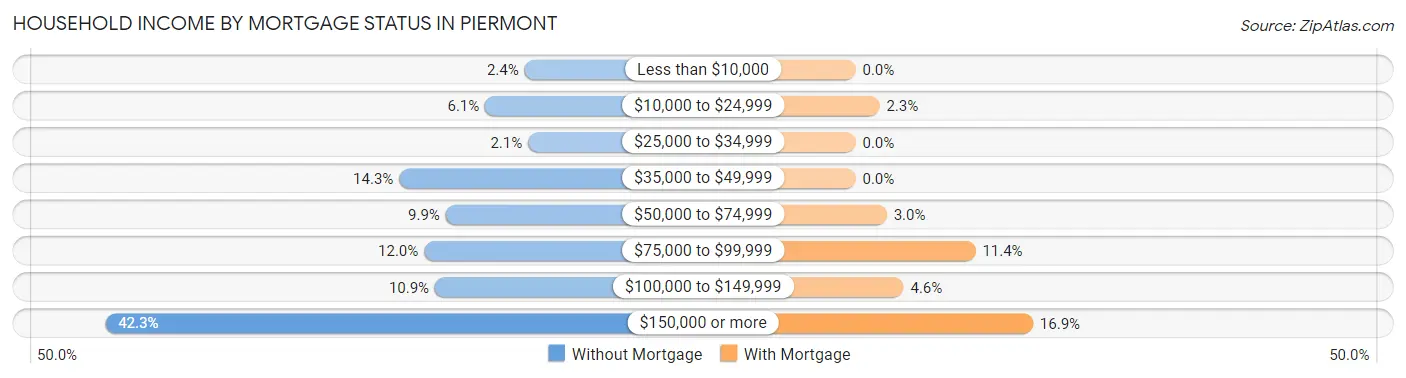
| Household Income | Without Mortgage | With Mortgage |
| Less than $10,000 | 7 (2.4%) | 0 (0.0%) |
| $10,000 to $24,999 | 18 (6.1%) | 10 (2.3%) |
| $25,000 to $34,999 | 6 (2.1%) | 0 (0.0%) |
| $35,000 to $49,999 | 42 (14.3%) | 0 (0.0%) |
| $50,000 to $74,999 | 29 (9.9%) | 13 (3.0%) |
| $75,000 to $99,999 | 35 (11.9%) | 50 (11.4%) |
| $100,000 to $149,999 | 32 (10.9%) | 20 (4.6%) |
| $150,000 or more | 124 (42.3%) | 74 (16.9%) |
| Total | 293 (100.0%) | 438 (100.0%) |
Property Value to Household Income Ratio in Piermont
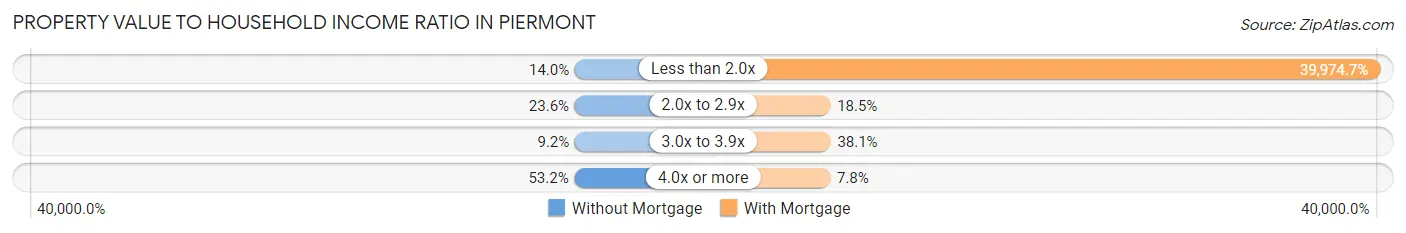
| Value-to-Income Ratio | Without Mortgage | With Mortgage |
| Less than 2.0x | 41 (14.0%) | 175,089 (39,974.7%) |
| 2.0x to 2.9x | 69 (23.5%) | 81 (18.5%) |
| 3.0x to 3.9x | 27 (9.2%) | 167 (38.1%) |
| 4.0x or more | 156 (53.2%) | 34 (7.8%) |
| Total | 293 (100.0%) | 438 (100.0%) |
Real Estate Taxes by Mortgage Status in Piermont
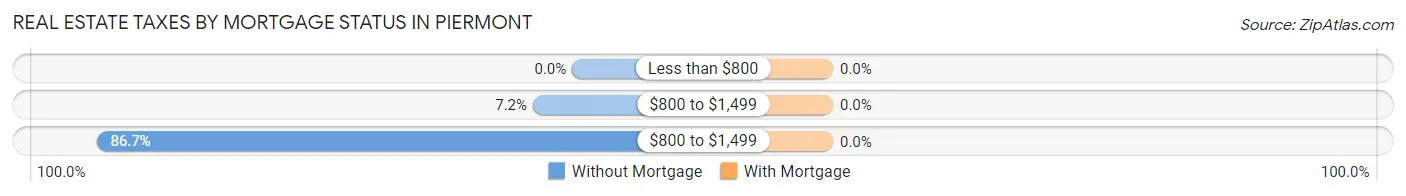
| Property Taxes | Without Mortgage | With Mortgage |
| Less than $800 | 0 (0.0%) | 0 (0.0%) |
| $800 to $1,499 | 21 (7.2%) | 0 (0.0%) |
| $800 to $1,499 | 254 (86.7%) | 0 (0.0%) |
| Total | 293 (100.0%) | 438 (100.0%) |
Health & Disability in Piermont
Health Insurance Coverage by Age in Piermont
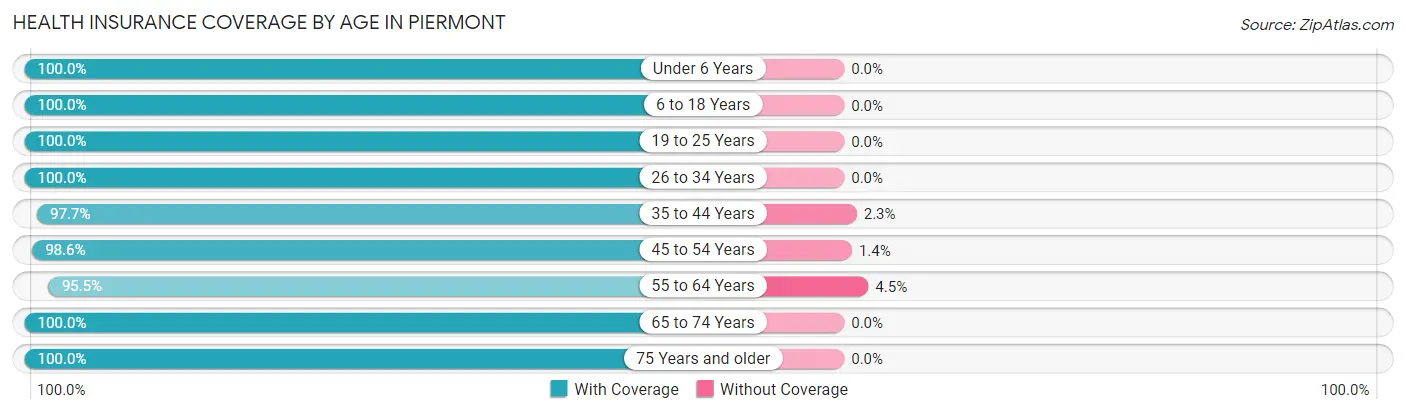
| Age Bracket | With Coverage | Without Coverage |
| Under 6 Years | 181 (100.0%) | 0 (0.0%) |
| 6 to 18 Years | 152 (100.0%) | 0 (0.0%) |
| 19 to 25 Years | 146 (100.0%) | 0 (0.0%) |
| 26 to 34 Years | 271 (100.0%) | 0 (0.0%) |
| 35 to 44 Years | 293 (97.7%) | 7 (2.3%) |
| 45 to 54 Years | 415 (98.6%) | 6 (1.4%) |
| 55 to 64 Years | 403 (95.5%) | 19 (4.5%) |
| 65 to 74 Years | 392 (100.0%) | 0 (0.0%) |
| 75 Years and older | 222 (100.0%) | 0 (0.0%) |
| Total | 2,475 (98.7%) | 32 (1.3%) |
Health Insurance Coverage by Citizenship Status in Piermont
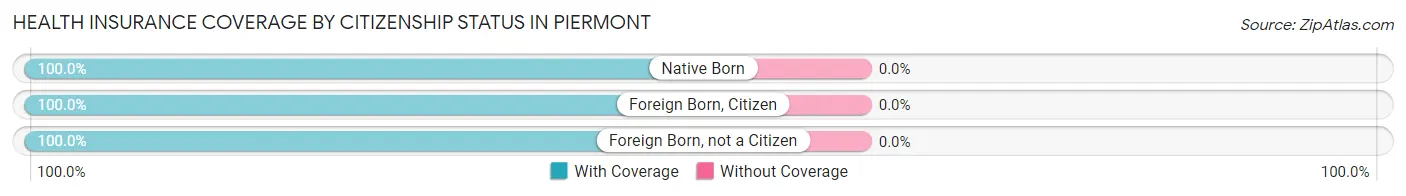
| Citizenship Status | With Coverage | Without Coverage |
| Native Born | 181 (100.0%) | 0 (0.0%) |
| Foreign Born, Citizen | 152 (100.0%) | 0 (0.0%) |
| Foreign Born, not a Citizen | 146 (100.0%) | 0 (0.0%) |
Health Insurance Coverage by Household Income in Piermont
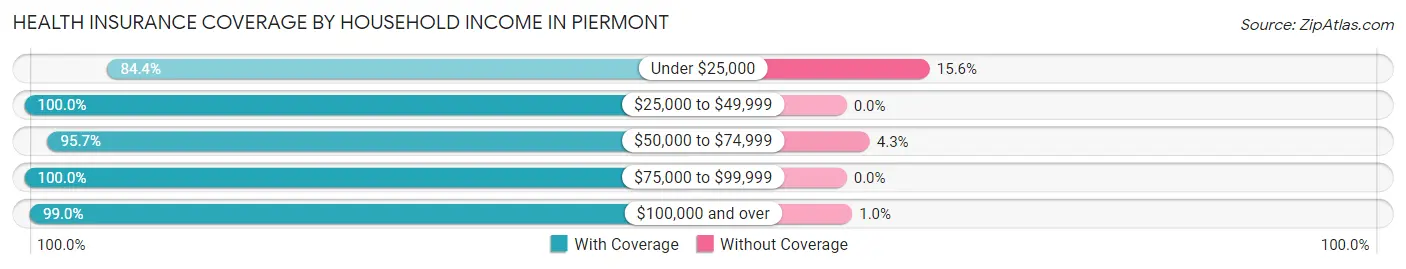
| Household Income | With Coverage | Without Coverage |
| Under $25,000 | 38 (84.4%) | 7 (15.6%) |
| $25,000 to $49,999 | 243 (100.0%) | 0 (0.0%) |
| $50,000 to $74,999 | 133 (95.7%) | 6 (4.3%) |
| $75,000 to $99,999 | 241 (100.0%) | 0 (0.0%) |
| $100,000 and over | 1,817 (99.0%) | 19 (1.0%) |
Public vs Private Health Insurance Coverage by Age in Piermont
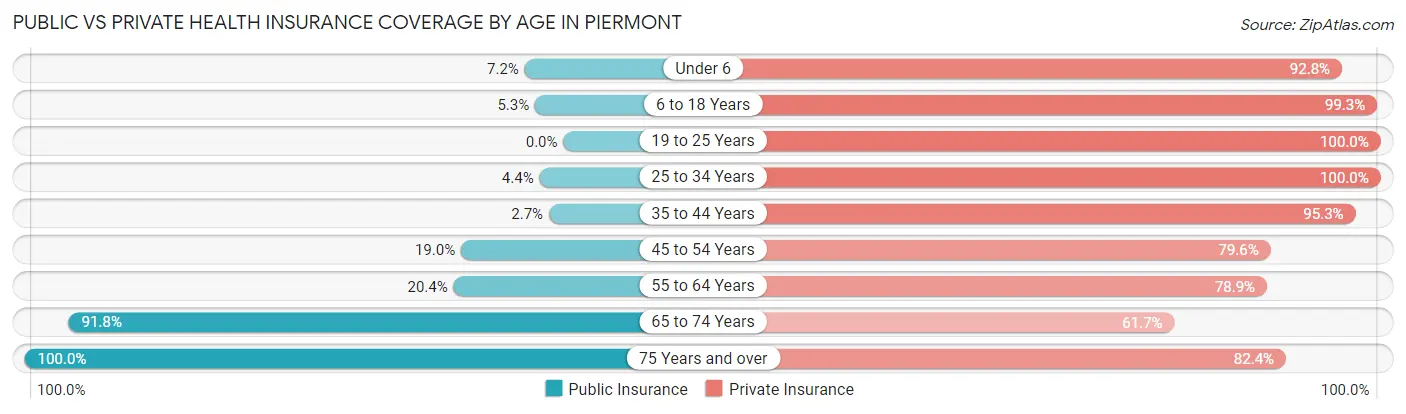
| Age Bracket | Public Insurance | Private Insurance |
| Under 6 | 13 (7.2%) | 168 (92.8%) |
| 6 to 18 Years | 8 (5.3%) | 151 (99.3%) |
| 19 to 25 Years | 0 (0.0%) | 146 (100.0%) |
| 25 to 34 Years | 12 (4.4%) | 271 (100.0%) |
| 35 to 44 Years | 8 (2.7%) | 286 (95.3%) |
| 45 to 54 Years | 80 (19.0%) | 335 (79.6%) |
| 55 to 64 Years | 86 (20.4%) | 333 (78.9%) |
| 65 to 74 Years | 360 (91.8%) | 242 (61.7%) |
| 75 Years and over | 222 (100.0%) | 183 (82.4%) |
| Total | 789 (31.5%) | 2,115 (84.4%) |
Disability Status by Sex by Age in Piermont
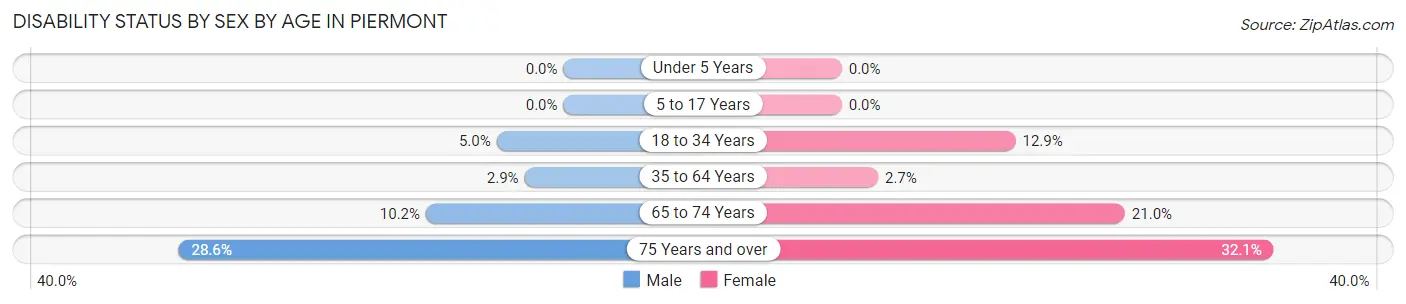
| Age Bracket | Male | Female |
| Under 5 Years | 0 (0.0%) | 0 (0.0%) |
| 5 to 17 Years | 0 (0.0%) | 0 (0.0%) |
| 18 to 34 Years | 13 (5.0%) | 20 (12.9%) |
| 35 to 64 Years | 18 (2.9%) | 14 (2.7%) |
| 65 to 74 Years | 24 (10.2%) | 33 (21.0%) |
| 75 Years and over | 26 (28.6%) | 42 (32.1%) |
Disability Class by Sex by Age in Piermont
Disability Class: Hearing Difficulty
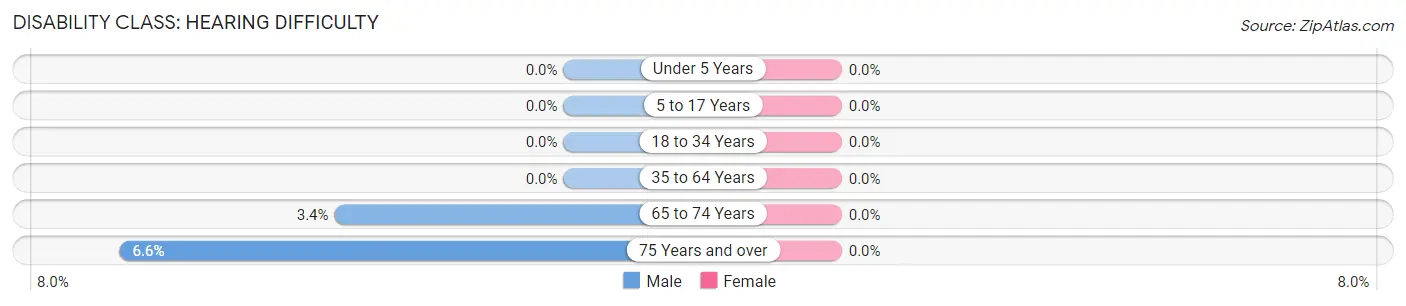
| Age Bracket | Male | Female |
| Under 5 Years | 0 (0.0%) | 0 (0.0%) |
| 5 to 17 Years | 0 (0.0%) | 0 (0.0%) |
| 18 to 34 Years | 0 (0.0%) | 0 (0.0%) |
| 35 to 64 Years | 0 (0.0%) | 0 (0.0%) |
| 65 to 74 Years | 8 (3.4%) | 0 (0.0%) |
| 75 Years and over | 6 (6.6%) | 0 (0.0%) |
Disability Class: Vision Difficulty
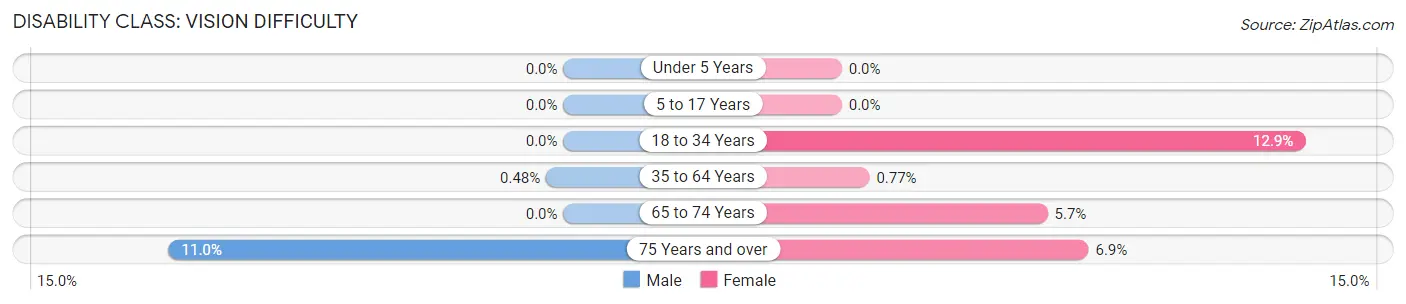
| Age Bracket | Male | Female |
| Under 5 Years | 0 (0.0%) | 0 (0.0%) |
| 5 to 17 Years | 0 (0.0%) | 0 (0.0%) |
| 18 to 34 Years | 0 (0.0%) | 20 (12.9%) |
| 35 to 64 Years | 3 (0.5%) | 4 (0.8%) |
| 65 to 74 Years | 0 (0.0%) | 9 (5.7%) |
| 75 Years and over | 10 (11.0%) | 9 (6.9%) |
Disability Class: Cognitive Difficulty
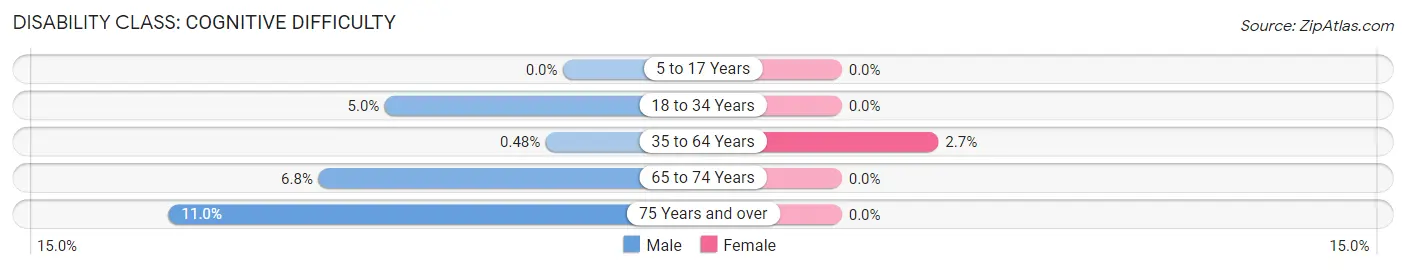
| Age Bracket | Male | Female |
| 5 to 17 Years | 0 (0.0%) | 0 (0.0%) |
| 18 to 34 Years | 13 (5.0%) | 0 (0.0%) |
| 35 to 64 Years | 3 (0.5%) | 14 (2.7%) |
| 65 to 74 Years | 16 (6.8%) | 0 (0.0%) |
| 75 Years and over | 10 (11.0%) | 0 (0.0%) |
Disability Class: Ambulatory Difficulty
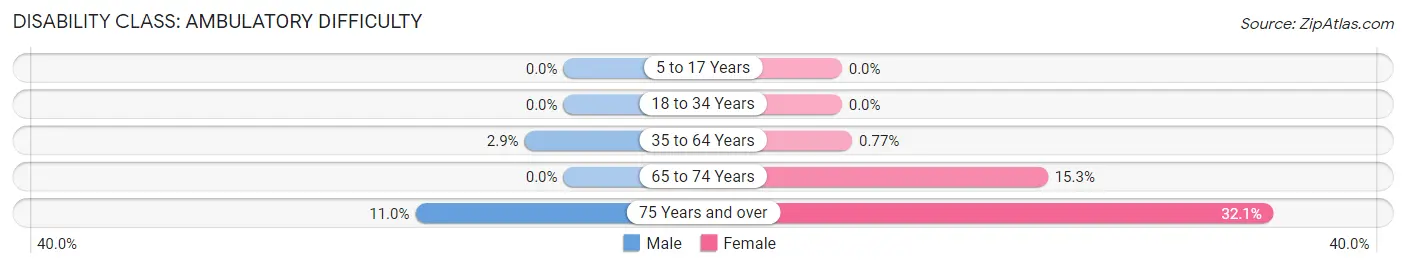
| Age Bracket | Male | Female |
| 5 to 17 Years | 0 (0.0%) | 0 (0.0%) |
| 18 to 34 Years | 0 (0.0%) | 0 (0.0%) |
| 35 to 64 Years | 18 (2.9%) | 4 (0.8%) |
| 65 to 74 Years | 0 (0.0%) | 24 (15.3%) |
| 75 Years and over | 10 (11.0%) | 42 (32.1%) |
Disability Class: Self-Care Difficulty
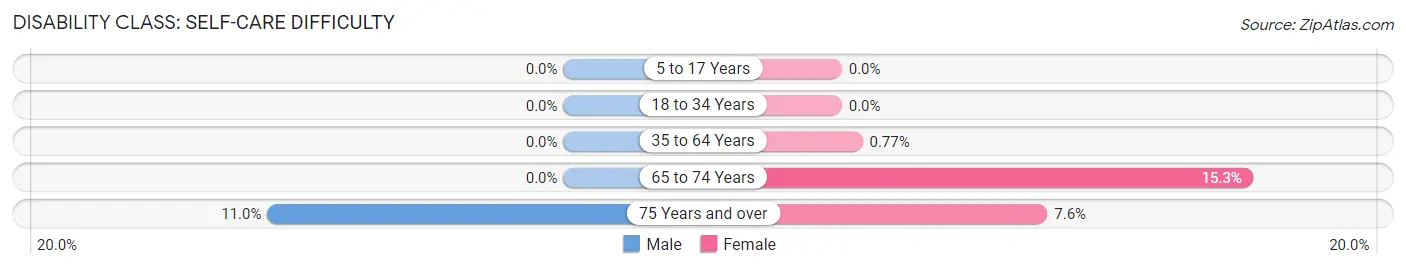
| Age Bracket | Male | Female |
| 5 to 17 Years | 0 (0.0%) | 0 (0.0%) |
| 18 to 34 Years | 0 (0.0%) | 0 (0.0%) |
| 35 to 64 Years | 0 (0.0%) | 4 (0.8%) |
| 65 to 74 Years | 0 (0.0%) | 24 (15.3%) |
| 75 Years and over | 10 (11.0%) | 10 (7.6%) |
Technology Access in Piermont
Computing Device Access in Piermont
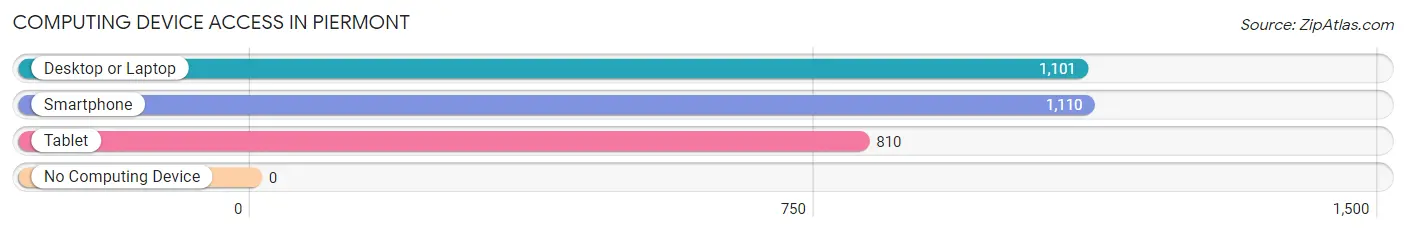
| Device Type | # Households | % Households |
| Desktop or Laptop | 1,101 | 89.4% |
| Smartphone | 1,110 | 90.1% |
| Tablet | 810 | 65.7% |
| No Computing Device | 0 | 0.0% |
| Total | 1,232 | 100.0% |
Internet Access in Piermont
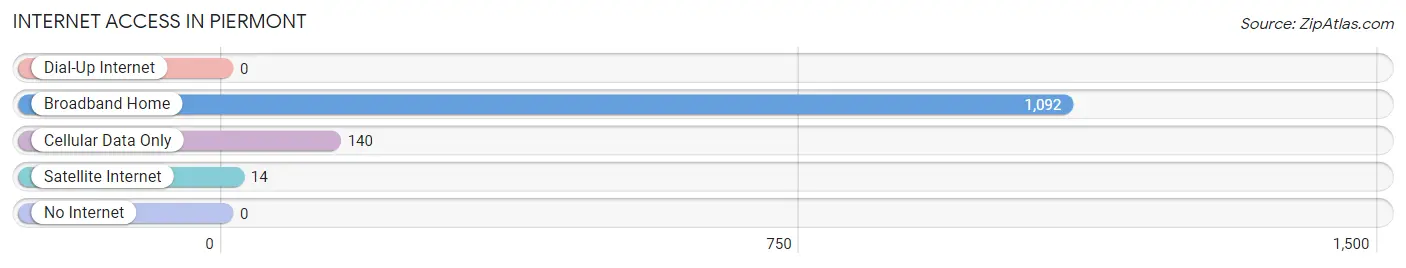
| Internet Type | # Households | % Households |
| Dial-Up Internet | 0 | 0.0% |
| Broadband Home | 1,092 | 88.6% |
| Cellular Data Only | 140 | 11.4% |
| Satellite Internet | 14 | 1.1% |
| No Internet | 0 | 0.0% |
| Total | 1,232 | 100.0% |
Piermont Summary
Piermont is a village located in Rockland County, New York, United States. It is situated on the west bank of the Hudson River, about 20 miles north of Manhattan. The village is part of the town of Orangetown and is bordered by the hamlet of Palisades to the north and the village of Grand View-on-Hudson to the south. As of the 2010 census, the village had a population of 2,510.
History
The area that is now Piermont was originally inhabited by the Munsee people, a branch of the Lenape Native Americans. The first European settlers arrived in the area in the late 17th century, and the village was officially incorporated in 1847. The village was named after the pier that was built in the area in 1839. The pier was used to transport goods from the Hudson River to the Erie Canal.
In the late 19th century, Piermont became a popular summer resort for wealthy New Yorkers. The village was home to several grand hotels, including the Piermont House, the Piermont Hotel, and the Piermont Inn. The village also had a thriving commercial center, with several stores, restaurants, and a movie theater.
In the early 20th century, Piermont began to decline as a resort destination. The hotels closed and the commercial center began to decline. However, the village remained a popular destination for day-trippers, who would come to enjoy the views of the Hudson River and the nearby Palisades.
Geography
Piermont is located at 41°2′17″N 73°55′17″W (41.038, -73.921). According to the United States Census Bureau, the village has a total area of 0.9 square miles (2.3 km2), all of it land.
The village is situated on the west bank of the Hudson River, about 20 miles north of Manhattan. It is bordered by the hamlet of Palisades to the north and the village of Grand View-on-Hudson to the south.
Economy
Piermont is a small, residential community with a limited commercial sector. The village is home to several small businesses, including restaurants, shops, and galleries. The village also has a marina, which provides access to the Hudson River.
The village is also home to several corporate offices, including those of the pharmaceutical company Pfizer and the financial services company UBS.
Demographics
As of the 2010 census, there were 2,510 people, 1,072 households, and 645 families residing in the village. The population density was 2,817.3 people per square mile (1,092.2/km2). There were 1,150 housing units at an average density of 1,279.3 per square mile (494.2/km2). The racial makeup of the village was 87.2% White, 4.2% African American, 0.2% Native American, 4.7% Asian, 0.1% Pacific Islander, 1.3% from other races, and 2.3% from two or more races. Hispanic or Latino of any race were 6.2% of the population.
There were 1,072 households, out of which 28.2% had children under the age of 18 living with them, 46.2% were married couples living together, 10.2% had a female householder with no husband present, and 39.2% were non-families. 33.2% of all households were made up of individuals, and 11.2% had someone living alone who was 65 years of age or older. The average household size was 2.34 and the average family size was 3.02.
In the village, the population was spread out, with 22.7% under the age of 18, 6.2% from 18 to 24, 28.2% from 25 to 44, 28.2% from 45 to 64, and 14.7% who were 65 years of age or older. The median age was 40 years. For every 100 females, there were 94.2 males. For every 100 females age 18 and over, there were 91.2 males.
The median income for a household in the village was $76,944, and the median income for a family was $90,938. Males had a median income of $60,000 versus $45,000 for females. The per capita income for the village was $41,945. About 4.2% of families and 5.7% of the population were below the poverty line, including 6.2% of those under age 18 and 4.2% of those age 65 or over.
Common Questions
What is Per Capita Income in Piermont?
Per Capita income in Piermont is $79,967.
What is the Median Family Income in Piermont?
Median Family Income in Piermont is $173,600.
What is the Median Household income in Piermont?
Median Household Income in Piermont is $131,458.
What is Income or Wage Gap in Piermont?
Income or Wage Gap in Piermont is 4.0%.
Women in Piermont earn 96.0 cents for every dollar earned by a man.
What is Inequality or Gini Index in Piermont?
Inequality or Gini Index in Piermont is 0.41.
What is the Total Population of Piermont?
Total Population of Piermont is 2,507.
What is the Total Male Population of Piermont?
Total Male Population of Piermont is 1,337.
What is the Total Female Population of Piermont?
Total Female Population of Piermont is 1,170.
What is the Ratio of Males per 100 Females in Piermont?
There are 114.27 Males per 100 Females in Piermont.
What is the Ratio of Females per 100 Males in Piermont?
There are 87.51 Females per 100 Males in Piermont.
What is the Median Population Age in Piermont?
Median Population Age in Piermont is 50.5 Years.
What is the Average Family Size in Piermont
Average Family Size in Piermont is 3.0 People.
What is the Average Household Size in Piermont
Average Household Size in Piermont is 2.0 People.
How Large is the Labor Force in Piermont?
There are 1,637 People in the Labor Forcein in Piermont.
What is the Percentage of People in the Labor Force in Piermont?
73.2% of People are in the Labor Force in Piermont.
What is the Unemployment Rate in Piermont?
Unemployment Rate in Piermont is 3.5%.