Shell Ridge, CA Map & Demographics
Shell Ridge Map
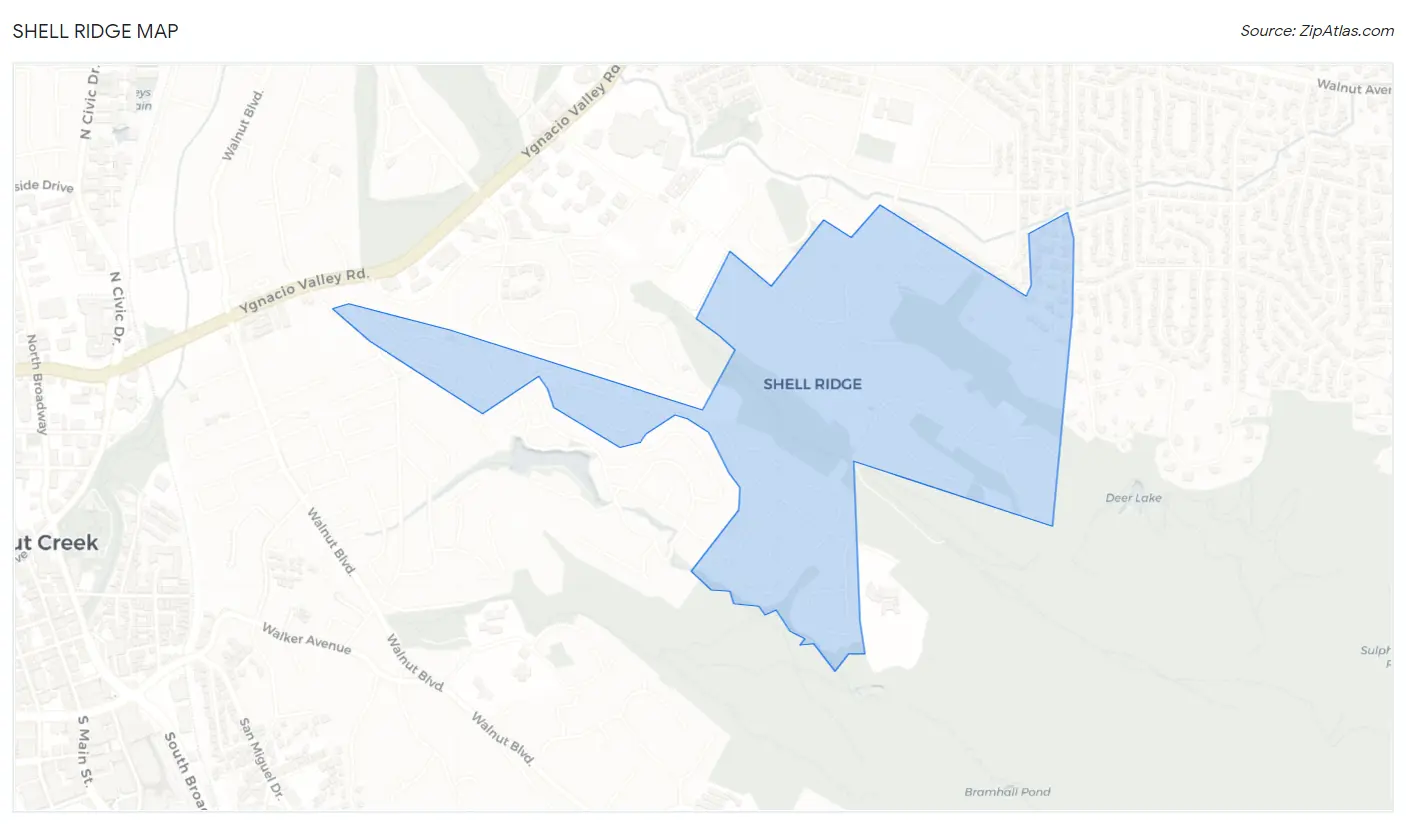
Shell Ridge Overview
$159,039
PER CAPITA INCOME
$234,057
AVG FAMILY INCOME
$234,160
AVG HOUSEHOLD INCOME
58.2%
WAGE / INCOME GAP [ % ]
41.8¢/ $1
WAGE / INCOME GAP [ $ ]
0.46
INEQUALITY / GINI INDEX
1,041
TOTAL POPULATION
424
MALE POPULATION
617
FEMALE POPULATION
68.72
MALES / 100 FEMALES
145.52
FEMALES / 100 MALES
44.1
MEDIAN AGE
3.0
AVG FAMILY SIZE
3.0
AVG HOUSEHOLD SIZE
601
LABOR FORCE [ PEOPLE ]
71.8%
PERCENT IN LABOR FORCE
1.8%
UNEMPLOYMENT RATE
Income in Shell Ridge
Income Overview in Shell Ridge
Per Capita Income in Shell Ridge is $159,039, while median incomes of families and households are $234,057 and $234,160 respectively.
| Characteristic | Number | Measure |
| Per Capita Income | 1,041 | $159,039 |
| Median Family Income | 326 | $234,057 |
| Mean Family Income | 326 | $456,989 |
| Median Household Income | 345 | $234,160 |
| Mean Household Income | 345 | $455,931 |
| Income Deficit | 326 | $0 |
| Wage / Income Gap (%) | 1,041 | 58.24% |
| Wage / Income Gap ($) | 1,041 | 41.76¢ per $1 |
| Gini / Inequality Index | 1,041 | 0.46 |
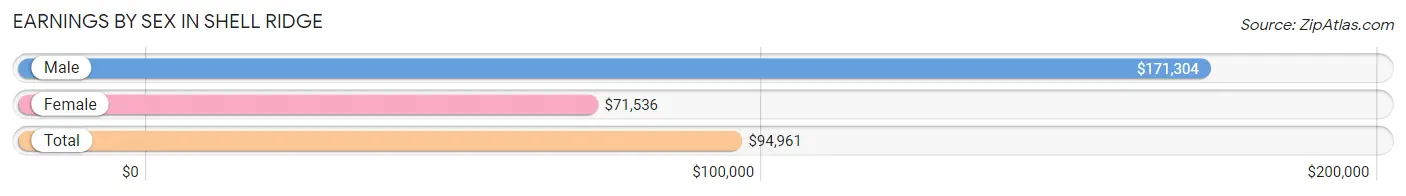
Earnings by Sex in Shell Ridge
Average Earnings in Shell Ridge are $94,961, $171,304 for men and $71,536 for women, a difference of 58.2%.
| Sex | Number | Average Earnings |
| Male | 286 (44.8%) | $171,304 |
| Female | 353 (55.2%) | $71,536 |
| Total | 639 (100.0%) | $94,961 |
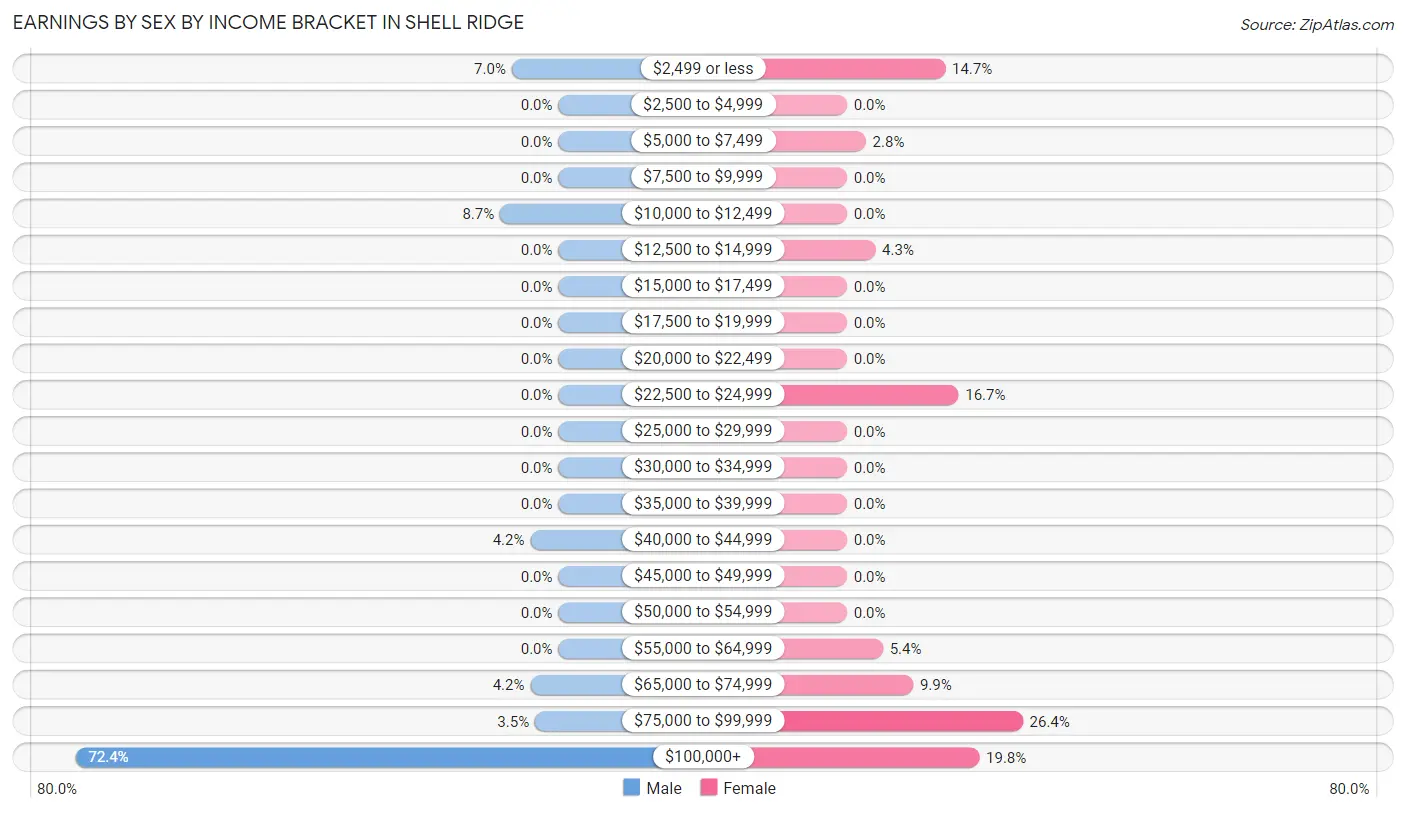
Earnings by Sex by Income Bracket in Shell Ridge
The most common earnings brackets in Shell Ridge are $100,000+ for men (207 | 72.4%) and $75,000 to $99,999 for women (93 | 26.4%).
| Income | Male | Female |
| $2,499 or less | 20 (7.0%) | 52 (14.7%) |
| $2,500 to $4,999 | 0 (0.0%) | 0 (0.0%) |
| $5,000 to $7,499 | 0 (0.0%) | 10 (2.8%) |
| $7,500 to $9,999 | 0 (0.0%) | 0 (0.0%) |
| $10,000 to $12,499 | 25 (8.7%) | 0 (0.0%) |
| $12,500 to $14,999 | 0 (0.0%) | 15 (4.3%) |
| $15,000 to $17,499 | 0 (0.0%) | 0 (0.0%) |
| $17,500 to $19,999 | 0 (0.0%) | 0 (0.0%) |
| $20,000 to $22,499 | 0 (0.0%) | 0 (0.0%) |
| $22,500 to $24,999 | 0 (0.0%) | 59 (16.7%) |
| $25,000 to $29,999 | 0 (0.0%) | 0 (0.0%) |
| $30,000 to $34,999 | 0 (0.0%) | 0 (0.0%) |
| $35,000 to $39,999 | 0 (0.0%) | 0 (0.0%) |
| $40,000 to $44,999 | 12 (4.2%) | 0 (0.0%) |
| $45,000 to $49,999 | 0 (0.0%) | 0 (0.0%) |
| $50,000 to $54,999 | 0 (0.0%) | 0 (0.0%) |
| $55,000 to $64,999 | 0 (0.0%) | 19 (5.4%) |
| $65,000 to $74,999 | 12 (4.2%) | 35 (9.9%) |
| $75,000 to $99,999 | 10 (3.5%) | 93 (26.4%) |
| $100,000+ | 207 (72.4%) | 70 (19.8%) |
| Total | 286 (100.0%) | 353 (100.0%) |
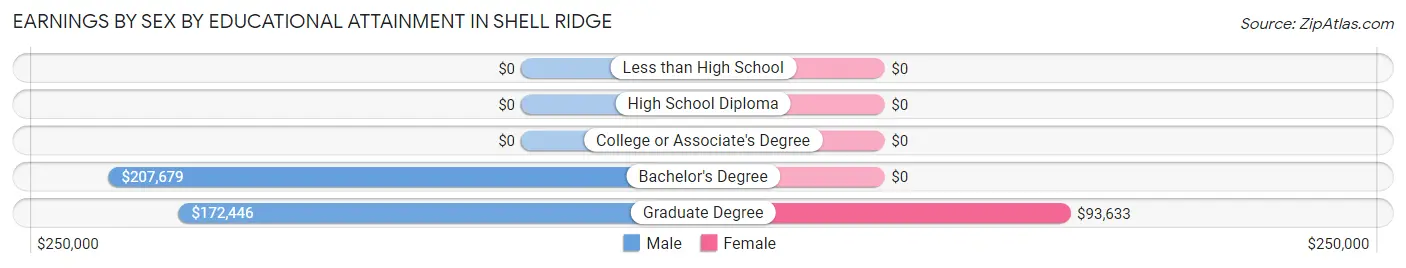
Earnings by Sex by Educational Attainment in Shell Ridge
Average earnings in Shell Ridge are $172,391 for men and $76,645 for women, a difference of 55.5%. Men with an educational attainment of bachelor's degree enjoy the highest average annual earnings of $207,679, while those with graduate degree education earn the least with $172,446. Women with an educational attainment of graduate degree earn the most with the average annual earnings of $93,633, while those with graduate degree education have the smallest earnings of $93,633.
| Educational Attainment | Male Income | Female Income |
| Less than High School | - | - |
| High School Diploma | - | - |
| College or Associate's Degree | - | - |
| Bachelor's Degree | $207,679 | $0 |
| Graduate Degree | $172,446 | $93,633 |
| Total | $172,391 | $76,645 |
Family Income in Shell Ridge
Family Income Brackets in Shell Ridge
According to the Shell Ridge family income data, there are 229 families falling into the $200,000+ income range, which is the most common income bracket and makes up 70.3% of all families.
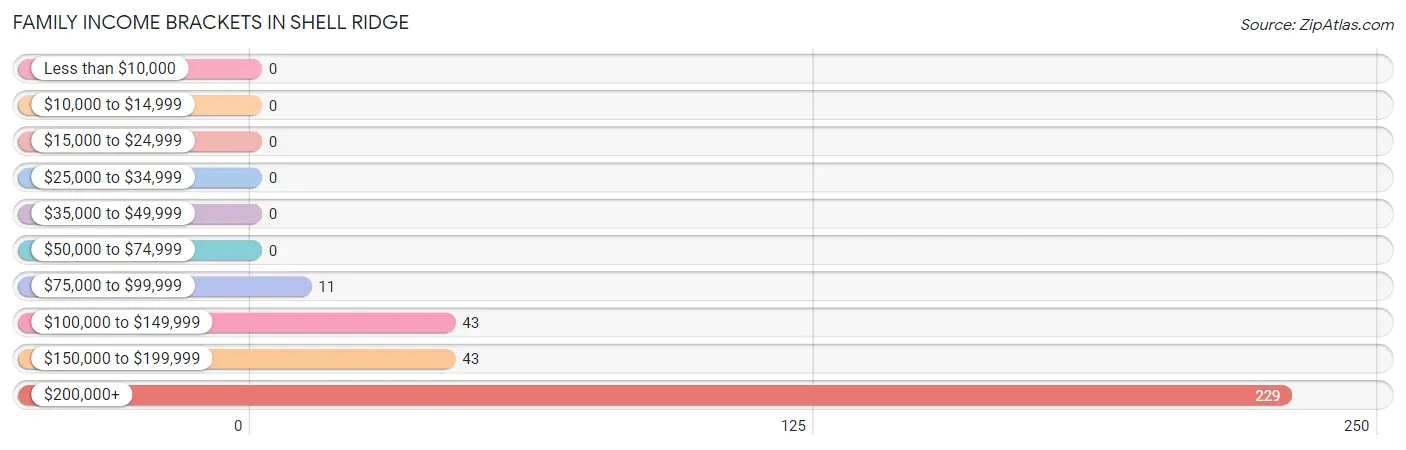
| Income Bracket | # Families | % Families |
| Less than $10,000 | 0 | 0.0% |
| $10,000 to $14,999 | 0 | 0.0% |
| $15,000 to $24,999 | 0 | 0.0% |
| $25,000 to $34,999 | 0 | 0.0% |
| $35,000 to $49,999 | 0 | 0.0% |
| $50,000 to $74,999 | 0 | 0.0% |
| $75,000 to $99,999 | 11 | 3.4% |
| $100,000 to $149,999 | 43 | 13.2% |
| $150,000 to $199,999 | 43 | 13.2% |
| $200,000+ | 229 | 70.2% |
Family Income by Famaliy Size in Shell Ridge
2-person families (138 | 42.3%) account for the highest median family income in Shell Ridge with $250,001 per family, while 2-person families (138 | 42.3%) have the highest median income of $125,000 per family member.
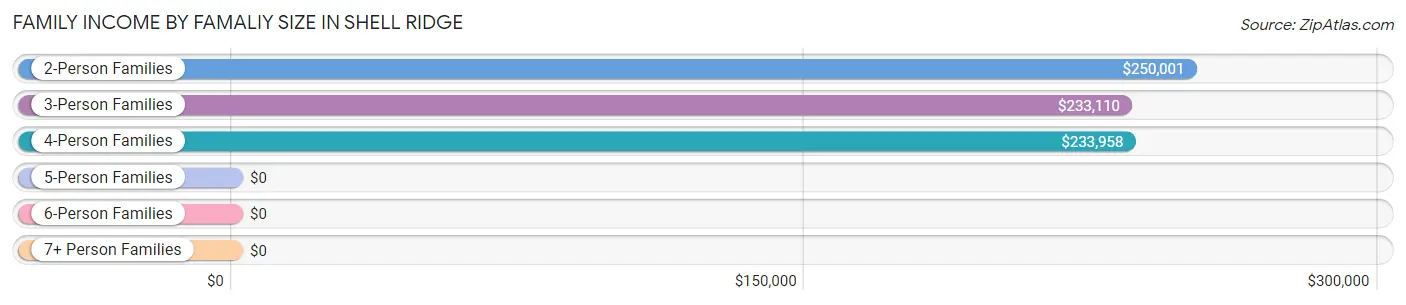
| Income Bracket | # Families | Median Income |
| 2-Person Families | 138 (42.3%) | $250,001 |
| 3-Person Families | 65 (19.9%) | $233,110 |
| 4-Person Families | 123 (37.7%) | $233,958 |
| 5-Person Families | 0 (0.0%) | $0 |
| 6-Person Families | 0 (0.0%) | $0 |
| 7+ Person Families | 0 (0.0%) | $0 |
| Total | 326 (100.0%) | $234,057 |
Family Income by Number of Earners in Shell Ridge
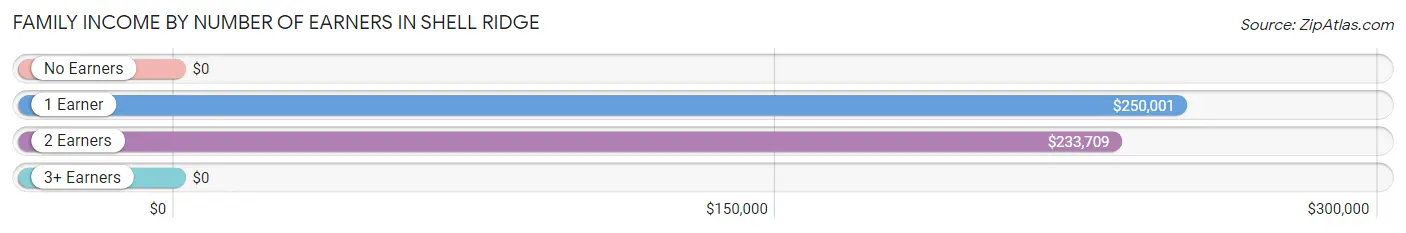
| Number of Earners | # Families | Median Income |
| No Earners | 0 (0.0%) | $0 |
| 1 Earner | 97 (29.7%) | $250,001 |
| 2 Earners | 219 (67.2%) | $233,709 |
| 3+ Earners | 10 (3.1%) | $0 |
| Total | 326 (100.0%) | $234,057 |
Household Income in Shell Ridge
Household Income Brackets in Shell Ridge
With 241 households falling in the category, the $200,000+ income range is the most frequent in Shell Ridge, accounting for 69.9% of all households.
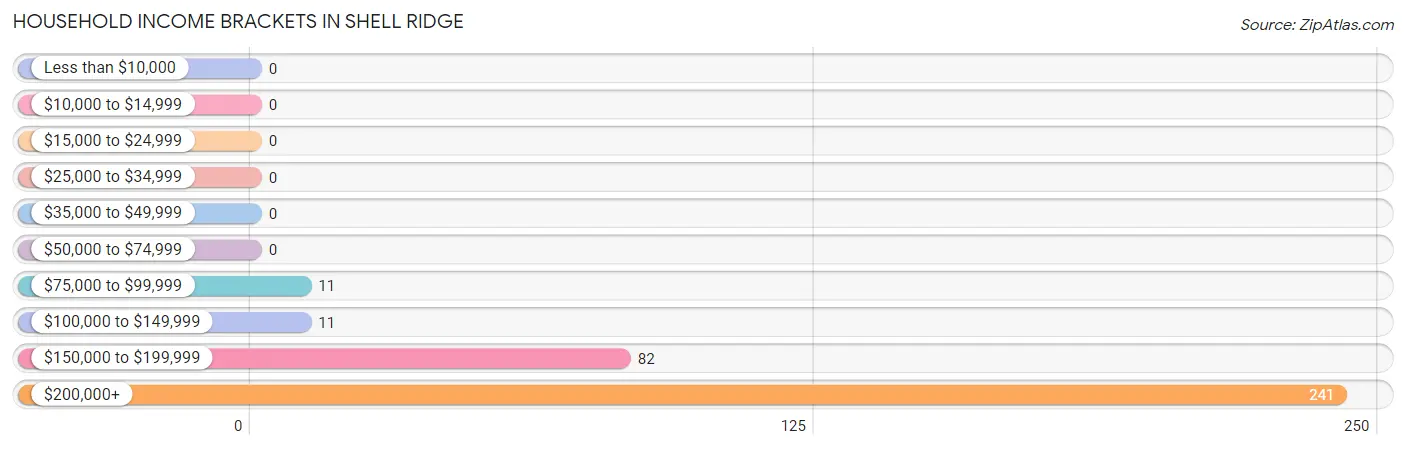
| Income Bracket | # Households | % Households |
| Less than $10,000 | 0 | 0.0% |
| $10,000 to $14,999 | 0 | 0.0% |
| $15,000 to $24,999 | 0 | 0.0% |
| $25,000 to $34,999 | 0 | 0.0% |
| $35,000 to $49,999 | 0 | 0.0% |
| $50,000 to $74,999 | 0 | 0.0% |
| $75,000 to $99,999 | 11 | 3.2% |
| $100,000 to $149,999 | 11 | 3.2% |
| $150,000 to $199,999 | 82 | 23.8% |
| $200,000+ | 241 | 69.9% |
Household Income by Householder Age in Shell Ridge
The median household income in Shell Ridge is $234,160, with the highest median household income of $234,931 found in the 65+ years age bracket for the primary householder. A total of 101 households (29.3%) fall into this category.
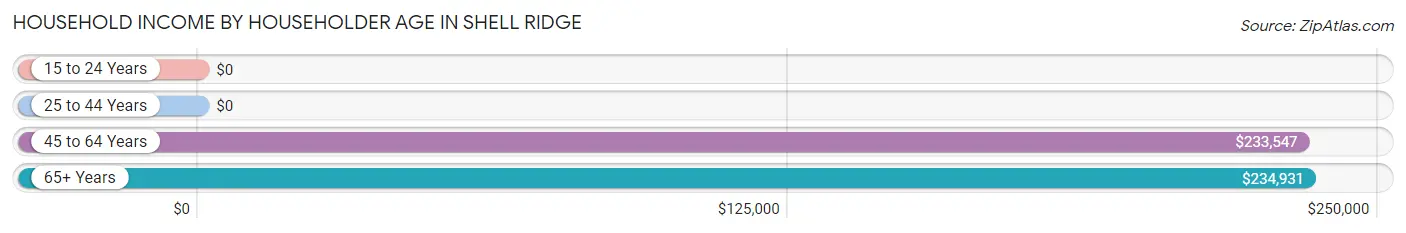
| Income Bracket | # Households | Median Income |
| 15 to 24 Years | 0 (0.0%) | $0 |
| 25 to 44 Years | 56 (16.2%) | $0 |
| 45 to 64 Years | 188 (54.5%) | $233,547 |
| 65+ Years | 101 (29.3%) | $234,931 |
| Total | 345 (100.0%) | $234,160 |
Poverty in Shell Ridge
Income Below Poverty by Sex and Age in Shell Ridge
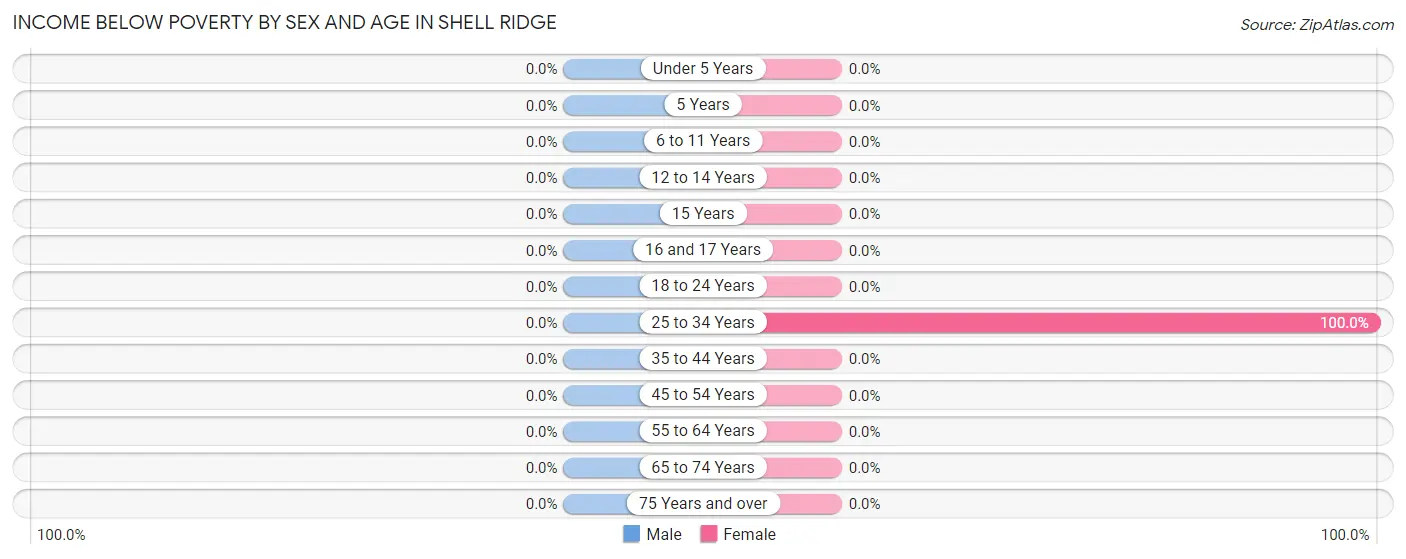
| Age Bracket | Male | Female |
| Under 5 Years | 0 (0.0%) | 0 (0.0%) |
| 5 Years | 0 (0.0%) | 0 (0.0%) |
| 6 to 11 Years | 0 (0.0%) | 0 (0.0%) |
| 12 to 14 Years | 0 (0.0%) | 0 (0.0%) |
| 15 Years | 0 (0.0%) | 0 (0.0%) |
| 16 and 17 Years | 0 (0.0%) | 0 (0.0%) |
| 18 to 24 Years | 0 (0.0%) | 0 (0.0%) |
| 25 to 34 Years | 0 (0.0%) | 12 (100.0%) |
| 35 to 44 Years | 0 (0.0%) | 0 (0.0%) |
| 45 to 54 Years | 0 (0.0%) | 0 (0.0%) |
| 55 to 64 Years | 0 (0.0%) | 0 (0.0%) |
| 65 to 74 Years | 0 (0.0%) | 0 (0.0%) |
| 75 Years and over | 0 (0.0%) | 0 (0.0%) |
| Total | 0 (0.0%) | 12 (1.9%) |
Income Above Poverty by Sex and Age in Shell Ridge
According to the poverty statistics in Shell Ridge, males aged 6 to 11 years and females aged under 5 years are the age groups that are most secure financially, with 100.0% of males and 100.0% of females in these age groups living above the poverty line.
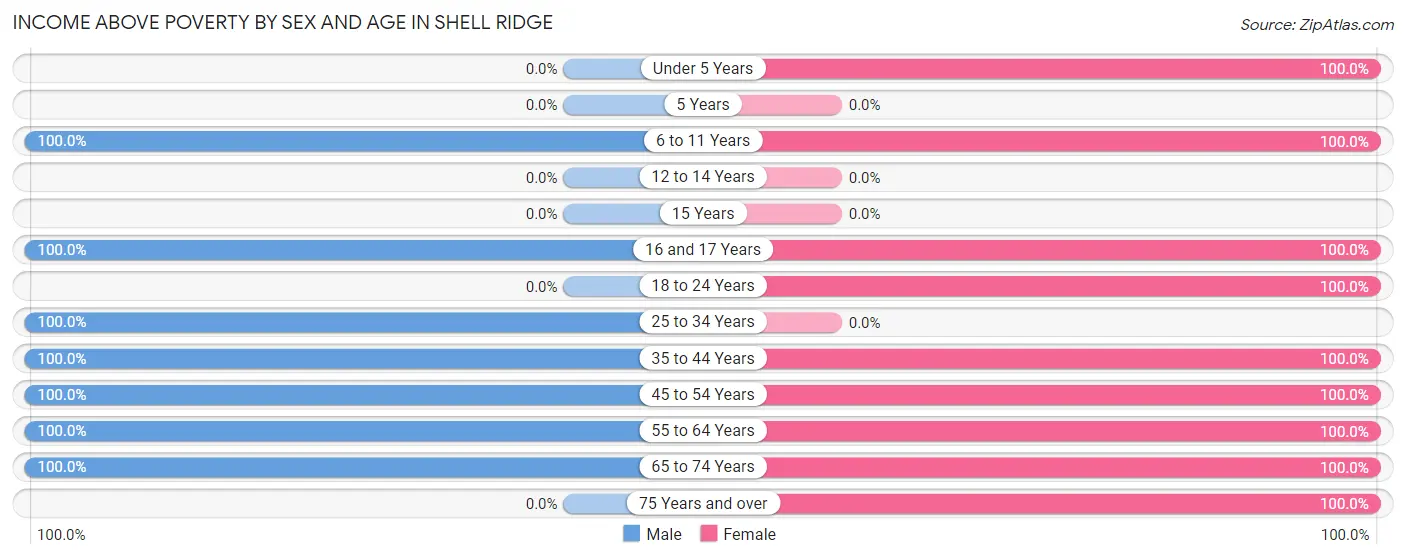
| Age Bracket | Male | Female |
| Under 5 Years | 0 (0.0%) | 51 (100.0%) |
| 5 Years | 0 (0.0%) | 0 (0.0%) |
| 6 to 11 Years | 33 (100.0%) | 120 (100.0%) |
| 12 to 14 Years | 0 (0.0%) | 0 (0.0%) |
| 15 Years | 0 (0.0%) | 0 (0.0%) |
| 16 and 17 Years | 40 (100.0%) | 9 (100.0%) |
| 18 to 24 Years | 0 (0.0%) | 52 (100.0%) |
| 25 to 34 Years | 37 (100.0%) | 0 (0.0%) |
| 35 to 44 Years | 56 (100.0%) | 135 (100.0%) |
| 45 to 54 Years | 80 (100.0%) | 58 (100.0%) |
| 55 to 64 Years | 76 (100.0%) | 137 (100.0%) |
| 65 to 74 Years | 102 (100.0%) | 31 (100.0%) |
| 75 Years and over | 0 (0.0%) | 12 (100.0%) |
| Total | 424 (100.0%) | 605 (98.1%) |
Income Below Poverty Among Married-Couple Families in Shell Ridge
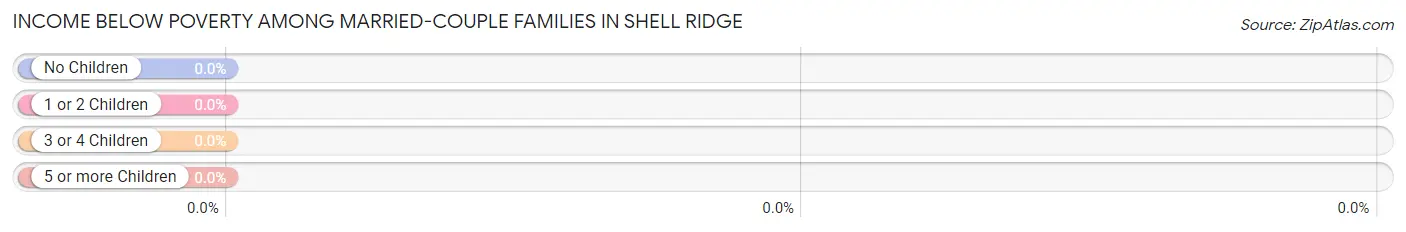
| Children | Above Poverty | Below Poverty |
| No Children | 131 (100.0%) | 0 (0.0%) |
| 1 or 2 Children | 155 (100.0%) | 0 (0.0%) |
| 3 or 4 Children | 0 (0.0%) | 0 (0.0%) |
| 5 or more Children | 0 (0.0%) | 0 (0.0%) |
| Total | 286 (100.0%) | 0 (0.0%) |
Income Below Poverty Among Single-Parent Households in Shell Ridge
| Children | Single Father | Single Mother |
| No Children | 0 (0.0%) | 0 (0.0%) |
| 1 or 2 Children | 0 (0.0%) | 0 (0.0%) |
| 3 or 4 Children | 0 (0.0%) | 0 (0.0%) |
| 5 or more Children | 0 (0.0%) | 0 (0.0%) |
| Total | 0 (0.0%) | 0 (0.0%) |
Income Below Poverty Among Married-Couple vs Single-Parent Households in Shell Ridge
| Children | Married-Couple Families | Single-Parent Households |
| No Children | 0 (0.0%) | 0 (0.0%) |
| 1 or 2 Children | 0 (0.0%) | 0 (0.0%) |
| 3 or 4 Children | 0 (0.0%) | 0 (0.0%) |
| 5 or more Children | 0 (0.0%) | 0 (0.0%) |
| Total | 0 (0.0%) | 0 (0.0%) |
Race in Shell Ridge
The most populous races in Shell Ridge are White / Caucasian (734 | 70.5%), Hispanic or Latino (205 | 19.7%), and Two or more Races (144 | 13.8%).
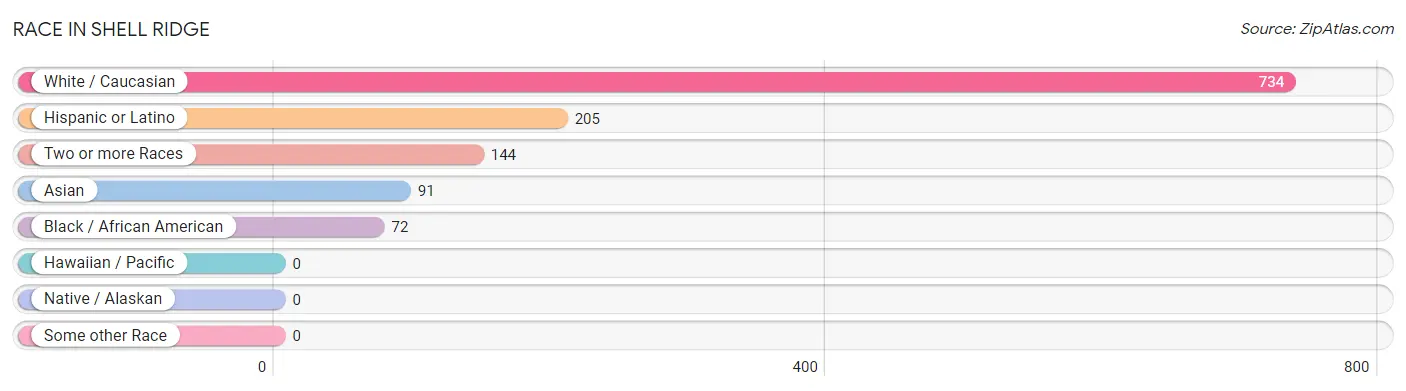
| Race | # Population | % Population |
| Asian | 91 | 8.7% |
| Black / African American | 72 | 6.9% |
| Hawaiian / Pacific | 0 | 0.0% |
| Hispanic or Latino | 205 | 19.7% |
| Native / Alaskan | 0 | 0.0% |
| White / Caucasian | 734 | 70.5% |
| Two or more Races | 144 | 13.8% |
| Some other Race | 0 | 0.0% |
| Total | 1,041 | 100.0% |
Ancestry in Shell Ridge
The most populous ancestries reported in Shell Ridge are English (254 | 24.4%), Irish (152 | 14.6%), German (147 | 14.1%), Dominican (88 | 8.5%), and Argentinean (85 | 8.2%), together accounting for 69.7% of all Shell Ridge residents.
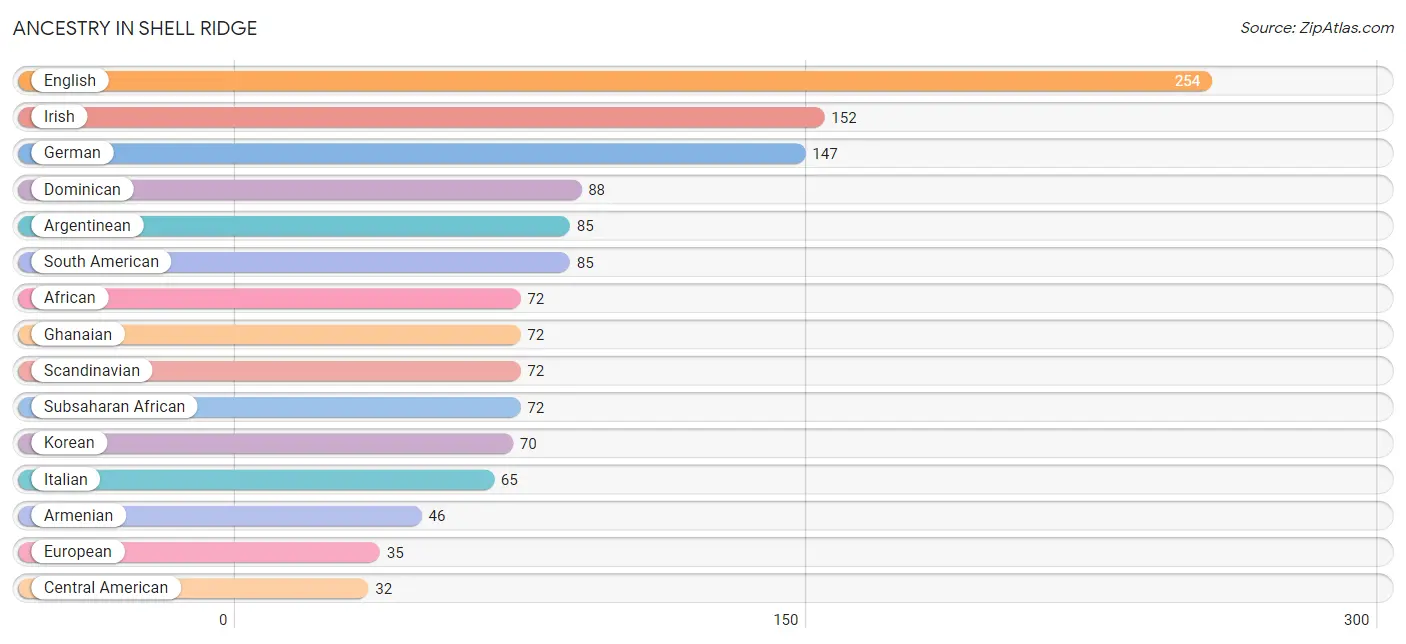
| Ancestry | # Population | % Population |
| African | 72 | 6.9% |
| American | 12 | 1.1% |
| Argentinean | 85 | 8.2% |
| Armenian | 46 | 4.4% |
| Assyrian / Chaldean / Syriac | 12 | 1.1% |
| British | 9 | 0.9% |
| Canadian | 12 | 1.1% |
| Central American | 32 | 3.1% |
| Danish | 27 | 2.6% |
| Dominican | 88 | 8.5% |
| English | 254 | 24.4% |
| European | 35 | 3.4% |
| German | 147 | 14.1% |
| Ghanaian | 72 | 6.9% |
| Guatemalan | 32 | 3.1% |
| Indian (Asian) | 29 | 2.8% |
| Irish | 152 | 14.6% |
| Italian | 65 | 6.2% |
| Korean | 70 | 6.7% |
| Lithuanian | 27 | 2.6% |
| Norwegian | 12 | 1.1% |
| Portuguese | 18 | 1.7% |
| Scandinavian | 72 | 6.9% |
| South American | 85 | 8.2% |
| Subsaharan African | 72 | 6.9% |
| Thai | 30 | 2.9% | View All 26 Rows |
Immigrants in Shell Ridge
The most numerous immigrant groups reported in Shell Ridge came from Asia (93 | 8.9%), Argentina (85 | 8.2%), Latin America (85 | 8.2%), South America (85 | 8.2%), and Africa (72 | 6.9%), together accounting for 40.4% of all Shell Ridge residents.
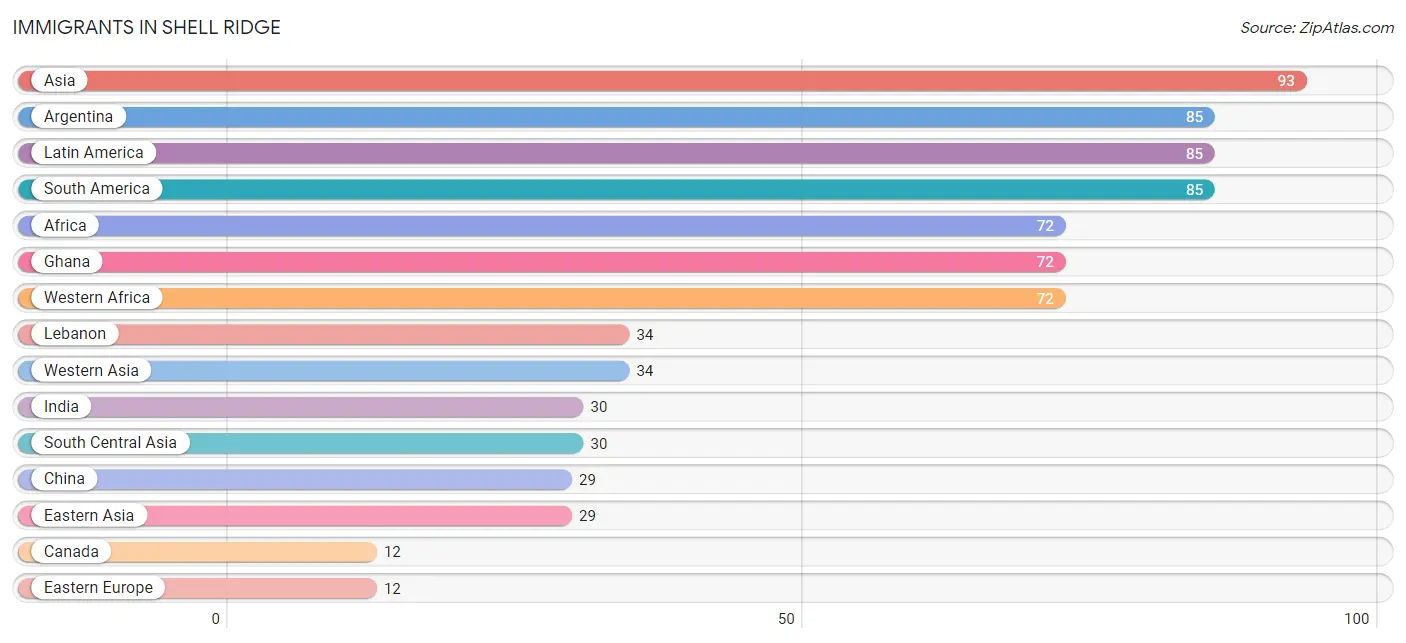
| Immigration Origin | # Population | % Population |
| Africa | 72 | 6.9% |
| Argentina | 85 | 8.2% |
| Asia | 93 | 8.9% |
| Canada | 12 | 1.1% |
| China | 29 | 2.8% |
| Eastern Asia | 29 | 2.8% |
| Eastern Europe | 12 | 1.1% |
| Europe | 12 | 1.1% |
| Ghana | 72 | 6.9% |
| India | 30 | 2.9% |
| Latin America | 85 | 8.2% |
| Lebanon | 34 | 3.3% |
| Oceania | 9 | 0.9% |
| Russia | 12 | 1.1% |
| South America | 85 | 8.2% |
| South Central Asia | 30 | 2.9% |
| Western Africa | 72 | 6.9% |
| Western Asia | 34 | 3.3% | View All 18 Rows |
Sex and Age in Shell Ridge
Sex and Age in Shell Ridge
The most populous age groups in Shell Ridge are 45 to 49 Years (80 | 18.9%) for men and 40 to 44 Years (100 | 16.2%) for women.
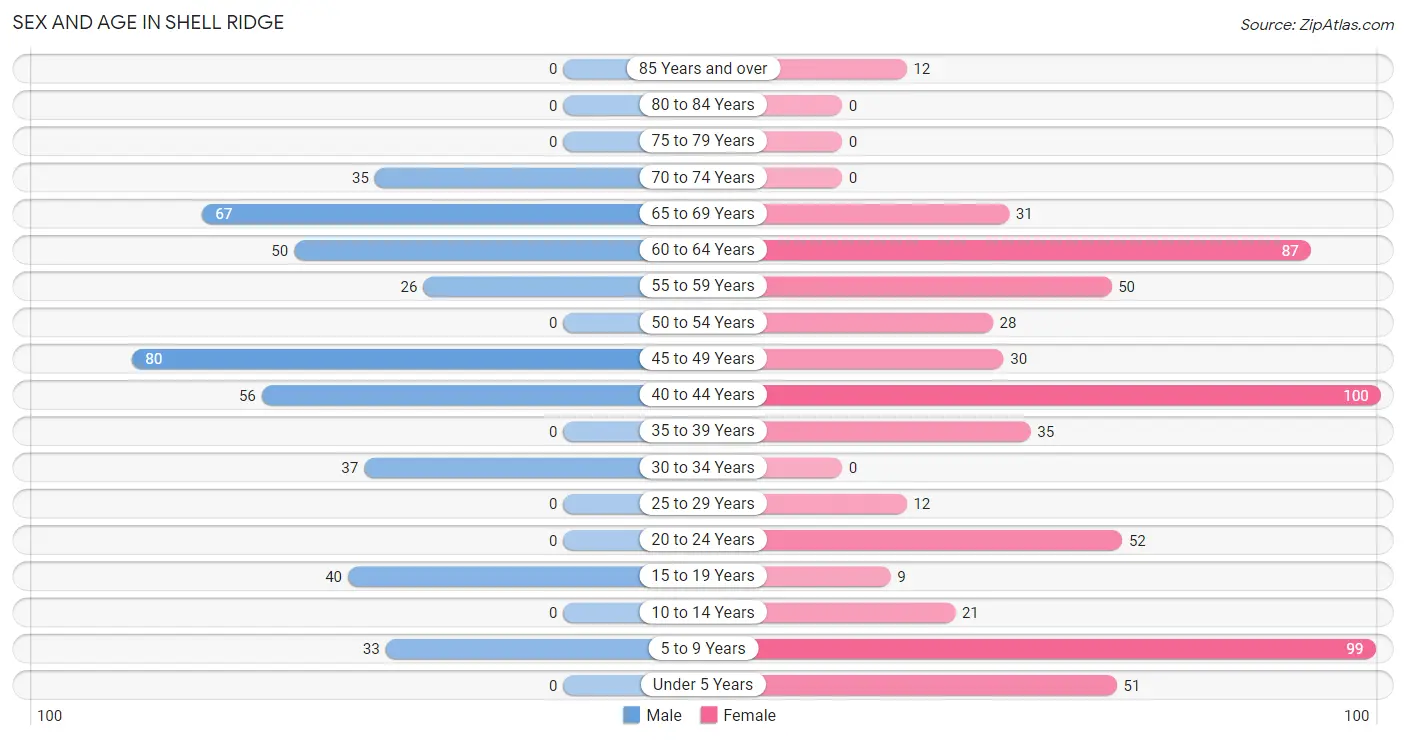
| Age Bracket | Male | Female |
| Under 5 Years | 0 (0.0%) | 51 (8.3%) |
| 5 to 9 Years | 33 (7.8%) | 99 (16.1%) |
| 10 to 14 Years | 0 (0.0%) | 21 (3.4%) |
| 15 to 19 Years | 40 (9.4%) | 9 (1.5%) |
| 20 to 24 Years | 0 (0.0%) | 52 (8.4%) |
| 25 to 29 Years | 0 (0.0%) | 12 (1.9%) |
| 30 to 34 Years | 37 (8.7%) | 0 (0.0%) |
| 35 to 39 Years | 0 (0.0%) | 35 (5.7%) |
| 40 to 44 Years | 56 (13.2%) | 100 (16.2%) |
| 45 to 49 Years | 80 (18.9%) | 30 (4.9%) |
| 50 to 54 Years | 0 (0.0%) | 28 (4.5%) |
| 55 to 59 Years | 26 (6.1%) | 50 (8.1%) |
| 60 to 64 Years | 50 (11.8%) | 87 (14.1%) |
| 65 to 69 Years | 67 (15.8%) | 31 (5.0%) |
| 70 to 74 Years | 35 (8.3%) | 0 (0.0%) |
| 75 to 79 Years | 0 (0.0%) | 0 (0.0%) |
| 80 to 84 Years | 0 (0.0%) | 0 (0.0%) |
| 85 Years and over | 0 (0.0%) | 12 (1.9%) |
| Total | 424 (100.0%) | 617 (100.0%) |
Families and Households in Shell Ridge
Median Family Size in Shell Ridge
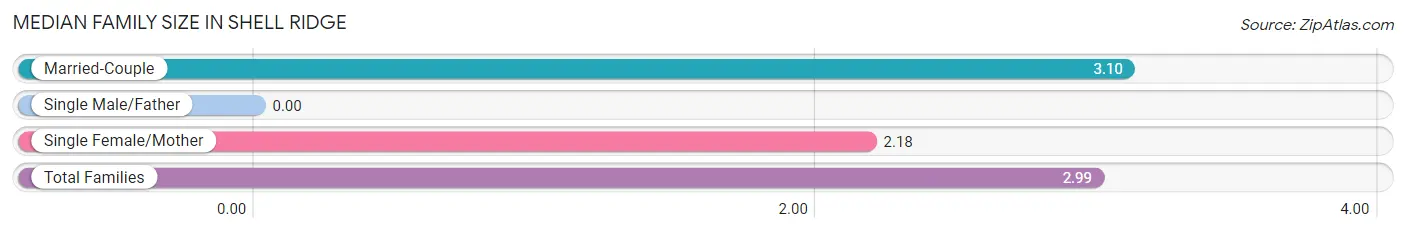
| Family Type | # Families | Family Size |
| Married-Couple | 286 (87.7%) | 3.10 |
| Single Male/Father | 0 (0.0%) | - |
| Single Female/Mother | 40 (12.3%) | 2.18 |
| Total Families | 326 (100.0%) | 2.99 |
Median Household Size in Shell Ridge
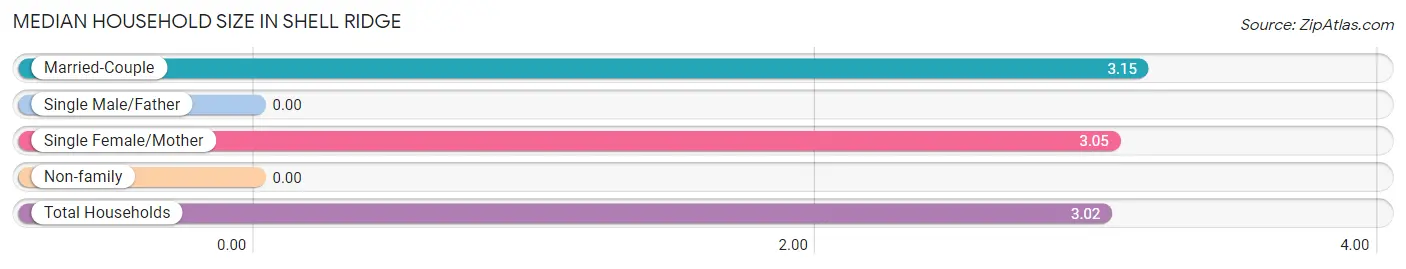
| Household Type | # Households | Household Size |
| Married-Couple | 286 (82.9%) | 3.15 |
| Single Male/Father | 0 (0.0%) | - |
| Single Female/Mother | 40 (11.6%) | 3.05 |
| Non-family | 19 (5.5%) | - |
| Total Households | 345 (100.0%) | 3.02 |
Household Size by Marriage Status in Shell Ridge
Out of a total of 345 households in Shell Ridge, 326 (94.5%) are family households, while 19 (5.5%) are nonfamily households. The most numerous type of family households are 4-person households, comprising 134, and the most common type of nonfamily households are 1-person households, comprising 19.
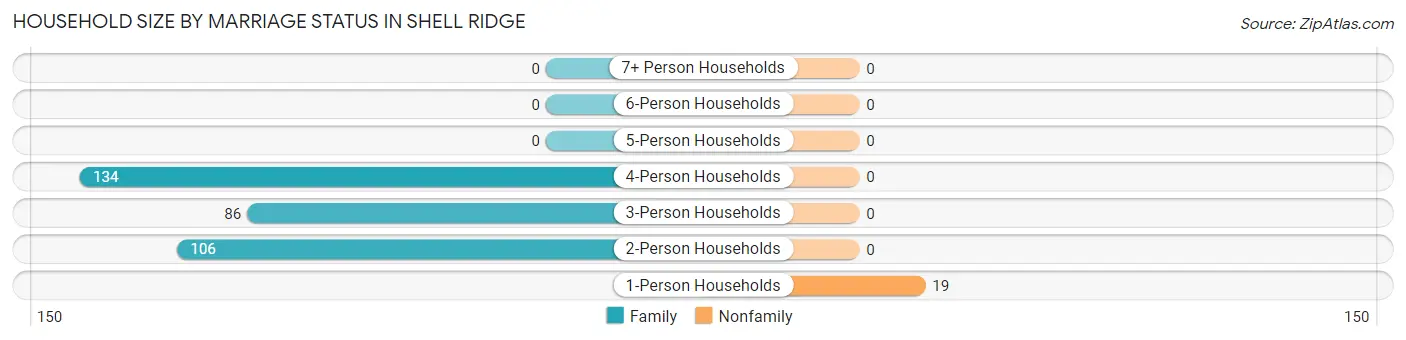
| Household Size | Family Households | Nonfamily Households |
| 1-Person Households | - | 19 (5.5%) |
| 2-Person Households | 106 (30.7%) | 0 (0.0%) |
| 3-Person Households | 86 (24.9%) | 0 (0.0%) |
| 4-Person Households | 134 (38.8%) | 0 (0.0%) |
| 5-Person Households | 0 (0.0%) | 0 (0.0%) |
| 6-Person Households | 0 (0.0%) | 0 (0.0%) |
| 7+ Person Households | 0 (0.0%) | 0 (0.0%) |
| Total | 326 (94.5%) | 19 (5.5%) |
Female Fertility in Shell Ridge
Fertility by Age in Shell Ridge
| Age Bracket | Women with Births | Births / 1,000 Women |
| 15 to 19 years | 0 (0.0%) | 0.0 |
| 20 to 34 years | 0 (0.0%) | 0.0 |
| 35 to 50 years | 0 (0.0%) | 0.0 |
| Total | 0 (0.0%) | 0.0 |
Fertility by Age by Marriage Status in Shell Ridge
| Age Bracket | Married | Unmarried |
| 15 to 19 years | 0 (0.0%) | 0 (0.0%) |
| 20 to 34 years | 0 (0.0%) | 0 (0.0%) |
| 35 to 50 years | 0 (0.0%) | 0 (0.0%) |
| Total | 0 (0.0%) | 0 (0.0%) |
Fertility by Education in Shell Ridge
| Educational Attainment | Women with Births | Births / 1,000 Women |
| Less than High School | 0 (0.0%) | 0.0 |
| High School Diploma | 0 (0.0%) | 0.0 |
| College or Associate's Degree | 0 (0.0%) | 0.0 |
| Bachelor's Degree | 0 (0.0%) | 0.0 |
| Graduate Degree | 0 (0.0%) | 0.0 |
| Total | 0 (0.0%) | 0.0 |
Fertility by Education by Marriage Status in Shell Ridge
| Educational Attainment | Married | Unmarried |
| Less than High School | 0 (0.0%) | 0 (0.0%) |
| High School Diploma | 0 (0.0%) | 0 (0.0%) |
| College or Associate's Degree | 0 (0.0%) | 0 (0.0%) |
| Bachelor's Degree | 0 (0.0%) | 0 (0.0%) |
| Graduate Degree | 0 (0.0%) | 0 (0.0%) |
| Total | 0 (0.0%) | 0 (0.0%) |
Employment Characteristics in Shell Ridge
Employment by Class of Employer in Shell Ridge
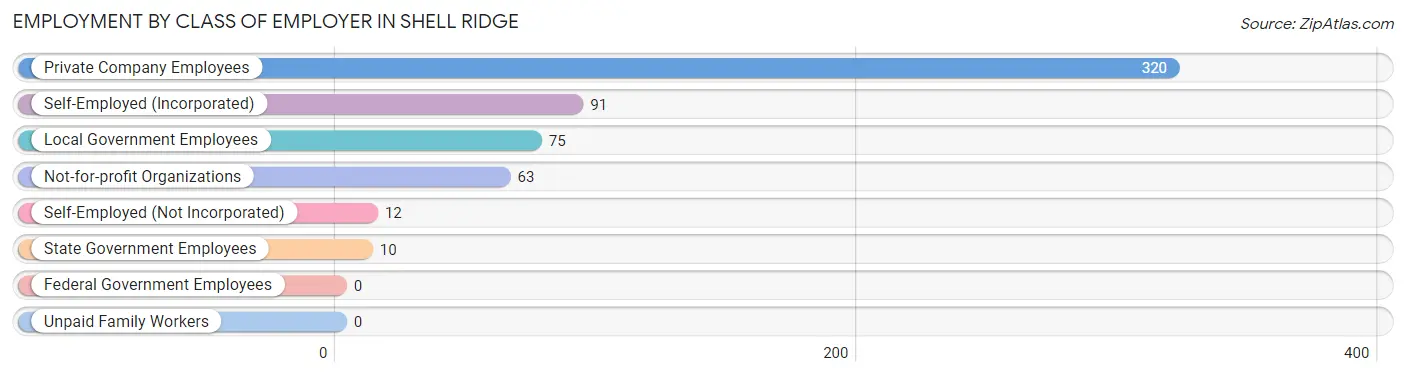
Among the 571 employed individuals in Shell Ridge, private company employees (320 | 56.0%), self-employed (incorporated) (91 | 15.9%), and local government employees (75 | 13.1%) make up the most common classes of employment.
| Employer Class | # Employees | % Employees |
| Private Company Employees | 320 | 56.0% |
| Self-Employed (Incorporated) | 91 | 15.9% |
| Self-Employed (Not Incorporated) | 12 | 2.1% |
| Not-for-profit Organizations | 63 | 11.0% |
| Local Government Employees | 75 | 13.1% |
| State Government Employees | 10 | 1.8% |
| Federal Government Employees | 0 | 0.0% |
| Unpaid Family Workers | 0 | 0.0% |
| Total | 571 | 100.0% |
Employment Status by Age in Shell Ridge
According to the labor force statistics for Shell Ridge, out of the total population over 16 years of age (837), 71.8% or 601 individuals are in the labor force, with 1.8% or 11 of them unemployed. The age group with the highest labor force participation rate is 30 to 34 years, with 100.0% or 37 individuals in the labor force. Within the labor force, the 65 to 74 years age range has the highest percentage of unemployed individuals, with 15.7% or 11 of them being unemployed.
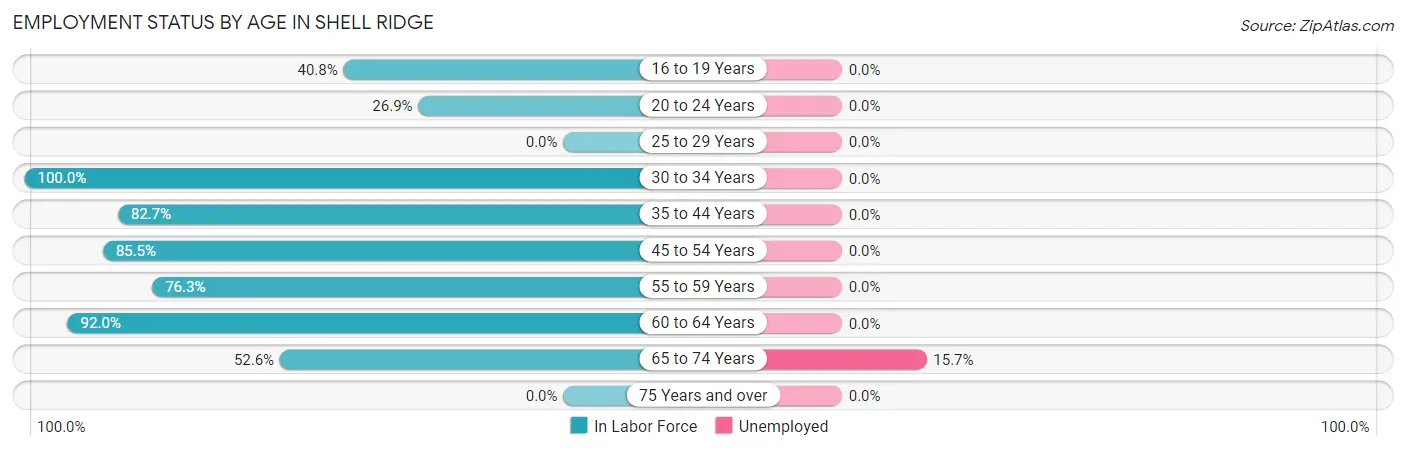
| Age Bracket | In Labor Force | Unemployed |
| 16 to 19 Years | 20 (40.8%) | 0 (0.0%) |
| 20 to 24 Years | 14 (26.9%) | 0 (0.0%) |
| 25 to 29 Years | 0 (0.0%) | 0 (0.0%) |
| 30 to 34 Years | 37 (100.0%) | 0 (0.0%) |
| 35 to 44 Years | 158 (82.7%) | 0 (0.0%) |
| 45 to 54 Years | 118 (85.5%) | 0 (0.0%) |
| 55 to 59 Years | 58 (76.3%) | 0 (0.0%) |
| 60 to 64 Years | 126 (92.0%) | 0 (0.0%) |
| 65 to 74 Years | 70 (52.6%) | 11 (15.7%) |
| 75 Years and over | 0 (0.0%) | 0 (0.0%) |
| Total | 601 (71.8%) | 11 (1.8%) |
Employment Status by Educational Attainment in Shell Ridge
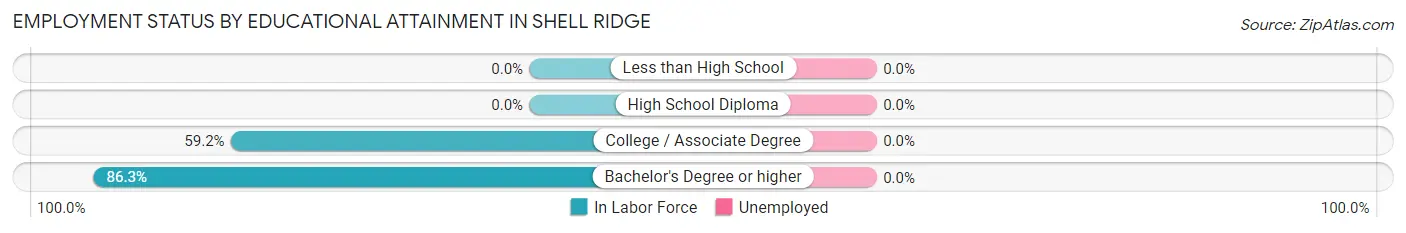
| Educational Attainment | In Labor Force | Unemployed |
| Less than High School | 0 (0.0%) | 0 (0.0%) |
| High School Diploma | 0 (0.0%) | 0 (0.0%) |
| College / Associate Degree | 29 (59.2%) | 0 (0.0%) |
| Bachelor's Degree or higher | 468 (86.3%) | 0 (0.0%) |
| Total | 497 (84.1%) | 0 (0.0%) |
Employment Occupations by Sex in Shell Ridge
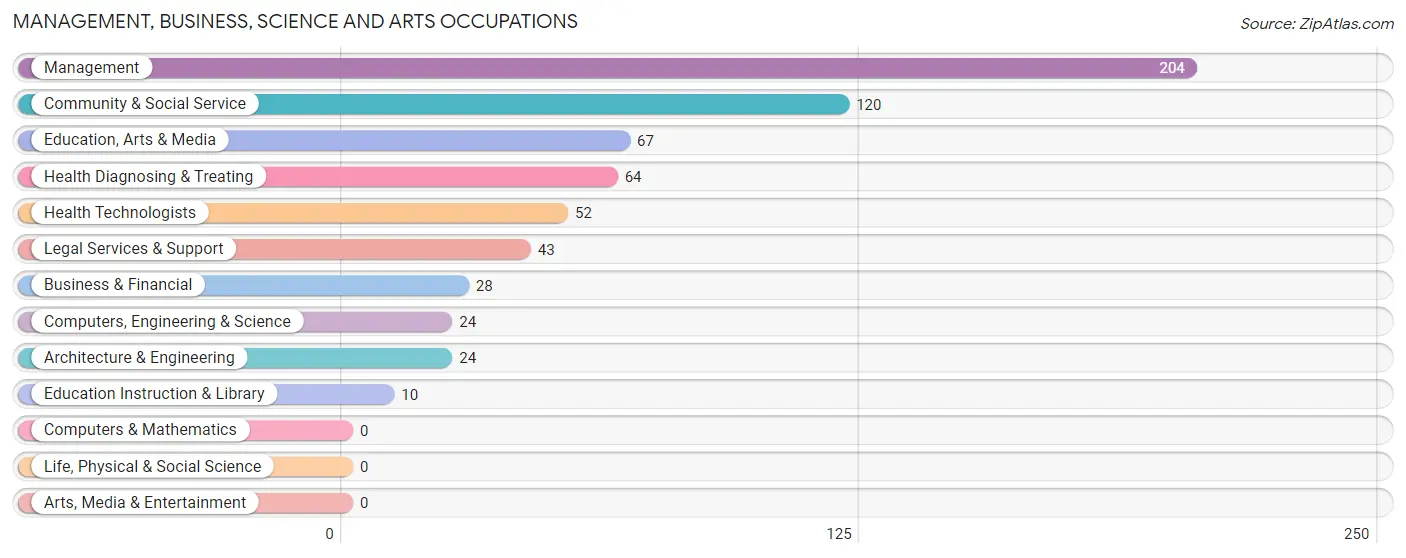
Management, Business, Science and Arts Occupations
The most common Management, Business, Science and Arts occupations in Shell Ridge are Management (204 | 34.6%), Community & Social Service (120 | 20.3%), Education, Arts & Media (67 | 11.4%), Health Diagnosing & Treating (64 | 10.8%), and Health Technologists (52 | 8.8%).
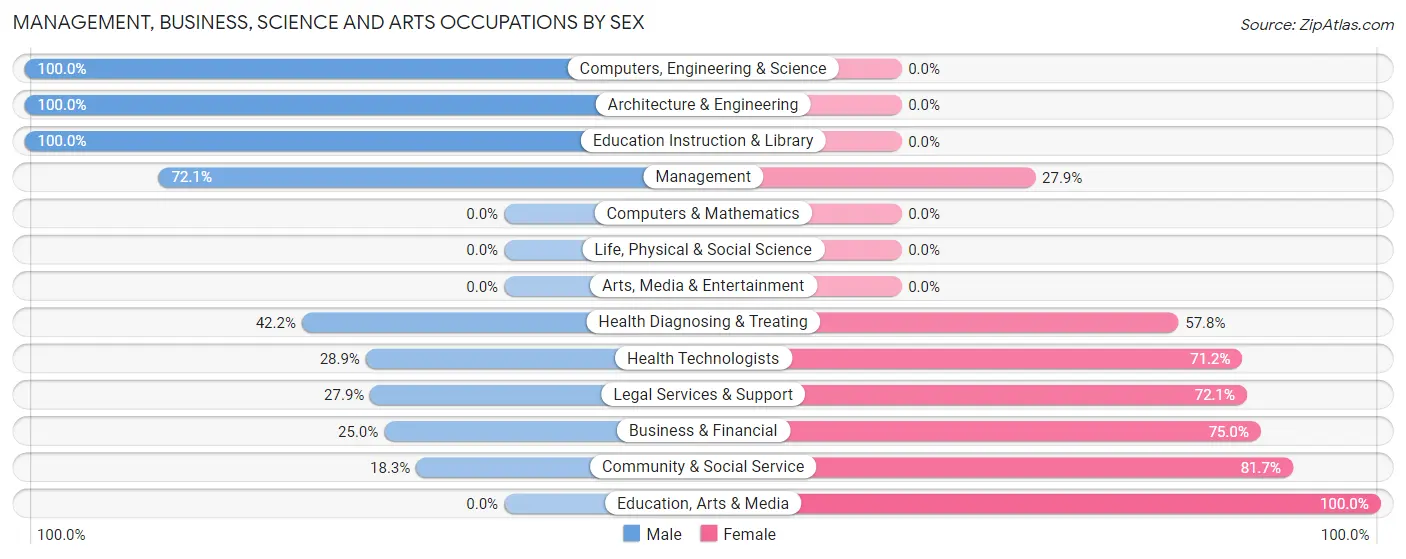
Management, Business, Science and Arts Occupations by Sex
Within the Management, Business, Science and Arts occupations in Shell Ridge, the most male-oriented occupations are Computers, Engineering & Science (100.0%), Architecture & Engineering (100.0%), and Education Instruction & Library (100.0%), while the most female-oriented occupations are Education, Arts & Media (100.0%), Community & Social Service (81.7%), and Business & Financial (75.0%).
| Occupation | Male | Female |
| Management | 147 (72.1%) | 57 (27.9%) |
| Business & Financial | 7 (25.0%) | 21 (75.0%) |
| Computers, Engineering & Science | 24 (100.0%) | 0 (0.0%) |
| Computers & Mathematics | 0 (0.0%) | 0 (0.0%) |
| Architecture & Engineering | 24 (100.0%) | 0 (0.0%) |
| Life, Physical & Social Science | 0 (0.0%) | 0 (0.0%) |
| Community & Social Service | 22 (18.3%) | 98 (81.7%) |
| Education, Arts & Media | 0 (0.0%) | 67 (100.0%) |
| Legal Services & Support | 12 (27.9%) | 31 (72.1%) |
| Education Instruction & Library | 10 (100.0%) | 0 (0.0%) |
| Arts, Media & Entertainment | 0 (0.0%) | 0 (0.0%) |
| Health Diagnosing & Treating | 27 (42.2%) | 37 (57.8%) |
| Health Technologists | 15 (28.8%) | 37 (71.2%) |
| Total (Category) | 227 (51.6%) | 213 (48.4%) |
| Total (Overall) | 275 (46.6%) | 315 (53.4%) |
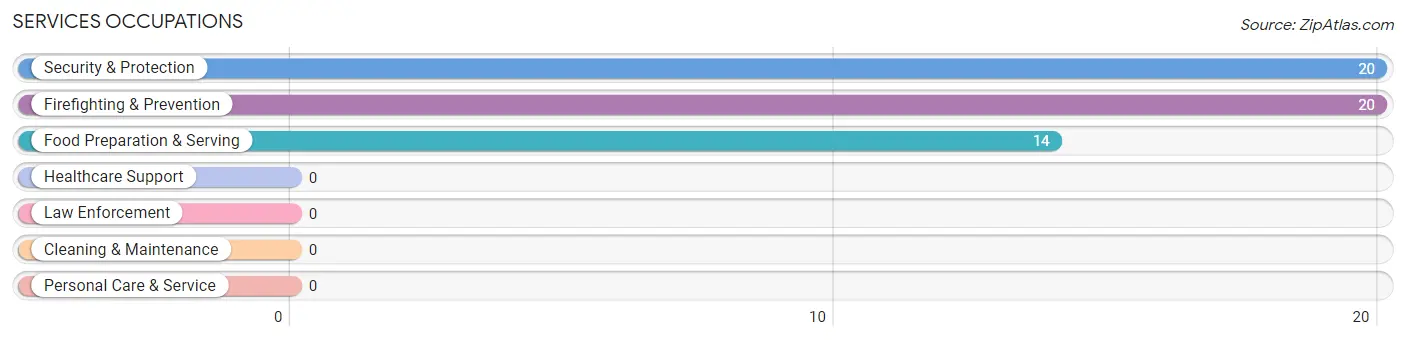
Services Occupations
The most common Services occupations in Shell Ridge are Security & Protection (20 | 3.4%), Firefighting & Prevention (20 | 3.4%), and Food Preparation & Serving (14 | 2.4%).
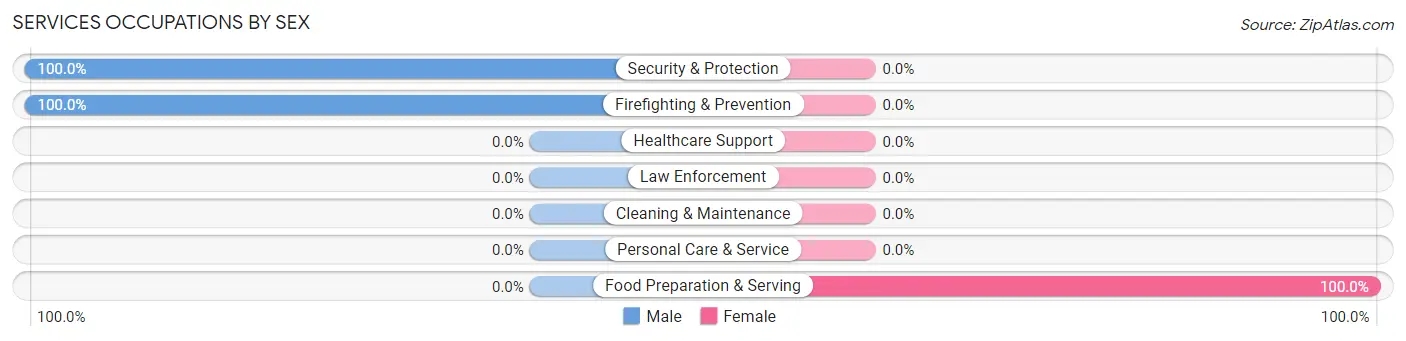
Services Occupations by Sex
| Occupation | Male | Female |
| Healthcare Support | 0 (0.0%) | 0 (0.0%) |
| Security & Protection | 20 (100.0%) | 0 (0.0%) |
| Firefighting & Prevention | 20 (100.0%) | 0 (0.0%) |
| Law Enforcement | 0 (0.0%) | 0 (0.0%) |
| Food Preparation & Serving | 0 (0.0%) | 14 (100.0%) |
| Cleaning & Maintenance | 0 (0.0%) | 0 (0.0%) |
| Personal Care & Service | 0 (0.0%) | 0 (0.0%) |
| Total (Category) | 20 (58.8%) | 14 (41.2%) |
| Total (Overall) | 275 (46.6%) | 315 (53.4%) |
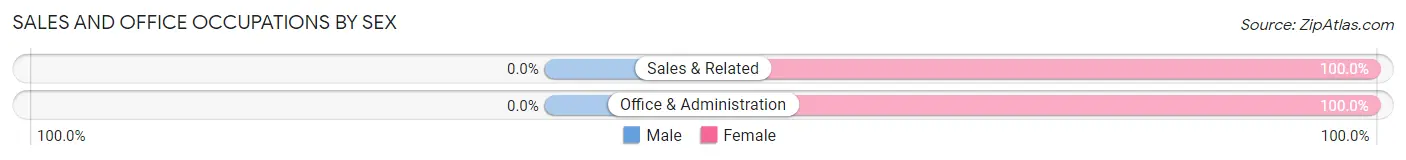
Sales and Office Occupations
The most common Sales and Office occupations in Shell Ridge are Sales & Related (51 | 8.6%), and Office & Administration (10 | 1.7%).

Sales and Office Occupations by Sex
| Occupation | Male | Female |
| Sales & Related | 0 (0.0%) | 51 (100.0%) |
| Office & Administration | 0 (0.0%) | 10 (100.0%) |
| Total (Category) | 0 (0.0%) | 61 (100.0%) |
| Total (Overall) | 275 (46.6%) | 315 (53.4%) |
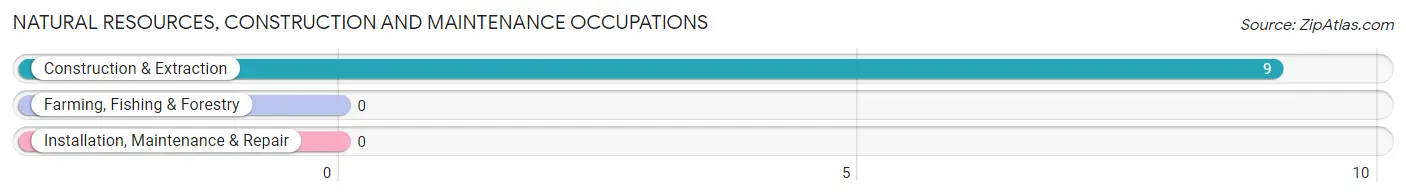
Natural Resources, Construction and Maintenance Occupations
The most common Natural Resources, Construction and Maintenance occupations in Shell Ridge are , and Construction & Extraction (9 | 1.5%).
Natural Resources, Construction and Maintenance Occupations by Sex
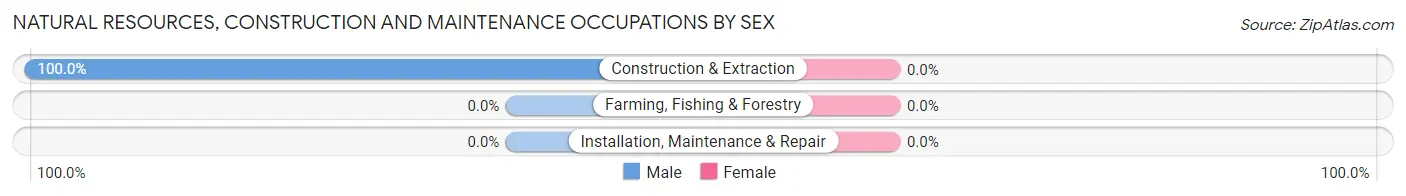
| Occupation | Male | Female |
| Farming, Fishing & Forestry | 0 (0.0%) | 0 (0.0%) |
| Construction & Extraction | 9 (100.0%) | 0 (0.0%) |
| Installation, Maintenance & Repair | 0 (0.0%) | 0 (0.0%) |
| Total (Category) | 9 (100.0%) | 0 (0.0%) |
| Total (Overall) | 275 (46.6%) | 315 (53.4%) |
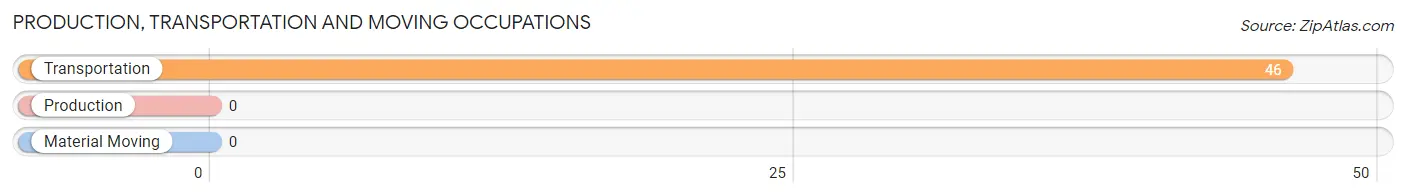
Production, Transportation and Moving Occupations
The most common Production, Transportation and Moving occupations in Shell Ridge are , and Transportation (46 | 7.8%).
Production, Transportation and Moving Occupations by Sex
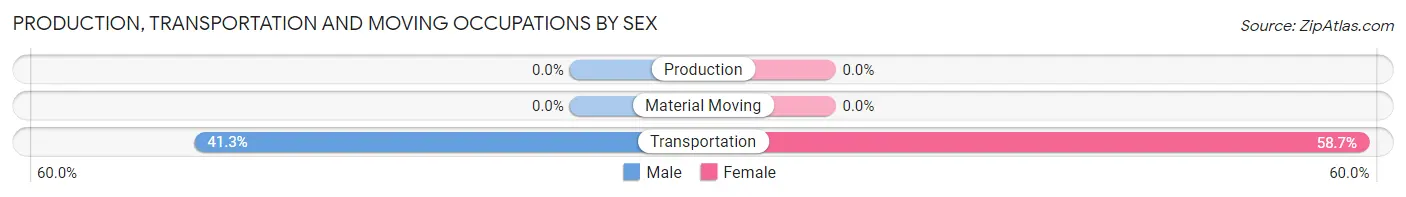
| Occupation | Male | Female |
| Production | 0 (0.0%) | 0 (0.0%) |
| Transportation | 19 (41.3%) | 27 (58.7%) |
| Material Moving | 0 (0.0%) | 0 (0.0%) |
| Total (Category) | 19 (41.3%) | 27 (58.7%) |
| Total (Overall) | 275 (46.6%) | 315 (53.4%) |
Employment Industries by Sex in Shell Ridge
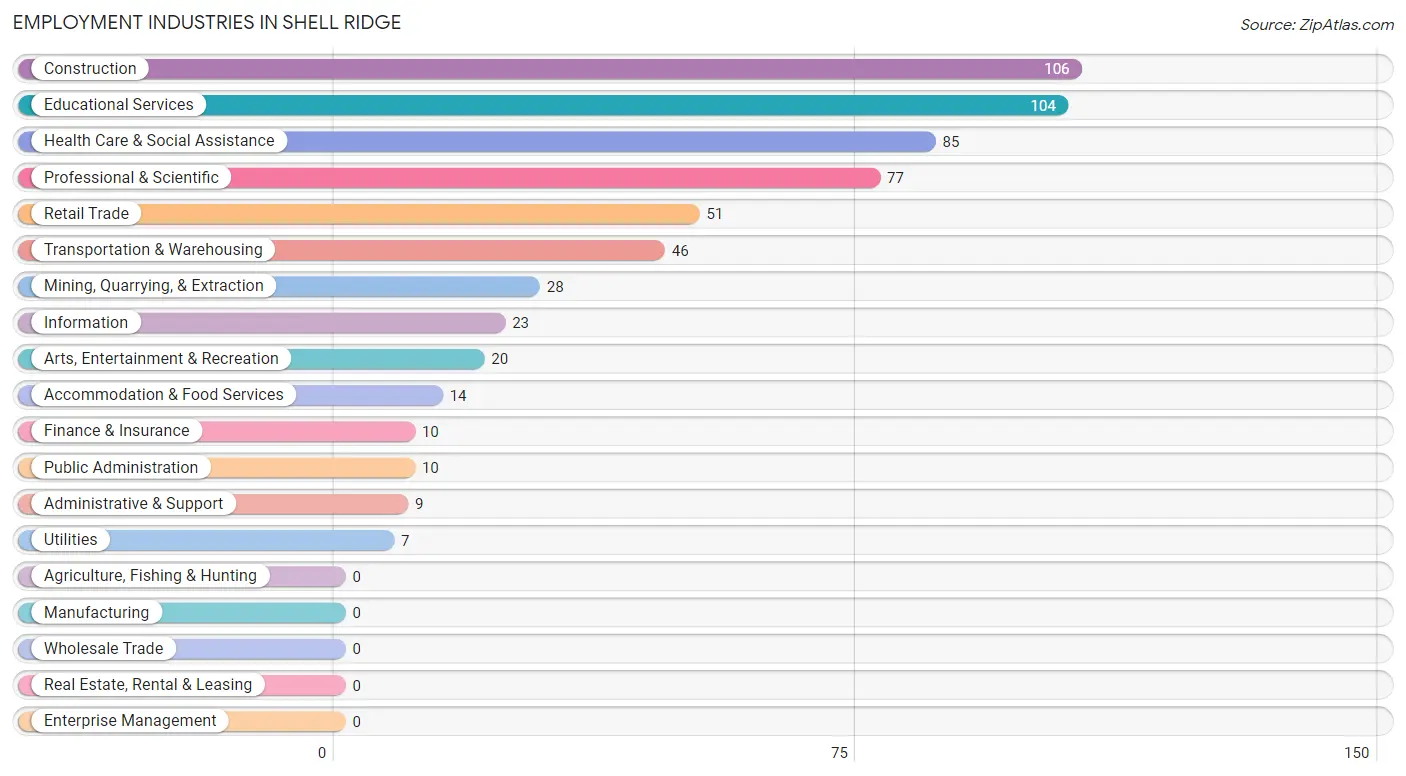
Employment Industries in Shell Ridge
The major employment industries in Shell Ridge include Construction (106 | 18.0%), Educational Services (104 | 17.6%), Health Care & Social Assistance (85 | 14.4%), Professional & Scientific (77 | 13.1%), and Retail Trade (51 | 8.6%).
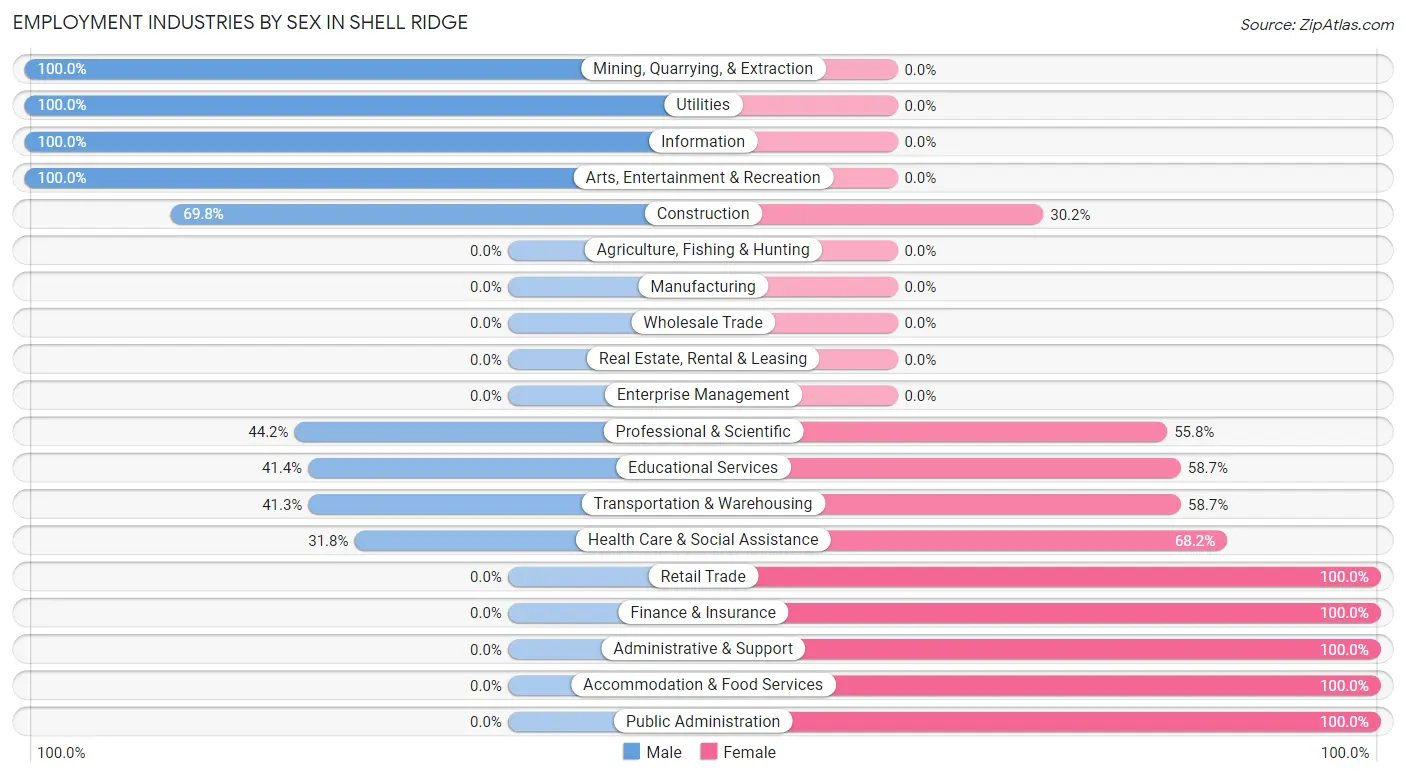
Employment Industries by Sex in Shell Ridge
The Shell Ridge industries that see more men than women are Mining, Quarrying, & Extraction (100.0%), Utilities (100.0%), and Information (100.0%), whereas the industries that tend to have a higher number of women are Retail Trade (100.0%), Finance & Insurance (100.0%), and Administrative & Support (100.0%).
| Industry | Male | Female |
| Agriculture, Fishing & Hunting | 0 (0.0%) | 0 (0.0%) |
| Mining, Quarrying, & Extraction | 28 (100.0%) | 0 (0.0%) |
| Construction | 74 (69.8%) | 32 (30.2%) |
| Manufacturing | 0 (0.0%) | 0 (0.0%) |
| Wholesale Trade | 0 (0.0%) | 0 (0.0%) |
| Retail Trade | 0 (0.0%) | 51 (100.0%) |
| Transportation & Warehousing | 19 (41.3%) | 27 (58.7%) |
| Utilities | 7 (100.0%) | 0 (0.0%) |
| Information | 23 (100.0%) | 0 (0.0%) |
| Finance & Insurance | 0 (0.0%) | 10 (100.0%) |
| Real Estate, Rental & Leasing | 0 (0.0%) | 0 (0.0%) |
| Professional & Scientific | 34 (44.2%) | 43 (55.8%) |
| Enterprise Management | 0 (0.0%) | 0 (0.0%) |
| Administrative & Support | 0 (0.0%) | 9 (100.0%) |
| Educational Services | 43 (41.3%) | 61 (58.7%) |
| Health Care & Social Assistance | 27 (31.8%) | 58 (68.2%) |
| Arts, Entertainment & Recreation | 20 (100.0%) | 0 (0.0%) |
| Accommodation & Food Services | 0 (0.0%) | 14 (100.0%) |
| Public Administration | 0 (0.0%) | 10 (100.0%) |
| Total | 275 (46.6%) | 315 (53.4%) |
Education in Shell Ridge
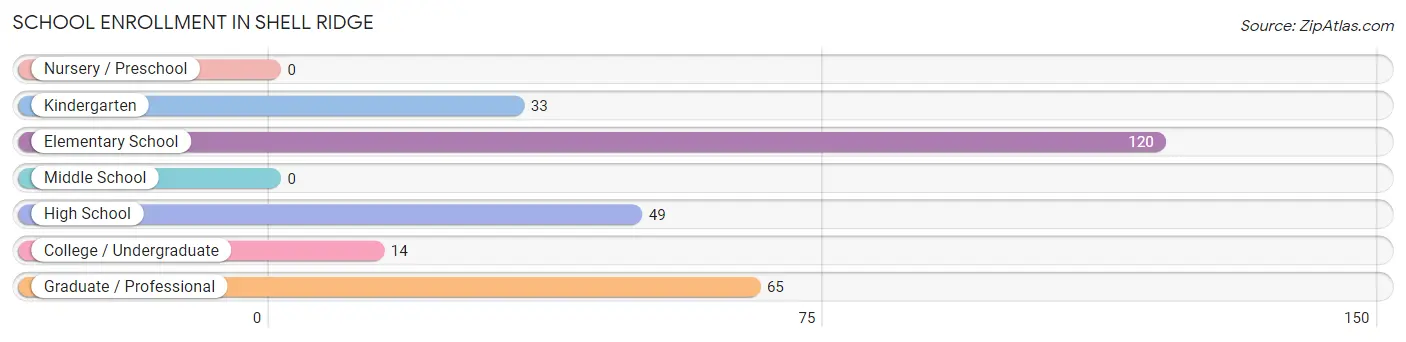
School Enrollment in Shell Ridge
The most common levels of schooling among the 281 students in Shell Ridge are elementary school (120 | 42.7%), graduate / professional (65 | 23.1%), and high school (49 | 17.4%).
| School Level | # Students | % Students |
| Nursery / Preschool | 0 | 0.0% |
| Kindergarten | 33 | 11.7% |
| Elementary School | 120 | 42.7% |
| Middle School | 0 | 0.0% |
| High School | 49 | 17.4% |
| College / Undergraduate | 14 | 5.0% |
| Graduate / Professional | 65 | 23.1% |
| Total | 281 | 100.0% |
School Enrollment by Age by Funding Source in Shell Ridge
Out of a total of 281 students who are enrolled in schools in Shell Ridge, 67 (23.8%) attend a private institution, while the remaining 214 (76.2%) are enrolled in public schools. The age group of 20 to 24 year olds has the highest likelihood of being enrolled in private schools, with 52 (100.0% in the age bracket) enrolled. Conversely, the age group of 5 to 9 year old has the lowest likelihood of being enrolled in a private school, with 132 (100.0% in the age bracket) attending a public institution.
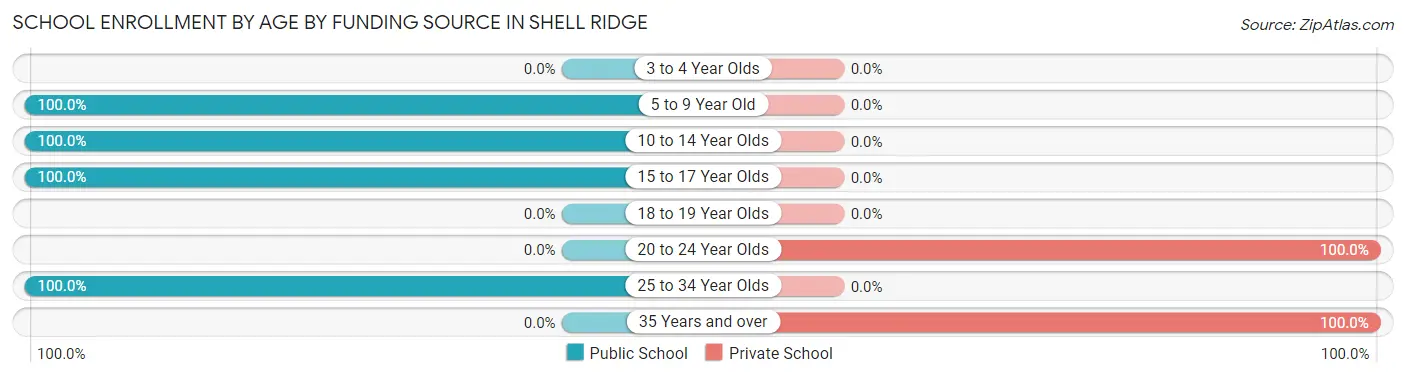
| Age Bracket | Public School | Private School |
| 3 to 4 Year Olds | 0 (0.0%) | 0 (0.0%) |
| 5 to 9 Year Old | 132 (100.0%) | 0 (0.0%) |
| 10 to 14 Year Olds | 21 (100.0%) | 0 (0.0%) |
| 15 to 17 Year Olds | 49 (100.0%) | 0 (0.0%) |
| 18 to 19 Year Olds | 0 (0.0%) | 0 (0.0%) |
| 20 to 24 Year Olds | 0 (0.0%) | 52 (100.0%) |
| 25 to 34 Year Olds | 12 (100.0%) | 0 (0.0%) |
| 35 Years and over | 0 (0.0%) | 15 (100.0%) |
| Total | 214 (76.2%) | 67 (23.8%) |
Educational Attainment by Field of Study in Shell Ridge
Science & technology (137 | 20.3%), literature & languages (97 | 14.3%), social sciences (80 | 11.8%), physical & health sciences (76 | 11.2%), and liberal arts & history (69 | 10.2%) are the most common fields of study among 676 individuals in Shell Ridge who have obtained a bachelor's degree or higher.
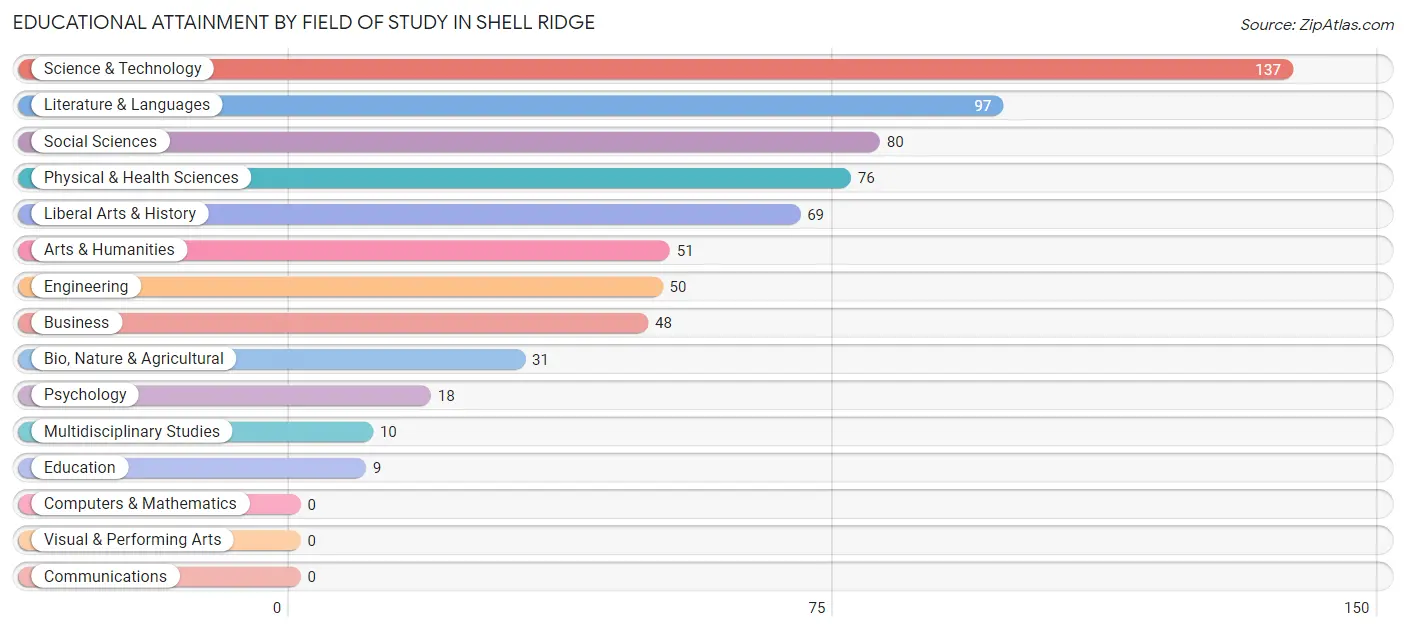
| Field of Study | # Graduates | % Graduates |
| Computers & Mathematics | 0 | 0.0% |
| Bio, Nature & Agricultural | 31 | 4.6% |
| Physical & Health Sciences | 76 | 11.2% |
| Psychology | 18 | 2.7% |
| Social Sciences | 80 | 11.8% |
| Engineering | 50 | 7.4% |
| Multidisciplinary Studies | 10 | 1.5% |
| Science & Technology | 137 | 20.3% |
| Business | 48 | 7.1% |
| Education | 9 | 1.3% |
| Literature & Languages | 97 | 14.3% |
| Liberal Arts & History | 69 | 10.2% |
| Visual & Performing Arts | 0 | 0.0% |
| Communications | 0 | 0.0% |
| Arts & Humanities | 51 | 7.5% |
| Total | 676 | 100.0% |
Transportation & Commute in Shell Ridge
Vehicle Availability by Sex in Shell Ridge
The most prevalent vehicle ownership categories in Shell Ridge are males with 2 vehicles (122, accounting for 44.4%) and females with 2 vehicles (142, making up 41.2%).
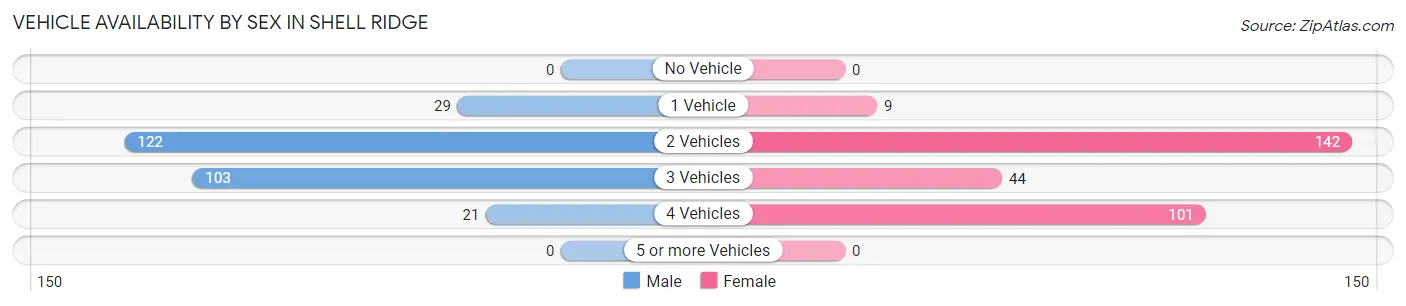
| Vehicles Available | Male | Female |
| No Vehicle | 0 (0.0%) | 0 (0.0%) |
| 1 Vehicle | 29 (10.5%) | 9 (3.0%) |
| 2 Vehicles | 122 (44.4%) | 142 (48.0%) |
| 3 Vehicles | 103 (37.4%) | 44 (14.9%) |
| 4 Vehicles | 21 (7.6%) | 101 (34.1%) |
| 5 or more Vehicles | 0 (0.0%) | 0 (0.0%) |
| Total | 275 (100.0%) | 296 (100.0%) |
Commute Time in Shell Ridge
The most frequently occuring commute durations in Shell Ridge are 60 to 89 minutes (83 commuters, 20.0%), 45 to 59 minutes (63 commuters, 15.2%), and 25 to 29 minutes (60 commuters, 14.5%).
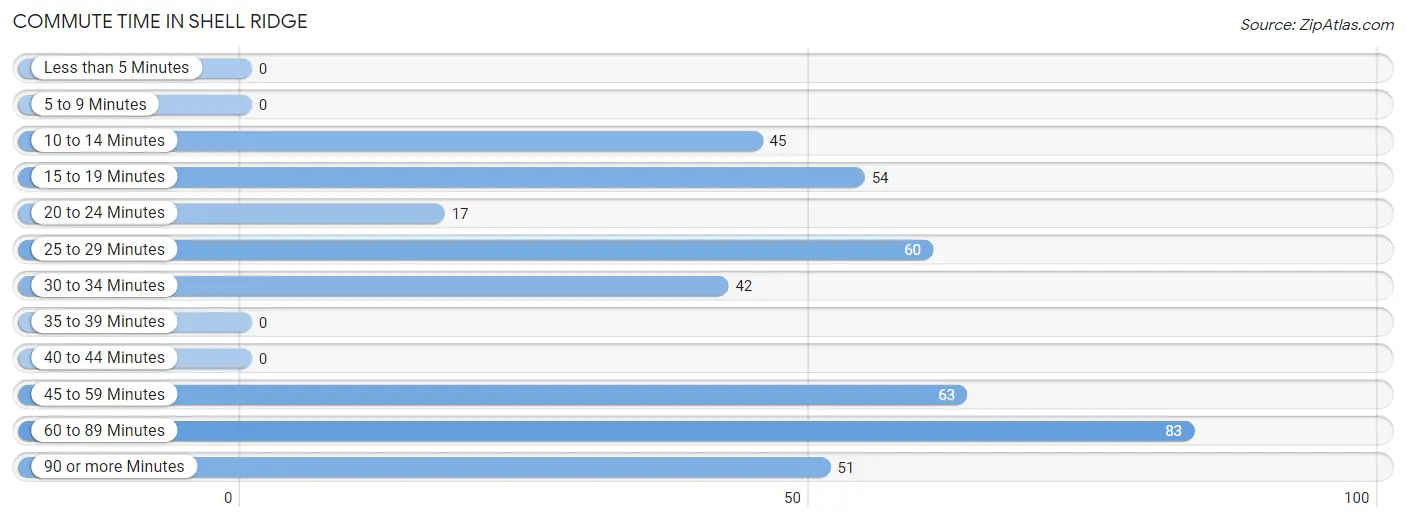
| Commute Time | # Commuters | % Commuters |
| Less than 5 Minutes | 0 | 0.0% |
| 5 to 9 Minutes | 0 | 0.0% |
| 10 to 14 Minutes | 45 | 10.8% |
| 15 to 19 Minutes | 54 | 13.0% |
| 20 to 24 Minutes | 17 | 4.1% |
| 25 to 29 Minutes | 60 | 14.5% |
| 30 to 34 Minutes | 42 | 10.1% |
| 35 to 39 Minutes | 0 | 0.0% |
| 40 to 44 Minutes | 0 | 0.0% |
| 45 to 59 Minutes | 63 | 15.2% |
| 60 to 89 Minutes | 83 | 20.0% |
| 90 or more Minutes | 51 | 12.3% |
Commute Time by Sex in Shell Ridge
The most common commute times in Shell Ridge are 60 to 89 minutes (83 commuters, 34.0%) for males and 15 to 19 minutes (42 commuters, 24.6%) for females.
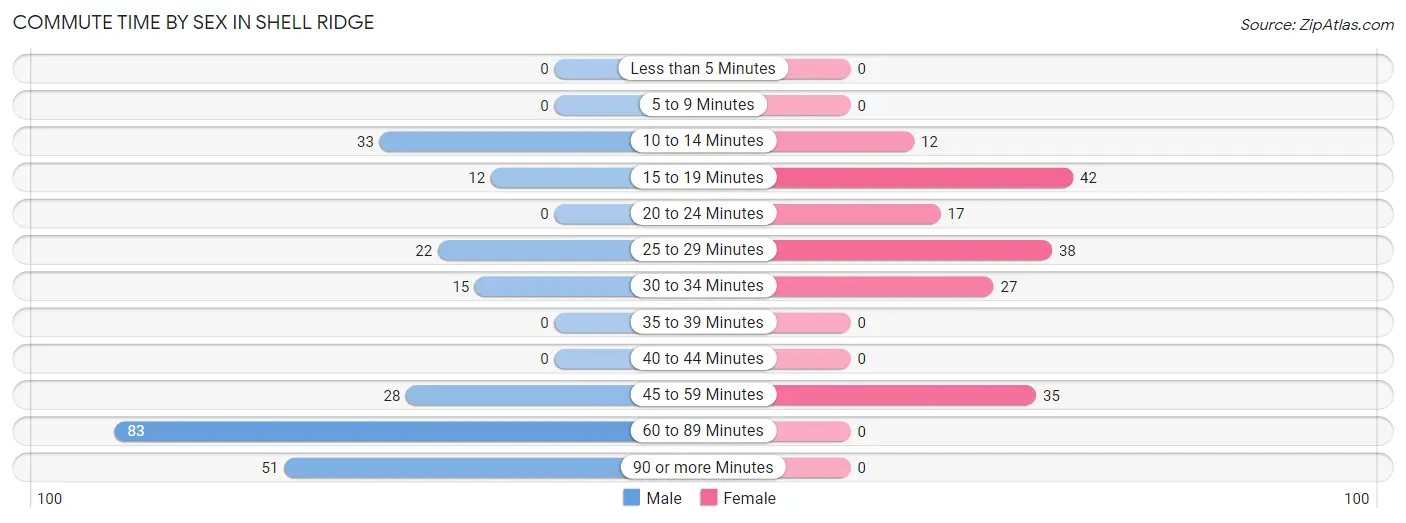
| Commute Time | Male | Female |
| Less than 5 Minutes | 0 (0.0%) | 0 (0.0%) |
| 5 to 9 Minutes | 0 (0.0%) | 0 (0.0%) |
| 10 to 14 Minutes | 33 (13.5%) | 12 (7.0%) |
| 15 to 19 Minutes | 12 (4.9%) | 42 (24.6%) |
| 20 to 24 Minutes | 0 (0.0%) | 17 (9.9%) |
| 25 to 29 Minutes | 22 (9.0%) | 38 (22.2%) |
| 30 to 34 Minutes | 15 (6.1%) | 27 (15.8%) |
| 35 to 39 Minutes | 0 (0.0%) | 0 (0.0%) |
| 40 to 44 Minutes | 0 (0.0%) | 0 (0.0%) |
| 45 to 59 Minutes | 28 (11.5%) | 35 (20.5%) |
| 60 to 89 Minutes | 83 (34.0%) | 0 (0.0%) |
| 90 or more Minutes | 51 (20.9%) | 0 (0.0%) |
Time of Departure to Work by Sex in Shell Ridge
The most frequent times of departure to work in Shell Ridge are 7:30 AM to 7:59 AM (50, 20.5%) for males and 8:00 AM to 8:29 AM (96, 56.1%) for females.
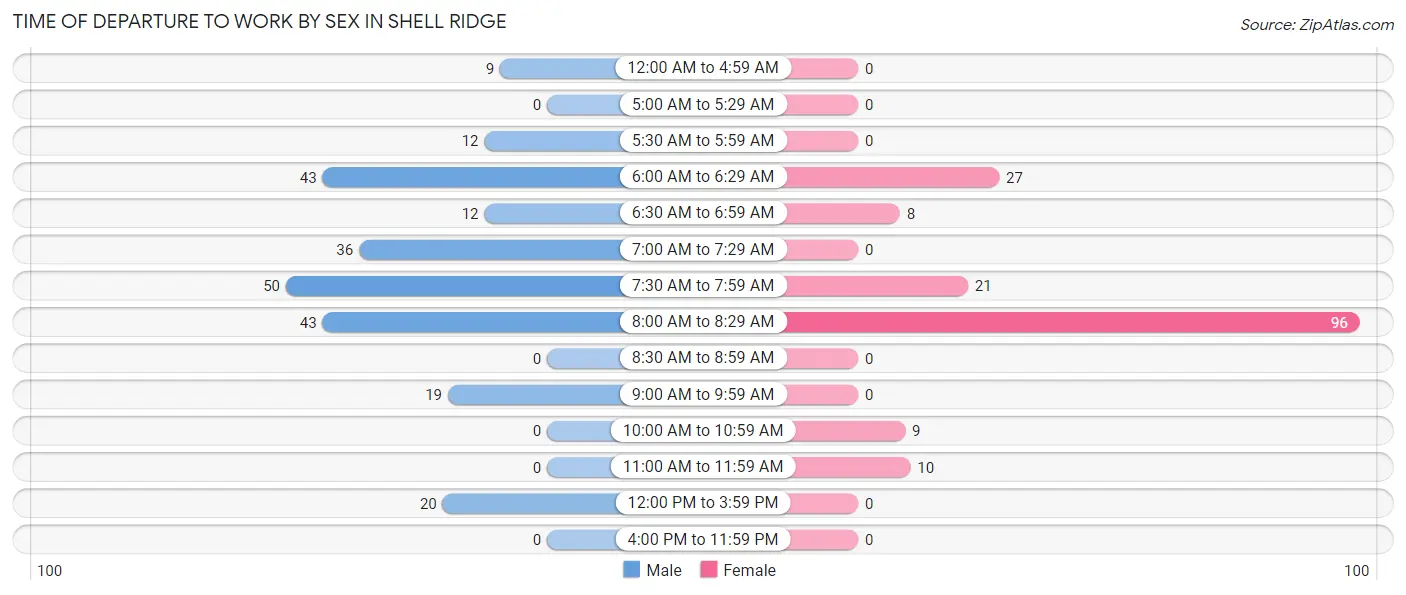
| Time of Departure | Male | Female |
| 12:00 AM to 4:59 AM | 9 (3.7%) | 0 (0.0%) |
| 5:00 AM to 5:29 AM | 0 (0.0%) | 0 (0.0%) |
| 5:30 AM to 5:59 AM | 12 (4.9%) | 0 (0.0%) |
| 6:00 AM to 6:29 AM | 43 (17.6%) | 27 (15.8%) |
| 6:30 AM to 6:59 AM | 12 (4.9%) | 8 (4.7%) |
| 7:00 AM to 7:29 AM | 36 (14.7%) | 0 (0.0%) |
| 7:30 AM to 7:59 AM | 50 (20.5%) | 21 (12.3%) |
| 8:00 AM to 8:29 AM | 43 (17.6%) | 96 (56.1%) |
| 8:30 AM to 8:59 AM | 0 (0.0%) | 0 (0.0%) |
| 9:00 AM to 9:59 AM | 19 (7.8%) | 0 (0.0%) |
| 10:00 AM to 10:59 AM | 0 (0.0%) | 9 (5.3%) |
| 11:00 AM to 11:59 AM | 0 (0.0%) | 10 (5.9%) |
| 12:00 PM to 3:59 PM | 20 (8.2%) | 0 (0.0%) |
| 4:00 PM to 11:59 PM | 0 (0.0%) | 0 (0.0%) |
| Total | 244 (100.0%) | 171 (100.0%) |
Housing Occupancy in Shell Ridge
Occupancy by Ownership in Shell Ridge
Of the total 345 dwellings in Shell Ridge, owner-occupied units account for 317 (91.9%), while renter-occupied units make up 28 (8.1%).
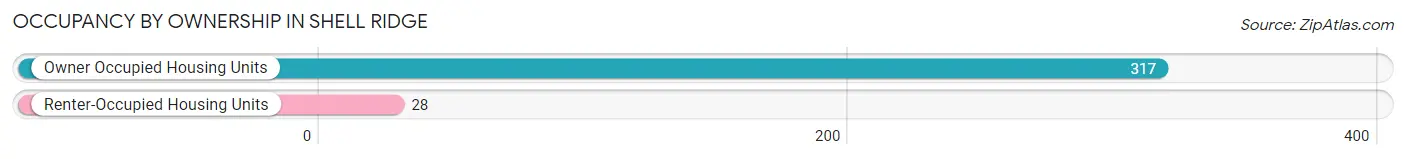
| Occupancy | # Housing Units | % Housing Units |
| Owner Occupied Housing Units | 317 | 91.9% |
| Renter-Occupied Housing Units | 28 | 8.1% |
| Total Occupied Housing Units | 345 | 100.0% |
Occupancy by Household Size in Shell Ridge
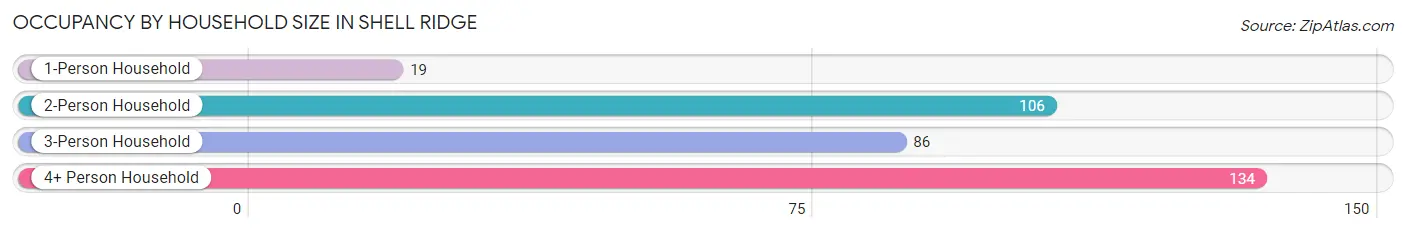
| Household Size | # Housing Units | % Housing Units |
| 1-Person Household | 19 | 5.5% |
| 2-Person Household | 106 | 30.7% |
| 3-Person Household | 86 | 24.9% |
| 4+ Person Household | 134 | 38.8% |
| Total Housing Units | 345 | 100.0% |
Occupancy by Ownership by Household Size in Shell Ridge
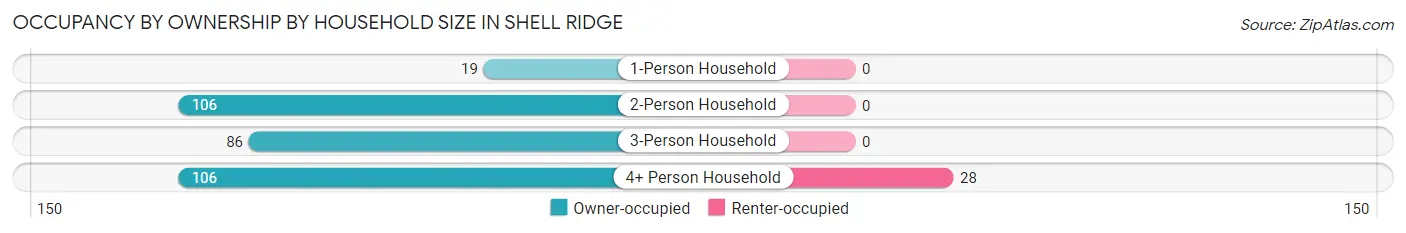
| Household Size | Owner-occupied | Renter-occupied |
| 1-Person Household | 19 (100.0%) | 0 (0.0%) |
| 2-Person Household | 106 (100.0%) | 0 (0.0%) |
| 3-Person Household | 86 (100.0%) | 0 (0.0%) |
| 4+ Person Household | 106 (79.1%) | 28 (20.9%) |
| Total Housing Units | 317 (91.9%) | 28 (8.1%) |
Occupancy by Educational Attainment in Shell Ridge
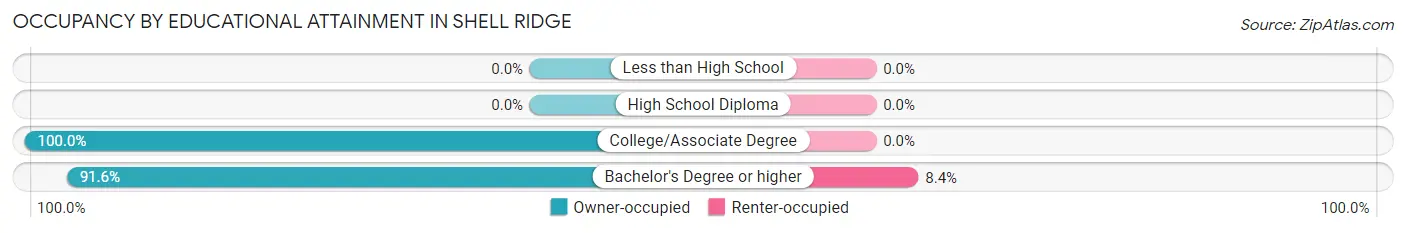
| Household Size | Owner-occupied | Renter-occupied |
| Less than High School | 0 (0.0%) | 0 (0.0%) |
| High School Diploma | 0 (0.0%) | 0 (0.0%) |
| College/Associate Degree | 10 (100.0%) | 0 (0.0%) |
| Bachelor's Degree or higher | 307 (91.6%) | 28 (8.4%) |
Occupancy by Age of Householder in Shell Ridge
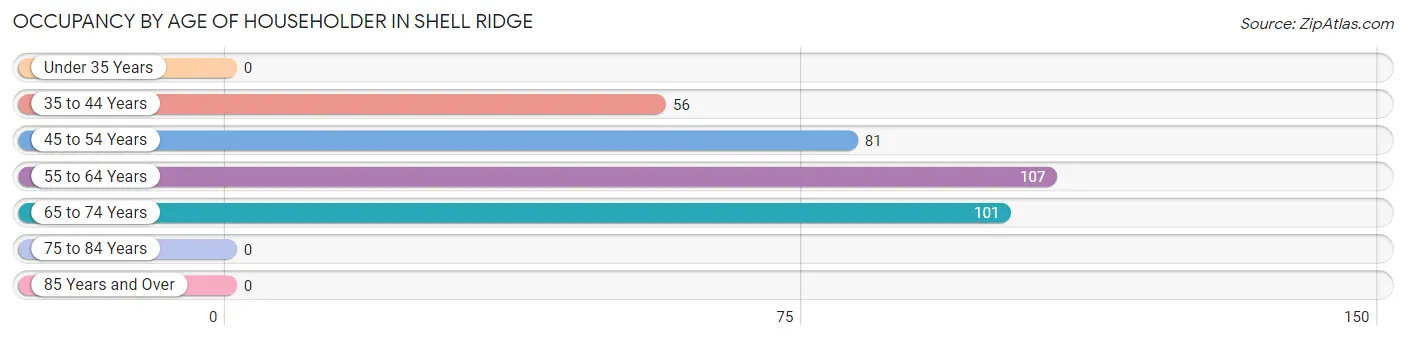
| Age Bracket | # Households | % Households |
| Under 35 Years | 0 | 0.0% |
| 35 to 44 Years | 56 | 16.2% |
| 45 to 54 Years | 81 | 23.5% |
| 55 to 64 Years | 107 | 31.0% |
| 65 to 74 Years | 101 | 29.3% |
| 75 to 84 Years | 0 | 0.0% |
| 85 Years and Over | 0 | 0.0% |
| Total | 345 | 100.0% |
Housing Finances in Shell Ridge
Median Income by Occupancy in Shell Ridge
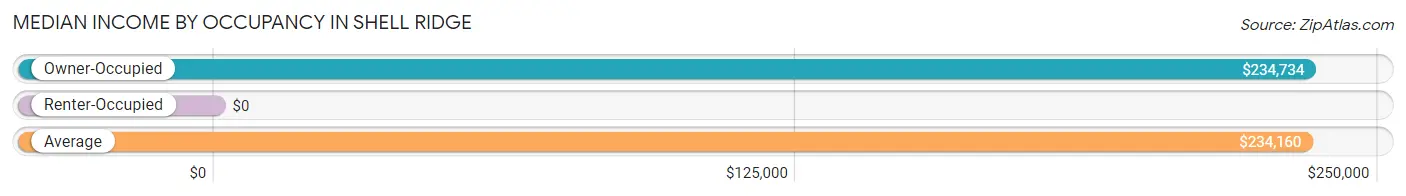
| Occupancy Type | # Households | Median Income |
| Owner-Occupied | 317 (91.9%) | $234,734 |
| Renter-Occupied | 28 (8.1%) | $0 |
| Average | 345 (100.0%) | $234,160 |
Occupancy by Householder Income Bracket in Shell Ridge
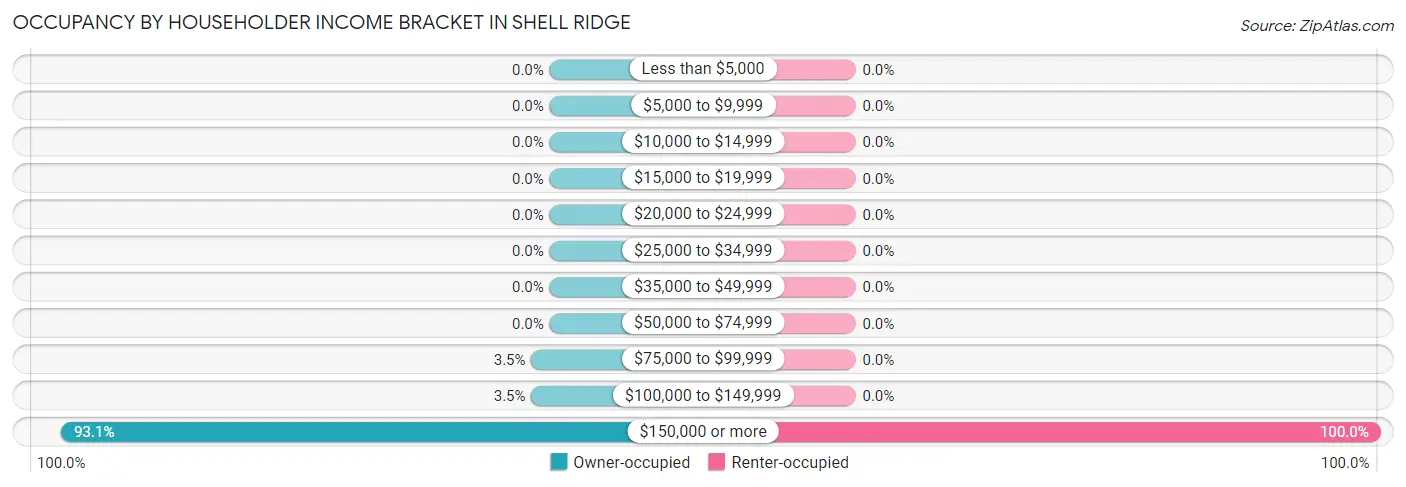
| Income Bracket | Owner-occupied | Renter-occupied |
| Less than $5,000 | 0 (0.0%) | 0 (0.0%) |
| $5,000 to $9,999 | 0 (0.0%) | 0 (0.0%) |
| $10,000 to $14,999 | 0 (0.0%) | 0 (0.0%) |
| $15,000 to $19,999 | 0 (0.0%) | 0 (0.0%) |
| $20,000 to $24,999 | 0 (0.0%) | 0 (0.0%) |
| $25,000 to $34,999 | 0 (0.0%) | 0 (0.0%) |
| $35,000 to $49,999 | 0 (0.0%) | 0 (0.0%) |
| $50,000 to $74,999 | 0 (0.0%) | 0 (0.0%) |
| $75,000 to $99,999 | 11 (3.5%) | 0 (0.0%) |
| $100,000 to $149,999 | 11 (3.5%) | 0 (0.0%) |
| $150,000 or more | 295 (93.1%) | 28 (100.0%) |
| Total | 317 (100.0%) | 28 (100.0%) |
Monthly Housing Cost Tiers in Shell Ridge
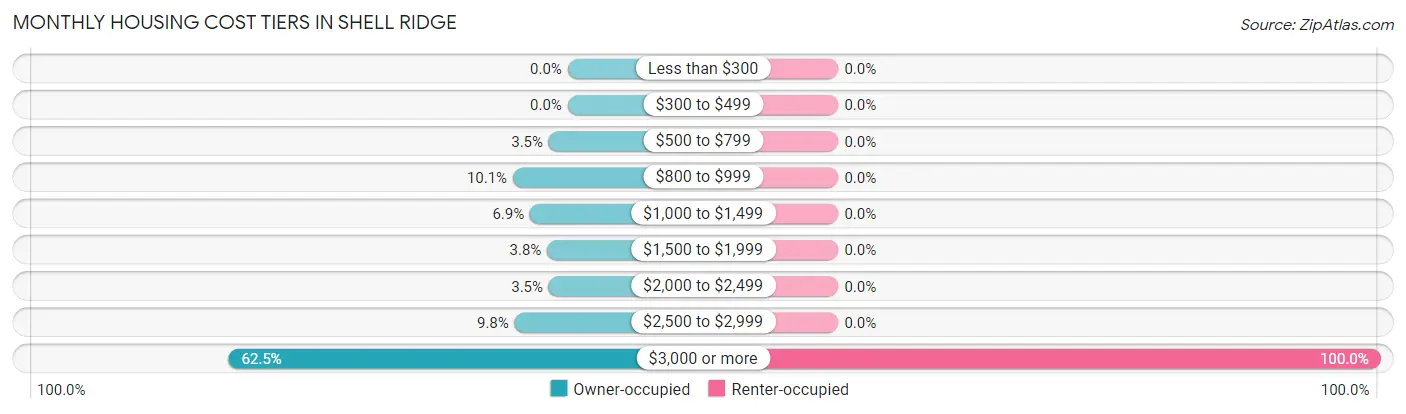
| Monthly Cost | Owner-occupied | Renter-occupied |
| Less than $300 | 0 (0.0%) | 0 (0.0%) |
| $300 to $499 | 0 (0.0%) | 0 (0.0%) |
| $500 to $799 | 11 (3.5%) | 0 (0.0%) |
| $800 to $999 | 32 (10.1%) | 0 (0.0%) |
| $1,000 to $1,499 | 22 (6.9%) | 0 (0.0%) |
| $1,500 to $1,999 | 12 (3.8%) | 0 (0.0%) |
| $2,000 to $2,499 | 11 (3.5%) | 0 (0.0%) |
| $2,500 to $2,999 | 31 (9.8%) | 0 (0.0%) |
| $3,000 or more | 198 (62.5%) | 28 (100.0%) |
| Total | 317 (100.0%) | 28 (100.0%) |
Physical Housing Characteristics in Shell Ridge
Housing Structures in Shell Ridge
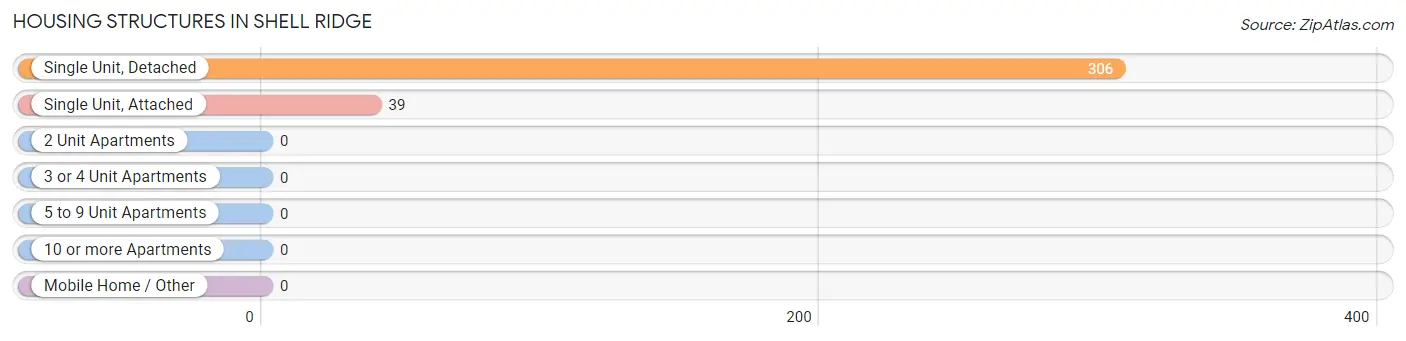
| Structure Type | # Housing Units | % Housing Units |
| Single Unit, Detached | 306 | 88.7% |
| Single Unit, Attached | 39 | 11.3% |
| 2 Unit Apartments | 0 | 0.0% |
| 3 or 4 Unit Apartments | 0 | 0.0% |
| 5 to 9 Unit Apartments | 0 | 0.0% |
| 10 or more Apartments | 0 | 0.0% |
| Mobile Home / Other | 0 | 0.0% |
| Total | 345 | 100.0% |
Housing Structures by Occupancy in Shell Ridge
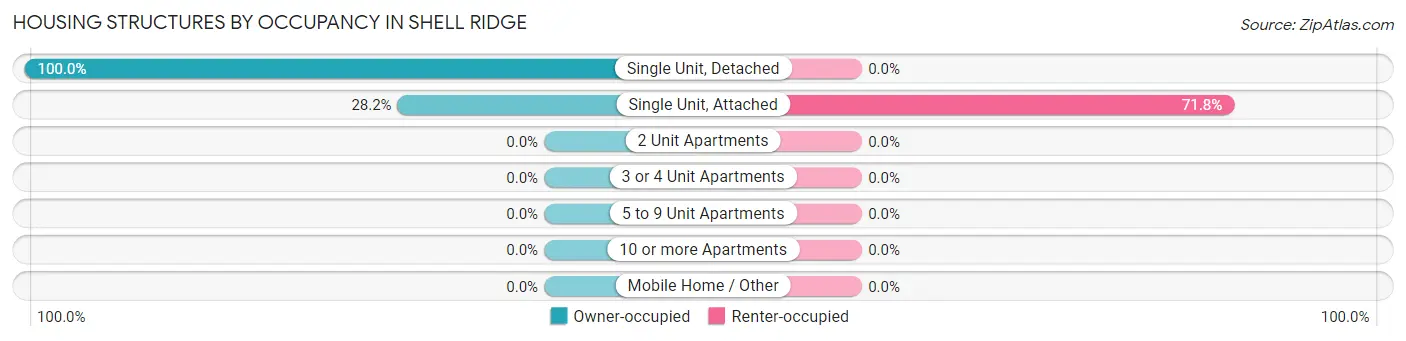
| Structure Type | Owner-occupied | Renter-occupied |
| Single Unit, Detached | 306 (100.0%) | 0 (0.0%) |
| Single Unit, Attached | 11 (28.2%) | 28 (71.8%) |
| 2 Unit Apartments | 0 (0.0%) | 0 (0.0%) |
| 3 or 4 Unit Apartments | 0 (0.0%) | 0 (0.0%) |
| 5 to 9 Unit Apartments | 0 (0.0%) | 0 (0.0%) |
| 10 or more Apartments | 0 (0.0%) | 0 (0.0%) |
| Mobile Home / Other | 0 (0.0%) | 0 (0.0%) |
| Total | 317 (91.9%) | 28 (8.1%) |
Housing Structures by Number of Rooms in Shell Ridge
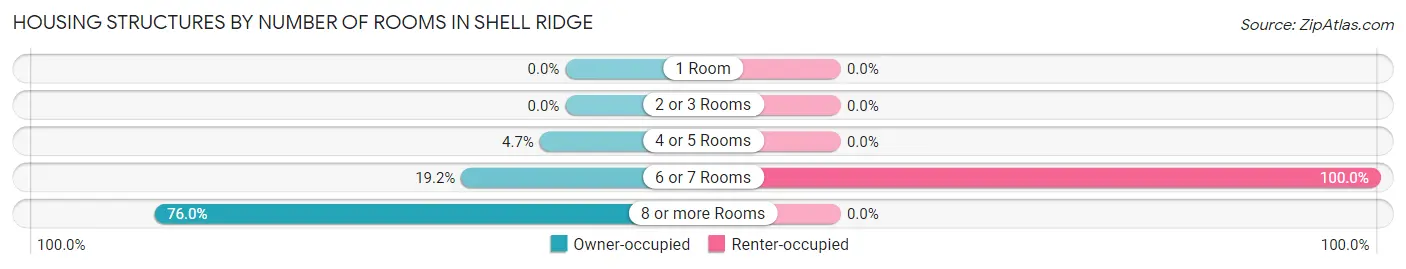
| Number of Rooms | Owner-occupied | Renter-occupied |
| 1 Room | 0 (0.0%) | 0 (0.0%) |
| 2 or 3 Rooms | 0 (0.0%) | 0 (0.0%) |
| 4 or 5 Rooms | 15 (4.7%) | 0 (0.0%) |
| 6 or 7 Rooms | 61 (19.2%) | 28 (100.0%) |
| 8 or more Rooms | 241 (76.0%) | 0 (0.0%) |
| Total | 317 (100.0%) | 28 (100.0%) |
Housing Structure by Heating Type in Shell Ridge
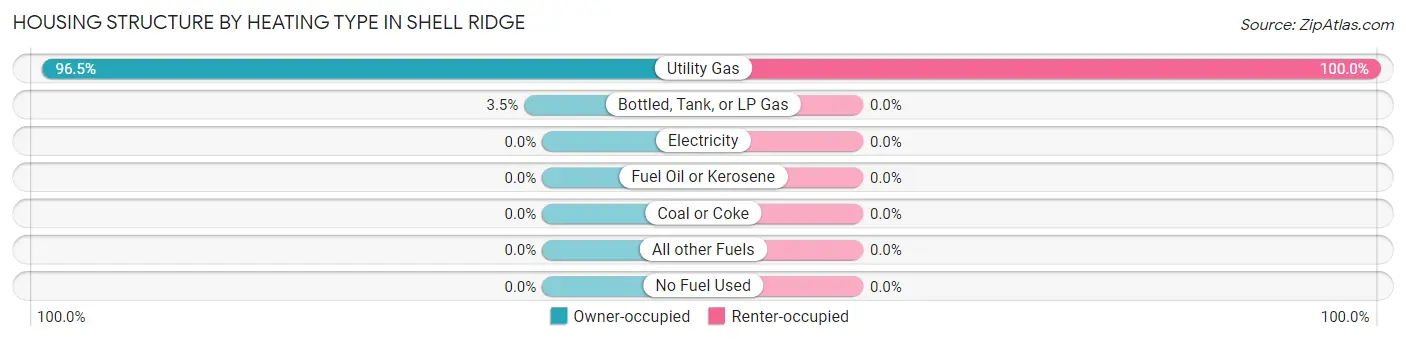
| Heating Type | Owner-occupied | Renter-occupied |
| Utility Gas | 306 (96.5%) | 28 (100.0%) |
| Bottled, Tank, or LP Gas | 11 (3.5%) | 0 (0.0%) |
| Electricity | 0 (0.0%) | 0 (0.0%) |
| Fuel Oil or Kerosene | 0 (0.0%) | 0 (0.0%) |
| Coal or Coke | 0 (0.0%) | 0 (0.0%) |
| All other Fuels | 0 (0.0%) | 0 (0.0%) |
| No Fuel Used | 0 (0.0%) | 0 (0.0%) |
| Total | 317 (100.0%) | 28 (100.0%) |
Household Vehicle Usage in Shell Ridge
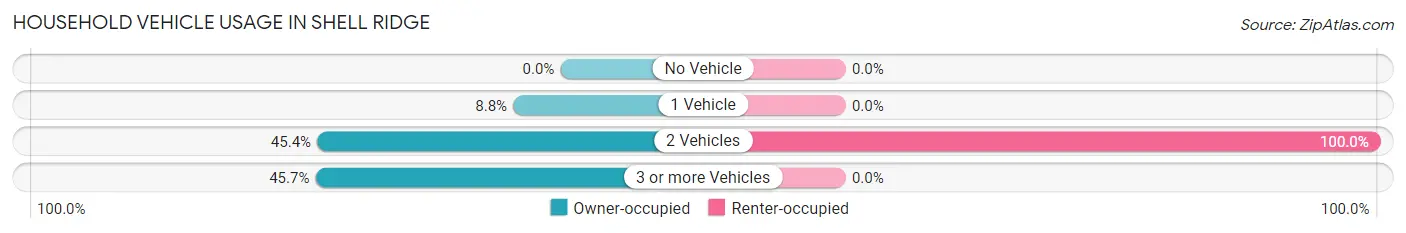
| Vehicles per Household | Owner-occupied | Renter-occupied |
| No Vehicle | 0 (0.0%) | 0 (0.0%) |
| 1 Vehicle | 28 (8.8%) | 0 (0.0%) |
| 2 Vehicles | 144 (45.4%) | 28 (100.0%) |
| 3 or more Vehicles | 145 (45.7%) | 0 (0.0%) |
| Total | 317 (100.0%) | 28 (100.0%) |
Real Estate & Mortgages in Shell Ridge
Real Estate and Mortgage Overview in Shell Ridge
| Characteristic | Without Mortgage | With Mortgage |
| Housing Units | 66 | 251 |
| Median Property Value | - | - |
| Median Household Income | $194,219 | $240 |
| Monthly Housing Costs | $969 | $198 |
| Real Estate Taxes | - | - |
Property Value by Mortgage Status in Shell Ridge
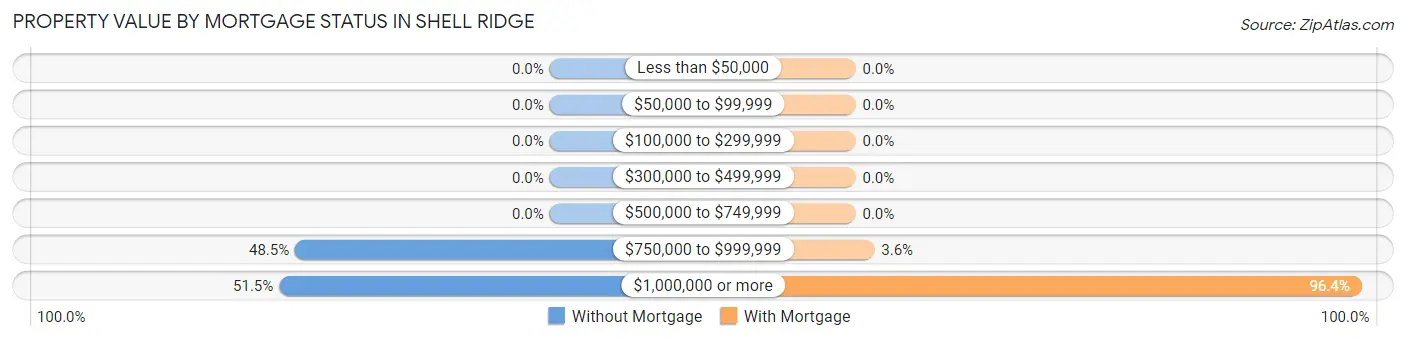
| Property Value | Without Mortgage | With Mortgage |
| Less than $50,000 | 0 (0.0%) | 0 (0.0%) |
| $50,000 to $99,999 | 0 (0.0%) | 0 (0.0%) |
| $100,000 to $299,999 | 0 (0.0%) | 0 (0.0%) |
| $300,000 to $499,999 | 0 (0.0%) | 0 (0.0%) |
| $500,000 to $749,999 | 0 (0.0%) | 0 (0.0%) |
| $750,000 to $999,999 | 32 (48.5%) | 9 (3.6%) |
| $1,000,000 or more | 34 (51.5%) | 242 (96.4%) |
| Total | 66 (100.0%) | 251 (100.0%) |
Household Income by Mortgage Status in Shell Ridge
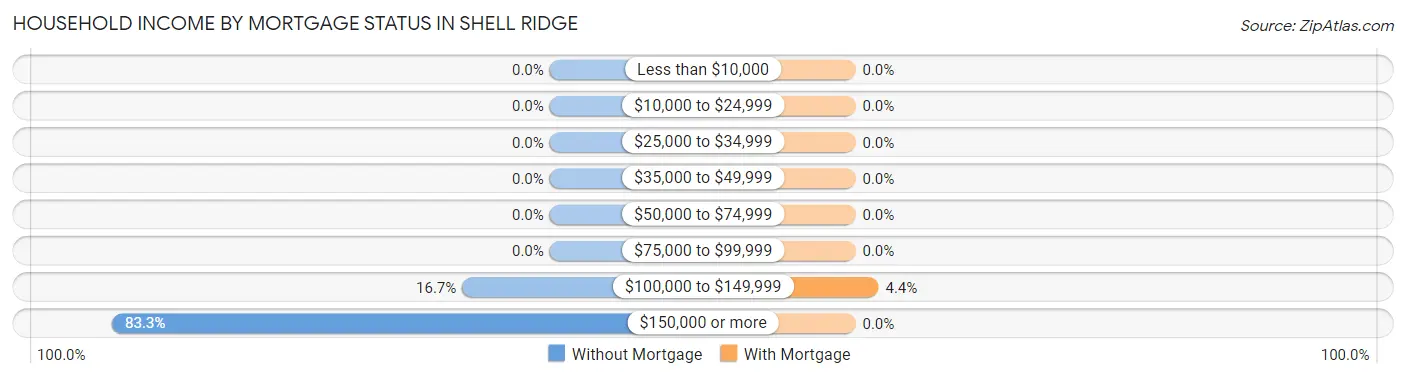
| Household Income | Without Mortgage | With Mortgage |
| Less than $10,000 | 0 (0.0%) | 0 (0.0%) |
| $10,000 to $24,999 | 0 (0.0%) | 0 (0.0%) |
| $25,000 to $34,999 | 0 (0.0%) | 0 (0.0%) |
| $35,000 to $49,999 | 0 (0.0%) | 0 (0.0%) |
| $50,000 to $74,999 | 0 (0.0%) | 0 (0.0%) |
| $75,000 to $99,999 | 0 (0.0%) | 0 (0.0%) |
| $100,000 to $149,999 | 11 (16.7%) | 11 (4.4%) |
| $150,000 or more | 55 (83.3%) | 0 (0.0%) |
| Total | 66 (100.0%) | 251 (100.0%) |
Property Value to Household Income Ratio in Shell Ridge
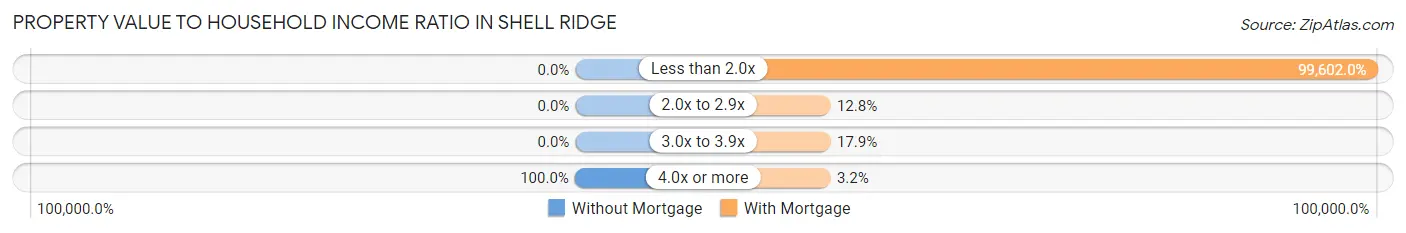
| Value-to-Income Ratio | Without Mortgage | With Mortgage |
| Less than 2.0x | 0 (0.0%) | 250,001 (99,602.0%) |
| 2.0x to 2.9x | 0 (0.0%) | 32 (12.8%) |
| 3.0x to 3.9x | 0 (0.0%) | 45 (17.9%) |
| 4.0x or more | 66 (100.0%) | 8 (3.2%) |
| Total | 66 (100.0%) | 251 (100.0%) |
Real Estate Taxes by Mortgage Status in Shell Ridge
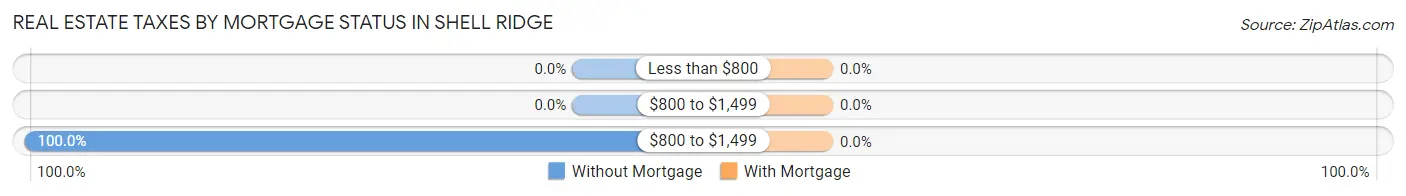
| Property Taxes | Without Mortgage | With Mortgage |
| Less than $800 | 0 (0.0%) | 0 (0.0%) |
| $800 to $1,499 | 0 (0.0%) | 0 (0.0%) |
| $800 to $1,499 | 66 (100.0%) | 0 (0.0%) |
| Total | 66 (100.0%) | 251 (100.0%) |
Health & Disability in Shell Ridge
Health Insurance Coverage by Age in Shell Ridge
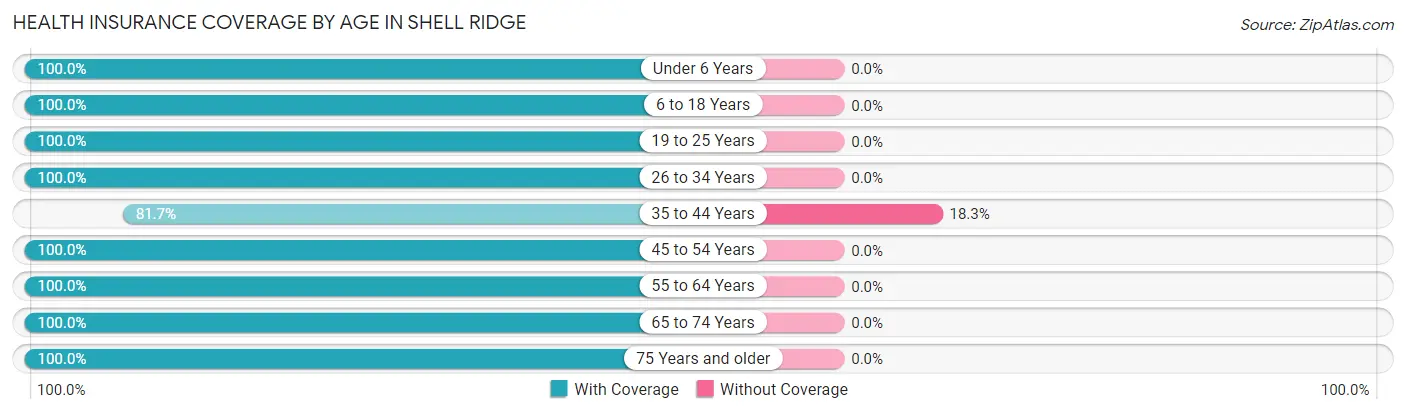
| Age Bracket | With Coverage | Without Coverage |
| Under 6 Years | 51 (100.0%) | 0 (0.0%) |
| 6 to 18 Years | 202 (100.0%) | 0 (0.0%) |
| 19 to 25 Years | 52 (100.0%) | 0 (0.0%) |
| 26 to 34 Years | 49 (100.0%) | 0 (0.0%) |
| 35 to 44 Years | 156 (81.7%) | 35 (18.3%) |
| 45 to 54 Years | 138 (100.0%) | 0 (0.0%) |
| 55 to 64 Years | 213 (100.0%) | 0 (0.0%) |
| 65 to 74 Years | 133 (100.0%) | 0 (0.0%) |
| 75 Years and older | 12 (100.0%) | 0 (0.0%) |
| Total | 1,006 (96.6%) | 35 (3.4%) |
Health Insurance Coverage by Citizenship Status in Shell Ridge
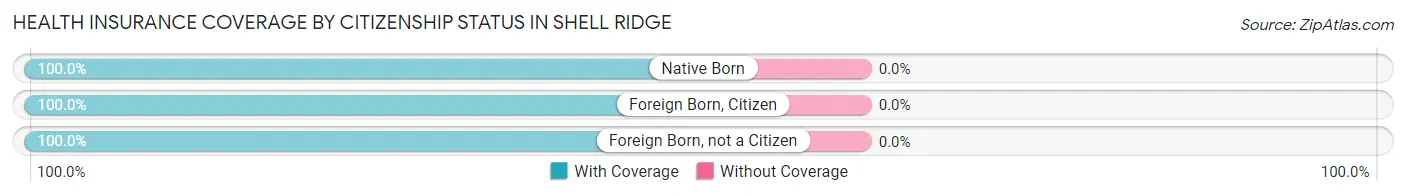
| Citizenship Status | With Coverage | Without Coverage |
| Native Born | 51 (100.0%) | 0 (0.0%) |
| Foreign Born, Citizen | 202 (100.0%) | 0 (0.0%) |
| Foreign Born, not a Citizen | 52 (100.0%) | 0 (0.0%) |
Health Insurance Coverage by Household Income in Shell Ridge
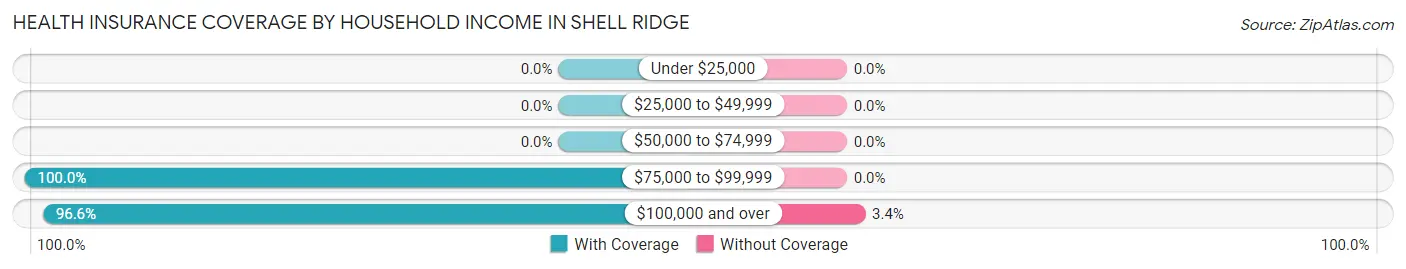
| Household Income | With Coverage | Without Coverage |
| Under $25,000 | 0 (0.0%) | 0 (0.0%) |
| $25,000 to $49,999 | 0 (0.0%) | 0 (0.0%) |
| $50,000 to $74,999 | 0 (0.0%) | 0 (0.0%) |
| $75,000 to $99,999 | 21 (100.0%) | 0 (0.0%) |
| $100,000 and over | 985 (96.6%) | 35 (3.4%) |
Public vs Private Health Insurance Coverage by Age in Shell Ridge
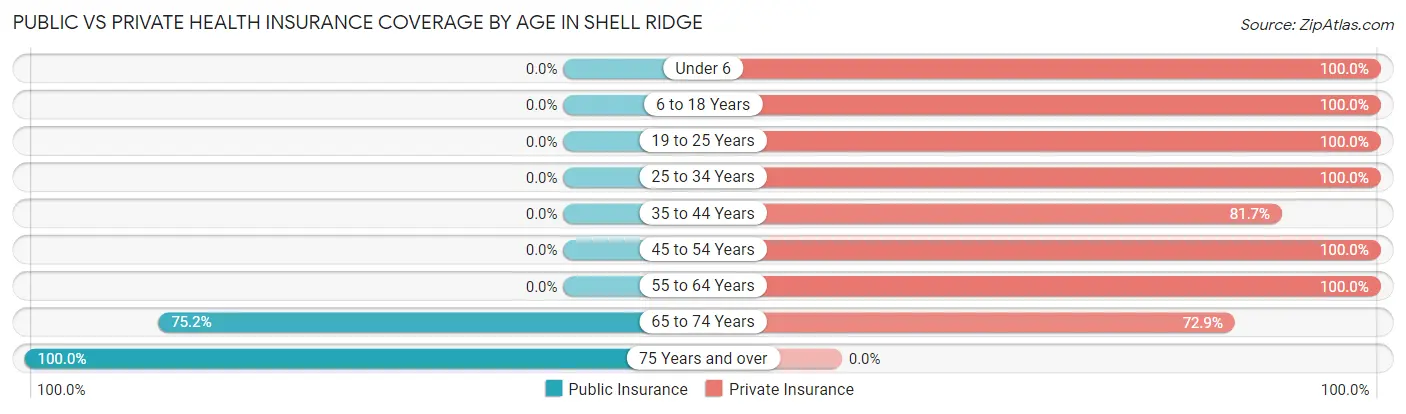
| Age Bracket | Public Insurance | Private Insurance |
| Under 6 | 0 (0.0%) | 51 (100.0%) |
| 6 to 18 Years | 0 (0.0%) | 202 (100.0%) |
| 19 to 25 Years | 0 (0.0%) | 52 (100.0%) |
| 25 to 34 Years | 0 (0.0%) | 49 (100.0%) |
| 35 to 44 Years | 0 (0.0%) | 156 (81.7%) |
| 45 to 54 Years | 0 (0.0%) | 138 (100.0%) |
| 55 to 64 Years | 0 (0.0%) | 213 (100.0%) |
| 65 to 74 Years | 100 (75.2%) | 97 (72.9%) |
| 75 Years and over | 12 (100.0%) | 0 (0.0%) |
| Total | 112 (10.8%) | 958 (92.0%) |
Disability Status by Sex by Age in Shell Ridge
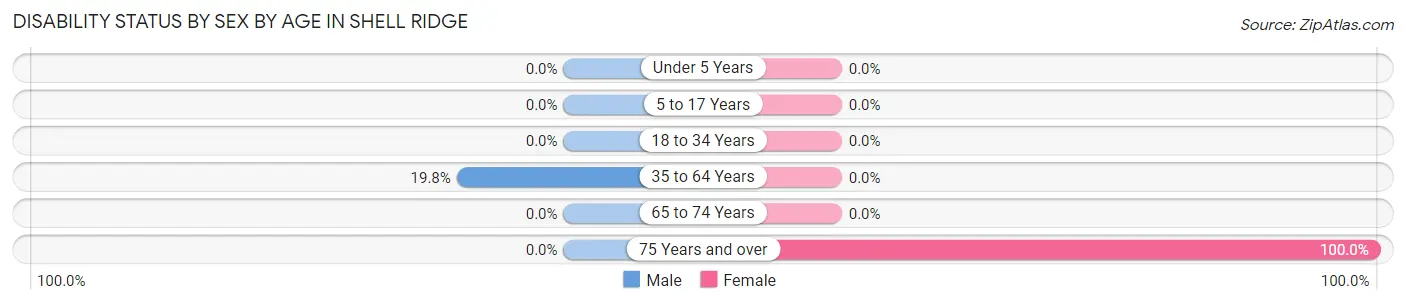
| Age Bracket | Male | Female |
| Under 5 Years | 0 (0.0%) | 0 (0.0%) |
| 5 to 17 Years | 0 (0.0%) | 0 (0.0%) |
| 18 to 34 Years | 0 (0.0%) | 0 (0.0%) |
| 35 to 64 Years | 42 (19.8%) | 0 (0.0%) |
| 65 to 74 Years | 0 (0.0%) | 0 (0.0%) |
| 75 Years and over | 0 (0.0%) | 12 (100.0%) |
Disability Class by Sex by Age in Shell Ridge
Disability Class: Hearing Difficulty
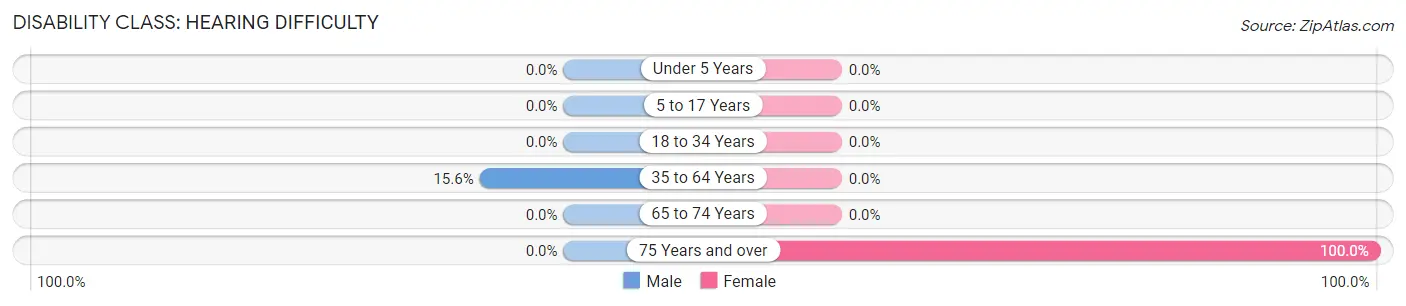
| Age Bracket | Male | Female |
| Under 5 Years | 0 (0.0%) | 0 (0.0%) |
| 5 to 17 Years | 0 (0.0%) | 0 (0.0%) |
| 18 to 34 Years | 0 (0.0%) | 0 (0.0%) |
| 35 to 64 Years | 33 (15.6%) | 0 (0.0%) |
| 65 to 74 Years | 0 (0.0%) | 0 (0.0%) |
| 75 Years and over | 0 (0.0%) | 12 (100.0%) |
Disability Class: Vision Difficulty
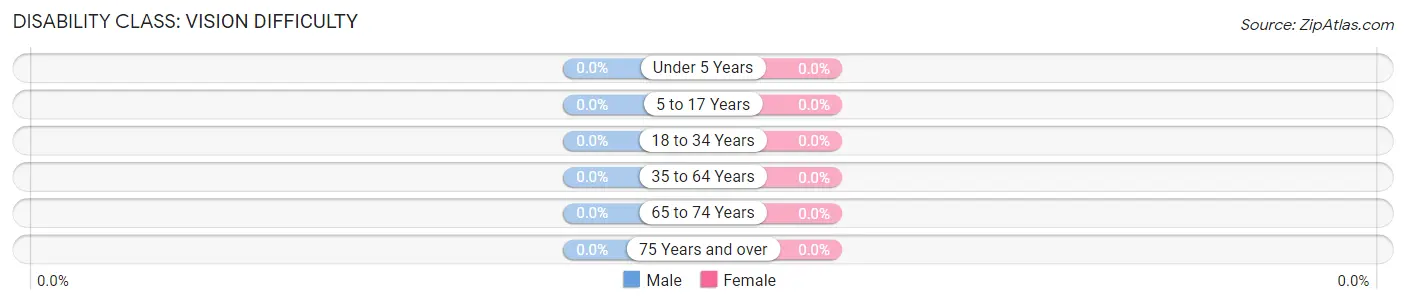
| Age Bracket | Male | Female |
| Under 5 Years | 0 (0.0%) | 0 (0.0%) |
| 5 to 17 Years | 0 (0.0%) | 0 (0.0%) |
| 18 to 34 Years | 0 (0.0%) | 0 (0.0%) |
| 35 to 64 Years | 0 (0.0%) | 0 (0.0%) |
| 65 to 74 Years | 0 (0.0%) | 0 (0.0%) |
| 75 Years and over | 0 (0.0%) | 0 (0.0%) |
Disability Class: Cognitive Difficulty
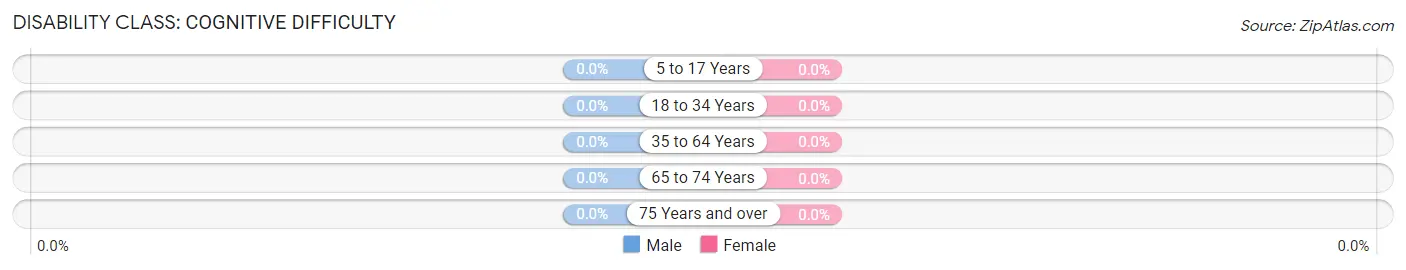
| Age Bracket | Male | Female |
| 5 to 17 Years | 0 (0.0%) | 0 (0.0%) |
| 18 to 34 Years | 0 (0.0%) | 0 (0.0%) |
| 35 to 64 Years | 0 (0.0%) | 0 (0.0%) |
| 65 to 74 Years | 0 (0.0%) | 0 (0.0%) |
| 75 Years and over | 0 (0.0%) | 0 (0.0%) |
Disability Class: Ambulatory Difficulty
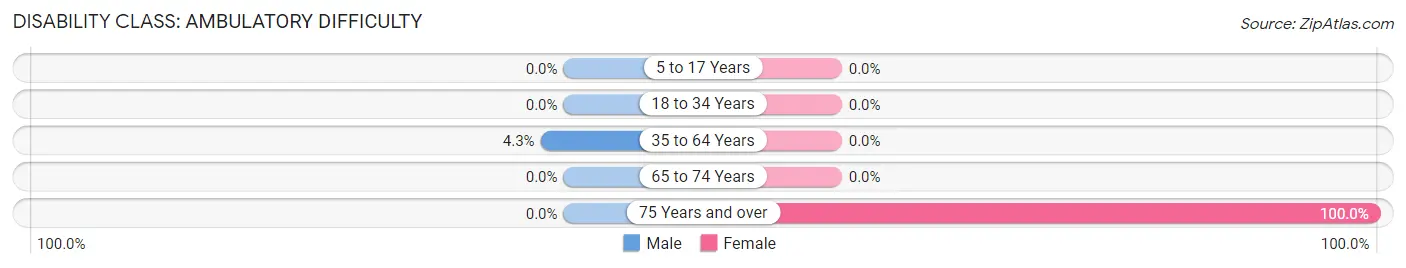
| Age Bracket | Male | Female |
| 5 to 17 Years | 0 (0.0%) | 0 (0.0%) |
| 18 to 34 Years | 0 (0.0%) | 0 (0.0%) |
| 35 to 64 Years | 9 (4.3%) | 0 (0.0%) |
| 65 to 74 Years | 0 (0.0%) | 0 (0.0%) |
| 75 Years and over | 0 (0.0%) | 12 (100.0%) |
Disability Class: Self-Care Difficulty
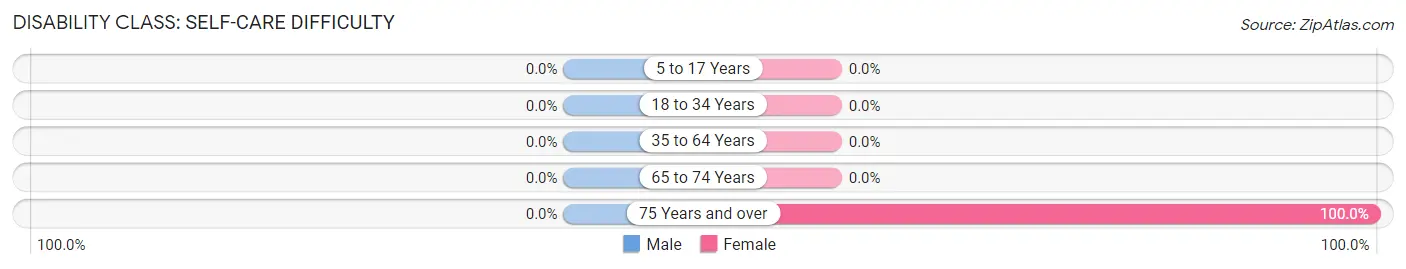
| Age Bracket | Male | Female |
| 5 to 17 Years | 0 (0.0%) | 0 (0.0%) |
| 18 to 34 Years | 0 (0.0%) | 0 (0.0%) |
| 35 to 64 Years | 0 (0.0%) | 0 (0.0%) |
| 65 to 74 Years | 0 (0.0%) | 0 (0.0%) |
| 75 Years and over | 0 (0.0%) | 12 (100.0%) |
Technology Access in Shell Ridge
Computing Device Access in Shell Ridge
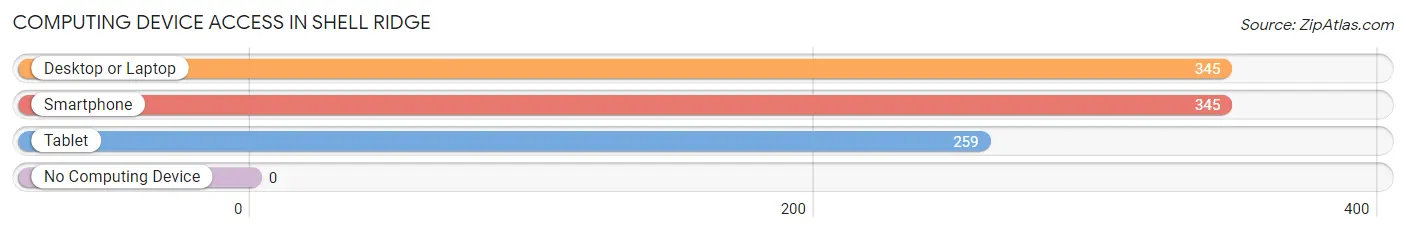
| Device Type | # Households | % Households |
| Desktop or Laptop | 345 | 100.0% |
| Smartphone | 345 | 100.0% |
| Tablet | 259 | 75.1% |
| No Computing Device | 0 | 0.0% |
| Total | 345 | 100.0% |
Internet Access in Shell Ridge
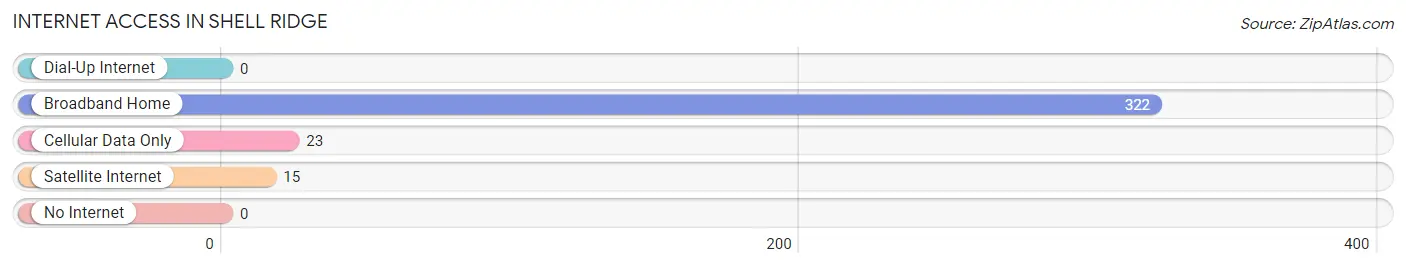
| Internet Type | # Households | % Households |
| Dial-Up Internet | 0 | 0.0% |
| Broadband Home | 322 | 93.3% |
| Cellular Data Only | 23 | 6.7% |
| Satellite Internet | 15 | 4.3% |
| No Internet | 0 | 0.0% |
| Total | 345 | 100.0% |
Shell Ridge Summary
Shell Ridge is a small unincorporated community located in Contra Costa County, California. It is situated in the foothills of the Diablo Range, approximately 25 miles east of San Francisco. The community is bordered by the cities of Walnut Creek, Pleasant Hill, and Concord. Shell Ridge is home to a variety of wildlife, including deer, coyotes, and mountain lions.
History
Shell Ridge has a long and varied history. The area was originally inhabited by the Ohlone people, who lived in the area for thousands of years before the arrival of Europeans. The first Europeans to settle in the area were Spanish missionaries, who established a mission in nearby Walnut Creek in 1797. The area was later settled by American pioneers in the mid-1800s.
The area was originally known as Shell Mound, named after the large shell mounds that were found in the area. The name was later changed to Shell Ridge in the early 1900s. The area was primarily used for ranching and farming until the 1950s, when the population began to grow rapidly.
Geography
Shell Ridge is located in the foothills of the Diablo Range, approximately 25 miles east of San Francisco. The area is characterized by rolling hills and valleys, with elevations ranging from 500 to 1,500 feet. The area is home to a variety of wildlife, including deer, coyotes, and mountain lions.
The climate in Shell Ridge is mild and Mediterranean, with warm summers and cool, wet winters. The average annual temperature is around 60 degrees Fahrenheit, with an average annual rainfall of around 20 inches.
Economy
The economy of Shell Ridge is primarily based on agriculture and tourism. The area is home to several wineries, as well as a variety of small businesses. The area is also home to a number of technology companies, including Oracle and Chevron.
Demographics
As of the 2010 census, the population of Shell Ridge was 2,845. The population is primarily white (83.3%), with a small Hispanic population (7.2%). The median household income is $90,000, and the median home value is $735,000. The area is served by the Walnut Creek School District.
Shell Ridge is a small, rural community with a rich history and a diverse population. The area is home to a variety of wildlife, and is a popular destination for tourists and outdoor enthusiasts. The economy is primarily based on agriculture and tourism, and the area is home to a number of technology companies. The population is primarily white, with a small Hispanic population. The median household income is $90,000, and the median home value is $735,000.
Common Questions
What is Per Capita Income in Shell Ridge?
Per Capita income in Shell Ridge is $159,039.
What is the Median Family Income in Shell Ridge?
Median Family Income in Shell Ridge is $234,057.
What is the Median Household income in Shell Ridge?
Median Household Income in Shell Ridge is $234,160.
What is Income or Wage Gap in Shell Ridge?
Income or Wage Gap in Shell Ridge is 58.2%.
Women in Shell Ridge earn 41.8 cents for every dollar earned by a man.
What is Inequality or Gini Index in Shell Ridge?
Inequality or Gini Index in Shell Ridge is 0.46.
What is the Total Population of Shell Ridge?
Total Population of Shell Ridge is 1,041.
What is the Total Male Population of Shell Ridge?
Total Male Population of Shell Ridge is 424.
What is the Total Female Population of Shell Ridge?
Total Female Population of Shell Ridge is 617.
What is the Ratio of Males per 100 Females in Shell Ridge?
There are 68.72 Males per 100 Females in Shell Ridge.
What is the Ratio of Females per 100 Males in Shell Ridge?
There are 145.52 Females per 100 Males in Shell Ridge.
What is the Median Population Age in Shell Ridge?
Median Population Age in Shell Ridge is 44.1 Years.
What is the Average Family Size in Shell Ridge
Average Family Size in Shell Ridge is 3.0 People.
What is the Average Household Size in Shell Ridge
Average Household Size in Shell Ridge is 3.0 People.
How Large is the Labor Force in Shell Ridge?
There are 601 People in the Labor Forcein in Shell Ridge.
What is the Percentage of People in the Labor Force in Shell Ridge?
71.8% of People are in the Labor Force in Shell Ridge.
What is the Unemployment Rate in Shell Ridge?
Unemployment Rate in Shell Ridge is 1.8%.