Grandview, TX Map & Demographics
Grandview Map
Grandview Overview
$29,814
PER CAPITA INCOME
$98,000
AVG FAMILY INCOME
$75,724
AVG HOUSEHOLD INCOME
46.0%
WAGE / INCOME GAP [ % ]
54.0¢/ $1
WAGE / INCOME GAP [ $ ]
0.43
INEQUALITY / GINI INDEX
1,978
TOTAL POPULATION
939
MALE POPULATION
1,039
FEMALE POPULATION
90.38
MALES / 100 FEMALES
110.65
FEMALES / 100 MALES
33.0
MEDIAN AGE
3.4
AVG FAMILY SIZE
2.8
AVG HOUSEHOLD SIZE
890
LABOR FORCE [ PEOPLE ]
64.0%
PERCENT IN LABOR FORCE
1.6%
UNEMPLOYMENT RATE
Grandview Zip Codes
Grandview Area Codes
Income in Grandview
Income Overview in Grandview
Per Capita Income in Grandview is $29,814, while median incomes of families and households are $98,000 and $75,724 respectively.
| Characteristic | Number | Measure |
| Per Capita Income | 1,978 | $29,814 |
| Median Family Income | 466 | $98,000 |
| Mean Family Income | 466 | $104,662 |
| Median Household Income | 671 | $75,724 |
| Mean Household Income | 671 | $85,298 |
| Income Deficit | 466 | $0 |
| Wage / Income Gap (%) | 1,978 | 45.96% |
| Wage / Income Gap ($) | 1,978 | 54.04¢ per $1 |
| Gini / Inequality Index | 1,978 | 0.43 |
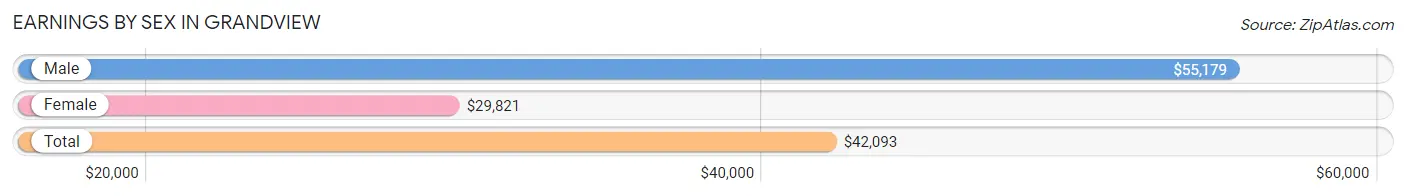
Earnings by Sex in Grandview
Average Earnings in Grandview are $42,093, $55,179 for men and $29,821 for women, a difference of 46.0%.
| Sex | Number | Average Earnings |
| Male | 477 (53.5%) | $55,179 |
| Female | 415 (46.5%) | $29,821 |
| Total | 892 (100.0%) | $42,093 |
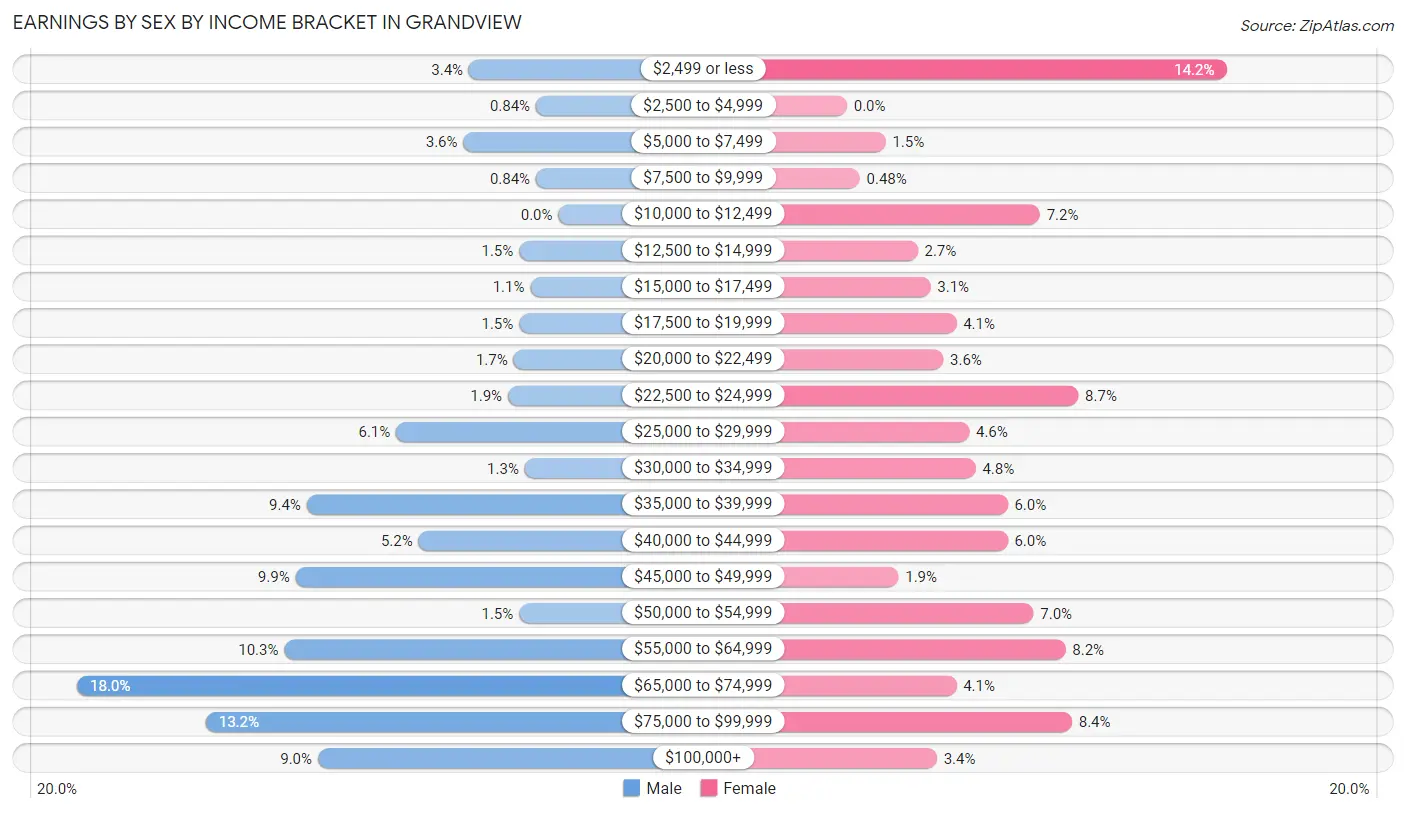
Earnings by Sex by Income Bracket in Grandview
The most common earnings brackets in Grandview are $65,000 to $74,999 for men (86 | 18.0%) and $2,499 or less for women (59 | 14.2%).
| Income | Male | Female |
| $2,499 or less | 16 (3.4%) | 59 (14.2%) |
| $2,500 to $4,999 | 4 (0.8%) | 0 (0.0%) |
| $5,000 to $7,499 | 17 (3.6%) | 6 (1.5%) |
| $7,500 to $9,999 | 4 (0.8%) | 2 (0.5%) |
| $10,000 to $12,499 | 0 (0.0%) | 30 (7.2%) |
| $12,500 to $14,999 | 7 (1.5%) | 11 (2.6%) |
| $15,000 to $17,499 | 5 (1.1%) | 13 (3.1%) |
| $17,500 to $19,999 | 7 (1.5%) | 17 (4.1%) |
| $20,000 to $22,499 | 8 (1.7%) | 15 (3.6%) |
| $22,500 to $24,999 | 9 (1.9%) | 36 (8.7%) |
| $25,000 to $29,999 | 29 (6.1%) | 19 (4.6%) |
| $30,000 to $34,999 | 6 (1.3%) | 20 (4.8%) |
| $35,000 to $39,999 | 45 (9.4%) | 25 (6.0%) |
| $40,000 to $44,999 | 25 (5.2%) | 25 (6.0%) |
| $45,000 to $49,999 | 47 (9.9%) | 8 (1.9%) |
| $50,000 to $54,999 | 7 (1.5%) | 29 (7.0%) |
| $55,000 to $64,999 | 49 (10.3%) | 34 (8.2%) |
| $65,000 to $74,999 | 86 (18.0%) | 17 (4.1%) |
| $75,000 to $99,999 | 63 (13.2%) | 35 (8.4%) |
| $100,000+ | 43 (9.0%) | 14 (3.4%) |
| Total | 477 (100.0%) | 415 (100.0%) |
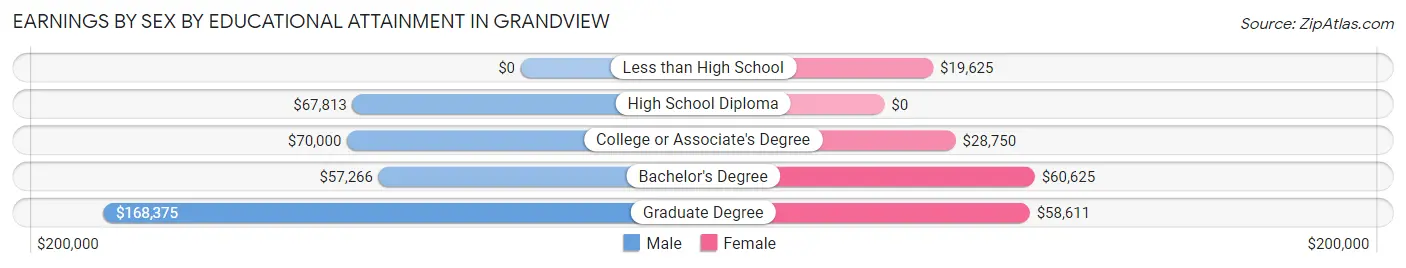
Earnings by Sex by Educational Attainment in Grandview
Average earnings in Grandview are $56,964 for men and $33,542 for women, a difference of 41.1%. Men with an educational attainment of graduate degree enjoy the highest average annual earnings of $168,375, while those with bachelor's degree education earn the least with $57,266. Women with an educational attainment of bachelor's degree earn the most with the average annual earnings of $60,625, while those with less than high school education have the smallest earnings of $19,625.
| Educational Attainment | Male Income | Female Income |
| Less than High School | - | - |
| High School Diploma | $67,813 | $0 |
| College or Associate's Degree | $70,000 | $28,750 |
| Bachelor's Degree | $57,266 | $60,625 |
| Graduate Degree | $168,375 | $58,611 |
| Total | $56,964 | $33,542 |
Family Income in Grandview
Family Income Brackets in Grandview
According to the Grandview family income data, there are 127 families falling into the $100,000 to $149,999 income range, which is the most common income bracket and makes up 27.3% of all families.
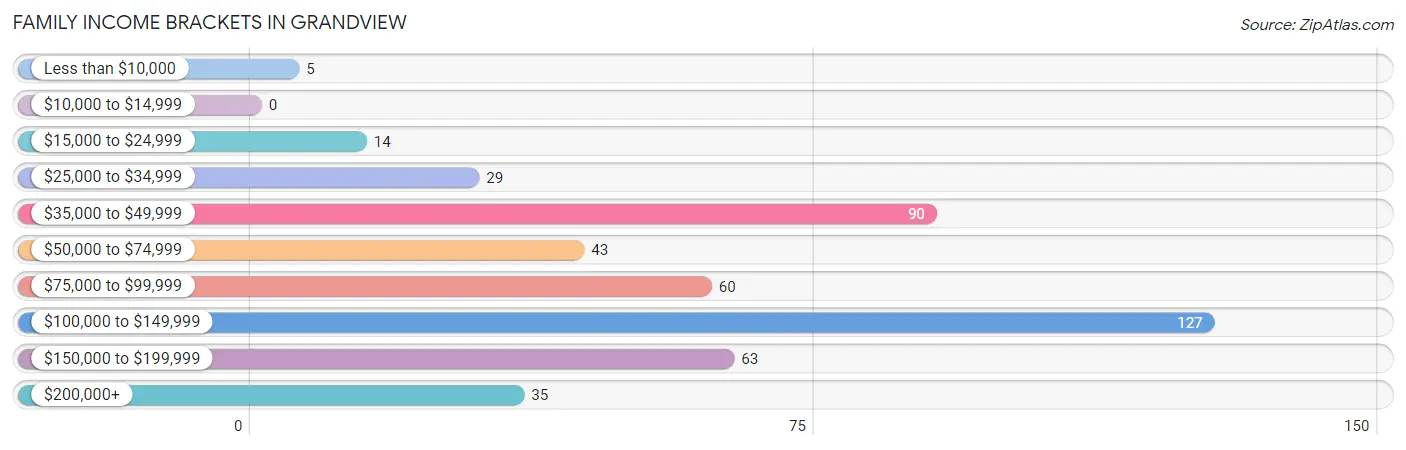
| Income Bracket | # Families | % Families |
| Less than $10,000 | 5 | 1.1% |
| $10,000 to $14,999 | 0 | 0.0% |
| $15,000 to $24,999 | 14 | 3.0% |
| $25,000 to $34,999 | 29 | 6.2% |
| $35,000 to $49,999 | 90 | 19.3% |
| $50,000 to $74,999 | 43 | 9.2% |
| $75,000 to $99,999 | 60 | 12.9% |
| $100,000 to $149,999 | 127 | 27.3% |
| $150,000 to $199,999 | 63 | 13.5% |
| $200,000+ | 35 | 7.5% |
Family Income by Famaliy Size in Grandview
4-person families (108 | 23.2%) account for the highest median family income in Grandview with $170,000 per family, while 4-person families (108 | 23.2%) have the highest median income of $42,500 per family member.
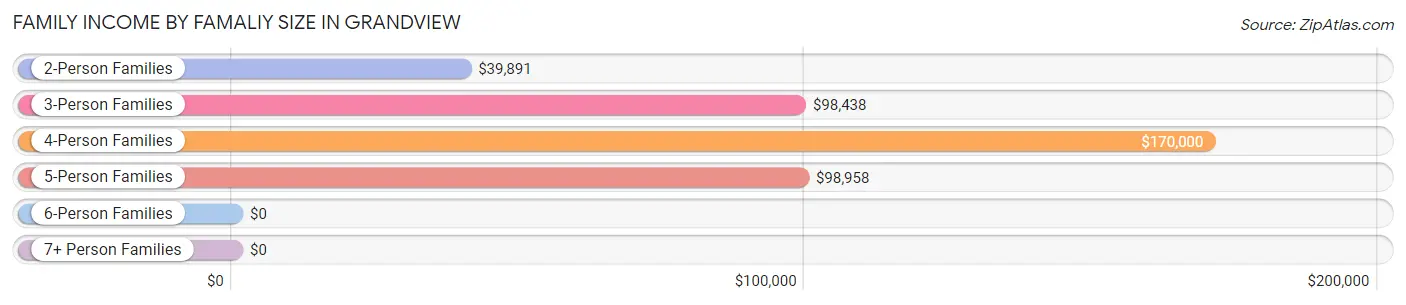
| Income Bracket | # Families | Median Income |
| 2-Person Families | 130 (27.9%) | $39,891 |
| 3-Person Families | 127 (27.3%) | $98,438 |
| 4-Person Families | 108 (23.2%) | $170,000 |
| 5-Person Families | 67 (14.4%) | $98,958 |
| 6-Person Families | 30 (6.4%) | $0 |
| 7+ Person Families | 4 (0.9%) | $0 |
| Total | 466 (100.0%) | $98,000 |
Family Income by Number of Earners in Grandview
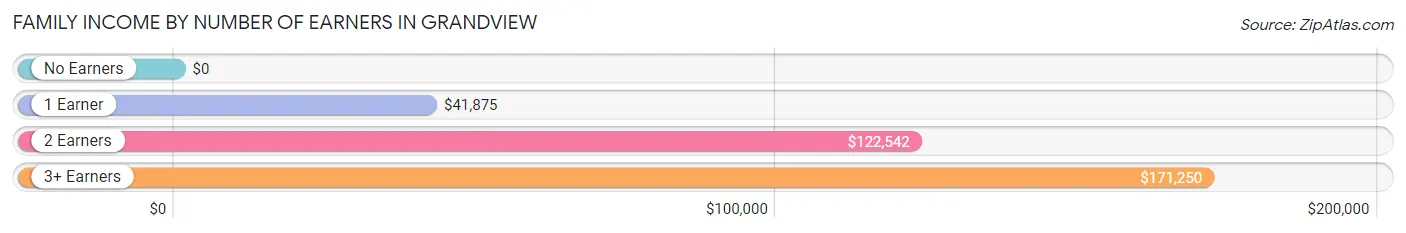
| Number of Earners | # Families | Median Income |
| No Earners | 13 (2.8%) | $0 |
| 1 Earner | 153 (32.8%) | $41,875 |
| 2 Earners | 277 (59.4%) | $122,542 |
| 3+ Earners | 23 (4.9%) | $171,250 |
| Total | 466 (100.0%) | $98,000 |
Household Income in Grandview
Household Income Brackets in Grandview
With 168 households falling in the category, the $100,000 to $149,999 income range is the most frequent in Grandview, accounting for 25.0% of all households. In contrast, only 29 households (4.3%) fall into the $10,000 to $14,999 income bracket, making it the least populous group.
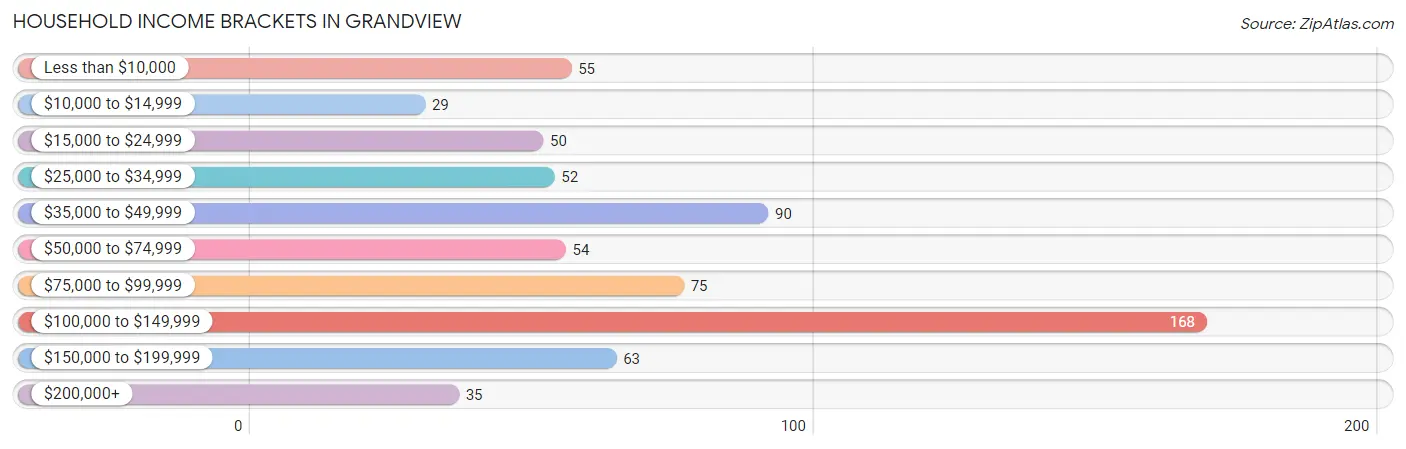
| Income Bracket | # Households | % Households |
| Less than $10,000 | 55 | 8.2% |
| $10,000 to $14,999 | 29 | 4.3% |
| $15,000 to $24,999 | 50 | 7.5% |
| $25,000 to $34,999 | 52 | 7.7% |
| $35,000 to $49,999 | 90 | 13.4% |
| $50,000 to $74,999 | 54 | 8.0% |
| $75,000 to $99,999 | 75 | 11.2% |
| $100,000 to $149,999 | 168 | 25.0% |
| $150,000 to $199,999 | 63 | 9.4% |
| $200,000+ | 35 | 5.2% |
Household Income by Householder Age in Grandview
The median household income in Grandview is $75,724, with the highest median household income of $107,083 found in the 45 to 64 years age bracket for the primary householder. A total of 221 households (32.9%) fall into this category. Meanwhile, the 15 to 24 years age bracket for the primary householder has the lowest median household income of $0, with 27 households (4.0%) in this group.
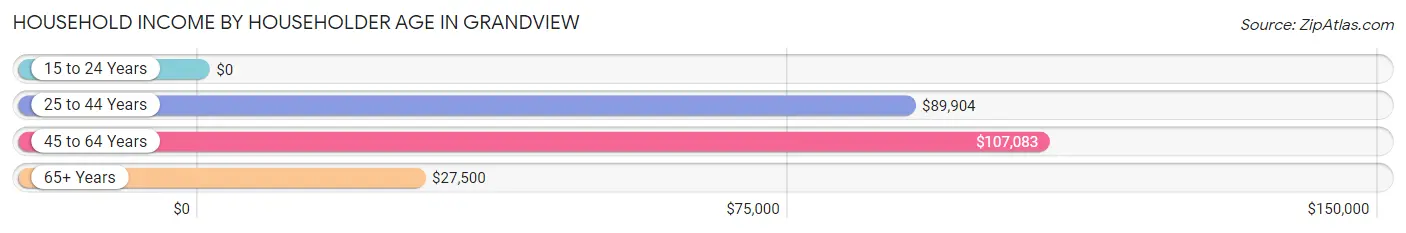
| Income Bracket | # Households | Median Income |
| 15 to 24 Years | 27 (4.0%) | $0 |
| 25 to 44 Years | 283 (42.2%) | $89,904 |
| 45 to 64 Years | 221 (32.9%) | $107,083 |
| 65+ Years | 140 (20.9%) | $27,500 |
| Total | 671 (100.0%) | $75,724 |
Poverty in Grandview
Income Below Poverty by Sex and Age in Grandview
With 2.1% poverty level for males and 11.5% for females among the residents of Grandview, 12 to 14 year old males and 55 to 64 year old females are the most vulnerable to poverty, with 5 males (9.8%) and 46 females (37.7%) in their respective age groups living below the poverty level.
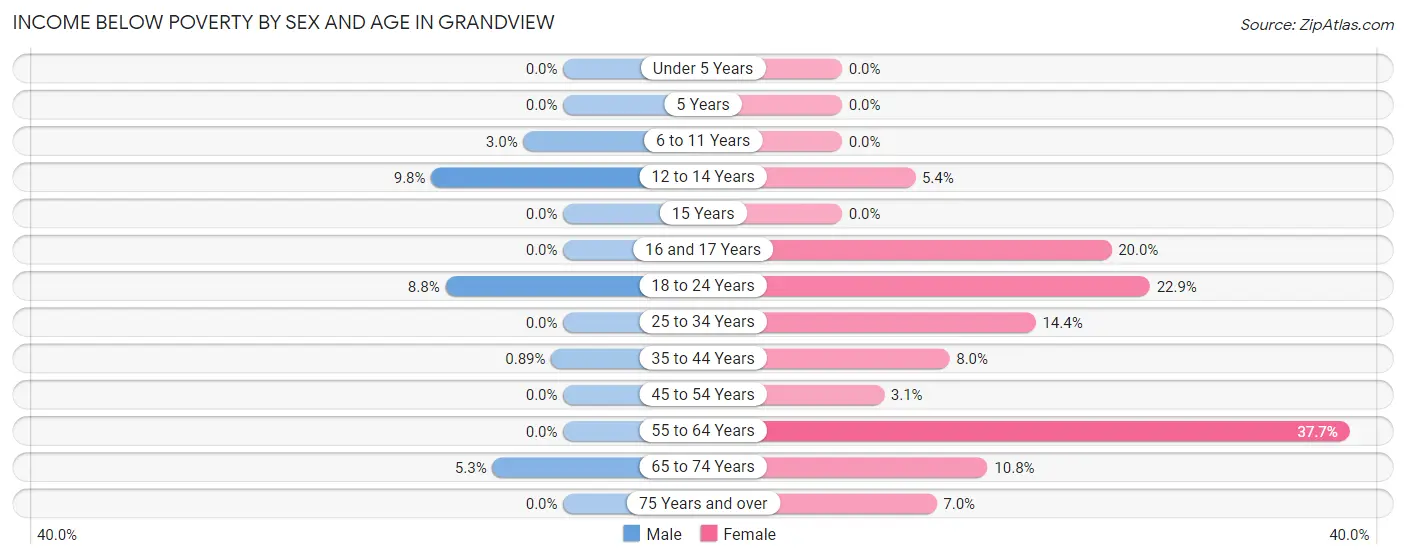
| Age Bracket | Male | Female |
| Under 5 Years | 0 (0.0%) | 0 (0.0%) |
| 5 Years | 0 (0.0%) | 0 (0.0%) |
| 6 to 11 Years | 4 (3.0%) | 0 (0.0%) |
| 12 to 14 Years | 5 (9.8%) | 5 (5.4%) |
| 15 Years | 0 (0.0%) | 0 (0.0%) |
| 16 and 17 Years | 0 (0.0%) | 4 (20.0%) |
| 18 to 24 Years | 7 (8.7%) | 8 (22.9%) |
| 25 to 34 Years | 0 (0.0%) | 23 (14.4%) |
| 35 to 44 Years | 1 (0.9%) | 15 (8.0%) |
| 45 to 54 Years | 0 (0.0%) | 2 (3.1%) |
| 55 to 64 Years | 0 (0.0%) | 46 (37.7%) |
| 65 to 74 Years | 2 (5.3%) | 8 (10.8%) |
| 75 Years and over | 0 (0.0%) | 4 (7.0%) |
| Total | 19 (2.1%) | 115 (11.5%) |
Income Above Poverty by Sex and Age in Grandview
According to the poverty statistics in Grandview, males aged under 5 years and females aged under 5 years are the age groups that are most secure financially, with 100.0% of males and 100.0% of females in these age groups living above the poverty line.
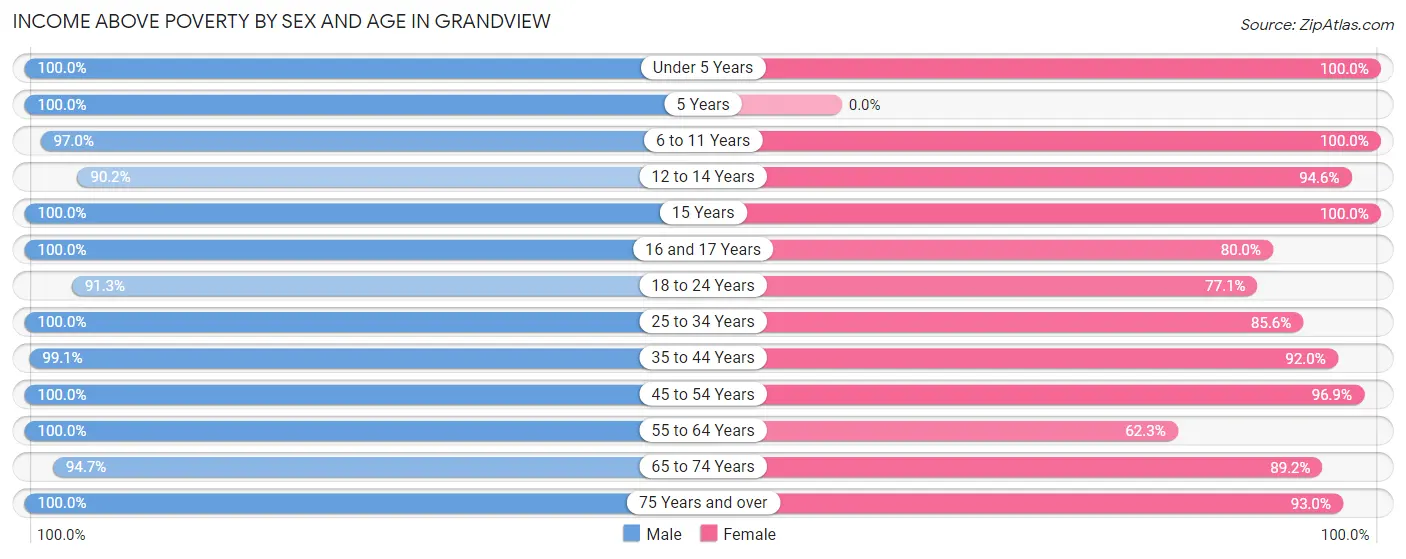
| Age Bracket | Male | Female |
| Under 5 Years | 95 (100.0%) | 19 (100.0%) |
| 5 Years | 10 (100.0%) | 0 (0.0%) |
| 6 to 11 Years | 131 (97.0%) | 163 (100.0%) |
| 12 to 14 Years | 46 (90.2%) | 87 (94.6%) |
| 15 Years | 12 (100.0%) | 10 (100.0%) |
| 16 and 17 Years | 19 (100.0%) | 16 (80.0%) |
| 18 to 24 Years | 73 (91.2%) | 27 (77.1%) |
| 25 to 34 Years | 156 (100.0%) | 137 (85.6%) |
| 35 to 44 Years | 111 (99.1%) | 173 (92.0%) |
| 45 to 54 Years | 54 (100.0%) | 62 (96.9%) |
| 55 to 64 Years | 122 (100.0%) | 76 (62.3%) |
| 65 to 74 Years | 36 (94.7%) | 66 (89.2%) |
| 75 Years and over | 9 (100.0%) | 53 (93.0%) |
| Total | 874 (97.9%) | 889 (88.5%) |
Income Below Poverty Among Married-Couple Families in Grandview
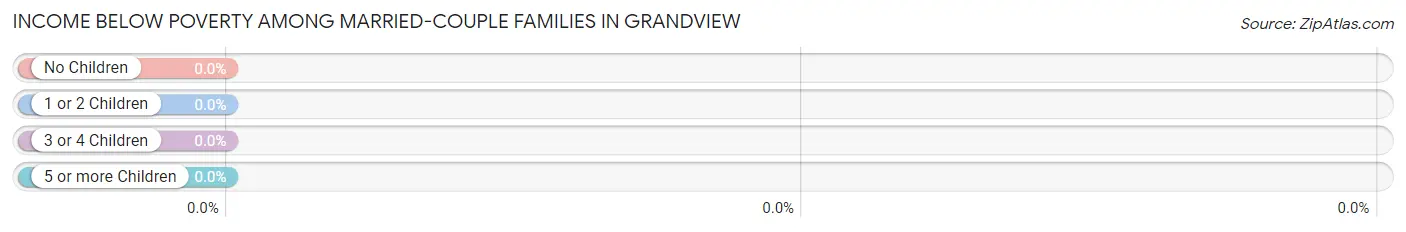
| Children | Above Poverty | Below Poverty |
| No Children | 84 (100.0%) | 0 (0.0%) |
| 1 or 2 Children | 180 (100.0%) | 0 (0.0%) |
| 3 or 4 Children | 70 (100.0%) | 0 (0.0%) |
| 5 or more Children | 0 (0.0%) | 0 (0.0%) |
| Total | 334 (100.0%) | 0 (0.0%) |
Income Below Poverty Among Single-Parent Households in Grandview
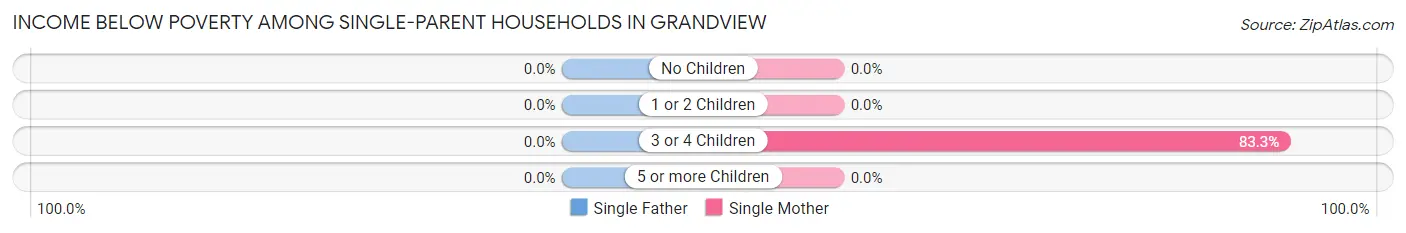
| Children | Single Father | Single Mother |
| No Children | 0 (0.0%) | 0 (0.0%) |
| 1 or 2 Children | 0 (0.0%) | 0 (0.0%) |
| 3 or 4 Children | 0 (0.0%) | 5 (83.3%) |
| 5 or more Children | 0 (0.0%) | 0 (0.0%) |
| Total | 0 (0.0%) | 5 (5.8%) |
Income Below Poverty Among Married-Couple vs Single-Parent Households in Grandview
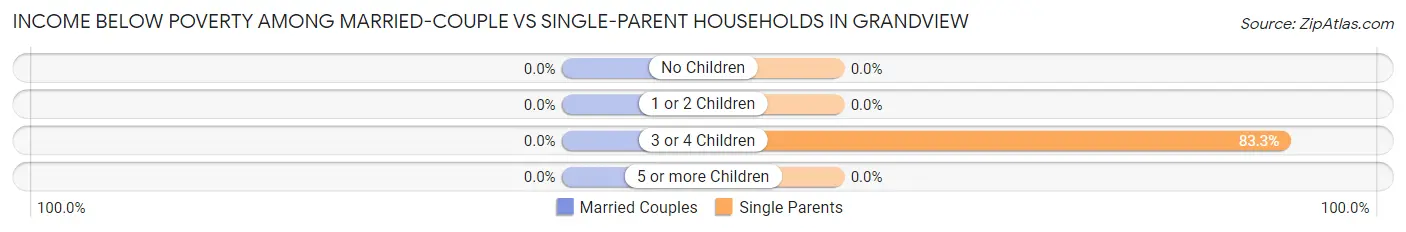
| Children | Married-Couple Families | Single-Parent Households |
| No Children | 0 (0.0%) | 0 (0.0%) |
| 1 or 2 Children | 0 (0.0%) | 0 (0.0%) |
| 3 or 4 Children | 0 (0.0%) | 5 (83.3%) |
| 5 or more Children | 0 (0.0%) | 0 (0.0%) |
| Total | 0 (0.0%) | 5 (3.8%) |
Race in Grandview
The most populous races in Grandview are White / Caucasian (1,832 | 92.6%), Hispanic or Latino (414 | 20.9%), and Two or more Races (80 | 4.0%).
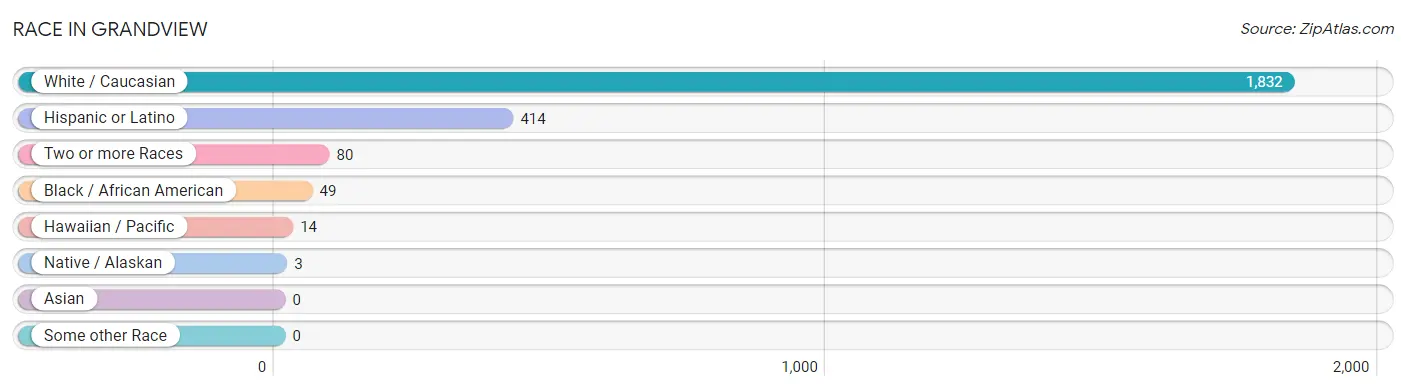
| Race | # Population | % Population |
| Asian | 0 | 0.0% |
| Black / African American | 49 | 2.5% |
| Hawaiian / Pacific | 14 | 0.7% |
| Hispanic or Latino | 414 | 20.9% |
| Native / Alaskan | 3 | 0.2% |
| White / Caucasian | 1,832 | 92.6% |
| Two or more Races | 80 | 4.0% |
| Some other Race | 0 | 0.0% |
| Total | 1,978 | 100.0% |
Ancestry in Grandview
The most populous ancestries reported in Grandview are Mexican (386 | 19.5%), American (367 | 18.5%), English (223 | 11.3%), Irish (191 | 9.7%), and German (169 | 8.5%), together accounting for 67.5% of all Grandview residents.
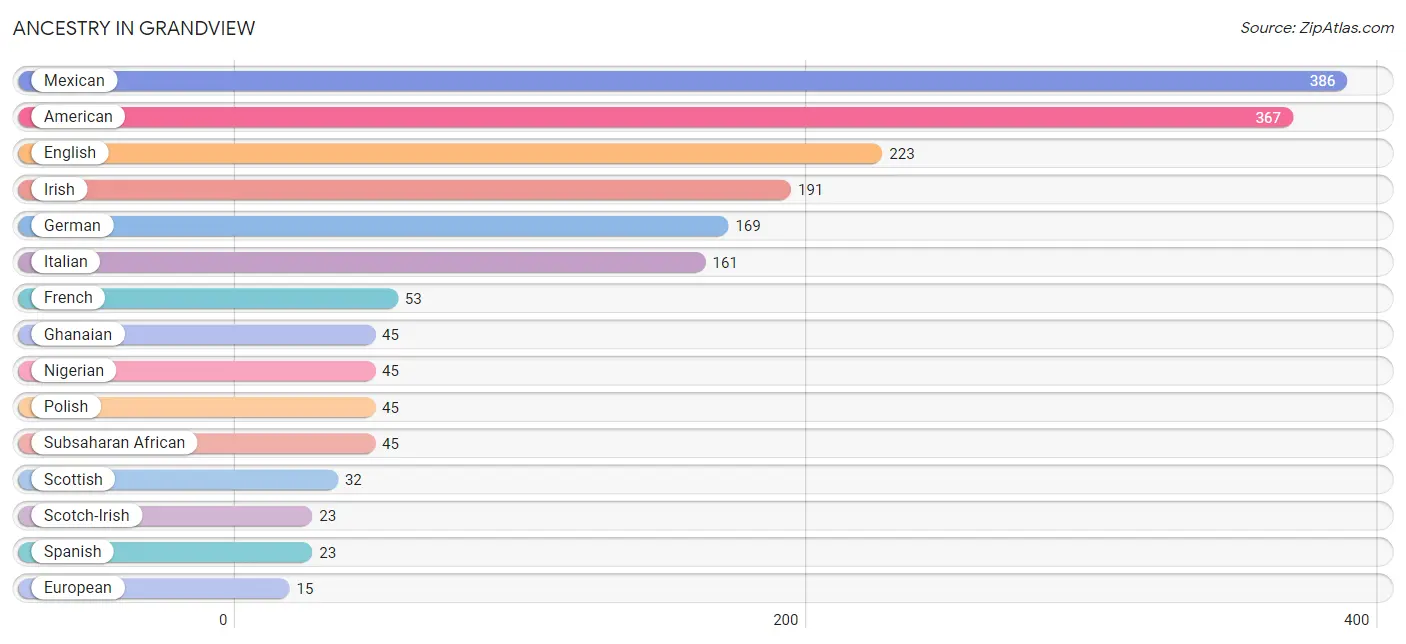
| Ancestry | # Population | % Population |
| American | 367 | 18.5% |
| Arab | 2 | 0.1% |
| Cajun | 2 | 0.1% |
| Canadian | 2 | 0.1% |
| Choctaw | 12 | 0.6% |
| Czech | 10 | 0.5% |
| Dutch | 4 | 0.2% |
| English | 223 | 11.3% |
| European | 15 | 0.8% |
| French | 53 | 2.7% |
| French Canadian | 14 | 0.7% |
| German | 169 | 8.5% |
| Ghanaian | 45 | 2.3% |
| Irish | 191 | 9.7% |
| Italian | 161 | 8.1% |
| Jamaican | 4 | 0.2% |
| Lebanese | 2 | 0.1% |
| Mexican | 386 | 19.5% |
| Nigerian | 45 | 2.3% |
| Polish | 45 | 2.3% |
| Portuguese | 8 | 0.4% |
| Puerto Rican | 5 | 0.3% |
| Russian | 14 | 0.7% |
| Scandinavian | 3 | 0.2% |
| Scotch-Irish | 23 | 1.2% |
| Scottish | 32 | 1.6% |
| Spanish | 23 | 1.2% |
| Subsaharan African | 45 | 2.3% |
| Swedish | 3 | 0.2% |
| Welsh | 15 | 0.8% |
| Yugoslavian | 2 | 0.1% | View All 31 Rows |
Immigrants in Grandview
The most numerous immigrant groups reported in Grandview came from Central America (52 | 2.6%), Latin America (52 | 2.6%), Mexico (52 | 2.6%), Bosnia and Herzegovina (2 | 0.1%), and Eastern Europe (2 | 0.1%), together accounting for 8.1% of all Grandview residents.
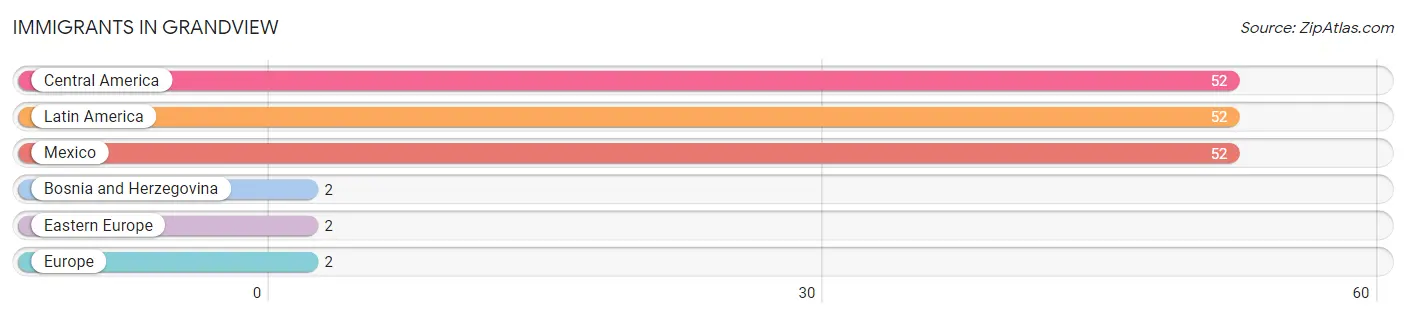
| Immigration Origin | # Population | % Population |
| Bosnia and Herzegovina | 2 | 0.1% |
| Central America | 52 | 2.6% |
| Eastern Europe | 2 | 0.1% |
| Europe | 2 | 0.1% |
| Latin America | 52 | 2.6% |
| Mexico | 52 | 2.6% | View All 6 Rows |
Sex and Age in Grandview
Sex and Age in Grandview
The most populous age groups in Grandview are 10 to 14 Years (132 | 14.1%) for men and 10 to 14 Years (153 | 14.7%) for women.
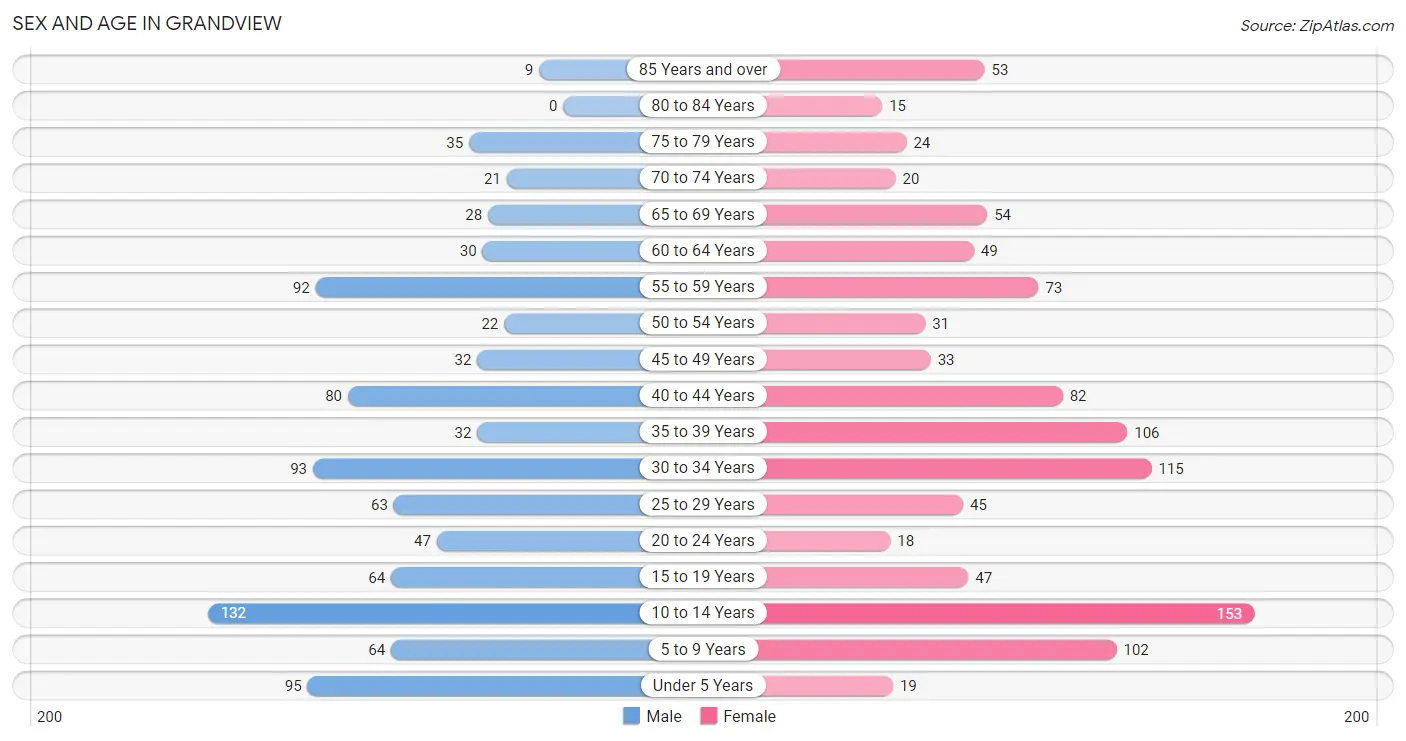
| Age Bracket | Male | Female |
| Under 5 Years | 95 (10.1%) | 19 (1.8%) |
| 5 to 9 Years | 64 (6.8%) | 102 (9.8%) |
| 10 to 14 Years | 132 (14.1%) | 153 (14.7%) |
| 15 to 19 Years | 64 (6.8%) | 47 (4.5%) |
| 20 to 24 Years | 47 (5.0%) | 18 (1.7%) |
| 25 to 29 Years | 63 (6.7%) | 45 (4.3%) |
| 30 to 34 Years | 93 (9.9%) | 115 (11.1%) |
| 35 to 39 Years | 32 (3.4%) | 106 (10.2%) |
| 40 to 44 Years | 80 (8.5%) | 82 (7.9%) |
| 45 to 49 Years | 32 (3.4%) | 33 (3.2%) |
| 50 to 54 Years | 22 (2.3%) | 31 (3.0%) |
| 55 to 59 Years | 92 (9.8%) | 73 (7.0%) |
| 60 to 64 Years | 30 (3.2%) | 49 (4.7%) |
| 65 to 69 Years | 28 (3.0%) | 54 (5.2%) |
| 70 to 74 Years | 21 (2.2%) | 20 (1.9%) |
| 75 to 79 Years | 35 (3.7%) | 24 (2.3%) |
| 80 to 84 Years | 0 (0.0%) | 15 (1.4%) |
| 85 Years and over | 9 (1.0%) | 53 (5.1%) |
| Total | 939 (100.0%) | 1,039 (100.0%) |
Families and Households in Grandview
Median Family Size in Grandview
The median family size in Grandview is 3.42 persons per family, with married-couple families (334 | 71.7%) accounting for the largest median family size of 3.75 persons per family. On the other hand, single male/father families (45 | 9.7%) represent the smallest median family size with 2.47 persons per family.
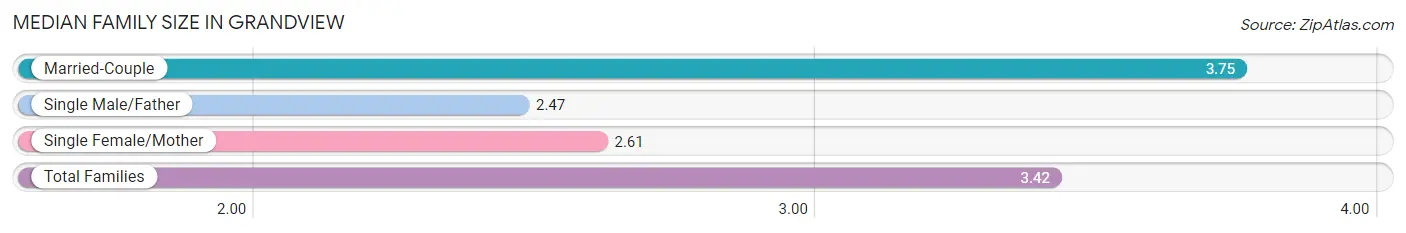
| Family Type | # Families | Family Size |
| Married-Couple | 334 (71.7%) | 3.75 |
| Single Male/Father | 45 (9.7%) | 2.47 |
| Single Female/Mother | 87 (18.7%) | 2.61 |
| Total Families | 466 (100.0%) | 3.42 |
Median Household Size in Grandview
The median household size in Grandview is 2.81 persons per household, with married-couple households (334 | 49.8%) accounting for the largest median household size of 3.78 persons per household. non-family households (205 | 30.5%) represent the smallest median household size with 1.09 persons per household.
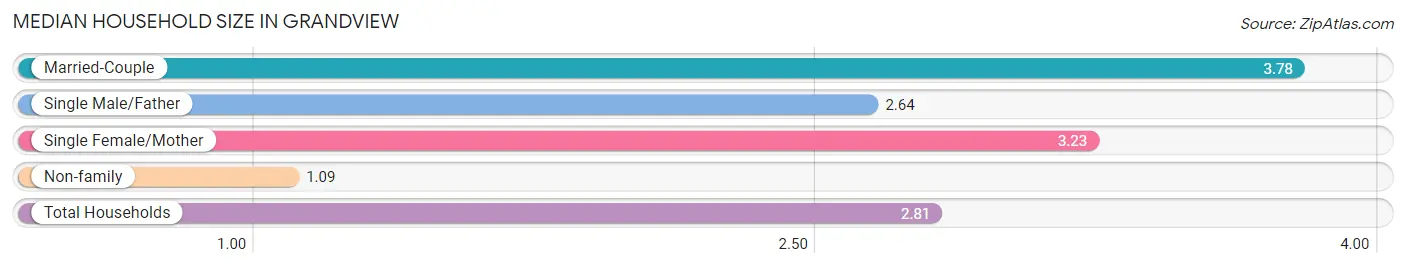
| Household Type | # Households | Household Size |
| Married-Couple | 334 (49.8%) | 3.78 |
| Single Male/Father | 45 (6.7%) | 2.64 |
| Single Female/Mother | 87 (13.0%) | 3.23 |
| Non-family | 205 (30.5%) | 1.09 |
| Total Households | 671 (100.0%) | 2.81 |
Household Size by Marriage Status in Grandview
Out of a total of 671 households in Grandview, 466 (69.5%) are family households, while 205 (30.5%) are nonfamily households. The most numerous type of family households are 3-person households, comprising 141, and the most common type of nonfamily households are 1-person households, comprising 197.
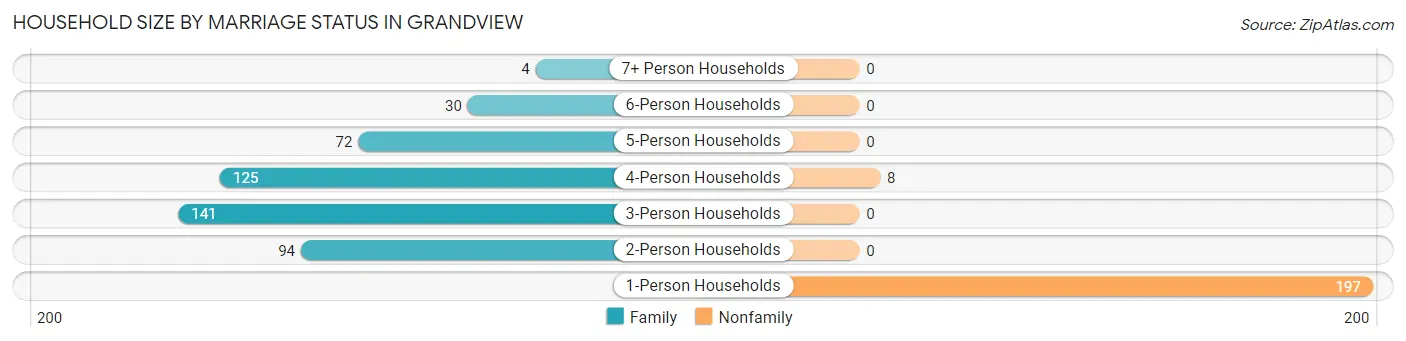
| Household Size | Family Households | Nonfamily Households |
| 1-Person Households | - | 197 (29.4%) |
| 2-Person Households | 94 (14.0%) | 0 (0.0%) |
| 3-Person Households | 141 (21.0%) | 0 (0.0%) |
| 4-Person Households | 125 (18.6%) | 8 (1.2%) |
| 5-Person Households | 72 (10.7%) | 0 (0.0%) |
| 6-Person Households | 30 (4.5%) | 0 (0.0%) |
| 7+ Person Households | 4 (0.6%) | 0 (0.0%) |
| Total | 466 (69.5%) | 205 (30.5%) |
Female Fertility in Grandview
Fertility by Age in Grandview
Average fertility rate in Grandview is 118.0 births per 1,000 women. Women in the age bracket of 20 to 34 years have the highest fertility rate with 213.0 births per 1,000 women. Women in the age bracket of 20 to 34 years acount for 71.7% of all women with births.
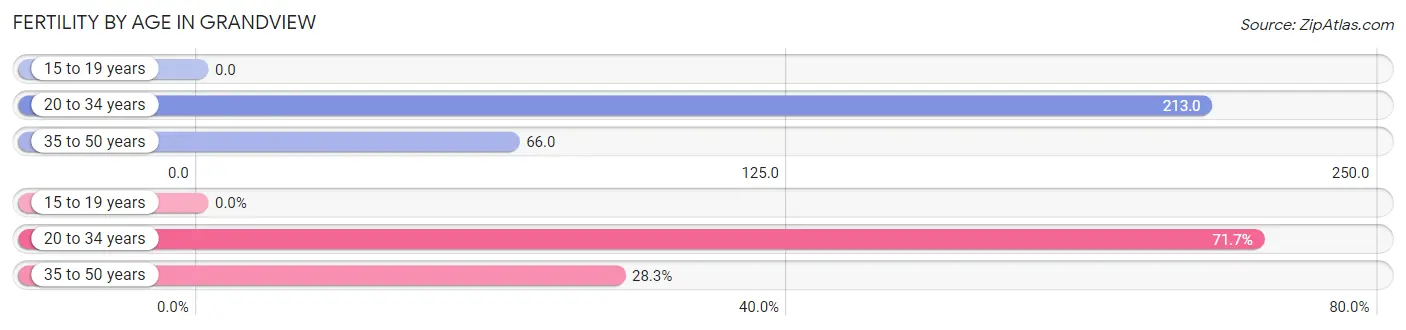
| Age Bracket | Women with Births | Births / 1,000 Women |
| 15 to 19 years | 0 (0.0%) | 0.0 |
| 20 to 34 years | 38 (71.7%) | 213.0 |
| 35 to 50 years | 15 (28.3%) | 66.0 |
| Total | 53 (100.0%) | 118.0 |
Fertility by Age by Marriage Status in Grandview
62.3% of women with births (53) in Grandview are married. The highest percentage of unmarried women with births falls into 35 to 50 years age bracket with 100.0% of them unmarried at the time of birth, while the lowest percentage of unmarried women with births belong to 20 to 34 years age bracket with 13.2% of them unmarried.
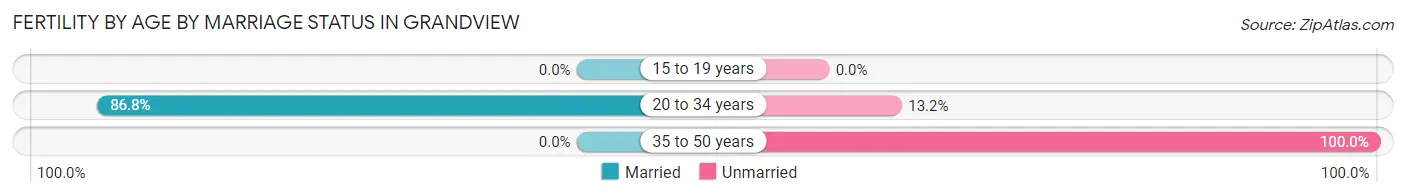
| Age Bracket | Married | Unmarried |
| 15 to 19 years | 0 (0.0%) | 0 (0.0%) |
| 20 to 34 years | 33 (86.8%) | 5 (13.2%) |
| 35 to 50 years | 0 (0.0%) | 15 (100.0%) |
| Total | 33 (62.3%) | 20 (37.7%) |
Fertility by Education in Grandview
Average fertility rate in Grandview is 118.0 births per 1,000 women. Women with the education attainment of graduate degree have the highest fertility rate of 346.0 births per 1,000 women, while women with the education attainment of high school diploma have the lowest fertility at 64.0 births per 1,000 women. Women with the education attainment of college or associate's degree represent 50.9% of all women with births.
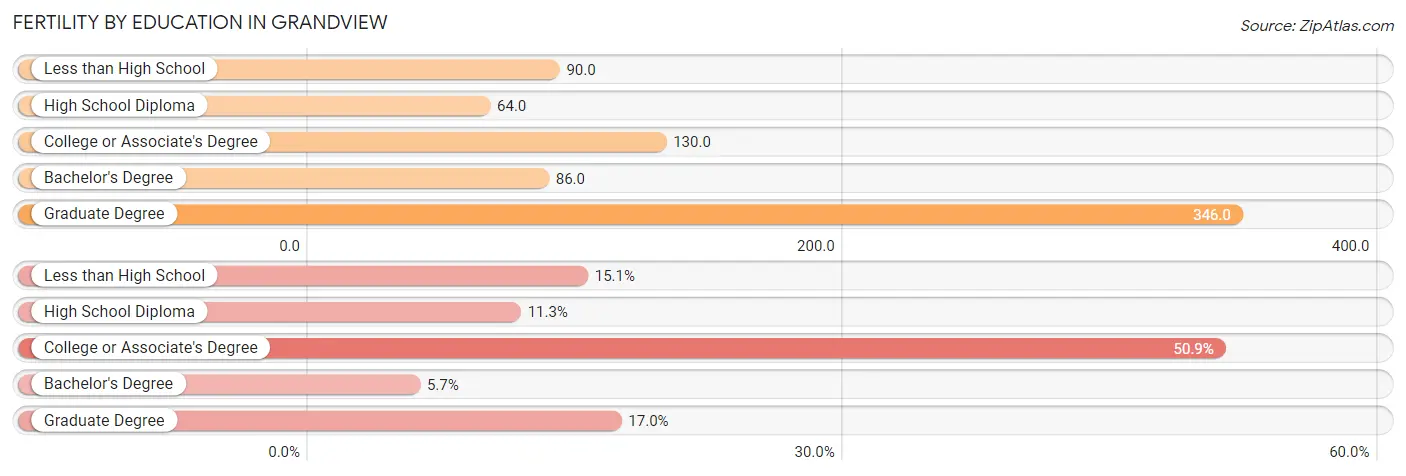
| Educational Attainment | Women with Births | Births / 1,000 Women |
| Less than High School | 8 (15.1%) | 90.0 |
| High School Diploma | 6 (11.3%) | 64.0 |
| College or Associate's Degree | 27 (50.9%) | 130.0 |
| Bachelor's Degree | 3 (5.7%) | 86.0 |
| Graduate Degree | 9 (17.0%) | 346.0 |
| Total | 53 (100.0%) | 118.0 |
Fertility by Education by Marriage Status in Grandview
37.7% of women with births in Grandview are unmarried. Women with the educational attainment of less than high school are most likely to be married with 100.0% of them married at childbirth, while women with the educational attainment of bachelor's degree are least likely to be married with 100.0% of them unmarried at childbirth.
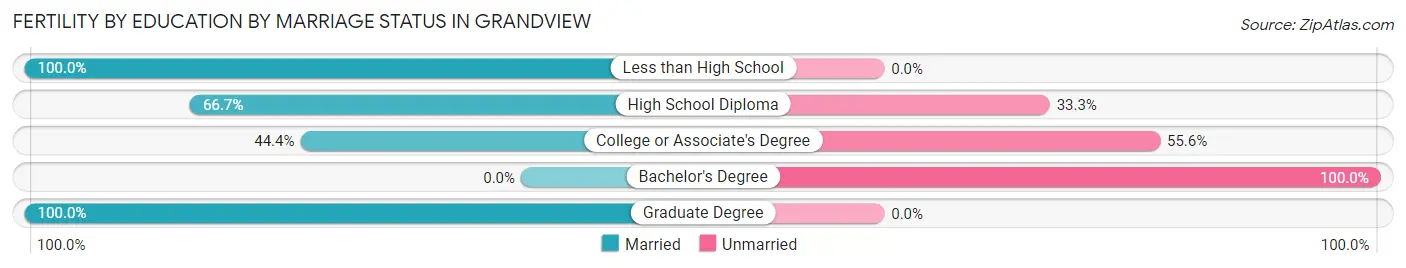
| Educational Attainment | Married | Unmarried |
| Less than High School | 8 (100.0%) | 0 (0.0%) |
| High School Diploma | 4 (66.7%) | 2 (33.3%) |
| College or Associate's Degree | 12 (44.4%) | 15 (55.6%) |
| Bachelor's Degree | 0 (0.0%) | 3 (100.0%) |
| Graduate Degree | 9 (100.0%) | 0 (0.0%) |
| Total | 33 (62.3%) | 20 (37.7%) |
Employment Characteristics in Grandview
Employment by Class of Employer in Grandview
Among the 844 employed individuals in Grandview, private company employees (554 | 65.6%), not-for-profit organizations (109 | 12.9%), and local government employees (108 | 12.8%) make up the most common classes of employment.
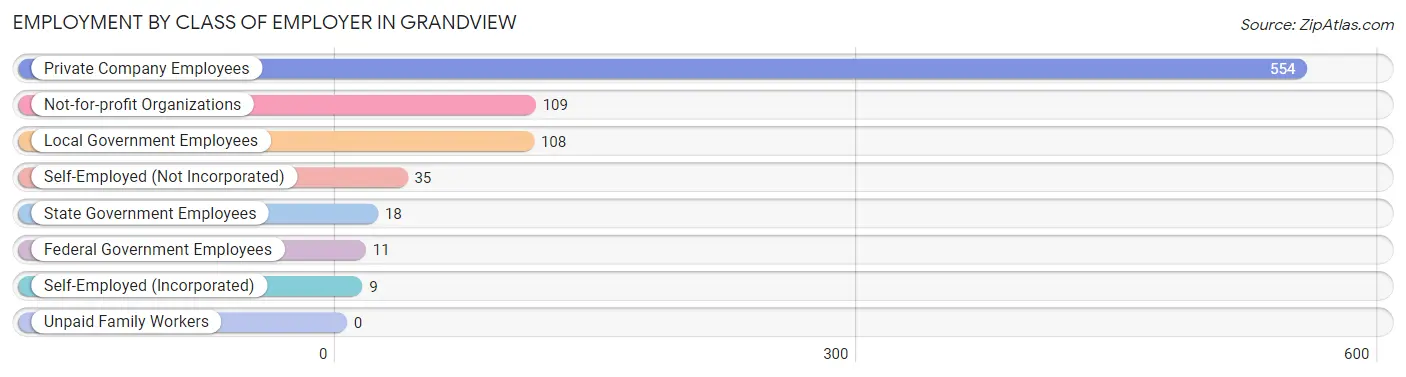
| Employer Class | # Employees | % Employees |
| Private Company Employees | 554 | 65.6% |
| Self-Employed (Incorporated) | 9 | 1.1% |
| Self-Employed (Not Incorporated) | 35 | 4.2% |
| Not-for-profit Organizations | 109 | 12.9% |
| Local Government Employees | 108 | 12.8% |
| State Government Employees | 18 | 2.1% |
| Federal Government Employees | 11 | 1.3% |
| Unpaid Family Workers | 0 | 0.0% |
| Total | 844 | 100.0% |
Employment Status by Age in Grandview
According to the labor force statistics for Grandview, out of the total population over 16 years of age (1,391), 64.0% or 890 individuals are in the labor force, with 1.6% or 14 of them unemployed. The age group with the highest labor force participation rate is 35 to 44 years, with 93.3% or 280 individuals in the labor force. Within the labor force, the 45 to 54 years age range has the highest percentage of unemployed individuals, with 8.6% or 9 of them being unemployed.
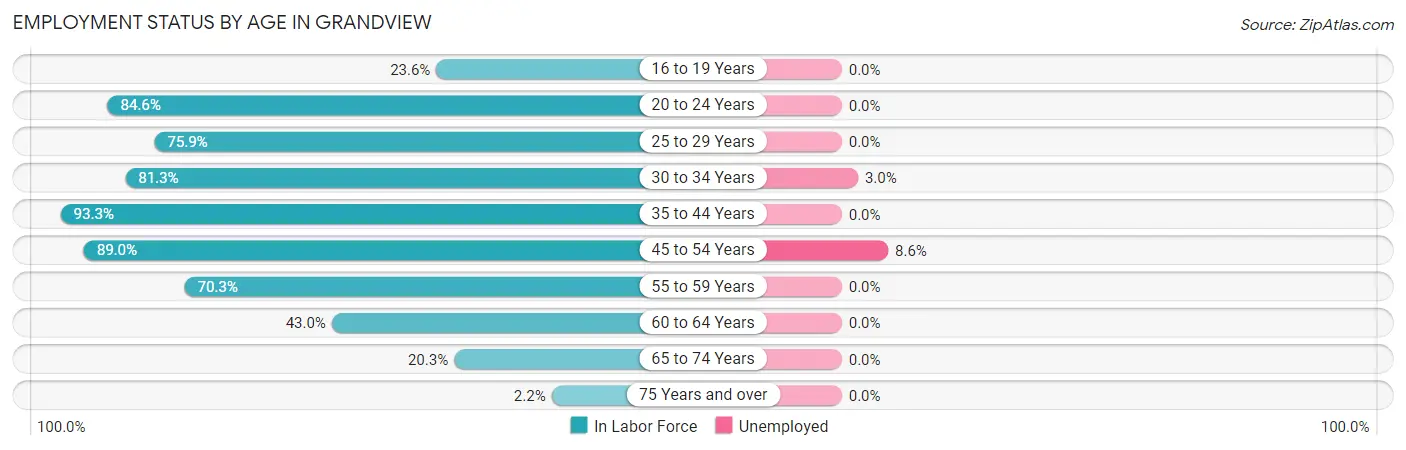
| Age Bracket | In Labor Force | Unemployed |
| 16 to 19 Years | 21 (23.6%) | 0 (0.0%) |
| 20 to 24 Years | 55 (84.6%) | 0 (0.0%) |
| 25 to 29 Years | 82 (75.9%) | 0 (0.0%) |
| 30 to 34 Years | 169 (81.3%) | 5 (3.0%) |
| 35 to 44 Years | 280 (93.3%) | 0 (0.0%) |
| 45 to 54 Years | 105 (89.0%) | 9 (8.6%) |
| 55 to 59 Years | 116 (70.3%) | 0 (0.0%) |
| 60 to 64 Years | 34 (43.0%) | 0 (0.0%) |
| 65 to 74 Years | 25 (20.3%) | 0 (0.0%) |
| 75 Years and over | 3 (2.2%) | 0 (0.0%) |
| Total | 890 (64.0%) | 14 (1.6%) |
Employment Status by Educational Attainment in Grandview
According to labor force statistics for Grandview, 80.4% of individuals (786) out of the total population between 25 and 64 years of age (978) are in the labor force, with 1.8% or 14 of them being unemployed. The group with the highest labor force participation rate are those with the educational attainment of bachelor's degree or higher, with 89.3% or 125 individuals in the labor force. Within the labor force, individuals with college / associate degree education have the highest percentage of unemployment, with 3.9% or 14 of them being unemployed.
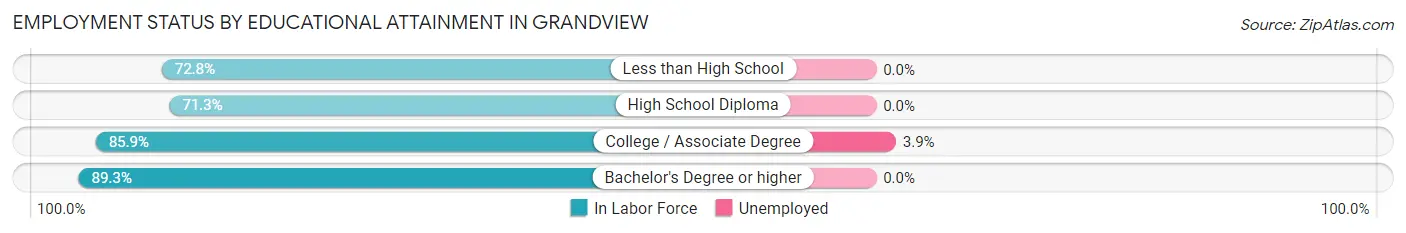
| Educational Attainment | In Labor Force | Unemployed |
| Less than High School | 107 (72.8%) | 0 (0.0%) |
| High School Diploma | 194 (71.3%) | 0 (0.0%) |
| College / Associate Degree | 360 (85.9%) | 16 (3.9%) |
| Bachelor's Degree or higher | 125 (89.3%) | 0 (0.0%) |
| Total | 786 (80.4%) | 18 (1.8%) |
Employment Occupations by Sex in Grandview
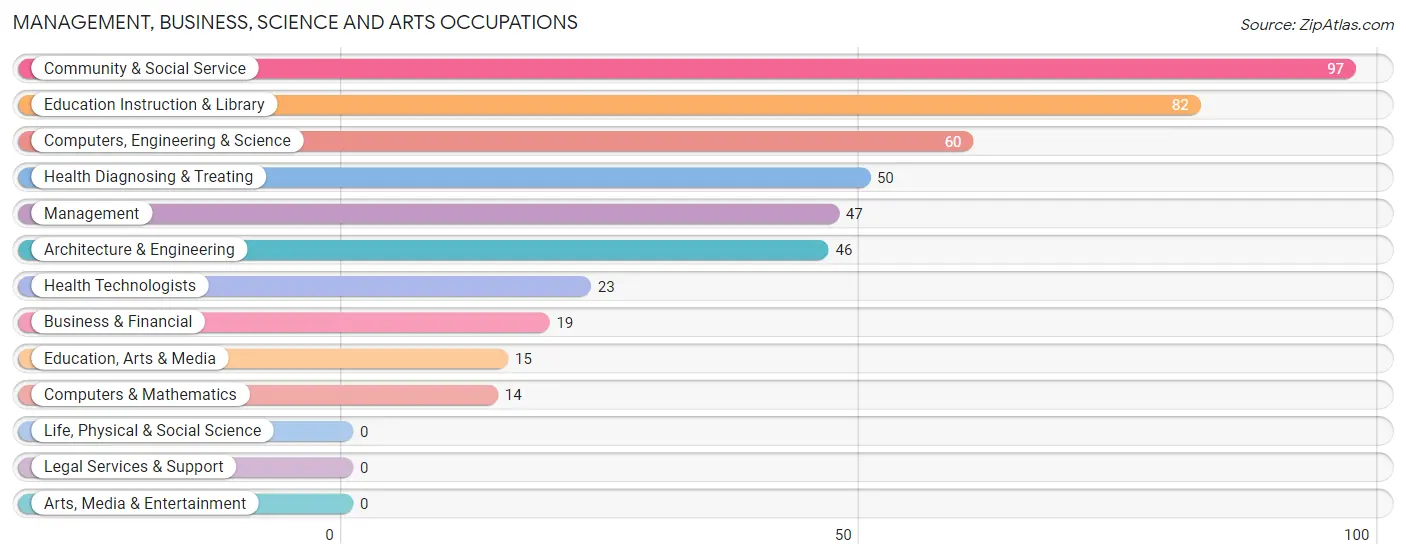
Management, Business, Science and Arts Occupations
The most common Management, Business, Science and Arts occupations in Grandview are Community & Social Service (97 | 11.1%), Education Instruction & Library (82 | 9.4%), Computers, Engineering & Science (60 | 6.9%), Health Diagnosing & Treating (50 | 5.7%), and Management (47 | 5.4%).
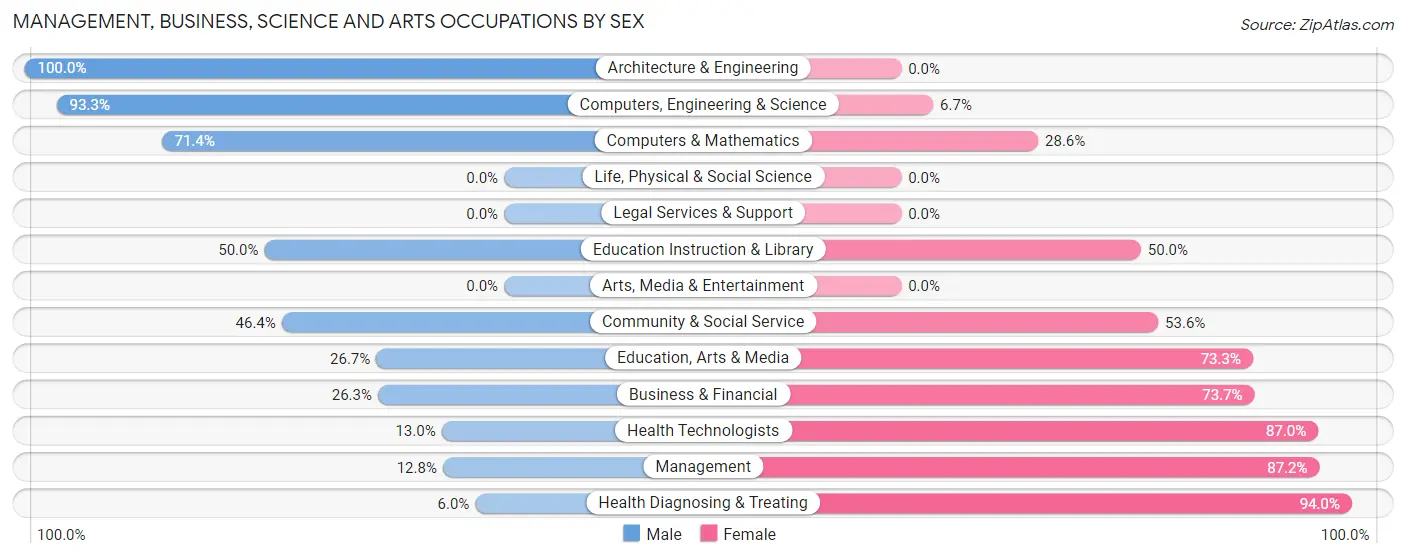
Management, Business, Science and Arts Occupations by Sex
Within the Management, Business, Science and Arts occupations in Grandview, the most male-oriented occupations are Architecture & Engineering (100.0%), Computers, Engineering & Science (93.3%), and Computers & Mathematics (71.4%), while the most female-oriented occupations are Health Diagnosing & Treating (94.0%), Management (87.2%), and Health Technologists (87.0%).
| Occupation | Male | Female |
| Management | 6 (12.8%) | 41 (87.2%) |
| Business & Financial | 5 (26.3%) | 14 (73.7%) |
| Computers, Engineering & Science | 56 (93.3%) | 4 (6.7%) |
| Computers & Mathematics | 10 (71.4%) | 4 (28.6%) |
| Architecture & Engineering | 46 (100.0%) | 0 (0.0%) |
| Life, Physical & Social Science | 0 (0.0%) | 0 (0.0%) |
| Community & Social Service | 45 (46.4%) | 52 (53.6%) |
| Education, Arts & Media | 4 (26.7%) | 11 (73.3%) |
| Legal Services & Support | 0 (0.0%) | 0 (0.0%) |
| Education Instruction & Library | 41 (50.0%) | 41 (50.0%) |
| Arts, Media & Entertainment | 0 (0.0%) | 0 (0.0%) |
| Health Diagnosing & Treating | 3 (6.0%) | 47 (94.0%) |
| Health Technologists | 3 (13.0%) | 20 (87.0%) |
| Total (Category) | 115 (42.1%) | 158 (57.9%) |
| Total (Overall) | 477 (54.4%) | 399 (45.6%) |
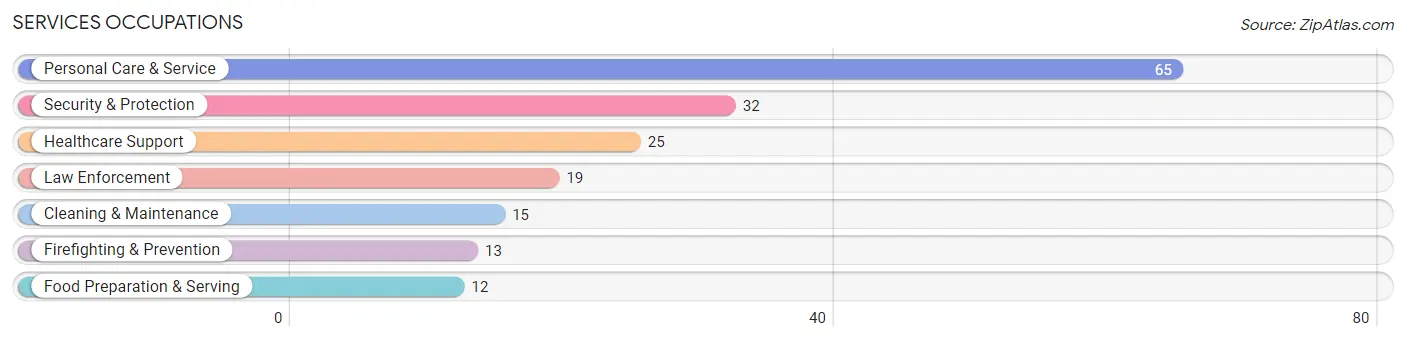
Services Occupations
The most common Services occupations in Grandview are Personal Care & Service (65 | 7.4%), Security & Protection (32 | 3.6%), Healthcare Support (25 | 2.9%), Law Enforcement (19 | 2.2%), and Cleaning & Maintenance (15 | 1.7%).
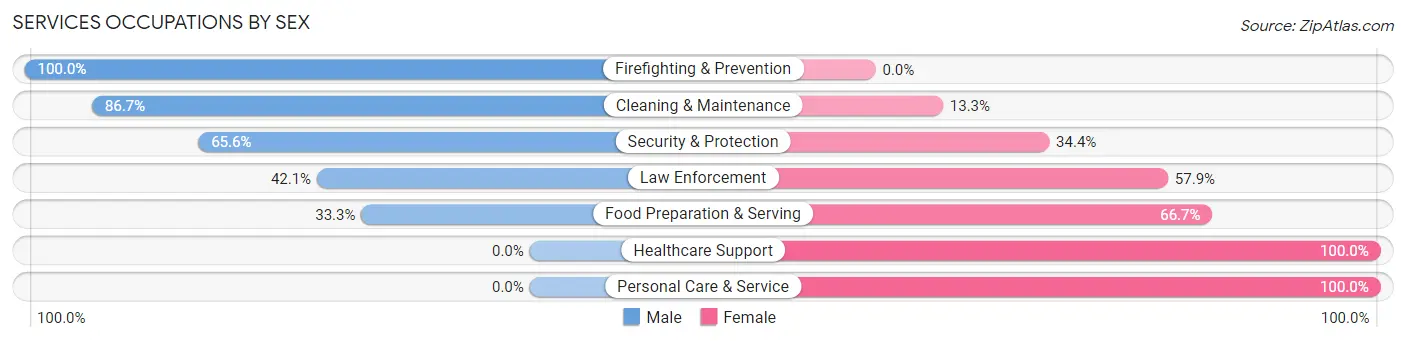
Services Occupations by Sex
Within the Services occupations in Grandview, the most male-oriented occupations are Firefighting & Prevention (100.0%), Cleaning & Maintenance (86.7%), and Security & Protection (65.6%), while the most female-oriented occupations are Healthcare Support (100.0%), Personal Care & Service (100.0%), and Food Preparation & Serving (66.7%).
| Occupation | Male | Female |
| Healthcare Support | 0 (0.0%) | 25 (100.0%) |
| Security & Protection | 21 (65.6%) | 11 (34.4%) |
| Firefighting & Prevention | 13 (100.0%) | 0 (0.0%) |
| Law Enforcement | 8 (42.1%) | 11 (57.9%) |
| Food Preparation & Serving | 4 (33.3%) | 8 (66.7%) |
| Cleaning & Maintenance | 13 (86.7%) | 2 (13.3%) |
| Personal Care & Service | 0 (0.0%) | 65 (100.0%) |
| Total (Category) | 38 (25.5%) | 111 (74.5%) |
| Total (Overall) | 477 (54.4%) | 399 (45.6%) |
Sales and Office Occupations
The most common Sales and Office occupations in Grandview are Office & Administration (57 | 6.5%), and Sales & Related (36 | 4.1%).

Sales and Office Occupations by Sex

| Occupation | Male | Female |
| Sales & Related | 29 (80.6%) | 7 (19.4%) |
| Office & Administration | 20 (35.1%) | 37 (64.9%) |
| Total (Category) | 49 (52.7%) | 44 (47.3%) |
| Total (Overall) | 477 (54.4%) | 399 (45.6%) |
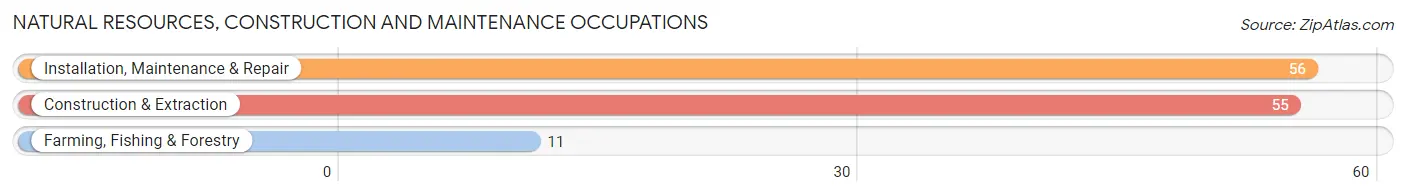
Natural Resources, Construction and Maintenance Occupations
The most common Natural Resources, Construction and Maintenance occupations in Grandview are Installation, Maintenance & Repair (56 | 6.4%), Construction & Extraction (55 | 6.3%), and Farming, Fishing & Forestry (11 | 1.3%).
Natural Resources, Construction and Maintenance Occupations by Sex
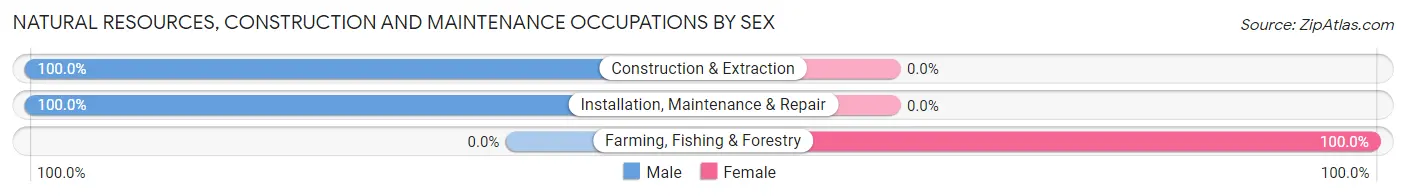
| Occupation | Male | Female |
| Farming, Fishing & Forestry | 0 (0.0%) | 11 (100.0%) |
| Construction & Extraction | 55 (100.0%) | 0 (0.0%) |
| Installation, Maintenance & Repair | 56 (100.0%) | 0 (0.0%) |
| Total (Category) | 111 (91.0%) | 11 (9.0%) |
| Total (Overall) | 477 (54.4%) | 399 (45.6%) |
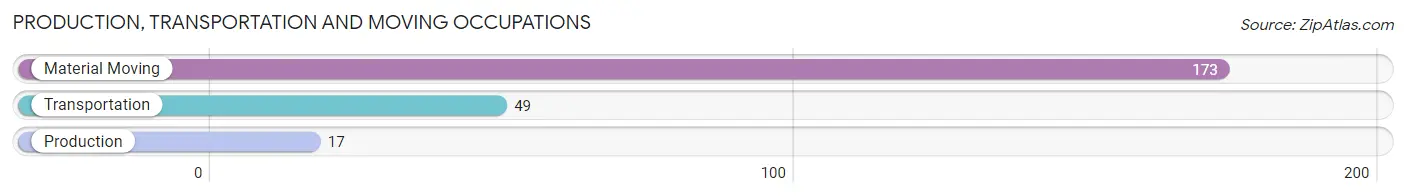
Production, Transportation and Moving Occupations
The most common Production, Transportation and Moving occupations in Grandview are Material Moving (173 | 19.8%), Transportation (49 | 5.6%), and Production (17 | 1.9%).
Production, Transportation and Moving Occupations by Sex
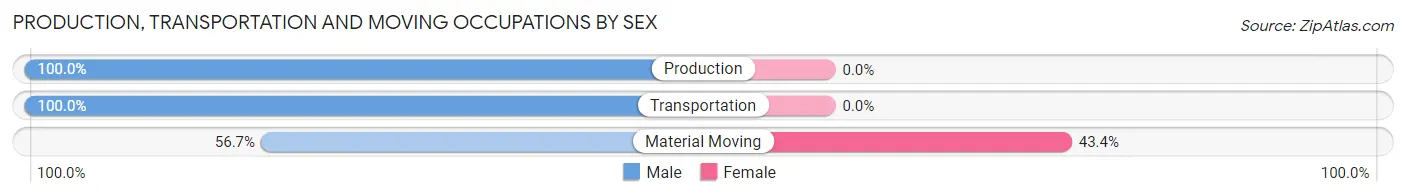
| Occupation | Male | Female |
| Production | 17 (100.0%) | 0 (0.0%) |
| Transportation | 49 (100.0%) | 0 (0.0%) |
| Material Moving | 98 (56.7%) | 75 (43.3%) |
| Total (Category) | 164 (68.6%) | 75 (31.4%) |
| Total (Overall) | 477 (54.4%) | 399 (45.6%) |
Employment Industries by Sex in Grandview
Employment Industries in Grandview
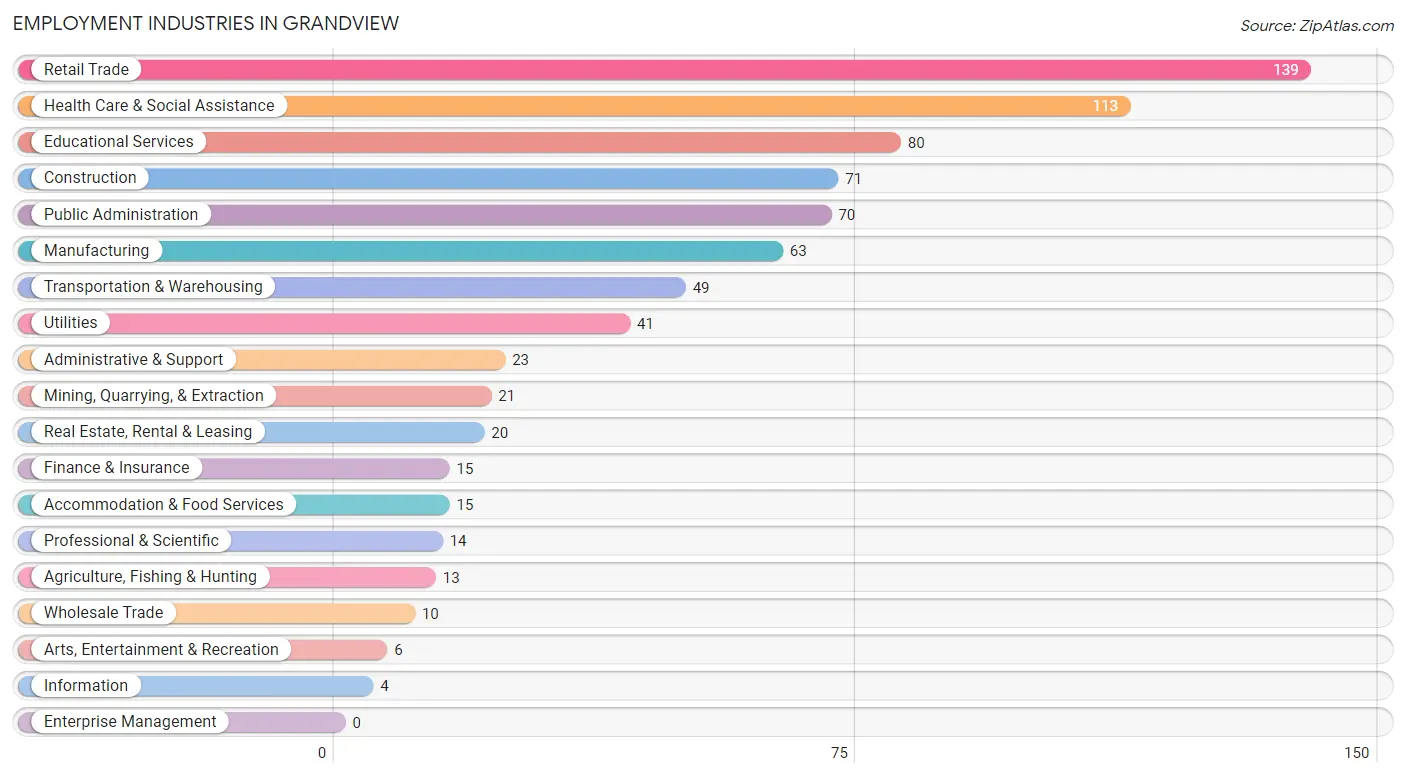
The major employment industries in Grandview include Retail Trade (139 | 15.9%), Health Care & Social Assistance (113 | 12.9%), Educational Services (80 | 9.1%), Construction (71 | 8.1%), and Public Administration (70 | 8.0%).
Employment Industries by Sex in Grandview
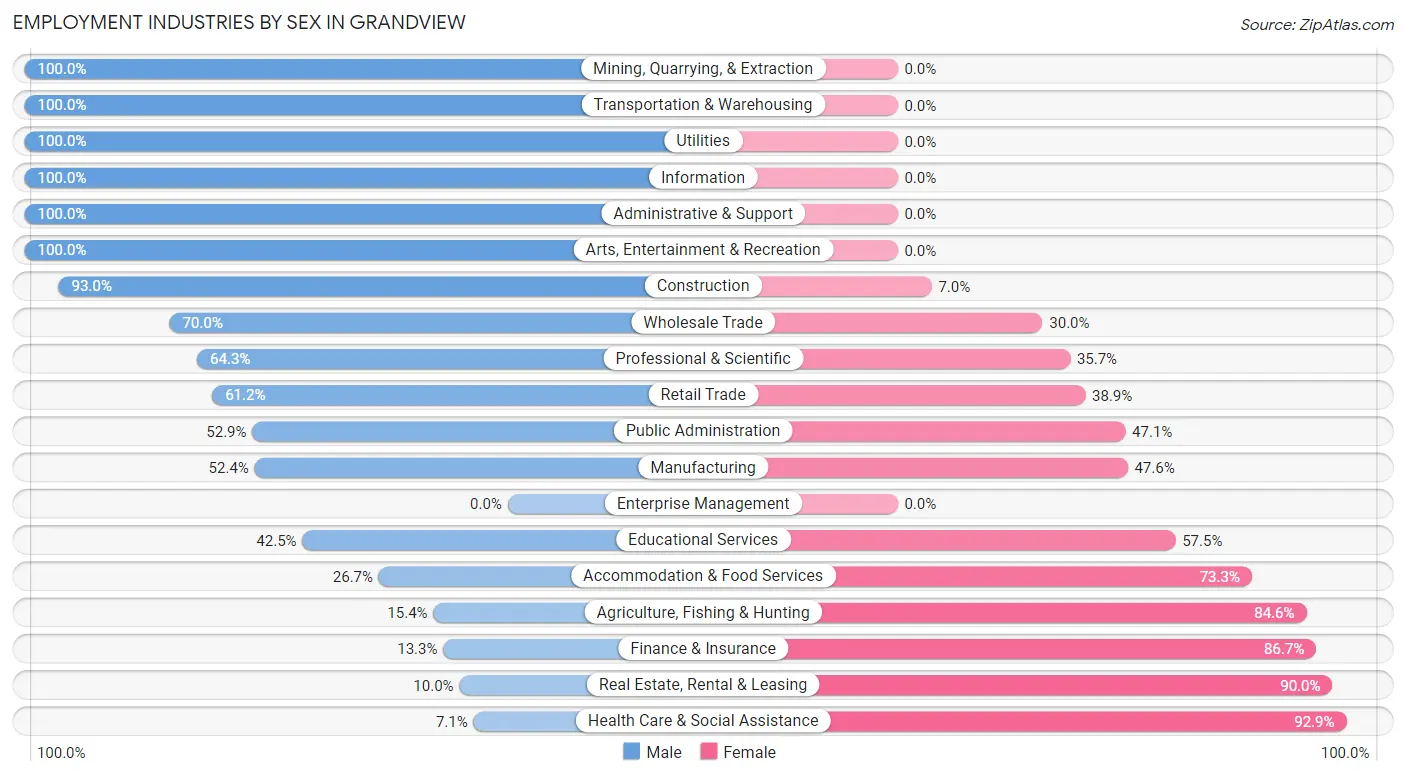
The Grandview industries that see more men than women are Mining, Quarrying, & Extraction (100.0%), Transportation & Warehousing (100.0%), and Utilities (100.0%), whereas the industries that tend to have a higher number of women are Health Care & Social Assistance (92.9%), Real Estate, Rental & Leasing (90.0%), and Finance & Insurance (86.7%).
| Industry | Male | Female |
| Agriculture, Fishing & Hunting | 2 (15.4%) | 11 (84.6%) |
| Mining, Quarrying, & Extraction | 21 (100.0%) | 0 (0.0%) |
| Construction | 66 (93.0%) | 5 (7.0%) |
| Manufacturing | 33 (52.4%) | 30 (47.6%) |
| Wholesale Trade | 7 (70.0%) | 3 (30.0%) |
| Retail Trade | 85 (61.2%) | 54 (38.9%) |
| Transportation & Warehousing | 49 (100.0%) | 0 (0.0%) |
| Utilities | 41 (100.0%) | 0 (0.0%) |
| Information | 4 (100.0%) | 0 (0.0%) |
| Finance & Insurance | 2 (13.3%) | 13 (86.7%) |
| Real Estate, Rental & Leasing | 2 (10.0%) | 18 (90.0%) |
| Professional & Scientific | 9 (64.3%) | 5 (35.7%) |
| Enterprise Management | 0 (0.0%) | 0 (0.0%) |
| Administrative & Support | 23 (100.0%) | 0 (0.0%) |
| Educational Services | 34 (42.5%) | 46 (57.5%) |
| Health Care & Social Assistance | 8 (7.1%) | 105 (92.9%) |
| Arts, Entertainment & Recreation | 6 (100.0%) | 0 (0.0%) |
| Accommodation & Food Services | 4 (26.7%) | 11 (73.3%) |
| Public Administration | 37 (52.9%) | 33 (47.1%) |
| Total | 477 (54.4%) | 399 (45.6%) |
Education in Grandview
School Enrollment in Grandview
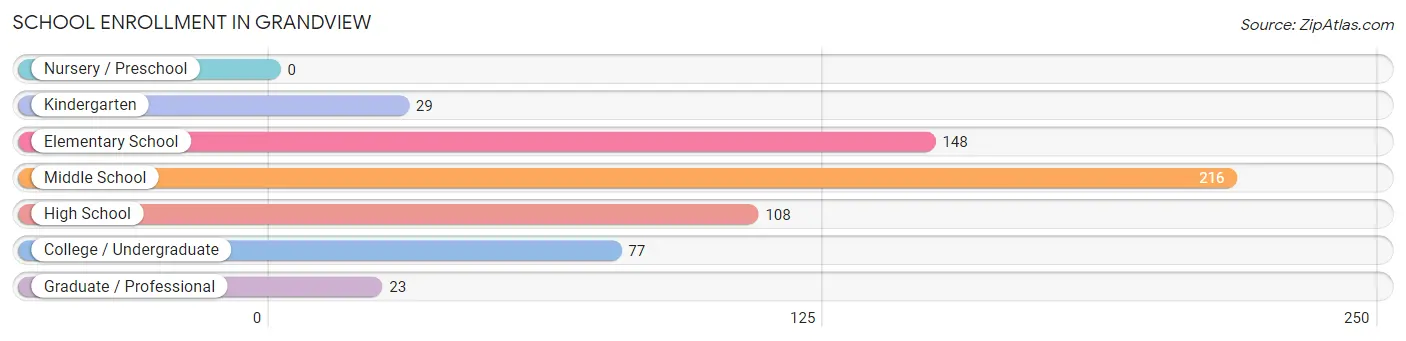
The most common levels of schooling among the 601 students in Grandview are middle school (216 | 35.9%), elementary school (148 | 24.6%), and high school (108 | 18.0%).
| School Level | # Students | % Students |
| Nursery / Preschool | 0 | 0.0% |
| Kindergarten | 29 | 4.8% |
| Elementary School | 148 | 24.6% |
| Middle School | 216 | 35.9% |
| High School | 108 | 18.0% |
| College / Undergraduate | 77 | 12.8% |
| Graduate / Professional | 23 | 3.8% |
| Total | 601 | 100.0% |
School Enrollment by Age by Funding Source in Grandview
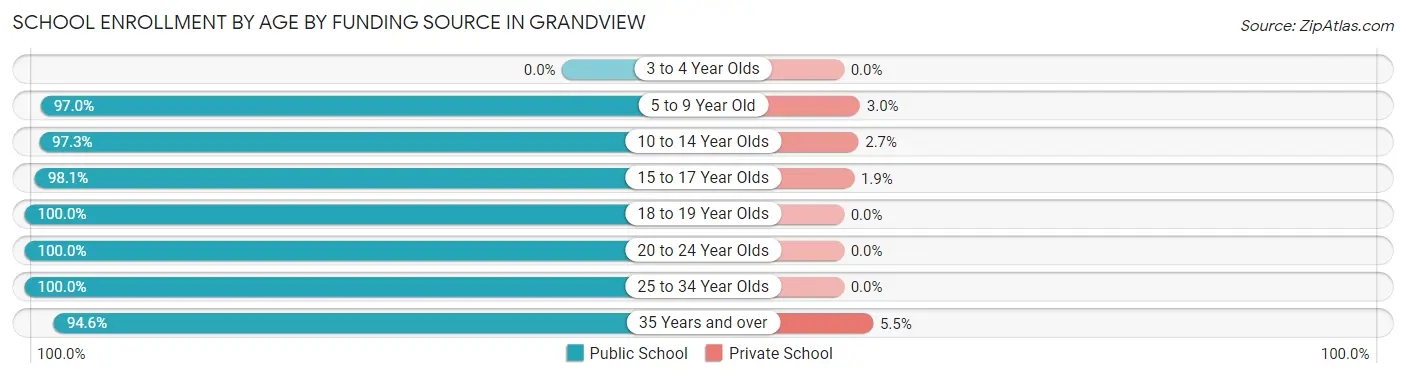
Out of a total of 601 students who are enrolled in schools in Grandview, 16 (2.7%) attend a private institution, while the remaining 585 (97.3%) are enrolled in public schools. The age group of 35 years and over has the highest likelihood of being enrolled in private schools, with 3 (5.4% in the age bracket) enrolled. Conversely, the age group of 18 to 19 year olds has the lowest likelihood of being enrolled in a private school, with 24 (100.0% in the age bracket) attending a public institution.
| Age Bracket | Public School | Private School |
| 3 to 4 Year Olds | 0 (0.0%) | 0 (0.0%) |
| 5 to 9 Year Old | 161 (97.0%) | 5 (3.0%) |
| 10 to 14 Year Olds | 250 (97.3%) | 7 (2.7%) |
| 15 to 17 Year Olds | 51 (98.1%) | 1 (1.9%) |
| 18 to 19 Year Olds | 24 (100.0%) | 0 (0.0%) |
| 20 to 24 Year Olds | 4 (100.0%) | 0 (0.0%) |
| 25 to 34 Year Olds | 43 (100.0%) | 0 (0.0%) |
| 35 Years and over | 52 (94.6%) | 3 (5.4%) |
| Total | 585 (97.3%) | 16 (2.7%) |
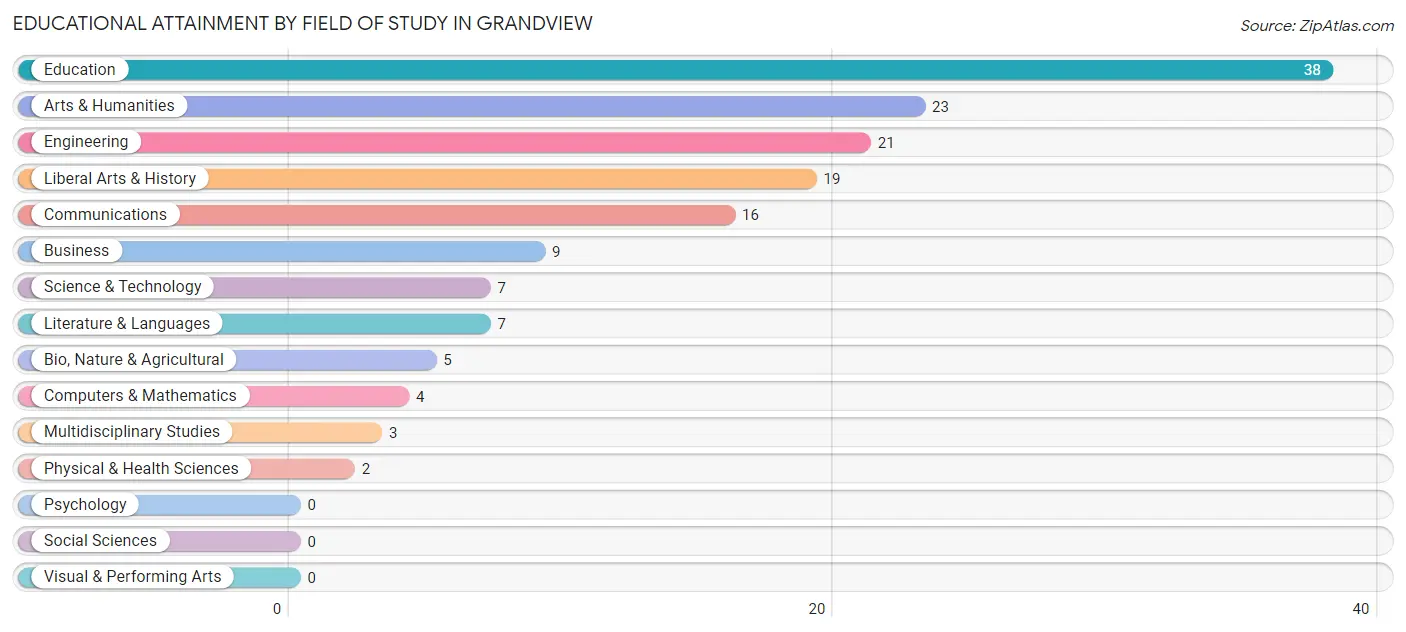
Educational Attainment by Field of Study in Grandview
Education (38 | 24.7%), arts & humanities (23 | 14.9%), engineering (21 | 13.6%), liberal arts & history (19 | 12.3%), and communications (16 | 10.4%) are the most common fields of study among 154 individuals in Grandview who have obtained a bachelor's degree or higher.
| Field of Study | # Graduates | % Graduates |
| Computers & Mathematics | 4 | 2.6% |
| Bio, Nature & Agricultural | 5 | 3.3% |
| Physical & Health Sciences | 2 | 1.3% |
| Psychology | 0 | 0.0% |
| Social Sciences | 0 | 0.0% |
| Engineering | 21 | 13.6% |
| Multidisciplinary Studies | 3 | 1.9% |
| Science & Technology | 7 | 4.5% |
| Business | 9 | 5.8% |
| Education | 38 | 24.7% |
| Literature & Languages | 7 | 4.5% |
| Liberal Arts & History | 19 | 12.3% |
| Visual & Performing Arts | 0 | 0.0% |
| Communications | 16 | 10.4% |
| Arts & Humanities | 23 | 14.9% |
| Total | 154 | 100.0% |
Transportation & Commute in Grandview
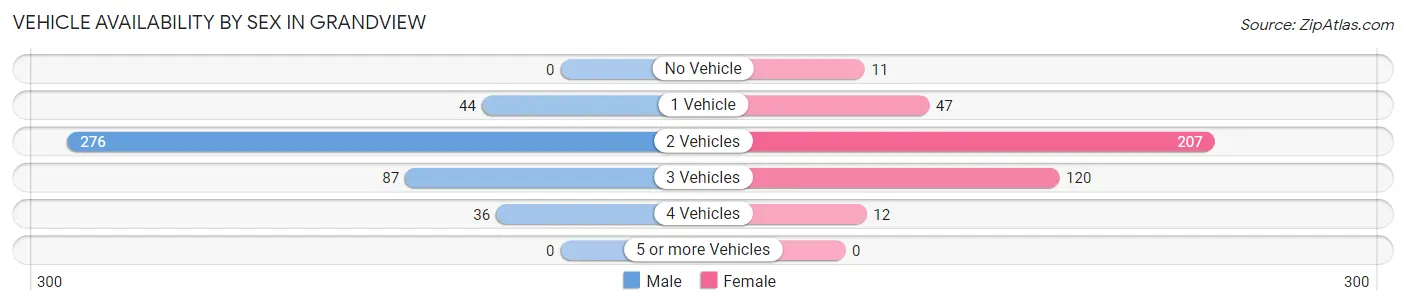
Vehicle Availability by Sex in Grandview
The most prevalent vehicle ownership categories in Grandview are males with 2 vehicles (276, accounting for 62.3%) and females with 2 vehicles (207, making up 69.5%).
| Vehicles Available | Male | Female |
| No Vehicle | 0 (0.0%) | 11 (2.8%) |
| 1 Vehicle | 44 (9.9%) | 47 (11.8%) |
| 2 Vehicles | 276 (62.3%) | 207 (52.1%) |
| 3 Vehicles | 87 (19.6%) | 120 (30.2%) |
| 4 Vehicles | 36 (8.1%) | 12 (3.0%) |
| 5 or more Vehicles | 0 (0.0%) | 0 (0.0%) |
| Total | 443 (100.0%) | 397 (100.0%) |
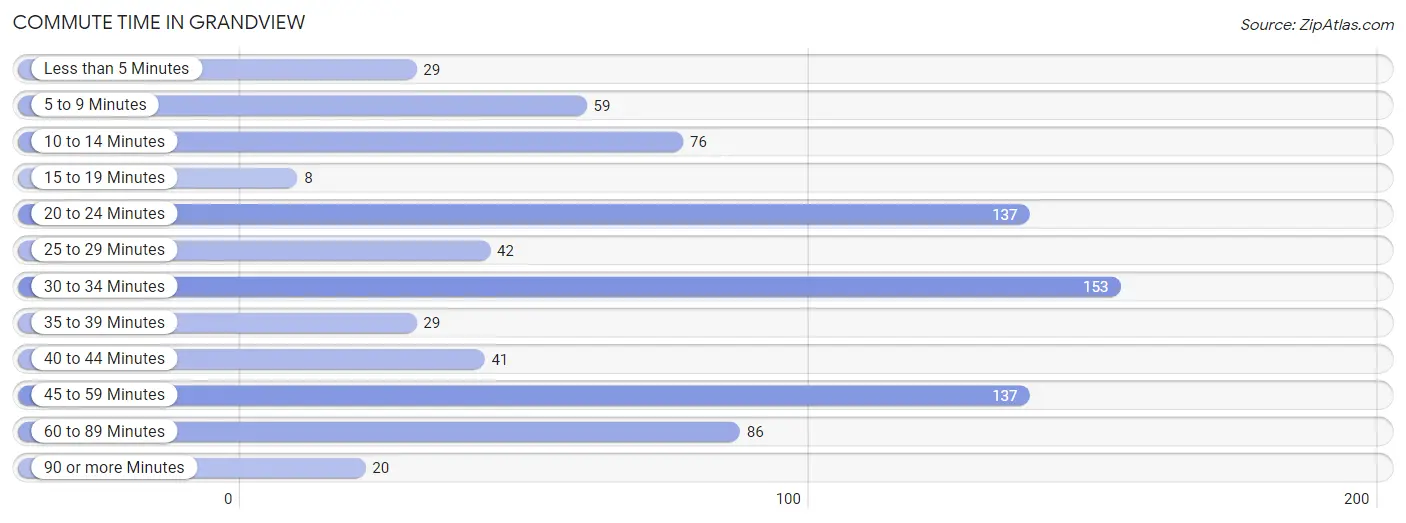
Commute Time in Grandview
The most frequently occuring commute durations in Grandview are 30 to 34 minutes (153 commuters, 18.7%), 20 to 24 minutes (137 commuters, 16.8%), and 45 to 59 minutes (137 commuters, 16.8%).
| Commute Time | # Commuters | % Commuters |
| Less than 5 Minutes | 29 | 3.5% |
| 5 to 9 Minutes | 59 | 7.2% |
| 10 to 14 Minutes | 76 | 9.3% |
| 15 to 19 Minutes | 8 | 1.0% |
| 20 to 24 Minutes | 137 | 16.8% |
| 25 to 29 Minutes | 42 | 5.1% |
| 30 to 34 Minutes | 153 | 18.7% |
| 35 to 39 Minutes | 29 | 3.5% |
| 40 to 44 Minutes | 41 | 5.0% |
| 45 to 59 Minutes | 137 | 16.8% |
| 60 to 89 Minutes | 86 | 10.5% |
| 90 or more Minutes | 20 | 2.5% |
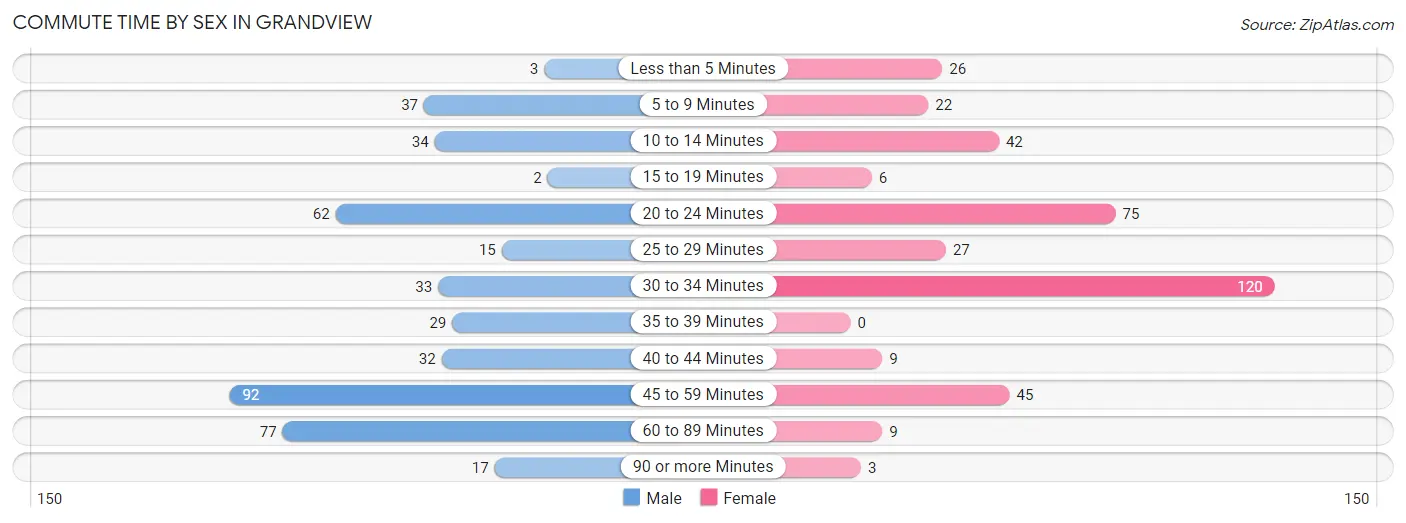
Commute Time by Sex in Grandview
The most common commute times in Grandview are 45 to 59 minutes (92 commuters, 21.2%) for males and 30 to 34 minutes (120 commuters, 31.2%) for females.
| Commute Time | Male | Female |
| Less than 5 Minutes | 3 (0.7%) | 26 (6.8%) |
| 5 to 9 Minutes | 37 (8.6%) | 22 (5.7%) |
| 10 to 14 Minutes | 34 (7.9%) | 42 (10.9%) |
| 15 to 19 Minutes | 2 (0.5%) | 6 (1.6%) |
| 20 to 24 Minutes | 62 (14.3%) | 75 (19.5%) |
| 25 to 29 Minutes | 15 (3.5%) | 27 (7.0%) |
| 30 to 34 Minutes | 33 (7.6%) | 120 (31.2%) |
| 35 to 39 Minutes | 29 (6.7%) | 0 (0.0%) |
| 40 to 44 Minutes | 32 (7.4%) | 9 (2.3%) |
| 45 to 59 Minutes | 92 (21.2%) | 45 (11.7%) |
| 60 to 89 Minutes | 77 (17.8%) | 9 (2.3%) |
| 90 or more Minutes | 17 (3.9%) | 3 (0.8%) |
Time of Departure to Work by Sex in Grandview
The most frequent times of departure to work in Grandview are 7:00 AM to 7:29 AM (142, 32.8%) for males and 7:00 AM to 7:29 AM (145, 37.8%) for females.
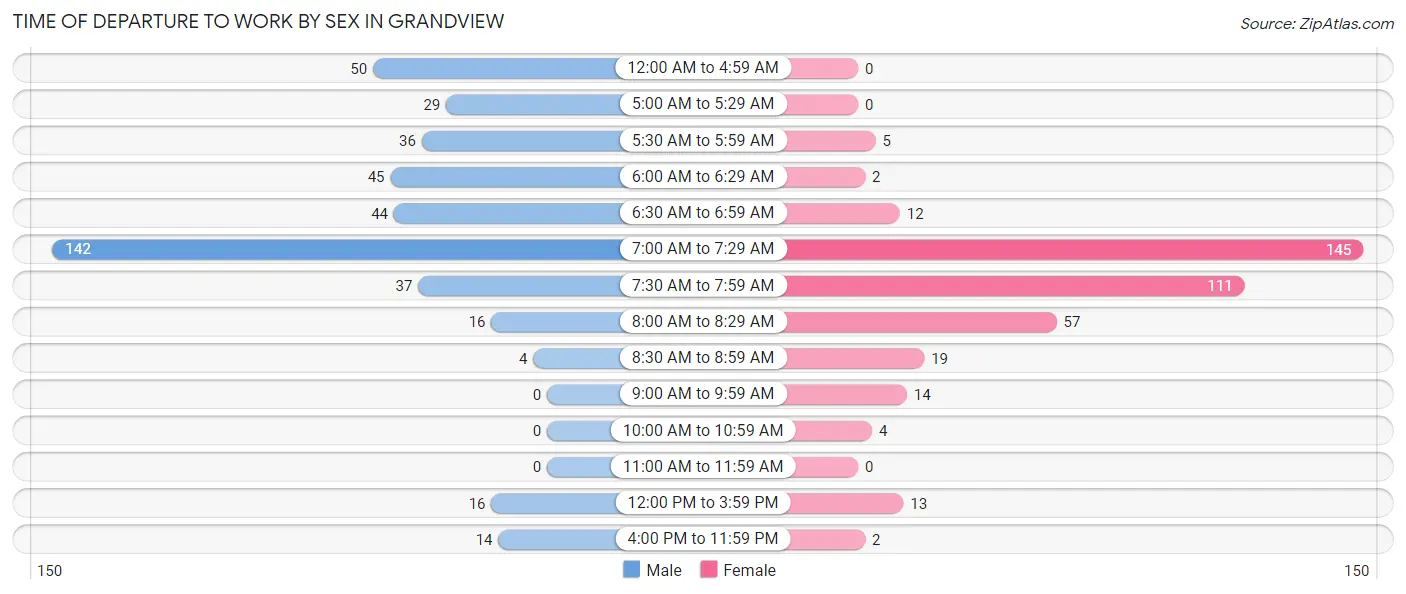
| Time of Departure | Male | Female |
| 12:00 AM to 4:59 AM | 50 (11.6%) | 0 (0.0%) |
| 5:00 AM to 5:29 AM | 29 (6.7%) | 0 (0.0%) |
| 5:30 AM to 5:59 AM | 36 (8.3%) | 5 (1.3%) |
| 6:00 AM to 6:29 AM | 45 (10.4%) | 2 (0.5%) |
| 6:30 AM to 6:59 AM | 44 (10.2%) | 12 (3.1%) |
| 7:00 AM to 7:29 AM | 142 (32.8%) | 145 (37.8%) |
| 7:30 AM to 7:59 AM | 37 (8.6%) | 111 (28.9%) |
| 8:00 AM to 8:29 AM | 16 (3.7%) | 57 (14.8%) |
| 8:30 AM to 8:59 AM | 4 (0.9%) | 19 (5.0%) |
| 9:00 AM to 9:59 AM | 0 (0.0%) | 14 (3.6%) |
| 10:00 AM to 10:59 AM | 0 (0.0%) | 4 (1.0%) |
| 11:00 AM to 11:59 AM | 0 (0.0%) | 0 (0.0%) |
| 12:00 PM to 3:59 PM | 16 (3.7%) | 13 (3.4%) |
| 4:00 PM to 11:59 PM | 14 (3.2%) | 2 (0.5%) |
| Total | 433 (100.0%) | 384 (100.0%) |
Housing Occupancy in Grandview
Occupancy by Ownership in Grandview
Of the total 671 dwellings in Grandview, owner-occupied units account for 413 (61.6%), while renter-occupied units make up 258 (38.5%).
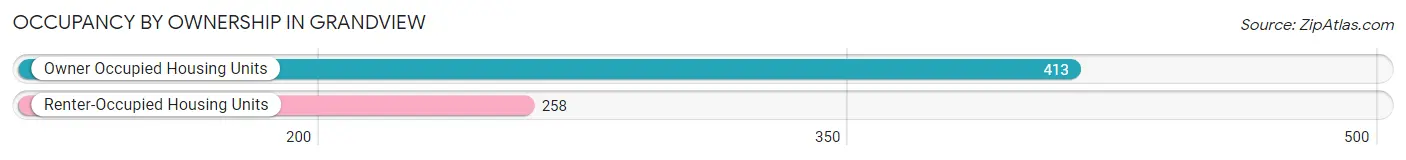
| Occupancy | # Housing Units | % Housing Units |
| Owner Occupied Housing Units | 413 | 61.6% |
| Renter-Occupied Housing Units | 258 | 38.5% |
| Total Occupied Housing Units | 671 | 100.0% |
Occupancy by Household Size in Grandview
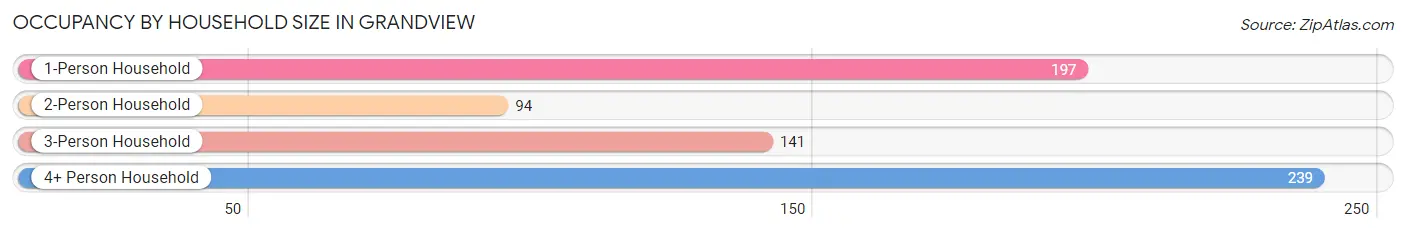
| Household Size | # Housing Units | % Housing Units |
| 1-Person Household | 197 | 29.4% |
| 2-Person Household | 94 | 14.0% |
| 3-Person Household | 141 | 21.0% |
| 4+ Person Household | 239 | 35.6% |
| Total Housing Units | 671 | 100.0% |
Occupancy by Ownership by Household Size in Grandview
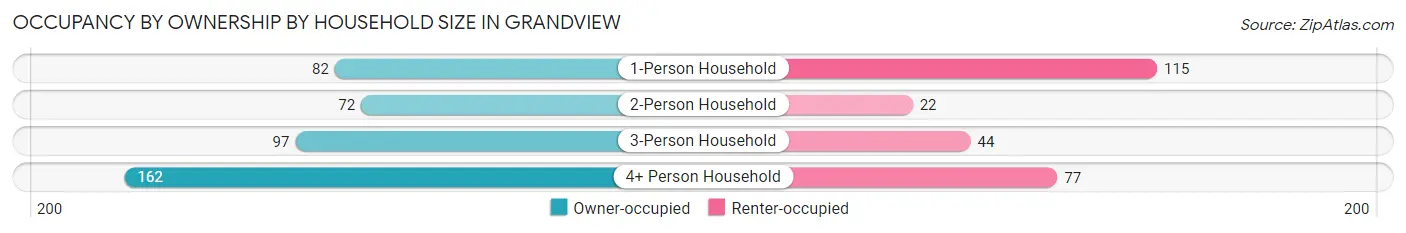
| Household Size | Owner-occupied | Renter-occupied |
| 1-Person Household | 82 (41.6%) | 115 (58.4%) |
| 2-Person Household | 72 (76.6%) | 22 (23.4%) |
| 3-Person Household | 97 (68.8%) | 44 (31.2%) |
| 4+ Person Household | 162 (67.8%) | 77 (32.2%) |
| Total Housing Units | 413 (61.6%) | 258 (38.5%) |
Occupancy by Educational Attainment in Grandview
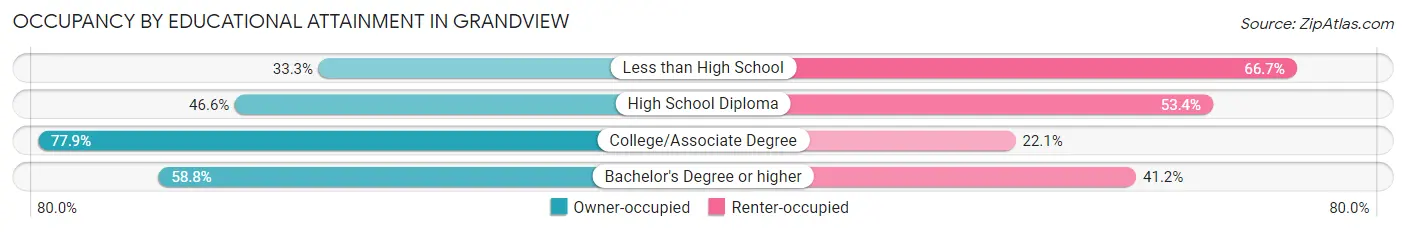
| Household Size | Owner-occupied | Renter-occupied |
| Less than High School | 21 (33.3%) | 42 (66.7%) |
| High School Diploma | 89 (46.6%) | 102 (53.4%) |
| College/Associate Degree | 236 (77.9%) | 67 (22.1%) |
| Bachelor's Degree or higher | 67 (58.8%) | 47 (41.2%) |
Occupancy by Age of Householder in Grandview
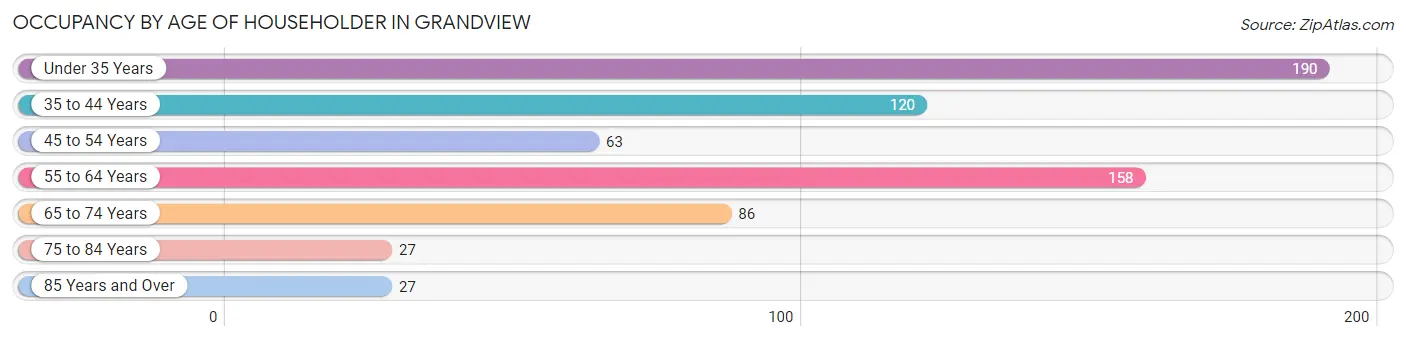
| Age Bracket | # Households | % Households |
| Under 35 Years | 190 | 28.3% |
| 35 to 44 Years | 120 | 17.9% |
| 45 to 54 Years | 63 | 9.4% |
| 55 to 64 Years | 158 | 23.5% |
| 65 to 74 Years | 86 | 12.8% |
| 75 to 84 Years | 27 | 4.0% |
| 85 Years and Over | 27 | 4.0% |
| Total | 671 | 100.0% |
Housing Finances in Grandview
Median Income by Occupancy in Grandview
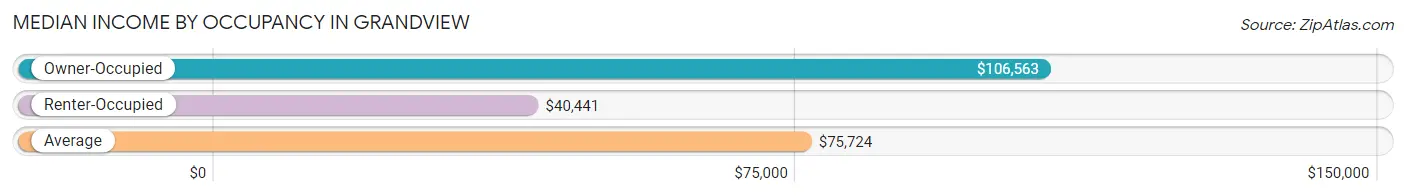
| Occupancy Type | # Households | Median Income |
| Owner-Occupied | 413 (61.6%) | $106,563 |
| Renter-Occupied | 258 (38.5%) | $40,441 |
| Average | 671 (100.0%) | $75,724 |
Occupancy by Householder Income Bracket in Grandview
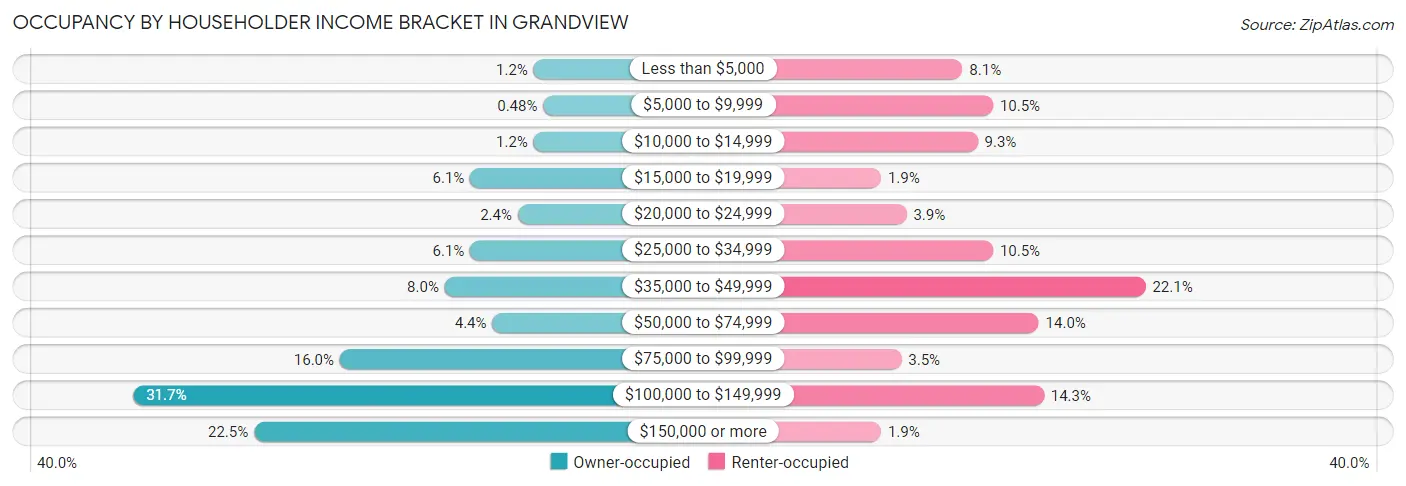
| Income Bracket | Owner-occupied | Renter-occupied |
| Less than $5,000 | 5 (1.2%) | 21 (8.1%) |
| $5,000 to $9,999 | 2 (0.5%) | 27 (10.5%) |
| $10,000 to $14,999 | 5 (1.2%) | 24 (9.3%) |
| $15,000 to $19,999 | 25 (6.0%) | 5 (1.9%) |
| $20,000 to $24,999 | 10 (2.4%) | 10 (3.9%) |
| $25,000 to $34,999 | 25 (6.0%) | 27 (10.5%) |
| $35,000 to $49,999 | 33 (8.0%) | 57 (22.1%) |
| $50,000 to $74,999 | 18 (4.4%) | 36 (14.0%) |
| $75,000 to $99,999 | 66 (16.0%) | 9 (3.5%) |
| $100,000 to $149,999 | 131 (31.7%) | 37 (14.3%) |
| $150,000 or more | 93 (22.5%) | 5 (1.9%) |
| Total | 413 (100.0%) | 258 (100.0%) |
Monthly Housing Cost Tiers in Grandview
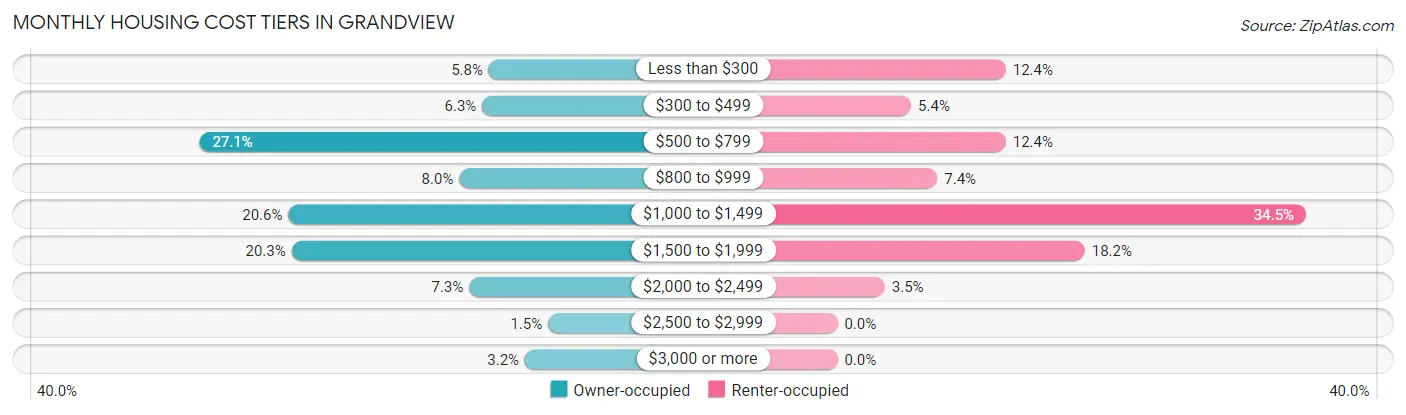
| Monthly Cost | Owner-occupied | Renter-occupied |
| Less than $300 | 24 (5.8%) | 32 (12.4%) |
| $300 to $499 | 26 (6.3%) | 14 (5.4%) |
| $500 to $799 | 112 (27.1%) | 32 (12.4%) |
| $800 to $999 | 33 (8.0%) | 19 (7.4%) |
| $1,000 to $1,499 | 85 (20.6%) | 89 (34.5%) |
| $1,500 to $1,999 | 84 (20.3%) | 47 (18.2%) |
| $2,000 to $2,499 | 30 (7.3%) | 9 (3.5%) |
| $2,500 to $2,999 | 6 (1.5%) | 0 (0.0%) |
| $3,000 or more | 13 (3.2%) | 0 (0.0%) |
| Total | 413 (100.0%) | 258 (100.0%) |
Physical Housing Characteristics in Grandview
Housing Structures in Grandview
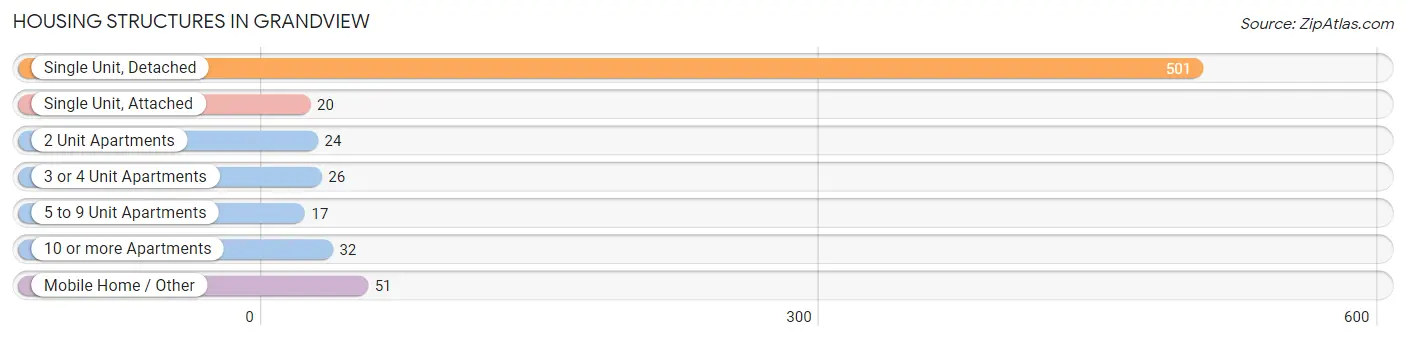
| Structure Type | # Housing Units | % Housing Units |
| Single Unit, Detached | 501 | 74.7% |
| Single Unit, Attached | 20 | 3.0% |
| 2 Unit Apartments | 24 | 3.6% |
| 3 or 4 Unit Apartments | 26 | 3.9% |
| 5 to 9 Unit Apartments | 17 | 2.5% |
| 10 or more Apartments | 32 | 4.8% |
| Mobile Home / Other | 51 | 7.6% |
| Total | 671 | 100.0% |
Housing Structures by Occupancy in Grandview
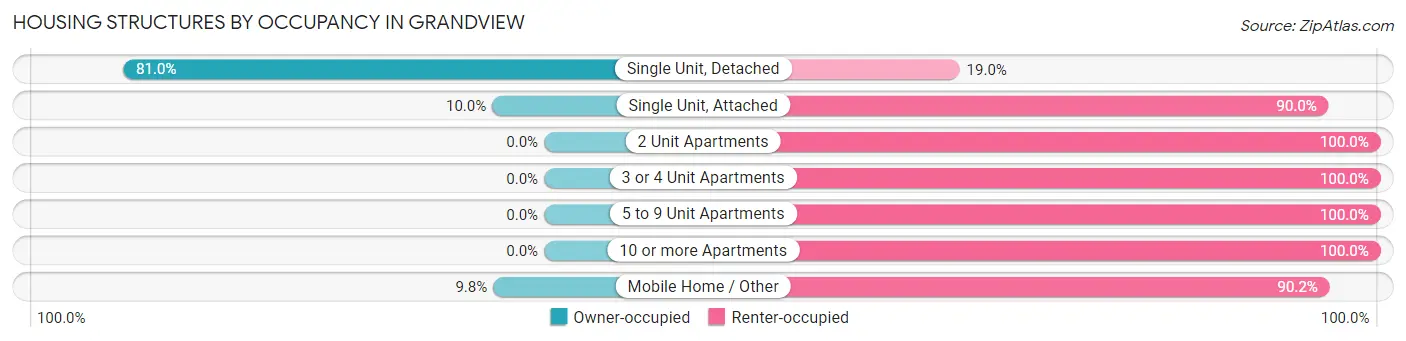
| Structure Type | Owner-occupied | Renter-occupied |
| Single Unit, Detached | 406 (81.0%) | 95 (19.0%) |
| Single Unit, Attached | 2 (10.0%) | 18 (90.0%) |
| 2 Unit Apartments | 0 (0.0%) | 24 (100.0%) |
| 3 or 4 Unit Apartments | 0 (0.0%) | 26 (100.0%) |
| 5 to 9 Unit Apartments | 0 (0.0%) | 17 (100.0%) |
| 10 or more Apartments | 0 (0.0%) | 32 (100.0%) |
| Mobile Home / Other | 5 (9.8%) | 46 (90.2%) |
| Total | 413 (61.6%) | 258 (38.5%) |
Housing Structures by Number of Rooms in Grandview
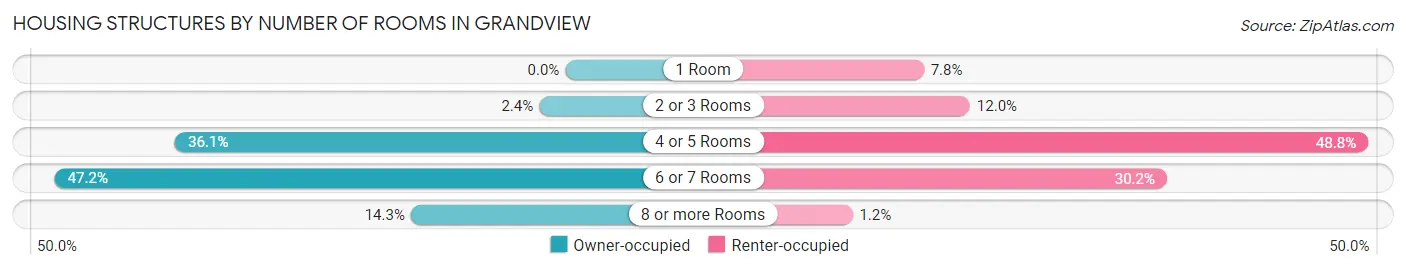
| Number of Rooms | Owner-occupied | Renter-occupied |
| 1 Room | 0 (0.0%) | 20 (7.7%) |
| 2 or 3 Rooms | 10 (2.4%) | 31 (12.0%) |
| 4 or 5 Rooms | 149 (36.1%) | 126 (48.8%) |
| 6 or 7 Rooms | 195 (47.2%) | 78 (30.2%) |
| 8 or more Rooms | 59 (14.3%) | 3 (1.2%) |
| Total | 413 (100.0%) | 258 (100.0%) |
Housing Structure by Heating Type in Grandview
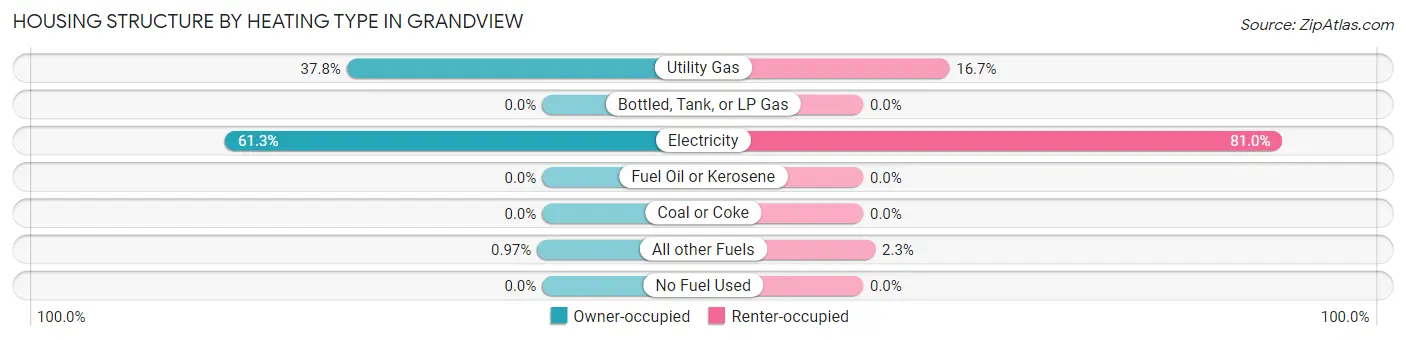
| Heating Type | Owner-occupied | Renter-occupied |
| Utility Gas | 156 (37.8%) | 43 (16.7%) |
| Bottled, Tank, or LP Gas | 0 (0.0%) | 0 (0.0%) |
| Electricity | 253 (61.3%) | 209 (81.0%) |
| Fuel Oil or Kerosene | 0 (0.0%) | 0 (0.0%) |
| Coal or Coke | 0 (0.0%) | 0 (0.0%) |
| All other Fuels | 4 (1.0%) | 6 (2.3%) |
| No Fuel Used | 0 (0.0%) | 0 (0.0%) |
| Total | 413 (100.0%) | 258 (100.0%) |
Household Vehicle Usage in Grandview
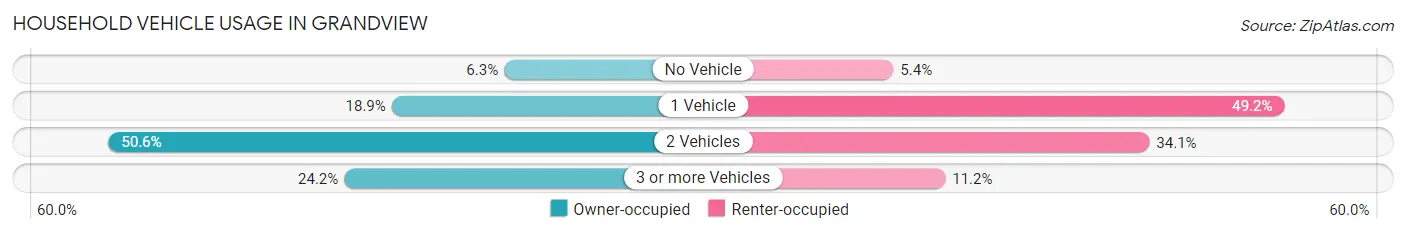
| Vehicles per Household | Owner-occupied | Renter-occupied |
| No Vehicle | 26 (6.3%) | 14 (5.4%) |
| 1 Vehicle | 78 (18.9%) | 127 (49.2%) |
| 2 Vehicles | 209 (50.6%) | 88 (34.1%) |
| 3 or more Vehicles | 100 (24.2%) | 29 (11.2%) |
| Total | 413 (100.0%) | 258 (100.0%) |
Real Estate & Mortgages in Grandview
Real Estate and Mortgage Overview in Grandview
| Characteristic | Without Mortgage | With Mortgage |
| Housing Units | 194 | 219 |
| Median Property Value | $203,600 | $174,300 |
| Median Household Income | $76,538 | $27 |
| Monthly Housing Costs | $709 | $13 |
| Real Estate Taxes | $2,648 | $5 |
Property Value by Mortgage Status in Grandview
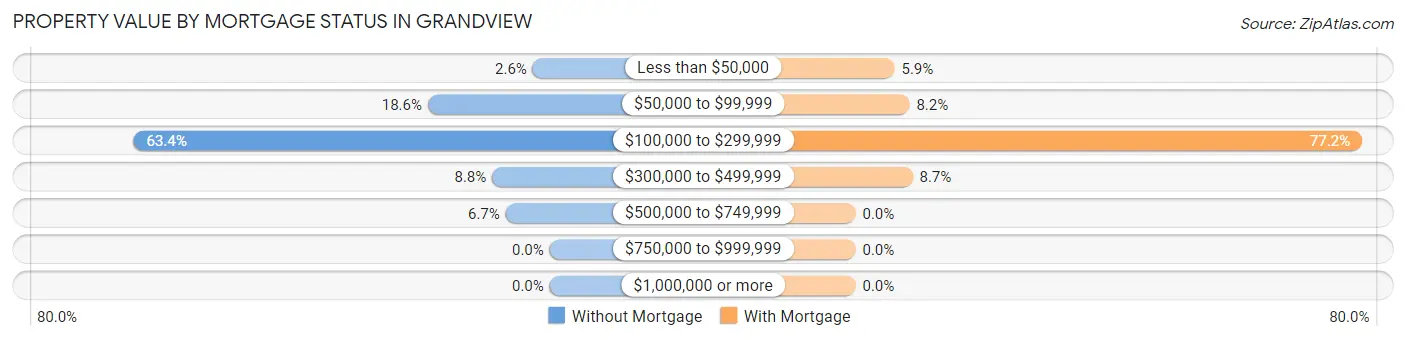
| Property Value | Without Mortgage | With Mortgage |
| Less than $50,000 | 5 (2.6%) | 13 (5.9%) |
| $50,000 to $99,999 | 36 (18.6%) | 18 (8.2%) |
| $100,000 to $299,999 | 123 (63.4%) | 169 (77.2%) |
| $300,000 to $499,999 | 17 (8.8%) | 19 (8.7%) |
| $500,000 to $749,999 | 13 (6.7%) | 0 (0.0%) |
| $750,000 to $999,999 | 0 (0.0%) | 0 (0.0%) |
| $1,000,000 or more | 0 (0.0%) | 0 (0.0%) |
| Total | 194 (100.0%) | 219 (100.0%) |
Household Income by Mortgage Status in Grandview
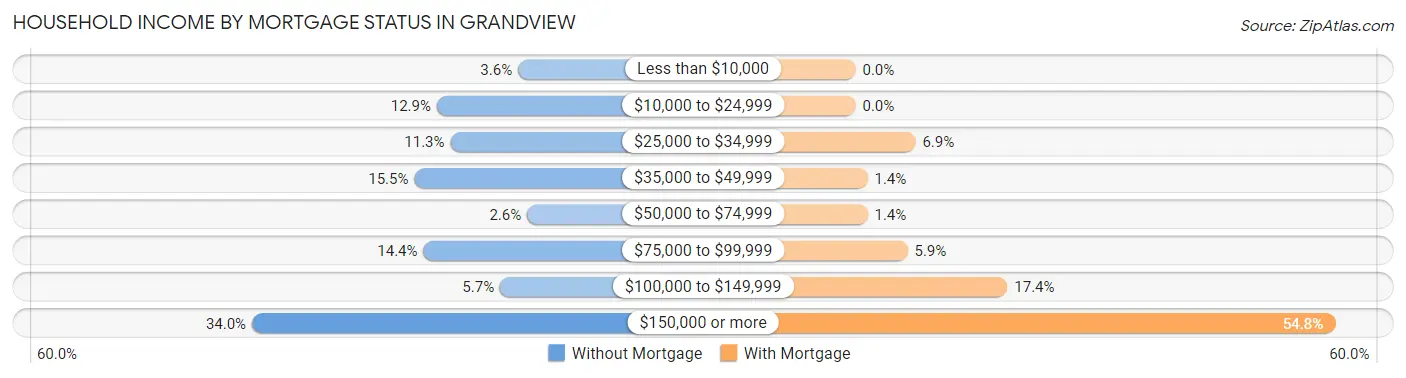
| Household Income | Without Mortgage | With Mortgage |
| Less than $10,000 | 7 (3.6%) | 0 (0.0%) |
| $10,000 to $24,999 | 25 (12.9%) | 0 (0.0%) |
| $25,000 to $34,999 | 22 (11.3%) | 15 (6.9%) |
| $35,000 to $49,999 | 30 (15.5%) | 3 (1.4%) |
| $50,000 to $74,999 | 5 (2.6%) | 3 (1.4%) |
| $75,000 to $99,999 | 28 (14.4%) | 13 (5.9%) |
| $100,000 to $149,999 | 11 (5.7%) | 38 (17.3%) |
| $150,000 or more | 66 (34.0%) | 120 (54.8%) |
| Total | 194 (100.0%) | 219 (100.0%) |
Property Value to Household Income Ratio in Grandview
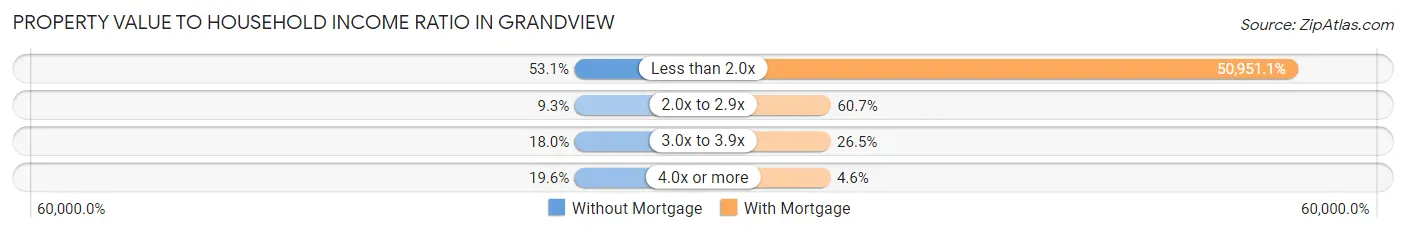
| Value-to-Income Ratio | Without Mortgage | With Mortgage |
| Less than 2.0x | 103 (53.1%) | 111,583 (50,951.1%) |
| 2.0x to 2.9x | 18 (9.3%) | 133 (60.7%) |
| 3.0x to 3.9x | 35 (18.0%) | 58 (26.5%) |
| 4.0x or more | 38 (19.6%) | 10 (4.6%) |
| Total | 194 (100.0%) | 219 (100.0%) |
Real Estate Taxes by Mortgage Status in Grandview
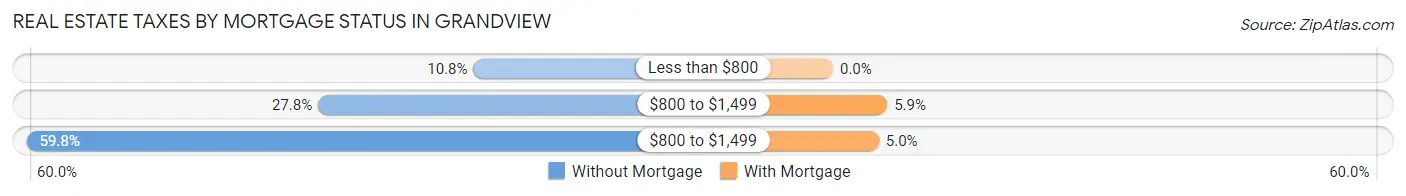
| Property Taxes | Without Mortgage | With Mortgage |
| Less than $800 | 21 (10.8%) | 0 (0.0%) |
| $800 to $1,499 | 54 (27.8%) | 13 (5.9%) |
| $800 to $1,499 | 116 (59.8%) | 11 (5.0%) |
| Total | 194 (100.0%) | 219 (100.0%) |
Health & Disability in Grandview
Health Insurance Coverage by Age in Grandview
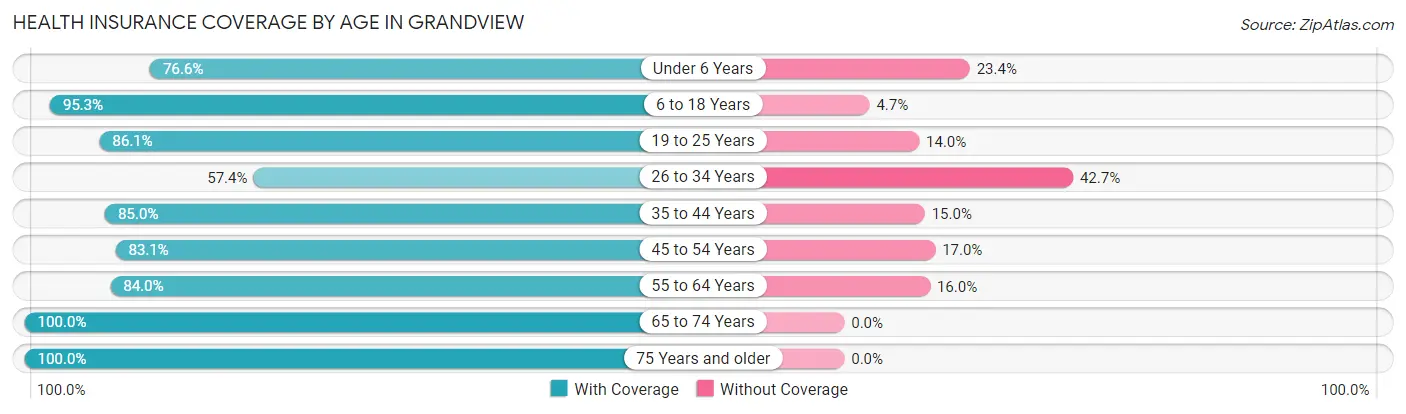
| Age Bracket | With Coverage | Without Coverage |
| Under 6 Years | 95 (76.6%) | 29 (23.4%) |
| 6 to 18 Years | 507 (95.3%) | 25 (4.7%) |
| 19 to 25 Years | 111 (86.1%) | 18 (14.0%) |
| 26 to 34 Years | 156 (57.4%) | 116 (42.6%) |
| 35 to 44 Years | 255 (85.0%) | 45 (15.0%) |
| 45 to 54 Years | 98 (83.1%) | 20 (17.0%) |
| 55 to 64 Years | 205 (84.0%) | 39 (16.0%) |
| 65 to 74 Years | 112 (100.0%) | 0 (0.0%) |
| 75 Years and older | 66 (100.0%) | 0 (0.0%) |
| Total | 1,605 (84.6%) | 292 (15.4%) |
Health Insurance Coverage by Citizenship Status in Grandview

| Citizenship Status | With Coverage | Without Coverage |
| Native Born | 95 (76.6%) | 29 (23.4%) |
| Foreign Born, Citizen | 507 (95.3%) | 25 (4.7%) |
| Foreign Born, not a Citizen | 111 (86.1%) | 18 (14.0%) |
Health Insurance Coverage by Household Income in Grandview
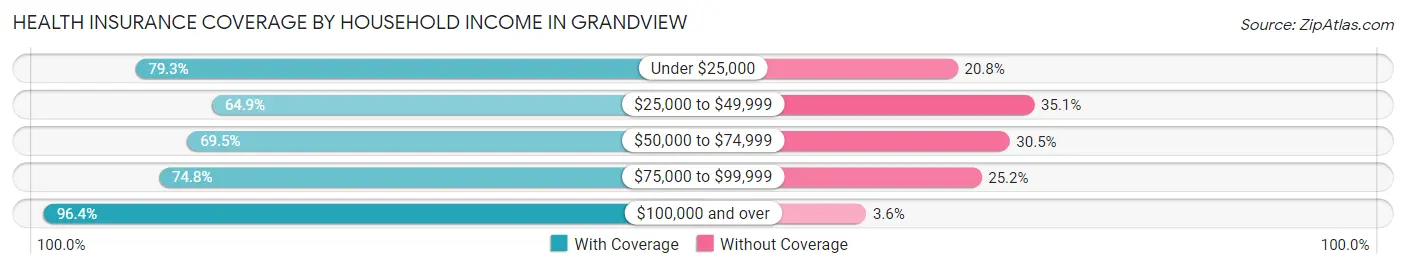
| Household Income | With Coverage | Without Coverage |
| Under $25,000 | 126 (79.2%) | 33 (20.7%) |
| $25,000 to $49,999 | 222 (64.9%) | 120 (35.1%) |
| $50,000 to $74,999 | 89 (69.5%) | 39 (30.5%) |
| $75,000 to $99,999 | 190 (74.8%) | 64 (25.2%) |
| $100,000 and over | 967 (96.4%) | 36 (3.6%) |
Public vs Private Health Insurance Coverage by Age in Grandview
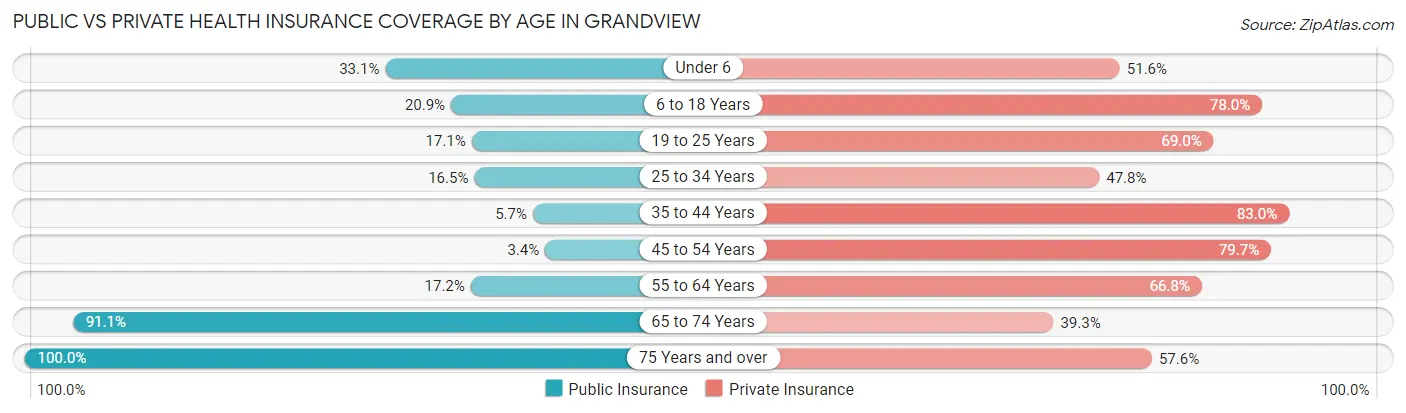
| Age Bracket | Public Insurance | Private Insurance |
| Under 6 | 41 (33.1%) | 64 (51.6%) |
| 6 to 18 Years | 111 (20.9%) | 415 (78.0%) |
| 19 to 25 Years | 22 (17.1%) | 89 (69.0%) |
| 25 to 34 Years | 45 (16.5%) | 130 (47.8%) |
| 35 to 44 Years | 17 (5.7%) | 249 (83.0%) |
| 45 to 54 Years | 4 (3.4%) | 94 (79.7%) |
| 55 to 64 Years | 42 (17.2%) | 163 (66.8%) |
| 65 to 74 Years | 102 (91.1%) | 44 (39.3%) |
| 75 Years and over | 66 (100.0%) | 38 (57.6%) |
| Total | 450 (23.7%) | 1,286 (67.8%) |
Disability Status by Sex by Age in Grandview
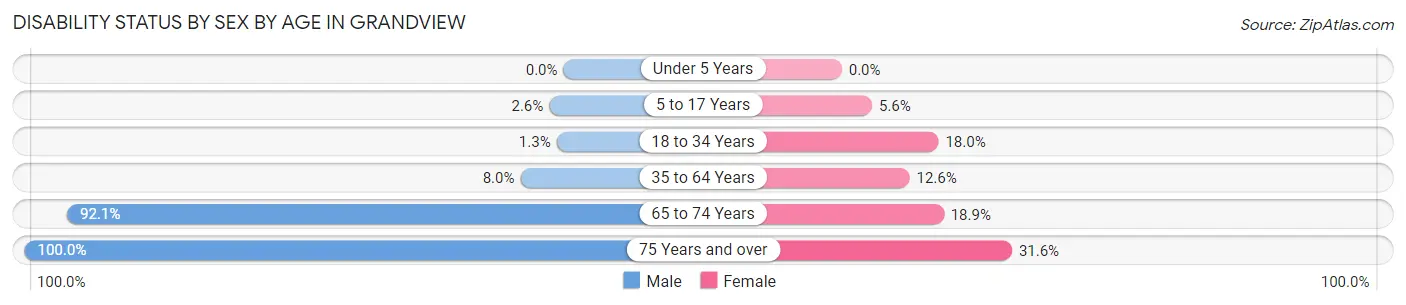
| Age Bracket | Male | Female |
| Under 5 Years | 0 (0.0%) | 0 (0.0%) |
| 5 to 17 Years | 6 (2.6%) | 16 (5.6%) |
| 18 to 34 Years | 3 (1.3%) | 35 (17.9%) |
| 35 to 64 Years | 23 (8.0%) | 47 (12.6%) |
| 65 to 74 Years | 35 (92.1%) | 14 (18.9%) |
| 75 Years and over | 9 (100.0%) | 18 (31.6%) |
Disability Class by Sex by Age in Grandview
Disability Class: Hearing Difficulty
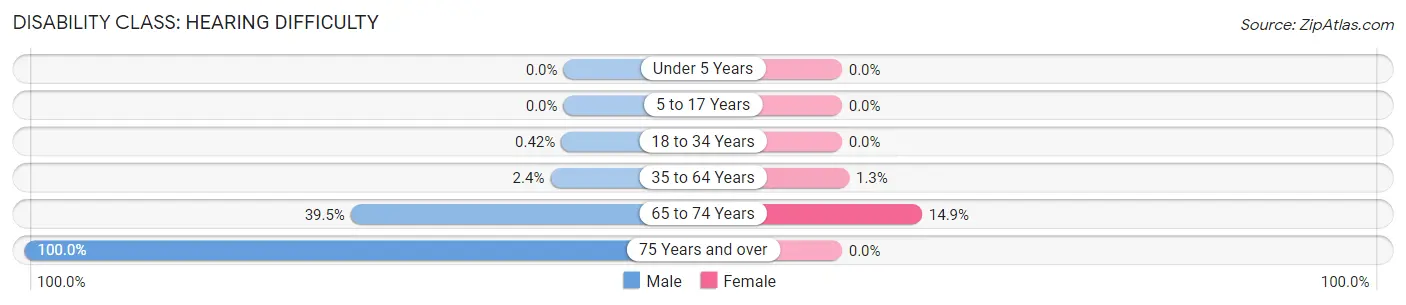
| Age Bracket | Male | Female |
| Under 5 Years | 0 (0.0%) | 0 (0.0%) |
| 5 to 17 Years | 0 (0.0%) | 0 (0.0%) |
| 18 to 34 Years | 1 (0.4%) | 0 (0.0%) |
| 35 to 64 Years | 7 (2.4%) | 5 (1.3%) |
| 65 to 74 Years | 15 (39.5%) | 11 (14.9%) |
| 75 Years and over | 9 (100.0%) | 0 (0.0%) |
Disability Class: Vision Difficulty
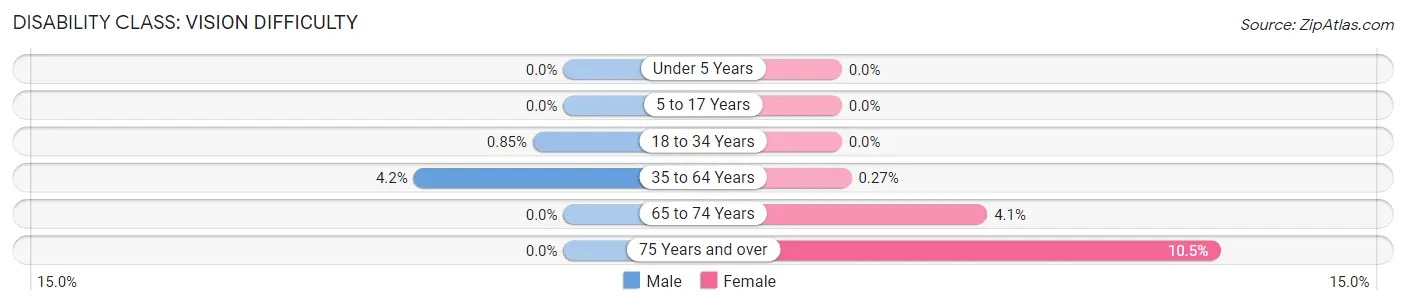
| Age Bracket | Male | Female |
| Under 5 Years | 0 (0.0%) | 0 (0.0%) |
| 5 to 17 Years | 0 (0.0%) | 0 (0.0%) |
| 18 to 34 Years | 2 (0.9%) | 0 (0.0%) |
| 35 to 64 Years | 12 (4.2%) | 1 (0.3%) |
| 65 to 74 Years | 0 (0.0%) | 3 (4.1%) |
| 75 Years and over | 0 (0.0%) | 6 (10.5%) |
Disability Class: Cognitive Difficulty
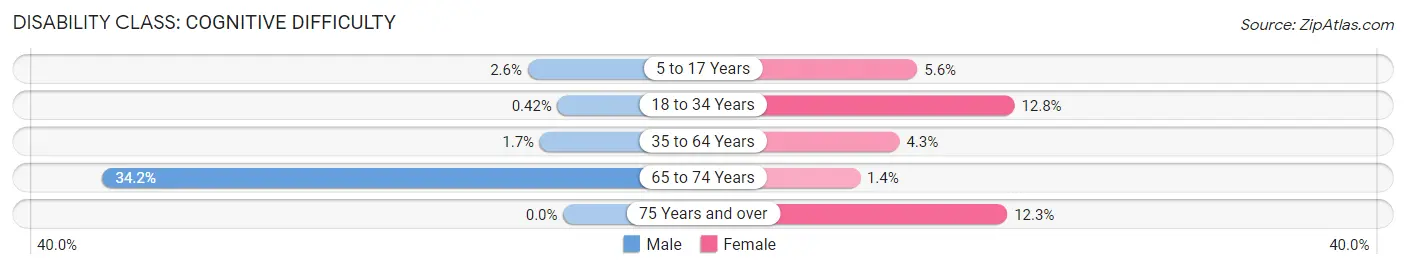
| Age Bracket | Male | Female |
| 5 to 17 Years | 6 (2.6%) | 16 (5.6%) |
| 18 to 34 Years | 1 (0.4%) | 25 (12.8%) |
| 35 to 64 Years | 5 (1.7%) | 16 (4.3%) |
| 65 to 74 Years | 13 (34.2%) | 1 (1.3%) |
| 75 Years and over | 0 (0.0%) | 7 (12.3%) |
Disability Class: Ambulatory Difficulty
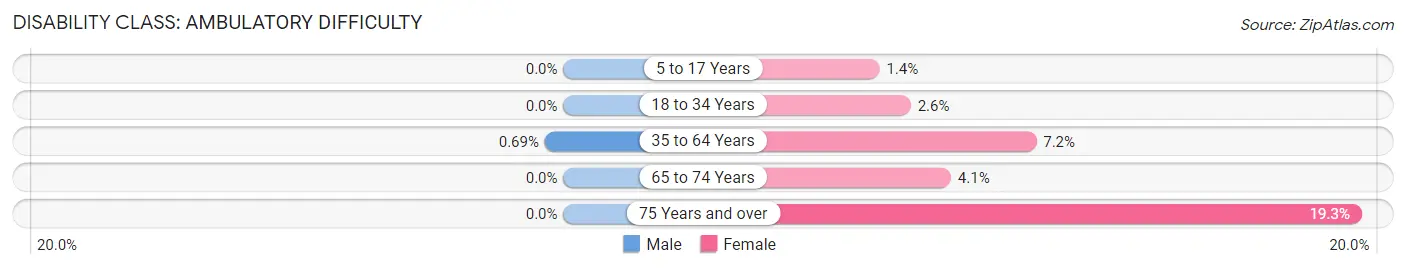
| Age Bracket | Male | Female |
| 5 to 17 Years | 0 (0.0%) | 4 (1.4%) |
| 18 to 34 Years | 0 (0.0%) | 5 (2.6%) |
| 35 to 64 Years | 2 (0.7%) | 27 (7.2%) |
| 65 to 74 Years | 0 (0.0%) | 3 (4.1%) |
| 75 Years and over | 0 (0.0%) | 11 (19.3%) |
Disability Class: Self-Care Difficulty
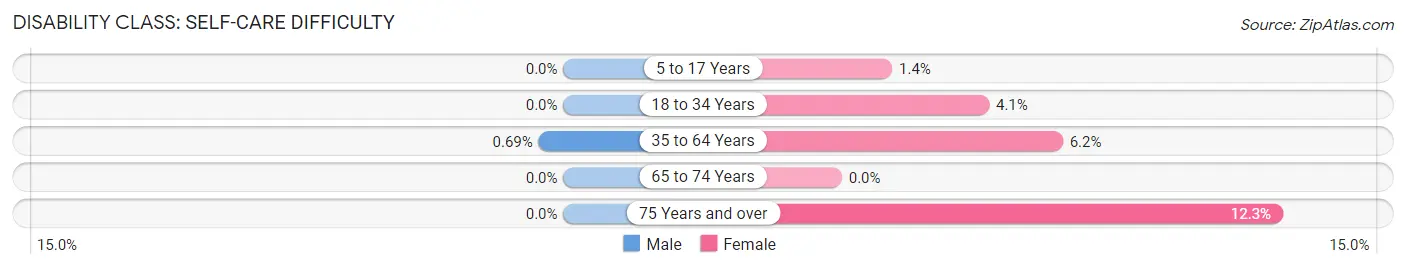
| Age Bracket | Male | Female |
| 5 to 17 Years | 0 (0.0%) | 4 (1.4%) |
| 18 to 34 Years | 0 (0.0%) | 8 (4.1%) |
| 35 to 64 Years | 2 (0.7%) | 23 (6.1%) |
| 65 to 74 Years | 0 (0.0%) | 0 (0.0%) |
| 75 Years and over | 0 (0.0%) | 7 (12.3%) |
Technology Access in Grandview
Computing Device Access in Grandview
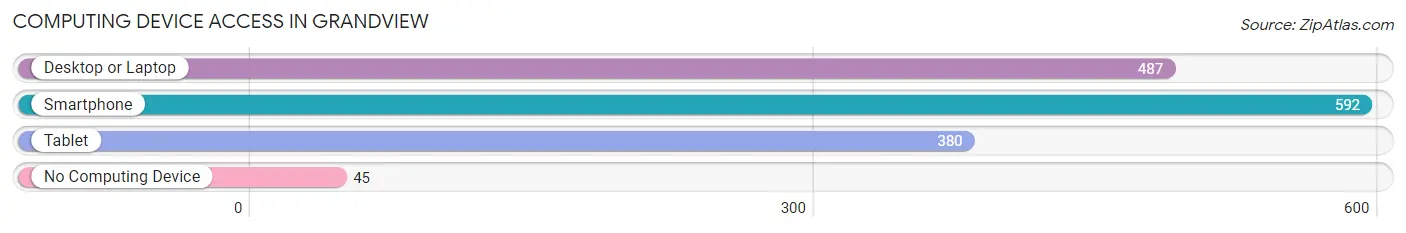
| Device Type | # Households | % Households |
| Desktop or Laptop | 487 | 72.6% |
| Smartphone | 592 | 88.2% |
| Tablet | 380 | 56.6% |
| No Computing Device | 45 | 6.7% |
| Total | 671 | 100.0% |
Internet Access in Grandview
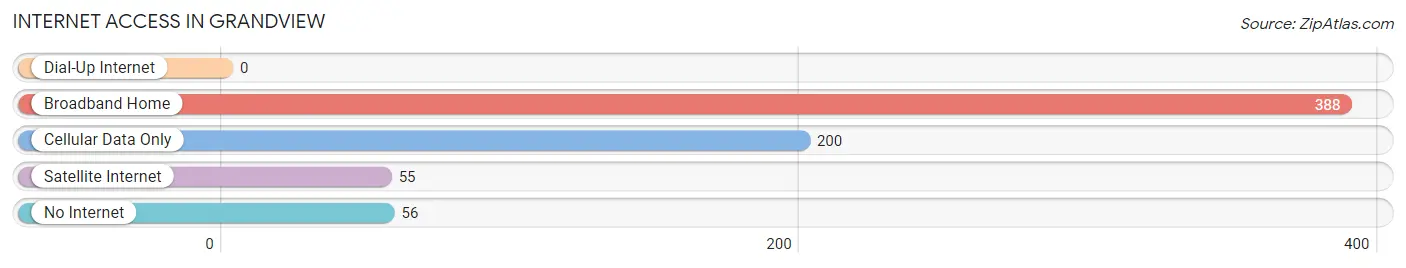
| Internet Type | # Households | % Households |
| Dial-Up Internet | 0 | 0.0% |
| Broadband Home | 388 | 57.8% |
| Cellular Data Only | 200 | 29.8% |
| Satellite Internet | 55 | 8.2% |
| No Internet | 56 | 8.4% |
| Total | 671 | 100.0% |
Grandview Summary
Geography
Grandview is a city located in Johnson County, Texas, United States. It is situated along the Brazos River, approximately 25 miles south of Fort Worth and 50 miles northwest of Waco. The city has a total area of 4.2 square miles, all of which is land. The terrain is mostly flat with some rolling hills. The climate is characterized by hot, humid summers and mild winters.
History
Grandview was founded in 1881 by a group of settlers from Missouri. The town was named after the nearby Grandview Ranch, which was owned by the family of one of the settlers. The town grew quickly, and by 1890 it had a population of over 500. The town was incorporated in 1891 and by 1900 the population had grown to over 1,000.
The town was a center of commerce for the surrounding area, and it was home to several businesses, including a cotton gin, a grist mill, and a blacksmith shop. The town also had a school, a bank, and a post office.
In the early 1900s, the town began to decline as the railroad bypassed it and the population began to move away. By the 1950s, the population had dropped to just over 500.
Economy
The economy of Grandview is largely based on agriculture. The town is home to several farms, which produce cotton, corn, wheat, and hay. The town also has a few small businesses, including a grocery store, a hardware store, and a few restaurants.
The town is also home to a few manufacturing companies, including a plastics factory and a metal fabrication plant. The town also has a few service-based businesses, such as a car dealership and a few auto repair shops.
Demographics
As of the 2010 census, the population of Grandview was 1,845. The racial makeup of the town was 79.3% White, 15.2% Hispanic or Latino, 1.2% African American, 0.7% Native American, 0.2% Asian, and 3.4% from other races.
The median household income in Grandview was $37,917, and the median family income was $45,938. The per capita income was $17,945. About 16.3% of the population was below the poverty line.
Conclusion
Grandview is a small town located in Johnson County, Texas. It has a long history, dating back to 1881, and it has a largely agricultural economy. The population of the town is mostly White, with a small percentage of Hispanic or Latino, African American, Native American, and Asian residents. The median household income is slightly below the national average, and about 16.3% of the population is below the poverty line. Despite its small size, Grandview is a vibrant community with a rich history and a bright future.
Common Questions
What is Per Capita Income in Grandview?
Per Capita income in Grandview is $29,814.
What is the Median Family Income in Grandview?
Median Family Income in Grandview is $98,000.
What is the Median Household income in Grandview?
Median Household Income in Grandview is $75,724.
What is Income or Wage Gap in Grandview?
Income or Wage Gap in Grandview is 46.0%.
Women in Grandview earn 54.0 cents for every dollar earned by a man.
What is Inequality or Gini Index in Grandview?
Inequality or Gini Index in Grandview is 0.43.
What is the Total Population of Grandview?
Total Population of Grandview is 1,978.
What is the Total Male Population of Grandview?
Total Male Population of Grandview is 939.
What is the Total Female Population of Grandview?
Total Female Population of Grandview is 1,039.
What is the Ratio of Males per 100 Females in Grandview?
There are 90.38 Males per 100 Females in Grandview.
What is the Ratio of Females per 100 Males in Grandview?
There are 110.65 Females per 100 Males in Grandview.
What is the Median Population Age in Grandview?
Median Population Age in Grandview is 33.0 Years.
What is the Average Family Size in Grandview
Average Family Size in Grandview is 3.4 People.
What is the Average Household Size in Grandview
Average Household Size in Grandview is 2.8 People.
How Large is the Labor Force in Grandview?
There are 890 People in the Labor Forcein in Grandview.
What is the Percentage of People in the Labor Force in Grandview?
64.0% of People are in the Labor Force in Grandview.
What is the Unemployment Rate in Grandview?
Unemployment Rate in Grandview is 1.6%.