Chagrin Falls, OH Map & Demographics
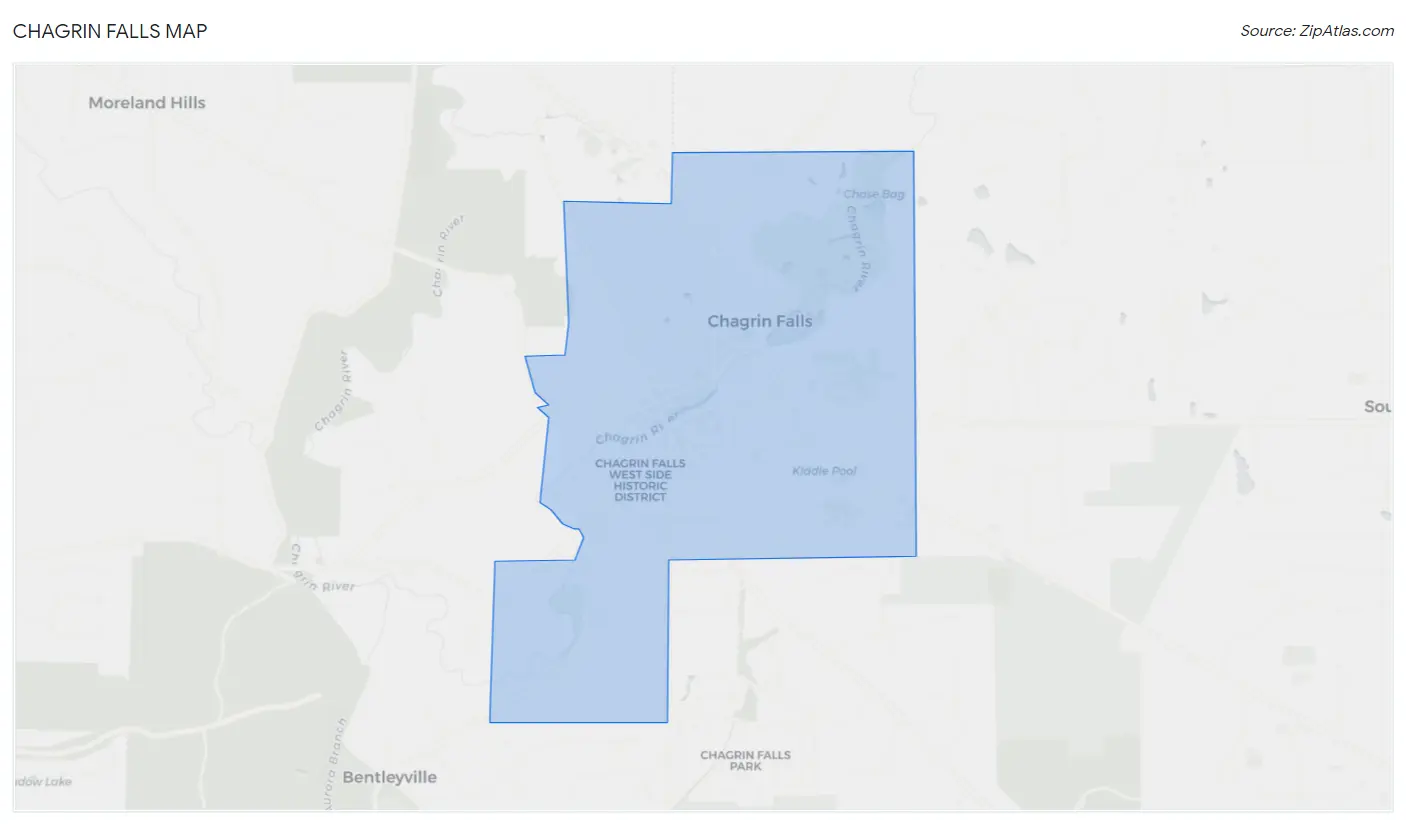
Chagrin Falls Map
Chagrin Falls Overview
$78,360
PER CAPITA INCOME
$152,386
AVG FAMILY INCOME
$99,821
AVG HOUSEHOLD INCOME
37.6%
WAGE / INCOME GAP [ % ]
62.4¢/ $1
WAGE / INCOME GAP [ $ ]
0.52
INEQUALITY / GINI INDEX
4,116
TOTAL POPULATION
1,824
MALE POPULATION
2,292
FEMALE POPULATION
79.58
MALES / 100 FEMALES
125.66
FEMALES / 100 MALES
49.6
MEDIAN AGE
2.8
AVG FAMILY SIZE
2.1
AVG HOUSEHOLD SIZE
2,118
LABOR FORCE [ PEOPLE ]
61.4%
PERCENT IN LABOR FORCE
3.6%
UNEMPLOYMENT RATE
Chagrin Falls Area Codes
Income in Chagrin Falls
Income Overview in Chagrin Falls
Per Capita Income in Chagrin Falls is $78,360, while median incomes of families and households are $152,386 and $99,821 respectively.
| Characteristic | Number | Measure |
| Per Capita Income | 4,116 | $78,360 |
| Median Family Income | 1,121 | $152,386 |
| Mean Family Income | 1,121 | $234,317 |
| Median Household Income | 1,897 | $99,821 |
| Mean Household Income | 1,897 | $171,398 |
| Income Deficit | 1,121 | $0 |
| Wage / Income Gap (%) | 4,116 | 37.59% |
| Wage / Income Gap ($) | 4,116 | 62.41¢ per $1 |
| Gini / Inequality Index | 4,116 | 0.52 |
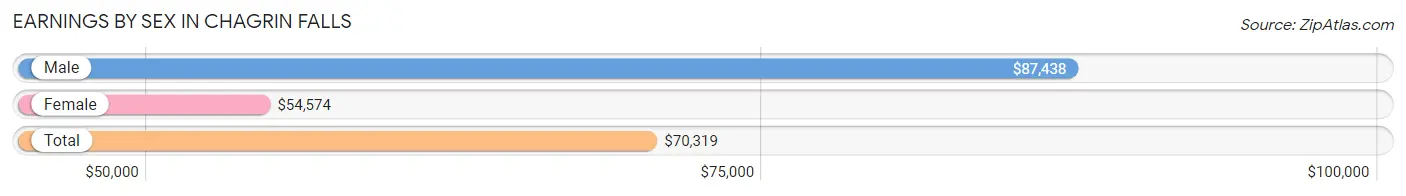
Earnings by Sex in Chagrin Falls
Average Earnings in Chagrin Falls are $70,319, $87,438 for men and $54,574 for women, a difference of 37.6%.
| Sex | Number | Average Earnings |
| Male | 1,071 (47.0%) | $87,438 |
| Female | 1,207 (53.0%) | $54,574 |
| Total | 2,278 (100.0%) | $70,319 |
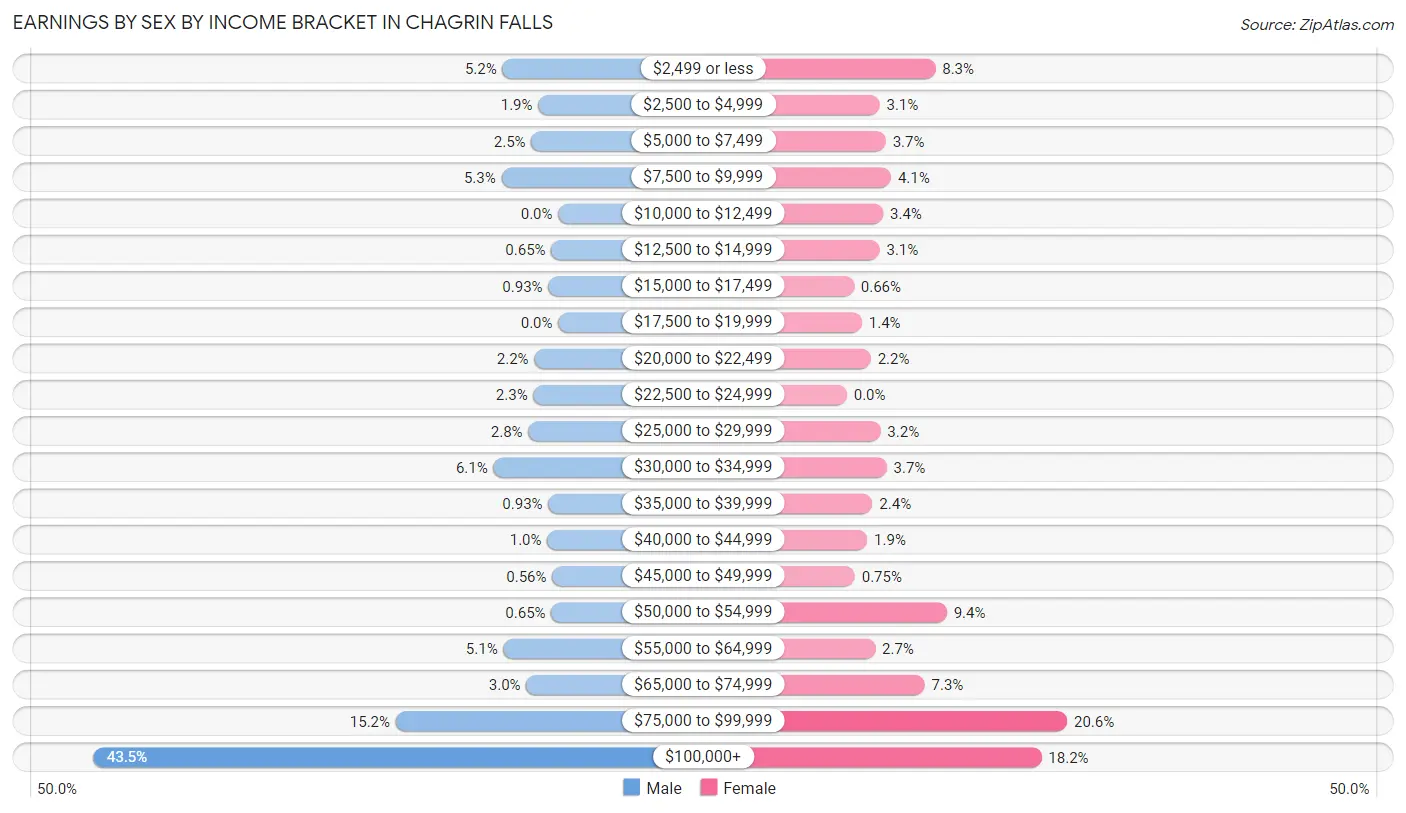
Earnings by Sex by Income Bracket in Chagrin Falls
The most common earnings brackets in Chagrin Falls are $100,000+ for men (466 | 43.5%) and $75,000 to $99,999 for women (249 | 20.6%).
| Income | Male | Female |
| $2,499 or less | 56 (5.2%) | 100 (8.3%) |
| $2,500 to $4,999 | 20 (1.9%) | 37 (3.1%) |
| $5,000 to $7,499 | 27 (2.5%) | 44 (3.6%) |
| $7,500 to $9,999 | 57 (5.3%) | 50 (4.1%) |
| $10,000 to $12,499 | 0 (0.0%) | 41 (3.4%) |
| $12,500 to $14,999 | 7 (0.6%) | 37 (3.1%) |
| $15,000 to $17,499 | 10 (0.9%) | 8 (0.7%) |
| $17,500 to $19,999 | 0 (0.0%) | 17 (1.4%) |
| $20,000 to $22,499 | 24 (2.2%) | 27 (2.2%) |
| $22,500 to $24,999 | 25 (2.3%) | 0 (0.0%) |
| $25,000 to $29,999 | 30 (2.8%) | 38 (3.2%) |
| $30,000 to $34,999 | 65 (6.1%) | 45 (3.7%) |
| $35,000 to $39,999 | 10 (0.9%) | 29 (2.4%) |
| $40,000 to $44,999 | 11 (1.0%) | 23 (1.9%) |
| $45,000 to $49,999 | 6 (0.6%) | 9 (0.7%) |
| $50,000 to $54,999 | 7 (0.6%) | 113 (9.4%) |
| $55,000 to $64,999 | 55 (5.1%) | 32 (2.6%) |
| $65,000 to $74,999 | 32 (3.0%) | 88 (7.3%) |
| $75,000 to $99,999 | 163 (15.2%) | 249 (20.6%) |
| $100,000+ | 466 (43.5%) | 220 (18.2%) |
| Total | 1,071 (100.0%) | 1,207 (100.0%) |
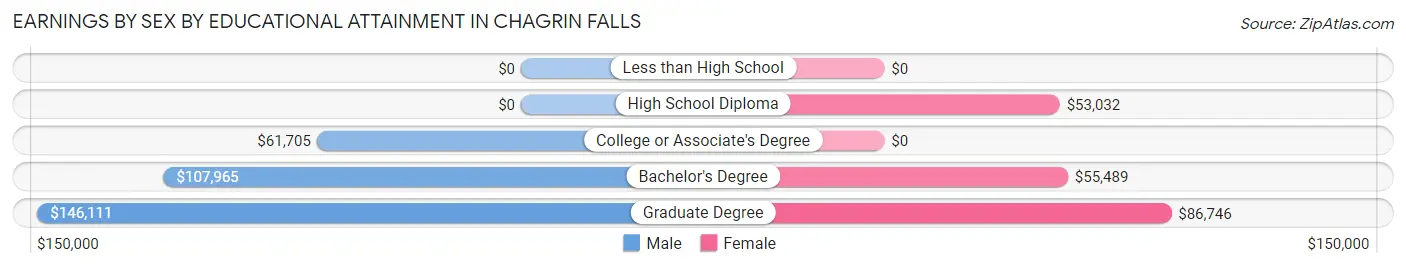
Earnings by Sex by Educational Attainment in Chagrin Falls
Average earnings in Chagrin Falls are $96,250 for men and $57,778 for women, a difference of 40.0%. Men with an educational attainment of graduate degree enjoy the highest average annual earnings of $146,111, while those with college or associate's degree education earn the least with $61,705. Women with an educational attainment of graduate degree earn the most with the average annual earnings of $86,746, while those with high school diploma education have the smallest earnings of $53,032.
| Educational Attainment | Male Income | Female Income |
| Less than High School | - | - |
| High School Diploma | - | - |
| College or Associate's Degree | $61,705 | $0 |
| Bachelor's Degree | $107,965 | $55,489 |
| Graduate Degree | $146,111 | $86,746 |
| Total | $96,250 | $57,778 |
Family Income in Chagrin Falls
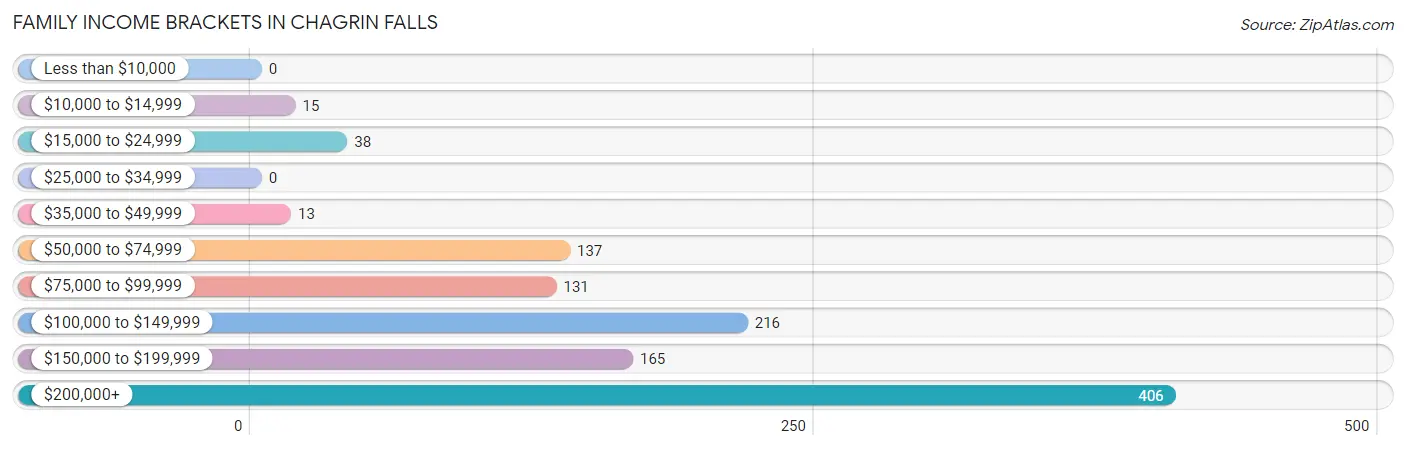
Family Income Brackets in Chagrin Falls
According to the Chagrin Falls family income data, there are 406 families falling into the $200,000+ income range, which is the most common income bracket and makes up 36.2% of all families.
| Income Bracket | # Families | % Families |
| Less than $10,000 | 0 | 0.0% |
| $10,000 to $14,999 | 15 | 1.3% |
| $15,000 to $24,999 | 38 | 3.4% |
| $25,000 to $34,999 | 0 | 0.0% |
| $35,000 to $49,999 | 13 | 1.2% |
| $50,000 to $74,999 | 137 | 12.2% |
| $75,000 to $99,999 | 131 | 11.7% |
| $100,000 to $149,999 | 216 | 19.3% |
| $150,000 to $199,999 | 165 | 14.7% |
| $200,000+ | 406 | 36.2% |
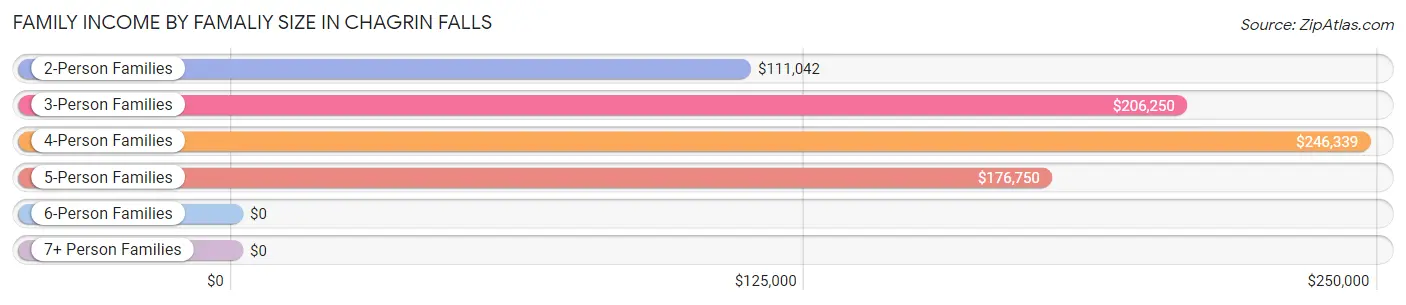
Family Income by Famaliy Size in Chagrin Falls
4-person families (195 | 17.4%) account for the highest median family income in Chagrin Falls with $246,339 per family, while 3-person families (173 | 15.4%) have the highest median income of $68,750 per family member.
| Income Bracket | # Families | Median Income |
| 2-Person Families | 618 (55.1%) | $111,042 |
| 3-Person Families | 173 (15.4%) | $206,250 |
| 4-Person Families | 195 (17.4%) | $246,339 |
| 5-Person Families | 113 (10.1%) | $176,750 |
| 6-Person Families | 22 (2.0%) | $0 |
| 7+ Person Families | 0 (0.0%) | $0 |
| Total | 1,121 (100.0%) | $152,386 |
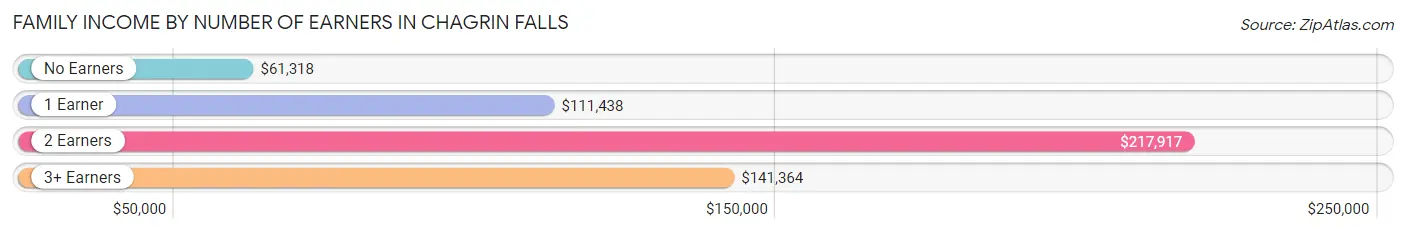
Family Income by Number of Earners in Chagrin Falls
The median family income in Chagrin Falls is $152,386, with families comprising 2 earners (507) having the highest median family income of $217,917, while families with no earners (209) have the lowest median family income of $61,318, accounting for 45.2% and 18.6% of families, respectively.
| Number of Earners | # Families | Median Income |
| No Earners | 209 (18.6%) | $61,318 |
| 1 Earner | 279 (24.9%) | $111,438 |
| 2 Earners | 507 (45.2%) | $217,917 |
| 3+ Earners | 126 (11.2%) | $141,364 |
| Total | 1,121 (100.0%) | $152,386 |
Household Income in Chagrin Falls
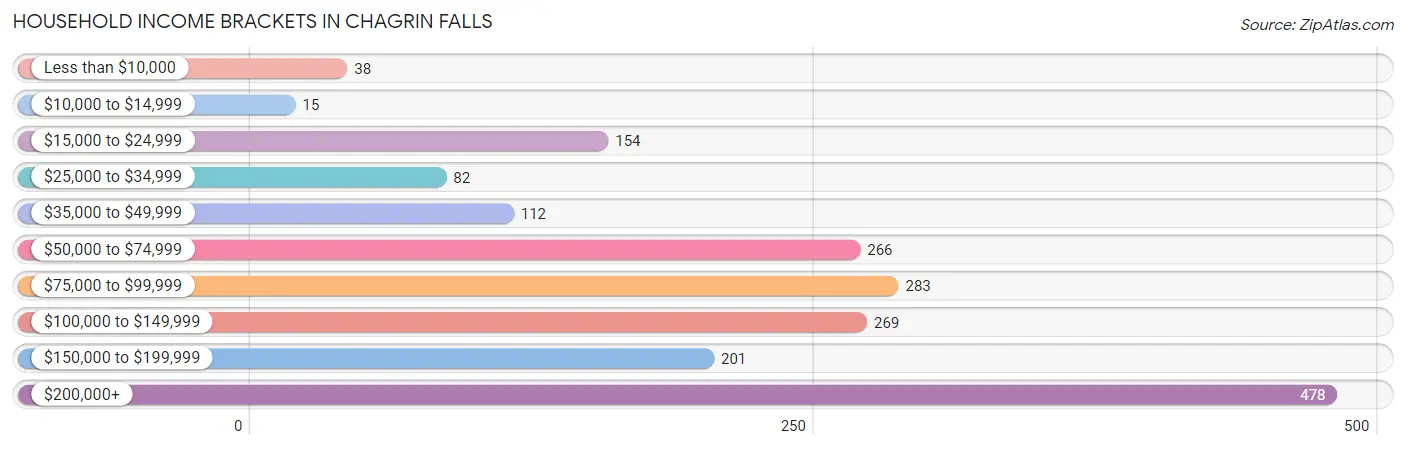
Household Income Brackets in Chagrin Falls
With 478 households falling in the category, the $200,000+ income range is the most frequent in Chagrin Falls, accounting for 25.2% of all households. In contrast, only 15 households (0.8%) fall into the $10,000 to $14,999 income bracket, making it the least populous group.
| Income Bracket | # Households | % Households |
| Less than $10,000 | 38 | 2.0% |
| $10,000 to $14,999 | 15 | 0.8% |
| $15,000 to $24,999 | 154 | 8.1% |
| $25,000 to $34,999 | 82 | 4.3% |
| $35,000 to $49,999 | 112 | 5.9% |
| $50,000 to $74,999 | 266 | 14.0% |
| $75,000 to $99,999 | 283 | 14.9% |
| $100,000 to $149,999 | 269 | 14.2% |
| $150,000 to $199,999 | 201 | 10.6% |
| $200,000+ | 478 | 25.2% |
Household Income by Householder Age in Chagrin Falls
The median household income in Chagrin Falls is $99,821, with the highest median household income of $159,643 found in the 45 to 64 years age bracket for the primary householder. A total of 828 households (43.6%) fall into this category.
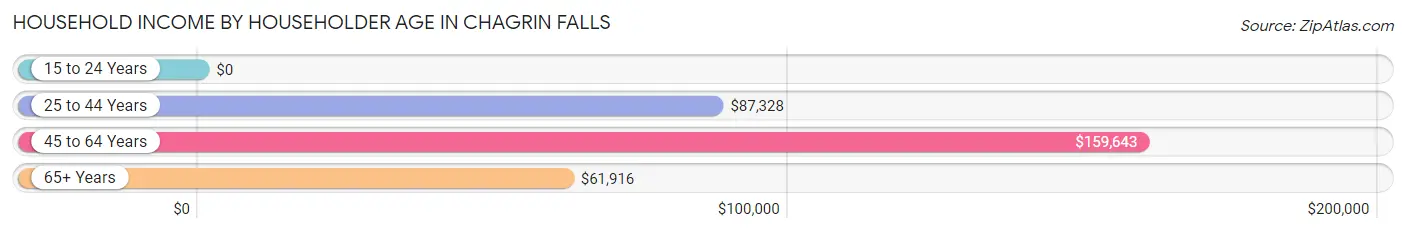
| Income Bracket | # Households | Median Income |
| 15 to 24 Years | 0 (0.0%) | $0 |
| 25 to 44 Years | 410 (21.6%) | $87,328 |
| 45 to 64 Years | 828 (43.6%) | $159,643 |
| 65+ Years | 659 (34.7%) | $61,916 |
| Total | 1,897 (100.0%) | $99,821 |
Poverty in Chagrin Falls
Income Below Poverty by Sex and Age in Chagrin Falls
With 4.1% poverty level for males and 2.0% for females among the residents of Chagrin Falls, 35 to 44 year old males and 16 and 17 year old females are the most vulnerable to poverty, with 56 males (26.2%) and 12 females (8.4%) in their respective age groups living below the poverty level.
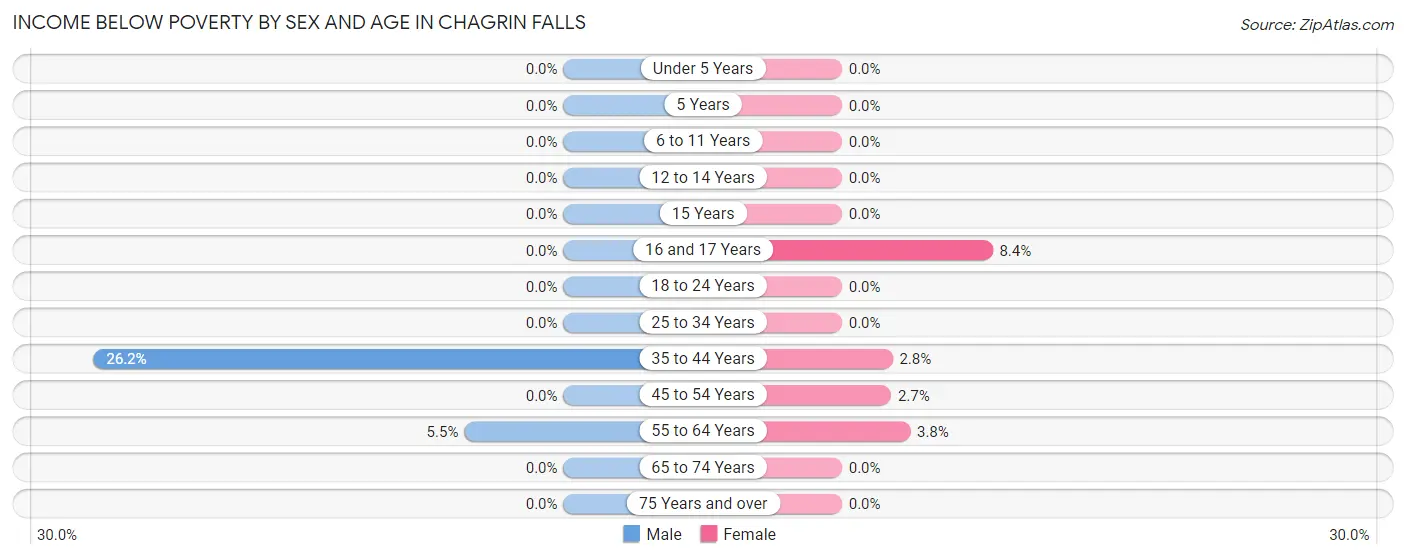
| Age Bracket | Male | Female |
| Under 5 Years | 0 (0.0%) | 0 (0.0%) |
| 5 Years | 0 (0.0%) | 0 (0.0%) |
| 6 to 11 Years | 0 (0.0%) | 0 (0.0%) |
| 12 to 14 Years | 0 (0.0%) | 0 (0.0%) |
| 15 Years | 0 (0.0%) | 0 (0.0%) |
| 16 and 17 Years | 0 (0.0%) | 12 (8.4%) |
| 18 to 24 Years | 0 (0.0%) | 0 (0.0%) |
| 25 to 34 Years | 0 (0.0%) | 0 (0.0%) |
| 35 to 44 Years | 56 (26.2%) | 10 (2.8%) |
| 45 to 54 Years | 0 (0.0%) | 9 (2.7%) |
| 55 to 64 Years | 18 (5.5%) | 15 (3.8%) |
| 65 to 74 Years | 0 (0.0%) | 0 (0.0%) |
| 75 Years and over | 0 (0.0%) | 0 (0.0%) |
| Total | 74 (4.1%) | 46 (2.0%) |
Income Above Poverty by Sex and Age in Chagrin Falls
According to the poverty statistics in Chagrin Falls, males aged under 5 years and females aged under 5 years are the age groups that are most secure financially, with 100.0% of males and 100.0% of females in these age groups living above the poverty line.
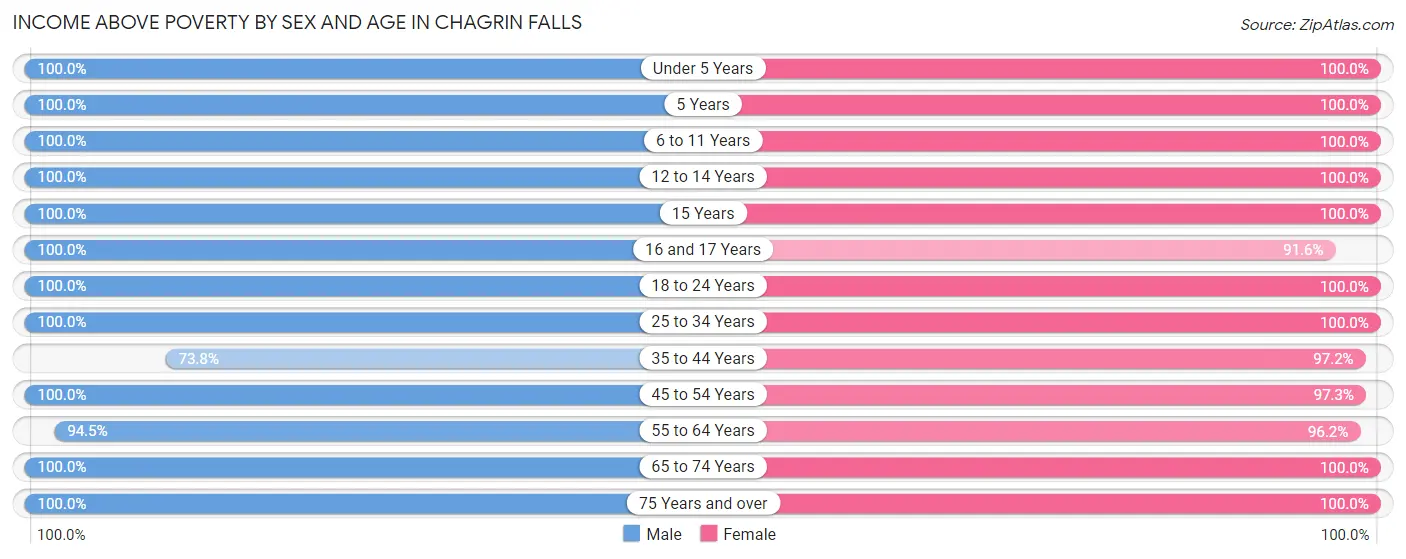
| Age Bracket | Male | Female |
| Under 5 Years | 71 (100.0%) | 43 (100.0%) |
| 5 Years | 25 (100.0%) | 31 (100.0%) |
| 6 to 11 Years | 114 (100.0%) | 113 (100.0%) |
| 12 to 14 Years | 141 (100.0%) | 60 (100.0%) |
| 15 Years | 23 (100.0%) | 45 (100.0%) |
| 16 and 17 Years | 71 (100.0%) | 131 (91.6%) |
| 18 to 24 Years | 71 (100.0%) | 70 (100.0%) |
| 25 to 34 Years | 129 (100.0%) | 94 (100.0%) |
| 35 to 44 Years | 158 (73.8%) | 344 (97.2%) |
| 45 to 54 Years | 271 (100.0%) | 320 (97.3%) |
| 55 to 64 Years | 308 (94.5%) | 380 (96.2%) |
| 65 to 74 Years | 91 (100.0%) | 223 (100.0%) |
| 75 Years and over | 262 (100.0%) | 356 (100.0%) |
| Total | 1,735 (95.9%) | 2,210 (98.0%) |
Income Below Poverty Among Married-Couple Families in Chagrin Falls
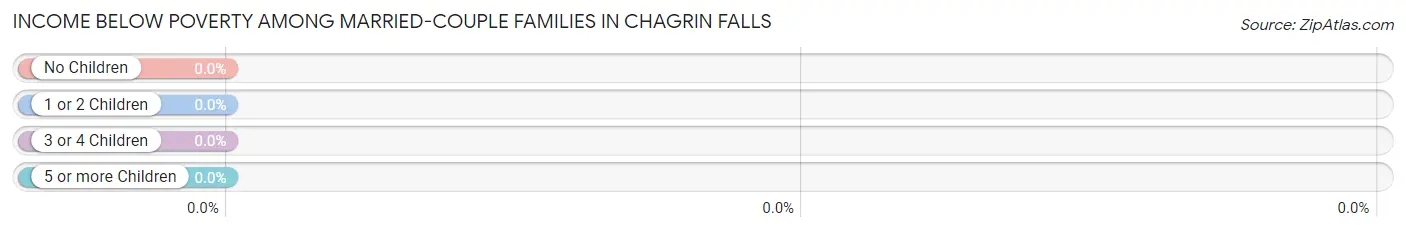
| Children | Above Poverty | Below Poverty |
| No Children | 563 (100.0%) | 0 (0.0%) |
| 1 or 2 Children | 268 (100.0%) | 0 (0.0%) |
| 3 or 4 Children | 122 (100.0%) | 0 (0.0%) |
| 5 or more Children | 0 (0.0%) | 0 (0.0%) |
| Total | 953 (100.0%) | 0 (0.0%) |
Income Below Poverty Among Single-Parent Households in Chagrin Falls
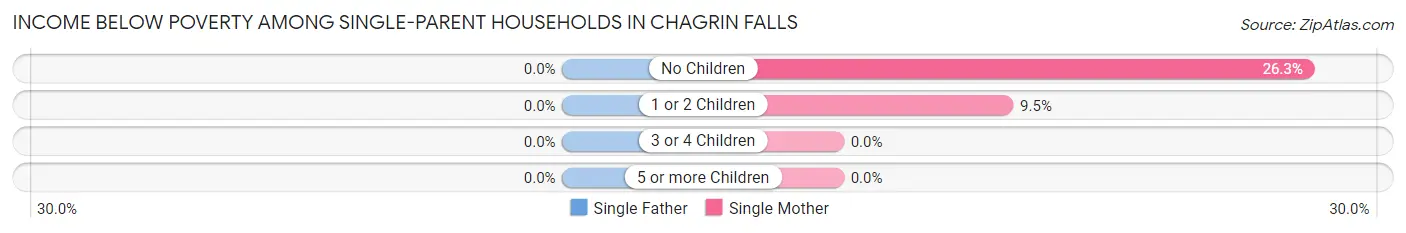
| Children | Single Father | Single Mother |
| No Children | 0 (0.0%) | 15 (26.3%) |
| 1 or 2 Children | 0 (0.0%) | 9 (9.5%) |
| 3 or 4 Children | 0 (0.0%) | 0 (0.0%) |
| 5 or more Children | 0 (0.0%) | 0 (0.0%) |
| Total | 0 (0.0%) | 24 (15.8%) |
Income Below Poverty Among Married-Couple vs Single-Parent Households in Chagrin Falls
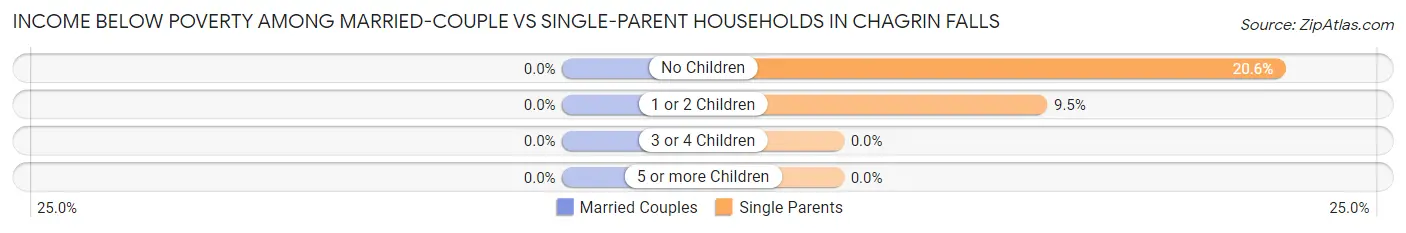
| Children | Married-Couple Families | Single-Parent Households |
| No Children | 0 (0.0%) | 15 (20.5%) |
| 1 or 2 Children | 0 (0.0%) | 9 (9.5%) |
| 3 or 4 Children | 0 (0.0%) | 0 (0.0%) |
| 5 or more Children | 0 (0.0%) | 0 (0.0%) |
| Total | 0 (0.0%) | 24 (14.3%) |
Race in Chagrin Falls
The most populous races in Chagrin Falls are White / Caucasian (3,745 | 91.0%), Two or more Races (140 | 3.4%), and Black / African American (133 | 3.2%).
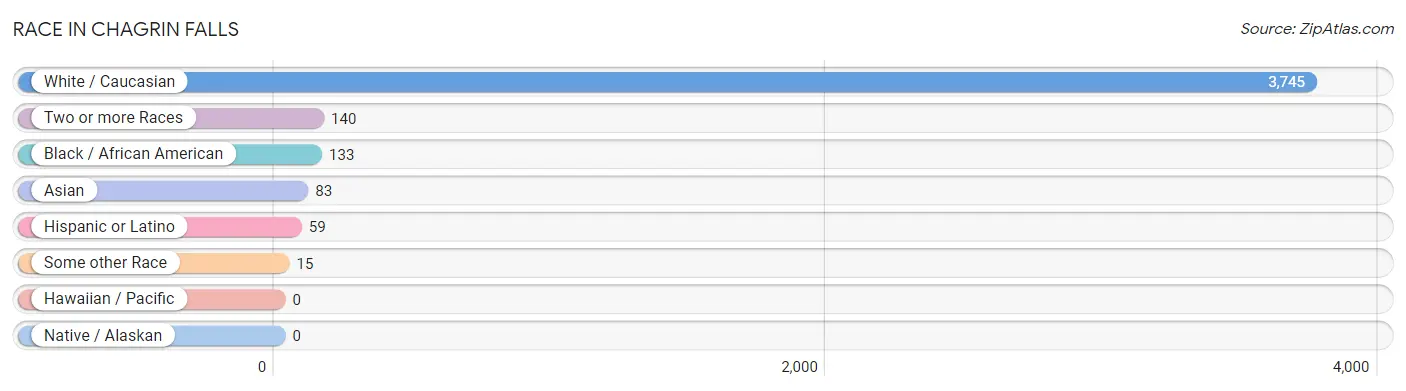
| Race | # Population | % Population |
| Asian | 83 | 2.0% |
| Black / African American | 133 | 3.2% |
| Hawaiian / Pacific | 0 | 0.0% |
| Hispanic or Latino | 59 | 1.4% |
| Native / Alaskan | 0 | 0.0% |
| White / Caucasian | 3,745 | 91.0% |
| Two or more Races | 140 | 3.4% |
| Some other Race | 15 | 0.4% |
| Total | 4,116 | 100.0% |
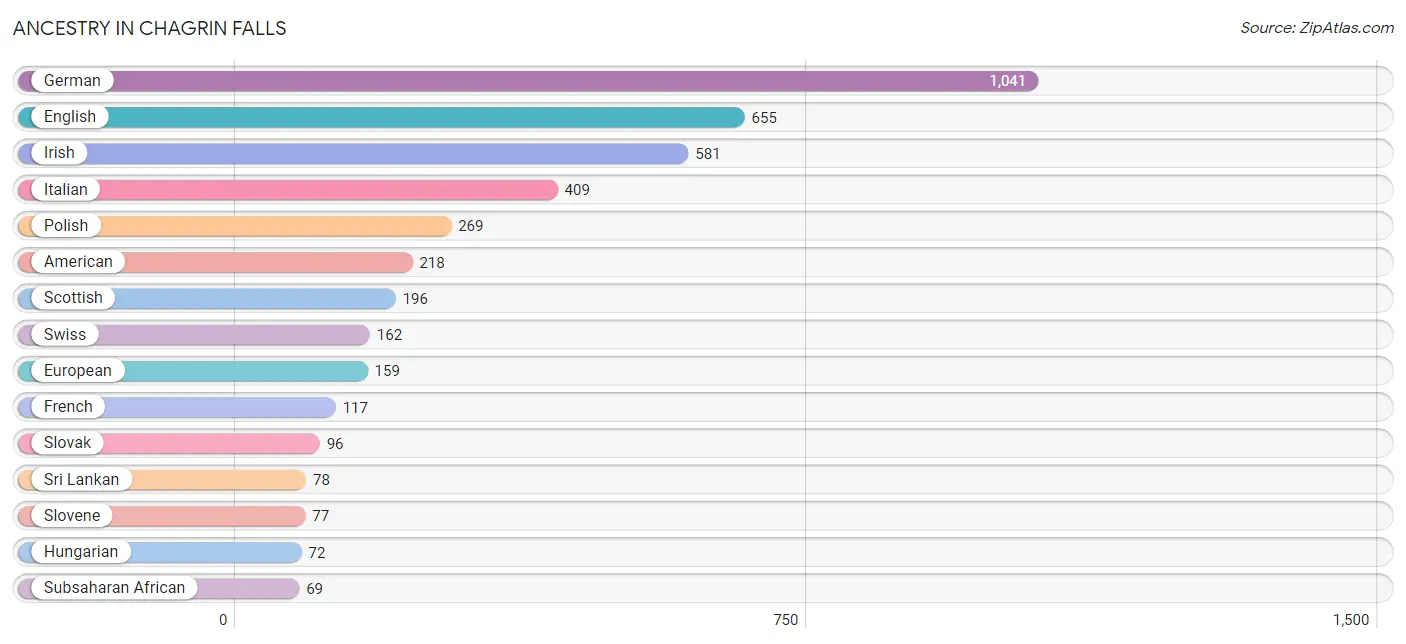
Ancestry in Chagrin Falls
The most populous ancestries reported in Chagrin Falls are German (1,041 | 25.3%), English (655 | 15.9%), Irish (581 | 14.1%), Italian (409 | 9.9%), and Polish (269 | 6.5%), together accounting for 71.8% of all Chagrin Falls residents.
| Ancestry | # Population | % Population |
| African | 15 | 0.4% |
| American | 218 | 5.3% |
| Armenian | 11 | 0.3% |
| Austrian | 64 | 1.5% |
| Basque | 22 | 0.5% |
| Bhutanese | 30 | 0.7% |
| British | 48 | 1.2% |
| Bulgarian | 57 | 1.4% |
| Canadian | 26 | 0.6% |
| Cherokee | 6 | 0.2% |
| Colombian | 29 | 0.7% |
| Croatian | 11 | 0.3% |
| Cuban | 1 | 0.0% |
| Czech | 14 | 0.3% |
| Danish | 12 | 0.3% |
| Dutch | 52 | 1.3% |
| Eastern European | 39 | 0.9% |
| English | 655 | 15.9% |
| Estonian | 6 | 0.2% |
| European | 159 | 3.9% |
| Finnish | 17 | 0.4% |
| French | 117 | 2.8% |
| French Canadian | 15 | 0.4% |
| German | 1,041 | 25.3% |
| Ghanaian | 54 | 1.3% |
| Greek | 19 | 0.5% |
| Hungarian | 72 | 1.8% |
| Iranian | 34 | 0.8% |
| Irish | 581 | 14.1% |
| Italian | 409 | 9.9% |
| Laotian | 13 | 0.3% |
| Lithuanian | 24 | 0.6% |
| Norwegian | 14 | 0.3% |
| Polish | 269 | 6.5% |
| Portuguese | 12 | 0.3% |
| Russian | 62 | 1.5% |
| Scandinavian | 30 | 0.7% |
| Scotch-Irish | 30 | 0.7% |
| Scottish | 196 | 4.8% |
| Serbian | 19 | 0.5% |
| Slavic | 12 | 0.3% |
| Slovak | 96 | 2.3% |
| Slovene | 77 | 1.9% |
| South American | 29 | 0.7% |
| Spaniard | 22 | 0.5% |
| Spanish | 7 | 0.2% |
| Sri Lankan | 78 | 1.9% |
| Subsaharan African | 69 | 1.7% |
| Swedish | 64 | 1.5% |
| Swiss | 162 | 3.9% |
| Ukrainian | 53 | 1.3% |
| Welsh | 39 | 0.9% | View All 52 Rows |
Immigrants in Chagrin Falls
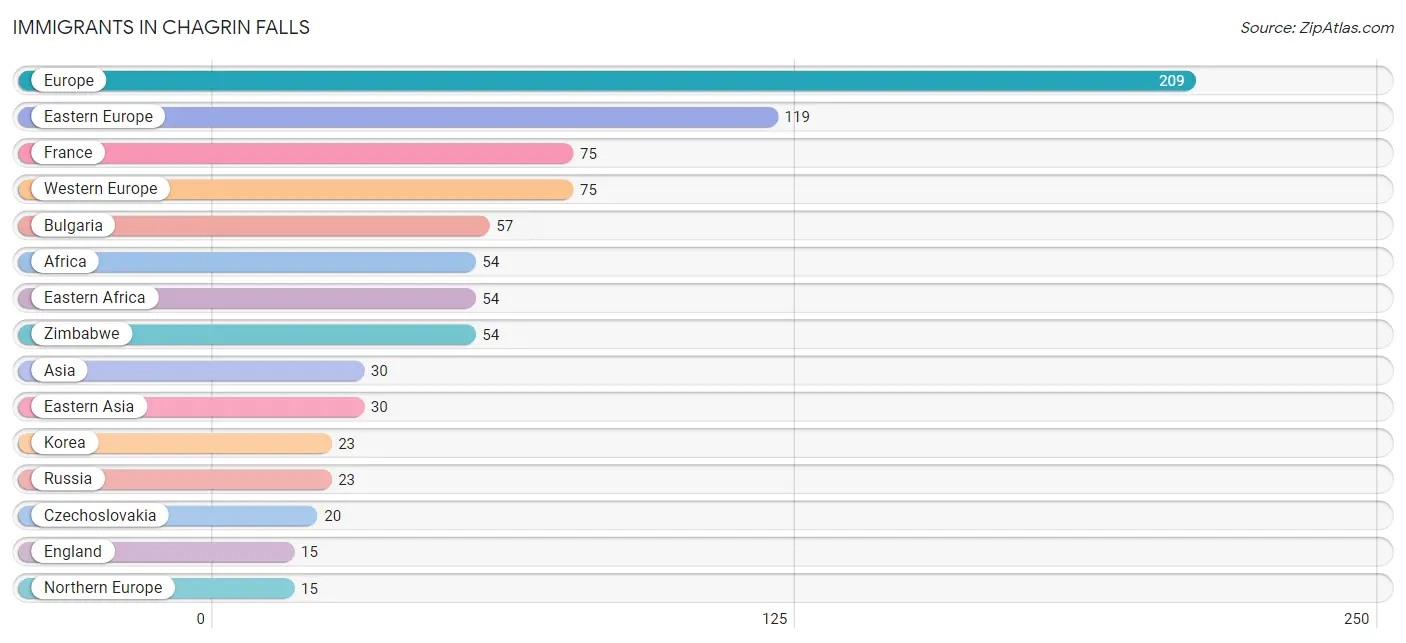
The most numerous immigrant groups reported in Chagrin Falls came from Europe (209 | 5.1%), Eastern Europe (119 | 2.9%), France (75 | 1.8%), Western Europe (75 | 1.8%), and Bulgaria (57 | 1.4%), together accounting for 13.0% of all Chagrin Falls residents.
| Immigration Origin | # Population | % Population |
| Africa | 54 | 1.3% |
| Asia | 30 | 0.7% |
| Bulgaria | 57 | 1.4% |
| Canada | 6 | 0.2% |
| Caribbean | 1 | 0.0% |
| Cuba | 1 | 0.0% |
| Czechoslovakia | 20 | 0.5% |
| Eastern Africa | 54 | 1.3% |
| Eastern Asia | 30 | 0.7% |
| Eastern Europe | 119 | 2.9% |
| England | 15 | 0.4% |
| Europe | 209 | 5.1% |
| France | 75 | 1.8% |
| Japan | 7 | 0.2% |
| Korea | 23 | 0.6% |
| Latin America | 1 | 0.0% |
| Northern Europe | 15 | 0.4% |
| Russia | 23 | 0.6% |
| Western Europe | 75 | 1.8% |
| Zimbabwe | 54 | 1.3% | View All 20 Rows |
Sex and Age in Chagrin Falls
Sex and Age in Chagrin Falls
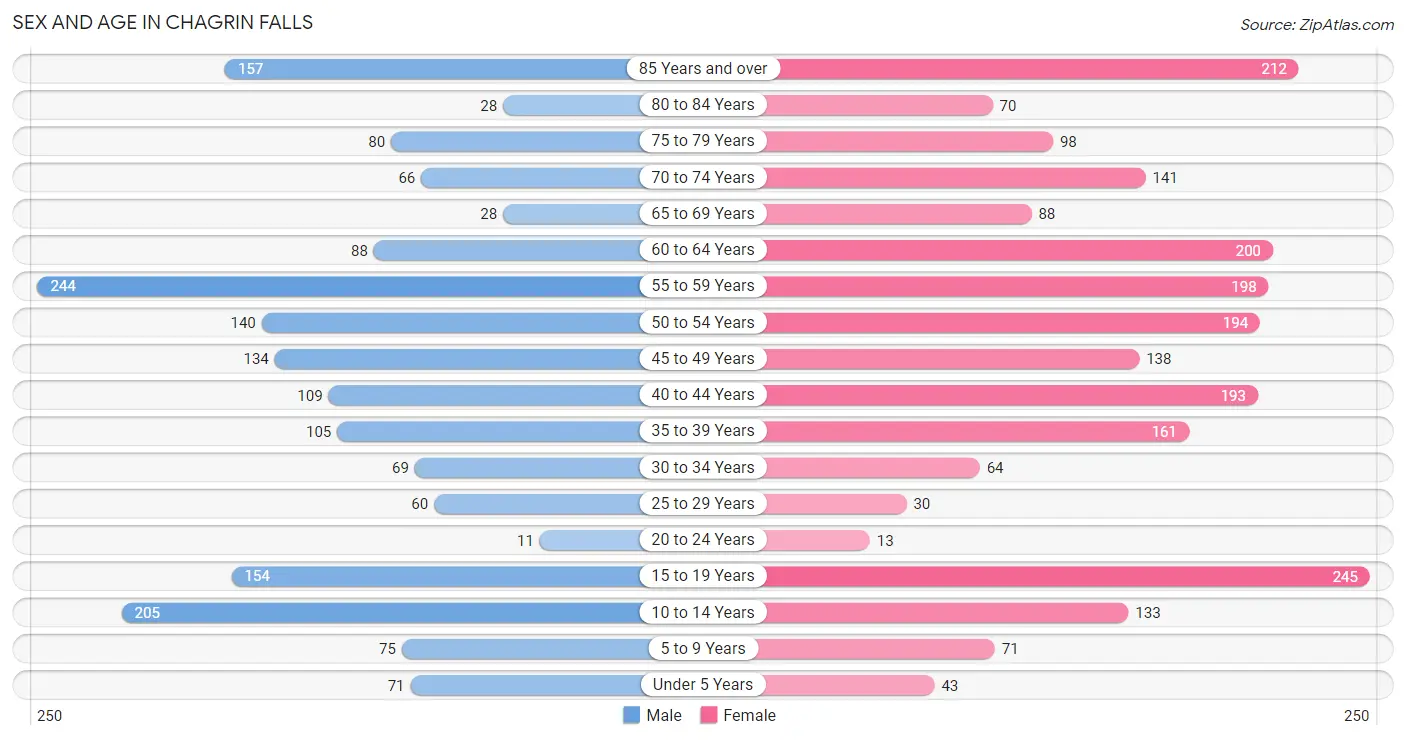
The most populous age groups in Chagrin Falls are 55 to 59 Years (244 | 13.4%) for men and 15 to 19 Years (245 | 10.7%) for women.
| Age Bracket | Male | Female |
| Under 5 Years | 71 (3.9%) | 43 (1.9%) |
| 5 to 9 Years | 75 (4.1%) | 71 (3.1%) |
| 10 to 14 Years | 205 (11.2%) | 133 (5.8%) |
| 15 to 19 Years | 154 (8.4%) | 245 (10.7%) |
| 20 to 24 Years | 11 (0.6%) | 13 (0.6%) |
| 25 to 29 Years | 60 (3.3%) | 30 (1.3%) |
| 30 to 34 Years | 69 (3.8%) | 64 (2.8%) |
| 35 to 39 Years | 105 (5.8%) | 161 (7.0%) |
| 40 to 44 Years | 109 (6.0%) | 193 (8.4%) |
| 45 to 49 Years | 134 (7.3%) | 138 (6.0%) |
| 50 to 54 Years | 140 (7.7%) | 194 (8.5%) |
| 55 to 59 Years | 244 (13.4%) | 198 (8.6%) |
| 60 to 64 Years | 88 (4.8%) | 200 (8.7%) |
| 65 to 69 Years | 28 (1.5%) | 88 (3.8%) |
| 70 to 74 Years | 66 (3.6%) | 141 (6.1%) |
| 75 to 79 Years | 80 (4.4%) | 98 (4.3%) |
| 80 to 84 Years | 28 (1.5%) | 70 (3.0%) |
| 85 Years and over | 157 (8.6%) | 212 (9.2%) |
| Total | 1,824 (100.0%) | 2,292 (100.0%) |
Families and Households in Chagrin Falls
Median Family Size in Chagrin Falls
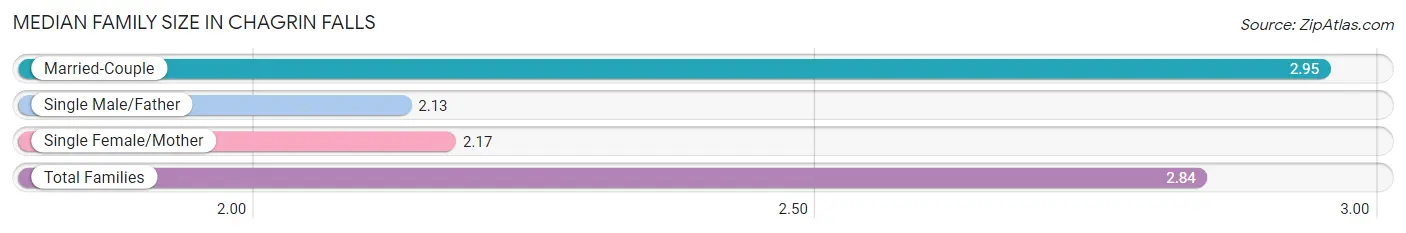
The median family size in Chagrin Falls is 2.84 persons per family, with married-couple families (953 | 85.0%) accounting for the largest median family size of 2.95 persons per family. On the other hand, single male/father families (16 | 1.4%) represent the smallest median family size with 2.13 persons per family.
| Family Type | # Families | Family Size |
| Married-Couple | 953 (85.0%) | 2.95 |
| Single Male/Father | 16 (1.4%) | 2.13 |
| Single Female/Mother | 152 (13.6%) | 2.17 |
| Total Families | 1,121 (100.0%) | 2.84 |
Median Household Size in Chagrin Falls
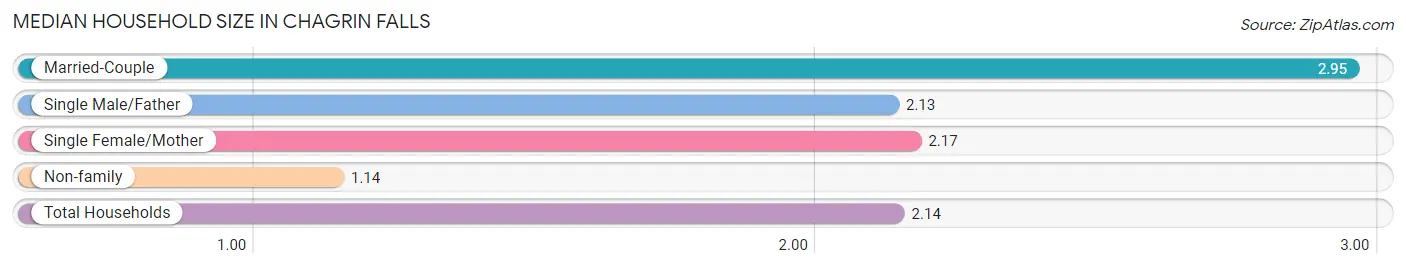
The median household size in Chagrin Falls is 2.14 persons per household, with married-couple households (953 | 50.2%) accounting for the largest median household size of 2.95 persons per household. non-family households (776 | 40.9%) represent the smallest median household size with 1.14 persons per household.
| Household Type | # Households | Household Size |
| Married-Couple | 953 (50.2%) | 2.95 |
| Single Male/Father | 16 (0.8%) | 2.13 |
| Single Female/Mother | 152 (8.0%) | 2.17 |
| Non-family | 776 (40.9%) | 1.14 |
| Total Households | 1,897 (100.0%) | 2.14 |
Household Size by Marriage Status in Chagrin Falls
Out of a total of 1,897 households in Chagrin Falls, 1,121 (59.1%) are family households, while 776 (40.9%) are nonfamily households. The most numerous type of family households are 2-person households, comprising 618, and the most common type of nonfamily households are 1-person households, comprising 722.
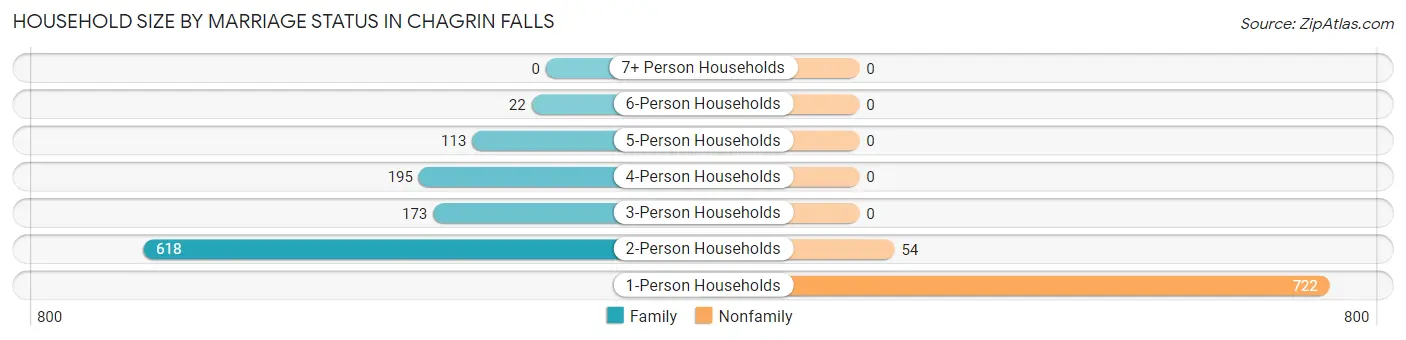
| Household Size | Family Households | Nonfamily Households |
| 1-Person Households | - | 722 (38.1%) |
| 2-Person Households | 618 (32.6%) | 54 (2.9%) |
| 3-Person Households | 173 (9.1%) | 0 (0.0%) |
| 4-Person Households | 195 (10.3%) | 0 (0.0%) |
| 5-Person Households | 113 (6.0%) | 0 (0.0%) |
| 6-Person Households | 22 (1.2%) | 0 (0.0%) |
| 7+ Person Households | 0 (0.0%) | 0 (0.0%) |
| Total | 1,121 (59.1%) | 776 (40.9%) |
Female Fertility in Chagrin Falls
Fertility by Age in Chagrin Falls
Average fertility rate in Chagrin Falls is 12.0 births per 1,000 women. Women in the age bracket of 35 to 50 years have the highest fertility rate with 20.0 births per 1,000 women. Women in the age bracket of 35 to 50 years acount for 100.0% of all women with births.
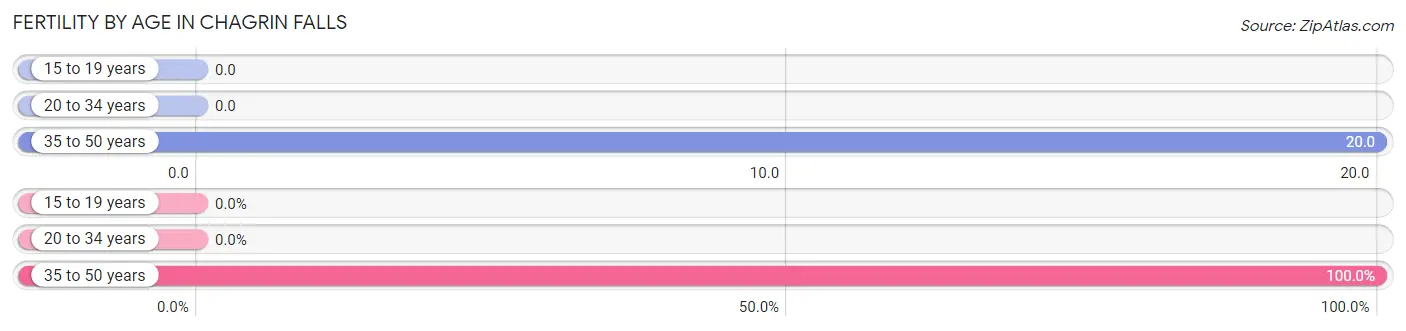
| Age Bracket | Women with Births | Births / 1,000 Women |
| 15 to 19 years | 0 (0.0%) | 0.0 |
| 20 to 34 years | 0 (0.0%) | 0.0 |
| 35 to 50 years | 11 (100.0%) | 20.0 |
| Total | 11 (100.0%) | 12.0 |
Fertility by Age by Marriage Status in Chagrin Falls
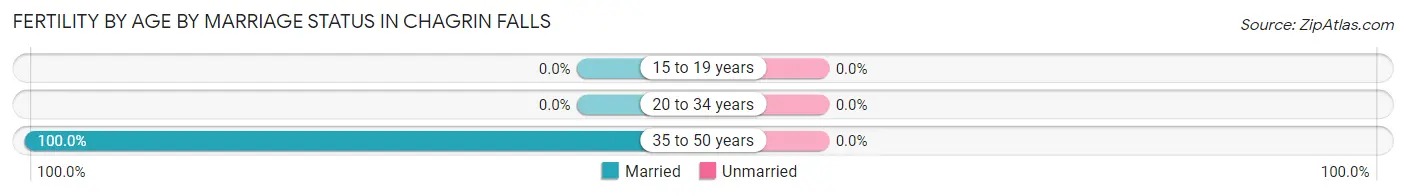
| Age Bracket | Married | Unmarried |
| 15 to 19 years | 0 (0.0%) | 0 (0.0%) |
| 20 to 34 years | 0 (0.0%) | 0 (0.0%) |
| 35 to 50 years | 11 (100.0%) | 0 (0.0%) |
| Total | 11 (100.0%) | 0 (0.0%) |
Fertility by Education in Chagrin Falls
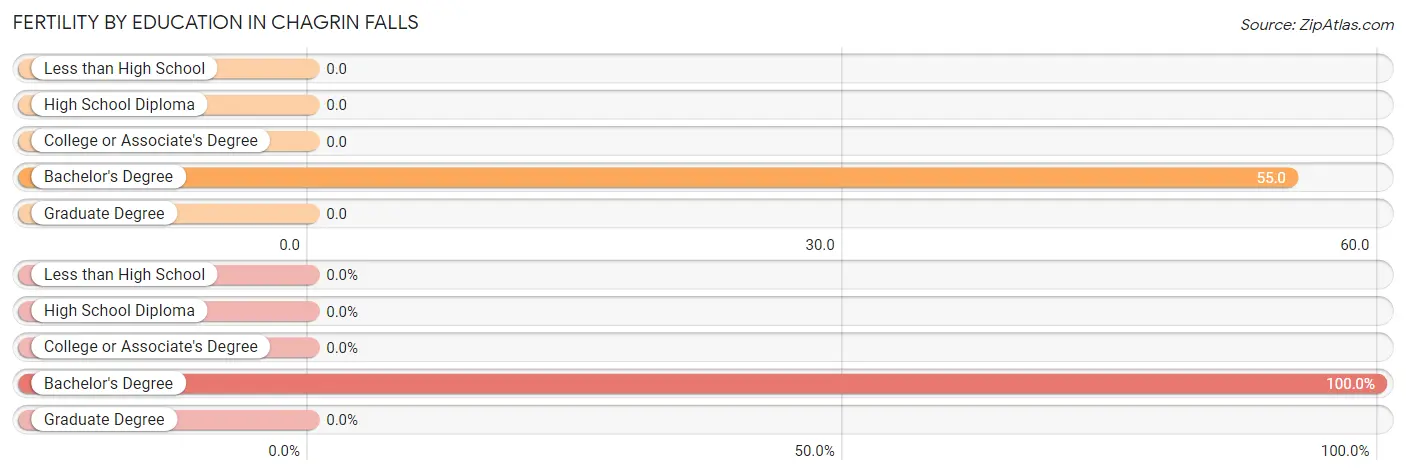
| Educational Attainment | Women with Births | Births / 1,000 Women |
| Less than High School | 0 (0.0%) | 0.0 |
| High School Diploma | 0 (0.0%) | 0.0 |
| College or Associate's Degree | 0 (0.0%) | 0.0 |
| Bachelor's Degree | 11 (100.0%) | 55.0 |
| Graduate Degree | 0 (0.0%) | 0.0 |
| Total | 11 (100.0%) | 12.0 |
Fertility by Education by Marriage Status in Chagrin Falls
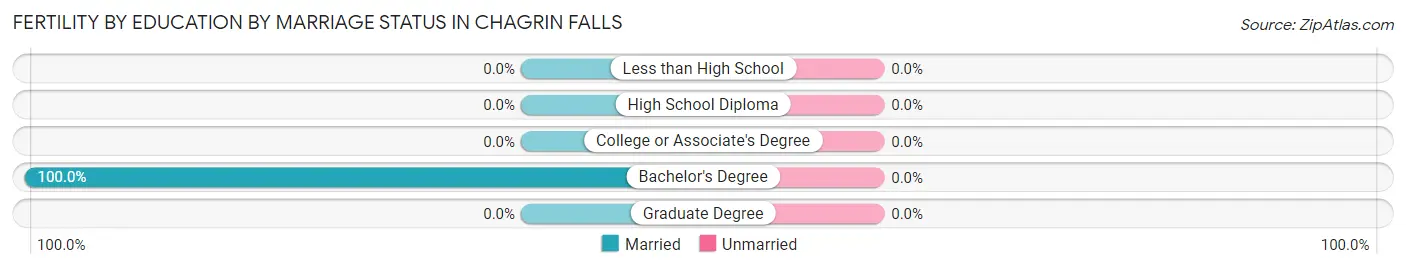
| Educational Attainment | Married | Unmarried |
| Less than High School | 0 (0.0%) | 0 (0.0%) |
| High School Diploma | 0 (0.0%) | 0 (0.0%) |
| College or Associate's Degree | 0 (0.0%) | 0 (0.0%) |
| Bachelor's Degree | 11 (100.0%) | 0 (0.0%) |
| Graduate Degree | 0 (0.0%) | 0 (0.0%) |
| Total | 11 (100.0%) | 0 (0.0%) |
Employment Characteristics in Chagrin Falls
Employment by Class of Employer in Chagrin Falls
Among the 2,020 employed individuals in Chagrin Falls, private company employees (1,268 | 62.8%), not-for-profit organizations (196 | 9.7%), and self-employed (incorporated) (163 | 8.1%) make up the most common classes of employment.
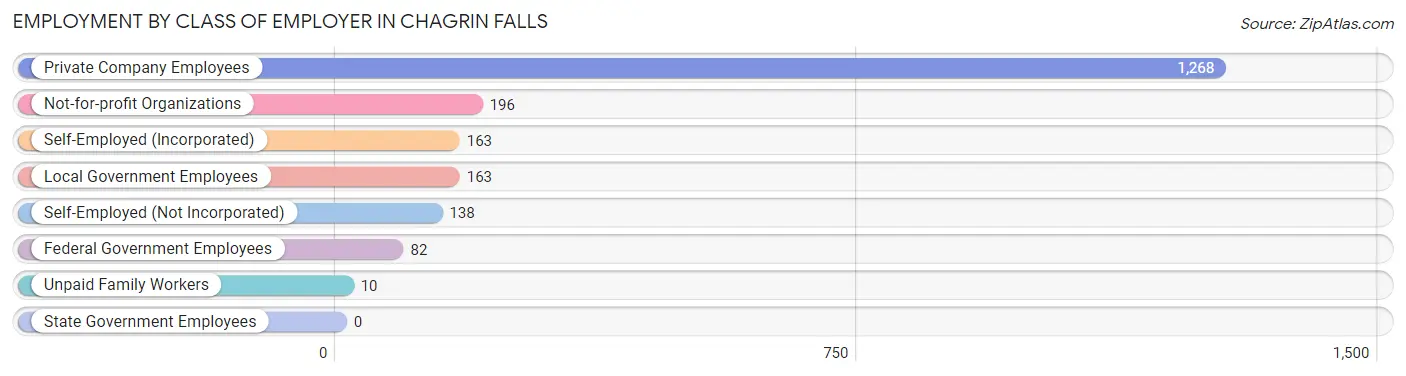
| Employer Class | # Employees | % Employees |
| Private Company Employees | 1,268 | 62.8% |
| Self-Employed (Incorporated) | 163 | 8.1% |
| Self-Employed (Not Incorporated) | 138 | 6.8% |
| Not-for-profit Organizations | 196 | 9.7% |
| Local Government Employees | 163 | 8.1% |
| State Government Employees | 0 | 0.0% |
| Federal Government Employees | 82 | 4.1% |
| Unpaid Family Workers | 10 | 0.5% |
| Total | 2,020 | 100.0% |
Employment Status by Age in Chagrin Falls
According to the labor force statistics for Chagrin Falls, out of the total population over 16 years of age (3,450), 61.4% or 2,118 individuals are in the labor force, with 3.6% or 76 of them unemployed. The age group with the highest labor force participation rate is 25 to 29 years, with 100.0% or 90 individuals in the labor force. Within the labor force, the 16 to 19 years age range has the highest percentage of unemployed individuals, with 33.3% or 22 of them being unemployed.
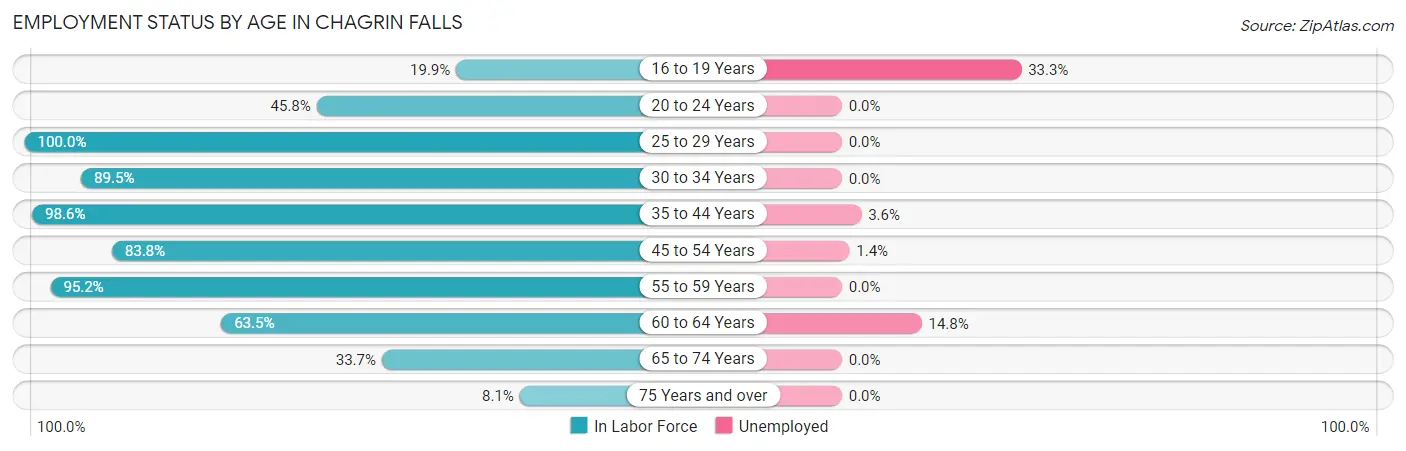
| Age Bracket | In Labor Force | Unemployed |
| 16 to 19 Years | 66 (19.9%) | 22 (33.3%) |
| 20 to 24 Years | 11 (45.8%) | 0 (0.0%) |
| 25 to 29 Years | 90 (100.0%) | 0 (0.0%) |
| 30 to 34 Years | 119 (89.5%) | 0 (0.0%) |
| 35 to 44 Years | 560 (98.6%) | 20 (3.6%) |
| 45 to 54 Years | 508 (83.8%) | 7 (1.4%) |
| 55 to 59 Years | 421 (95.2%) | 0 (0.0%) |
| 60 to 64 Years | 183 (63.5%) | 27 (14.8%) |
| 65 to 74 Years | 109 (33.7%) | 0 (0.0%) |
| 75 Years and over | 52 (8.1%) | 0 (0.0%) |
| Total | 2,118 (61.4%) | 76 (3.6%) |
Employment Status by Educational Attainment in Chagrin Falls
According to labor force statistics for Chagrin Falls, 88.4% of individuals (1,880) out of the total population between 25 and 64 years of age (2,127) are in the labor force, with 2.9% or 55 of them being unemployed. The group with the highest labor force participation rate are those with the educational attainment of bachelor's degree or higher, with 91.1% or 1,424 individuals in the labor force. Within the labor force, individuals with high school diploma education have the highest percentage of unemployment, with 11.2% or 20 of them being unemployed.
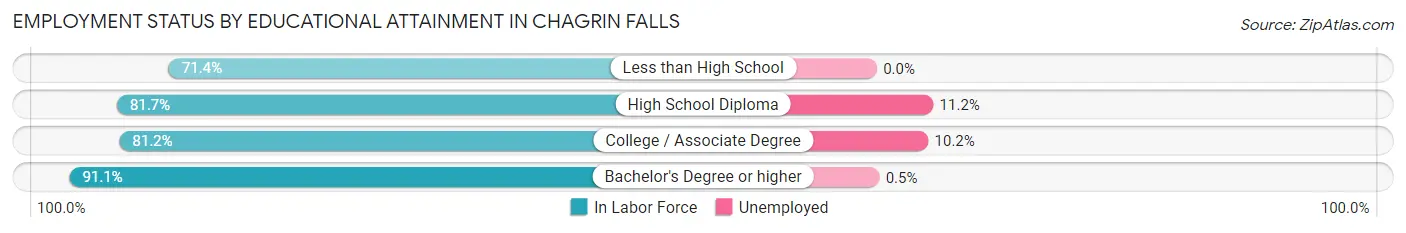
| Educational Attainment | In Labor Force | Unemployed |
| Less than High School | 15 (71.4%) | 0 (0.0%) |
| High School Diploma | 178 (81.7%) | 24 (11.2%) |
| College / Associate Degree | 264 (81.2%) | 33 (10.2%) |
| Bachelor's Degree or higher | 1,424 (91.1%) | 8 (0.5%) |
| Total | 1,880 (88.4%) | 62 (2.9%) |
Employment Occupations by Sex in Chagrin Falls
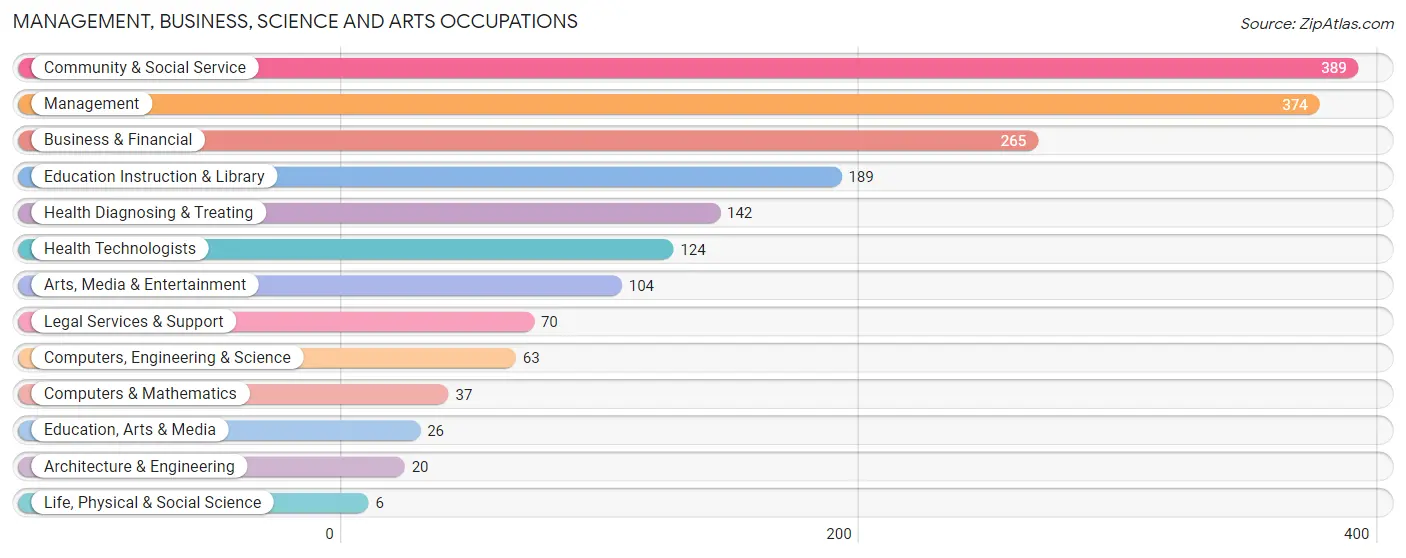
Management, Business, Science and Arts Occupations
The most common Management, Business, Science and Arts occupations in Chagrin Falls are Community & Social Service (389 | 19.0%), Management (374 | 18.3%), Business & Financial (265 | 13.0%), Education Instruction & Library (189 | 9.2%), and Health Diagnosing & Treating (142 | 7.0%).
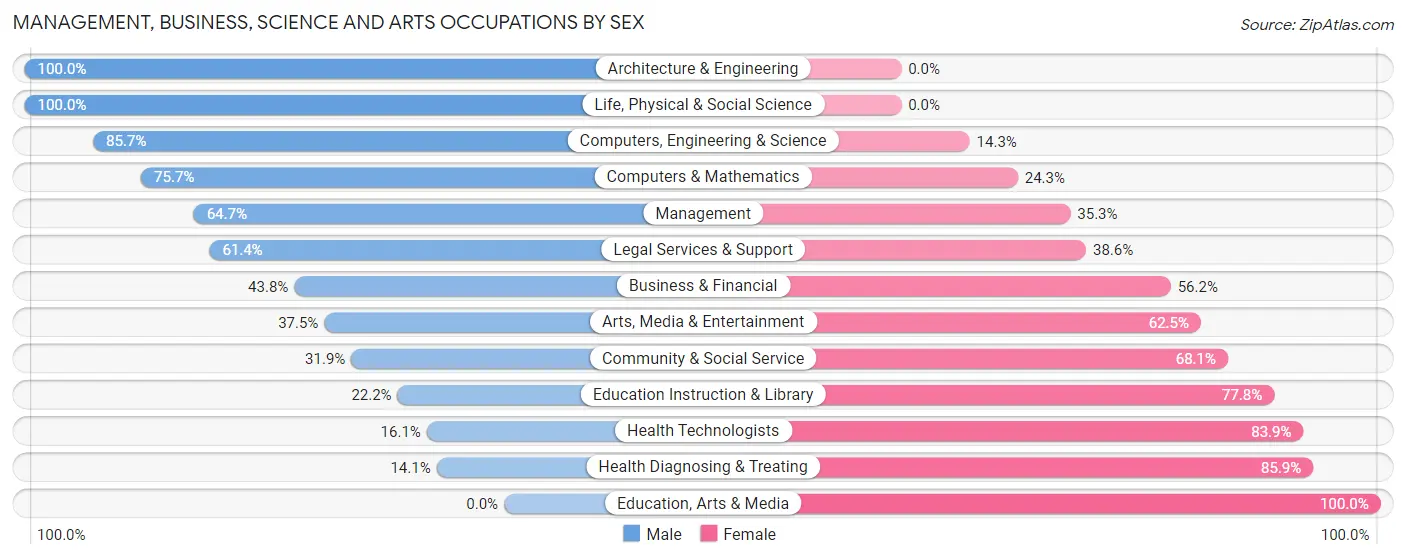
Management, Business, Science and Arts Occupations by Sex
Within the Management, Business, Science and Arts occupations in Chagrin Falls, the most male-oriented occupations are Architecture & Engineering (100.0%), Life, Physical & Social Science (100.0%), and Computers, Engineering & Science (85.7%), while the most female-oriented occupations are Education, Arts & Media (100.0%), Health Diagnosing & Treating (85.9%), and Health Technologists (83.9%).
| Occupation | Male | Female |
| Management | 242 (64.7%) | 132 (35.3%) |
| Business & Financial | 116 (43.8%) | 149 (56.2%) |
| Computers, Engineering & Science | 54 (85.7%) | 9 (14.3%) |
| Computers & Mathematics | 28 (75.7%) | 9 (24.3%) |
| Architecture & Engineering | 20 (100.0%) | 0 (0.0%) |
| Life, Physical & Social Science | 6 (100.0%) | 0 (0.0%) |
| Community & Social Service | 124 (31.9%) | 265 (68.1%) |
| Education, Arts & Media | 0 (0.0%) | 26 (100.0%) |
| Legal Services & Support | 43 (61.4%) | 27 (38.6%) |
| Education Instruction & Library | 42 (22.2%) | 147 (77.8%) |
| Arts, Media & Entertainment | 39 (37.5%) | 65 (62.5%) |
| Health Diagnosing & Treating | 20 (14.1%) | 122 (85.9%) |
| Health Technologists | 20 (16.1%) | 104 (83.9%) |
| Total (Category) | 556 (45.1%) | 677 (54.9%) |
| Total (Overall) | 976 (47.8%) | 1,067 (52.2%) |
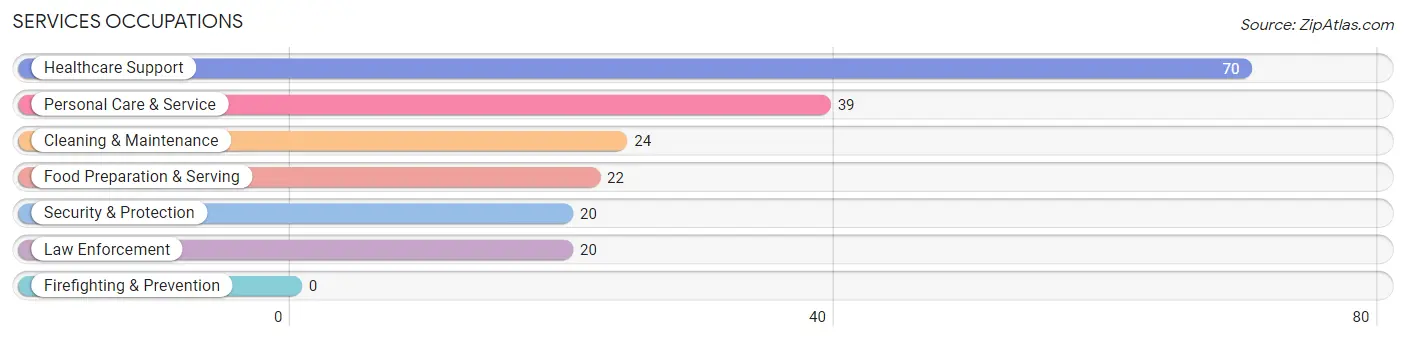
Services Occupations
The most common Services occupations in Chagrin Falls are Healthcare Support (70 | 3.4%), Personal Care & Service (39 | 1.9%), Cleaning & Maintenance (24 | 1.2%), Food Preparation & Serving (22 | 1.1%), and Security & Protection (20 | 1.0%).
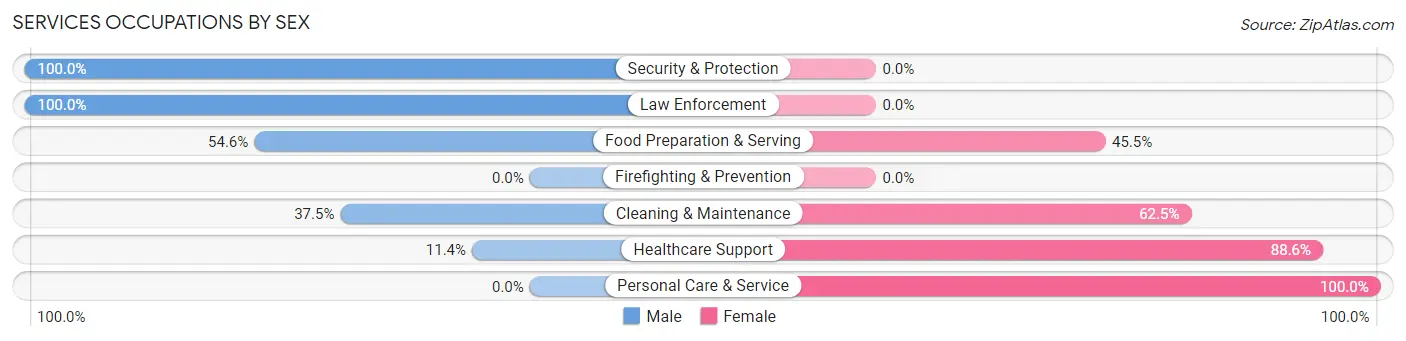
Services Occupations by Sex
Within the Services occupations in Chagrin Falls, the most male-oriented occupations are Security & Protection (100.0%), Law Enforcement (100.0%), and Food Preparation & Serving (54.5%), while the most female-oriented occupations are Personal Care & Service (100.0%), Healthcare Support (88.6%), and Cleaning & Maintenance (62.5%).
| Occupation | Male | Female |
| Healthcare Support | 8 (11.4%) | 62 (88.6%) |
| Security & Protection | 20 (100.0%) | 0 (0.0%) |
| Firefighting & Prevention | 0 (0.0%) | 0 (0.0%) |
| Law Enforcement | 20 (100.0%) | 0 (0.0%) |
| Food Preparation & Serving | 12 (54.5%) | 10 (45.5%) |
| Cleaning & Maintenance | 9 (37.5%) | 15 (62.5%) |
| Personal Care & Service | 0 (0.0%) | 39 (100.0%) |
| Total (Category) | 49 (28.0%) | 126 (72.0%) |
| Total (Overall) | 976 (47.8%) | 1,067 (52.2%) |
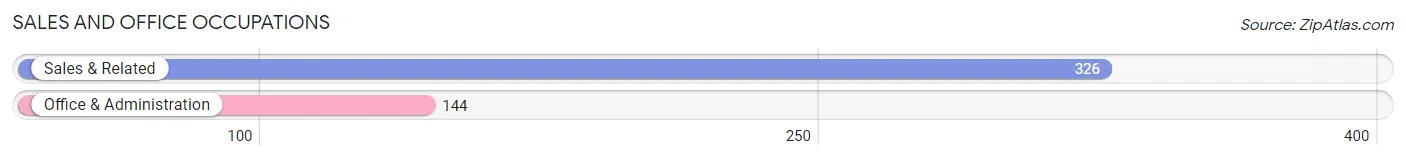
Sales and Office Occupations
The most common Sales and Office occupations in Chagrin Falls are Sales & Related (326 | 16.0%), and Office & Administration (144 | 7.0%).
Sales and Office Occupations by Sex
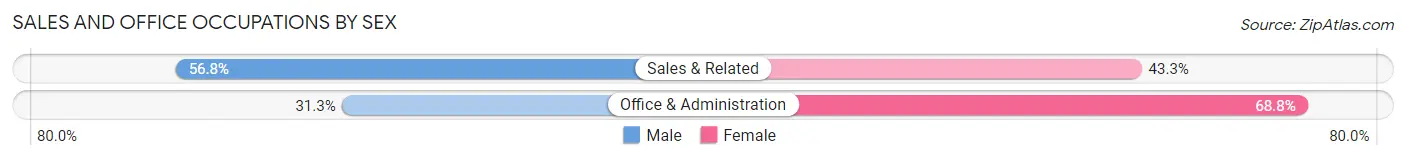
| Occupation | Male | Female |
| Sales & Related | 185 (56.8%) | 141 (43.2%) |
| Office & Administration | 45 (31.2%) | 99 (68.8%) |
| Total (Category) | 230 (48.9%) | 240 (51.1%) |
| Total (Overall) | 976 (47.8%) | 1,067 (52.2%) |
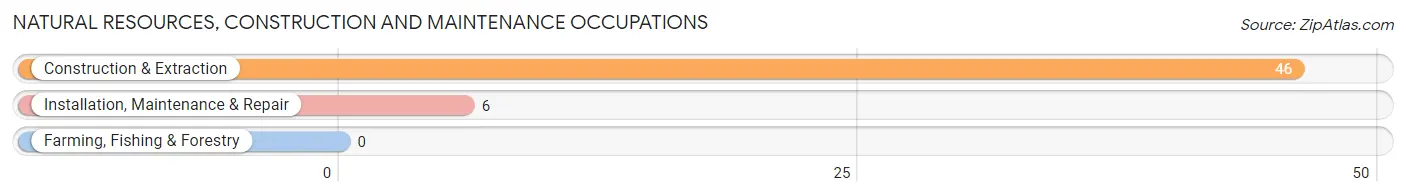
Natural Resources, Construction and Maintenance Occupations
The most common Natural Resources, Construction and Maintenance occupations in Chagrin Falls are Construction & Extraction (46 | 2.2%), and Installation, Maintenance & Repair (6 | 0.3%).
Natural Resources, Construction and Maintenance Occupations by Sex
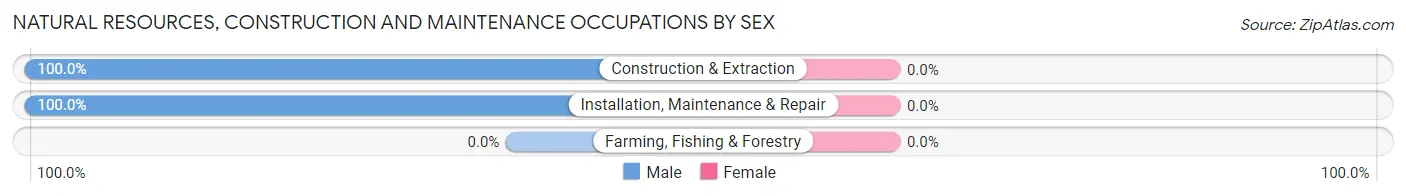
| Occupation | Male | Female |
| Farming, Fishing & Forestry | 0 (0.0%) | 0 (0.0%) |
| Construction & Extraction | 46 (100.0%) | 0 (0.0%) |
| Installation, Maintenance & Repair | 6 (100.0%) | 0 (0.0%) |
| Total (Category) | 52 (100.0%) | 0 (0.0%) |
| Total (Overall) | 976 (47.8%) | 1,067 (52.2%) |
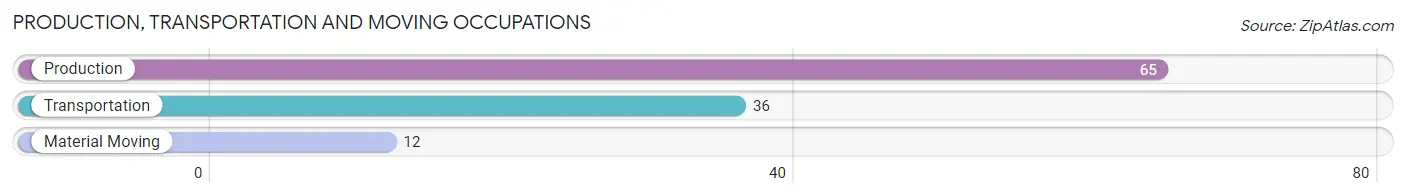
Production, Transportation and Moving Occupations
The most common Production, Transportation and Moving occupations in Chagrin Falls are Production (65 | 3.2%), Transportation (36 | 1.8%), and Material Moving (12 | 0.6%).
Production, Transportation and Moving Occupations by Sex
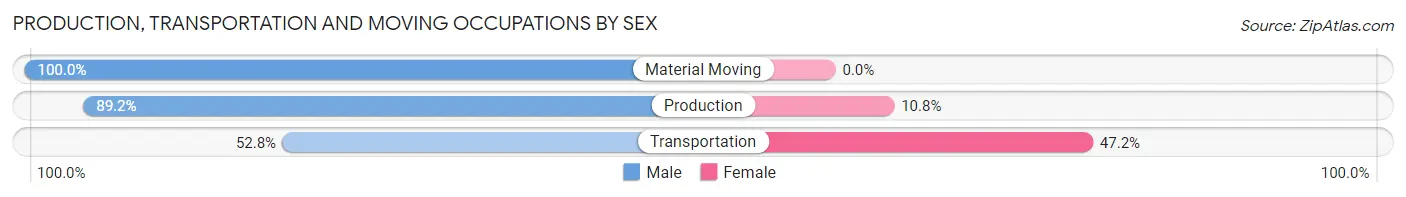
| Occupation | Male | Female |
| Production | 58 (89.2%) | 7 (10.8%) |
| Transportation | 19 (52.8%) | 17 (47.2%) |
| Material Moving | 12 (100.0%) | 0 (0.0%) |
| Total (Category) | 89 (78.8%) | 24 (21.2%) |
| Total (Overall) | 976 (47.8%) | 1,067 (52.2%) |
Employment Industries by Sex in Chagrin Falls
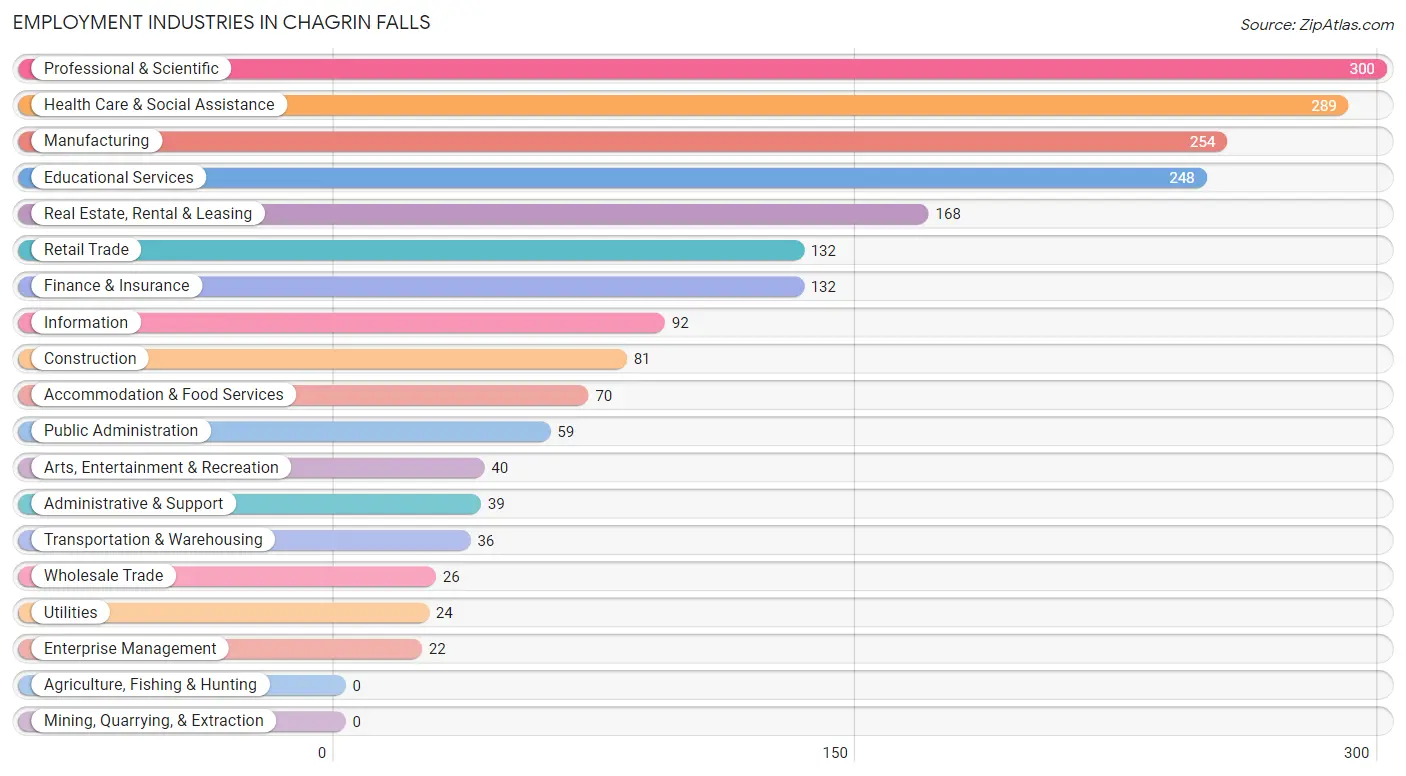
Employment Industries in Chagrin Falls
The major employment industries in Chagrin Falls include Professional & Scientific (300 | 14.7%), Health Care & Social Assistance (289 | 14.1%), Manufacturing (254 | 12.4%), Educational Services (248 | 12.1%), and Real Estate, Rental & Leasing (168 | 8.2%).
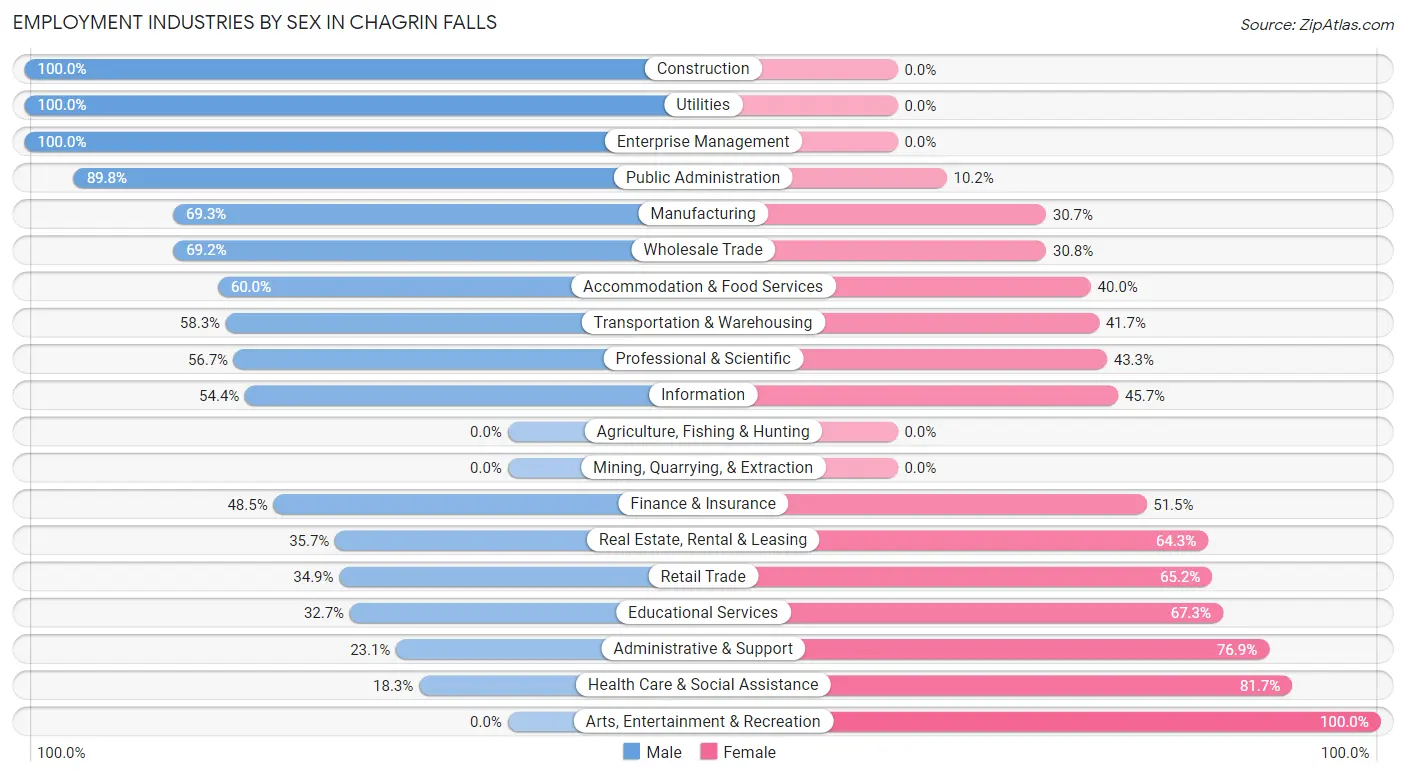
Employment Industries by Sex in Chagrin Falls
The Chagrin Falls industries that see more men than women are Construction (100.0%), Utilities (100.0%), and Enterprise Management (100.0%), whereas the industries that tend to have a higher number of women are Arts, Entertainment & Recreation (100.0%), Health Care & Social Assistance (81.7%), and Administrative & Support (76.9%).
| Industry | Male | Female |
| Agriculture, Fishing & Hunting | 0 (0.0%) | 0 (0.0%) |
| Mining, Quarrying, & Extraction | 0 (0.0%) | 0 (0.0%) |
| Construction | 81 (100.0%) | 0 (0.0%) |
| Manufacturing | 176 (69.3%) | 78 (30.7%) |
| Wholesale Trade | 18 (69.2%) | 8 (30.8%) |
| Retail Trade | 46 (34.8%) | 86 (65.1%) |
| Transportation & Warehousing | 21 (58.3%) | 15 (41.7%) |
| Utilities | 24 (100.0%) | 0 (0.0%) |
| Information | 50 (54.3%) | 42 (45.7%) |
| Finance & Insurance | 64 (48.5%) | 68 (51.5%) |
| Real Estate, Rental & Leasing | 60 (35.7%) | 108 (64.3%) |
| Professional & Scientific | 170 (56.7%) | 130 (43.3%) |
| Enterprise Management | 22 (100.0%) | 0 (0.0%) |
| Administrative & Support | 9 (23.1%) | 30 (76.9%) |
| Educational Services | 81 (32.7%) | 167 (67.3%) |
| Health Care & Social Assistance | 53 (18.3%) | 236 (81.7%) |
| Arts, Entertainment & Recreation | 0 (0.0%) | 40 (100.0%) |
| Accommodation & Food Services | 42 (60.0%) | 28 (40.0%) |
| Public Administration | 53 (89.8%) | 6 (10.2%) |
| Total | 976 (47.8%) | 1,067 (52.2%) |
Education in Chagrin Falls
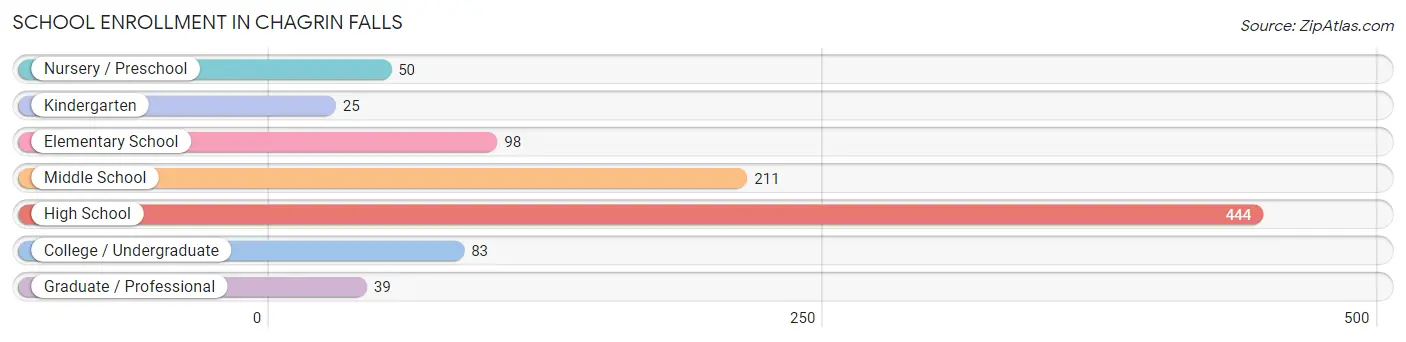
School Enrollment in Chagrin Falls
The most common levels of schooling among the 950 students in Chagrin Falls are high school (444 | 46.7%), middle school (211 | 22.2%), and elementary school (98 | 10.3%).
| School Level | # Students | % Students |
| Nursery / Preschool | 50 | 5.3% |
| Kindergarten | 25 | 2.6% |
| Elementary School | 98 | 10.3% |
| Middle School | 211 | 22.2% |
| High School | 444 | 46.7% |
| College / Undergraduate | 83 | 8.7% |
| Graduate / Professional | 39 | 4.1% |
| Total | 950 | 100.0% |
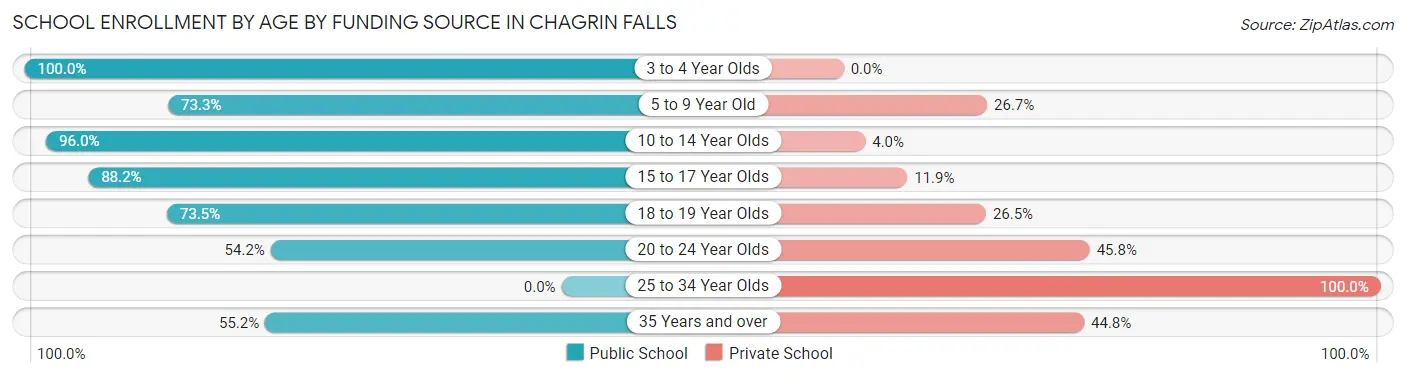
School Enrollment by Age by Funding Source in Chagrin Falls
Out of a total of 950 students who are enrolled in schools in Chagrin Falls, 160 (16.8%) attend a private institution, while the remaining 790 (83.2%) are enrolled in public schools. The age group of 25 to 34 year olds has the highest likelihood of being enrolled in private schools, with 8 (100.0% in the age bracket) enrolled. Conversely, the age group of 3 to 4 year olds has the lowest likelihood of being enrolled in a private school, with 10 (100.0% in the age bracket) attending a public institution.
| Age Bracket | Public School | Private School |
| 3 to 4 Year Olds | 10 (100.0%) | 0 (0.0%) |
| 5 to 9 Year Old | 96 (73.3%) | 35 (26.7%) |
| 10 to 14 Year Olds | 310 (96.0%) | 13 (4.0%) |
| 15 to 17 Year Olds | 238 (88.1%) | 32 (11.8%) |
| 18 to 19 Year Olds | 86 (73.5%) | 31 (26.5%) |
| 20 to 24 Year Olds | 13 (54.2%) | 11 (45.8%) |
| 25 to 34 Year Olds | 0 (0.0%) | 8 (100.0%) |
| 35 Years and over | 37 (55.2%) | 30 (44.8%) |
| Total | 790 (83.2%) | 160 (16.8%) |
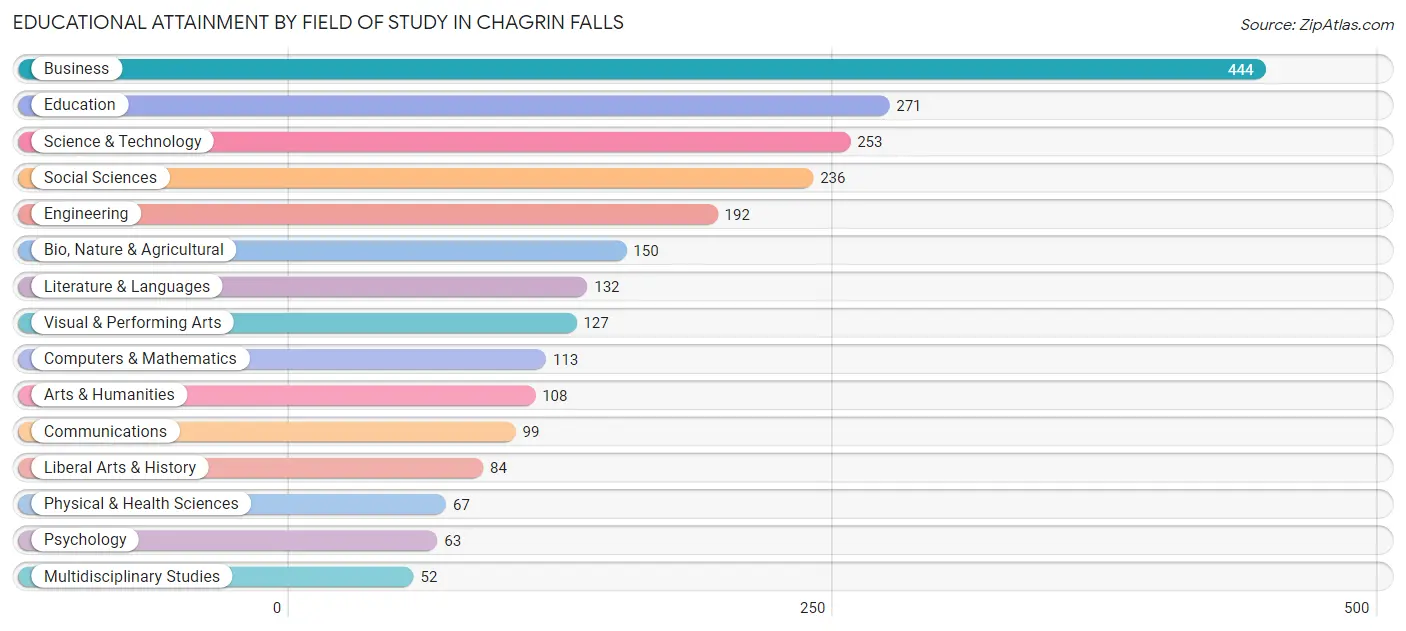
Educational Attainment by Field of Study in Chagrin Falls
Business (444 | 18.6%), education (271 | 11.3%), science & technology (253 | 10.6%), social sciences (236 | 9.9%), and engineering (192 | 8.0%) are the most common fields of study among 2,391 individuals in Chagrin Falls who have obtained a bachelor's degree or higher.
| Field of Study | # Graduates | % Graduates |
| Computers & Mathematics | 113 | 4.7% |
| Bio, Nature & Agricultural | 150 | 6.3% |
| Physical & Health Sciences | 67 | 2.8% |
| Psychology | 63 | 2.6% |
| Social Sciences | 236 | 9.9% |
| Engineering | 192 | 8.0% |
| Multidisciplinary Studies | 52 | 2.2% |
| Science & Technology | 253 | 10.6% |
| Business | 444 | 18.6% |
| Education | 271 | 11.3% |
| Literature & Languages | 132 | 5.5% |
| Liberal Arts & History | 84 | 3.5% |
| Visual & Performing Arts | 127 | 5.3% |
| Communications | 99 | 4.1% |
| Arts & Humanities | 108 | 4.5% |
| Total | 2,391 | 100.0% |
Transportation & Commute in Chagrin Falls
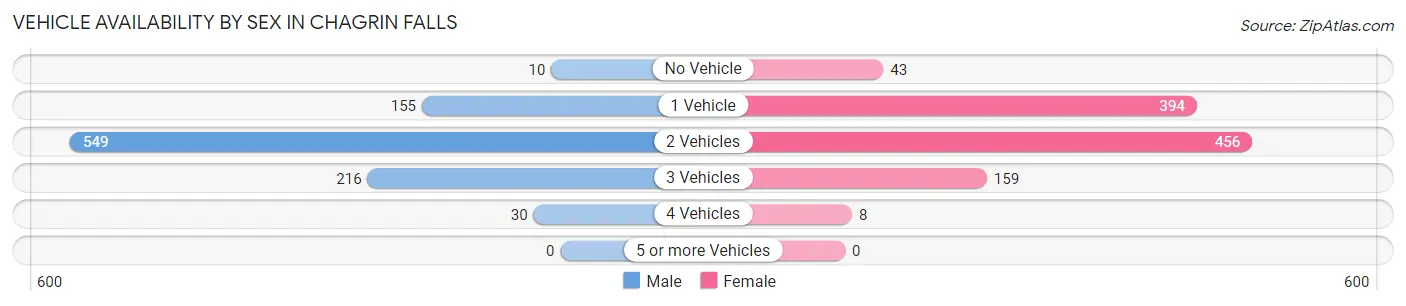
Vehicle Availability by Sex in Chagrin Falls
The most prevalent vehicle ownership categories in Chagrin Falls are males with 2 vehicles (549, accounting for 57.2%) and females with 2 vehicles (456, making up 51.8%).
| Vehicles Available | Male | Female |
| No Vehicle | 10 (1.0%) | 43 (4.1%) |
| 1 Vehicle | 155 (16.2%) | 394 (37.2%) |
| 2 Vehicles | 549 (57.2%) | 456 (43.0%) |
| 3 Vehicles | 216 (22.5%) | 159 (15.0%) |
| 4 Vehicles | 30 (3.1%) | 8 (0.7%) |
| 5 or more Vehicles | 0 (0.0%) | 0 (0.0%) |
| Total | 960 (100.0%) | 1,060 (100.0%) |
Commute Time in Chagrin Falls
The most frequently occuring commute durations in Chagrin Falls are 5 to 9 minutes (268 commuters, 18.0%), 15 to 19 minutes (227 commuters, 15.3%), and 30 to 34 minutes (217 commuters, 14.6%).
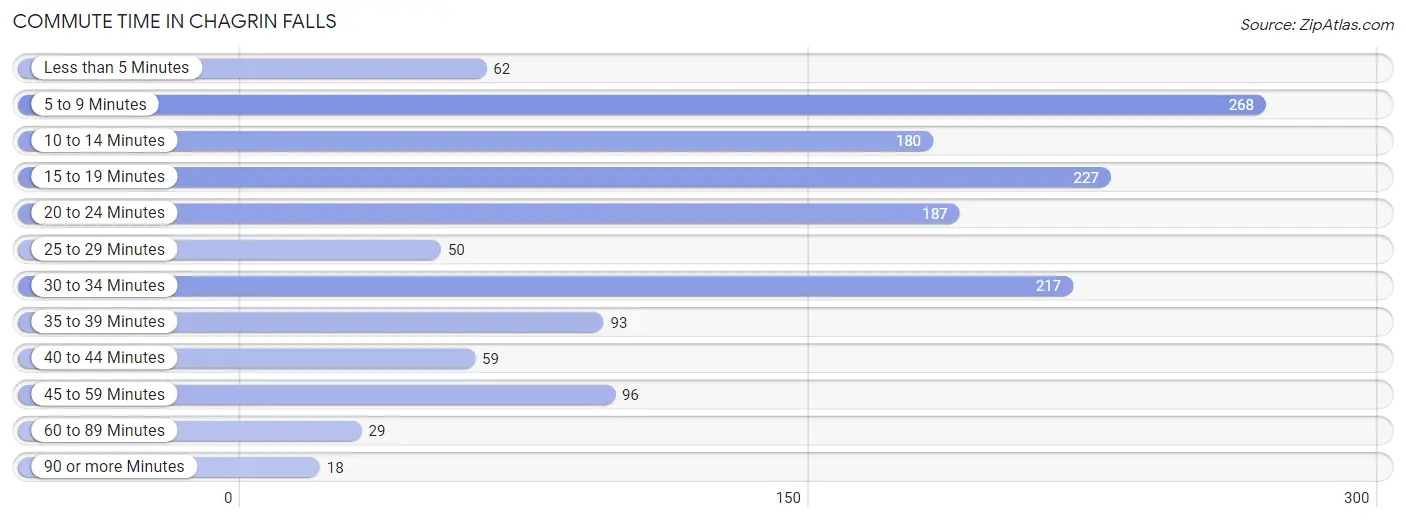
| Commute Time | # Commuters | % Commuters |
| Less than 5 Minutes | 62 | 4.2% |
| 5 to 9 Minutes | 268 | 18.0% |
| 10 to 14 Minutes | 180 | 12.1% |
| 15 to 19 Minutes | 227 | 15.3% |
| 20 to 24 Minutes | 187 | 12.6% |
| 25 to 29 Minutes | 50 | 3.4% |
| 30 to 34 Minutes | 217 | 14.6% |
| 35 to 39 Minutes | 93 | 6.3% |
| 40 to 44 Minutes | 59 | 4.0% |
| 45 to 59 Minutes | 96 | 6.5% |
| 60 to 89 Minutes | 29 | 1.9% |
| 90 or more Minutes | 18 | 1.2% |
Commute Time by Sex in Chagrin Falls
The most common commute times in Chagrin Falls are 30 to 34 minutes (131 commuters, 17.7%) for males and 5 to 9 minutes (192 commuters, 25.8%) for females.
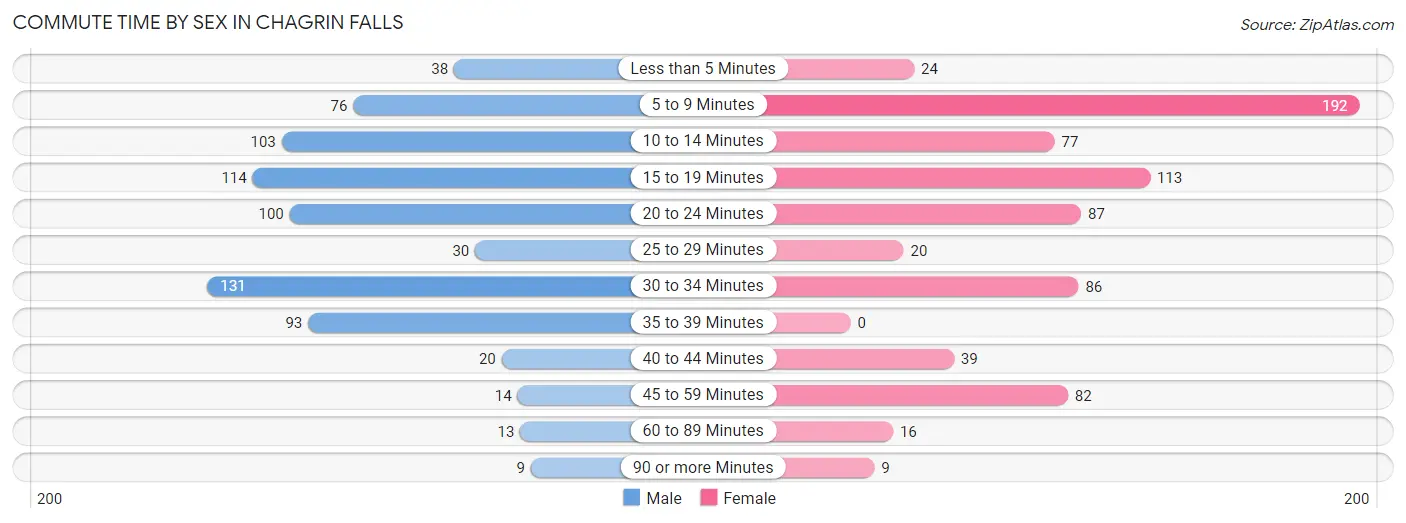
| Commute Time | Male | Female |
| Less than 5 Minutes | 38 (5.1%) | 24 (3.2%) |
| 5 to 9 Minutes | 76 (10.3%) | 192 (25.8%) |
| 10 to 14 Minutes | 103 (13.9%) | 77 (10.3%) |
| 15 to 19 Minutes | 114 (15.4%) | 113 (15.2%) |
| 20 to 24 Minutes | 100 (13.5%) | 87 (11.7%) |
| 25 to 29 Minutes | 30 (4.1%) | 20 (2.7%) |
| 30 to 34 Minutes | 131 (17.7%) | 86 (11.5%) |
| 35 to 39 Minutes | 93 (12.6%) | 0 (0.0%) |
| 40 to 44 Minutes | 20 (2.7%) | 39 (5.2%) |
| 45 to 59 Minutes | 14 (1.9%) | 82 (11.0%) |
| 60 to 89 Minutes | 13 (1.8%) | 16 (2.1%) |
| 90 or more Minutes | 9 (1.2%) | 9 (1.2%) |
Time of Departure to Work by Sex in Chagrin Falls
The most frequent times of departure to work in Chagrin Falls are 7:30 AM to 7:59 AM (180, 24.3%) for males and 7:30 AM to 7:59 AM (166, 22.3%) for females.
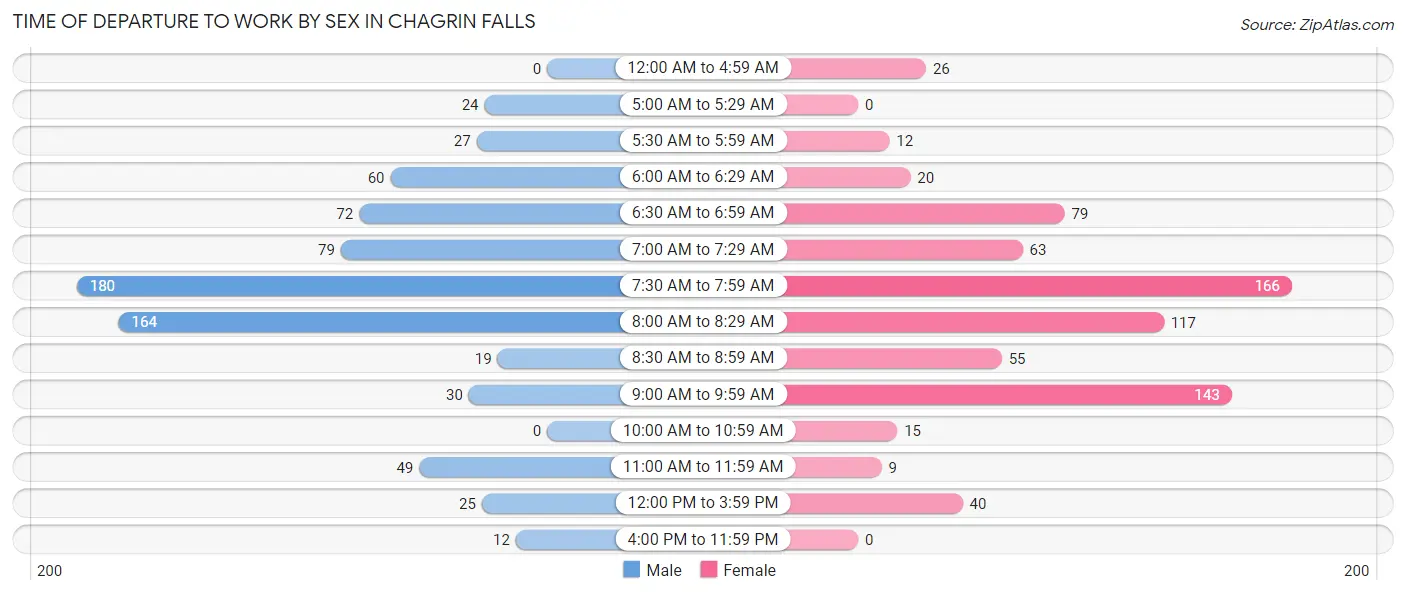
| Time of Departure | Male | Female |
| 12:00 AM to 4:59 AM | 0 (0.0%) | 26 (3.5%) |
| 5:00 AM to 5:29 AM | 24 (3.2%) | 0 (0.0%) |
| 5:30 AM to 5:59 AM | 27 (3.6%) | 12 (1.6%) |
| 6:00 AM to 6:29 AM | 60 (8.1%) | 20 (2.7%) |
| 6:30 AM to 6:59 AM | 72 (9.7%) | 79 (10.6%) |
| 7:00 AM to 7:29 AM | 79 (10.7%) | 63 (8.5%) |
| 7:30 AM to 7:59 AM | 180 (24.3%) | 166 (22.3%) |
| 8:00 AM to 8:29 AM | 164 (22.1%) | 117 (15.7%) |
| 8:30 AM to 8:59 AM | 19 (2.6%) | 55 (7.4%) |
| 9:00 AM to 9:59 AM | 30 (4.1%) | 143 (19.2%) |
| 10:00 AM to 10:59 AM | 0 (0.0%) | 15 (2.0%) |
| 11:00 AM to 11:59 AM | 49 (6.6%) | 9 (1.2%) |
| 12:00 PM to 3:59 PM | 25 (3.4%) | 40 (5.4%) |
| 4:00 PM to 11:59 PM | 12 (1.6%) | 0 (0.0%) |
| Total | 741 (100.0%) | 745 (100.0%) |
Housing Occupancy in Chagrin Falls
Occupancy by Ownership in Chagrin Falls
Of the total 1,897 dwellings in Chagrin Falls, owner-occupied units account for 1,514 (79.8%), while renter-occupied units make up 383 (20.2%).
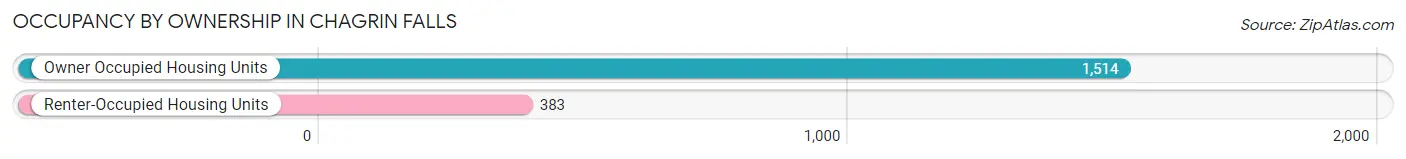
| Occupancy | # Housing Units | % Housing Units |
| Owner Occupied Housing Units | 1,514 | 79.8% |
| Renter-Occupied Housing Units | 383 | 20.2% |
| Total Occupied Housing Units | 1,897 | 100.0% |
Occupancy by Household Size in Chagrin Falls
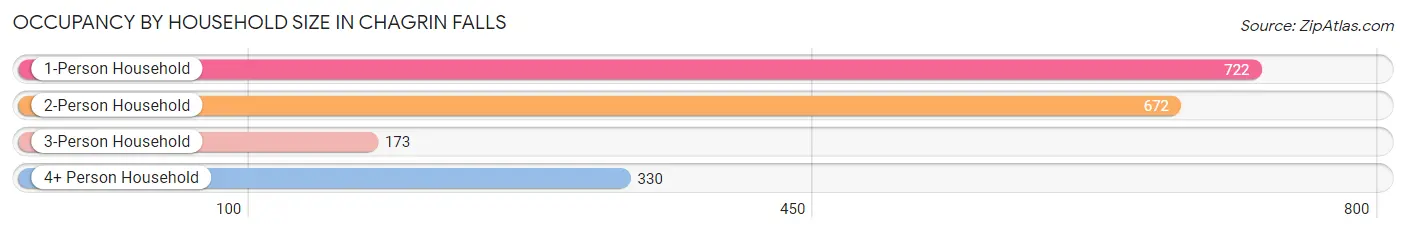
| Household Size | # Housing Units | % Housing Units |
| 1-Person Household | 722 | 38.1% |
| 2-Person Household | 672 | 35.4% |
| 3-Person Household | 173 | 9.1% |
| 4+ Person Household | 330 | 17.4% |
| Total Housing Units | 1,897 | 100.0% |
Occupancy by Ownership by Household Size in Chagrin Falls
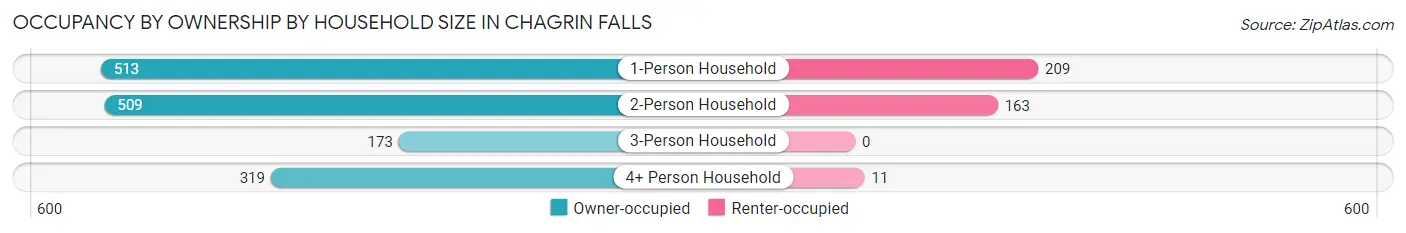
| Household Size | Owner-occupied | Renter-occupied |
| 1-Person Household | 513 (71.1%) | 209 (28.9%) |
| 2-Person Household | 509 (75.7%) | 163 (24.3%) |
| 3-Person Household | 173 (100.0%) | 0 (0.0%) |
| 4+ Person Household | 319 (96.7%) | 11 (3.3%) |
| Total Housing Units | 1,514 (79.8%) | 383 (20.2%) |
Occupancy by Educational Attainment in Chagrin Falls
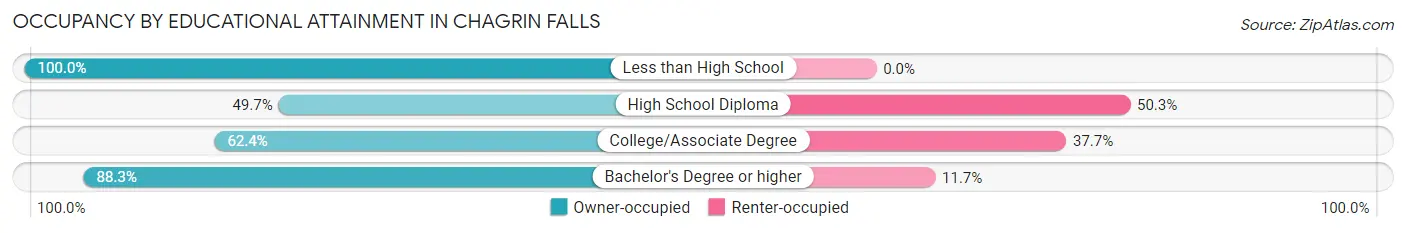
| Household Size | Owner-occupied | Renter-occupied |
| Less than High School | 38 (100.0%) | 0 (0.0%) |
| High School Diploma | 74 (49.7%) | 75 (50.3%) |
| College/Associate Degree | 260 (62.4%) | 157 (37.7%) |
| Bachelor's Degree or higher | 1,142 (88.3%) | 151 (11.7%) |
Occupancy by Age of Householder in Chagrin Falls
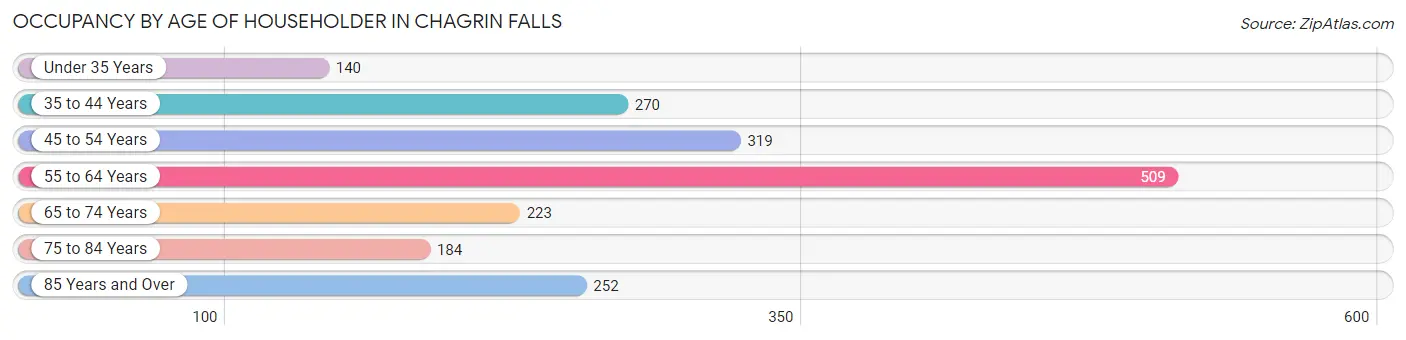
| Age Bracket | # Households | % Households |
| Under 35 Years | 140 | 7.4% |
| 35 to 44 Years | 270 | 14.2% |
| 45 to 54 Years | 319 | 16.8% |
| 55 to 64 Years | 509 | 26.8% |
| 65 to 74 Years | 223 | 11.8% |
| 75 to 84 Years | 184 | 9.7% |
| 85 Years and Over | 252 | 13.3% |
| Total | 1,897 | 100.0% |
Housing Finances in Chagrin Falls
Median Income by Occupancy in Chagrin Falls
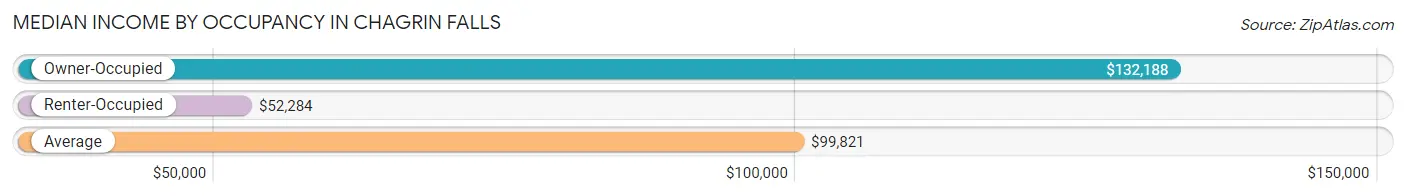
| Occupancy Type | # Households | Median Income |
| Owner-Occupied | 1,514 (79.8%) | $132,188 |
| Renter-Occupied | 383 (20.2%) | $52,284 |
| Average | 1,897 (100.0%) | $99,821 |
Occupancy by Householder Income Bracket in Chagrin Falls
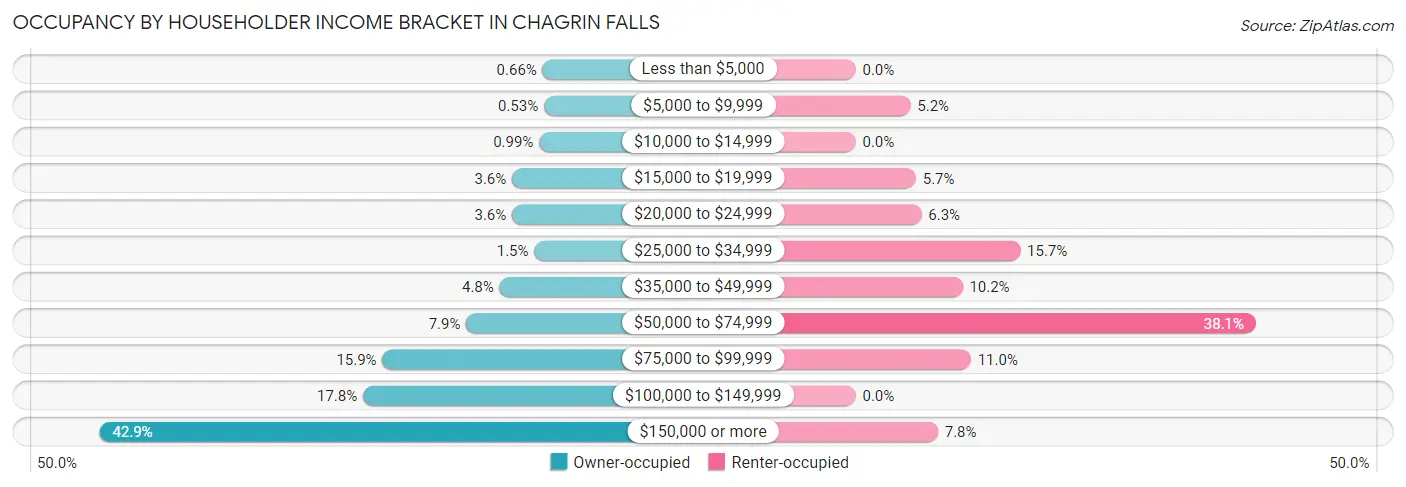
| Income Bracket | Owner-occupied | Renter-occupied |
| Less than $5,000 | 10 (0.7%) | 0 (0.0%) |
| $5,000 to $9,999 | 8 (0.5%) | 20 (5.2%) |
| $10,000 to $14,999 | 15 (1.0%) | 0 (0.0%) |
| $15,000 to $19,999 | 54 (3.6%) | 22 (5.7%) |
| $20,000 to $24,999 | 54 (3.6%) | 24 (6.3%) |
| $25,000 to $34,999 | 22 (1.5%) | 60 (15.7%) |
| $35,000 to $49,999 | 72 (4.8%) | 39 (10.2%) |
| $50,000 to $74,999 | 120 (7.9%) | 146 (38.1%) |
| $75,000 to $99,999 | 241 (15.9%) | 42 (11.0%) |
| $100,000 to $149,999 | 269 (17.8%) | 0 (0.0%) |
| $150,000 or more | 649 (42.9%) | 30 (7.8%) |
| Total | 1,514 (100.0%) | 383 (100.0%) |
Monthly Housing Cost Tiers in Chagrin Falls
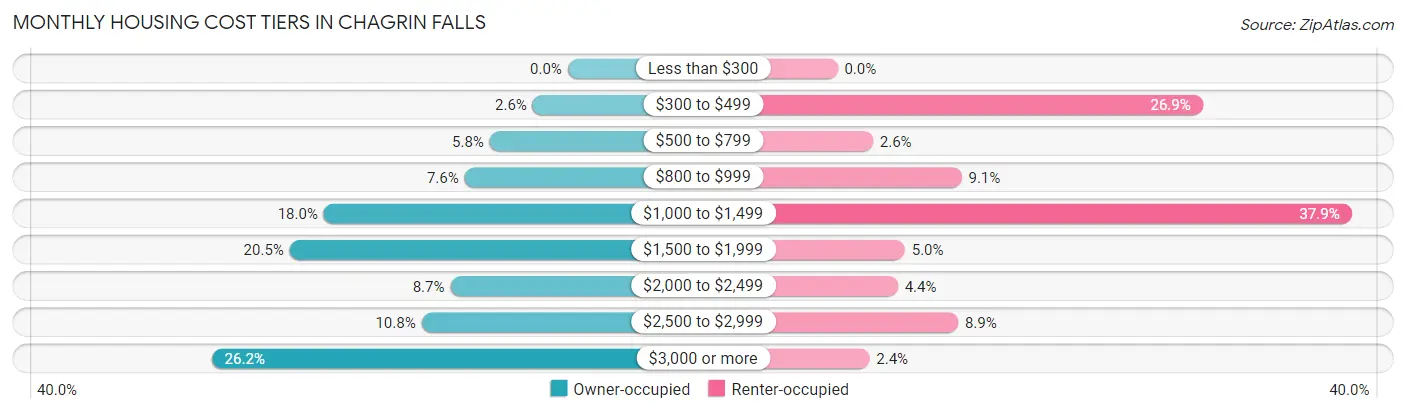
| Monthly Cost | Owner-occupied | Renter-occupied |
| Less than $300 | 0 (0.0%) | 0 (0.0%) |
| $300 to $499 | 39 (2.6%) | 103 (26.9%) |
| $500 to $799 | 87 (5.8%) | 10 (2.6%) |
| $800 to $999 | 115 (7.6%) | 35 (9.1%) |
| $1,000 to $1,499 | 272 (18.0%) | 145 (37.9%) |
| $1,500 to $1,999 | 310 (20.5%) | 19 (5.0%) |
| $2,000 to $2,499 | 131 (8.6%) | 17 (4.4%) |
| $2,500 to $2,999 | 163 (10.8%) | 34 (8.9%) |
| $3,000 or more | 397 (26.2%) | 9 (2.4%) |
| Total | 1,514 (100.0%) | 383 (100.0%) |
Physical Housing Characteristics in Chagrin Falls
Housing Structures in Chagrin Falls
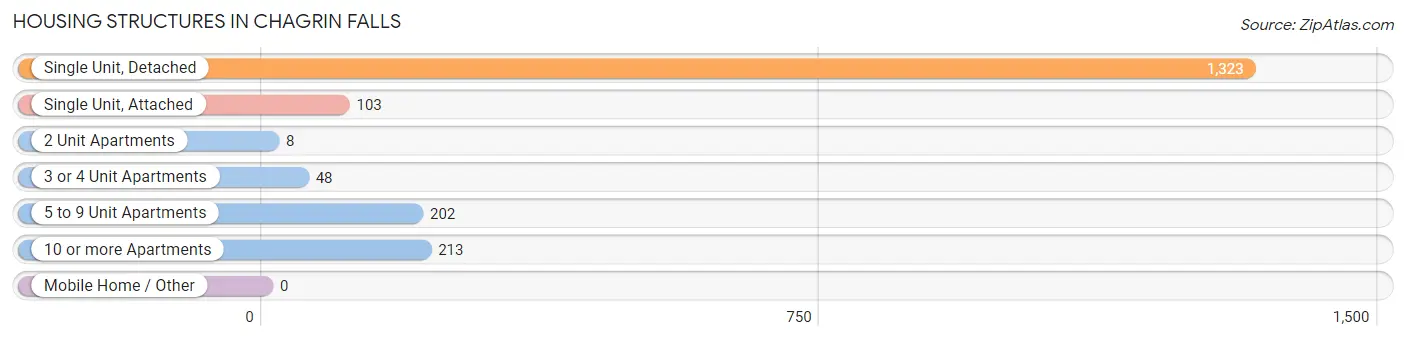
| Structure Type | # Housing Units | % Housing Units |
| Single Unit, Detached | 1,323 | 69.7% |
| Single Unit, Attached | 103 | 5.4% |
| 2 Unit Apartments | 8 | 0.4% |
| 3 or 4 Unit Apartments | 48 | 2.5% |
| 5 to 9 Unit Apartments | 202 | 10.6% |
| 10 or more Apartments | 213 | 11.2% |
| Mobile Home / Other | 0 | 0.0% |
| Total | 1,897 | 100.0% |
Housing Structures by Occupancy in Chagrin Falls
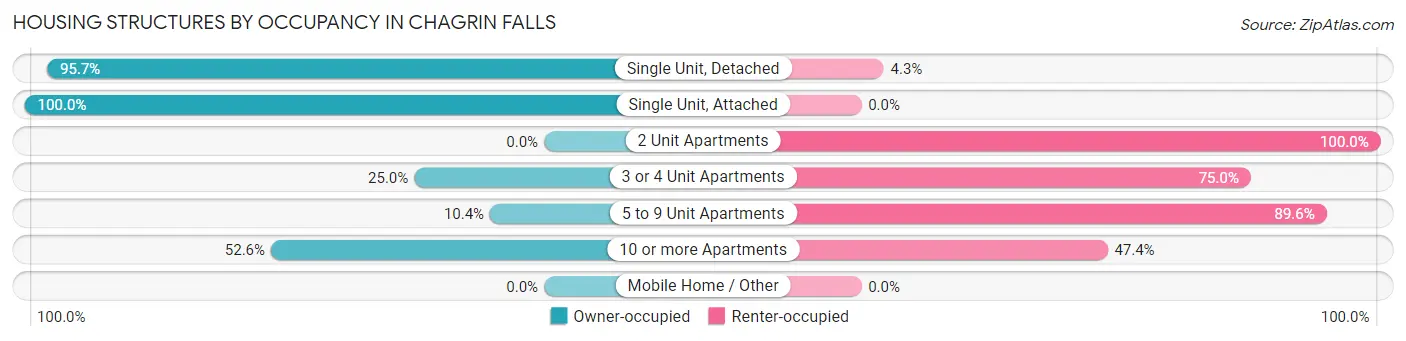
| Structure Type | Owner-occupied | Renter-occupied |
| Single Unit, Detached | 1,266 (95.7%) | 57 (4.3%) |
| Single Unit, Attached | 103 (100.0%) | 0 (0.0%) |
| 2 Unit Apartments | 0 (0.0%) | 8 (100.0%) |
| 3 or 4 Unit Apartments | 12 (25.0%) | 36 (75.0%) |
| 5 to 9 Unit Apartments | 21 (10.4%) | 181 (89.6%) |
| 10 or more Apartments | 112 (52.6%) | 101 (47.4%) |
| Mobile Home / Other | 0 (0.0%) | 0 (0.0%) |
| Total | 1,514 (79.8%) | 383 (20.2%) |
Housing Structures by Number of Rooms in Chagrin Falls
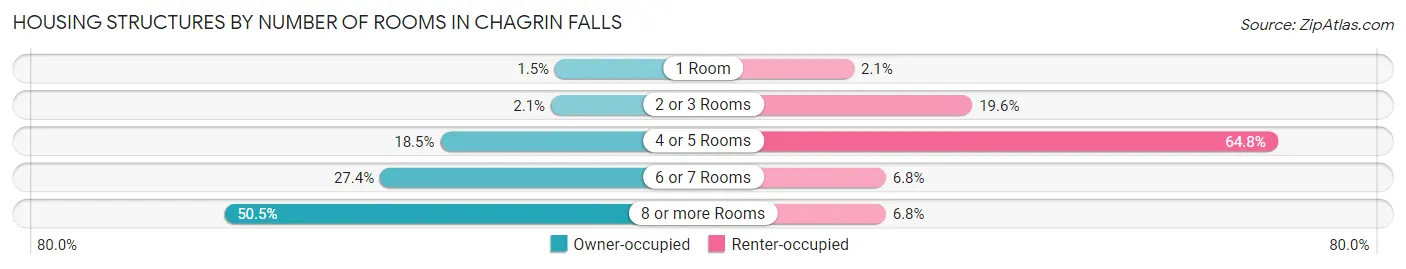
| Number of Rooms | Owner-occupied | Renter-occupied |
| 1 Room | 23 (1.5%) | 8 (2.1%) |
| 2 or 3 Rooms | 32 (2.1%) | 75 (19.6%) |
| 4 or 5 Rooms | 280 (18.5%) | 248 (64.7%) |
| 6 or 7 Rooms | 415 (27.4%) | 26 (6.8%) |
| 8 or more Rooms | 764 (50.5%) | 26 (6.8%) |
| Total | 1,514 (100.0%) | 383 (100.0%) |
Housing Structure by Heating Type in Chagrin Falls
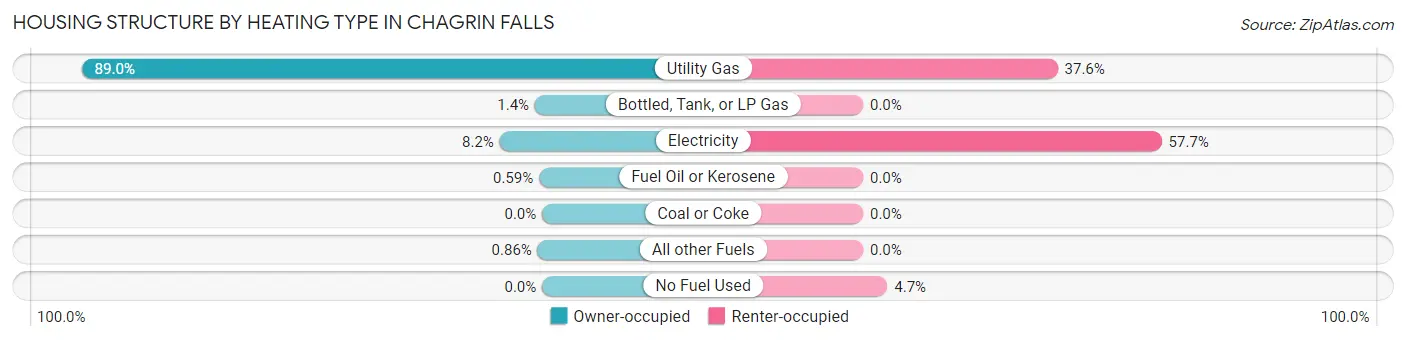
| Heating Type | Owner-occupied | Renter-occupied |
| Utility Gas | 1,347 (89.0%) | 144 (37.6%) |
| Bottled, Tank, or LP Gas | 21 (1.4%) | 0 (0.0%) |
| Electricity | 124 (8.2%) | 221 (57.7%) |
| Fuel Oil or Kerosene | 9 (0.6%) | 0 (0.0%) |
| Coal or Coke | 0 (0.0%) | 0 (0.0%) |
| All other Fuels | 13 (0.9%) | 0 (0.0%) |
| No Fuel Used | 0 (0.0%) | 18 (4.7%) |
| Total | 1,514 (100.0%) | 383 (100.0%) |
Household Vehicle Usage in Chagrin Falls
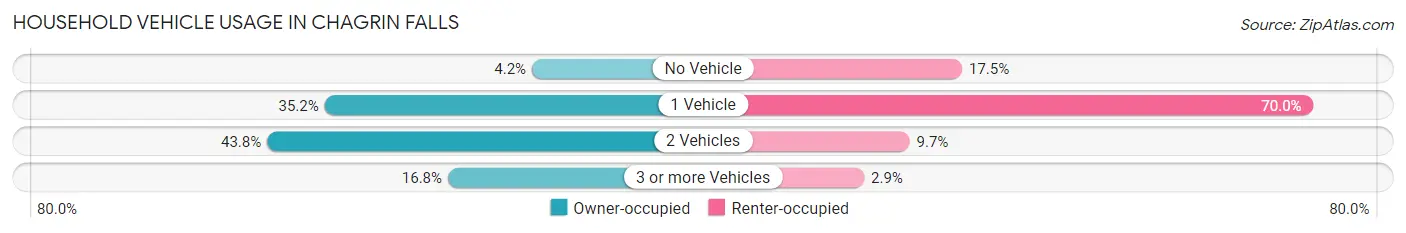
| Vehicles per Household | Owner-occupied | Renter-occupied |
| No Vehicle | 64 (4.2%) | 67 (17.5%) |
| 1 Vehicle | 533 (35.2%) | 268 (70.0%) |
| 2 Vehicles | 663 (43.8%) | 37 (9.7%) |
| 3 or more Vehicles | 254 (16.8%) | 11 (2.9%) |
| Total | 1,514 (100.0%) | 383 (100.0%) |
Real Estate & Mortgages in Chagrin Falls
Real Estate and Mortgage Overview in Chagrin Falls
| Characteristic | Without Mortgage | With Mortgage |
| Housing Units | 509 | 1,005 |
| Median Property Value | $396,500 | $383,200 |
| Median Household Income | $101,250 | $504 |
| Monthly Housing Costs | $1,122 | $377 |
| Real Estate Taxes | $8,438 | $0 |
Property Value by Mortgage Status in Chagrin Falls
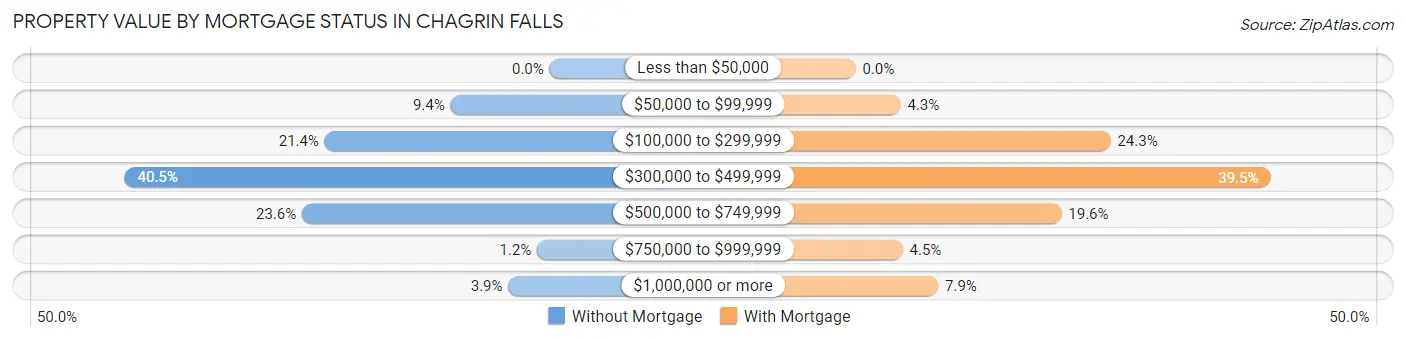
| Property Value | Without Mortgage | With Mortgage |
| Less than $50,000 | 0 (0.0%) | 0 (0.0%) |
| $50,000 to $99,999 | 48 (9.4%) | 43 (4.3%) |
| $100,000 to $299,999 | 109 (21.4%) | 244 (24.3%) |
| $300,000 to $499,999 | 206 (40.5%) | 397 (39.5%) |
| $500,000 to $749,999 | 120 (23.6%) | 197 (19.6%) |
| $750,000 to $999,999 | 6 (1.2%) | 45 (4.5%) |
| $1,000,000 or more | 20 (3.9%) | 79 (7.9%) |
| Total | 509 (100.0%) | 1,005 (100.0%) |
Household Income by Mortgage Status in Chagrin Falls
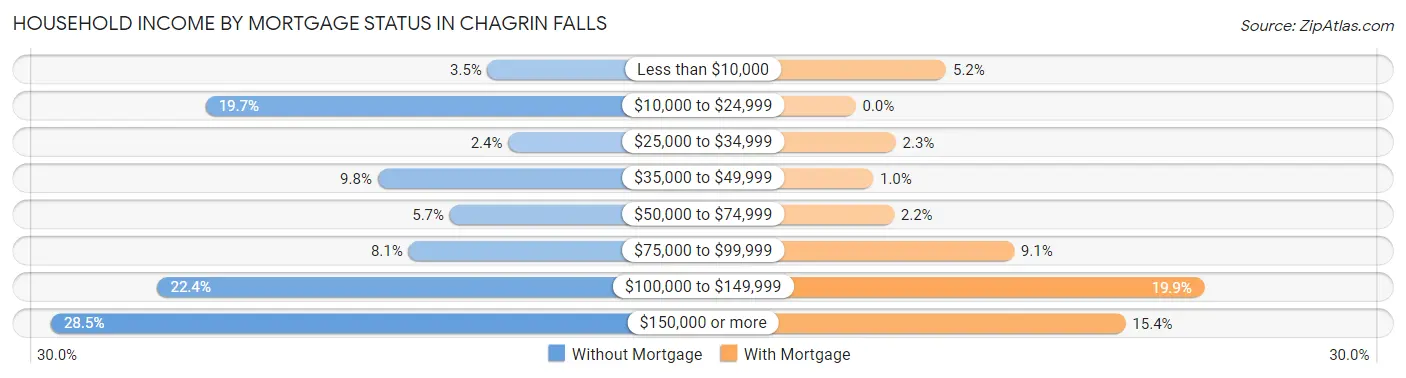
| Household Income | Without Mortgage | With Mortgage |
| Less than $10,000 | 18 (3.5%) | 52 (5.2%) |
| $10,000 to $24,999 | 100 (19.7%) | 0 (0.0%) |
| $25,000 to $34,999 | 12 (2.4%) | 23 (2.3%) |
| $35,000 to $49,999 | 50 (9.8%) | 10 (1.0%) |
| $50,000 to $74,999 | 29 (5.7%) | 22 (2.2%) |
| $75,000 to $99,999 | 41 (8.1%) | 91 (9.0%) |
| $100,000 to $149,999 | 114 (22.4%) | 200 (19.9%) |
| $150,000 or more | 145 (28.5%) | 155 (15.4%) |
| Total | 509 (100.0%) | 1,005 (100.0%) |
Property Value to Household Income Ratio in Chagrin Falls
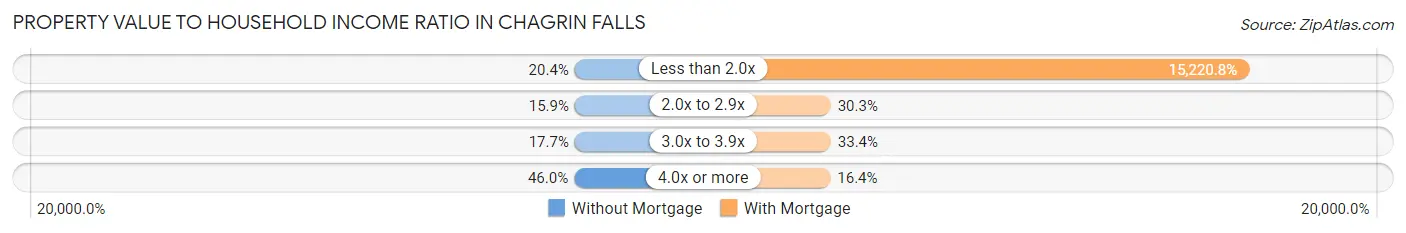
| Value-to-Income Ratio | Without Mortgage | With Mortgage |
| Less than 2.0x | 104 (20.4%) | 152,969 (15,220.8%) |
| 2.0x to 2.9x | 81 (15.9%) | 304 (30.2%) |
| 3.0x to 3.9x | 90 (17.7%) | 336 (33.4%) |
| 4.0x or more | 234 (46.0%) | 165 (16.4%) |
| Total | 509 (100.0%) | 1,005 (100.0%) |
Real Estate Taxes by Mortgage Status in Chagrin Falls
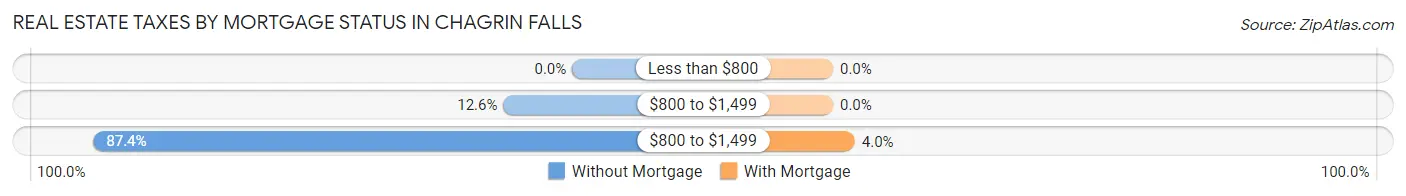
| Property Taxes | Without Mortgage | With Mortgage |
| Less than $800 | 0 (0.0%) | 0 (0.0%) |
| $800 to $1,499 | 64 (12.6%) | 0 (0.0%) |
| $800 to $1,499 | 445 (87.4%) | 40 (4.0%) |
| Total | 509 (100.0%) | 1,005 (100.0%) |
Health & Disability in Chagrin Falls
Health Insurance Coverage by Age in Chagrin Falls
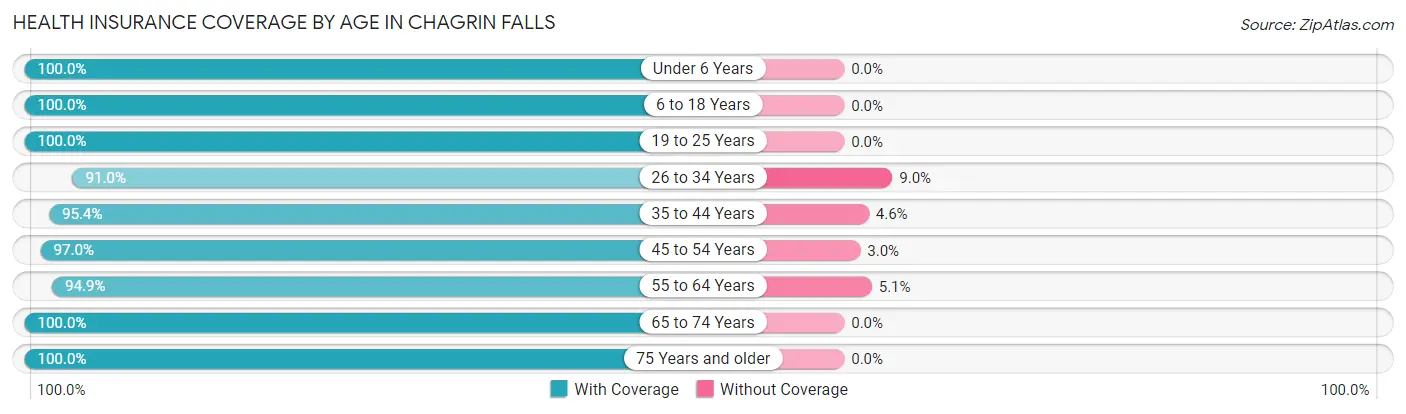
| Age Bracket | With Coverage | Without Coverage |
| Under 6 Years | 170 (100.0%) | 0 (0.0%) |
| 6 to 18 Years | 791 (100.0%) | 0 (0.0%) |
| 19 to 25 Years | 71 (100.0%) | 0 (0.0%) |
| 26 to 34 Years | 193 (91.0%) | 19 (9.0%) |
| 35 to 44 Years | 542 (95.4%) | 26 (4.6%) |
| 45 to 54 Years | 582 (97.0%) | 18 (3.0%) |
| 55 to 64 Years | 684 (94.9%) | 37 (5.1%) |
| 65 to 74 Years | 314 (100.0%) | 0 (0.0%) |
| 75 Years and older | 618 (100.0%) | 0 (0.0%) |
| Total | 3,965 (97.5%) | 100 (2.5%) |
Health Insurance Coverage by Citizenship Status in Chagrin Falls
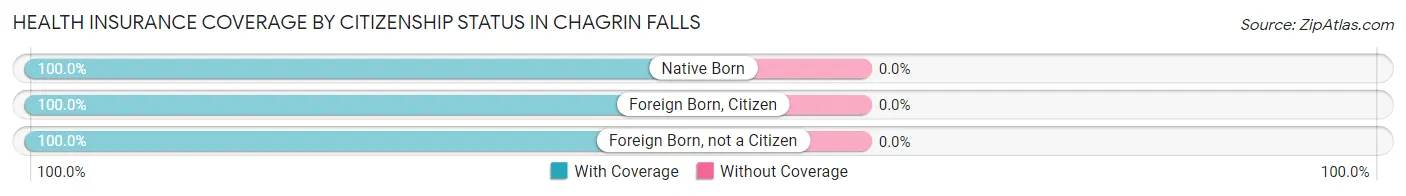
| Citizenship Status | With Coverage | Without Coverage |
| Native Born | 170 (100.0%) | 0 (0.0%) |
| Foreign Born, Citizen | 791 (100.0%) | 0 (0.0%) |
| Foreign Born, not a Citizen | 71 (100.0%) | 0 (0.0%) |
Health Insurance Coverage by Household Income in Chagrin Falls
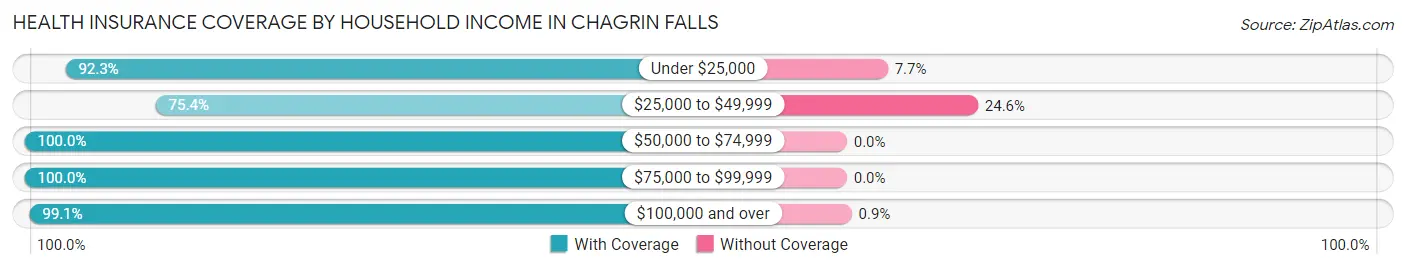
| Household Income | With Coverage | Without Coverage |
| Under $25,000 | 241 (92.3%) | 20 (7.7%) |
| $25,000 to $49,999 | 172 (75.4%) | 56 (24.6%) |
| $50,000 to $74,999 | 419 (100.0%) | 0 (0.0%) |
| $75,000 to $99,999 | 478 (100.0%) | 0 (0.0%) |
| $100,000 and over | 2,655 (99.1%) | 24 (0.9%) |
Public vs Private Health Insurance Coverage by Age in Chagrin Falls
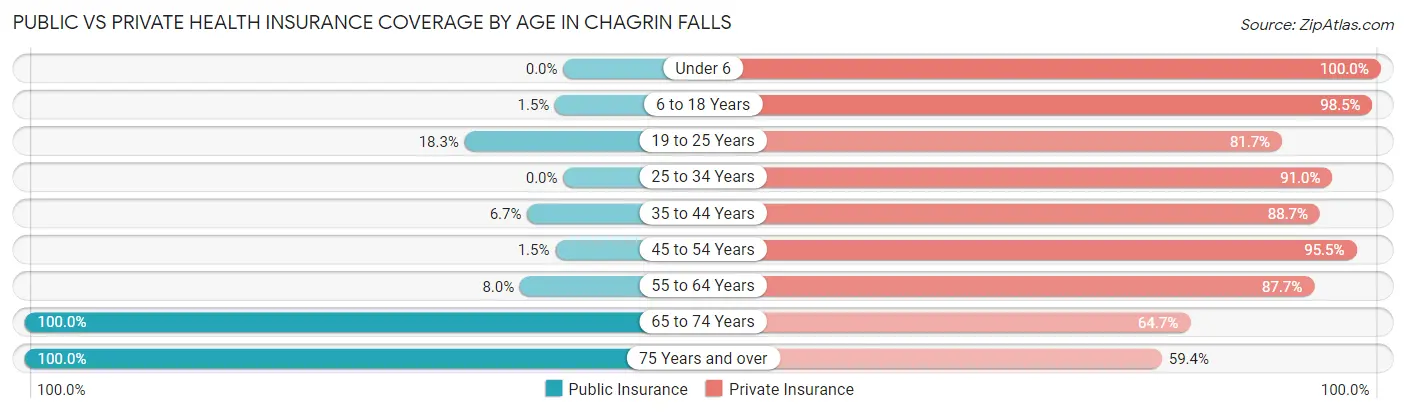
| Age Bracket | Public Insurance | Private Insurance |
| Under 6 | 0 (0.0%) | 170 (100.0%) |
| 6 to 18 Years | 12 (1.5%) | 779 (98.5%) |
| 19 to 25 Years | 13 (18.3%) | 58 (81.7%) |
| 25 to 34 Years | 0 (0.0%) | 193 (91.0%) |
| 35 to 44 Years | 38 (6.7%) | 504 (88.7%) |
| 45 to 54 Years | 9 (1.5%) | 573 (95.5%) |
| 55 to 64 Years | 58 (8.0%) | 632 (87.7%) |
| 65 to 74 Years | 314 (100.0%) | 203 (64.6%) |
| 75 Years and over | 618 (100.0%) | 367 (59.4%) |
| Total | 1,062 (26.1%) | 3,479 (85.6%) |
Disability Status by Sex by Age in Chagrin Falls
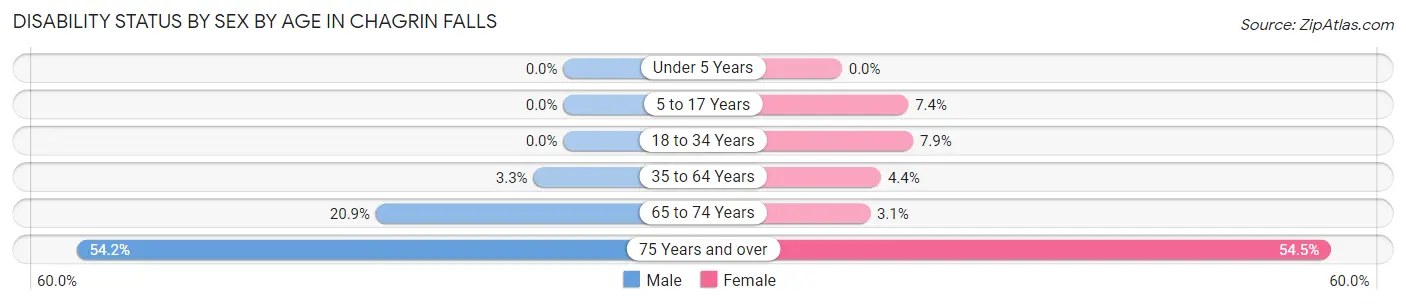
| Age Bracket | Male | Female |
| Under 5 Years | 0 (0.0%) | 0 (0.0%) |
| 5 to 17 Years | 0 (0.0%) | 29 (7.4%) |
| 18 to 34 Years | 0 (0.0%) | 13 (7.9%) |
| 35 to 64 Years | 27 (3.3%) | 47 (4.4%) |
| 65 to 74 Years | 19 (20.9%) | 7 (3.1%) |
| 75 Years and over | 142 (54.2%) | 194 (54.5%) |
Disability Class by Sex by Age in Chagrin Falls
Disability Class: Hearing Difficulty
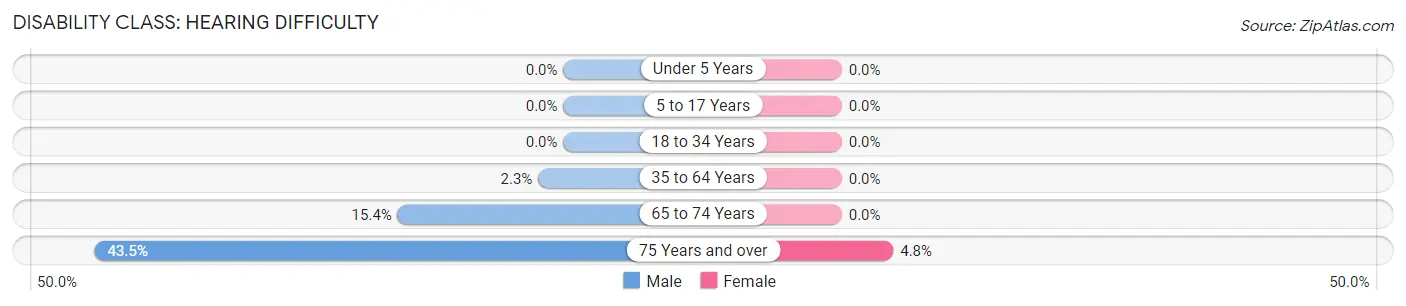
| Age Bracket | Male | Female |
| Under 5 Years | 0 (0.0%) | 0 (0.0%) |
| 5 to 17 Years | 0 (0.0%) | 0 (0.0%) |
| 18 to 34 Years | 0 (0.0%) | 0 (0.0%) |
| 35 to 64 Years | 19 (2.3%) | 0 (0.0%) |
| 65 to 74 Years | 14 (15.4%) | 0 (0.0%) |
| 75 Years and over | 114 (43.5%) | 17 (4.8%) |
Disability Class: Vision Difficulty
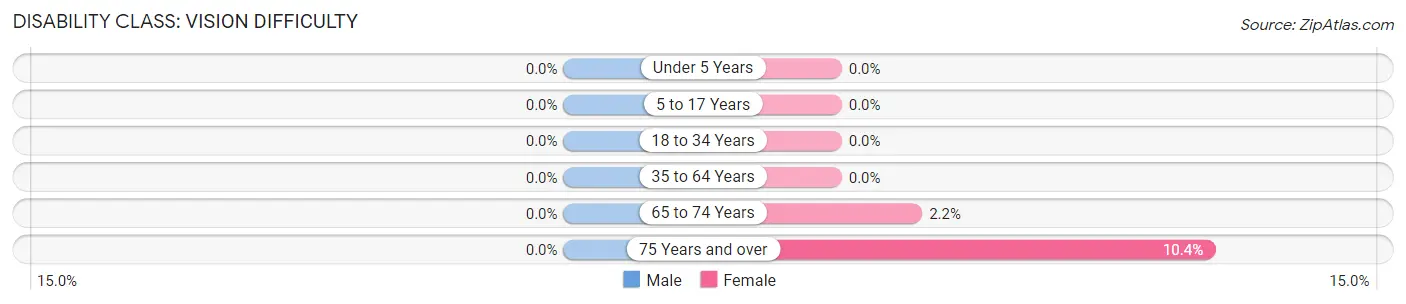
| Age Bracket | Male | Female |
| Under 5 Years | 0 (0.0%) | 0 (0.0%) |
| 5 to 17 Years | 0 (0.0%) | 0 (0.0%) |
| 18 to 34 Years | 0 (0.0%) | 0 (0.0%) |
| 35 to 64 Years | 0 (0.0%) | 0 (0.0%) |
| 65 to 74 Years | 0 (0.0%) | 5 (2.2%) |
| 75 Years and over | 0 (0.0%) | 37 (10.4%) |
Disability Class: Cognitive Difficulty
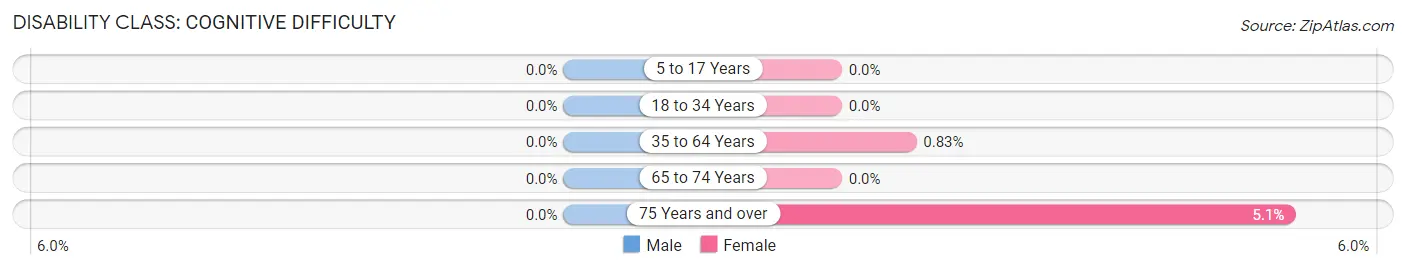
| Age Bracket | Male | Female |
| 5 to 17 Years | 0 (0.0%) | 0 (0.0%) |
| 18 to 34 Years | 0 (0.0%) | 0 (0.0%) |
| 35 to 64 Years | 0 (0.0%) | 9 (0.8%) |
| 65 to 74 Years | 0 (0.0%) | 0 (0.0%) |
| 75 Years and over | 0 (0.0%) | 18 (5.1%) |
Disability Class: Ambulatory Difficulty
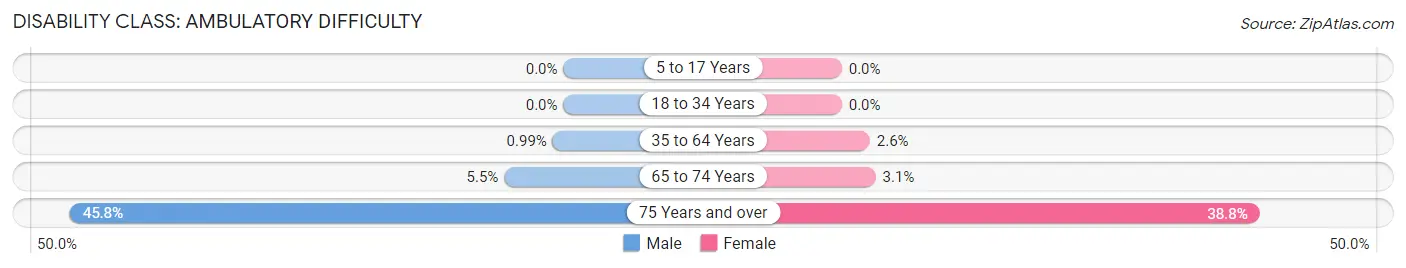
| Age Bracket | Male | Female |
| 5 to 17 Years | 0 (0.0%) | 0 (0.0%) |
| 18 to 34 Years | 0 (0.0%) | 0 (0.0%) |
| 35 to 64 Years | 8 (1.0%) | 28 (2.6%) |
| 65 to 74 Years | 5 (5.5%) | 7 (3.1%) |
| 75 Years and over | 120 (45.8%) | 138 (38.8%) |
Disability Class: Self-Care Difficulty
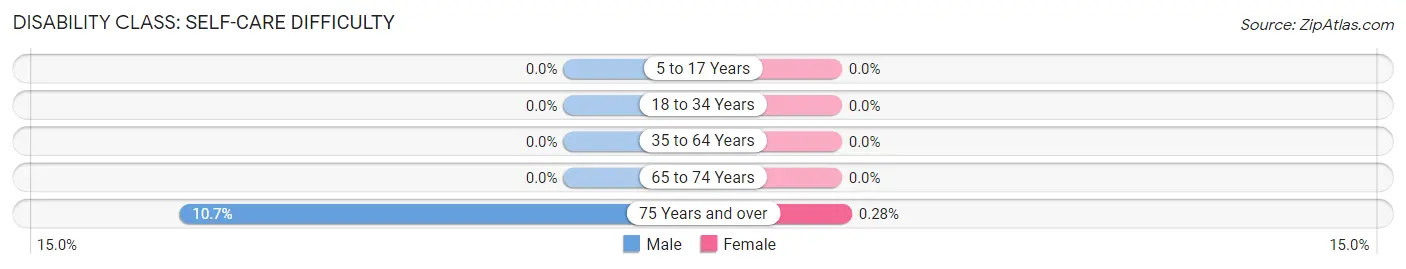
| Age Bracket | Male | Female |
| 5 to 17 Years | 0 (0.0%) | 0 (0.0%) |
| 18 to 34 Years | 0 (0.0%) | 0 (0.0%) |
| 35 to 64 Years | 0 (0.0%) | 0 (0.0%) |
| 65 to 74 Years | 0 (0.0%) | 0 (0.0%) |
| 75 Years and over | 28 (10.7%) | 1 (0.3%) |
Technology Access in Chagrin Falls
Computing Device Access in Chagrin Falls
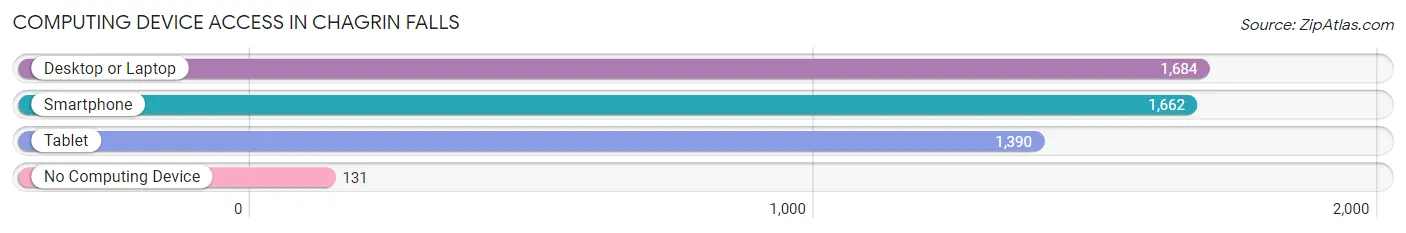
| Device Type | # Households | % Households |
| Desktop or Laptop | 1,684 | 88.8% |
| Smartphone | 1,662 | 87.6% |
| Tablet | 1,390 | 73.3% |
| No Computing Device | 131 | 6.9% |
| Total | 1,897 | 100.0% |
Internet Access in Chagrin Falls
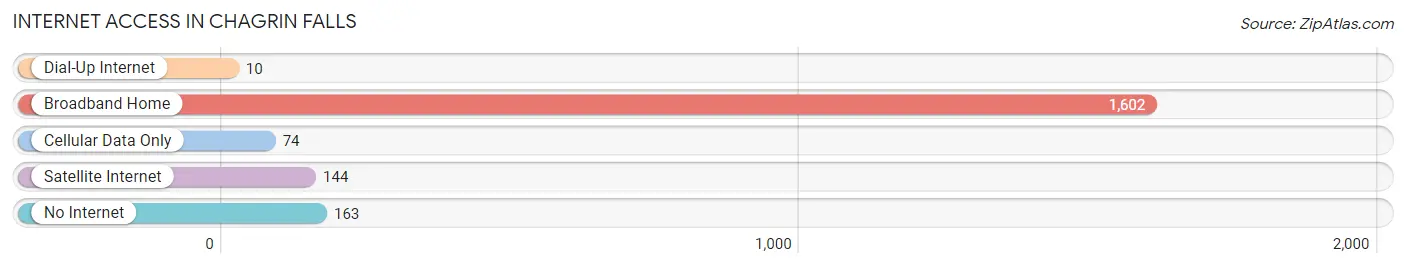
| Internet Type | # Households | % Households |
| Dial-Up Internet | 10 | 0.5% |
| Broadband Home | 1,602 | 84.5% |
| Cellular Data Only | 74 | 3.9% |
| Satellite Internet | 144 | 7.6% |
| No Internet | 163 | 8.6% |
| Total | 1,897 | 100.0% |
Chagrin Falls Summary
Chagrin Falls is a small village located in Cuyahoga County, Ohio. It is situated on the banks of the Chagrin River, approximately 30 miles east of Cleveland. The village is known for its picturesque waterfalls, quaint downtown, and historic architecture. The population of Chagrin Falls was 4,113 at the 2010 census.
History
The area that is now Chagrin Falls was originally inhabited by the Erie, Iroquois, and Wyandot Native American tribes. The first white settlers arrived in the area in the early 1800s. The village was founded in 1844 by two brothers, John and William Stearns, who named it after the nearby Chagrin River. The village was incorporated in 1845 and quickly became a popular destination for tourists and vacationers.
In the late 1800s, the village experienced a period of rapid growth and development. The Chagrin Falls Hydraulic Company was established in 1876, providing the village with its first source of electricity. The Chagrin Falls Paper Mill was built in 1882, and the Chagrin Falls Iron Works was established in 1883. The village also became a popular destination for wealthy Clevelanders, who built large summer homes in the area.
Geography
Chagrin Falls is located at 41°22'N 81°20'W (41.37, -81.33). The village is situated on the banks of the Chagrin River, approximately 30 miles east of Cleveland. The village is surrounded by the townships of Bainbridge, Chagrin, and Russell. The total area of the village is 2.2 square miles, all of which is land.
Economy
The economy of Chagrin Falls is largely based on tourism and retail. The village is home to several small businesses, including restaurants, boutiques, and art galleries. The Chagrin Falls Paper Mill is the largest employer in the village, providing jobs for over 200 people. The village also has a thriving arts and culture scene, with several annual festivals and events.
Demographics
As of the 2010 census, the population of Chagrin Falls was 4,113. The racial makeup of the village was 94.3% White, 1.7% African American, 0.3% Native American, 1.2% Asian, 0.1% Pacific Islander, 0.7% from other races, and 1.9% from two or more races. Hispanic or Latino of any race were 2.2% of the population.
The median income for a household in Chagrin Falls was $76,944, and the median income for a family was $90,917. The per capita income for the village was $41,945. About 3.2% of families and 4.3% of the population were below the poverty line, including 4.7% of those under age 18 and 4.2% of those age 65 or over.
Common Questions
What is Per Capita Income in Chagrin Falls?
Per Capita income in Chagrin Falls is $78,360.
What is the Median Family Income in Chagrin Falls?
Median Family Income in Chagrin Falls is $152,386.
What is the Median Household income in Chagrin Falls?
Median Household Income in Chagrin Falls is $99,821.
What is Income or Wage Gap in Chagrin Falls?
Income or Wage Gap in Chagrin Falls is 37.6%.
Women in Chagrin Falls earn 62.4 cents for every dollar earned by a man.
What is Inequality or Gini Index in Chagrin Falls?
Inequality or Gini Index in Chagrin Falls is 0.52.
What is the Total Population of Chagrin Falls?
Total Population of Chagrin Falls is 4,116.
What is the Total Male Population of Chagrin Falls?
Total Male Population of Chagrin Falls is 1,824.
What is the Total Female Population of Chagrin Falls?
Total Female Population of Chagrin Falls is 2,292.
What is the Ratio of Males per 100 Females in Chagrin Falls?
There are 79.58 Males per 100 Females in Chagrin Falls.
What is the Ratio of Females per 100 Males in Chagrin Falls?
There are 125.66 Females per 100 Males in Chagrin Falls.
What is the Median Population Age in Chagrin Falls?
Median Population Age in Chagrin Falls is 49.6 Years.
What is the Average Family Size in Chagrin Falls
Average Family Size in Chagrin Falls is 2.8 People.
What is the Average Household Size in Chagrin Falls
Average Household Size in Chagrin Falls is 2.1 People.
How Large is the Labor Force in Chagrin Falls?
There are 2,118 People in the Labor Forcein in Chagrin Falls.
What is the Percentage of People in the Labor Force in Chagrin Falls?
61.4% of People are in the Labor Force in Chagrin Falls.
What is the Unemployment Rate in Chagrin Falls?
Unemployment Rate in Chagrin Falls is 3.6%.