New Market, MD Map & Demographics
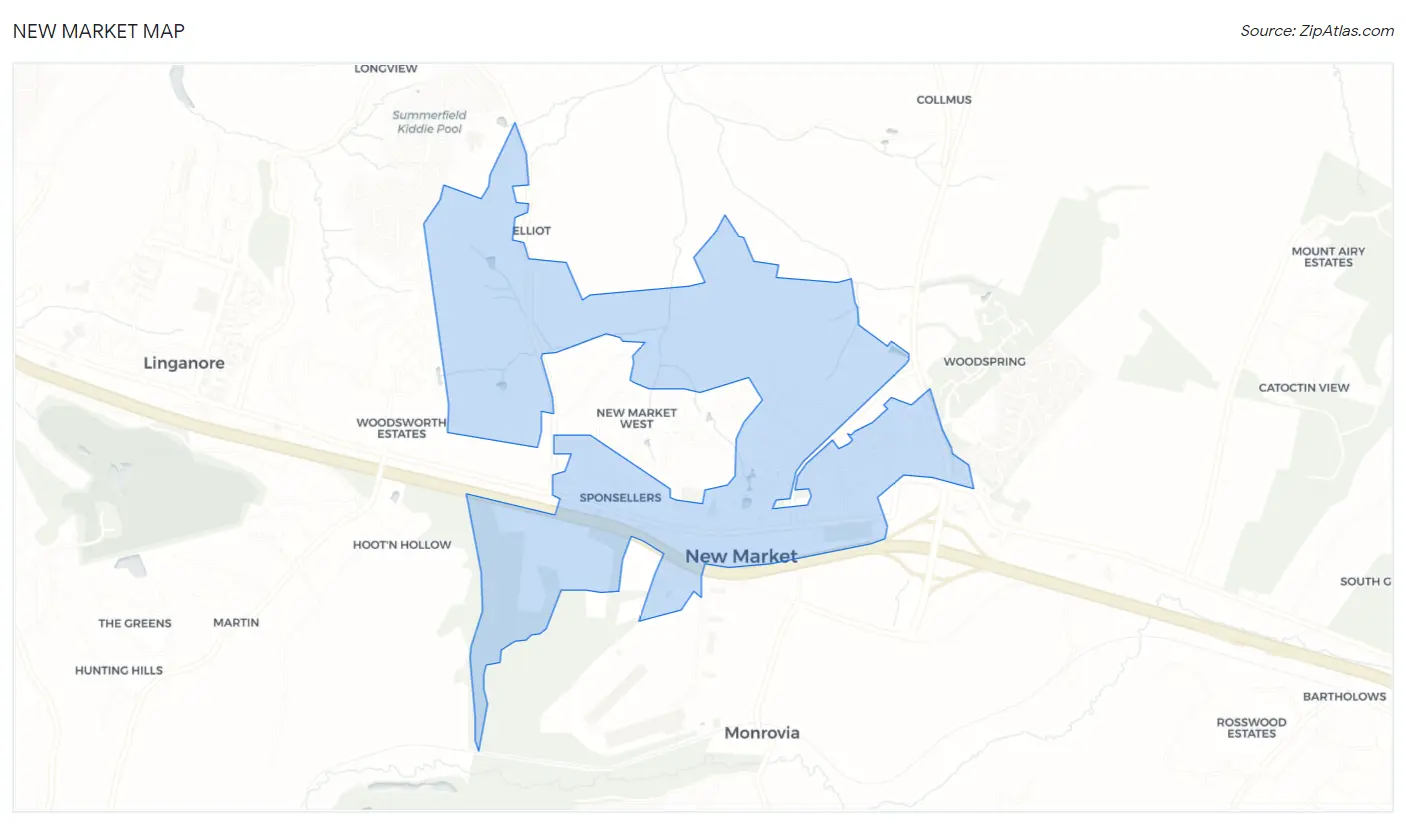
New Market Map
New Market Overview
$65,068
PER CAPITA INCOME
$193,009
AVG FAMILY INCOME
$190,750
AVG HOUSEHOLD INCOME
33.4%
WAGE / INCOME GAP [ % ]
66.6¢/ $1
WAGE / INCOME GAP [ $ ]
0.37
INEQUALITY / GINI INDEX
1,534
TOTAL POPULATION
745
MALE POPULATION
789
FEMALE POPULATION
94.42
MALES / 100 FEMALES
105.91
FEMALES / 100 MALES
35.5
MEDIAN AGE
3.5
AVG FAMILY SIZE
3.3
AVG HOUSEHOLD SIZE
827
LABOR FORCE [ PEOPLE ]
78.9%
PERCENT IN LABOR FORCE
3.5%
UNEMPLOYMENT RATE
New Market Zip Codes
New Market Area Codes
Income in New Market
Income Overview in New Market
Per Capita Income in New Market is $65,068, while median incomes of families and households are $193,009 and $190,750 respectively.
| Characteristic | Number | Measure |
| Per Capita Income | 1,534 | $65,068 |
| Median Family Income | 405 | $193,009 |
| Mean Family Income | 405 | $225,155 |
| Median Household Income | 468 | $190,750 |
| Mean Household Income | 468 | $211,227 |
| Income Deficit | 405 | $0 |
| Wage / Income Gap (%) | 1,534 | 33.43% |
| Wage / Income Gap ($) | 1,534 | 66.57¢ per $1 |
| Gini / Inequality Index | 1,534 | 0.37 |
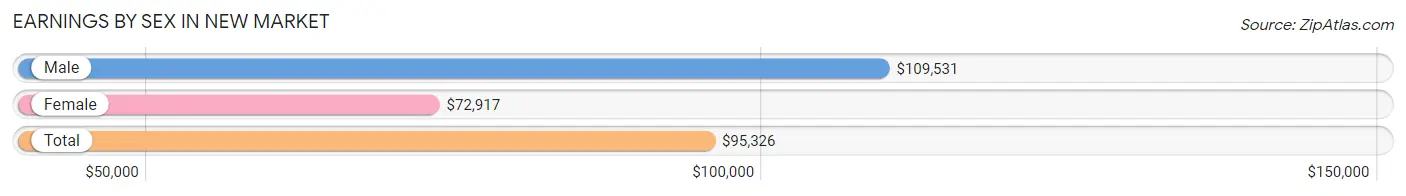
Earnings by Sex in New Market
Average Earnings in New Market are $95,326, $109,531 for men and $72,917 for women, a difference of 33.4%.
| Sex | Number | Average Earnings |
| Male | 483 (57.5%) | $109,531 |
| Female | 357 (42.5%) | $72,917 |
| Total | 840 (100.0%) | $95,326 |
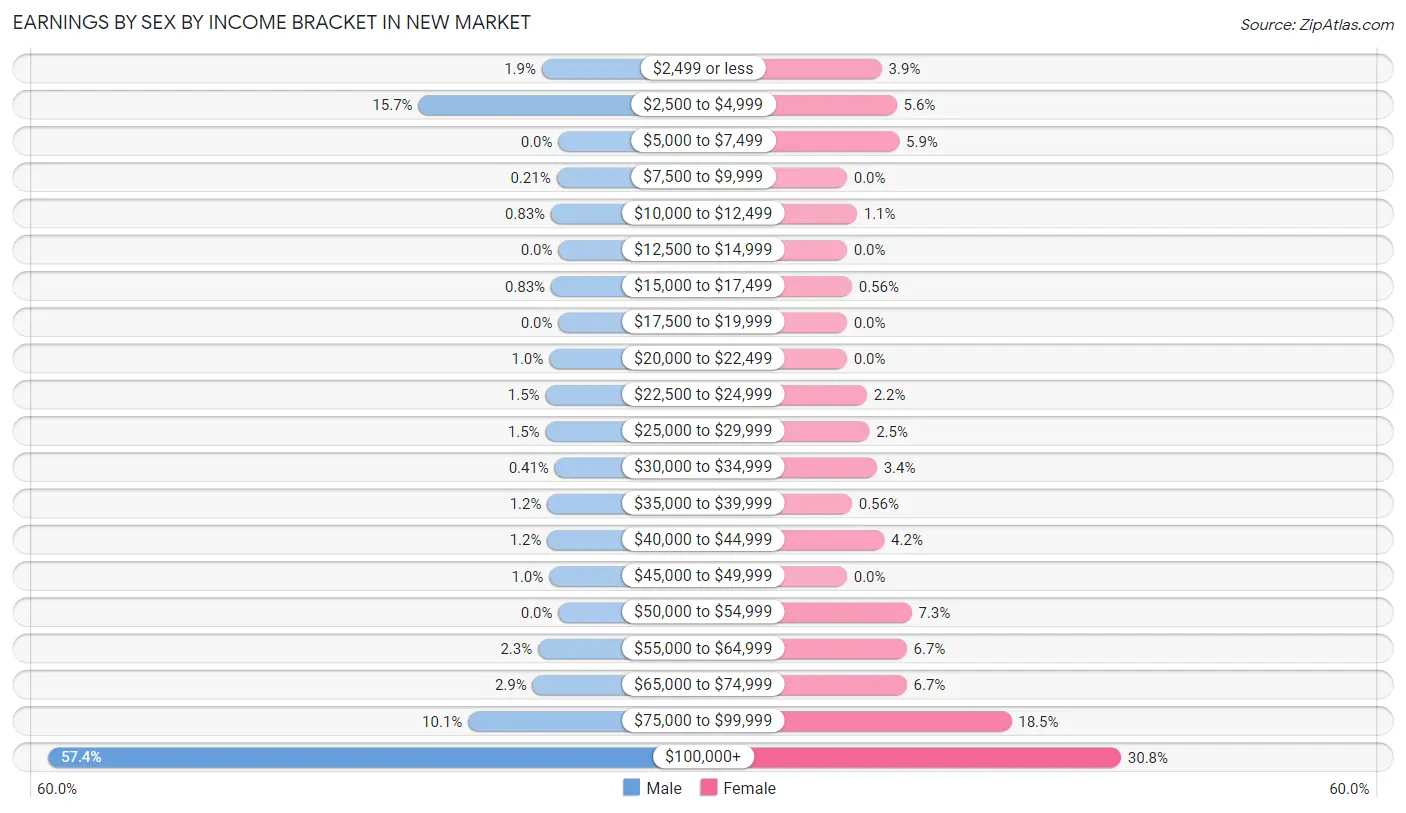
Earnings by Sex by Income Bracket in New Market
The most common earnings brackets in New Market are $100,000+ for men (277 | 57.4%) and $100,000+ for women (110 | 30.8%).
| Income | Male | Female |
| $2,499 or less | 9 (1.9%) | 14 (3.9%) |
| $2,500 to $4,999 | 76 (15.7%) | 20 (5.6%) |
| $5,000 to $7,499 | 0 (0.0%) | 21 (5.9%) |
| $7,500 to $9,999 | 1 (0.2%) | 0 (0.0%) |
| $10,000 to $12,499 | 4 (0.8%) | 4 (1.1%) |
| $12,500 to $14,999 | 0 (0.0%) | 0 (0.0%) |
| $15,000 to $17,499 | 4 (0.8%) | 2 (0.6%) |
| $17,500 to $19,999 | 0 (0.0%) | 0 (0.0%) |
| $20,000 to $22,499 | 5 (1.0%) | 0 (0.0%) |
| $22,500 to $24,999 | 7 (1.5%) | 8 (2.2%) |
| $25,000 to $29,999 | 7 (1.5%) | 9 (2.5%) |
| $30,000 to $34,999 | 2 (0.4%) | 12 (3.4%) |
| $35,000 to $39,999 | 6 (1.2%) | 2 (0.6%) |
| $40,000 to $44,999 | 6 (1.2%) | 15 (4.2%) |
| $45,000 to $49,999 | 5 (1.0%) | 0 (0.0%) |
| $50,000 to $54,999 | 0 (0.0%) | 26 (7.3%) |
| $55,000 to $64,999 | 11 (2.3%) | 24 (6.7%) |
| $65,000 to $74,999 | 14 (2.9%) | 24 (6.7%) |
| $75,000 to $99,999 | 49 (10.1%) | 66 (18.5%) |
| $100,000+ | 277 (57.4%) | 110 (30.8%) |
| Total | 483 (100.0%) | 357 (100.0%) |
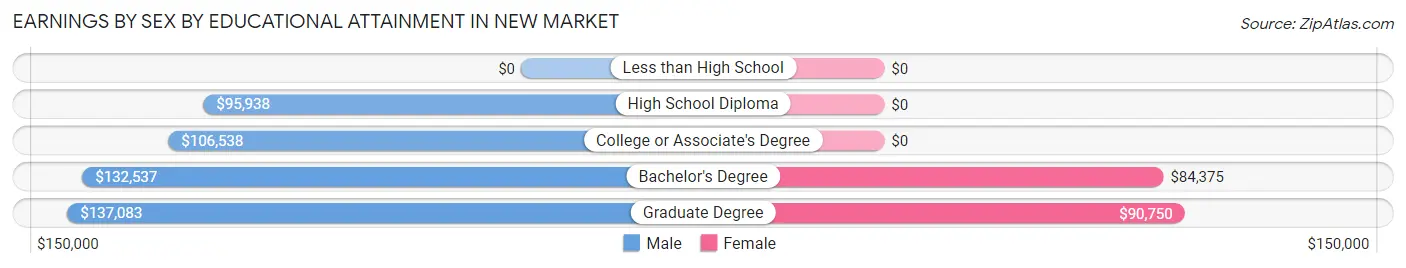
Earnings by Sex by Educational Attainment in New Market
Average earnings in New Market are $124,688 for men and $79,125 for women, a difference of 36.5%. Men with an educational attainment of graduate degree enjoy the highest average annual earnings of $137,083, while those with high school diploma education earn the least with $95,938. Women with an educational attainment of graduate degree earn the most with the average annual earnings of $90,750, while those with bachelor's degree education have the smallest earnings of $84,375.
| Educational Attainment | Male Income | Female Income |
| Less than High School | - | - |
| High School Diploma | $95,938 | $0 |
| College or Associate's Degree | $106,538 | $0 |
| Bachelor's Degree | $132,537 | $84,375 |
| Graduate Degree | $137,083 | $90,750 |
| Total | $124,688 | $79,125 |
Family Income in New Market
Family Income Brackets in New Market
According to the New Market family income data, there are 175 families falling into the $200,000+ income range, which is the most common income bracket and makes up 43.2% of all families.
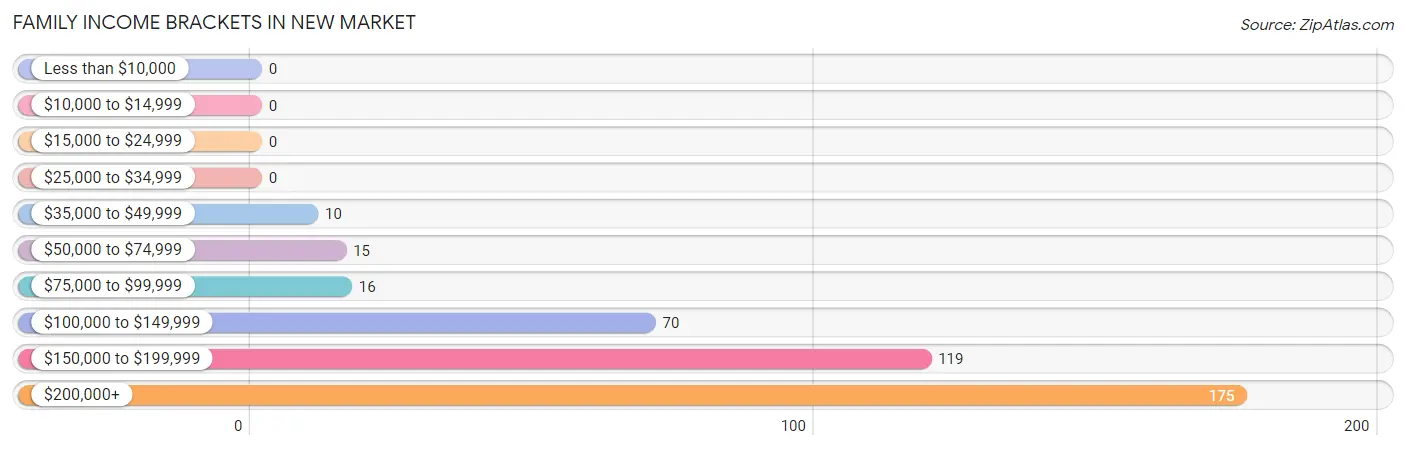
| Income Bracket | # Families | % Families |
| Less than $10,000 | 0 | 0.0% |
| $10,000 to $14,999 | 0 | 0.0% |
| $15,000 to $24,999 | 0 | 0.0% |
| $25,000 to $34,999 | 0 | 0.0% |
| $35,000 to $49,999 | 10 | 2.5% |
| $50,000 to $74,999 | 15 | 3.7% |
| $75,000 to $99,999 | 16 | 4.0% |
| $100,000 to $149,999 | 70 | 17.3% |
| $150,000 to $199,999 | 119 | 29.4% |
| $200,000+ | 175 | 43.2% |
Family Income by Famaliy Size in New Market
4-person families (108 | 26.7%) account for the highest median family income in New Market with $243,125 per family, while 2-person families (125 | 30.9%) have the highest median income of $84,688 per family member.
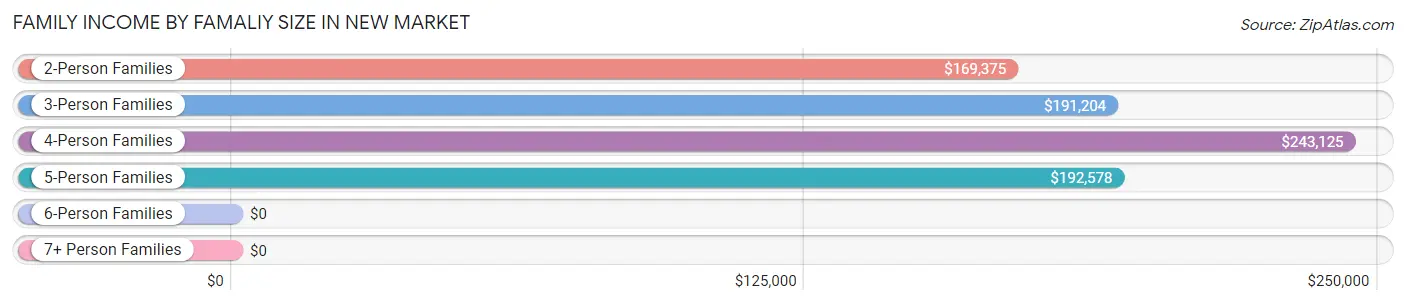
| Income Bracket | # Families | Median Income |
| 2-Person Families | 125 (30.9%) | $169,375 |
| 3-Person Families | 78 (19.3%) | $191,204 |
| 4-Person Families | 108 (26.7%) | $243,125 |
| 5-Person Families | 75 (18.5%) | $192,578 |
| 6-Person Families | 11 (2.7%) | $0 |
| 7+ Person Families | 8 (2.0%) | $0 |
| Total | 405 (100.0%) | $193,009 |
Family Income by Number of Earners in New Market
The median family income in New Market is $193,009, with families comprising 2 earners (243) having the highest median family income of $210,972, while families with no earners (20) have the lowest median family income of $71,071, accounting for 60.0% and 4.9% of families, respectively.
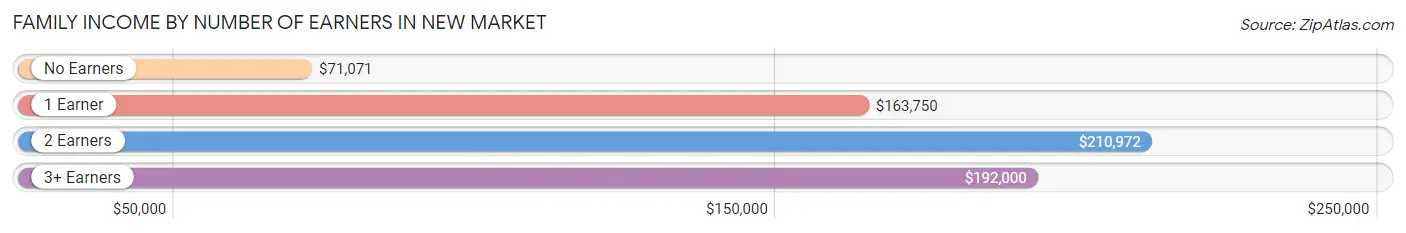
| Number of Earners | # Families | Median Income |
| No Earners | 20 (4.9%) | $71,071 |
| 1 Earner | 86 (21.2%) | $163,750 |
| 2 Earners | 243 (60.0%) | $210,972 |
| 3+ Earners | 56 (13.8%) | $192,000 |
| Total | 405 (100.0%) | $193,009 |
Household Income in New Market
Household Income Brackets in New Market
With 180 households falling in the category, the $200,000+ income range is the most frequent in New Market, accounting for 38.5% of all households.
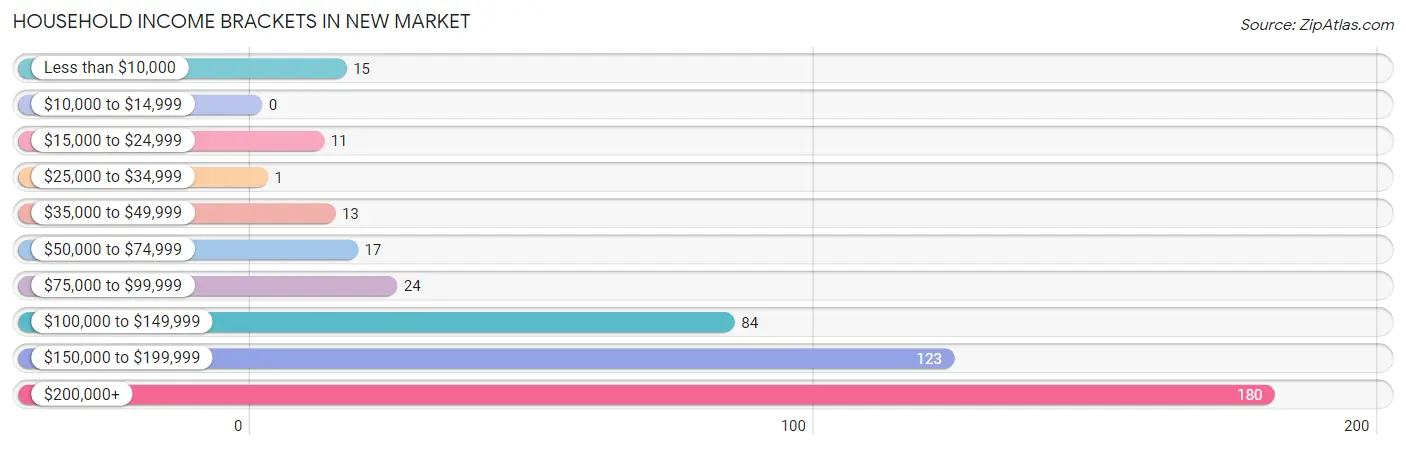
| Income Bracket | # Households | % Households |
| Less than $10,000 | 15 | 3.2% |
| $10,000 to $14,999 | 0 | 0.0% |
| $15,000 to $24,999 | 11 | 2.4% |
| $25,000 to $34,999 | 1 | 0.2% |
| $35,000 to $49,999 | 13 | 2.8% |
| $50,000 to $74,999 | 17 | 3.6% |
| $75,000 to $99,999 | 24 | 5.1% |
| $100,000 to $149,999 | 84 | 17.9% |
| $150,000 to $199,999 | 123 | 26.3% |
| $200,000+ | 180 | 38.5% |
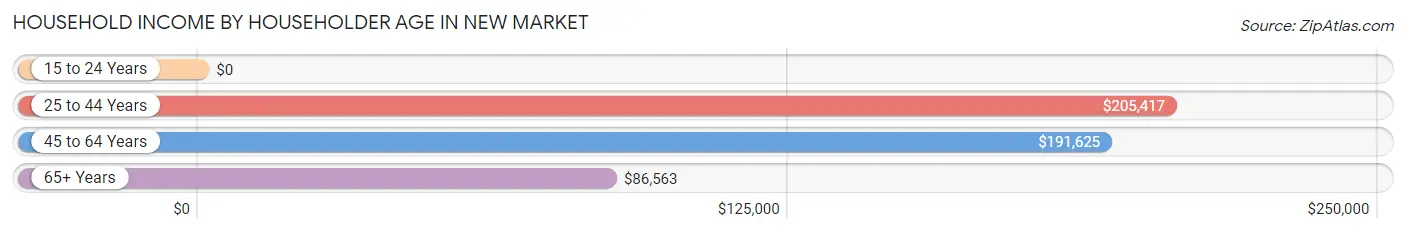
Household Income by Householder Age in New Market
The median household income in New Market is $190,750, with the highest median household income of $205,417 found in the 25 to 44 years age bracket for the primary householder. A total of 180 households (38.5%) fall into this category.
| Income Bracket | # Households | Median Income |
| 15 to 24 Years | 0 (0.0%) | $0 |
| 25 to 44 Years | 180 (38.5%) | $205,417 |
| 45 to 64 Years | 225 (48.1%) | $191,625 |
| 65+ Years | 63 (13.5%) | $86,563 |
| Total | 468 (100.0%) | $190,750 |
Poverty in New Market
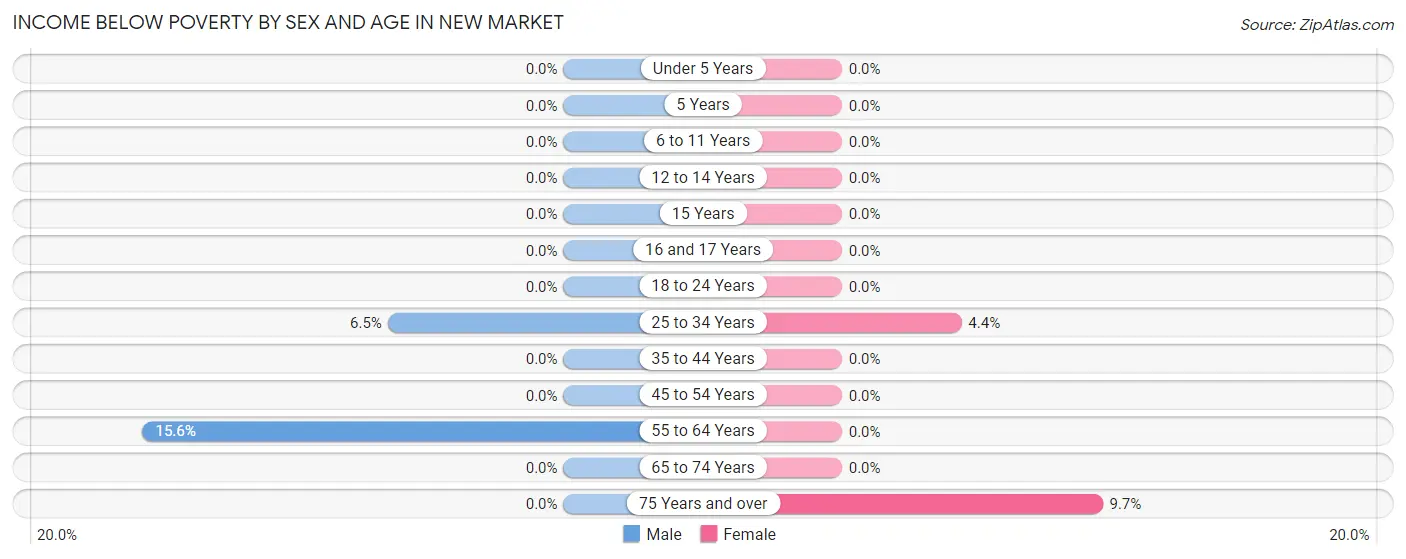
Income Below Poverty by Sex and Age in New Market
With 1.8% poverty level for males and 0.6% for females among the residents of New Market, 55 to 64 year old males and 75 year old and over females are the most vulnerable to poverty, with 10 males (15.6%) and 3 females (9.7%) in their respective age groups living below the poverty level.
| Age Bracket | Male | Female |
| Under 5 Years | 0 (0.0%) | 0 (0.0%) |
| 5 Years | 0 (0.0%) | 0 (0.0%) |
| 6 to 11 Years | 0 (0.0%) | 0 (0.0%) |
| 12 to 14 Years | 0 (0.0%) | 0 (0.0%) |
| 15 Years | 0 (0.0%) | 0 (0.0%) |
| 16 and 17 Years | 0 (0.0%) | 0 (0.0%) |
| 18 to 24 Years | 0 (0.0%) | 0 (0.0%) |
| 25 to 34 Years | 3 (6.5%) | 2 (4.4%) |
| 35 to 44 Years | 0 (0.0%) | 0 (0.0%) |
| 45 to 54 Years | 0 (0.0%) | 0 (0.0%) |
| 55 to 64 Years | 10 (15.6%) | 0 (0.0%) |
| 65 to 74 Years | 0 (0.0%) | 0 (0.0%) |
| 75 Years and over | 0 (0.0%) | 3 (9.7%) |
| Total | 13 (1.8%) | 5 (0.6%) |
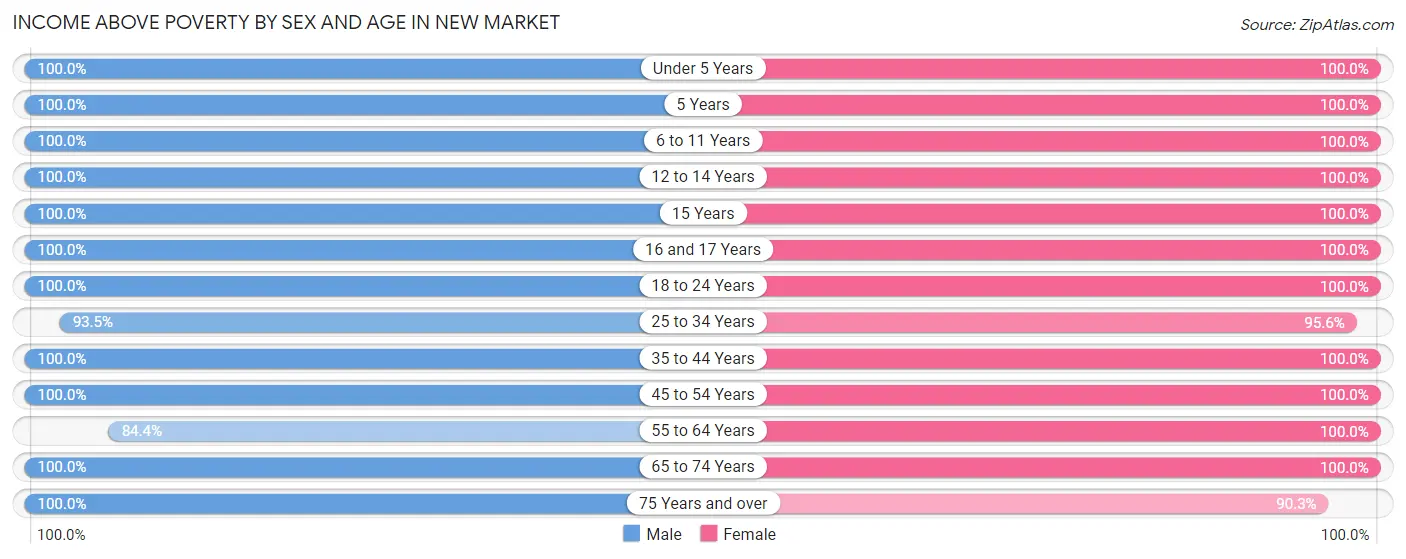
Income Above Poverty by Sex and Age in New Market
According to the poverty statistics in New Market, males aged under 5 years and females aged under 5 years are the age groups that are most secure financially, with 100.0% of males and 100.0% of females in these age groups living above the poverty line.
| Age Bracket | Male | Female |
| Under 5 Years | 13 (100.0%) | 49 (100.0%) |
| 5 Years | 11 (100.0%) | 28 (100.0%) |
| 6 to 11 Years | 106 (100.0%) | 137 (100.0%) |
| 12 to 14 Years | 31 (100.0%) | 52 (100.0%) |
| 15 Years | 25 (100.0%) | 29 (100.0%) |
| 16 and 17 Years | 22 (100.0%) | 13 (100.0%) |
| 18 to 24 Years | 102 (100.0%) | 40 (100.0%) |
| 25 to 34 Years | 43 (93.5%) | 43 (95.6%) |
| 35 to 44 Years | 131 (100.0%) | 145 (100.0%) |
| 45 to 54 Years | 150 (100.0%) | 137 (100.0%) |
| 55 to 64 Years | 54 (84.4%) | 45 (100.0%) |
| 65 to 74 Years | 31 (100.0%) | 36 (100.0%) |
| 75 Years and over | 10 (100.0%) | 28 (90.3%) |
| Total | 729 (98.3%) | 782 (99.4%) |
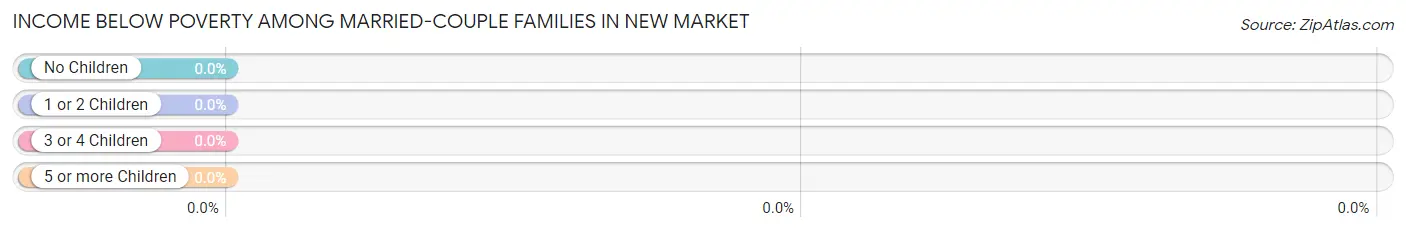
Income Below Poverty Among Married-Couple Families in New Market
| Children | Above Poverty | Below Poverty |
| No Children | 157 (100.0%) | 0 (0.0%) |
| 1 or 2 Children | 139 (100.0%) | 0 (0.0%) |
| 3 or 4 Children | 64 (100.0%) | 0 (0.0%) |
| 5 or more Children | 8 (100.0%) | 0 (0.0%) |
| Total | 368 (100.0%) | 0 (0.0%) |
Income Below Poverty Among Single-Parent Households in New Market
| Children | Single Father | Single Mother |
| No Children | 0 (0.0%) | 0 (0.0%) |
| 1 or 2 Children | 0 (0.0%) | 0 (0.0%) |
| 3 or 4 Children | 0 (0.0%) | 0 (0.0%) |
| 5 or more Children | 0 (0.0%) | 0 (0.0%) |
| Total | 0 (0.0%) | 0 (0.0%) |
Income Below Poverty Among Married-Couple vs Single-Parent Households in New Market
| Children | Married-Couple Families | Single-Parent Households |
| No Children | 0 (0.0%) | 0 (0.0%) |
| 1 or 2 Children | 0 (0.0%) | 0 (0.0%) |
| 3 or 4 Children | 0 (0.0%) | 0 (0.0%) |
| 5 or more Children | 0 (0.0%) | 0 (0.0%) |
| Total | 0 (0.0%) | 0 (0.0%) |
Race in New Market
The most populous races in New Market are White / Caucasian (1,259 | 82.1%), Two or more Races (157 | 10.2%), and Hispanic or Latino (82 | 5.3%).
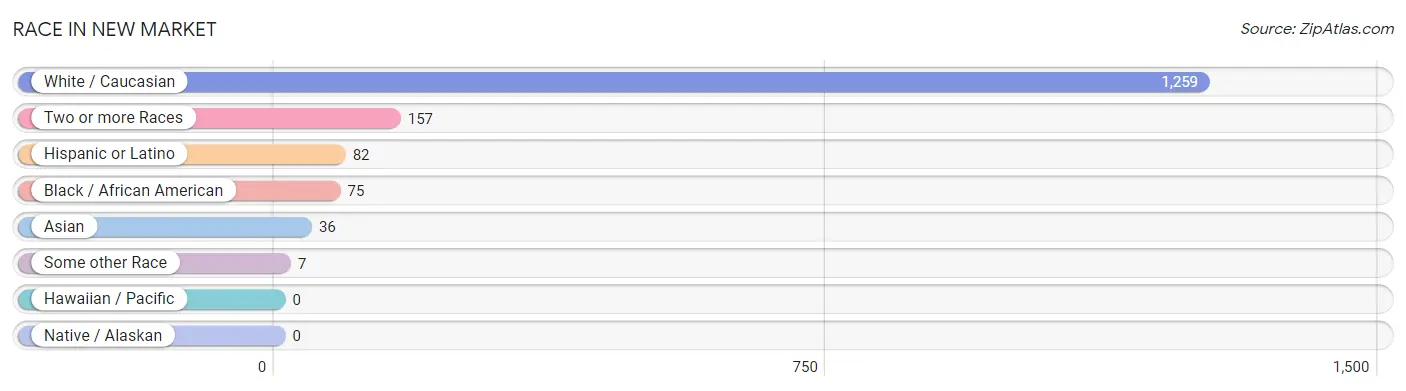
| Race | # Population | % Population |
| Asian | 36 | 2.4% |
| Black / African American | 75 | 4.9% |
| Hawaiian / Pacific | 0 | 0.0% |
| Hispanic or Latino | 82 | 5.3% |
| Native / Alaskan | 0 | 0.0% |
| White / Caucasian | 1,259 | 82.1% |
| Two or more Races | 157 | 10.2% |
| Some other Race | 7 | 0.5% |
| Total | 1,534 | 100.0% |
Ancestry in New Market
The most populous ancestries reported in New Market are Irish (351 | 22.9%), German (350 | 22.8%), Italian (298 | 19.4%), English (171 | 11.2%), and Norwegian (98 | 6.4%), together accounting for 82.7% of all New Market residents.
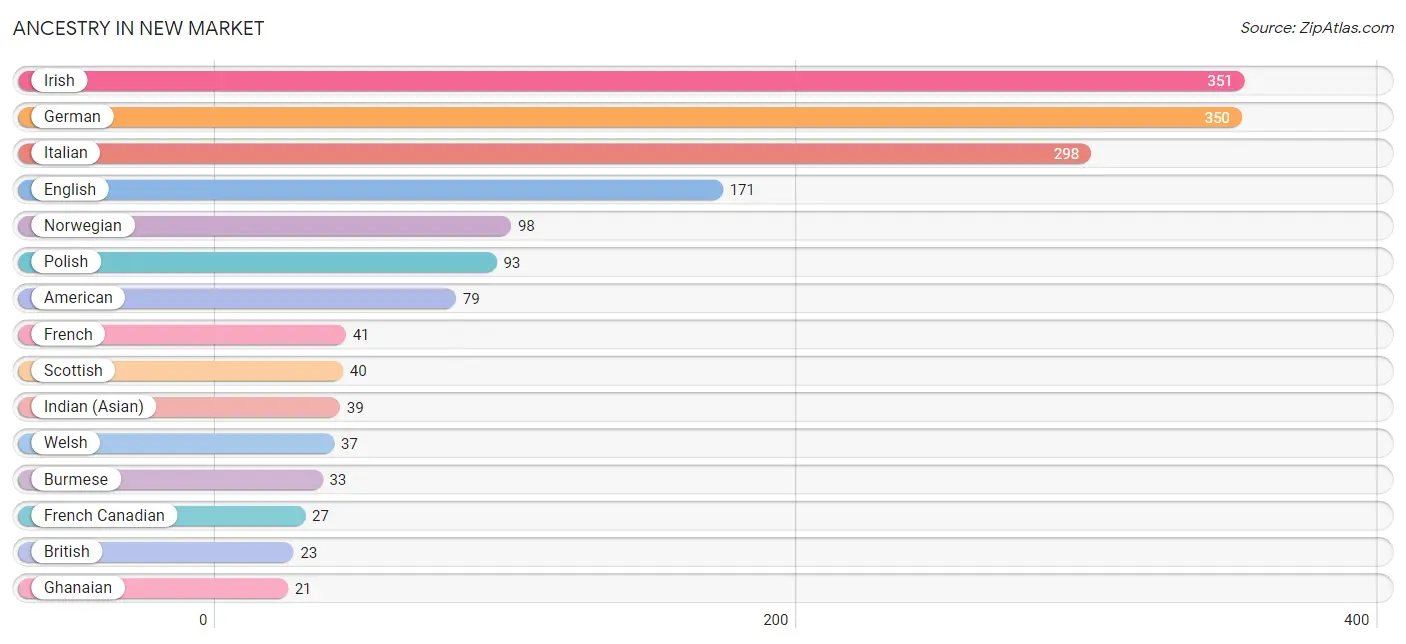
| Ancestry | # Population | % Population |
| American | 79 | 5.1% |
| Arab | 9 | 0.6% |
| Austrian | 3 | 0.2% |
| British | 23 | 1.5% |
| Burmese | 33 | 2.1% |
| Central American | 20 | 1.3% |
| Cherokee | 4 | 0.3% |
| Chilean | 3 | 0.2% |
| Choctaw | 6 | 0.4% |
| Cuban | 2 | 0.1% |
| Czech | 4 | 0.3% |
| Czechoslovakian | 2 | 0.1% |
| Dutch | 20 | 1.3% |
| Egyptian | 9 | 0.6% |
| English | 171 | 11.2% |
| European | 20 | 1.3% |
| Filipino | 15 | 1.0% |
| French | 41 | 2.7% |
| French Canadian | 27 | 1.8% |
| German | 350 | 22.8% |
| Ghanaian | 21 | 1.4% |
| Greek | 3 | 0.2% |
| Honduran | 13 | 0.9% |
| Hungarian | 3 | 0.2% |
| Indian (Asian) | 39 | 2.5% |
| Irish | 351 | 22.9% |
| Italian | 298 | 19.4% |
| Japanese | 11 | 0.7% |
| Korean | 4 | 0.3% |
| Lithuanian | 4 | 0.3% |
| Maltese | 2 | 0.1% |
| Mexican | 20 | 1.3% |
| Norwegian | 98 | 6.4% |
| Peruvian | 4 | 0.3% |
| Polish | 93 | 6.1% |
| Portuguese | 4 | 0.3% |
| Puerto Rican | 9 | 0.6% |
| Russian | 16 | 1.0% |
| Salvadoran | 7 | 0.5% |
| Scandinavian | 3 | 0.2% |
| Scotch-Irish | 10 | 0.6% |
| Scottish | 40 | 2.6% |
| Slovak | 4 | 0.3% |
| South American | 7 | 0.5% |
| Spaniard | 20 | 1.3% |
| Subsaharan African | 21 | 1.4% |
| Swedish | 15 | 1.0% |
| Ukrainian | 4 | 0.3% |
| Welsh | 37 | 2.4% | View All 49 Rows |
Immigrants in New Market
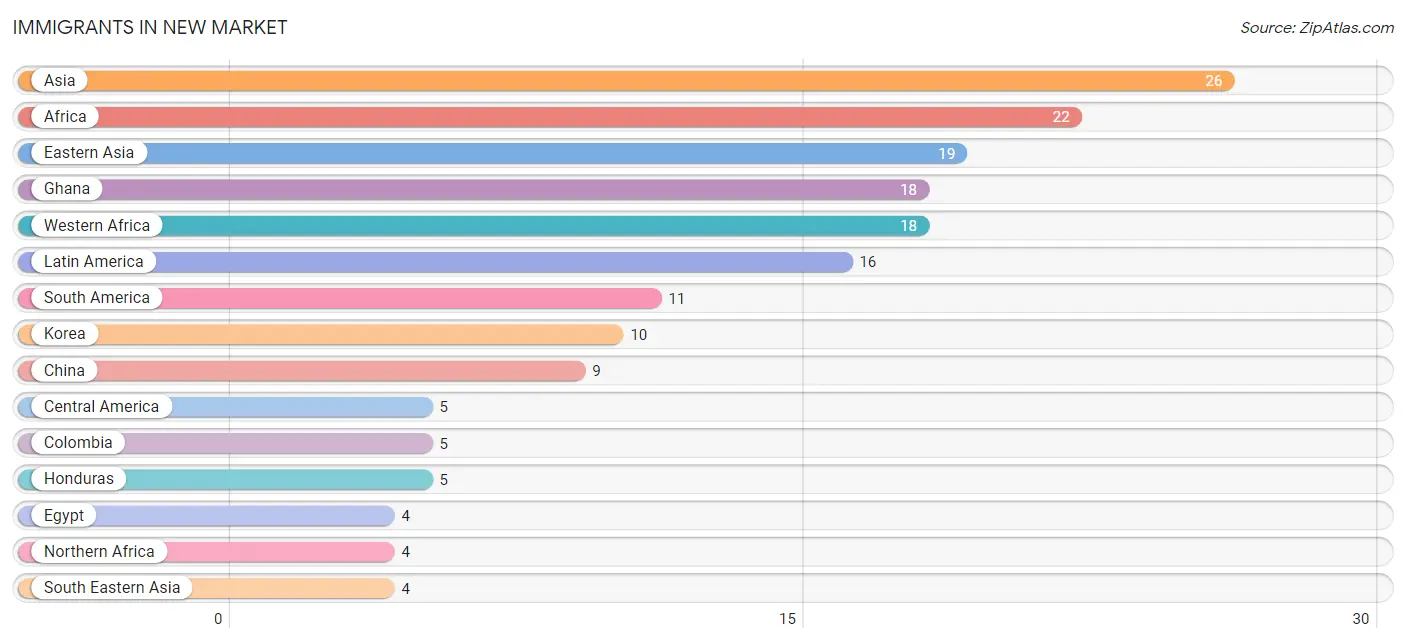
The most numerous immigrant groups reported in New Market came from Asia (26 | 1.7%), Africa (22 | 1.4%), Eastern Asia (19 | 1.2%), Ghana (18 | 1.2%), and Western Africa (18 | 1.2%), together accounting for 6.7% of all New Market residents.
| Immigration Origin | # Population | % Population |
| Africa | 22 | 1.4% |
| Asia | 26 | 1.7% |
| Central America | 5 | 0.3% |
| Chile | 3 | 0.2% |
| China | 9 | 0.6% |
| Colombia | 5 | 0.3% |
| Eastern Asia | 19 | 1.2% |
| Egypt | 4 | 0.3% |
| Europe | 3 | 0.2% |
| Ghana | 18 | 1.2% |
| Honduras | 5 | 0.3% |
| Korea | 10 | 0.6% |
| Latin America | 16 | 1.0% |
| Lebanon | 3 | 0.2% |
| Northern Africa | 4 | 0.3% |
| Northern Europe | 3 | 0.2% |
| Peru | 3 | 0.2% |
| South America | 11 | 0.7% |
| South Eastern Asia | 4 | 0.3% |
| Thailand | 4 | 0.3% |
| Western Africa | 18 | 1.2% |
| Western Asia | 3 | 0.2% | View All 22 Rows |
Sex and Age in New Market
Sex and Age in New Market
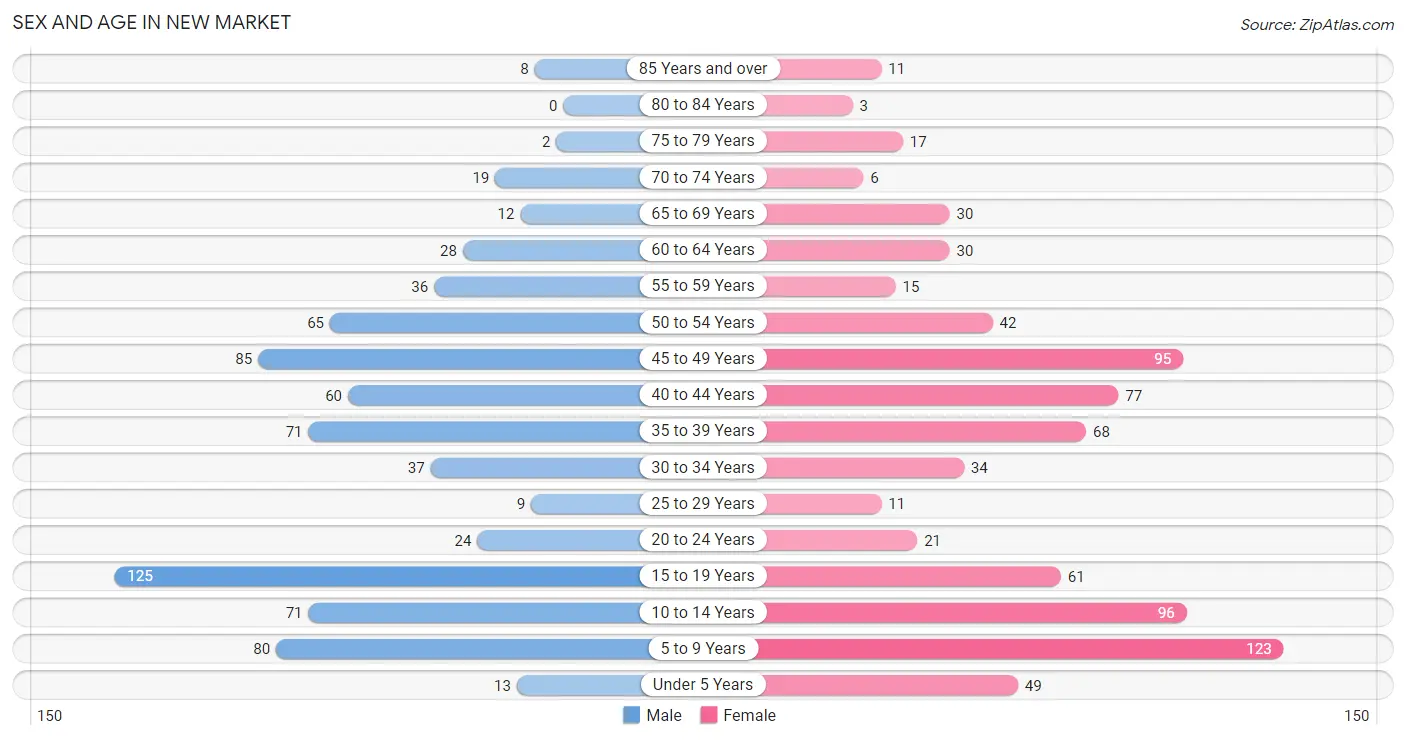
The most populous age groups in New Market are 15 to 19 Years (125 | 16.8%) for men and 5 to 9 Years (123 | 15.6%) for women.
| Age Bracket | Male | Female |
| Under 5 Years | 13 (1.7%) | 49 (6.2%) |
| 5 to 9 Years | 80 (10.7%) | 123 (15.6%) |
| 10 to 14 Years | 71 (9.5%) | 96 (12.2%) |
| 15 to 19 Years | 125 (16.8%) | 61 (7.7%) |
| 20 to 24 Years | 24 (3.2%) | 21 (2.7%) |
| 25 to 29 Years | 9 (1.2%) | 11 (1.4%) |
| 30 to 34 Years | 37 (5.0%) | 34 (4.3%) |
| 35 to 39 Years | 71 (9.5%) | 68 (8.6%) |
| 40 to 44 Years | 60 (8.1%) | 77 (9.8%) |
| 45 to 49 Years | 85 (11.4%) | 95 (12.0%) |
| 50 to 54 Years | 65 (8.7%) | 42 (5.3%) |
| 55 to 59 Years | 36 (4.8%) | 15 (1.9%) |
| 60 to 64 Years | 28 (3.8%) | 30 (3.8%) |
| 65 to 69 Years | 12 (1.6%) | 30 (3.8%) |
| 70 to 74 Years | 19 (2.5%) | 6 (0.8%) |
| 75 to 79 Years | 2 (0.3%) | 17 (2.1%) |
| 80 to 84 Years | 0 (0.0%) | 3 (0.4%) |
| 85 Years and over | 8 (1.1%) | 11 (1.4%) |
| Total | 745 (100.0%) | 789 (100.0%) |
Families and Households in New Market
Median Family Size in New Market
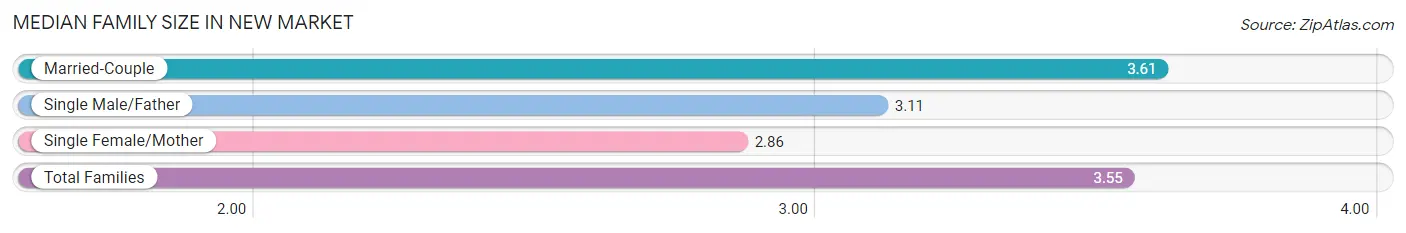
The median family size in New Market is 3.55 persons per family, with married-couple families (368 | 90.9%) accounting for the largest median family size of 3.61 persons per family. On the other hand, single female/mother families (28 | 6.9%) represent the smallest median family size with 2.86 persons per family.
| Family Type | # Families | Family Size |
| Married-Couple | 368 (90.9%) | 3.61 |
| Single Male/Father | 9 (2.2%) | 3.11 |
| Single Female/Mother | 28 (6.9%) | 2.86 |
| Total Families | 405 (100.0%) | 3.55 |
Median Household Size in New Market
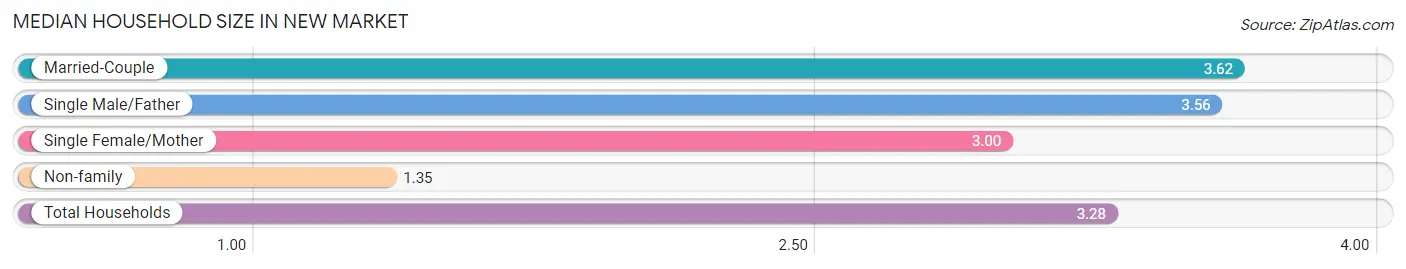
The median household size in New Market is 3.28 persons per household, with married-couple households (368 | 78.6%) accounting for the largest median household size of 3.62 persons per household. non-family households (63 | 13.5%) represent the smallest median household size with 1.35 persons per household.
| Household Type | # Households | Household Size |
| Married-Couple | 368 (78.6%) | 3.62 |
| Single Male/Father | 9 (1.9%) | 3.56 |
| Single Female/Mother | 28 (6.0%) | 3.00 |
| Non-family | 63 (13.5%) | 1.35 |
| Total Households | 468 (100.0%) | 3.28 |
Household Size by Marriage Status in New Market
Out of a total of 468 households in New Market, 405 (86.5%) are family households, while 63 (13.5%) are nonfamily households. The most numerous type of family households are 2-person households, comprising 125, and the most common type of nonfamily households are 1-person households, comprising 40.
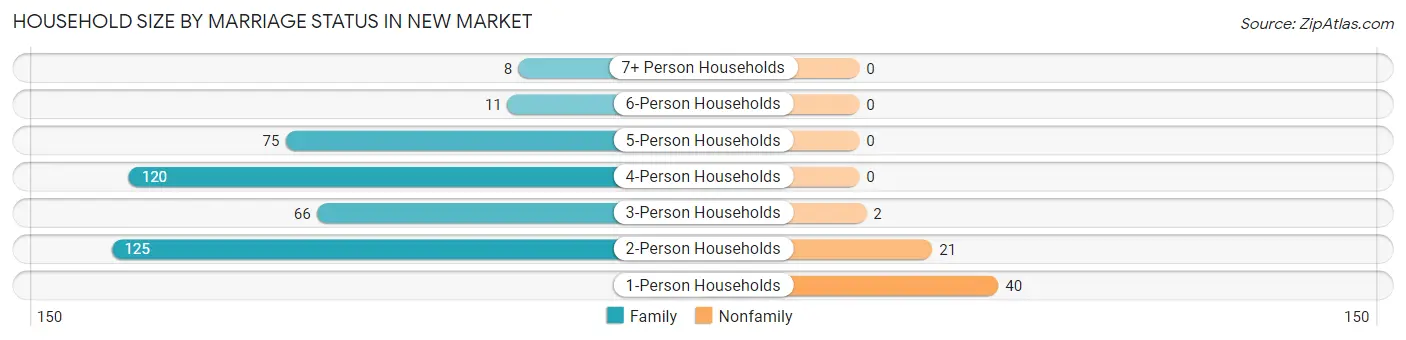
| Household Size | Family Households | Nonfamily Households |
| 1-Person Households | - | 40 (8.6%) |
| 2-Person Households | 125 (26.7%) | 21 (4.5%) |
| 3-Person Households | 66 (14.1%) | 2 (0.4%) |
| 4-Person Households | 120 (25.6%) | 0 (0.0%) |
| 5-Person Households | 75 (16.0%) | 0 (0.0%) |
| 6-Person Households | 11 (2.4%) | 0 (0.0%) |
| 7+ Person Households | 8 (1.7%) | 0 (0.0%) |
| Total | 405 (86.5%) | 63 (13.5%) |
Female Fertility in New Market
Fertility by Age in New Market
Average fertility rate in New Market is 40.0 births per 1,000 women. Women in the age bracket of 35 to 50 years have the highest fertility rate with 49.0 births per 1,000 women. Women in the age bracket of 35 to 50 years acount for 80.0% of all women with births.
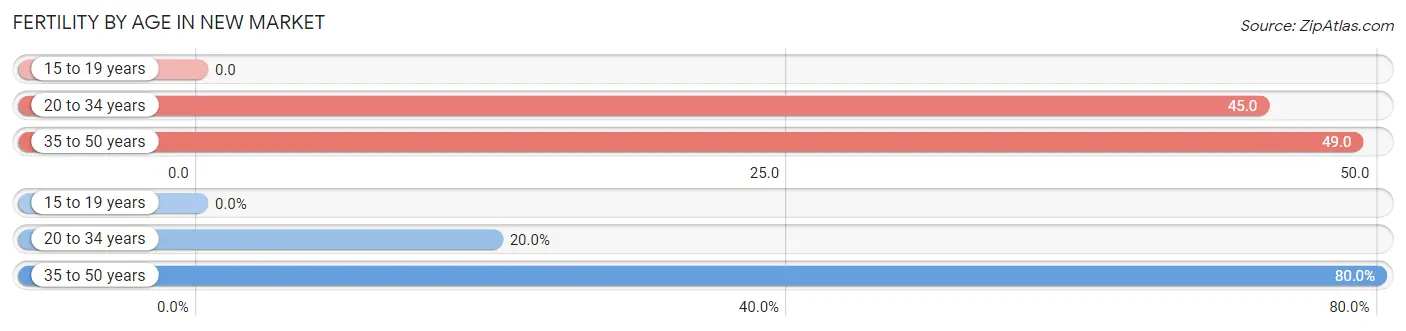
| Age Bracket | Women with Births | Births / 1,000 Women |
| 15 to 19 years | 0 (0.0%) | 0.0 |
| 20 to 34 years | 3 (20.0%) | 45.0 |
| 35 to 50 years | 12 (80.0%) | 49.0 |
| Total | 15 (100.0%) | 40.0 |
Fertility by Age by Marriage Status in New Market
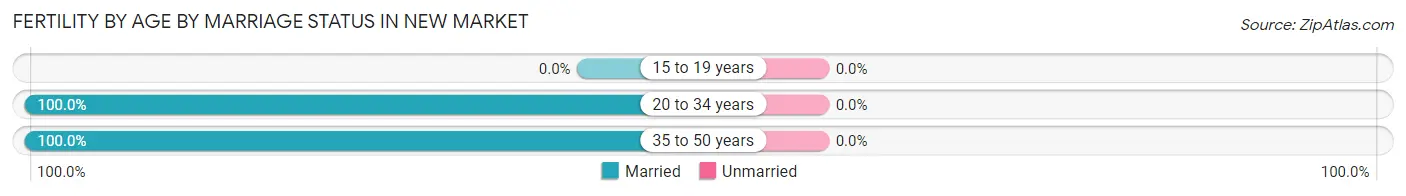
| Age Bracket | Married | Unmarried |
| 15 to 19 years | 0 (0.0%) | 0 (0.0%) |
| 20 to 34 years | 3 (100.0%) | 0 (0.0%) |
| 35 to 50 years | 12 (100.0%) | 0 (0.0%) |
| Total | 15 (100.0%) | 0 (0.0%) |
Fertility by Education in New Market
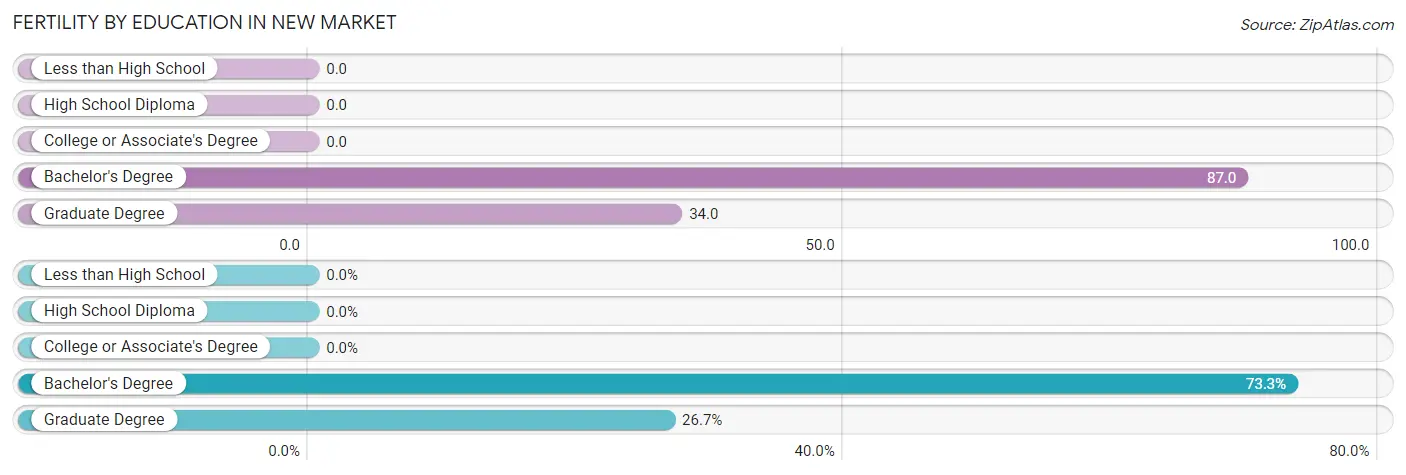
| Educational Attainment | Women with Births | Births / 1,000 Women |
| Less than High School | 0 (0.0%) | 0.0 |
| High School Diploma | 0 (0.0%) | 0.0 |
| College or Associate's Degree | 0 (0.0%) | 0.0 |
| Bachelor's Degree | 11 (73.3%) | 87.0 |
| Graduate Degree | 4 (26.7%) | 34.0 |
| Total | 15 (100.0%) | 40.0 |
Fertility by Education by Marriage Status in New Market
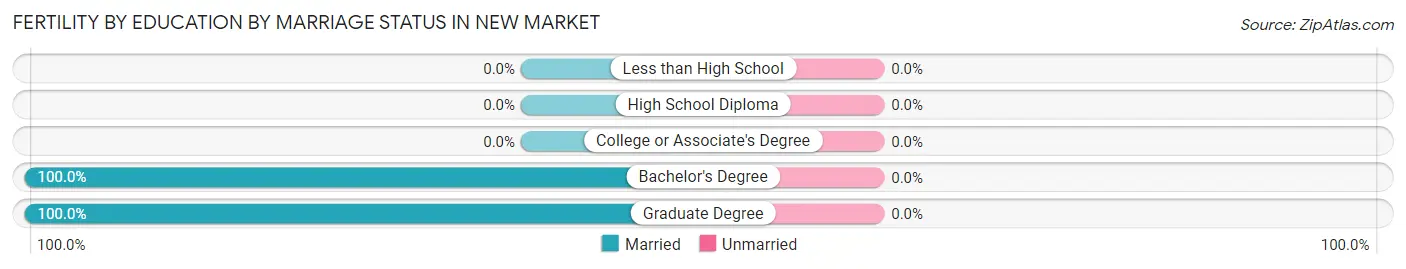
| Educational Attainment | Married | Unmarried |
| Less than High School | 0 (0.0%) | 0 (0.0%) |
| High School Diploma | 0 (0.0%) | 0 (0.0%) |
| College or Associate's Degree | 0 (0.0%) | 0 (0.0%) |
| Bachelor's Degree | 11 (100.0%) | 0 (0.0%) |
| Graduate Degree | 4 (100.0%) | 0 (0.0%) |
| Total | 15 (100.0%) | 0 (0.0%) |
Employment Characteristics in New Market
Employment by Class of Employer in New Market
Among the 792 employed individuals in New Market, private company employees (475 | 60.0%), local government employees (99 | 12.5%), and not-for-profit organizations (77 | 9.7%) make up the most common classes of employment.
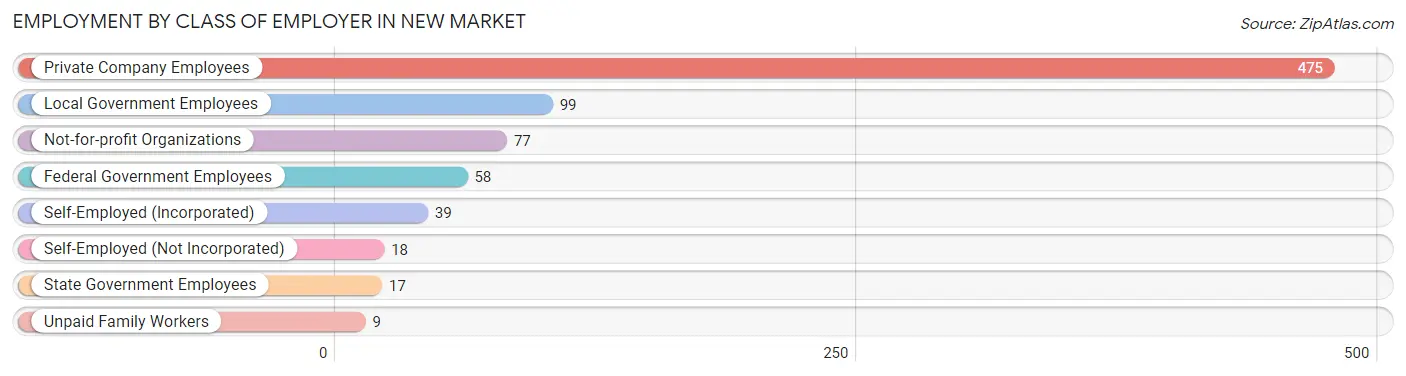
| Employer Class | # Employees | % Employees |
| Private Company Employees | 475 | 60.0% |
| Self-Employed (Incorporated) | 39 | 4.9% |
| Self-Employed (Not Incorporated) | 18 | 2.3% |
| Not-for-profit Organizations | 77 | 9.7% |
| Local Government Employees | 99 | 12.5% |
| State Government Employees | 17 | 2.1% |
| Federal Government Employees | 58 | 7.3% |
| Unpaid Family Workers | 9 | 1.1% |
| Total | 792 | 100.0% |
Employment Status by Age in New Market
According to the labor force statistics for New Market, out of the total population over 16 years of age (1,048), 78.9% or 827 individuals are in the labor force, with 3.5% or 29 of them unemployed. The age group with the highest labor force participation rate is 30 to 34 years, with 100.0% or 71 individuals in the labor force. Within the labor force, the 55 to 59 years age range has the highest percentage of unemployed individuals, with 20.8% or 10 of them being unemployed.
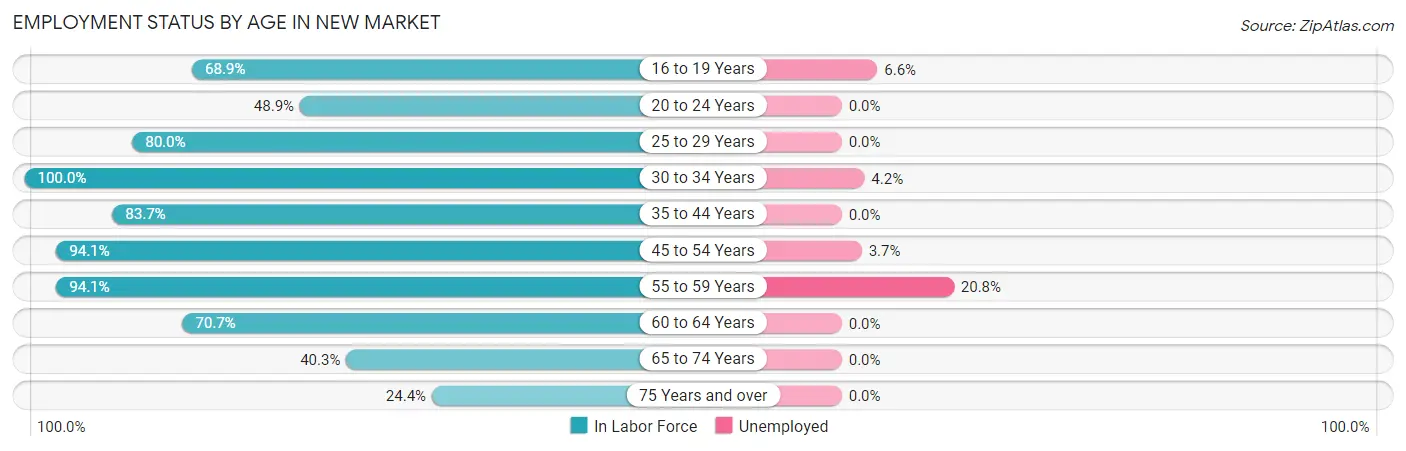
| Age Bracket | In Labor Force | Unemployed |
| 16 to 19 Years | 91 (68.9%) | 6 (6.6%) |
| 20 to 24 Years | 22 (48.9%) | 0 (0.0%) |
| 25 to 29 Years | 16 (80.0%) | 0 (0.0%) |
| 30 to 34 Years | 71 (100.0%) | 3 (4.2%) |
| 35 to 44 Years | 231 (83.7%) | 0 (0.0%) |
| 45 to 54 Years | 270 (94.1%) | 10 (3.7%) |
| 55 to 59 Years | 48 (94.1%) | 10 (20.8%) |
| 60 to 64 Years | 41 (70.7%) | 0 (0.0%) |
| 65 to 74 Years | 27 (40.3%) | 0 (0.0%) |
| 75 Years and over | 10 (24.4%) | 0 (0.0%) |
| Total | 827 (78.9%) | 29 (3.5%) |
Employment Status by Educational Attainment in New Market
According to labor force statistics for New Market, 88.7% of individuals (677) out of the total population between 25 and 64 years of age (763) are in the labor force, with 3.4% or 23 of them being unemployed. The group with the highest labor force participation rate are those with the educational attainment of college / associate degree, with 94.2% or 146 individuals in the labor force. Within the labor force, individuals with bachelor's degree or higher education have the highest percentage of unemployment, with 4.7% or 23 of them being unemployed.
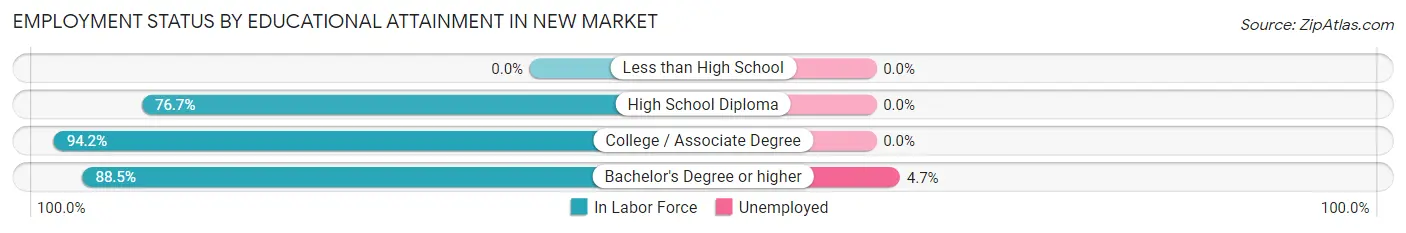
| Educational Attainment | In Labor Force | Unemployed |
| Less than High School | 0 (0.0%) | 0 (0.0%) |
| High School Diploma | 46 (76.7%) | 0 (0.0%) |
| College / Associate Degree | 146 (94.2%) | 0 (0.0%) |
| Bachelor's Degree or higher | 485 (88.5%) | 26 (4.7%) |
| Total | 677 (88.7%) | 26 (3.4%) |
Employment Occupations by Sex in New Market
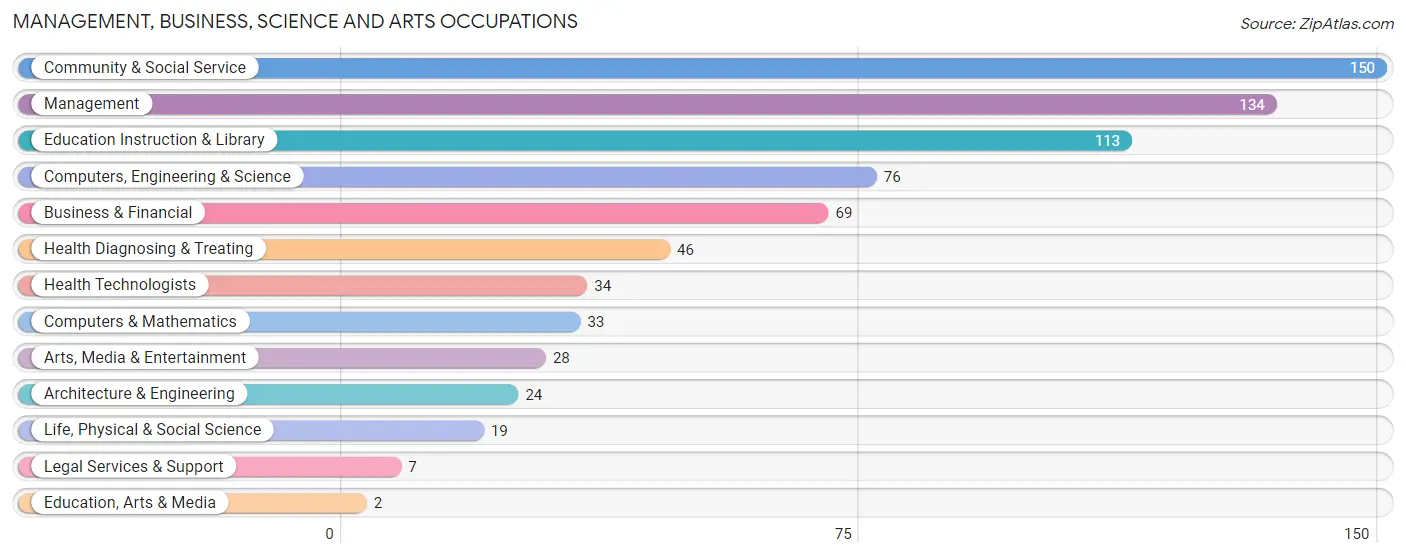
Management, Business, Science and Arts Occupations
The most common Management, Business, Science and Arts occupations in New Market are Community & Social Service (150 | 18.8%), Management (134 | 16.8%), Education Instruction & Library (113 | 14.2%), Computers, Engineering & Science (76 | 9.5%), and Business & Financial (69 | 8.6%).
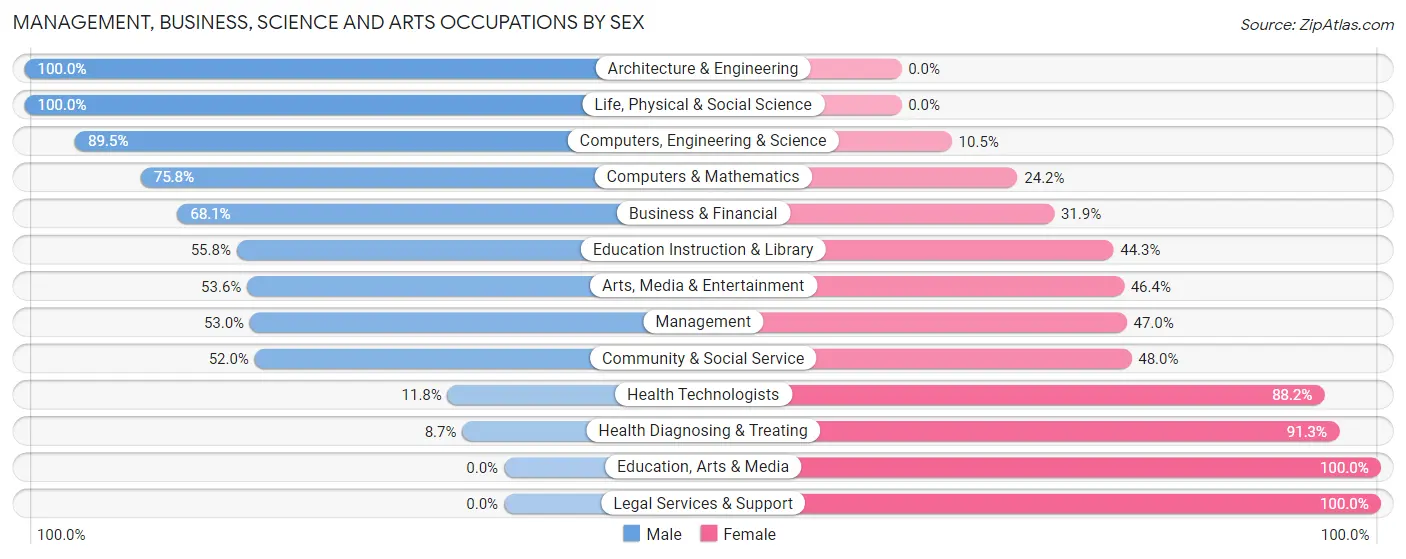
Management, Business, Science and Arts Occupations by Sex
Within the Management, Business, Science and Arts occupations in New Market, the most male-oriented occupations are Architecture & Engineering (100.0%), Life, Physical & Social Science (100.0%), and Computers, Engineering & Science (89.5%), while the most female-oriented occupations are Education, Arts & Media (100.0%), Legal Services & Support (100.0%), and Health Diagnosing & Treating (91.3%).
| Occupation | Male | Female |
| Management | 71 (53.0%) | 63 (47.0%) |
| Business & Financial | 47 (68.1%) | 22 (31.9%) |
| Computers, Engineering & Science | 68 (89.5%) | 8 (10.5%) |
| Computers & Mathematics | 25 (75.8%) | 8 (24.2%) |
| Architecture & Engineering | 24 (100.0%) | 0 (0.0%) |
| Life, Physical & Social Science | 19 (100.0%) | 0 (0.0%) |
| Community & Social Service | 78 (52.0%) | 72 (48.0%) |
| Education, Arts & Media | 0 (0.0%) | 2 (100.0%) |
| Legal Services & Support | 0 (0.0%) | 7 (100.0%) |
| Education Instruction & Library | 63 (55.7%) | 50 (44.3%) |
| Arts, Media & Entertainment | 15 (53.6%) | 13 (46.4%) |
| Health Diagnosing & Treating | 4 (8.7%) | 42 (91.3%) |
| Health Technologists | 4 (11.8%) | 30 (88.2%) |
| Total (Category) | 268 (56.4%) | 207 (43.6%) |
| Total (Overall) | 464 (58.2%) | 334 (41.8%) |
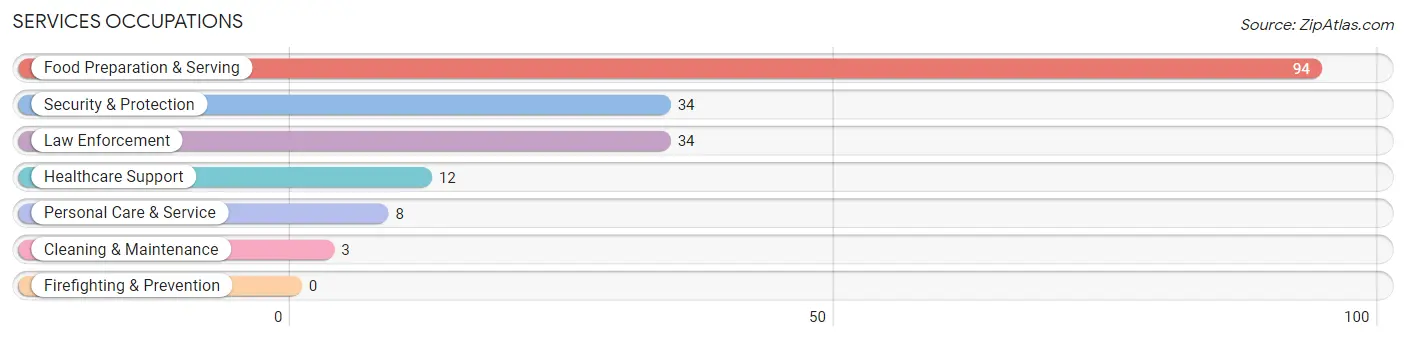
Services Occupations
The most common Services occupations in New Market are Food Preparation & Serving (94 | 11.8%), Security & Protection (34 | 4.3%), Law Enforcement (34 | 4.3%), Healthcare Support (12 | 1.5%), and Personal Care & Service (8 | 1.0%).
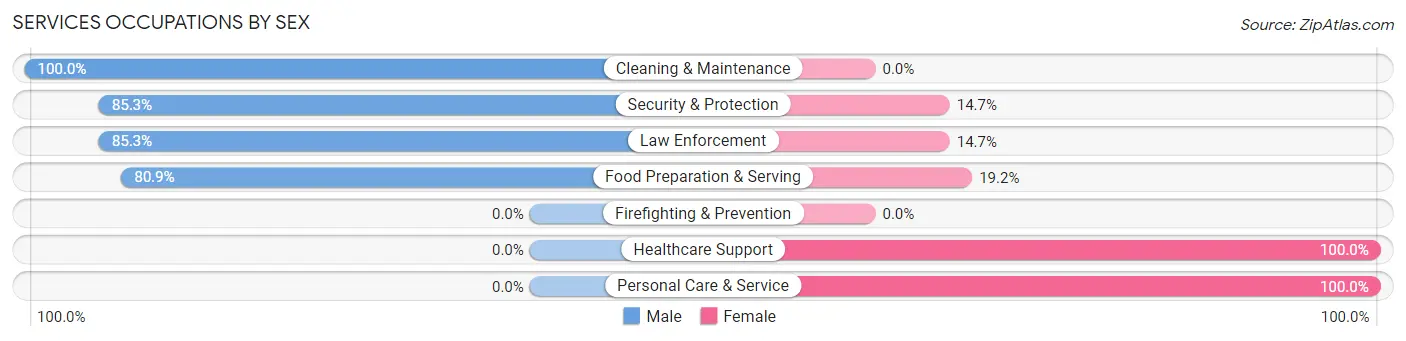
Services Occupations by Sex
Within the Services occupations in New Market, the most male-oriented occupations are Cleaning & Maintenance (100.0%), Security & Protection (85.3%), and Law Enforcement (85.3%), while the most female-oriented occupations are Healthcare Support (100.0%), Personal Care & Service (100.0%), and Food Preparation & Serving (19.2%).
| Occupation | Male | Female |
| Healthcare Support | 0 (0.0%) | 12 (100.0%) |
| Security & Protection | 29 (85.3%) | 5 (14.7%) |
| Firefighting & Prevention | 0 (0.0%) | 0 (0.0%) |
| Law Enforcement | 29 (85.3%) | 5 (14.7%) |
| Food Preparation & Serving | 76 (80.8%) | 18 (19.2%) |
| Cleaning & Maintenance | 3 (100.0%) | 0 (0.0%) |
| Personal Care & Service | 0 (0.0%) | 8 (100.0%) |
| Total (Category) | 108 (71.5%) | 43 (28.5%) |
| Total (Overall) | 464 (58.2%) | 334 (41.8%) |
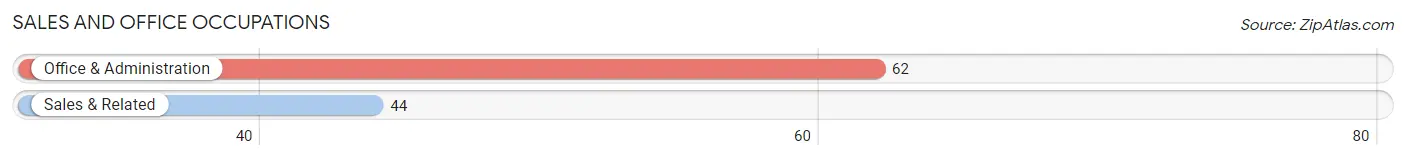
Sales and Office Occupations
The most common Sales and Office occupations in New Market are Office & Administration (62 | 7.8%), and Sales & Related (44 | 5.5%).
Sales and Office Occupations by Sex
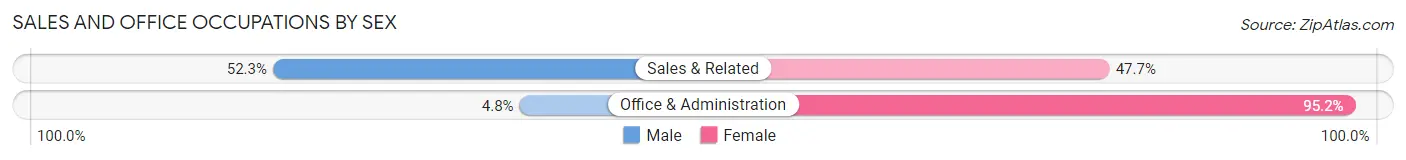
| Occupation | Male | Female |
| Sales & Related | 23 (52.3%) | 21 (47.7%) |
| Office & Administration | 3 (4.8%) | 59 (95.2%) |
| Total (Category) | 26 (24.5%) | 80 (75.5%) |
| Total (Overall) | 464 (58.2%) | 334 (41.8%) |
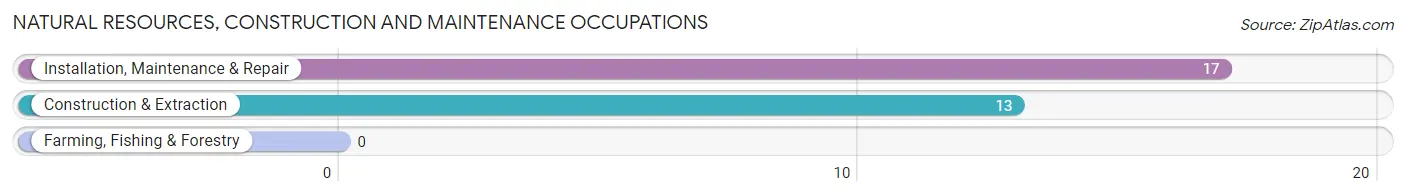
Natural Resources, Construction and Maintenance Occupations
The most common Natural Resources, Construction and Maintenance occupations in New Market are Installation, Maintenance & Repair (17 | 2.1%), and Construction & Extraction (13 | 1.6%).
Natural Resources, Construction and Maintenance Occupations by Sex
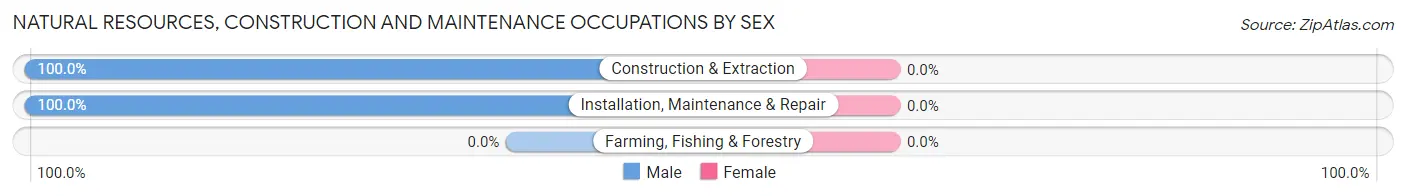
| Occupation | Male | Female |
| Farming, Fishing & Forestry | 0 (0.0%) | 0 (0.0%) |
| Construction & Extraction | 13 (100.0%) | 0 (0.0%) |
| Installation, Maintenance & Repair | 17 (100.0%) | 0 (0.0%) |
| Total (Category) | 30 (100.0%) | 0 (0.0%) |
| Total (Overall) | 464 (58.2%) | 334 (41.8%) |
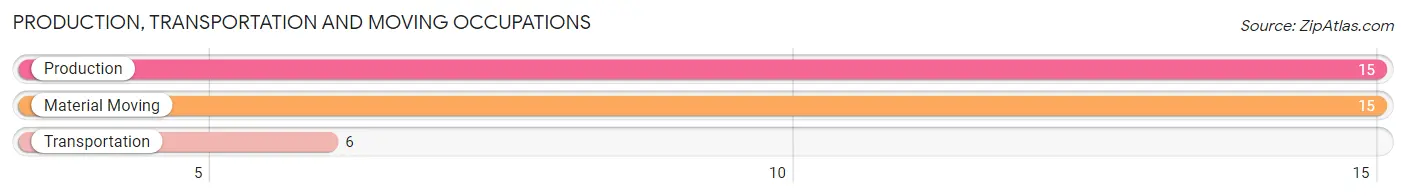
Production, Transportation and Moving Occupations
The most common Production, Transportation and Moving occupations in New Market are Production (15 | 1.9%), Material Moving (15 | 1.9%), and Transportation (6 | 0.7%).
Production, Transportation and Moving Occupations by Sex
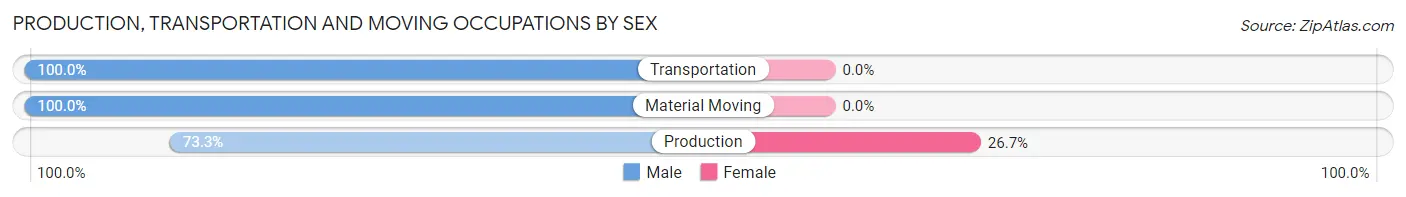
| Occupation | Male | Female |
| Production | 11 (73.3%) | 4 (26.7%) |
| Transportation | 6 (100.0%) | 0 (0.0%) |
| Material Moving | 15 (100.0%) | 0 (0.0%) |
| Total (Category) | 32 (88.9%) | 4 (11.1%) |
| Total (Overall) | 464 (58.2%) | 334 (41.8%) |
Employment Industries by Sex in New Market
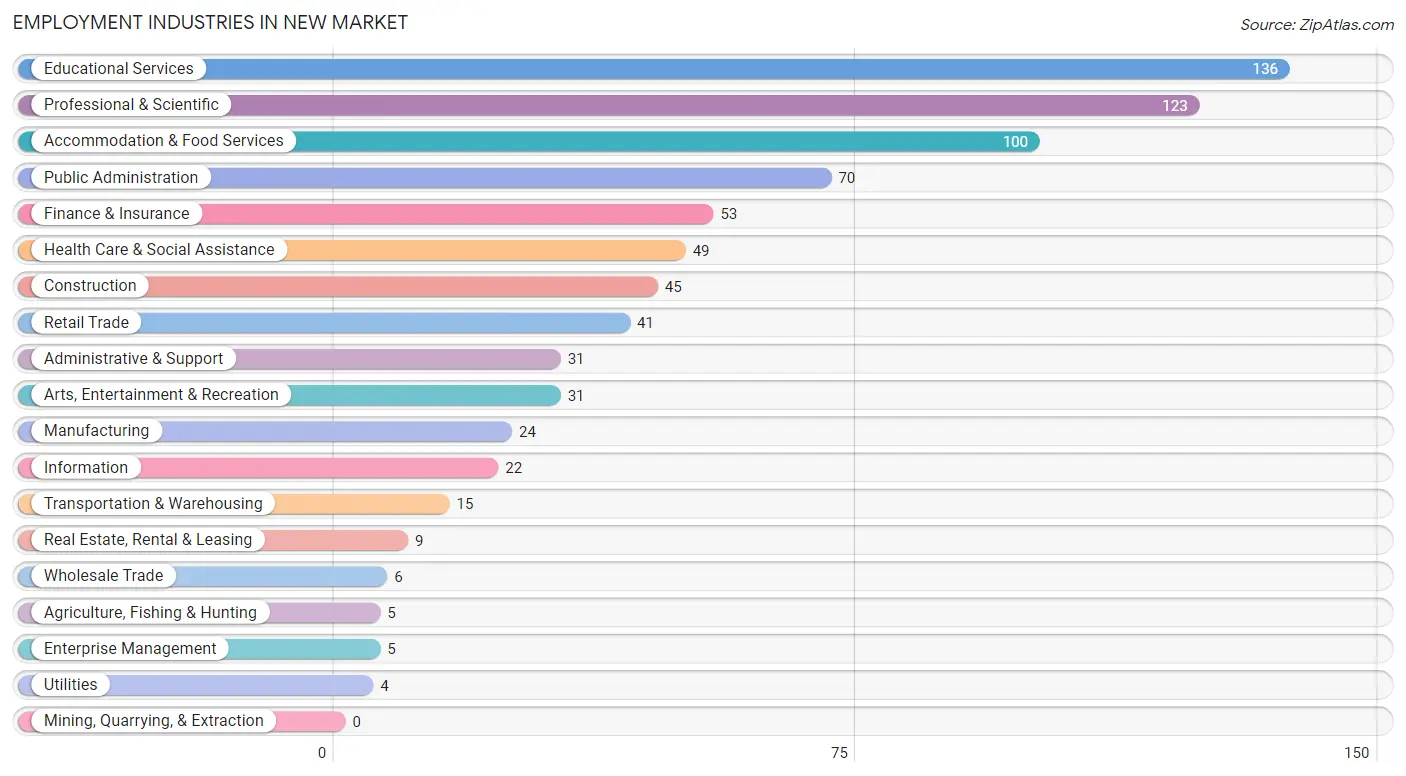
Employment Industries in New Market
The major employment industries in New Market include Educational Services (136 | 17.0%), Professional & Scientific (123 | 15.4%), Accommodation & Food Services (100 | 12.5%), Public Administration (70 | 8.8%), and Finance & Insurance (53 | 6.6%).
Employment Industries by Sex in New Market
The New Market industries that see more men than women are Agriculture, Fishing & Hunting (100.0%), Utilities (100.0%), and Information (100.0%), whereas the industries that tend to have a higher number of women are Health Care & Social Assistance (100.0%), Educational Services (64.7%), and Manufacturing (50.0%).
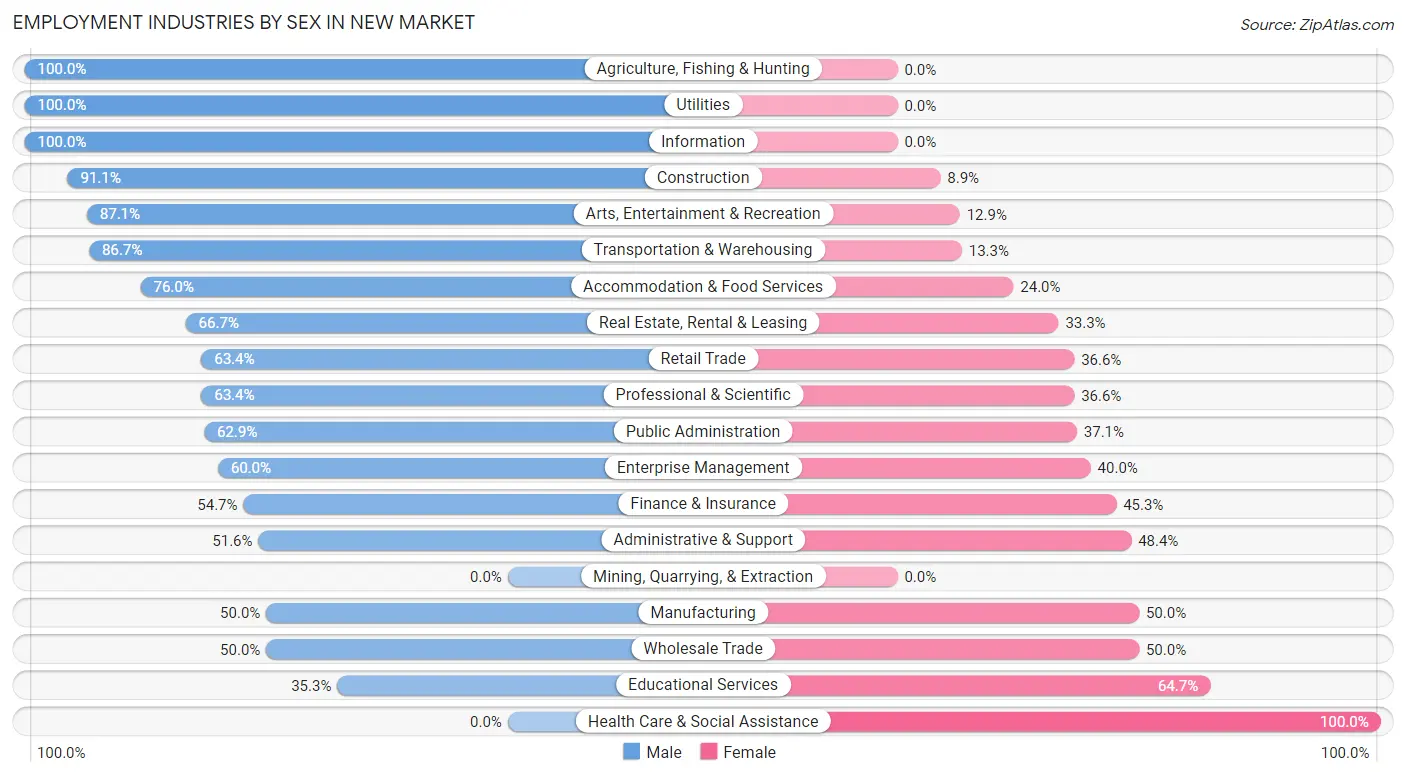
| Industry | Male | Female |
| Agriculture, Fishing & Hunting | 5 (100.0%) | 0 (0.0%) |
| Mining, Quarrying, & Extraction | 0 (0.0%) | 0 (0.0%) |
| Construction | 41 (91.1%) | 4 (8.9%) |
| Manufacturing | 12 (50.0%) | 12 (50.0%) |
| Wholesale Trade | 3 (50.0%) | 3 (50.0%) |
| Retail Trade | 26 (63.4%) | 15 (36.6%) |
| Transportation & Warehousing | 13 (86.7%) | 2 (13.3%) |
| Utilities | 4 (100.0%) | 0 (0.0%) |
| Information | 22 (100.0%) | 0 (0.0%) |
| Finance & Insurance | 29 (54.7%) | 24 (45.3%) |
| Real Estate, Rental & Leasing | 6 (66.7%) | 3 (33.3%) |
| Professional & Scientific | 78 (63.4%) | 45 (36.6%) |
| Enterprise Management | 3 (60.0%) | 2 (40.0%) |
| Administrative & Support | 16 (51.6%) | 15 (48.4%) |
| Educational Services | 48 (35.3%) | 88 (64.7%) |
| Health Care & Social Assistance | 0 (0.0%) | 49 (100.0%) |
| Arts, Entertainment & Recreation | 27 (87.1%) | 4 (12.9%) |
| Accommodation & Food Services | 76 (76.0%) | 24 (24.0%) |
| Public Administration | 44 (62.9%) | 26 (37.1%) |
| Total | 464 (58.2%) | 334 (41.8%) |
Education in New Market
School Enrollment in New Market
The most common levels of schooling among the 636 students in New Market are elementary school (155 | 24.4%), middle school (148 | 23.3%), and high school (122 | 19.2%).
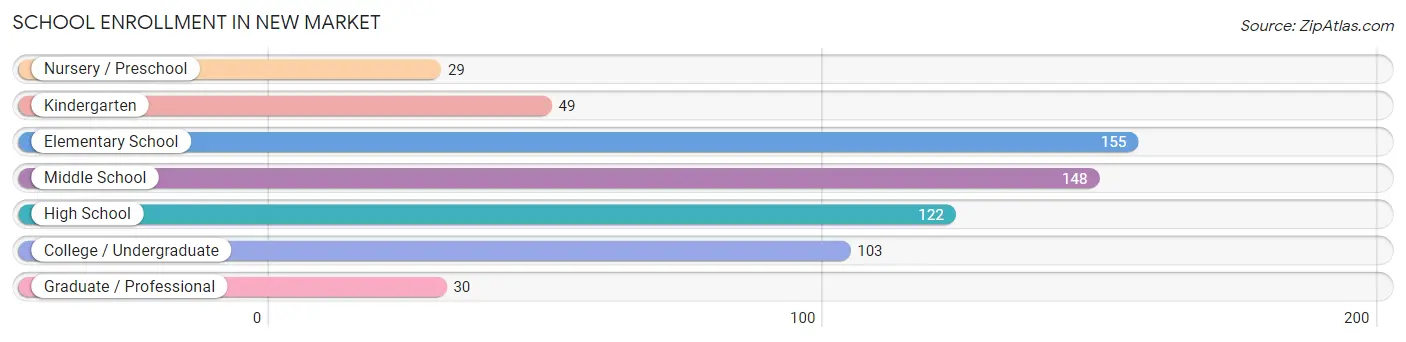
| School Level | # Students | % Students |
| Nursery / Preschool | 29 | 4.6% |
| Kindergarten | 49 | 7.7% |
| Elementary School | 155 | 24.4% |
| Middle School | 148 | 23.3% |
| High School | 122 | 19.2% |
| College / Undergraduate | 103 | 16.2% |
| Graduate / Professional | 30 | 4.7% |
| Total | 636 | 100.0% |
School Enrollment by Age by Funding Source in New Market
Out of a total of 636 students who are enrolled in schools in New Market, 189 (29.7%) attend a private institution, while the remaining 447 (70.3%) are enrolled in public schools. The age group of 3 to 4 year olds has the highest likelihood of being enrolled in private schools, with 19 (90.5% in the age bracket) enrolled. Conversely, the age group of 10 to 14 year olds has the lowest likelihood of being enrolled in a private school, with 151 (90.4% in the age bracket) attending a public institution.
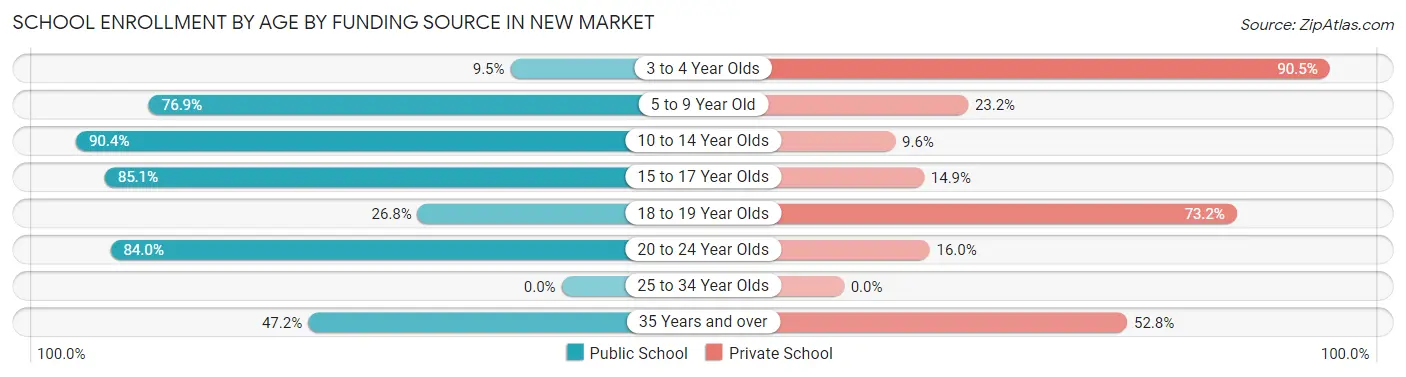
| Age Bracket | Public School | Private School |
| 3 to 4 Year Olds | 2 (9.5%) | 19 (90.5%) |
| 5 to 9 Year Old | 156 (76.8%) | 47 (23.2%) |
| 10 to 14 Year Olds | 151 (90.4%) | 16 (9.6%) |
| 15 to 17 Year Olds | 74 (85.1%) | 13 (14.9%) |
| 18 to 19 Year Olds | 26 (26.8%) | 71 (73.2%) |
| 20 to 24 Year Olds | 21 (84.0%) | 4 (16.0%) |
| 25 to 34 Year Olds | 0 (0.0%) | 0 (0.0%) |
| 35 Years and over | 17 (47.2%) | 19 (52.8%) |
| Total | 447 (70.3%) | 189 (29.7%) |
Educational Attainment by Field of Study in New Market
Business (120 | 18.9%), social sciences (93 | 14.6%), science & technology (73 | 11.5%), arts & humanities (61 | 9.6%), and education (50 | 7.9%) are the most common fields of study among 635 individuals in New Market who have obtained a bachelor's degree or higher.
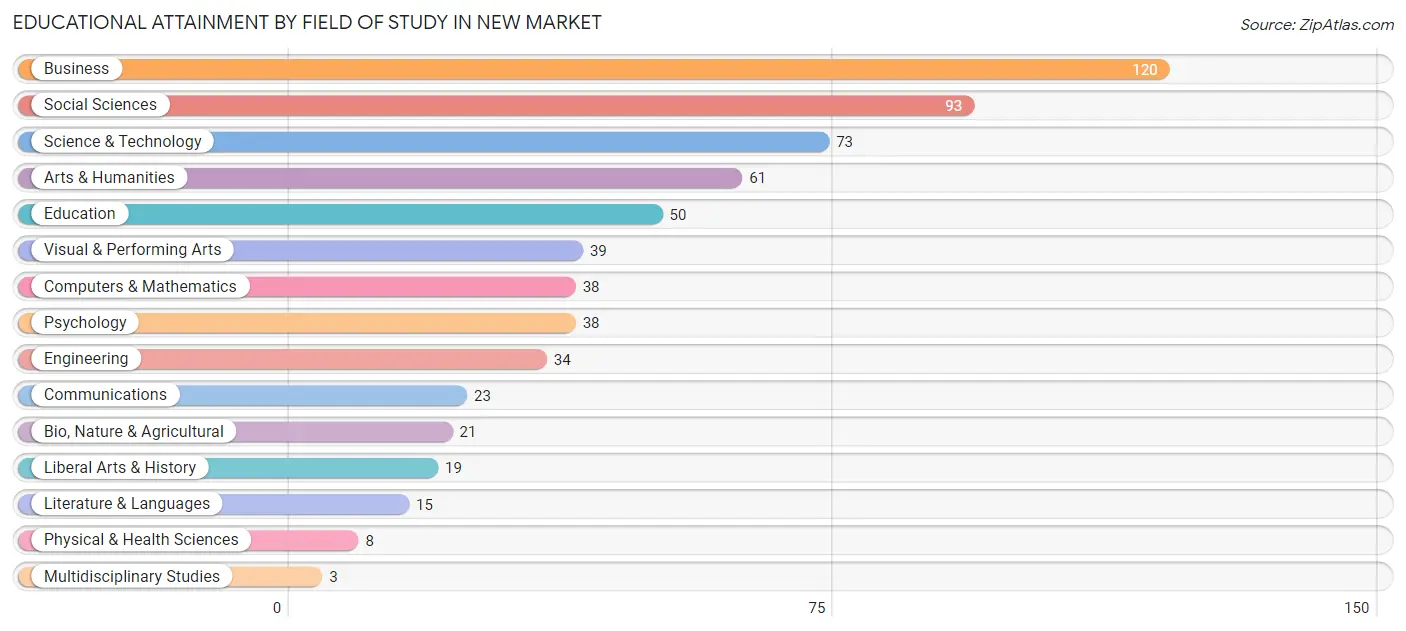
| Field of Study | # Graduates | % Graduates |
| Computers & Mathematics | 38 | 6.0% |
| Bio, Nature & Agricultural | 21 | 3.3% |
| Physical & Health Sciences | 8 | 1.3% |
| Psychology | 38 | 6.0% |
| Social Sciences | 93 | 14.6% |
| Engineering | 34 | 5.3% |
| Multidisciplinary Studies | 3 | 0.5% |
| Science & Technology | 73 | 11.5% |
| Business | 120 | 18.9% |
| Education | 50 | 7.9% |
| Literature & Languages | 15 | 2.4% |
| Liberal Arts & History | 19 | 3.0% |
| Visual & Performing Arts | 39 | 6.1% |
| Communications | 23 | 3.6% |
| Arts & Humanities | 61 | 9.6% |
| Total | 635 | 100.0% |
Transportation & Commute in New Market
Vehicle Availability by Sex in New Market
The most prevalent vehicle ownership categories in New Market are males with 2 vehicles (194, accounting for 41.8%) and females with 2 vehicles (161, making up 59.2%).
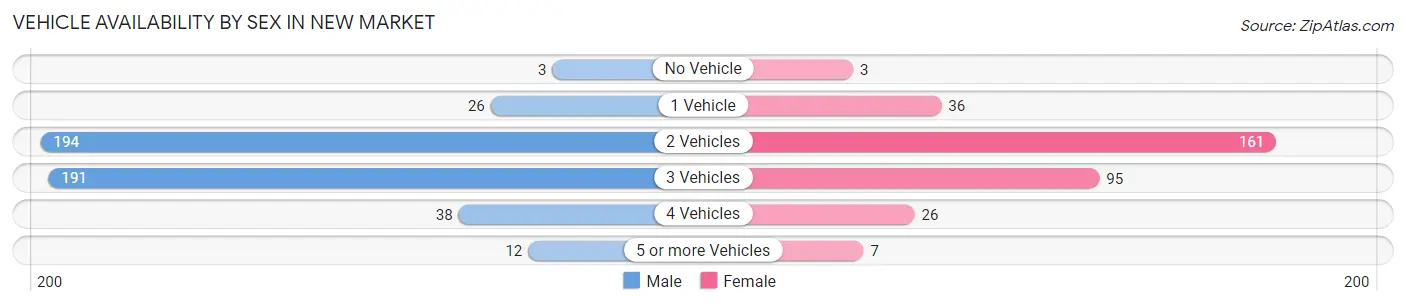
| Vehicles Available | Male | Female |
| No Vehicle | 3 (0.6%) | 3 (0.9%) |
| 1 Vehicle | 26 (5.6%) | 36 (11.0%) |
| 2 Vehicles | 194 (41.8%) | 161 (49.1%) |
| 3 Vehicles | 191 (41.2%) | 95 (29.0%) |
| 4 Vehicles | 38 (8.2%) | 26 (7.9%) |
| 5 or more Vehicles | 12 (2.6%) | 7 (2.1%) |
| Total | 464 (100.0%) | 328 (100.0%) |
Commute Time in New Market
The most frequently occuring commute durations in New Market are 45 to 59 minutes (133 commuters, 21.0%), 10 to 14 minutes (116 commuters, 18.3%), and 60 to 89 minutes (91 commuters, 14.3%).
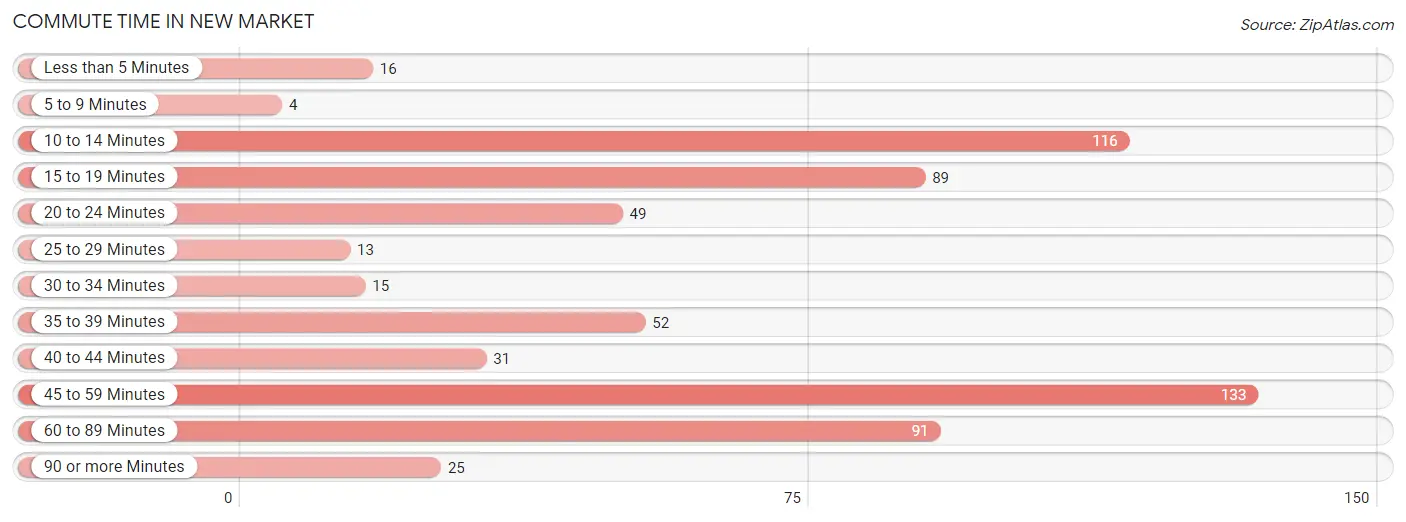
| Commute Time | # Commuters | % Commuters |
| Less than 5 Minutes | 16 | 2.5% |
| 5 to 9 Minutes | 4 | 0.6% |
| 10 to 14 Minutes | 116 | 18.3% |
| 15 to 19 Minutes | 89 | 14.0% |
| 20 to 24 Minutes | 49 | 7.7% |
| 25 to 29 Minutes | 13 | 2.1% |
| 30 to 34 Minutes | 15 | 2.4% |
| 35 to 39 Minutes | 52 | 8.2% |
| 40 to 44 Minutes | 31 | 4.9% |
| 45 to 59 Minutes | 133 | 21.0% |
| 60 to 89 Minutes | 91 | 14.3% |
| 90 or more Minutes | 25 | 3.9% |
Commute Time by Sex in New Market
The most common commute times in New Market are 10 to 14 minutes (108 commuters, 29.0%) for males and 15 to 19 minutes (70 commuters, 26.7%) for females.
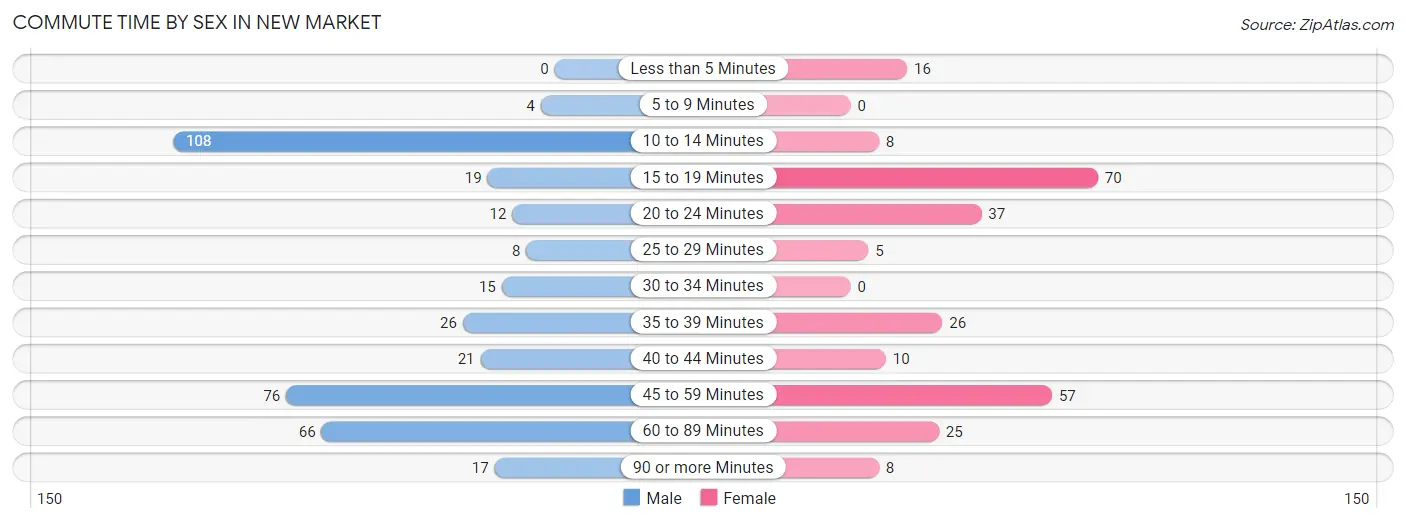
| Commute Time | Male | Female |
| Less than 5 Minutes | 0 (0.0%) | 16 (6.1%) |
| 5 to 9 Minutes | 4 (1.1%) | 0 (0.0%) |
| 10 to 14 Minutes | 108 (29.0%) | 8 (3.0%) |
| 15 to 19 Minutes | 19 (5.1%) | 70 (26.7%) |
| 20 to 24 Minutes | 12 (3.2%) | 37 (14.1%) |
| 25 to 29 Minutes | 8 (2.1%) | 5 (1.9%) |
| 30 to 34 Minutes | 15 (4.0%) | 0 (0.0%) |
| 35 to 39 Minutes | 26 (7.0%) | 26 (9.9%) |
| 40 to 44 Minutes | 21 (5.7%) | 10 (3.8%) |
| 45 to 59 Minutes | 76 (20.4%) | 57 (21.8%) |
| 60 to 89 Minutes | 66 (17.7%) | 25 (9.5%) |
| 90 or more Minutes | 17 (4.6%) | 8 (3.0%) |
Time of Departure to Work by Sex in New Market
The most frequent times of departure to work in New Market are 7:00 AM to 7:29 AM (80, 21.5%) for males and 8:00 AM to 8:29 AM (39, 14.9%) for females.
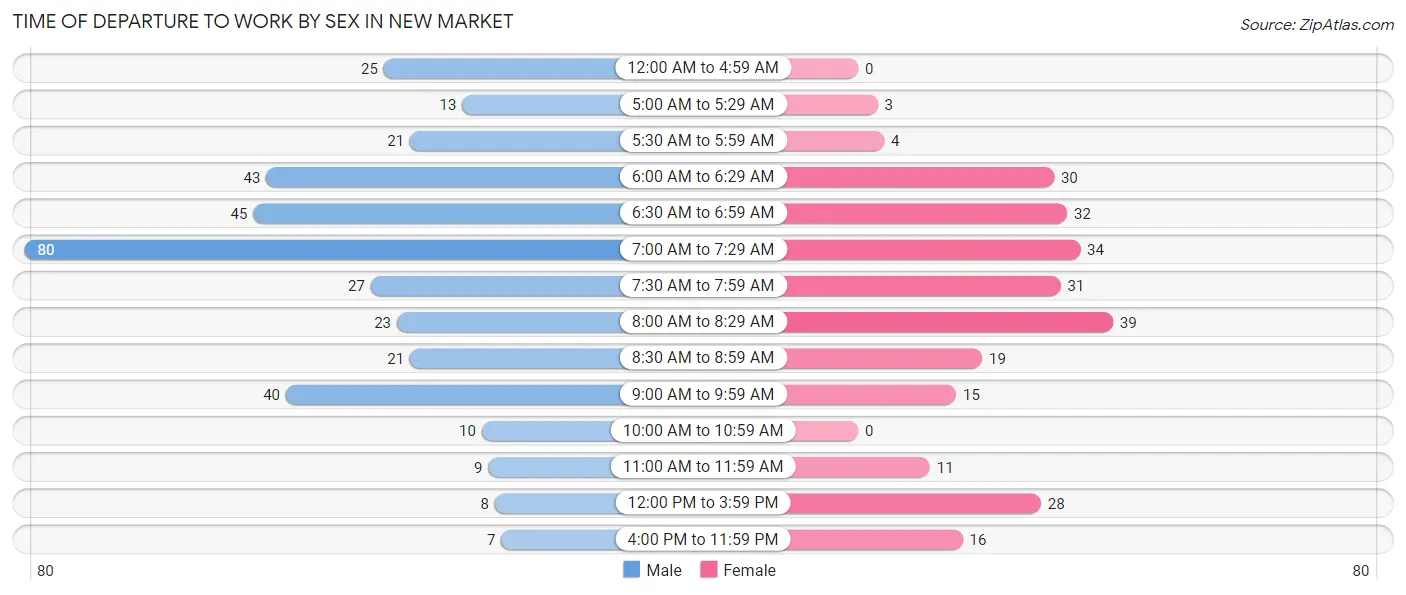
| Time of Departure | Male | Female |
| 12:00 AM to 4:59 AM | 25 (6.7%) | 0 (0.0%) |
| 5:00 AM to 5:29 AM | 13 (3.5%) | 3 (1.1%) |
| 5:30 AM to 5:59 AM | 21 (5.7%) | 4 (1.5%) |
| 6:00 AM to 6:29 AM | 43 (11.6%) | 30 (11.5%) |
| 6:30 AM to 6:59 AM | 45 (12.1%) | 32 (12.2%) |
| 7:00 AM to 7:29 AM | 80 (21.5%) | 34 (13.0%) |
| 7:30 AM to 7:59 AM | 27 (7.3%) | 31 (11.8%) |
| 8:00 AM to 8:29 AM | 23 (6.2%) | 39 (14.9%) |
| 8:30 AM to 8:59 AM | 21 (5.7%) | 19 (7.2%) |
| 9:00 AM to 9:59 AM | 40 (10.7%) | 15 (5.7%) |
| 10:00 AM to 10:59 AM | 10 (2.7%) | 0 (0.0%) |
| 11:00 AM to 11:59 AM | 9 (2.4%) | 11 (4.2%) |
| 12:00 PM to 3:59 PM | 8 (2.1%) | 28 (10.7%) |
| 4:00 PM to 11:59 PM | 7 (1.9%) | 16 (6.1%) |
| Total | 372 (100.0%) | 262 (100.0%) |
Housing Occupancy in New Market
Occupancy by Ownership in New Market
Of the total 468 dwellings in New Market, owner-occupied units account for 442 (94.4%), while renter-occupied units make up 26 (5.6%).
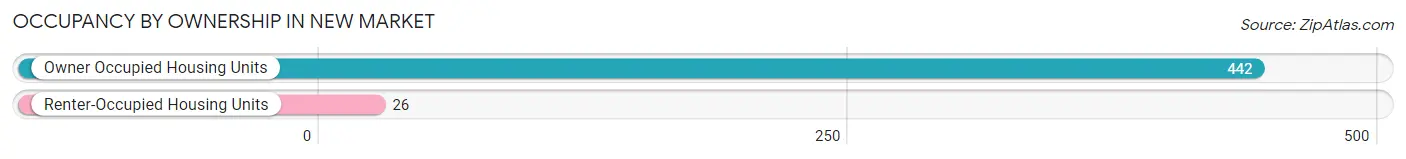
| Occupancy | # Housing Units | % Housing Units |
| Owner Occupied Housing Units | 442 | 94.4% |
| Renter-Occupied Housing Units | 26 | 5.6% |
| Total Occupied Housing Units | 468 | 100.0% |
Occupancy by Household Size in New Market
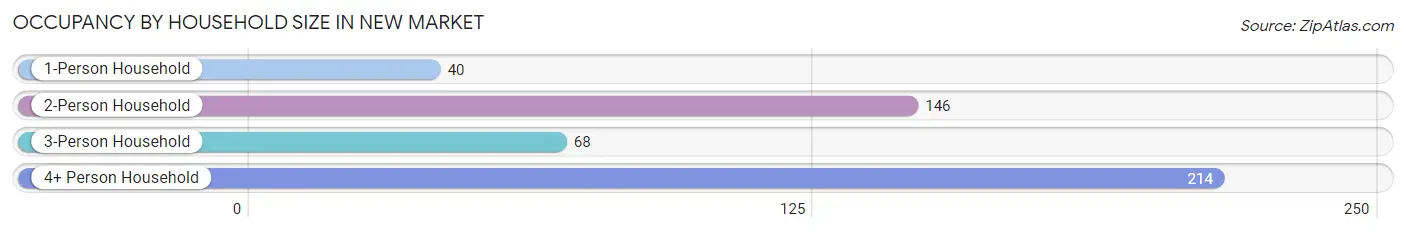
| Household Size | # Housing Units | % Housing Units |
| 1-Person Household | 40 | 8.6% |
| 2-Person Household | 146 | 31.2% |
| 3-Person Household | 68 | 14.5% |
| 4+ Person Household | 214 | 45.7% |
| Total Housing Units | 468 | 100.0% |
Occupancy by Ownership by Household Size in New Market
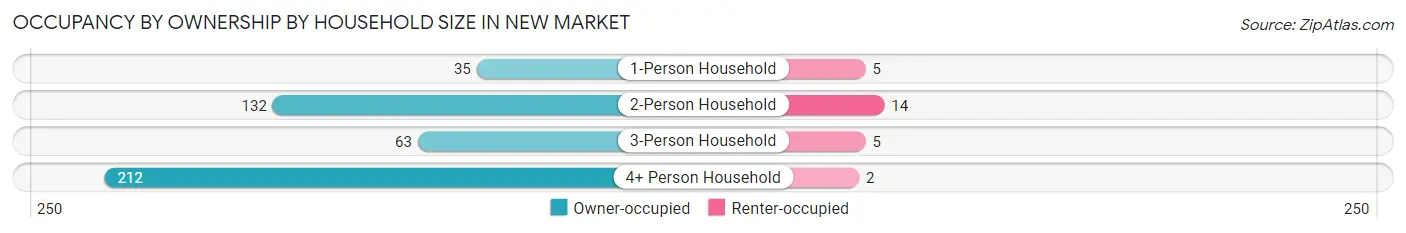
| Household Size | Owner-occupied | Renter-occupied |
| 1-Person Household | 35 (87.5%) | 5 (12.5%) |
| 2-Person Household | 132 (90.4%) | 14 (9.6%) |
| 3-Person Household | 63 (92.6%) | 5 (7.3%) |
| 4+ Person Household | 212 (99.1%) | 2 (0.9%) |
| Total Housing Units | 442 (94.4%) | 26 (5.6%) |
Occupancy by Educational Attainment in New Market
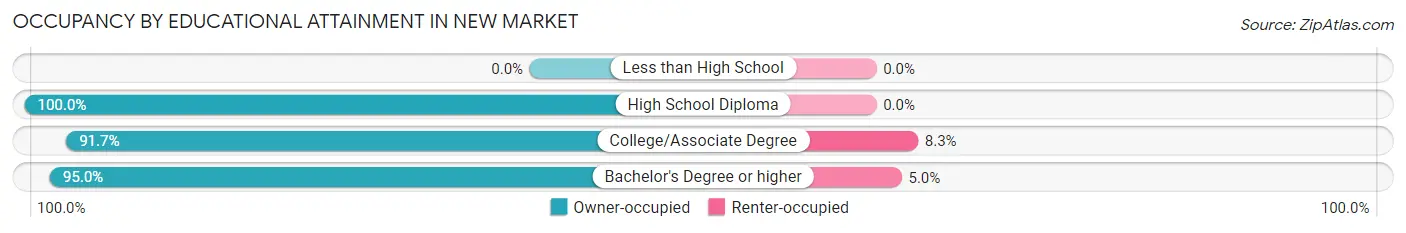
| Household Size | Owner-occupied | Renter-occupied |
| Less than High School | 0 (0.0%) | 0 (0.0%) |
| High School Diploma | 21 (100.0%) | 0 (0.0%) |
| College/Associate Degree | 100 (91.7%) | 9 (8.3%) |
| Bachelor's Degree or higher | 321 (95.0%) | 17 (5.0%) |
Occupancy by Age of Householder in New Market
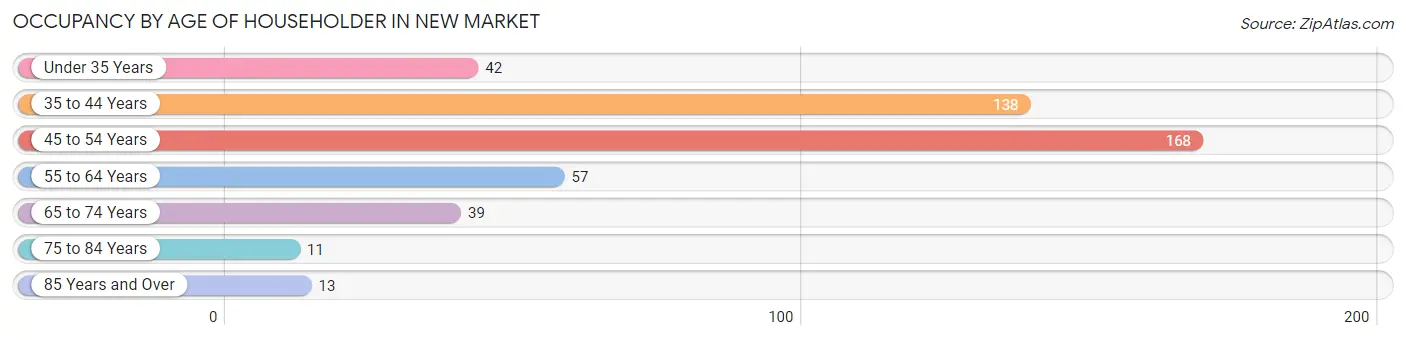
| Age Bracket | # Households | % Households |
| Under 35 Years | 42 | 9.0% |
| 35 to 44 Years | 138 | 29.5% |
| 45 to 54 Years | 168 | 35.9% |
| 55 to 64 Years | 57 | 12.2% |
| 65 to 74 Years | 39 | 8.3% |
| 75 to 84 Years | 11 | 2.4% |
| 85 Years and Over | 13 | 2.8% |
| Total | 468 | 100.0% |
Housing Finances in New Market
Median Income by Occupancy in New Market
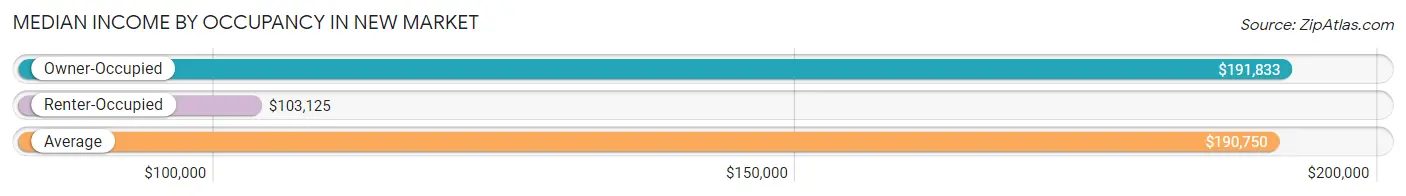
| Occupancy Type | # Households | Median Income |
| Owner-Occupied | 442 (94.4%) | $191,833 |
| Renter-Occupied | 26 (5.6%) | $103,125 |
| Average | 468 (100.0%) | $190,750 |
Occupancy by Householder Income Bracket in New Market
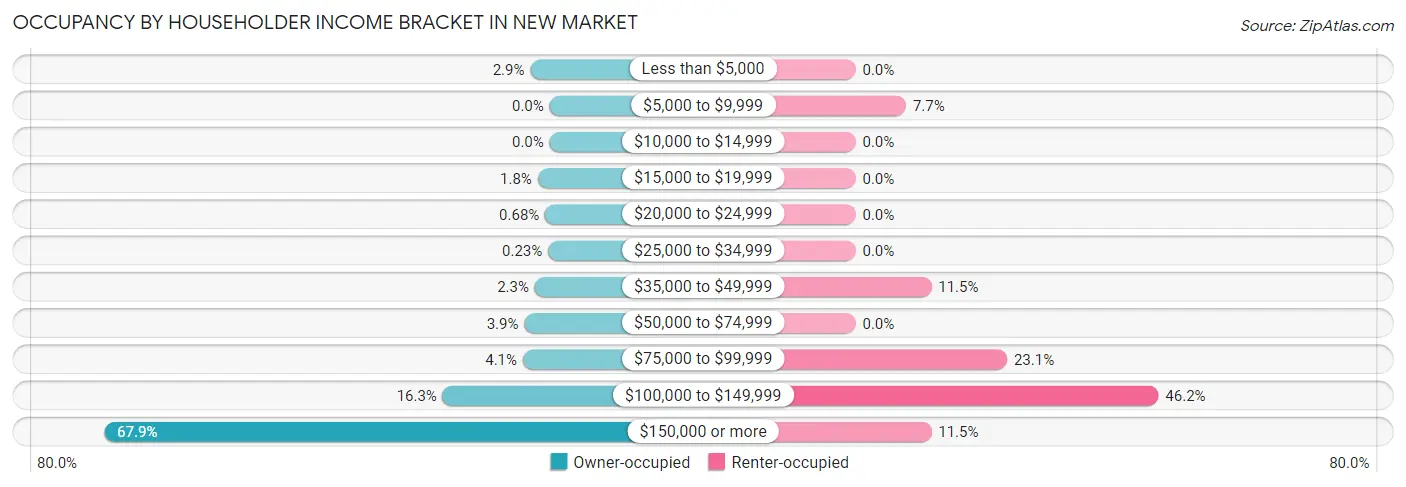
| Income Bracket | Owner-occupied | Renter-occupied |
| Less than $5,000 | 13 (2.9%) | 0 (0.0%) |
| $5,000 to $9,999 | 0 (0.0%) | 2 (7.7%) |
| $10,000 to $14,999 | 0 (0.0%) | 0 (0.0%) |
| $15,000 to $19,999 | 8 (1.8%) | 0 (0.0%) |
| $20,000 to $24,999 | 3 (0.7%) | 0 (0.0%) |
| $25,000 to $34,999 | 1 (0.2%) | 0 (0.0%) |
| $35,000 to $49,999 | 10 (2.3%) | 3 (11.5%) |
| $50,000 to $74,999 | 17 (3.8%) | 0 (0.0%) |
| $75,000 to $99,999 | 18 (4.1%) | 6 (23.1%) |
| $100,000 to $149,999 | 72 (16.3%) | 12 (46.2%) |
| $150,000 or more | 300 (67.9%) | 3 (11.5%) |
| Total | 442 (100.0%) | 26 (100.0%) |
Monthly Housing Cost Tiers in New Market
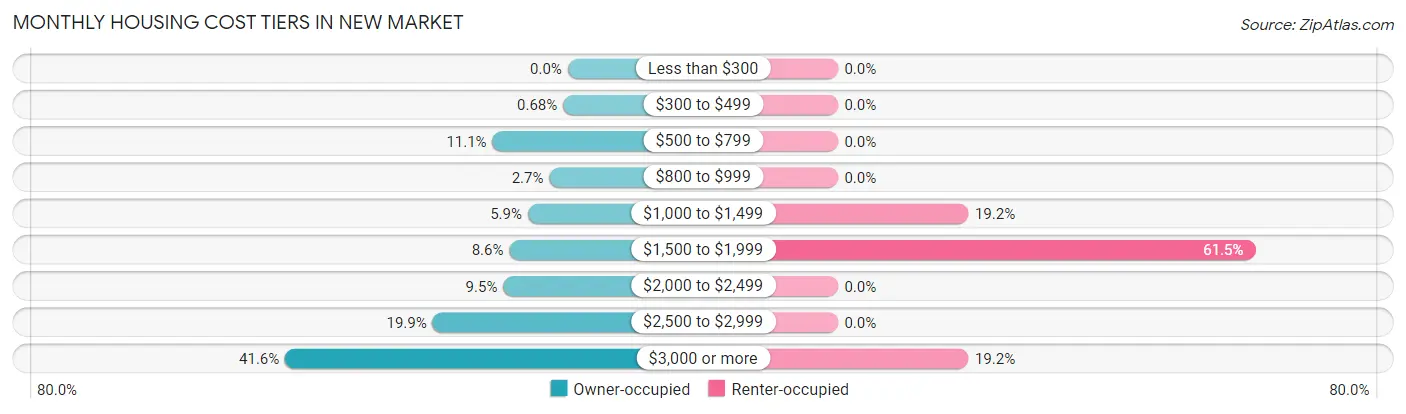
| Monthly Cost | Owner-occupied | Renter-occupied |
| Less than $300 | 0 (0.0%) | 0 (0.0%) |
| $300 to $499 | 3 (0.7%) | 0 (0.0%) |
| $500 to $799 | 49 (11.1%) | 0 (0.0%) |
| $800 to $999 | 12 (2.7%) | 0 (0.0%) |
| $1,000 to $1,499 | 26 (5.9%) | 5 (19.2%) |
| $1,500 to $1,999 | 38 (8.6%) | 16 (61.5%) |
| $2,000 to $2,499 | 42 (9.5%) | 0 (0.0%) |
| $2,500 to $2,999 | 88 (19.9%) | 0 (0.0%) |
| $3,000 or more | 184 (41.6%) | 5 (19.2%) |
| Total | 442 (100.0%) | 26 (100.0%) |
Physical Housing Characteristics in New Market
Housing Structures in New Market
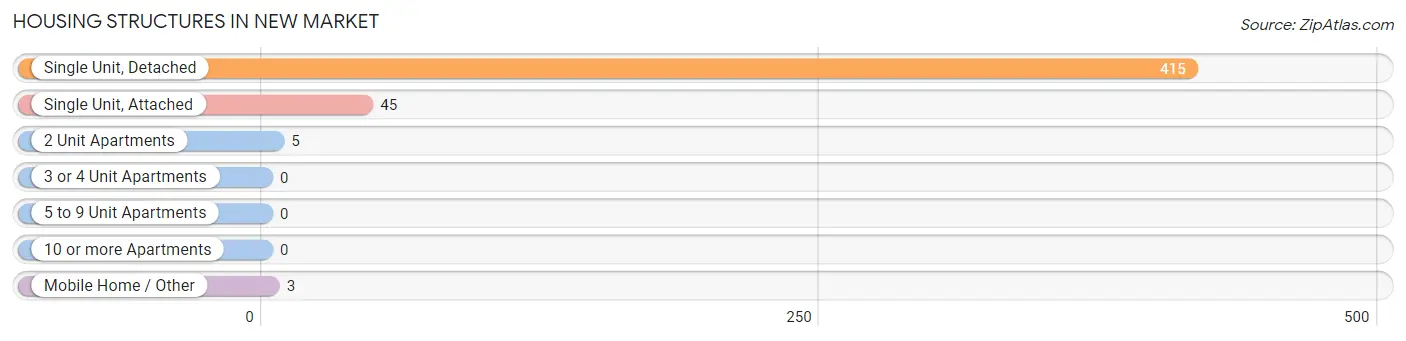
| Structure Type | # Housing Units | % Housing Units |
| Single Unit, Detached | 415 | 88.7% |
| Single Unit, Attached | 45 | 9.6% |
| 2 Unit Apartments | 5 | 1.1% |
| 3 or 4 Unit Apartments | 0 | 0.0% |
| 5 to 9 Unit Apartments | 0 | 0.0% |
| 10 or more Apartments | 0 | 0.0% |
| Mobile Home / Other | 3 | 0.6% |
| Total | 468 | 100.0% |
Housing Structures by Occupancy in New Market
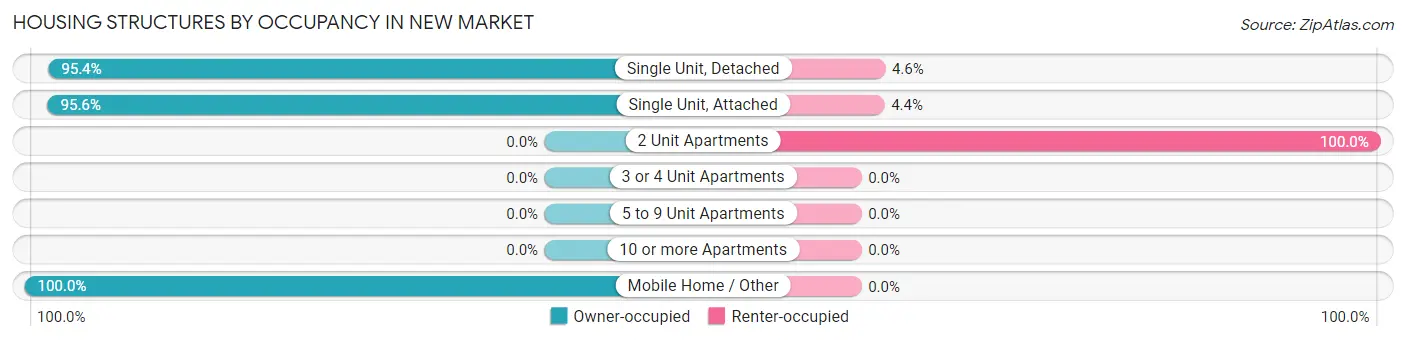
| Structure Type | Owner-occupied | Renter-occupied |
| Single Unit, Detached | 396 (95.4%) | 19 (4.6%) |
| Single Unit, Attached | 43 (95.6%) | 2 (4.4%) |
| 2 Unit Apartments | 0 (0.0%) | 5 (100.0%) |
| 3 or 4 Unit Apartments | 0 (0.0%) | 0 (0.0%) |
| 5 to 9 Unit Apartments | 0 (0.0%) | 0 (0.0%) |
| 10 or more Apartments | 0 (0.0%) | 0 (0.0%) |
| Mobile Home / Other | 3 (100.0%) | 0 (0.0%) |
| Total | 442 (94.4%) | 26 (5.6%) |
Housing Structures by Number of Rooms in New Market
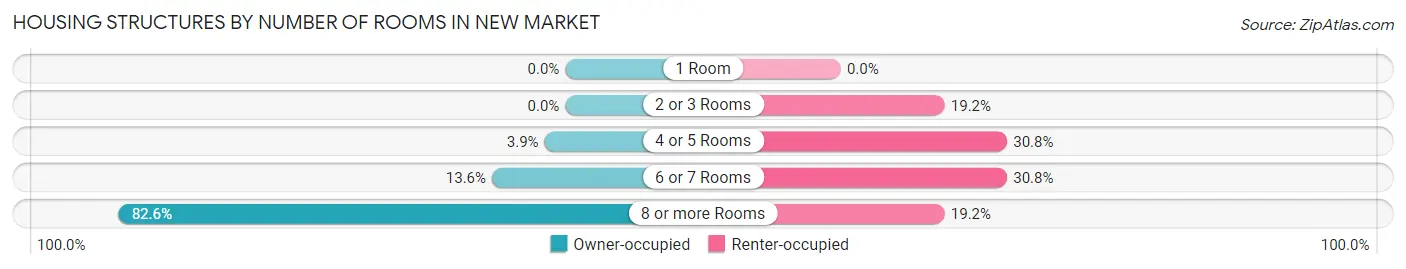
| Number of Rooms | Owner-occupied | Renter-occupied |
| 1 Room | 0 (0.0%) | 0 (0.0%) |
| 2 or 3 Rooms | 0 (0.0%) | 5 (19.2%) |
| 4 or 5 Rooms | 17 (3.8%) | 8 (30.8%) |
| 6 or 7 Rooms | 60 (13.6%) | 8 (30.8%) |
| 8 or more Rooms | 365 (82.6%) | 5 (19.2%) |
| Total | 442 (100.0%) | 26 (100.0%) |
Housing Structure by Heating Type in New Market
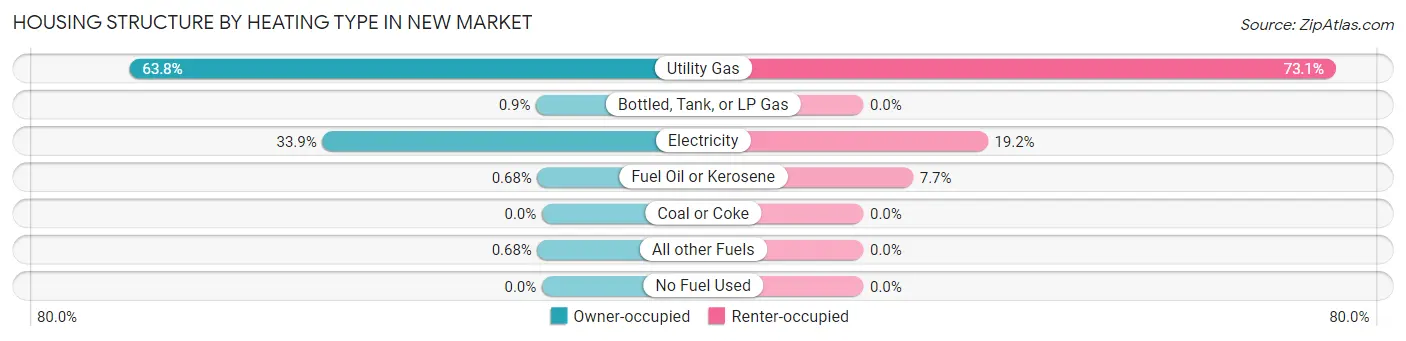
| Heating Type | Owner-occupied | Renter-occupied |
| Utility Gas | 282 (63.8%) | 19 (73.1%) |
| Bottled, Tank, or LP Gas | 4 (0.9%) | 0 (0.0%) |
| Electricity | 150 (33.9%) | 5 (19.2%) |
| Fuel Oil or Kerosene | 3 (0.7%) | 2 (7.7%) |
| Coal or Coke | 0 (0.0%) | 0 (0.0%) |
| All other Fuels | 3 (0.7%) | 0 (0.0%) |
| No Fuel Used | 0 (0.0%) | 0 (0.0%) |
| Total | 442 (100.0%) | 26 (100.0%) |
Household Vehicle Usage in New Market
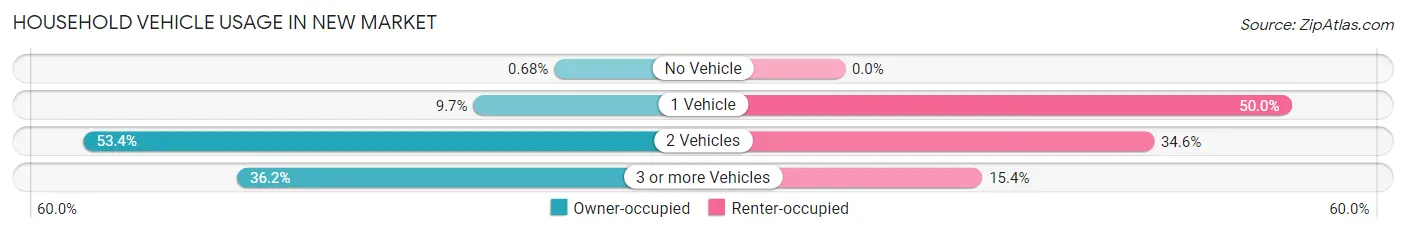
| Vehicles per Household | Owner-occupied | Renter-occupied |
| No Vehicle | 3 (0.7%) | 0 (0.0%) |
| 1 Vehicle | 43 (9.7%) | 13 (50.0%) |
| 2 Vehicles | 236 (53.4%) | 9 (34.6%) |
| 3 or more Vehicles | 160 (36.2%) | 4 (15.4%) |
| Total | 442 (100.0%) | 26 (100.0%) |
Real Estate & Mortgages in New Market
Real Estate and Mortgage Overview in New Market
| Characteristic | Without Mortgage | With Mortgage |
| Housing Units | 79 | 363 |
| Median Property Value | $452,500 | $616,700 |
| Median Household Income | $95,417 | $270 |
| Monthly Housing Costs | $750 | $184 |
| Real Estate Taxes | $4,750 | $0 |
Property Value by Mortgage Status in New Market
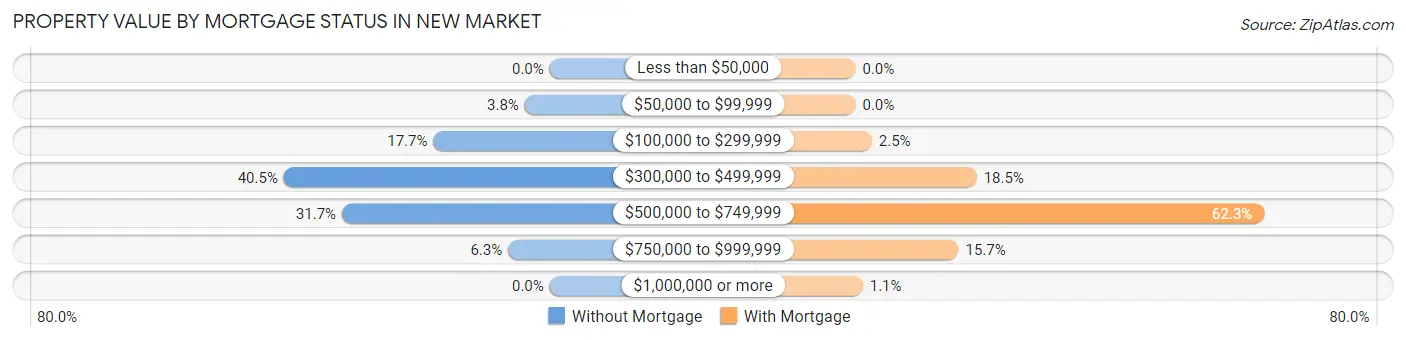
| Property Value | Without Mortgage | With Mortgage |
| Less than $50,000 | 0 (0.0%) | 0 (0.0%) |
| $50,000 to $99,999 | 3 (3.8%) | 0 (0.0%) |
| $100,000 to $299,999 | 14 (17.7%) | 9 (2.5%) |
| $300,000 to $499,999 | 32 (40.5%) | 67 (18.5%) |
| $500,000 to $749,999 | 25 (31.7%) | 226 (62.3%) |
| $750,000 to $999,999 | 5 (6.3%) | 57 (15.7%) |
| $1,000,000 or more | 0 (0.0%) | 4 (1.1%) |
| Total | 79 (100.0%) | 363 (100.0%) |
Household Income by Mortgage Status in New Market
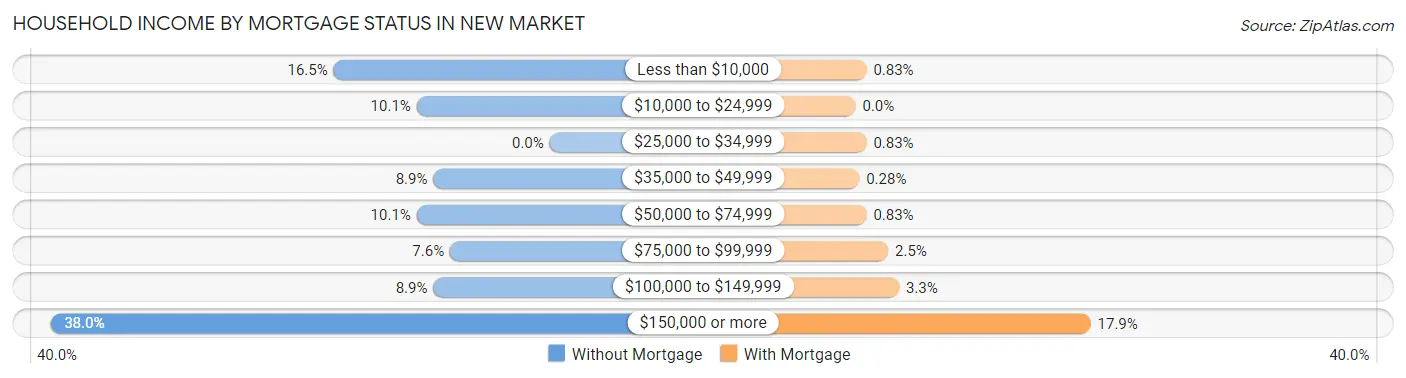
| Household Income | Without Mortgage | With Mortgage |
| Less than $10,000 | 13 (16.5%) | 3 (0.8%) |
| $10,000 to $24,999 | 8 (10.1%) | 0 (0.0%) |
| $25,000 to $34,999 | 0 (0.0%) | 3 (0.8%) |
| $35,000 to $49,999 | 7 (8.9%) | 1 (0.3%) |
| $50,000 to $74,999 | 8 (10.1%) | 3 (0.8%) |
| $75,000 to $99,999 | 6 (7.6%) | 9 (2.5%) |
| $100,000 to $149,999 | 7 (8.9%) | 12 (3.3%) |
| $150,000 or more | 30 (38.0%) | 65 (17.9%) |
| Total | 79 (100.0%) | 363 (100.0%) |
Property Value to Household Income Ratio in New Market
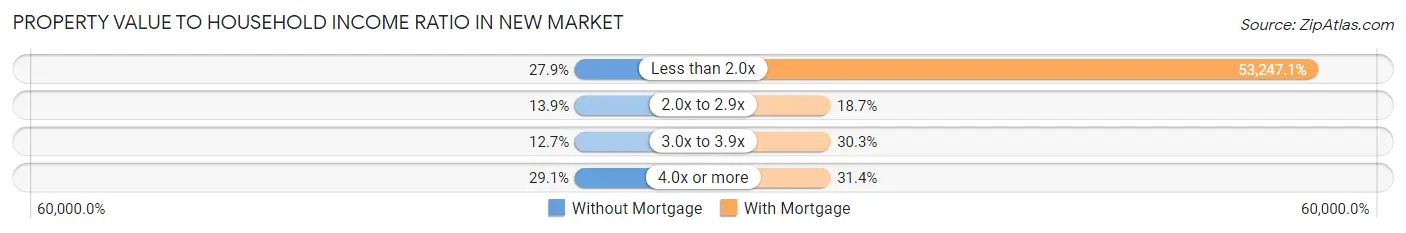
| Value-to-Income Ratio | Without Mortgage | With Mortgage |
| Less than 2.0x | 22 (27.9%) | 193,287 (53,247.1%) |
| 2.0x to 2.9x | 11 (13.9%) | 68 (18.7%) |
| 3.0x to 3.9x | 10 (12.7%) | 110 (30.3%) |
| 4.0x or more | 23 (29.1%) | 114 (31.4%) |
| Total | 79 (100.0%) | 363 (100.0%) |
Real Estate Taxes by Mortgage Status in New Market
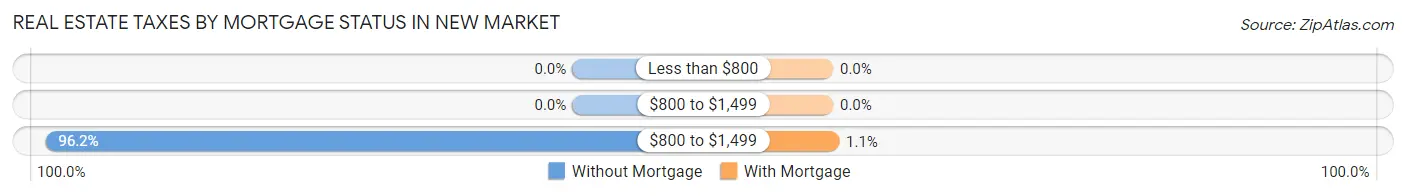
| Property Taxes | Without Mortgage | With Mortgage |
| Less than $800 | 0 (0.0%) | 0 (0.0%) |
| $800 to $1,499 | 0 (0.0%) | 0 (0.0%) |
| $800 to $1,499 | 76 (96.2%) | 4 (1.1%) |
| Total | 79 (100.0%) | 363 (100.0%) |
Health & Disability in New Market
Health Insurance Coverage by Age in New Market
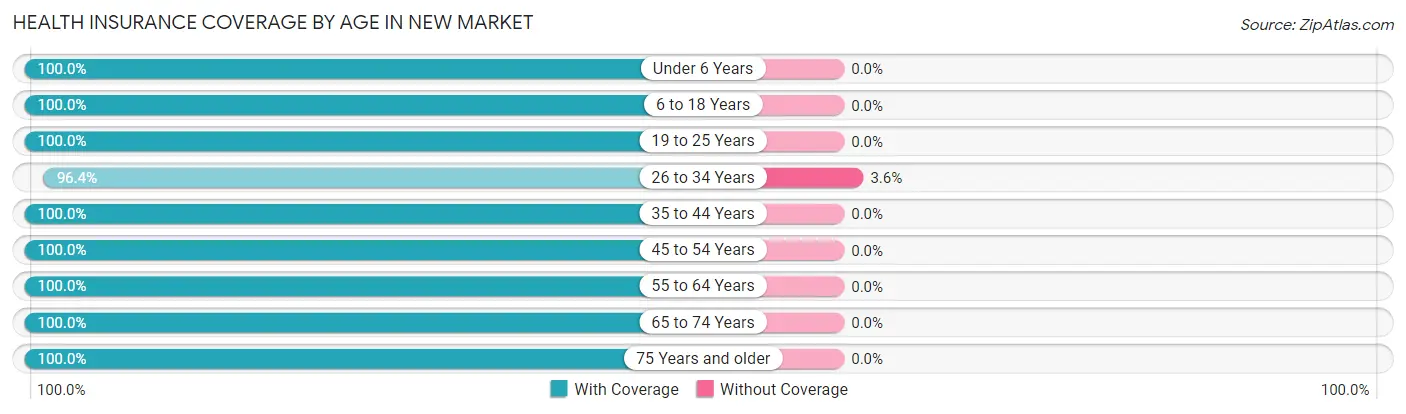
| Age Bracket | With Coverage | Without Coverage |
| Under 6 Years | 103 (100.0%) | 0 (0.0%) |
| 6 to 18 Years | 447 (100.0%) | 0 (0.0%) |
| 19 to 25 Years | 120 (100.0%) | 0 (0.0%) |
| 26 to 34 Years | 81 (96.4%) | 3 (3.6%) |
| 35 to 44 Years | 276 (100.0%) | 0 (0.0%) |
| 45 to 54 Years | 287 (100.0%) | 0 (0.0%) |
| 55 to 64 Years | 109 (100.0%) | 0 (0.0%) |
| 65 to 74 Years | 67 (100.0%) | 0 (0.0%) |
| 75 Years and older | 41 (100.0%) | 0 (0.0%) |
| Total | 1,531 (99.8%) | 3 (0.2%) |
Health Insurance Coverage by Citizenship Status in New Market
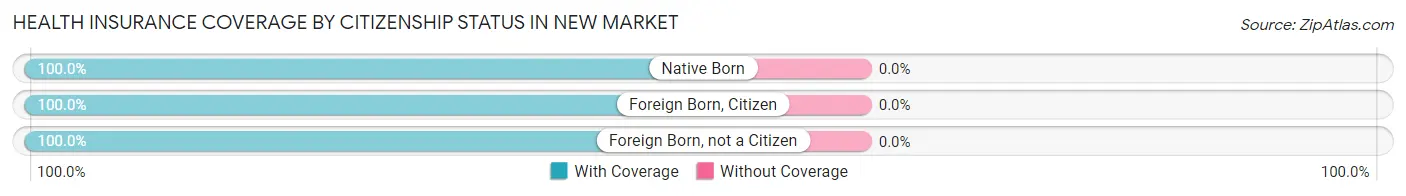
| Citizenship Status | With Coverage | Without Coverage |
| Native Born | 103 (100.0%) | 0 (0.0%) |
| Foreign Born, Citizen | 447 (100.0%) | 0 (0.0%) |
| Foreign Born, not a Citizen | 120 (100.0%) | 0 (0.0%) |
Health Insurance Coverage by Household Income in New Market
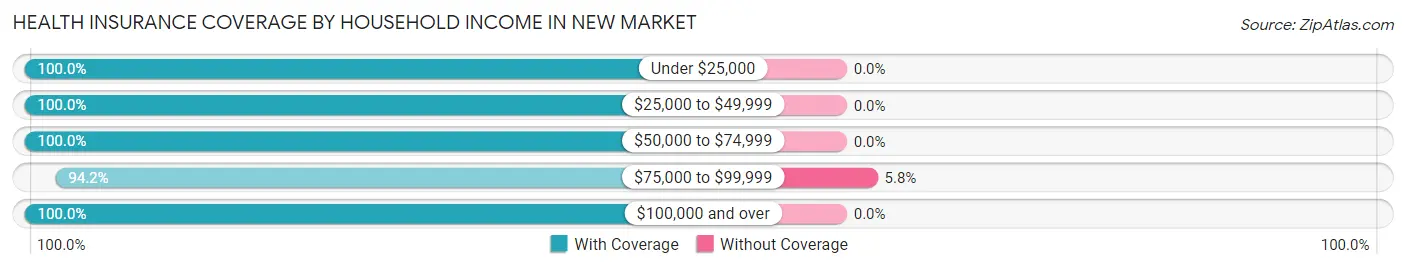
| Household Income | With Coverage | Without Coverage |
| Under $25,000 | 28 (100.0%) | 0 (0.0%) |
| $25,000 to $49,999 | 24 (100.0%) | 0 (0.0%) |
| $50,000 to $74,999 | 47 (100.0%) | 0 (0.0%) |
| $75,000 to $99,999 | 49 (94.2%) | 3 (5.8%) |
| $100,000 and over | 1,383 (100.0%) | 0 (0.0%) |
Public vs Private Health Insurance Coverage by Age in New Market
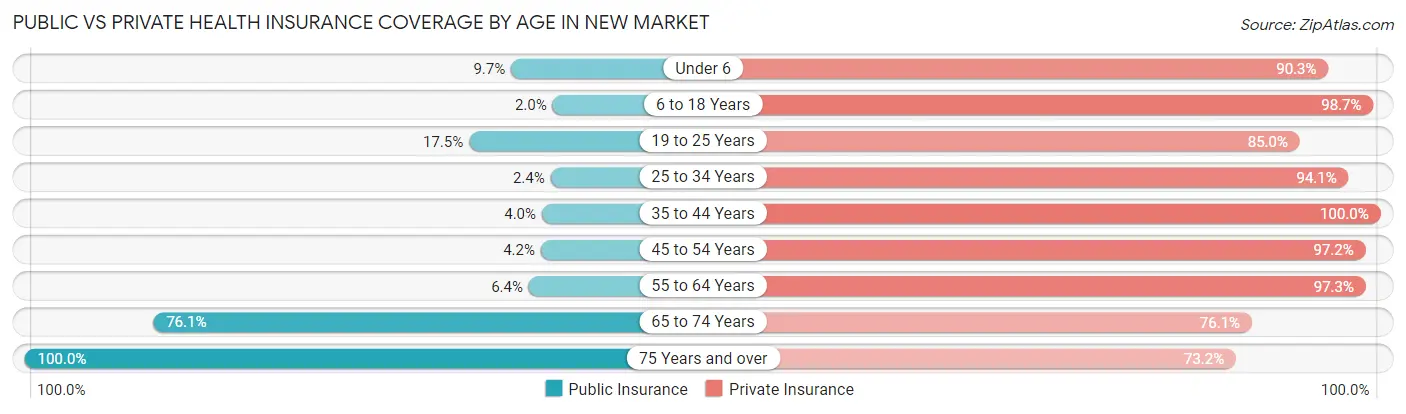
| Age Bracket | Public Insurance | Private Insurance |
| Under 6 | 10 (9.7%) | 93 (90.3%) |
| 6 to 18 Years | 9 (2.0%) | 441 (98.7%) |
| 19 to 25 Years | 21 (17.5%) | 102 (85.0%) |
| 25 to 34 Years | 2 (2.4%) | 79 (94.1%) |
| 35 to 44 Years | 11 (4.0%) | 276 (100.0%) |
| 45 to 54 Years | 12 (4.2%) | 279 (97.2%) |
| 55 to 64 Years | 7 (6.4%) | 106 (97.3%) |
| 65 to 74 Years | 51 (76.1%) | 51 (76.1%) |
| 75 Years and over | 41 (100.0%) | 30 (73.2%) |
| Total | 164 (10.7%) | 1,457 (95.0%) |
Disability Status by Sex by Age in New Market
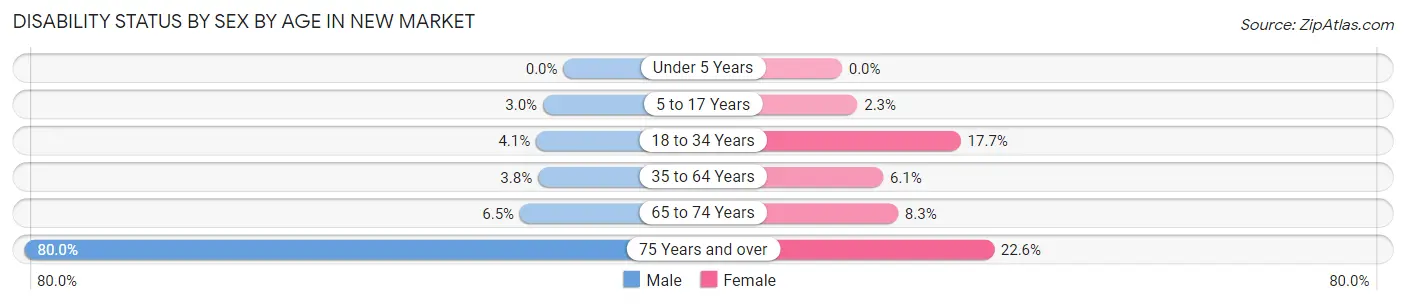
| Age Bracket | Male | Female |
| Under 5 Years | 0 (0.0%) | 0 (0.0%) |
| 5 to 17 Years | 6 (3.0%) | 6 (2.3%) |
| 18 to 34 Years | 6 (4.1%) | 15 (17.6%) |
| 35 to 64 Years | 13 (3.8%) | 20 (6.1%) |
| 65 to 74 Years | 2 (6.5%) | 3 (8.3%) |
| 75 Years and over | 8 (80.0%) | 7 (22.6%) |
Disability Class by Sex by Age in New Market
Disability Class: Hearing Difficulty
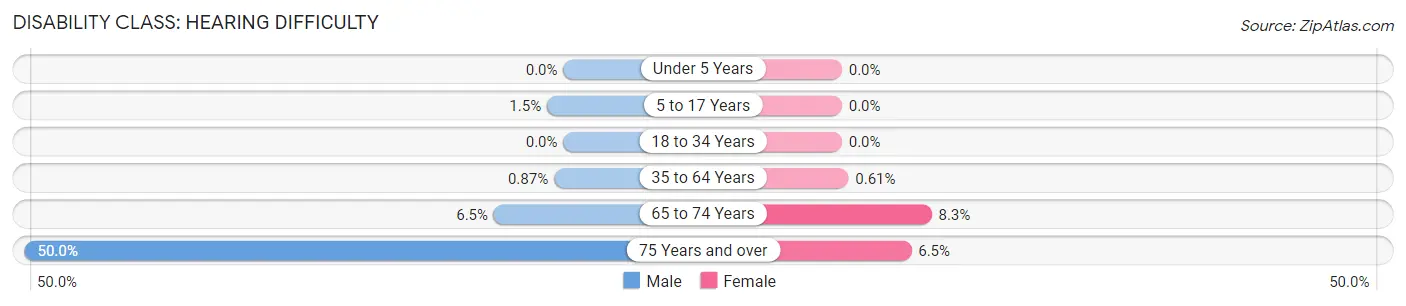
| Age Bracket | Male | Female |
| Under 5 Years | 0 (0.0%) | 0 (0.0%) |
| 5 to 17 Years | 3 (1.5%) | 0 (0.0%) |
| 18 to 34 Years | 0 (0.0%) | 0 (0.0%) |
| 35 to 64 Years | 3 (0.9%) | 2 (0.6%) |
| 65 to 74 Years | 2 (6.5%) | 3 (8.3%) |
| 75 Years and over | 5 (50.0%) | 2 (6.5%) |
Disability Class: Vision Difficulty
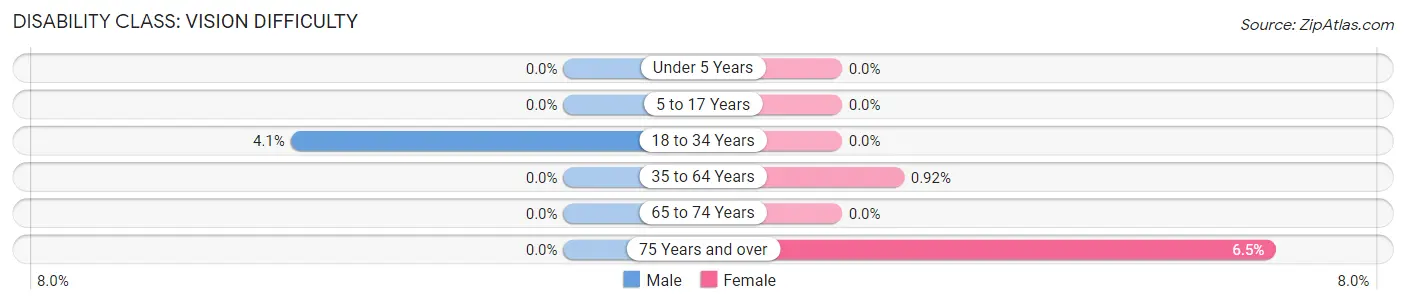
| Age Bracket | Male | Female |
| Under 5 Years | 0 (0.0%) | 0 (0.0%) |
| 5 to 17 Years | 0 (0.0%) | 0 (0.0%) |
| 18 to 34 Years | 6 (4.1%) | 0 (0.0%) |
| 35 to 64 Years | 0 (0.0%) | 3 (0.9%) |
| 65 to 74 Years | 0 (0.0%) | 0 (0.0%) |
| 75 Years and over | 0 (0.0%) | 2 (6.5%) |
Disability Class: Cognitive Difficulty
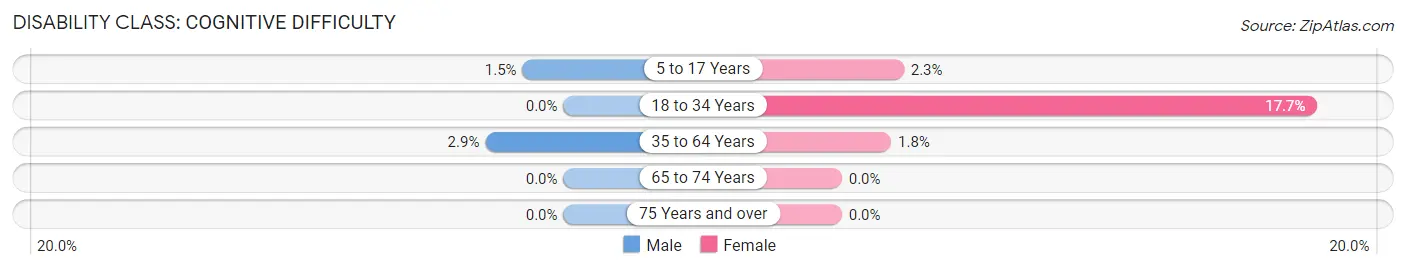
| Age Bracket | Male | Female |
| 5 to 17 Years | 3 (1.5%) | 6 (2.3%) |
| 18 to 34 Years | 0 (0.0%) | 15 (17.6%) |
| 35 to 64 Years | 10 (2.9%) | 6 (1.8%) |
| 65 to 74 Years | 0 (0.0%) | 0 (0.0%) |
| 75 Years and over | 0 (0.0%) | 0 (0.0%) |
Disability Class: Ambulatory Difficulty
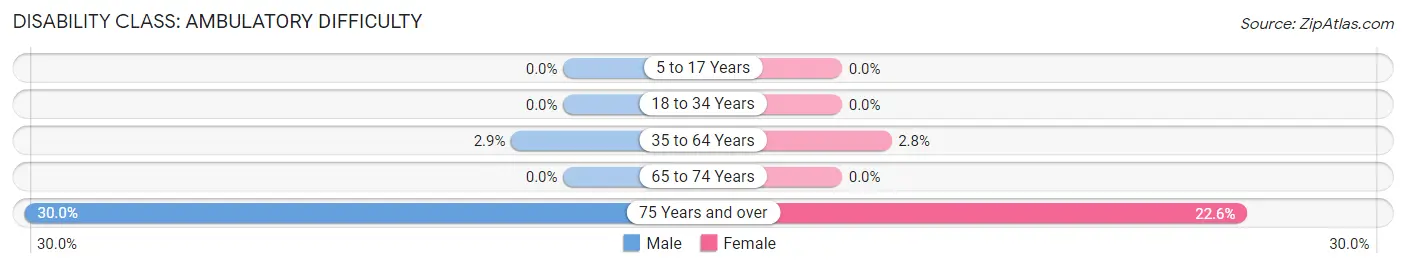
| Age Bracket | Male | Female |
| 5 to 17 Years | 0 (0.0%) | 0 (0.0%) |
| 18 to 34 Years | 0 (0.0%) | 0 (0.0%) |
| 35 to 64 Years | 10 (2.9%) | 9 (2.8%) |
| 65 to 74 Years | 0 (0.0%) | 0 (0.0%) |
| 75 Years and over | 3 (30.0%) | 7 (22.6%) |
Disability Class: Self-Care Difficulty
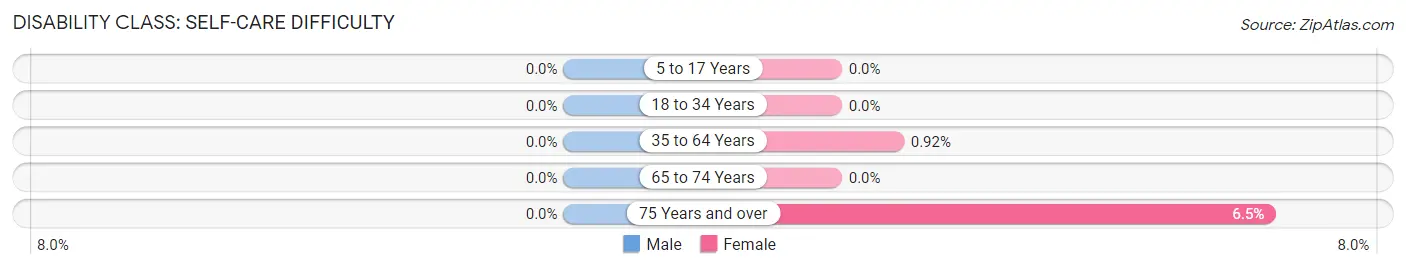
| Age Bracket | Male | Female |
| 5 to 17 Years | 0 (0.0%) | 0 (0.0%) |
| 18 to 34 Years | 0 (0.0%) | 0 (0.0%) |
| 35 to 64 Years | 0 (0.0%) | 3 (0.9%) |
| 65 to 74 Years | 0 (0.0%) | 0 (0.0%) |
| 75 Years and over | 0 (0.0%) | 2 (6.5%) |
Technology Access in New Market
Computing Device Access in New Market
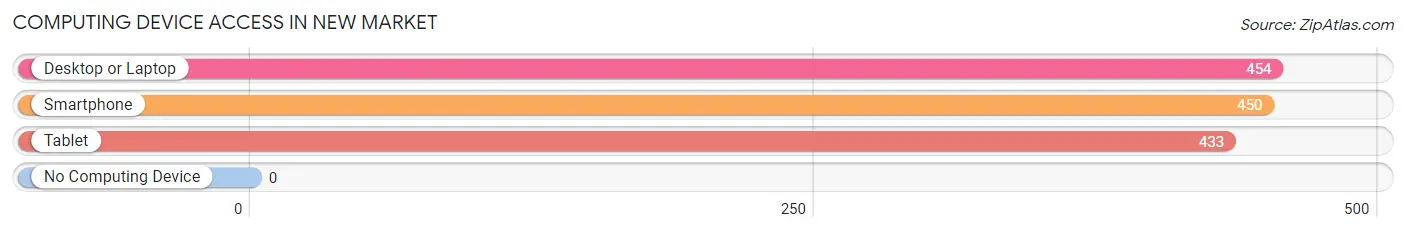
| Device Type | # Households | % Households |
| Desktop or Laptop | 454 | 97.0% |
| Smartphone | 450 | 96.2% |
| Tablet | 433 | 92.5% |
| No Computing Device | 0 | 0.0% |
| Total | 468 | 100.0% |
Internet Access in New Market
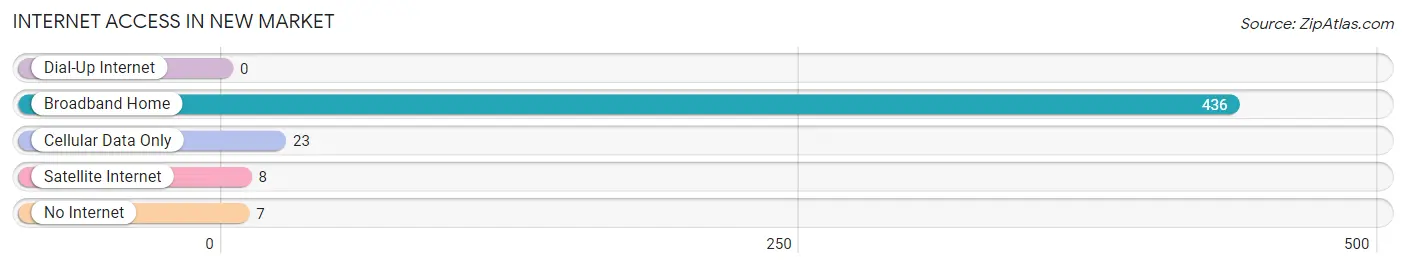
| Internet Type | # Households | % Households |
| Dial-Up Internet | 0 | 0.0% |
| Broadband Home | 436 | 93.2% |
| Cellular Data Only | 23 | 4.9% |
| Satellite Internet | 8 | 1.7% |
| No Internet | 7 | 1.5% |
| Total | 468 | 100.0% |
New Market Summary
New Market is a small town located in Frederick County, Maryland, United States. It is situated in the northern part of the state, approximately 40 miles northwest of Baltimore and 30 miles northeast of Washington, D.C. The town has a population of approximately 1,500 people and covers an area of 0.7 square miles.
History
New Market was founded in 1790 by a group of German settlers who had migrated from Pennsylvania. The town was originally known as “New Market Crossroads” and was located at the intersection of two major roads, the National Road and the Old Monocacy Road. The town was officially incorporated in 1820 and was named after the nearby New Market Race Course, which was established in 1791.
The town was an important stop on the National Road, which was the first federally funded highway in the United States. The road was built in the early 19th century to connect the eastern seaboard with the Ohio River Valley. The town was also an important stop on the Baltimore and Ohio Railroad, which was built in the mid-19th century.
The town was home to several important industries in the 19th and early 20th centuries, including a flour mill, a sawmill, a brickyard, and a canning factory. The town also had several stores, a hotel, and a post office.
Geography
New Market is located in the northern part of Frederick County, Maryland, approximately 40 miles northwest of Baltimore and 30 miles northeast of Washington, D.C. The town is situated in the Catoctin Valley, which is part of the Appalachian Mountains. The town is surrounded by rolling hills and farmland.
The town is located at the intersection of two major roads, the National Road and the Old Monocacy Road. The town is also located near the Monocacy River, which flows through the town.
Economy
The economy of New Market is largely based on agriculture and tourism. The town is home to several farms, which produce a variety of crops, including corn, soybeans, wheat, and hay. The town is also home to several wineries, which produce a variety of wines.
The town is also a popular tourist destination, as it is located near several historical sites, including the Monocacy National Battlefield and the National Road. The town is also home to several antique shops, art galleries, and restaurants.
Demographics
As of the 2010 census, the population of New Market was 1,500 people. The town is predominantly white, with approximately 95% of the population identifying as white. The town also has a small Hispanic population, with approximately 3% of the population identifying as Hispanic or Latino. The median household income in the town is approximately $50,000.
Common Questions
What is Per Capita Income in New Market?
Per Capita income in New Market is $65,068.
What is the Median Family Income in New Market?
Median Family Income in New Market is $193,009.
What is the Median Household income in New Market?
Median Household Income in New Market is $190,750.
What is Income or Wage Gap in New Market?
Income or Wage Gap in New Market is 33.4%.
Women in New Market earn 66.6 cents for every dollar earned by a man.
What is Inequality or Gini Index in New Market?
Inequality or Gini Index in New Market is 0.37.
What is the Total Population of New Market?
Total Population of New Market is 1,534.
What is the Total Male Population of New Market?
Total Male Population of New Market is 745.
What is the Total Female Population of New Market?
Total Female Population of New Market is 789.
What is the Ratio of Males per 100 Females in New Market?
There are 94.42 Males per 100 Females in New Market.
What is the Ratio of Females per 100 Males in New Market?
There are 105.91 Females per 100 Males in New Market.
What is the Median Population Age in New Market?
Median Population Age in New Market is 35.5 Years.
What is the Average Family Size in New Market
Average Family Size in New Market is 3.5 People.
What is the Average Household Size in New Market
Average Household Size in New Market is 3.3 People.
How Large is the Labor Force in New Market?
There are 827 People in the Labor Forcein in New Market.
What is the Percentage of People in the Labor Force in New Market?
78.9% of People are in the Labor Force in New Market.
What is the Unemployment Rate in New Market?
Unemployment Rate in New Market is 3.5%.