Emmitsburg, MD Map & Demographics
Emmitsburg Map
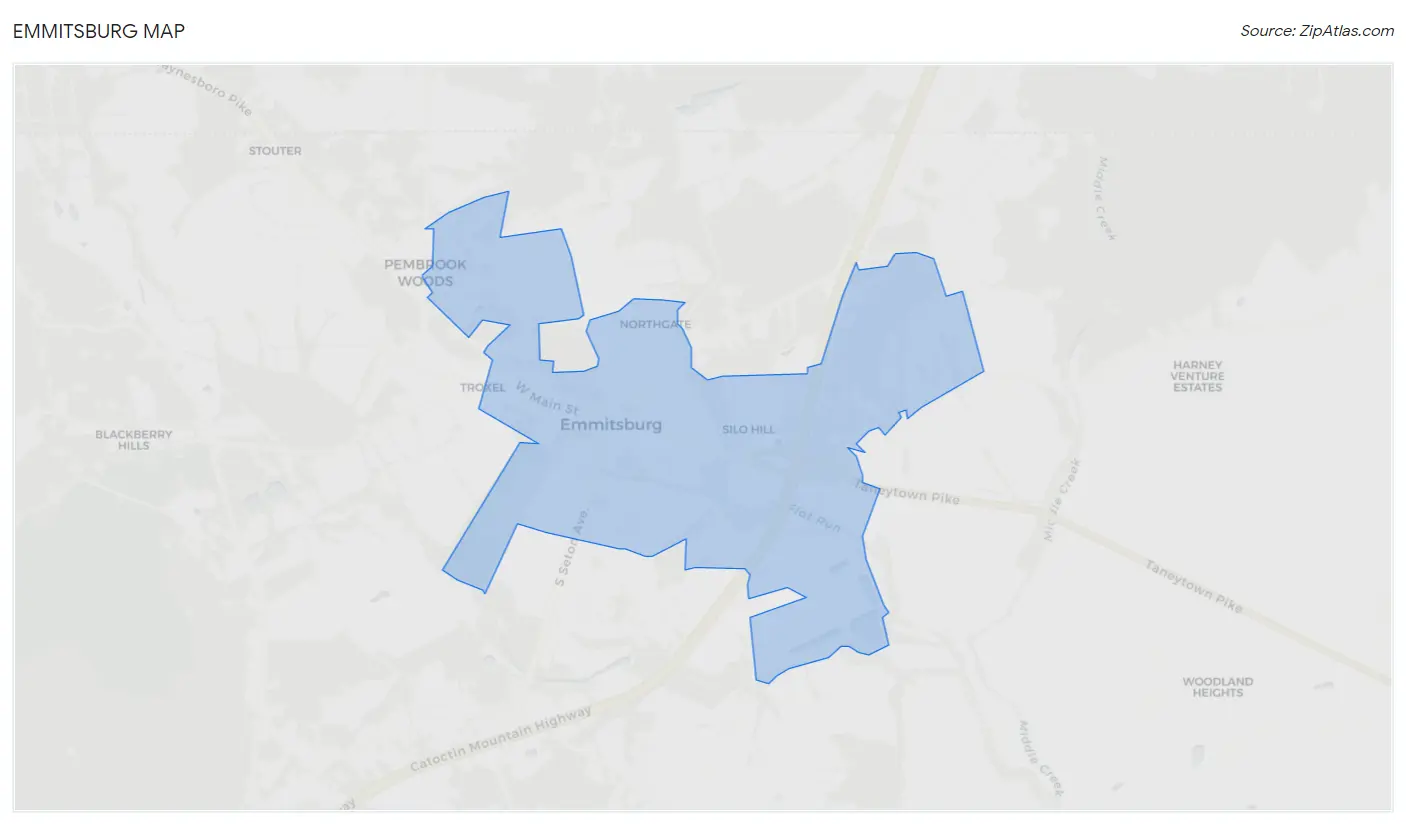
Emmitsburg Overview
$33,379
PER CAPITA INCOME
$88,879
AVG FAMILY INCOME
$74,563
AVG HOUSEHOLD INCOME
39.0%
WAGE / INCOME GAP [ % ]
61.0¢/ $1
WAGE / INCOME GAP [ $ ]
0.41
INEQUALITY / GINI INDEX
2,818
TOTAL POPULATION
1,411
MALE POPULATION
1,407
FEMALE POPULATION
100.28
MALES / 100 FEMALES
99.72
FEMALES / 100 MALES
39.5
MEDIAN AGE
3.0
AVG FAMILY SIZE
2.5
AVG HOUSEHOLD SIZE
1,532
LABOR FORCE [ PEOPLE ]
63.9%
PERCENT IN LABOR FORCE
4.0%
UNEMPLOYMENT RATE
Emmitsburg Zip Codes
Income in Emmitsburg
Income Overview in Emmitsburg
Per Capita Income in Emmitsburg is $33,379, while median incomes of families and households are $88,879 and $74,563 respectively.
| Characteristic | Number | Measure |
| Per Capita Income | 2,818 | $33,379 |
| Median Family Income | 682 | $88,879 |
| Mean Family Income | 682 | $103,158 |
| Median Household Income | 1,083 | $74,563 |
| Mean Household Income | 1,083 | $84,287 |
| Income Deficit | 682 | $0 |
| Wage / Income Gap (%) | 2,818 | 39.02% |
| Wage / Income Gap ($) | 2,818 | 60.98¢ per $1 |
| Gini / Inequality Index | 2,818 | 0.41 |
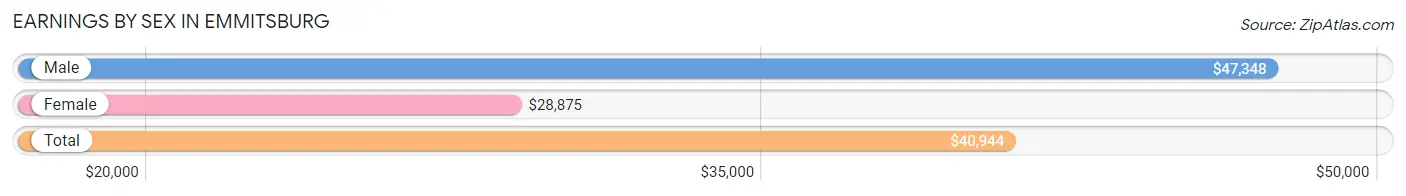
Earnings by Sex in Emmitsburg
Average Earnings in Emmitsburg are $40,944, $47,348 for men and $28,875 for women, a difference of 39.0%.
| Sex | Number | Average Earnings |
| Male | 849 (54.3%) | $47,348 |
| Female | 715 (45.7%) | $28,875 |
| Total | 1,564 (100.0%) | $40,944 |
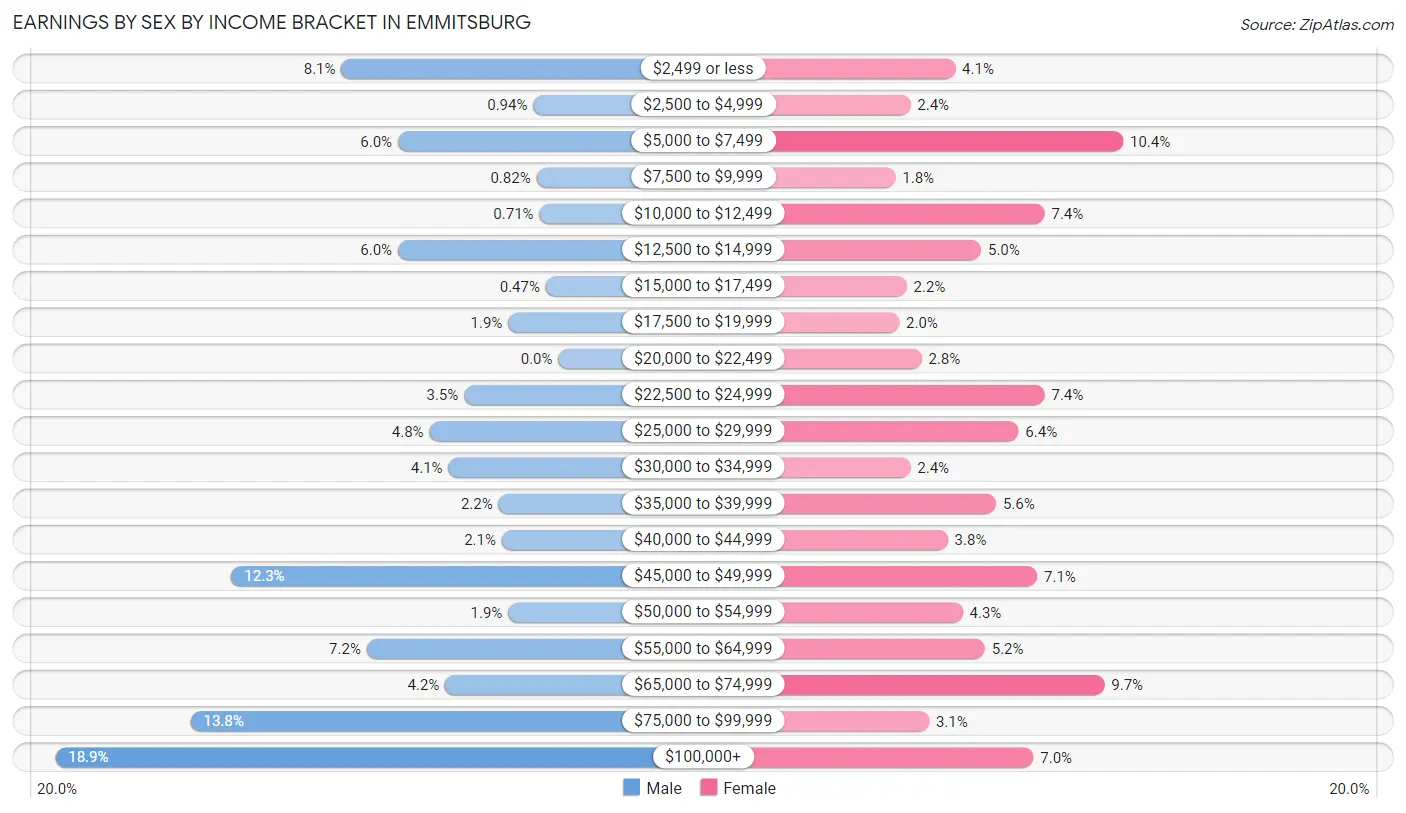
Earnings by Sex by Income Bracket in Emmitsburg
The most common earnings brackets in Emmitsburg are $100,000+ for men (160 | 18.9%) and $5,000 to $7,499 for women (74 | 10.3%).
| Income | Male | Female |
| $2,499 or less | 69 (8.1%) | 29 (4.1%) |
| $2,500 to $4,999 | 8 (0.9%) | 17 (2.4%) |
| $5,000 to $7,499 | 51 (6.0%) | 74 (10.3%) |
| $7,500 to $9,999 | 7 (0.8%) | 13 (1.8%) |
| $10,000 to $12,499 | 6 (0.7%) | 53 (7.4%) |
| $12,500 to $14,999 | 51 (6.0%) | 36 (5.0%) |
| $15,000 to $17,499 | 4 (0.5%) | 16 (2.2%) |
| $17,500 to $19,999 | 16 (1.9%) | 14 (2.0%) |
| $20,000 to $22,499 | 0 (0.0%) | 20 (2.8%) |
| $22,500 to $24,999 | 30 (3.5%) | 53 (7.4%) |
| $25,000 to $29,999 | 41 (4.8%) | 46 (6.4%) |
| $30,000 to $34,999 | 35 (4.1%) | 17 (2.4%) |
| $35,000 to $39,999 | 19 (2.2%) | 40 (5.6%) |
| $40,000 to $44,999 | 18 (2.1%) | 27 (3.8%) |
| $45,000 to $49,999 | 104 (12.2%) | 51 (7.1%) |
| $50,000 to $54,999 | 16 (1.9%) | 31 (4.3%) |
| $55,000 to $64,999 | 61 (7.2%) | 37 (5.2%) |
| $65,000 to $74,999 | 36 (4.2%) | 69 (9.7%) |
| $75,000 to $99,999 | 117 (13.8%) | 22 (3.1%) |
| $100,000+ | 160 (18.9%) | 50 (7.0%) |
| Total | 849 (100.0%) | 715 (100.0%) |
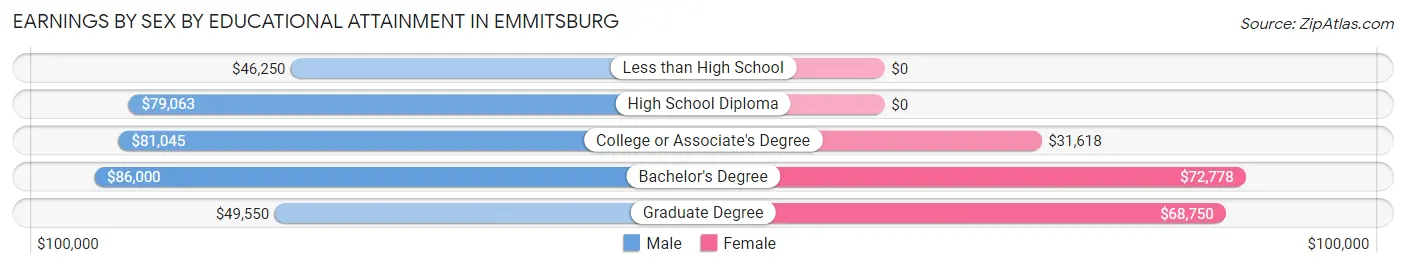
Earnings by Sex by Educational Attainment in Emmitsburg
Average earnings in Emmitsburg are $74,762 for men and $38,125 for women, a difference of 49.0%. Men with an educational attainment of bachelor's degree enjoy the highest average annual earnings of $86,000, while those with less than high school education earn the least with $46,250. Women with an educational attainment of bachelor's degree earn the most with the average annual earnings of $72,778, while those with college or associate's degree education have the smallest earnings of $31,618.
| Educational Attainment | Male Income | Female Income |
| Less than High School | $46,250 | $0 |
| High School Diploma | $79,063 | $0 |
| College or Associate's Degree | $81,045 | $31,618 |
| Bachelor's Degree | $86,000 | $72,778 |
| Graduate Degree | $49,550 | $68,750 |
| Total | $74,762 | $38,125 |
Family Income in Emmitsburg
Family Income Brackets in Emmitsburg
According to the Emmitsburg family income data, there are 150 families falling into the $100,000 to $149,999 income range, which is the most common income bracket and makes up 22.0% of all families.
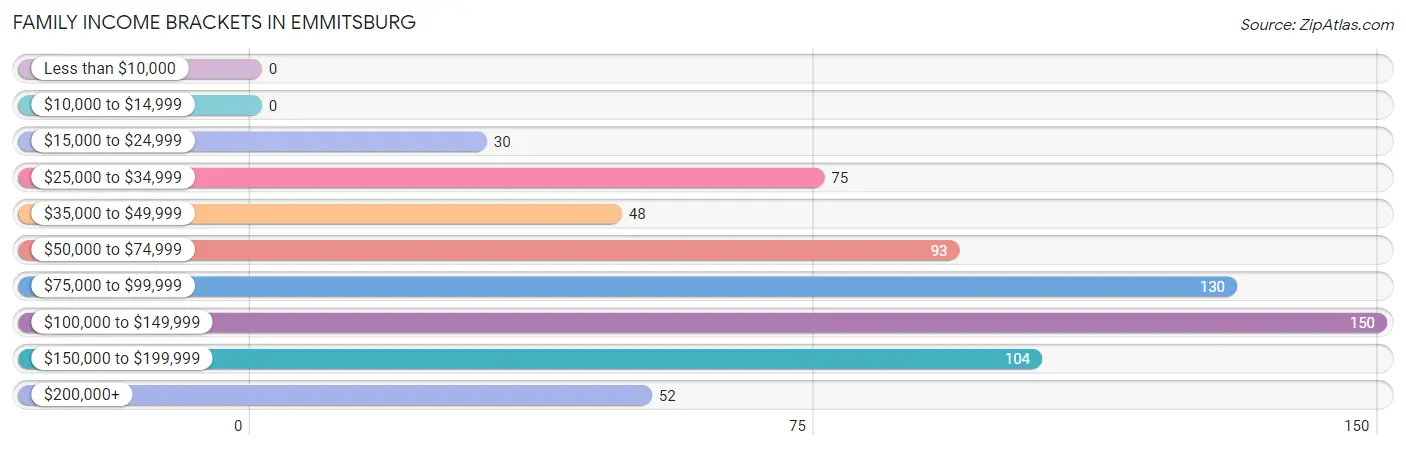
| Income Bracket | # Families | % Families |
| Less than $10,000 | 0 | 0.0% |
| $10,000 to $14,999 | 0 | 0.0% |
| $15,000 to $24,999 | 30 | 4.4% |
| $25,000 to $34,999 | 75 | 11.0% |
| $35,000 to $49,999 | 48 | 7.0% |
| $50,000 to $74,999 | 93 | 13.6% |
| $75,000 to $99,999 | 130 | 19.1% |
| $100,000 to $149,999 | 150 | 22.0% |
| $150,000 to $199,999 | 104 | 15.2% |
| $200,000+ | 52 | 7.6% |
Family Income by Famaliy Size in Emmitsburg
3-person families (195 | 28.6%) account for the highest median family income in Emmitsburg with $121,917 per family, while 3-person families (195 | 28.6%) have the highest median income of $40,639 per family member.
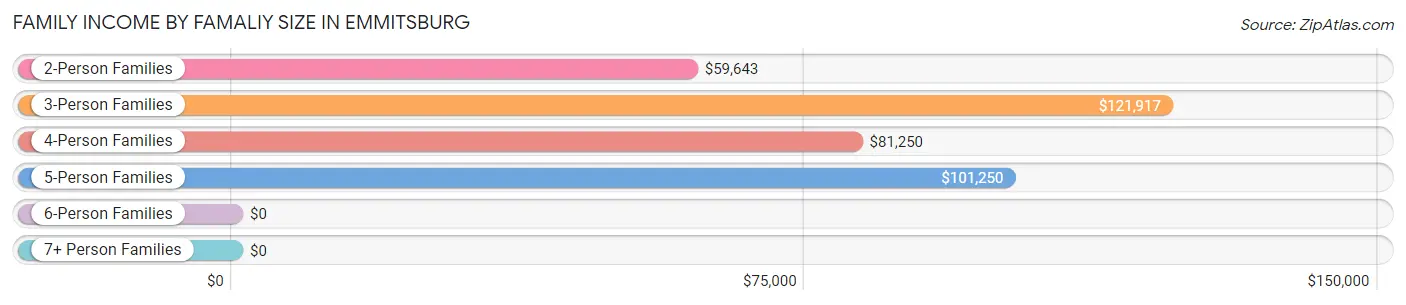
| Income Bracket | # Families | Median Income |
| 2-Person Families | 290 (42.5%) | $59,643 |
| 3-Person Families | 195 (28.6%) | $121,917 |
| 4-Person Families | 118 (17.3%) | $81,250 |
| 5-Person Families | 57 (8.4%) | $101,250 |
| 6-Person Families | 19 (2.8%) | $0 |
| 7+ Person Families | 3 (0.4%) | $0 |
| Total | 682 (100.0%) | $88,879 |
Family Income by Number of Earners in Emmitsburg
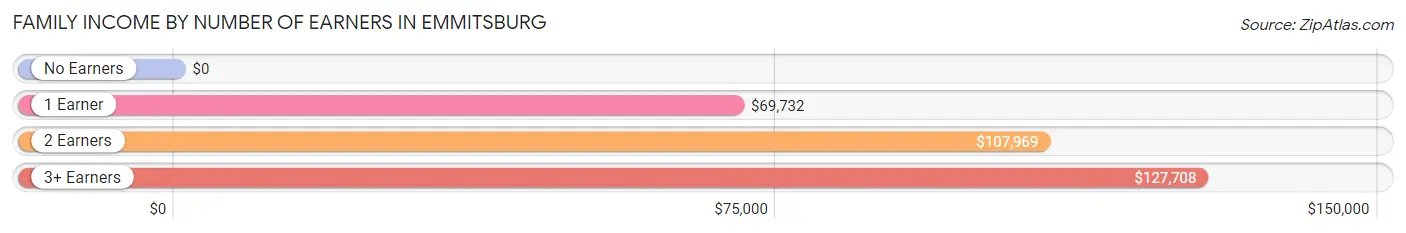
| Number of Earners | # Families | Median Income |
| No Earners | 109 (16.0%) | $0 |
| 1 Earner | 175 (25.7%) | $69,732 |
| 2 Earners | 303 (44.4%) | $107,969 |
| 3+ Earners | 95 (13.9%) | $127,708 |
| Total | 682 (100.0%) | $88,879 |
Household Income in Emmitsburg
Household Income Brackets in Emmitsburg
With 203 households falling in the category, the $100,000 to $149,999 income range is the most frequent in Emmitsburg, accounting for 18.7% of all households. In contrast, only 19 households (1.8%) fall into the $10,000 to $14,999 income bracket, making it the least populous group.
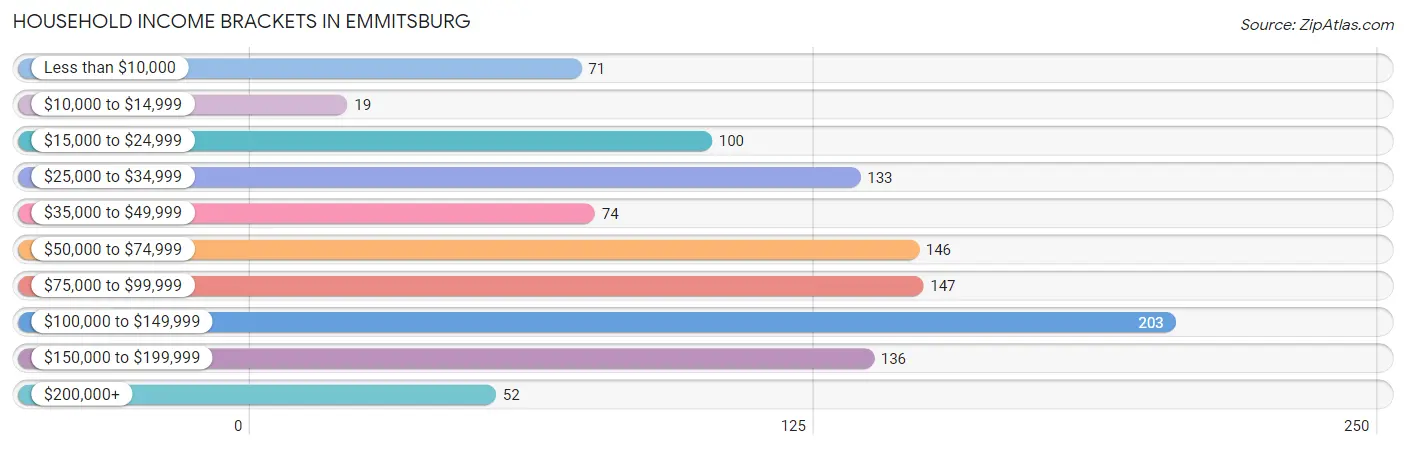
| Income Bracket | # Households | % Households |
| Less than $10,000 | 71 | 6.6% |
| $10,000 to $14,999 | 19 | 1.8% |
| $15,000 to $24,999 | 100 | 9.2% |
| $25,000 to $34,999 | 133 | 12.3% |
| $35,000 to $49,999 | 74 | 6.8% |
| $50,000 to $74,999 | 146 | 13.5% |
| $75,000 to $99,999 | 147 | 13.6% |
| $100,000 to $149,999 | 203 | 18.7% |
| $150,000 to $199,999 | 136 | 12.6% |
| $200,000+ | 52 | 4.8% |
Household Income by Householder Age in Emmitsburg
The median household income in Emmitsburg is $74,563, with the highest median household income of $126,250 found in the 45 to 64 years age bracket for the primary householder. A total of 359 households (33.2%) fall into this category. Meanwhile, the 15 to 24 years age bracket for the primary householder has the lowest median household income of $0, with 101 households (9.3%) in this group.
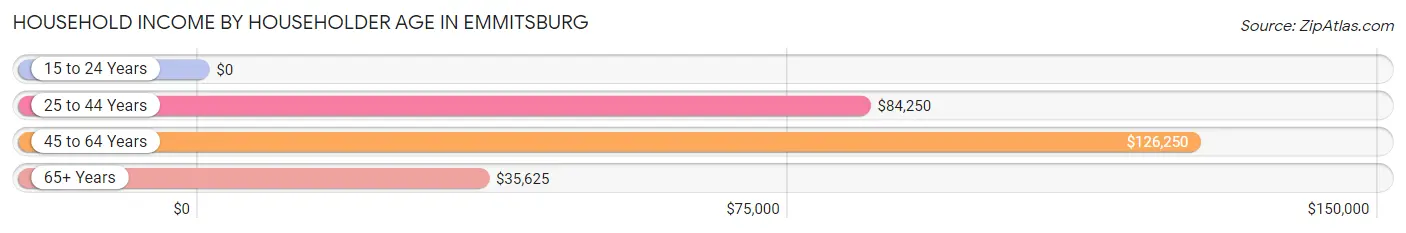
| Income Bracket | # Households | Median Income |
| 15 to 24 Years | 101 (9.3%) | $0 |
| 25 to 44 Years | 253 (23.4%) | $84,250 |
| 45 to 64 Years | 359 (33.2%) | $126,250 |
| 65+ Years | 370 (34.2%) | $35,625 |
| Total | 1,083 (100.0%) | $74,563 |
Poverty in Emmitsburg
Income Below Poverty by Sex and Age in Emmitsburg
With 10.1% poverty level for males and 14.6% for females among the residents of Emmitsburg, 18 to 24 year old males and 12 to 14 year old females are the most vulnerable to poverty, with 108 males (34.8%) and 13 females (44.8%) in their respective age groups living below the poverty level.
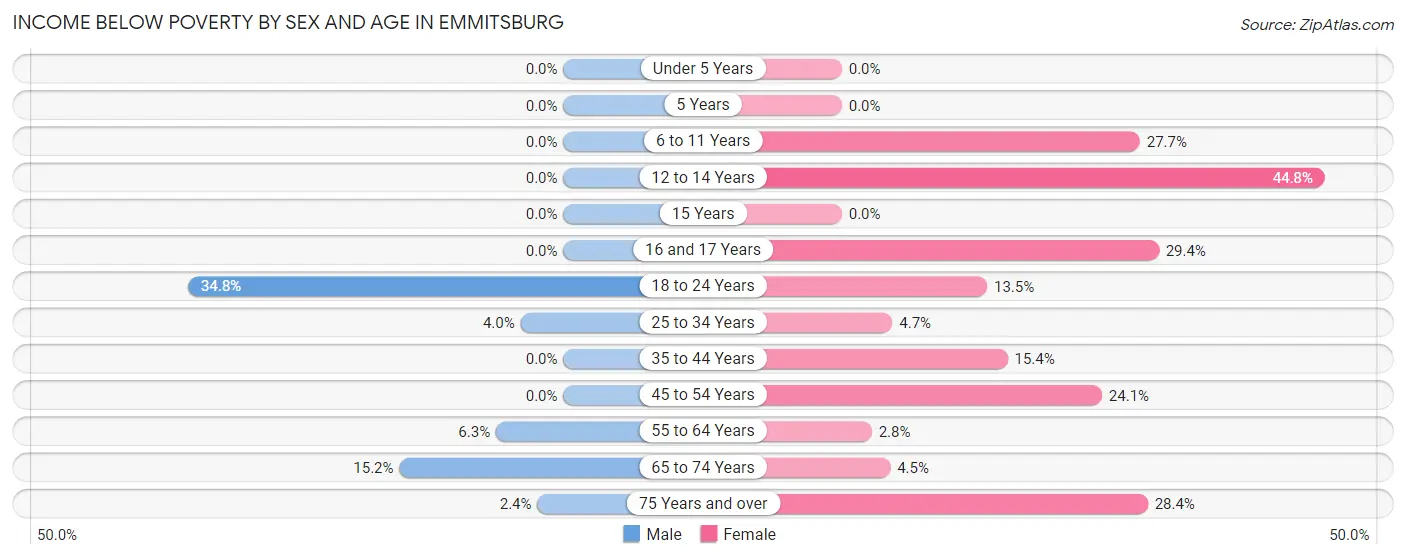
| Age Bracket | Male | Female |
| Under 5 Years | 0 (0.0%) | 0 (0.0%) |
| 5 Years | 0 (0.0%) | 0 (0.0%) |
| 6 to 11 Years | 0 (0.0%) | 26 (27.7%) |
| 12 to 14 Years | 0 (0.0%) | 13 (44.8%) |
| 15 Years | 0 (0.0%) | 0 (0.0%) |
| 16 and 17 Years | 0 (0.0%) | 5 (29.4%) |
| 18 to 24 Years | 108 (34.8%) | 24 (13.5%) |
| 25 to 34 Years | 5 (4.0%) | 9 (4.7%) |
| 35 to 44 Years | 0 (0.0%) | 22 (15.4%) |
| 45 to 54 Years | 0 (0.0%) | 42 (24.1%) |
| 55 to 64 Years | 8 (6.2%) | 4 (2.8%) |
| 65 to 74 Years | 14 (15.2%) | 7 (4.5%) |
| 75 Years and over | 4 (2.4%) | 44 (28.4%) |
| Total | 139 (10.1%) | 196 (14.6%) |
Income Above Poverty by Sex and Age in Emmitsburg
According to the poverty statistics in Emmitsburg, males aged under 5 years and females aged under 5 years are the age groups that are most secure financially, with 100.0% of males and 100.0% of females in these age groups living above the poverty line.
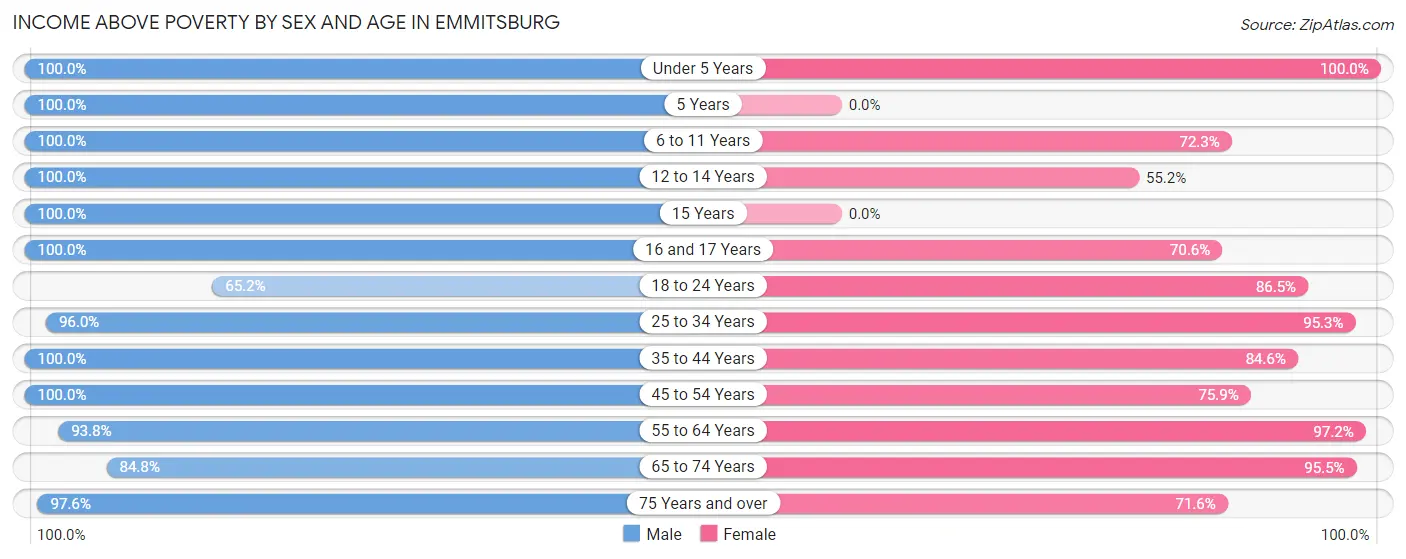
| Age Bracket | Male | Female |
| Under 5 Years | 102 (100.0%) | 57 (100.0%) |
| 5 Years | 5 (100.0%) | 0 (0.0%) |
| 6 to 11 Years | 61 (100.0%) | 68 (72.3%) |
| 12 to 14 Years | 42 (100.0%) | 16 (55.2%) |
| 15 Years | 14 (100.0%) | 0 (0.0%) |
| 16 and 17 Years | 47 (100.0%) | 12 (70.6%) |
| 18 to 24 Years | 202 (65.2%) | 154 (86.5%) |
| 25 to 34 Years | 121 (96.0%) | 183 (95.3%) |
| 35 to 44 Years | 85 (100.0%) | 121 (84.6%) |
| 45 to 54 Years | 203 (100.0%) | 132 (75.9%) |
| 55 to 64 Years | 120 (93.8%) | 140 (97.2%) |
| 65 to 74 Years | 78 (84.8%) | 149 (95.5%) |
| 75 Years and over | 162 (97.6%) | 111 (71.6%) |
| Total | 1,242 (89.9%) | 1,143 (85.4%) |
Income Below Poverty Among Married-Couple Families in Emmitsburg
The poverty statistics for married-couple families in Emmitsburg show that 0.8% or 4 of the total 498 families live below the poverty line. Families with no children have the highest poverty rate of 1.2%, comprising of 4 families. On the other hand, families with 1 or 2 children have the lowest poverty rate of 0.0%, which includes 0 families.
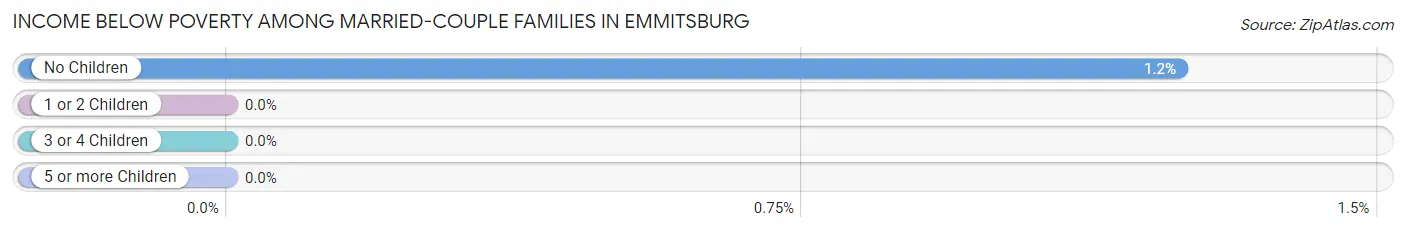
| Children | Above Poverty | Below Poverty |
| No Children | 318 (98.8%) | 4 (1.2%) |
| 1 or 2 Children | 115 (100.0%) | 0 (0.0%) |
| 3 or 4 Children | 61 (100.0%) | 0 (0.0%) |
| 5 or more Children | 0 (0.0%) | 0 (0.0%) |
| Total | 494 (99.2%) | 4 (0.8%) |
Income Below Poverty Among Single-Parent Households in Emmitsburg
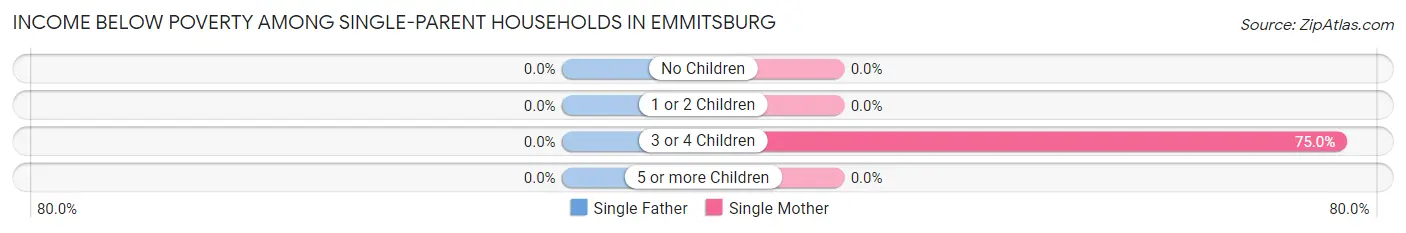
| Children | Single Father | Single Mother |
| No Children | 0 (0.0%) | 0 (0.0%) |
| 1 or 2 Children | 0 (0.0%) | 0 (0.0%) |
| 3 or 4 Children | 0 (0.0%) | 12 (75.0%) |
| 5 or more Children | 0 (0.0%) | 0 (0.0%) |
| Total | 0 (0.0%) | 12 (10.0%) |
Income Below Poverty Among Married-Couple vs Single-Parent Households in Emmitsburg
The poverty data for Emmitsburg shows that 4 of the married-couple family households (0.8%) and 12 of the single-parent households (6.5%) are living below the poverty level. Within the married-couple family households, those with no children have the highest poverty rate, with 4 households (1.2%) falling below the poverty line. Among the single-parent households, those with 3 or 4 children have the highest poverty rate, with 12 household (75.0%) living below poverty.
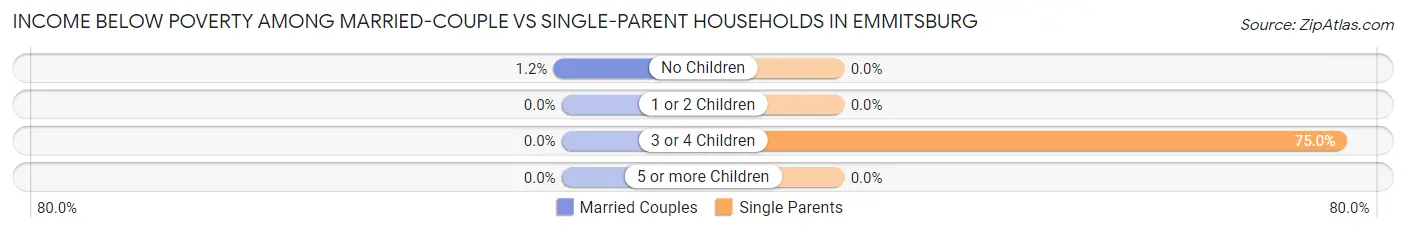
| Children | Married-Couple Families | Single-Parent Households |
| No Children | 4 (1.2%) | 0 (0.0%) |
| 1 or 2 Children | 0 (0.0%) | 0 (0.0%) |
| 3 or 4 Children | 0 (0.0%) | 12 (75.0%) |
| 5 or more Children | 0 (0.0%) | 0 (0.0%) |
| Total | 4 (0.8%) | 12 (6.5%) |
Race in Emmitsburg
The most populous races in Emmitsburg are White / Caucasian (2,372 | 84.2%), Hispanic or Latino (235 | 8.3%), and Black / African American (217 | 7.7%).
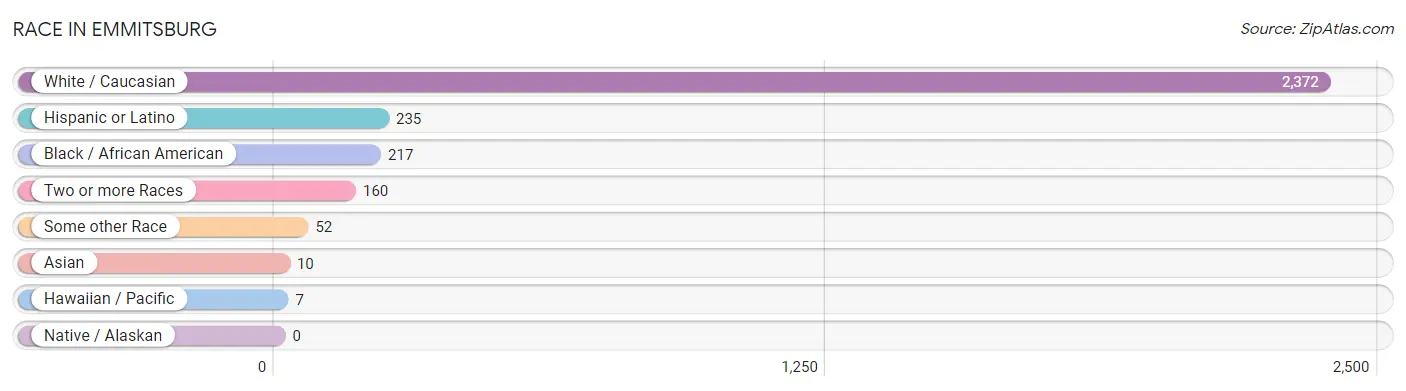
| Race | # Population | % Population |
| Asian | 10 | 0.4% |
| Black / African American | 217 | 7.7% |
| Hawaiian / Pacific | 7 | 0.3% |
| Hispanic or Latino | 235 | 8.3% |
| Native / Alaskan | 0 | 0.0% |
| White / Caucasian | 2,372 | 84.2% |
| Two or more Races | 160 | 5.7% |
| Some other Race | 52 | 1.8% |
| Total | 2,818 | 100.0% |
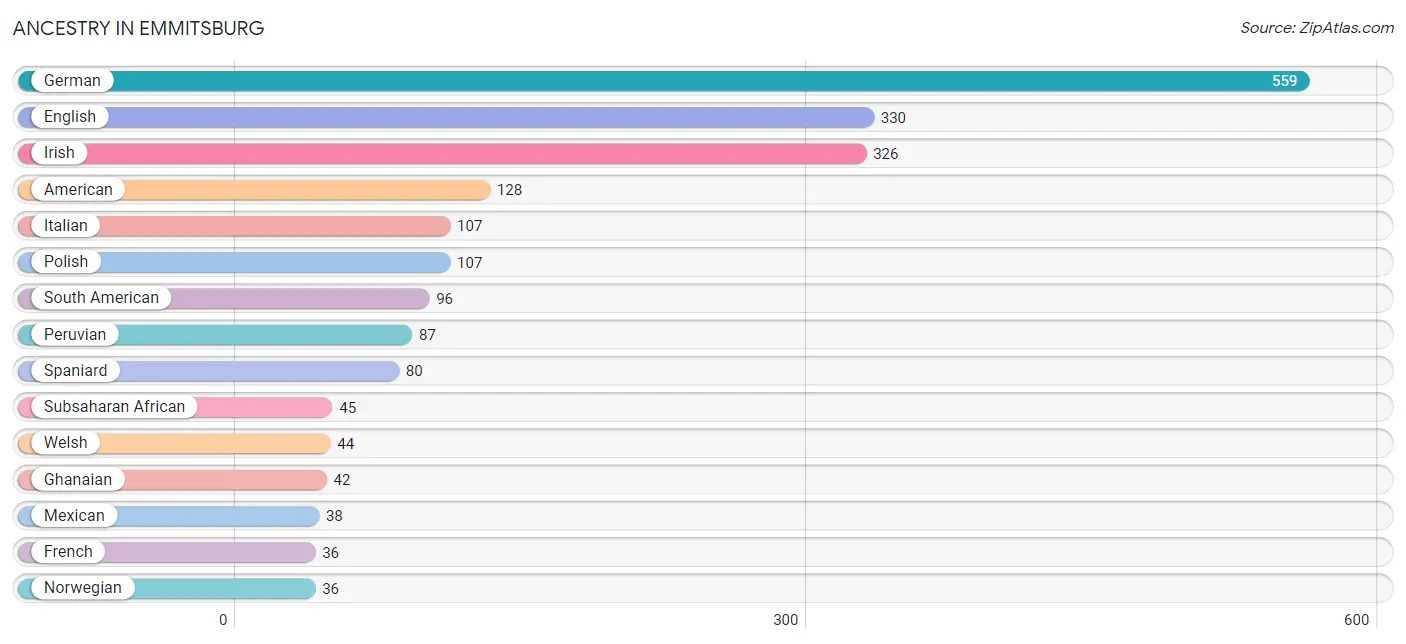
Ancestry in Emmitsburg
The most populous ancestries reported in Emmitsburg are German (559 | 19.8%), English (330 | 11.7%), Irish (326 | 11.6%), American (128 | 4.5%), and Italian (107 | 3.8%), together accounting for 51.5% of all Emmitsburg residents.
| Ancestry | # Population | % Population |
| American | 128 | 4.5% |
| Arab | 12 | 0.4% |
| Austrian | 3 | 0.1% |
| Bhutanese | 6 | 0.2% |
| British | 10 | 0.4% |
| Burmese | 8 | 0.3% |
| Canadian | 8 | 0.3% |
| Cherokee | 2 | 0.1% |
| Colombian | 9 | 0.3% |
| Dutch | 10 | 0.4% |
| Eastern European | 11 | 0.4% |
| English | 330 | 11.7% |
| European | 9 | 0.3% |
| French | 36 | 1.3% |
| German | 559 | 19.8% |
| Ghanaian | 42 | 1.5% |
| Hungarian | 3 | 0.1% |
| Indian (Asian) | 6 | 0.2% |
| Irish | 326 | 11.6% |
| Italian | 107 | 3.8% |
| Lebanese | 12 | 0.4% |
| Mexican | 38 | 1.3% |
| Native Hawaiian | 7 | 0.3% |
| Norwegian | 36 | 1.3% |
| Peruvian | 87 | 3.1% |
| Polish | 107 | 3.8% |
| Puerto Rican | 15 | 0.5% |
| Russian | 12 | 0.4% |
| Scotch-Irish | 26 | 0.9% |
| Scottish | 24 | 0.9% |
| South American | 96 | 3.4% |
| Spaniard | 80 | 2.8% |
| Sri Lankan | 10 | 0.4% |
| Subsaharan African | 45 | 1.6% |
| Swiss | 10 | 0.4% |
| Welsh | 44 | 1.6% |
| West Indian | 3 | 0.1% | View All 37 Rows |
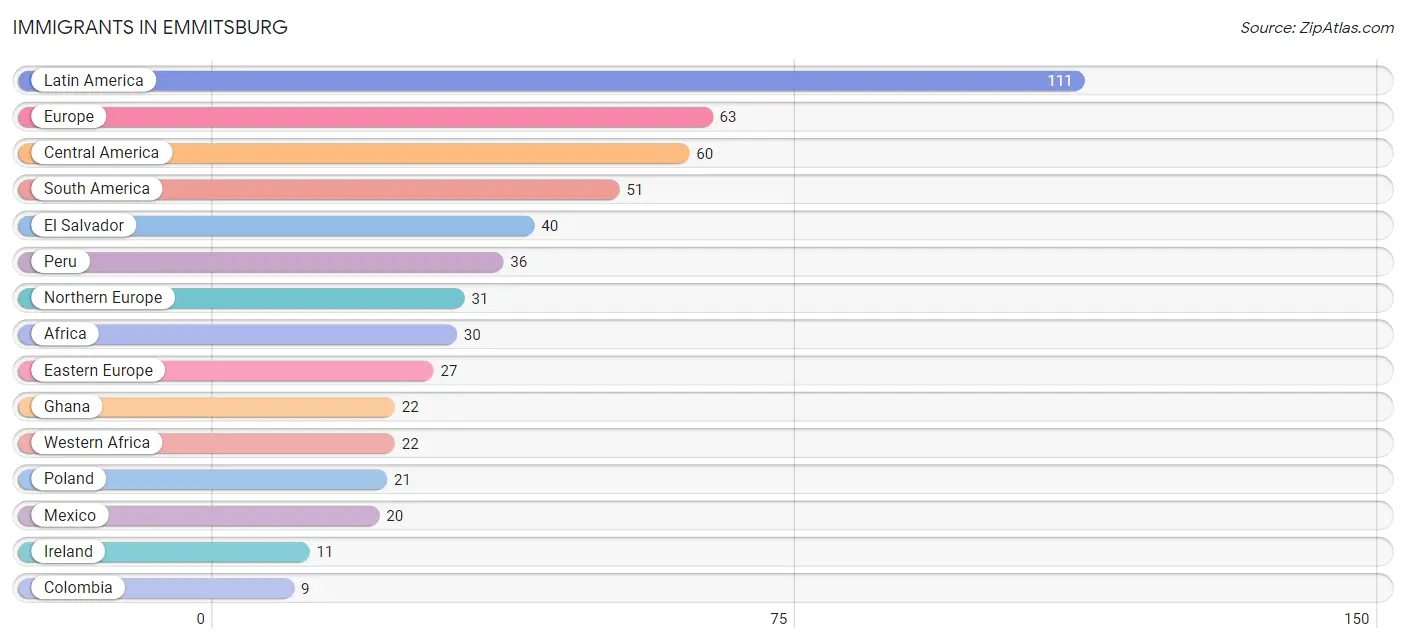
Immigrants in Emmitsburg
The most numerous immigrant groups reported in Emmitsburg came from Latin America (111 | 3.9%), Europe (63 | 2.2%), Central America (60 | 2.1%), South America (51 | 1.8%), and El Salvador (40 | 1.4%), together accounting for 11.5% of all Emmitsburg residents.
| Immigration Origin | # Population | % Population |
| Africa | 30 | 1.1% |
| Asia | 6 | 0.2% |
| Brazil | 6 | 0.2% |
| Cameroon | 8 | 0.3% |
| Central America | 60 | 2.1% |
| China | 6 | 0.2% |
| Colombia | 9 | 0.3% |
| Eastern Asia | 6 | 0.2% |
| Eastern Europe | 27 | 1.0% |
| El Salvador | 40 | 1.4% |
| Europe | 63 | 2.2% |
| Ghana | 22 | 0.8% |
| Ireland | 11 | 0.4% |
| Latin America | 111 | 3.9% |
| Mexico | 20 | 0.7% |
| Middle Africa | 8 | 0.3% |
| Northern Europe | 31 | 1.1% |
| Peru | 36 | 1.3% |
| Poland | 21 | 0.7% |
| Russia | 6 | 0.2% |
| South America | 51 | 1.8% |
| Switzerland | 5 | 0.2% |
| Western Africa | 22 | 0.8% |
| Western Europe | 5 | 0.2% | View All 24 Rows |
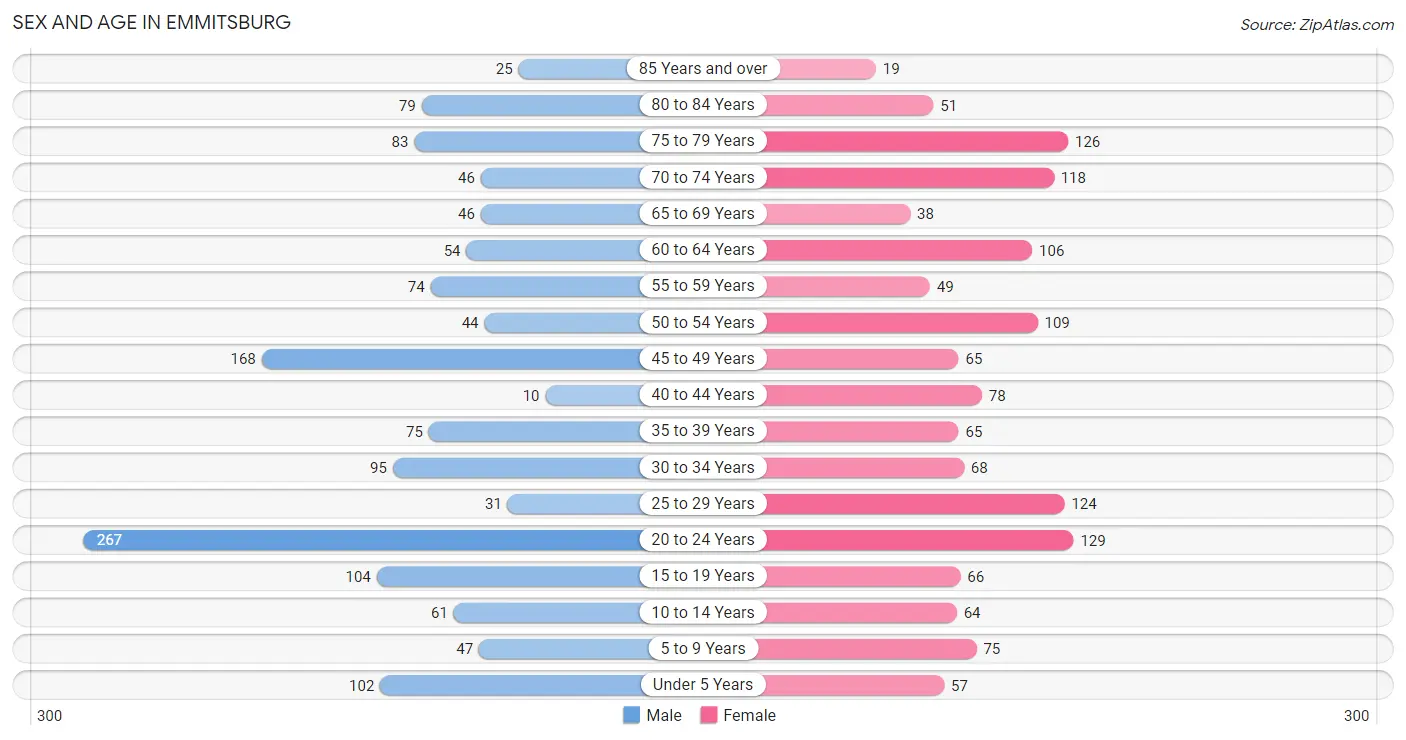
Sex and Age in Emmitsburg
Sex and Age in Emmitsburg
The most populous age groups in Emmitsburg are 20 to 24 Years (267 | 18.9%) for men and 20 to 24 Years (129 | 9.2%) for women.
| Age Bracket | Male | Female |
| Under 5 Years | 102 (7.2%) | 57 (4.1%) |
| 5 to 9 Years | 47 (3.3%) | 75 (5.3%) |
| 10 to 14 Years | 61 (4.3%) | 64 (4.5%) |
| 15 to 19 Years | 104 (7.4%) | 66 (4.7%) |
| 20 to 24 Years | 267 (18.9%) | 129 (9.2%) |
| 25 to 29 Years | 31 (2.2%) | 124 (8.8%) |
| 30 to 34 Years | 95 (6.7%) | 68 (4.8%) |
| 35 to 39 Years | 75 (5.3%) | 65 (4.6%) |
| 40 to 44 Years | 10 (0.7%) | 78 (5.5%) |
| 45 to 49 Years | 168 (11.9%) | 65 (4.6%) |
| 50 to 54 Years | 44 (3.1%) | 109 (7.7%) |
| 55 to 59 Years | 74 (5.2%) | 49 (3.5%) |
| 60 to 64 Years | 54 (3.8%) | 106 (7.5%) |
| 65 to 69 Years | 46 (3.3%) | 38 (2.7%) |
| 70 to 74 Years | 46 (3.3%) | 118 (8.4%) |
| 75 to 79 Years | 83 (5.9%) | 126 (9.0%) |
| 80 to 84 Years | 79 (5.6%) | 51 (3.6%) |
| 85 Years and over | 25 (1.8%) | 19 (1.3%) |
| Total | 1,411 (100.0%) | 1,407 (100.0%) |
Families and Households in Emmitsburg
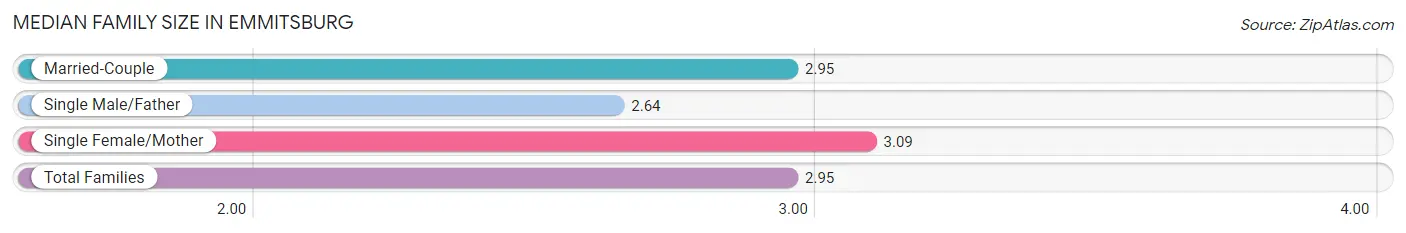
Median Family Size in Emmitsburg
The median family size in Emmitsburg is 2.95 persons per family, with single female/mother families (120 | 17.6%) accounting for the largest median family size of 3.09 persons per family. On the other hand, single male/father families (64 | 9.4%) represent the smallest median family size with 2.64 persons per family.
| Family Type | # Families | Family Size |
| Married-Couple | 498 (73.0%) | 2.95 |
| Single Male/Father | 64 (9.4%) | 2.64 |
| Single Female/Mother | 120 (17.6%) | 3.09 |
| Total Families | 682 (100.0%) | 2.95 |
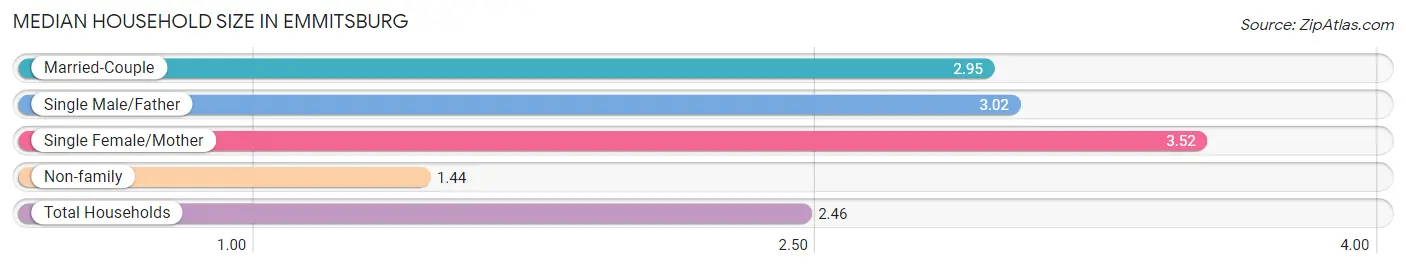
Median Household Size in Emmitsburg
The median household size in Emmitsburg is 2.46 persons per household, with single female/mother households (120 | 11.1%) accounting for the largest median household size of 3.52 persons per household. non-family households (401 | 37.0%) represent the smallest median household size with 1.44 persons per household.
| Household Type | # Households | Household Size |
| Married-Couple | 498 (46.0%) | 2.95 |
| Single Male/Father | 64 (5.9%) | 3.02 |
| Single Female/Mother | 120 (11.1%) | 3.52 |
| Non-family | 401 (37.0%) | 1.44 |
| Total Households | 1,083 (100.0%) | 2.46 |
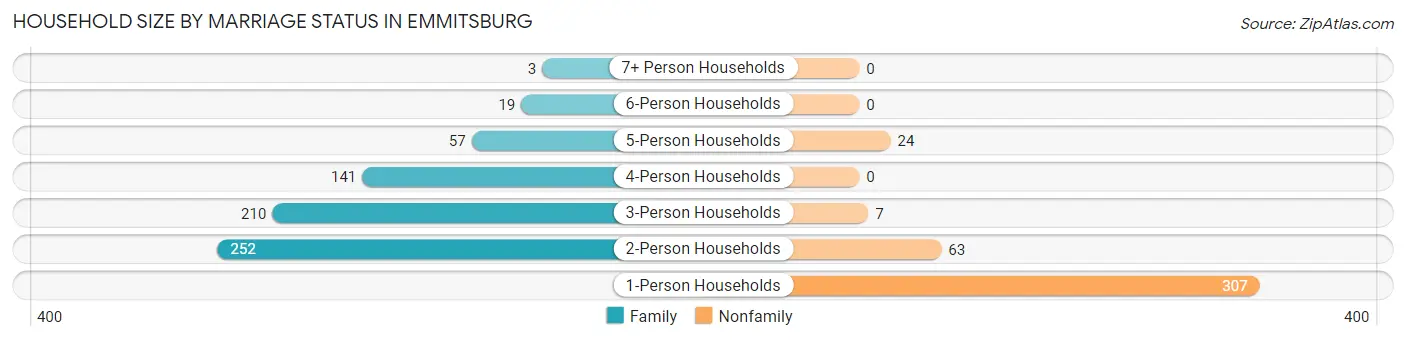
Household Size by Marriage Status in Emmitsburg
Out of a total of 1,083 households in Emmitsburg, 682 (63.0%) are family households, while 401 (37.0%) are nonfamily households. The most numerous type of family households are 2-person households, comprising 252, and the most common type of nonfamily households are 1-person households, comprising 307.
| Household Size | Family Households | Nonfamily Households |
| 1-Person Households | - | 307 (28.3%) |
| 2-Person Households | 252 (23.3%) | 63 (5.8%) |
| 3-Person Households | 210 (19.4%) | 7 (0.6%) |
| 4-Person Households | 141 (13.0%) | 0 (0.0%) |
| 5-Person Households | 57 (5.3%) | 24 (2.2%) |
| 6-Person Households | 19 (1.8%) | 0 (0.0%) |
| 7+ Person Households | 3 (0.3%) | 0 (0.0%) |
| Total | 682 (63.0%) | 401 (37.0%) |
Female Fertility in Emmitsburg
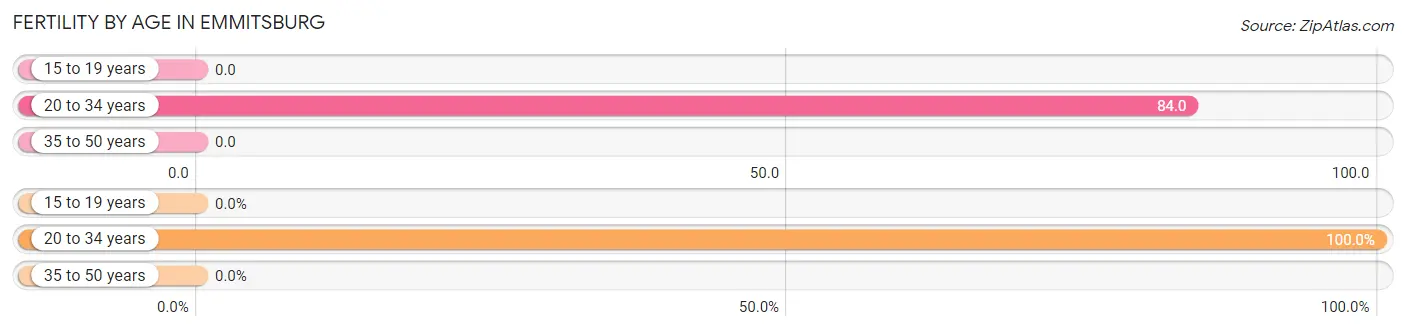
Fertility by Age in Emmitsburg
Average fertility rate in Emmitsburg is 43.0 births per 1,000 women. Women in the age bracket of 20 to 34 years have the highest fertility rate with 84.0 births per 1,000 women. Women in the age bracket of 20 to 34 years acount for 100.0% of all women with births.
| Age Bracket | Women with Births | Births / 1,000 Women |
| 15 to 19 years | 0 (0.0%) | 0.0 |
| 20 to 34 years | 27 (100.0%) | 84.0 |
| 35 to 50 years | 0 (0.0%) | 0.0 |
| Total | 27 (100.0%) | 43.0 |
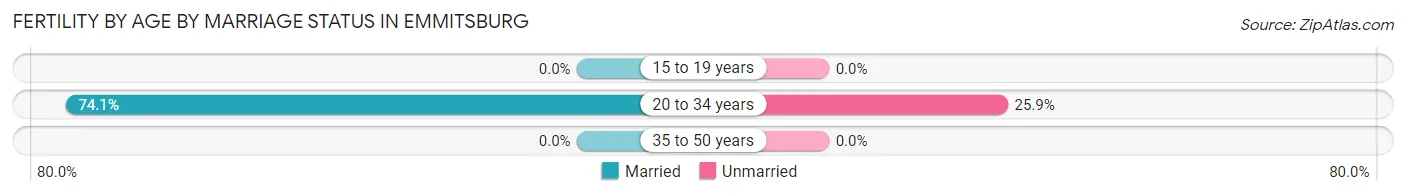
Fertility by Age by Marriage Status in Emmitsburg
74.1% of women with births (27) in Emmitsburg are married. The highest percentage of unmarried women with births falls into 20 to 34 years age bracket with 25.9% of them unmarried at the time of birth, while the lowest percentage of unmarried women with births belong to 20 to 34 years age bracket with 25.9% of them unmarried.
| Age Bracket | Married | Unmarried |
| 15 to 19 years | 0 (0.0%) | 0 (0.0%) |
| 20 to 34 years | 20 (74.1%) | 7 (25.9%) |
| 35 to 50 years | 0 (0.0%) | 0 (0.0%) |
| Total | 20 (74.1%) | 7 (25.9%) |
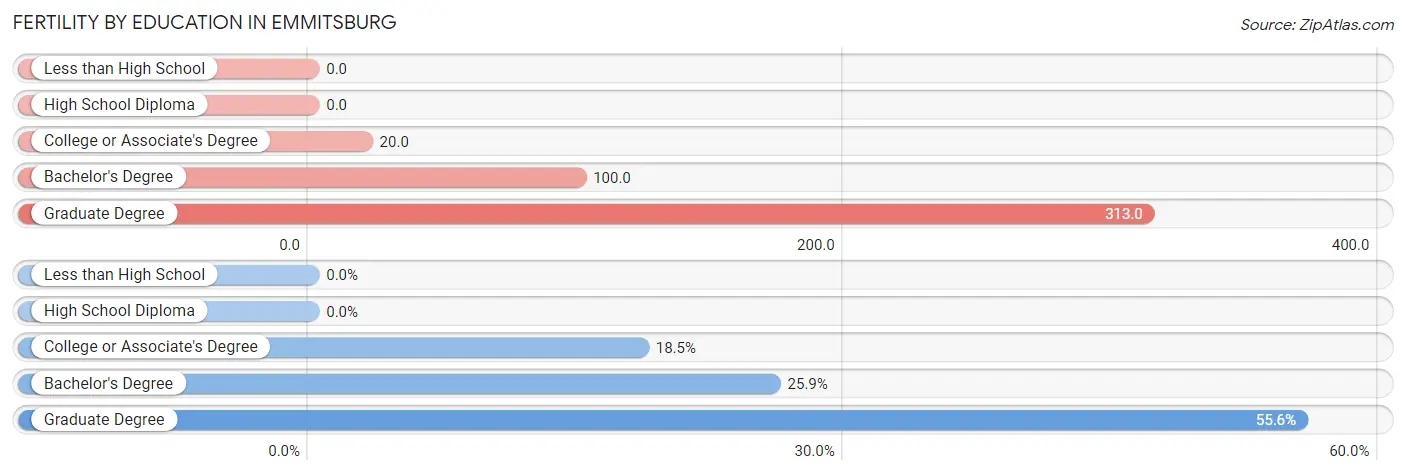
Fertility by Education in Emmitsburg
| Educational Attainment | Women with Births | Births / 1,000 Women |
| Less than High School | 0 (0.0%) | 0.0 |
| High School Diploma | 0 (0.0%) | 0.0 |
| College or Associate's Degree | 5 (18.5%) | 20.0 |
| Bachelor's Degree | 7 (25.9%) | 100.0 |
| Graduate Degree | 15 (55.6%) | 313.0 |
| Total | 27 (100.0%) | 43.0 |
Fertility by Education by Marriage Status in Emmitsburg
25.9% of women with births in Emmitsburg are unmarried. Women with the educational attainment of college or associate's degree are most likely to be married with 100.0% of them married at childbirth, while women with the educational attainment of bachelor's degree are least likely to be married with 100.0% of them unmarried at childbirth.
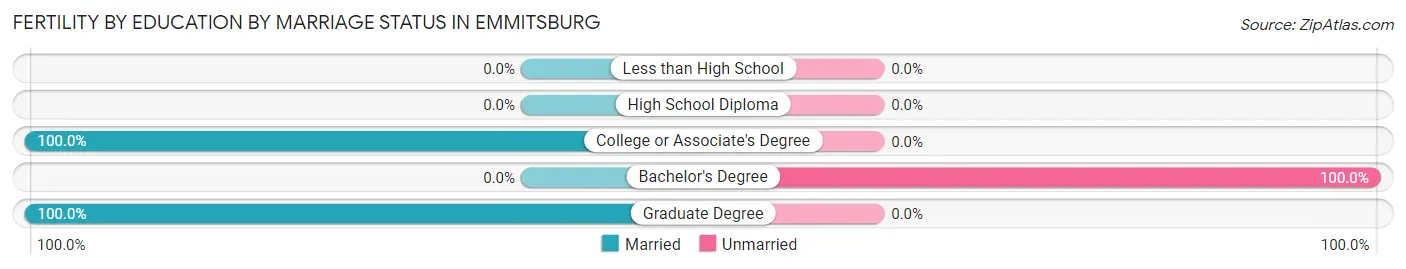
| Educational Attainment | Married | Unmarried |
| Less than High School | 0 (0.0%) | 0 (0.0%) |
| High School Diploma | 0 (0.0%) | 0 (0.0%) |
| College or Associate's Degree | 5 (100.0%) | 0 (0.0%) |
| Bachelor's Degree | 0 (0.0%) | 7 (100.0%) |
| Graduate Degree | 15 (100.0%) | 0 (0.0%) |
| Total | 20 (74.1%) | 7 (25.9%) |
Employment Characteristics in Emmitsburg
Employment by Class of Employer in Emmitsburg
Among the 1,405 employed individuals in Emmitsburg, private company employees (1,020 | 72.6%), local government employees (101 | 7.2%), and federal government employees (86 | 6.1%) make up the most common classes of employment.
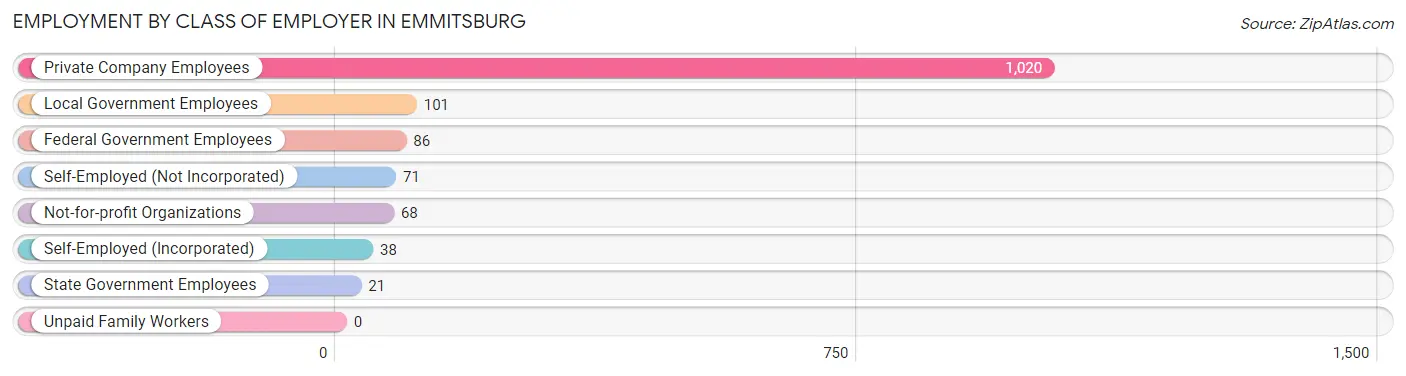
| Employer Class | # Employees | % Employees |
| Private Company Employees | 1,020 | 72.6% |
| Self-Employed (Incorporated) | 38 | 2.7% |
| Self-Employed (Not Incorporated) | 71 | 5.1% |
| Not-for-profit Organizations | 68 | 4.8% |
| Local Government Employees | 101 | 7.2% |
| State Government Employees | 21 | 1.5% |
| Federal Government Employees | 86 | 6.1% |
| Unpaid Family Workers | 0 | 0.0% |
| Total | 1,405 | 100.0% |
Employment Status by Age in Emmitsburg
According to the labor force statistics for Emmitsburg, out of the total population over 16 years of age (2,398), 63.9% or 1,532 individuals are in the labor force, with 4.0% or 61 of them unemployed. The age group with the highest labor force participation rate is 25 to 29 years, with 94.2% or 146 individuals in the labor force. Within the labor force, the 16 to 19 years age range has the highest percentage of unemployed individuals, with 14.5% or 8 of them being unemployed.
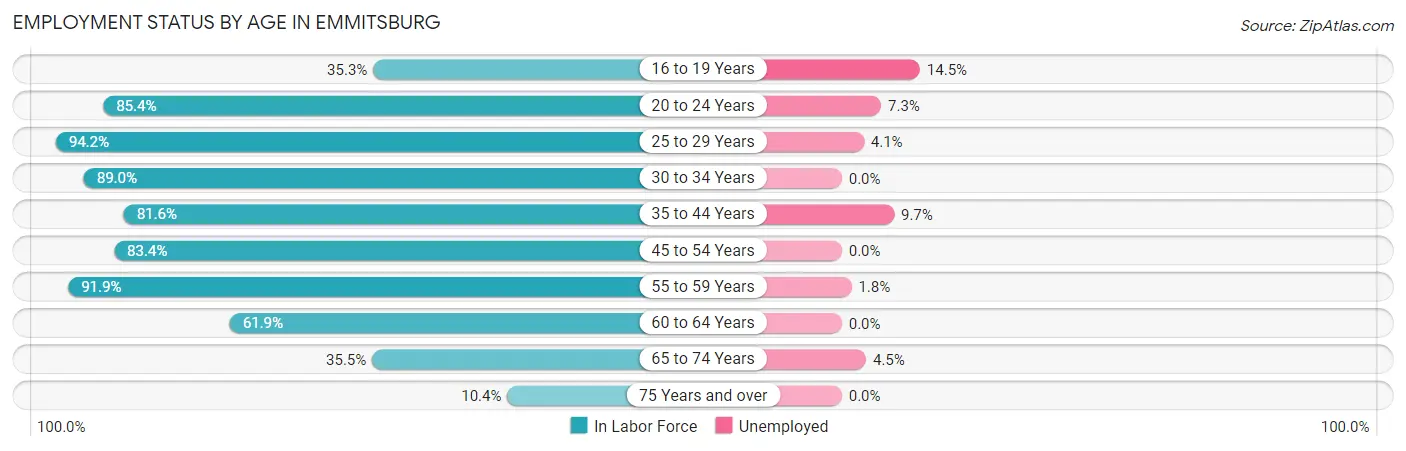
| Age Bracket | In Labor Force | Unemployed |
| 16 to 19 Years | 55 (35.3%) | 8 (14.5%) |
| 20 to 24 Years | 338 (85.4%) | 25 (7.3%) |
| 25 to 29 Years | 146 (94.2%) | 6 (4.1%) |
| 30 to 34 Years | 145 (89.0%) | 0 (0.0%) |
| 35 to 44 Years | 186 (81.6%) | 18 (9.7%) |
| 45 to 54 Years | 322 (83.4%) | 0 (0.0%) |
| 55 to 59 Years | 113 (91.9%) | 2 (1.8%) |
| 60 to 64 Years | 99 (61.9%) | 0 (0.0%) |
| 65 to 74 Years | 88 (35.5%) | 4 (4.5%) |
| 75 Years and over | 40 (10.4%) | 0 (0.0%) |
| Total | 1,532 (63.9%) | 61 (4.0%) |
Employment Status by Educational Attainment in Emmitsburg
According to labor force statistics for Emmitsburg, 83.2% of individuals (1,011) out of the total population between 25 and 64 years of age (1,215) are in the labor force, with 2.4% or 24 of them being unemployed. The group with the highest labor force participation rate are those with the educational attainment of college / associate degree, with 88.6% or 389 individuals in the labor force. Within the labor force, individuals with college / associate degree education have the highest percentage of unemployment, with 6.5% or 25 of them being unemployed.
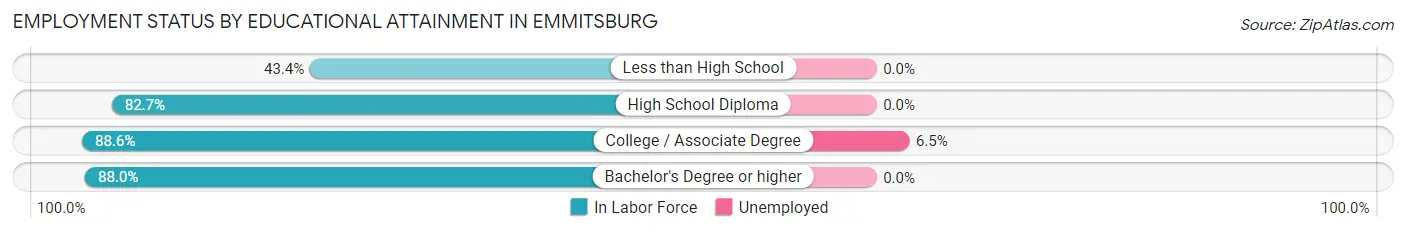
| Educational Attainment | In Labor Force | Unemployed |
| Less than High School | 36 (43.4%) | 0 (0.0%) |
| High School Diploma | 367 (82.7%) | 0 (0.0%) |
| College / Associate Degree | 389 (88.6%) | 29 (6.5%) |
| Bachelor's Degree or higher | 219 (88.0%) | 0 (0.0%) |
| Total | 1,011 (83.2%) | 29 (2.4%) |
Employment Occupations by Sex in Emmitsburg
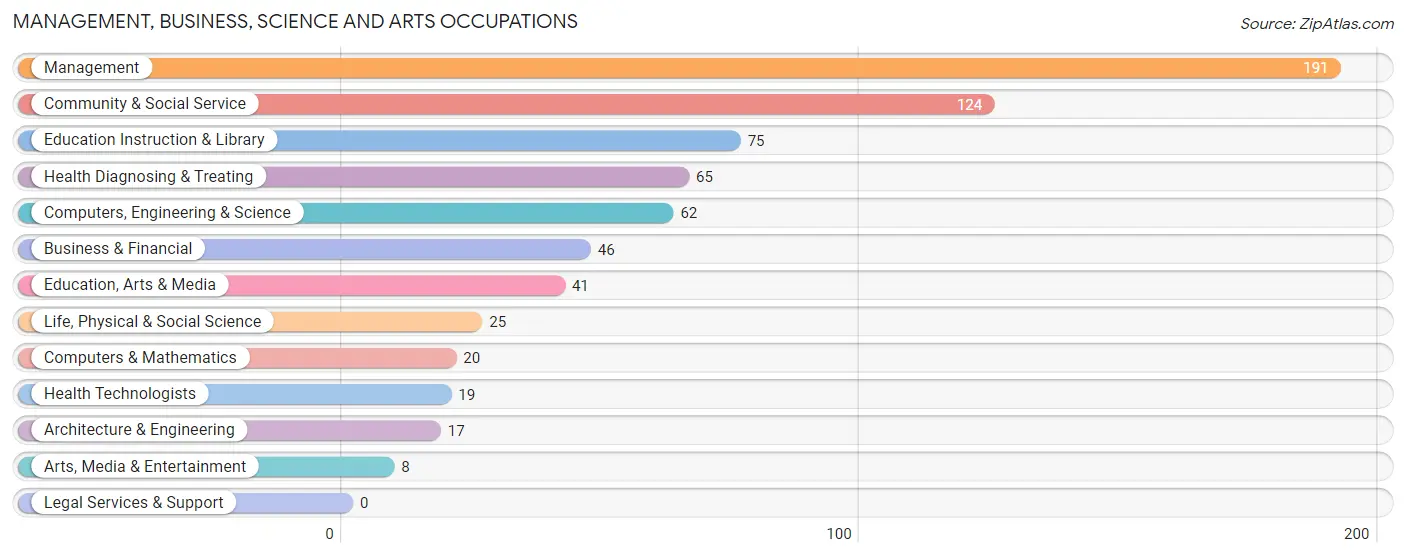
Management, Business, Science and Arts Occupations
The most common Management, Business, Science and Arts occupations in Emmitsburg are Management (191 | 13.4%), Community & Social Service (124 | 8.7%), Education Instruction & Library (75 | 5.2%), Health Diagnosing & Treating (65 | 4.5%), and Computers, Engineering & Science (62 | 4.3%).
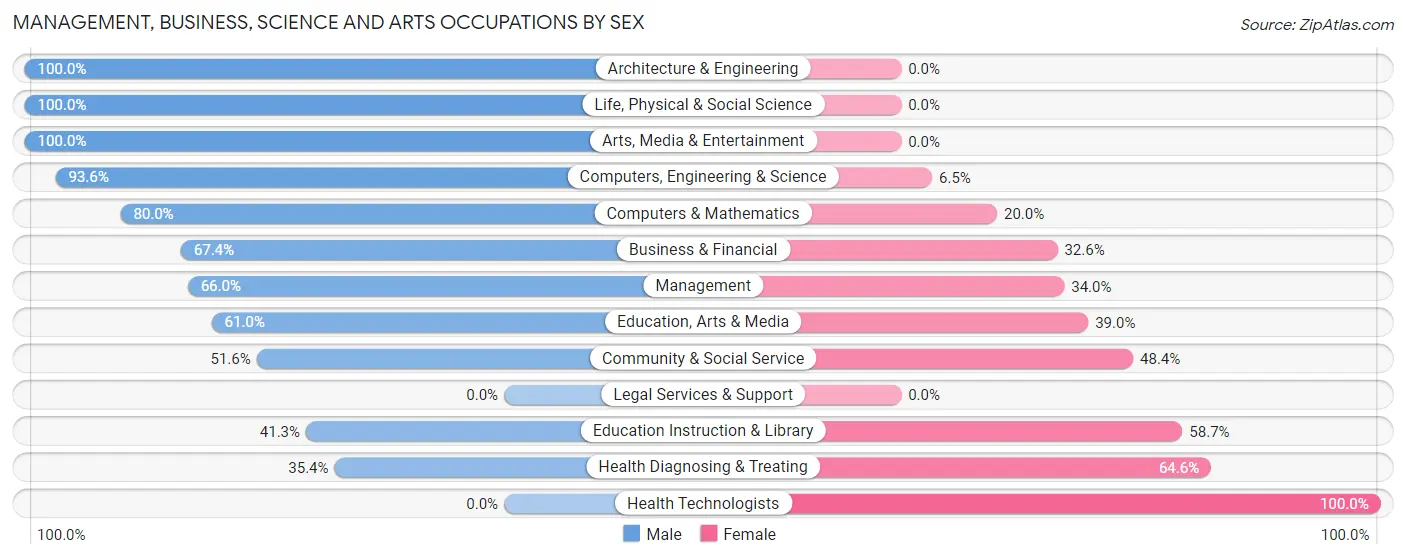
Management, Business, Science and Arts Occupations by Sex
Within the Management, Business, Science and Arts occupations in Emmitsburg, the most male-oriented occupations are Architecture & Engineering (100.0%), Life, Physical & Social Science (100.0%), and Arts, Media & Entertainment (100.0%), while the most female-oriented occupations are Health Technologists (100.0%), Health Diagnosing & Treating (64.6%), and Education Instruction & Library (58.7%).
| Occupation | Male | Female |
| Management | 126 (66.0%) | 65 (34.0%) |
| Business & Financial | 31 (67.4%) | 15 (32.6%) |
| Computers, Engineering & Science | 58 (93.5%) | 4 (6.5%) |
| Computers & Mathematics | 16 (80.0%) | 4 (20.0%) |
| Architecture & Engineering | 17 (100.0%) | 0 (0.0%) |
| Life, Physical & Social Science | 25 (100.0%) | 0 (0.0%) |
| Community & Social Service | 64 (51.6%) | 60 (48.4%) |
| Education, Arts & Media | 25 (61.0%) | 16 (39.0%) |
| Legal Services & Support | 0 (0.0%) | 0 (0.0%) |
| Education Instruction & Library | 31 (41.3%) | 44 (58.7%) |
| Arts, Media & Entertainment | 8 (100.0%) | 0 (0.0%) |
| Health Diagnosing & Treating | 23 (35.4%) | 42 (64.6%) |
| Health Technologists | 0 (0.0%) | 19 (100.0%) |
| Total (Category) | 302 (61.9%) | 186 (38.1%) |
| Total (Overall) | 741 (51.9%) | 687 (48.1%) |
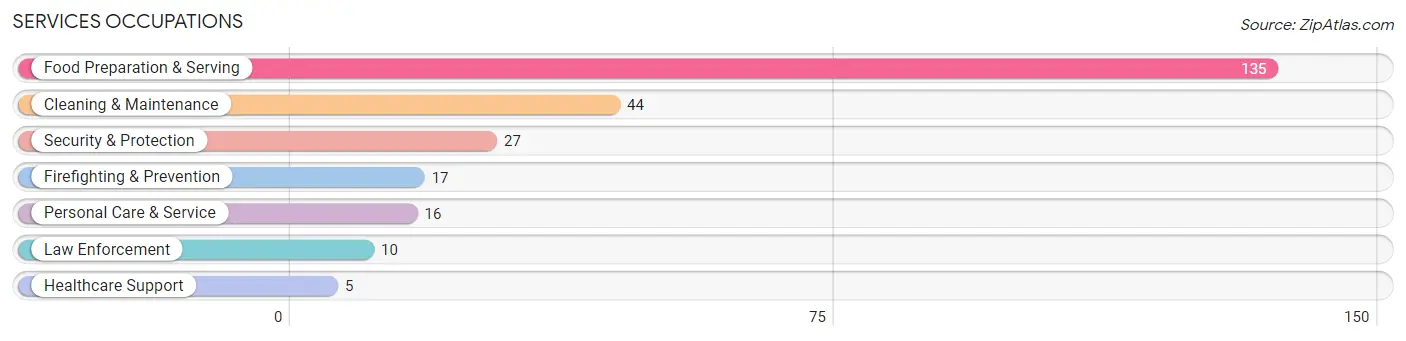
Services Occupations
The most common Services occupations in Emmitsburg are Food Preparation & Serving (135 | 9.5%), Cleaning & Maintenance (44 | 3.1%), Security & Protection (27 | 1.9%), Firefighting & Prevention (17 | 1.2%), and Personal Care & Service (16 | 1.1%).
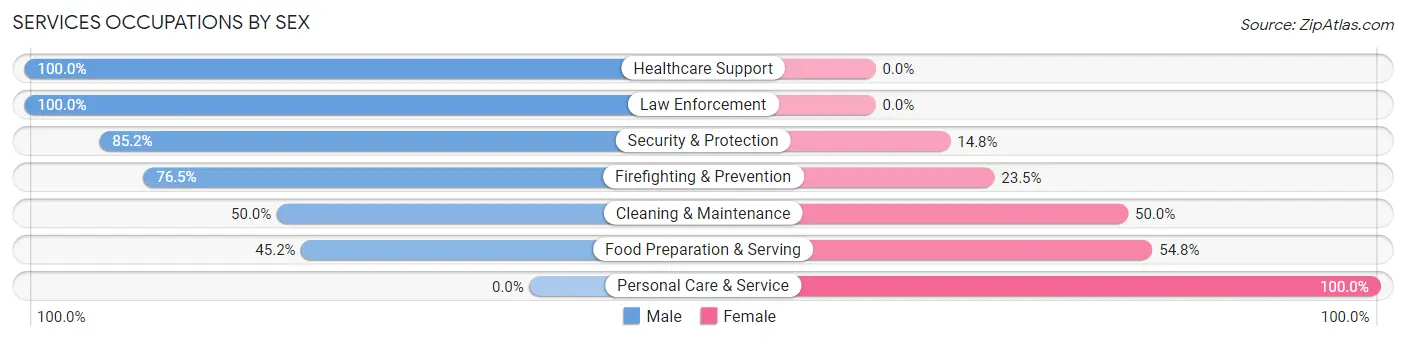
Services Occupations by Sex
Within the Services occupations in Emmitsburg, the most male-oriented occupations are Healthcare Support (100.0%), Law Enforcement (100.0%), and Security & Protection (85.2%), while the most female-oriented occupations are Personal Care & Service (100.0%), Food Preparation & Serving (54.8%), and Cleaning & Maintenance (50.0%).
| Occupation | Male | Female |
| Healthcare Support | 5 (100.0%) | 0 (0.0%) |
| Security & Protection | 23 (85.2%) | 4 (14.8%) |
| Firefighting & Prevention | 13 (76.5%) | 4 (23.5%) |
| Law Enforcement | 10 (100.0%) | 0 (0.0%) |
| Food Preparation & Serving | 61 (45.2%) | 74 (54.8%) |
| Cleaning & Maintenance | 22 (50.0%) | 22 (50.0%) |
| Personal Care & Service | 0 (0.0%) | 16 (100.0%) |
| Total (Category) | 111 (48.9%) | 116 (51.1%) |
| Total (Overall) | 741 (51.9%) | 687 (48.1%) |
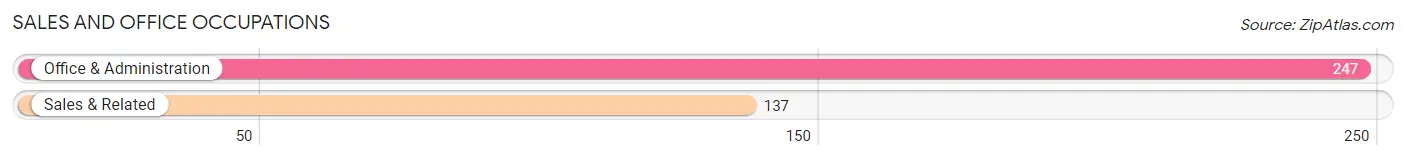
Sales and Office Occupations
The most common Sales and Office occupations in Emmitsburg are Office & Administration (247 | 17.3%), and Sales & Related (137 | 9.6%).
Sales and Office Occupations by Sex
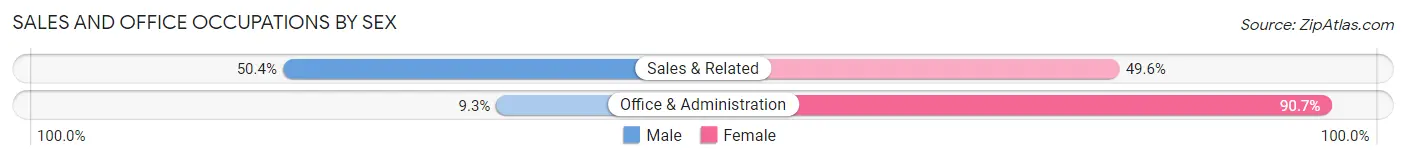
| Occupation | Male | Female |
| Sales & Related | 69 (50.4%) | 68 (49.6%) |
| Office & Administration | 23 (9.3%) | 224 (90.7%) |
| Total (Category) | 92 (24.0%) | 292 (76.0%) |
| Total (Overall) | 741 (51.9%) | 687 (48.1%) |
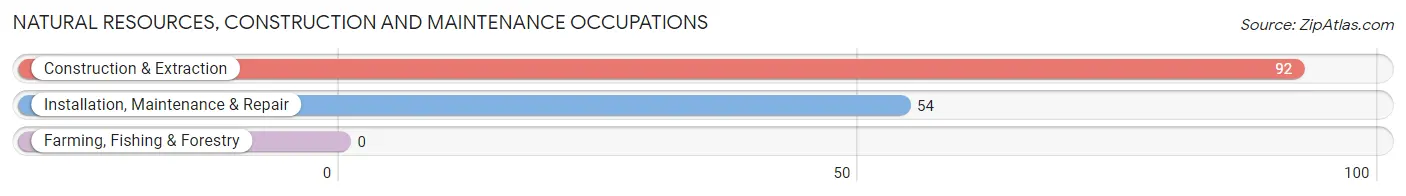
Natural Resources, Construction and Maintenance Occupations
The most common Natural Resources, Construction and Maintenance occupations in Emmitsburg are Construction & Extraction (92 | 6.4%), and Installation, Maintenance & Repair (54 | 3.8%).
Natural Resources, Construction and Maintenance Occupations by Sex
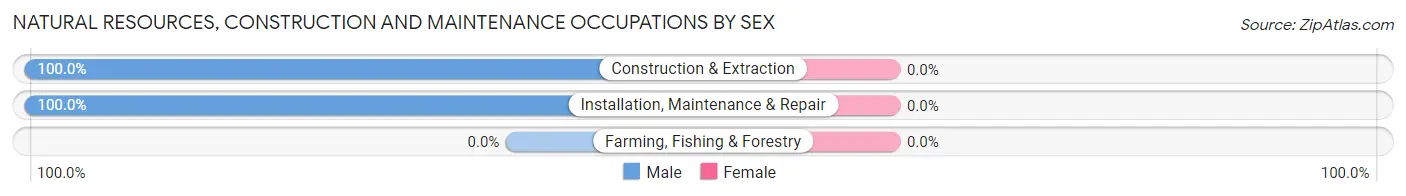
| Occupation | Male | Female |
| Farming, Fishing & Forestry | 0 (0.0%) | 0 (0.0%) |
| Construction & Extraction | 92 (100.0%) | 0 (0.0%) |
| Installation, Maintenance & Repair | 54 (100.0%) | 0 (0.0%) |
| Total (Category) | 146 (100.0%) | 0 (0.0%) |
| Total (Overall) | 741 (51.9%) | 687 (48.1%) |
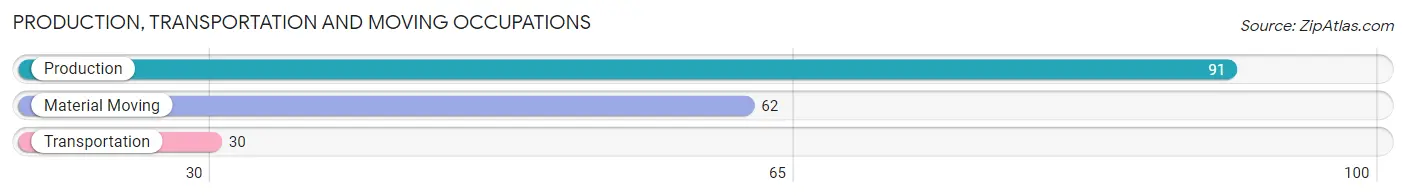
Production, Transportation and Moving Occupations
The most common Production, Transportation and Moving occupations in Emmitsburg are Production (91 | 6.4%), Material Moving (62 | 4.3%), and Transportation (30 | 2.1%).
Production, Transportation and Moving Occupations by Sex
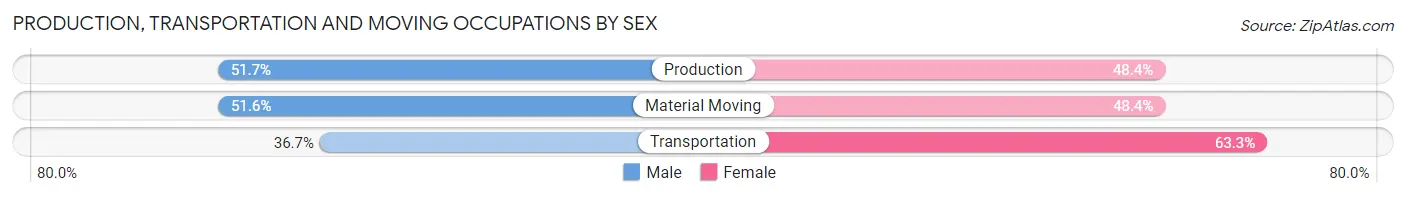
| Occupation | Male | Female |
| Production | 47 (51.6%) | 44 (48.3%) |
| Transportation | 11 (36.7%) | 19 (63.3%) |
| Material Moving | 32 (51.6%) | 30 (48.4%) |
| Total (Category) | 90 (49.2%) | 93 (50.8%) |
| Total (Overall) | 741 (51.9%) | 687 (48.1%) |
Employment Industries by Sex in Emmitsburg
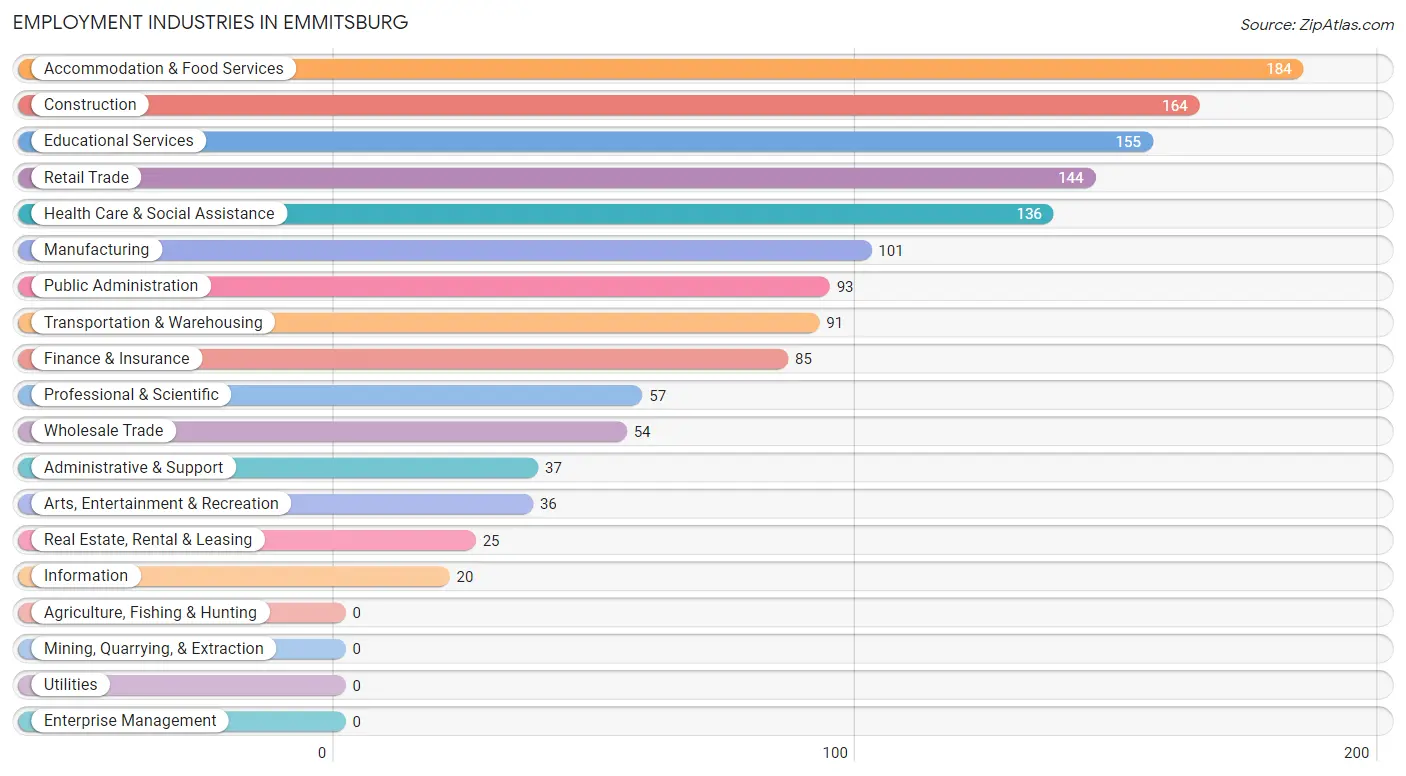
Employment Industries in Emmitsburg
The major employment industries in Emmitsburg include Accommodation & Food Services (184 | 12.9%), Construction (164 | 11.5%), Educational Services (155 | 10.8%), Retail Trade (144 | 10.1%), and Health Care & Social Assistance (136 | 9.5%).
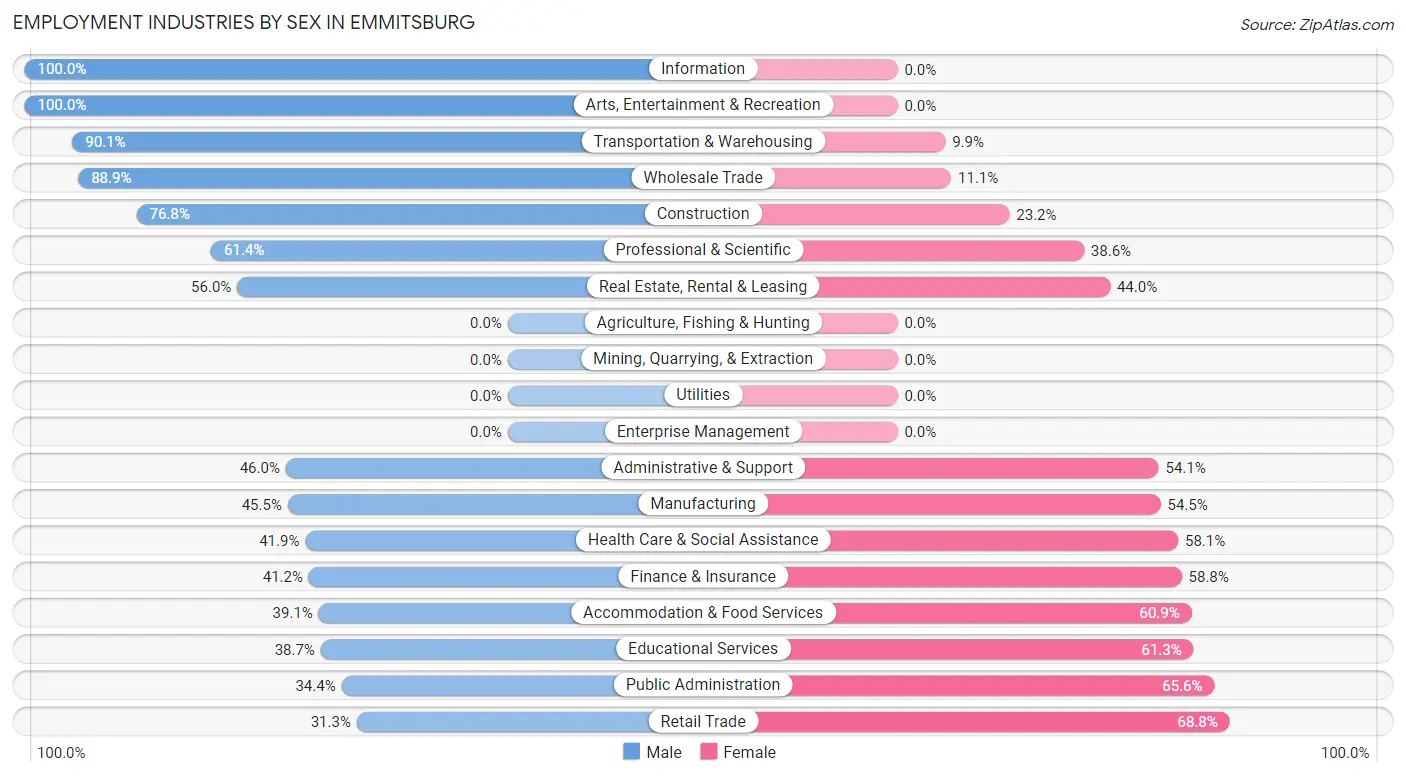
Employment Industries by Sex in Emmitsburg
The Emmitsburg industries that see more men than women are Information (100.0%), Arts, Entertainment & Recreation (100.0%), and Transportation & Warehousing (90.1%), whereas the industries that tend to have a higher number of women are Retail Trade (68.8%), Public Administration (65.6%), and Educational Services (61.3%).
| Industry | Male | Female |
| Agriculture, Fishing & Hunting | 0 (0.0%) | 0 (0.0%) |
| Mining, Quarrying, & Extraction | 0 (0.0%) | 0 (0.0%) |
| Construction | 126 (76.8%) | 38 (23.2%) |
| Manufacturing | 46 (45.5%) | 55 (54.5%) |
| Wholesale Trade | 48 (88.9%) | 6 (11.1%) |
| Retail Trade | 45 (31.2%) | 99 (68.8%) |
| Transportation & Warehousing | 82 (90.1%) | 9 (9.9%) |
| Utilities | 0 (0.0%) | 0 (0.0%) |
| Information | 20 (100.0%) | 0 (0.0%) |
| Finance & Insurance | 35 (41.2%) | 50 (58.8%) |
| Real Estate, Rental & Leasing | 14 (56.0%) | 11 (44.0%) |
| Professional & Scientific | 35 (61.4%) | 22 (38.6%) |
| Enterprise Management | 0 (0.0%) | 0 (0.0%) |
| Administrative & Support | 17 (46.0%) | 20 (54.0%) |
| Educational Services | 60 (38.7%) | 95 (61.3%) |
| Health Care & Social Assistance | 57 (41.9%) | 79 (58.1%) |
| Arts, Entertainment & Recreation | 36 (100.0%) | 0 (0.0%) |
| Accommodation & Food Services | 72 (39.1%) | 112 (60.9%) |
| Public Administration | 32 (34.4%) | 61 (65.6%) |
| Total | 741 (51.9%) | 687 (48.1%) |
Education in Emmitsburg
School Enrollment in Emmitsburg
The most common levels of schooling among the 712 students in Emmitsburg are college / undergraduate (266 | 37.4%), high school (153 | 21.5%), and elementary school (103 | 14.5%).
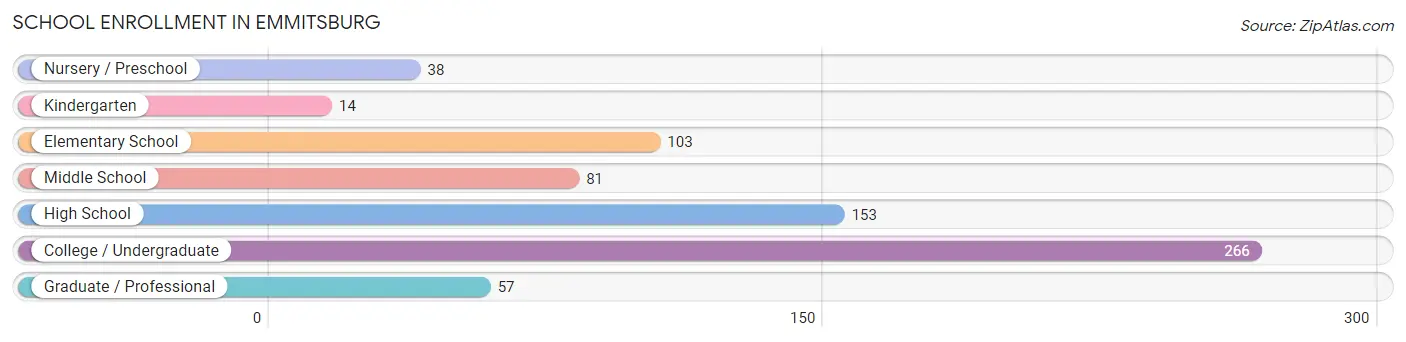
| School Level | # Students | % Students |
| Nursery / Preschool | 38 | 5.3% |
| Kindergarten | 14 | 2.0% |
| Elementary School | 103 | 14.5% |
| Middle School | 81 | 11.4% |
| High School | 153 | 21.5% |
| College / Undergraduate | 266 | 37.4% |
| Graduate / Professional | 57 | 8.0% |
| Total | 712 | 100.0% |
School Enrollment by Age by Funding Source in Emmitsburg
Out of a total of 712 students who are enrolled in schools in Emmitsburg, 224 (31.5%) attend a private institution, while the remaining 488 (68.5%) are enrolled in public schools. The age group of 20 to 24 year olds has the highest likelihood of being enrolled in private schools, with 158 (69.6% in the age bracket) enrolled. Conversely, the age group of 5 to 9 year old has the lowest likelihood of being enrolled in a private school, with 110 (94.8% in the age bracket) attending a public institution.
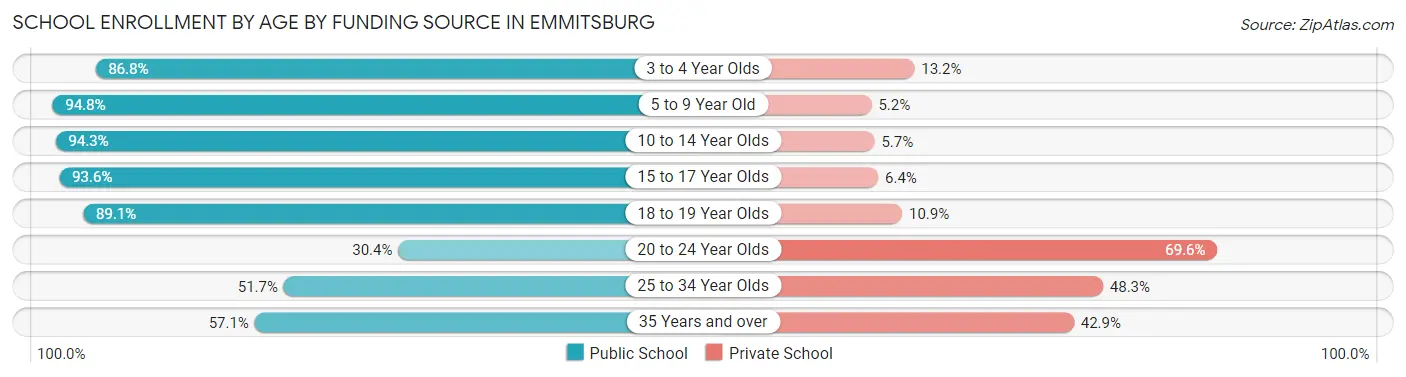
| Age Bracket | Public School | Private School |
| 3 to 4 Year Olds | 33 (86.8%) | 5 (13.2%) |
| 5 to 9 Year Old | 110 (94.8%) | 6 (5.2%) |
| 10 to 14 Year Olds | 115 (94.3%) | 7 (5.7%) |
| 15 to 17 Year Olds | 73 (93.6%) | 5 (6.4%) |
| 18 to 19 Year Olds | 41 (89.1%) | 5 (10.9%) |
| 20 to 24 Year Olds | 69 (30.4%) | 158 (69.6%) |
| 25 to 34 Year Olds | 15 (51.7%) | 14 (48.3%) |
| 35 Years and over | 32 (57.1%) | 24 (42.9%) |
| Total | 488 (68.5%) | 224 (31.5%) |
Educational Attainment by Field of Study in Emmitsburg
Education (80 | 18.6%), science & technology (63 | 14.6%), social sciences (48 | 11.1%), psychology (47 | 10.9%), and arts & humanities (42 | 9.7%) are the most common fields of study among 431 individuals in Emmitsburg who have obtained a bachelor's degree or higher.
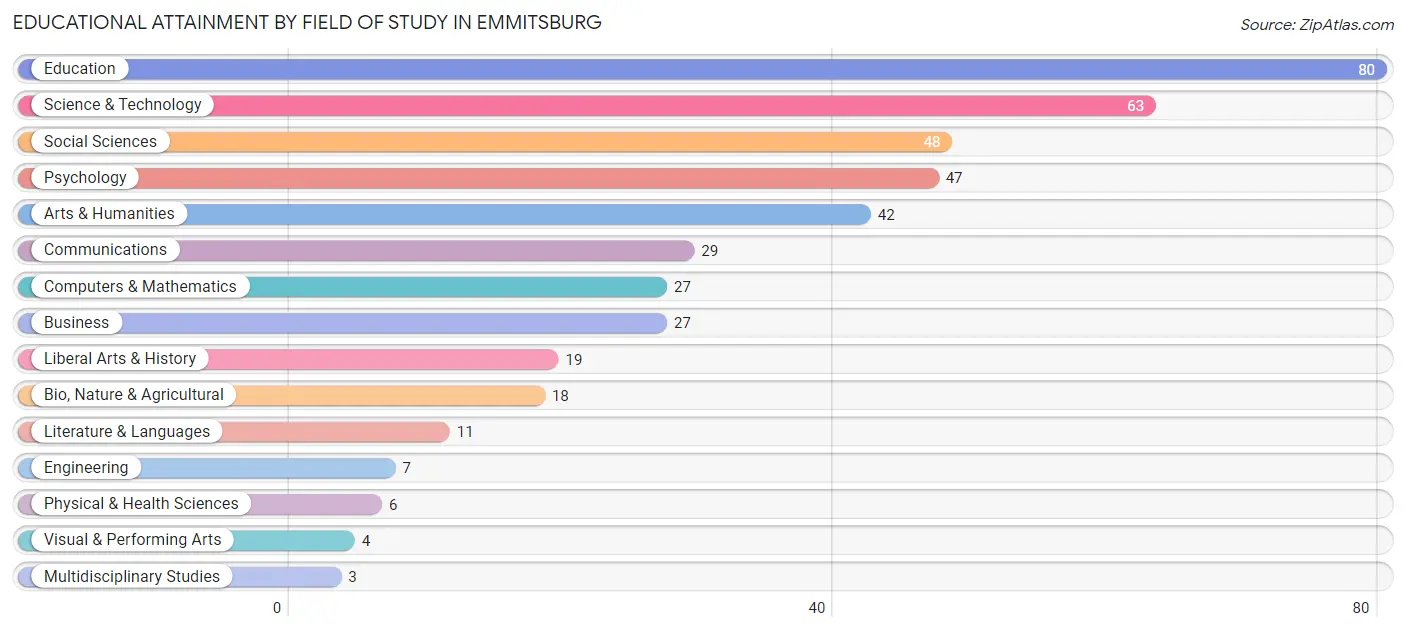
| Field of Study | # Graduates | % Graduates |
| Computers & Mathematics | 27 | 6.3% |
| Bio, Nature & Agricultural | 18 | 4.2% |
| Physical & Health Sciences | 6 | 1.4% |
| Psychology | 47 | 10.9% |
| Social Sciences | 48 | 11.1% |
| Engineering | 7 | 1.6% |
| Multidisciplinary Studies | 3 | 0.7% |
| Science & Technology | 63 | 14.6% |
| Business | 27 | 6.3% |
| Education | 80 | 18.6% |
| Literature & Languages | 11 | 2.5% |
| Liberal Arts & History | 19 | 4.4% |
| Visual & Performing Arts | 4 | 0.9% |
| Communications | 29 | 6.7% |
| Arts & Humanities | 42 | 9.7% |
| Total | 431 | 100.0% |
Transportation & Commute in Emmitsburg
Vehicle Availability by Sex in Emmitsburg
The most prevalent vehicle ownership categories in Emmitsburg are males with 3 vehicles (234, accounting for 30.7%) and females with 3 vehicles (249, making up 36.9%).
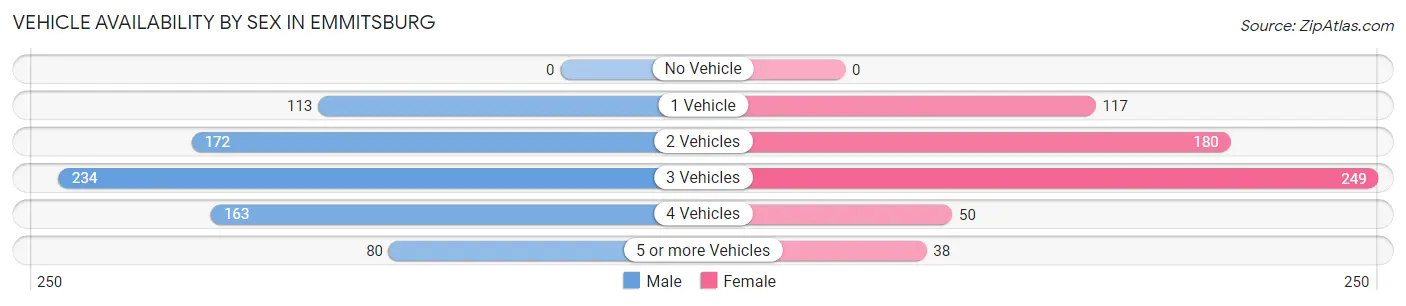
| Vehicles Available | Male | Female |
| No Vehicle | 0 (0.0%) | 0 (0.0%) |
| 1 Vehicle | 113 (14.8%) | 117 (18.4%) |
| 2 Vehicles | 172 (22.6%) | 180 (28.4%) |
| 3 Vehicles | 234 (30.7%) | 249 (39.3%) |
| 4 Vehicles | 163 (21.4%) | 50 (7.9%) |
| 5 or more Vehicles | 80 (10.5%) | 38 (6.0%) |
| Total | 762 (100.0%) | 634 (100.0%) |
Commute Time in Emmitsburg
The most frequently occuring commute durations in Emmitsburg are 30 to 34 minutes (258 commuters, 21.2%), 5 to 9 minutes (158 commuters, 13.0%), and 60 to 89 minutes (141 commuters, 11.6%).
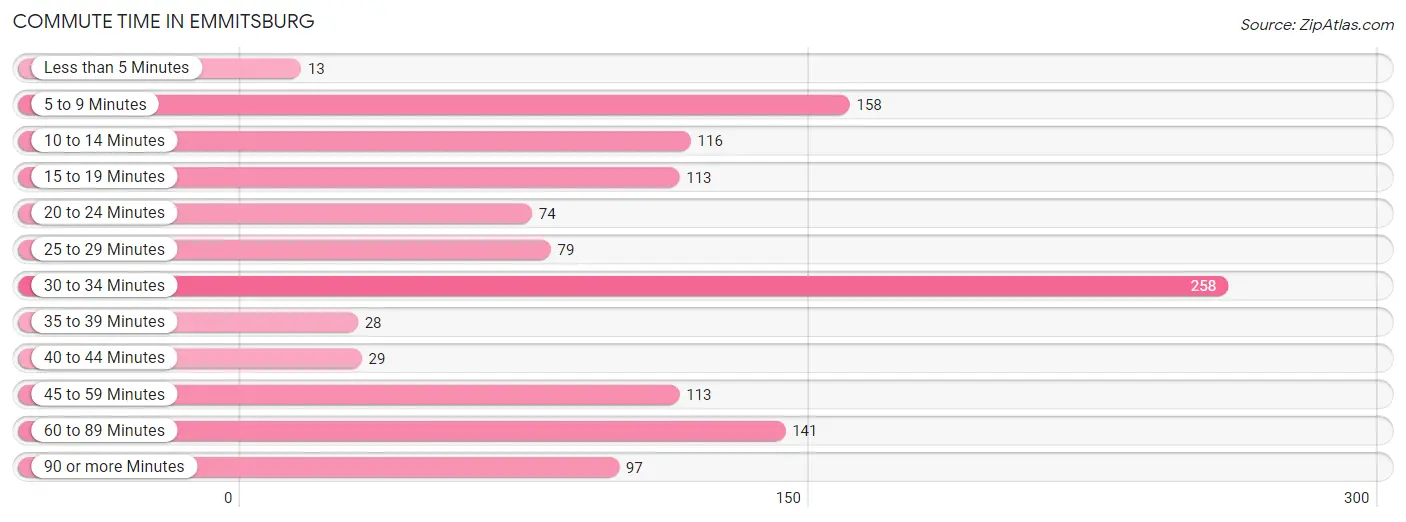
| Commute Time | # Commuters | % Commuters |
| Less than 5 Minutes | 13 | 1.1% |
| 5 to 9 Minutes | 158 | 13.0% |
| 10 to 14 Minutes | 116 | 9.5% |
| 15 to 19 Minutes | 113 | 9.3% |
| 20 to 24 Minutes | 74 | 6.1% |
| 25 to 29 Minutes | 79 | 6.5% |
| 30 to 34 Minutes | 258 | 21.2% |
| 35 to 39 Minutes | 28 | 2.3% |
| 40 to 44 Minutes | 29 | 2.4% |
| 45 to 59 Minutes | 113 | 9.3% |
| 60 to 89 Minutes | 141 | 11.6% |
| 90 or more Minutes | 97 | 8.0% |
Commute Time by Sex in Emmitsburg
The most common commute times in Emmitsburg are 30 to 34 minutes (144 commuters, 21.7%) for males and 30 to 34 minutes (114 commuters, 20.5%) for females.
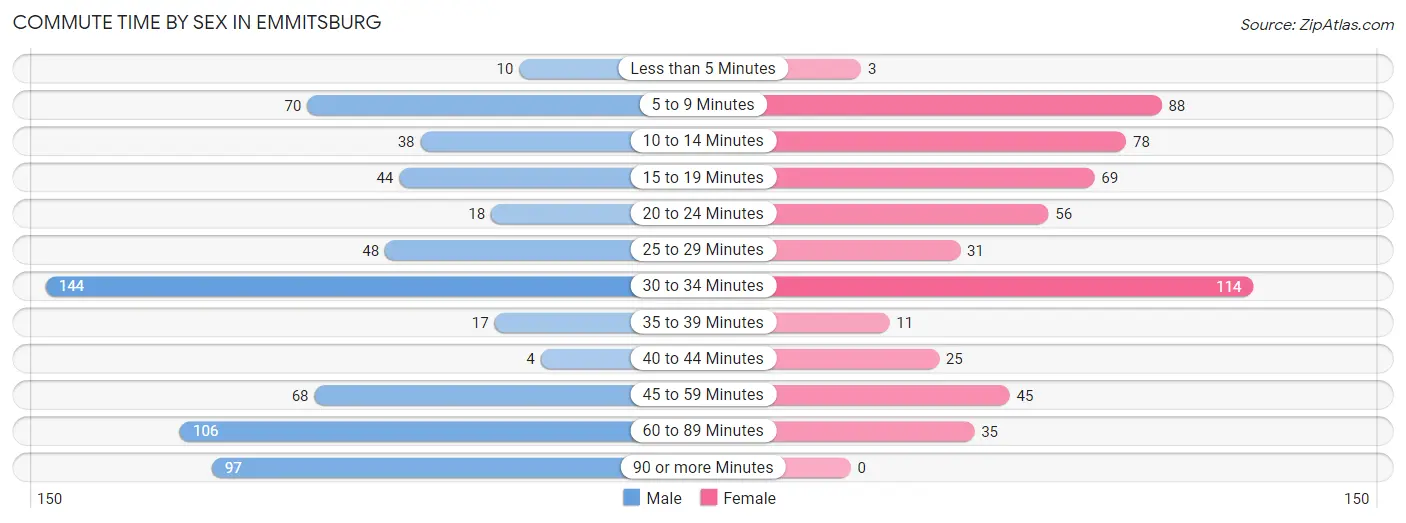
| Commute Time | Male | Female |
| Less than 5 Minutes | 10 (1.5%) | 3 (0.5%) |
| 5 to 9 Minutes | 70 (10.5%) | 88 (15.9%) |
| 10 to 14 Minutes | 38 (5.7%) | 78 (14.1%) |
| 15 to 19 Minutes | 44 (6.6%) | 69 (12.4%) |
| 20 to 24 Minutes | 18 (2.7%) | 56 (10.1%) |
| 25 to 29 Minutes | 48 (7.2%) | 31 (5.6%) |
| 30 to 34 Minutes | 144 (21.7%) | 114 (20.5%) |
| 35 to 39 Minutes | 17 (2.6%) | 11 (2.0%) |
| 40 to 44 Minutes | 4 (0.6%) | 25 (4.5%) |
| 45 to 59 Minutes | 68 (10.2%) | 45 (8.1%) |
| 60 to 89 Minutes | 106 (16.0%) | 35 (6.3%) |
| 90 or more Minutes | 97 (14.6%) | 0 (0.0%) |
Time of Departure to Work by Sex in Emmitsburg
The most frequent times of departure to work in Emmitsburg are 12:00 AM to 4:59 AM (156, 23.5%) for males and 9:00 AM to 9:59 AM (94, 16.9%) for females.
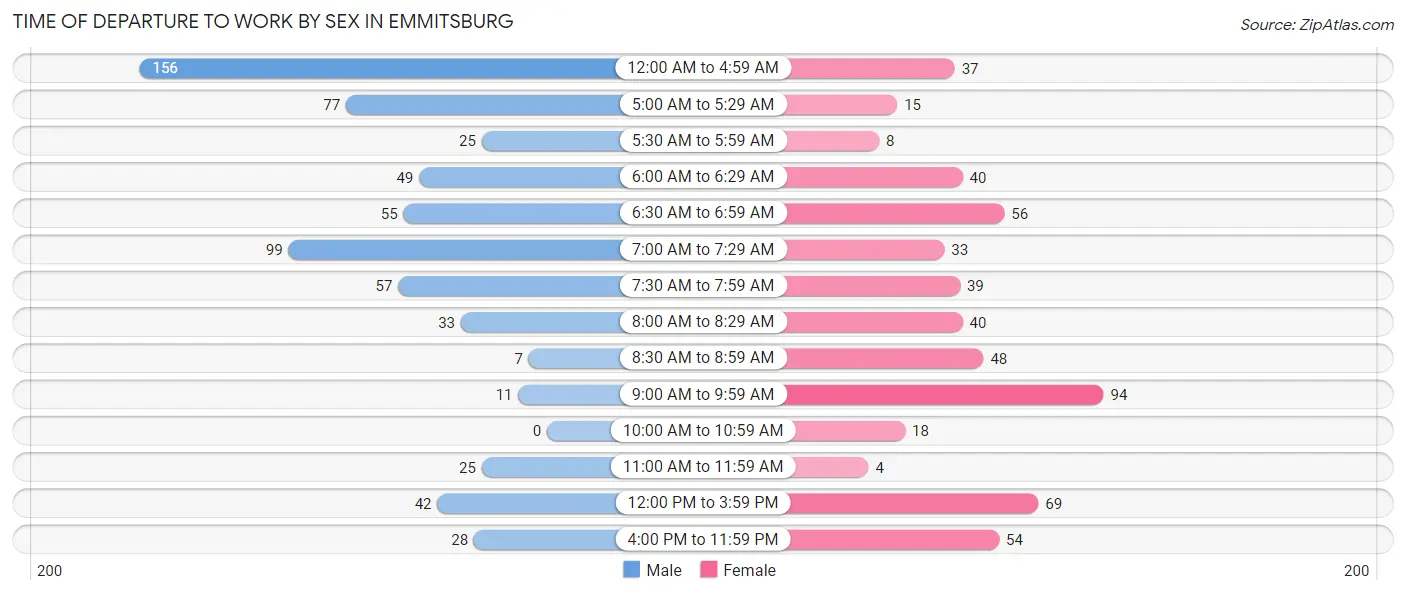
| Time of Departure | Male | Female |
| 12:00 AM to 4:59 AM | 156 (23.5%) | 37 (6.7%) |
| 5:00 AM to 5:29 AM | 77 (11.6%) | 15 (2.7%) |
| 5:30 AM to 5:59 AM | 25 (3.8%) | 8 (1.4%) |
| 6:00 AM to 6:29 AM | 49 (7.4%) | 40 (7.2%) |
| 6:30 AM to 6:59 AM | 55 (8.3%) | 56 (10.1%) |
| 7:00 AM to 7:29 AM | 99 (14.9%) | 33 (5.9%) |
| 7:30 AM to 7:59 AM | 57 (8.6%) | 39 (7.0%) |
| 8:00 AM to 8:29 AM | 33 (5.0%) | 40 (7.2%) |
| 8:30 AM to 8:59 AM | 7 (1.1%) | 48 (8.6%) |
| 9:00 AM to 9:59 AM | 11 (1.7%) | 94 (16.9%) |
| 10:00 AM to 10:59 AM | 0 (0.0%) | 18 (3.2%) |
| 11:00 AM to 11:59 AM | 25 (3.8%) | 4 (0.7%) |
| 12:00 PM to 3:59 PM | 42 (6.3%) | 69 (12.4%) |
| 4:00 PM to 11:59 PM | 28 (4.2%) | 54 (9.7%) |
| Total | 664 (100.0%) | 555 (100.0%) |
Housing Occupancy in Emmitsburg
Occupancy by Ownership in Emmitsburg
Of the total 1,083 dwellings in Emmitsburg, owner-occupied units account for 729 (67.3%), while renter-occupied units make up 354 (32.7%).
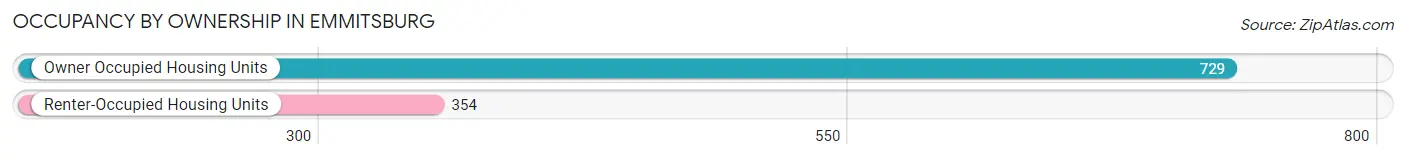
| Occupancy | # Housing Units | % Housing Units |
| Owner Occupied Housing Units | 729 | 67.3% |
| Renter-Occupied Housing Units | 354 | 32.7% |
| Total Occupied Housing Units | 1,083 | 100.0% |
Occupancy by Household Size in Emmitsburg
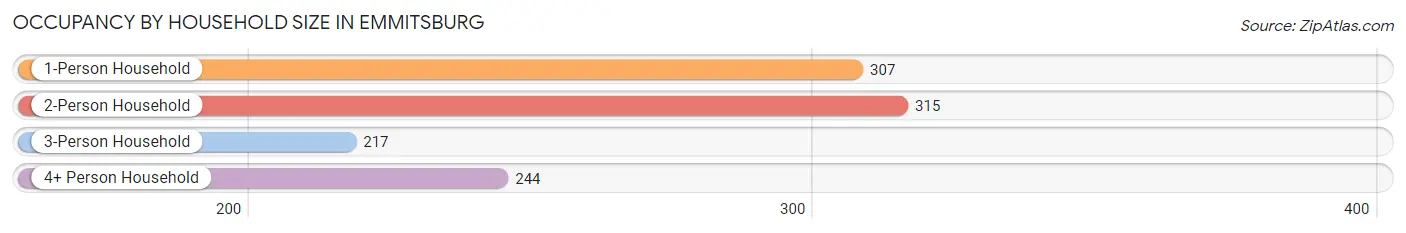
| Household Size | # Housing Units | % Housing Units |
| 1-Person Household | 307 | 28.3% |
| 2-Person Household | 315 | 29.1% |
| 3-Person Household | 217 | 20.0% |
| 4+ Person Household | 244 | 22.5% |
| Total Housing Units | 1,083 | 100.0% |
Occupancy by Ownership by Household Size in Emmitsburg
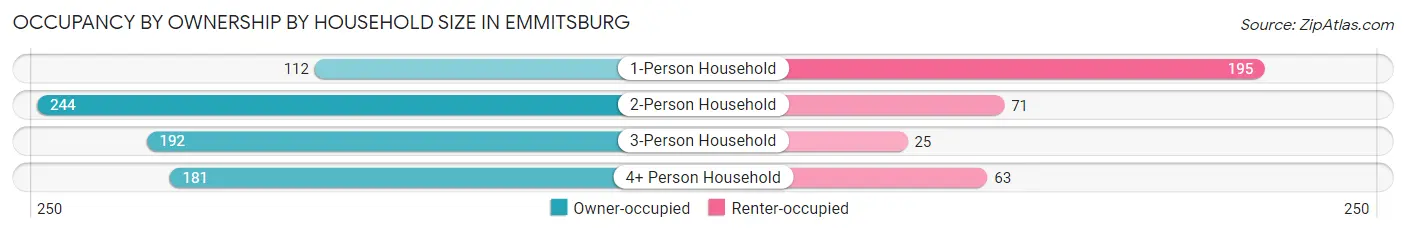
| Household Size | Owner-occupied | Renter-occupied |
| 1-Person Household | 112 (36.5%) | 195 (63.5%) |
| 2-Person Household | 244 (77.5%) | 71 (22.5%) |
| 3-Person Household | 192 (88.5%) | 25 (11.5%) |
| 4+ Person Household | 181 (74.2%) | 63 (25.8%) |
| Total Housing Units | 729 (67.3%) | 354 (32.7%) |
Occupancy by Educational Attainment in Emmitsburg
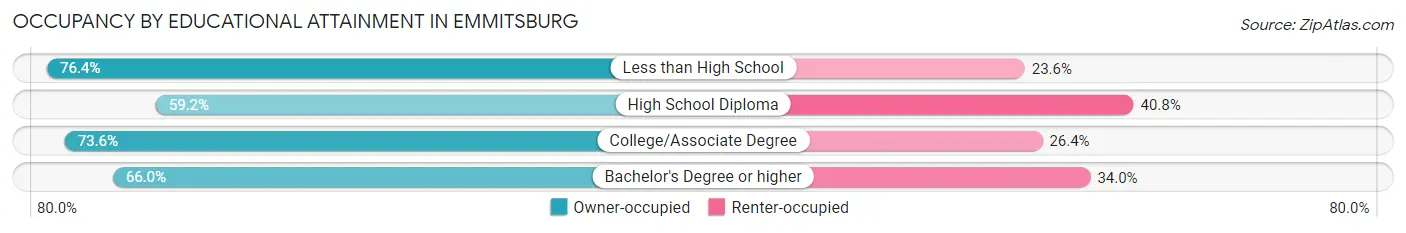
| Household Size | Owner-occupied | Renter-occupied |
| Less than High School | 81 (76.4%) | 25 (23.6%) |
| High School Diploma | 213 (59.2%) | 147 (40.8%) |
| College/Associate Degree | 268 (73.6%) | 96 (26.4%) |
| Bachelor's Degree or higher | 167 (66.0%) | 86 (34.0%) |
Occupancy by Age of Householder in Emmitsburg
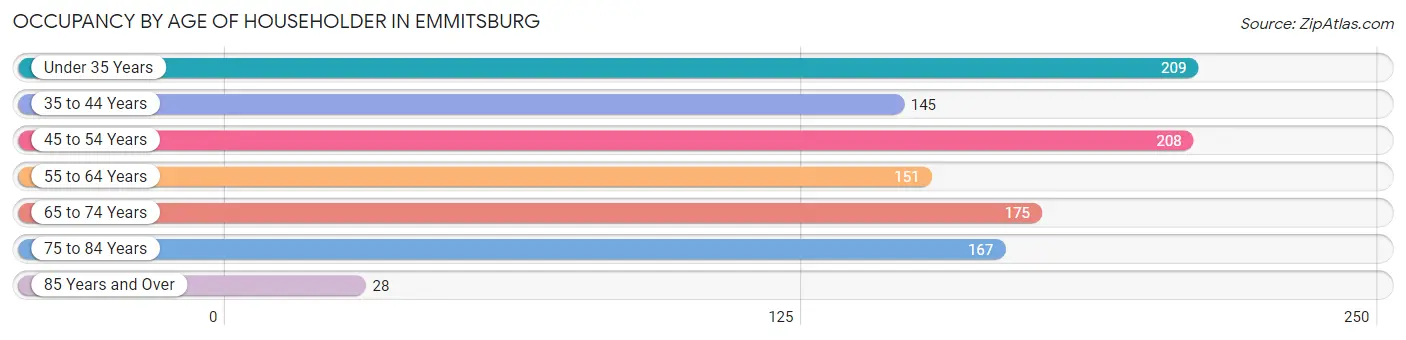
| Age Bracket | # Households | % Households |
| Under 35 Years | 209 | 19.3% |
| 35 to 44 Years | 145 | 13.4% |
| 45 to 54 Years | 208 | 19.2% |
| 55 to 64 Years | 151 | 13.9% |
| 65 to 74 Years | 175 | 16.2% |
| 75 to 84 Years | 167 | 15.4% |
| 85 Years and Over | 28 | 2.6% |
| Total | 1,083 | 100.0% |
Housing Finances in Emmitsburg
Median Income by Occupancy in Emmitsburg
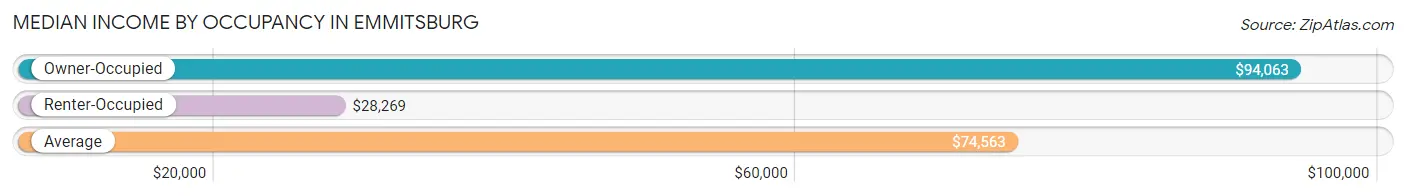
| Occupancy Type | # Households | Median Income |
| Owner-Occupied | 729 (67.3%) | $94,063 |
| Renter-Occupied | 354 (32.7%) | $28,269 |
| Average | 1,083 (100.0%) | $74,563 |
Occupancy by Householder Income Bracket in Emmitsburg
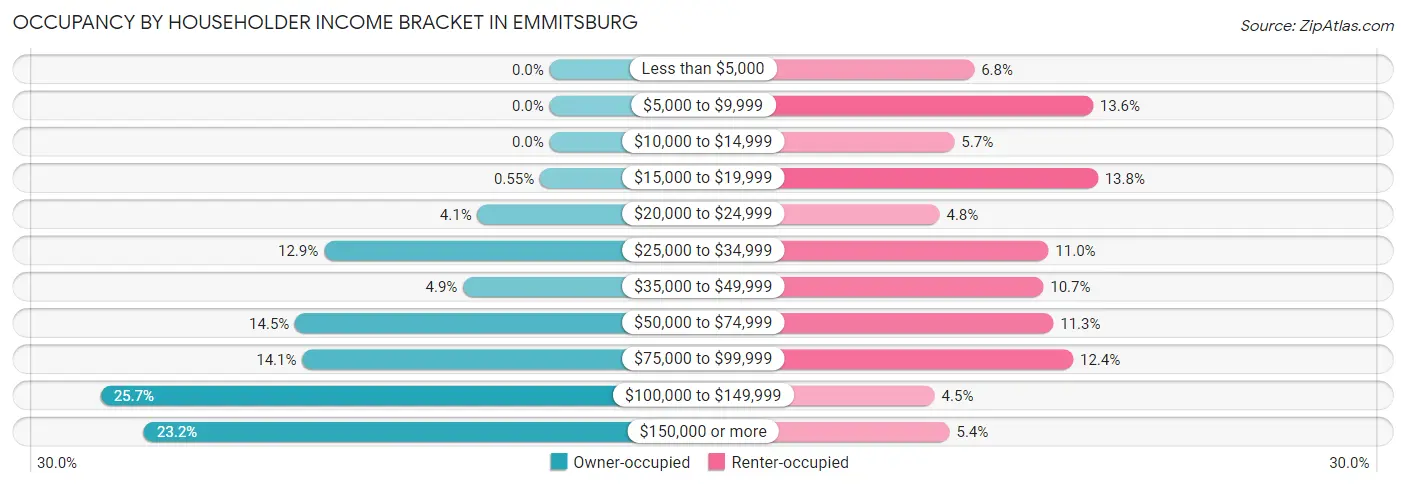
| Income Bracket | Owner-occupied | Renter-occupied |
| Less than $5,000 | 0 (0.0%) | 24 (6.8%) |
| $5,000 to $9,999 | 0 (0.0%) | 48 (13.6%) |
| $10,000 to $14,999 | 0 (0.0%) | 20 (5.7%) |
| $15,000 to $19,999 | 4 (0.5%) | 49 (13.8%) |
| $20,000 to $24,999 | 30 (4.1%) | 17 (4.8%) |
| $25,000 to $34,999 | 94 (12.9%) | 39 (11.0%) |
| $35,000 to $49,999 | 36 (4.9%) | 38 (10.7%) |
| $50,000 to $74,999 | 106 (14.5%) | 40 (11.3%) |
| $75,000 to $99,999 | 103 (14.1%) | 44 (12.4%) |
| $100,000 to $149,999 | 187 (25.7%) | 16 (4.5%) |
| $150,000 or more | 169 (23.2%) | 19 (5.4%) |
| Total | 729 (100.0%) | 354 (100.0%) |
Monthly Housing Cost Tiers in Emmitsburg
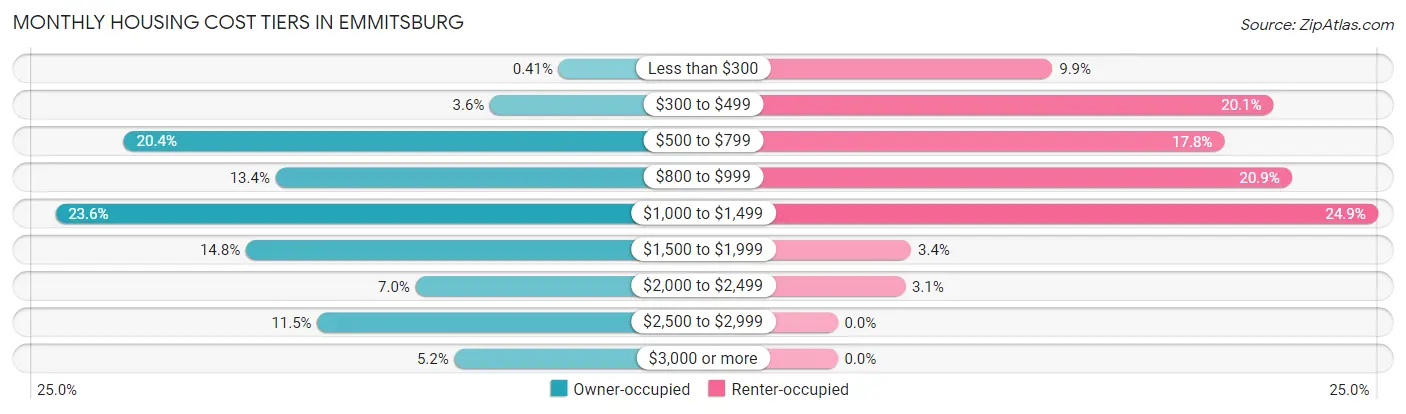
| Monthly Cost | Owner-occupied | Renter-occupied |
| Less than $300 | 3 (0.4%) | 35 (9.9%) |
| $300 to $499 | 26 (3.6%) | 71 (20.1%) |
| $500 to $799 | 149 (20.4%) | 63 (17.8%) |
| $800 to $999 | 98 (13.4%) | 74 (20.9%) |
| $1,000 to $1,499 | 172 (23.6%) | 88 (24.9%) |
| $1,500 to $1,999 | 108 (14.8%) | 12 (3.4%) |
| $2,000 to $2,499 | 51 (7.0%) | 11 (3.1%) |
| $2,500 to $2,999 | 84 (11.5%) | 0 (0.0%) |
| $3,000 or more | 38 (5.2%) | 0 (0.0%) |
| Total | 729 (100.0%) | 354 (100.0%) |
Physical Housing Characteristics in Emmitsburg
Housing Structures in Emmitsburg
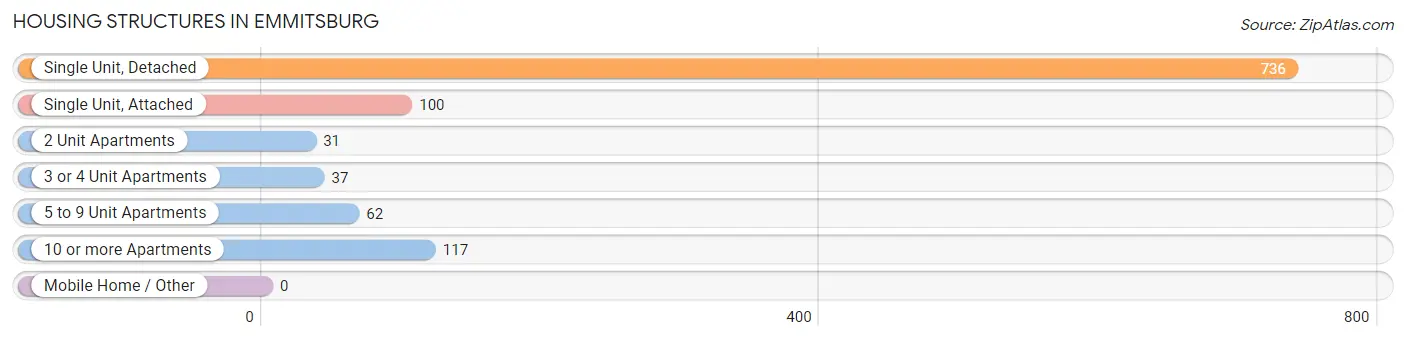
| Structure Type | # Housing Units | % Housing Units |
| Single Unit, Detached | 736 | 68.0% |
| Single Unit, Attached | 100 | 9.2% |
| 2 Unit Apartments | 31 | 2.9% |
| 3 or 4 Unit Apartments | 37 | 3.4% |
| 5 to 9 Unit Apartments | 62 | 5.7% |
| 10 or more Apartments | 117 | 10.8% |
| Mobile Home / Other | 0 | 0.0% |
| Total | 1,083 | 100.0% |
Housing Structures by Occupancy in Emmitsburg
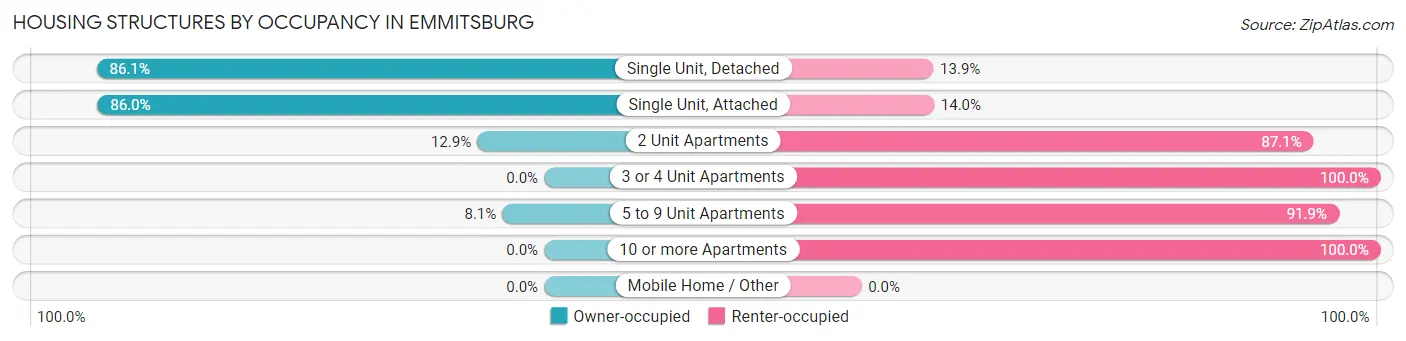
| Structure Type | Owner-occupied | Renter-occupied |
| Single Unit, Detached | 634 (86.1%) | 102 (13.9%) |
| Single Unit, Attached | 86 (86.0%) | 14 (14.0%) |
| 2 Unit Apartments | 4 (12.9%) | 27 (87.1%) |
| 3 or 4 Unit Apartments | 0 (0.0%) | 37 (100.0%) |
| 5 to 9 Unit Apartments | 5 (8.1%) | 57 (91.9%) |
| 10 or more Apartments | 0 (0.0%) | 117 (100.0%) |
| Mobile Home / Other | 0 (0.0%) | 0 (0.0%) |
| Total | 729 (67.3%) | 354 (32.7%) |
Housing Structures by Number of Rooms in Emmitsburg
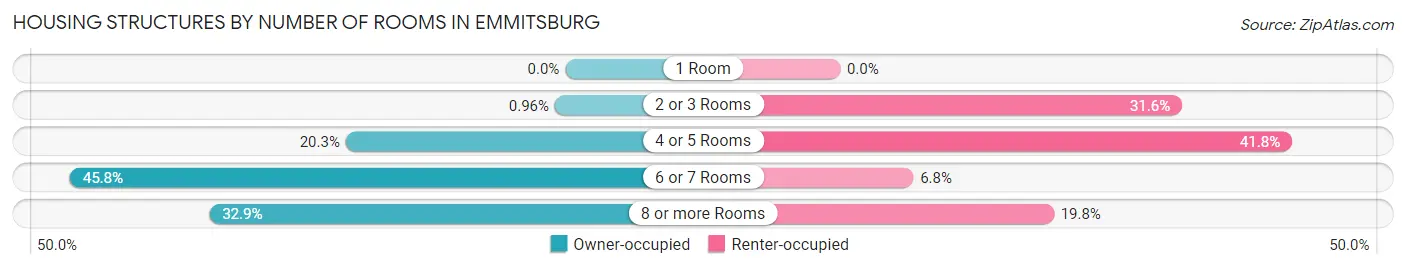
| Number of Rooms | Owner-occupied | Renter-occupied |
| 1 Room | 0 (0.0%) | 0 (0.0%) |
| 2 or 3 Rooms | 7 (1.0%) | 112 (31.6%) |
| 4 or 5 Rooms | 148 (20.3%) | 148 (41.8%) |
| 6 or 7 Rooms | 334 (45.8%) | 24 (6.8%) |
| 8 or more Rooms | 240 (32.9%) | 70 (19.8%) |
| Total | 729 (100.0%) | 354 (100.0%) |
Housing Structure by Heating Type in Emmitsburg
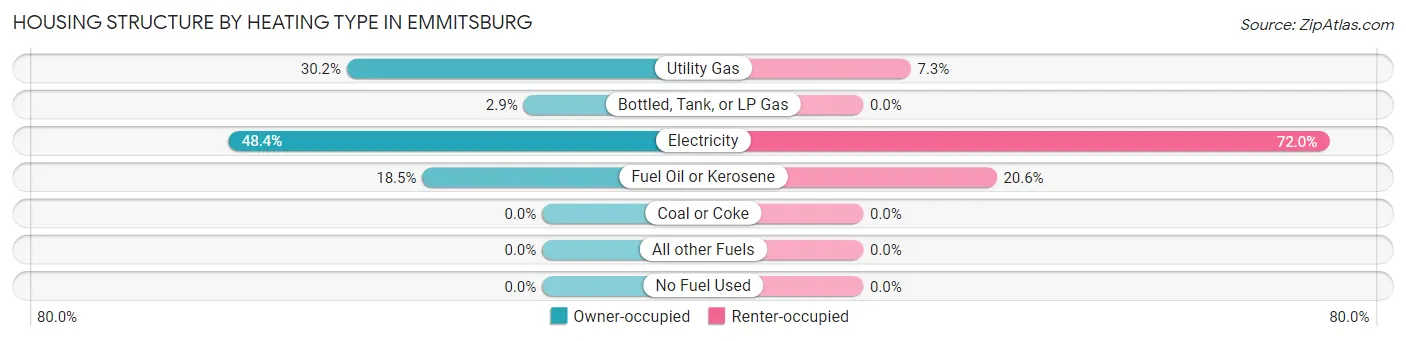
| Heating Type | Owner-occupied | Renter-occupied |
| Utility Gas | 220 (30.2%) | 26 (7.3%) |
| Bottled, Tank, or LP Gas | 21 (2.9%) | 0 (0.0%) |
| Electricity | 353 (48.4%) | 255 (72.0%) |
| Fuel Oil or Kerosene | 135 (18.5%) | 73 (20.6%) |
| Coal or Coke | 0 (0.0%) | 0 (0.0%) |
| All other Fuels | 0 (0.0%) | 0 (0.0%) |
| No Fuel Used | 0 (0.0%) | 0 (0.0%) |
| Total | 729 (100.0%) | 354 (100.0%) |
Household Vehicle Usage in Emmitsburg
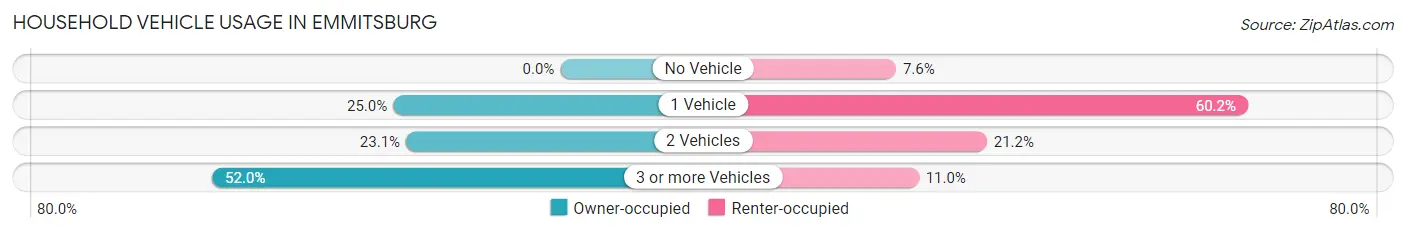
| Vehicles per Household | Owner-occupied | Renter-occupied |
| No Vehicle | 0 (0.0%) | 27 (7.6%) |
| 1 Vehicle | 182 (25.0%) | 213 (60.2%) |
| 2 Vehicles | 168 (23.1%) | 75 (21.2%) |
| 3 or more Vehicles | 379 (52.0%) | 39 (11.0%) |
| Total | 729 (100.0%) | 354 (100.0%) |
Real Estate & Mortgages in Emmitsburg
Real Estate and Mortgage Overview in Emmitsburg
| Characteristic | Without Mortgage | With Mortgage |
| Housing Units | 255 | 474 |
| Median Property Value | $265,000 | $289,100 |
| Median Household Income | $58,009 | $166 |
| Monthly Housing Costs | $707 | $38 |
| Real Estate Taxes | $3,075 | $20 |
Property Value by Mortgage Status in Emmitsburg
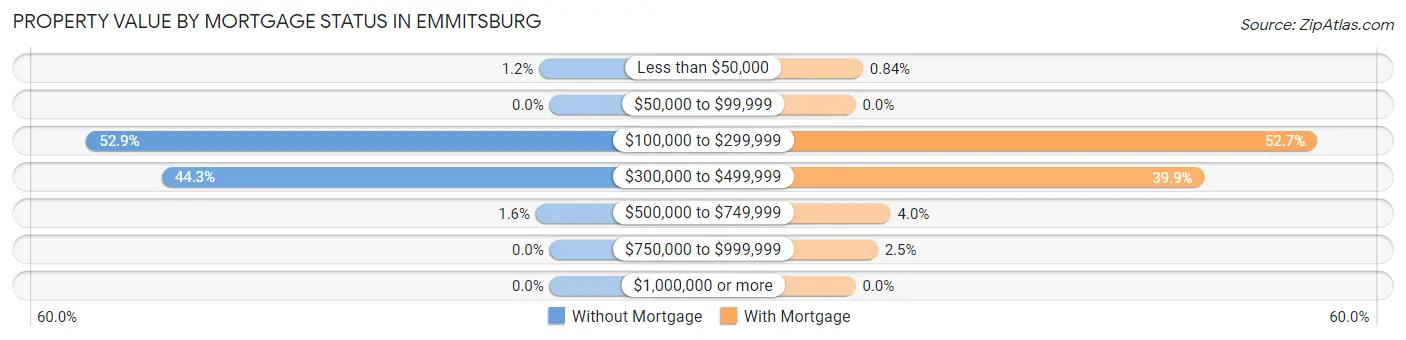
| Property Value | Without Mortgage | With Mortgage |
| Less than $50,000 | 3 (1.2%) | 4 (0.8%) |
| $50,000 to $99,999 | 0 (0.0%) | 0 (0.0%) |
| $100,000 to $299,999 | 135 (52.9%) | 250 (52.7%) |
| $300,000 to $499,999 | 113 (44.3%) | 189 (39.9%) |
| $500,000 to $749,999 | 4 (1.6%) | 19 (4.0%) |
| $750,000 to $999,999 | 0 (0.0%) | 12 (2.5%) |
| $1,000,000 or more | 0 (0.0%) | 0 (0.0%) |
| Total | 255 (100.0%) | 474 (100.0%) |
Household Income by Mortgage Status in Emmitsburg
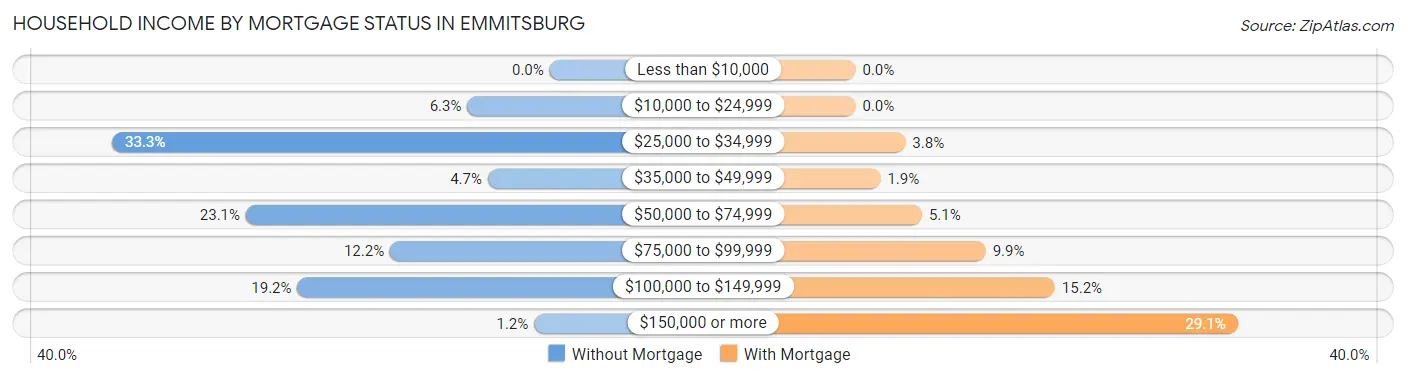
| Household Income | Without Mortgage | With Mortgage |
| Less than $10,000 | 0 (0.0%) | 0 (0.0%) |
| $10,000 to $24,999 | 16 (6.3%) | 0 (0.0%) |
| $25,000 to $34,999 | 85 (33.3%) | 18 (3.8%) |
| $35,000 to $49,999 | 12 (4.7%) | 9 (1.9%) |
| $50,000 to $74,999 | 59 (23.1%) | 24 (5.1%) |
| $75,000 to $99,999 | 31 (12.2%) | 47 (9.9%) |
| $100,000 to $149,999 | 49 (19.2%) | 72 (15.2%) |
| $150,000 or more | 3 (1.2%) | 138 (29.1%) |
| Total | 255 (100.0%) | 474 (100.0%) |
Property Value to Household Income Ratio in Emmitsburg
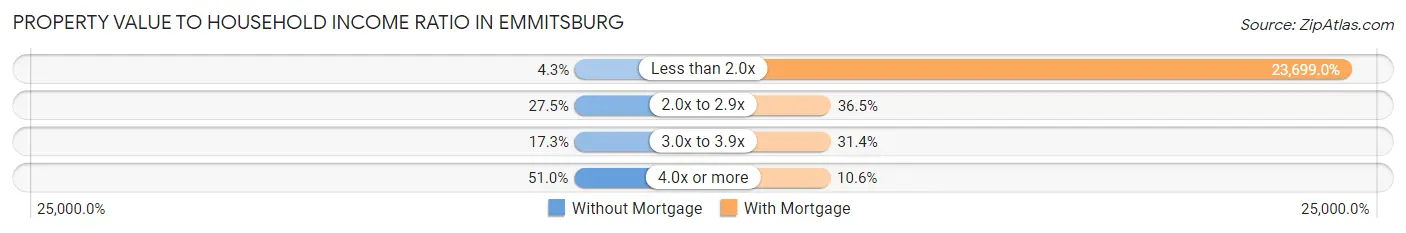
| Value-to-Income Ratio | Without Mortgage | With Mortgage |
| Less than 2.0x | 11 (4.3%) | 112,333 (23,698.9%) |
| 2.0x to 2.9x | 70 (27.5%) | 173 (36.5%) |
| 3.0x to 3.9x | 44 (17.2%) | 149 (31.4%) |
| 4.0x or more | 130 (51.0%) | 50 (10.5%) |
| Total | 255 (100.0%) | 474 (100.0%) |
Real Estate Taxes by Mortgage Status in Emmitsburg
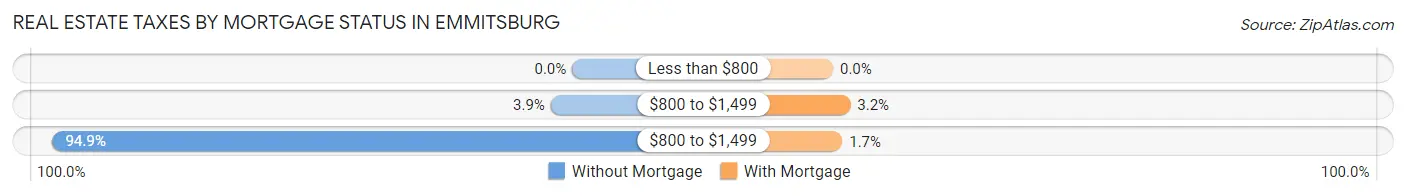
| Property Taxes | Without Mortgage | With Mortgage |
| Less than $800 | 0 (0.0%) | 0 (0.0%) |
| $800 to $1,499 | 10 (3.9%) | 15 (3.2%) |
| $800 to $1,499 | 242 (94.9%) | 8 (1.7%) |
| Total | 255 (100.0%) | 474 (100.0%) |
Health & Disability in Emmitsburg
Health Insurance Coverage by Age in Emmitsburg
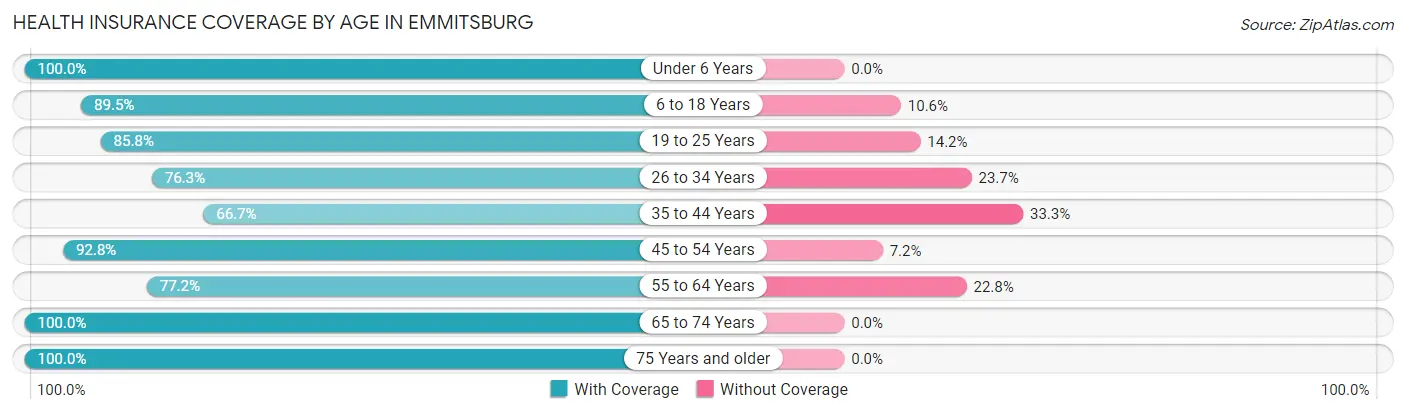
| Age Bracket | With Coverage | Without Coverage |
| Under 6 Years | 164 (100.0%) | 0 (0.0%) |
| 6 to 18 Years | 356 (89.4%) | 42 (10.5%) |
| 19 to 25 Years | 351 (85.8%) | 58 (14.2%) |
| 26 to 34 Years | 225 (76.3%) | 70 (23.7%) |
| 35 to 44 Years | 138 (66.7%) | 69 (33.3%) |
| 45 to 54 Years | 350 (92.8%) | 27 (7.2%) |
| 55 to 64 Years | 210 (77.2%) | 62 (22.8%) |
| 65 to 74 Years | 248 (100.0%) | 0 (0.0%) |
| 75 Years and older | 321 (100.0%) | 0 (0.0%) |
| Total | 2,363 (87.8%) | 328 (12.2%) |
Health Insurance Coverage by Citizenship Status in Emmitsburg
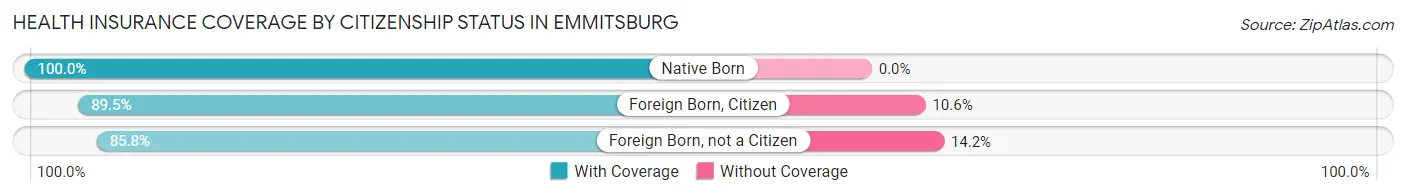
| Citizenship Status | With Coverage | Without Coverage |
| Native Born | 164 (100.0%) | 0 (0.0%) |
| Foreign Born, Citizen | 356 (89.4%) | 42 (10.5%) |
| Foreign Born, not a Citizen | 351 (85.8%) | 58 (14.2%) |
Health Insurance Coverage by Household Income in Emmitsburg
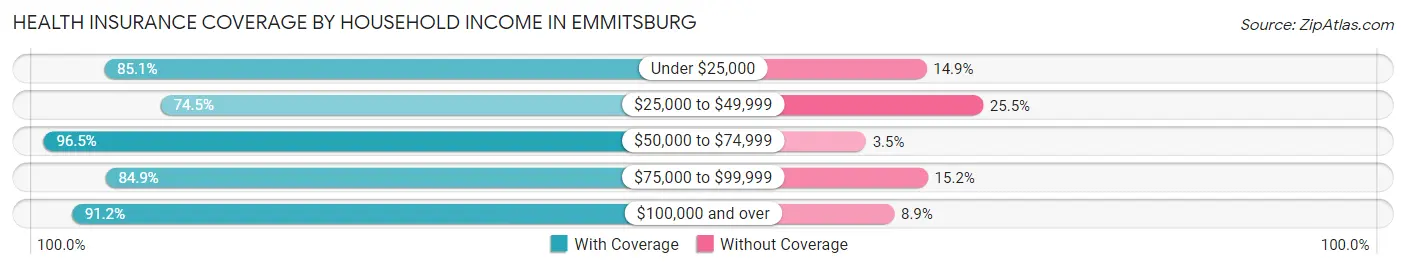
| Household Income | With Coverage | Without Coverage |
| Under $25,000 | 217 (85.1%) | 38 (14.9%) |
| $25,000 to $49,999 | 301 (74.5%) | 103 (25.5%) |
| $50,000 to $74,999 | 300 (96.5%) | 11 (3.5%) |
| $75,000 to $99,999 | 409 (84.9%) | 73 (15.1%) |
| $100,000 and over | 1,061 (91.1%) | 103 (8.8%) |
Public vs Private Health Insurance Coverage by Age in Emmitsburg
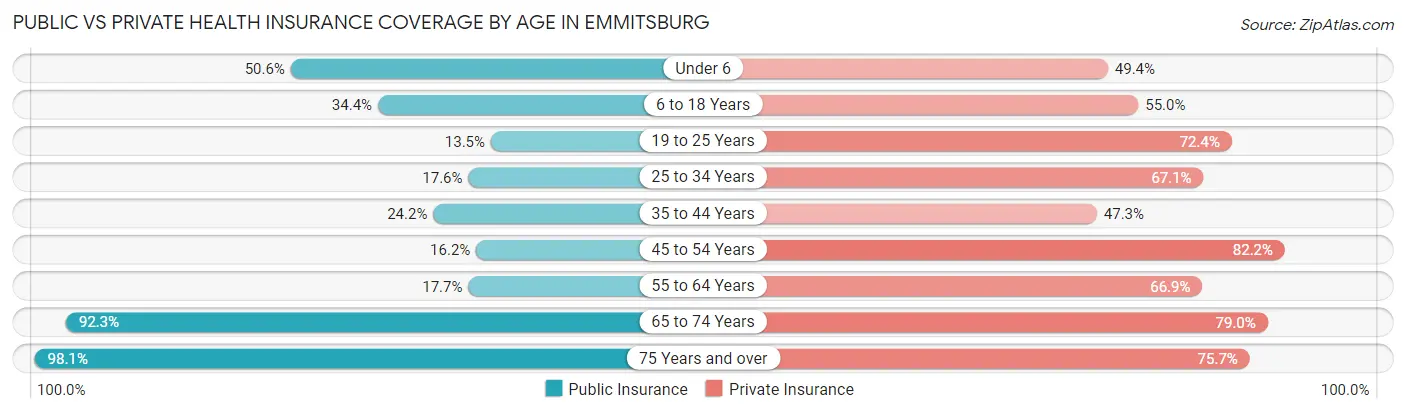
| Age Bracket | Public Insurance | Private Insurance |
| Under 6 | 83 (50.6%) | 81 (49.4%) |
| 6 to 18 Years | 137 (34.4%) | 219 (55.0%) |
| 19 to 25 Years | 55 (13.5%) | 296 (72.4%) |
| 25 to 34 Years | 52 (17.6%) | 198 (67.1%) |
| 35 to 44 Years | 50 (24.1%) | 98 (47.3%) |
| 45 to 54 Years | 61 (16.2%) | 310 (82.2%) |
| 55 to 64 Years | 48 (17.6%) | 182 (66.9%) |
| 65 to 74 Years | 229 (92.3%) | 196 (79.0%) |
| 75 Years and over | 315 (98.1%) | 243 (75.7%) |
| Total | 1,030 (38.3%) | 1,823 (67.7%) |
Disability Status by Sex by Age in Emmitsburg
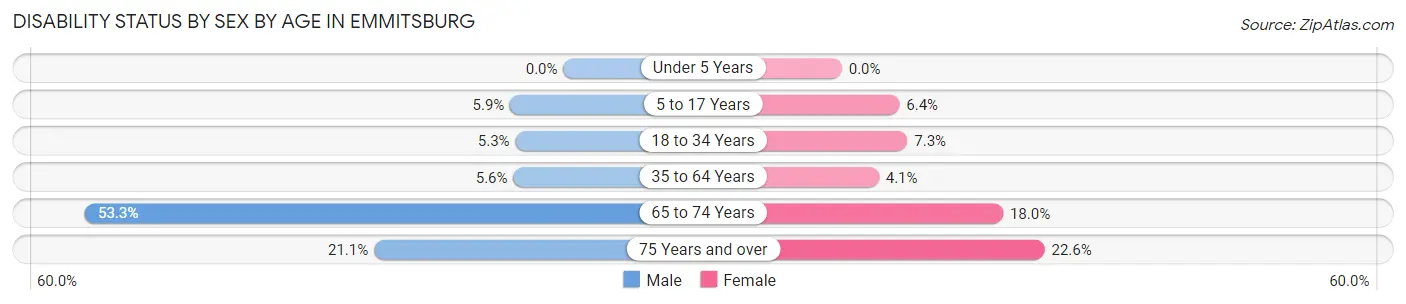
| Age Bracket | Male | Female |
| Under 5 Years | 0 (0.0%) | 0 (0.0%) |
| 5 to 17 Years | 10 (5.9%) | 10 (6.4%) |
| 18 to 34 Years | 22 (5.3%) | 27 (7.3%) |
| 35 to 64 Years | 22 (5.6%) | 19 (4.1%) |
| 65 to 74 Years | 49 (53.3%) | 28 (17.9%) |
| 75 Years and over | 35 (21.1%) | 35 (22.6%) |
Disability Class by Sex by Age in Emmitsburg
Disability Class: Hearing Difficulty
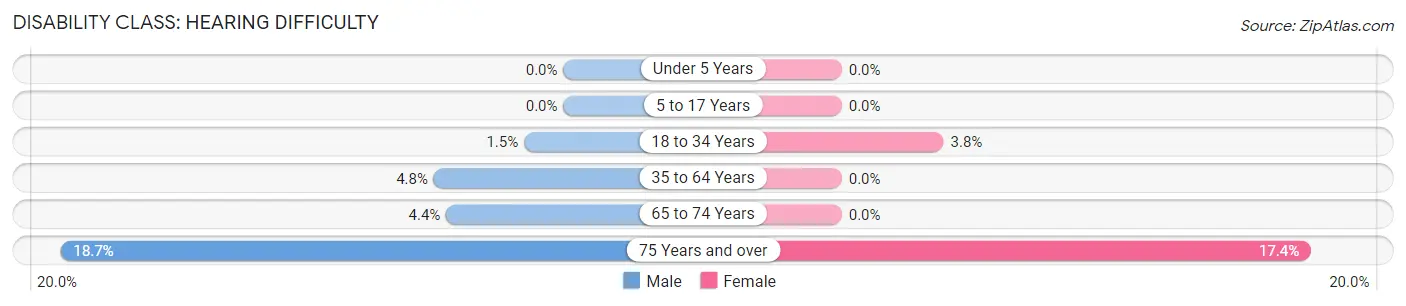
| Age Bracket | Male | Female |
| Under 5 Years | 0 (0.0%) | 0 (0.0%) |
| 5 to 17 Years | 0 (0.0%) | 0 (0.0%) |
| 18 to 34 Years | 6 (1.5%) | 14 (3.8%) |
| 35 to 64 Years | 19 (4.8%) | 0 (0.0%) |
| 65 to 74 Years | 4 (4.3%) | 0 (0.0%) |
| 75 Years and over | 31 (18.7%) | 27 (17.4%) |
Disability Class: Vision Difficulty
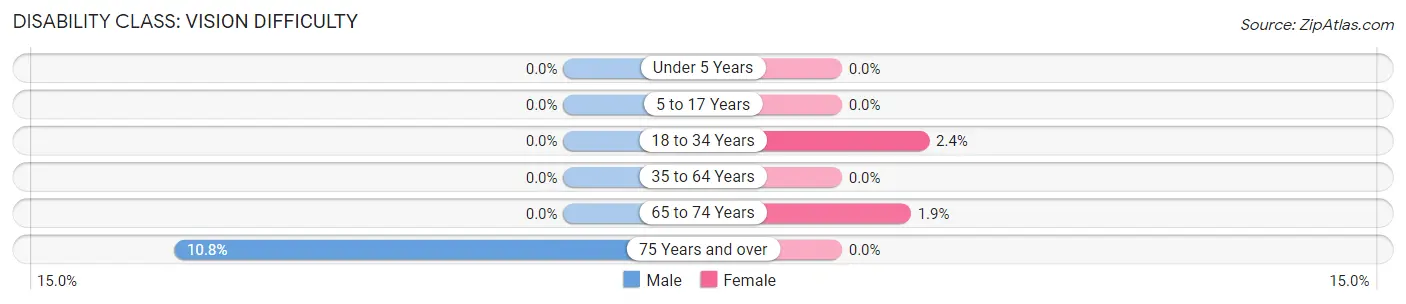
| Age Bracket | Male | Female |
| Under 5 Years | 0 (0.0%) | 0 (0.0%) |
| 5 to 17 Years | 0 (0.0%) | 0 (0.0%) |
| 18 to 34 Years | 0 (0.0%) | 9 (2.4%) |
| 35 to 64 Years | 0 (0.0%) | 0 (0.0%) |
| 65 to 74 Years | 0 (0.0%) | 3 (1.9%) |
| 75 Years and over | 18 (10.8%) | 0 (0.0%) |
Disability Class: Cognitive Difficulty
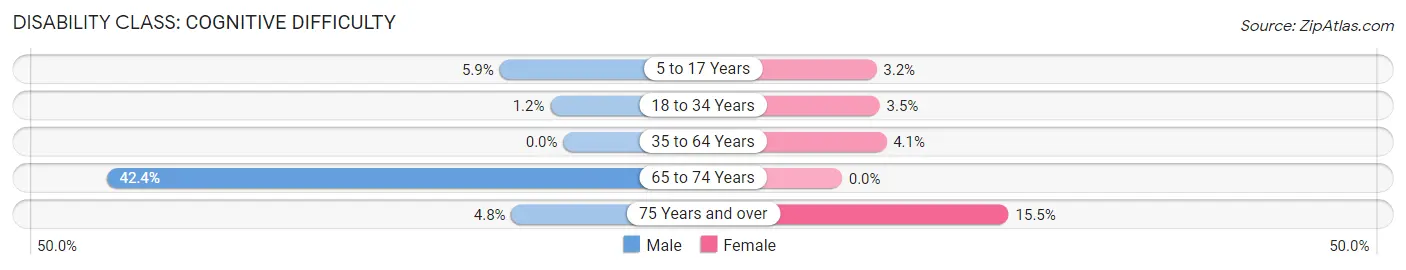
| Age Bracket | Male | Female |
| 5 to 17 Years | 10 (5.9%) | 5 (3.2%) |
| 18 to 34 Years | 5 (1.2%) | 13 (3.5%) |
| 35 to 64 Years | 0 (0.0%) | 19 (4.1%) |
| 65 to 74 Years | 39 (42.4%) | 0 (0.0%) |
| 75 Years and over | 8 (4.8%) | 24 (15.5%) |
Disability Class: Ambulatory Difficulty
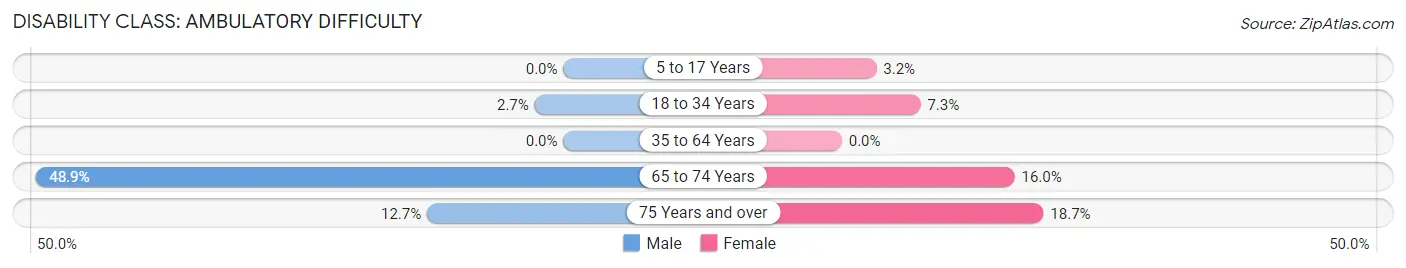
| Age Bracket | Male | Female |
| 5 to 17 Years | 0 (0.0%) | 5 (3.2%) |
| 18 to 34 Years | 11 (2.7%) | 27 (7.3%) |
| 35 to 64 Years | 0 (0.0%) | 0 (0.0%) |
| 65 to 74 Years | 45 (48.9%) | 25 (16.0%) |
| 75 Years and over | 21 (12.7%) | 29 (18.7%) |
Disability Class: Self-Care Difficulty
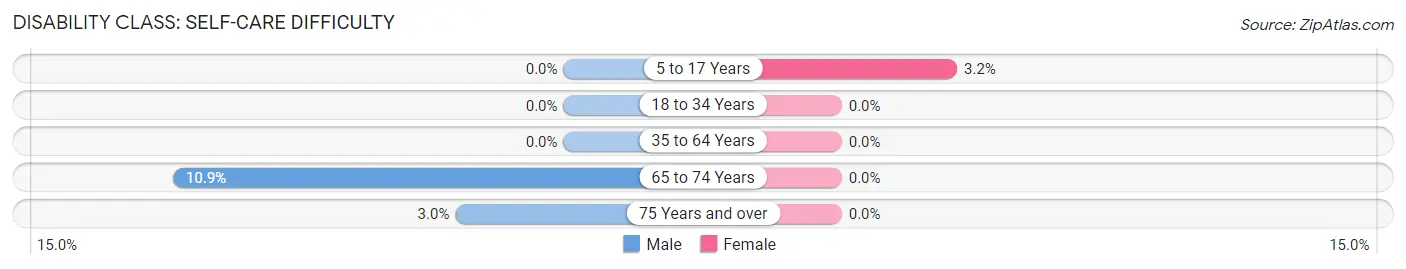
| Age Bracket | Male | Female |
| 5 to 17 Years | 0 (0.0%) | 5 (3.2%) |
| 18 to 34 Years | 0 (0.0%) | 0 (0.0%) |
| 35 to 64 Years | 0 (0.0%) | 0 (0.0%) |
| 65 to 74 Years | 10 (10.9%) | 0 (0.0%) |
| 75 Years and over | 5 (3.0%) | 0 (0.0%) |
Technology Access in Emmitsburg
Computing Device Access in Emmitsburg
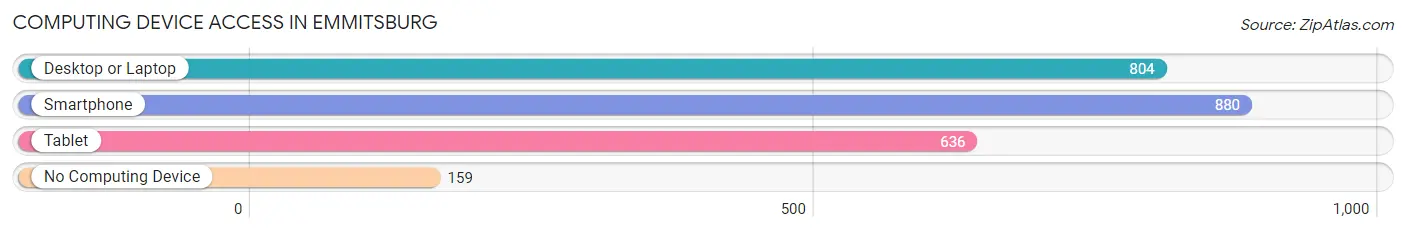
| Device Type | # Households | % Households |
| Desktop or Laptop | 804 | 74.2% |
| Smartphone | 880 | 81.3% |
| Tablet | 636 | 58.7% |
| No Computing Device | 159 | 14.7% |
| Total | 1,083 | 100.0% |
Internet Access in Emmitsburg
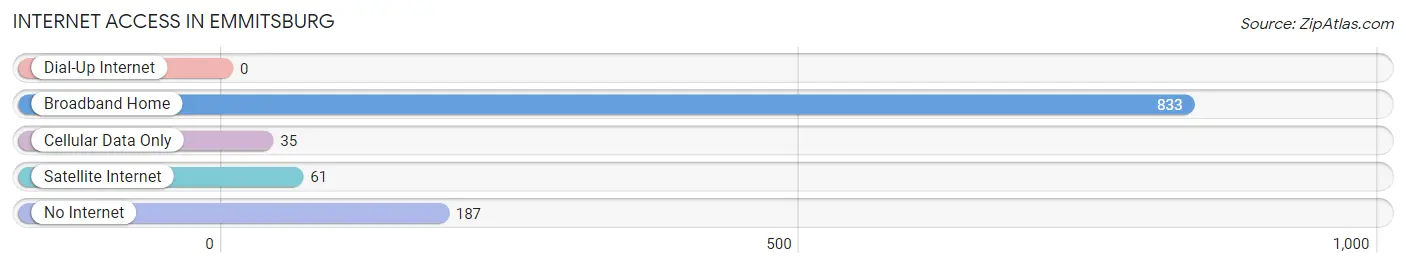
| Internet Type | # Households | % Households |
| Dial-Up Internet | 0 | 0.0% |
| Broadband Home | 833 | 76.9% |
| Cellular Data Only | 35 | 3.2% |
| Satellite Internet | 61 | 5.6% |
| No Internet | 187 | 17.3% |
| Total | 1,083 | 100.0% |
Emmitsburg Summary
Emmitsburg, Maryland is a small town located in Frederick County, Maryland, approximately 10 miles south of the Pennsylvania border. The town is situated in the Catoctin Valley, a region of rolling hills and valleys that is part of the Appalachian Mountains. The town is home to approximately 2,200 people and is the home of Mount St. Mary’s University, a private Catholic university.
History
Emmitsburg was founded in 1785 by German immigrant Michael Emmit. The town was originally known as Emmitsburg Crossroads, and was a small farming community. In 1808, the town was officially incorporated as Emmitsburg.
In 1826, the town was chosen as the site of Mount St. Mary’s University, a private Catholic university. The university has been a major part of the town’s history and economy ever since.
During the Civil War, Emmitsburg was a major stop on the Underground Railroad. The town was also the site of the Battle of Emmitsburg, a major battle in the Gettysburg Campaign.
Geography
Emmitsburg is located in the Catoctin Valley, a region of rolling hills and valleys that is part of the Appalachian Mountains. The town is situated at the intersection of US Route 15 and US Route 40. The town is approximately 10 miles south of the Pennsylvania border and is approximately 50 miles northwest of Baltimore.
The town is located in a temperate climate, with hot summers and cold winters. The average annual temperature is around 50 degrees Fahrenheit.
Economy
Emmitsburg’s economy is largely based on tourism and education. The town is home to Mount St. Mary’s University, which is a major employer in the area. The university also attracts many visitors to the town, as do the nearby Catoctin Mountain Park and Gettysburg National Military Park.
The town is also home to several small businesses including restaurants shops and other services
Demographics
As of the 2010 census, the population of Emmitsburg was 2,178. The racial makeup of the town was 91.3% White, 4.2% African American, 0.3% Native American, 1.2% Asian, 0.1% Pacific Islander, 1.2% from other races, and 1.7% from two or more races. Hispanic or Latino of any race were 3.2% of the population.
The median household income in Emmitsburg was $50,977, and the median family income was $60,938. The per capita income for the town was $22,945. About 8.2% of families and 10.3% of the population were below the poverty line, including 14.2% of those under age 18 and 5.2% of those age 65 or over.
Common Questions
What is Per Capita Income in Emmitsburg?
Per Capita income in Emmitsburg is $33,379.
What is the Median Family Income in Emmitsburg?
Median Family Income in Emmitsburg is $88,879.
What is the Median Household income in Emmitsburg?
Median Household Income in Emmitsburg is $74,563.
What is Income or Wage Gap in Emmitsburg?
Income or Wage Gap in Emmitsburg is 39.0%.
Women in Emmitsburg earn 61.0 cents for every dollar earned by a man.
What is Inequality or Gini Index in Emmitsburg?
Inequality or Gini Index in Emmitsburg is 0.41.
What is the Total Population of Emmitsburg?
Total Population of Emmitsburg is 2,818.
What is the Total Male Population of Emmitsburg?
Total Male Population of Emmitsburg is 1,411.
What is the Total Female Population of Emmitsburg?
Total Female Population of Emmitsburg is 1,407.
What is the Ratio of Males per 100 Females in Emmitsburg?
There are 100.28 Males per 100 Females in Emmitsburg.
What is the Ratio of Females per 100 Males in Emmitsburg?
There are 99.72 Females per 100 Males in Emmitsburg.
What is the Median Population Age in Emmitsburg?
Median Population Age in Emmitsburg is 39.5 Years.
What is the Average Family Size in Emmitsburg
Average Family Size in Emmitsburg is 3.0 People.
What is the Average Household Size in Emmitsburg
Average Household Size in Emmitsburg is 2.5 People.
How Large is the Labor Force in Emmitsburg?
There are 1,532 People in the Labor Forcein in Emmitsburg.
What is the Percentage of People in the Labor Force in Emmitsburg?
63.9% of People are in the Labor Force in Emmitsburg.
What is the Unemployment Rate in Emmitsburg?
Unemployment Rate in Emmitsburg is 4.0%.