Vinton, IA Map & Demographics
Vinton Map
Vinton Overview
$34,619
PER CAPITA INCOME
$84,476
AVG FAMILY INCOME
$63,100
AVG HOUSEHOLD INCOME
12.6%
WAGE / INCOME GAP [ % ]
87.4¢/ $1
WAGE / INCOME GAP [ $ ]
0.46
INEQUALITY / GINI INDEX
4,953
TOTAL POPULATION
2,267
MALE POPULATION
2,686
FEMALE POPULATION
84.40
MALES / 100 FEMALES
118.48
FEMALES / 100 MALES
44.1
MEDIAN AGE
2.9
AVG FAMILY SIZE
2.2
AVG HOUSEHOLD SIZE
2,358
LABOR FORCE [ PEOPLE ]
61.0%
PERCENT IN LABOR FORCE
2.2%
UNEMPLOYMENT RATE
Vinton Zip Codes
Vinton Area Codes
Income in Vinton
Income Overview in Vinton
Per Capita Income in Vinton is $34,619, while median incomes of families and households are $84,476 and $63,100 respectively.
| Characteristic | Number | Measure |
| Per Capita Income | 4,953 | $34,619 |
| Median Family Income | 1,203 | $84,476 |
| Mean Family Income | 1,203 | $107,449 |
| Median Household Income | 2,154 | $63,100 |
| Mean Household Income | 2,154 | $78,763 |
| Income Deficit | 1,203 | $0 |
| Wage / Income Gap (%) | 4,953 | 12.62% |
| Wage / Income Gap ($) | 4,953 | 87.38¢ per $1 |
| Gini / Inequality Index | 4,953 | 0.46 |
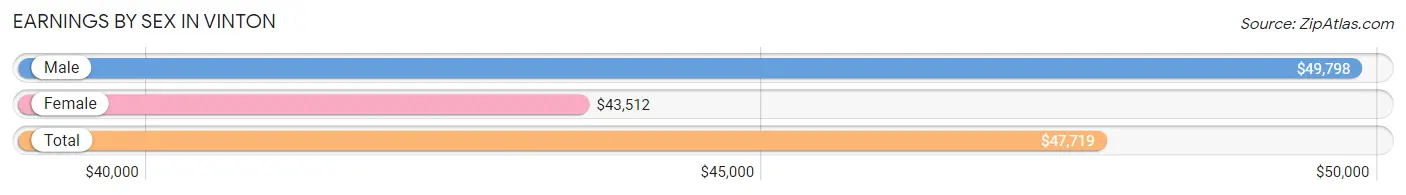
Earnings by Sex in Vinton
Average Earnings in Vinton are $47,719, $49,798 for men and $43,512 for women, a difference of 12.6%.
| Sex | Number | Average Earnings |
| Male | 1,285 (51.0%) | $49,798 |
| Female | 1,236 (49.0%) | $43,512 |
| Total | 2,521 (100.0%) | $47,719 |
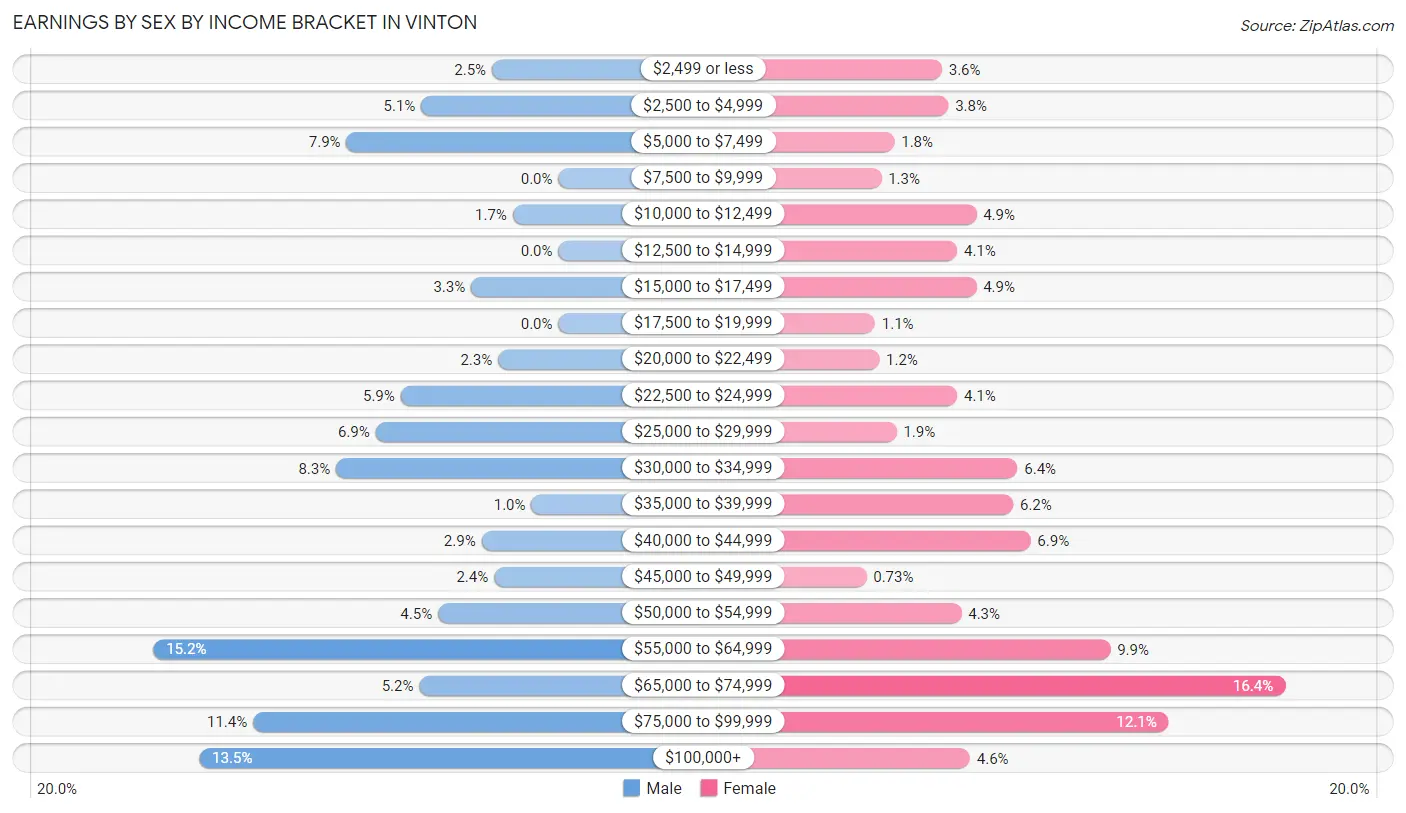
Earnings by Sex by Income Bracket in Vinton
The most common earnings brackets in Vinton are $55,000 to $64,999 for men (195 | 15.2%) and $65,000 to $74,999 for women (203 | 16.4%).
| Income | Male | Female |
| $2,499 or less | 32 (2.5%) | 44 (3.6%) |
| $2,500 to $4,999 | 66 (5.1%) | 47 (3.8%) |
| $5,000 to $7,499 | 102 (7.9%) | 22 (1.8%) |
| $7,500 to $9,999 | 0 (0.0%) | 16 (1.3%) |
| $10,000 to $12,499 | 22 (1.7%) | 60 (4.9%) |
| $12,500 to $14,999 | 0 (0.0%) | 51 (4.1%) |
| $15,000 to $17,499 | 42 (3.3%) | 60 (4.9%) |
| $17,500 to $19,999 | 0 (0.0%) | 13 (1.1%) |
| $20,000 to $22,499 | 29 (2.3%) | 15 (1.2%) |
| $22,500 to $24,999 | 76 (5.9%) | 51 (4.1%) |
| $25,000 to $29,999 | 88 (6.9%) | 23 (1.9%) |
| $30,000 to $34,999 | 107 (8.3%) | 79 (6.4%) |
| $35,000 to $39,999 | 13 (1.0%) | 77 (6.2%) |
| $40,000 to $44,999 | 37 (2.9%) | 85 (6.9%) |
| $45,000 to $49,999 | 31 (2.4%) | 9 (0.7%) |
| $50,000 to $54,999 | 58 (4.5%) | 53 (4.3%) |
| $55,000 to $64,999 | 195 (15.2%) | 122 (9.9%) |
| $65,000 to $74,999 | 67 (5.2%) | 203 (16.4%) |
| $75,000 to $99,999 | 147 (11.4%) | 149 (12.1%) |
| $100,000+ | 173 (13.5%) | 57 (4.6%) |
| Total | 1,285 (100.0%) | 1,236 (100.0%) |
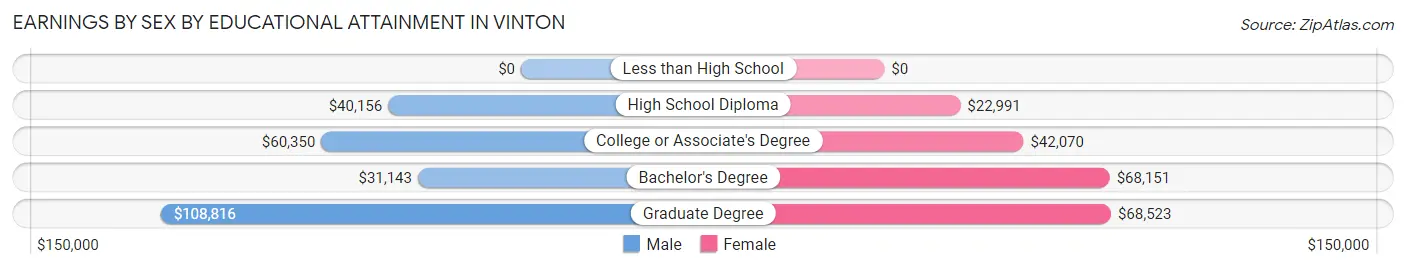
Earnings by Sex by Educational Attainment in Vinton
Average earnings in Vinton are $56,344 for men and $55,804 for women, a difference of 1.0%. Men with an educational attainment of graduate degree enjoy the highest average annual earnings of $108,816, while those with bachelor's degree education earn the least with $31,143. Women with an educational attainment of graduate degree earn the most with the average annual earnings of $68,523, while those with high school diploma education have the smallest earnings of $22,991.
| Educational Attainment | Male Income | Female Income |
| Less than High School | - | - |
| High School Diploma | $40,156 | $22,991 |
| College or Associate's Degree | $60,350 | $42,070 |
| Bachelor's Degree | $31,143 | $68,151 |
| Graduate Degree | $108,816 | $68,523 |
| Total | $56,344 | $55,804 |
Family Income in Vinton
Family Income Brackets in Vinton
According to the Vinton family income data, there are 275 families falling into the $50,000 to $74,999 income range, which is the most common income bracket and makes up 22.9% of all families.
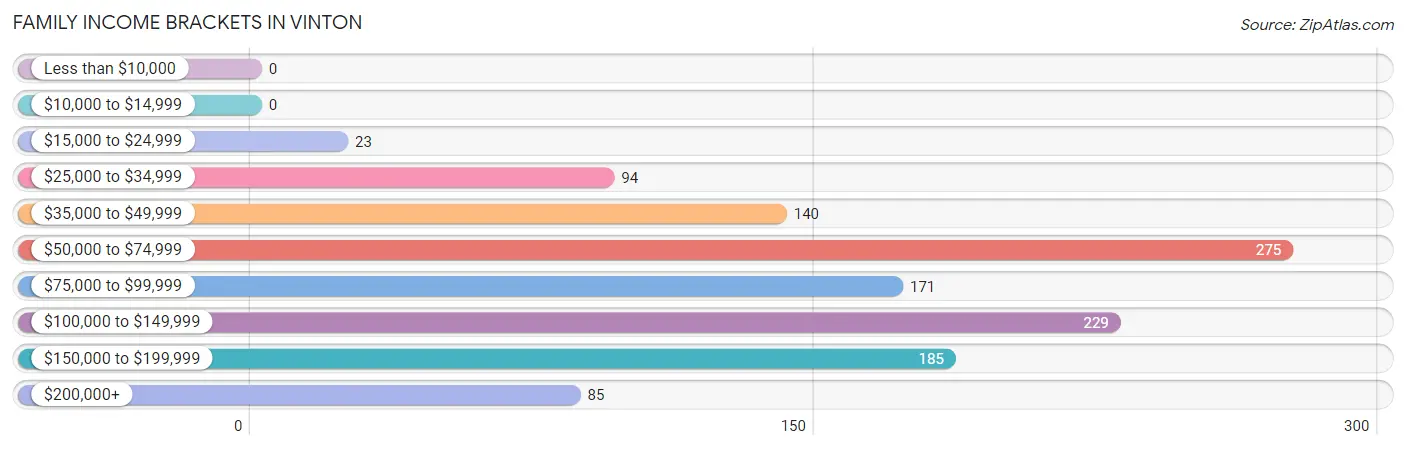
| Income Bracket | # Families | % Families |
| Less than $10,000 | 0 | 0.0% |
| $10,000 to $14,999 | 0 | 0.0% |
| $15,000 to $24,999 | 23 | 1.9% |
| $25,000 to $34,999 | 94 | 7.8% |
| $35,000 to $49,999 | 140 | 11.6% |
| $50,000 to $74,999 | 275 | 22.9% |
| $75,000 to $99,999 | 171 | 14.2% |
| $100,000 to $149,999 | 229 | 19.0% |
| $150,000 to $199,999 | 185 | 15.4% |
| $200,000+ | 85 | 7.1% |
Family Income by Famaliy Size in Vinton
5-person families (58 | 4.8%) account for the highest median family income in Vinton with $250,001 per family, while 5-person families (58 | 4.8%) have the highest median income of $50,000 per family member.
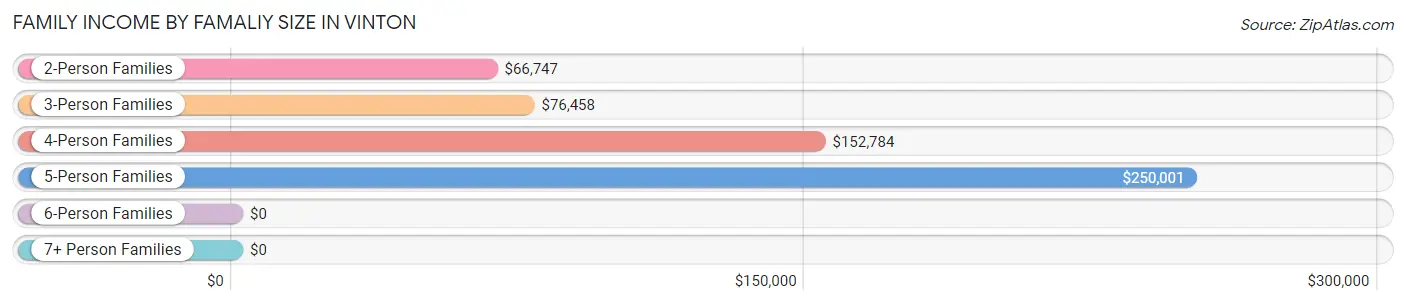
| Income Bracket | # Families | Median Income |
| 2-Person Families | 712 (59.2%) | $66,747 |
| 3-Person Families | 82 (6.8%) | $76,458 |
| 4-Person Families | 296 (24.6%) | $152,784 |
| 5-Person Families | 58 (4.8%) | $250,001 |
| 6-Person Families | 24 (2.0%) | $0 |
| 7+ Person Families | 31 (2.6%) | $0 |
| Total | 1,203 (100.0%) | $84,476 |
Family Income by Number of Earners in Vinton
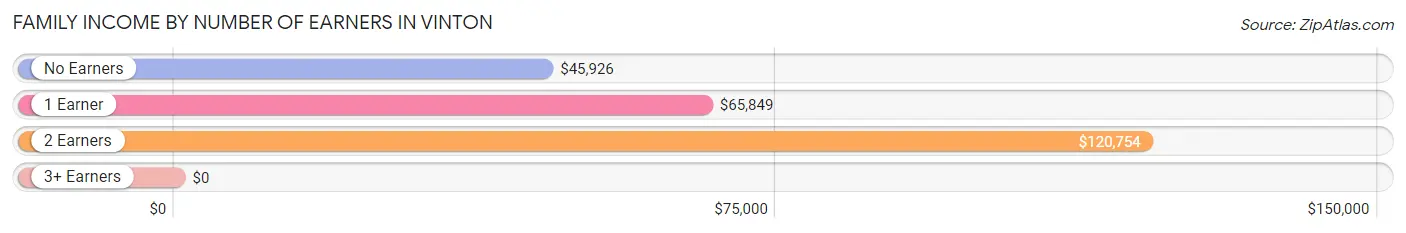
| Number of Earners | # Families | Median Income |
| No Earners | 168 (14.0%) | $45,926 |
| 1 Earner | 343 (28.5%) | $65,849 |
| 2 Earners | 599 (49.8%) | $120,754 |
| 3+ Earners | 93 (7.7%) | $0 |
| Total | 1,203 (100.0%) | $84,476 |
Household Income in Vinton
Household Income Brackets in Vinton
With 355 households falling in the category, the $50,000 to $74,999 income range is the most frequent in Vinton, accounting for 16.5% of all households. In contrast, only 99 households (4.6%) fall into the $200,000+ income bracket, making it the least populous group.
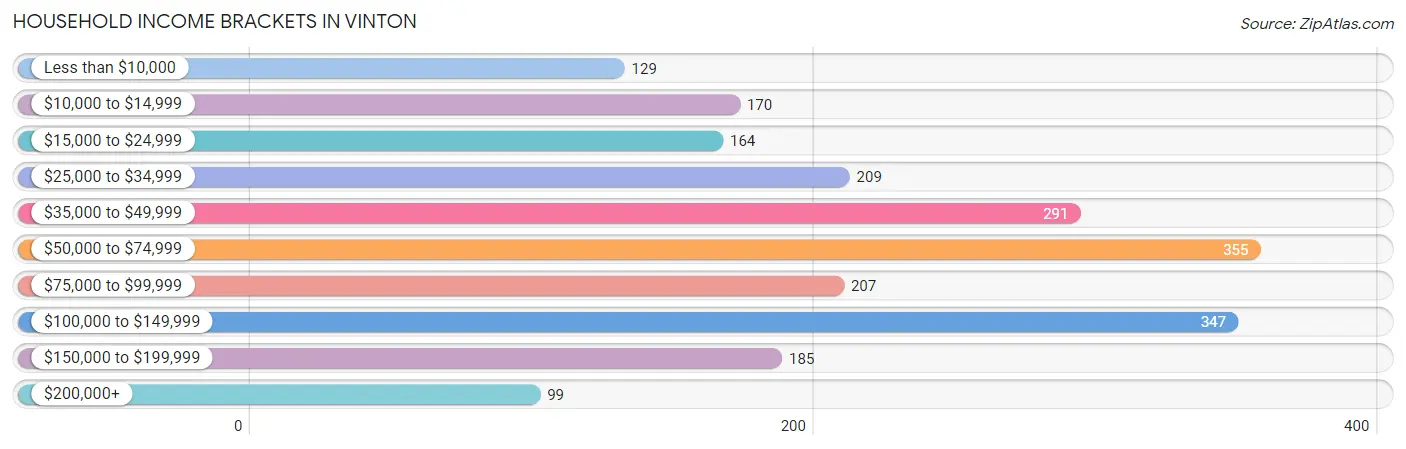
| Income Bracket | # Households | % Households |
| Less than $10,000 | 129 | 6.0% |
| $10,000 to $14,999 | 170 | 7.9% |
| $15,000 to $24,999 | 164 | 7.6% |
| $25,000 to $34,999 | 209 | 9.7% |
| $35,000 to $49,999 | 291 | 13.5% |
| $50,000 to $74,999 | 355 | 16.5% |
| $75,000 to $99,999 | 207 | 9.6% |
| $100,000 to $149,999 | 347 | 16.1% |
| $150,000 to $199,999 | 185 | 8.6% |
| $200,000+ | 99 | 4.6% |
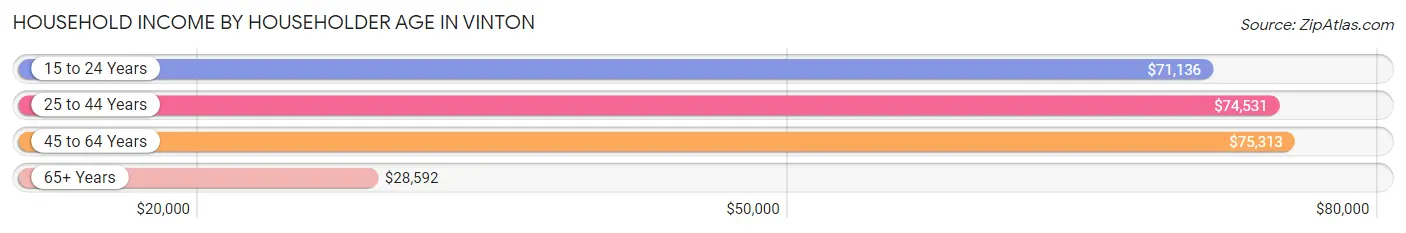
Household Income by Householder Age in Vinton
The median household income in Vinton is $63,100, with the highest median household income of $75,313 found in the 45 to 64 years age bracket for the primary householder. A total of 808 households (37.5%) fall into this category. Meanwhile, the 65+ years age bracket for the primary householder has the lowest median household income of $28,592, with 748 households (34.7%) in this group.
| Income Bracket | # Households | Median Income |
| 15 to 24 Years | 36 (1.7%) | $71,136 |
| 25 to 44 Years | 562 (26.1%) | $74,531 |
| 45 to 64 Years | 808 (37.5%) | $75,313 |
| 65+ Years | 748 (34.7%) | $28,592 |
| Total | 2,154 (100.0%) | $63,100 |
Poverty in Vinton
Income Below Poverty by Sex and Age in Vinton
With 4.6% poverty level for males and 15.8% for females among the residents of Vinton, 16 and 17 year old males and 75 year old and over females are the most vulnerable to poverty, with 20 males (52.6%) and 157 females (69.5%) in their respective age groups living below the poverty level.
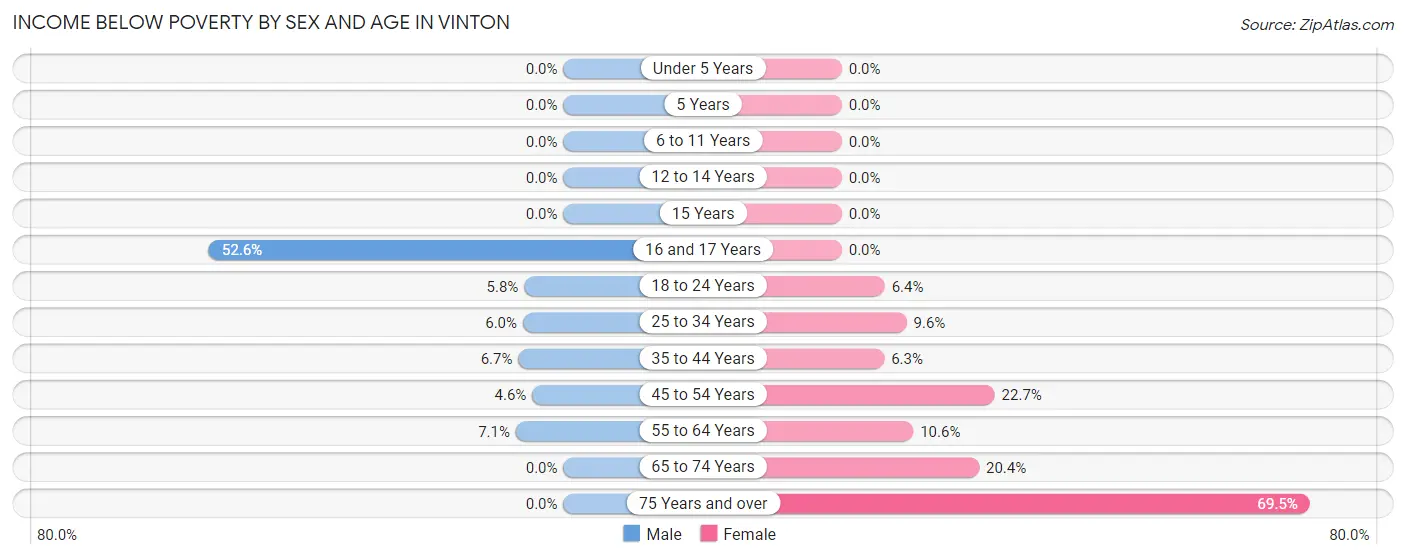
| Age Bracket | Male | Female |
| Under 5 Years | 0 (0.0%) | 0 (0.0%) |
| 5 Years | 0 (0.0%) | 0 (0.0%) |
| 6 to 11 Years | 0 (0.0%) | 0 (0.0%) |
| 12 to 14 Years | 0 (0.0%) | 0 (0.0%) |
| 15 Years | 0 (0.0%) | 0 (0.0%) |
| 16 and 17 Years | 20 (52.6%) | 0 (0.0%) |
| 18 to 24 Years | 11 (5.8%) | 12 (6.4%) |
| 25 to 34 Years | 11 (6.0%) | 15 (9.6%) |
| 35 to 44 Years | 22 (6.7%) | 23 (6.3%) |
| 45 to 54 Years | 12 (4.6%) | 74 (22.7%) |
| 55 to 64 Years | 23 (7.1%) | 33 (10.6%) |
| 65 to 74 Years | 0 (0.0%) | 85 (20.4%) |
| 75 Years and over | 0 (0.0%) | 157 (69.5%) |
| Total | 99 (4.6%) | 399 (15.8%) |
Income Above Poverty by Sex and Age in Vinton
According to the poverty statistics in Vinton, males aged under 5 years and females aged under 5 years are the age groups that are most secure financially, with 100.0% of males and 100.0% of females in these age groups living above the poverty line.
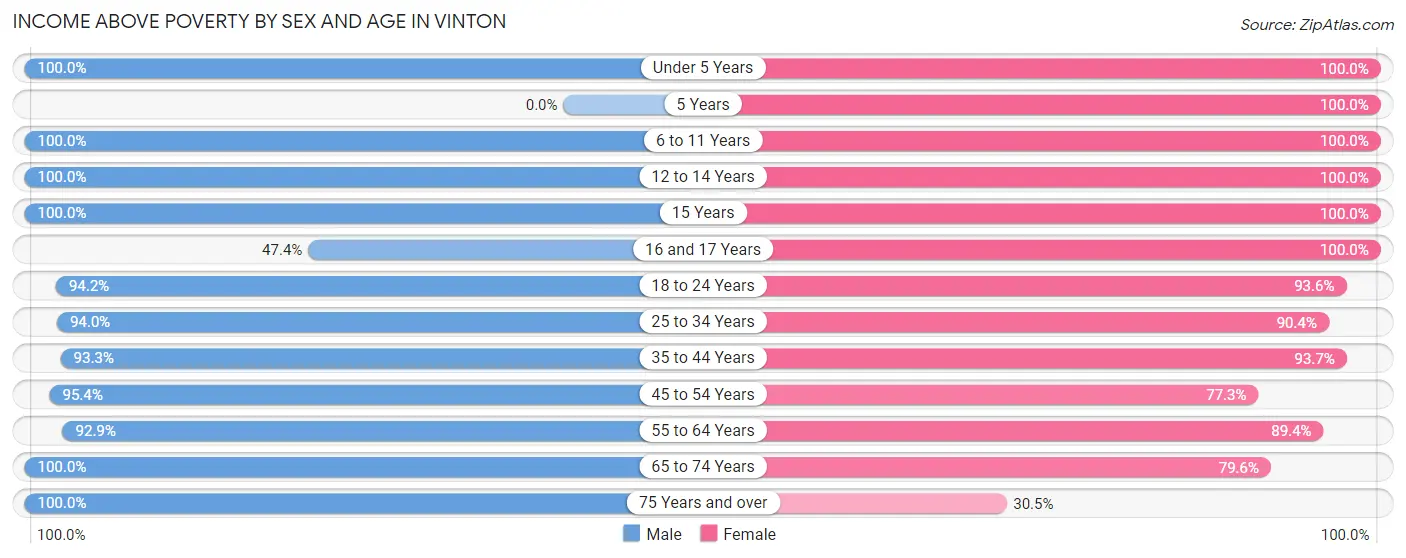
| Age Bracket | Male | Female |
| Under 5 Years | 31 (100.0%) | 102 (100.0%) |
| 5 Years | 0 (0.0%) | 60 (100.0%) |
| 6 to 11 Years | 189 (100.0%) | 218 (100.0%) |
| 12 to 14 Years | 210 (100.0%) | 104 (100.0%) |
| 15 Years | 26 (100.0%) | 7 (100.0%) |
| 16 and 17 Years | 18 (47.4%) | 47 (100.0%) |
| 18 to 24 Years | 178 (94.2%) | 176 (93.6%) |
| 25 to 34 Years | 172 (94.0%) | 141 (90.4%) |
| 35 to 44 Years | 307 (93.3%) | 342 (93.7%) |
| 45 to 54 Years | 247 (95.4%) | 252 (77.3%) |
| 55 to 64 Years | 303 (92.9%) | 278 (89.4%) |
| 65 to 74 Years | 233 (100.0%) | 332 (79.6%) |
| 75 Years and over | 139 (100.0%) | 69 (30.5%) |
| Total | 2,053 (95.4%) | 2,128 (84.2%) |
Income Below Poverty Among Married-Couple Families in Vinton
The poverty statistics for married-couple families in Vinton show that 2.4% or 23 of the total 948 families live below the poverty line. Families with no children have the highest poverty rate of 4.3%, comprising of 23 families. On the other hand, families with 1 or 2 children have the lowest poverty rate of 0.0%, which includes 0 families.
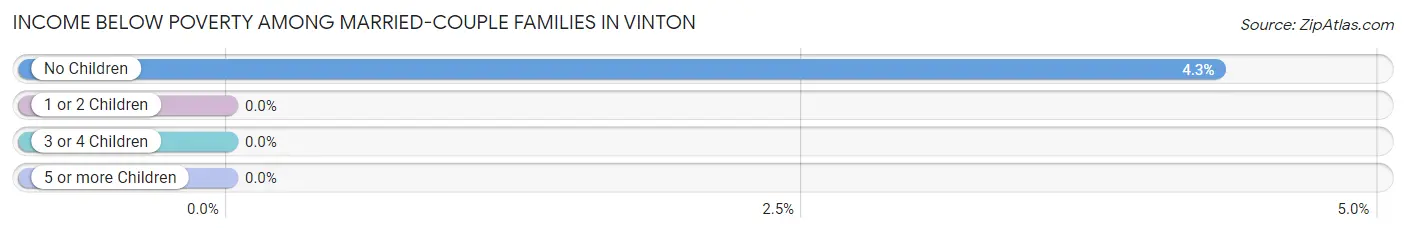
| Children | Above Poverty | Below Poverty |
| No Children | 512 (95.7%) | 23 (4.3%) |
| 1 or 2 Children | 325 (100.0%) | 0 (0.0%) |
| 3 or 4 Children | 57 (100.0%) | 0 (0.0%) |
| 5 or more Children | 31 (100.0%) | 0 (0.0%) |
| Total | 925 (97.6%) | 23 (2.4%) |
Income Below Poverty Among Single-Parent Households in Vinton
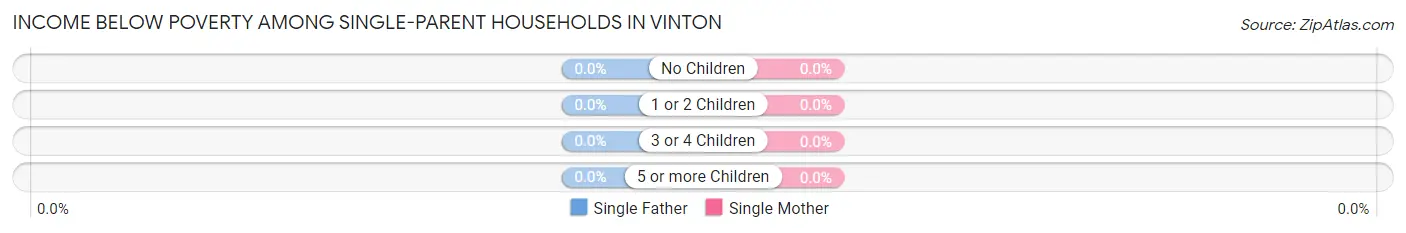
| Children | Single Father | Single Mother |
| No Children | 0 (0.0%) | 0 (0.0%) |
| 1 or 2 Children | 0 (0.0%) | 0 (0.0%) |
| 3 or 4 Children | 0 (0.0%) | 0 (0.0%) |
| 5 or more Children | 0 (0.0%) | 0 (0.0%) |
| Total | 0 (0.0%) | 0 (0.0%) |
Income Below Poverty Among Married-Couple vs Single-Parent Households in Vinton
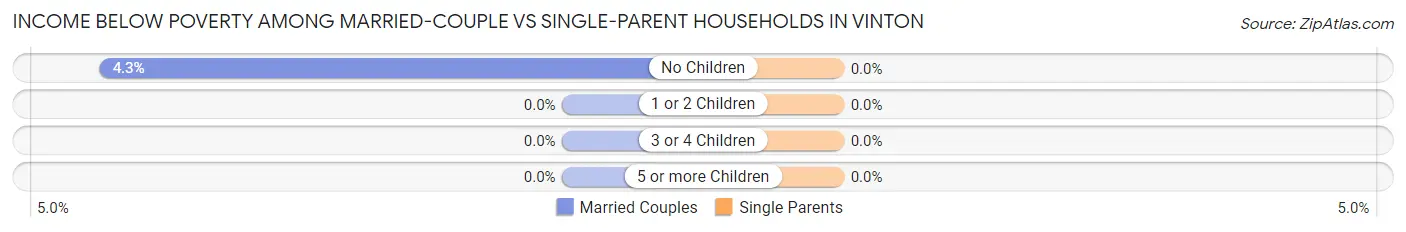
| Children | Married-Couple Families | Single-Parent Households |
| No Children | 23 (4.3%) | 0 (0.0%) |
| 1 or 2 Children | 0 (0.0%) | 0 (0.0%) |
| 3 or 4 Children | 0 (0.0%) | 0 (0.0%) |
| 5 or more Children | 0 (0.0%) | 0 (0.0%) |
| Total | 23 (2.4%) | 0 (0.0%) |
Race in Vinton
The most populous races in Vinton are White / Caucasian (4,602 | 92.9%), Two or more Races (164 | 3.3%), and Hispanic or Latino (145 | 2.9%).
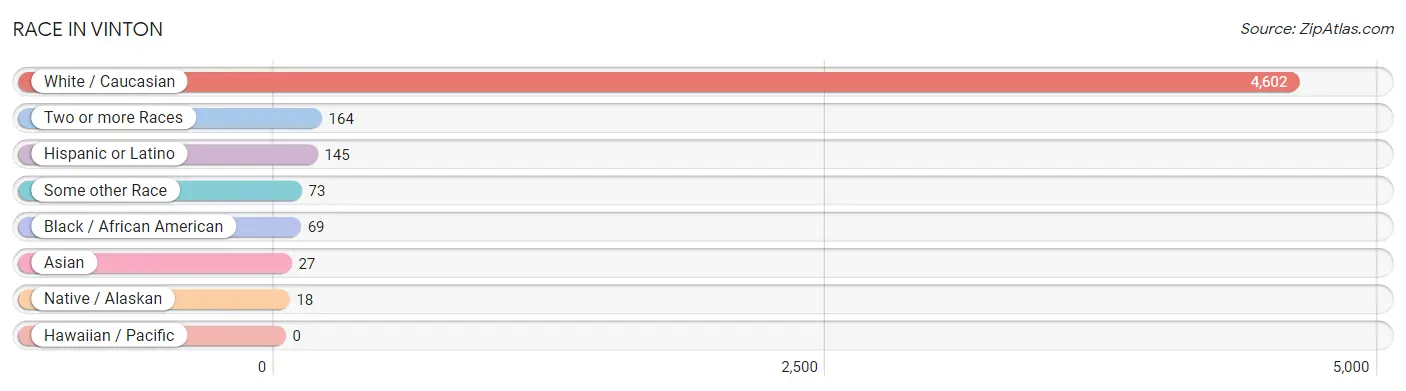
| Race | # Population | % Population |
| Asian | 27 | 0.5% |
| Black / African American | 69 | 1.4% |
| Hawaiian / Pacific | 0 | 0.0% |
| Hispanic or Latino | 145 | 2.9% |
| Native / Alaskan | 18 | 0.4% |
| White / Caucasian | 4,602 | 92.9% |
| Two or more Races | 164 | 3.3% |
| Some other Race | 73 | 1.5% |
| Total | 4,953 | 100.0% |
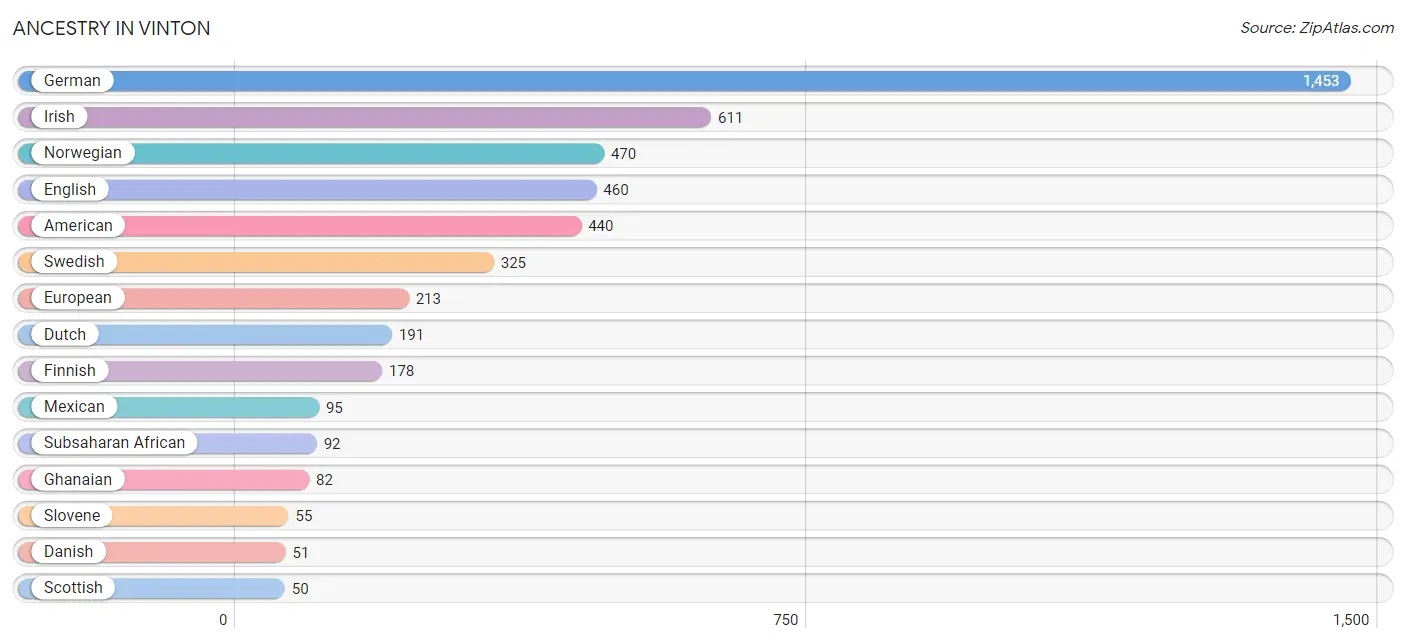
Ancestry in Vinton
The most populous ancestries reported in Vinton are German (1,453 | 29.3%), Irish (611 | 12.3%), Norwegian (470 | 9.5%), English (460 | 9.3%), and American (440 | 8.9%), together accounting for 69.3% of all Vinton residents.
| Ancestry | # Population | % Population |
| African | 10 | 0.2% |
| American | 440 | 8.9% |
| Apache | 8 | 0.2% |
| Belgian | 26 | 0.5% |
| British | 1 | 0.0% |
| Central American | 26 | 0.5% |
| Cherokee | 8 | 0.2% |
| Czech | 42 | 0.9% |
| Czechoslovakian | 13 | 0.3% |
| Danish | 51 | 1.0% |
| Dutch | 191 | 3.9% |
| English | 460 | 9.3% |
| European | 213 | 4.3% |
| Finnish | 178 | 3.6% |
| French | 37 | 0.7% |
| French Canadian | 21 | 0.4% |
| German | 1,453 | 29.3% |
| Ghanaian | 82 | 1.7% |
| Guatemalan | 1 | 0.0% |
| Honduran | 7 | 0.1% |
| Irish | 611 | 12.3% |
| Italian | 12 | 0.2% |
| Lithuanian | 12 | 0.2% |
| Mexican | 95 | 1.9% |
| Navajo | 1 | 0.0% |
| Northern European | 11 | 0.2% |
| Norwegian | 470 | 9.5% |
| Polish | 12 | 0.2% |
| Russian | 12 | 0.2% |
| Salvadoran | 18 | 0.4% |
| Scotch-Irish | 38 | 0.8% |
| Scottish | 50 | 1.0% |
| Sioux | 10 | 0.2% |
| Slovene | 55 | 1.1% |
| Subsaharan African | 92 | 1.9% |
| Swedish | 325 | 6.6% |
| Swiss | 1 | 0.0% |
| Thai | 27 | 0.5% |
| Welsh | 11 | 0.2% | View All 39 Rows |
Immigrants in Vinton
The most numerous immigrant groups reported in Vinton came from Central America (29 | 0.6%), Latin America (29 | 0.6%), Mexico (28 | 0.6%), Asia (27 | 0.5%), and India (27 | 0.5%), together accounting for 2.8% of all Vinton residents.
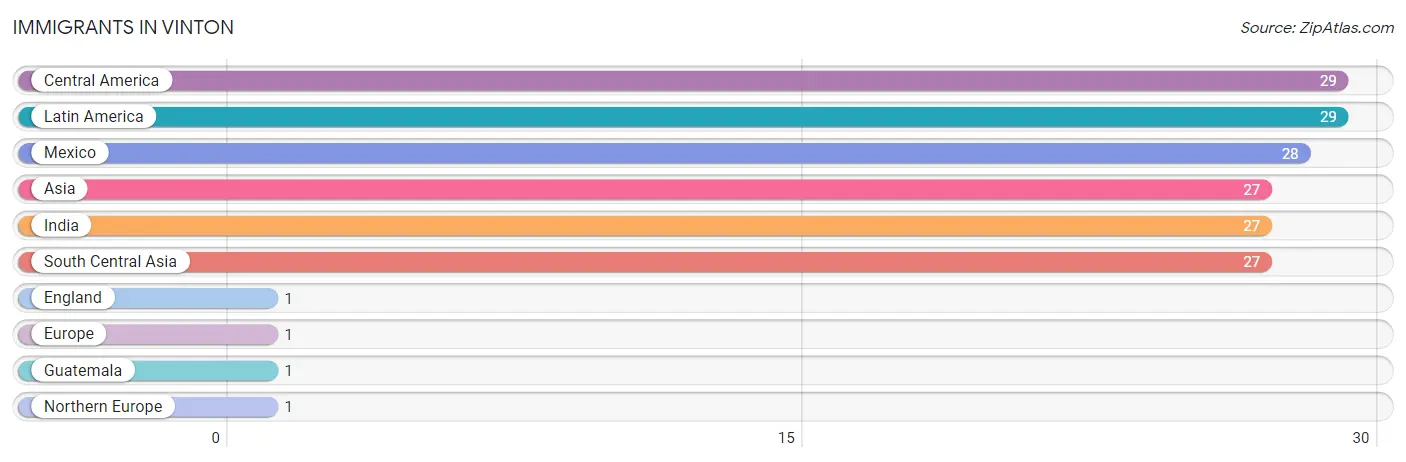
| Immigration Origin | # Population | % Population |
| Asia | 27 | 0.5% |
| Central America | 29 | 0.6% |
| England | 1 | 0.0% |
| Europe | 1 | 0.0% |
| Guatemala | 1 | 0.0% |
| India | 27 | 0.5% |
| Latin America | 29 | 0.6% |
| Mexico | 28 | 0.6% |
| Northern Europe | 1 | 0.0% |
| South Central Asia | 27 | 0.5% | View All 10 Rows |
Sex and Age in Vinton
Sex and Age in Vinton
The most populous age groups in Vinton are 10 to 14 Years (258 | 11.4%) for men and 70 to 74 Years (337 | 12.6%) for women.
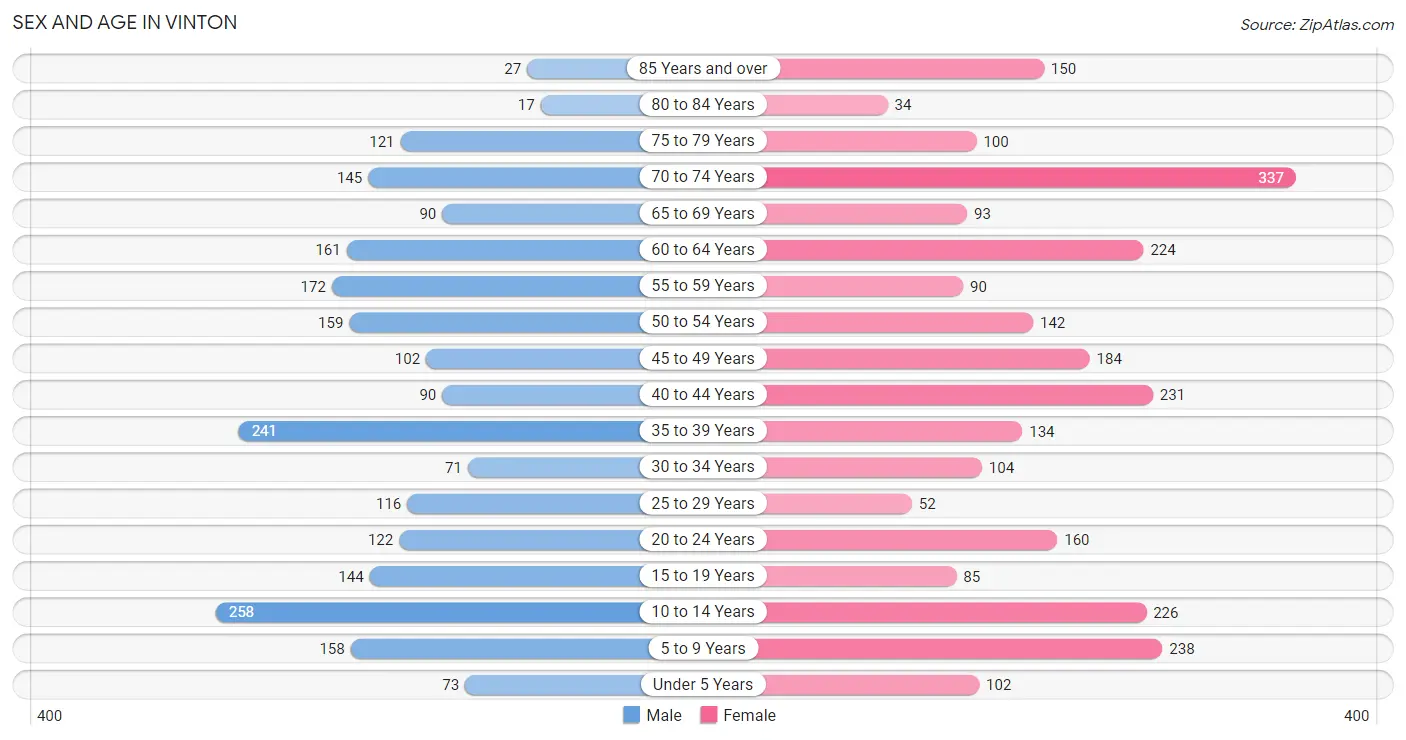
| Age Bracket | Male | Female |
| Under 5 Years | 73 (3.2%) | 102 (3.8%) |
| 5 to 9 Years | 158 (7.0%) | 238 (8.9%) |
| 10 to 14 Years | 258 (11.4%) | 226 (8.4%) |
| 15 to 19 Years | 144 (6.4%) | 85 (3.2%) |
| 20 to 24 Years | 122 (5.4%) | 160 (6.0%) |
| 25 to 29 Years | 116 (5.1%) | 52 (1.9%) |
| 30 to 34 Years | 71 (3.1%) | 104 (3.9%) |
| 35 to 39 Years | 241 (10.6%) | 134 (5.0%) |
| 40 to 44 Years | 90 (4.0%) | 231 (8.6%) |
| 45 to 49 Years | 102 (4.5%) | 184 (6.9%) |
| 50 to 54 Years | 159 (7.0%) | 142 (5.3%) |
| 55 to 59 Years | 172 (7.6%) | 90 (3.4%) |
| 60 to 64 Years | 161 (7.1%) | 224 (8.3%) |
| 65 to 69 Years | 90 (4.0%) | 93 (3.5%) |
| 70 to 74 Years | 145 (6.4%) | 337 (12.6%) |
| 75 to 79 Years | 121 (5.3%) | 100 (3.7%) |
| 80 to 84 Years | 17 (0.7%) | 34 (1.3%) |
| 85 Years and over | 27 (1.2%) | 150 (5.6%) |
| Total | 2,267 (100.0%) | 2,686 (100.0%) |
Families and Households in Vinton
Median Family Size in Vinton
The median family size in Vinton is 2.88 persons per family, with married-couple families (948 | 78.8%) accounting for the largest median family size of 3 persons per family. On the other hand, single female/mother families (154 | 12.8%) represent the smallest median family size with 2.31 persons per family.
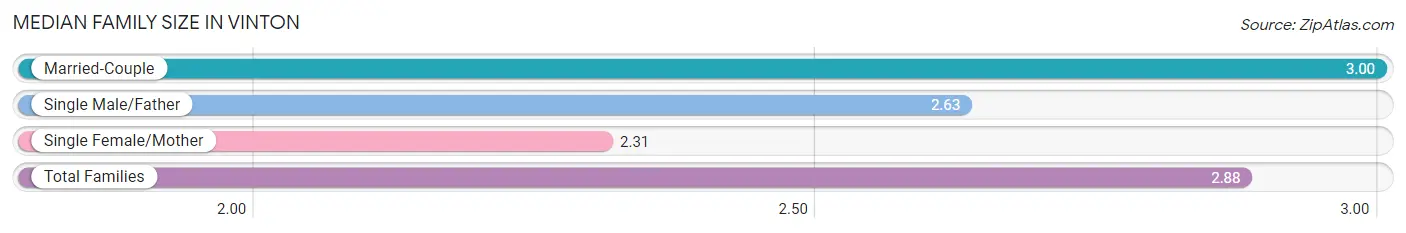
| Family Type | # Families | Family Size |
| Married-Couple | 948 (78.8%) | 3.00 |
| Single Male/Father | 101 (8.4%) | 2.63 |
| Single Female/Mother | 154 (12.8%) | 2.31 |
| Total Families | 1,203 (100.0%) | 2.88 |
Median Household Size in Vinton
The median household size in Vinton is 2.22 persons per household, with married-couple households (948 | 44.0%) accounting for the largest median household size of 3 persons per household. non-family households (951 | 44.2%) represent the smallest median household size with 1.30 persons per household.
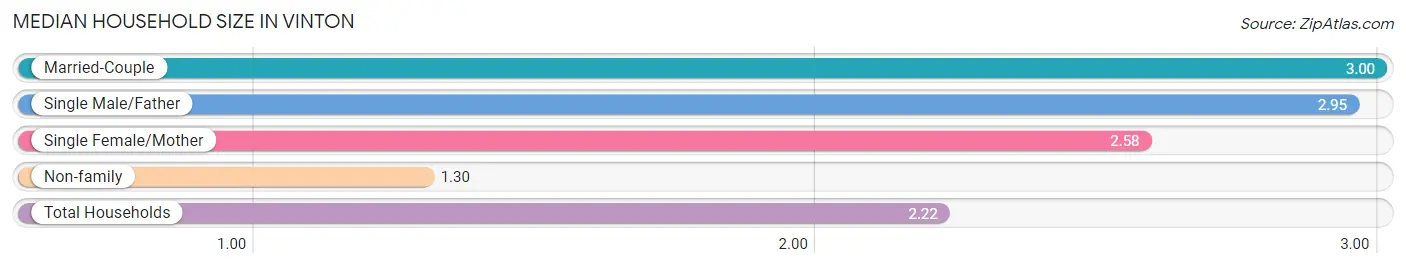
| Household Type | # Households | Household Size |
| Married-Couple | 948 (44.0%) | 3.00 |
| Single Male/Father | 101 (4.7%) | 2.95 |
| Single Female/Mother | 154 (7.1%) | 2.58 |
| Non-family | 951 (44.2%) | 1.30 |
| Total Households | 2,154 (100.0%) | 2.22 |
Household Size by Marriage Status in Vinton
Out of a total of 2,154 households in Vinton, 1,203 (55.8%) are family households, while 951 (44.2%) are nonfamily households. The most numerous type of family households are 2-person households, comprising 695, and the most common type of nonfamily households are 1-person households, comprising 732.
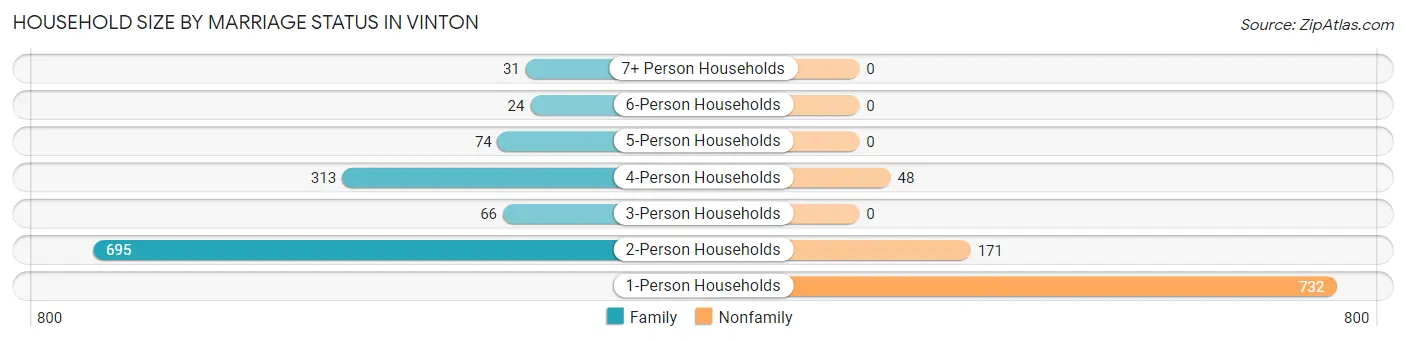
| Household Size | Family Households | Nonfamily Households |
| 1-Person Households | - | 732 (34.0%) |
| 2-Person Households | 695 (32.3%) | 171 (7.9%) |
| 3-Person Households | 66 (3.1%) | 0 (0.0%) |
| 4-Person Households | 313 (14.5%) | 48 (2.2%) |
| 5-Person Households | 74 (3.4%) | 0 (0.0%) |
| 6-Person Households | 24 (1.1%) | 0 (0.0%) |
| 7+ Person Households | 31 (1.4%) | 0 (0.0%) |
| Total | 1,203 (55.8%) | 951 (44.2%) |
Female Fertility in Vinton
Fertility by Age in Vinton
| Age Bracket | Women with Births | Births / 1,000 Women |
| 15 to 19 years | 0 (0.0%) | 0.0 |
| 20 to 34 years | 0 (0.0%) | 0.0 |
| 35 to 50 years | 0 (0.0%) | 0.0 |
| Total | 0 (0.0%) | 0.0 |
Fertility by Age by Marriage Status in Vinton
| Age Bracket | Married | Unmarried |
| 15 to 19 years | 0 (0.0%) | 0 (0.0%) |
| 20 to 34 years | 0 (0.0%) | 0 (0.0%) |
| 35 to 50 years | 0 (0.0%) | 0 (0.0%) |
| Total | 0 (0.0%) | 0 (0.0%) |
Fertility by Education in Vinton
| Educational Attainment | Women with Births | Births / 1,000 Women |
| Less than High School | 0 (0.0%) | 0.0 |
| High School Diploma | 0 (0.0%) | 0.0 |
| College or Associate's Degree | 0 (0.0%) | 0.0 |
| Bachelor's Degree | 0 (0.0%) | 0.0 |
| Graduate Degree | 0 (0.0%) | 0.0 |
| Total | 0 (0.0%) | 0.0 |
Fertility by Education by Marriage Status in Vinton
| Educational Attainment | Married | Unmarried |
| Less than High School | 0 (0.0%) | 0 (0.0%) |
| High School Diploma | 0 (0.0%) | 0 (0.0%) |
| College or Associate's Degree | 0 (0.0%) | 0 (0.0%) |
| Bachelor's Degree | 0 (0.0%) | 0 (0.0%) |
| Graduate Degree | 0 (0.0%) | 0 (0.0%) |
| Total | 0 (0.0%) | 0 (0.0%) |
Employment Characteristics in Vinton
Employment by Class of Employer in Vinton
Among the 2,304 employed individuals in Vinton, private company employees (1,497 | 65.0%), local government employees (307 | 13.3%), and not-for-profit organizations (199 | 8.6%) make up the most common classes of employment.
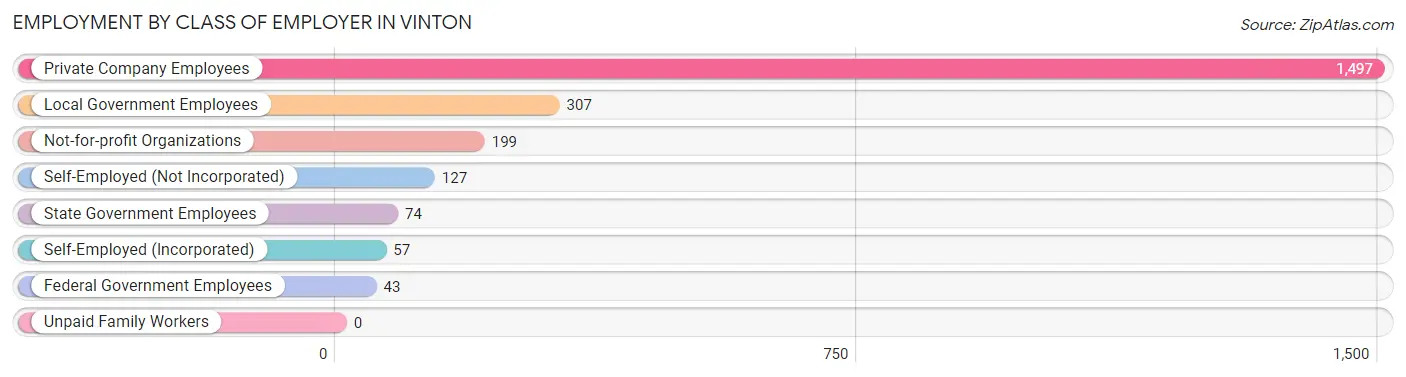
| Employer Class | # Employees | % Employees |
| Private Company Employees | 1,497 | 65.0% |
| Self-Employed (Incorporated) | 57 | 2.5% |
| Self-Employed (Not Incorporated) | 127 | 5.5% |
| Not-for-profit Organizations | 199 | 8.6% |
| Local Government Employees | 307 | 13.3% |
| State Government Employees | 74 | 3.2% |
| Federal Government Employees | 43 | 1.9% |
| Unpaid Family Workers | 0 | 0.0% |
| Total | 2,304 | 100.0% |
Employment Status by Age in Vinton
According to the labor force statistics for Vinton, out of the total population over 16 years of age (3,865), 61.0% or 2,358 individuals are in the labor force, with 2.2% or 52 of them unemployed. The age group with the highest labor force participation rate is 30 to 34 years, with 98.3% or 172 individuals in the labor force. Within the labor force, the 20 to 24 years age range has the highest percentage of unemployed individuals, with 18.8% or 44 of them being unemployed.
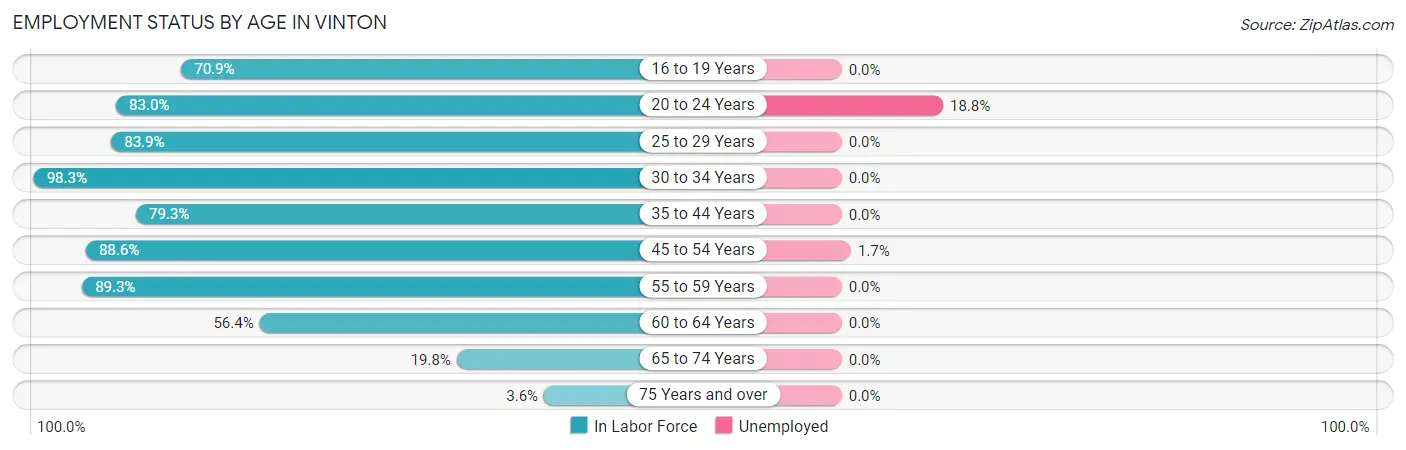
| Age Bracket | In Labor Force | Unemployed |
| 16 to 19 Years | 139 (70.9%) | 0 (0.0%) |
| 20 to 24 Years | 234 (83.0%) | 44 (18.8%) |
| 25 to 29 Years | 141 (83.9%) | 0 (0.0%) |
| 30 to 34 Years | 172 (98.3%) | 0 (0.0%) |
| 35 to 44 Years | 552 (79.3%) | 0 (0.0%) |
| 45 to 54 Years | 520 (88.6%) | 9 (1.7%) |
| 55 to 59 Years | 234 (89.3%) | 0 (0.0%) |
| 60 to 64 Years | 217 (56.4%) | 0 (0.0%) |
| 65 to 74 Years | 132 (19.8%) | 0 (0.0%) |
| 75 Years and over | 16 (3.6%) | 0 (0.0%) |
| Total | 2,358 (61.0%) | 52 (2.2%) |
Employment Status by Educational Attainment in Vinton
According to labor force statistics for Vinton, 80.8% of individuals (1,837) out of the total population between 25 and 64 years of age (2,273) are in the labor force, with 0.5% or 9 of them being unemployed. The group with the highest labor force participation rate are those with the educational attainment of bachelor's degree or higher, with 92.4% or 536 individuals in the labor force. Within the labor force, individuals with high school diploma education have the highest percentage of unemployment, with 2.2% or 9 of them being unemployed.
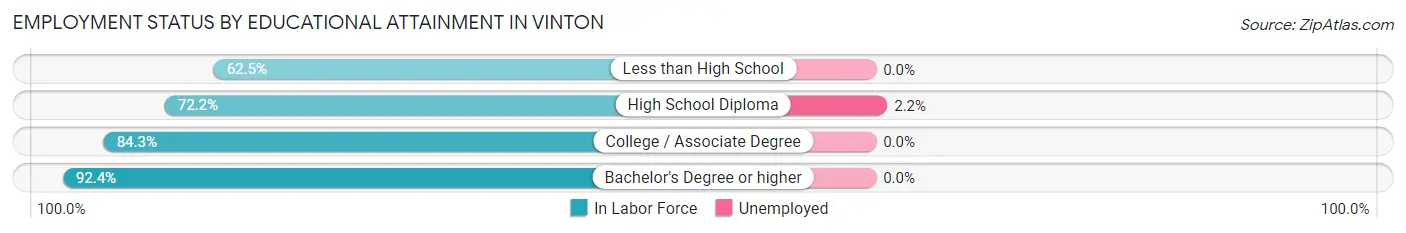
| Educational Attainment | In Labor Force | Unemployed |
| Less than High School | 168 (62.5%) | 0 (0.0%) |
| High School Diploma | 407 (72.2%) | 12 (2.2%) |
| College / Associate Degree | 725 (84.3%) | 0 (0.0%) |
| Bachelor's Degree or higher | 536 (92.4%) | 0 (0.0%) |
| Total | 1,837 (80.8%) | 11 (0.5%) |
Employment Occupations by Sex in Vinton
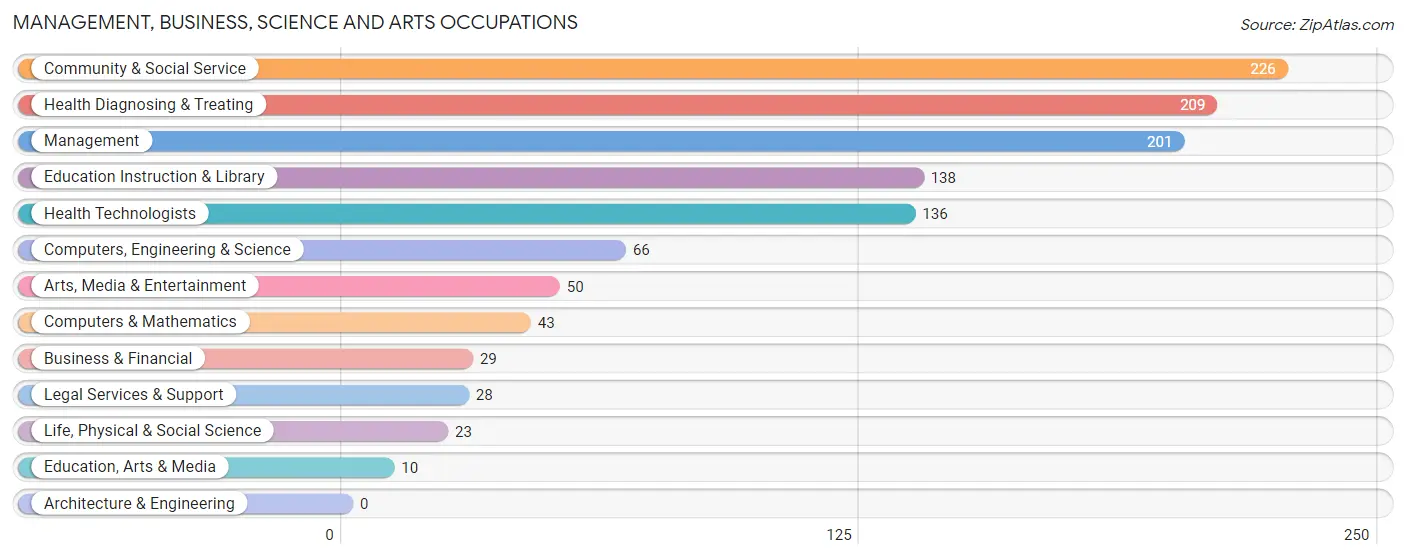
Management, Business, Science and Arts Occupations
The most common Management, Business, Science and Arts occupations in Vinton are Community & Social Service (226 | 9.8%), Health Diagnosing & Treating (209 | 9.1%), Management (201 | 8.7%), Education Instruction & Library (138 | 6.0%), and Health Technologists (136 | 5.9%).
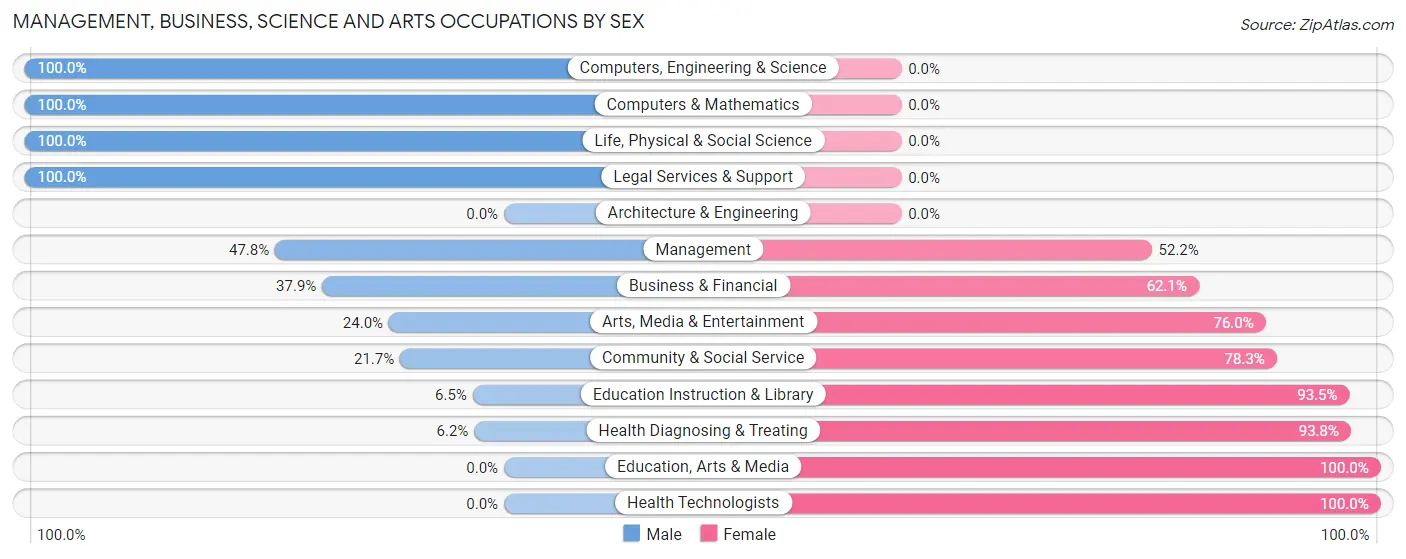
Management, Business, Science and Arts Occupations by Sex
Within the Management, Business, Science and Arts occupations in Vinton, the most male-oriented occupations are Computers, Engineering & Science (100.0%), Computers & Mathematics (100.0%), and Life, Physical & Social Science (100.0%), while the most female-oriented occupations are Education, Arts & Media (100.0%), Health Technologists (100.0%), and Health Diagnosing & Treating (93.8%).
| Occupation | Male | Female |
| Management | 96 (47.8%) | 105 (52.2%) |
| Business & Financial | 11 (37.9%) | 18 (62.1%) |
| Computers, Engineering & Science | 66 (100.0%) | 0 (0.0%) |
| Computers & Mathematics | 43 (100.0%) | 0 (0.0%) |
| Architecture & Engineering | 0 (0.0%) | 0 (0.0%) |
| Life, Physical & Social Science | 23 (100.0%) | 0 (0.0%) |
| Community & Social Service | 49 (21.7%) | 177 (78.3%) |
| Education, Arts & Media | 0 (0.0%) | 10 (100.0%) |
| Legal Services & Support | 28 (100.0%) | 0 (0.0%) |
| Education Instruction & Library | 9 (6.5%) | 129 (93.5%) |
| Arts, Media & Entertainment | 12 (24.0%) | 38 (76.0%) |
| Health Diagnosing & Treating | 13 (6.2%) | 196 (93.8%) |
| Health Technologists | 0 (0.0%) | 136 (100.0%) |
| Total (Category) | 235 (32.2%) | 496 (67.8%) |
| Total (Overall) | 1,188 (51.6%) | 1,116 (48.4%) |
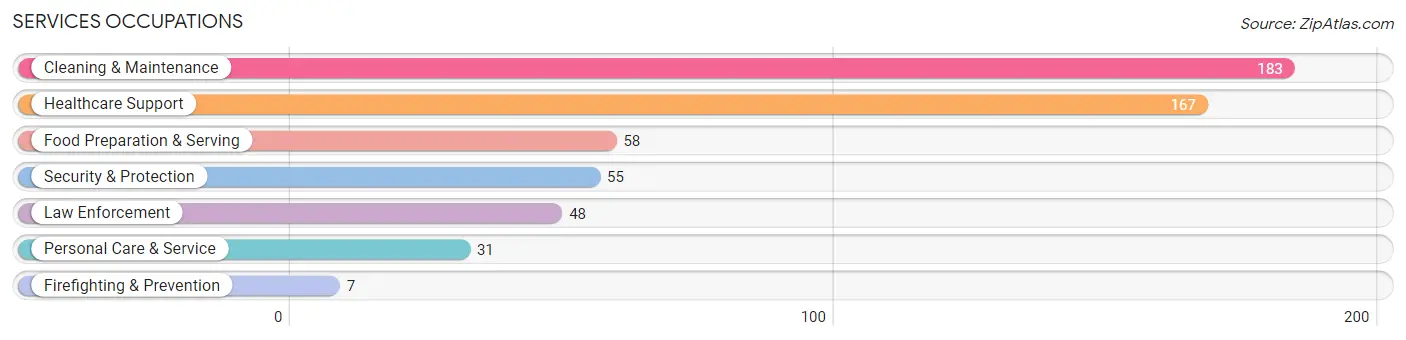
Services Occupations
The most common Services occupations in Vinton are Cleaning & Maintenance (183 | 7.9%), Healthcare Support (167 | 7.2%), Food Preparation & Serving (58 | 2.5%), Security & Protection (55 | 2.4%), and Law Enforcement (48 | 2.1%).
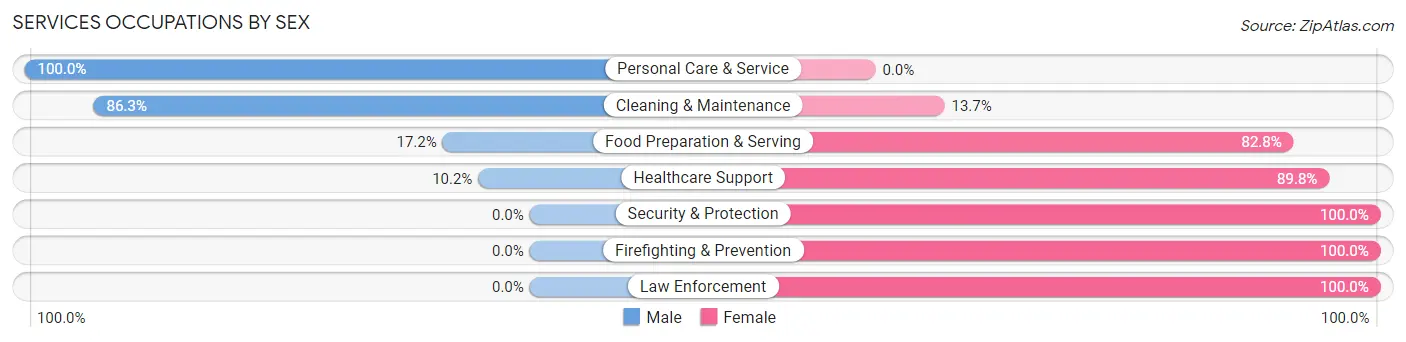
Services Occupations by Sex
Within the Services occupations in Vinton, the most male-oriented occupations are Personal Care & Service (100.0%), Cleaning & Maintenance (86.3%), and Food Preparation & Serving (17.2%), while the most female-oriented occupations are Security & Protection (100.0%), Firefighting & Prevention (100.0%), and Law Enforcement (100.0%).
| Occupation | Male | Female |
| Healthcare Support | 17 (10.2%) | 150 (89.8%) |
| Security & Protection | 0 (0.0%) | 55 (100.0%) |
| Firefighting & Prevention | 0 (0.0%) | 7 (100.0%) |
| Law Enforcement | 0 (0.0%) | 48 (100.0%) |
| Food Preparation & Serving | 10 (17.2%) | 48 (82.8%) |
| Cleaning & Maintenance | 158 (86.3%) | 25 (13.7%) |
| Personal Care & Service | 31 (100.0%) | 0 (0.0%) |
| Total (Category) | 216 (43.7%) | 278 (56.3%) |
| Total (Overall) | 1,188 (51.6%) | 1,116 (48.4%) |
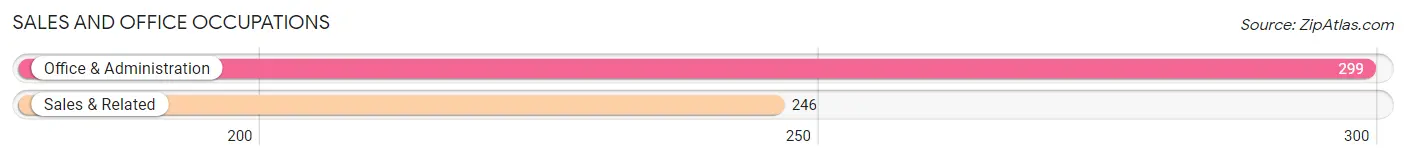
Sales and Office Occupations
The most common Sales and Office occupations in Vinton are Office & Administration (299 | 13.0%), and Sales & Related (246 | 10.7%).
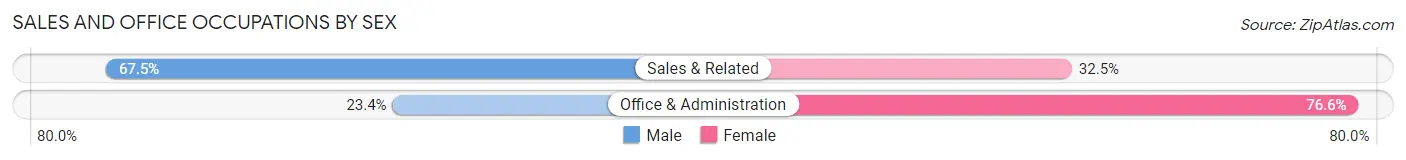
Sales and Office Occupations by Sex
| Occupation | Male | Female |
| Sales & Related | 166 (67.5%) | 80 (32.5%) |
| Office & Administration | 70 (23.4%) | 229 (76.6%) |
| Total (Category) | 236 (43.3%) | 309 (56.7%) |
| Total (Overall) | 1,188 (51.6%) | 1,116 (48.4%) |
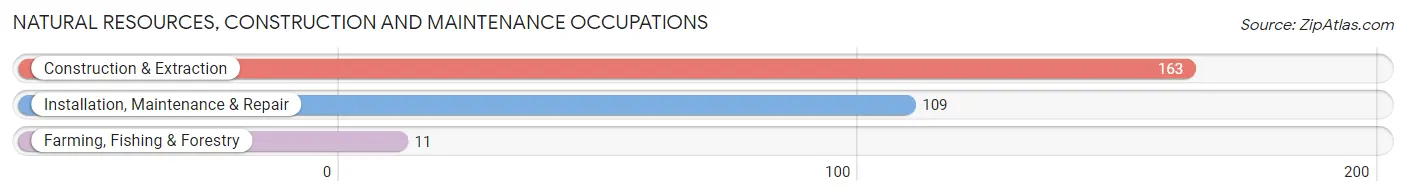
Natural Resources, Construction and Maintenance Occupations
The most common Natural Resources, Construction and Maintenance occupations in Vinton are Construction & Extraction (163 | 7.1%), Installation, Maintenance & Repair (109 | 4.7%), and Farming, Fishing & Forestry (11 | 0.5%).
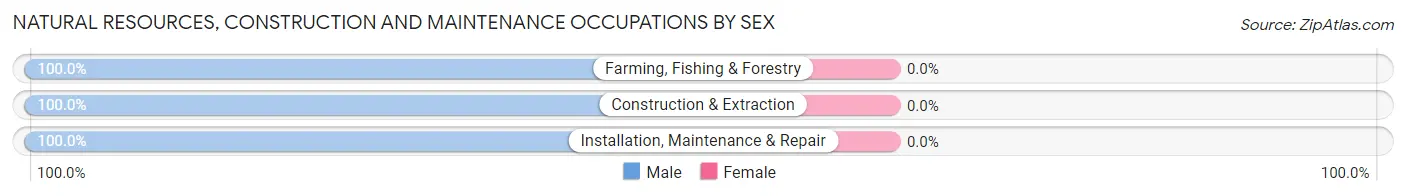
Natural Resources, Construction and Maintenance Occupations by Sex
| Occupation | Male | Female |
| Farming, Fishing & Forestry | 11 (100.0%) | 0 (0.0%) |
| Construction & Extraction | 163 (100.0%) | 0 (0.0%) |
| Installation, Maintenance & Repair | 109 (100.0%) | 0 (0.0%) |
| Total (Category) | 283 (100.0%) | 0 (0.0%) |
| Total (Overall) | 1,188 (51.6%) | 1,116 (48.4%) |
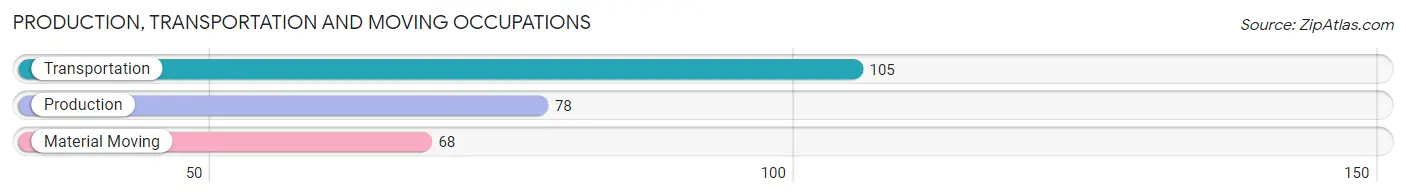
Production, Transportation and Moving Occupations
The most common Production, Transportation and Moving occupations in Vinton are Transportation (105 | 4.6%), Production (78 | 3.4%), and Material Moving (68 | 2.9%).
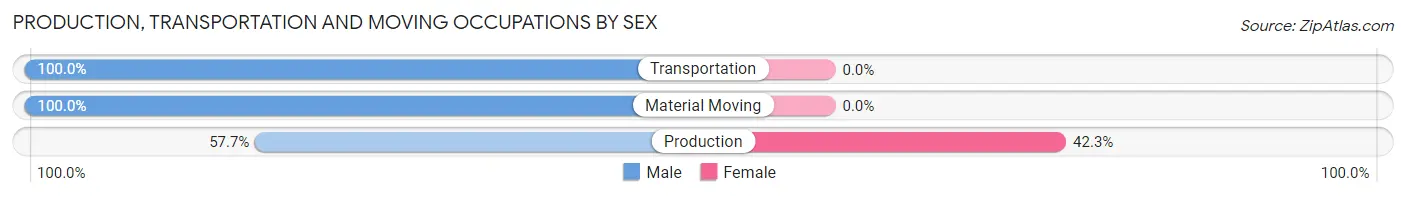
Production, Transportation and Moving Occupations by Sex
| Occupation | Male | Female |
| Production | 45 (57.7%) | 33 (42.3%) |
| Transportation | 105 (100.0%) | 0 (0.0%) |
| Material Moving | 68 (100.0%) | 0 (0.0%) |
| Total (Category) | 218 (86.9%) | 33 (13.2%) |
| Total (Overall) | 1,188 (51.6%) | 1,116 (48.4%) |
Employment Industries by Sex in Vinton
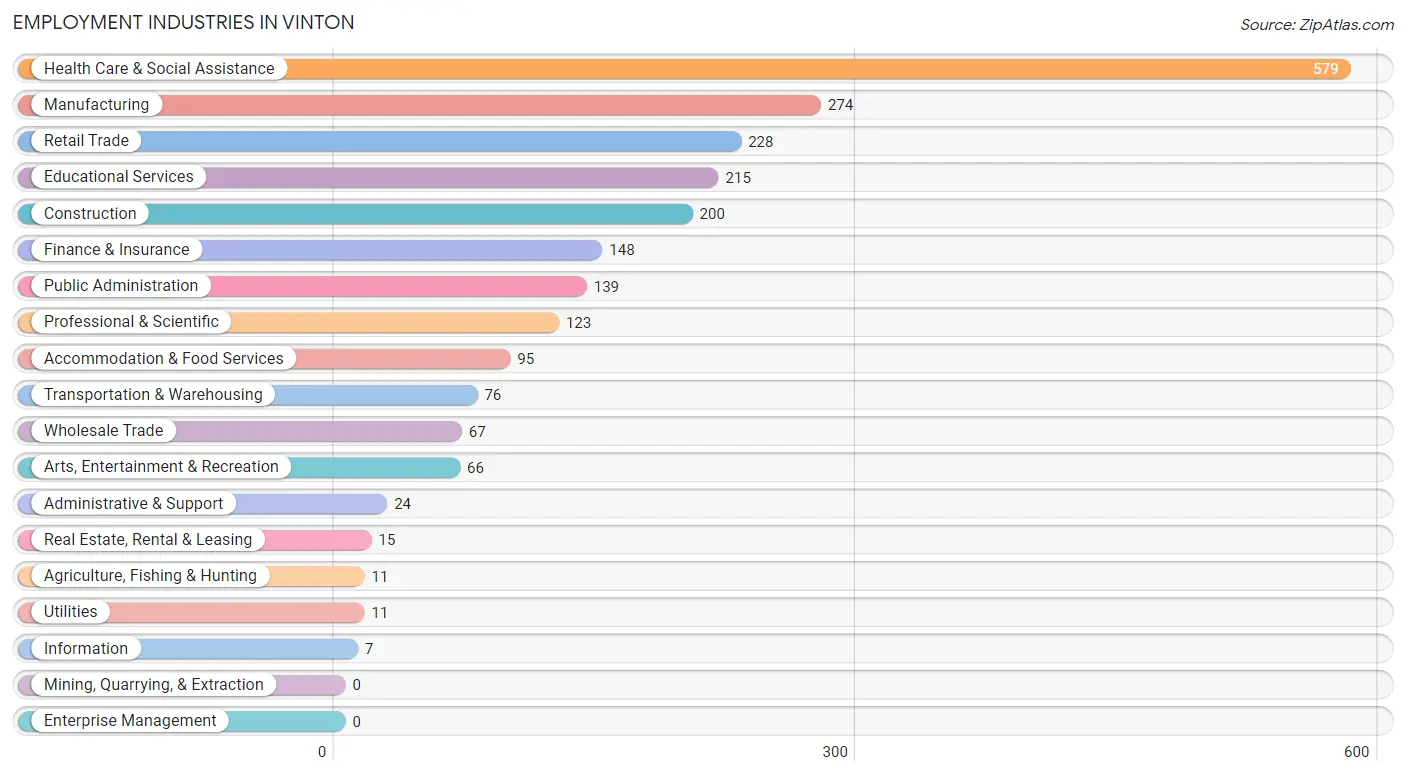
Employment Industries in Vinton
The major employment industries in Vinton include Health Care & Social Assistance (579 | 25.1%), Manufacturing (274 | 11.9%), Retail Trade (228 | 9.9%), Educational Services (215 | 9.3%), and Construction (200 | 8.7%).
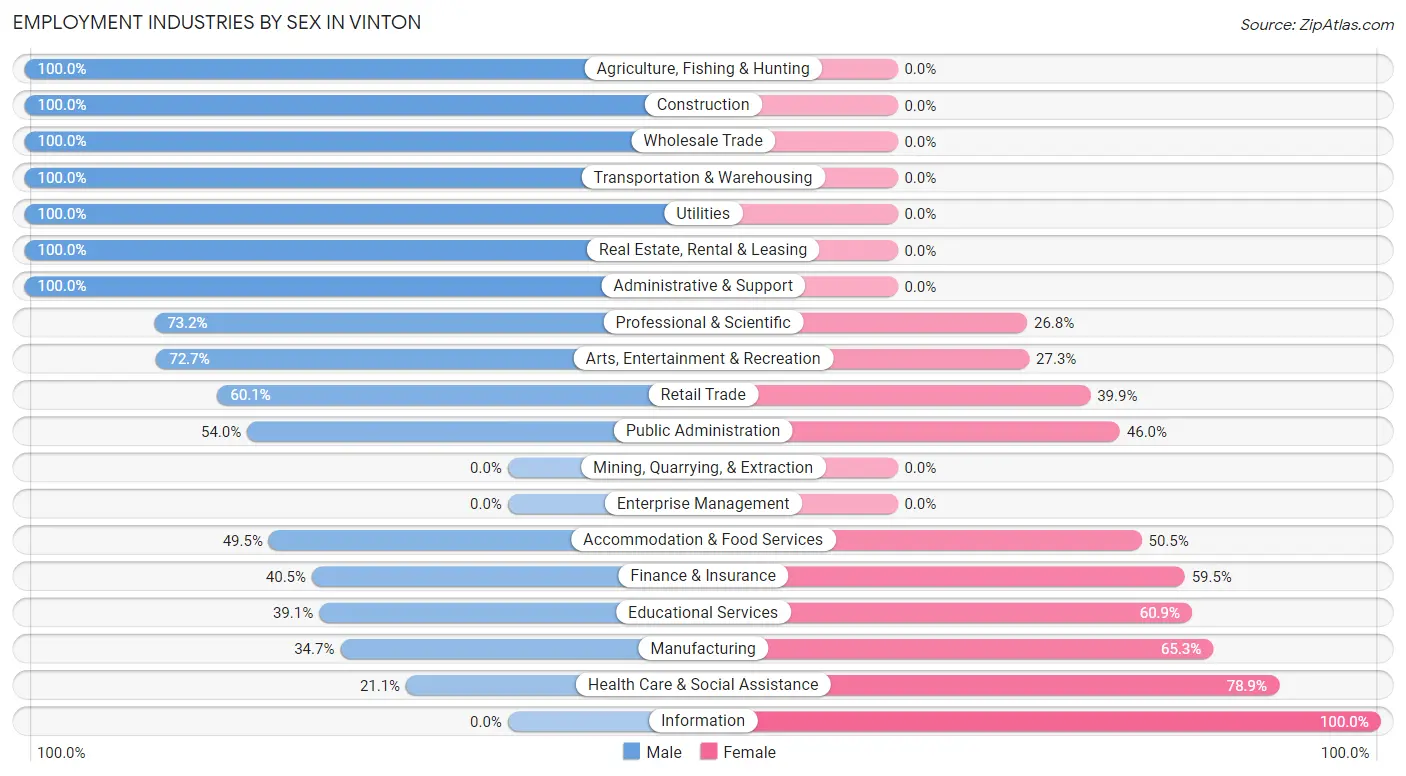
Employment Industries by Sex in Vinton
The Vinton industries that see more men than women are Agriculture, Fishing & Hunting (100.0%), Construction (100.0%), and Wholesale Trade (100.0%), whereas the industries that tend to have a higher number of women are Information (100.0%), Health Care & Social Assistance (78.9%), and Manufacturing (65.3%).
| Industry | Male | Female |
| Agriculture, Fishing & Hunting | 11 (100.0%) | 0 (0.0%) |
| Mining, Quarrying, & Extraction | 0 (0.0%) | 0 (0.0%) |
| Construction | 200 (100.0%) | 0 (0.0%) |
| Manufacturing | 95 (34.7%) | 179 (65.3%) |
| Wholesale Trade | 67 (100.0%) | 0 (0.0%) |
| Retail Trade | 137 (60.1%) | 91 (39.9%) |
| Transportation & Warehousing | 76 (100.0%) | 0 (0.0%) |
| Utilities | 11 (100.0%) | 0 (0.0%) |
| Information | 0 (0.0%) | 7 (100.0%) |
| Finance & Insurance | 60 (40.5%) | 88 (59.5%) |
| Real Estate, Rental & Leasing | 15 (100.0%) | 0 (0.0%) |
| Professional & Scientific | 90 (73.2%) | 33 (26.8%) |
| Enterprise Management | 0 (0.0%) | 0 (0.0%) |
| Administrative & Support | 24 (100.0%) | 0 (0.0%) |
| Educational Services | 84 (39.1%) | 131 (60.9%) |
| Health Care & Social Assistance | 122 (21.1%) | 457 (78.9%) |
| Arts, Entertainment & Recreation | 48 (72.7%) | 18 (27.3%) |
| Accommodation & Food Services | 47 (49.5%) | 48 (50.5%) |
| Public Administration | 75 (54.0%) | 64 (46.0%) |
| Total | 1,188 (51.6%) | 1,116 (48.4%) |
Education in Vinton
School Enrollment in Vinton
The most common levels of schooling among the 1,157 students in Vinton are middle school (378 | 32.7%), elementary school (337 | 29.1%), and high school (206 | 17.8%).
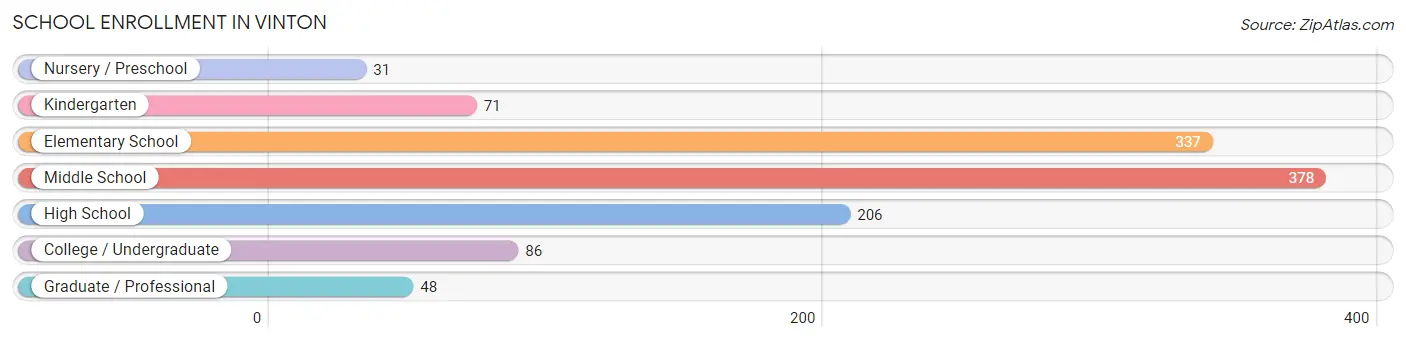
| School Level | # Students | % Students |
| Nursery / Preschool | 31 | 2.7% |
| Kindergarten | 71 | 6.1% |
| Elementary School | 337 | 29.1% |
| Middle School | 378 | 32.7% |
| High School | 206 | 17.8% |
| College / Undergraduate | 86 | 7.4% |
| Graduate / Professional | 48 | 4.2% |
| Total | 1,157 | 100.0% |
School Enrollment by Age by Funding Source in Vinton
Out of a total of 1,157 students who are enrolled in schools in Vinton, 132 (11.4%) attend a private institution, while the remaining 1,025 (88.6%) are enrolled in public schools. The age group of 35 years and over has the highest likelihood of being enrolled in private schools, with 22 (45.8% in the age bracket) enrolled. Conversely, the age group of 3 to 4 year olds has the lowest likelihood of being enrolled in a private school, with 24 (100.0% in the age bracket) attending a public institution.
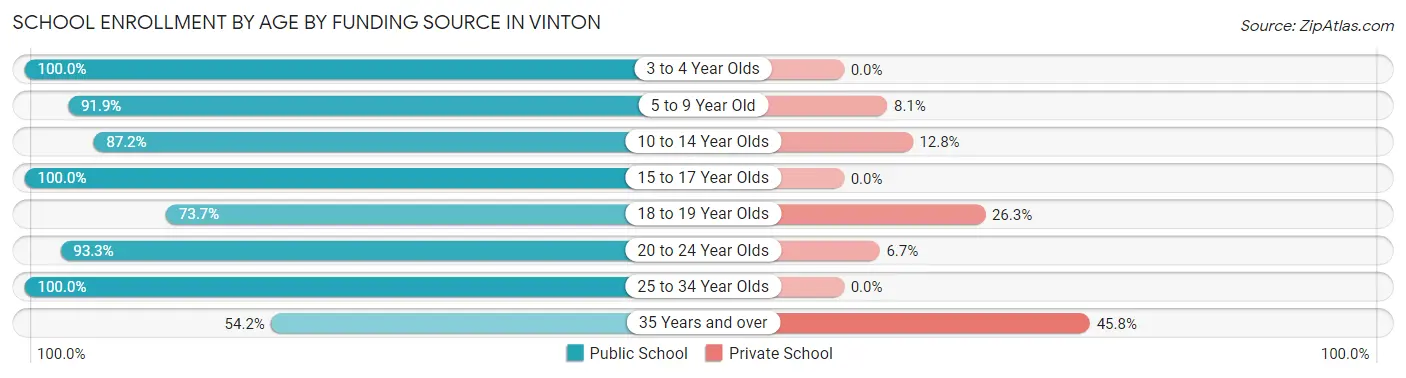
| Age Bracket | Public School | Private School |
| 3 to 4 Year Olds | 24 (100.0%) | 0 (0.0%) |
| 5 to 9 Year Old | 364 (91.9%) | 32 (8.1%) |
| 10 to 14 Year Olds | 422 (87.2%) | 62 (12.8%) |
| 15 to 17 Year Olds | 118 (100.0%) | 0 (0.0%) |
| 18 to 19 Year Olds | 42 (73.7%) | 15 (26.3%) |
| 20 to 24 Year Olds | 14 (93.3%) | 1 (6.7%) |
| 25 to 34 Year Olds | 15 (100.0%) | 0 (0.0%) |
| 35 Years and over | 26 (54.2%) | 22 (45.8%) |
| Total | 1,025 (88.6%) | 132 (11.4%) |
Educational Attainment by Field of Study in Vinton
Education (294 | 28.2%), business (275 | 26.3%), science & technology (133 | 12.7%), bio, nature & agricultural (83 | 8.0%), and social sciences (83 | 8.0%) are the most common fields of study among 1,044 individuals in Vinton who have obtained a bachelor's degree or higher.
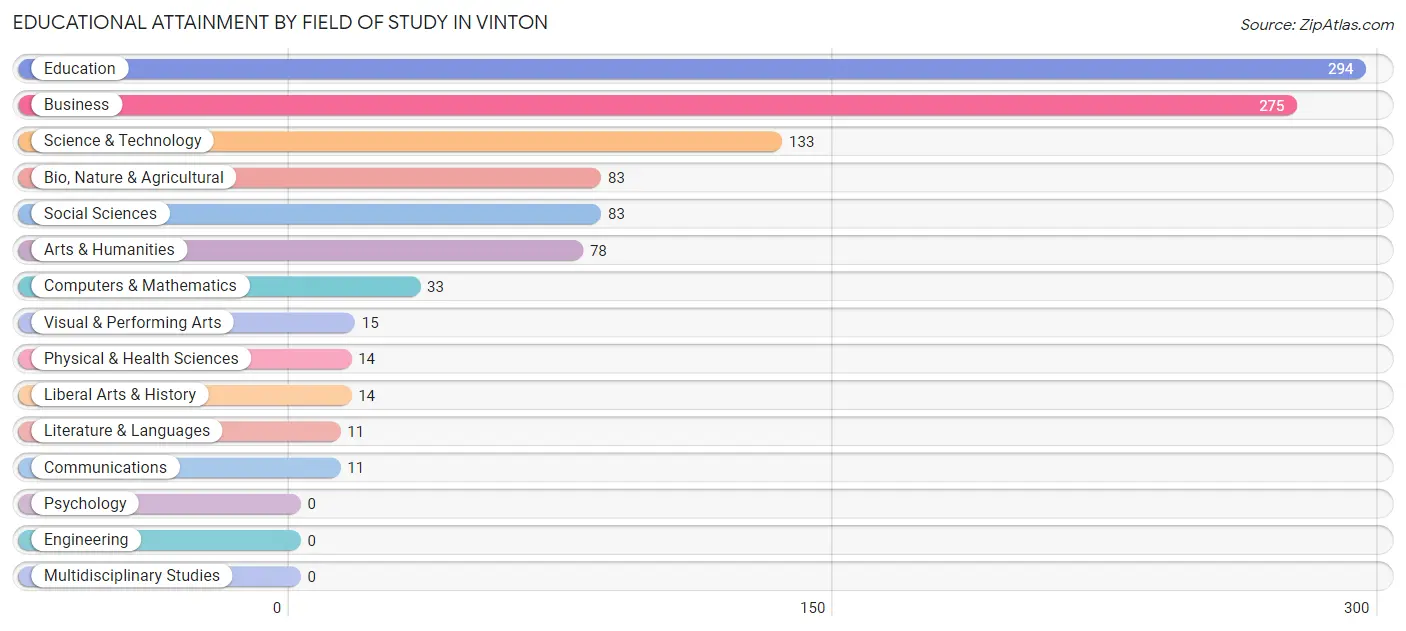
| Field of Study | # Graduates | % Graduates |
| Computers & Mathematics | 33 | 3.2% |
| Bio, Nature & Agricultural | 83 | 8.0% |
| Physical & Health Sciences | 14 | 1.3% |
| Psychology | 0 | 0.0% |
| Social Sciences | 83 | 8.0% |
| Engineering | 0 | 0.0% |
| Multidisciplinary Studies | 0 | 0.0% |
| Science & Technology | 133 | 12.7% |
| Business | 275 | 26.3% |
| Education | 294 | 28.2% |
| Literature & Languages | 11 | 1.1% |
| Liberal Arts & History | 14 | 1.3% |
| Visual & Performing Arts | 15 | 1.4% |
| Communications | 11 | 1.1% |
| Arts & Humanities | 78 | 7.5% |
| Total | 1,044 | 100.0% |
Transportation & Commute in Vinton
Vehicle Availability by Sex in Vinton
The most prevalent vehicle ownership categories in Vinton are males with 2 vehicles (604, accounting for 52.4%) and females with 2 vehicles (542, making up 54.1%).
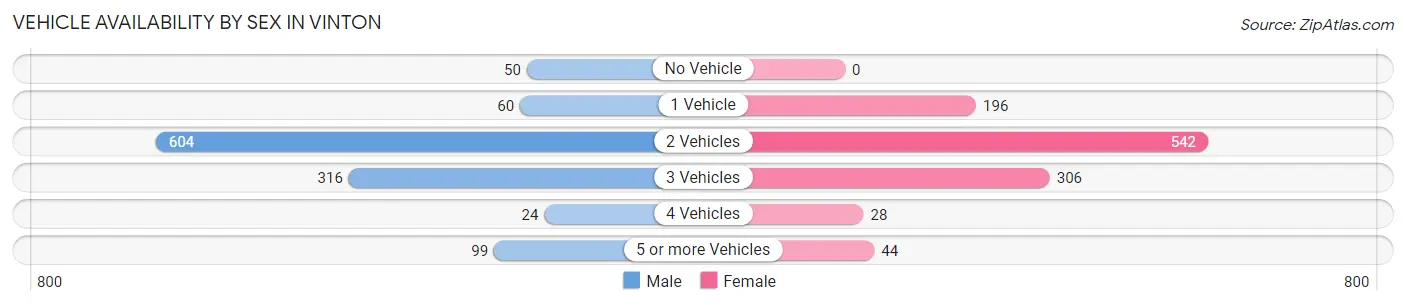
| Vehicles Available | Male | Female |
| No Vehicle | 50 (4.3%) | 0 (0.0%) |
| 1 Vehicle | 60 (5.2%) | 196 (17.6%) |
| 2 Vehicles | 604 (52.4%) | 542 (48.6%) |
| 3 Vehicles | 316 (27.4%) | 306 (27.4%) |
| 4 Vehicles | 24 (2.1%) | 28 (2.5%) |
| 5 or more Vehicles | 99 (8.6%) | 44 (3.9%) |
| Total | 1,153 (100.0%) | 1,116 (100.0%) |
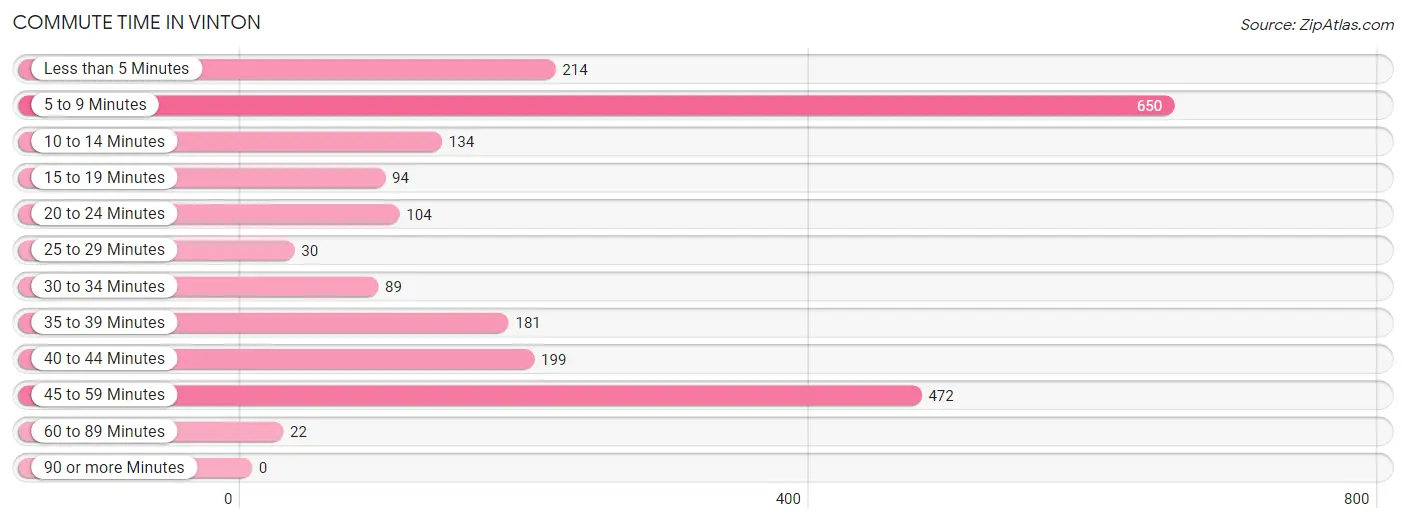
Commute Time in Vinton
The most frequently occuring commute durations in Vinton are 5 to 9 minutes (650 commuters, 29.7%), 45 to 59 minutes (472 commuters, 21.6%), and less than 5 minutes (214 commuters, 9.8%).
| Commute Time | # Commuters | % Commuters |
| Less than 5 Minutes | 214 | 9.8% |
| 5 to 9 Minutes | 650 | 29.7% |
| 10 to 14 Minutes | 134 | 6.1% |
| 15 to 19 Minutes | 94 | 4.3% |
| 20 to 24 Minutes | 104 | 4.8% |
| 25 to 29 Minutes | 30 | 1.4% |
| 30 to 34 Minutes | 89 | 4.1% |
| 35 to 39 Minutes | 181 | 8.3% |
| 40 to 44 Minutes | 199 | 9.1% |
| 45 to 59 Minutes | 472 | 21.6% |
| 60 to 89 Minutes | 22 | 1.0% |
| 90 or more Minutes | 0 | 0.0% |
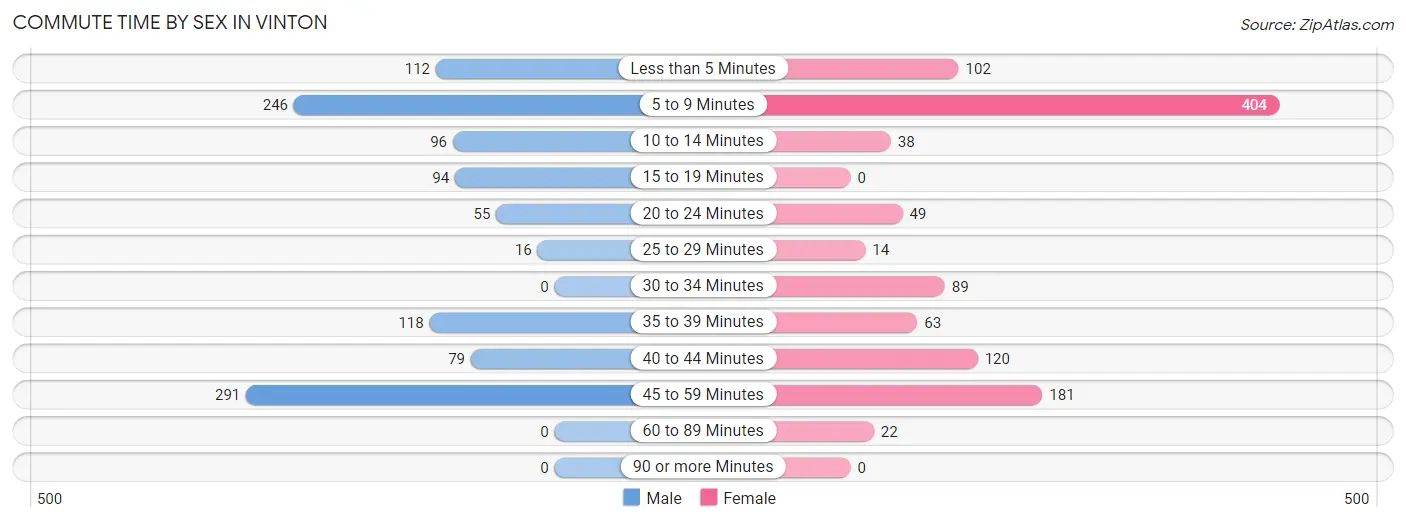
Commute Time by Sex in Vinton
The most common commute times in Vinton are 45 to 59 minutes (291 commuters, 26.3%) for males and 5 to 9 minutes (404 commuters, 37.3%) for females.
| Commute Time | Male | Female |
| Less than 5 Minutes | 112 (10.1%) | 102 (9.4%) |
| 5 to 9 Minutes | 246 (22.2%) | 404 (37.3%) |
| 10 to 14 Minutes | 96 (8.7%) | 38 (3.5%) |
| 15 to 19 Minutes | 94 (8.5%) | 0 (0.0%) |
| 20 to 24 Minutes | 55 (5.0%) | 49 (4.5%) |
| 25 to 29 Minutes | 16 (1.5%) | 14 (1.3%) |
| 30 to 34 Minutes | 0 (0.0%) | 89 (8.2%) |
| 35 to 39 Minutes | 118 (10.7%) | 63 (5.8%) |
| 40 to 44 Minutes | 79 (7.1%) | 120 (11.1%) |
| 45 to 59 Minutes | 291 (26.3%) | 181 (16.7%) |
| 60 to 89 Minutes | 0 (0.0%) | 22 (2.0%) |
| 90 or more Minutes | 0 (0.0%) | 0 (0.0%) |
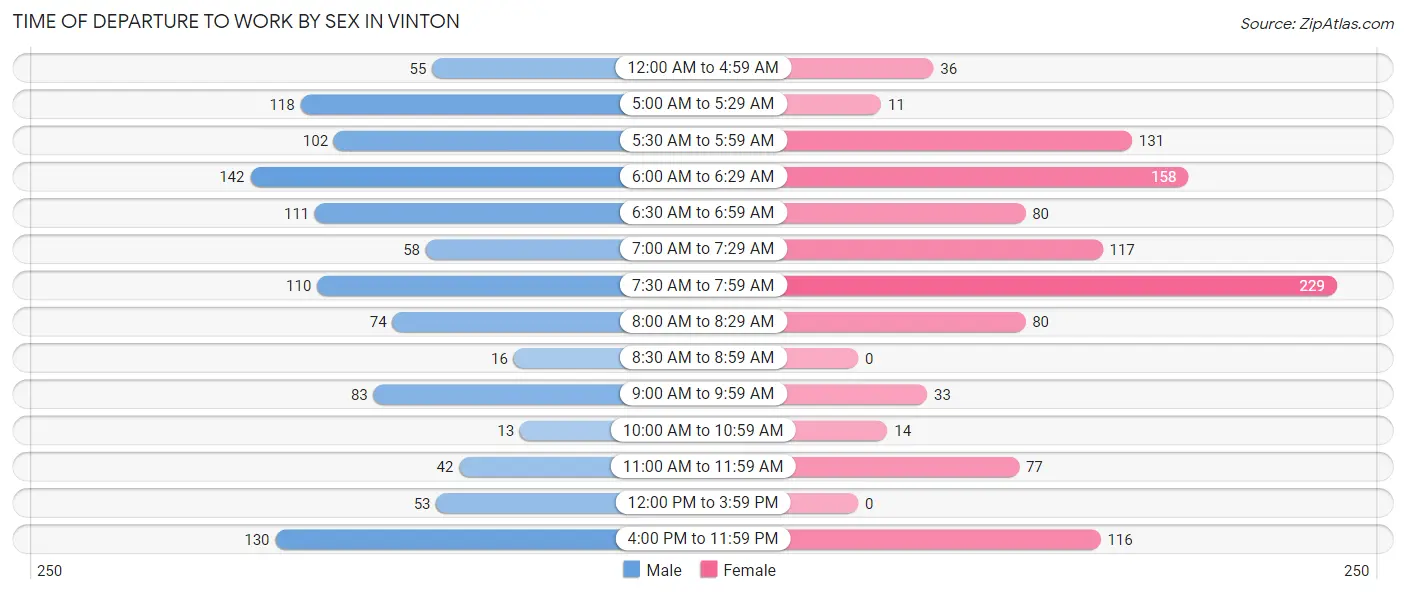
Time of Departure to Work by Sex in Vinton
The most frequent times of departure to work in Vinton are 6:00 AM to 6:29 AM (142, 12.8%) for males and 7:30 AM to 7:59 AM (229, 21.2%) for females.
| Time of Departure | Male | Female |
| 12:00 AM to 4:59 AM | 55 (5.0%) | 36 (3.3%) |
| 5:00 AM to 5:29 AM | 118 (10.7%) | 11 (1.0%) |
| 5:30 AM to 5:59 AM | 102 (9.2%) | 131 (12.1%) |
| 6:00 AM to 6:29 AM | 142 (12.8%) | 158 (14.6%) |
| 6:30 AM to 6:59 AM | 111 (10.0%) | 80 (7.4%) |
| 7:00 AM to 7:29 AM | 58 (5.2%) | 117 (10.8%) |
| 7:30 AM to 7:59 AM | 110 (9.9%) | 229 (21.2%) |
| 8:00 AM to 8:29 AM | 74 (6.7%) | 80 (7.4%) |
| 8:30 AM to 8:59 AM | 16 (1.5%) | 0 (0.0%) |
| 9:00 AM to 9:59 AM | 83 (7.5%) | 33 (3.0%) |
| 10:00 AM to 10:59 AM | 13 (1.2%) | 14 (1.3%) |
| 11:00 AM to 11:59 AM | 42 (3.8%) | 77 (7.1%) |
| 12:00 PM to 3:59 PM | 53 (4.8%) | 0 (0.0%) |
| 4:00 PM to 11:59 PM | 130 (11.7%) | 116 (10.7%) |
| Total | 1,107 (100.0%) | 1,082 (100.0%) |
Housing Occupancy in Vinton
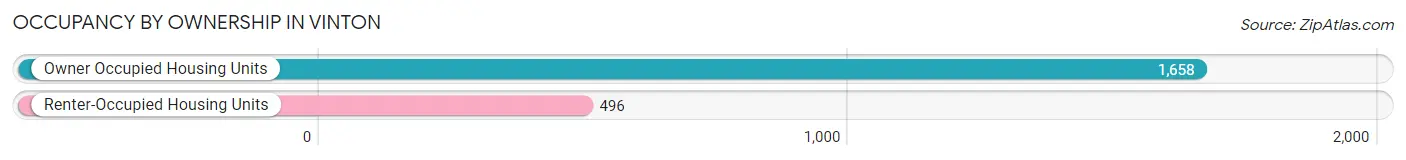
Occupancy by Ownership in Vinton
Of the total 2,154 dwellings in Vinton, owner-occupied units account for 1,658 (77.0%), while renter-occupied units make up 496 (23.0%).
| Occupancy | # Housing Units | % Housing Units |
| Owner Occupied Housing Units | 1,658 | 77.0% |
| Renter-Occupied Housing Units | 496 | 23.0% |
| Total Occupied Housing Units | 2,154 | 100.0% |
Occupancy by Household Size in Vinton
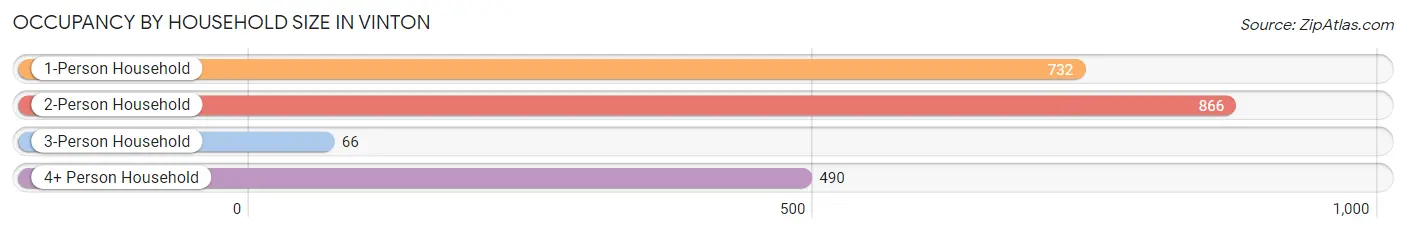
| Household Size | # Housing Units | % Housing Units |
| 1-Person Household | 732 | 34.0% |
| 2-Person Household | 866 | 40.2% |
| 3-Person Household | 66 | 3.1% |
| 4+ Person Household | 490 | 22.8% |
| Total Housing Units | 2,154 | 100.0% |
Occupancy by Ownership by Household Size in Vinton
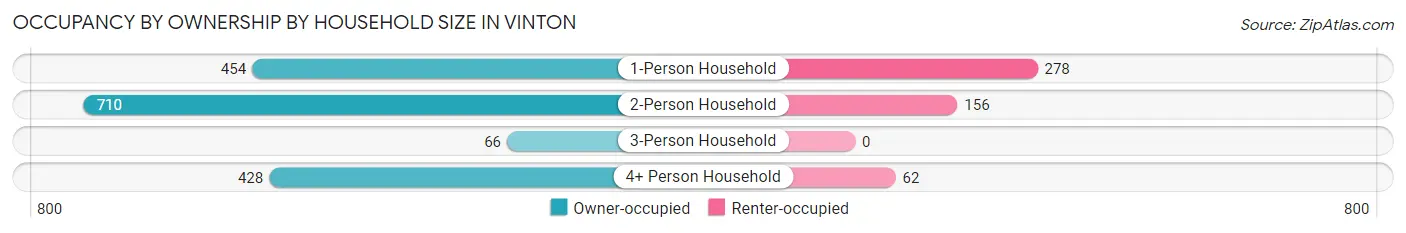
| Household Size | Owner-occupied | Renter-occupied |
| 1-Person Household | 454 (62.0%) | 278 (38.0%) |
| 2-Person Household | 710 (82.0%) | 156 (18.0%) |
| 3-Person Household | 66 (100.0%) | 0 (0.0%) |
| 4+ Person Household | 428 (87.4%) | 62 (12.7%) |
| Total Housing Units | 1,658 (77.0%) | 496 (23.0%) |
Occupancy by Educational Attainment in Vinton
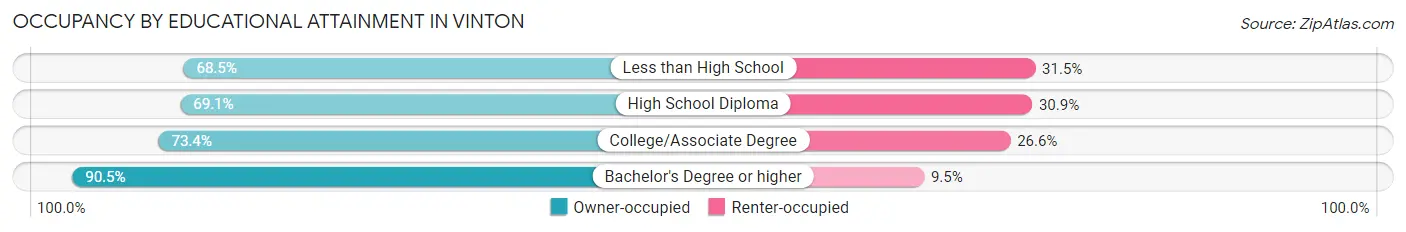
| Household Size | Owner-occupied | Renter-occupied |
| Less than High School | 126 (68.5%) | 58 (31.5%) |
| High School Diploma | 425 (69.1%) | 190 (30.9%) |
| College/Associate Degree | 514 (73.4%) | 186 (26.6%) |
| Bachelor's Degree or higher | 593 (90.5%) | 62 (9.5%) |
Occupancy by Age of Householder in Vinton
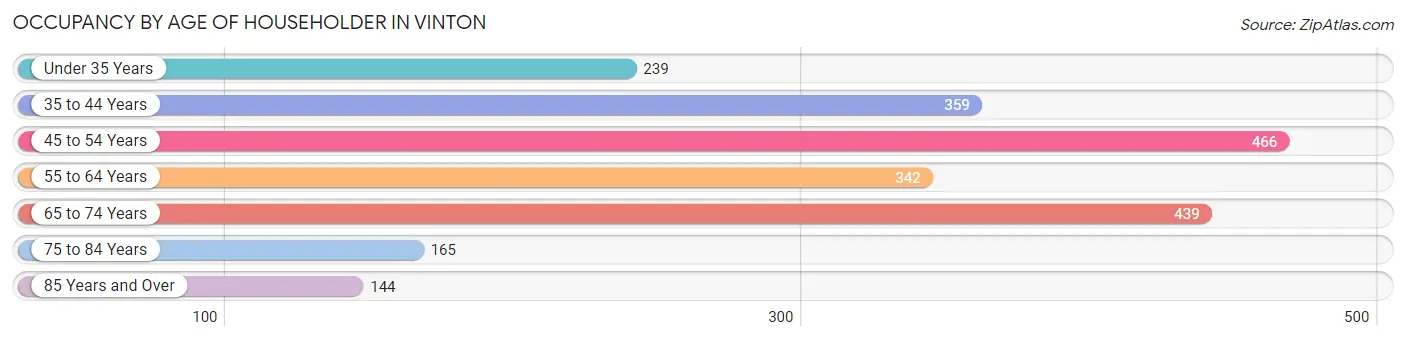
| Age Bracket | # Households | % Households |
| Under 35 Years | 239 | 11.1% |
| 35 to 44 Years | 359 | 16.7% |
| 45 to 54 Years | 466 | 21.6% |
| 55 to 64 Years | 342 | 15.9% |
| 65 to 74 Years | 439 | 20.4% |
| 75 to 84 Years | 165 | 7.7% |
| 85 Years and Over | 144 | 6.7% |
| Total | 2,154 | 100.0% |
Housing Finances in Vinton
Median Income by Occupancy in Vinton
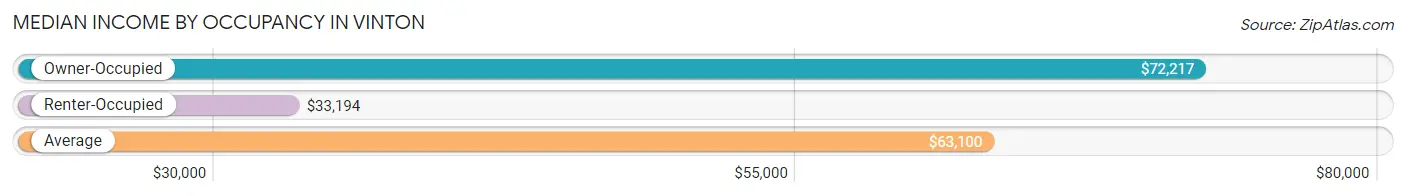
| Occupancy Type | # Households | Median Income |
| Owner-Occupied | 1,658 (77.0%) | $72,217 |
| Renter-Occupied | 496 (23.0%) | $33,194 |
| Average | 2,154 (100.0%) | $63,100 |
Occupancy by Householder Income Bracket in Vinton
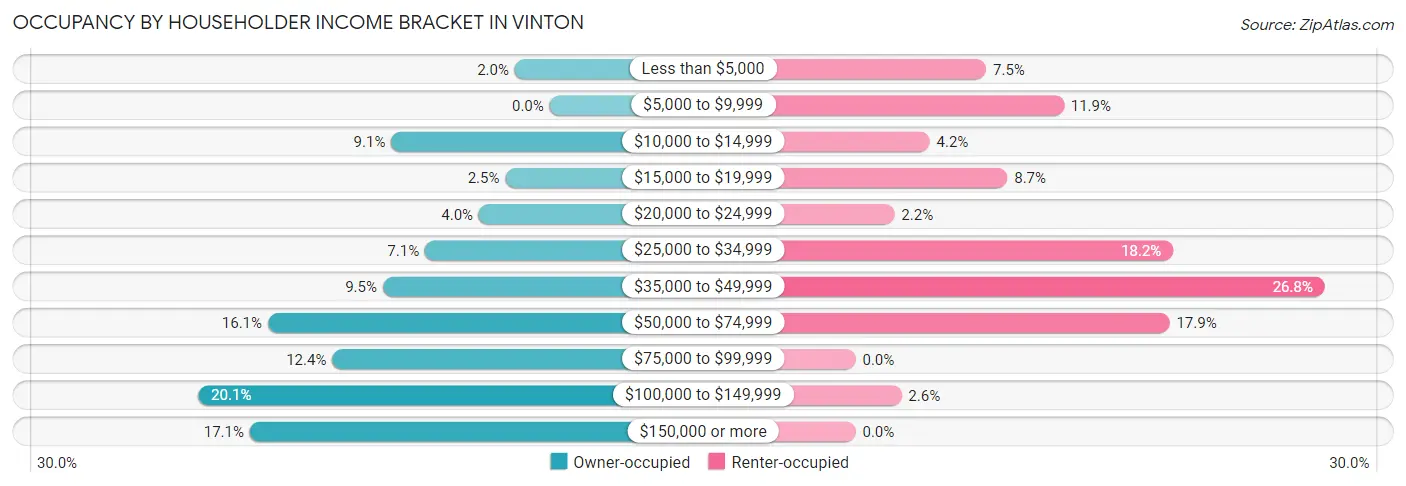
| Income Bracket | Owner-occupied | Renter-occupied |
| Less than $5,000 | 33 (2.0%) | 37 (7.5%) |
| $5,000 to $9,999 | 0 (0.0%) | 59 (11.9%) |
| $10,000 to $14,999 | 150 (9.0%) | 21 (4.2%) |
| $15,000 to $19,999 | 42 (2.5%) | 43 (8.7%) |
| $20,000 to $24,999 | 67 (4.0%) | 11 (2.2%) |
| $25,000 to $34,999 | 118 (7.1%) | 90 (18.1%) |
| $35,000 to $49,999 | 158 (9.5%) | 133 (26.8%) |
| $50,000 to $74,999 | 267 (16.1%) | 89 (17.9%) |
| $75,000 to $99,999 | 206 (12.4%) | 0 (0.0%) |
| $100,000 to $149,999 | 333 (20.1%) | 13 (2.6%) |
| $150,000 or more | 284 (17.1%) | 0 (0.0%) |
| Total | 1,658 (100.0%) | 496 (100.0%) |
Monthly Housing Cost Tiers in Vinton
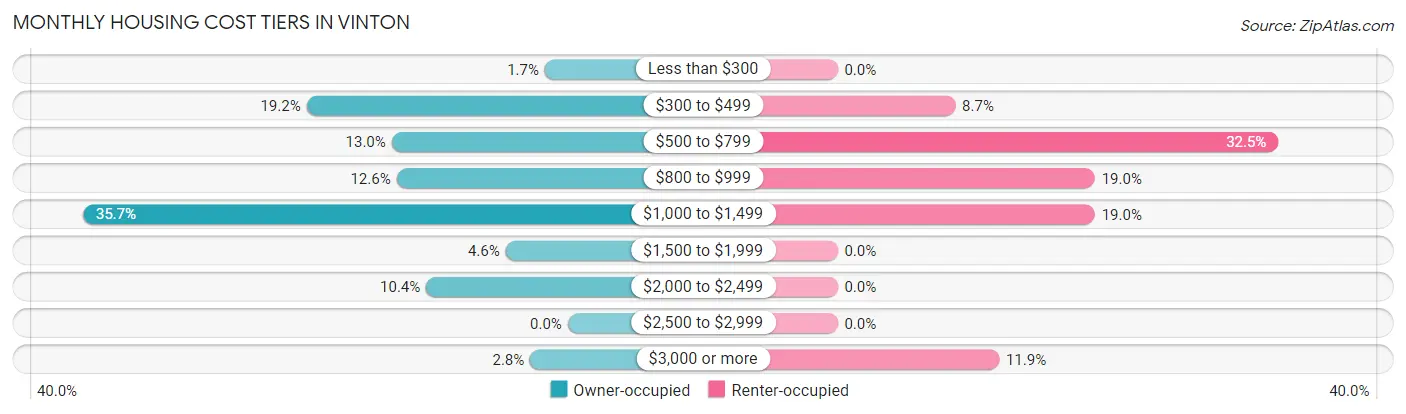
| Monthly Cost | Owner-occupied | Renter-occupied |
| Less than $300 | 28 (1.7%) | 0 (0.0%) |
| $300 to $499 | 319 (19.2%) | 43 (8.7%) |
| $500 to $799 | 215 (13.0%) | 161 (32.5%) |
| $800 to $999 | 209 (12.6%) | 94 (19.0%) |
| $1,000 to $1,499 | 592 (35.7%) | 94 (19.0%) |
| $1,500 to $1,999 | 76 (4.6%) | 0 (0.0%) |
| $2,000 to $2,499 | 173 (10.4%) | 0 (0.0%) |
| $2,500 to $2,999 | 0 (0.0%) | 0 (0.0%) |
| $3,000 or more | 46 (2.8%) | 59 (11.9%) |
| Total | 1,658 (100.0%) | 496 (100.0%) |
Physical Housing Characteristics in Vinton
Housing Structures in Vinton
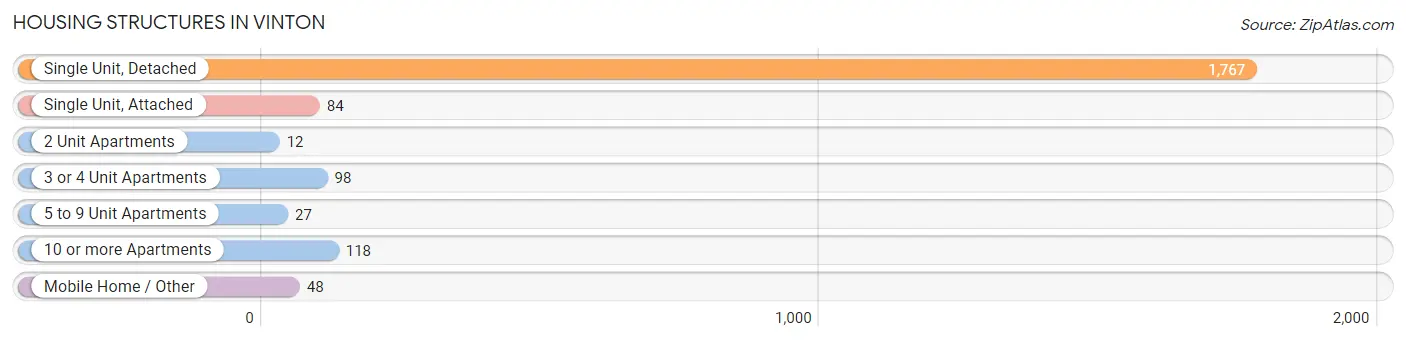
| Structure Type | # Housing Units | % Housing Units |
| Single Unit, Detached | 1,767 | 82.0% |
| Single Unit, Attached | 84 | 3.9% |
| 2 Unit Apartments | 12 | 0.6% |
| 3 or 4 Unit Apartments | 98 | 4.5% |
| 5 to 9 Unit Apartments | 27 | 1.3% |
| 10 or more Apartments | 118 | 5.5% |
| Mobile Home / Other | 48 | 2.2% |
| Total | 2,154 | 100.0% |
Housing Structures by Occupancy in Vinton
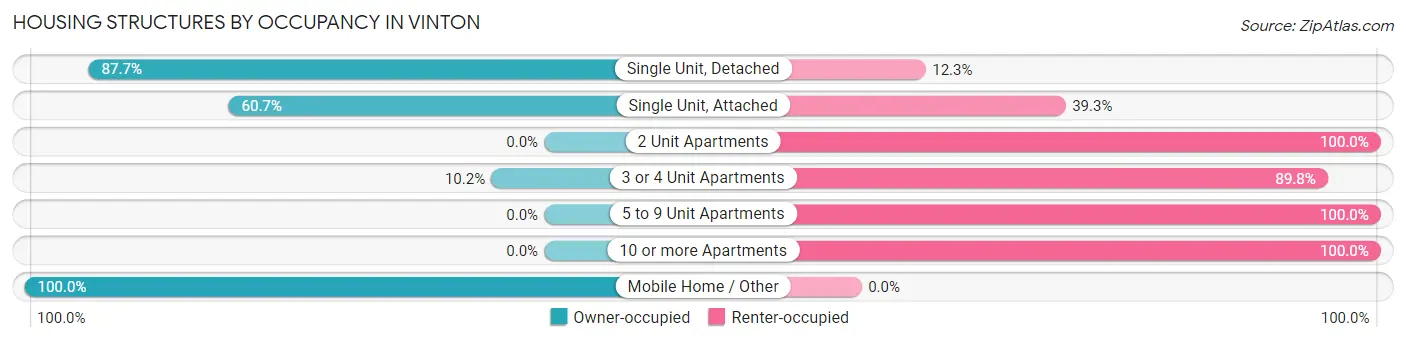
| Structure Type | Owner-occupied | Renter-occupied |
| Single Unit, Detached | 1,549 (87.7%) | 218 (12.3%) |
| Single Unit, Attached | 51 (60.7%) | 33 (39.3%) |
| 2 Unit Apartments | 0 (0.0%) | 12 (100.0%) |
| 3 or 4 Unit Apartments | 10 (10.2%) | 88 (89.8%) |
| 5 to 9 Unit Apartments | 0 (0.0%) | 27 (100.0%) |
| 10 or more Apartments | 0 (0.0%) | 118 (100.0%) |
| Mobile Home / Other | 48 (100.0%) | 0 (0.0%) |
| Total | 1,658 (77.0%) | 496 (23.0%) |
Housing Structures by Number of Rooms in Vinton
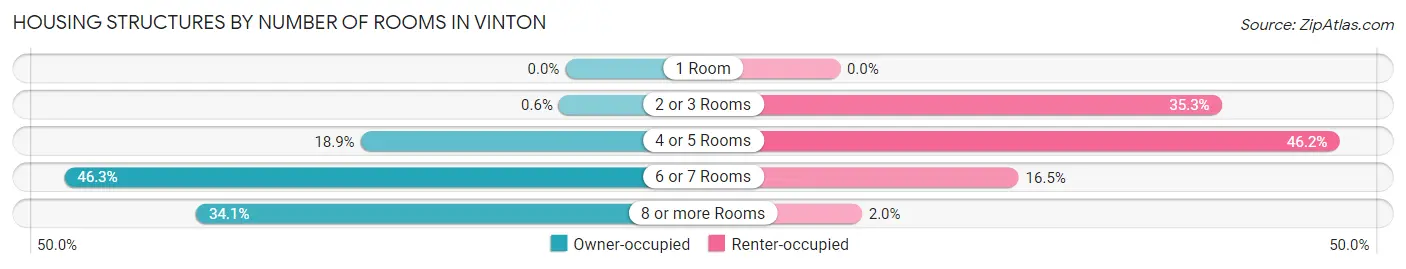
| Number of Rooms | Owner-occupied | Renter-occupied |
| 1 Room | 0 (0.0%) | 0 (0.0%) |
| 2 or 3 Rooms | 10 (0.6%) | 175 (35.3%) |
| 4 or 5 Rooms | 314 (18.9%) | 229 (46.2%) |
| 6 or 7 Rooms | 768 (46.3%) | 82 (16.5%) |
| 8 or more Rooms | 566 (34.1%) | 10 (2.0%) |
| Total | 1,658 (100.0%) | 496 (100.0%) |
Housing Structure by Heating Type in Vinton
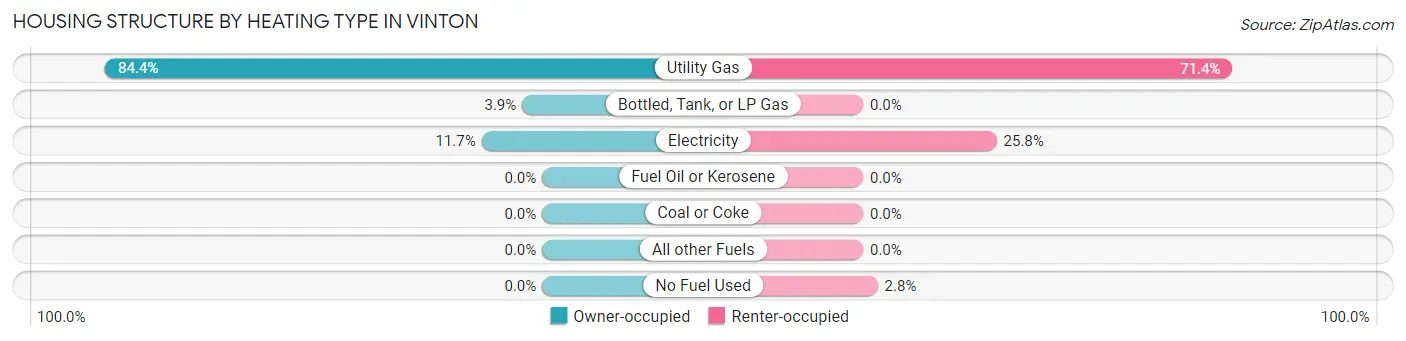
| Heating Type | Owner-occupied | Renter-occupied |
| Utility Gas | 1,400 (84.4%) | 354 (71.4%) |
| Bottled, Tank, or LP Gas | 64 (3.9%) | 0 (0.0%) |
| Electricity | 194 (11.7%) | 128 (25.8%) |
| Fuel Oil or Kerosene | 0 (0.0%) | 0 (0.0%) |
| Coal or Coke | 0 (0.0%) | 0 (0.0%) |
| All other Fuels | 0 (0.0%) | 0 (0.0%) |
| No Fuel Used | 0 (0.0%) | 14 (2.8%) |
| Total | 1,658 (100.0%) | 496 (100.0%) |
Household Vehicle Usage in Vinton
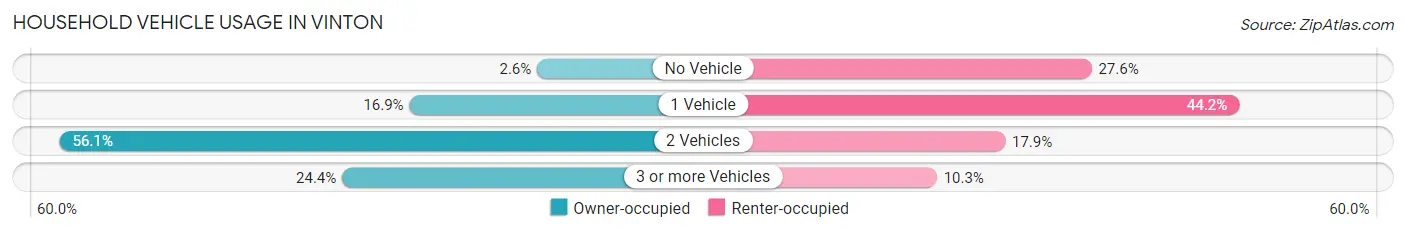
| Vehicles per Household | Owner-occupied | Renter-occupied |
| No Vehicle | 43 (2.6%) | 137 (27.6%) |
| 1 Vehicle | 280 (16.9%) | 219 (44.2%) |
| 2 Vehicles | 930 (56.1%) | 89 (17.9%) |
| 3 or more Vehicles | 405 (24.4%) | 51 (10.3%) |
| Total | 1,658 (100.0%) | 496 (100.0%) |
Real Estate & Mortgages in Vinton
Real Estate and Mortgage Overview in Vinton
| Characteristic | Without Mortgage | With Mortgage |
| Housing Units | 671 | 987 |
| Median Property Value | $156,800 | $150,800 |
| Median Household Income | $29,894 | $255 |
| Monthly Housing Costs | $495 | $46 |
| Real Estate Taxes | $2,148 | $12 |
Property Value by Mortgage Status in Vinton
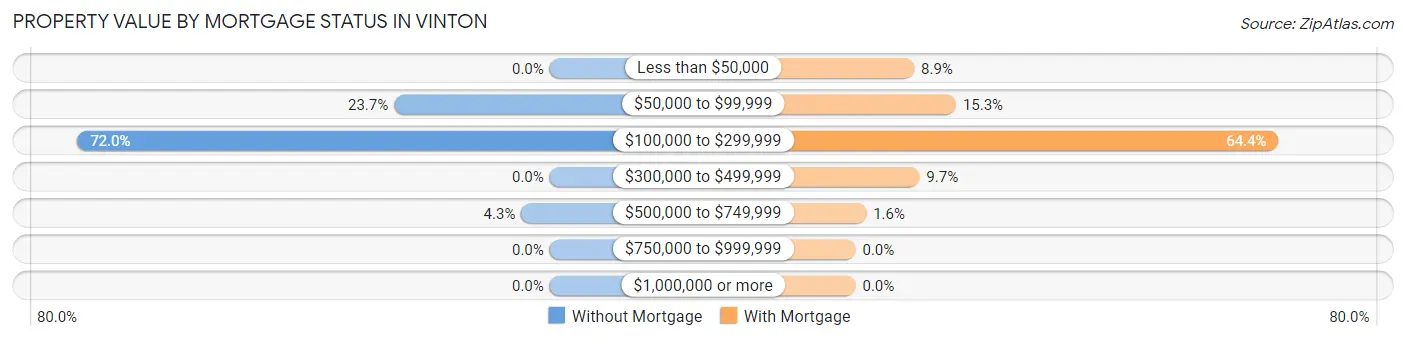
| Property Value | Without Mortgage | With Mortgage |
| Less than $50,000 | 0 (0.0%) | 88 (8.9%) |
| $50,000 to $99,999 | 159 (23.7%) | 151 (15.3%) |
| $100,000 to $299,999 | 483 (72.0%) | 636 (64.4%) |
| $300,000 to $499,999 | 0 (0.0%) | 96 (9.7%) |
| $500,000 to $749,999 | 29 (4.3%) | 16 (1.6%) |
| $750,000 to $999,999 | 0 (0.0%) | 0 (0.0%) |
| $1,000,000 or more | 0 (0.0%) | 0 (0.0%) |
| Total | 671 (100.0%) | 987 (100.0%) |
Household Income by Mortgage Status in Vinton
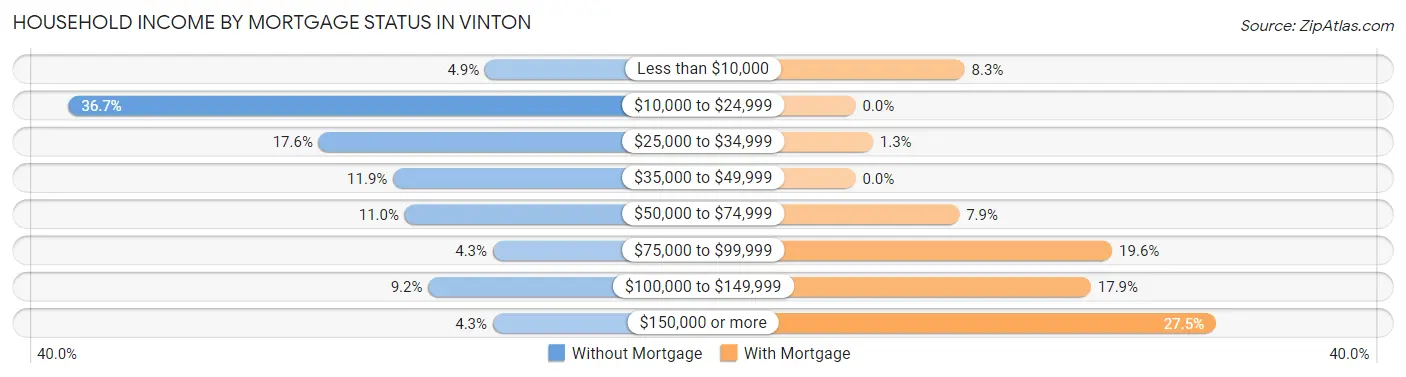
| Household Income | Without Mortgage | With Mortgage |
| Less than $10,000 | 33 (4.9%) | 82 (8.3%) |
| $10,000 to $24,999 | 246 (36.7%) | 0 (0.0%) |
| $25,000 to $34,999 | 118 (17.6%) | 13 (1.3%) |
| $35,000 to $49,999 | 80 (11.9%) | 0 (0.0%) |
| $50,000 to $74,999 | 74 (11.0%) | 78 (7.9%) |
| $75,000 to $99,999 | 29 (4.3%) | 193 (19.6%) |
| $100,000 to $149,999 | 62 (9.2%) | 177 (17.9%) |
| $150,000 or more | 29 (4.3%) | 271 (27.5%) |
| Total | 671 (100.0%) | 987 (100.0%) |
Property Value to Household Income Ratio in Vinton
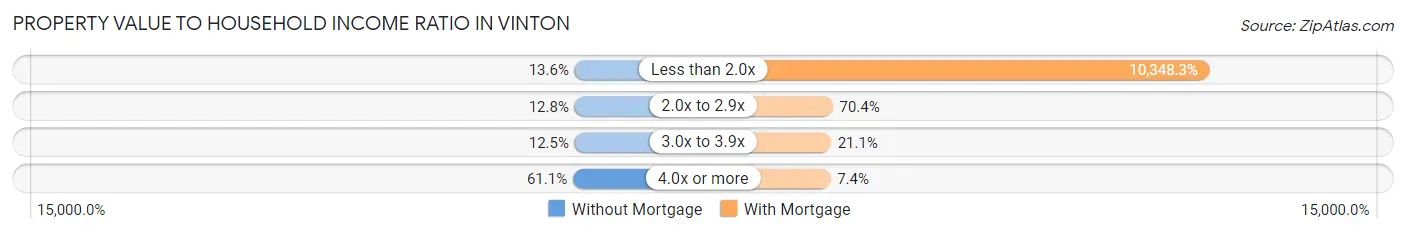
| Value-to-Income Ratio | Without Mortgage | With Mortgage |
| Less than 2.0x | 91 (13.6%) | 102,138 (10,348.3%) |
| 2.0x to 2.9x | 86 (12.8%) | 695 (70.4%) |
| 3.0x to 3.9x | 84 (12.5%) | 208 (21.1%) |
| 4.0x or more | 410 (61.1%) | 73 (7.4%) |
| Total | 671 (100.0%) | 987 (100.0%) |
Real Estate Taxes by Mortgage Status in Vinton
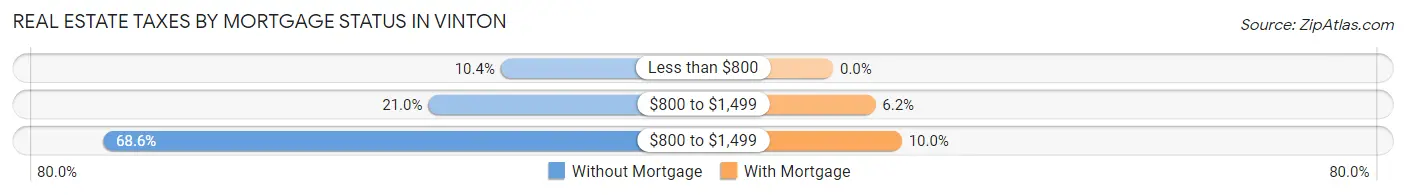
| Property Taxes | Without Mortgage | With Mortgage |
| Less than $800 | 70 (10.4%) | 0 (0.0%) |
| $800 to $1,499 | 141 (21.0%) | 61 (6.2%) |
| $800 to $1,499 | 460 (68.5%) | 99 (10.0%) |
| Total | 671 (100.0%) | 987 (100.0%) |
Health & Disability in Vinton
Health Insurance Coverage by Age in Vinton
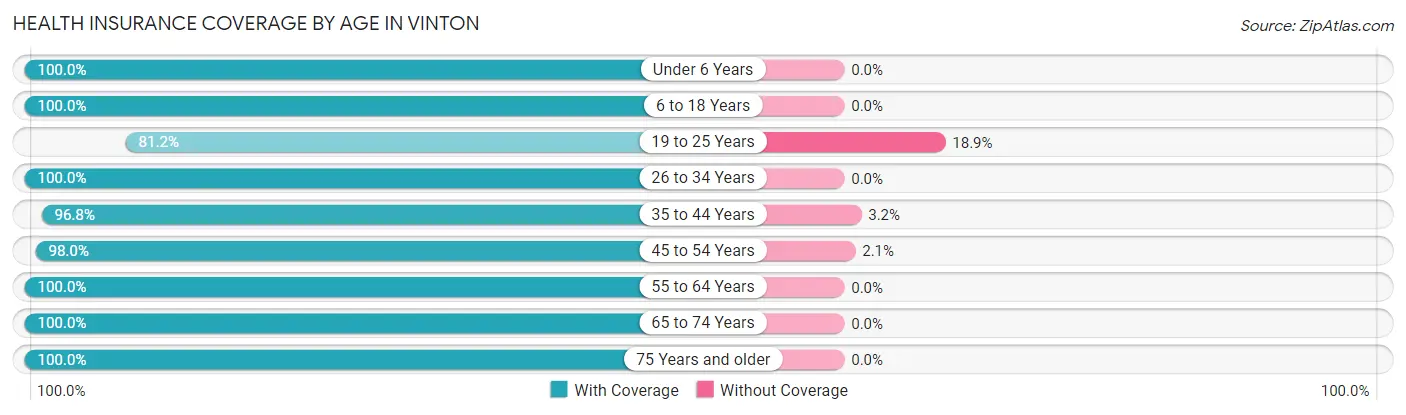
| Age Bracket | With Coverage | Without Coverage |
| Under 6 Years | 235 (100.0%) | 0 (0.0%) |
| 6 to 18 Years | 994 (100.0%) | 0 (0.0%) |
| 19 to 25 Years | 297 (81.1%) | 69 (18.9%) |
| 26 to 34 Years | 294 (100.0%) | 0 (0.0%) |
| 35 to 44 Years | 672 (96.8%) | 22 (3.2%) |
| 45 to 54 Years | 573 (98.0%) | 12 (2.1%) |
| 55 to 64 Years | 637 (100.0%) | 0 (0.0%) |
| 65 to 74 Years | 650 (100.0%) | 0 (0.0%) |
| 75 Years and older | 365 (100.0%) | 0 (0.0%) |
| Total | 4,717 (97.9%) | 103 (2.1%) |
Health Insurance Coverage by Citizenship Status in Vinton
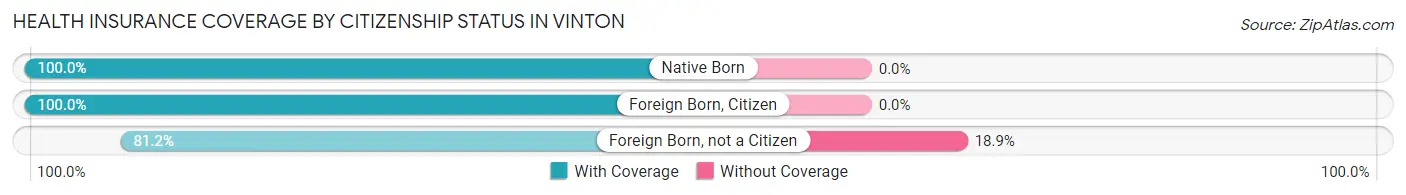
| Citizenship Status | With Coverage | Without Coverage |
| Native Born | 235 (100.0%) | 0 (0.0%) |
| Foreign Born, Citizen | 994 (100.0%) | 0 (0.0%) |
| Foreign Born, not a Citizen | 297 (81.1%) | 69 (18.9%) |
Health Insurance Coverage by Household Income in Vinton
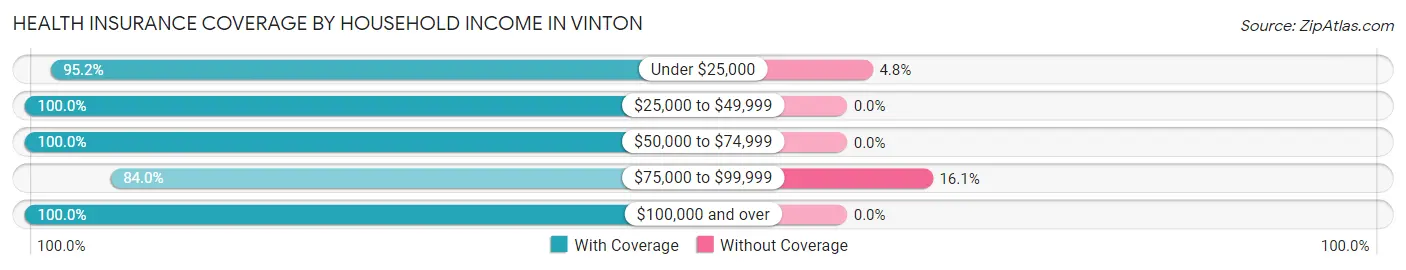
| Household Income | With Coverage | Without Coverage |
| Under $25,000 | 475 (95.2%) | 24 (4.8%) |
| $25,000 to $49,999 | 903 (100.0%) | 0 (0.0%) |
| $50,000 to $74,999 | 883 (100.0%) | 0 (0.0%) |
| $75,000 to $99,999 | 361 (84.0%) | 69 (16.1%) |
| $100,000 and over | 2,061 (100.0%) | 0 (0.0%) |
Public vs Private Health Insurance Coverage by Age in Vinton
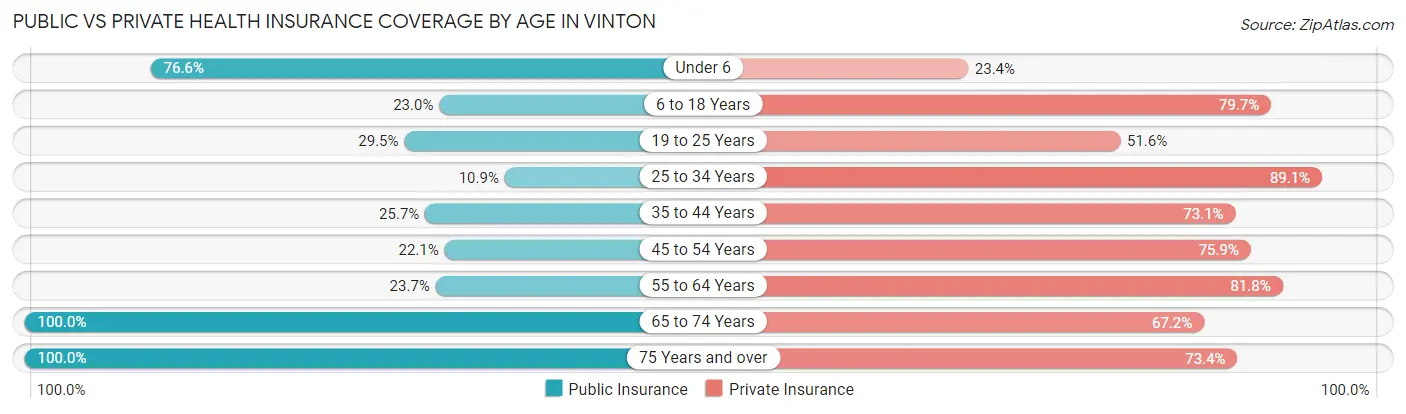
| Age Bracket | Public Insurance | Private Insurance |
| Under 6 | 180 (76.6%) | 55 (23.4%) |
| 6 to 18 Years | 229 (23.0%) | 792 (79.7%) |
| 19 to 25 Years | 108 (29.5%) | 189 (51.6%) |
| 25 to 34 Years | 32 (10.9%) | 262 (89.1%) |
| 35 to 44 Years | 178 (25.7%) | 507 (73.1%) |
| 45 to 54 Years | 129 (22.1%) | 444 (75.9%) |
| 55 to 64 Years | 151 (23.7%) | 521 (81.8%) |
| 65 to 74 Years | 650 (100.0%) | 437 (67.2%) |
| 75 Years and over | 365 (100.0%) | 268 (73.4%) |
| Total | 2,022 (41.9%) | 3,475 (72.1%) |
Disability Status by Sex by Age in Vinton
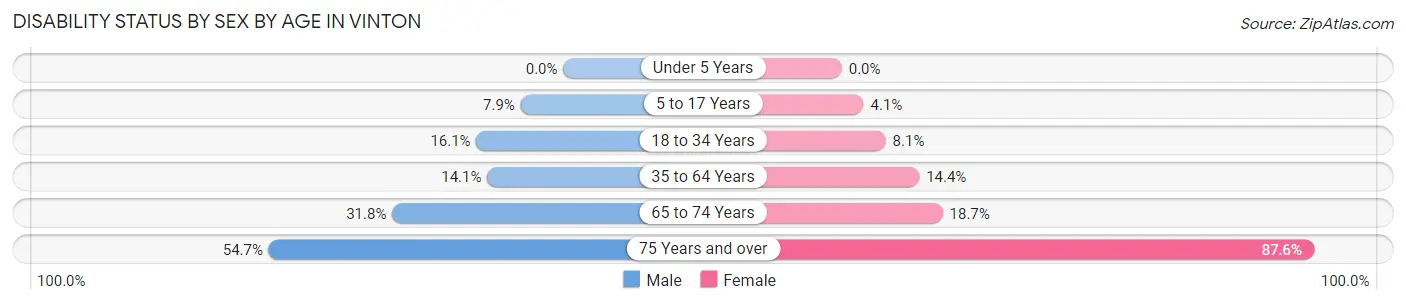
| Age Bracket | Male | Female |
| Under 5 Years | 0 (0.0%) | 0 (0.0%) |
| 5 to 17 Years | 38 (7.9%) | 21 (4.1%) |
| 18 to 34 Years | 60 (16.1%) | 28 (8.1%) |
| 35 to 64 Years | 129 (14.1%) | 144 (14.4%) |
| 65 to 74 Years | 74 (31.8%) | 78 (18.7%) |
| 75 Years and over | 76 (54.7%) | 198 (87.6%) |
Disability Class by Sex by Age in Vinton
Disability Class: Hearing Difficulty
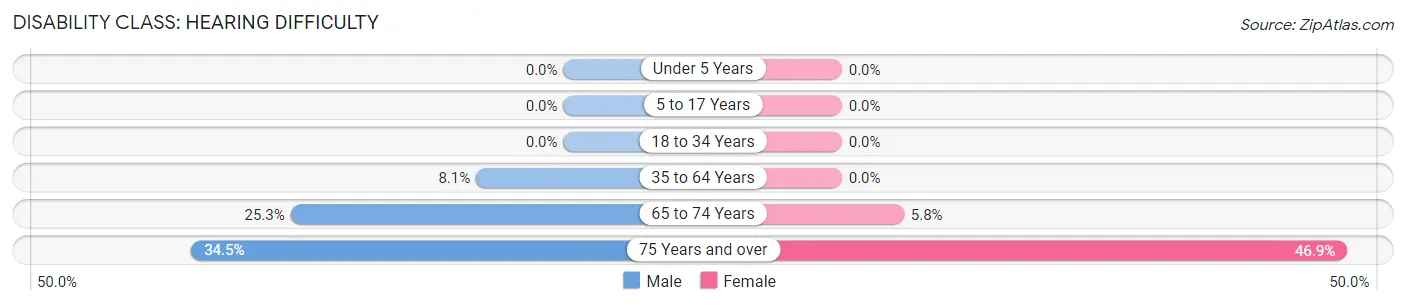
| Age Bracket | Male | Female |
| Under 5 Years | 0 (0.0%) | 0 (0.0%) |
| 5 to 17 Years | 0 (0.0%) | 0 (0.0%) |
| 18 to 34 Years | 0 (0.0%) | 0 (0.0%) |
| 35 to 64 Years | 74 (8.1%) | 0 (0.0%) |
| 65 to 74 Years | 59 (25.3%) | 24 (5.8%) |
| 75 Years and over | 48 (34.5%) | 106 (46.9%) |
Disability Class: Vision Difficulty
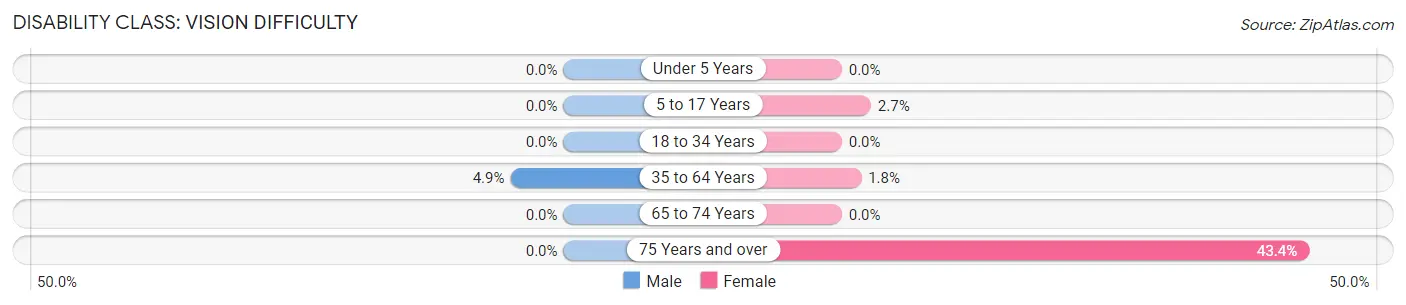
| Age Bracket | Male | Female |
| Under 5 Years | 0 (0.0%) | 0 (0.0%) |
| 5 to 17 Years | 0 (0.0%) | 14 (2.7%) |
| 18 to 34 Years | 0 (0.0%) | 0 (0.0%) |
| 35 to 64 Years | 45 (4.9%) | 18 (1.8%) |
| 65 to 74 Years | 0 (0.0%) | 0 (0.0%) |
| 75 Years and over | 0 (0.0%) | 98 (43.4%) |
Disability Class: Cognitive Difficulty
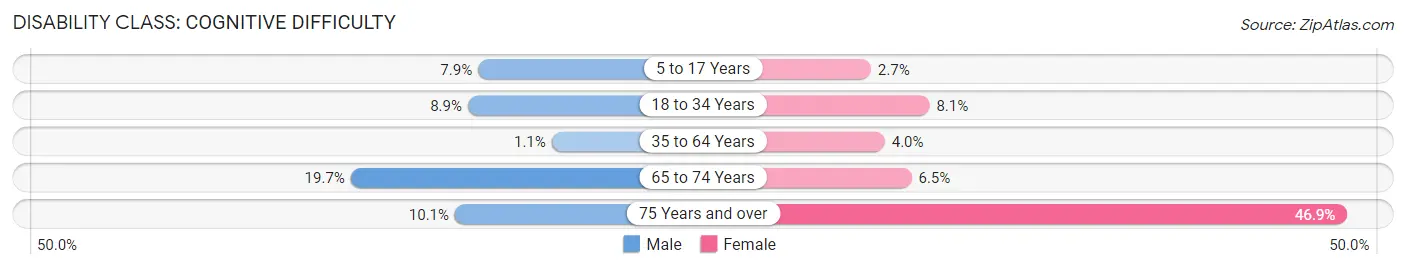
| Age Bracket | Male | Female |
| 5 to 17 Years | 38 (7.9%) | 14 (2.7%) |
| 18 to 34 Years | 33 (8.9%) | 28 (8.1%) |
| 35 to 64 Years | 10 (1.1%) | 40 (4.0%) |
| 65 to 74 Years | 46 (19.7%) | 27 (6.5%) |
| 75 Years and over | 14 (10.1%) | 106 (46.9%) |
Disability Class: Ambulatory Difficulty
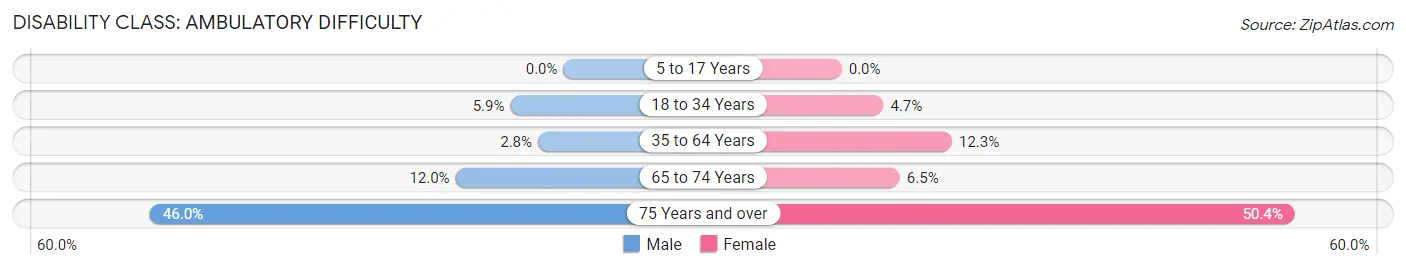
| Age Bracket | Male | Female |
| 5 to 17 Years | 0 (0.0%) | 0 (0.0%) |
| 18 to 34 Years | 22 (5.9%) | 16 (4.6%) |
| 35 to 64 Years | 26 (2.8%) | 123 (12.3%) |
| 65 to 74 Years | 28 (12.0%) | 27 (6.5%) |
| 75 Years and over | 64 (46.0%) | 114 (50.4%) |
Disability Class: Self-Care Difficulty
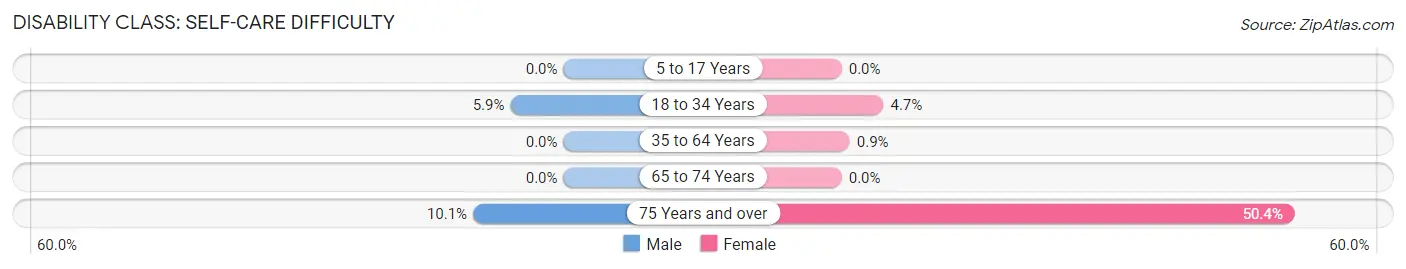
| Age Bracket | Male | Female |
| 5 to 17 Years | 0 (0.0%) | 0 (0.0%) |
| 18 to 34 Years | 22 (5.9%) | 16 (4.6%) |
| 35 to 64 Years | 0 (0.0%) | 9 (0.9%) |
| 65 to 74 Years | 0 (0.0%) | 0 (0.0%) |
| 75 Years and over | 14 (10.1%) | 114 (50.4%) |
Technology Access in Vinton
Computing Device Access in Vinton
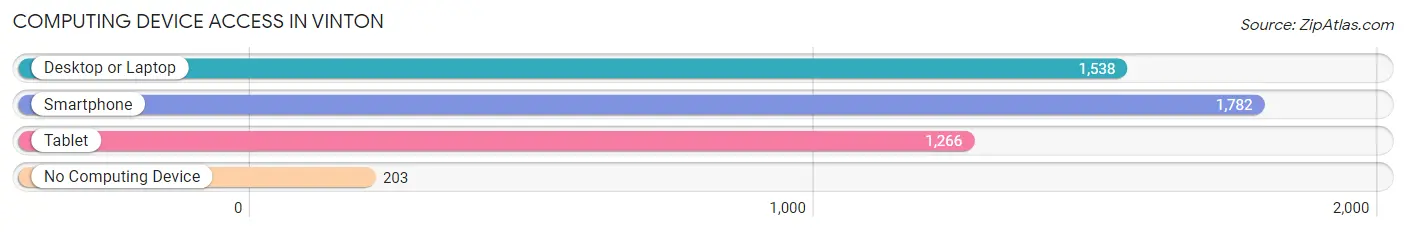
| Device Type | # Households | % Households |
| Desktop or Laptop | 1,538 | 71.4% |
| Smartphone | 1,782 | 82.7% |
| Tablet | 1,266 | 58.8% |
| No Computing Device | 203 | 9.4% |
| Total | 2,154 | 100.0% |
Internet Access in Vinton
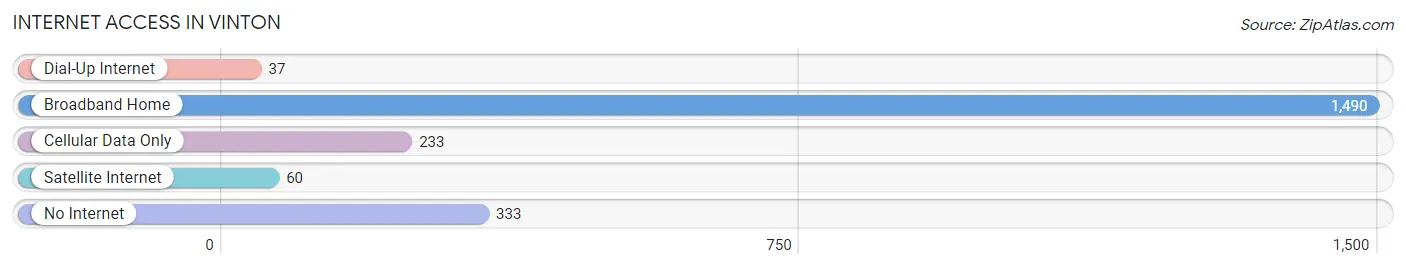
| Internet Type | # Households | % Households |
| Dial-Up Internet | 37 | 1.7% |
| Broadband Home | 1,490 | 69.2% |
| Cellular Data Only | 233 | 10.8% |
| Satellite Internet | 60 | 2.8% |
| No Internet | 333 | 15.5% |
| Total | 2,154 | 100.0% |
Vinton Summary
Vinton, Iowa is a small city located in Benton County, Iowa. It is situated on the Cedar River and is part of the Cedar Rapids Metropolitan Statistical Area. The city has a population of 5,257 as of the 2010 census.
History
Vinton was founded in 1853 by William Vinton, a settler from Ohio. The city was originally named Vintonville, but the name was changed to Vinton in 1857. The city was incorporated in 1868.
Vinton was a major stop on the Chicago, Rock Island and Pacific Railroad, which ran through the city from 1866 to 1970. The railroad was a major factor in the city's growth and development.
Geography
Vinton is located at 42°10'25" North, 92°7'17" West (42.173611, -92.121389). According to the United States Census Bureau, the city has a total area of 4.2 square miles (10.8 km2), all of it land.
Economy
Vinton's economy is largely based on manufacturing and agriculture. The city is home to several manufacturing companies, including Vinton Manufacturing, which produces industrial equipment, and Vinton Plastics, which produces plastic products.
Agriculture is also an important part of the local economy. The city is home to several farms, including the Vinton Family Farm, which produces corn, soybeans, and hay.
Demographics
As of the 2010 census, Vinton had a population of 5,257. The racial makeup of the city was 95.2% White, 0.7% African American, 0.3% Native American, 0.7% Asian, 0.1% Pacific Islander, 1.3% from other races, and 1.7% from two or more races. Hispanic or Latino of any race were 3.2% of the population.
The median income for a household in the city was $41,944, and the median income for a family was $50,917. The per capita income for the city was $20,845. About 8.2% of families and 10.2% of the population were below the poverty line, including 14.2% of those under age 18 and 8.2% of those age 65 or over.
Vinton is served by the Vinton-Shellsburg Community School District. The district has two elementary schools, one middle school, and one high school. The city is also home to Kirkwood Community College, which offers a variety of associate degree and certificate programs.
Common Questions
What is Per Capita Income in Vinton?
Per Capita income in Vinton is $34,619.
What is the Median Family Income in Vinton?
Median Family Income in Vinton is $84,476.
What is the Median Household income in Vinton?
Median Household Income in Vinton is $63,100.
What is Income or Wage Gap in Vinton?
Income or Wage Gap in Vinton is 12.6%.
Women in Vinton earn 87.4 cents for every dollar earned by a man.
What is Inequality or Gini Index in Vinton?
Inequality or Gini Index in Vinton is 0.46.
What is the Total Population of Vinton?
Total Population of Vinton is 4,953.
What is the Total Male Population of Vinton?
Total Male Population of Vinton is 2,267.
What is the Total Female Population of Vinton?
Total Female Population of Vinton is 2,686.
What is the Ratio of Males per 100 Females in Vinton?
There are 84.40 Males per 100 Females in Vinton.
What is the Ratio of Females per 100 Males in Vinton?
There are 118.48 Females per 100 Males in Vinton.
What is the Median Population Age in Vinton?
Median Population Age in Vinton is 44.1 Years.
What is the Average Family Size in Vinton
Average Family Size in Vinton is 2.9 People.
What is the Average Household Size in Vinton
Average Household Size in Vinton is 2.2 People.
How Large is the Labor Force in Vinton?
There are 2,358 People in the Labor Forcein in Vinton.
What is the Percentage of People in the Labor Force in Vinton?
61.0% of People are in the Labor Force in Vinton.
What is the Unemployment Rate in Vinton?
Unemployment Rate in Vinton is 2.2%.