Belle Plaine, MN Map & Demographics
Belle Plaine Map
Belle Plaine Overview
$39,848
PER CAPITA INCOME
$108,897
AVG FAMILY INCOME
$94,698
AVG HOUSEHOLD INCOME
22.5%
WAGE / INCOME GAP [ % ]
77.5¢/ $1
WAGE / INCOME GAP [ $ ]
0.35
INEQUALITY / GINI INDEX
7,363
TOTAL POPULATION
3,728
MALE POPULATION
3,635
FEMALE POPULATION
102.56
MALES / 100 FEMALES
97.51
FEMALES / 100 MALES
38.5
MEDIAN AGE
3.0
AVG FAMILY SIZE
2.6
AVG HOUSEHOLD SIZE
3,996
LABOR FORCE [ PEOPLE ]
73.1%
PERCENT IN LABOR FORCE
0.7%
UNEMPLOYMENT RATE
Belle Plaine Zip Codes
Belle Plaine Area Codes
Income in Belle Plaine
Income Overview in Belle Plaine
Per Capita Income in Belle Plaine is $39,848, while median incomes of families and households are $108,897 and $94,698 respectively.
| Characteristic | Number | Measure |
| Per Capita Income | 7,363 | $39,848 |
| Median Family Income | 1,961 | $108,897 |
| Mean Family Income | 1,961 | $122,832 |
| Median Household Income | 2,658 | $94,698 |
| Mean Household Income | 2,658 | $108,337 |
| Income Deficit | 1,961 | $0 |
| Wage / Income Gap (%) | 7,363 | 22.50% |
| Wage / Income Gap ($) | 7,363 | 77.50¢ per $1 |
| Gini / Inequality Index | 7,363 | 0.35 |
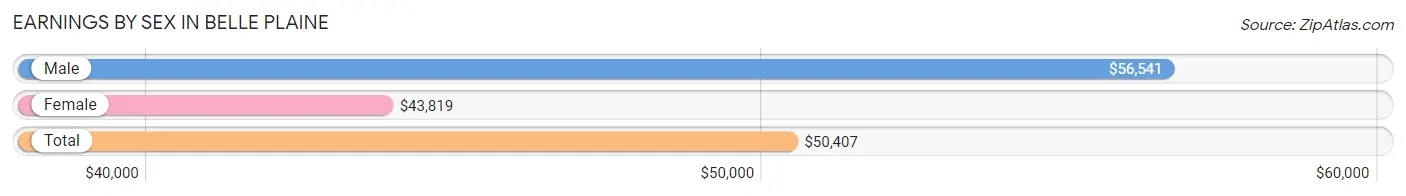
Earnings by Sex in Belle Plaine
Average Earnings in Belle Plaine are $50,407, $56,541 for men and $43,819 for women, a difference of 22.5%.
| Sex | Number | Average Earnings |
| Male | 2,186 (52.0%) | $56,541 |
| Female | 2,021 (48.0%) | $43,819 |
| Total | 4,207 (100.0%) | $50,407 |
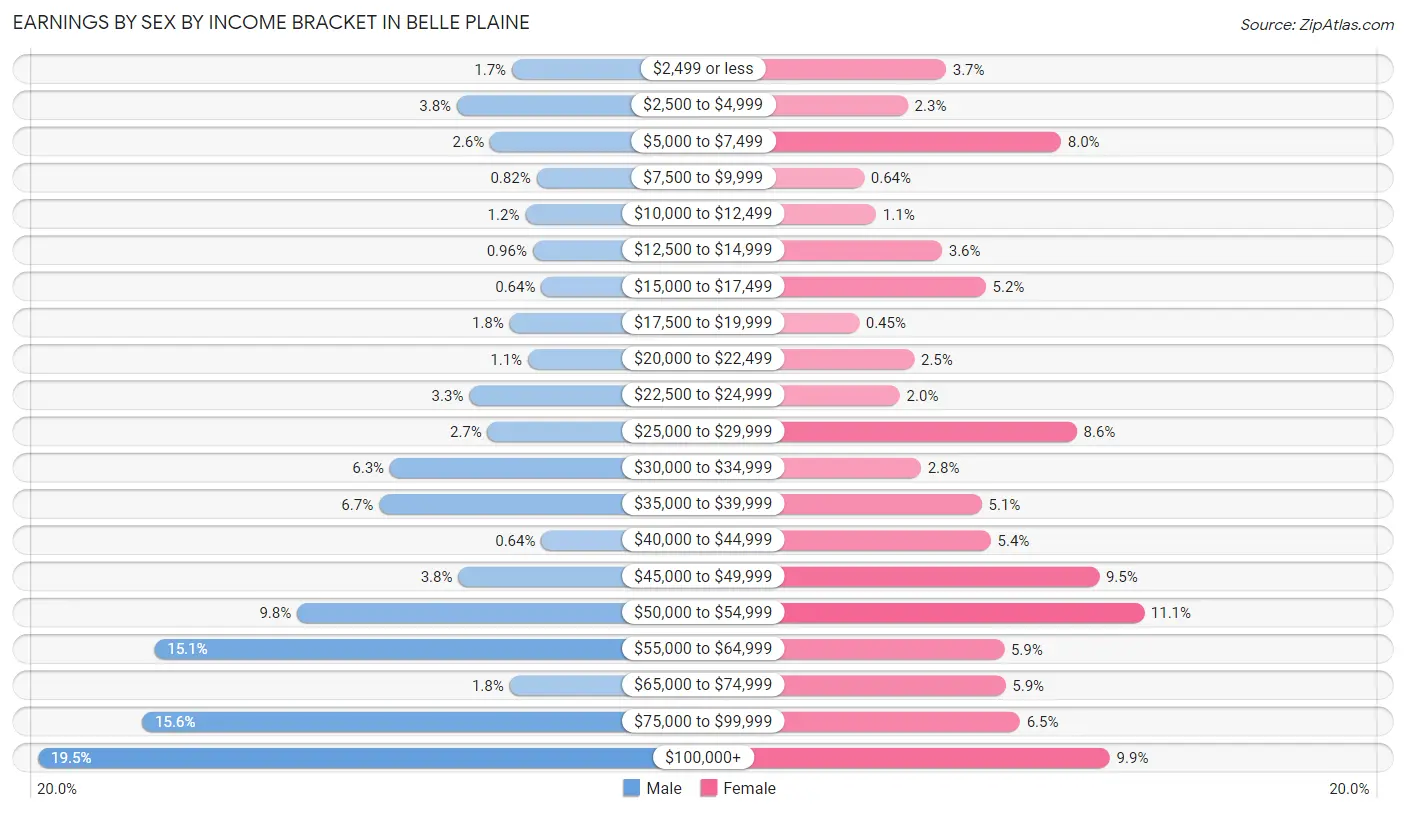
Earnings by Sex by Income Bracket in Belle Plaine
The most common earnings brackets in Belle Plaine are $100,000+ for men (426 | 19.5%) and $50,000 to $54,999 for women (225 | 11.1%).
| Income | Male | Female |
| $2,499 or less | 38 (1.7%) | 75 (3.7%) |
| $2,500 to $4,999 | 83 (3.8%) | 46 (2.3%) |
| $5,000 to $7,499 | 56 (2.6%) | 162 (8.0%) |
| $7,500 to $9,999 | 18 (0.8%) | 13 (0.6%) |
| $10,000 to $12,499 | 27 (1.2%) | 22 (1.1%) |
| $12,500 to $14,999 | 21 (1.0%) | 72 (3.6%) |
| $15,000 to $17,499 | 14 (0.6%) | 105 (5.2%) |
| $17,500 to $19,999 | 40 (1.8%) | 9 (0.4%) |
| $20,000 to $22,499 | 25 (1.1%) | 51 (2.5%) |
| $22,500 to $24,999 | 73 (3.3%) | 40 (2.0%) |
| $25,000 to $29,999 | 58 (2.6%) | 174 (8.6%) |
| $30,000 to $34,999 | 138 (6.3%) | 56 (2.8%) |
| $35,000 to $39,999 | 147 (6.7%) | 102 (5.1%) |
| $40,000 to $44,999 | 14 (0.6%) | 109 (5.4%) |
| $45,000 to $49,999 | 82 (3.7%) | 191 (9.5%) |
| $50,000 to $54,999 | 214 (9.8%) | 225 (11.1%) |
| $55,000 to $64,999 | 331 (15.1%) | 119 (5.9%) |
| $65,000 to $74,999 | 40 (1.8%) | 120 (5.9%) |
| $75,000 to $99,999 | 341 (15.6%) | 131 (6.5%) |
| $100,000+ | 426 (19.5%) | 199 (9.9%) |
| Total | 2,186 (100.0%) | 2,021 (100.0%) |
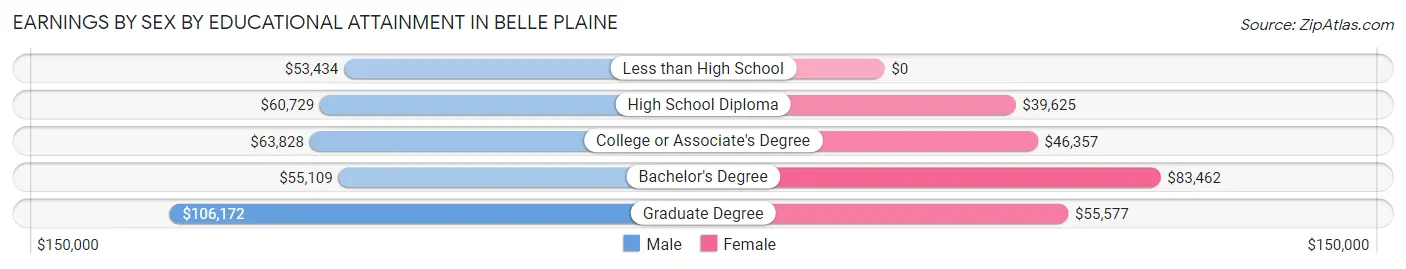
Earnings by Sex by Educational Attainment in Belle Plaine
Average earnings in Belle Plaine are $60,986 for men and $47,900 for women, a difference of 21.5%. Men with an educational attainment of graduate degree enjoy the highest average annual earnings of $106,172, while those with less than high school education earn the least with $53,434. Women with an educational attainment of bachelor's degree earn the most with the average annual earnings of $83,462, while those with high school diploma education have the smallest earnings of $39,625.
| Educational Attainment | Male Income | Female Income |
| Less than High School | $53,434 | $0 |
| High School Diploma | $60,729 | $39,625 |
| College or Associate's Degree | $63,828 | $46,357 |
| Bachelor's Degree | $55,109 | $83,462 |
| Graduate Degree | $106,172 | $55,577 |
| Total | $60,986 | $47,900 |
Family Income in Belle Plaine
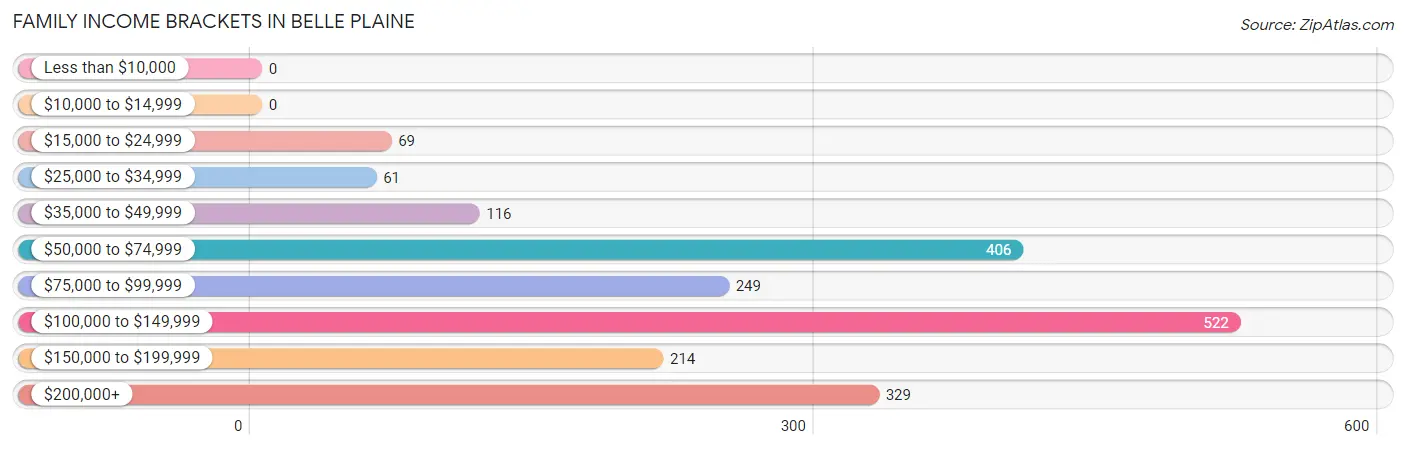
Family Income Brackets in Belle Plaine
According to the Belle Plaine family income data, there are 522 families falling into the $100,000 to $149,999 income range, which is the most common income bracket and makes up 26.6% of all families.
| Income Bracket | # Families | % Families |
| Less than $10,000 | 0 | 0.0% |
| $10,000 to $14,999 | 0 | 0.0% |
| $15,000 to $24,999 | 69 | 3.5% |
| $25,000 to $34,999 | 61 | 3.1% |
| $35,000 to $49,999 | 116 | 5.9% |
| $50,000 to $74,999 | 406 | 20.7% |
| $75,000 to $99,999 | 249 | 12.7% |
| $100,000 to $149,999 | 522 | 26.6% |
| $150,000 to $199,999 | 214 | 10.9% |
| $200,000+ | 329 | 16.8% |
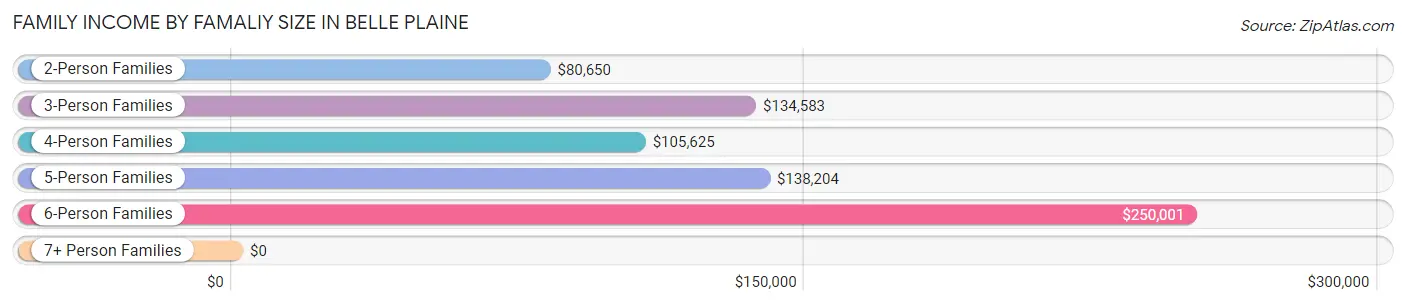
Family Income by Famaliy Size in Belle Plaine
6-person families (64 | 3.3%) account for the highest median family income in Belle Plaine with $250,001 per family, while 3-person families (546 | 27.8%) have the highest median income of $44,861 per family member.
| Income Bracket | # Families | Median Income |
| 2-Person Families | 785 (40.0%) | $80,650 |
| 3-Person Families | 546 (27.8%) | $134,583 |
| 4-Person Families | 252 (12.9%) | $105,625 |
| 5-Person Families | 314 (16.0%) | $138,204 |
| 6-Person Families | 64 (3.3%) | $250,001 |
| 7+ Person Families | 0 (0.0%) | $0 |
| Total | 1,961 (100.0%) | $108,897 |
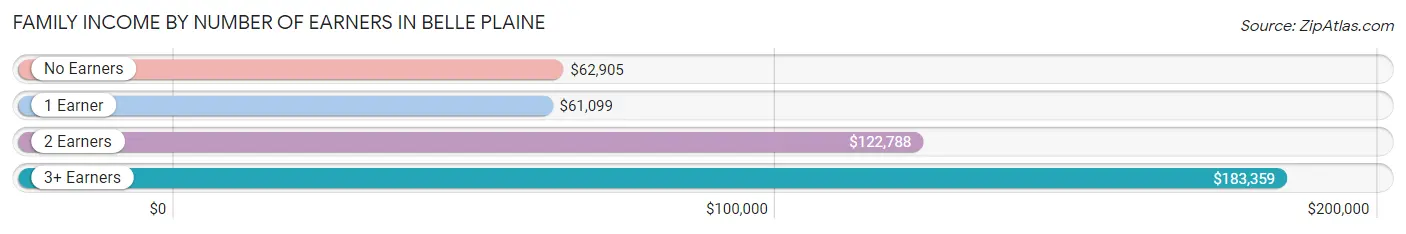
Family Income by Number of Earners in Belle Plaine
The median family income in Belle Plaine is $108,897, with families comprising 3+ earners (327) having the highest median family income of $183,359, while families with 1 earner (437) have the lowest median family income of $61,099, accounting for 16.7% and 22.3% of families, respectively.
| Number of Earners | # Families | Median Income |
| No Earners | 246 (12.5%) | $62,905 |
| 1 Earner | 437 (22.3%) | $61,099 |
| 2 Earners | 951 (48.5%) | $122,788 |
| 3+ Earners | 327 (16.7%) | $183,359 |
| Total | 1,961 (100.0%) | $108,897 |
Household Income in Belle Plaine
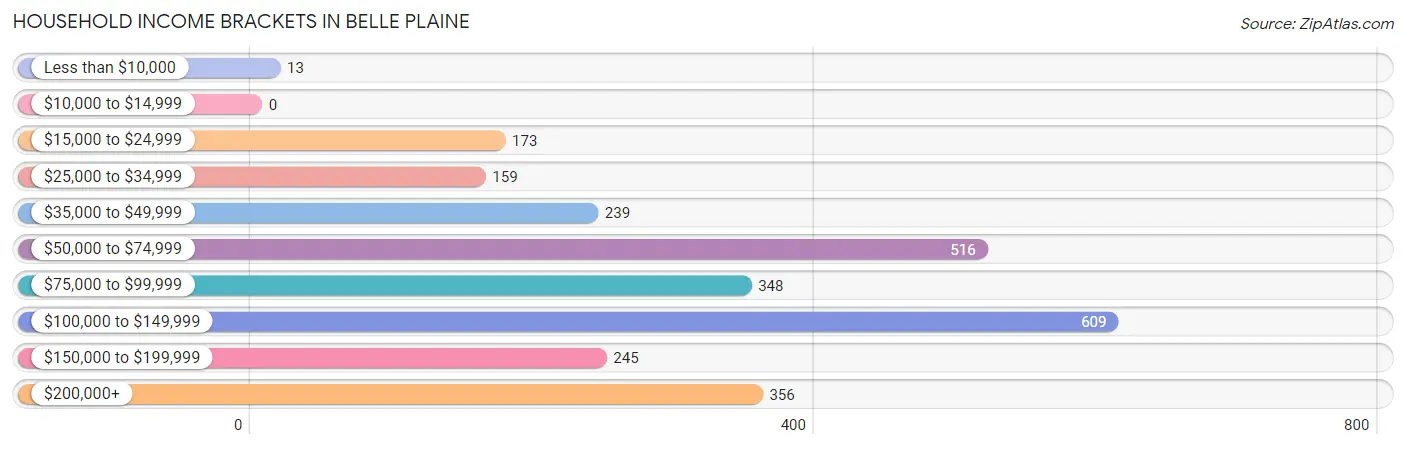
Household Income Brackets in Belle Plaine
With 609 households falling in the category, the $100,000 to $149,999 income range is the most frequent in Belle Plaine, accounting for 22.9% of all households.
| Income Bracket | # Households | % Households |
| Less than $10,000 | 13 | 0.5% |
| $10,000 to $14,999 | 0 | 0.0% |
| $15,000 to $24,999 | 173 | 6.5% |
| $25,000 to $34,999 | 159 | 6.0% |
| $35,000 to $49,999 | 239 | 9.0% |
| $50,000 to $74,999 | 516 | 19.4% |
| $75,000 to $99,999 | 348 | 13.1% |
| $100,000 to $149,999 | 609 | 22.9% |
| $150,000 to $199,999 | 245 | 9.2% |
| $200,000+ | 356 | 13.4% |
Household Income by Householder Age in Belle Plaine
The median household income in Belle Plaine is $94,698, with the highest median household income of $120,833 found in the 45 to 64 years age bracket for the primary householder. A total of 972 households (36.6%) fall into this category. Meanwhile, the 15 to 24 years age bracket for the primary householder has the lowest median household income of $0, with 32 households (1.2%) in this group.

| Income Bracket | # Households | Median Income |
| 15 to 24 Years | 32 (1.2%) | $0 |
| 25 to 44 Years | 1,047 (39.4%) | $97,560 |
| 45 to 64 Years | 972 (36.6%) | $120,833 |
| 65+ Years | 607 (22.8%) | $55,332 |
| Total | 2,658 (100.0%) | $94,698 |
Poverty in Belle Plaine
Income Below Poverty by Sex and Age in Belle Plaine
With 1.6% poverty level for males and 2.5% for females among the residents of Belle Plaine, 16 and 17 year old males and 18 to 24 year old females are the most vulnerable to poverty, with 19 males (35.8%) and 32 females (16.6%) in their respective age groups living below the poverty level.
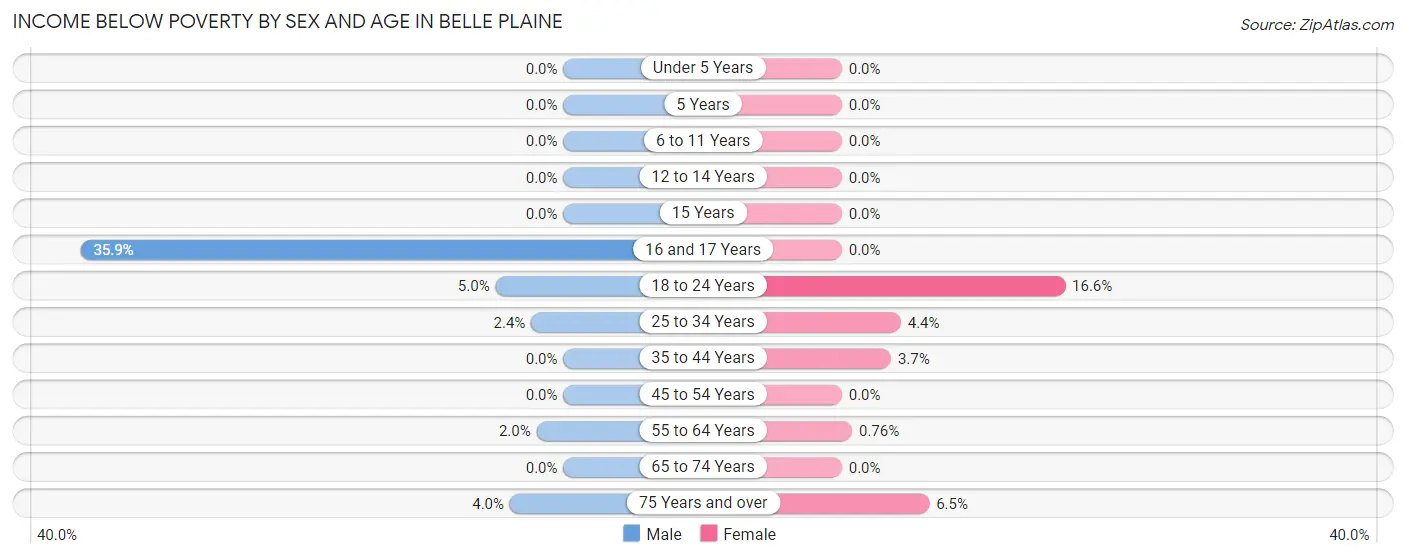
| Age Bracket | Male | Female |
| Under 5 Years | 0 (0.0%) | 0 (0.0%) |
| 5 Years | 0 (0.0%) | 0 (0.0%) |
| 6 to 11 Years | 0 (0.0%) | 0 (0.0%) |
| 12 to 14 Years | 0 (0.0%) | 0 (0.0%) |
| 15 Years | 0 (0.0%) | 0 (0.0%) |
| 16 and 17 Years | 19 (35.8%) | 0 (0.0%) |
| 18 to 24 Years | 13 (5.0%) | 32 (16.6%) |
| 25 to 34 Years | 8 (2.4%) | 16 (4.4%) |
| 35 to 44 Years | 0 (0.0%) | 21 (3.6%) |
| 45 to 54 Years | 0 (0.0%) | 0 (0.0%) |
| 55 to 64 Years | 8 (2.0%) | 3 (0.8%) |
| 65 to 74 Years | 0 (0.0%) | 0 (0.0%) |
| 75 Years and over | 10 (4.0%) | 12 (6.5%) |
| Total | 58 (1.6%) | 84 (2.5%) |
Income Above Poverty by Sex and Age in Belle Plaine
According to the poverty statistics in Belle Plaine, males aged under 5 years and females aged under 5 years are the age groups that are most secure financially, with 100.0% of males and 100.0% of females in these age groups living above the poverty line.
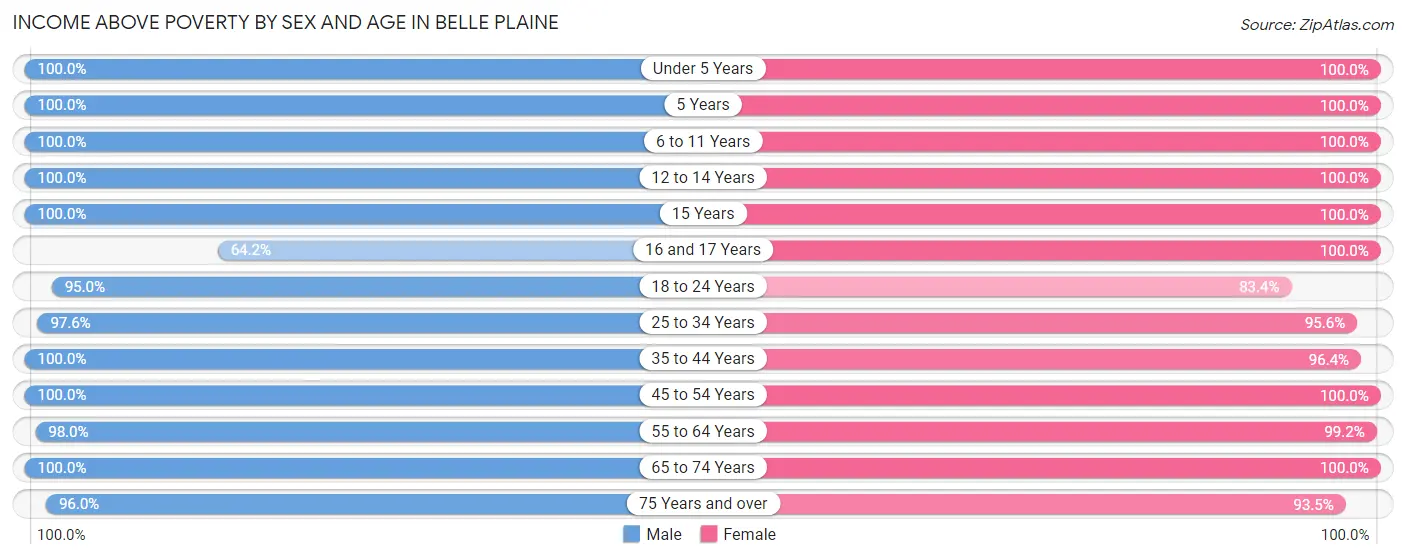
| Age Bracket | Male | Female |
| Under 5 Years | 334 (100.0%) | 219 (100.0%) |
| 5 Years | 47 (100.0%) | 36 (100.0%) |
| 6 to 11 Years | 305 (100.0%) | 510 (100.0%) |
| 12 to 14 Years | 128 (100.0%) | 188 (100.0%) |
| 15 Years | 78 (100.0%) | 34 (100.0%) |
| 16 and 17 Years | 34 (64.1%) | 92 (100.0%) |
| 18 to 24 Years | 245 (95.0%) | 161 (83.4%) |
| 25 to 34 Years | 327 (97.6%) | 349 (95.6%) |
| 35 to 44 Years | 553 (100.0%) | 555 (96.4%) |
| 45 to 54 Years | 548 (100.0%) | 369 (100.0%) |
| 55 to 64 Years | 395 (98.0%) | 391 (99.2%) |
| 65 to 74 Years | 294 (100.0%) | 237 (100.0%) |
| 75 Years and over | 242 (96.0%) | 173 (93.5%) |
| Total | 3,530 (98.4%) | 3,314 (97.5%) |
Income Below Poverty Among Married-Couple Families in Belle Plaine
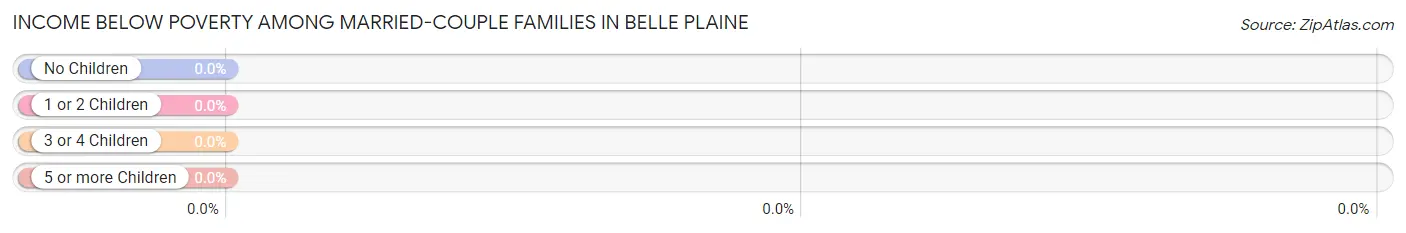
| Children | Above Poverty | Below Poverty |
| No Children | 769 (100.0%) | 0 (0.0%) |
| 1 or 2 Children | 531 (100.0%) | 0 (0.0%) |
| 3 or 4 Children | 211 (100.0%) | 0 (0.0%) |
| 5 or more Children | 0 (0.0%) | 0 (0.0%) |
| Total | 1,511 (100.0%) | 0 (0.0%) |
Income Below Poverty Among Single-Parent Households in Belle Plaine
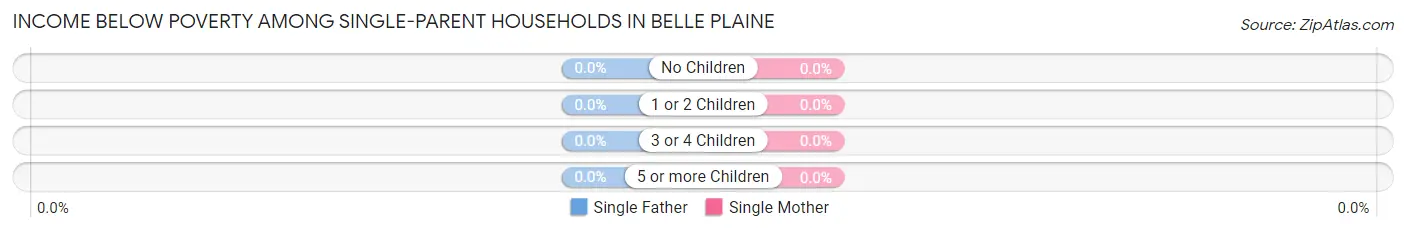
| Children | Single Father | Single Mother |
| No Children | 0 (0.0%) | 0 (0.0%) |
| 1 or 2 Children | 0 (0.0%) | 0 (0.0%) |
| 3 or 4 Children | 0 (0.0%) | 0 (0.0%) |
| 5 or more Children | 0 (0.0%) | 0 (0.0%) |
| Total | 0 (0.0%) | 0 (0.0%) |
Income Below Poverty Among Married-Couple vs Single-Parent Households in Belle Plaine
| Children | Married-Couple Families | Single-Parent Households |
| No Children | 0 (0.0%) | 0 (0.0%) |
| 1 or 2 Children | 0 (0.0%) | 0 (0.0%) |
| 3 or 4 Children | 0 (0.0%) | 0 (0.0%) |
| 5 or more Children | 0 (0.0%) | 0 (0.0%) |
| Total | 0 (0.0%) | 0 (0.0%) |
Race in Belle Plaine
The most populous races in Belle Plaine are White / Caucasian (6,811 | 92.5%), Black / African American (262 | 3.6%), and Two or more Races (177 | 2.4%).

| Race | # Population | % Population |
| Asian | 24 | 0.3% |
| Black / African American | 262 | 3.6% |
| Hawaiian / Pacific | 0 | 0.0% |
| Hispanic or Latino | 21 | 0.3% |
| Native / Alaskan | 12 | 0.2% |
| White / Caucasian | 6,811 | 92.5% |
| Two or more Races | 177 | 2.4% |
| Some other Race | 77 | 1.1% |
| Total | 7,363 | 100.0% |
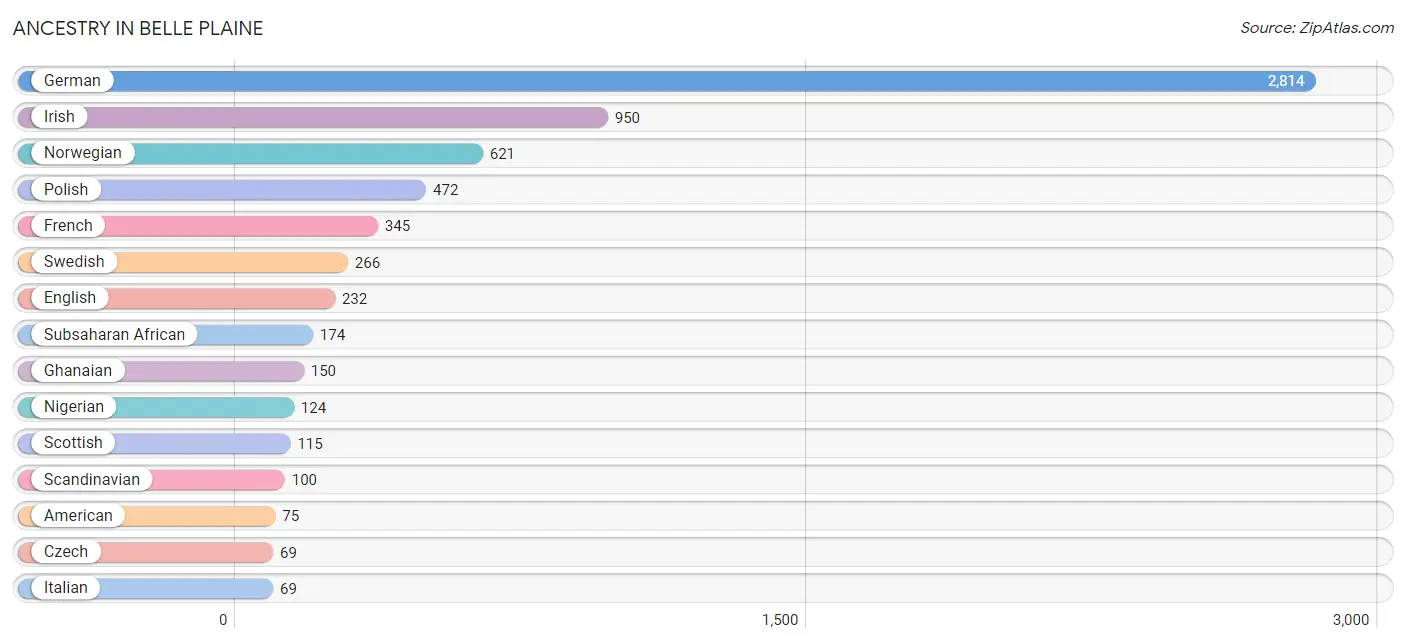
Ancestry in Belle Plaine
The most populous ancestries reported in Belle Plaine are German (2,814 | 38.2%), Irish (950 | 12.9%), Norwegian (621 | 8.4%), Polish (472 | 6.4%), and French (345 | 4.7%), together accounting for 70.7% of all Belle Plaine residents.
| Ancestry | # Population | % Population |
| American | 75 | 1.0% |
| Burmese | 56 | 0.8% |
| Canadian | 20 | 0.3% |
| Croatian | 57 | 0.8% |
| Czech | 69 | 0.9% |
| Czechoslovakian | 53 | 0.7% |
| Danish | 43 | 0.6% |
| Dutch | 26 | 0.4% |
| English | 232 | 3.2% |
| European | 46 | 0.6% |
| Finnish | 33 | 0.4% |
| French | 345 | 4.7% |
| German | 2,814 | 38.2% |
| Ghanaian | 150 | 2.0% |
| Greek | 24 | 0.3% |
| Irish | 950 | 12.9% |
| Italian | 69 | 0.9% |
| Korean | 24 | 0.3% |
| Mexican | 21 | 0.3% |
| Nigerian | 124 | 1.7% |
| Norwegian | 621 | 8.4% |
| Polish | 472 | 6.4% |
| Russian | 32 | 0.4% |
| Scandinavian | 100 | 1.4% |
| Scotch-Irish | 48 | 0.6% |
| Scottish | 115 | 1.6% |
| Sioux | 26 | 0.4% |
| Subsaharan African | 174 | 2.4% |
| Swedish | 266 | 3.6% |
| Swiss | 35 | 0.5% |
| Ukrainian | 3 | 0.0% |
| Welsh | 49 | 0.7% | View All 32 Rows |
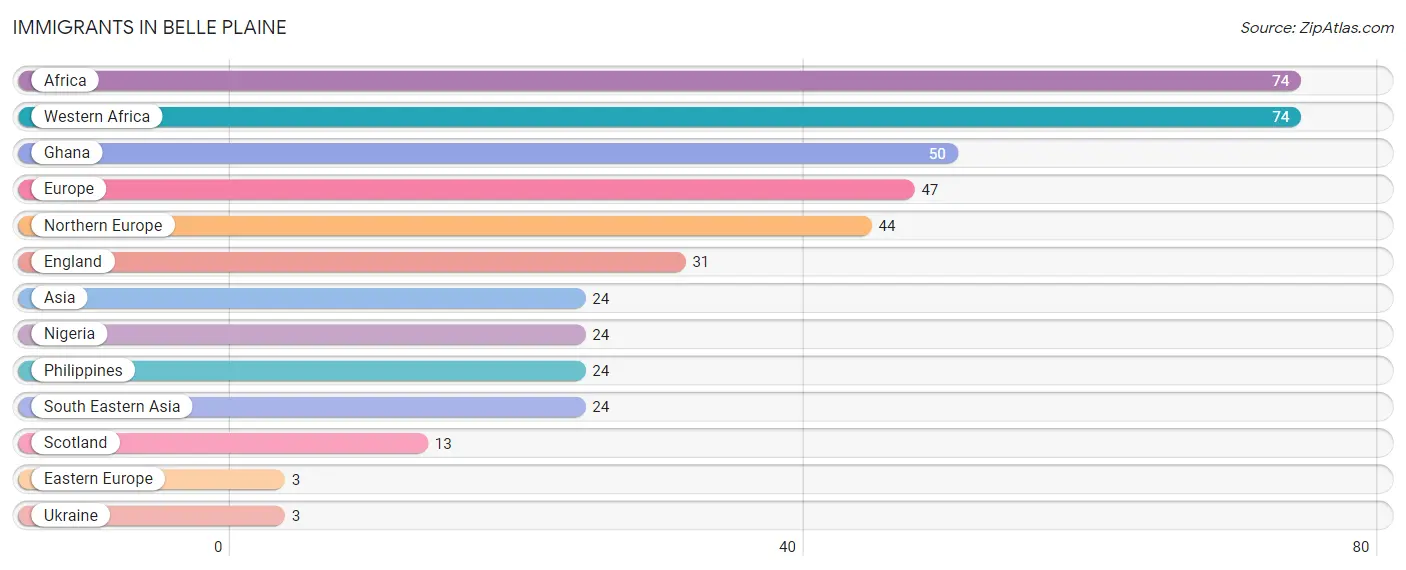
Immigrants in Belle Plaine
The most numerous immigrant groups reported in Belle Plaine came from Africa (74 | 1.0%), Western Africa (74 | 1.0%), Ghana (50 | 0.7%), Europe (47 | 0.6%), and Northern Europe (44 | 0.6%), together accounting for 3.9% of all Belle Plaine residents.
| Immigration Origin | # Population | % Population |
| Africa | 74 | 1.0% |
| Asia | 24 | 0.3% |
| Eastern Europe | 3 | 0.0% |
| England | 31 | 0.4% |
| Europe | 47 | 0.6% |
| Ghana | 50 | 0.7% |
| Nigeria | 24 | 0.3% |
| Northern Europe | 44 | 0.6% |
| Philippines | 24 | 0.3% |
| Scotland | 13 | 0.2% |
| South Eastern Asia | 24 | 0.3% |
| Ukraine | 3 | 0.0% |
| Western Africa | 74 | 1.0% | View All 13 Rows |
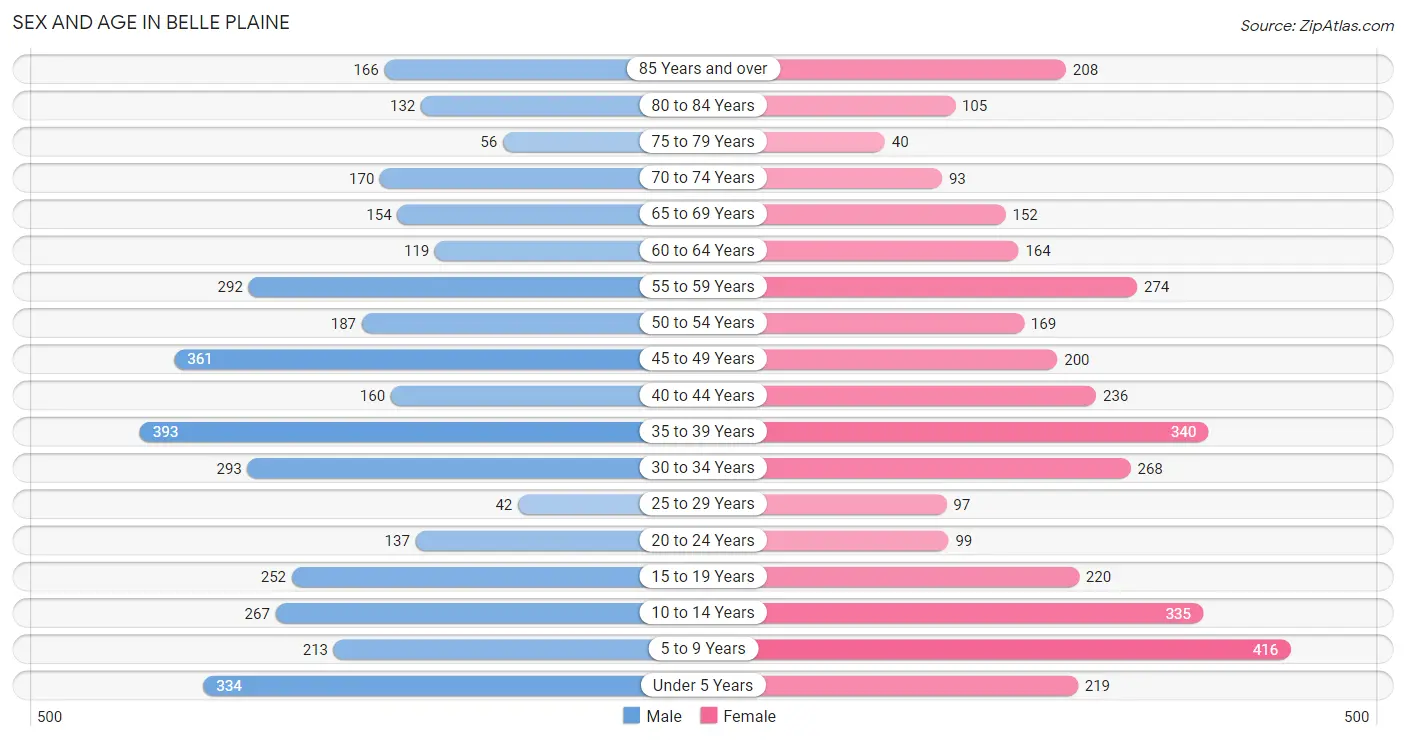
Sex and Age in Belle Plaine
Sex and Age in Belle Plaine
The most populous age groups in Belle Plaine are 35 to 39 Years (393 | 10.5%) for men and 5 to 9 Years (416 | 11.4%) for women.
| Age Bracket | Male | Female |
| Under 5 Years | 334 (9.0%) | 219 (6.0%) |
| 5 to 9 Years | 213 (5.7%) | 416 (11.4%) |
| 10 to 14 Years | 267 (7.2%) | 335 (9.2%) |
| 15 to 19 Years | 252 (6.8%) | 220 (6.0%) |
| 20 to 24 Years | 137 (3.7%) | 99 (2.7%) |
| 25 to 29 Years | 42 (1.1%) | 97 (2.7%) |
| 30 to 34 Years | 293 (7.9%) | 268 (7.4%) |
| 35 to 39 Years | 393 (10.5%) | 340 (9.3%) |
| 40 to 44 Years | 160 (4.3%) | 236 (6.5%) |
| 45 to 49 Years | 361 (9.7%) | 200 (5.5%) |
| 50 to 54 Years | 187 (5.0%) | 169 (4.6%) |
| 55 to 59 Years | 292 (7.8%) | 274 (7.5%) |
| 60 to 64 Years | 119 (3.2%) | 164 (4.5%) |
| 65 to 69 Years | 154 (4.1%) | 152 (4.2%) |
| 70 to 74 Years | 170 (4.6%) | 93 (2.6%) |
| 75 to 79 Years | 56 (1.5%) | 40 (1.1%) |
| 80 to 84 Years | 132 (3.5%) | 105 (2.9%) |
| 85 Years and over | 166 (4.4%) | 208 (5.7%) |
| Total | 3,728 (100.0%) | 3,635 (100.0%) |
Families and Households in Belle Plaine
Median Family Size in Belle Plaine
The median family size in Belle Plaine is 3.00 persons per family, with single male/father families (163 | 8.3%) accounting for the largest median family size of 3.03 persons per family. On the other hand, single female/mother families (287 | 14.6%) represent the smallest median family size with 2.92 persons per family.
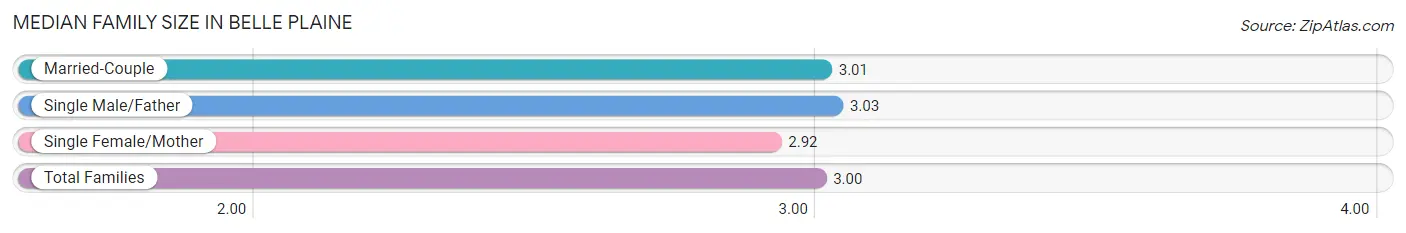
| Family Type | # Families | Family Size |
| Married-Couple | 1,511 (77.0%) | 3.01 |
| Single Male/Father | 163 (8.3%) | 3.03 |
| Single Female/Mother | 287 (14.6%) | 2.92 |
| Total Families | 1,961 (100.0%) | 3.00 |
Median Household Size in Belle Plaine
The median household size in Belle Plaine is 2.61 persons per household, with single male/father households (163 | 6.1%) accounting for the largest median household size of 3.45 persons per household. non-family households (697 | 26.2%) represent the smallest median household size with 1.38 persons per household.
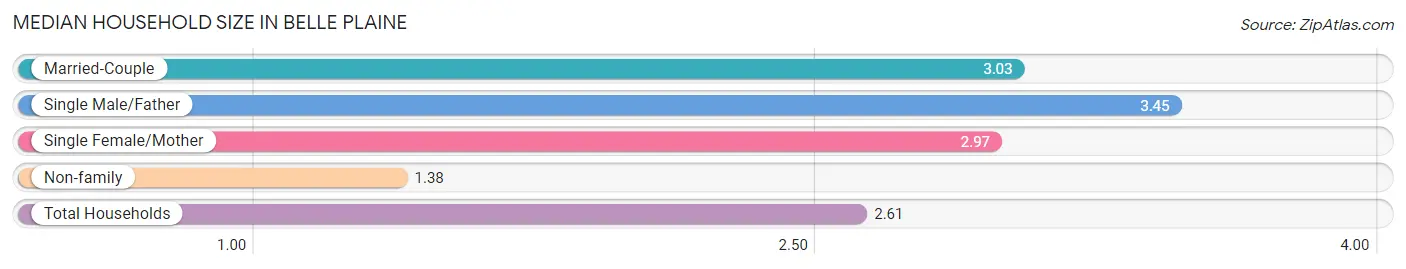
| Household Type | # Households | Household Size |
| Married-Couple | 1,511 (56.9%) | 3.03 |
| Single Male/Father | 163 (6.1%) | 3.45 |
| Single Female/Mother | 287 (10.8%) | 2.97 |
| Non-family | 697 (26.2%) | 1.38 |
| Total Households | 2,658 (100.0%) | 2.61 |
Household Size by Marriage Status in Belle Plaine
Out of a total of 2,658 households in Belle Plaine, 1,961 (73.8%) are family households, while 697 (26.2%) are nonfamily households. The most numerous type of family households are 2-person households, comprising 766, and the most common type of nonfamily households are 1-person households, comprising 514.
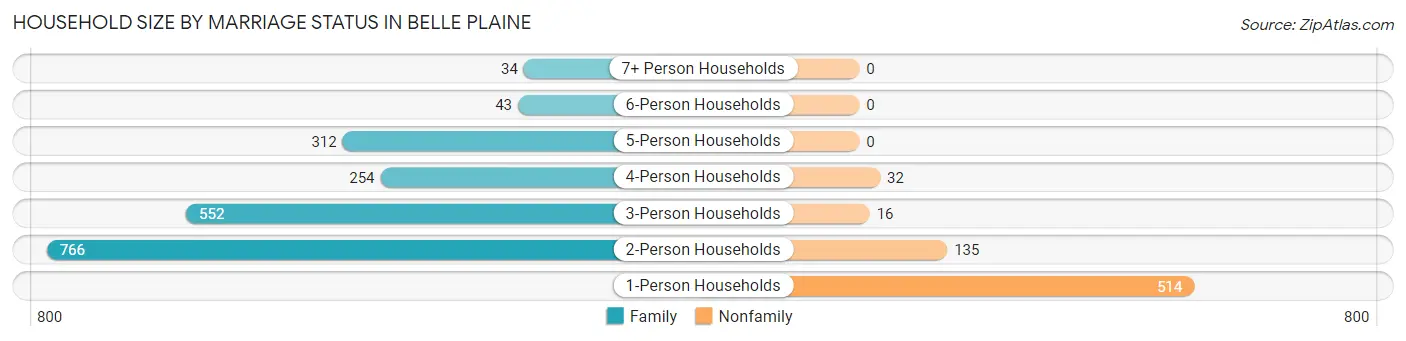
| Household Size | Family Households | Nonfamily Households |
| 1-Person Households | - | 514 (19.3%) |
| 2-Person Households | 766 (28.8%) | 135 (5.1%) |
| 3-Person Households | 552 (20.8%) | 16 (0.6%) |
| 4-Person Households | 254 (9.6%) | 32 (1.2%) |
| 5-Person Households | 312 (11.7%) | 0 (0.0%) |
| 6-Person Households | 43 (1.6%) | 0 (0.0%) |
| 7+ Person Households | 34 (1.3%) | 0 (0.0%) |
| Total | 1,961 (73.8%) | 697 (26.2%) |
Female Fertility in Belle Plaine
Fertility by Age in Belle Plaine
Average fertility rate in Belle Plaine is 54.0 births per 1,000 women. Women in the age bracket of 20 to 34 years have the highest fertility rate with 183.0 births per 1,000 women. Women in the age bracket of 20 to 34 years acount for 100.0% of all women with births.
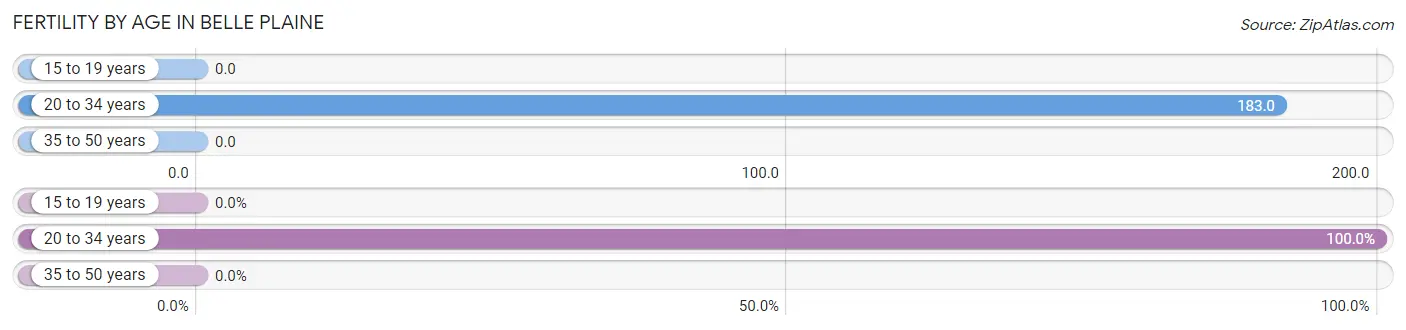
| Age Bracket | Women with Births | Births / 1,000 Women |
| 15 to 19 years | 0 (0.0%) | 0.0 |
| 20 to 34 years | 85 (100.0%) | 183.0 |
| 35 to 50 years | 0 (0.0%) | 0.0 |
| Total | 85 (100.0%) | 54.0 |
Fertility by Age by Marriage Status in Belle Plaine
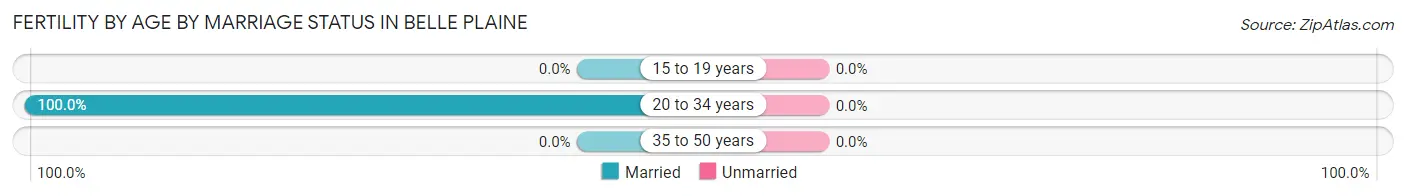
| Age Bracket | Married | Unmarried |
| 15 to 19 years | 0 (0.0%) | 0 (0.0%) |
| 20 to 34 years | 85 (100.0%) | 0 (0.0%) |
| 35 to 50 years | 0 (0.0%) | 0 (0.0%) |
| Total | 85 (100.0%) | 0 (0.0%) |
Fertility by Education in Belle Plaine
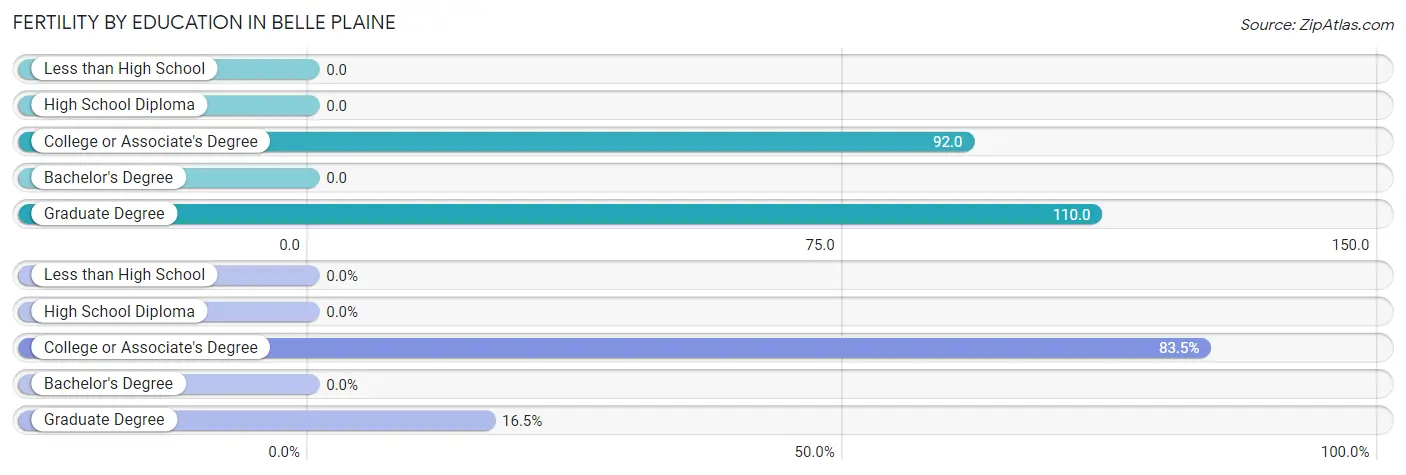
| Educational Attainment | Women with Births | Births / 1,000 Women |
| Less than High School | 0 (0.0%) | 0.0 |
| High School Diploma | 0 (0.0%) | 0.0 |
| College or Associate's Degree | 71 (83.5%) | 92.0 |
| Bachelor's Degree | 0 (0.0%) | 0.0 |
| Graduate Degree | 14 (16.5%) | 110.0 |
| Total | 85 (100.0%) | 54.0 |
Fertility by Education by Marriage Status in Belle Plaine
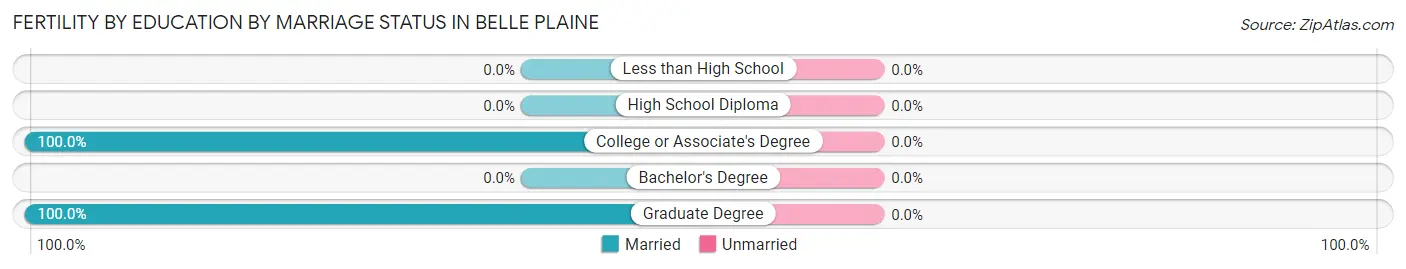
| Educational Attainment | Married | Unmarried |
| Less than High School | 0 (0.0%) | 0 (0.0%) |
| High School Diploma | 0 (0.0%) | 0 (0.0%) |
| College or Associate's Degree | 71 (100.0%) | 0 (0.0%) |
| Bachelor's Degree | 0 (0.0%) | 0 (0.0%) |
| Graduate Degree | 14 (100.0%) | 0 (0.0%) |
| Total | 85 (100.0%) | 0 (0.0%) |
Employment Characteristics in Belle Plaine
Employment by Class of Employer in Belle Plaine
Among the 3,927 employed individuals in Belle Plaine, private company employees (2,677 | 68.2%), not-for-profit organizations (540 | 13.8%), and local government employees (242 | 6.2%) make up the most common classes of employment.
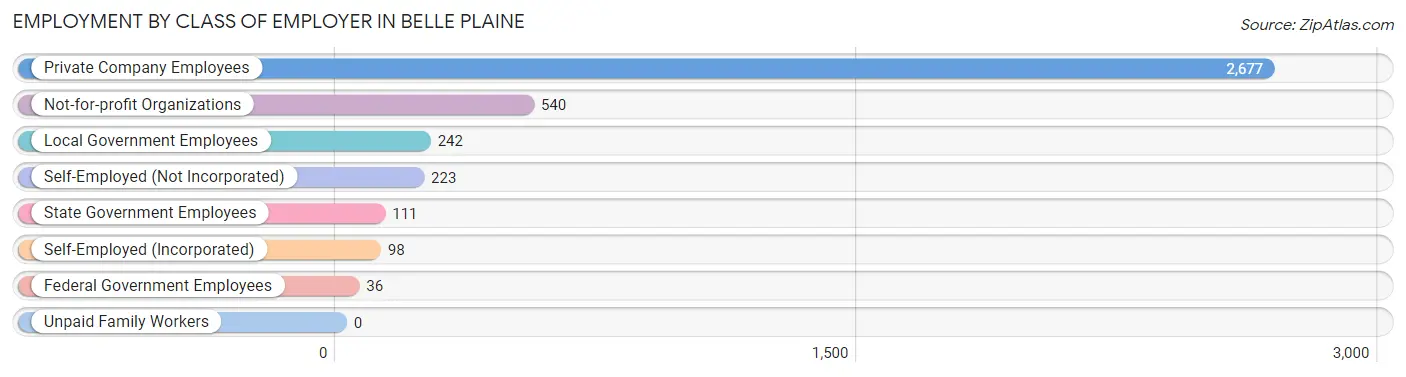
| Employer Class | # Employees | % Employees |
| Private Company Employees | 2,677 | 68.2% |
| Self-Employed (Incorporated) | 98 | 2.5% |
| Self-Employed (Not Incorporated) | 223 | 5.7% |
| Not-for-profit Organizations | 540 | 13.8% |
| Local Government Employees | 242 | 6.2% |
| State Government Employees | 111 | 2.8% |
| Federal Government Employees | 36 | 0.9% |
| Unpaid Family Workers | 0 | 0.0% |
| Total | 3,927 | 100.0% |
Employment Status by Age in Belle Plaine
According to the labor force statistics for Belle Plaine, out of the total population over 16 years of age (5,467), 73.1% or 3,996 individuals are in the labor force, with 0.7% or 28 of them unemployed. The age group with the highest labor force participation rate is 45 to 54 years, with 98.8% or 906 individuals in the labor force. Within the labor force, the 16 to 19 years age range has the highest percentage of unemployed individuals, with 10.0% or 18 of them being unemployed.
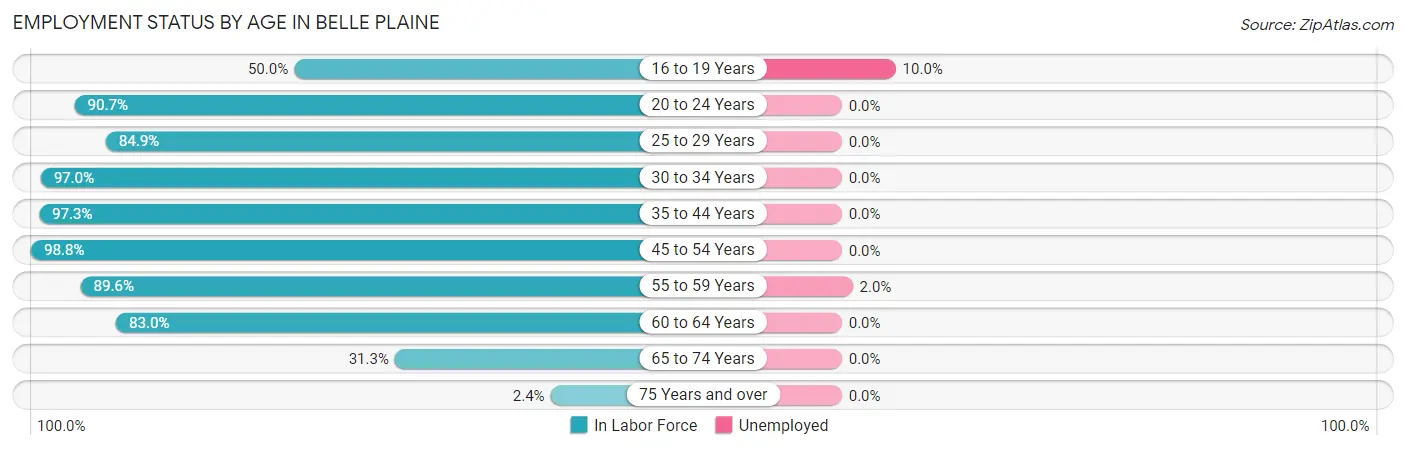
| Age Bracket | In Labor Force | Unemployed |
| 16 to 19 Years | 180 (50.0%) | 18 (10.0%) |
| 20 to 24 Years | 214 (90.7%) | 0 (0.0%) |
| 25 to 29 Years | 118 (84.9%) | 0 (0.0%) |
| 30 to 34 Years | 544 (97.0%) | 0 (0.0%) |
| 35 to 44 Years | 1,099 (97.3%) | 0 (0.0%) |
| 45 to 54 Years | 906 (98.8%) | 0 (0.0%) |
| 55 to 59 Years | 507 (89.6%) | 10 (2.0%) |
| 60 to 64 Years | 235 (83.0%) | 0 (0.0%) |
| 65 to 74 Years | 178 (31.3%) | 0 (0.0%) |
| 75 Years and over | 17 (2.4%) | 0 (0.0%) |
| Total | 3,996 (73.1%) | 28 (0.7%) |
Employment Status by Educational Attainment in Belle Plaine
According to labor force statistics for Belle Plaine, 94.8% of individuals (3,408) out of the total population between 25 and 64 years of age (3,595) are in the labor force, with 0.3% or 10 of them being unemployed. The group with the highest labor force participation rate are those with the educational attainment of college / associate degree, with 98.0% or 1,468 individuals in the labor force. Within the labor force, individuals with high school diploma education have the highest percentage of unemployment, with 1.4% or 10 of them being unemployed.
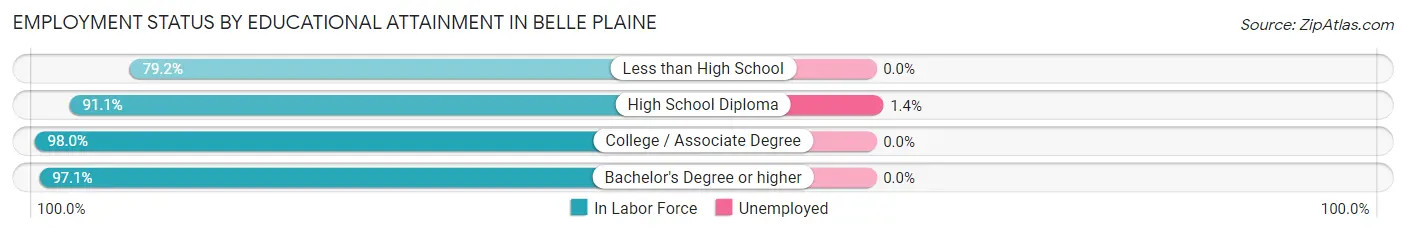
| Educational Attainment | In Labor Force | Unemployed |
| Less than High School | 210 (79.2%) | 0 (0.0%) |
| High School Diploma | 728 (91.1%) | 11 (1.4%) |
| College / Associate Degree | 1,468 (98.0%) | 0 (0.0%) |
| Bachelor's Degree or higher | 1,003 (97.1%) | 0 (0.0%) |
| Total | 3,408 (94.8%) | 11 (0.3%) |
Employment Occupations by Sex in Belle Plaine
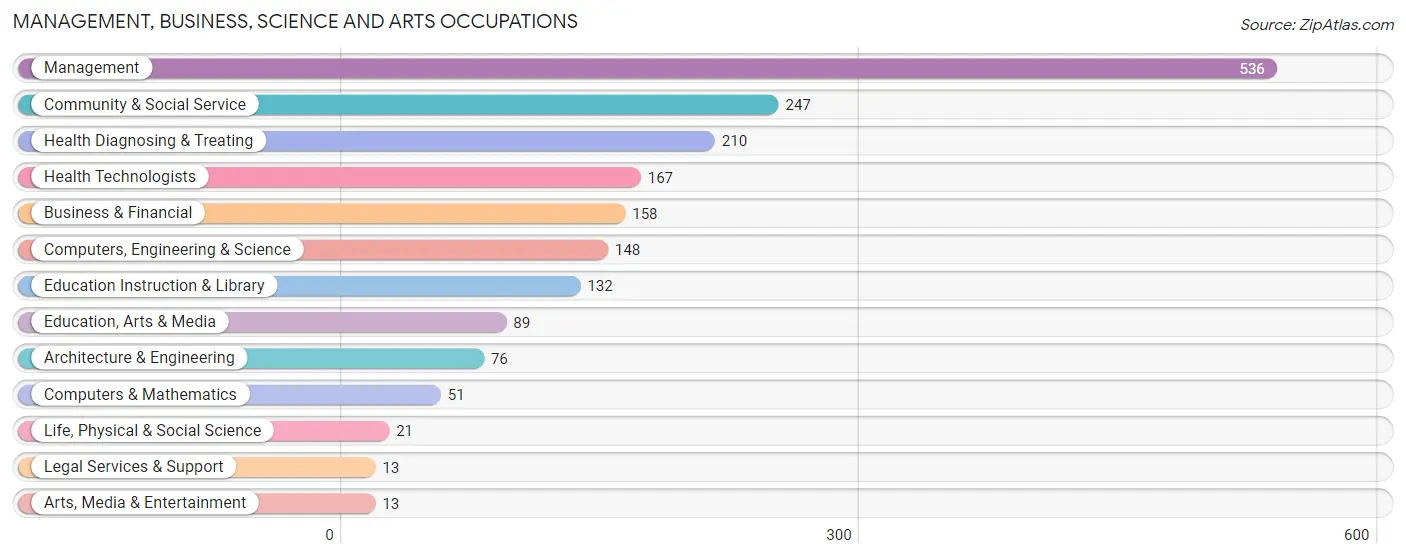
Management, Business, Science and Arts Occupations
The most common Management, Business, Science and Arts occupations in Belle Plaine are Management (536 | 13.5%), Community & Social Service (247 | 6.2%), Health Diagnosing & Treating (210 | 5.3%), Health Technologists (167 | 4.2%), and Business & Financial (158 | 4.0%).
Management, Business, Science and Arts Occupations by Sex
Within the Management, Business, Science and Arts occupations in Belle Plaine, the most male-oriented occupations are Architecture & Engineering (100.0%), Arts, Media & Entertainment (100.0%), and Computers & Mathematics (78.4%), while the most female-oriented occupations are Life, Physical & Social Science (100.0%), Legal Services & Support (100.0%), and Education, Arts & Media (89.9%).
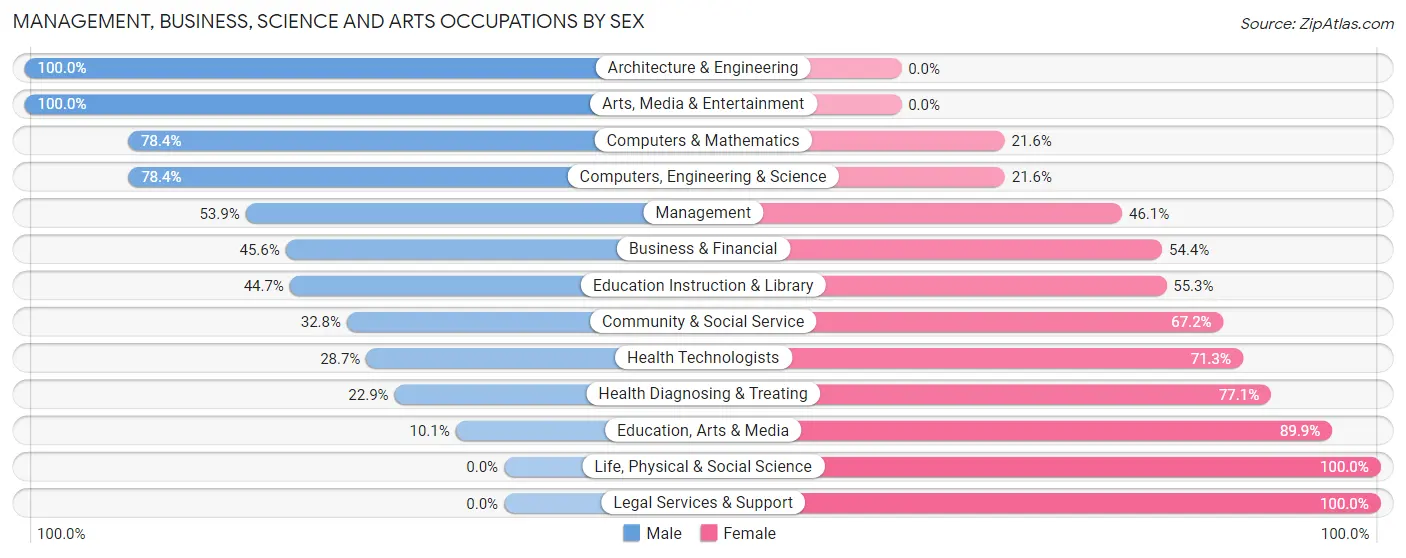
| Occupation | Male | Female |
| Management | 289 (53.9%) | 247 (46.1%) |
| Business & Financial | 72 (45.6%) | 86 (54.4%) |
| Computers, Engineering & Science | 116 (78.4%) | 32 (21.6%) |
| Computers & Mathematics | 40 (78.4%) | 11 (21.6%) |
| Architecture & Engineering | 76 (100.0%) | 0 (0.0%) |
| Life, Physical & Social Science | 0 (0.0%) | 21 (100.0%) |
| Community & Social Service | 81 (32.8%) | 166 (67.2%) |
| Education, Arts & Media | 9 (10.1%) | 80 (89.9%) |
| Legal Services & Support | 0 (0.0%) | 13 (100.0%) |
| Education Instruction & Library | 59 (44.7%) | 73 (55.3%) |
| Arts, Media & Entertainment | 13 (100.0%) | 0 (0.0%) |
| Health Diagnosing & Treating | 48 (22.9%) | 162 (77.1%) |
| Health Technologists | 48 (28.7%) | 119 (71.3%) |
| Total (Category) | 606 (46.7%) | 693 (53.3%) |
| Total (Overall) | 2,042 (51.4%) | 1,928 (48.6%) |
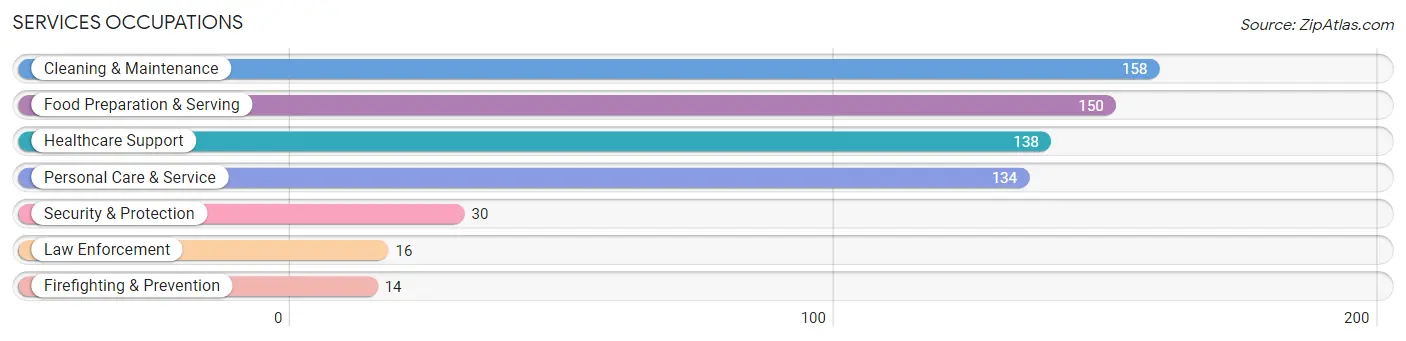
Services Occupations
The most common Services occupations in Belle Plaine are Cleaning & Maintenance (158 | 4.0%), Food Preparation & Serving (150 | 3.8%), Healthcare Support (138 | 3.5%), Personal Care & Service (134 | 3.4%), and Security & Protection (30 | 0.8%).
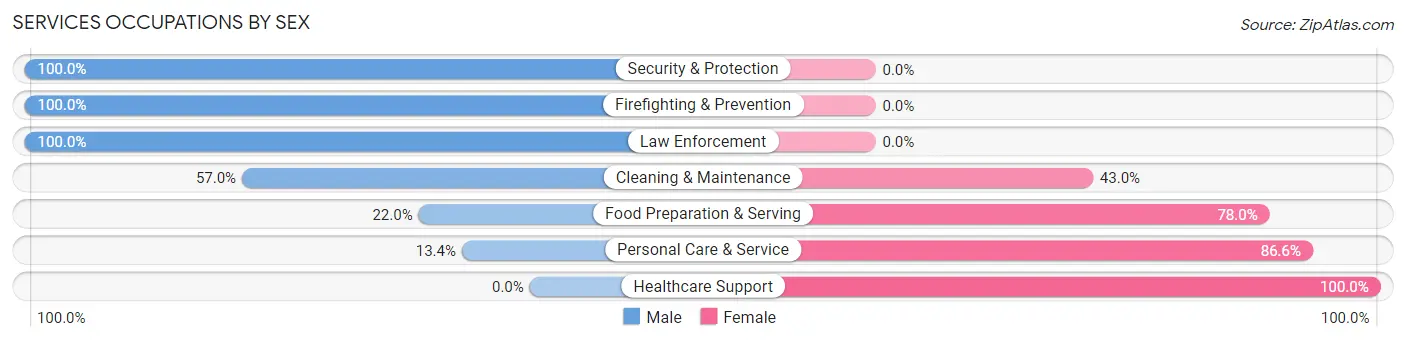
Services Occupations by Sex
Within the Services occupations in Belle Plaine, the most male-oriented occupations are Security & Protection (100.0%), Firefighting & Prevention (100.0%), and Law Enforcement (100.0%), while the most female-oriented occupations are Healthcare Support (100.0%), Personal Care & Service (86.6%), and Food Preparation & Serving (78.0%).
| Occupation | Male | Female |
| Healthcare Support | 0 (0.0%) | 138 (100.0%) |
| Security & Protection | 30 (100.0%) | 0 (0.0%) |
| Firefighting & Prevention | 14 (100.0%) | 0 (0.0%) |
| Law Enforcement | 16 (100.0%) | 0 (0.0%) |
| Food Preparation & Serving | 33 (22.0%) | 117 (78.0%) |
| Cleaning & Maintenance | 90 (57.0%) | 68 (43.0%) |
| Personal Care & Service | 18 (13.4%) | 116 (86.6%) |
| Total (Category) | 171 (28.0%) | 439 (72.0%) |
| Total (Overall) | 2,042 (51.4%) | 1,928 (48.6%) |
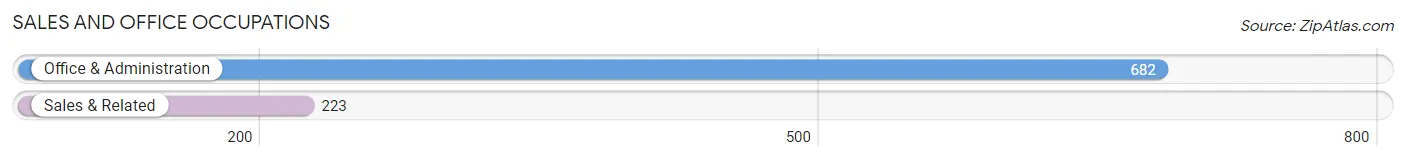
Sales and Office Occupations
The most common Sales and Office occupations in Belle Plaine are Office & Administration (682 | 17.2%), and Sales & Related (223 | 5.6%).
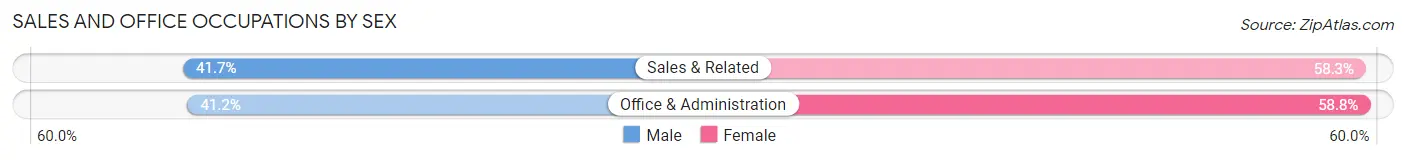
Sales and Office Occupations by Sex
| Occupation | Male | Female |
| Sales & Related | 93 (41.7%) | 130 (58.3%) |
| Office & Administration | 281 (41.2%) | 401 (58.8%) |
| Total (Category) | 374 (41.3%) | 531 (58.7%) |
| Total (Overall) | 2,042 (51.4%) | 1,928 (48.6%) |
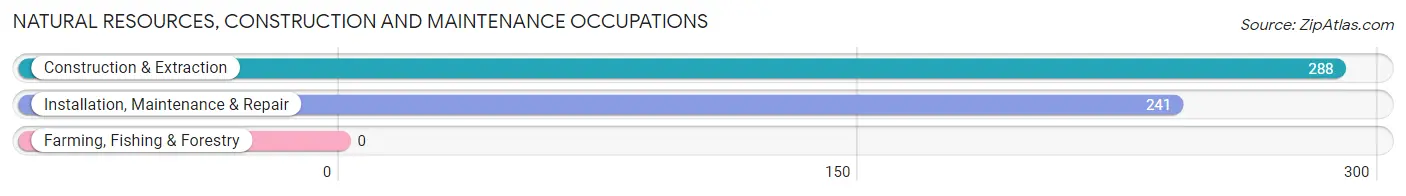
Natural Resources, Construction and Maintenance Occupations
The most common Natural Resources, Construction and Maintenance occupations in Belle Plaine are Construction & Extraction (288 | 7.2%), and Installation, Maintenance & Repair (241 | 6.1%).
Natural Resources, Construction and Maintenance Occupations by Sex
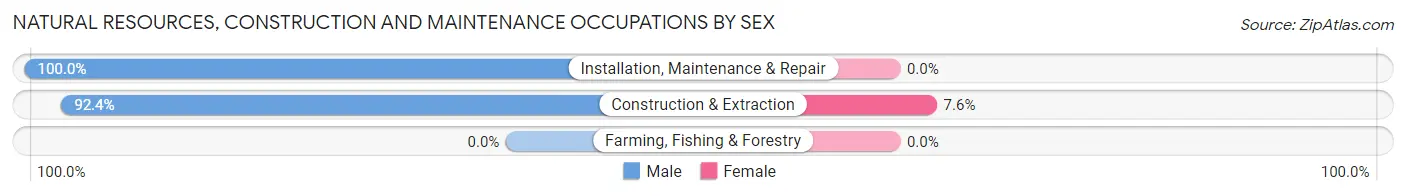
| Occupation | Male | Female |
| Farming, Fishing & Forestry | 0 (0.0%) | 0 (0.0%) |
| Construction & Extraction | 266 (92.4%) | 22 (7.6%) |
| Installation, Maintenance & Repair | 241 (100.0%) | 0 (0.0%) |
| Total (Category) | 507 (95.8%) | 22 (4.2%) |
| Total (Overall) | 2,042 (51.4%) | 1,928 (48.6%) |
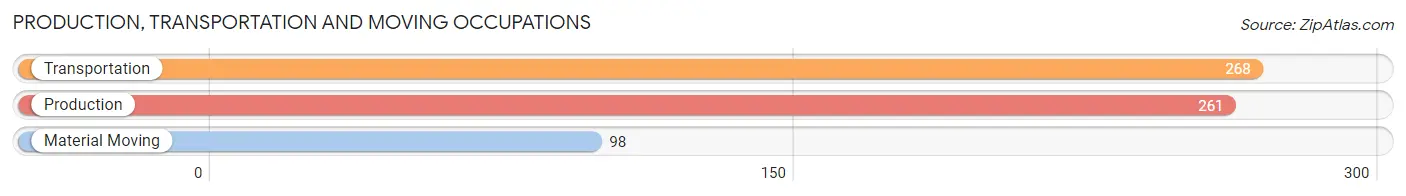
Production, Transportation and Moving Occupations
The most common Production, Transportation and Moving occupations in Belle Plaine are Transportation (268 | 6.8%), Production (261 | 6.6%), and Material Moving (98 | 2.5%).
Production, Transportation and Moving Occupations by Sex
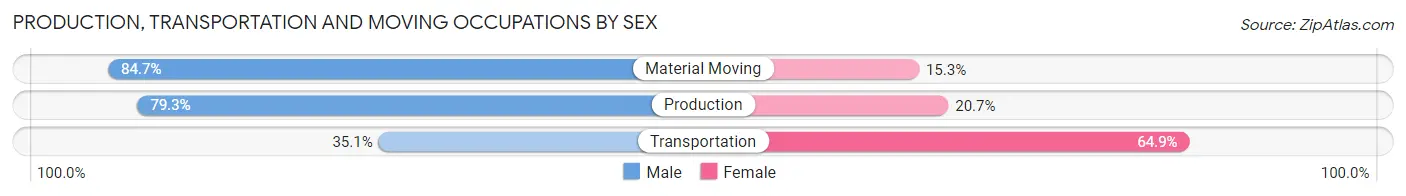
| Occupation | Male | Female |
| Production | 207 (79.3%) | 54 (20.7%) |
| Transportation | 94 (35.1%) | 174 (64.9%) |
| Material Moving | 83 (84.7%) | 15 (15.3%) |
| Total (Category) | 384 (61.2%) | 243 (38.8%) |
| Total (Overall) | 2,042 (51.4%) | 1,928 (48.6%) |
Employment Industries by Sex in Belle Plaine
Employment Industries in Belle Plaine
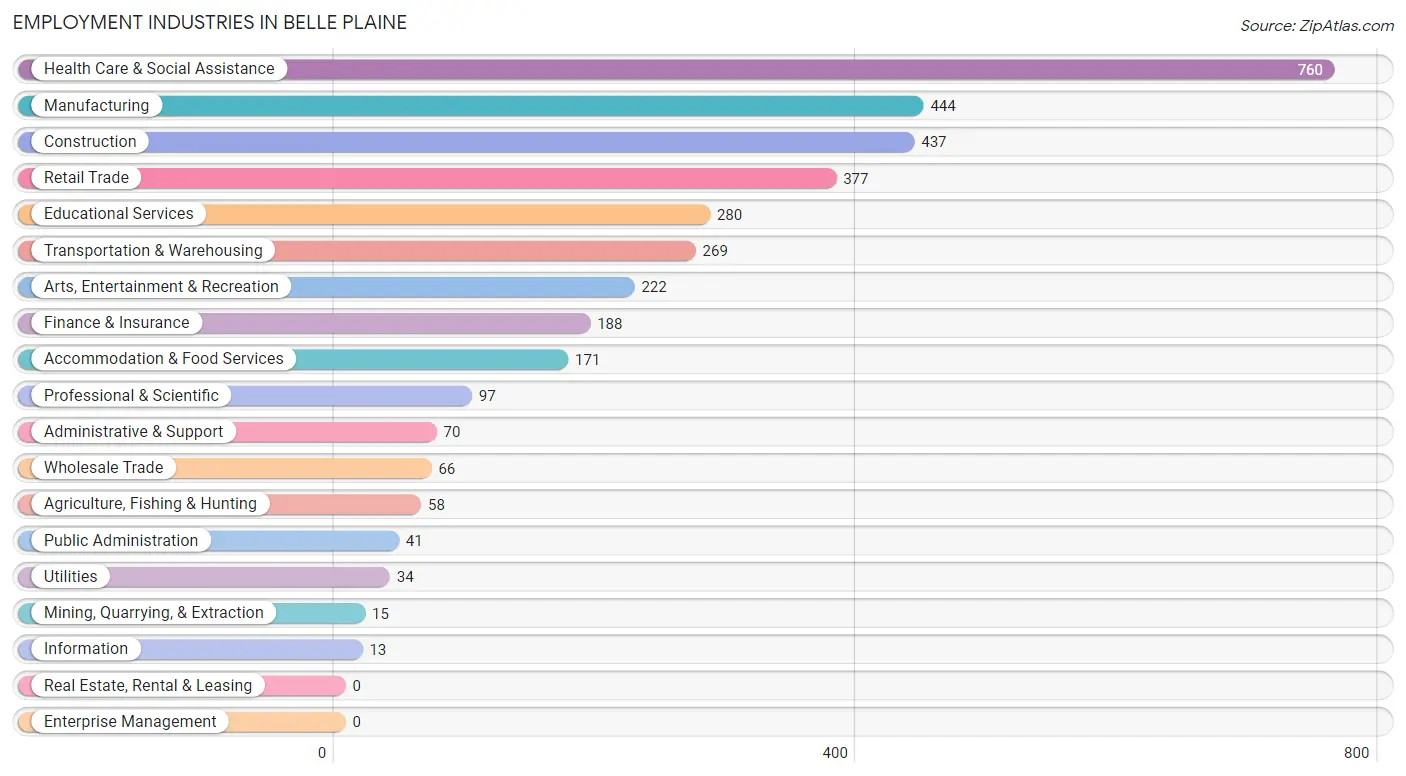
The major employment industries in Belle Plaine include Health Care & Social Assistance (760 | 19.1%), Manufacturing (444 | 11.2%), Construction (437 | 11.0%), Retail Trade (377 | 9.5%), and Educational Services (280 | 7.0%).
Employment Industries by Sex in Belle Plaine
The Belle Plaine industries that see more men than women are Mining, Quarrying, & Extraction (100.0%), Wholesale Trade (100.0%), and Utilities (100.0%), whereas the industries that tend to have a higher number of women are Information (100.0%), Health Care & Social Assistance (85.1%), and Accommodation & Food Services (80.7%).
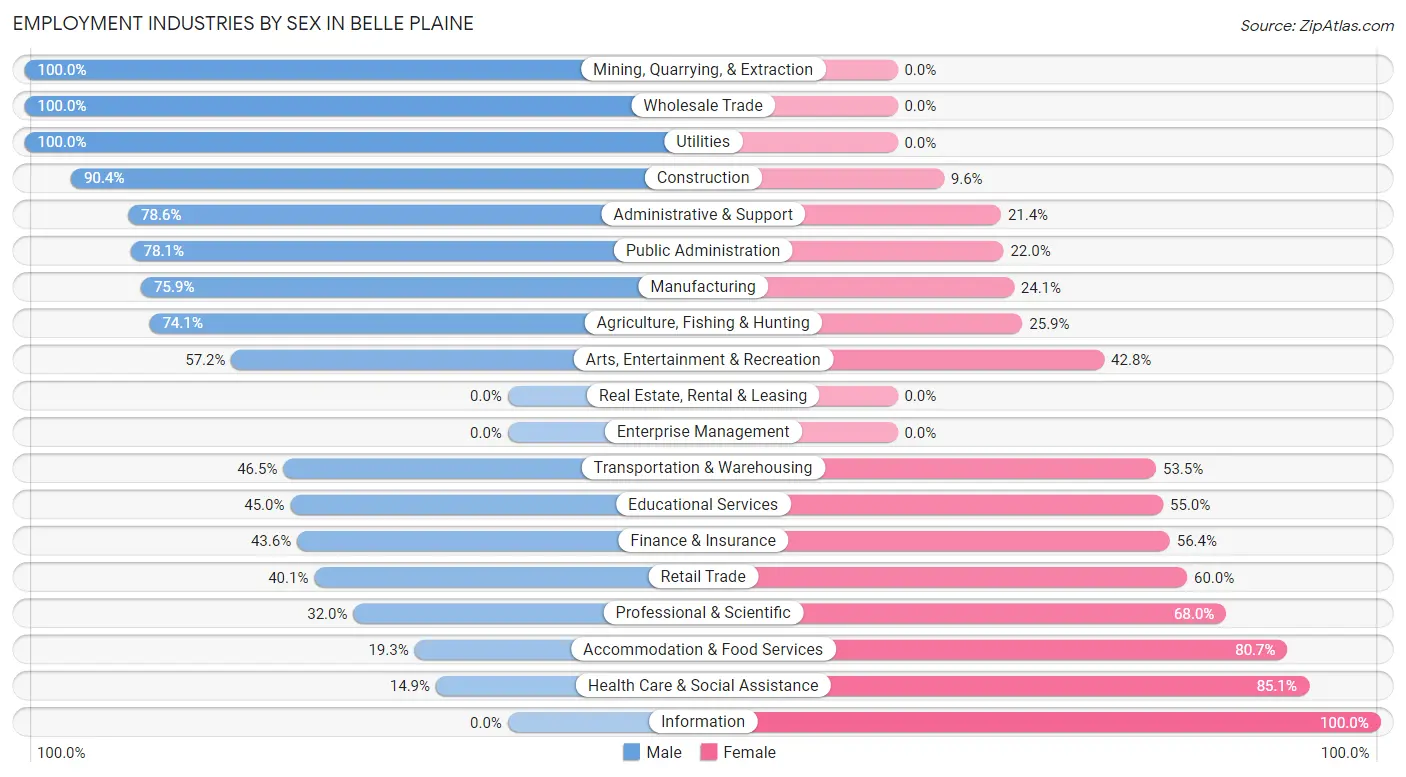
| Industry | Male | Female |
| Agriculture, Fishing & Hunting | 43 (74.1%) | 15 (25.9%) |
| Mining, Quarrying, & Extraction | 15 (100.0%) | 0 (0.0%) |
| Construction | 395 (90.4%) | 42 (9.6%) |
| Manufacturing | 337 (75.9%) | 107 (24.1%) |
| Wholesale Trade | 66 (100.0%) | 0 (0.0%) |
| Retail Trade | 151 (40.1%) | 226 (60.0%) |
| Transportation & Warehousing | 125 (46.5%) | 144 (53.5%) |
| Utilities | 34 (100.0%) | 0 (0.0%) |
| Information | 0 (0.0%) | 13 (100.0%) |
| Finance & Insurance | 82 (43.6%) | 106 (56.4%) |
| Real Estate, Rental & Leasing | 0 (0.0%) | 0 (0.0%) |
| Professional & Scientific | 31 (32.0%) | 66 (68.0%) |
| Enterprise Management | 0 (0.0%) | 0 (0.0%) |
| Administrative & Support | 55 (78.6%) | 15 (21.4%) |
| Educational Services | 126 (45.0%) | 154 (55.0%) |
| Health Care & Social Assistance | 113 (14.9%) | 647 (85.1%) |
| Arts, Entertainment & Recreation | 127 (57.2%) | 95 (42.8%) |
| Accommodation & Food Services | 33 (19.3%) | 138 (80.7%) |
| Public Administration | 32 (78.0%) | 9 (22.0%) |
| Total | 2,042 (51.4%) | 1,928 (48.6%) |
Education in Belle Plaine
School Enrollment in Belle Plaine
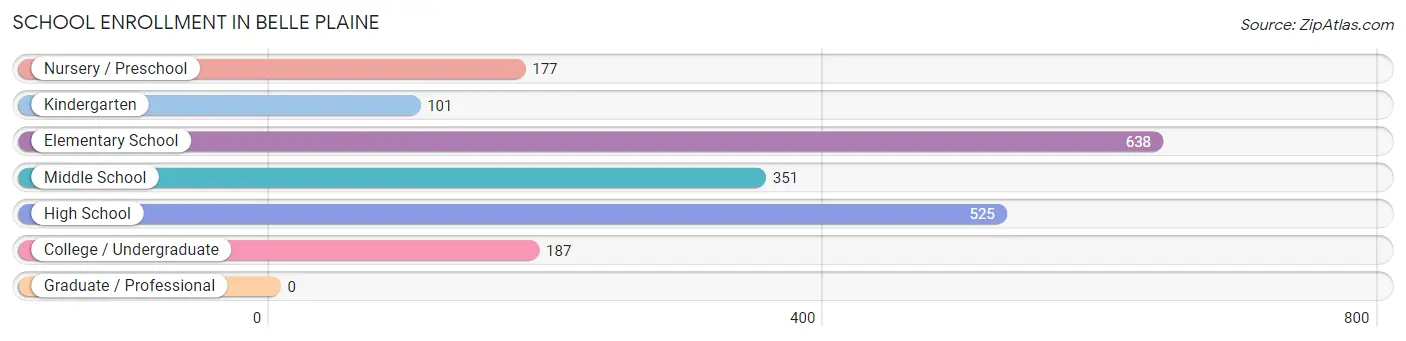
The most common levels of schooling among the 1,979 students in Belle Plaine are elementary school (638 | 32.2%), high school (525 | 26.5%), and middle school (351 | 17.7%).
| School Level | # Students | % Students |
| Nursery / Preschool | 177 | 8.9% |
| Kindergarten | 101 | 5.1% |
| Elementary School | 638 | 32.2% |
| Middle School | 351 | 17.7% |
| High School | 525 | 26.5% |
| College / Undergraduate | 187 | 9.5% |
| Graduate / Professional | 0 | 0.0% |
| Total | 1,979 | 100.0% |
School Enrollment by Age by Funding Source in Belle Plaine
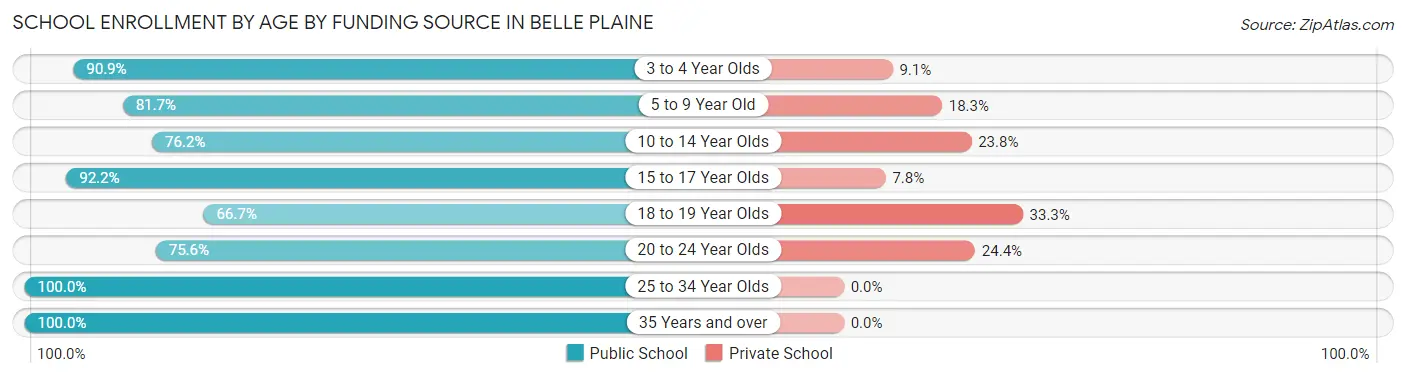
Out of a total of 1,979 students who are enrolled in schools in Belle Plaine, 372 (18.8%) attend a private institution, while the remaining 1,607 (81.2%) are enrolled in public schools. The age group of 18 to 19 year olds has the highest likelihood of being enrolled in private schools, with 62 (33.3% in the age bracket) enrolled. Conversely, the age group of 25 to 34 year olds has the lowest likelihood of being enrolled in a private school, with 37 (100.0% in the age bracket) attending a public institution.
| Age Bracket | Public School | Private School |
| 3 to 4 Year Olds | 150 (90.9%) | 15 (9.1%) |
| 5 to 9 Year Old | 514 (81.7%) | 115 (18.3%) |
| 10 to 14 Year Olds | 446 (76.2%) | 139 (23.8%) |
| 15 to 17 Year Olds | 237 (92.2%) | 20 (7.8%) |
| 18 to 19 Year Olds | 124 (66.7%) | 62 (33.3%) |
| 20 to 24 Year Olds | 68 (75.6%) | 22 (24.4%) |
| 25 to 34 Year Olds | 37 (100.0%) | 0 (0.0%) |
| 35 Years and over | 30 (100.0%) | 0 (0.0%) |
| Total | 1,607 (81.2%) | 372 (18.8%) |
Educational Attainment by Field of Study in Belle Plaine
Business (300 | 21.4%), education (262 | 18.7%), science & technology (167 | 11.9%), engineering (164 | 11.7%), and social sciences (106 | 7.6%) are the most common fields of study among 1,401 individuals in Belle Plaine who have obtained a bachelor's degree or higher.
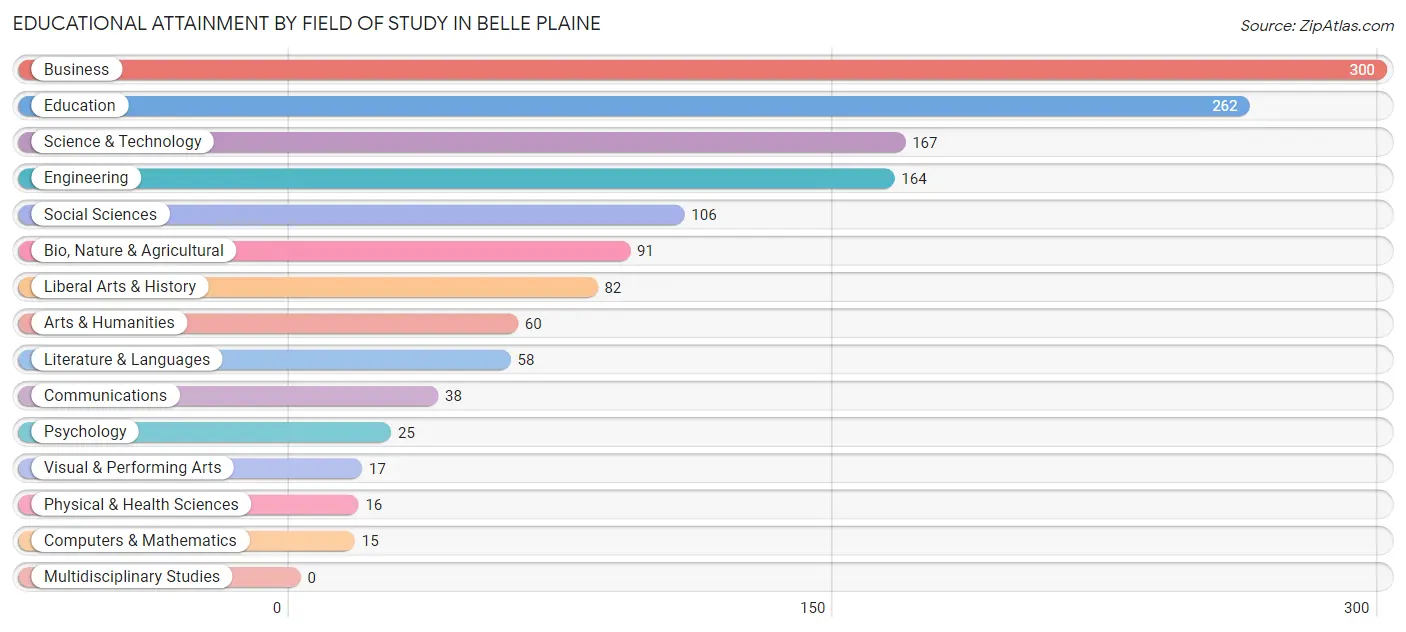
| Field of Study | # Graduates | % Graduates |
| Computers & Mathematics | 15 | 1.1% |
| Bio, Nature & Agricultural | 91 | 6.5% |
| Physical & Health Sciences | 16 | 1.1% |
| Psychology | 25 | 1.8% |
| Social Sciences | 106 | 7.6% |
| Engineering | 164 | 11.7% |
| Multidisciplinary Studies | 0 | 0.0% |
| Science & Technology | 167 | 11.9% |
| Business | 300 | 21.4% |
| Education | 262 | 18.7% |
| Literature & Languages | 58 | 4.1% |
| Liberal Arts & History | 82 | 5.9% |
| Visual & Performing Arts | 17 | 1.2% |
| Communications | 38 | 2.7% |
| Arts & Humanities | 60 | 4.3% |
| Total | 1,401 | 100.0% |
Transportation & Commute in Belle Plaine
Vehicle Availability by Sex in Belle Plaine
The most prevalent vehicle ownership categories in Belle Plaine are males with 2 vehicles (1,018, accounting for 50.5%) and females with 2 vehicles (826, making up 53.8%).
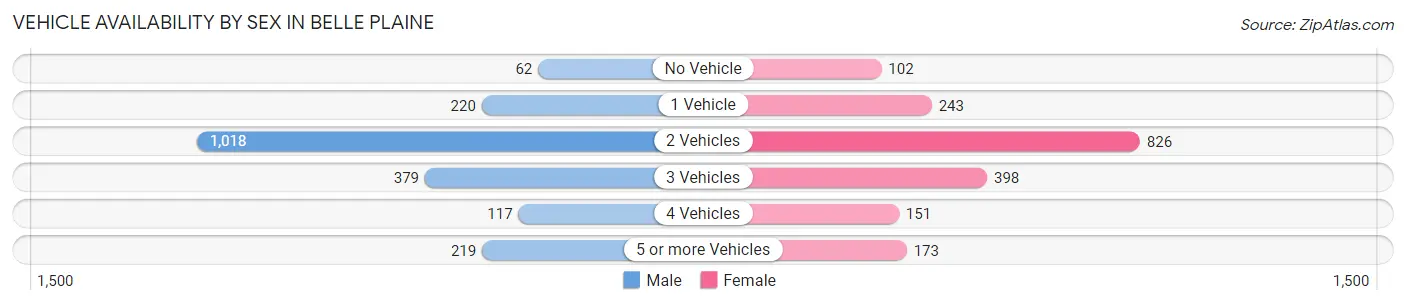
| Vehicles Available | Male | Female |
| No Vehicle | 62 (3.1%) | 102 (5.4%) |
| 1 Vehicle | 220 (10.9%) | 243 (12.8%) |
| 2 Vehicles | 1,018 (50.5%) | 826 (43.6%) |
| 3 Vehicles | 379 (18.8%) | 398 (21.0%) |
| 4 Vehicles | 117 (5.8%) | 151 (8.0%) |
| 5 or more Vehicles | 219 (10.9%) | 173 (9.1%) |
| Total | 2,015 (100.0%) | 1,893 (100.0%) |
Commute Time in Belle Plaine
The most frequently occuring commute durations in Belle Plaine are 5 to 9 minutes (846 commuters, 22.4%), 30 to 34 minutes (616 commuters, 16.3%), and 25 to 29 minutes (393 commuters, 10.4%).
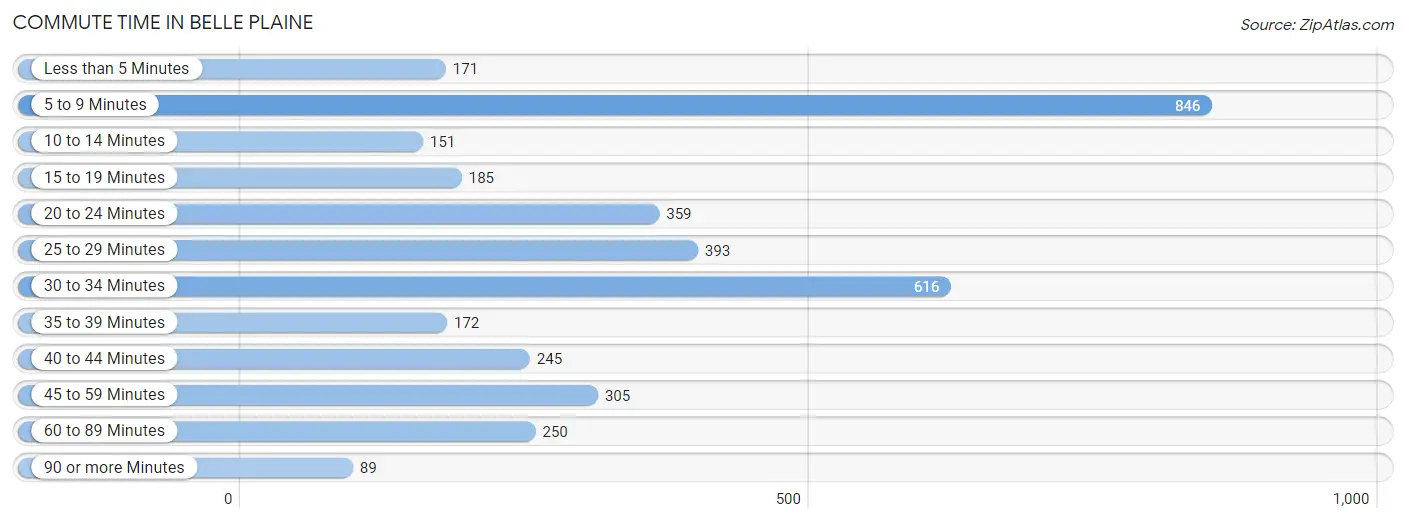
| Commute Time | # Commuters | % Commuters |
| Less than 5 Minutes | 171 | 4.5% |
| 5 to 9 Minutes | 846 | 22.4% |
| 10 to 14 Minutes | 151 | 4.0% |
| 15 to 19 Minutes | 185 | 4.9% |
| 20 to 24 Minutes | 359 | 9.5% |
| 25 to 29 Minutes | 393 | 10.4% |
| 30 to 34 Minutes | 616 | 16.3% |
| 35 to 39 Minutes | 172 | 4.5% |
| 40 to 44 Minutes | 245 | 6.5% |
| 45 to 59 Minutes | 305 | 8.1% |
| 60 to 89 Minutes | 250 | 6.6% |
| 90 or more Minutes | 89 | 2.4% |
Commute Time by Sex in Belle Plaine
The most common commute times in Belle Plaine are 30 to 34 minutes (341 commuters, 17.3%) for males and 5 to 9 minutes (602 commuters, 33.2%) for females.
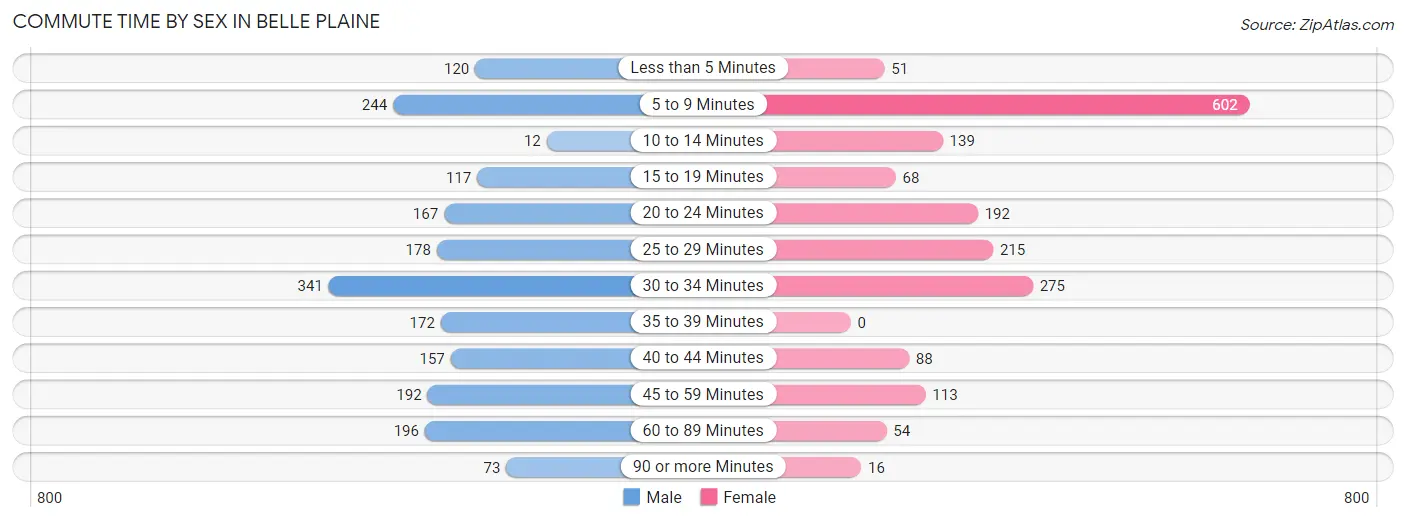
| Commute Time | Male | Female |
| Less than 5 Minutes | 120 (6.1%) | 51 (2.8%) |
| 5 to 9 Minutes | 244 (12.4%) | 602 (33.2%) |
| 10 to 14 Minutes | 12 (0.6%) | 139 (7.7%) |
| 15 to 19 Minutes | 117 (5.9%) | 68 (3.7%) |
| 20 to 24 Minutes | 167 (8.5%) | 192 (10.6%) |
| 25 to 29 Minutes | 178 (9.0%) | 215 (11.9%) |
| 30 to 34 Minutes | 341 (17.3%) | 275 (15.2%) |
| 35 to 39 Minutes | 172 (8.7%) | 0 (0.0%) |
| 40 to 44 Minutes | 157 (8.0%) | 88 (4.9%) |
| 45 to 59 Minutes | 192 (9.8%) | 113 (6.2%) |
| 60 to 89 Minutes | 196 (10.0%) | 54 (3.0%) |
| 90 or more Minutes | 73 (3.7%) | 16 (0.9%) |
Time of Departure to Work by Sex in Belle Plaine
The most frequent times of departure to work in Belle Plaine are 7:00 AM to 7:29 AM (470, 23.9%) for males and 7:00 AM to 7:29 AM (326, 18.0%) for females.
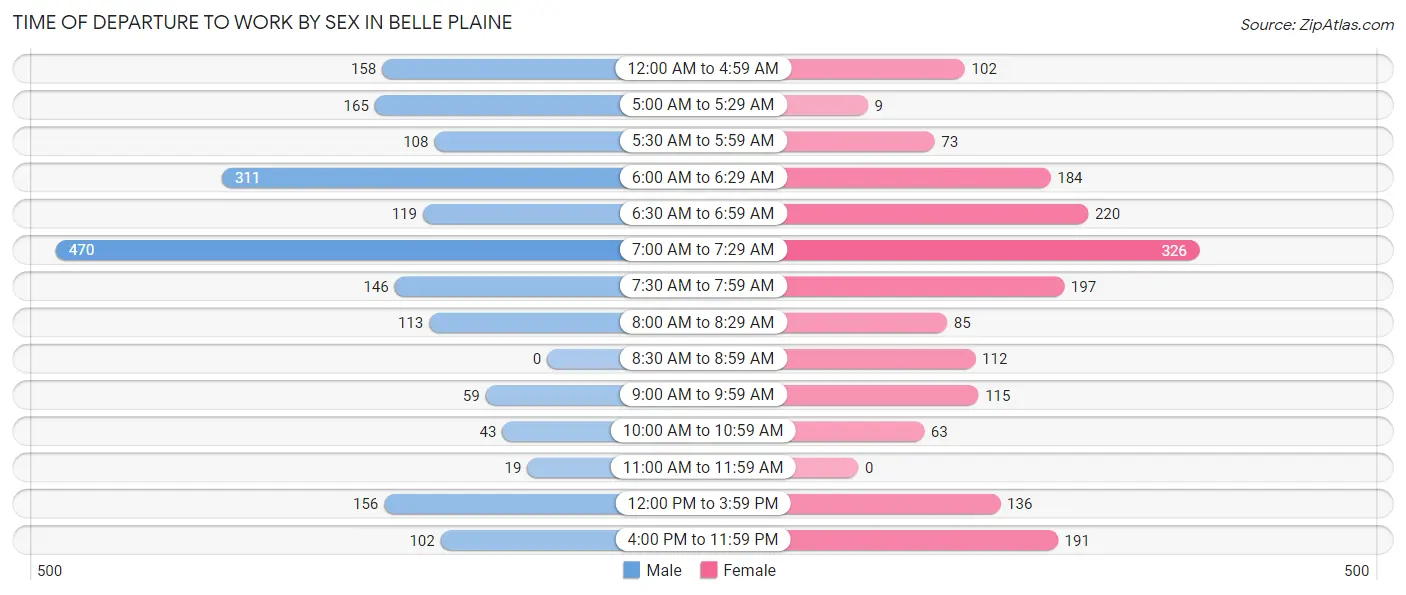
| Time of Departure | Male | Female |
| 12:00 AM to 4:59 AM | 158 (8.0%) | 102 (5.6%) |
| 5:00 AM to 5:29 AM | 165 (8.4%) | 9 (0.5%) |
| 5:30 AM to 5:59 AM | 108 (5.5%) | 73 (4.0%) |
| 6:00 AM to 6:29 AM | 311 (15.8%) | 184 (10.2%) |
| 6:30 AM to 6:59 AM | 119 (6.0%) | 220 (12.1%) |
| 7:00 AM to 7:29 AM | 470 (23.9%) | 326 (18.0%) |
| 7:30 AM to 7:59 AM | 146 (7.4%) | 197 (10.9%) |
| 8:00 AM to 8:29 AM | 113 (5.7%) | 85 (4.7%) |
| 8:30 AM to 8:59 AM | 0 (0.0%) | 112 (6.2%) |
| 9:00 AM to 9:59 AM | 59 (3.0%) | 115 (6.3%) |
| 10:00 AM to 10:59 AM | 43 (2.2%) | 63 (3.5%) |
| 11:00 AM to 11:59 AM | 19 (1.0%) | 0 (0.0%) |
| 12:00 PM to 3:59 PM | 156 (7.9%) | 136 (7.5%) |
| 4:00 PM to 11:59 PM | 102 (5.2%) | 191 (10.5%) |
| Total | 1,969 (100.0%) | 1,813 (100.0%) |
Housing Occupancy in Belle Plaine
Occupancy by Ownership in Belle Plaine
Of the total 2,658 dwellings in Belle Plaine, owner-occupied units account for 2,267 (85.3%), while renter-occupied units make up 391 (14.7%).
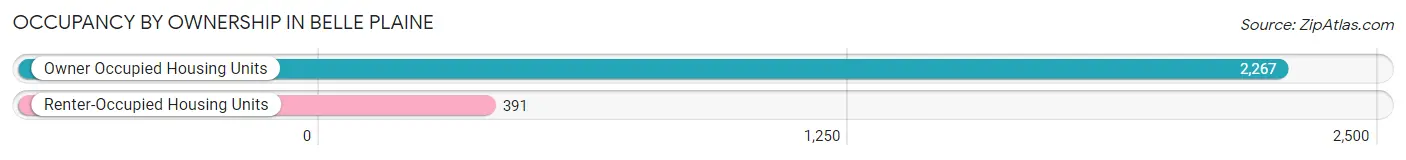
| Occupancy | # Housing Units | % Housing Units |
| Owner Occupied Housing Units | 2,267 | 85.3% |
| Renter-Occupied Housing Units | 391 | 14.7% |
| Total Occupied Housing Units | 2,658 | 100.0% |
Occupancy by Household Size in Belle Plaine
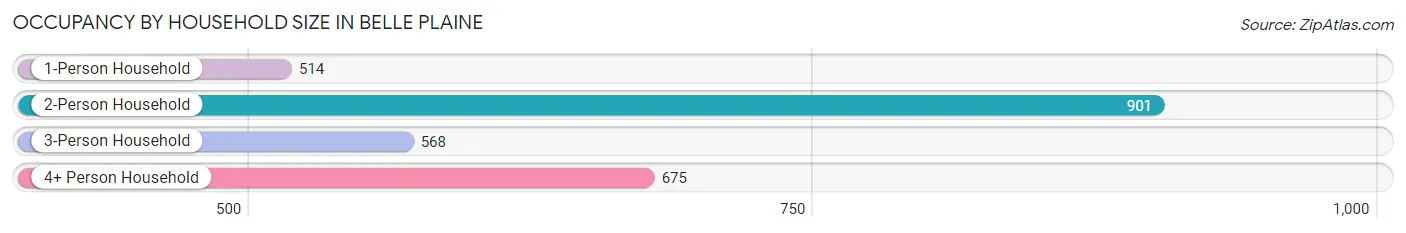
| Household Size | # Housing Units | % Housing Units |
| 1-Person Household | 514 | 19.3% |
| 2-Person Household | 901 | 33.9% |
| 3-Person Household | 568 | 21.4% |
| 4+ Person Household | 675 | 25.4% |
| Total Housing Units | 2,658 | 100.0% |
Occupancy by Ownership by Household Size in Belle Plaine
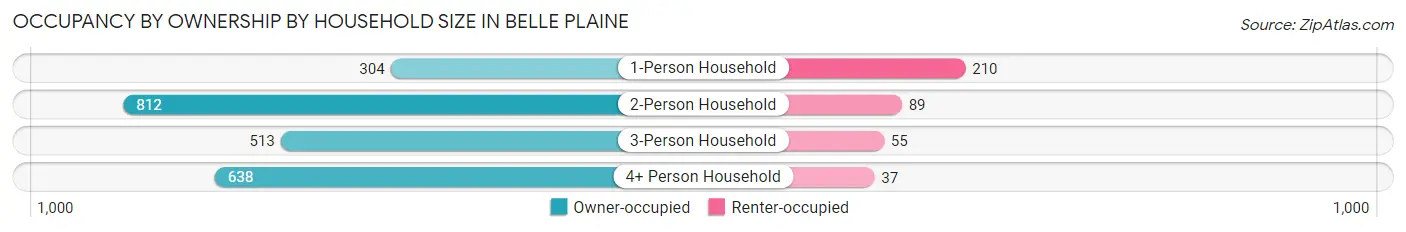
| Household Size | Owner-occupied | Renter-occupied |
| 1-Person Household | 304 (59.1%) | 210 (40.9%) |
| 2-Person Household | 812 (90.1%) | 89 (9.9%) |
| 3-Person Household | 513 (90.3%) | 55 (9.7%) |
| 4+ Person Household | 638 (94.5%) | 37 (5.5%) |
| Total Housing Units | 2,267 (85.3%) | 391 (14.7%) |
Occupancy by Educational Attainment in Belle Plaine
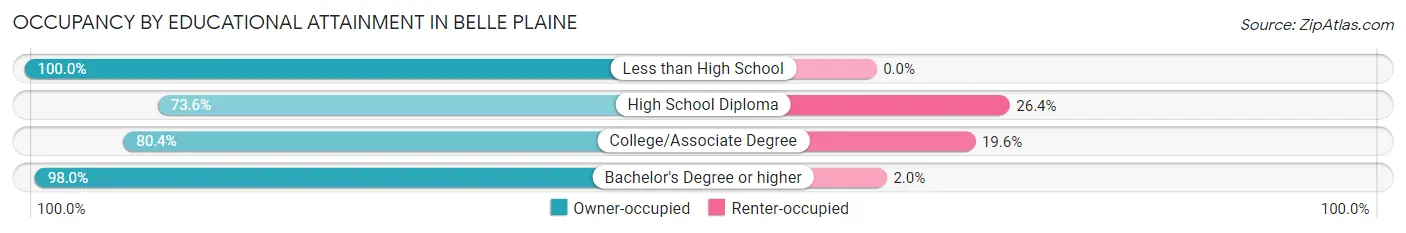
| Household Size | Owner-occupied | Renter-occupied |
| Less than High School | 269 (100.0%) | 0 (0.0%) |
| High School Diploma | 471 (73.6%) | 169 (26.4%) |
| College/Associate Degree | 854 (80.4%) | 208 (19.6%) |
| Bachelor's Degree or higher | 673 (98.0%) | 14 (2.0%) |
Occupancy by Age of Householder in Belle Plaine
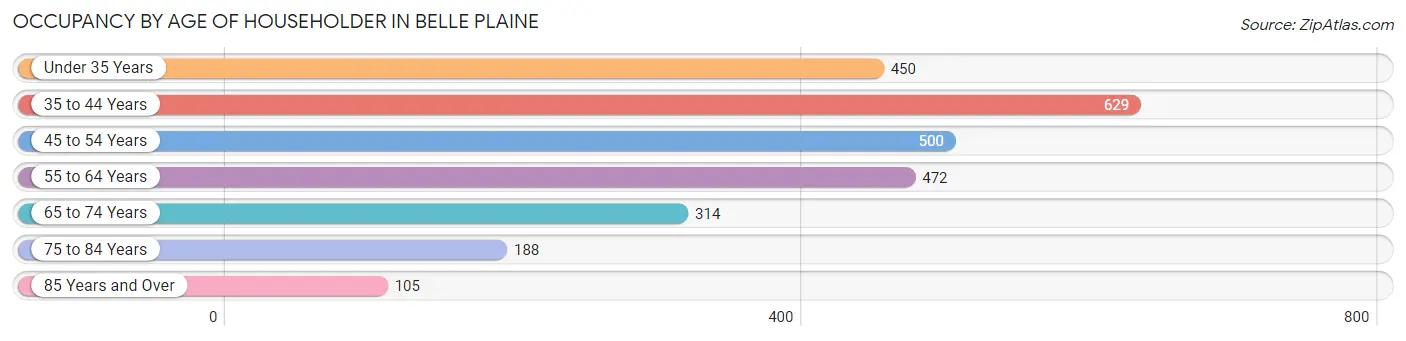
| Age Bracket | # Households | % Households |
| Under 35 Years | 450 | 16.9% |
| 35 to 44 Years | 629 | 23.7% |
| 45 to 54 Years | 500 | 18.8% |
| 55 to 64 Years | 472 | 17.8% |
| 65 to 74 Years | 314 | 11.8% |
| 75 to 84 Years | 188 | 7.1% |
| 85 Years and Over | 105 | 4.0% |
| Total | 2,658 | 100.0% |
Housing Finances in Belle Plaine
Median Income by Occupancy in Belle Plaine
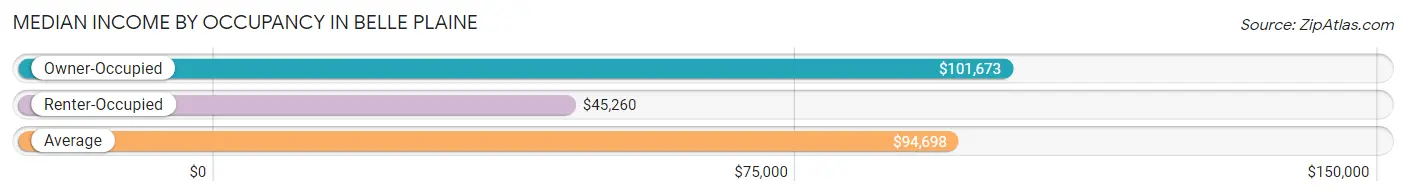
| Occupancy Type | # Households | Median Income |
| Owner-Occupied | 2,267 (85.3%) | $101,673 |
| Renter-Occupied | 391 (14.7%) | $45,260 |
| Average | 2,658 (100.0%) | $94,698 |
Occupancy by Householder Income Bracket in Belle Plaine
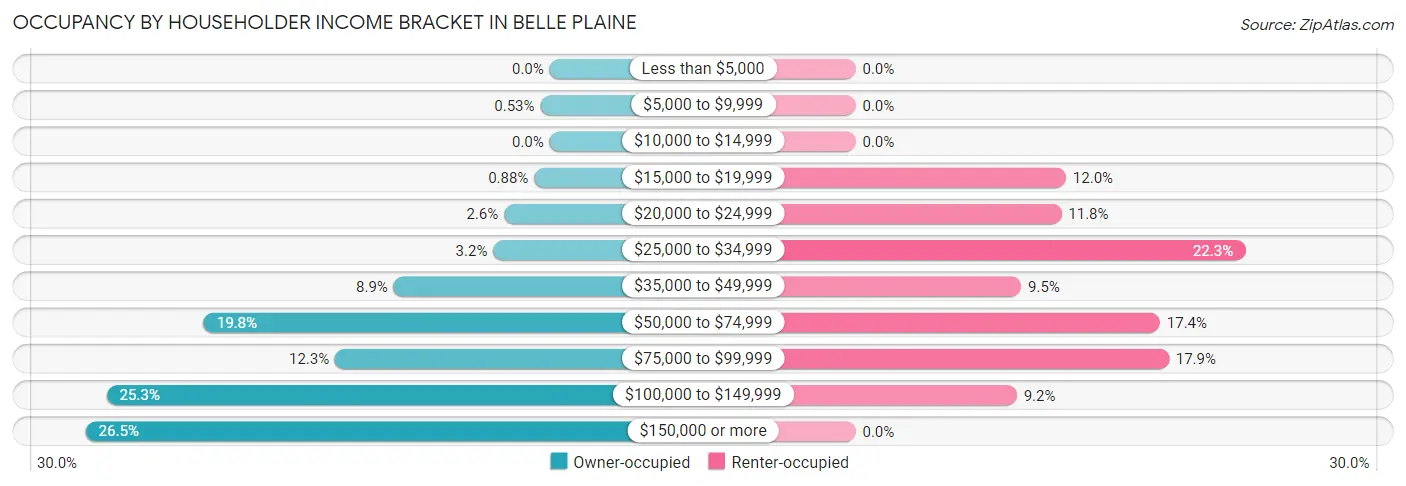
| Income Bracket | Owner-occupied | Renter-occupied |
| Less than $5,000 | 0 (0.0%) | 0 (0.0%) |
| $5,000 to $9,999 | 12 (0.5%) | 0 (0.0%) |
| $10,000 to $14,999 | 0 (0.0%) | 0 (0.0%) |
| $15,000 to $19,999 | 20 (0.9%) | 47 (12.0%) |
| $20,000 to $24,999 | 59 (2.6%) | 46 (11.8%) |
| $25,000 to $34,999 | 73 (3.2%) | 87 (22.3%) |
| $35,000 to $49,999 | 202 (8.9%) | 37 (9.5%) |
| $50,000 to $74,999 | 448 (19.8%) | 68 (17.4%) |
| $75,000 to $99,999 | 278 (12.3%) | 70 (17.9%) |
| $100,000 to $149,999 | 574 (25.3%) | 36 (9.2%) |
| $150,000 or more | 601 (26.5%) | 0 (0.0%) |
| Total | 2,267 (100.0%) | 391 (100.0%) |
Monthly Housing Cost Tiers in Belle Plaine
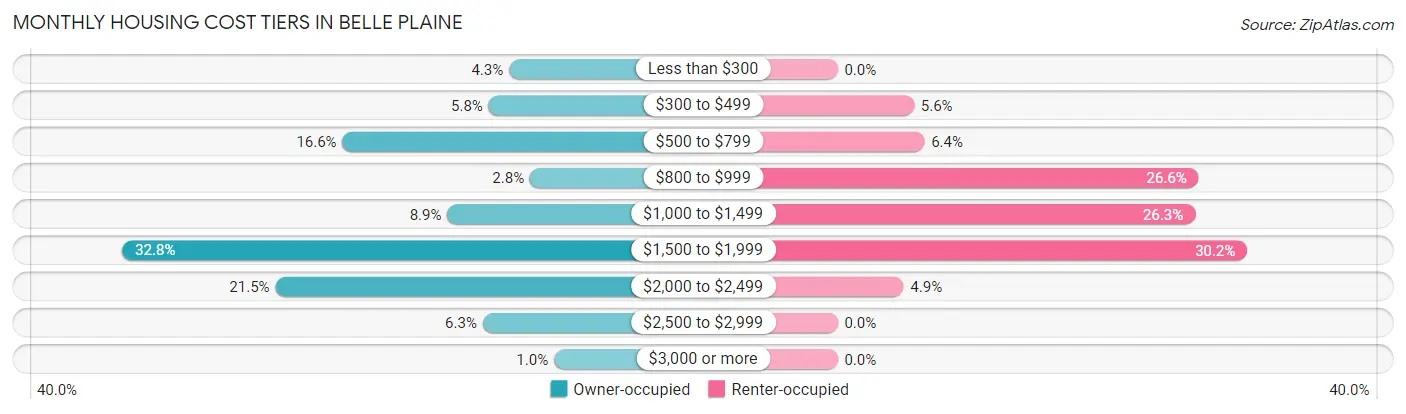
| Monthly Cost | Owner-occupied | Renter-occupied |
| Less than $300 | 98 (4.3%) | 0 (0.0%) |
| $300 to $499 | 132 (5.8%) | 22 (5.6%) |
| $500 to $799 | 376 (16.6%) | 25 (6.4%) |
| $800 to $999 | 63 (2.8%) | 104 (26.6%) |
| $1,000 to $1,499 | 201 (8.9%) | 103 (26.3%) |
| $1,500 to $1,999 | 744 (32.8%) | 118 (30.2%) |
| $2,000 to $2,499 | 488 (21.5%) | 19 (4.9%) |
| $2,500 to $2,999 | 142 (6.3%) | 0 (0.0%) |
| $3,000 or more | 23 (1.0%) | 0 (0.0%) |
| Total | 2,267 (100.0%) | 391 (100.0%) |
Physical Housing Characteristics in Belle Plaine
Housing Structures in Belle Plaine
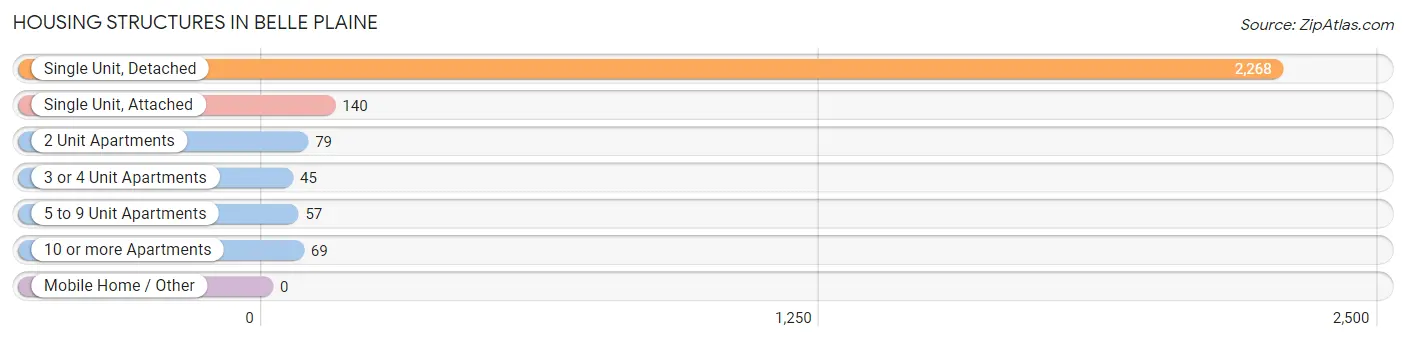
| Structure Type | # Housing Units | % Housing Units |
| Single Unit, Detached | 2,268 | 85.3% |
| Single Unit, Attached | 140 | 5.3% |
| 2 Unit Apartments | 79 | 3.0% |
| 3 or 4 Unit Apartments | 45 | 1.7% |
| 5 to 9 Unit Apartments | 57 | 2.1% |
| 10 or more Apartments | 69 | 2.6% |
| Mobile Home / Other | 0 | 0.0% |
| Total | 2,658 | 100.0% |
Housing Structures by Occupancy in Belle Plaine
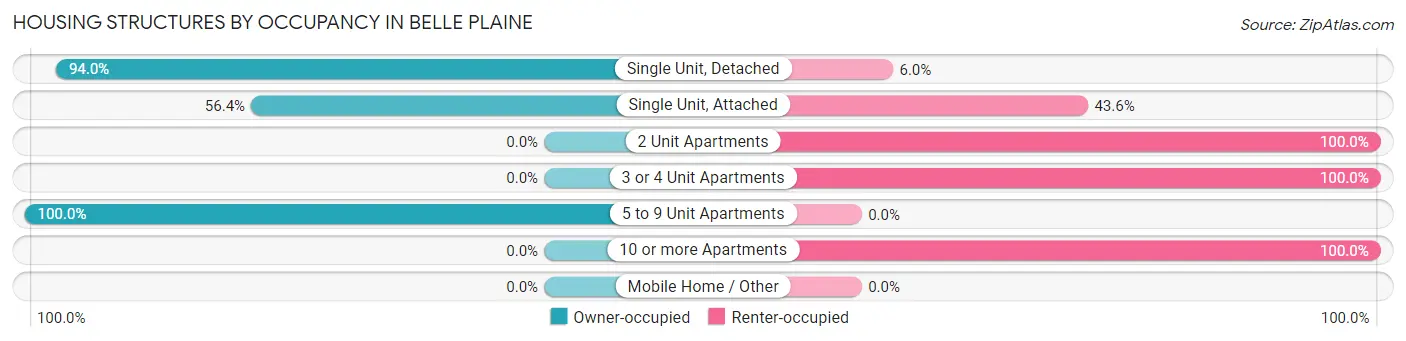
| Structure Type | Owner-occupied | Renter-occupied |
| Single Unit, Detached | 2,131 (94.0%) | 137 (6.0%) |
| Single Unit, Attached | 79 (56.4%) | 61 (43.6%) |
| 2 Unit Apartments | 0 (0.0%) | 79 (100.0%) |
| 3 or 4 Unit Apartments | 0 (0.0%) | 45 (100.0%) |
| 5 to 9 Unit Apartments | 57 (100.0%) | 0 (0.0%) |
| 10 or more Apartments | 0 (0.0%) | 69 (100.0%) |
| Mobile Home / Other | 0 (0.0%) | 0 (0.0%) |
| Total | 2,267 (85.3%) | 391 (14.7%) |
Housing Structures by Number of Rooms in Belle Plaine
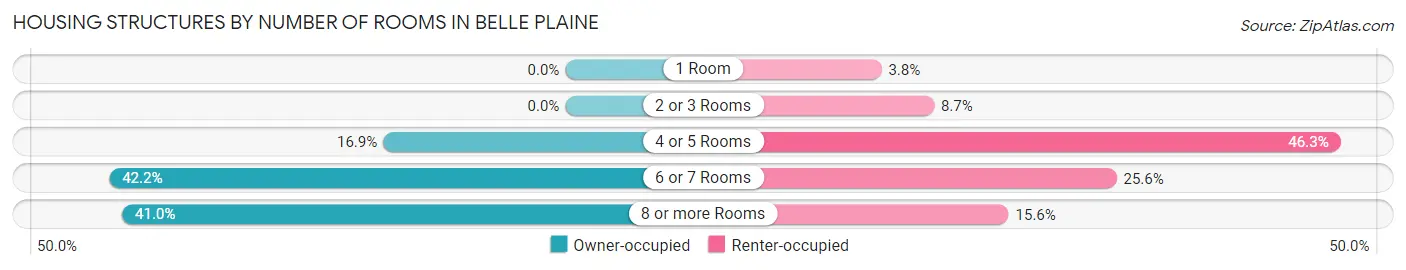
| Number of Rooms | Owner-occupied | Renter-occupied |
| 1 Room | 0 (0.0%) | 15 (3.8%) |
| 2 or 3 Rooms | 0 (0.0%) | 34 (8.7%) |
| 4 or 5 Rooms | 382 (16.9%) | 181 (46.3%) |
| 6 or 7 Rooms | 956 (42.2%) | 100 (25.6%) |
| 8 or more Rooms | 929 (41.0%) | 61 (15.6%) |
| Total | 2,267 (100.0%) | 391 (100.0%) |
Housing Structure by Heating Type in Belle Plaine
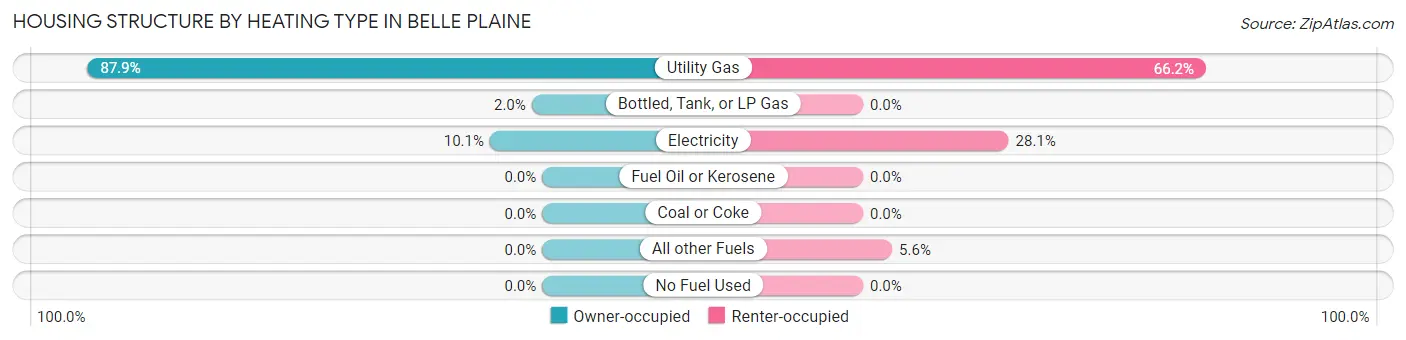
| Heating Type | Owner-occupied | Renter-occupied |
| Utility Gas | 1,992 (87.9%) | 259 (66.2%) |
| Bottled, Tank, or LP Gas | 46 (2.0%) | 0 (0.0%) |
| Electricity | 229 (10.1%) | 110 (28.1%) |
| Fuel Oil or Kerosene | 0 (0.0%) | 0 (0.0%) |
| Coal or Coke | 0 (0.0%) | 0 (0.0%) |
| All other Fuels | 0 (0.0%) | 22 (5.6%) |
| No Fuel Used | 0 (0.0%) | 0 (0.0%) |
| Total | 2,267 (100.0%) | 391 (100.0%) |
Household Vehicle Usage in Belle Plaine
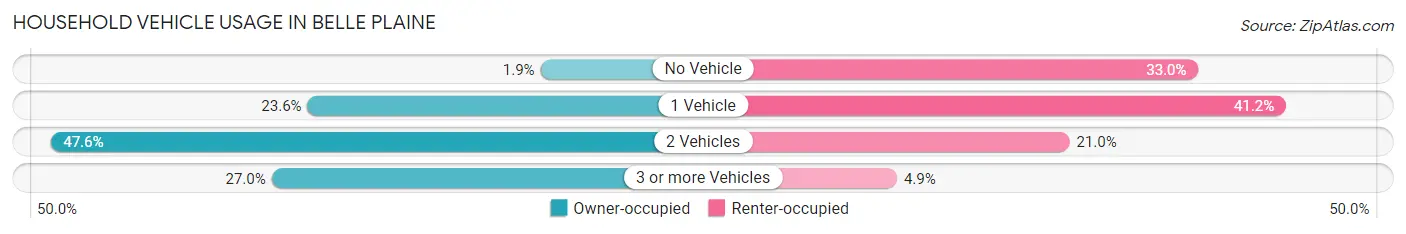
| Vehicles per Household | Owner-occupied | Renter-occupied |
| No Vehicle | 42 (1.8%) | 129 (33.0%) |
| 1 Vehicle | 535 (23.6%) | 161 (41.2%) |
| 2 Vehicles | 1,079 (47.6%) | 82 (21.0%) |
| 3 or more Vehicles | 611 (27.0%) | 19 (4.9%) |
| Total | 2,267 (100.0%) | 391 (100.0%) |
Real Estate & Mortgages in Belle Plaine
Real Estate and Mortgage Overview in Belle Plaine
| Characteristic | Without Mortgage | With Mortgage |
| Housing Units | 684 | 1,583 |
| Median Property Value | $261,500 | $280,300 |
| Median Household Income | $63,919 | $445 |
| Monthly Housing Costs | $635 | $23 |
| Real Estate Taxes | $3,163 | $55 |
Property Value by Mortgage Status in Belle Plaine
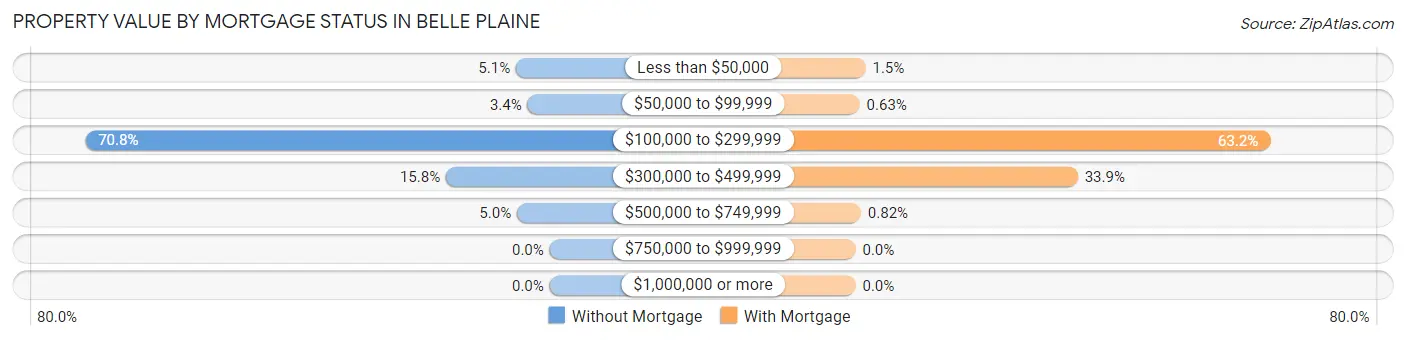
| Property Value | Without Mortgage | With Mortgage |
| Less than $50,000 | 35 (5.1%) | 24 (1.5%) |
| $50,000 to $99,999 | 23 (3.4%) | 10 (0.6%) |
| $100,000 to $299,999 | 484 (70.8%) | 1,000 (63.2%) |
| $300,000 to $499,999 | 108 (15.8%) | 536 (33.9%) |
| $500,000 to $749,999 | 34 (5.0%) | 13 (0.8%) |
| $750,000 to $999,999 | 0 (0.0%) | 0 (0.0%) |
| $1,000,000 or more | 0 (0.0%) | 0 (0.0%) |
| Total | 684 (100.0%) | 1,583 (100.0%) |
Household Income by Mortgage Status in Belle Plaine
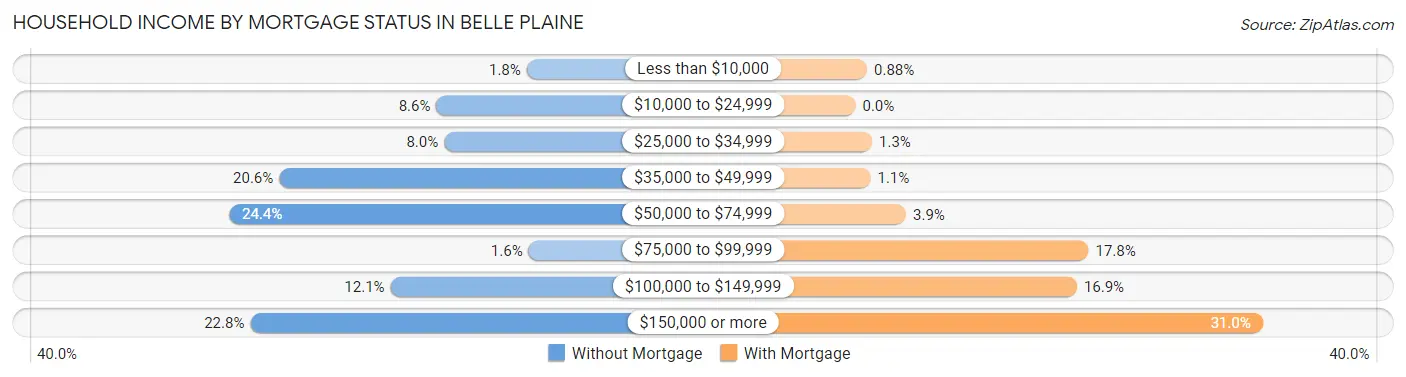
| Household Income | Without Mortgage | With Mortgage |
| Less than $10,000 | 12 (1.8%) | 14 (0.9%) |
| $10,000 to $24,999 | 59 (8.6%) | 0 (0.0%) |
| $25,000 to $34,999 | 55 (8.0%) | 20 (1.3%) |
| $35,000 to $49,999 | 141 (20.6%) | 18 (1.1%) |
| $50,000 to $74,999 | 167 (24.4%) | 61 (3.8%) |
| $75,000 to $99,999 | 11 (1.6%) | 281 (17.7%) |
| $100,000 to $149,999 | 83 (12.1%) | 267 (16.9%) |
| $150,000 or more | 156 (22.8%) | 491 (31.0%) |
| Total | 684 (100.0%) | 1,583 (100.0%) |
Property Value to Household Income Ratio in Belle Plaine
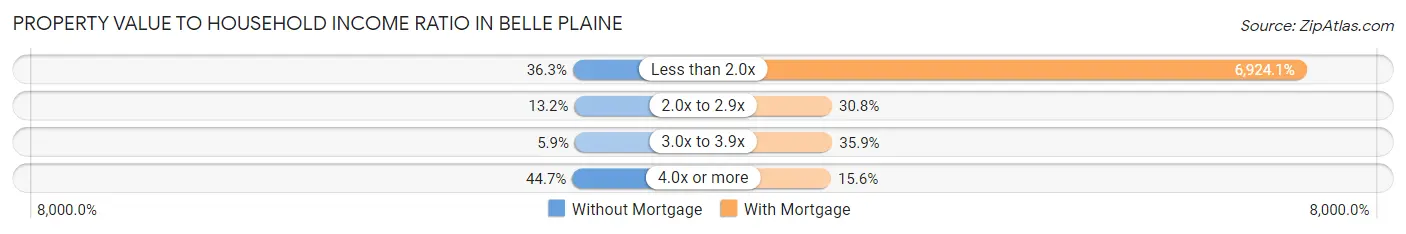
| Value-to-Income Ratio | Without Mortgage | With Mortgage |
| Less than 2.0x | 248 (36.3%) | 109,609 (6,924.1%) |
| 2.0x to 2.9x | 90 (13.2%) | 488 (30.8%) |
| 3.0x to 3.9x | 40 (5.9%) | 569 (35.9%) |
| 4.0x or more | 306 (44.7%) | 247 (15.6%) |
| Total | 684 (100.0%) | 1,583 (100.0%) |
Real Estate Taxes by Mortgage Status in Belle Plaine
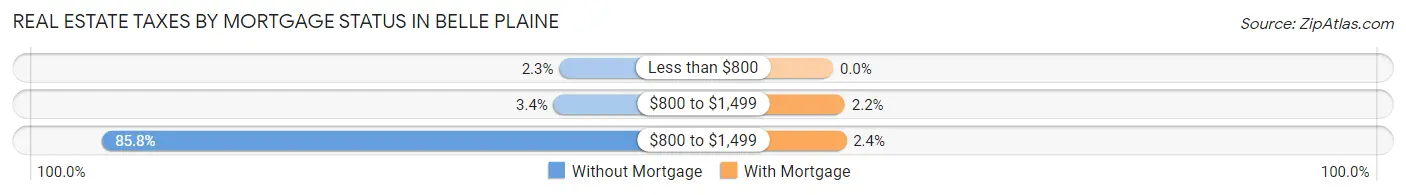
| Property Taxes | Without Mortgage | With Mortgage |
| Less than $800 | 16 (2.3%) | 0 (0.0%) |
| $800 to $1,499 | 23 (3.4%) | 34 (2.1%) |
| $800 to $1,499 | 587 (85.8%) | 38 (2.4%) |
| Total | 684 (100.0%) | 1,583 (100.0%) |
Health & Disability in Belle Plaine
Health Insurance Coverage by Age in Belle Plaine
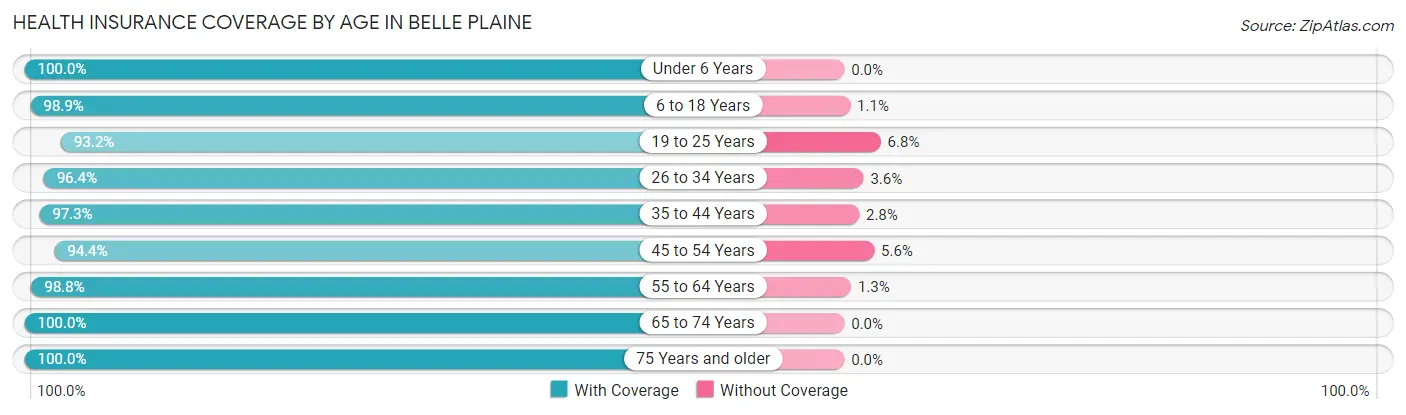
| Age Bracket | With Coverage | Without Coverage |
| Under 6 Years | 636 (100.0%) | 0 (0.0%) |
| 6 to 18 Years | 1,544 (98.9%) | 17 (1.1%) |
| 19 to 25 Years | 275 (93.2%) | 20 (6.8%) |
| 26 to 34 Years | 675 (96.4%) | 25 (3.6%) |
| 35 to 44 Years | 1,098 (97.3%) | 31 (2.8%) |
| 45 to 54 Years | 866 (94.4%) | 51 (5.6%) |
| 55 to 64 Years | 787 (98.8%) | 10 (1.3%) |
| 65 to 74 Years | 531 (100.0%) | 0 (0.0%) |
| 75 Years and older | 437 (100.0%) | 0 (0.0%) |
| Total | 6,849 (97.8%) | 154 (2.2%) |
Health Insurance Coverage by Citizenship Status in Belle Plaine
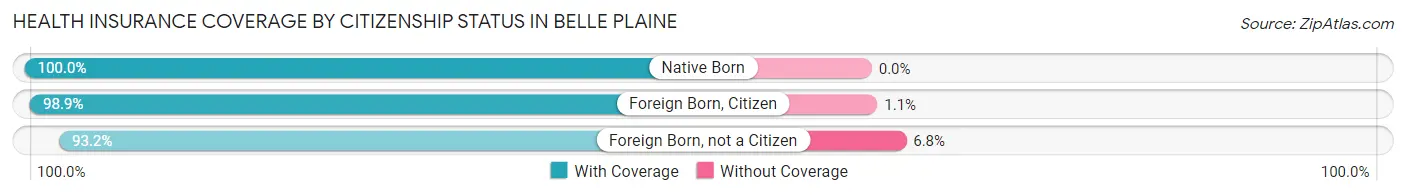
| Citizenship Status | With Coverage | Without Coverage |
| Native Born | 636 (100.0%) | 0 (0.0%) |
| Foreign Born, Citizen | 1,544 (98.9%) | 17 (1.1%) |
| Foreign Born, not a Citizen | 275 (93.2%) | 20 (6.8%) |
Health Insurance Coverage by Household Income in Belle Plaine
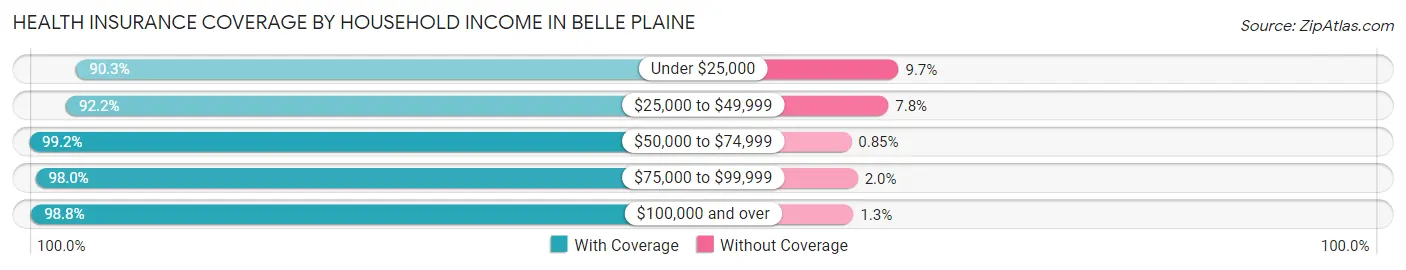
| Household Income | With Coverage | Without Coverage |
| Under $25,000 | 233 (90.3%) | 25 (9.7%) |
| $25,000 to $49,999 | 604 (92.2%) | 51 (7.8%) |
| $50,000 to $74,999 | 1,170 (99.2%) | 10 (0.9%) |
| $75,000 to $99,999 | 912 (98.0%) | 19 (2.0%) |
| $100,000 and over | 3,876 (98.8%) | 49 (1.3%) |
Public vs Private Health Insurance Coverage by Age in Belle Plaine
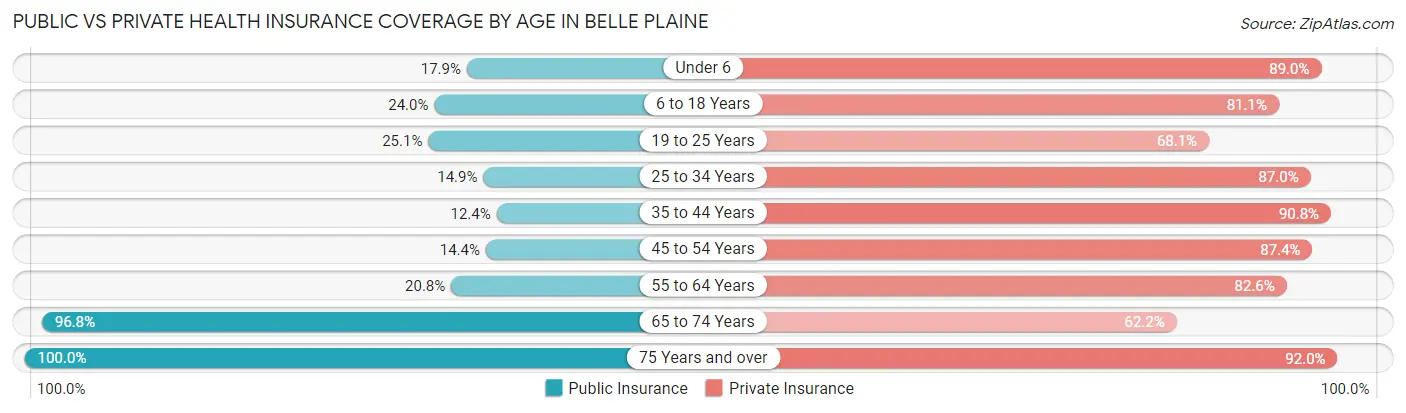
| Age Bracket | Public Insurance | Private Insurance |
| Under 6 | 114 (17.9%) | 566 (89.0%) |
| 6 to 18 Years | 374 (24.0%) | 1,266 (81.1%) |
| 19 to 25 Years | 74 (25.1%) | 201 (68.1%) |
| 25 to 34 Years | 104 (14.9%) | 609 (87.0%) |
| 35 to 44 Years | 140 (12.4%) | 1,025 (90.8%) |
| 45 to 54 Years | 132 (14.4%) | 801 (87.4%) |
| 55 to 64 Years | 166 (20.8%) | 658 (82.6%) |
| 65 to 74 Years | 514 (96.8%) | 330 (62.2%) |
| 75 Years and over | 437 (100.0%) | 402 (92.0%) |
| Total | 2,055 (29.3%) | 5,858 (83.7%) |
Disability Status by Sex by Age in Belle Plaine
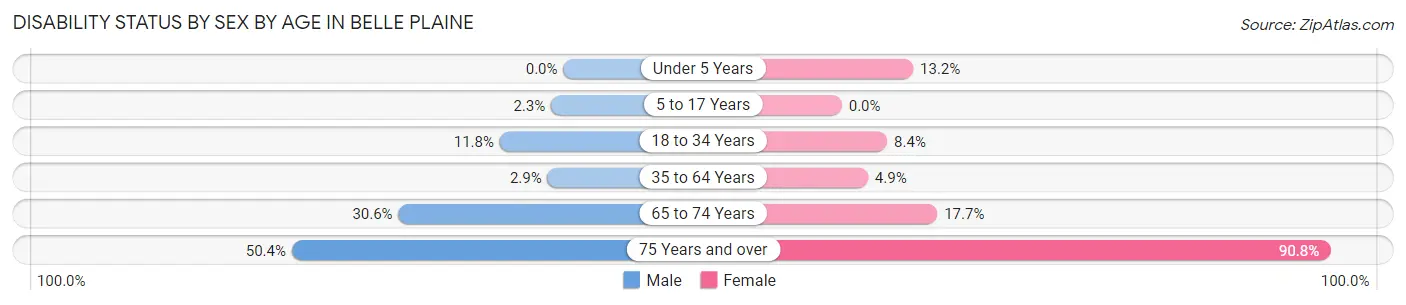
| Age Bracket | Male | Female |
| Under 5 Years | 0 (0.0%) | 29 (13.2%) |
| 5 to 17 Years | 14 (2.3%) | 0 (0.0%) |
| 18 to 34 Years | 70 (11.8%) | 47 (8.4%) |
| 35 to 64 Years | 44 (2.9%) | 65 (4.9%) |
| 65 to 74 Years | 90 (30.6%) | 42 (17.7%) |
| 75 Years and over | 127 (50.4%) | 168 (90.8%) |
Disability Class by Sex by Age in Belle Plaine
Disability Class: Hearing Difficulty
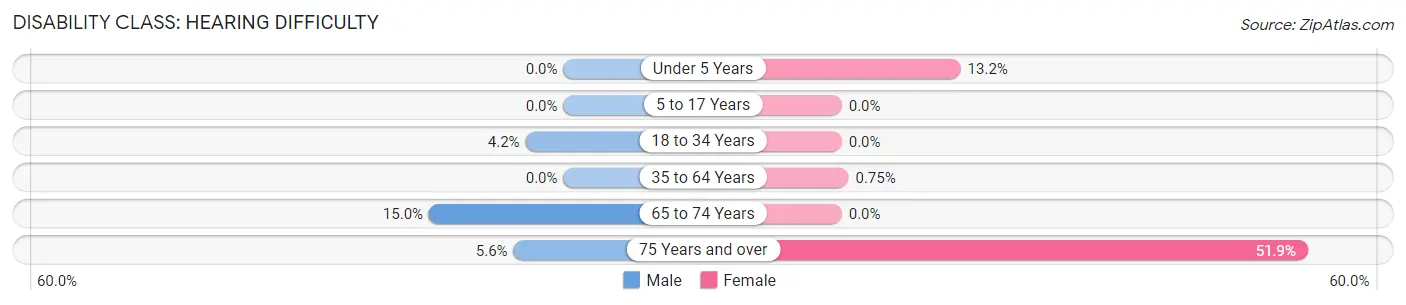
| Age Bracket | Male | Female |
| Under 5 Years | 0 (0.0%) | 29 (13.2%) |
| 5 to 17 Years | 0 (0.0%) | 0 (0.0%) |
| 18 to 34 Years | 25 (4.2%) | 0 (0.0%) |
| 35 to 64 Years | 0 (0.0%) | 10 (0.7%) |
| 65 to 74 Years | 44 (15.0%) | 0 (0.0%) |
| 75 Years and over | 14 (5.6%) | 96 (51.9%) |
Disability Class: Vision Difficulty
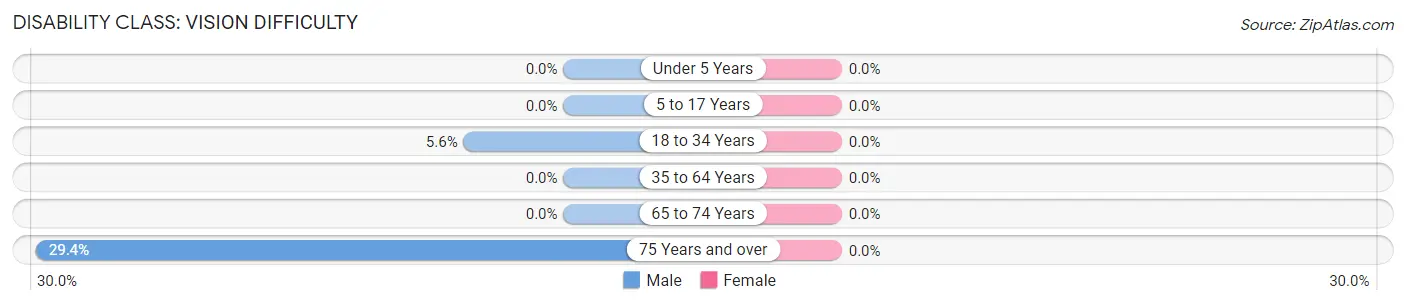
| Age Bracket | Male | Female |
| Under 5 Years | 0 (0.0%) | 0 (0.0%) |
| 5 to 17 Years | 0 (0.0%) | 0 (0.0%) |
| 18 to 34 Years | 33 (5.6%) | 0 (0.0%) |
| 35 to 64 Years | 0 (0.0%) | 0 (0.0%) |
| 65 to 74 Years | 0 (0.0%) | 0 (0.0%) |
| 75 Years and over | 74 (29.4%) | 0 (0.0%) |
Disability Class: Cognitive Difficulty
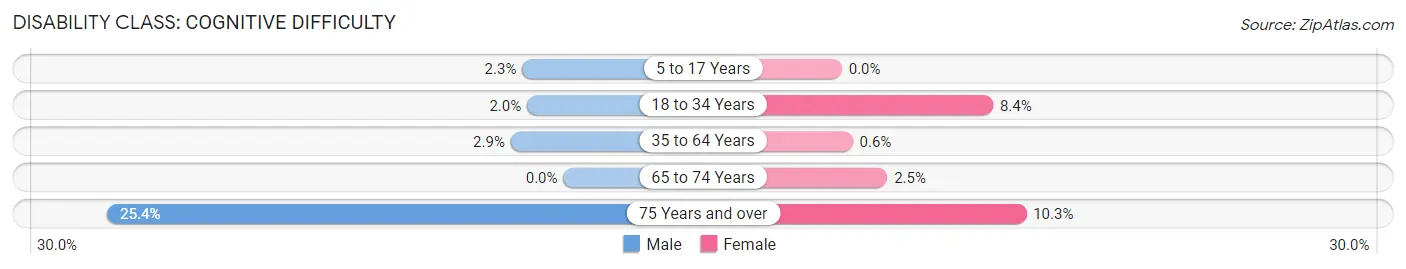
| Age Bracket | Male | Female |
| 5 to 17 Years | 14 (2.3%) | 0 (0.0%) |
| 18 to 34 Years | 12 (2.0%) | 47 (8.4%) |
| 35 to 64 Years | 44 (2.9%) | 8 (0.6%) |
| 65 to 74 Years | 0 (0.0%) | 6 (2.5%) |
| 75 Years and over | 64 (25.4%) | 19 (10.3%) |
Disability Class: Ambulatory Difficulty
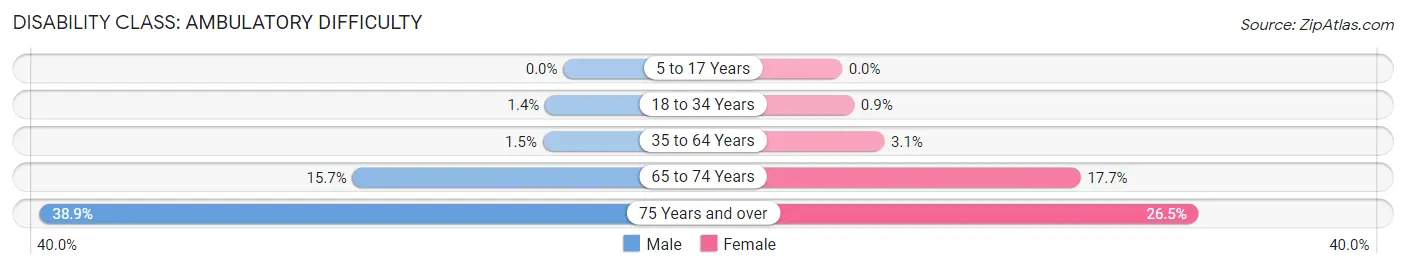
| Age Bracket | Male | Female |
| 5 to 17 Years | 0 (0.0%) | 0 (0.0%) |
| 18 to 34 Years | 8 (1.3%) | 5 (0.9%) |
| 35 to 64 Years | 23 (1.5%) | 42 (3.1%) |
| 65 to 74 Years | 46 (15.7%) | 42 (17.7%) |
| 75 Years and over | 98 (38.9%) | 49 (26.5%) |
Disability Class: Self-Care Difficulty
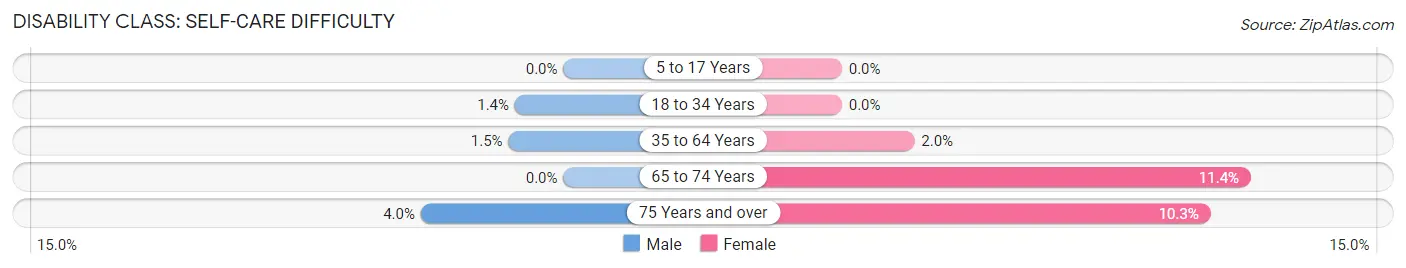
| Age Bracket | Male | Female |
| 5 to 17 Years | 0 (0.0%) | 0 (0.0%) |
| 18 to 34 Years | 8 (1.3%) | 0 (0.0%) |
| 35 to 64 Years | 23 (1.5%) | 27 (2.0%) |
| 65 to 74 Years | 0 (0.0%) | 27 (11.4%) |
| 75 Years and over | 10 (4.0%) | 19 (10.3%) |
Technology Access in Belle Plaine
Computing Device Access in Belle Plaine
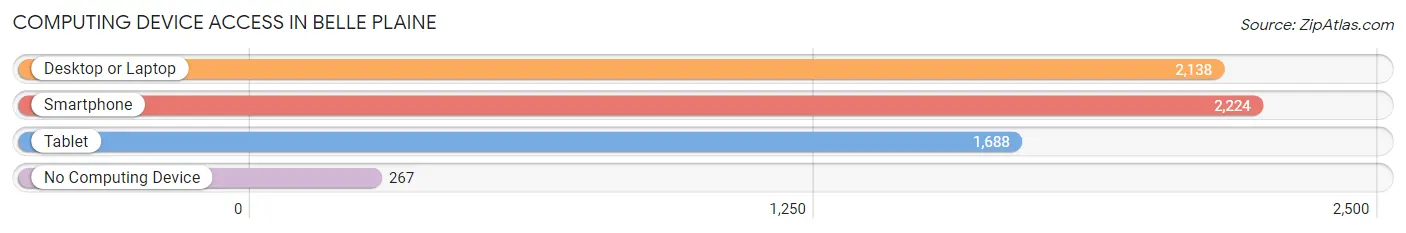
| Device Type | # Households | % Households |
| Desktop or Laptop | 2,138 | 80.4% |
| Smartphone | 2,224 | 83.7% |
| Tablet | 1,688 | 63.5% |
| No Computing Device | 267 | 10.1% |
| Total | 2,658 | 100.0% |
Internet Access in Belle Plaine
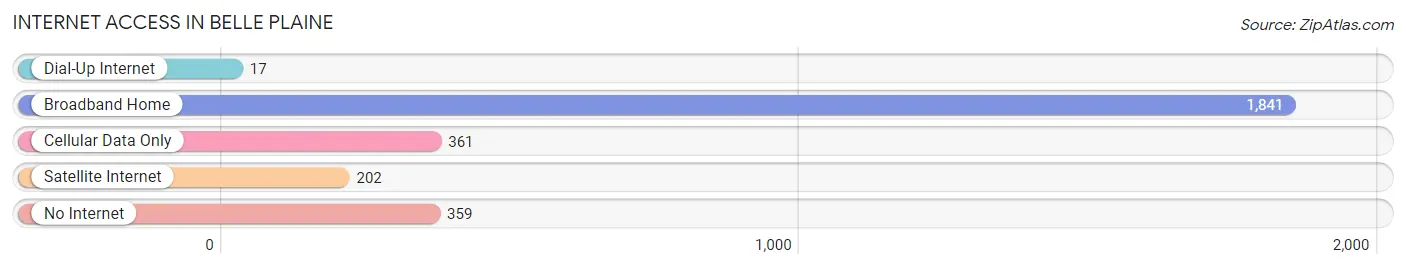
| Internet Type | # Households | % Households |
| Dial-Up Internet | 17 | 0.6% |
| Broadband Home | 1,841 | 69.3% |
| Cellular Data Only | 361 | 13.6% |
| Satellite Internet | 202 | 7.6% |
| No Internet | 359 | 13.5% |
| Total | 2,658 | 100.0% |
Belle Plaine Summary
Belle Plaine, Minnesota is a small city located in Scott County, in the south-central part of the state. It is situated on the Minnesota River, about 25 miles southwest of Minneapolis. The city has a population of approximately 5,000 people, and is part of the Twin Cities metropolitan area.
History
Belle Plaine was founded in 1856 by a group of settlers from New York. The city was named after the French phrase for “beautiful plain”, and was originally intended to be a farming community. The city was incorporated in 1872, and the first mayor was elected in 1873.
In the late 19th century, Belle Plaine was a thriving agricultural community, with a variety of crops being grown in the area. The city was also home to several businesses, including a flour mill, a creamery, and a brickyard.
In the early 20th century, Belle Plaine began to experience a period of growth and development. The city was connected to the Twin Cities by rail in 1910, and the first paved road was built in 1912. The city also saw the construction of several new buildings, including a new city hall, a library, and a hospital.
Geography
Belle Plaine is located in the Minnesota River Valley, and is surrounded by rolling hills and farmland. The city is situated on the banks of the Minnesota River, and is about 25 miles southwest of Minneapolis. The city has a total area of 4.2 square miles, and is located at an elevation of 890 feet.
The climate in Belle Plaine is classified as humid continental, with hot summers and cold winters. The average annual temperature is around 45 degrees Fahrenheit, and the average annual precipitation is around 30 inches.
Economy
Belle Plaine’s economy is largely based on agriculture and manufacturing. The city is home to several large agricultural operations, including a dairy farm, a hog farm, and a grain elevator. The city is also home to several manufacturing companies, including a plastics manufacturer and a metal fabrication company.
The city is also home to several retail stores, restaurants, and other businesses. The city is served by several major highways, including Interstate 35 and U.S. Highway 169.
Demographics
As of the 2010 census, Belle Plaine had a population of 5,073 people. The racial makeup of the city was 94.3% White, 0.7% African American, 0.3% Native American, 0.7% Asian, and 3.0% from other races. The median household income was $50,945, and the median family income was $60,945.
Belle Plaine is served by the Belle Plaine Public School District, which includes two elementary schools, one middle school, and one high school. The city is also home to several churches, including the First Presbyterian Church, the First Baptist Church, and the Church of the Nazarene.
Common Questions
What is Per Capita Income in Belle Plaine?
Per Capita income in Belle Plaine is $39,848.
What is the Median Family Income in Belle Plaine?
Median Family Income in Belle Plaine is $108,897.
What is the Median Household income in Belle Plaine?
Median Household Income in Belle Plaine is $94,698.
What is Income or Wage Gap in Belle Plaine?
Income or Wage Gap in Belle Plaine is 22.5%.
Women in Belle Plaine earn 77.5 cents for every dollar earned by a man.
What is Inequality or Gini Index in Belle Plaine?
Inequality or Gini Index in Belle Plaine is 0.35.
What is the Total Population of Belle Plaine?
Total Population of Belle Plaine is 7,363.
What is the Total Male Population of Belle Plaine?
Total Male Population of Belle Plaine is 3,728.
What is the Total Female Population of Belle Plaine?
Total Female Population of Belle Plaine is 3,635.
What is the Ratio of Males per 100 Females in Belle Plaine?
There are 102.56 Males per 100 Females in Belle Plaine.
What is the Ratio of Females per 100 Males in Belle Plaine?
There are 97.51 Females per 100 Males in Belle Plaine.
What is the Median Population Age in Belle Plaine?
Median Population Age in Belle Plaine is 38.5 Years.
What is the Average Family Size in Belle Plaine
Average Family Size in Belle Plaine is 3.0 People.
What is the Average Household Size in Belle Plaine
Average Household Size in Belle Plaine is 2.6 People.
How Large is the Labor Force in Belle Plaine?
There are 3,996 People in the Labor Forcein in Belle Plaine.
What is the Percentage of People in the Labor Force in Belle Plaine?
73.1% of People are in the Labor Force in Belle Plaine.
What is the Unemployment Rate in Belle Plaine?
Unemployment Rate in Belle Plaine is 0.7%.