Bryantown, MD Map & Demographics
Bryantown Map
Bryantown Overview
$68,440
PER CAPITA INCOME
$124,965
AVG FAMILY INCOME
$123,785
AVG HOUSEHOLD INCOME
0.38
INEQUALITY / GINI INDEX
620
TOTAL POPULATION
310
MALE POPULATION
310
FEMALE POPULATION
100.00
MALES / 100 FEMALES
100.00
FEMALES / 100 MALES
41.0
MEDIAN AGE
3.3
AVG FAMILY SIZE
3.0
AVG HOUSEHOLD SIZE
320
LABOR FORCE [ PEOPLE ]
66.1%
PERCENT IN LABOR FORCE
Bryantown Zip Codes
Bryantown Area Codes
Income in Bryantown
Income Overview in Bryantown
Per Capita Income in Bryantown is $68,440, while median incomes of families and households are $124,965 and $123,785 respectively.
| Characteristic | Number | Measure |
| Per Capita Income | 620 | $68,440 |
| Median Family Income | 173 | $124,965 |
| Mean Family Income | 173 | $203,210 |
| Median Household Income | 207 | $123,785 |
| Mean Household Income | 207 | $193,519 |
| Income Deficit | 173 | $0 |
| Wage / Income Gap (%) | 620 | 0.00% |
| Wage / Income Gap ($) | 620 | 100.00¢ per $1 |
| Gini / Inequality Index | 620 | 0.38 |
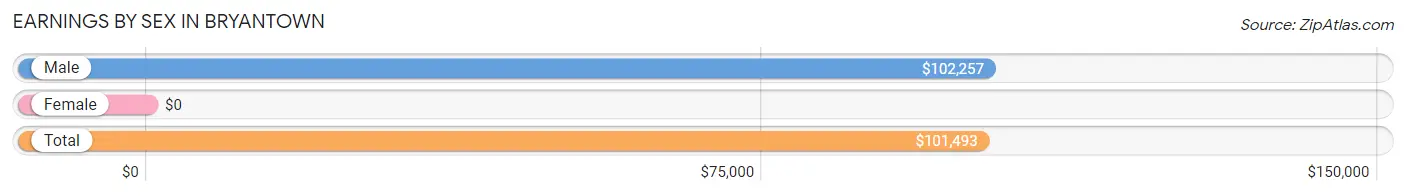
Earnings by Sex in Bryantown
| Sex | Number | Average Earnings |
| Male | 161 (48.3%) | $102,257 |
| Female | 172 (51.6%) | $0 |
| Total | 333 (100.0%) | $101,493 |
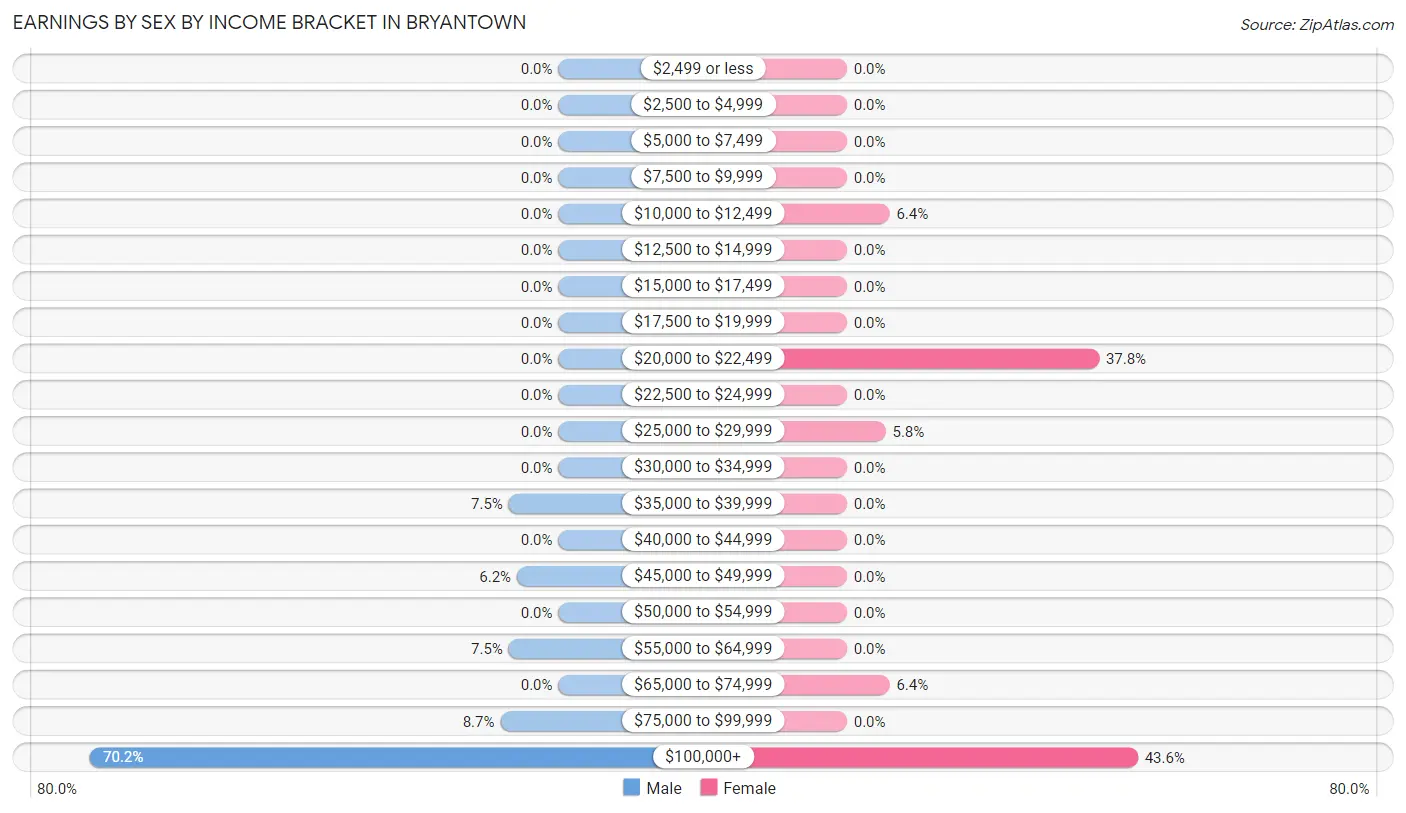
Earnings by Sex by Income Bracket in Bryantown
The most common earnings brackets in Bryantown are $100,000+ for men (113 | 70.2%) and $100,000+ for women (75 | 43.6%).
| Income | Male | Female |
| $2,499 or less | 0 (0.0%) | 0 (0.0%) |
| $2,500 to $4,999 | 0 (0.0%) | 0 (0.0%) |
| $5,000 to $7,499 | 0 (0.0%) | 0 (0.0%) |
| $7,500 to $9,999 | 0 (0.0%) | 0 (0.0%) |
| $10,000 to $12,499 | 0 (0.0%) | 11 (6.4%) |
| $12,500 to $14,999 | 0 (0.0%) | 0 (0.0%) |
| $15,000 to $17,499 | 0 (0.0%) | 0 (0.0%) |
| $17,500 to $19,999 | 0 (0.0%) | 0 (0.0%) |
| $20,000 to $22,499 | 0 (0.0%) | 65 (37.8%) |
| $22,500 to $24,999 | 0 (0.0%) | 0 (0.0%) |
| $25,000 to $29,999 | 0 (0.0%) | 10 (5.8%) |
| $30,000 to $34,999 | 0 (0.0%) | 0 (0.0%) |
| $35,000 to $39,999 | 12 (7.4%) | 0 (0.0%) |
| $40,000 to $44,999 | 0 (0.0%) | 0 (0.0%) |
| $45,000 to $49,999 | 10 (6.2%) | 0 (0.0%) |
| $50,000 to $54,999 | 0 (0.0%) | 0 (0.0%) |
| $55,000 to $64,999 | 12 (7.4%) | 0 (0.0%) |
| $65,000 to $74,999 | 0 (0.0%) | 11 (6.4%) |
| $75,000 to $99,999 | 14 (8.7%) | 0 (0.0%) |
| $100,000+ | 113 (70.2%) | 75 (43.6%) |
| Total | 161 (100.0%) | 172 (100.0%) |
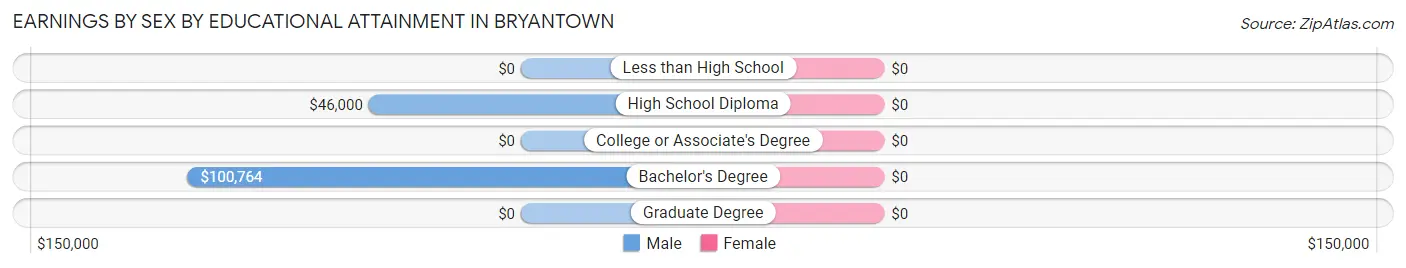
Earnings by Sex by Educational Attainment in Bryantown
| Educational Attainment | Male Income | Female Income |
| Less than High School | - | - |
| High School Diploma | $46,000 | $0 |
| College or Associate's Degree | - | - |
| Bachelor's Degree | $100,764 | $0 |
| Graduate Degree | - | - |
| Total | $102,257 | $0 |
Family Income in Bryantown
Family Income Brackets in Bryantown
According to the Bryantown family income data, there are 47 families falling into the $200,000+ income range, which is the most common income bracket and makes up 27.2% of all families.
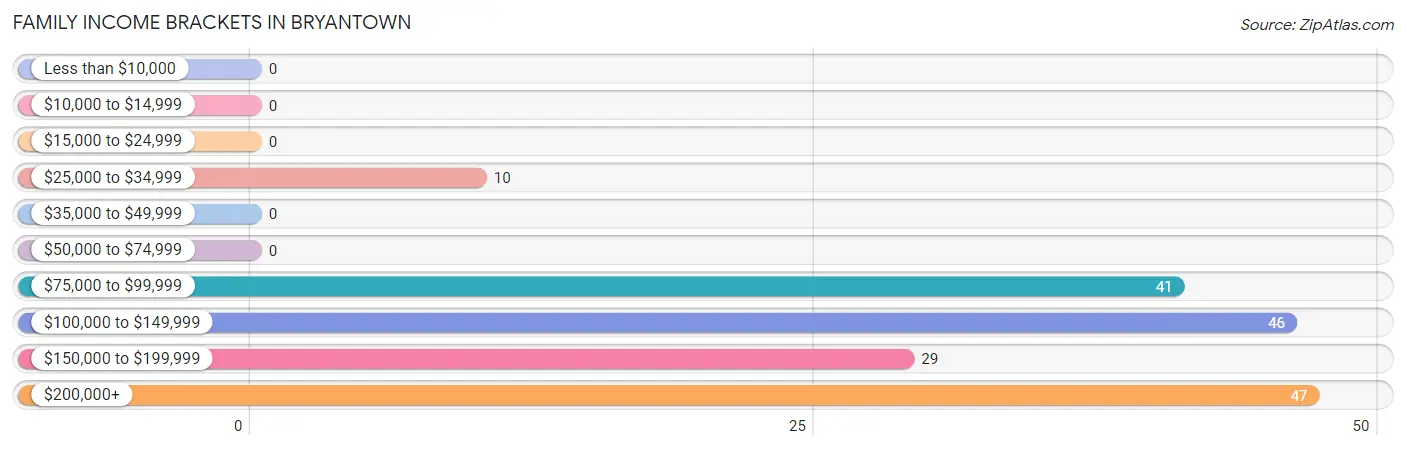
| Income Bracket | # Families | % Families |
| Less than $10,000 | 0 | 0.0% |
| $10,000 to $14,999 | 0 | 0.0% |
| $15,000 to $24,999 | 0 | 0.0% |
| $25,000 to $34,999 | 10 | 5.8% |
| $35,000 to $49,999 | 0 | 0.0% |
| $50,000 to $74,999 | 0 | 0.0% |
| $75,000 to $99,999 | 41 | 23.7% |
| $100,000 to $149,999 | 46 | 26.6% |
| $150,000 to $199,999 | 29 | 16.8% |
| $200,000+ | 47 | 27.2% |
Family Income by Famaliy Size in Bryantown
2-person families (93 | 53.8%) account for the highest median family income in Bryantown with $197,656 per family, while 2-person families (93 | 53.8%) have the highest median income of $98,828 per family member.
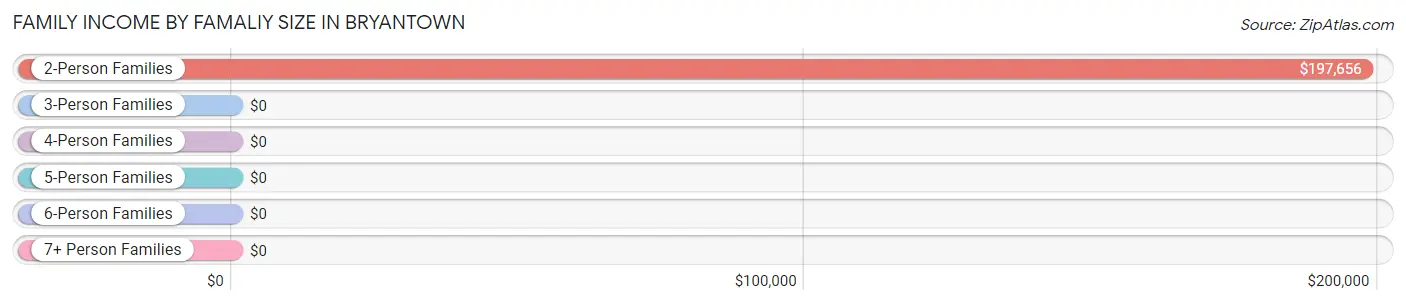
| Income Bracket | # Families | Median Income |
| 2-Person Families | 93 (53.8%) | $197,656 |
| 3-Person Families | 14 (8.1%) | $0 |
| 4-Person Families | 20 (11.6%) | $0 |
| 5-Person Families | 46 (26.6%) | $0 |
| 6-Person Families | 0 (0.0%) | $0 |
| 7+ Person Families | 0 (0.0%) | $0 |
| Total | 173 (100.0%) | $124,965 |
Family Income by Number of Earners in Bryantown
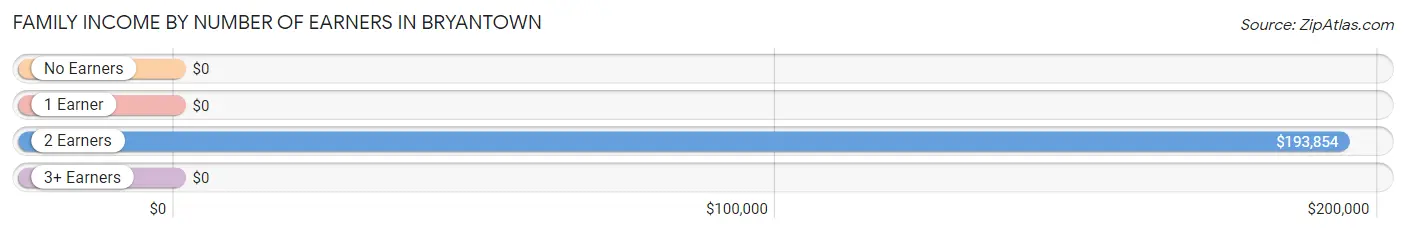
| Number of Earners | # Families | Median Income |
| No Earners | 27 (15.6%) | $0 |
| 1 Earner | 41 (23.7%) | $0 |
| 2 Earners | 105 (60.7%) | $193,854 |
| 3+ Earners | 0 (0.0%) | $0 |
| Total | 173 (100.0%) | $124,965 |
Household Income in Bryantown
Household Income Brackets in Bryantown
With 73 households falling in the category, the $100,000 to $149,999 income range is the most frequent in Bryantown, accounting for 35.3% of all households.
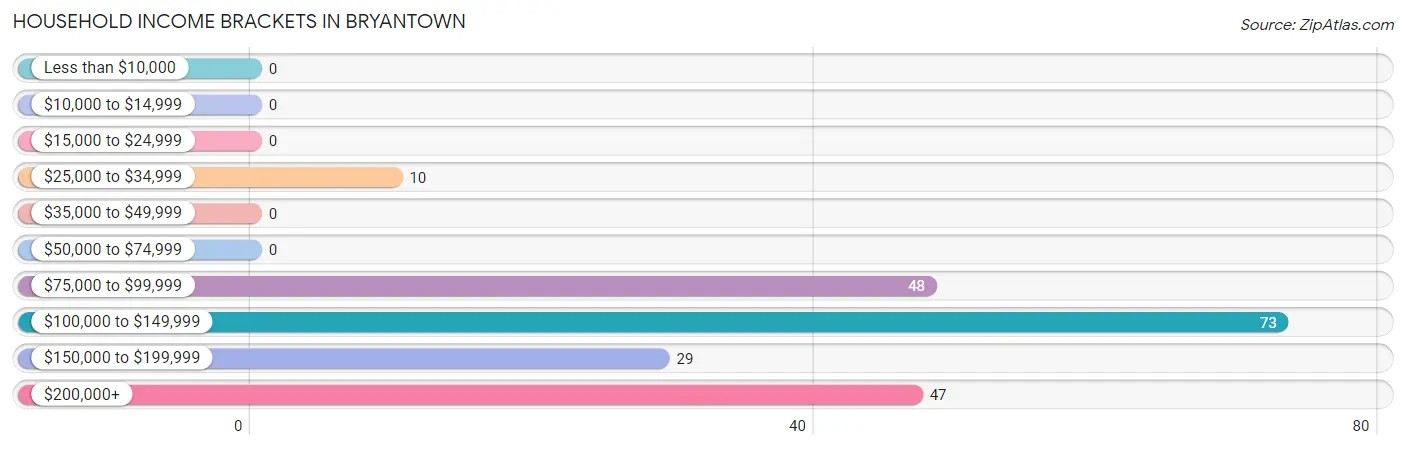
| Income Bracket | # Households | % Households |
| Less than $10,000 | 0 | 0.0% |
| $10,000 to $14,999 | 0 | 0.0% |
| $15,000 to $24,999 | 0 | 0.0% |
| $25,000 to $34,999 | 10 | 4.8% |
| $35,000 to $49,999 | 0 | 0.0% |
| $50,000 to $74,999 | 0 | 0.0% |
| $75,000 to $99,999 | 48 | 23.2% |
| $100,000 to $149,999 | 73 | 35.3% |
| $150,000 to $199,999 | 29 | 14.0% |
| $200,000+ | 47 | 22.7% |
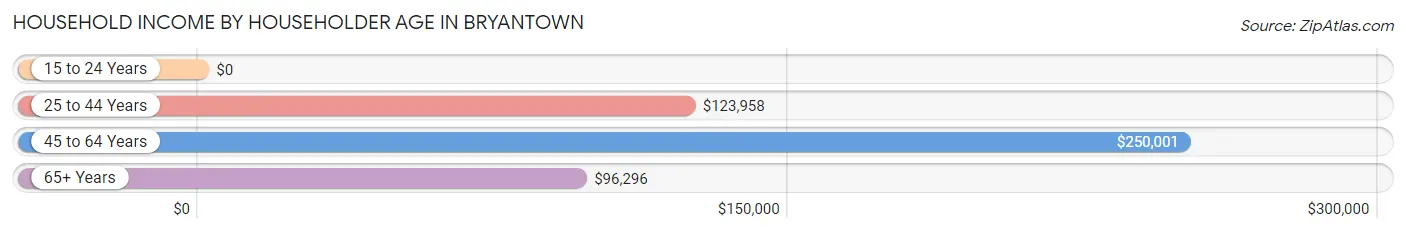
Household Income by Householder Age in Bryantown
The median household income in Bryantown is $123,785, with the highest median household income of $250,001 found in the 45 to 64 years age bracket for the primary householder. A total of 75 households (36.2%) fall into this category.
| Income Bracket | # Households | Median Income |
| 15 to 24 Years | 0 (0.0%) | $0 |
| 25 to 44 Years | 70 (33.8%) | $123,958 |
| 45 to 64 Years | 75 (36.2%) | $250,001 |
| 65+ Years | 62 (29.9%) | $96,296 |
| Total | 207 (100.0%) | $123,785 |
Poverty in Bryantown
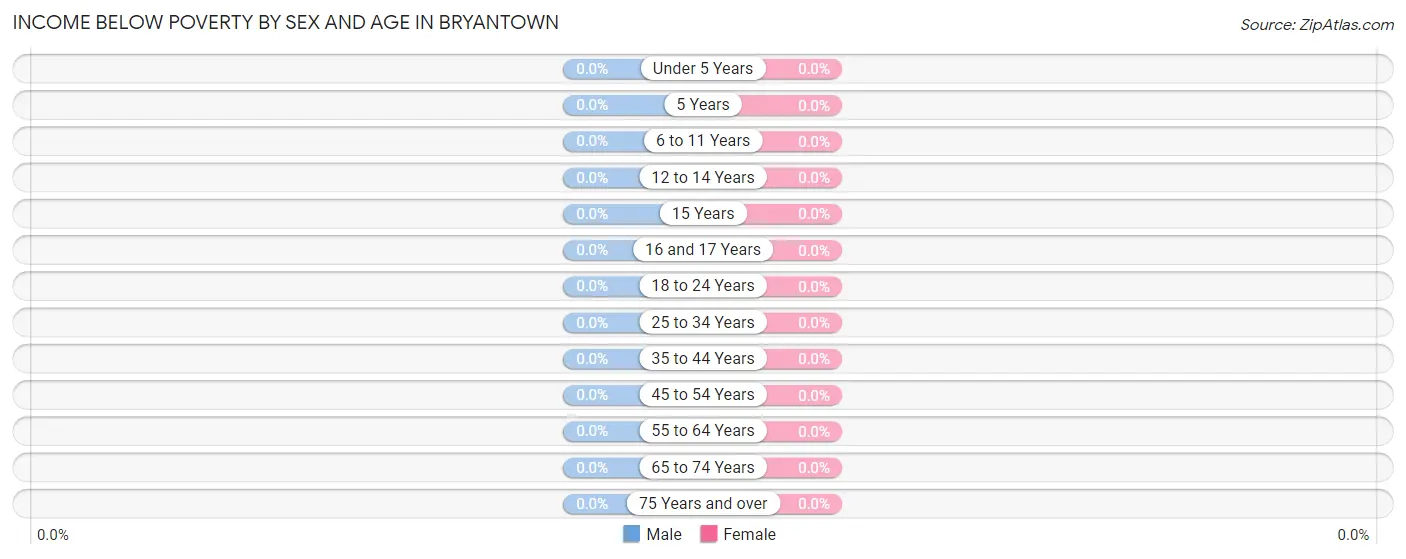
Income Below Poverty by Sex and Age in Bryantown
| Age Bracket | Male | Female |
| Under 5 Years | 0 (0.0%) | 0 (0.0%) |
| 5 Years | 0 (0.0%) | 0 (0.0%) |
| 6 to 11 Years | 0 (0.0%) | 0 (0.0%) |
| 12 to 14 Years | 0 (0.0%) | 0 (0.0%) |
| 15 Years | 0 (0.0%) | 0 (0.0%) |
| 16 and 17 Years | 0 (0.0%) | 0 (0.0%) |
| 18 to 24 Years | 0 (0.0%) | 0 (0.0%) |
| 25 to 34 Years | 0 (0.0%) | 0 (0.0%) |
| 35 to 44 Years | 0 (0.0%) | 0 (0.0%) |
| 45 to 54 Years | 0 (0.0%) | 0 (0.0%) |
| 55 to 64 Years | 0 (0.0%) | 0 (0.0%) |
| 65 to 74 Years | 0 (0.0%) | 0 (0.0%) |
| 75 Years and over | 0 (0.0%) | 0 (0.0%) |
| Total | 0 (0.0%) | 0 (0.0%) |
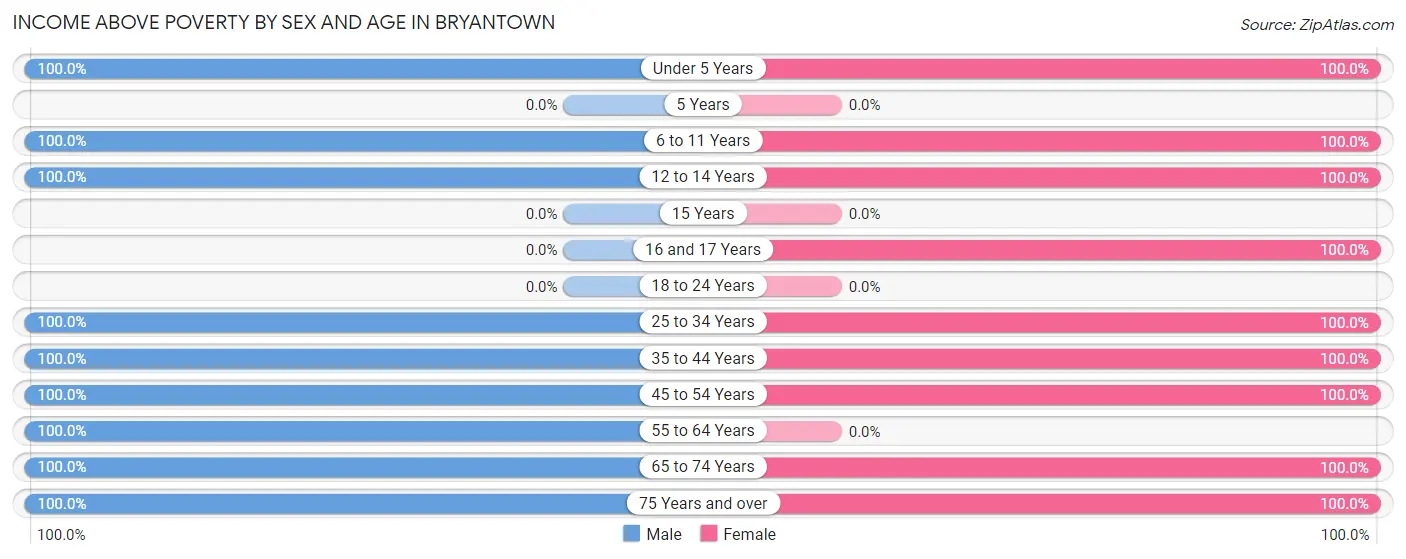
Income Above Poverty by Sex and Age in Bryantown
According to the poverty statistics in Bryantown, males aged under 5 years and females aged under 5 years are the age groups that are most secure financially, with 100.0% of males and 100.0% of females in these age groups living above the poverty line.
| Age Bracket | Male | Female |
| Under 5 Years | 36 (100.0%) | 12 (100.0%) |
| 5 Years | 0 (0.0%) | 0 (0.0%) |
| 6 to 11 Years | 35 (100.0%) | 10 (100.0%) |
| 12 to 14 Years | 34 (100.0%) | 9 (100.0%) |
| 15 Years | 0 (0.0%) | 0 (0.0%) |
| 16 and 17 Years | 0 (0.0%) | 33 (100.0%) |
| 18 to 24 Years | 0 (0.0%) | 0 (0.0%) |
| 25 to 34 Years | 38 (100.0%) | 21 (100.0%) |
| 35 to 44 Years | 46 (100.0%) | 83 (100.0%) |
| 45 to 54 Years | 57 (100.0%) | 87 (100.0%) |
| 55 to 64 Years | 20 (100.0%) | 0 (0.0%) |
| 65 to 74 Years | 10 (100.0%) | 9 (100.0%) |
| 75 Years and over | 34 (100.0%) | 46 (100.0%) |
| Total | 310 (100.0%) | 310 (100.0%) |
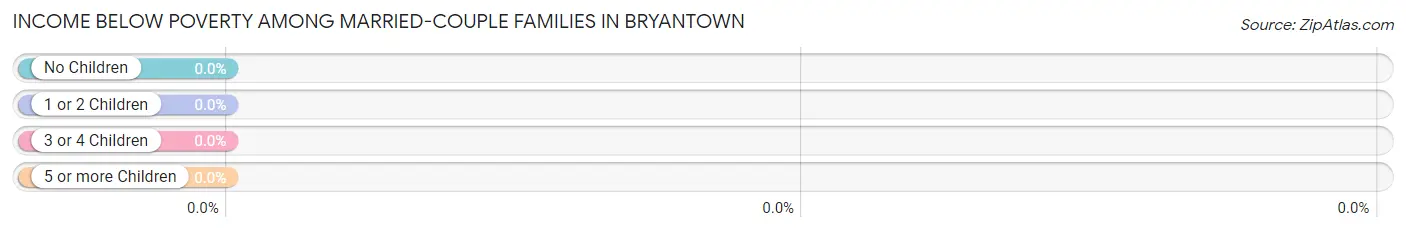
Income Below Poverty Among Married-Couple Families in Bryantown
| Children | Above Poverty | Below Poverty |
| No Children | 64 (100.0%) | 0 (0.0%) |
| 1 or 2 Children | 44 (100.0%) | 0 (0.0%) |
| 3 or 4 Children | 36 (100.0%) | 0 (0.0%) |
| 5 or more Children | 0 (0.0%) | 0 (0.0%) |
| Total | 144 (100.0%) | 0 (0.0%) |
Income Below Poverty Among Single-Parent Households in Bryantown
| Children | Single Father | Single Mother |
| No Children | 0 (0.0%) | 0 (0.0%) |
| 1 or 2 Children | 0 (0.0%) | 0 (0.0%) |
| 3 or 4 Children | 0 (0.0%) | 0 (0.0%) |
| 5 or more Children | 0 (0.0%) | 0 (0.0%) |
| Total | 0 (0.0%) | 0 (0.0%) |
Income Below Poverty Among Married-Couple vs Single-Parent Households in Bryantown
| Children | Married-Couple Families | Single-Parent Households |
| No Children | 0 (0.0%) | 0 (0.0%) |
| 1 or 2 Children | 0 (0.0%) | 0 (0.0%) |
| 3 or 4 Children | 0 (0.0%) | 0 (0.0%) |
| 5 or more Children | 0 (0.0%) | 0 (0.0%) |
| Total | 0 (0.0%) | 0 (0.0%) |
Race in Bryantown
The most populous races in Bryantown are White / Caucasian (434 | 70.0%), Black / African American (121 | 19.5%), and Hispanic or Latino (65 | 10.5%).
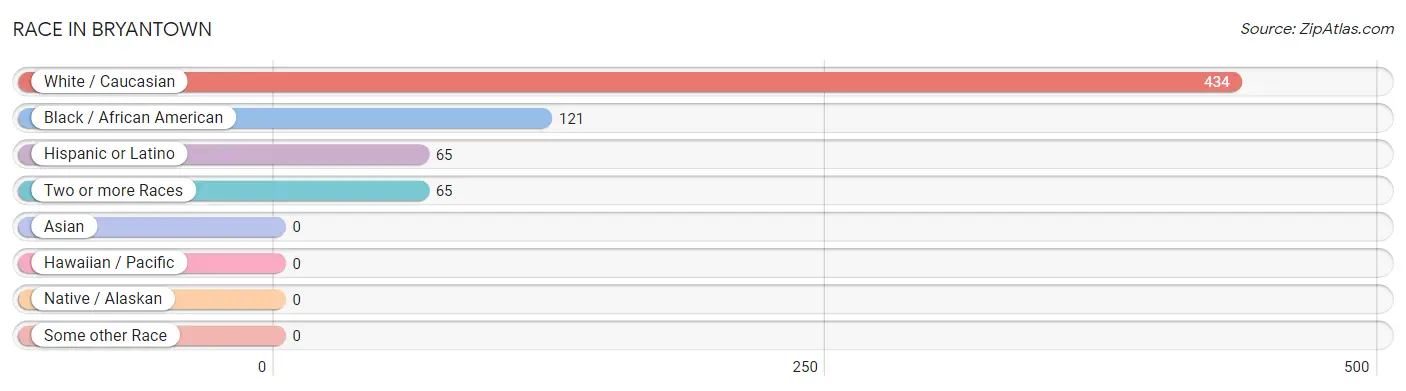
| Race | # Population | % Population |
| Asian | 0 | 0.0% |
| Black / African American | 121 | 19.5% |
| Hawaiian / Pacific | 0 | 0.0% |
| Hispanic or Latino | 65 | 10.5% |
| Native / Alaskan | 0 | 0.0% |
| White / Caucasian | 434 | 70.0% |
| Two or more Races | 65 | 10.5% |
| Some other Race | 0 | 0.0% |
| Total | 620 | 100.0% |
Ancestry in Bryantown
The most populous ancestries reported in Bryantown are German (113 | 18.2%), Irish (110 | 17.7%), Mexican (65 | 10.5%), Norwegian (47 | 7.6%), and English (32 | 5.2%), together accounting for 59.2% of all Bryantown residents.
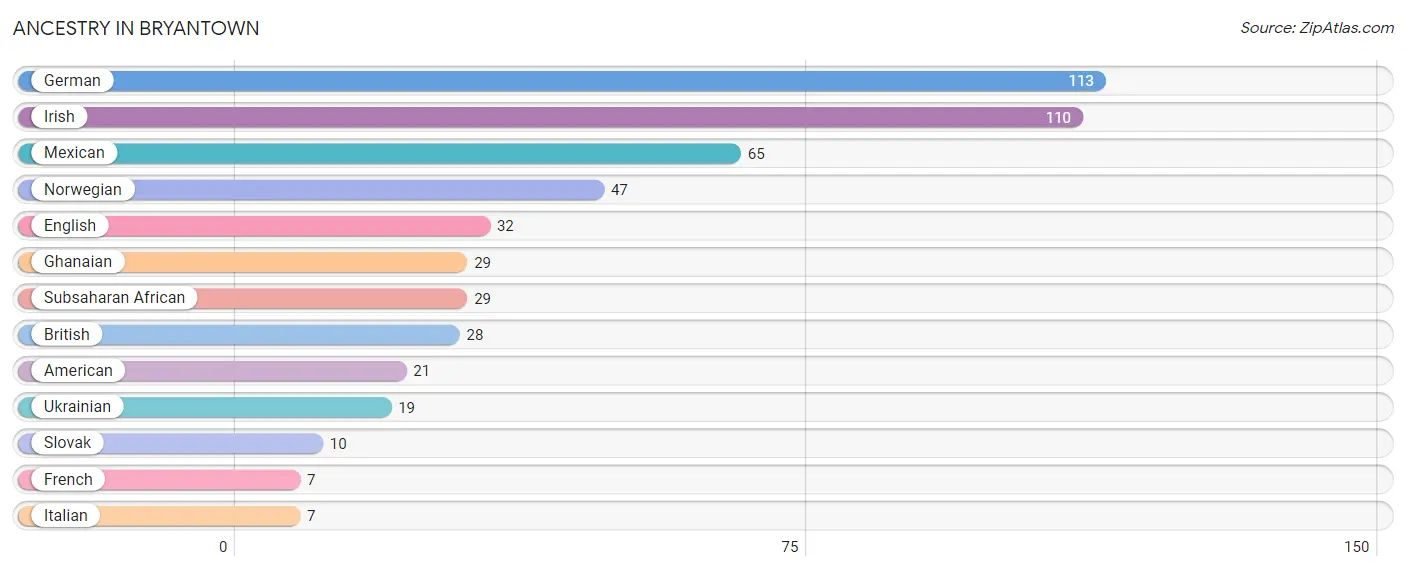
| Ancestry | # Population | % Population |
| American | 21 | 3.4% |
| British | 28 | 4.5% |
| English | 32 | 5.2% |
| French | 7 | 1.1% |
| German | 113 | 18.2% |
| Ghanaian | 29 | 4.7% |
| Irish | 110 | 17.7% |
| Italian | 7 | 1.1% |
| Mexican | 65 | 10.5% |
| Norwegian | 47 | 7.6% |
| Slovak | 10 | 1.6% |
| Subsaharan African | 29 | 4.7% |
| Ukrainian | 19 | 3.1% | View All 13 Rows |
Immigrants in Bryantown

| Immigration Origin | # Population | % Population | View All 0 Rows |
Sex and Age in Bryantown
Sex and Age in Bryantown
The most populous age groups in Bryantown are 50 to 54 Years (57 | 18.4%) for men and 40 to 44 Years (75 | 24.2%) for women.
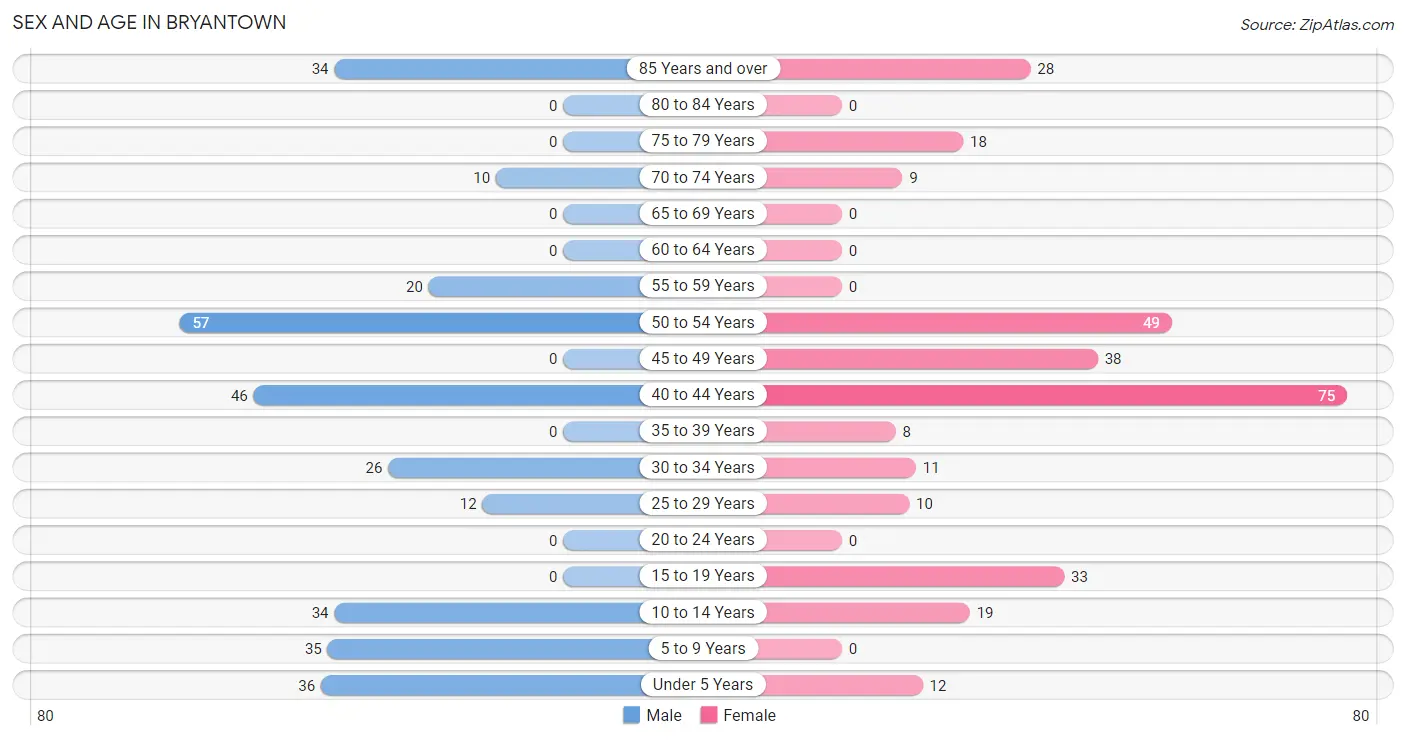
| Age Bracket | Male | Female |
| Under 5 Years | 36 (11.6%) | 12 (3.9%) |
| 5 to 9 Years | 35 (11.3%) | 0 (0.0%) |
| 10 to 14 Years | 34 (11.0%) | 19 (6.1%) |
| 15 to 19 Years | 0 (0.0%) | 33 (10.6%) |
| 20 to 24 Years | 0 (0.0%) | 0 (0.0%) |
| 25 to 29 Years | 12 (3.9%) | 10 (3.2%) |
| 30 to 34 Years | 26 (8.4%) | 11 (3.5%) |
| 35 to 39 Years | 0 (0.0%) | 8 (2.6%) |
| 40 to 44 Years | 46 (14.8%) | 75 (24.2%) |
| 45 to 49 Years | 0 (0.0%) | 38 (12.3%) |
| 50 to 54 Years | 57 (18.4%) | 49 (15.8%) |
| 55 to 59 Years | 20 (6.5%) | 0 (0.0%) |
| 60 to 64 Years | 0 (0.0%) | 0 (0.0%) |
| 65 to 69 Years | 0 (0.0%) | 0 (0.0%) |
| 70 to 74 Years | 10 (3.2%) | 9 (2.9%) |
| 75 to 79 Years | 0 (0.0%) | 18 (5.8%) |
| 80 to 84 Years | 0 (0.0%) | 0 (0.0%) |
| 85 Years and over | 34 (11.0%) | 28 (9.0%) |
| Total | 310 (100.0%) | 310 (100.0%) |
Families and Households in Bryantown
Median Family Size in Bryantown
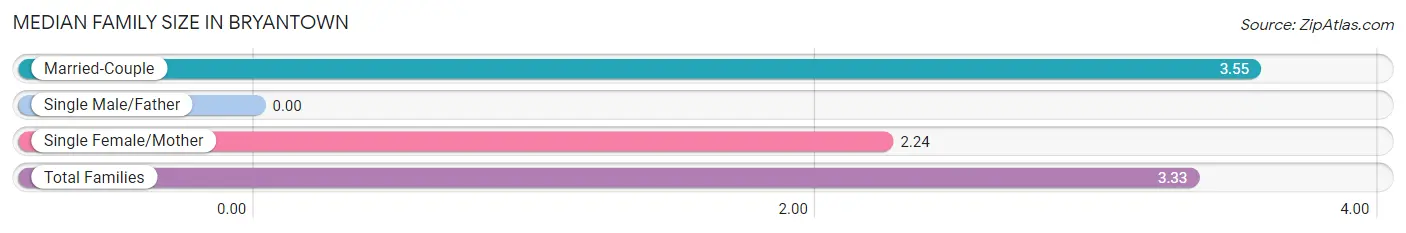
| Family Type | # Families | Family Size |
| Married-Couple | 144 (83.2%) | 3.55 |
| Single Male/Father | 0 (0.0%) | - |
| Single Female/Mother | 29 (16.8%) | 2.24 |
| Total Families | 173 (100.0%) | 3.33 |
Median Household Size in Bryantown
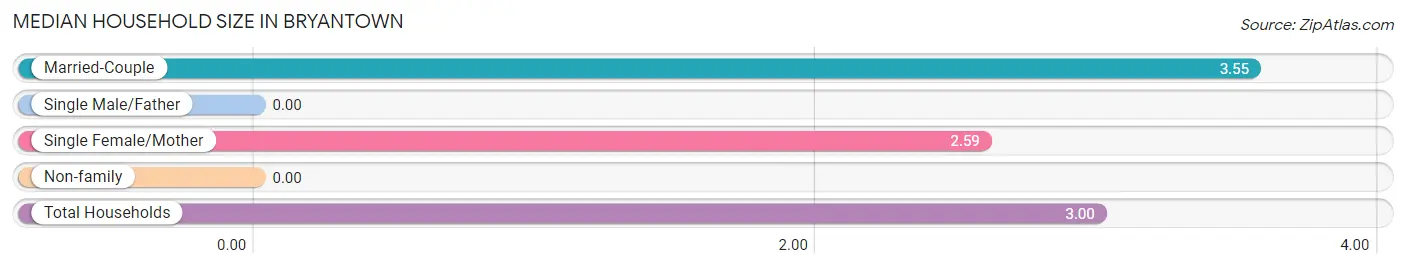
| Household Type | # Households | Household Size |
| Married-Couple | 144 (69.6%) | 3.55 |
| Single Male/Father | 0 (0.0%) | - |
| Single Female/Mother | 29 (14.0%) | 2.59 |
| Non-family | 34 (16.4%) | - |
| Total Households | 207 (100.0%) | 3.00 |
Household Size by Marriage Status in Bryantown
Out of a total of 207 households in Bryantown, 173 (83.6%) are family households, while 34 (16.4%) are nonfamily households. The most numerous type of family households are 2-person households, comprising 82, and the most common type of nonfamily households are 1-person households, comprising 34.
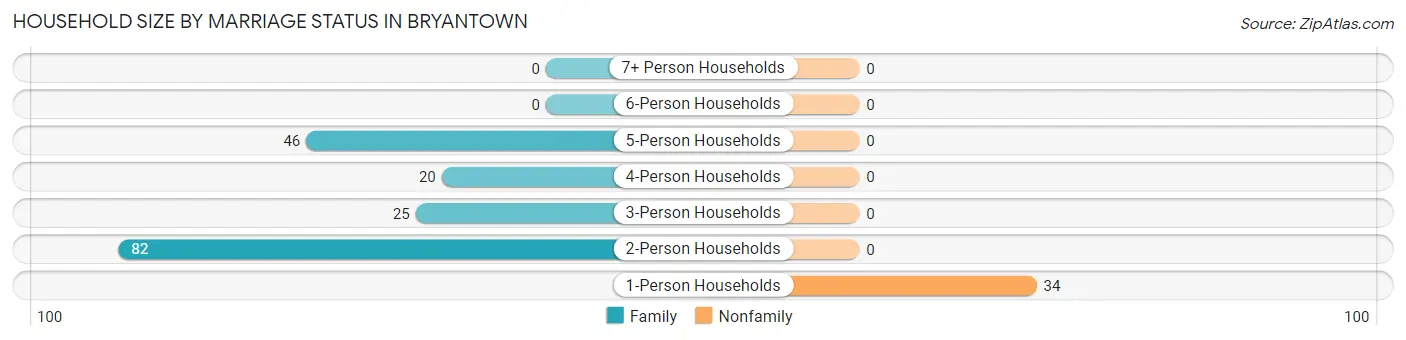
| Household Size | Family Households | Nonfamily Households |
| 1-Person Households | - | 34 (16.4%) |
| 2-Person Households | 82 (39.6%) | 0 (0.0%) |
| 3-Person Households | 25 (12.1%) | 0 (0.0%) |
| 4-Person Households | 20 (9.7%) | 0 (0.0%) |
| 5-Person Households | 46 (22.2%) | 0 (0.0%) |
| 6-Person Households | 0 (0.0%) | 0 (0.0%) |
| 7+ Person Households | 0 (0.0%) | 0 (0.0%) |
| Total | 173 (83.6%) | 34 (16.4%) |
Female Fertility in Bryantown
Fertility by Age in Bryantown
| Age Bracket | Women with Births | Births / 1,000 Women |
| 15 to 19 years | 0 (0.0%) | 0.0 |
| 20 to 34 years | 0 (0.0%) | 0.0 |
| 35 to 50 years | 0 (0.0%) | 0.0 |
| Total | 0 (0.0%) | 0.0 |
Fertility by Age by Marriage Status in Bryantown
| Age Bracket | Married | Unmarried |
| 15 to 19 years | 0 (0.0%) | 0 (0.0%) |
| 20 to 34 years | 0 (0.0%) | 0 (0.0%) |
| 35 to 50 years | 0 (0.0%) | 0 (0.0%) |
| Total | 0 (0.0%) | 0 (0.0%) |
Fertility by Education in Bryantown

| Educational Attainment | Women with Births | Births / 1,000 Women |
| Less than High School | 0 (0.0%) | 0.0 |
| High School Diploma | 0 (0.0%) | 0.0 |
| College or Associate's Degree | 0 (0.0%) | 0.0 |
| Bachelor's Degree | 0 (0.0%) | 0.0 |
| Graduate Degree | 0 (0.0%) | 0.0 |
| Total | 0 (0.0%) | 0.0 |
Fertility by Education by Marriage Status in Bryantown
| Educational Attainment | Married | Unmarried |
| Less than High School | 0 (0.0%) | 0 (0.0%) |
| High School Diploma | 0 (0.0%) | 0 (0.0%) |
| College or Associate's Degree | 0 (0.0%) | 0 (0.0%) |
| Bachelor's Degree | 0 (0.0%) | 0 (0.0%) |
| Graduate Degree | 0 (0.0%) | 0 (0.0%) |
| Total | 0 (0.0%) | 0 (0.0%) |
Employment Characteristics in Bryantown
Employment by Class of Employer in Bryantown
Among the 320 employed individuals in Bryantown, private company employees (152 | 47.5%), federal government employees (136 | 42.5%), and self-employed (incorporated) (20 | 6.2%) make up the most common classes of employment.
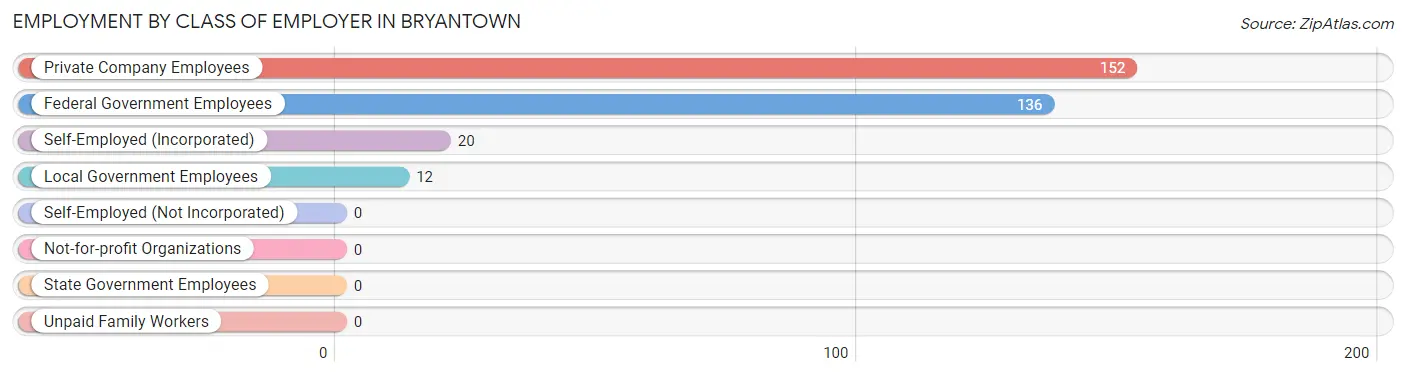
| Employer Class | # Employees | % Employees |
| Private Company Employees | 152 | 47.5% |
| Self-Employed (Incorporated) | 20 | 6.2% |
| Self-Employed (Not Incorporated) | 0 | 0.0% |
| Not-for-profit Organizations | 0 | 0.0% |
| Local Government Employees | 12 | 3.7% |
| State Government Employees | 0 | 0.0% |
| Federal Government Employees | 136 | 42.5% |
| Unpaid Family Workers | 0 | 0.0% |
| Total | 320 | 100.0% |
Employment Status by Age in Bryantown
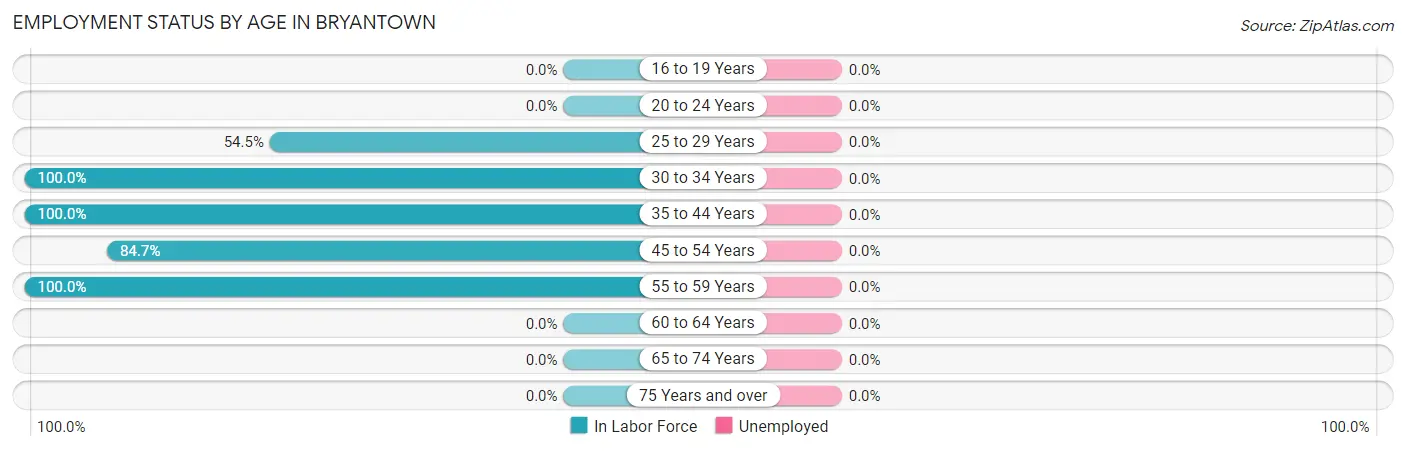
| Age Bracket | In Labor Force | Unemployed |
| 16 to 19 Years | 0 (0.0%) | 0 (0.0%) |
| 20 to 24 Years | 0 (0.0%) | 0 (0.0%) |
| 25 to 29 Years | 12 (54.5%) | 0 (0.0%) |
| 30 to 34 Years | 37 (100.0%) | 0 (0.0%) |
| 35 to 44 Years | 129 (100.0%) | 0 (0.0%) |
| 45 to 54 Years | 122 (84.7%) | 0 (0.0%) |
| 55 to 59 Years | 20 (100.0%) | 0 (0.0%) |
| 60 to 64 Years | 0 (0.0%) | 0 (0.0%) |
| 65 to 74 Years | 0 (0.0%) | 0 (0.0%) |
| 75 Years and over | 0 (0.0%) | 0 (0.0%) |
| Total | 320 (66.1%) | 0 (0.0%) |
Employment Status by Educational Attainment in Bryantown
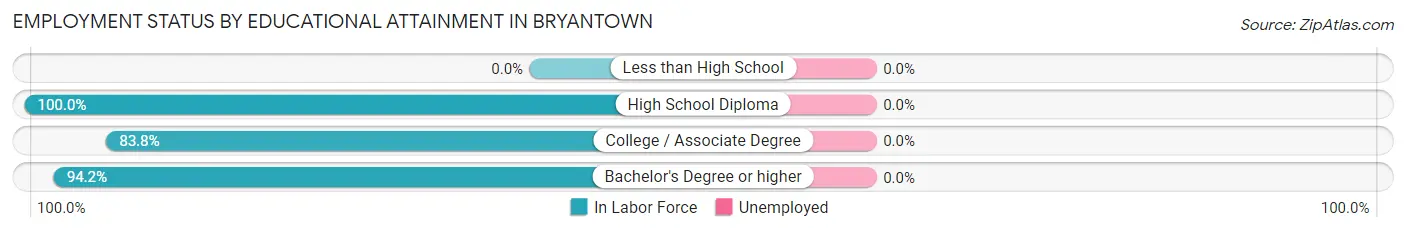
| Educational Attainment | In Labor Force | Unemployed |
| Less than High School | 0 (0.0%) | 0 (0.0%) |
| High School Diploma | 43 (100.0%) | 0 (0.0%) |
| College / Associate Degree | 114 (83.8%) | 0 (0.0%) |
| Bachelor's Degree or higher | 163 (94.2%) | 0 (0.0%) |
| Total | 320 (90.9%) | 0 (0.0%) |
Employment Occupations by Sex in Bryantown
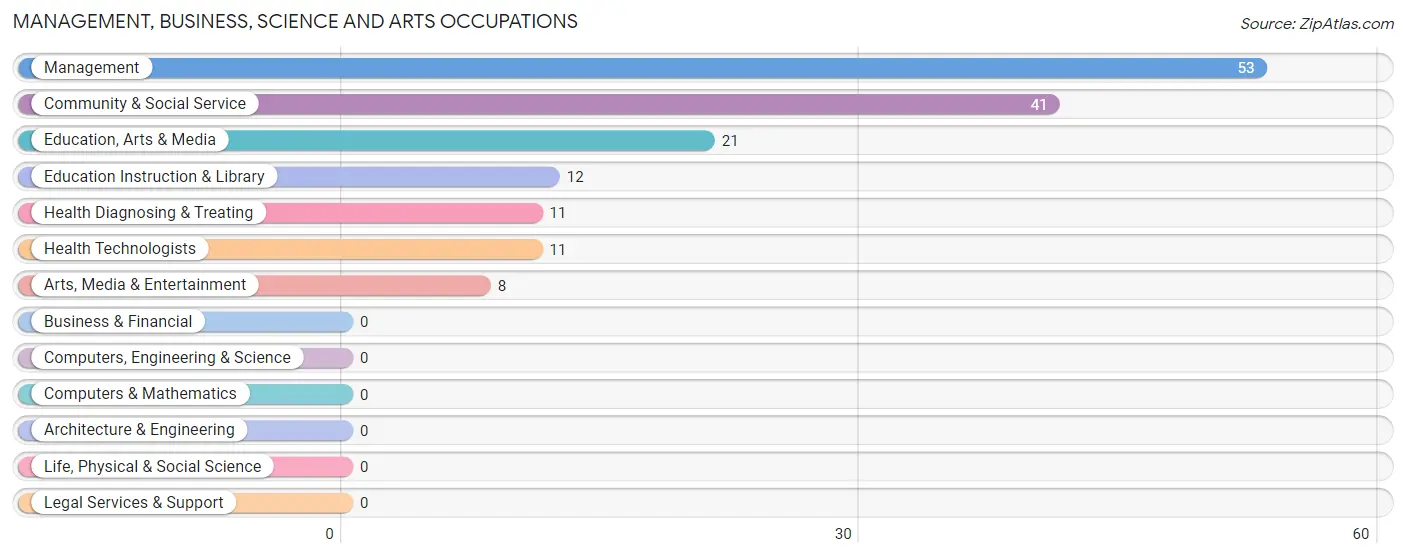
Management, Business, Science and Arts Occupations
The most common Management, Business, Science and Arts occupations in Bryantown are Management (53 | 18.7%), Community & Social Service (41 | 14.4%), Education, Arts & Media (21 | 7.4%), Education Instruction & Library (12 | 4.2%), and Health Diagnosing & Treating (11 | 3.9%).
Management, Business, Science and Arts Occupations by Sex
Within the Management, Business, Science and Arts occupations in Bryantown, the most male-oriented occupations are Education Instruction & Library (100.0%), Management (49.1%), and Community & Social Service (29.3%), while the most female-oriented occupations are Education, Arts & Media (100.0%), Arts, Media & Entertainment (100.0%), and Health Diagnosing & Treating (100.0%).
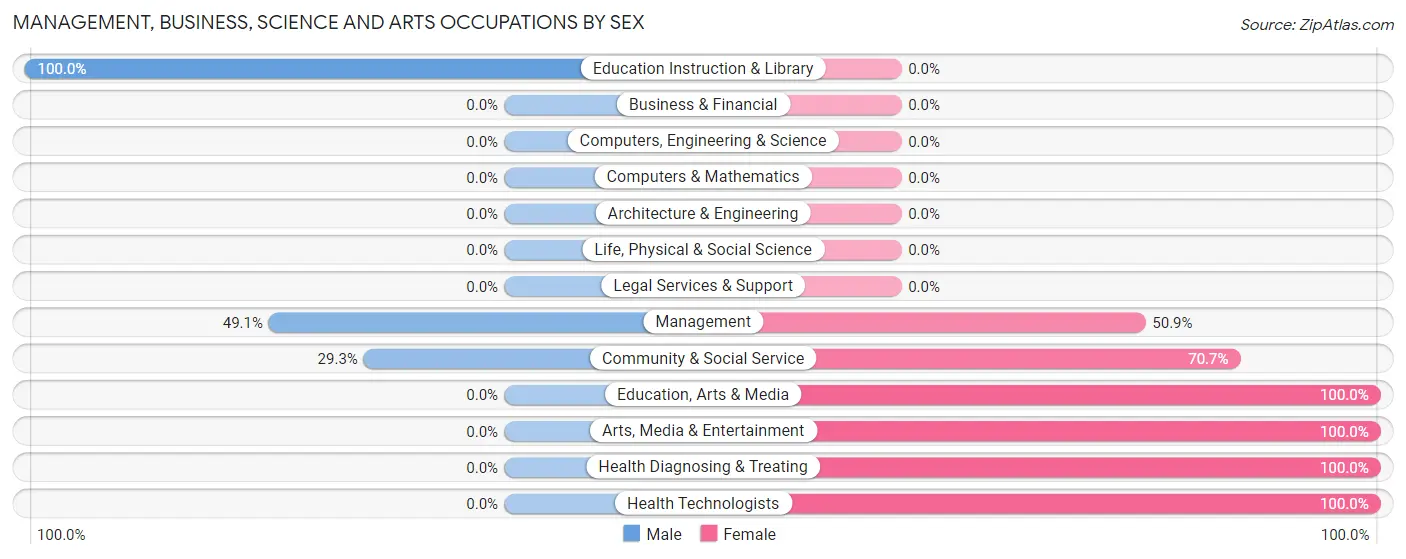
| Occupation | Male | Female |
| Management | 26 (49.1%) | 27 (50.9%) |
| Business & Financial | 0 (0.0%) | 0 (0.0%) |
| Computers, Engineering & Science | 0 (0.0%) | 0 (0.0%) |
| Computers & Mathematics | 0 (0.0%) | 0 (0.0%) |
| Architecture & Engineering | 0 (0.0%) | 0 (0.0%) |
| Life, Physical & Social Science | 0 (0.0%) | 0 (0.0%) |
| Community & Social Service | 12 (29.3%) | 29 (70.7%) |
| Education, Arts & Media | 0 (0.0%) | 21 (100.0%) |
| Legal Services & Support | 0 (0.0%) | 0 (0.0%) |
| Education Instruction & Library | 12 (100.0%) | 0 (0.0%) |
| Arts, Media & Entertainment | 0 (0.0%) | 8 (100.0%) |
| Health Diagnosing & Treating | 0 (0.0%) | 11 (100.0%) |
| Health Technologists | 0 (0.0%) | 11 (100.0%) |
| Total (Category) | 38 (36.2%) | 67 (63.8%) |
| Total (Overall) | 112 (39.4%) | 172 (60.6%) |
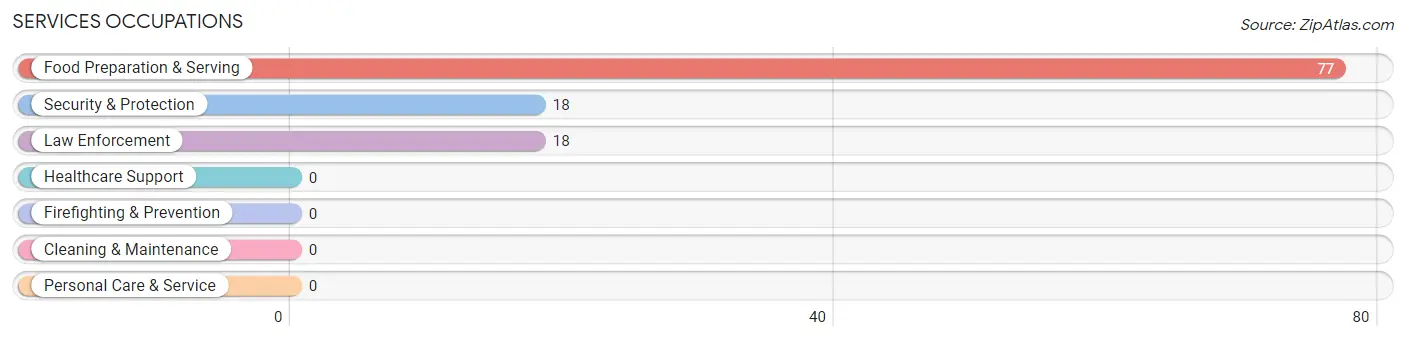
Services Occupations
The most common Services occupations in Bryantown are Food Preparation & Serving (77 | 27.1%), Security & Protection (18 | 6.3%), and Law Enforcement (18 | 6.3%).
Services Occupations by Sex
Within the Services occupations in Bryantown, the most male-oriented occupations are Security & Protection (55.6%), Law Enforcement (55.6%), and Food Preparation & Serving (15.6%), while the most female-oriented occupations are Food Preparation & Serving (84.4%), Security & Protection (44.4%), and Law Enforcement (44.4%).
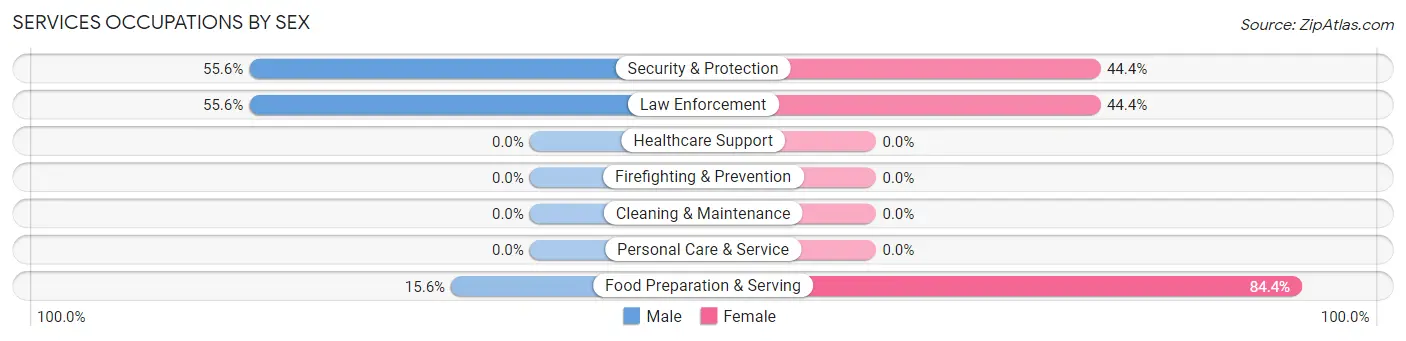
| Occupation | Male | Female |
| Healthcare Support | 0 (0.0%) | 0 (0.0%) |
| Security & Protection | 10 (55.6%) | 8 (44.4%) |
| Firefighting & Prevention | 0 (0.0%) | 0 (0.0%) |
| Law Enforcement | 10 (55.6%) | 8 (44.4%) |
| Food Preparation & Serving | 12 (15.6%) | 65 (84.4%) |
| Cleaning & Maintenance | 0 (0.0%) | 0 (0.0%) |
| Personal Care & Service | 0 (0.0%) | 0 (0.0%) |
| Total (Category) | 22 (23.2%) | 73 (76.8%) |
| Total (Overall) | 112 (39.4%) | 172 (60.6%) |
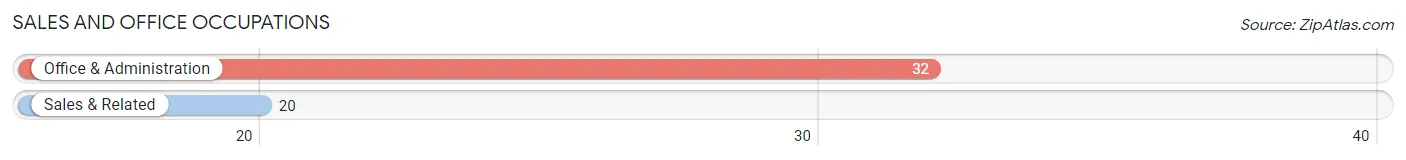
Sales and Office Occupations
The most common Sales and Office occupations in Bryantown are Office & Administration (32 | 11.3%), and Sales & Related (20 | 7.0%).
Sales and Office Occupations by Sex
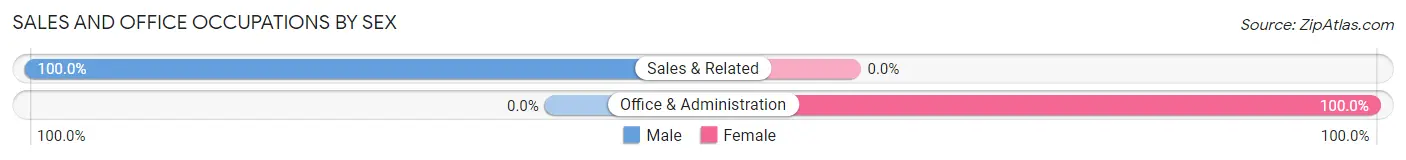
| Occupation | Male | Female |
| Sales & Related | 20 (100.0%) | 0 (0.0%) |
| Office & Administration | 0 (0.0%) | 32 (100.0%) |
| Total (Category) | 20 (38.5%) | 32 (61.5%) |
| Total (Overall) | 112 (39.4%) | 172 (60.6%) |
Natural Resources, Construction and Maintenance Occupations
The most common Natural Resources, Construction and Maintenance occupations in Bryantown are , and Construction & Extraction (22 | 7.7%).
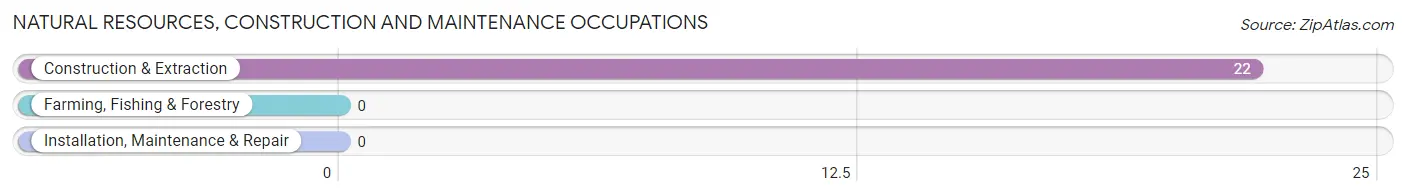
Natural Resources, Construction and Maintenance Occupations by Sex
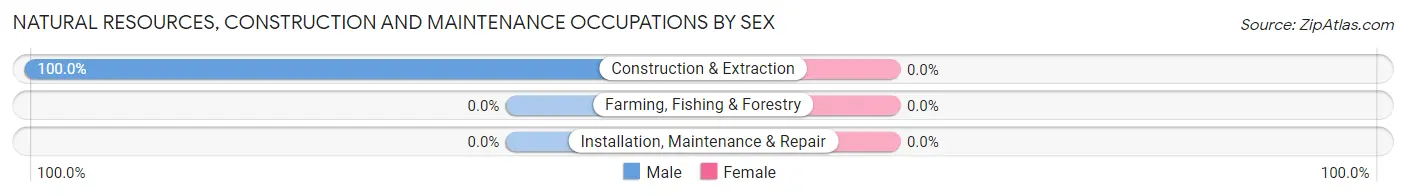
| Occupation | Male | Female |
| Farming, Fishing & Forestry | 0 (0.0%) | 0 (0.0%) |
| Construction & Extraction | 22 (100.0%) | 0 (0.0%) |
| Installation, Maintenance & Repair | 0 (0.0%) | 0 (0.0%) |
| Total (Category) | 22 (100.0%) | 0 (0.0%) |
| Total (Overall) | 112 (39.4%) | 172 (60.6%) |
Production, Transportation and Moving Occupations
The most common Production, Transportation and Moving occupations in Bryantown are , and Material Moving (10 | 3.5%).
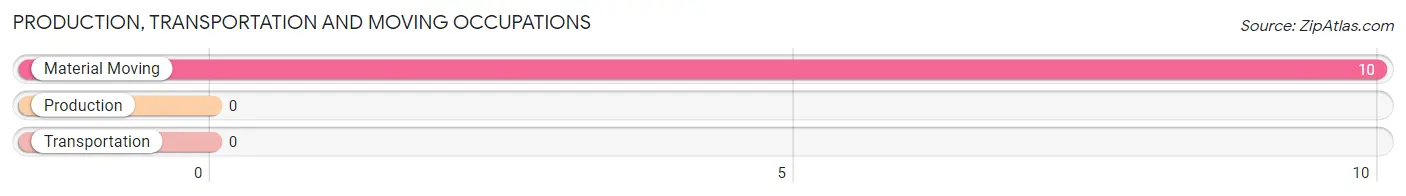
Production, Transportation and Moving Occupations by Sex
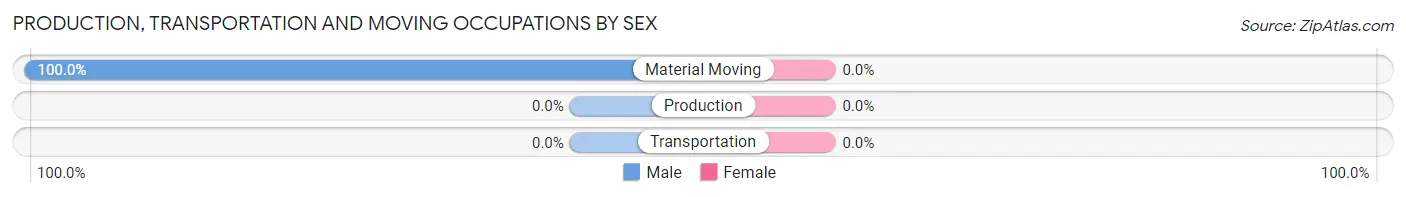
| Occupation | Male | Female |
| Production | 0 (0.0%) | 0 (0.0%) |
| Transportation | 0 (0.0%) | 0 (0.0%) |
| Material Moving | 10 (100.0%) | 0 (0.0%) |
| Total (Category) | 10 (100.0%) | 0 (0.0%) |
| Total (Overall) | 112 (39.4%) | 172 (60.6%) |
Employment Industries by Sex in Bryantown
Employment Industries in Bryantown
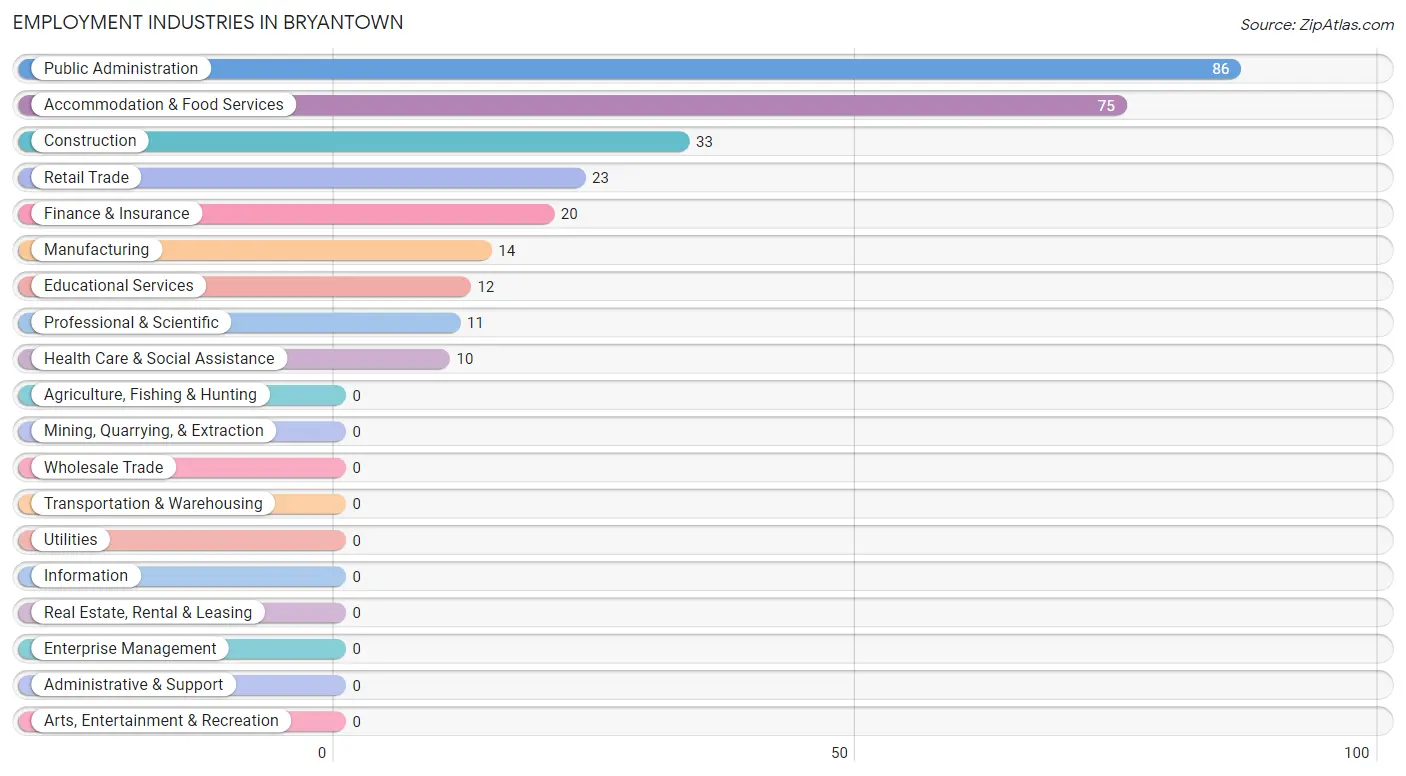
The major employment industries in Bryantown include Public Administration (86 | 30.3%), Accommodation & Food Services (75 | 26.4%), Construction (33 | 11.6%), Retail Trade (23 | 8.1%), and Finance & Insurance (20 | 7.0%).
Employment Industries by Sex in Bryantown
The Bryantown industries that see more men than women are Manufacturing (100.0%), Finance & Insurance (100.0%), and Educational Services (100.0%), whereas the industries that tend to have a higher number of women are Professional & Scientific (100.0%), Health Care & Social Assistance (100.0%), and Accommodation & Food Services (86.7%).
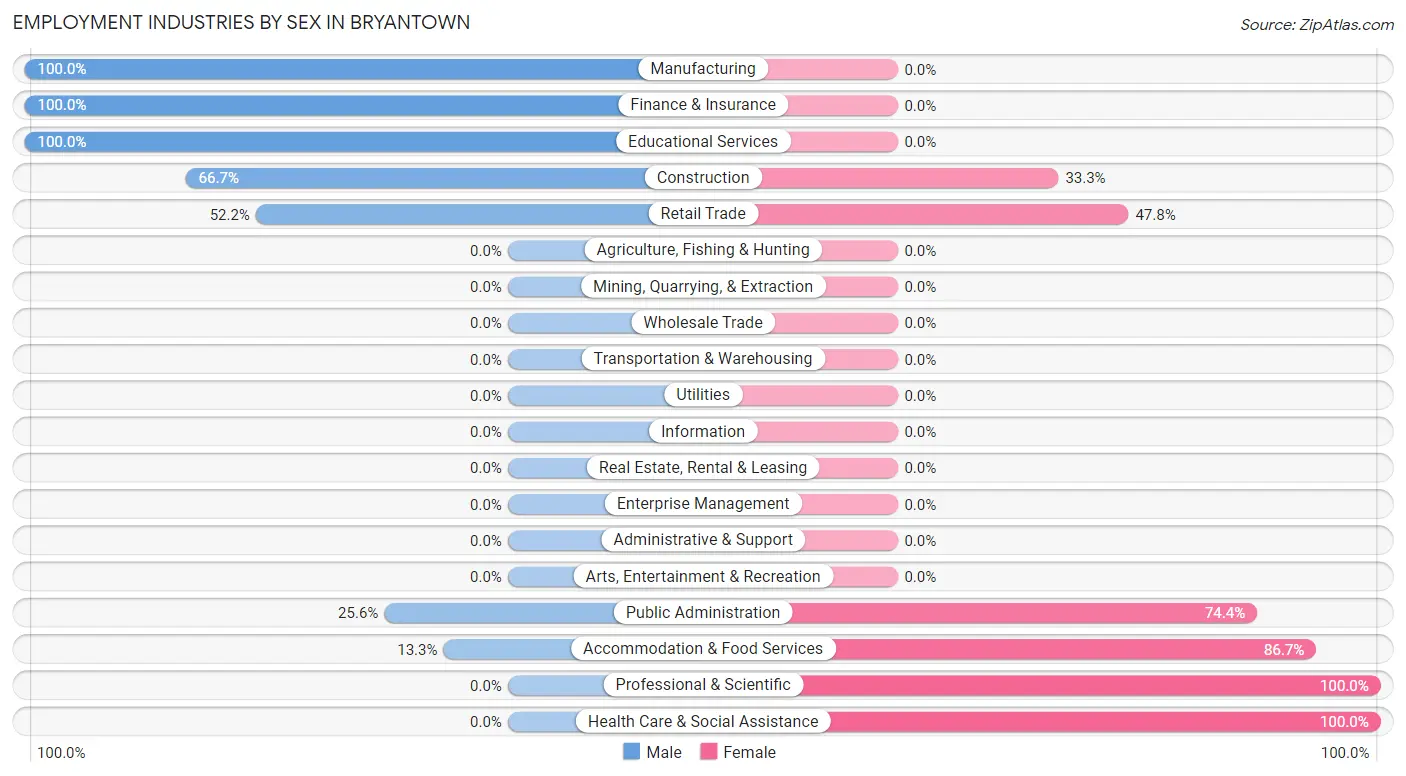
| Industry | Male | Female |
| Agriculture, Fishing & Hunting | 0 (0.0%) | 0 (0.0%) |
| Mining, Quarrying, & Extraction | 0 (0.0%) | 0 (0.0%) |
| Construction | 22 (66.7%) | 11 (33.3%) |
| Manufacturing | 14 (100.0%) | 0 (0.0%) |
| Wholesale Trade | 0 (0.0%) | 0 (0.0%) |
| Retail Trade | 12 (52.2%) | 11 (47.8%) |
| Transportation & Warehousing | 0 (0.0%) | 0 (0.0%) |
| Utilities | 0 (0.0%) | 0 (0.0%) |
| Information | 0 (0.0%) | 0 (0.0%) |
| Finance & Insurance | 20 (100.0%) | 0 (0.0%) |
| Real Estate, Rental & Leasing | 0 (0.0%) | 0 (0.0%) |
| Professional & Scientific | 0 (0.0%) | 11 (100.0%) |
| Enterprise Management | 0 (0.0%) | 0 (0.0%) |
| Administrative & Support | 0 (0.0%) | 0 (0.0%) |
| Educational Services | 12 (100.0%) | 0 (0.0%) |
| Health Care & Social Assistance | 0 (0.0%) | 10 (100.0%) |
| Arts, Entertainment & Recreation | 0 (0.0%) | 0 (0.0%) |
| Accommodation & Food Services | 10 (13.3%) | 65 (86.7%) |
| Public Administration | 22 (25.6%) | 64 (74.4%) |
| Total | 112 (39.4%) | 172 (60.6%) |
Education in Bryantown
School Enrollment in Bryantown
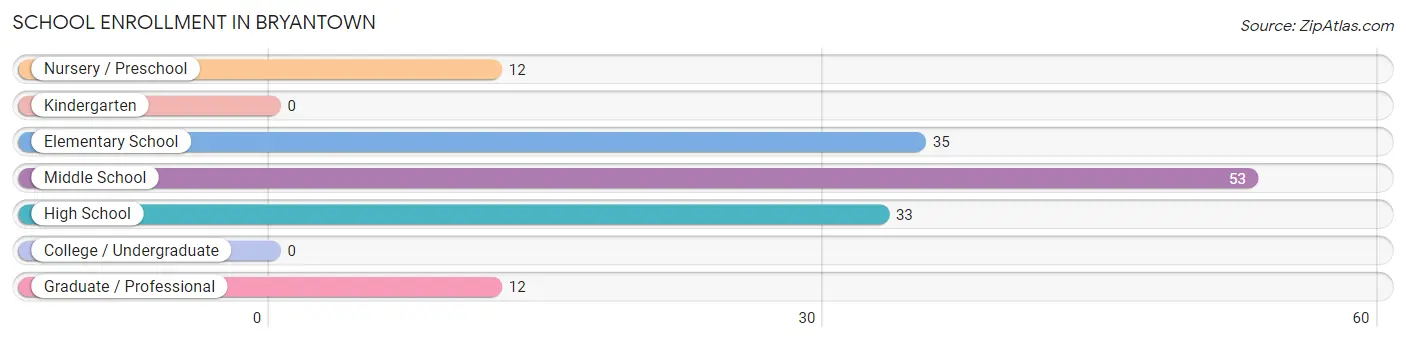
The most common levels of schooling among the 145 students in Bryantown are middle school (53 | 36.5%), elementary school (35 | 24.1%), and high school (33 | 22.8%).
| School Level | # Students | % Students |
| Nursery / Preschool | 12 | 8.3% |
| Kindergarten | 0 | 0.0% |
| Elementary School | 35 | 24.1% |
| Middle School | 53 | 36.5% |
| High School | 33 | 22.8% |
| College / Undergraduate | 0 | 0.0% |
| Graduate / Professional | 12 | 8.3% |
| Total | 145 | 100.0% |
School Enrollment by Age by Funding Source in Bryantown
Out of a total of 145 students who are enrolled in schools in Bryantown, 21 (14.5%) attend a private institution, while the remaining 124 (85.5%) are enrolled in public schools. The age group of 3 to 4 year olds has the highest likelihood of being enrolled in private schools, with 12 (100.0% in the age bracket) enrolled. Conversely, the age group of 5 to 9 year old has the lowest likelihood of being enrolled in a private school, with 35 (100.0% in the age bracket) attending a public institution.
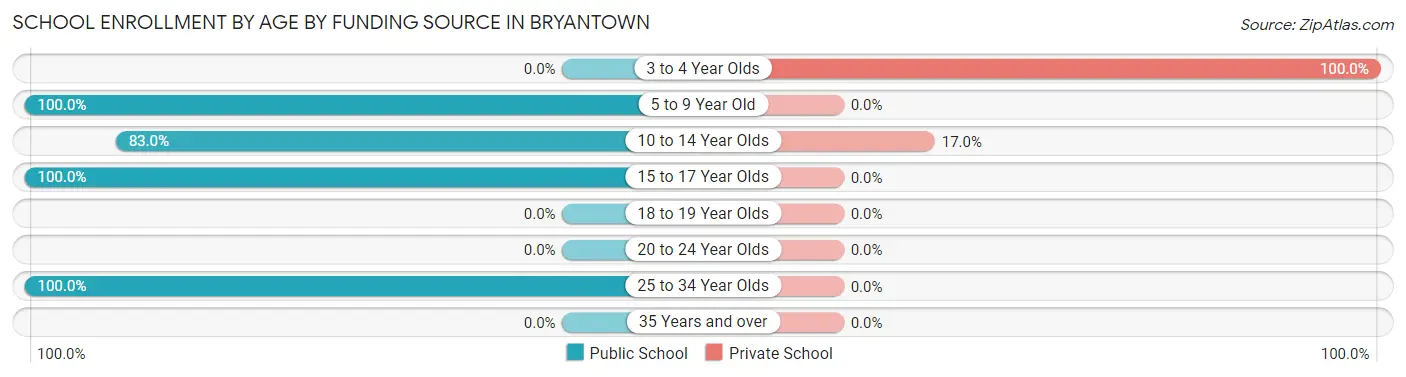
| Age Bracket | Public School | Private School |
| 3 to 4 Year Olds | 0 (0.0%) | 12 (100.0%) |
| 5 to 9 Year Old | 35 (100.0%) | 0 (0.0%) |
| 10 to 14 Year Olds | 44 (83.0%) | 9 (17.0%) |
| 15 to 17 Year Olds | 33 (100.0%) | 0 (0.0%) |
| 18 to 19 Year Olds | 0 (0.0%) | 0 (0.0%) |
| 20 to 24 Year Olds | 0 (0.0%) | 0 (0.0%) |
| 25 to 34 Year Olds | 12 (100.0%) | 0 (0.0%) |
| 35 Years and over | 0 (0.0%) | 0 (0.0%) |
| Total | 124 (85.5%) | 21 (14.5%) |
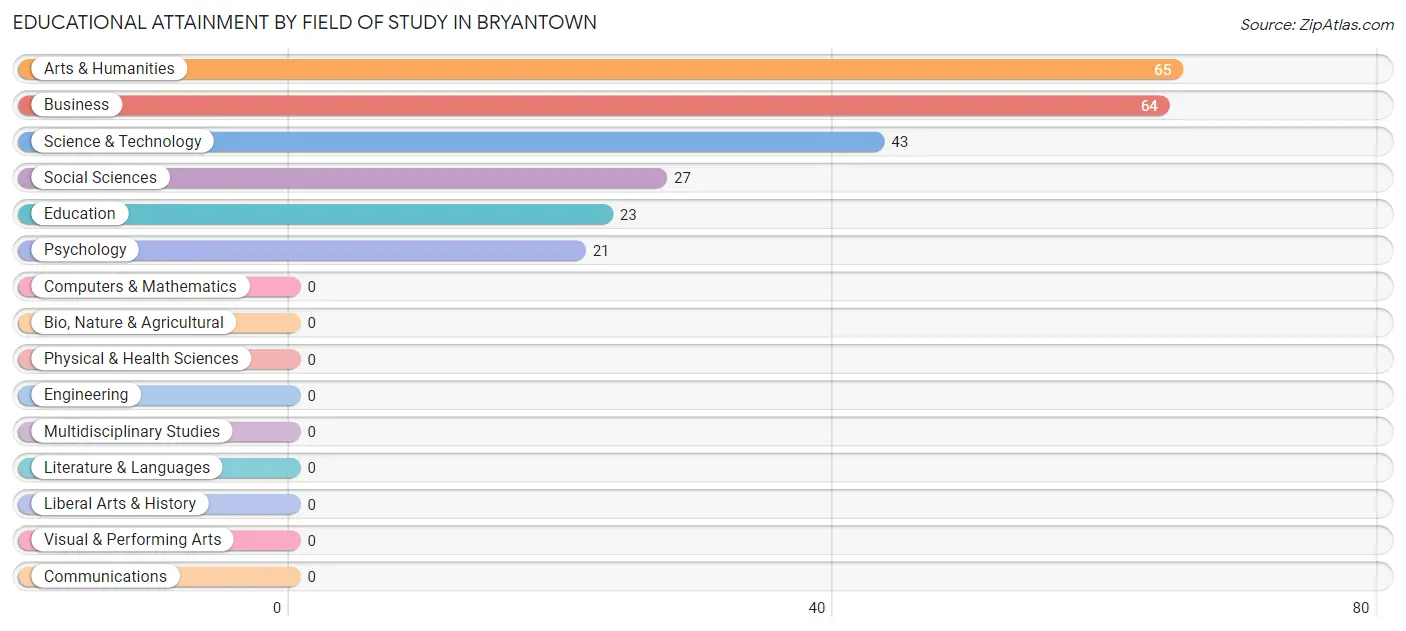
Educational Attainment by Field of Study in Bryantown
Arts & humanities (65 | 26.8%), business (64 | 26.3%), science & technology (43 | 17.7%), social sciences (27 | 11.1%), and education (23 | 9.5%) are the most common fields of study among 243 individuals in Bryantown who have obtained a bachelor's degree or higher.
| Field of Study | # Graduates | % Graduates |
| Computers & Mathematics | 0 | 0.0% |
| Bio, Nature & Agricultural | 0 | 0.0% |
| Physical & Health Sciences | 0 | 0.0% |
| Psychology | 21 | 8.6% |
| Social Sciences | 27 | 11.1% |
| Engineering | 0 | 0.0% |
| Multidisciplinary Studies | 0 | 0.0% |
| Science & Technology | 43 | 17.7% |
| Business | 64 | 26.3% |
| Education | 23 | 9.5% |
| Literature & Languages | 0 | 0.0% |
| Liberal Arts & History | 0 | 0.0% |
| Visual & Performing Arts | 0 | 0.0% |
| Communications | 0 | 0.0% |
| Arts & Humanities | 65 | 26.8% |
| Total | 243 | 100.0% |
Transportation & Commute in Bryantown
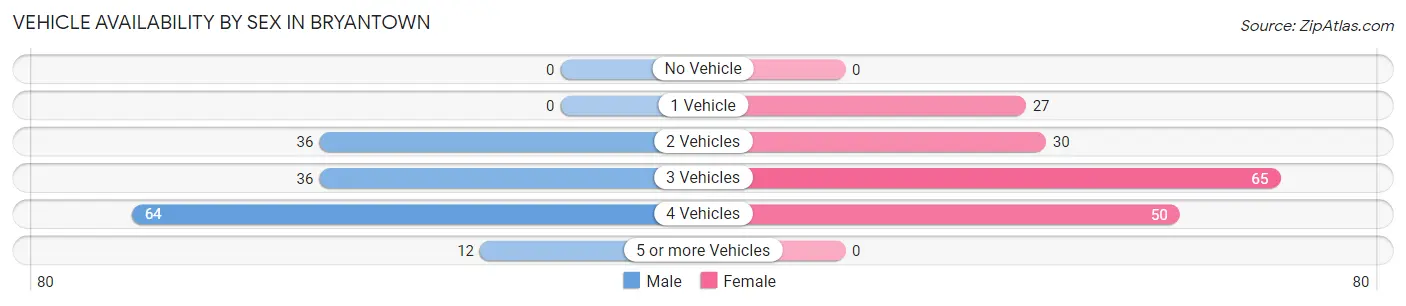
Vehicle Availability by Sex in Bryantown
The most prevalent vehicle ownership categories in Bryantown are males with 4 vehicles (64, accounting for 43.2%) and females with 4 vehicles (50, making up 37.2%).
| Vehicles Available | Male | Female |
| No Vehicle | 0 (0.0%) | 0 (0.0%) |
| 1 Vehicle | 0 (0.0%) | 27 (15.7%) |
| 2 Vehicles | 36 (24.3%) | 30 (17.4%) |
| 3 Vehicles | 36 (24.3%) | 65 (37.8%) |
| 4 Vehicles | 64 (43.2%) | 50 (29.1%) |
| 5 or more Vehicles | 12 (8.1%) | 0 (0.0%) |
| Total | 148 (100.0%) | 172 (100.0%) |
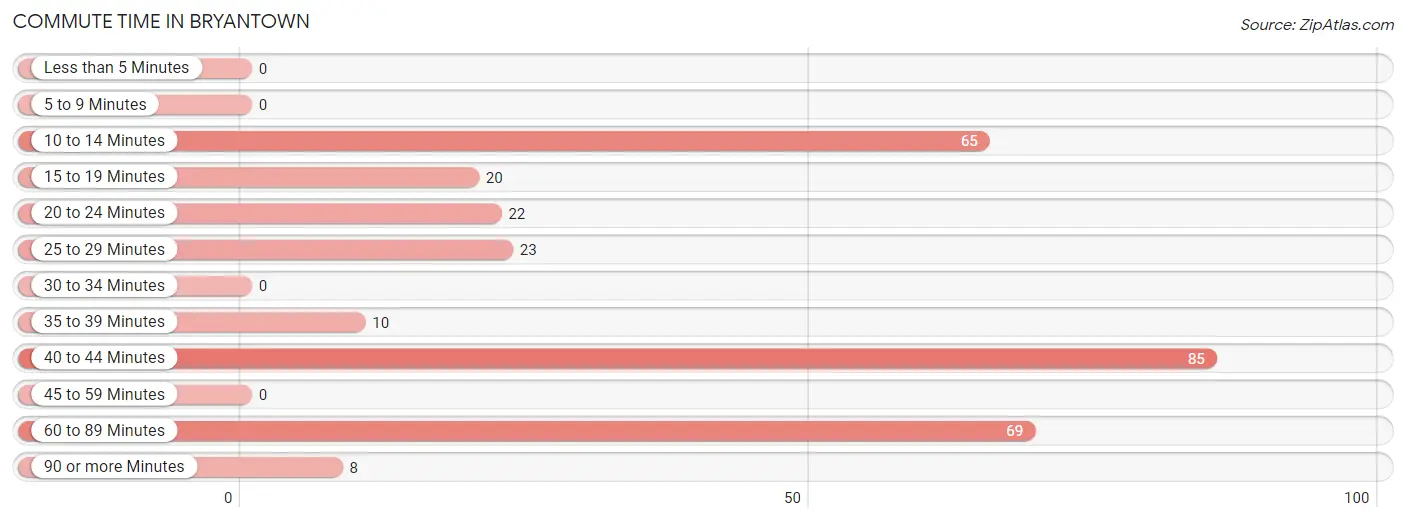
Commute Time in Bryantown
The most frequently occuring commute durations in Bryantown are 40 to 44 minutes (85 commuters, 28.1%), 60 to 89 minutes (69 commuters, 22.9%), and 10 to 14 minutes (65 commuters, 21.5%).
| Commute Time | # Commuters | % Commuters |
| Less than 5 Minutes | 0 | 0.0% |
| 5 to 9 Minutes | 0 | 0.0% |
| 10 to 14 Minutes | 65 | 21.5% |
| 15 to 19 Minutes | 20 | 6.6% |
| 20 to 24 Minutes | 22 | 7.3% |
| 25 to 29 Minutes | 23 | 7.6% |
| 30 to 34 Minutes | 0 | 0.0% |
| 35 to 39 Minutes | 10 | 3.3% |
| 40 to 44 Minutes | 85 | 28.1% |
| 45 to 59 Minutes | 0 | 0.0% |
| 60 to 89 Minutes | 69 | 22.9% |
| 90 or more Minutes | 8 | 2.6% |
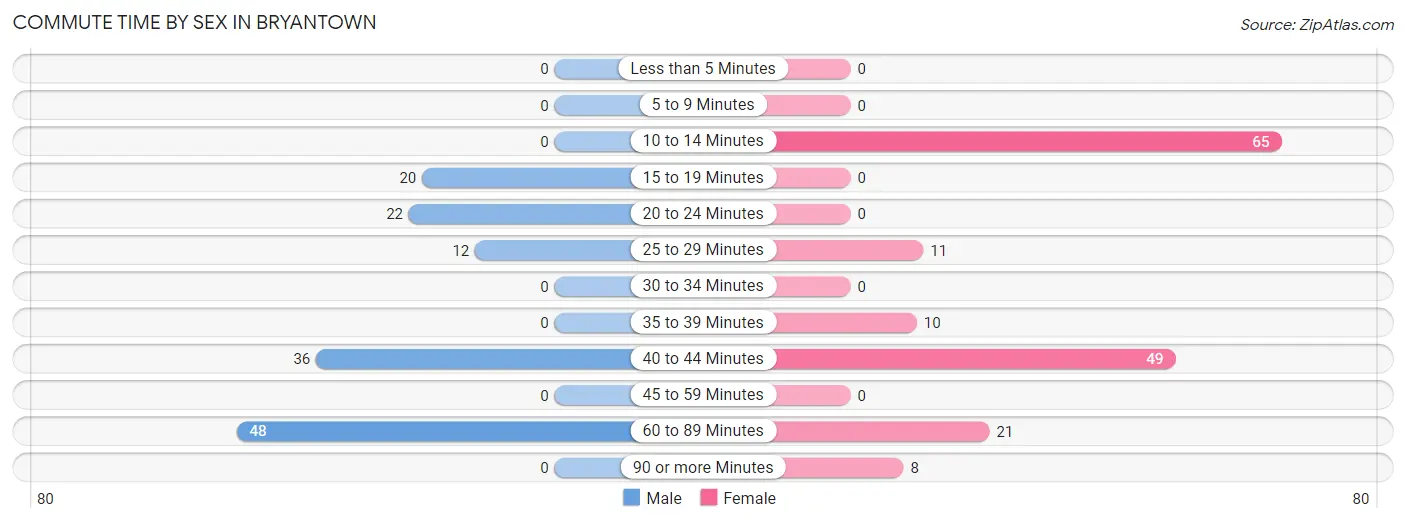
Commute Time by Sex in Bryantown
The most common commute times in Bryantown are 60 to 89 minutes (48 commuters, 34.8%) for males and 10 to 14 minutes (65 commuters, 39.6%) for females.
| Commute Time | Male | Female |
| Less than 5 Minutes | 0 (0.0%) | 0 (0.0%) |
| 5 to 9 Minutes | 0 (0.0%) | 0 (0.0%) |
| 10 to 14 Minutes | 0 (0.0%) | 65 (39.6%) |
| 15 to 19 Minutes | 20 (14.5%) | 0 (0.0%) |
| 20 to 24 Minutes | 22 (15.9%) | 0 (0.0%) |
| 25 to 29 Minutes | 12 (8.7%) | 11 (6.7%) |
| 30 to 34 Minutes | 0 (0.0%) | 0 (0.0%) |
| 35 to 39 Minutes | 0 (0.0%) | 10 (6.1%) |
| 40 to 44 Minutes | 36 (26.1%) | 49 (29.9%) |
| 45 to 59 Minutes | 0 (0.0%) | 0 (0.0%) |
| 60 to 89 Minutes | 48 (34.8%) | 21 (12.8%) |
| 90 or more Minutes | 0 (0.0%) | 8 (4.9%) |
Time of Departure to Work by Sex in Bryantown
The most frequent times of departure to work in Bryantown are 6:30 AM to 6:59 AM (48, 34.8%) for males and 8:00 AM to 8:29 AM (65, 39.6%) for females.
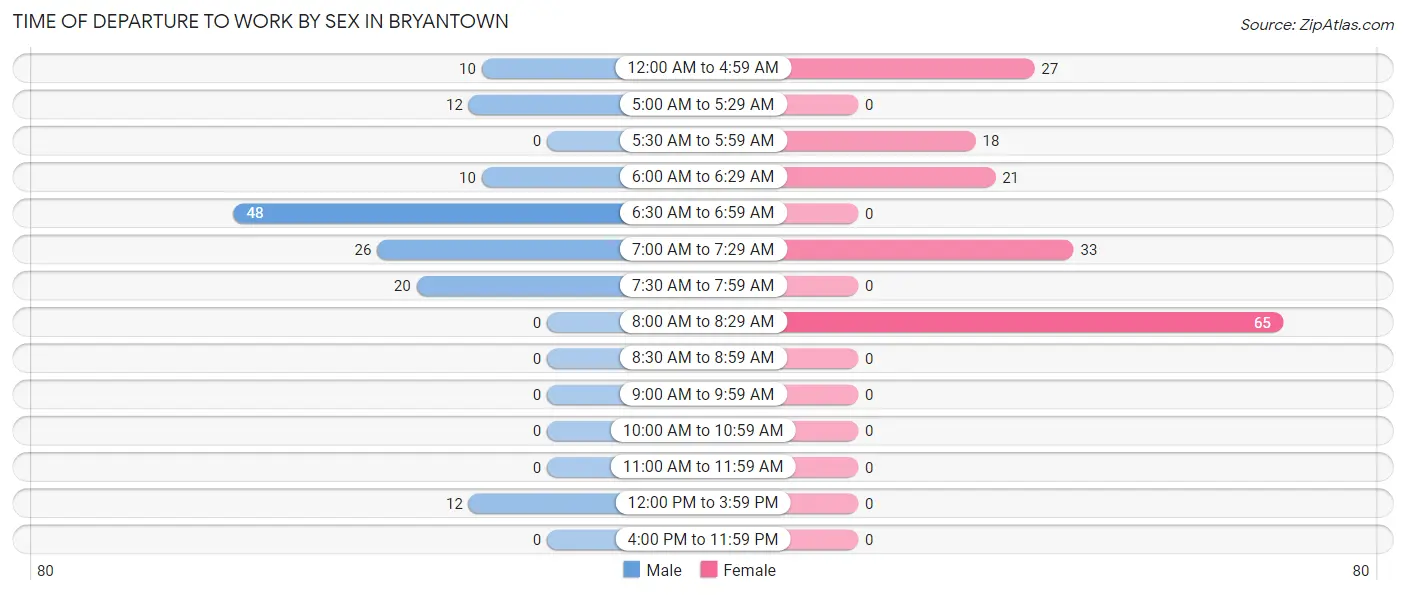
| Time of Departure | Male | Female |
| 12:00 AM to 4:59 AM | 10 (7.2%) | 27 (16.5%) |
| 5:00 AM to 5:29 AM | 12 (8.7%) | 0 (0.0%) |
| 5:30 AM to 5:59 AM | 0 (0.0%) | 18 (11.0%) |
| 6:00 AM to 6:29 AM | 10 (7.2%) | 21 (12.8%) |
| 6:30 AM to 6:59 AM | 48 (34.8%) | 0 (0.0%) |
| 7:00 AM to 7:29 AM | 26 (18.8%) | 33 (20.1%) |
| 7:30 AM to 7:59 AM | 20 (14.5%) | 0 (0.0%) |
| 8:00 AM to 8:29 AM | 0 (0.0%) | 65 (39.6%) |
| 8:30 AM to 8:59 AM | 0 (0.0%) | 0 (0.0%) |
| 9:00 AM to 9:59 AM | 0 (0.0%) | 0 (0.0%) |
| 10:00 AM to 10:59 AM | 0 (0.0%) | 0 (0.0%) |
| 11:00 AM to 11:59 AM | 0 (0.0%) | 0 (0.0%) |
| 12:00 PM to 3:59 PM | 12 (8.7%) | 0 (0.0%) |
| 4:00 PM to 11:59 PM | 0 (0.0%) | 0 (0.0%) |
| Total | 138 (100.0%) | 164 (100.0%) |
Housing Occupancy in Bryantown
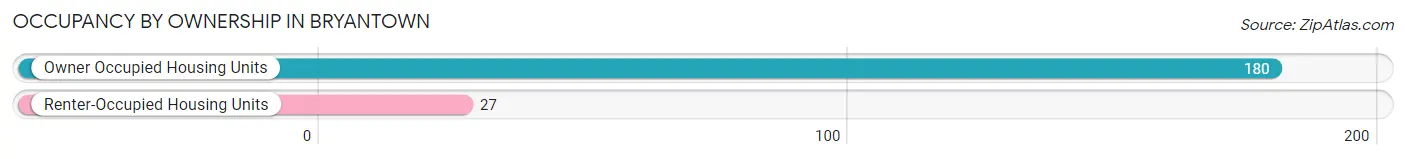
Occupancy by Ownership in Bryantown
Of the total 207 dwellings in Bryantown, owner-occupied units account for 180 (87.0%), while renter-occupied units make up 27 (13.0%).
| Occupancy | # Housing Units | % Housing Units |
| Owner Occupied Housing Units | 180 | 87.0% |
| Renter-Occupied Housing Units | 27 | 13.0% |
| Total Occupied Housing Units | 207 | 100.0% |
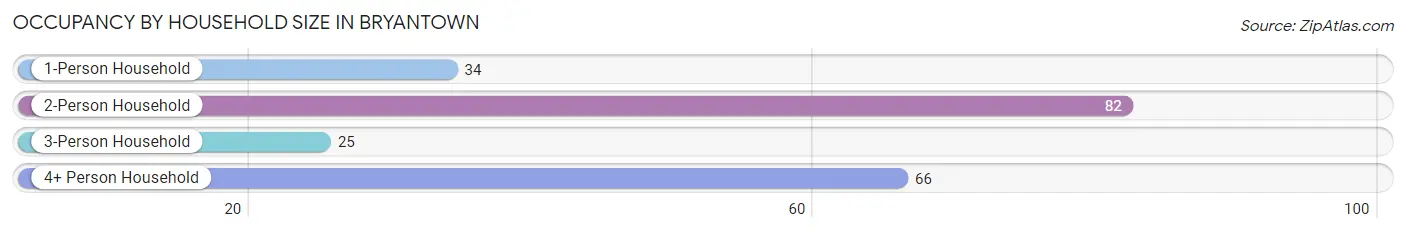
Occupancy by Household Size in Bryantown
| Household Size | # Housing Units | % Housing Units |
| 1-Person Household | 34 | 16.4% |
| 2-Person Household | 82 | 39.6% |
| 3-Person Household | 25 | 12.1% |
| 4+ Person Household | 66 | 31.9% |
| Total Housing Units | 207 | 100.0% |
Occupancy by Ownership by Household Size in Bryantown
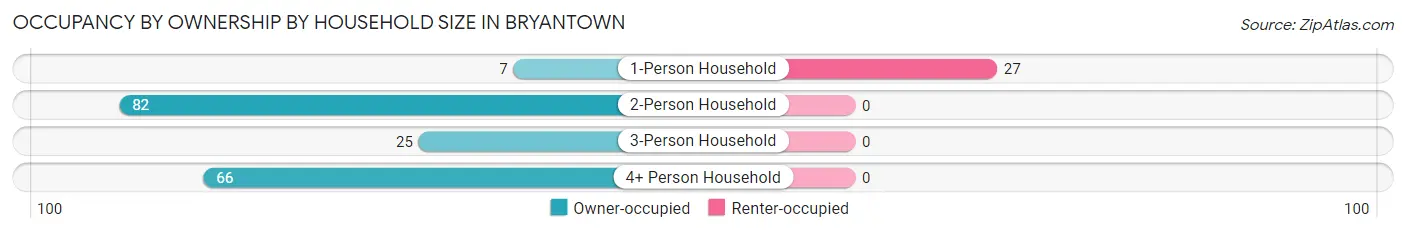
| Household Size | Owner-occupied | Renter-occupied |
| 1-Person Household | 7 (20.6%) | 27 (79.4%) |
| 2-Person Household | 82 (100.0%) | 0 (0.0%) |
| 3-Person Household | 25 (100.0%) | 0 (0.0%) |
| 4+ Person Household | 66 (100.0%) | 0 (0.0%) |
| Total Housing Units | 180 (87.0%) | 27 (13.0%) |
Occupancy by Educational Attainment in Bryantown
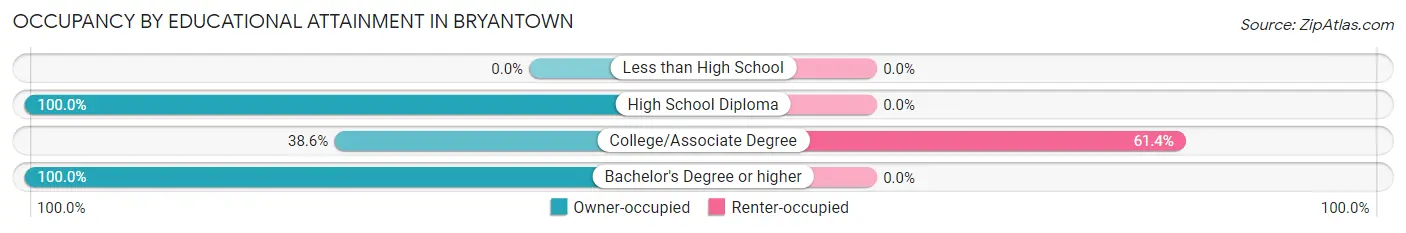
| Household Size | Owner-occupied | Renter-occupied |
| Less than High School | 0 (0.0%) | 0 (0.0%) |
| High School Diploma | 28 (100.0%) | 0 (0.0%) |
| College/Associate Degree | 17 (38.6%) | 27 (61.4%) |
| Bachelor's Degree or higher | 135 (100.0%) | 0 (0.0%) |
Occupancy by Age of Householder in Bryantown
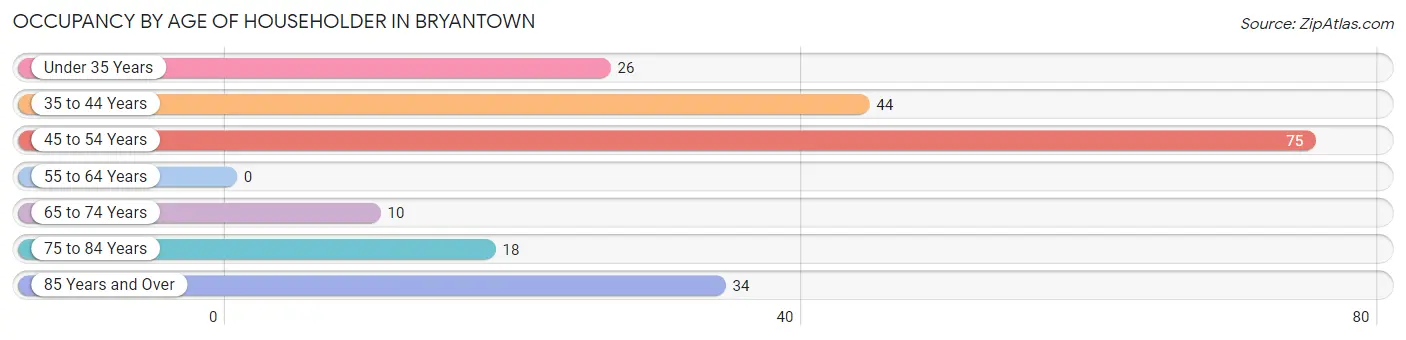
| Age Bracket | # Households | % Households |
| Under 35 Years | 26 | 12.6% |
| 35 to 44 Years | 44 | 21.3% |
| 45 to 54 Years | 75 | 36.2% |
| 55 to 64 Years | 0 | 0.0% |
| 65 to 74 Years | 10 | 4.8% |
| 75 to 84 Years | 18 | 8.7% |
| 85 Years and Over | 34 | 16.4% |
| Total | 207 | 100.0% |
Housing Finances in Bryantown
Median Income by Occupancy in Bryantown
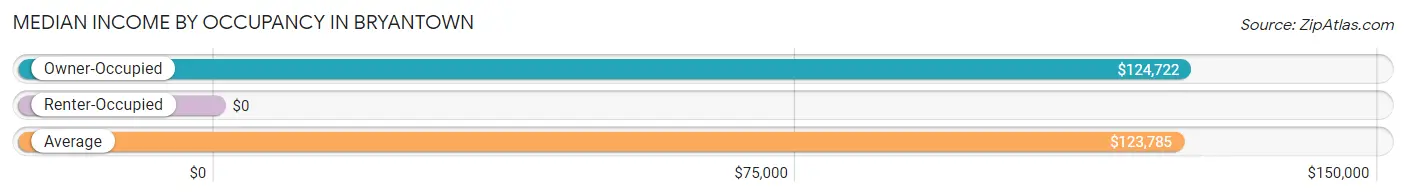
| Occupancy Type | # Households | Median Income |
| Owner-Occupied | 180 (87.0%) | $124,722 |
| Renter-Occupied | 27 (13.0%) | $0 |
| Average | 207 (100.0%) | $123,785 |
Occupancy by Householder Income Bracket in Bryantown
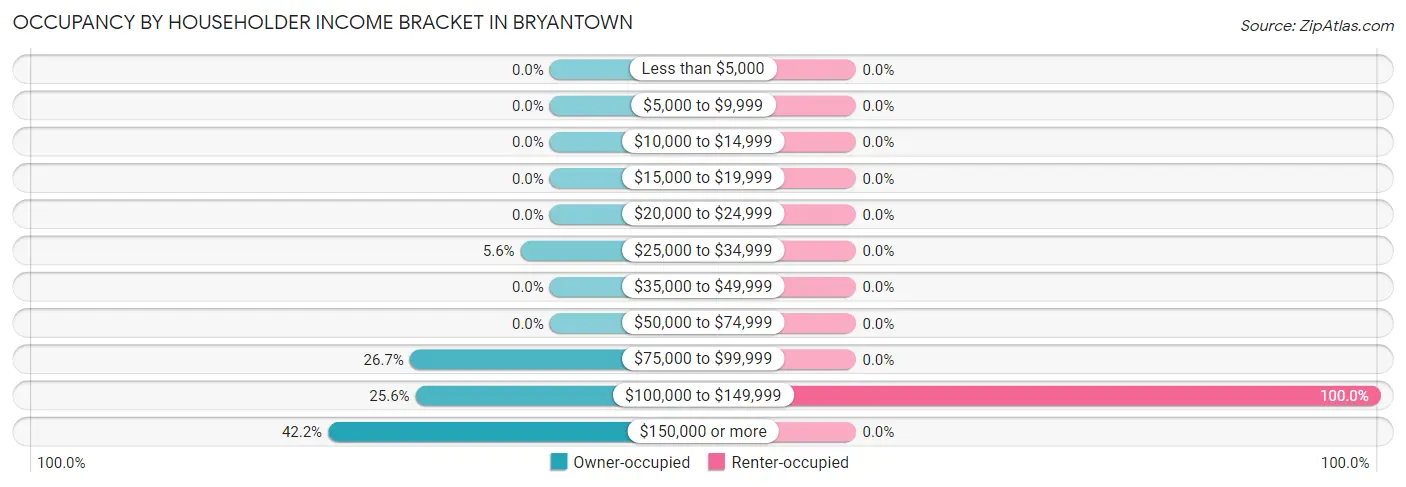
| Income Bracket | Owner-occupied | Renter-occupied |
| Less than $5,000 | 0 (0.0%) | 0 (0.0%) |
| $5,000 to $9,999 | 0 (0.0%) | 0 (0.0%) |
| $10,000 to $14,999 | 0 (0.0%) | 0 (0.0%) |
| $15,000 to $19,999 | 0 (0.0%) | 0 (0.0%) |
| $20,000 to $24,999 | 0 (0.0%) | 0 (0.0%) |
| $25,000 to $34,999 | 10 (5.6%) | 0 (0.0%) |
| $35,000 to $49,999 | 0 (0.0%) | 0 (0.0%) |
| $50,000 to $74,999 | 0 (0.0%) | 0 (0.0%) |
| $75,000 to $99,999 | 48 (26.7%) | 0 (0.0%) |
| $100,000 to $149,999 | 46 (25.6%) | 27 (100.0%) |
| $150,000 or more | 76 (42.2%) | 0 (0.0%) |
| Total | 180 (100.0%) | 27 (100.0%) |
Monthly Housing Cost Tiers in Bryantown
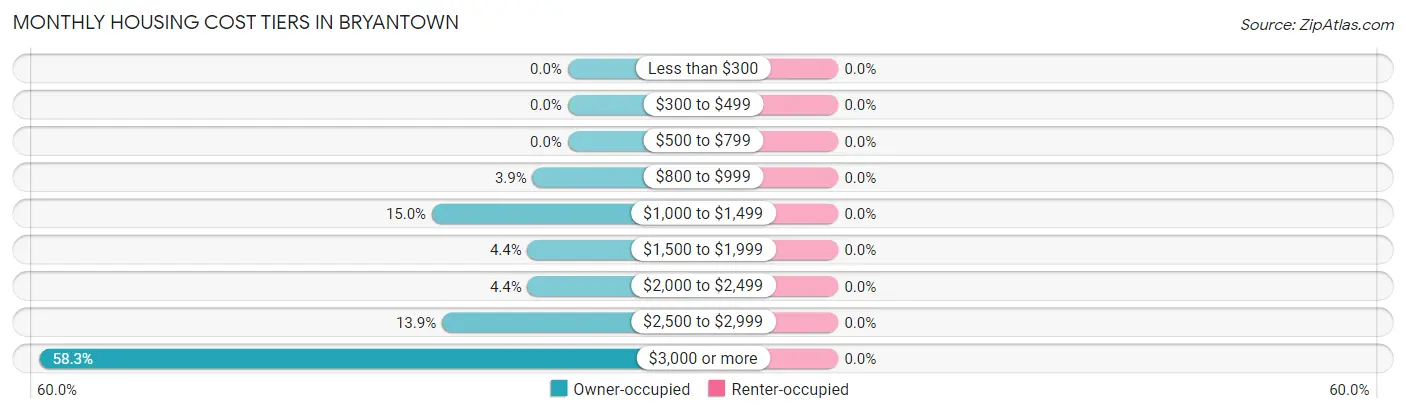
| Monthly Cost | Owner-occupied | Renter-occupied |
| Less than $300 | 0 (0.0%) | 0 (0.0%) |
| $300 to $499 | 0 (0.0%) | 0 (0.0%) |
| $500 to $799 | 0 (0.0%) | 0 (0.0%) |
| $800 to $999 | 7 (3.9%) | 0 (0.0%) |
| $1,000 to $1,499 | 27 (15.0%) | 0 (0.0%) |
| $1,500 to $1,999 | 8 (4.4%) | 0 (0.0%) |
| $2,000 to $2,499 | 8 (4.4%) | 0 (0.0%) |
| $2,500 to $2,999 | 25 (13.9%) | 0 (0.0%) |
| $3,000 or more | 105 (58.3%) | 0 (0.0%) |
| Total | 180 (100.0%) | 27 (100.0%) |
Physical Housing Characteristics in Bryantown
Housing Structures in Bryantown
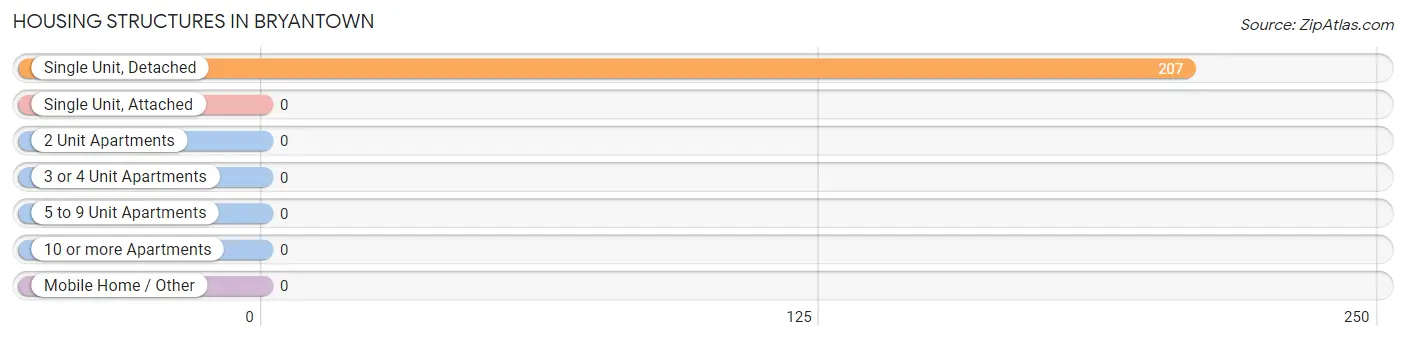
| Structure Type | # Housing Units | % Housing Units |
| Single Unit, Detached | 207 | 100.0% |
| Single Unit, Attached | 0 | 0.0% |
| 2 Unit Apartments | 0 | 0.0% |
| 3 or 4 Unit Apartments | 0 | 0.0% |
| 5 to 9 Unit Apartments | 0 | 0.0% |
| 10 or more Apartments | 0 | 0.0% |
| Mobile Home / Other | 0 | 0.0% |
| Total | 207 | 100.0% |
Housing Structures by Occupancy in Bryantown
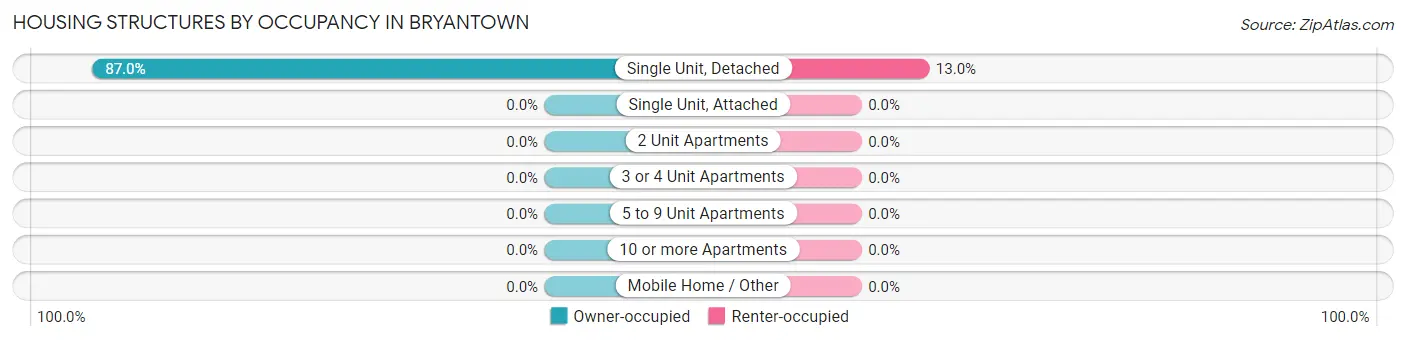
| Structure Type | Owner-occupied | Renter-occupied |
| Single Unit, Detached | 180 (87.0%) | 27 (13.0%) |
| Single Unit, Attached | 0 (0.0%) | 0 (0.0%) |
| 2 Unit Apartments | 0 (0.0%) | 0 (0.0%) |
| 3 or 4 Unit Apartments | 0 (0.0%) | 0 (0.0%) |
| 5 to 9 Unit Apartments | 0 (0.0%) | 0 (0.0%) |
| 10 or more Apartments | 0 (0.0%) | 0 (0.0%) |
| Mobile Home / Other | 0 (0.0%) | 0 (0.0%) |
| Total | 180 (87.0%) | 27 (13.0%) |
Housing Structures by Number of Rooms in Bryantown
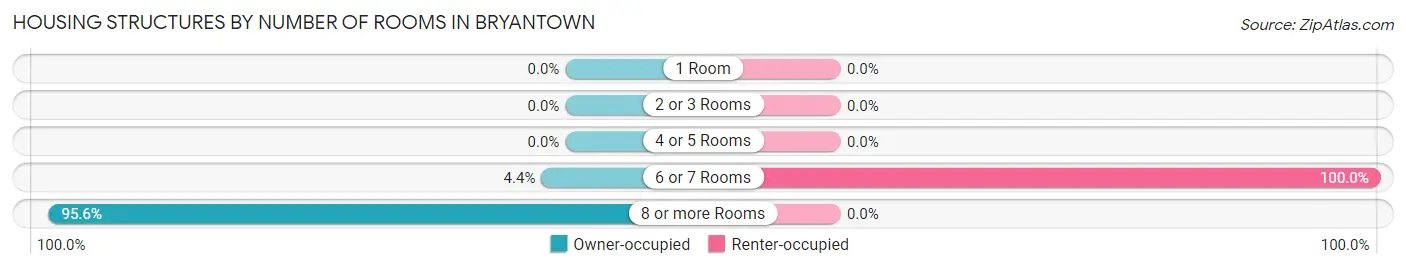
| Number of Rooms | Owner-occupied | Renter-occupied |
| 1 Room | 0 (0.0%) | 0 (0.0%) |
| 2 or 3 Rooms | 0 (0.0%) | 0 (0.0%) |
| 4 or 5 Rooms | 0 (0.0%) | 0 (0.0%) |
| 6 or 7 Rooms | 8 (4.4%) | 27 (100.0%) |
| 8 or more Rooms | 172 (95.6%) | 0 (0.0%) |
| Total | 180 (100.0%) | 27 (100.0%) |
Housing Structure by Heating Type in Bryantown
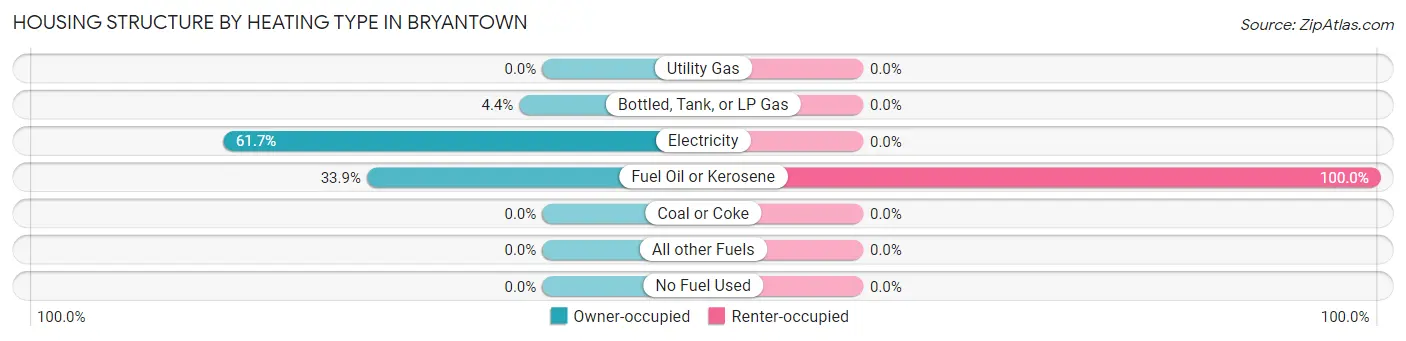
| Heating Type | Owner-occupied | Renter-occupied |
| Utility Gas | 0 (0.0%) | 0 (0.0%) |
| Bottled, Tank, or LP Gas | 8 (4.4%) | 0 (0.0%) |
| Electricity | 111 (61.7%) | 0 (0.0%) |
| Fuel Oil or Kerosene | 61 (33.9%) | 27 (100.0%) |
| Coal or Coke | 0 (0.0%) | 0 (0.0%) |
| All other Fuels | 0 (0.0%) | 0 (0.0%) |
| No Fuel Used | 0 (0.0%) | 0 (0.0%) |
| Total | 180 (100.0%) | 27 (100.0%) |
Household Vehicle Usage in Bryantown
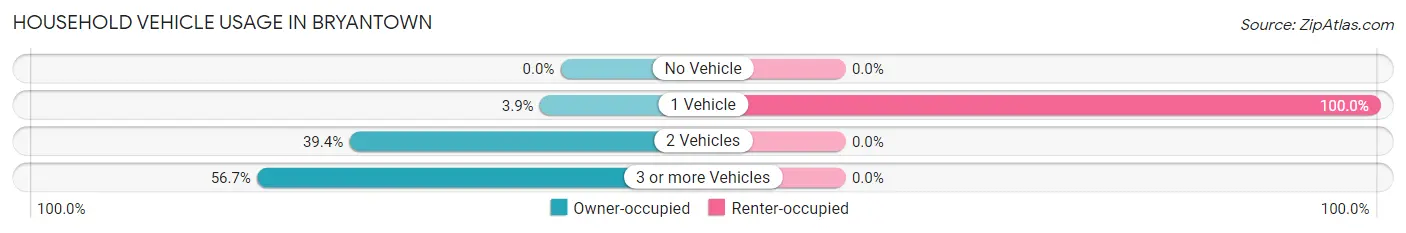
| Vehicles per Household | Owner-occupied | Renter-occupied |
| No Vehicle | 0 (0.0%) | 0 (0.0%) |
| 1 Vehicle | 7 (3.9%) | 27 (100.0%) |
| 2 Vehicles | 71 (39.4%) | 0 (0.0%) |
| 3 or more Vehicles | 102 (56.7%) | 0 (0.0%) |
| Total | 180 (100.0%) | 27 (100.0%) |
Real Estate & Mortgages in Bryantown
Real Estate and Mortgage Overview in Bryantown
| Characteristic | Without Mortgage | With Mortgage |
| Housing Units | 34 | 146 |
| Median Property Value | - | - |
| Median Household Income | - | - |
| Monthly Housing Costs | - | - |
| Real Estate Taxes | - | - |
Property Value by Mortgage Status in Bryantown
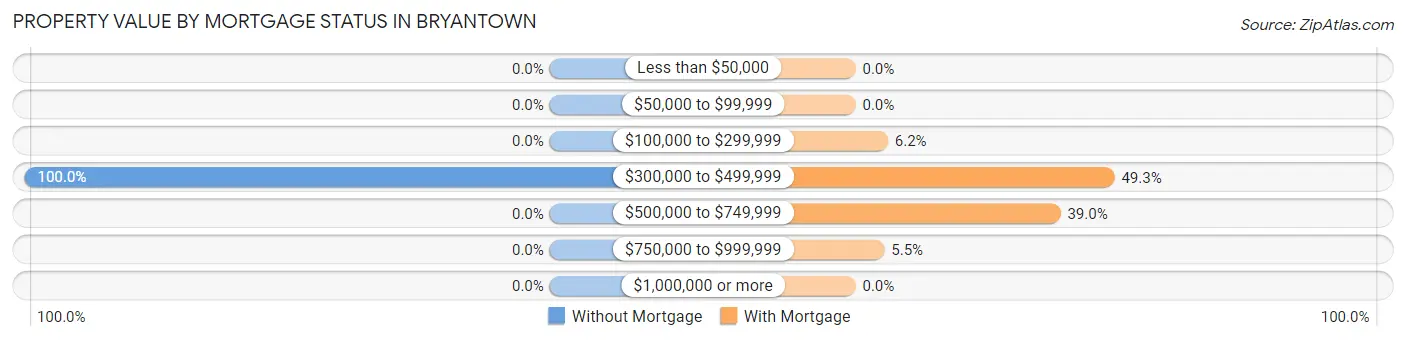
| Property Value | Without Mortgage | With Mortgage |
| Less than $50,000 | 0 (0.0%) | 0 (0.0%) |
| $50,000 to $99,999 | 0 (0.0%) | 0 (0.0%) |
| $100,000 to $299,999 | 0 (0.0%) | 9 (6.2%) |
| $300,000 to $499,999 | 34 (100.0%) | 72 (49.3%) |
| $500,000 to $749,999 | 0 (0.0%) | 57 (39.0%) |
| $750,000 to $999,999 | 0 (0.0%) | 8 (5.5%) |
| $1,000,000 or more | 0 (0.0%) | 0 (0.0%) |
| Total | 34 (100.0%) | 146 (100.0%) |
Household Income by Mortgage Status in Bryantown
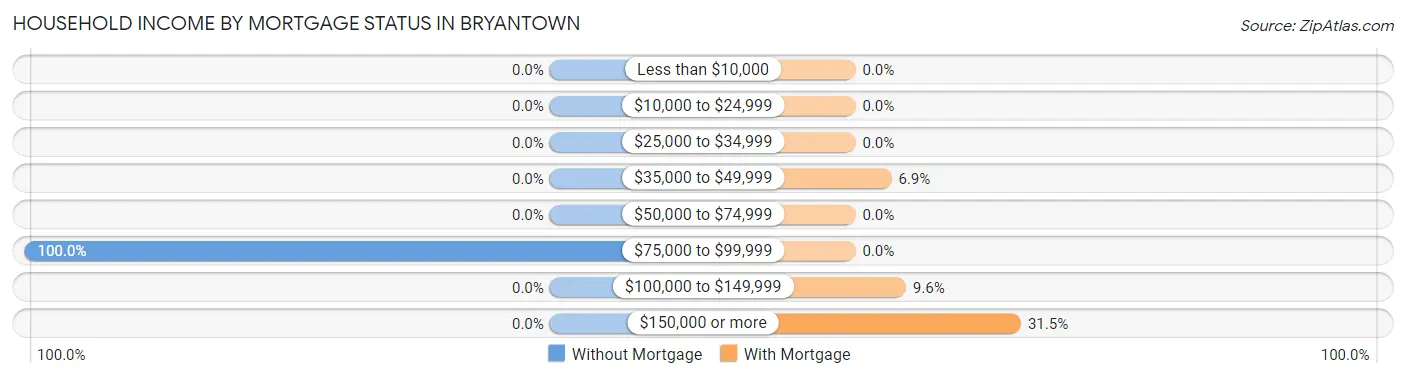
| Household Income | Without Mortgage | With Mortgage |
| Less than $10,000 | 0 (0.0%) | 0 (0.0%) |
| $10,000 to $24,999 | 0 (0.0%) | 0 (0.0%) |
| $25,000 to $34,999 | 0 (0.0%) | 0 (0.0%) |
| $35,000 to $49,999 | 0 (0.0%) | 10 (6.9%) |
| $50,000 to $74,999 | 0 (0.0%) | 0 (0.0%) |
| $75,000 to $99,999 | 34 (100.0%) | 0 (0.0%) |
| $100,000 to $149,999 | 0 (0.0%) | 14 (9.6%) |
| $150,000 or more | 0 (0.0%) | 46 (31.5%) |
| Total | 34 (100.0%) | 146 (100.0%) |
Property Value to Household Income Ratio in Bryantown
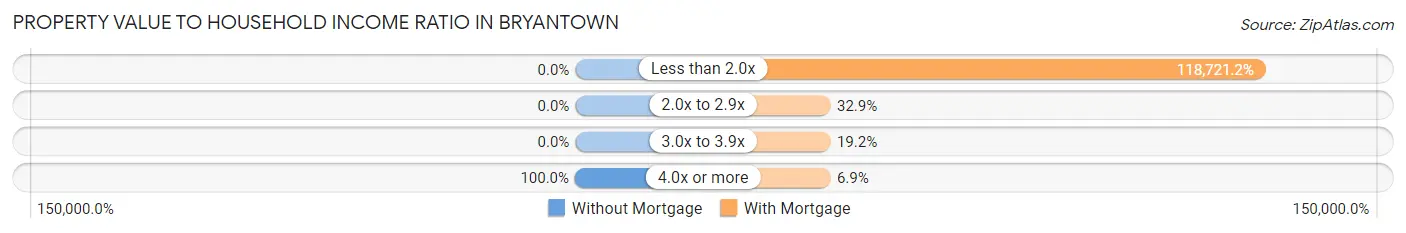
| Value-to-Income Ratio | Without Mortgage | With Mortgage |
| Less than 2.0x | 0 (0.0%) | 173,333 (118,721.2%) |
| 2.0x to 2.9x | 0 (0.0%) | 48 (32.9%) |
| 3.0x to 3.9x | 0 (0.0%) | 28 (19.2%) |
| 4.0x or more | 34 (100.0%) | 10 (6.9%) |
| Total | 34 (100.0%) | 146 (100.0%) |
Real Estate Taxes by Mortgage Status in Bryantown
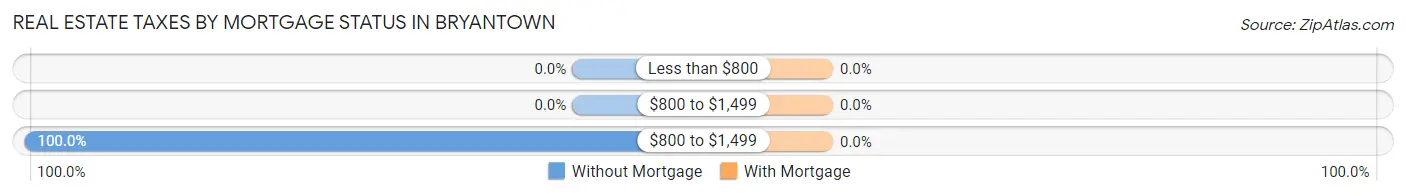
| Property Taxes | Without Mortgage | With Mortgage |
| Less than $800 | 0 (0.0%) | 0 (0.0%) |
| $800 to $1,499 | 0 (0.0%) | 0 (0.0%) |
| $800 to $1,499 | 34 (100.0%) | 0 (0.0%) |
| Total | 34 (100.0%) | 146 (100.0%) |
Health & Disability in Bryantown
Health Insurance Coverage by Age in Bryantown
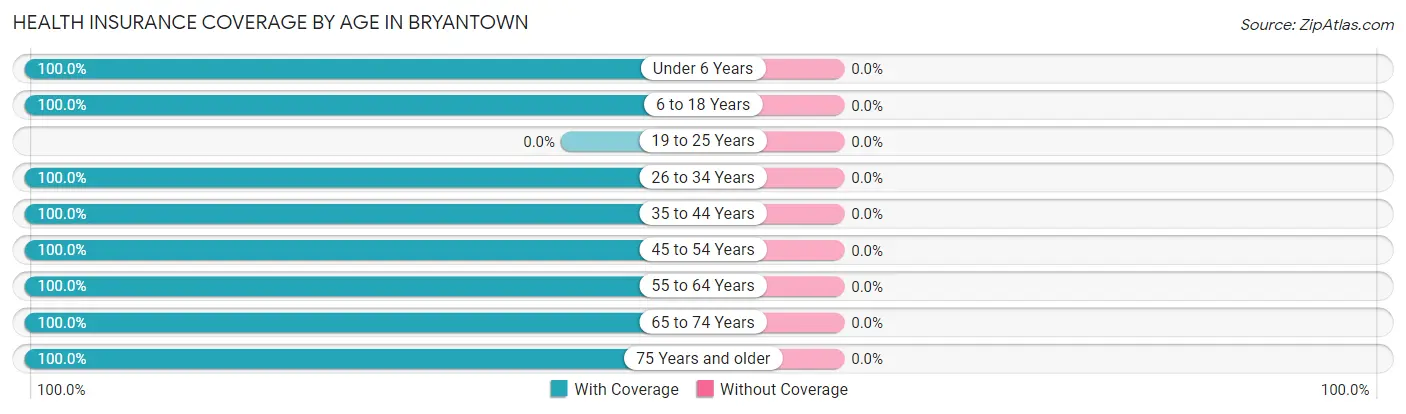
| Age Bracket | With Coverage | Without Coverage |
| Under 6 Years | 48 (100.0%) | 0 (0.0%) |
| 6 to 18 Years | 121 (100.0%) | 0 (0.0%) |
| 19 to 25 Years | 0 (0.0%) | 0 (0.0%) |
| 26 to 34 Years | 59 (100.0%) | 0 (0.0%) |
| 35 to 44 Years | 93 (100.0%) | 0 (0.0%) |
| 45 to 54 Years | 144 (100.0%) | 0 (0.0%) |
| 55 to 64 Years | 20 (100.0%) | 0 (0.0%) |
| 65 to 74 Years | 19 (100.0%) | 0 (0.0%) |
| 75 Years and older | 80 (100.0%) | 0 (0.0%) |
| Total | 584 (100.0%) | 0 (0.0%) |
Health Insurance Coverage by Citizenship Status in Bryantown
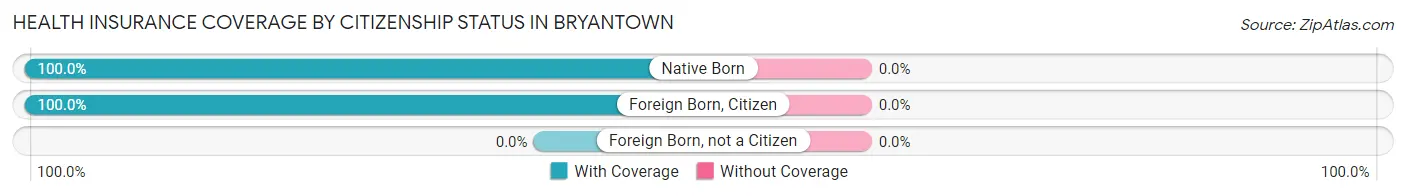
| Citizenship Status | With Coverage | Without Coverage |
| Native Born | 48 (100.0%) | 0 (0.0%) |
| Foreign Born, Citizen | 121 (100.0%) | 0 (0.0%) |
| Foreign Born, not a Citizen | 0 (0.0%) | 0 (0.0%) |
Health Insurance Coverage by Household Income in Bryantown
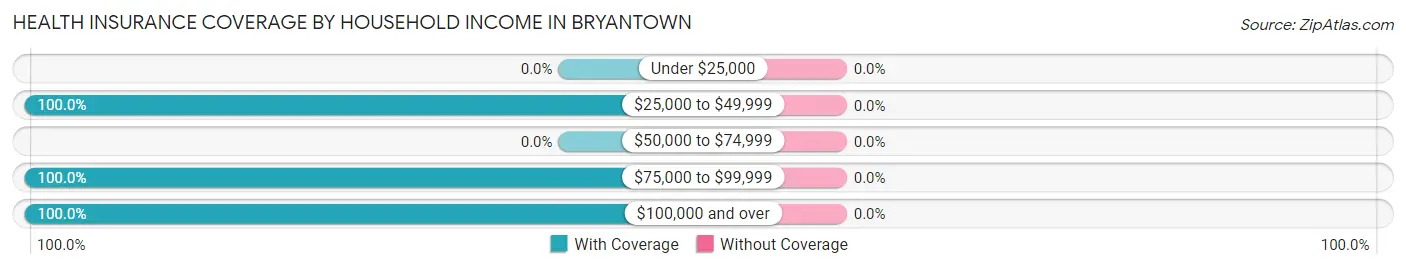
| Household Income | With Coverage | Without Coverage |
| Under $25,000 | 0 (0.0%) | 0 (0.0%) |
| $25,000 to $49,999 | 21 (100.0%) | 0 (0.0%) |
| $50,000 to $74,999 | 0 (0.0%) | 0 (0.0%) |
| $75,000 to $99,999 | 98 (100.0%) | 0 (0.0%) |
| $100,000 and over | 465 (100.0%) | 0 (0.0%) |
Public vs Private Health Insurance Coverage by Age in Bryantown
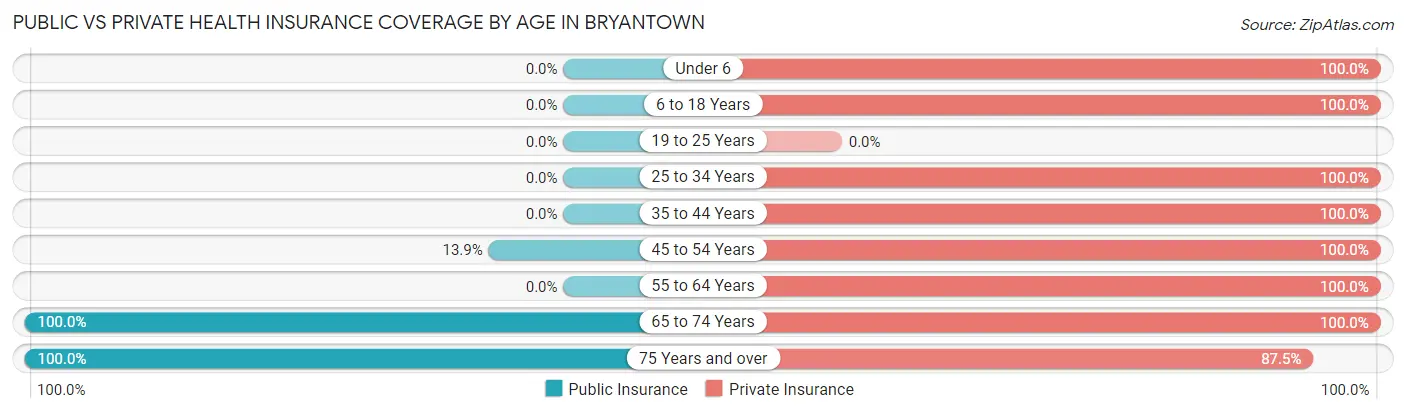
| Age Bracket | Public Insurance | Private Insurance |
| Under 6 | 0 (0.0%) | 48 (100.0%) |
| 6 to 18 Years | 0 (0.0%) | 121 (100.0%) |
| 19 to 25 Years | 0 (0.0%) | 0 (0.0%) |
| 25 to 34 Years | 0 (0.0%) | 59 (100.0%) |
| 35 to 44 Years | 0 (0.0%) | 93 (100.0%) |
| 45 to 54 Years | 20 (13.9%) | 144 (100.0%) |
| 55 to 64 Years | 0 (0.0%) | 20 (100.0%) |
| 65 to 74 Years | 19 (100.0%) | 19 (100.0%) |
| 75 Years and over | 80 (100.0%) | 70 (87.5%) |
| Total | 119 (20.4%) | 574 (98.3%) |
Disability Status by Sex by Age in Bryantown
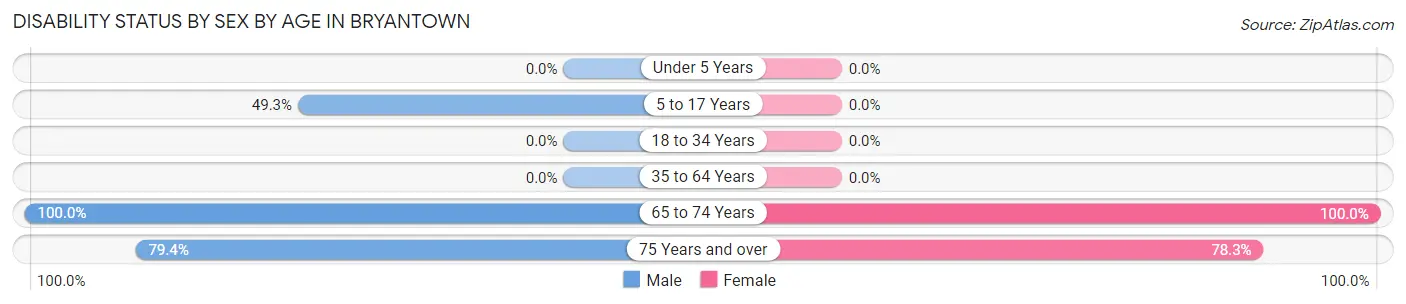
| Age Bracket | Male | Female |
| Under 5 Years | 0 (0.0%) | 0 (0.0%) |
| 5 to 17 Years | 34 (49.3%) | 0 (0.0%) |
| 18 to 34 Years | 0 (0.0%) | 0 (0.0%) |
| 35 to 64 Years | 0 (0.0%) | 0 (0.0%) |
| 65 to 74 Years | 10 (100.0%) | 9 (100.0%) |
| 75 Years and over | 27 (79.4%) | 36 (78.3%) |
Disability Class by Sex by Age in Bryantown
Disability Class: Hearing Difficulty
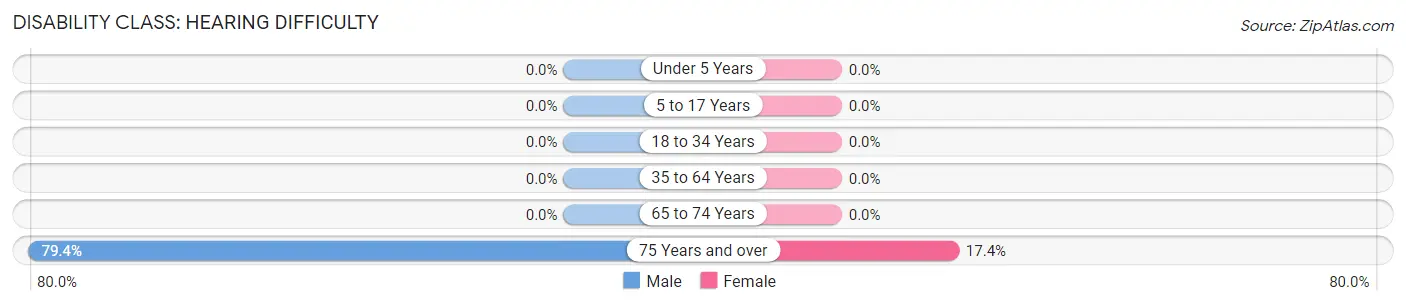
| Age Bracket | Male | Female |
| Under 5 Years | 0 (0.0%) | 0 (0.0%) |
| 5 to 17 Years | 0 (0.0%) | 0 (0.0%) |
| 18 to 34 Years | 0 (0.0%) | 0 (0.0%) |
| 35 to 64 Years | 0 (0.0%) | 0 (0.0%) |
| 65 to 74 Years | 0 (0.0%) | 0 (0.0%) |
| 75 Years and over | 27 (79.4%) | 8 (17.4%) |
Disability Class: Vision Difficulty
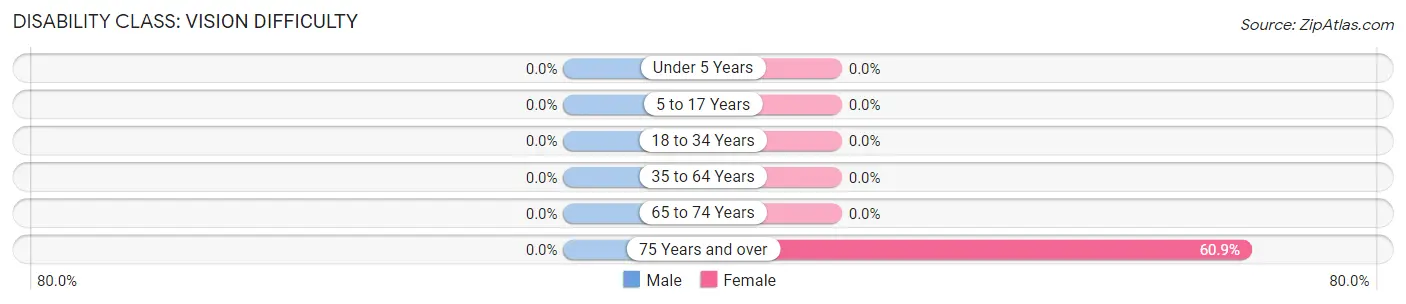
| Age Bracket | Male | Female |
| Under 5 Years | 0 (0.0%) | 0 (0.0%) |
| 5 to 17 Years | 0 (0.0%) | 0 (0.0%) |
| 18 to 34 Years | 0 (0.0%) | 0 (0.0%) |
| 35 to 64 Years | 0 (0.0%) | 0 (0.0%) |
| 65 to 74 Years | 0 (0.0%) | 0 (0.0%) |
| 75 Years and over | 0 (0.0%) | 28 (60.9%) |
Disability Class: Cognitive Difficulty
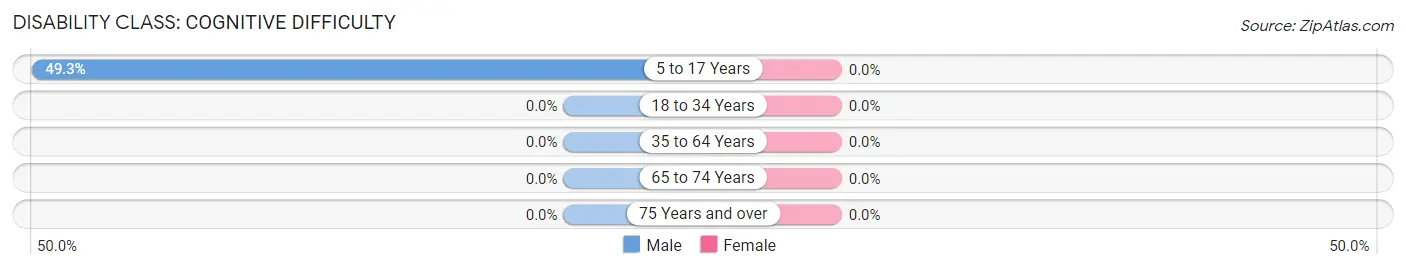
| Age Bracket | Male | Female |
| 5 to 17 Years | 34 (49.3%) | 0 (0.0%) |
| 18 to 34 Years | 0 (0.0%) | 0 (0.0%) |
| 35 to 64 Years | 0 (0.0%) | 0 (0.0%) |
| 65 to 74 Years | 0 (0.0%) | 0 (0.0%) |
| 75 Years and over | 0 (0.0%) | 0 (0.0%) |
Disability Class: Ambulatory Difficulty
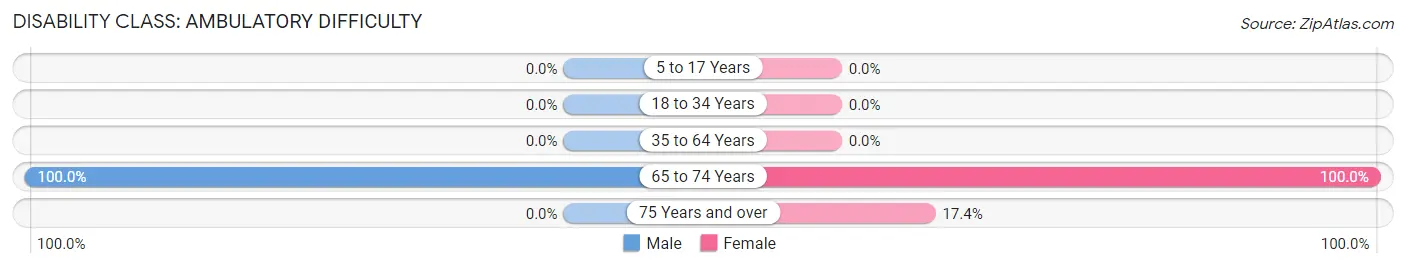
| Age Bracket | Male | Female |
| 5 to 17 Years | 0 (0.0%) | 0 (0.0%) |
| 18 to 34 Years | 0 (0.0%) | 0 (0.0%) |
| 35 to 64 Years | 0 (0.0%) | 0 (0.0%) |
| 65 to 74 Years | 10 (100.0%) | 9 (100.0%) |
| 75 Years and over | 0 (0.0%) | 8 (17.4%) |
Disability Class: Self-Care Difficulty
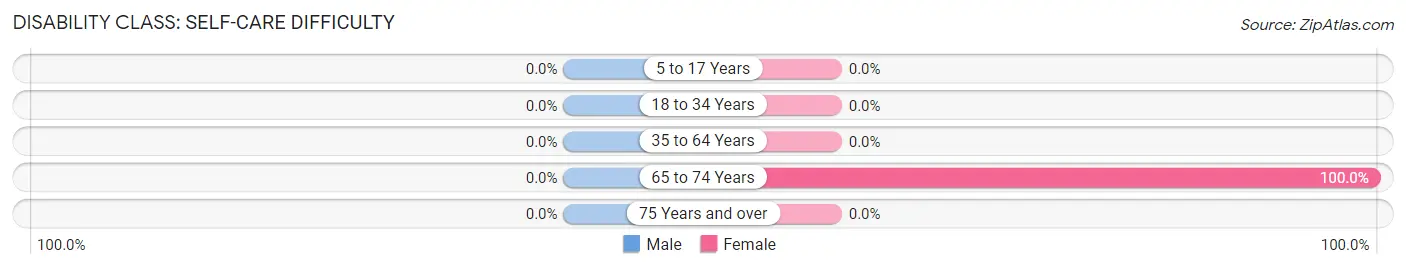
| Age Bracket | Male | Female |
| 5 to 17 Years | 0 (0.0%) | 0 (0.0%) |
| 18 to 34 Years | 0 (0.0%) | 0 (0.0%) |
| 35 to 64 Years | 0 (0.0%) | 0 (0.0%) |
| 65 to 74 Years | 0 (0.0%) | 9 (100.0%) |
| 75 Years and over | 0 (0.0%) | 0 (0.0%) |
Technology Access in Bryantown
Computing Device Access in Bryantown
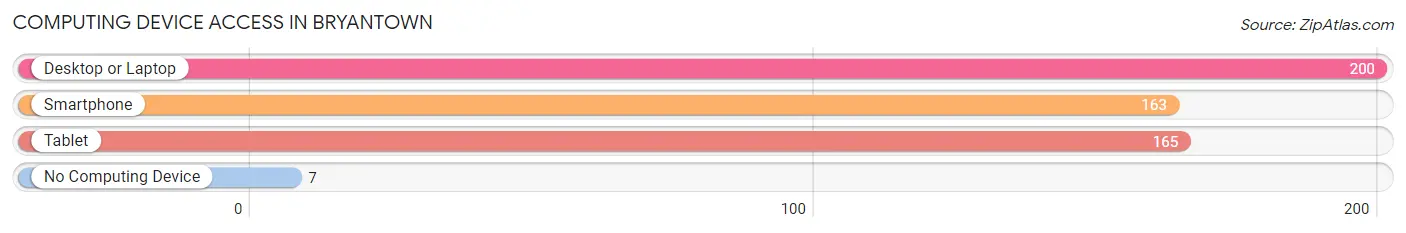
| Device Type | # Households | % Households |
| Desktop or Laptop | 200 | 96.6% |
| Smartphone | 163 | 78.7% |
| Tablet | 165 | 79.7% |
| No Computing Device | 7 | 3.4% |
| Total | 207 | 100.0% |
Internet Access in Bryantown
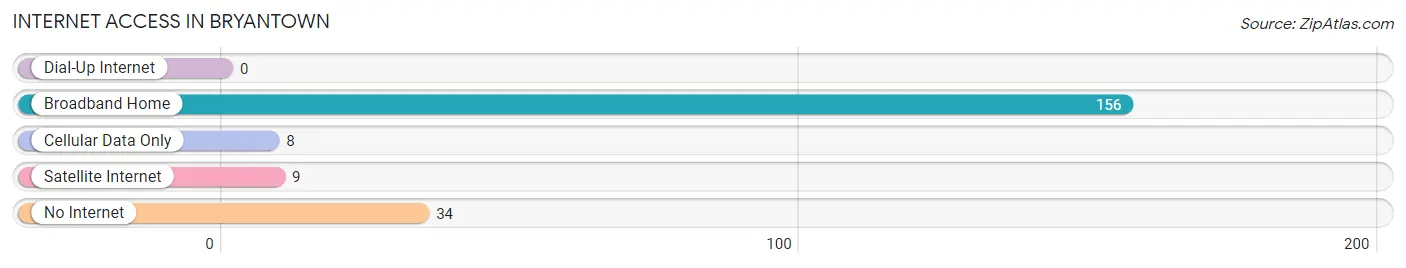
| Internet Type | # Households | % Households |
| Dial-Up Internet | 0 | 0.0% |
| Broadband Home | 156 | 75.4% |
| Cellular Data Only | 8 | 3.9% |
| Satellite Internet | 9 | 4.3% |
| No Internet | 34 | 16.4% |
| Total | 207 | 100.0% |
Bryantown Summary
Bryantown is an unincorporated community located in Charles County, Maryland, United States. It is situated along Maryland Route 5, approximately 8 miles south of La Plata and 8 miles north of Waldorf. The population of Bryantown was 1,845 at the 2010 census.
History
Bryantown was founded in 1719 by Thomas Bryant, a planter and merchant from England. The town was named after him and was originally known as Bryant's Town. The town was a major trading center in the 18th century and was home to a number of prominent families. In 1790, the town was the site of a major battle between the British and American forces during the War of 1812.
Geography
Bryantown is located at 38°27'45"N 76°55'45"W (38.4625, -76.9292). According to the United States Census Bureau, the town has a total area of 0.7 square miles (1.8 km2), all of it land.
Economy
Bryantown is primarily a residential community, with most of its residents commuting to nearby towns and cities for work. The town is home to a number of small businesses, including a gas station, a convenience store, a restaurant, and a few other retail stores.
Demographics
As of the 2010 census, there were 1,845 people, 690 households, and 517 families residing in the town. The population density was 2,621.4 people per square mile (1,011.2/km2). There were 745 housing units at an average density of 1,053.6 per square mile (406.7/km2). The racial makeup of the town was 79.2% White, 15.2% African American, 0.2% Native American, 0.7% Asian, 0.1% Pacific Islander, 2.2% from other races, and 2.6% from two or more races. Hispanic or Latino of any race were 4.2% of the population.
There were 690 households, out of which 33.3% had children under the age of 18 living with them, 54.3% were married couples living together, 13.0% had a female householder with no husband present, and 27.2% were non-families. 22.2% of all households were made up of individuals, and 8.3% had someone living alone who was 65 years of age or older. The average household size was 2.68 and the average family size was 3.14.
In the town, the population was spread out, with 25.2% under the age of 18, 7.2% from 18 to 24, 28.7% from 25 to 44, 25.2% from 45 to 64, and 13.7% who were 65 years of age or older. The median age was 38 years. For every 100 females, there were 94.2 males. For every 100 females age 18 and over, there were 91.2 males.
The median income for a household in the town was $60,000, and the median income for a family was $68,750. Males had a median income of $45,000 versus $35,000 for females. The per capita income for the town was $25,945. About 4.2% of families and 5.7% of the population were below the poverty line, including 6.3% of those under age 18 and 6.3% of those age 65 or over.
Common Questions
What is Per Capita Income in Bryantown?
Per Capita income in Bryantown is $68,440.
What is the Median Family Income in Bryantown?
Median Family Income in Bryantown is $124,965.
What is the Median Household income in Bryantown?
Median Household Income in Bryantown is $123,785.
What is Inequality or Gini Index in Bryantown?
Inequality or Gini Index in Bryantown is 0.38.
What is the Total Population of Bryantown?
Total Population of Bryantown is 620.
What is the Total Male Population of Bryantown?
Total Male Population of Bryantown is 310.
What is the Total Female Population of Bryantown?
Total Female Population of Bryantown is 310.
What is the Ratio of Males per 100 Females in Bryantown?
There are 100.00 Males per 100 Females in Bryantown.
What is the Ratio of Females per 100 Males in Bryantown?
There are 100.00 Females per 100 Males in Bryantown.
What is the Median Population Age in Bryantown?
Median Population Age in Bryantown is 41.0 Years.
What is the Average Family Size in Bryantown
Average Family Size in Bryantown is 3.3 People.
What is the Average Household Size in Bryantown
Average Household Size in Bryantown is 3.0 People.
How Large is the Labor Force in Bryantown?
There are 320 People in the Labor Forcein in Bryantown.
What is the Percentage of People in the Labor Force in Bryantown?
66.1% of People are in the Labor Force in Bryantown.