Missouri City, MO Map & Demographics
Missouri City Map
Missouri City Overview
$34,906
PER CAPITA INCOME
$53,125
AVG FAMILY INCOME
$35,000
AVG HOUSEHOLD INCOME
0.5%
WAGE / INCOME GAP [ % ]
99.5¢/ $1
WAGE / INCOME GAP [ $ ]
0.44
INEQUALITY / GINI INDEX
299
TOTAL POPULATION
175
MALE POPULATION
124
FEMALE POPULATION
141.13
MALES / 100 FEMALES
70.86
FEMALES / 100 MALES
57.9
MEDIAN AGE
2.6
AVG FAMILY SIZE
2.0
AVG HOUSEHOLD SIZE
129
LABOR FORCE [ PEOPLE ]
45.9%
PERCENT IN LABOR FORCE
5.4%
UNEMPLOYMENT RATE
Missouri City Zip Codes
Missouri City Area Codes
Income in Missouri City
Income Overview in Missouri City
Per Capita Income in Missouri City is $34,906, while median incomes of families and households are $53,125 and $35,000 respectively.
| Characteristic | Number | Measure |
| Per Capita Income | 299 | $34,906 |
| Median Family Income | 89 | $53,125 |
| Mean Family Income | 89 | $81,172 |
| Median Household Income | 146 | $35,000 |
| Mean Household Income | 146 | $66,280 |
| Income Deficit | 89 | $0 |
| Wage / Income Gap (%) | 299 | 0.52% |
| Wage / Income Gap ($) | 299 | 99.48¢ per $1 |
| Gini / Inequality Index | 299 | 0.44 |
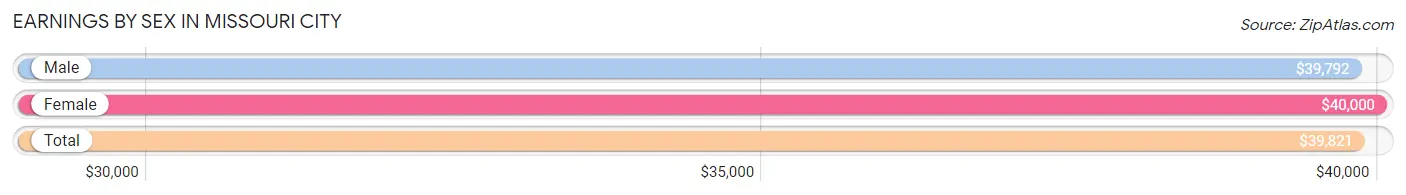
Earnings by Sex in Missouri City
Average Earnings in Missouri City are $39,821, $39,792 for men and $40,000 for women, a difference of 0.5%.
| Sex | Number | Average Earnings |
| Male | 89 (64.0%) | $39,792 |
| Female | 50 (36.0%) | $40,000 |
| Total | 139 (100.0%) | $39,821 |
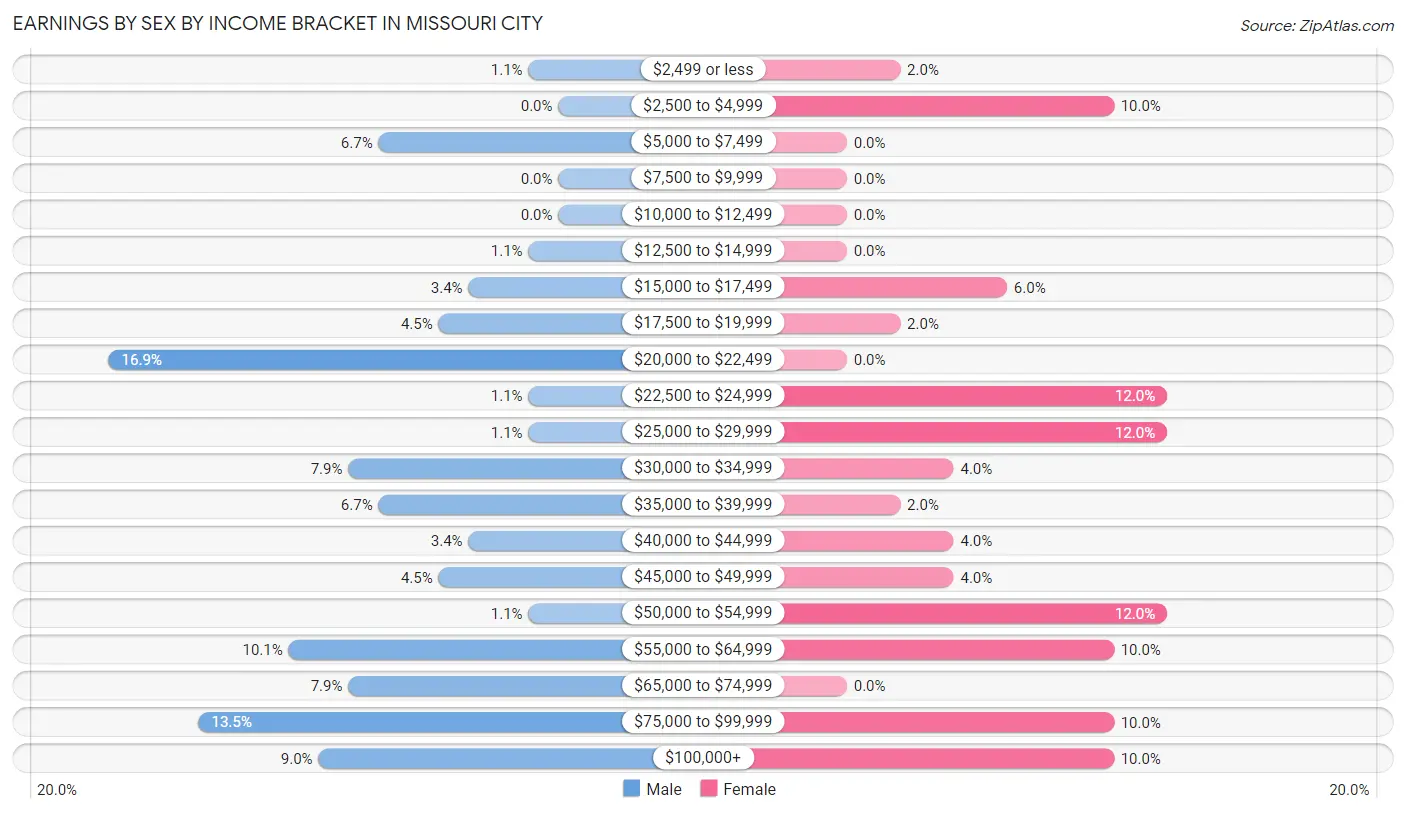
Earnings by Sex by Income Bracket in Missouri City
The most common earnings brackets in Missouri City are $20,000 to $22,499 for men (15 | 16.9%) and $22,500 to $24,999 for women (6 | 12.0%).
| Income | Male | Female |
| $2,499 or less | 1 (1.1%) | 1 (2.0%) |
| $2,500 to $4,999 | 0 (0.0%) | 5 (10.0%) |
| $5,000 to $7,499 | 6 (6.7%) | 0 (0.0%) |
| $7,500 to $9,999 | 0 (0.0%) | 0 (0.0%) |
| $10,000 to $12,499 | 0 (0.0%) | 0 (0.0%) |
| $12,500 to $14,999 | 1 (1.1%) | 0 (0.0%) |
| $15,000 to $17,499 | 3 (3.4%) | 3 (6.0%) |
| $17,500 to $19,999 | 4 (4.5%) | 1 (2.0%) |
| $20,000 to $22,499 | 15 (16.9%) | 0 (0.0%) |
| $22,500 to $24,999 | 1 (1.1%) | 6 (12.0%) |
| $25,000 to $29,999 | 1 (1.1%) | 6 (12.0%) |
| $30,000 to $34,999 | 7 (7.9%) | 2 (4.0%) |
| $35,000 to $39,999 | 6 (6.7%) | 1 (2.0%) |
| $40,000 to $44,999 | 3 (3.4%) | 2 (4.0%) |
| $45,000 to $49,999 | 4 (4.5%) | 2 (4.0%) |
| $50,000 to $54,999 | 1 (1.1%) | 6 (12.0%) |
| $55,000 to $64,999 | 9 (10.1%) | 5 (10.0%) |
| $65,000 to $74,999 | 7 (7.9%) | 0 (0.0%) |
| $75,000 to $99,999 | 12 (13.5%) | 5 (10.0%) |
| $100,000+ | 8 (9.0%) | 5 (10.0%) |
| Total | 89 (100.0%) | 50 (100.0%) |
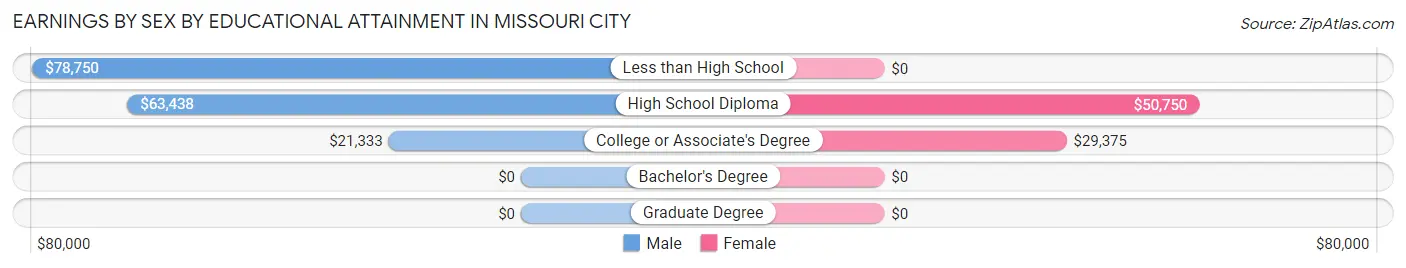
Earnings by Sex by Educational Attainment in Missouri City
Average earnings in Missouri City are $44,583 for men and $45,000 for women, a difference of 0.9%. Men with an educational attainment of less than high school enjoy the highest average annual earnings of $78,750, while those with college or associate's degree education earn the least with $21,333. Women with an educational attainment of high school diploma earn the most with the average annual earnings of $50,750, while those with college or associate's degree education have the smallest earnings of $29,375.
| Educational Attainment | Male Income | Female Income |
| Less than High School | $78,750 | $0 |
| High School Diploma | $63,438 | $50,750 |
| College or Associate's Degree | $21,333 | $29,375 |
| Bachelor's Degree | - | - |
| Graduate Degree | - | - |
| Total | $44,583 | $45,000 |
Family Income in Missouri City
Family Income Brackets in Missouri City
According to the Missouri City family income data, there are 39 families falling into the $25,000 to $34,999 income range, which is the most common income bracket and makes up 43.8% of all families.
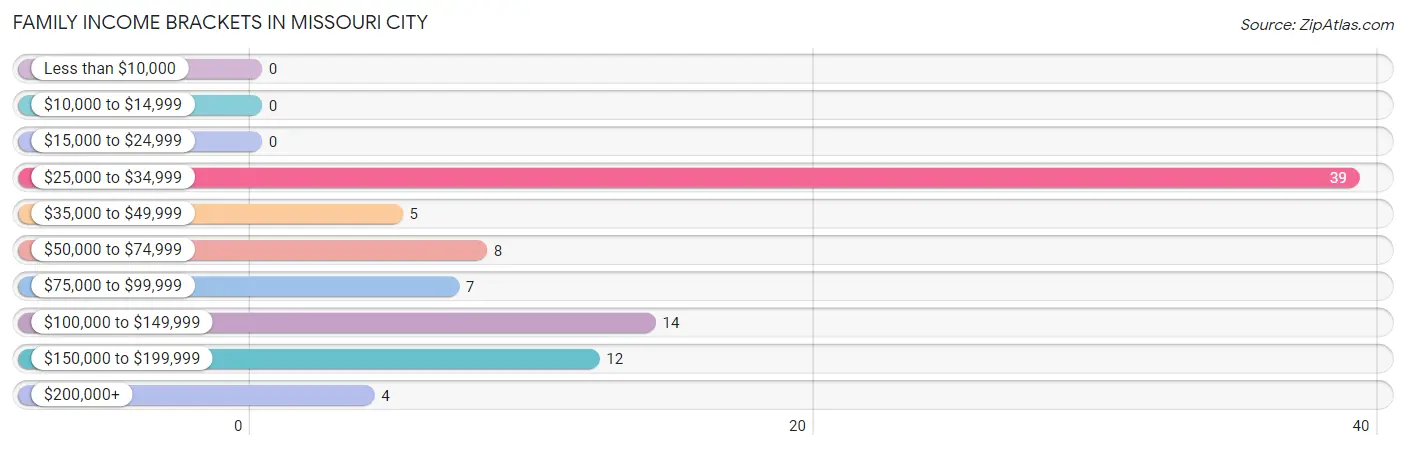
| Income Bracket | # Families | % Families |
| Less than $10,000 | 0 | 0.0% |
| $10,000 to $14,999 | 0 | 0.0% |
| $15,000 to $24,999 | 0 | 0.0% |
| $25,000 to $34,999 | 39 | 43.8% |
| $35,000 to $49,999 | 5 | 5.6% |
| $50,000 to $74,999 | 8 | 9.0% |
| $75,000 to $99,999 | 7 | 7.9% |
| $100,000 to $149,999 | 14 | 15.7% |
| $150,000 to $199,999 | 12 | 13.5% |
| $200,000+ | 4 | 4.5% |
Family Income by Famaliy Size in Missouri City
3-person families (11 | 12.4%) account for the highest median family income in Missouri City with $128,750 per family, while 3-person families (11 | 12.4%) have the highest median income of $42,917 per family member.

| Income Bracket | # Families | Median Income |
| 2-Person Families | 69 (77.5%) | $31,563 |
| 3-Person Families | 11 (12.4%) | $128,750 |
| 4-Person Families | 4 (4.5%) | $0 |
| 5-Person Families | 4 (4.5%) | $0 |
| 6-Person Families | 1 (1.1%) | $0 |
| 7+ Person Families | 0 (0.0%) | $0 |
| Total | 89 (100.0%) | $53,125 |
Family Income by Number of Earners in Missouri City
The median family income in Missouri City is $53,125, with families comprising 3+ earners (8) having the highest median family income of $190,625, while families with no earners (49) have the lowest median family income of $29,479, accounting for 9.0% and 55.1% of families, respectively.
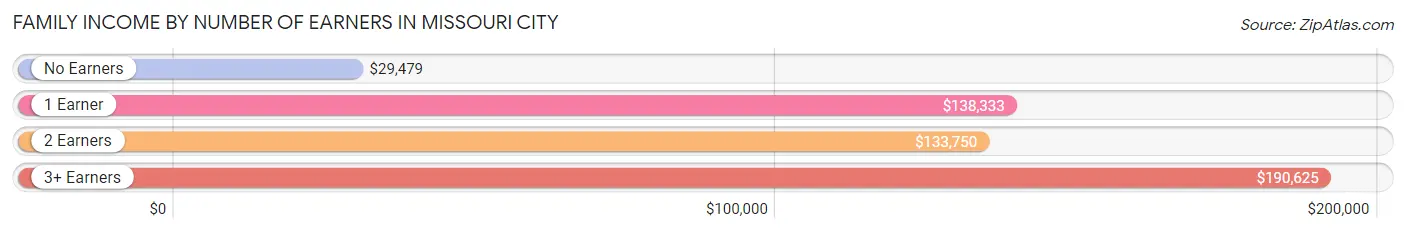
| Number of Earners | # Families | Median Income |
| No Earners | 49 (55.1%) | $29,479 |
| 1 Earner | 14 (15.7%) | $138,333 |
| 2 Earners | 18 (20.2%) | $133,750 |
| 3+ Earners | 8 (9.0%) | $190,625 |
| Total | 89 (100.0%) | $53,125 |
Household Income in Missouri City
Household Income Brackets in Missouri City
With 45 households falling in the category, the $25,000 to $34,999 income range is the most frequent in Missouri City, accounting for 30.8% of all households. In contrast, only 4 households (2.7%) fall into the less than $10,000 income bracket, making it the least populous group.
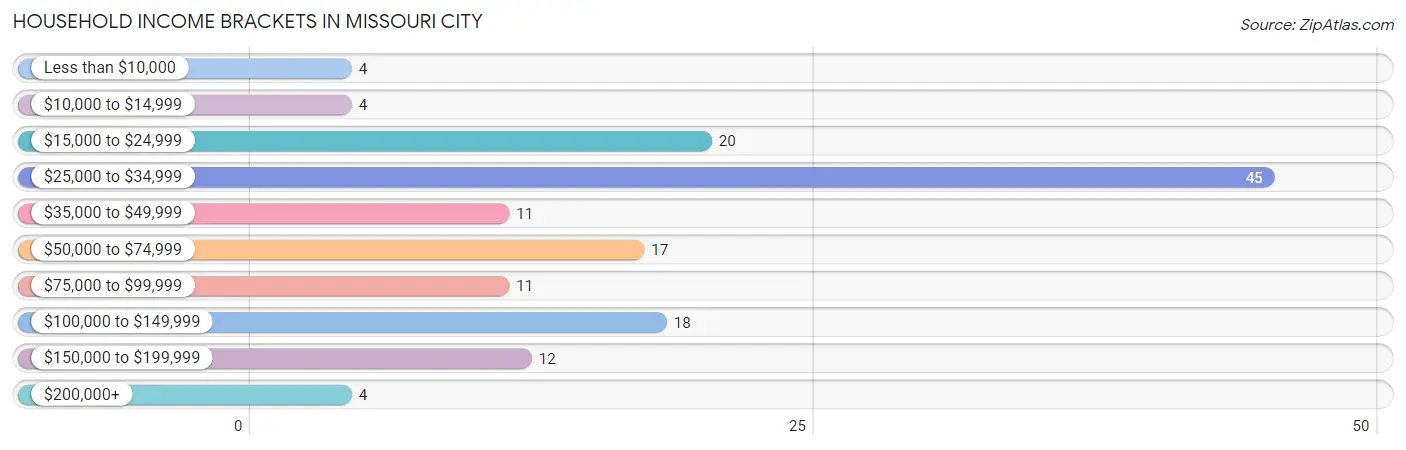
| Income Bracket | # Households | % Households |
| Less than $10,000 | 4 | 2.7% |
| $10,000 to $14,999 | 4 | 2.7% |
| $15,000 to $24,999 | 20 | 13.7% |
| $25,000 to $34,999 | 45 | 30.8% |
| $35,000 to $49,999 | 11 | 7.5% |
| $50,000 to $74,999 | 17 | 11.6% |
| $75,000 to $99,999 | 11 | 7.5% |
| $100,000 to $149,999 | 18 | 12.3% |
| $150,000 to $199,999 | 12 | 8.2% |
| $200,000+ | 4 | 2.7% |
Household Income by Householder Age in Missouri City
The median household income in Missouri City is $35,000, with the highest median household income of $76,250 found in the 45 to 64 years age bracket for the primary householder. A total of 59 households (40.4%) fall into this category.
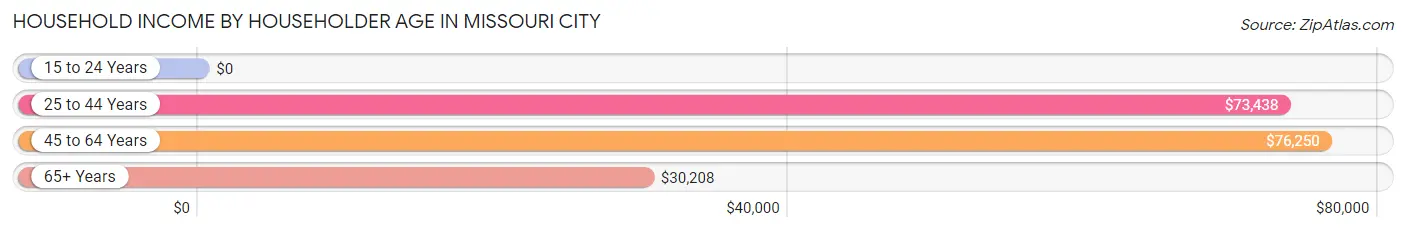
| Income Bracket | # Households | Median Income |
| 15 to 24 Years | 0 (0.0%) | $0 |
| 25 to 44 Years | 19 (13.0%) | $73,438 |
| 45 to 64 Years | 59 (40.4%) | $76,250 |
| 65+ Years | 68 (46.6%) | $30,208 |
| Total | 146 (100.0%) | $35,000 |
Poverty in Missouri City
Income Below Poverty by Sex and Age in Missouri City
With 1.1% poverty level for males and 6.5% for females among the residents of Missouri City, 25 to 34 year old males and 65 to 74 year old females are the most vulnerable to poverty, with 1 males (20.0%) and 5 females (13.5%) in their respective age groups living below the poverty level.
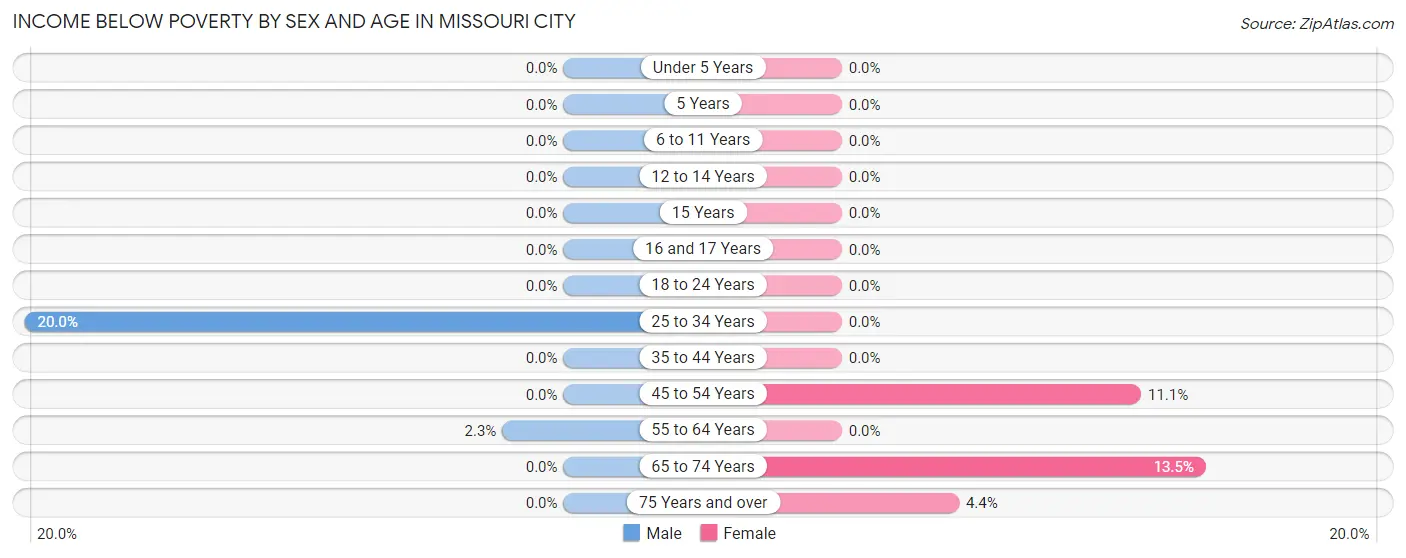
| Age Bracket | Male | Female |
| Under 5 Years | 0 (0.0%) | 0 (0.0%) |
| 5 Years | 0 (0.0%) | 0 (0.0%) |
| 6 to 11 Years | 0 (0.0%) | 0 (0.0%) |
| 12 to 14 Years | 0 (0.0%) | 0 (0.0%) |
| 15 Years | 0 (0.0%) | 0 (0.0%) |
| 16 and 17 Years | 0 (0.0%) | 0 (0.0%) |
| 18 to 24 Years | 0 (0.0%) | 0 (0.0%) |
| 25 to 34 Years | 1 (20.0%) | 0 (0.0%) |
| 35 to 44 Years | 0 (0.0%) | 0 (0.0%) |
| 45 to 54 Years | 0 (0.0%) | 2 (11.1%) |
| 55 to 64 Years | 1 (2.3%) | 0 (0.0%) |
| 65 to 74 Years | 0 (0.0%) | 5 (13.5%) |
| 75 Years and over | 0 (0.0%) | 1 (4.3%) |
| Total | 2 (1.1%) | 8 (6.5%) |
Income Above Poverty by Sex and Age in Missouri City
According to the poverty statistics in Missouri City, males aged under 5 years and females aged 6 to 11 years are the age groups that are most secure financially, with 100.0% of males and 100.0% of females in these age groups living above the poverty line.
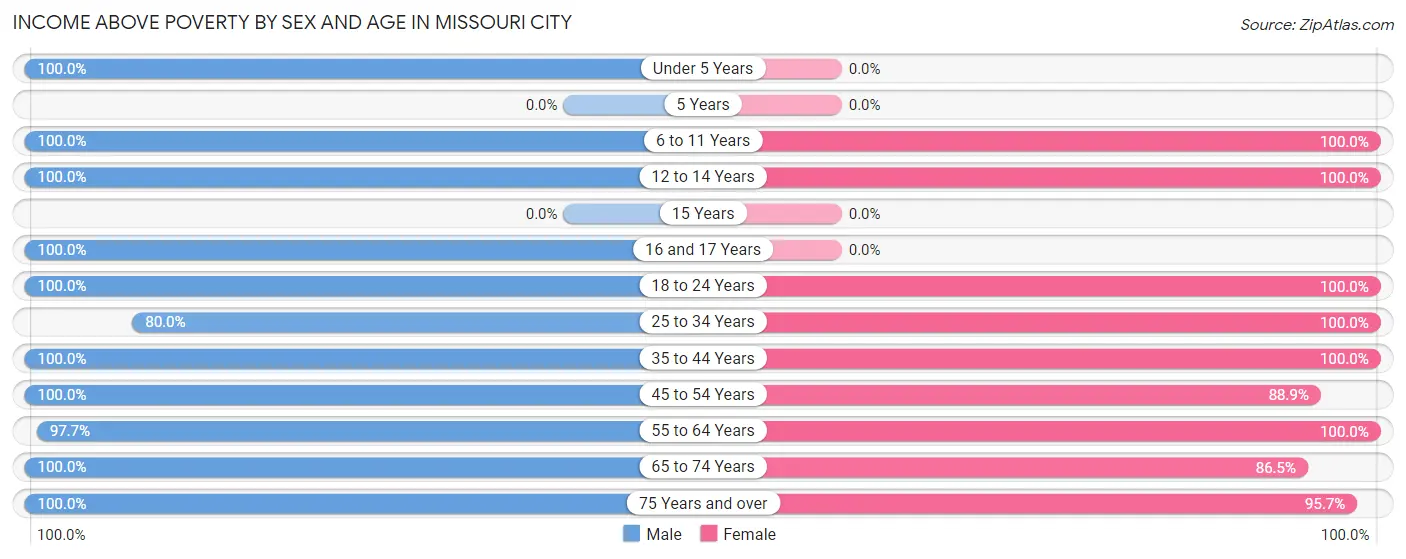
| Age Bracket | Male | Female |
| Under 5 Years | 3 (100.0%) | 0 (0.0%) |
| 5 Years | 0 (0.0%) | 0 (0.0%) |
| 6 to 11 Years | 3 (100.0%) | 6 (100.0%) |
| 12 to 14 Years | 5 (100.0%) | 1 (100.0%) |
| 15 Years | 0 (0.0%) | 0 (0.0%) |
| 16 and 17 Years | 1 (100.0%) | 0 (0.0%) |
| 18 to 24 Years | 10 (100.0%) | 10 (100.0%) |
| 25 to 34 Years | 4 (80.0%) | 3 (100.0%) |
| 35 to 44 Years | 20 (100.0%) | 12 (100.0%) |
| 45 to 54 Years | 38 (100.0%) | 16 (88.9%) |
| 55 to 64 Years | 43 (97.7%) | 14 (100.0%) |
| 65 to 74 Years | 11 (100.0%) | 32 (86.5%) |
| 75 Years and over | 35 (100.0%) | 22 (95.7%) |
| Total | 173 (98.9%) | 116 (93.5%) |
Income Below Poverty Among Married-Couple Families in Missouri City
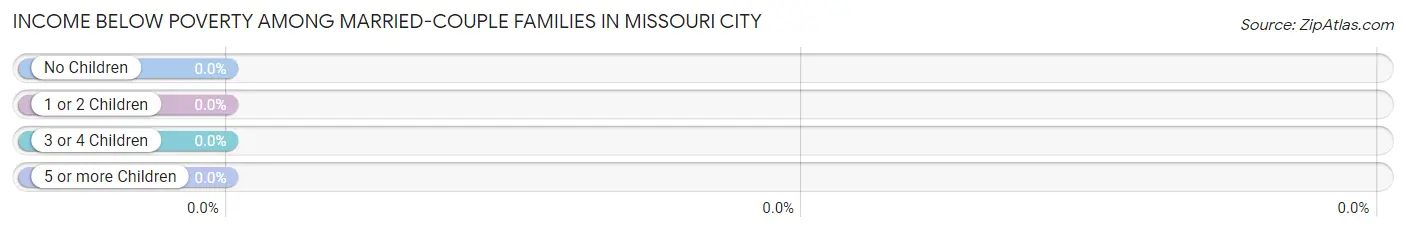
| Children | Above Poverty | Below Poverty |
| No Children | 72 (100.0%) | 0 (0.0%) |
| 1 or 2 Children | 8 (100.0%) | 0 (0.0%) |
| 3 or 4 Children | 1 (100.0%) | 0 (0.0%) |
| 5 or more Children | 0 (0.0%) | 0 (0.0%) |
| Total | 81 (100.0%) | 0 (0.0%) |
Income Below Poverty Among Single-Parent Households in Missouri City
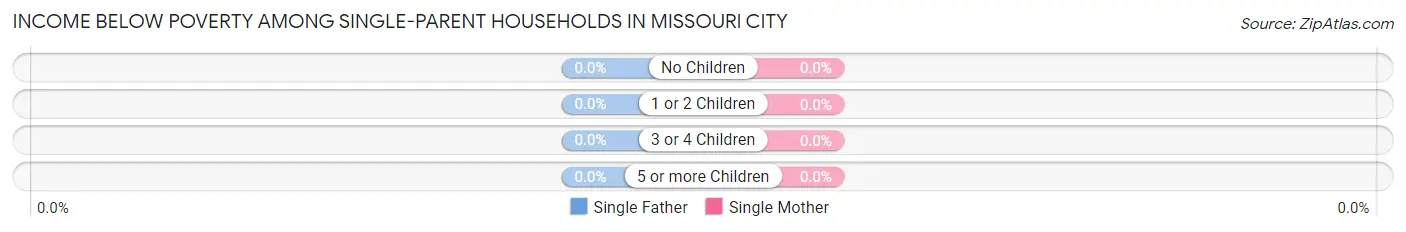
| Children | Single Father | Single Mother |
| No Children | 0 (0.0%) | 0 (0.0%) |
| 1 or 2 Children | 0 (0.0%) | 0 (0.0%) |
| 3 or 4 Children | 0 (0.0%) | 0 (0.0%) |
| 5 or more Children | 0 (0.0%) | 0 (0.0%) |
| Total | 0 (0.0%) | 0 (0.0%) |
Income Below Poverty Among Married-Couple vs Single-Parent Households in Missouri City
| Children | Married-Couple Families | Single-Parent Households |
| No Children | 0 (0.0%) | 0 (0.0%) |
| 1 or 2 Children | 0 (0.0%) | 0 (0.0%) |
| 3 or 4 Children | 0 (0.0%) | 0 (0.0%) |
| 5 or more Children | 0 (0.0%) | 0 (0.0%) |
| Total | 0 (0.0%) | 0 (0.0%) |
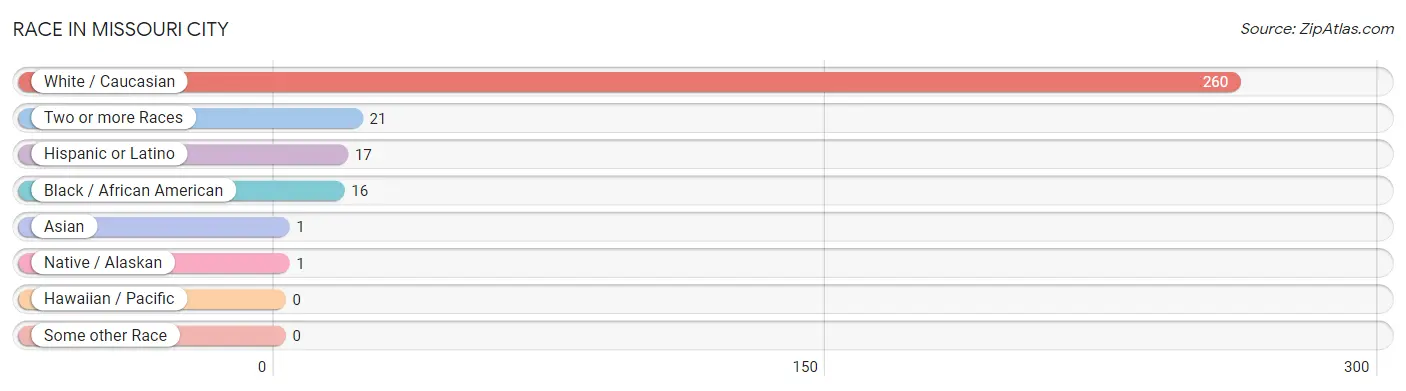
Race in Missouri City
The most populous races in Missouri City are White / Caucasian (260 | 87.0%), Two or more Races (21 | 7.0%), and Hispanic or Latino (17 | 5.7%).
| Race | # Population | % Population |
| Asian | 1 | 0.3% |
| Black / African American | 16 | 5.3% |
| Hawaiian / Pacific | 0 | 0.0% |
| Hispanic or Latino | 17 | 5.7% |
| Native / Alaskan | 1 | 0.3% |
| White / Caucasian | 260 | 87.0% |
| Two or more Races | 21 | 7.0% |
| Some other Race | 0 | 0.0% |
| Total | 299 | 100.0% |
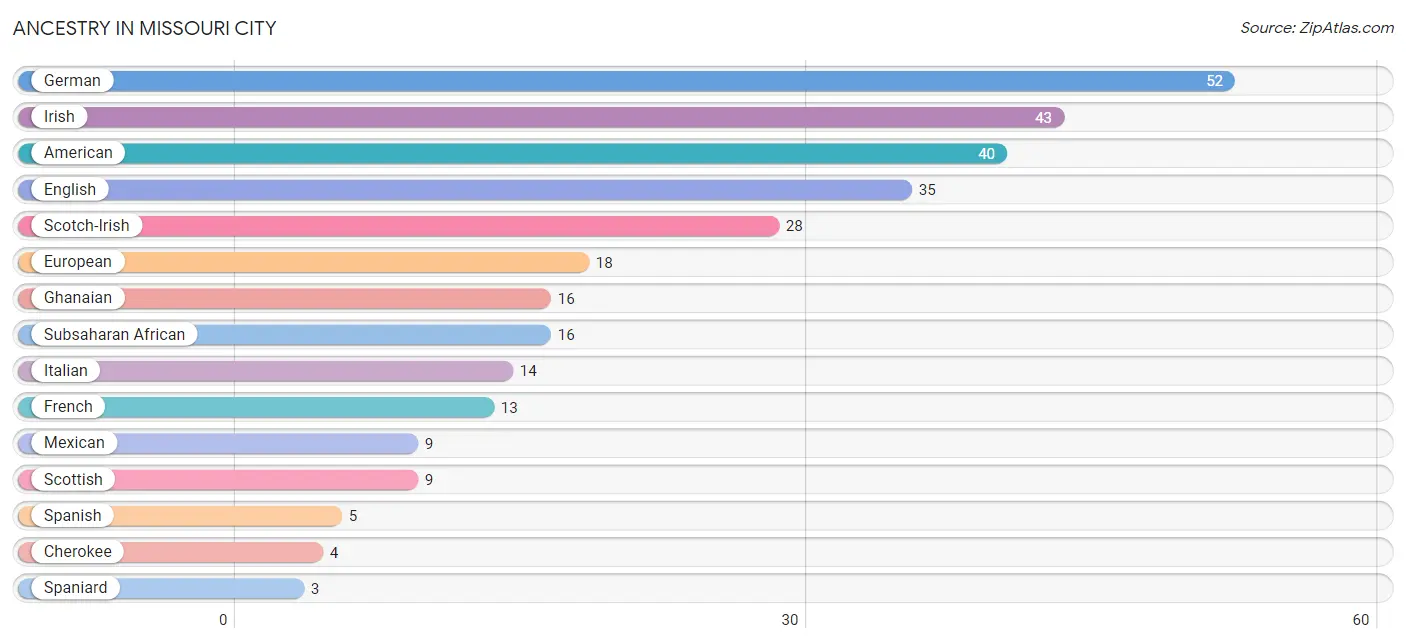
Ancestry in Missouri City
The most populous ancestries reported in Missouri City are German (52 | 17.4%), Irish (43 | 14.4%), American (40 | 13.4%), English (35 | 11.7%), and Scotch-Irish (28 | 9.4%), together accounting for 66.2% of all Missouri City residents.
| Ancestry | # Population | % Population |
| American | 40 | 13.4% |
| Arab | 1 | 0.3% |
| British | 2 | 0.7% |
| Cherokee | 4 | 1.3% |
| Czech | 2 | 0.7% |
| Eastern European | 2 | 0.7% |
| English | 35 | 11.7% |
| European | 18 | 6.0% |
| French | 13 | 4.3% |
| German | 52 | 17.4% |
| Ghanaian | 16 | 5.3% |
| Hopi | 1 | 0.3% |
| Irish | 43 | 14.4% |
| Italian | 14 | 4.7% |
| Lebanese | 1 | 0.3% |
| Mexican | 9 | 3.0% |
| Norwegian | 1 | 0.3% |
| Pakistani | 1 | 0.3% |
| Scotch-Irish | 28 | 9.4% |
| Scottish | 9 | 3.0% |
| Spaniard | 3 | 1.0% |
| Spanish | 5 | 1.7% |
| Subsaharan African | 16 | 5.3% |
| Swedish | 2 | 0.7% |
| Welsh | 2 | 0.7% |
| Yaqui | 1 | 0.3% | View All 26 Rows |
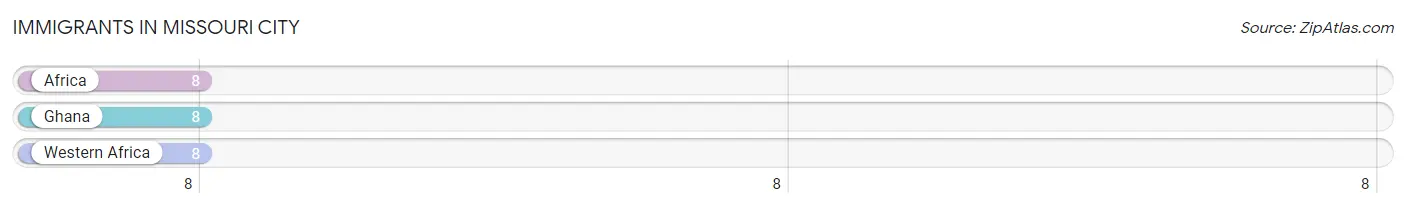
Immigrants in Missouri City
The most numerous immigrant groups reported in Missouri City came from Africa (8 | 2.7%), Ghana (8 | 2.7%), and Western Africa (8 | 2.7%), together accounting for 8.0% of all Missouri City residents.
| Immigration Origin | # Population | % Population |
| Africa | 8 | 2.7% |
| Ghana | 8 | 2.7% |
| Western Africa | 8 | 2.7% | View All 3 Rows |
Sex and Age in Missouri City
Sex and Age in Missouri City
The most populous age groups in Missouri City are 60 to 64 Years (32 | 18.3%) for men and 70 to 74 Years (20 | 16.1%) for women.
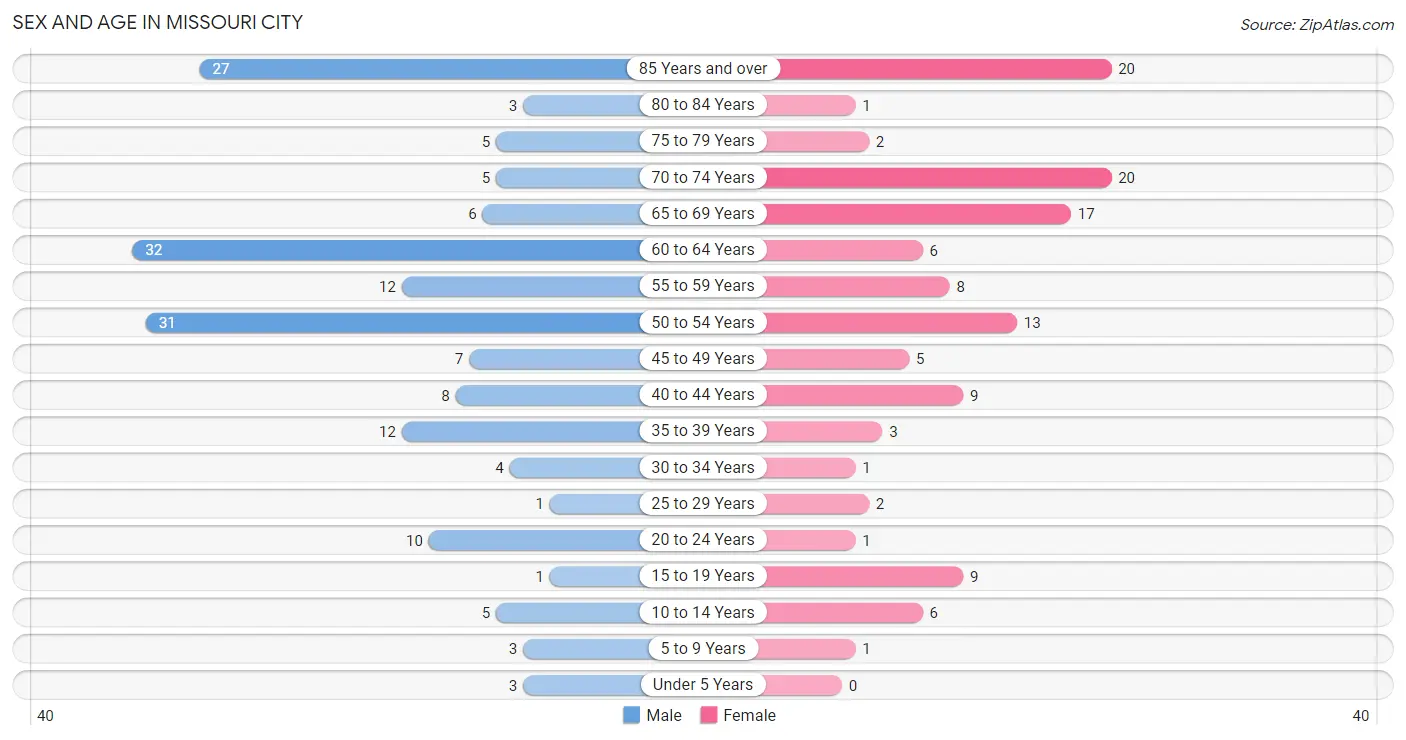
| Age Bracket | Male | Female |
| Under 5 Years | 3 (1.7%) | 0 (0.0%) |
| 5 to 9 Years | 3 (1.7%) | 1 (0.8%) |
| 10 to 14 Years | 5 (2.9%) | 6 (4.8%) |
| 15 to 19 Years | 1 (0.6%) | 9 (7.3%) |
| 20 to 24 Years | 10 (5.7%) | 1 (0.8%) |
| 25 to 29 Years | 1 (0.6%) | 2 (1.6%) |
| 30 to 34 Years | 4 (2.3%) | 1 (0.8%) |
| 35 to 39 Years | 12 (6.9%) | 3 (2.4%) |
| 40 to 44 Years | 8 (4.6%) | 9 (7.3%) |
| 45 to 49 Years | 7 (4.0%) | 5 (4.0%) |
| 50 to 54 Years | 31 (17.7%) | 13 (10.5%) |
| 55 to 59 Years | 12 (6.9%) | 8 (6.5%) |
| 60 to 64 Years | 32 (18.3%) | 6 (4.8%) |
| 65 to 69 Years | 6 (3.4%) | 17 (13.7%) |
| 70 to 74 Years | 5 (2.9%) | 20 (16.1%) |
| 75 to 79 Years | 5 (2.9%) | 2 (1.6%) |
| 80 to 84 Years | 3 (1.7%) | 1 (0.8%) |
| 85 Years and over | 27 (15.4%) | 20 (16.1%) |
| Total | 175 (100.0%) | 124 (100.0%) |
Families and Households in Missouri City
Median Family Size in Missouri City
The median family size in Missouri City is 2.56 persons per family, with single male/father families (5 | 5.6%) accounting for the largest median family size of 3.2 persons per family. On the other hand, married-couple families (81 | 91.0%) represent the smallest median family size with 2.51 persons per family.
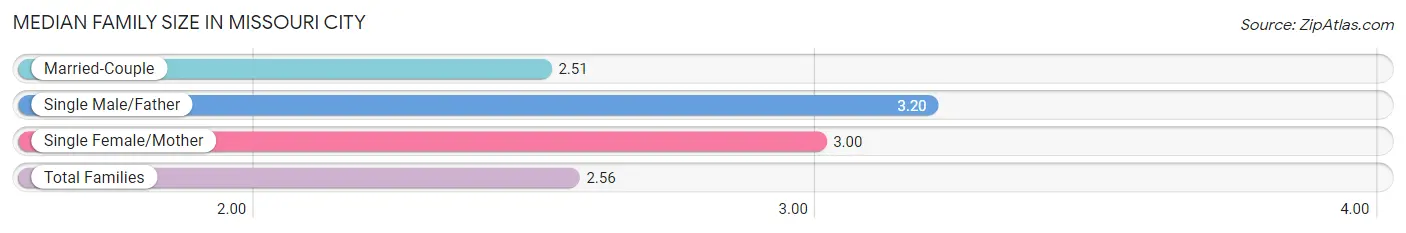
| Family Type | # Families | Family Size |
| Married-Couple | 81 (91.0%) | 2.51 |
| Single Male/Father | 5 (5.6%) | 3.20 |
| Single Female/Mother | 3 (3.4%) | 3.00 |
| Total Families | 89 (100.0%) | 2.56 |
Median Household Size in Missouri City
The median household size in Missouri City is 2.05 persons per household, with single male/father households (5 | 3.4%) accounting for the largest median household size of 4.6 persons per household. non-family households (57 | 39.0%) represent the smallest median household size with 1.12 persons per household.
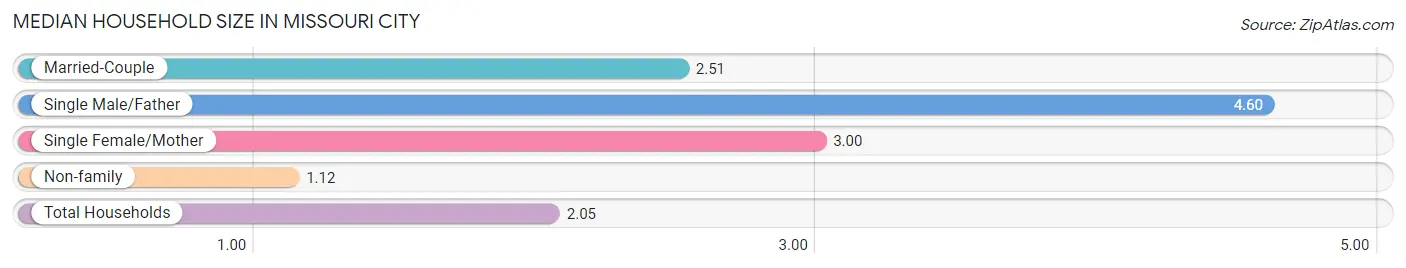
| Household Type | # Households | Household Size |
| Married-Couple | 81 (55.5%) | 2.51 |
| Single Male/Father | 5 (3.4%) | 4.60 |
| Single Female/Mother | 3 (2.1%) | 3.00 |
| Non-family | 57 (39.0%) | 1.12 |
| Total Households | 146 (100.0%) | 2.05 |
Household Size by Marriage Status in Missouri City
Out of a total of 146 households in Missouri City, 89 (61.0%) are family households, while 57 (39.0%) are nonfamily households. The most numerous type of family households are 2-person households, comprising 67, and the most common type of nonfamily households are 1-person households, comprising 50.
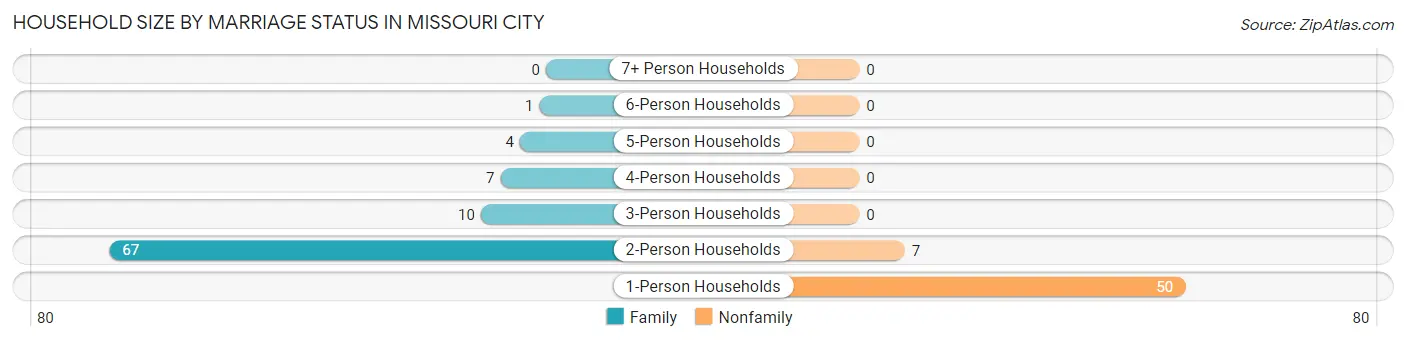
| Household Size | Family Households | Nonfamily Households |
| 1-Person Households | - | 50 (34.3%) |
| 2-Person Households | 67 (45.9%) | 7 (4.8%) |
| 3-Person Households | 10 (6.9%) | 0 (0.0%) |
| 4-Person Households | 7 (4.8%) | 0 (0.0%) |
| 5-Person Households | 4 (2.7%) | 0 (0.0%) |
| 6-Person Households | 1 (0.7%) | 0 (0.0%) |
| 7+ Person Households | 0 (0.0%) | 0 (0.0%) |
| Total | 89 (61.0%) | 57 (39.0%) |
Female Fertility in Missouri City
Fertility by Age in Missouri City
Average fertility rate in Missouri City is 30.0 births per 1,000 women. Women in the age bracket of 35 to 50 years have the highest fertility rate with 50.0 births per 1,000 women. Women in the age bracket of 35 to 50 years acount for 100.0% of all women with births.
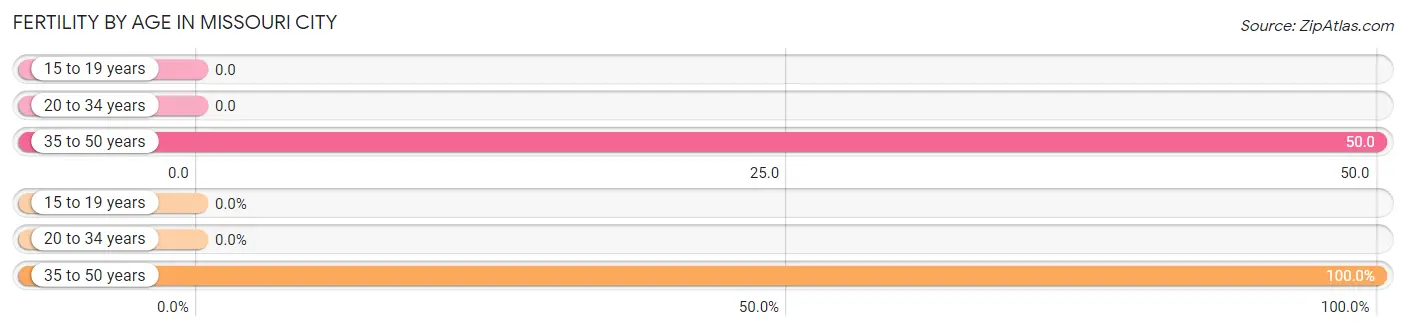
| Age Bracket | Women with Births | Births / 1,000 Women |
| 15 to 19 years | 0 (0.0%) | 0.0 |
| 20 to 34 years | 0 (0.0%) | 0.0 |
| 35 to 50 years | 1 (100.0%) | 50.0 |
| Total | 1 (100.0%) | 30.0 |
Fertility by Age by Marriage Status in Missouri City
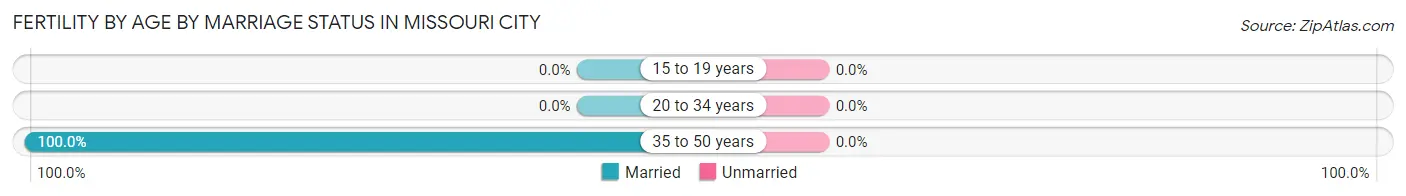
| Age Bracket | Married | Unmarried |
| 15 to 19 years | 0 (0.0%) | 0 (0.0%) |
| 20 to 34 years | 0 (0.0%) | 0 (0.0%) |
| 35 to 50 years | 1 (100.0%) | 0 (0.0%) |
| Total | 1 (100.0%) | 0 (0.0%) |
Fertility by Education in Missouri City
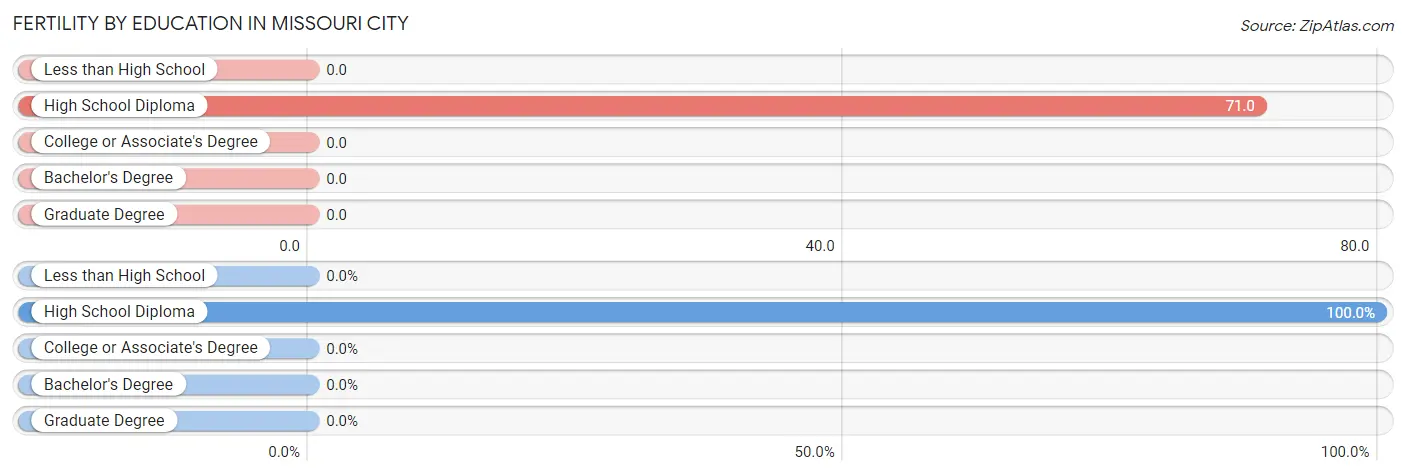
| Educational Attainment | Women with Births | Births / 1,000 Women |
| Less than High School | 0 (0.0%) | 0.0 |
| High School Diploma | 1 (100.0%) | 71.0 |
| College or Associate's Degree | 0 (0.0%) | 0.0 |
| Bachelor's Degree | 0 (0.0%) | 0.0 |
| Graduate Degree | 0 (0.0%) | 0.0 |
| Total | 1 (100.0%) | 30.0 |
Fertility by Education by Marriage Status in Missouri City
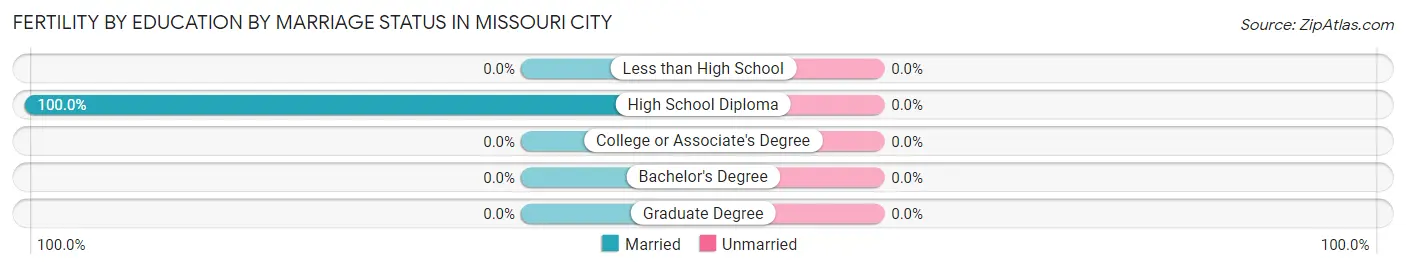
| Educational Attainment | Married | Unmarried |
| Less than High School | 0 (0.0%) | 0 (0.0%) |
| High School Diploma | 1 (100.0%) | 0 (0.0%) |
| College or Associate's Degree | 0 (0.0%) | 0 (0.0%) |
| Bachelor's Degree | 0 (0.0%) | 0 (0.0%) |
| Graduate Degree | 0 (0.0%) | 0 (0.0%) |
| Total | 1 (100.0%) | 0 (0.0%) |
Employment Characteristics in Missouri City
Employment by Class of Employer in Missouri City
Among the 122 employed individuals in Missouri City, private company employees (91 | 74.6%), local government employees (10 | 8.2%), and not-for-profit organizations (5 | 4.1%) make up the most common classes of employment.
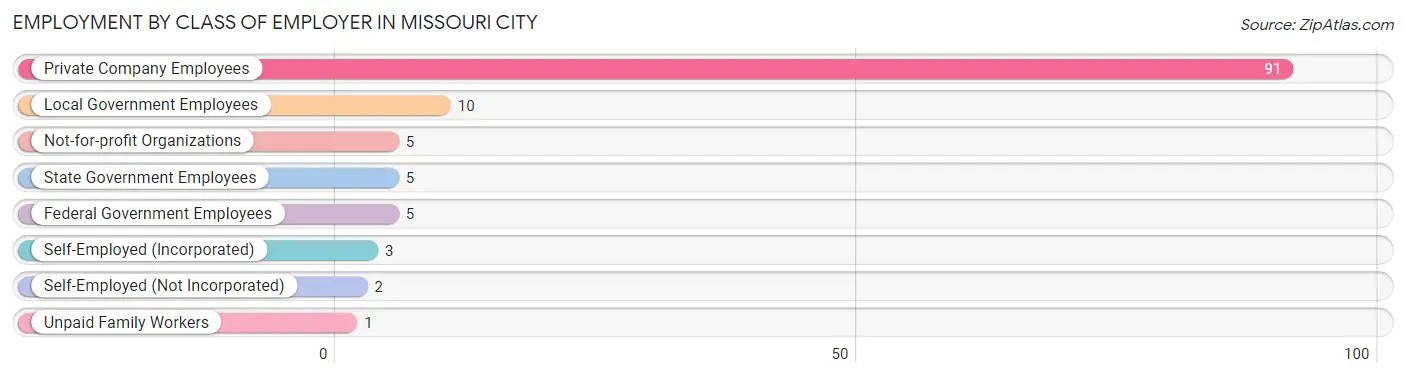
| Employer Class | # Employees | % Employees |
| Private Company Employees | 91 | 74.6% |
| Self-Employed (Incorporated) | 3 | 2.5% |
| Self-Employed (Not Incorporated) | 2 | 1.6% |
| Not-for-profit Organizations | 5 | 4.1% |
| Local Government Employees | 10 | 8.2% |
| State Government Employees | 5 | 4.1% |
| Federal Government Employees | 5 | 4.1% |
| Unpaid Family Workers | 1 | 0.8% |
| Total | 122 | 100.0% |
Employment Status by Age in Missouri City
According to the labor force statistics for Missouri City, out of the total population over 16 years of age (281), 45.9% or 129 individuals are in the labor force, with 5.4% or 7 of them unemployed. The age group with the highest labor force participation rate is 20 to 24 years, with 100.0% or 11 individuals in the labor force. Within the labor force, the 45 to 54 years age range has the highest percentage of unemployed individuals, with 14.3% or 7 of them being unemployed.
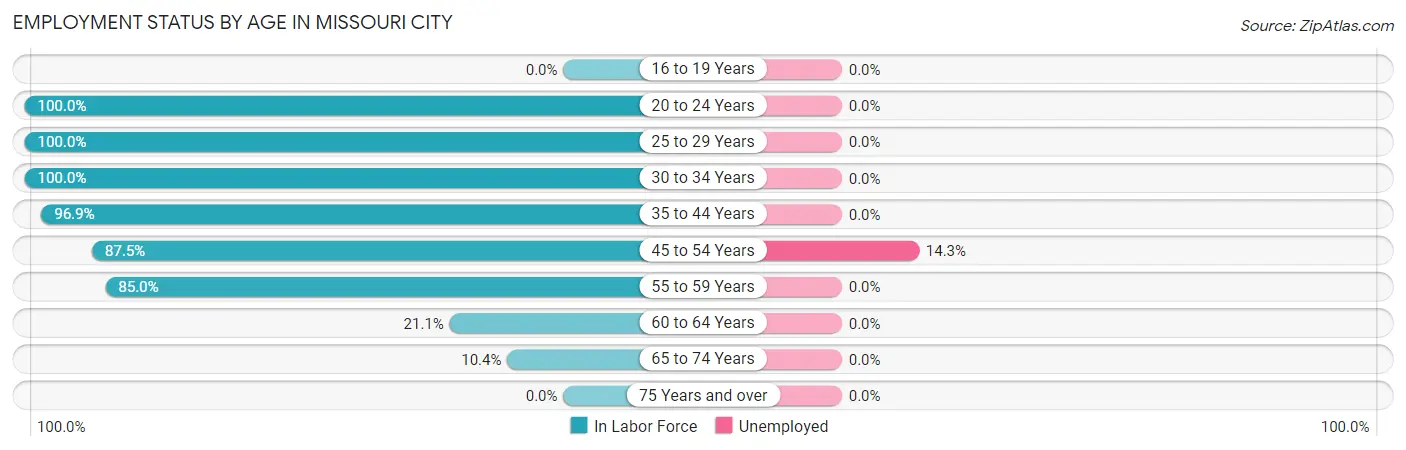
| Age Bracket | In Labor Force | Unemployed |
| 16 to 19 Years | 0 (0.0%) | 0 (0.0%) |
| 20 to 24 Years | 11 (100.0%) | 0 (0.0%) |
| 25 to 29 Years | 3 (100.0%) | 0 (0.0%) |
| 30 to 34 Years | 5 (100.0%) | 0 (0.0%) |
| 35 to 44 Years | 31 (96.9%) | 0 (0.0%) |
| 45 to 54 Years | 49 (87.5%) | 7 (14.3%) |
| 55 to 59 Years | 17 (85.0%) | 0 (0.0%) |
| 60 to 64 Years | 8 (21.1%) | 0 (0.0%) |
| 65 to 74 Years | 5 (10.4%) | 0 (0.0%) |
| 75 Years and over | 0 (0.0%) | 0 (0.0%) |
| Total | 129 (45.9%) | 7 (5.4%) |
Employment Status by Educational Attainment in Missouri City
According to labor force statistics for Missouri City, 73.4% of individuals (113) out of the total population between 25 and 64 years of age (154) are in the labor force, with 6.2% or 7 of them being unemployed. The group with the highest labor force participation rate are those with the educational attainment of less than high school, with 87.5% or 7 individuals in the labor force. Within the labor force, individuals with college / associate degree education have the highest percentage of unemployment, with 7.9% or 3 of them being unemployed.
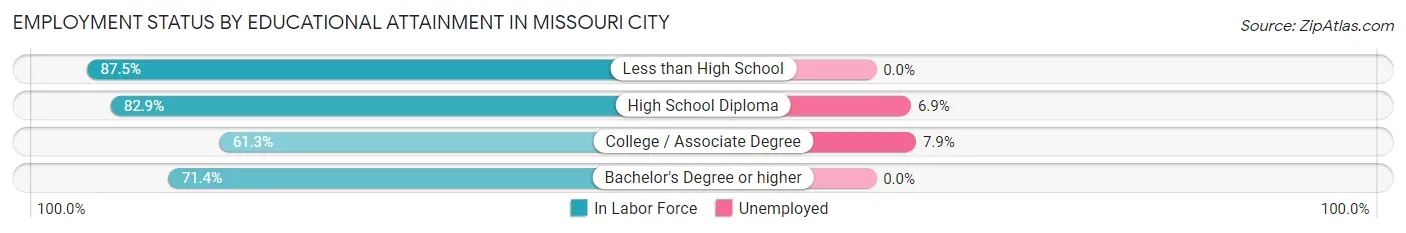
| Educational Attainment | In Labor Force | Unemployed |
| Less than High School | 7 (87.5%) | 0 (0.0%) |
| High School Diploma | 58 (82.9%) | 5 (6.9%) |
| College / Associate Degree | 38 (61.3%) | 5 (7.9%) |
| Bachelor's Degree or higher | 10 (71.4%) | 0 (0.0%) |
| Total | 113 (73.4%) | 10 (6.2%) |
Employment Occupations by Sex in Missouri City
Management, Business, Science and Arts Occupations
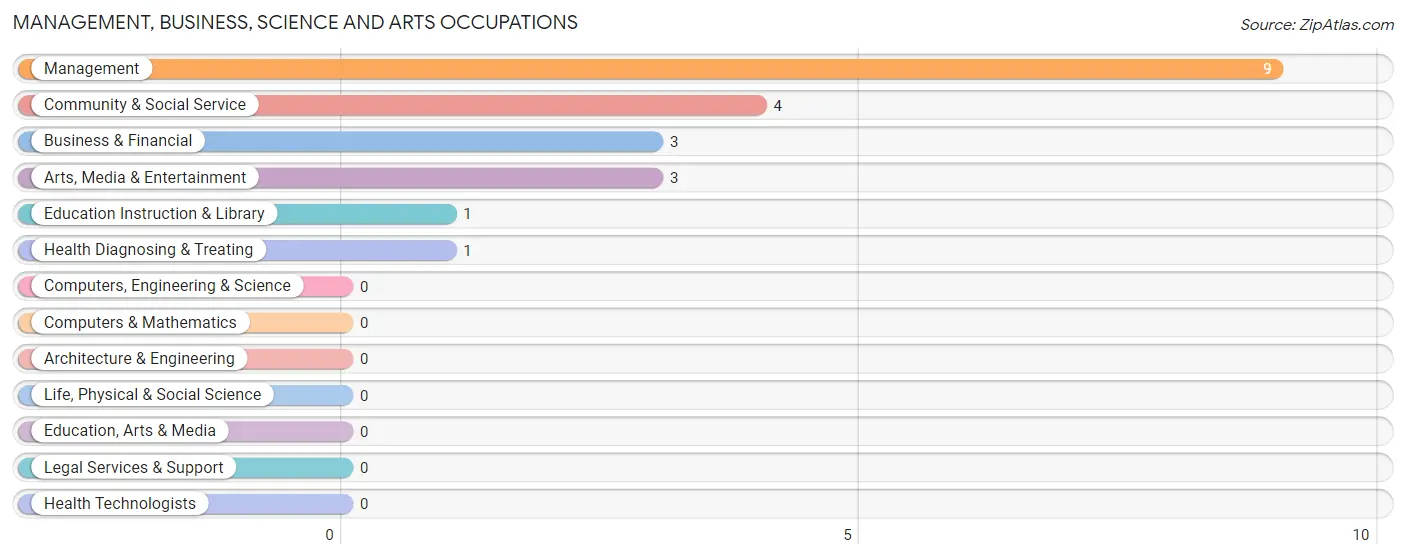
The most common Management, Business, Science and Arts occupations in Missouri City are Management (9 | 7.4%), Community & Social Service (4 | 3.3%), Business & Financial (3 | 2.5%), Arts, Media & Entertainment (3 | 2.5%), and Education Instruction & Library (1 | 0.8%).
Management, Business, Science and Arts Occupations by Sex
Within the Management, Business, Science and Arts occupations in Missouri City, the most male-oriented occupations are Arts, Media & Entertainment (100.0%), Community & Social Service (75.0%), and Management (66.7%), while the most female-oriented occupations are Business & Financial (100.0%), Education Instruction & Library (100.0%), and Health Diagnosing & Treating (100.0%).
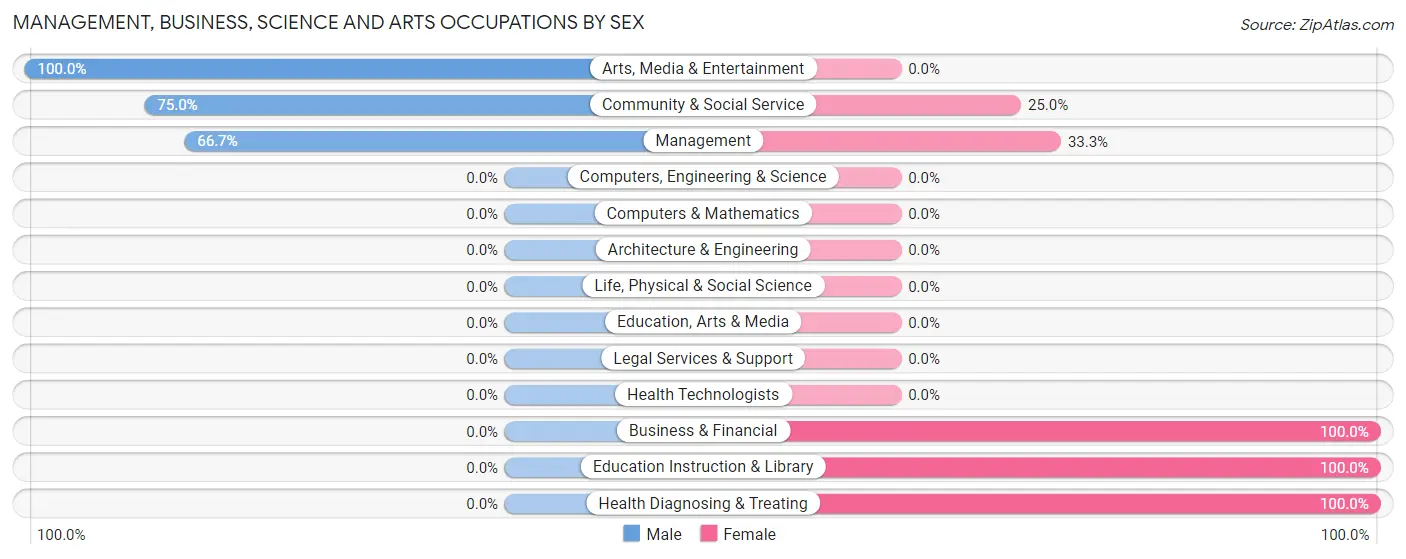
| Occupation | Male | Female |
| Management | 6 (66.7%) | 3 (33.3%) |
| Business & Financial | 0 (0.0%) | 3 (100.0%) |
| Computers, Engineering & Science | 0 (0.0%) | 0 (0.0%) |
| Computers & Mathematics | 0 (0.0%) | 0 (0.0%) |
| Architecture & Engineering | 0 (0.0%) | 0 (0.0%) |
| Life, Physical & Social Science | 0 (0.0%) | 0 (0.0%) |
| Community & Social Service | 3 (75.0%) | 1 (25.0%) |
| Education, Arts & Media | 0 (0.0%) | 0 (0.0%) |
| Legal Services & Support | 0 (0.0%) | 0 (0.0%) |
| Education Instruction & Library | 0 (0.0%) | 1 (100.0%) |
| Arts, Media & Entertainment | 3 (100.0%) | 0 (0.0%) |
| Health Diagnosing & Treating | 0 (0.0%) | 1 (100.0%) |
| Health Technologists | 0 (0.0%) | 0 (0.0%) |
| Total (Category) | 9 (52.9%) | 8 (47.1%) |
| Total (Overall) | 79 (64.7%) | 43 (35.2%) |
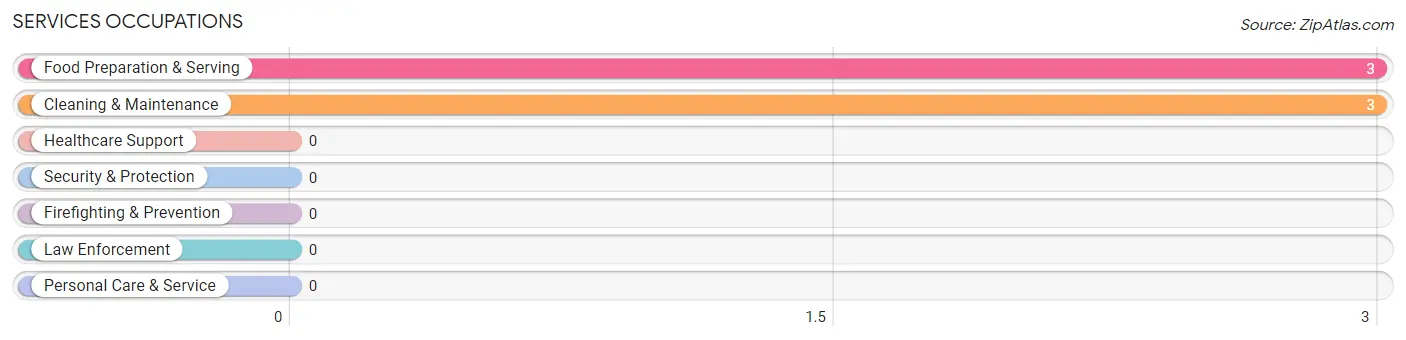
Services Occupations
The most common Services occupations in Missouri City are Food Preparation & Serving (3 | 2.5%), and Cleaning & Maintenance (3 | 2.5%).
Services Occupations by Sex
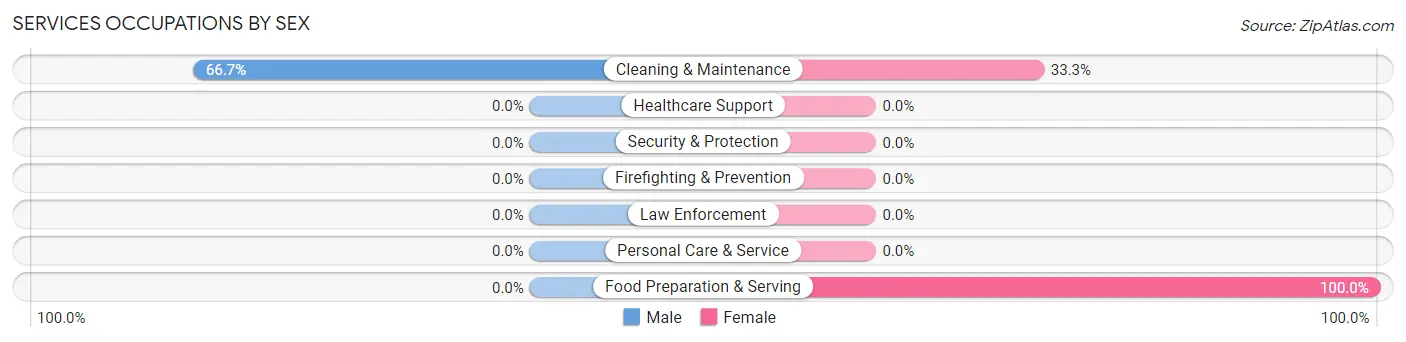
| Occupation | Male | Female |
| Healthcare Support | 0 (0.0%) | 0 (0.0%) |
| Security & Protection | 0 (0.0%) | 0 (0.0%) |
| Firefighting & Prevention | 0 (0.0%) | 0 (0.0%) |
| Law Enforcement | 0 (0.0%) | 0 (0.0%) |
| Food Preparation & Serving | 0 (0.0%) | 3 (100.0%) |
| Cleaning & Maintenance | 2 (66.7%) | 1 (33.3%) |
| Personal Care & Service | 0 (0.0%) | 0 (0.0%) |
| Total (Category) | 2 (33.3%) | 4 (66.7%) |
| Total (Overall) | 79 (64.7%) | 43 (35.2%) |
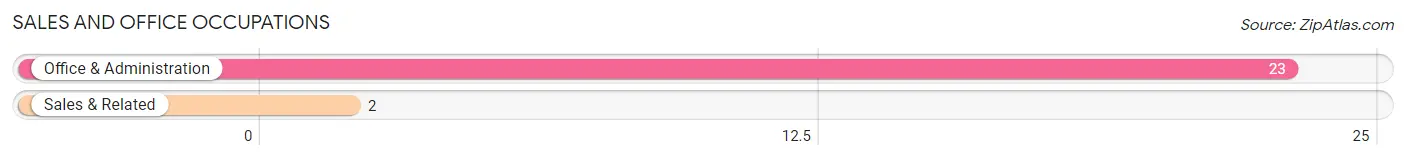
Sales and Office Occupations
The most common Sales and Office occupations in Missouri City are Office & Administration (23 | 18.9%), and Sales & Related (2 | 1.6%).
Sales and Office Occupations by Sex
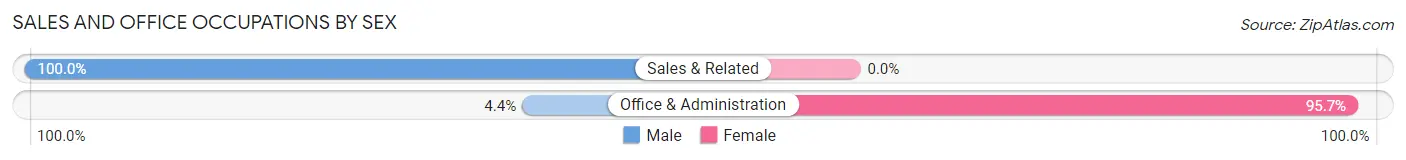
| Occupation | Male | Female |
| Sales & Related | 2 (100.0%) | 0 (0.0%) |
| Office & Administration | 1 (4.3%) | 22 (95.7%) |
| Total (Category) | 3 (12.0%) | 22 (88.0%) |
| Total (Overall) | 79 (64.7%) | 43 (35.2%) |
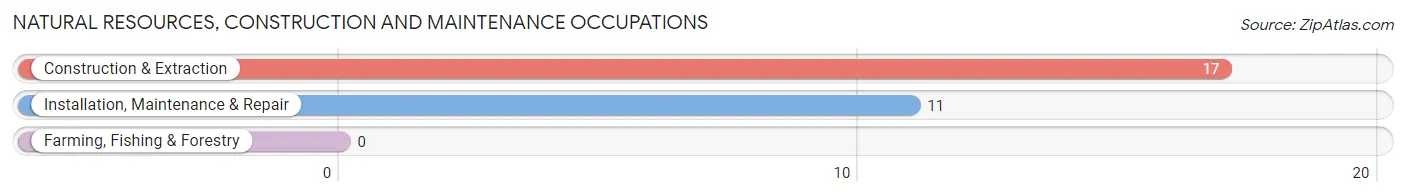
Natural Resources, Construction and Maintenance Occupations
The most common Natural Resources, Construction and Maintenance occupations in Missouri City are Construction & Extraction (17 | 13.9%), and Installation, Maintenance & Repair (11 | 9.0%).
Natural Resources, Construction and Maintenance Occupations by Sex
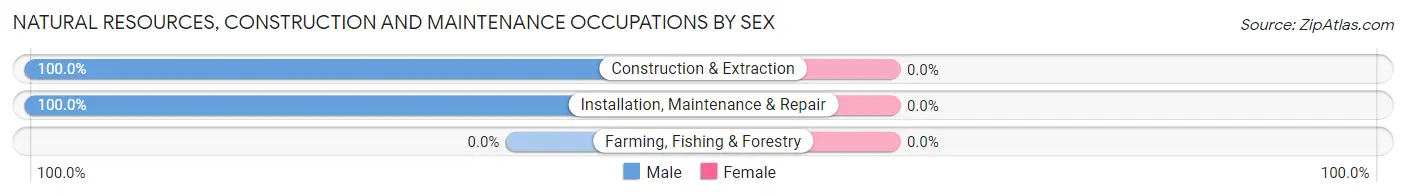
| Occupation | Male | Female |
| Farming, Fishing & Forestry | 0 (0.0%) | 0 (0.0%) |
| Construction & Extraction | 17 (100.0%) | 0 (0.0%) |
| Installation, Maintenance & Repair | 11 (100.0%) | 0 (0.0%) |
| Total (Category) | 28 (100.0%) | 0 (0.0%) |
| Total (Overall) | 79 (64.7%) | 43 (35.2%) |
Production, Transportation and Moving Occupations
The most common Production, Transportation and Moving occupations in Missouri City are Production (19 | 15.6%), Transportation (14 | 11.5%), and Material Moving (13 | 10.7%).
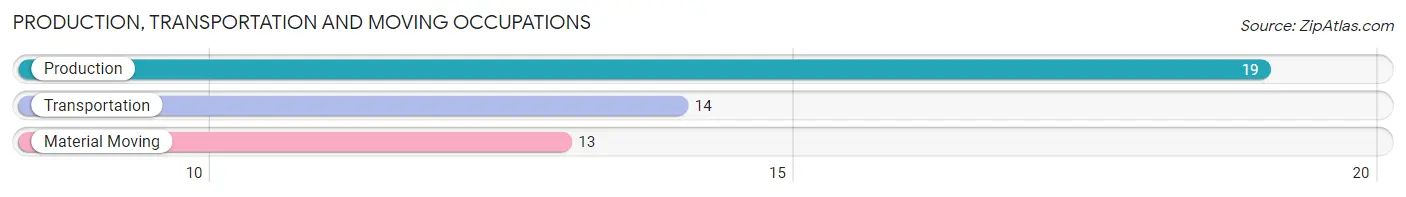
Production, Transportation and Moving Occupations by Sex
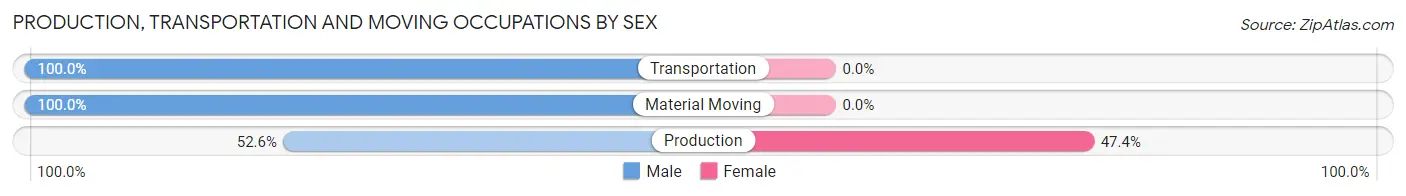
| Occupation | Male | Female |
| Production | 10 (52.6%) | 9 (47.4%) |
| Transportation | 14 (100.0%) | 0 (0.0%) |
| Material Moving | 13 (100.0%) | 0 (0.0%) |
| Total (Category) | 37 (80.4%) | 9 (19.6%) |
| Total (Overall) | 79 (64.7%) | 43 (35.2%) |
Employment Industries by Sex in Missouri City
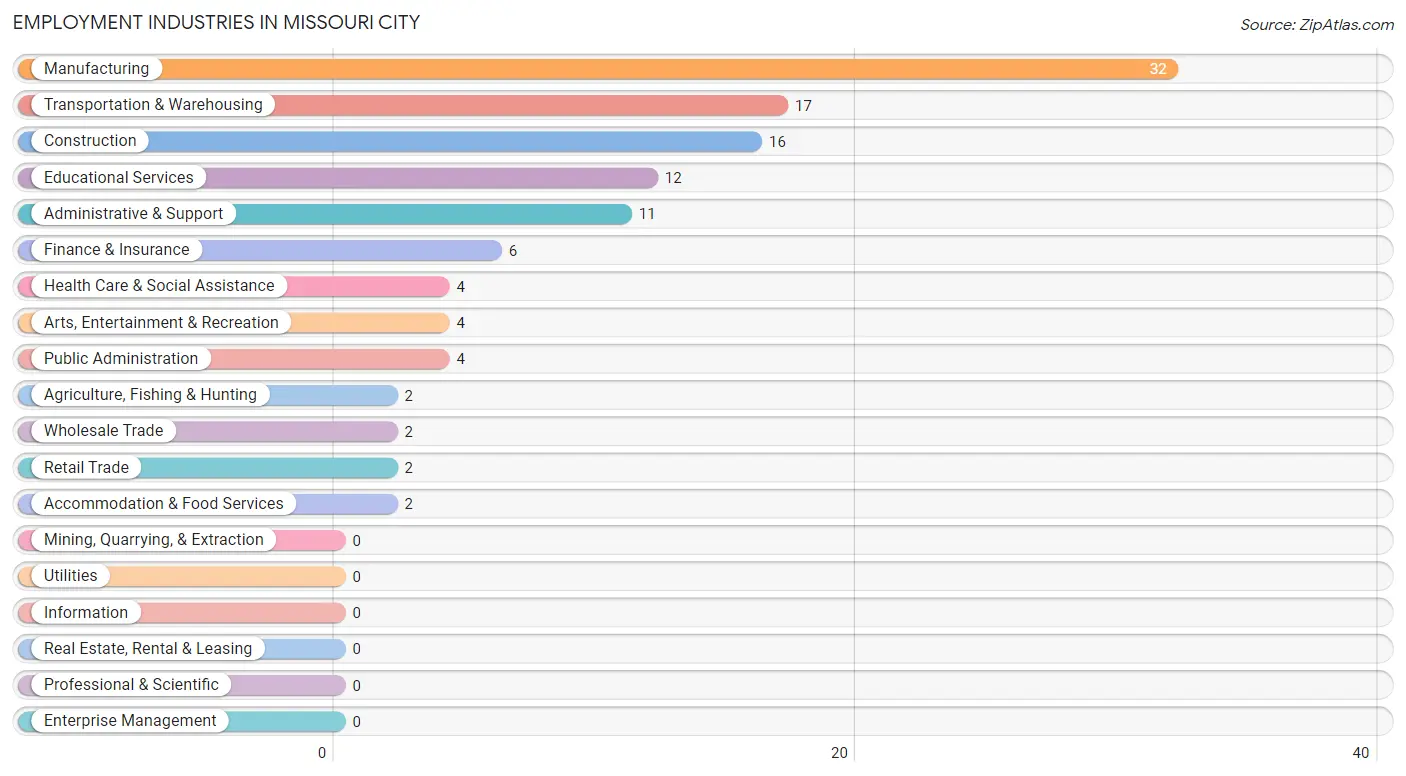
Employment Industries in Missouri City
The major employment industries in Missouri City include Manufacturing (32 | 26.2%), Transportation & Warehousing (17 | 13.9%), Construction (16 | 13.1%), Educational Services (12 | 9.8%), and Administrative & Support (11 | 9.0%).
Employment Industries by Sex in Missouri City
The Missouri City industries that see more men than women are Agriculture, Fishing & Hunting (100.0%), Construction (100.0%), and Retail Trade (100.0%), whereas the industries that tend to have a higher number of women are Finance & Insurance (100.0%), Health Care & Social Assistance (100.0%), and Public Administration (100.0%).
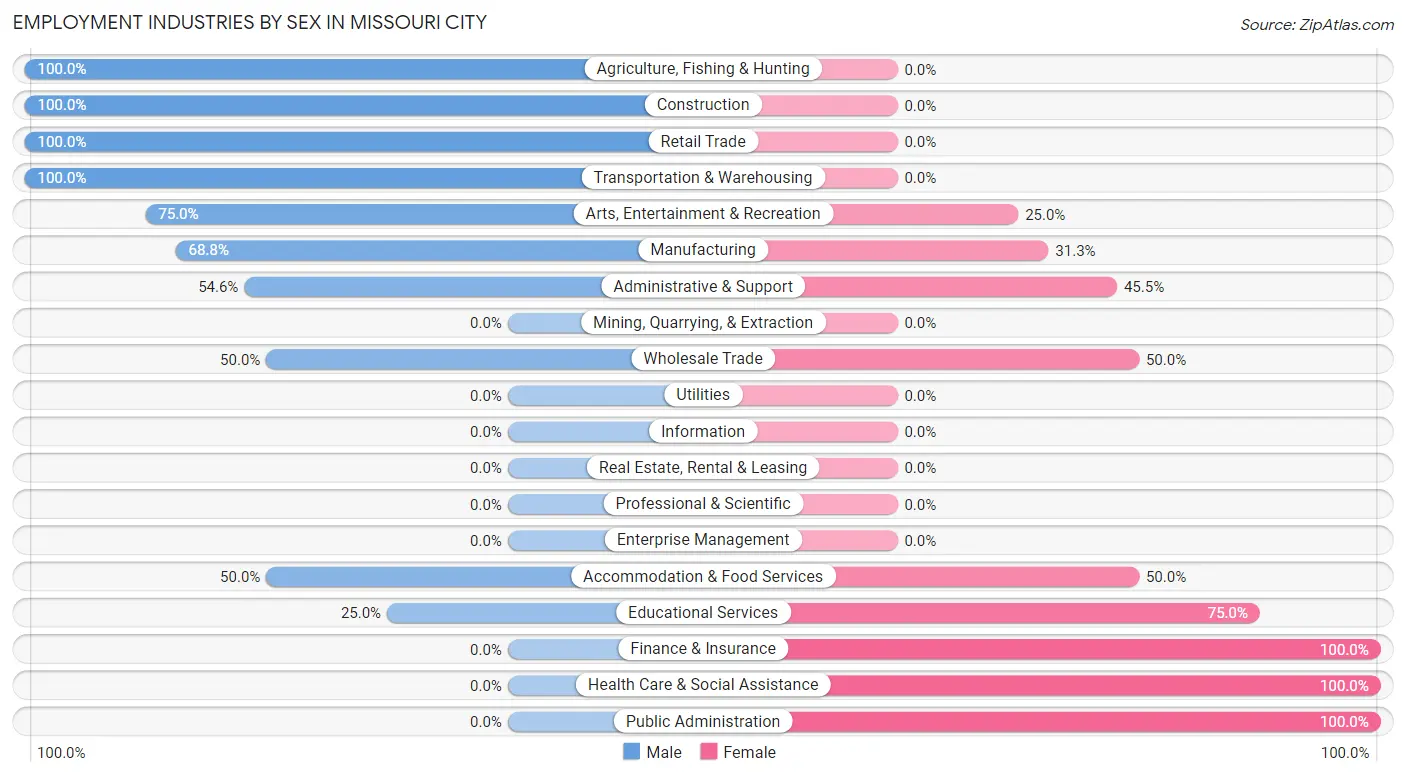
| Industry | Male | Female |
| Agriculture, Fishing & Hunting | 2 (100.0%) | 0 (0.0%) |
| Mining, Quarrying, & Extraction | 0 (0.0%) | 0 (0.0%) |
| Construction | 16 (100.0%) | 0 (0.0%) |
| Manufacturing | 22 (68.8%) | 10 (31.2%) |
| Wholesale Trade | 1 (50.0%) | 1 (50.0%) |
| Retail Trade | 2 (100.0%) | 0 (0.0%) |
| Transportation & Warehousing | 17 (100.0%) | 0 (0.0%) |
| Utilities | 0 (0.0%) | 0 (0.0%) |
| Information | 0 (0.0%) | 0 (0.0%) |
| Finance & Insurance | 0 (0.0%) | 6 (100.0%) |
| Real Estate, Rental & Leasing | 0 (0.0%) | 0 (0.0%) |
| Professional & Scientific | 0 (0.0%) | 0 (0.0%) |
| Enterprise Management | 0 (0.0%) | 0 (0.0%) |
| Administrative & Support | 6 (54.5%) | 5 (45.5%) |
| Educational Services | 3 (25.0%) | 9 (75.0%) |
| Health Care & Social Assistance | 0 (0.0%) | 4 (100.0%) |
| Arts, Entertainment & Recreation | 3 (75.0%) | 1 (25.0%) |
| Accommodation & Food Services | 1 (50.0%) | 1 (50.0%) |
| Public Administration | 0 (0.0%) | 4 (100.0%) |
| Total | 79 (64.7%) | 43 (35.2%) |
Education in Missouri City
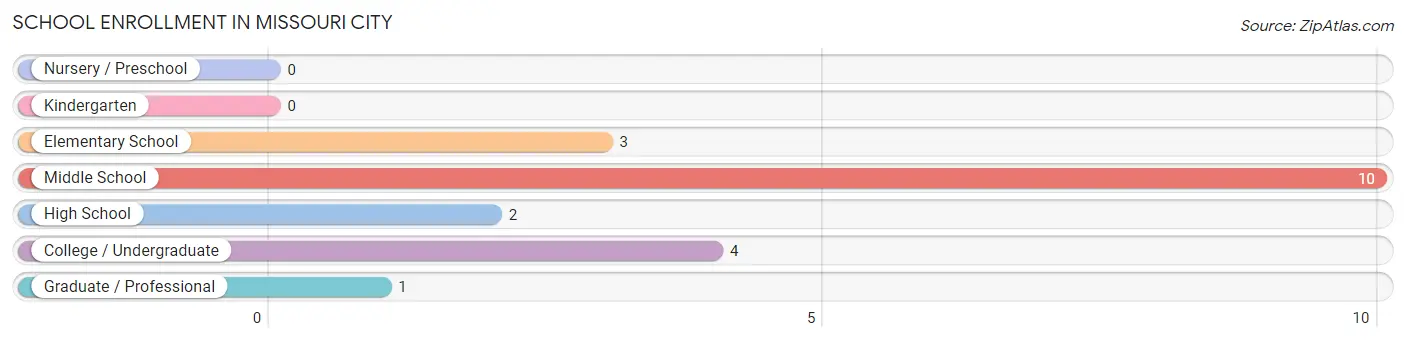
School Enrollment in Missouri City
The most common levels of schooling among the 20 students in Missouri City are middle school (10 | 50.0%), college / undergraduate (4 | 20.0%), and elementary school (3 | 15.0%).
| School Level | # Students | % Students |
| Nursery / Preschool | 0 | 0.0% |
| Kindergarten | 0 | 0.0% |
| Elementary School | 3 | 15.0% |
| Middle School | 10 | 50.0% |
| High School | 2 | 10.0% |
| College / Undergraduate | 4 | 20.0% |
| Graduate / Professional | 1 | 5.0% |
| Total | 20 | 100.0% |
School Enrollment by Age by Funding Source in Missouri City
Out of a total of 20 students who are enrolled in schools in Missouri City, 2 (10.0%) attend a private institution, while the remaining 18 (90.0%) are enrolled in public schools. The age group of 35 years and over has the highest likelihood of being enrolled in private schools, with 1 (100.0% in the age bracket) enrolled. Conversely, the age group of 5 to 9 year old has the lowest likelihood of being enrolled in a private school, with 3 (100.0% in the age bracket) attending a public institution.
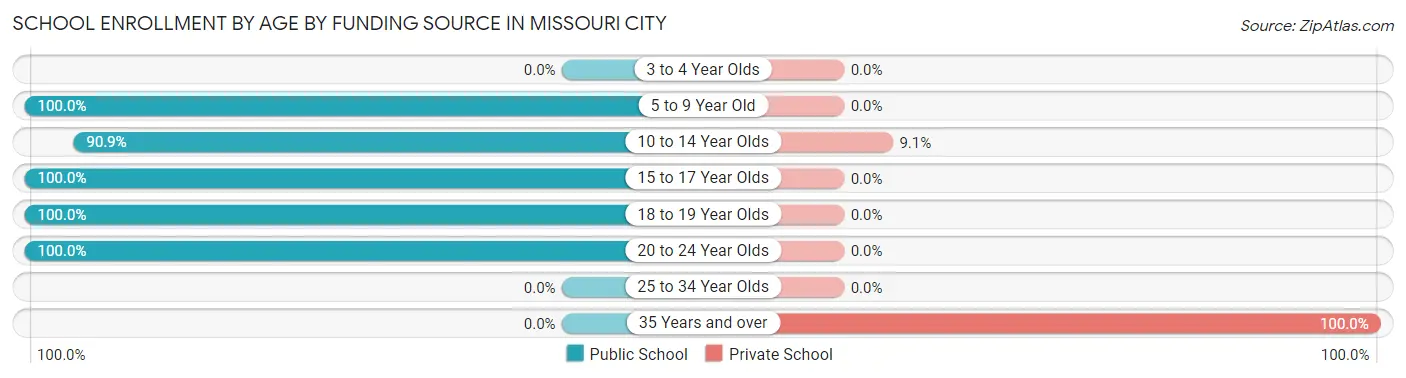
| Age Bracket | Public School | Private School |
| 3 to 4 Year Olds | 0 (0.0%) | 0 (0.0%) |
| 5 to 9 Year Old | 3 (100.0%) | 0 (0.0%) |
| 10 to 14 Year Olds | 10 (90.9%) | 1 (9.1%) |
| 15 to 17 Year Olds | 1 (100.0%) | 0 (0.0%) |
| 18 to 19 Year Olds | 3 (100.0%) | 0 (0.0%) |
| 20 to 24 Year Olds | 1 (100.0%) | 0 (0.0%) |
| 25 to 34 Year Olds | 0 (0.0%) | 0 (0.0%) |
| 35 Years and over | 0 (0.0%) | 1 (100.0%) |
| Total | 18 (90.0%) | 2 (10.0%) |
Educational Attainment by Field of Study in Missouri City
Education (12 | 50.0%), computers & mathematics (3 | 12.5%), business (3 | 12.5%), bio, nature & agricultural (2 | 8.3%), and arts & humanities (2 | 8.3%) are the most common fields of study among 24 individuals in Missouri City who have obtained a bachelor's degree or higher.
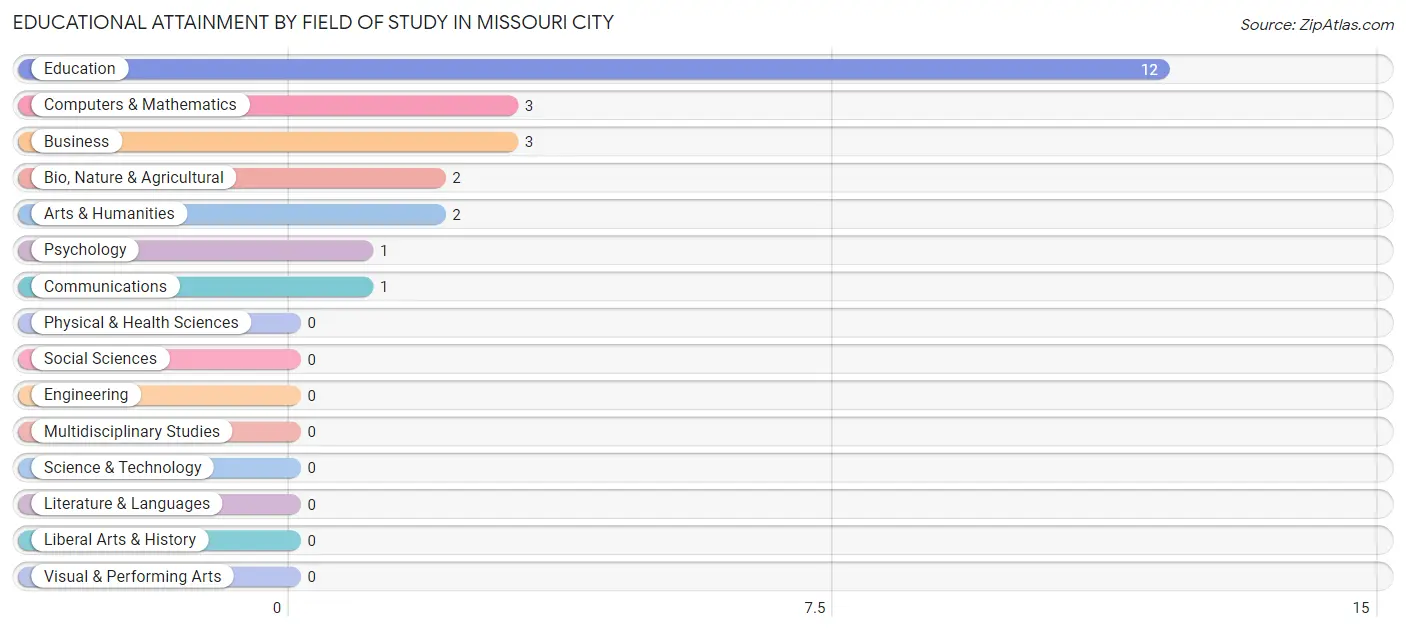
| Field of Study | # Graduates | % Graduates |
| Computers & Mathematics | 3 | 12.5% |
| Bio, Nature & Agricultural | 2 | 8.3% |
| Physical & Health Sciences | 0 | 0.0% |
| Psychology | 1 | 4.2% |
| Social Sciences | 0 | 0.0% |
| Engineering | 0 | 0.0% |
| Multidisciplinary Studies | 0 | 0.0% |
| Science & Technology | 0 | 0.0% |
| Business | 3 | 12.5% |
| Education | 12 | 50.0% |
| Literature & Languages | 0 | 0.0% |
| Liberal Arts & History | 0 | 0.0% |
| Visual & Performing Arts | 0 | 0.0% |
| Communications | 1 | 4.2% |
| Arts & Humanities | 2 | 8.3% |
| Total | 24 | 100.0% |
Transportation & Commute in Missouri City
Vehicle Availability by Sex in Missouri City
The most prevalent vehicle ownership categories in Missouri City are males with 2 vehicles (31, accounting for 39.2%) and females with 2 vehicles (11, making up 72.1%).
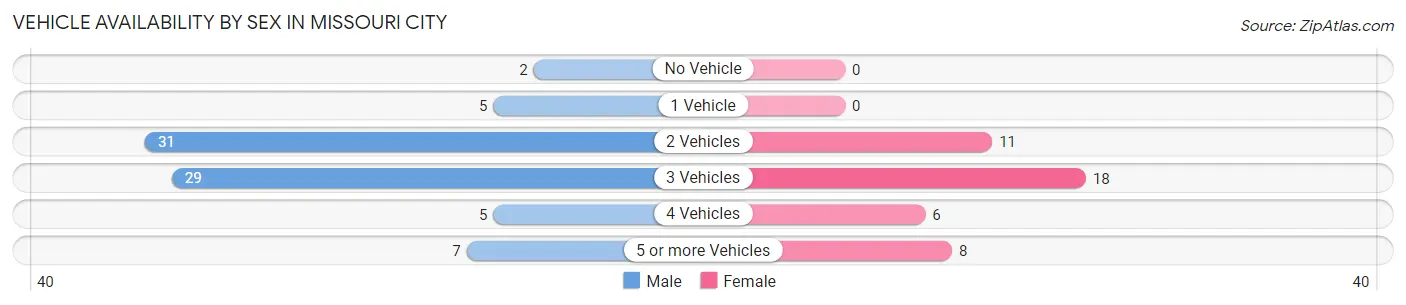
| Vehicles Available | Male | Female |
| No Vehicle | 2 (2.5%) | 0 (0.0%) |
| 1 Vehicle | 5 (6.3%) | 0 (0.0%) |
| 2 Vehicles | 31 (39.2%) | 11 (25.6%) |
| 3 Vehicles | 29 (36.7%) | 18 (41.9%) |
| 4 Vehicles | 5 (6.3%) | 6 (14.0%) |
| 5 or more Vehicles | 7 (8.9%) | 8 (18.6%) |
| Total | 79 (100.0%) | 43 (100.0%) |
Commute Time in Missouri City
The most frequently occuring commute durations in Missouri City are 15 to 19 minutes (25 commuters, 20.8%), 40 to 44 minutes (22 commuters, 18.3%), and 20 to 24 minutes (19 commuters, 15.8%).
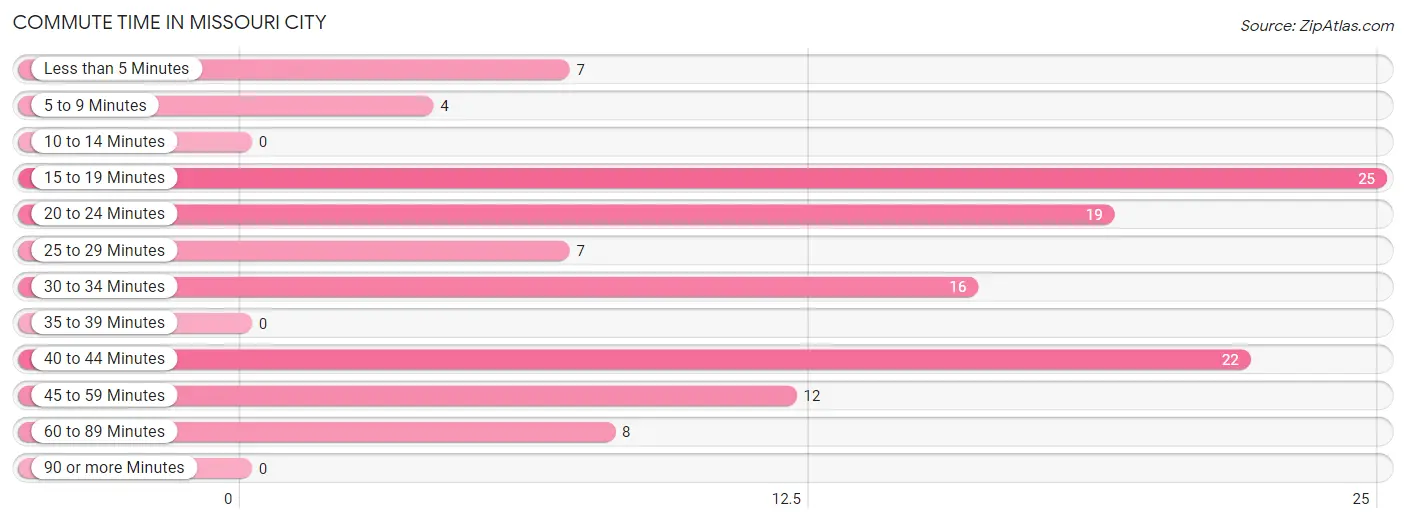
| Commute Time | # Commuters | % Commuters |
| Less than 5 Minutes | 7 | 5.8% |
| 5 to 9 Minutes | 4 | 3.3% |
| 10 to 14 Minutes | 0 | 0.0% |
| 15 to 19 Minutes | 25 | 20.8% |
| 20 to 24 Minutes | 19 | 15.8% |
| 25 to 29 Minutes | 7 | 5.8% |
| 30 to 34 Minutes | 16 | 13.3% |
| 35 to 39 Minutes | 0 | 0.0% |
| 40 to 44 Minutes | 22 | 18.3% |
| 45 to 59 Minutes | 12 | 10.0% |
| 60 to 89 Minutes | 8 | 6.7% |
| 90 or more Minutes | 0 | 0.0% |
Commute Time by Sex in Missouri City
The most common commute times in Missouri City are 40 to 44 minutes (18 commuters, 23.1%) for males and 15 to 19 minutes (11 commuters, 26.2%) for females.
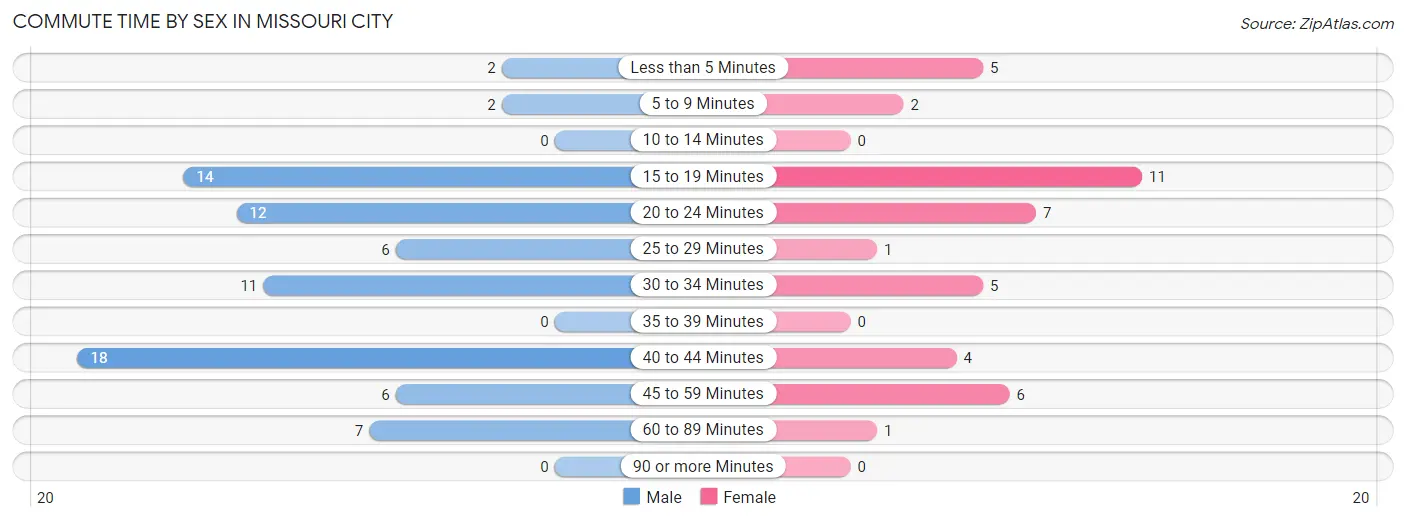
| Commute Time | Male | Female |
| Less than 5 Minutes | 2 (2.6%) | 5 (11.9%) |
| 5 to 9 Minutes | 2 (2.6%) | 2 (4.8%) |
| 10 to 14 Minutes | 0 (0.0%) | 0 (0.0%) |
| 15 to 19 Minutes | 14 (17.9%) | 11 (26.2%) |
| 20 to 24 Minutes | 12 (15.4%) | 7 (16.7%) |
| 25 to 29 Minutes | 6 (7.7%) | 1 (2.4%) |
| 30 to 34 Minutes | 11 (14.1%) | 5 (11.9%) |
| 35 to 39 Minutes | 0 (0.0%) | 0 (0.0%) |
| 40 to 44 Minutes | 18 (23.1%) | 4 (9.5%) |
| 45 to 59 Minutes | 6 (7.7%) | 6 (14.3%) |
| 60 to 89 Minutes | 7 (9.0%) | 1 (2.4%) |
| 90 or more Minutes | 0 (0.0%) | 0 (0.0%) |
Time of Departure to Work by Sex in Missouri City
The most frequent times of departure to work in Missouri City are 12:00 AM to 4:59 AM (35, 44.9%) for males and 12:00 AM to 4:59 AM (12, 28.6%) for females.
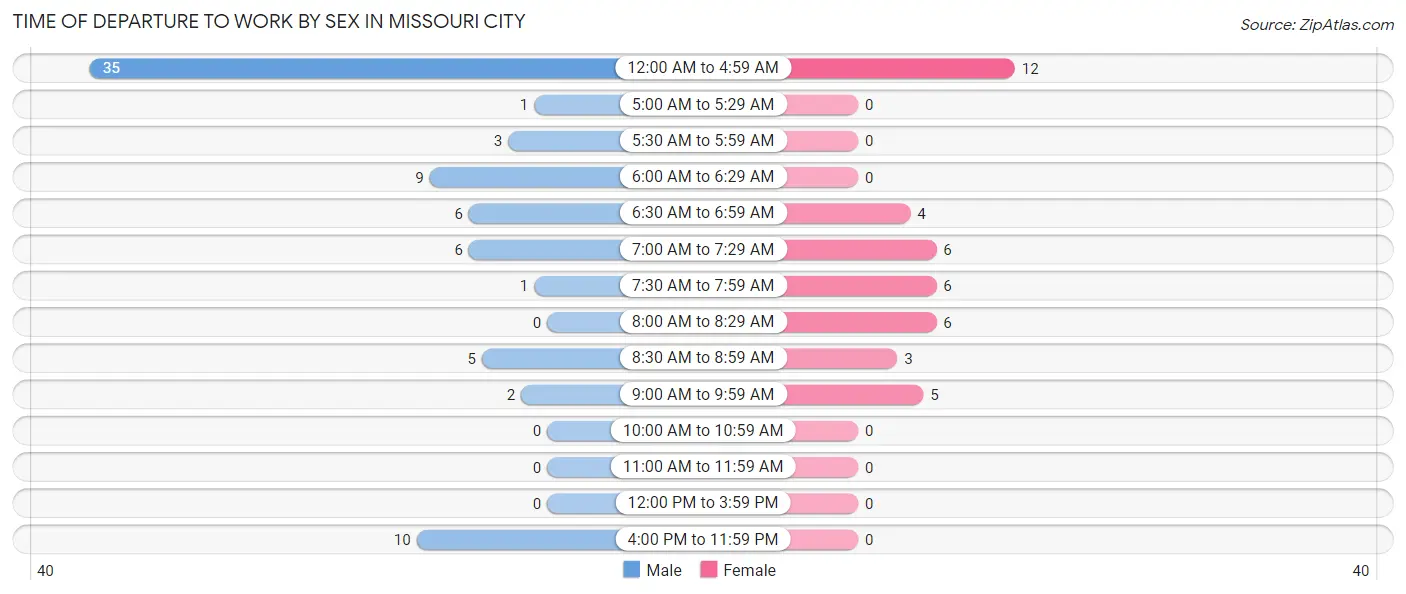
| Time of Departure | Male | Female |
| 12:00 AM to 4:59 AM | 35 (44.9%) | 12 (28.6%) |
| 5:00 AM to 5:29 AM | 1 (1.3%) | 0 (0.0%) |
| 5:30 AM to 5:59 AM | 3 (3.8%) | 0 (0.0%) |
| 6:00 AM to 6:29 AM | 9 (11.5%) | 0 (0.0%) |
| 6:30 AM to 6:59 AM | 6 (7.7%) | 4 (9.5%) |
| 7:00 AM to 7:29 AM | 6 (7.7%) | 6 (14.3%) |
| 7:30 AM to 7:59 AM | 1 (1.3%) | 6 (14.3%) |
| 8:00 AM to 8:29 AM | 0 (0.0%) | 6 (14.3%) |
| 8:30 AM to 8:59 AM | 5 (6.4%) | 3 (7.1%) |
| 9:00 AM to 9:59 AM | 2 (2.6%) | 5 (11.9%) |
| 10:00 AM to 10:59 AM | 0 (0.0%) | 0 (0.0%) |
| 11:00 AM to 11:59 AM | 0 (0.0%) | 0 (0.0%) |
| 12:00 PM to 3:59 PM | 0 (0.0%) | 0 (0.0%) |
| 4:00 PM to 11:59 PM | 10 (12.8%) | 0 (0.0%) |
| Total | 78 (100.0%) | 42 (100.0%) |
Housing Occupancy in Missouri City
Occupancy by Ownership in Missouri City
Of the total 146 dwellings in Missouri City, owner-occupied units account for 126 (86.3%), while renter-occupied units make up 20 (13.7%).
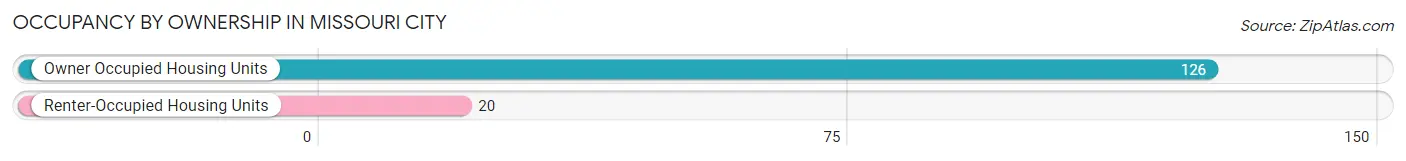
| Occupancy | # Housing Units | % Housing Units |
| Owner Occupied Housing Units | 126 | 86.3% |
| Renter-Occupied Housing Units | 20 | 13.7% |
| Total Occupied Housing Units | 146 | 100.0% |
Occupancy by Household Size in Missouri City
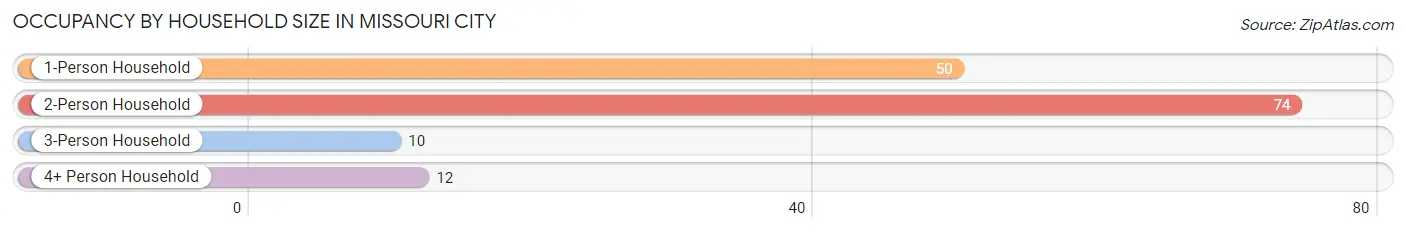
| Household Size | # Housing Units | % Housing Units |
| 1-Person Household | 50 | 34.3% |
| 2-Person Household | 74 | 50.7% |
| 3-Person Household | 10 | 6.9% |
| 4+ Person Household | 12 | 8.2% |
| Total Housing Units | 146 | 100.0% |
Occupancy by Ownership by Household Size in Missouri City
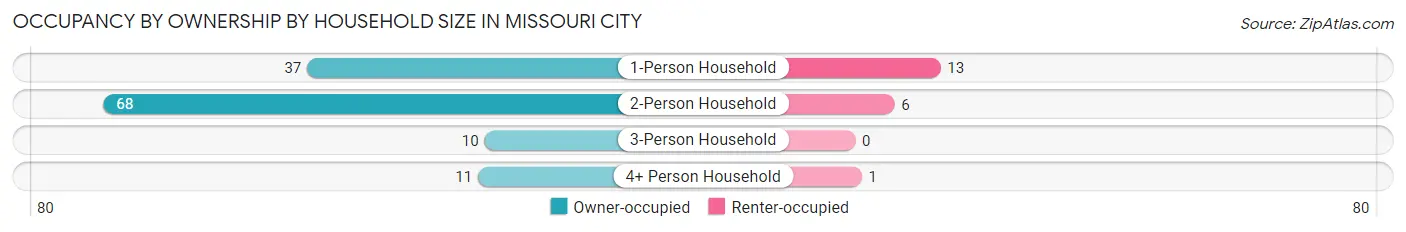
| Household Size | Owner-occupied | Renter-occupied |
| 1-Person Household | 37 (74.0%) | 13 (26.0%) |
| 2-Person Household | 68 (91.9%) | 6 (8.1%) |
| 3-Person Household | 10 (100.0%) | 0 (0.0%) |
| 4+ Person Household | 11 (91.7%) | 1 (8.3%) |
| Total Housing Units | 126 (86.3%) | 20 (13.7%) |
Occupancy by Educational Attainment in Missouri City
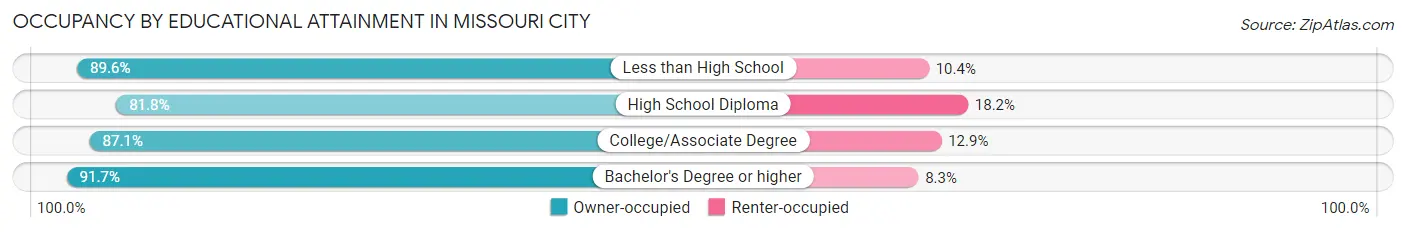
| Household Size | Owner-occupied | Renter-occupied |
| Less than High School | 43 (89.6%) | 5 (10.4%) |
| High School Diploma | 45 (81.8%) | 10 (18.2%) |
| College/Associate Degree | 27 (87.1%) | 4 (12.9%) |
| Bachelor's Degree or higher | 11 (91.7%) | 1 (8.3%) |
Occupancy by Age of Householder in Missouri City
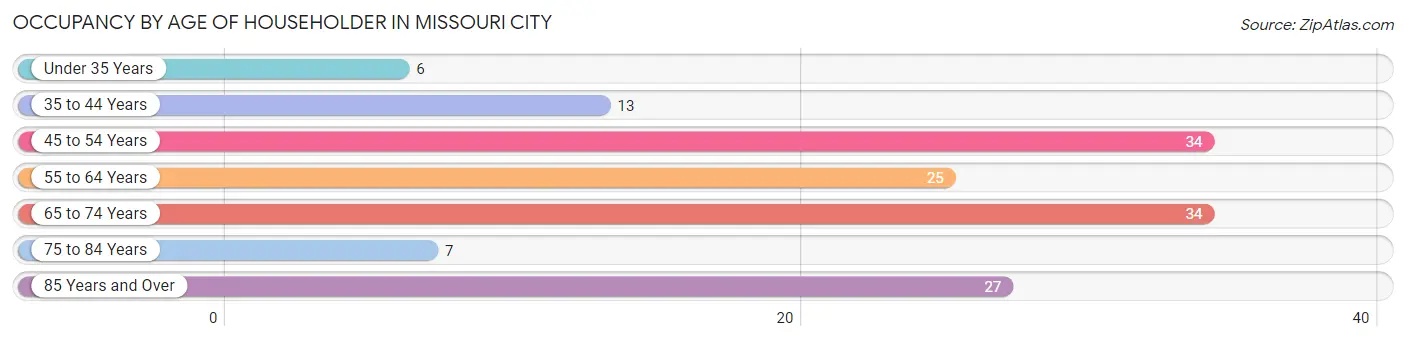
| Age Bracket | # Households | % Households |
| Under 35 Years | 6 | 4.1% |
| 35 to 44 Years | 13 | 8.9% |
| 45 to 54 Years | 34 | 23.3% |
| 55 to 64 Years | 25 | 17.1% |
| 65 to 74 Years | 34 | 23.3% |
| 75 to 84 Years | 7 | 4.8% |
| 85 Years and Over | 27 | 18.5% |
| Total | 146 | 100.0% |
Housing Finances in Missouri City
Median Income by Occupancy in Missouri City
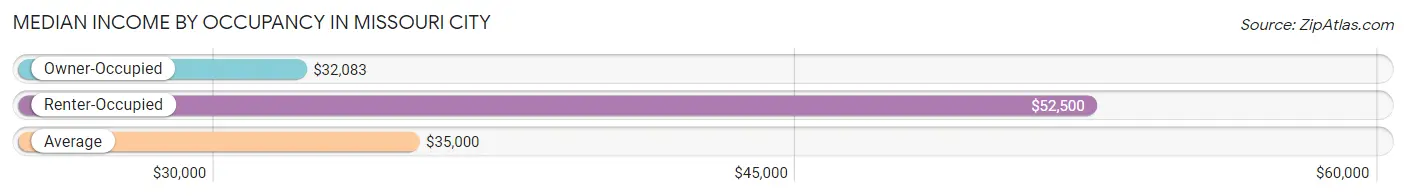
| Occupancy Type | # Households | Median Income |
| Owner-Occupied | 126 (86.3%) | $32,083 |
| Renter-Occupied | 20 (13.7%) | $52,500 |
| Average | 146 (100.0%) | $35,000 |
Occupancy by Householder Income Bracket in Missouri City
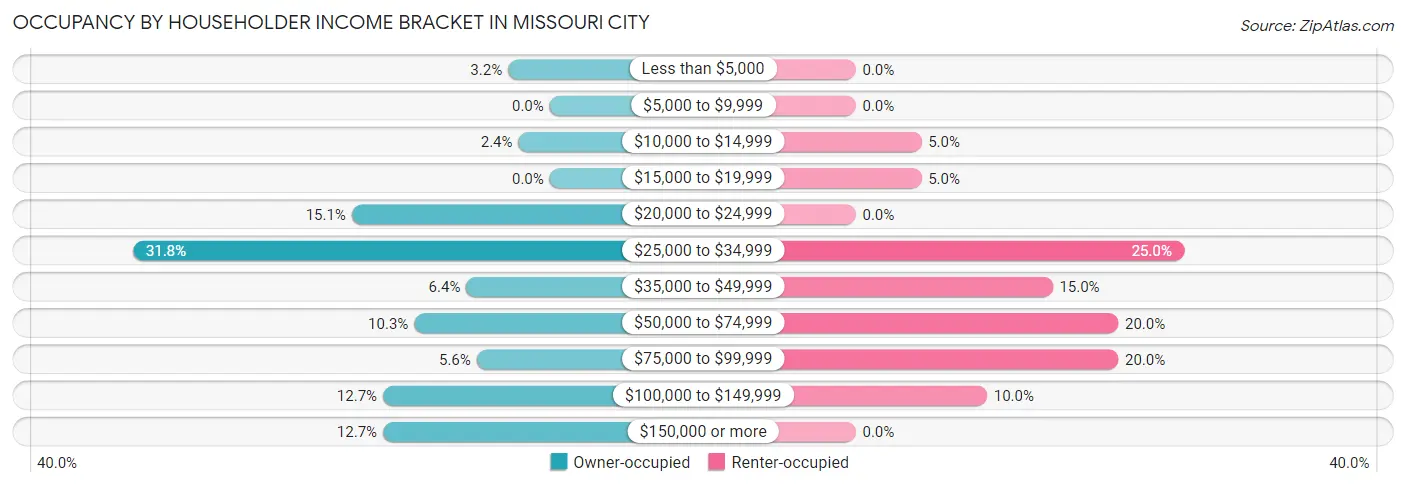
| Income Bracket | Owner-occupied | Renter-occupied |
| Less than $5,000 | 4 (3.2%) | 0 (0.0%) |
| $5,000 to $9,999 | 0 (0.0%) | 0 (0.0%) |
| $10,000 to $14,999 | 3 (2.4%) | 1 (5.0%) |
| $15,000 to $19,999 | 0 (0.0%) | 1 (5.0%) |
| $20,000 to $24,999 | 19 (15.1%) | 0 (0.0%) |
| $25,000 to $34,999 | 40 (31.8%) | 5 (25.0%) |
| $35,000 to $49,999 | 8 (6.4%) | 3 (15.0%) |
| $50,000 to $74,999 | 13 (10.3%) | 4 (20.0%) |
| $75,000 to $99,999 | 7 (5.6%) | 4 (20.0%) |
| $100,000 to $149,999 | 16 (12.7%) | 2 (10.0%) |
| $150,000 or more | 16 (12.7%) | 0 (0.0%) |
| Total | 126 (100.0%) | 20 (100.0%) |
Monthly Housing Cost Tiers in Missouri City
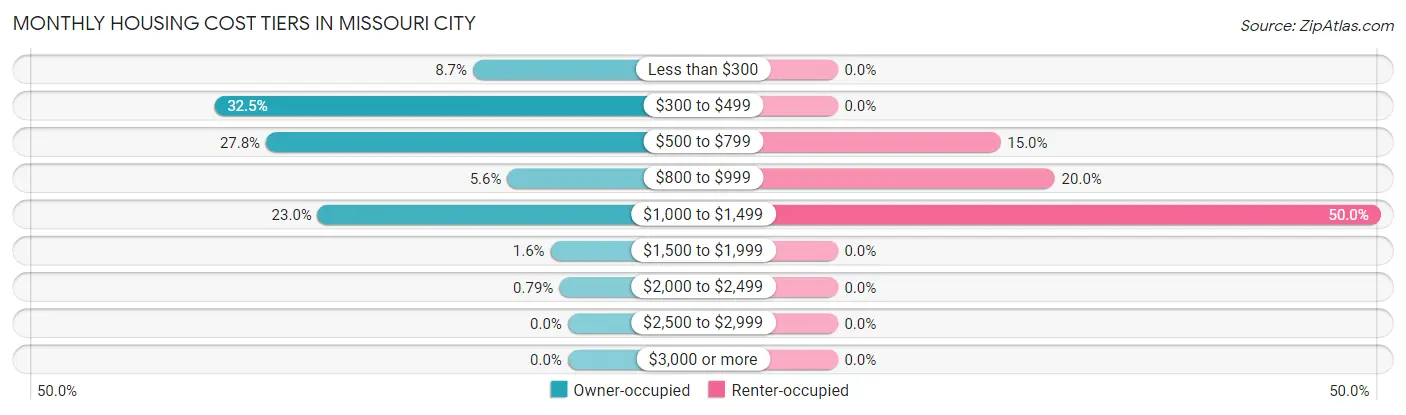
| Monthly Cost | Owner-occupied | Renter-occupied |
| Less than $300 | 11 (8.7%) | 0 (0.0%) |
| $300 to $499 | 41 (32.5%) | 0 (0.0%) |
| $500 to $799 | 35 (27.8%) | 3 (15.0%) |
| $800 to $999 | 7 (5.6%) | 4 (20.0%) |
| $1,000 to $1,499 | 29 (23.0%) | 10 (50.0%) |
| $1,500 to $1,999 | 2 (1.6%) | 0 (0.0%) |
| $2,000 to $2,499 | 1 (0.8%) | 0 (0.0%) |
| $2,500 to $2,999 | 0 (0.0%) | 0 (0.0%) |
| $3,000 or more | 0 (0.0%) | 0 (0.0%) |
| Total | 126 (100.0%) | 20 (100.0%) |
Physical Housing Characteristics in Missouri City
Housing Structures in Missouri City
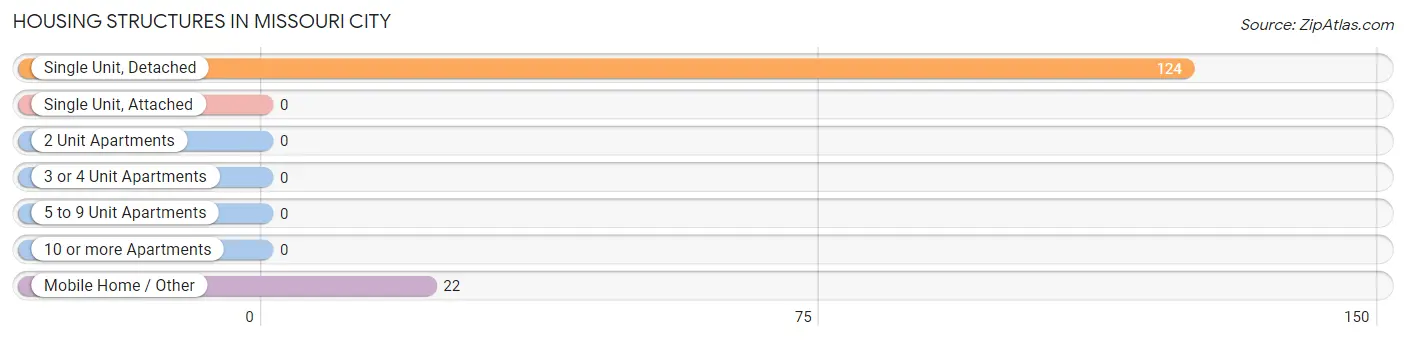
| Structure Type | # Housing Units | % Housing Units |
| Single Unit, Detached | 124 | 84.9% |
| Single Unit, Attached | 0 | 0.0% |
| 2 Unit Apartments | 0 | 0.0% |
| 3 or 4 Unit Apartments | 0 | 0.0% |
| 5 to 9 Unit Apartments | 0 | 0.0% |
| 10 or more Apartments | 0 | 0.0% |
| Mobile Home / Other | 22 | 15.1% |
| Total | 146 | 100.0% |
Housing Structures by Occupancy in Missouri City
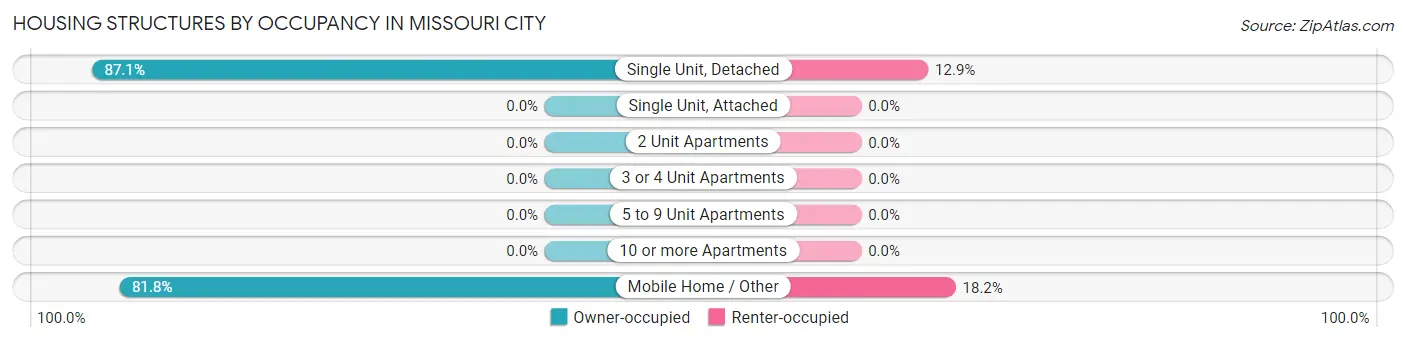
| Structure Type | Owner-occupied | Renter-occupied |
| Single Unit, Detached | 108 (87.1%) | 16 (12.9%) |
| Single Unit, Attached | 0 (0.0%) | 0 (0.0%) |
| 2 Unit Apartments | 0 (0.0%) | 0 (0.0%) |
| 3 or 4 Unit Apartments | 0 (0.0%) | 0 (0.0%) |
| 5 to 9 Unit Apartments | 0 (0.0%) | 0 (0.0%) |
| 10 or more Apartments | 0 (0.0%) | 0 (0.0%) |
| Mobile Home / Other | 18 (81.8%) | 4 (18.2%) |
| Total | 126 (86.3%) | 20 (13.7%) |
Housing Structures by Number of Rooms in Missouri City
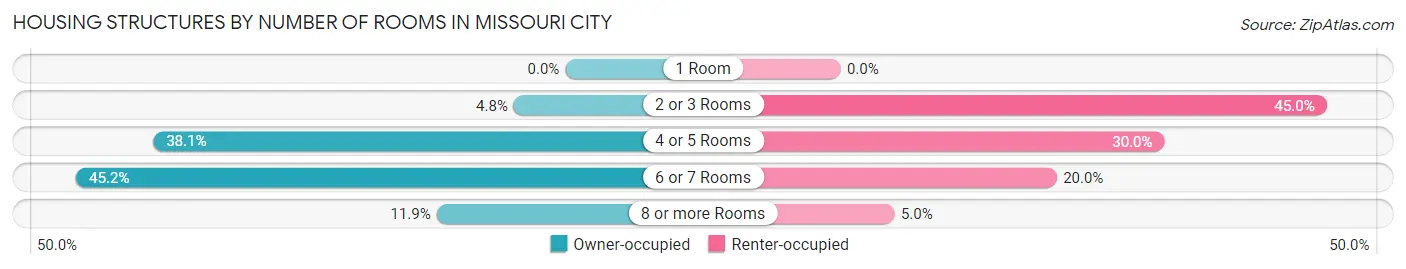
| Number of Rooms | Owner-occupied | Renter-occupied |
| 1 Room | 0 (0.0%) | 0 (0.0%) |
| 2 or 3 Rooms | 6 (4.8%) | 9 (45.0%) |
| 4 or 5 Rooms | 48 (38.1%) | 6 (30.0%) |
| 6 or 7 Rooms | 57 (45.2%) | 4 (20.0%) |
| 8 or more Rooms | 15 (11.9%) | 1 (5.0%) |
| Total | 126 (100.0%) | 20 (100.0%) |
Housing Structure by Heating Type in Missouri City
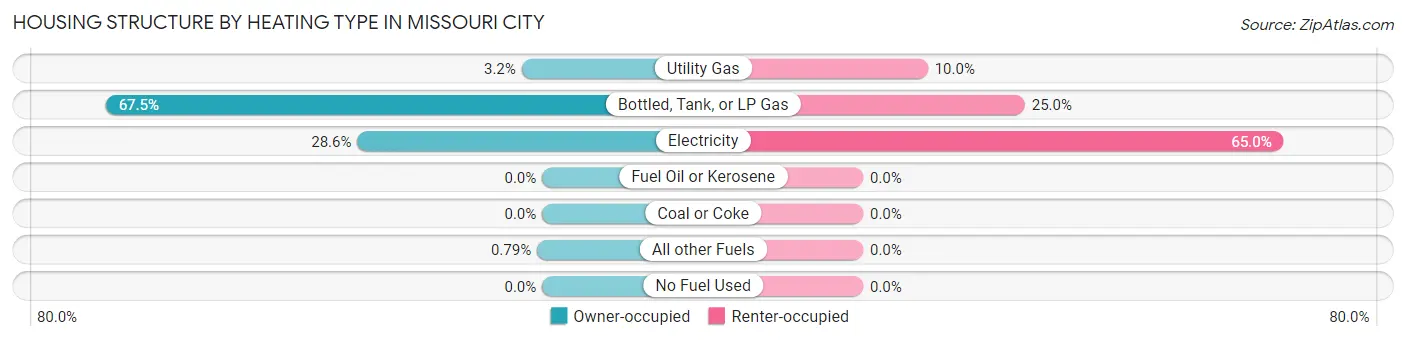
| Heating Type | Owner-occupied | Renter-occupied |
| Utility Gas | 4 (3.2%) | 2 (10.0%) |
| Bottled, Tank, or LP Gas | 85 (67.5%) | 5 (25.0%) |
| Electricity | 36 (28.6%) | 13 (65.0%) |
| Fuel Oil or Kerosene | 0 (0.0%) | 0 (0.0%) |
| Coal or Coke | 0 (0.0%) | 0 (0.0%) |
| All other Fuels | 1 (0.8%) | 0 (0.0%) |
| No Fuel Used | 0 (0.0%) | 0 (0.0%) |
| Total | 126 (100.0%) | 20 (100.0%) |
Household Vehicle Usage in Missouri City
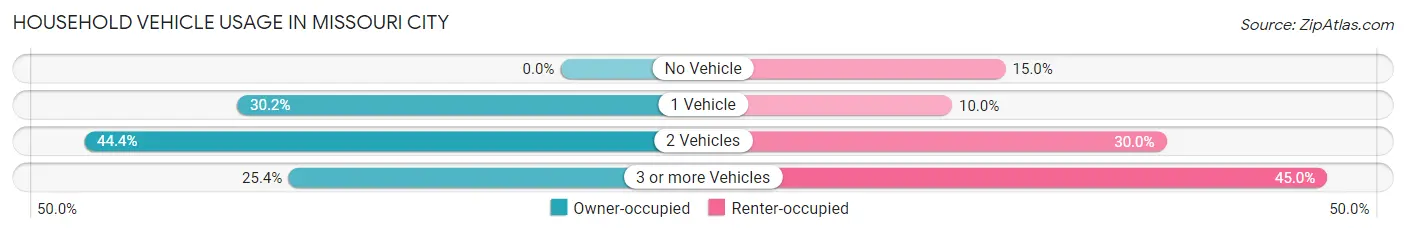
| Vehicles per Household | Owner-occupied | Renter-occupied |
| No Vehicle | 0 (0.0%) | 3 (15.0%) |
| 1 Vehicle | 38 (30.2%) | 2 (10.0%) |
| 2 Vehicles | 56 (44.4%) | 6 (30.0%) |
| 3 or more Vehicles | 32 (25.4%) | 9 (45.0%) |
| Total | 126 (100.0%) | 20 (100.0%) |
Real Estate & Mortgages in Missouri City
Real Estate and Mortgage Overview in Missouri City
| Characteristic | Without Mortgage | With Mortgage |
| Housing Units | 91 | 35 |
| Median Property Value | $75,000 | $66,600 |
| Median Household Income | $31,771 | $8 |
| Monthly Housing Costs | $396 | $0 |
| Real Estate Taxes | $777 | $0 |
Property Value by Mortgage Status in Missouri City
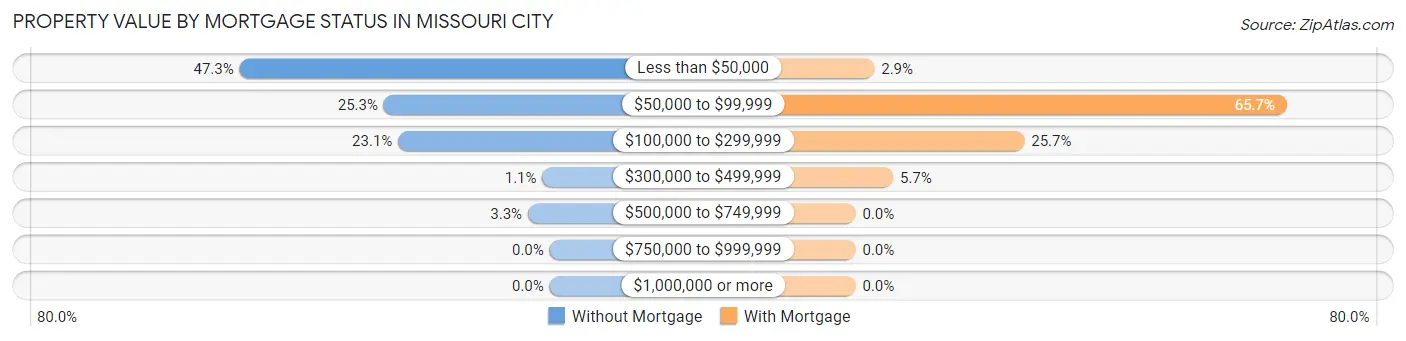
| Property Value | Without Mortgage | With Mortgage |
| Less than $50,000 | 43 (47.2%) | 1 (2.9%) |
| $50,000 to $99,999 | 23 (25.3%) | 23 (65.7%) |
| $100,000 to $299,999 | 21 (23.1%) | 9 (25.7%) |
| $300,000 to $499,999 | 1 (1.1%) | 2 (5.7%) |
| $500,000 to $749,999 | 3 (3.3%) | 0 (0.0%) |
| $750,000 to $999,999 | 0 (0.0%) | 0 (0.0%) |
| $1,000,000 or more | 0 (0.0%) | 0 (0.0%) |
| Total | 91 (100.0%) | 35 (100.0%) |
Household Income by Mortgage Status in Missouri City
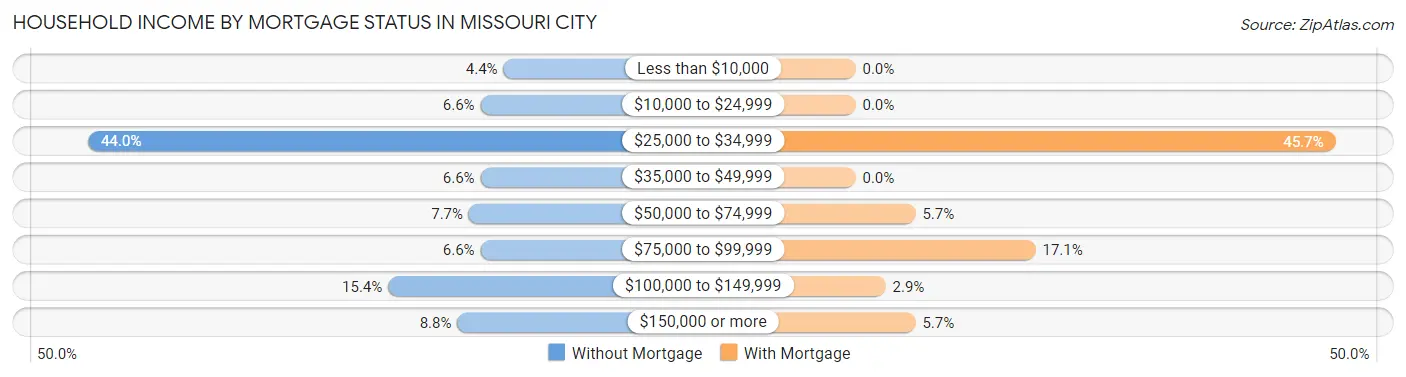
| Household Income | Without Mortgage | With Mortgage |
| Less than $10,000 | 4 (4.4%) | 0 (0.0%) |
| $10,000 to $24,999 | 6 (6.6%) | 0 (0.0%) |
| $25,000 to $34,999 | 40 (44.0%) | 16 (45.7%) |
| $35,000 to $49,999 | 6 (6.6%) | 0 (0.0%) |
| $50,000 to $74,999 | 7 (7.7%) | 2 (5.7%) |
| $75,000 to $99,999 | 6 (6.6%) | 6 (17.1%) |
| $100,000 to $149,999 | 14 (15.4%) | 1 (2.9%) |
| $150,000 or more | 8 (8.8%) | 2 (5.7%) |
| Total | 91 (100.0%) | 35 (100.0%) |
Property Value to Household Income Ratio in Missouri City
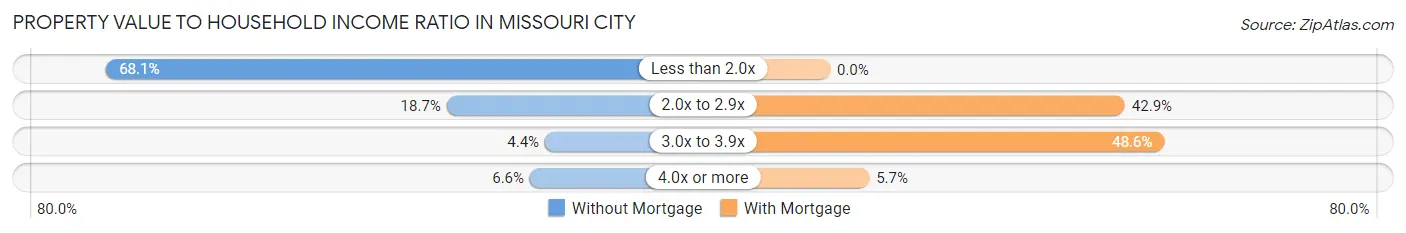
| Value-to-Income Ratio | Without Mortgage | With Mortgage |
| Less than 2.0x | 62 (68.1%) | 0 (0.0%) |
| 2.0x to 2.9x | 17 (18.7%) | 15 (42.9%) |
| 3.0x to 3.9x | 4 (4.4%) | 17 (48.6%) |
| 4.0x or more | 6 (6.6%) | 2 (5.7%) |
| Total | 91 (100.0%) | 35 (100.0%) |
Real Estate Taxes by Mortgage Status in Missouri City
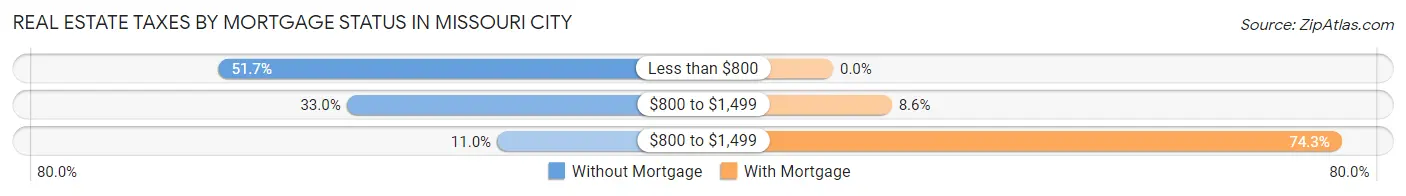
| Property Taxes | Without Mortgage | With Mortgage |
| Less than $800 | 47 (51.6%) | 0 (0.0%) |
| $800 to $1,499 | 30 (33.0%) | 3 (8.6%) |
| $800 to $1,499 | 10 (11.0%) | 26 (74.3%) |
| Total | 91 (100.0%) | 35 (100.0%) |
Health & Disability in Missouri City
Health Insurance Coverage by Age in Missouri City
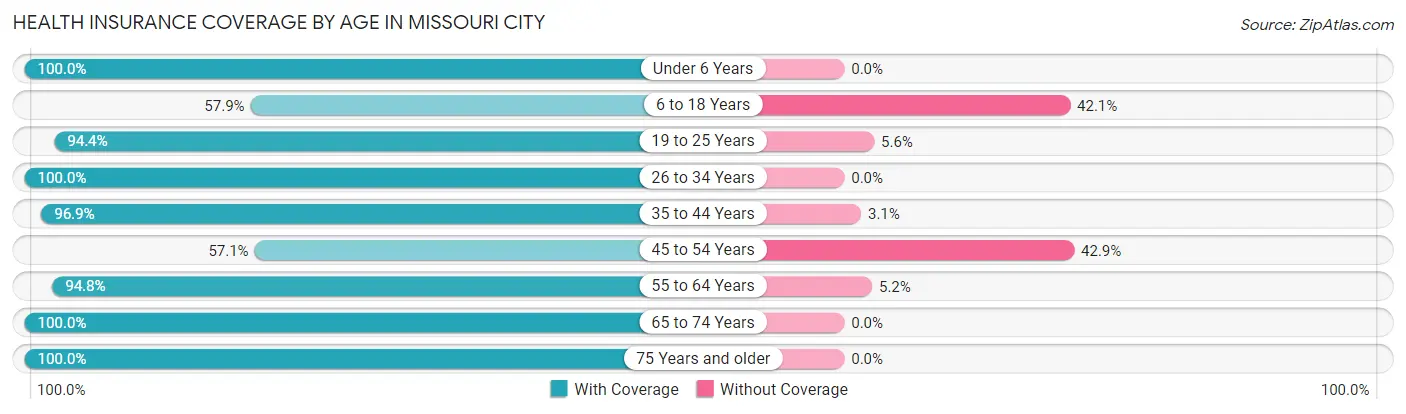
| Age Bracket | With Coverage | Without Coverage |
| Under 6 Years | 3 (100.0%) | 0 (0.0%) |
| 6 to 18 Years | 11 (57.9%) | 8 (42.1%) |
| 19 to 25 Years | 17 (94.4%) | 1 (5.6%) |
| 26 to 34 Years | 7 (100.0%) | 0 (0.0%) |
| 35 to 44 Years | 31 (96.9%) | 1 (3.1%) |
| 45 to 54 Years | 32 (57.1%) | 24 (42.9%) |
| 55 to 64 Years | 55 (94.8%) | 3 (5.2%) |
| 65 to 74 Years | 48 (100.0%) | 0 (0.0%) |
| 75 Years and older | 58 (100.0%) | 0 (0.0%) |
| Total | 262 (87.6%) | 37 (12.4%) |
Health Insurance Coverage by Citizenship Status in Missouri City
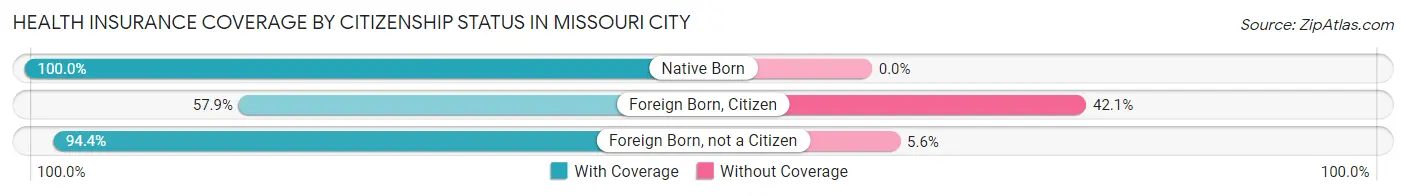
| Citizenship Status | With Coverage | Without Coverage |
| Native Born | 3 (100.0%) | 0 (0.0%) |
| Foreign Born, Citizen | 11 (57.9%) | 8 (42.1%) |
| Foreign Born, not a Citizen | 17 (94.4%) | 1 (5.6%) |
Health Insurance Coverage by Household Income in Missouri City
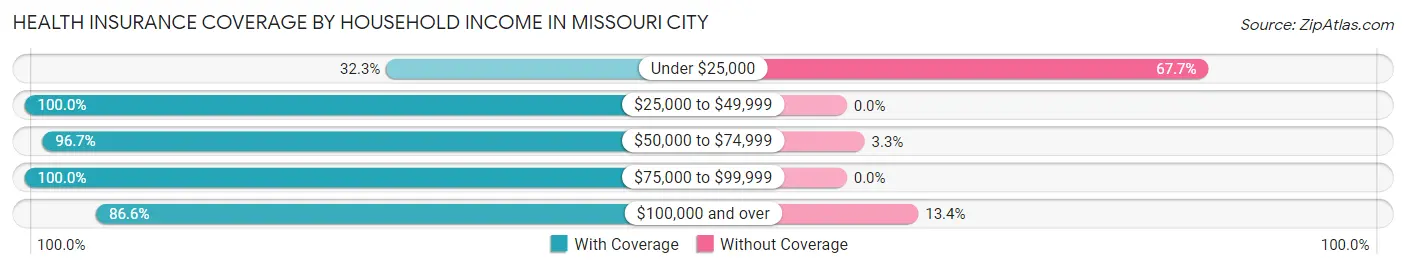
| Household Income | With Coverage | Without Coverage |
| Under $25,000 | 10 (32.3%) | 21 (67.7%) |
| $25,000 to $49,999 | 107 (100.0%) | 0 (0.0%) |
| $50,000 to $74,999 | 29 (96.7%) | 1 (3.3%) |
| $75,000 to $99,999 | 19 (100.0%) | 0 (0.0%) |
| $100,000 and over | 97 (86.6%) | 15 (13.4%) |
Public vs Private Health Insurance Coverage by Age in Missouri City
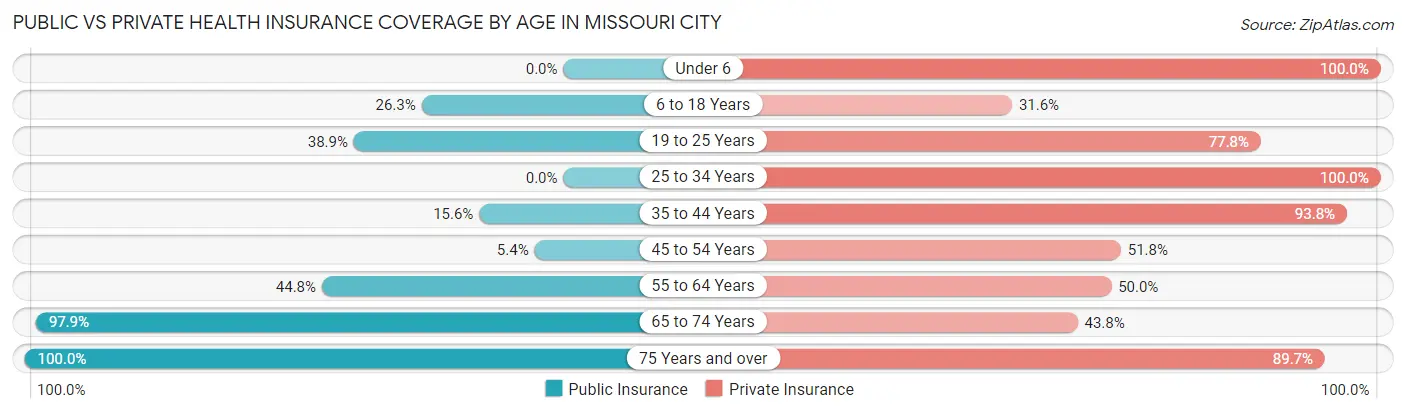
| Age Bracket | Public Insurance | Private Insurance |
| Under 6 | 0 (0.0%) | 3 (100.0%) |
| 6 to 18 Years | 5 (26.3%) | 6 (31.6%) |
| 19 to 25 Years | 7 (38.9%) | 14 (77.8%) |
| 25 to 34 Years | 0 (0.0%) | 7 (100.0%) |
| 35 to 44 Years | 5 (15.6%) | 30 (93.8%) |
| 45 to 54 Years | 3 (5.4%) | 29 (51.8%) |
| 55 to 64 Years | 26 (44.8%) | 29 (50.0%) |
| 65 to 74 Years | 47 (97.9%) | 21 (43.8%) |
| 75 Years and over | 58 (100.0%) | 52 (89.7%) |
| Total | 151 (50.5%) | 191 (63.9%) |
Disability Status by Sex by Age in Missouri City
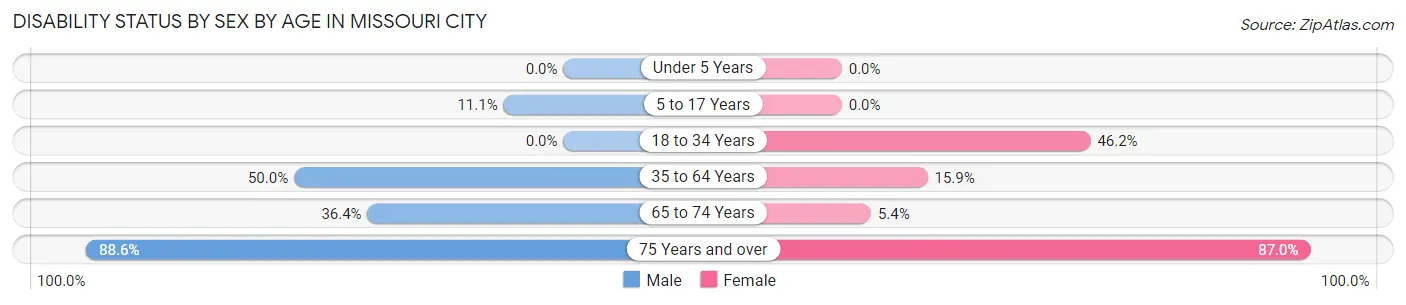
| Age Bracket | Male | Female |
| Under 5 Years | 0 (0.0%) | 0 (0.0%) |
| 5 to 17 Years | 1 (11.1%) | 0 (0.0%) |
| 18 to 34 Years | 0 (0.0%) | 6 (46.2%) |
| 35 to 64 Years | 51 (50.0%) | 7 (15.9%) |
| 65 to 74 Years | 4 (36.4%) | 2 (5.4%) |
| 75 Years and over | 31 (88.6%) | 20 (87.0%) |
Disability Class by Sex by Age in Missouri City
Disability Class: Hearing Difficulty
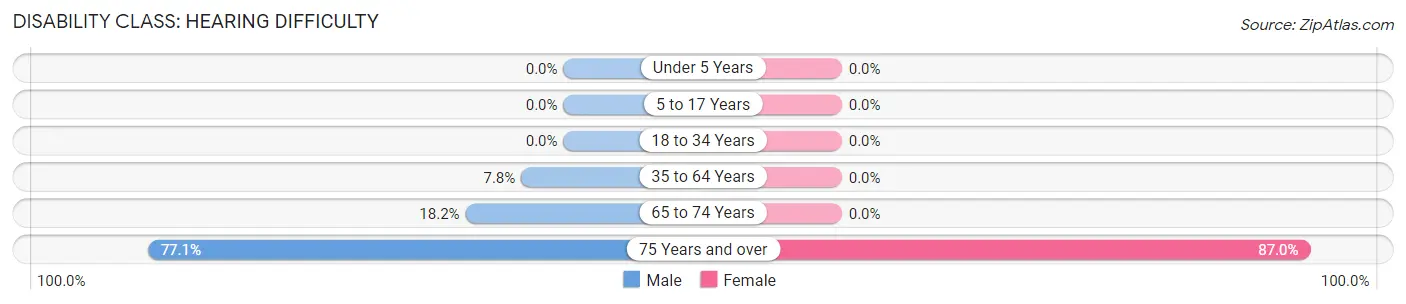
| Age Bracket | Male | Female |
| Under 5 Years | 0 (0.0%) | 0 (0.0%) |
| 5 to 17 Years | 0 (0.0%) | 0 (0.0%) |
| 18 to 34 Years | 0 (0.0%) | 0 (0.0%) |
| 35 to 64 Years | 8 (7.8%) | 0 (0.0%) |
| 65 to 74 Years | 2 (18.2%) | 0 (0.0%) |
| 75 Years and over | 27 (77.1%) | 20 (87.0%) |
Disability Class: Vision Difficulty
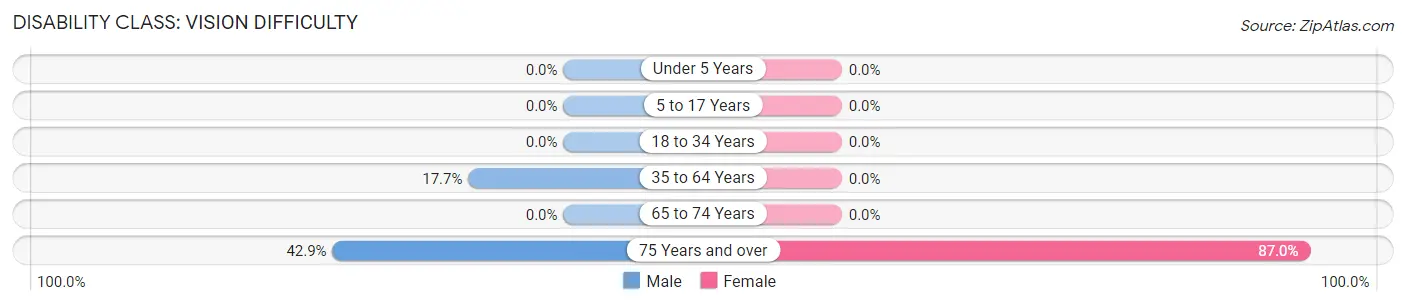
| Age Bracket | Male | Female |
| Under 5 Years | 0 (0.0%) | 0 (0.0%) |
| 5 to 17 Years | 0 (0.0%) | 0 (0.0%) |
| 18 to 34 Years | 0 (0.0%) | 0 (0.0%) |
| 35 to 64 Years | 18 (17.6%) | 0 (0.0%) |
| 65 to 74 Years | 0 (0.0%) | 0 (0.0%) |
| 75 Years and over | 15 (42.9%) | 20 (87.0%) |
Disability Class: Cognitive Difficulty
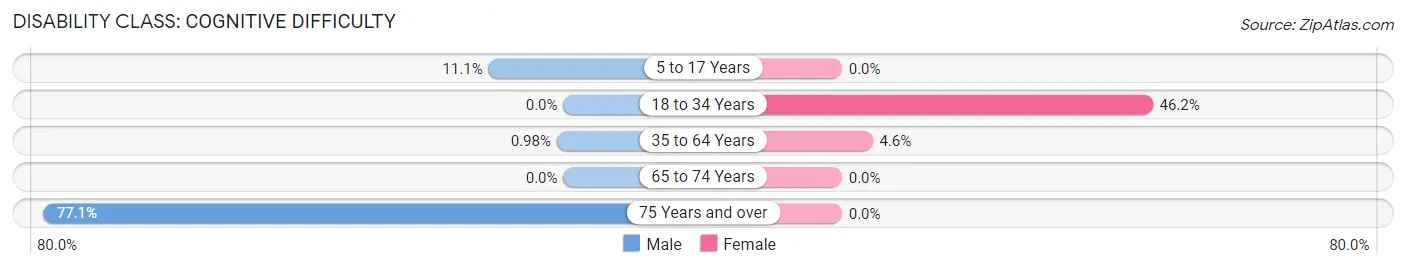
| Age Bracket | Male | Female |
| 5 to 17 Years | 1 (11.1%) | 0 (0.0%) |
| 18 to 34 Years | 0 (0.0%) | 6 (46.2%) |
| 35 to 64 Years | 1 (1.0%) | 2 (4.5%) |
| 65 to 74 Years | 0 (0.0%) | 0 (0.0%) |
| 75 Years and over | 27 (77.1%) | 0 (0.0%) |
Disability Class: Ambulatory Difficulty
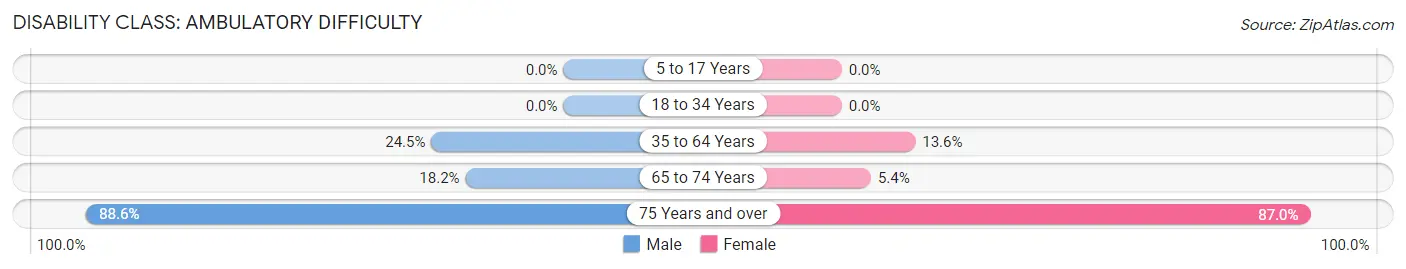
| Age Bracket | Male | Female |
| 5 to 17 Years | 0 (0.0%) | 0 (0.0%) |
| 18 to 34 Years | 0 (0.0%) | 0 (0.0%) |
| 35 to 64 Years | 25 (24.5%) | 6 (13.6%) |
| 65 to 74 Years | 2 (18.2%) | 2 (5.4%) |
| 75 Years and over | 31 (88.6%) | 20 (87.0%) |
Disability Class: Self-Care Difficulty
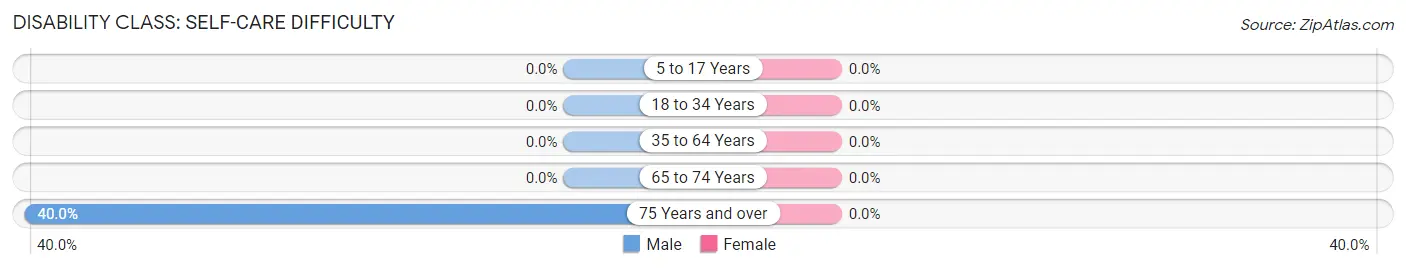
| Age Bracket | Male | Female |
| 5 to 17 Years | 0 (0.0%) | 0 (0.0%) |
| 18 to 34 Years | 0 (0.0%) | 0 (0.0%) |
| 35 to 64 Years | 0 (0.0%) | 0 (0.0%) |
| 65 to 74 Years | 0 (0.0%) | 0 (0.0%) |
| 75 Years and over | 14 (40.0%) | 0 (0.0%) |
Technology Access in Missouri City
Computing Device Access in Missouri City
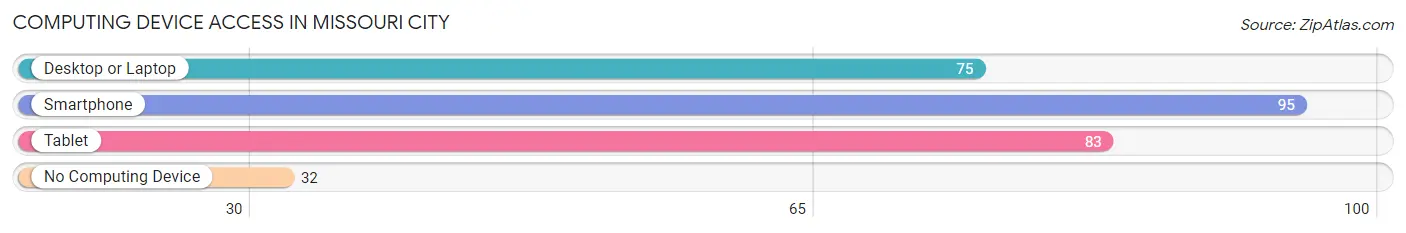
| Device Type | # Households | % Households |
| Desktop or Laptop | 75 | 51.4% |
| Smartphone | 95 | 65.1% |
| Tablet | 83 | 56.9% |
| No Computing Device | 32 | 21.9% |
| Total | 146 | 100.0% |
Internet Access in Missouri City
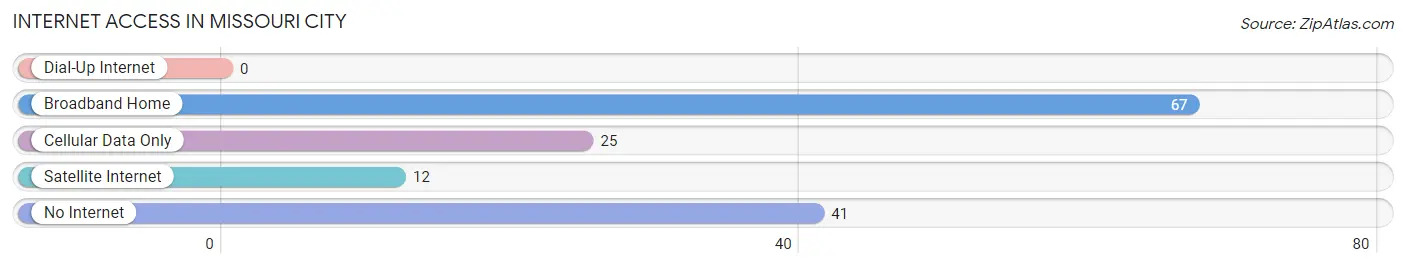
| Internet Type | # Households | % Households |
| Dial-Up Internet | 0 | 0.0% |
| Broadband Home | 67 | 45.9% |
| Cellular Data Only | 25 | 17.1% |
| Satellite Internet | 12 | 8.2% |
| No Internet | 41 | 28.1% |
| Total | 146 | 100.0% |
Missouri City Summary
Missouri City is a city located in the state of Missouri, United States. It is located in the southeastern corner of the state, and is part of the St. Louis metropolitan area. The city has a population of approximately 8,000 people, and is the county seat of St. Louis County.
Geography
Missouri City is located in the southeastern corner of Missouri, and is part of the St. Louis metropolitan area. The city is situated on the banks of the Mississippi River, and is bordered by the cities of St. Louis, St. Charles, and St. Peters. The city is located at an elevation of approximately 500 feet above sea level.
The city has a total area of 4.2 square miles, of which 4.1 square miles is land and 0.1 square miles is water. The city is located in a humid continental climate zone, with hot summers and cold winters.
History
Missouri City was founded in 1819 by a group of settlers from Kentucky. The city was originally named “New Kentucky”, but was later changed to Missouri City. The city was incorporated in 1837, and was the first city in the state to be incorporated.
The city was an important port city during the 19th century, and was a major hub for the steamboat industry. The city was also an important center for the cotton industry, and was home to several cotton mills.
The city was also an important center for the railroad industry, and was home to several major railroads. The city was also home to several major manufacturing companies, including the St. Louis Car Company and the Missouri Car Company.
Economy
The economy of Missouri City is largely based on the service industry. The city is home to several major hospitals, including St. Louis University Hospital and Barnes-Jewish Hospital. The city is also home to several major universities, including Washington University in St. Louis and St. Louis University.
The city is also home to several major corporations, including Monsanto, Express Scripts, and Emerson Electric. The city is also home to several major retail stores, including Target, Walmart, and Best Buy.
Demographics
As of the 2010 census, the population of Missouri City was 8,000 people. The racial makeup of the city was 79.2% White, 15.2% African American, 0.3% Native American, 1.2% Asian, 0.1% Pacific Islander, and 3.9% from other races. Hispanic or Latino of any race were 5.2% of the population.
The median income for a household in the city was $45,000, and the median income for a family was $50,000. The per capita income for the city was $20,000. About 11.2% of families and 14.2% of the population were below the poverty line, including 18.2% of those under age 18 and 8.2% of those age 65 or over.
Conclusion
Missouri City is a city located in the southeastern corner of Missouri, United States. It is part of the St. Louis metropolitan area, and has a population of approximately 8,000 people. The city has a humid continental climate, and is home to several major hospitals, universities, and corporations. The economy of the city is largely based on the service industry, and the median income for a household is $45,000. The racial makeup of the city is 79.2% White, 15.2% African American, 0.3% Native American, 1.2% Asian, 0.1% Pacific Islander, and 3.9% from other races.
Common Questions
What is Per Capita Income in Missouri City?
Per Capita income in Missouri City is $34,906.
What is the Median Family Income in Missouri City?
Median Family Income in Missouri City is $53,125.
What is the Median Household income in Missouri City?
Median Household Income in Missouri City is $35,000.
What is Income or Wage Gap in Missouri City?
Income or Wage Gap in Missouri City is 0.5%.
Women in Missouri City earn 99.5 cents for every dollar earned by a man.
What is Inequality or Gini Index in Missouri City?
Inequality or Gini Index in Missouri City is 0.44.
What is the Total Population of Missouri City?
Total Population of Missouri City is 299.
What is the Total Male Population of Missouri City?
Total Male Population of Missouri City is 175.
What is the Total Female Population of Missouri City?
Total Female Population of Missouri City is 124.
What is the Ratio of Males per 100 Females in Missouri City?
There are 141.13 Males per 100 Females in Missouri City.
What is the Ratio of Females per 100 Males in Missouri City?
There are 70.86 Females per 100 Males in Missouri City.
What is the Median Population Age in Missouri City?
Median Population Age in Missouri City is 57.9 Years.
What is the Average Family Size in Missouri City
Average Family Size in Missouri City is 2.6 People.
What is the Average Household Size in Missouri City
Average Household Size in Missouri City is 2.0 People.
How Large is the Labor Force in Missouri City?
There are 129 People in the Labor Forcein in Missouri City.
What is the Percentage of People in the Labor Force in Missouri City?
45.9% of People are in the Labor Force in Missouri City.
What is the Unemployment Rate in Missouri City?
Unemployment Rate in Missouri City is 5.4%.