Palmetto, GA Map & Demographics
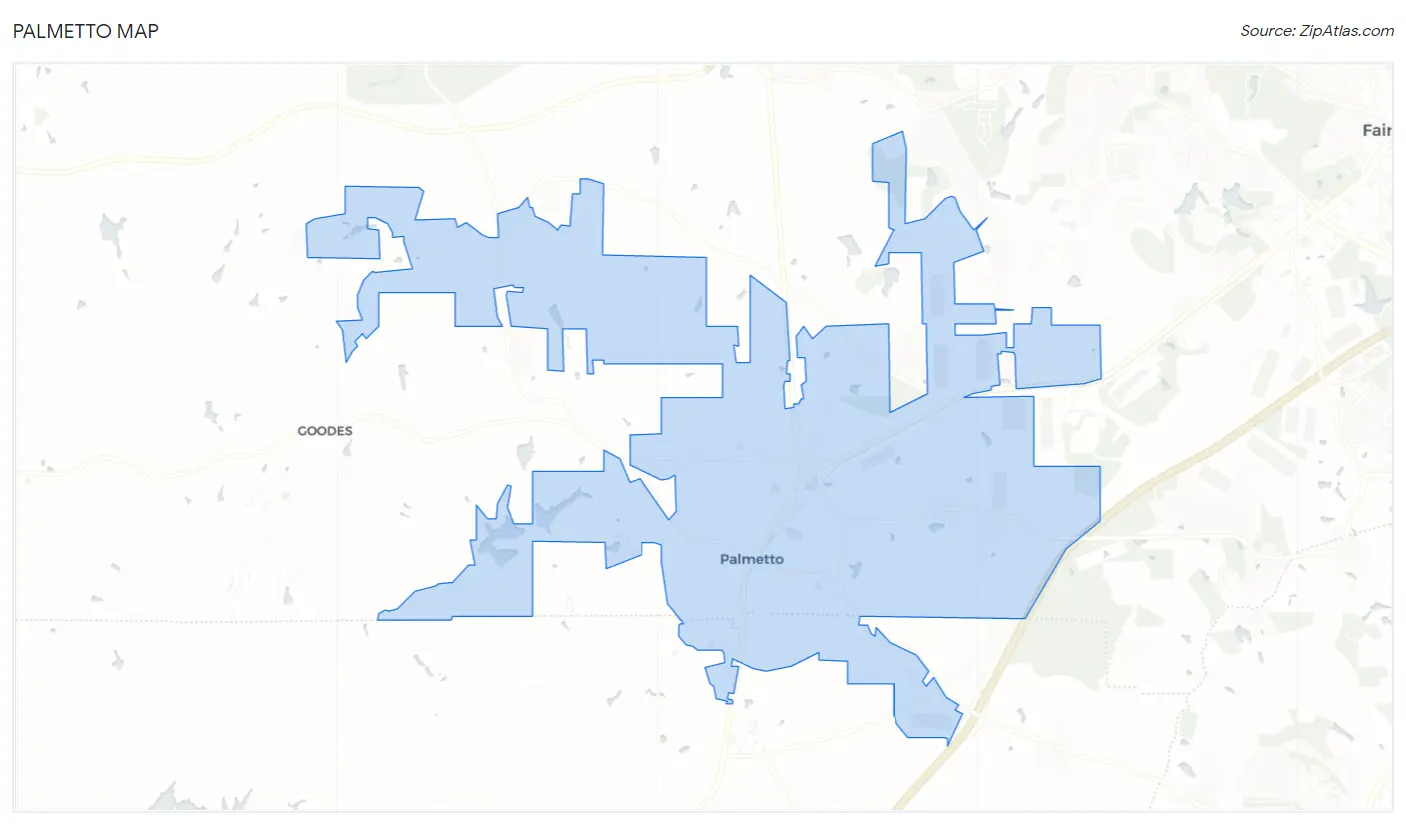
Palmetto Map
Palmetto Overview
$30,907
PER CAPITA INCOME
$83,523
AVG FAMILY INCOME
$52,444
AVG HOUSEHOLD INCOME
3.1%
WAGE / INCOME GAP [ % ]
96.9¢/ $1
WAGE / INCOME GAP [ $ ]
0.37
INEQUALITY / GINI INDEX
4,650
TOTAL POPULATION
2,119
MALE POPULATION
2,531
FEMALE POPULATION
83.72
MALES / 100 FEMALES
119.44
FEMALES / 100 MALES
38.2
MEDIAN AGE
3.2
AVG FAMILY SIZE
2.4
AVG HOUSEHOLD SIZE
2,619
LABOR FORCE [ PEOPLE ]
70.6%
PERCENT IN LABOR FORCE
6.9%
UNEMPLOYMENT RATE
Palmetto Zip Codes
Palmetto Area Codes
Income in Palmetto
Income Overview in Palmetto
Per Capita Income in Palmetto is $30,907, while median incomes of families and households are $83,523 and $52,444 respectively.
| Characteristic | Number | Measure |
| Per Capita Income | 4,650 | $30,907 |
| Median Family Income | 1,168 | $83,523 |
| Mean Family Income | 1,168 | $89,019 |
| Median Household Income | 1,880 | $52,444 |
| Mean Household Income | 1,880 | $73,478 |
| Income Deficit | 1,168 | $0 |
| Wage / Income Gap (%) | 4,650 | 3.05% |
| Wage / Income Gap ($) | 4,650 | 96.95¢ per $1 |
| Gini / Inequality Index | 4,650 | 0.37 |
Earnings by Sex in Palmetto
Average Earnings in Palmetto are $35,000, $34,424 for men and $35,507 for women, a difference of 3.0%.
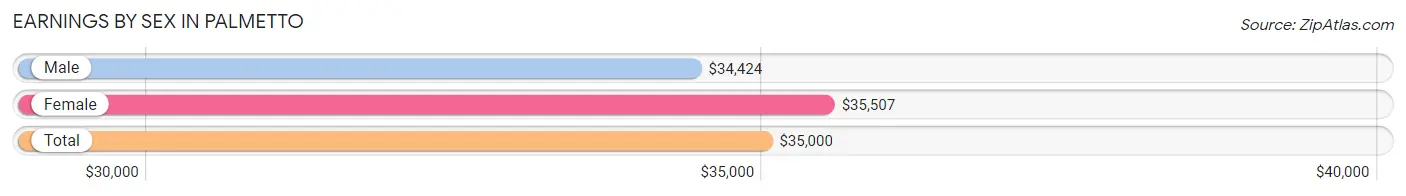
| Sex | Number | Average Earnings |
| Male | 1,397 (50.3%) | $34,424 |
| Female | 1,379 (49.7%) | $35,507 |
| Total | 2,776 (100.0%) | $35,000 |
Earnings by Sex by Income Bracket in Palmetto
The most common earnings brackets in Palmetto are $50,000 to $54,999 for men (162 | 11.6%) and $75,000 to $99,999 for women (223 | 16.2%).
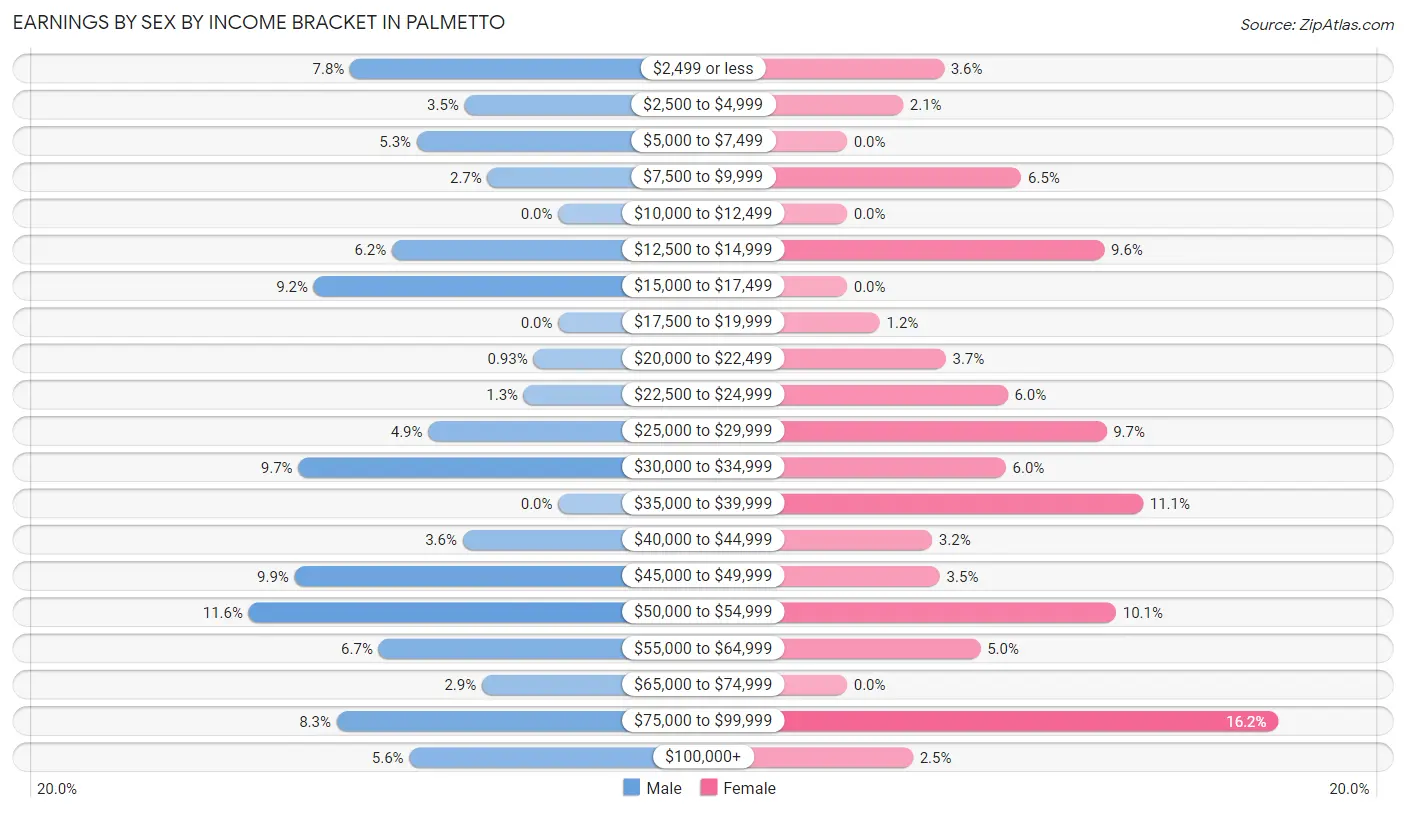
| Income | Male | Female |
| $2,499 or less | 109 (7.8%) | 50 (3.6%) |
| $2,500 to $4,999 | 49 (3.5%) | 29 (2.1%) |
| $5,000 to $7,499 | 74 (5.3%) | 0 (0.0%) |
| $7,500 to $9,999 | 37 (2.6%) | 90 (6.5%) |
| $10,000 to $12,499 | 0 (0.0%) | 0 (0.0%) |
| $12,500 to $14,999 | 87 (6.2%) | 133 (9.6%) |
| $15,000 to $17,499 | 128 (9.2%) | 0 (0.0%) |
| $17,500 to $19,999 | 0 (0.0%) | 17 (1.2%) |
| $20,000 to $22,499 | 13 (0.9%) | 51 (3.7%) |
| $22,500 to $24,999 | 18 (1.3%) | 83 (6.0%) |
| $25,000 to $29,999 | 68 (4.9%) | 134 (9.7%) |
| $30,000 to $34,999 | 136 (9.7%) | 82 (5.9%) |
| $35,000 to $39,999 | 0 (0.0%) | 153 (11.1%) |
| $40,000 to $44,999 | 50 (3.6%) | 44 (3.2%) |
| $45,000 to $49,999 | 138 (9.9%) | 48 (3.5%) |
| $50,000 to $54,999 | 162 (11.6%) | 139 (10.1%) |
| $55,000 to $64,999 | 94 (6.7%) | 69 (5.0%) |
| $65,000 to $74,999 | 40 (2.9%) | 0 (0.0%) |
| $75,000 to $99,999 | 116 (8.3%) | 223 (16.2%) |
| $100,000+ | 78 (5.6%) | 34 (2.5%) |
| Total | 1,397 (100.0%) | 1,379 (100.0%) |
Earnings by Sex by Educational Attainment in Palmetto
Average earnings in Palmetto are $46,123 for men and $37,524 for women, a difference of 18.6%. Men with an educational attainment of bachelor's degree enjoy the highest average annual earnings of $140,905, while those with college or associate's degree education earn the least with $47,349. Women with an educational attainment of graduate degree earn the most with the average annual earnings of $75,972, while those with less than high school education have the smallest earnings of $28,787.
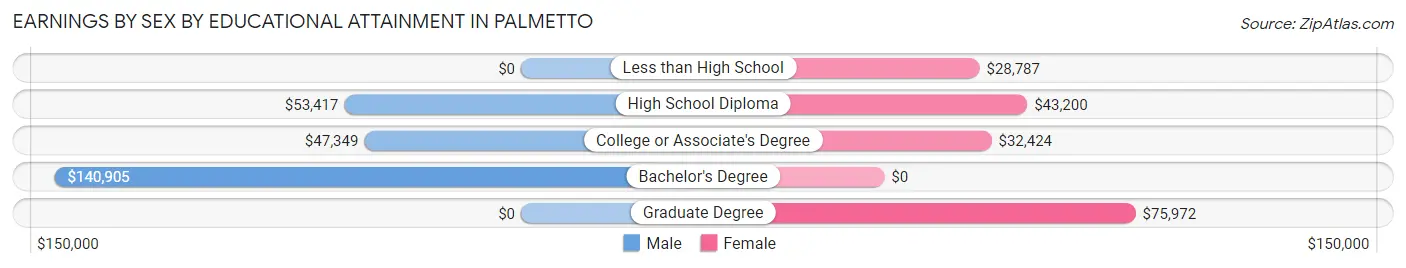
| Educational Attainment | Male Income | Female Income |
| Less than High School | - | - |
| High School Diploma | $53,417 | $43,200 |
| College or Associate's Degree | $47,349 | $32,424 |
| Bachelor's Degree | $140,905 | $0 |
| Graduate Degree | - | - |
| Total | $46,123 | $37,524 |
Family Income in Palmetto
Family Income Brackets in Palmetto
According to the Palmetto family income data, there are 264 families falling into the $100,000 to $149,999 income range, which is the most common income bracket and makes up 22.6% of all families.
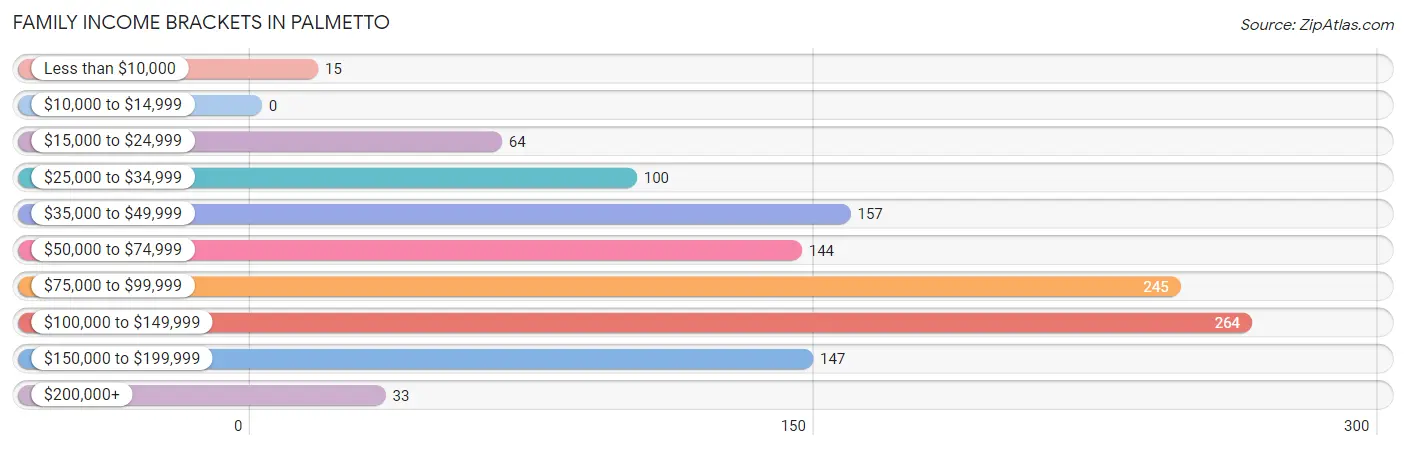
| Income Bracket | # Families | % Families |
| Less than $10,000 | 15 | 1.3% |
| $10,000 to $14,999 | 0 | 0.0% |
| $15,000 to $24,999 | 64 | 5.5% |
| $25,000 to $34,999 | 100 | 8.6% |
| $35,000 to $49,999 | 157 | 13.4% |
| $50,000 to $74,999 | 144 | 12.3% |
| $75,000 to $99,999 | 245 | 21.0% |
| $100,000 to $149,999 | 264 | 22.6% |
| $150,000 to $199,999 | 147 | 12.6% |
| $200,000+ | 33 | 2.8% |
Family Income by Famaliy Size in Palmetto
3-person families (321 | 27.5%) account for the highest median family income in Palmetto with $103,932 per family, while 2-person families (503 | 43.1%) have the highest median income of $36,585 per family member.
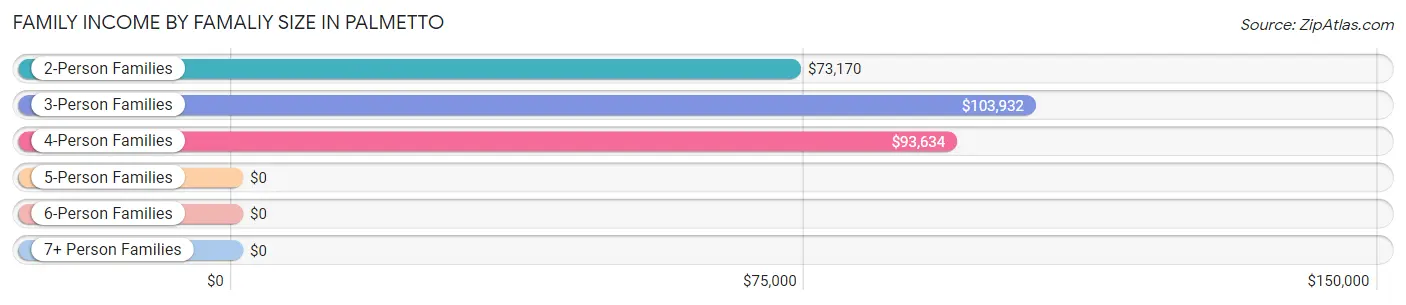
| Income Bracket | # Families | Median Income |
| 2-Person Families | 503 (43.1%) | $73,170 |
| 3-Person Families | 321 (27.5%) | $103,932 |
| 4-Person Families | 262 (22.4%) | $93,634 |
| 5-Person Families | 39 (3.3%) | $0 |
| 6-Person Families | 43 (3.7%) | $0 |
| 7+ Person Families | 0 (0.0%) | $0 |
| Total | 1,168 (100.0%) | $83,523 |
Family Income by Number of Earners in Palmetto
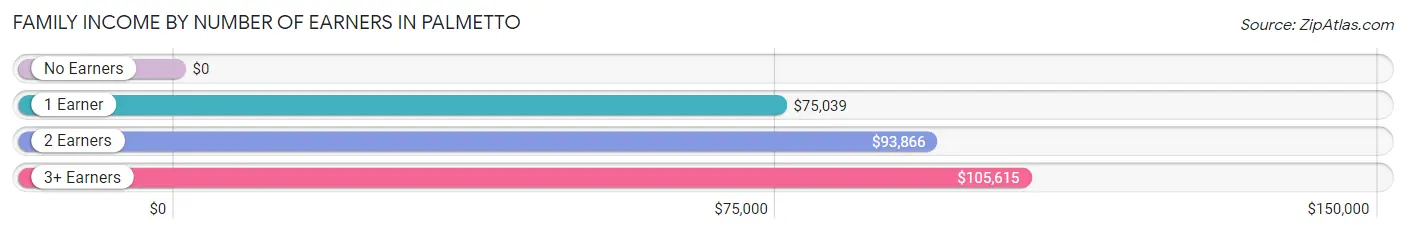
| Number of Earners | # Families | Median Income |
| No Earners | 83 (7.1%) | $0 |
| 1 Earner | 323 (27.7%) | $75,039 |
| 2 Earners | 466 (39.9%) | $93,866 |
| 3+ Earners | 296 (25.3%) | $105,615 |
| Total | 1,168 (100.0%) | $83,523 |
Household Income in Palmetto
Household Income Brackets in Palmetto
With 363 households falling in the category, the $35,000 to $49,999 income range is the most frequent in Palmetto, accounting for 19.3% of all households. In contrast, only 34 households (1.8%) fall into the $200,000+ income bracket, making it the least populous group.
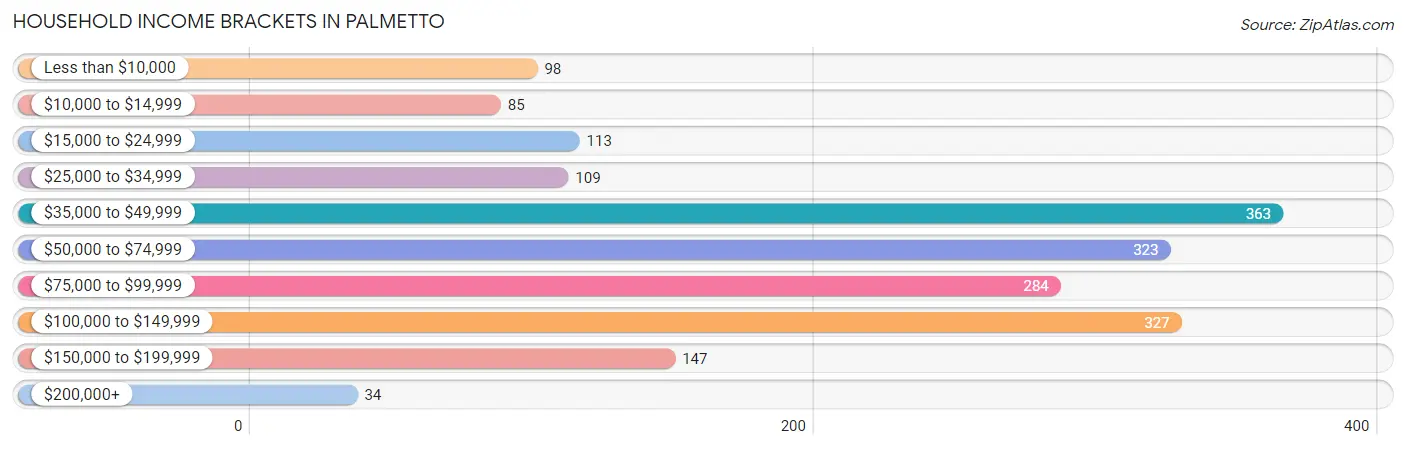
| Income Bracket | # Households | % Households |
| Less than $10,000 | 98 | 5.2% |
| $10,000 to $14,999 | 85 | 4.5% |
| $15,000 to $24,999 | 113 | 6.0% |
| $25,000 to $34,999 | 109 | 5.8% |
| $35,000 to $49,999 | 363 | 19.3% |
| $50,000 to $74,999 | 323 | 17.2% |
| $75,000 to $99,999 | 284 | 15.1% |
| $100,000 to $149,999 | 327 | 17.4% |
| $150,000 to $199,999 | 147 | 7.8% |
| $200,000+ | 34 | 1.8% |
Household Income by Householder Age in Palmetto
The median household income in Palmetto is $52,444, with the highest median household income of $77,409 found in the 25 to 44 years age bracket for the primary householder. A total of 559 households (29.7%) fall into this category. Meanwhile, the 15 to 24 years age bracket for the primary householder has the lowest median household income of $0, with 19 households (1.0%) in this group.
| Income Bracket | # Households | Median Income |
| 15 to 24 Years | 19 (1.0%) | $0 |
| 25 to 44 Years | 559 (29.7%) | $77,409 |
| 45 to 64 Years | 841 (44.7%) | $52,335 |
| 65+ Years | 461 (24.5%) | $37,628 |
| Total | 1,880 (100.0%) | $52,444 |
Poverty in Palmetto
Income Below Poverty by Sex and Age in Palmetto
With 9.2% poverty level for males and 13.8% for females among the residents of Palmetto, 12 to 14 year old males and 12 to 14 year old females are the most vulnerable to poverty, with 69 males (77.5%) and 57 females (68.7%) in their respective age groups living below the poverty level.
| Age Bracket | Male | Female |
| Under 5 Years | 14 (20.0%) | 30 (48.4%) |
| 5 Years | 0 (0.0%) | 17 (12.0%) |
| 6 to 11 Years | 0 (0.0%) | 0 (0.0%) |
| 12 to 14 Years | 69 (77.5%) | 57 (68.7%) |
| 15 Years | 0 (0.0%) | 0 (0.0%) |
| 16 and 17 Years | 35 (56.5%) | 25 (54.3%) |
| 18 to 24 Years | 0 (0.0%) | 11 (6.7%) |
| 25 to 34 Years | 0 (0.0%) | 49 (20.2%) |
| 35 to 44 Years | 10 (3.6%) | 26 (8.5%) |
| 45 to 54 Years | 20 (7.8%) | 0 (0.0%) |
| 55 to 64 Years | 0 (0.0%) | 9 (2.5%) |
| 65 to 74 Years | 45 (25.9%) | 37 (20.2%) |
| 75 Years and over | 0 (0.0%) | 85 (45.2%) |
| Total | 193 (9.2%) | 346 (13.8%) |
Income Above Poverty by Sex and Age in Palmetto
According to the poverty statistics in Palmetto, males aged 5 years and females aged 6 to 11 years are the age groups that are most secure financially, with 100.0% of males and 100.0% of females in these age groups living above the poverty line.
| Age Bracket | Male | Female |
| Under 5 Years | 56 (80.0%) | 32 (51.6%) |
| 5 Years | 19 (100.0%) | 125 (88.0%) |
| 6 to 11 Years | 95 (100.0%) | 322 (100.0%) |
| 12 to 14 Years | 20 (22.5%) | 26 (31.3%) |
| 15 Years | 31 (100.0%) | 0 (0.0%) |
| 16 and 17 Years | 27 (43.5%) | 21 (45.7%) |
| 18 to 24 Years | 402 (100.0%) | 154 (93.3%) |
| 25 to 34 Years | 173 (100.0%) | 194 (79.8%) |
| 35 to 44 Years | 266 (96.4%) | 281 (91.5%) |
| 45 to 54 Years | 237 (92.2%) | 397 (100.0%) |
| 55 to 64 Years | 387 (100.0%) | 353 (97.5%) |
| 65 to 74 Years | 129 (74.1%) | 146 (79.8%) |
| 75 Years and over | 65 (100.0%) | 103 (54.8%) |
| Total | 1,907 (90.8%) | 2,154 (86.2%) |
Income Below Poverty Among Married-Couple Families in Palmetto
The poverty statistics for married-couple families in Palmetto show that 1.8% or 15 of the total 825 families live below the poverty line. Families with 3 or 4 children have the highest poverty rate of 25.9%, comprising of 15 families. On the other hand, families with no children have the lowest poverty rate of 0.0%, which includes 0 families.
| Children | Above Poverty | Below Poverty |
| No Children | 530 (100.0%) | 0 (0.0%) |
| 1 or 2 Children | 237 (100.0%) | 0 (0.0%) |
| 3 or 4 Children | 43 (74.1%) | 15 (25.9%) |
| 5 or more Children | 0 (0.0%) | 0 (0.0%) |
| Total | 810 (98.2%) | 15 (1.8%) |
Income Below Poverty Among Single-Parent Households in Palmetto
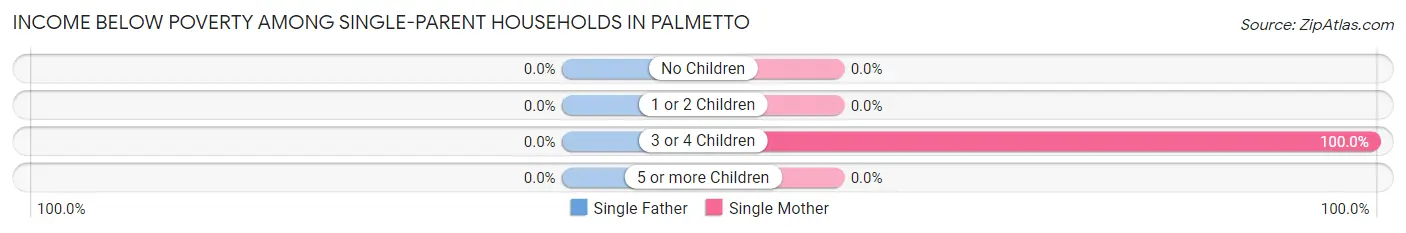
| Children | Single Father | Single Mother |
| No Children | 0 (0.0%) | 0 (0.0%) |
| 1 or 2 Children | 0 (0.0%) | 0 (0.0%) |
| 3 or 4 Children | 0 (0.0%) | 60 (100.0%) |
| 5 or more Children | 0 (0.0%) | 0 (0.0%) |
| Total | 0 (0.0%) | 60 (18.4%) |
Income Below Poverty Among Married-Couple vs Single-Parent Households in Palmetto
The poverty data for Palmetto shows that 15 of the married-couple family households (1.8%) and 60 of the single-parent households (17.5%) are living below the poverty level. Within the married-couple family households, those with 3 or 4 children have the highest poverty rate, with 15 households (25.9%) falling below the poverty line. Among the single-parent households, those with 3 or 4 children have the highest poverty rate, with 60 household (100.0%) living below poverty.
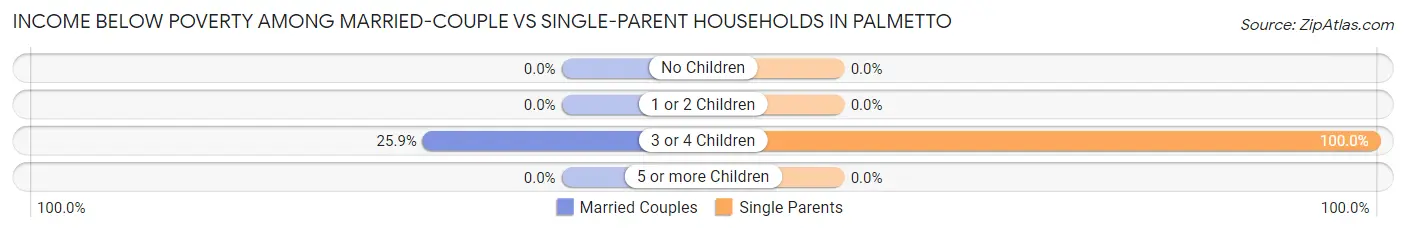
| Children | Married-Couple Families | Single-Parent Households |
| No Children | 0 (0.0%) | 0 (0.0%) |
| 1 or 2 Children | 0 (0.0%) | 0 (0.0%) |
| 3 or 4 Children | 15 (25.9%) | 60 (100.0%) |
| 5 or more Children | 0 (0.0%) | 0 (0.0%) |
| Total | 15 (1.8%) | 60 (17.5%) |
Race in Palmetto
The most populous races in Palmetto are Black / African American (2,579 | 55.5%), White / Caucasian (1,093 | 23.5%), and Hispanic or Latino (803 | 17.3%).
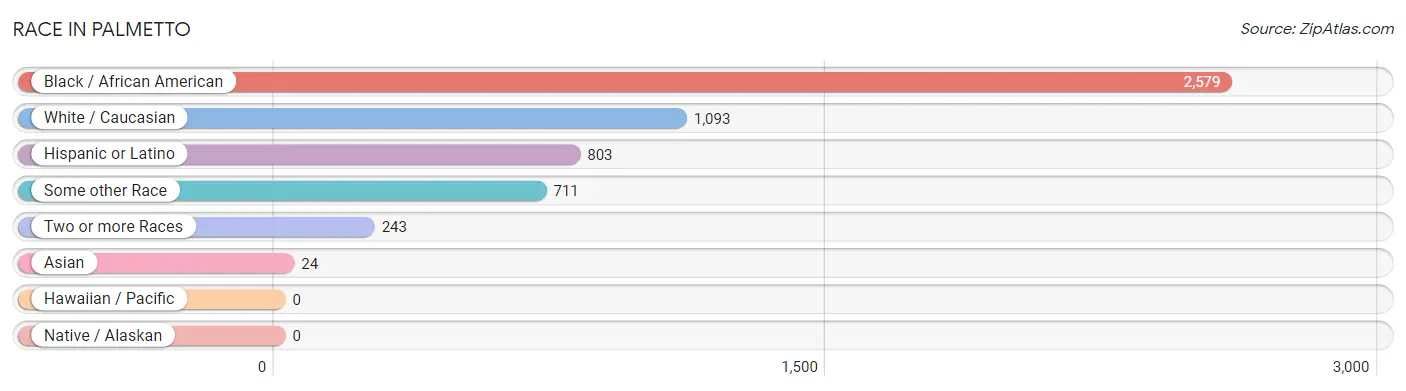
| Race | # Population | % Population |
| Asian | 24 | 0.5% |
| Black / African American | 2,579 | 55.5% |
| Hawaiian / Pacific | 0 | 0.0% |
| Hispanic or Latino | 803 | 17.3% |
| Native / Alaskan | 0 | 0.0% |
| White / Caucasian | 1,093 | 23.5% |
| Two or more Races | 243 | 5.2% |
| Some other Race | 711 | 15.3% |
| Total | 4,650 | 100.0% |
Ancestry in Palmetto
The most populous ancestries reported in Palmetto are Mexican (659 | 14.2%), Irish (275 | 5.9%), Subsaharan African (202 | 4.3%), German (159 | 3.4%), and African (139 | 3.0%), together accounting for 30.8% of all Palmetto residents.
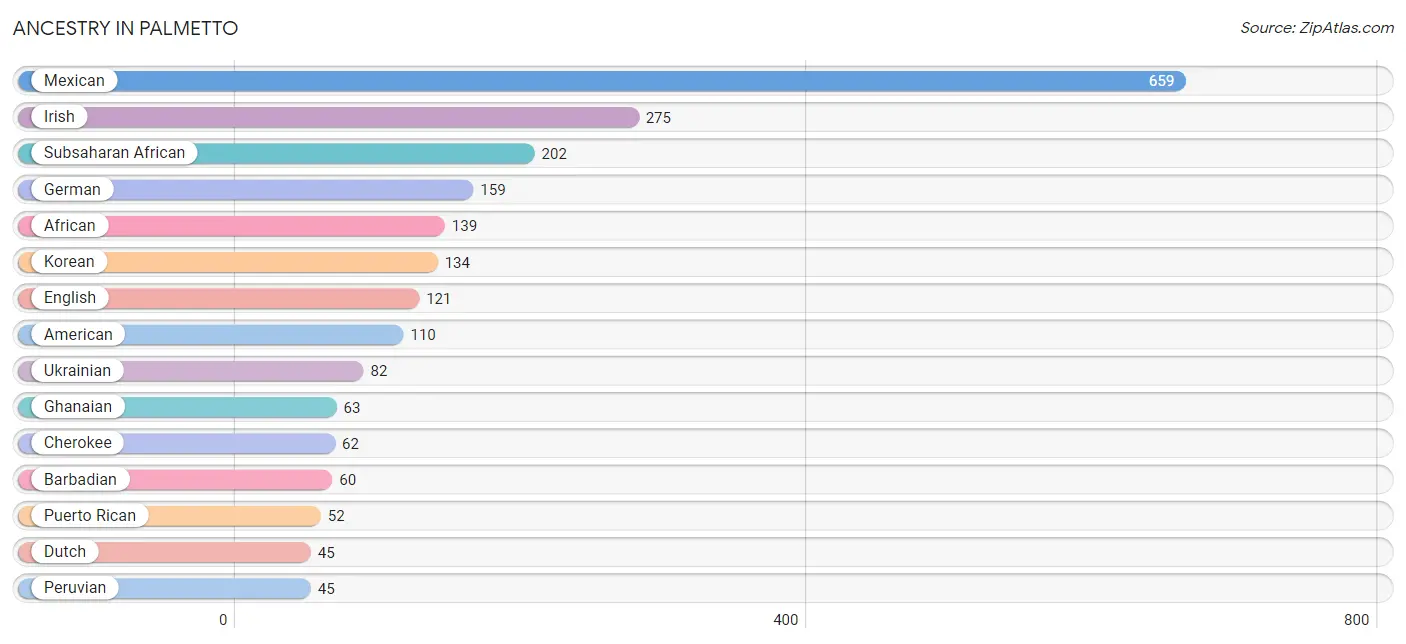
| Ancestry | # Population | % Population |
| African | 139 | 3.0% |
| American | 110 | 2.4% |
| Barbadian | 60 | 1.3% |
| Blackfeet | 43 | 0.9% |
| Cherokee | 62 | 1.3% |
| Dutch | 45 | 1.0% |
| English | 121 | 2.6% |
| German | 159 | 3.4% |
| Ghanaian | 63 | 1.3% |
| Irish | 275 | 5.9% |
| Italian | 16 | 0.3% |
| Korean | 134 | 2.9% |
| Mexican | 659 | 14.2% |
| Peruvian | 45 | 1.0% |
| Polish | 32 | 0.7% |
| Puerto Rican | 52 | 1.1% |
| South American | 45 | 1.0% |
| Subsaharan African | 202 | 4.3% |
| Ukrainian | 82 | 1.8% | View All 19 Rows |
Immigrants in Palmetto
The most numerous immigrant groups reported in Palmetto came from Latin America (242 | 5.2%), Caribbean (111 | 2.4%), Central America (86 | 1.8%), Mexico (86 | 1.8%), and Cuba (82 | 1.8%), together accounting for 13.1% of all Palmetto residents.
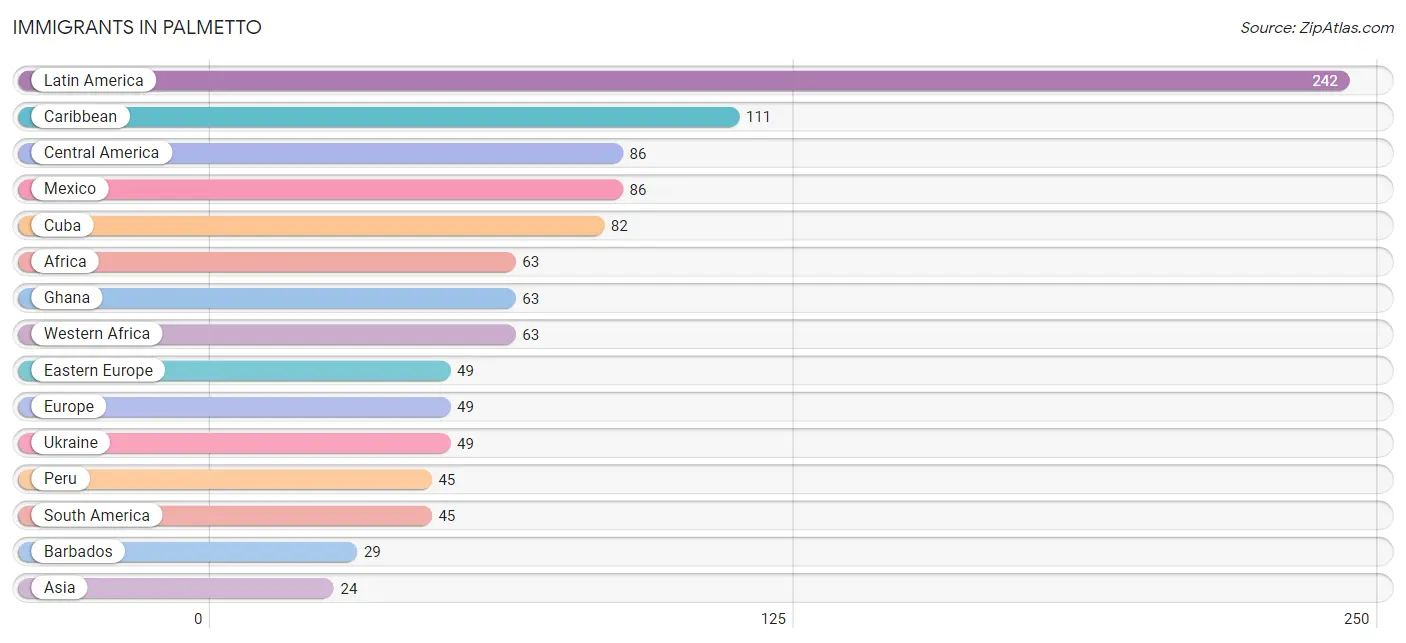
| Immigration Origin | # Population | % Population |
| Africa | 63 | 1.3% |
| Asia | 24 | 0.5% |
| Barbados | 29 | 0.6% |
| Caribbean | 111 | 2.4% |
| Central America | 86 | 1.8% |
| Cuba | 82 | 1.8% |
| Eastern Europe | 49 | 1.1% |
| Europe | 49 | 1.1% |
| Ghana | 63 | 1.3% |
| Latin America | 242 | 5.2% |
| Mexico | 86 | 1.8% |
| Peru | 45 | 1.0% |
| Philippines | 24 | 0.5% |
| South America | 45 | 1.0% |
| South Eastern Asia | 24 | 0.5% |
| Ukraine | 49 | 1.1% |
| Western Africa | 63 | 1.3% | View All 17 Rows |
Sex and Age in Palmetto
Sex and Age in Palmetto
The most populous age groups in Palmetto are 15 to 19 Years (256 | 12.1%) for men and 5 to 9 Years (438 | 17.3%) for women.
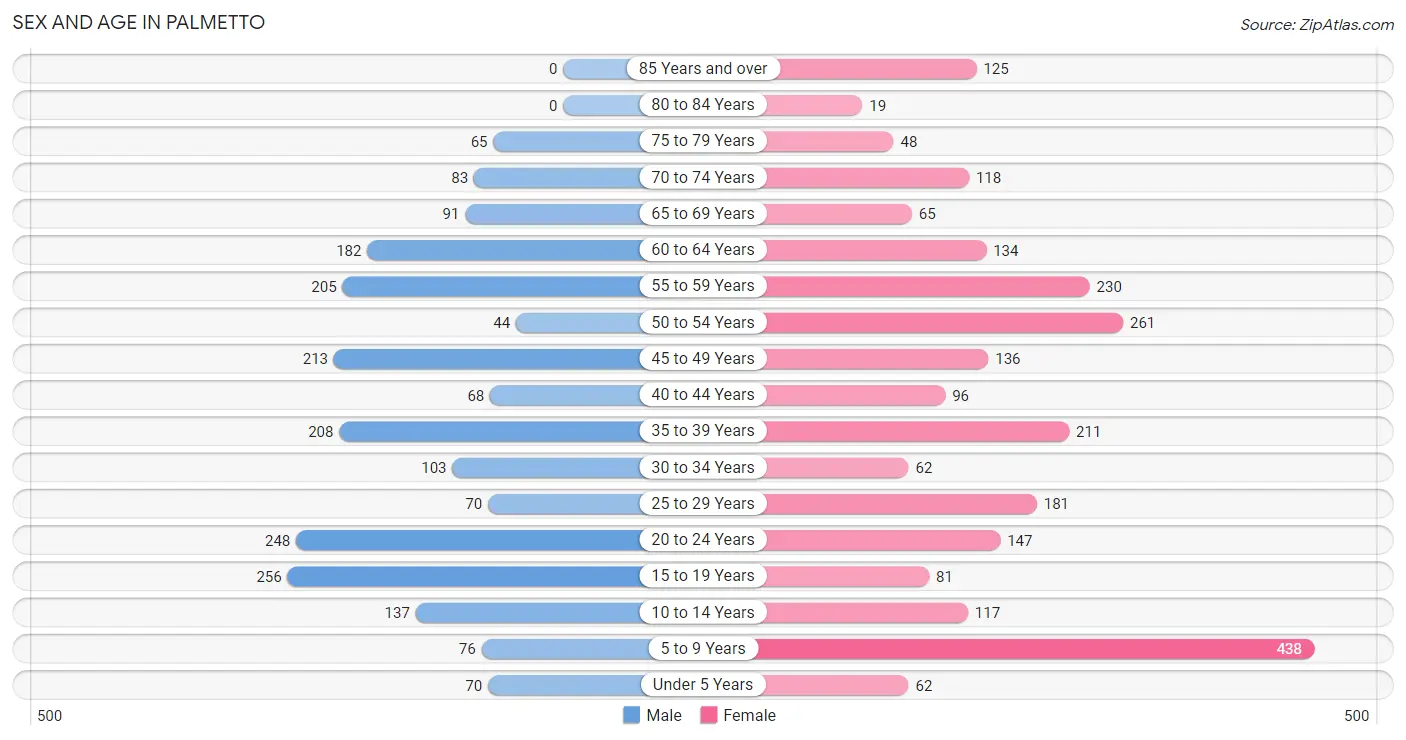
| Age Bracket | Male | Female |
| Under 5 Years | 70 (3.3%) | 62 (2.5%) |
| 5 to 9 Years | 76 (3.6%) | 438 (17.3%) |
| 10 to 14 Years | 137 (6.5%) | 117 (4.6%) |
| 15 to 19 Years | 256 (12.1%) | 81 (3.2%) |
| 20 to 24 Years | 248 (11.7%) | 147 (5.8%) |
| 25 to 29 Years | 70 (3.3%) | 181 (7.1%) |
| 30 to 34 Years | 103 (4.9%) | 62 (2.5%) |
| 35 to 39 Years | 208 (9.8%) | 211 (8.3%) |
| 40 to 44 Years | 68 (3.2%) | 96 (3.8%) |
| 45 to 49 Years | 213 (10.1%) | 136 (5.4%) |
| 50 to 54 Years | 44 (2.1%) | 261 (10.3%) |
| 55 to 59 Years | 205 (9.7%) | 230 (9.1%) |
| 60 to 64 Years | 182 (8.6%) | 134 (5.3%) |
| 65 to 69 Years | 91 (4.3%) | 65 (2.6%) |
| 70 to 74 Years | 83 (3.9%) | 118 (4.7%) |
| 75 to 79 Years | 65 (3.1%) | 48 (1.9%) |
| 80 to 84 Years | 0 (0.0%) | 19 (0.7%) |
| 85 Years and over | 0 (0.0%) | 125 (4.9%) |
| Total | 2,119 (100.0%) | 2,531 (100.0%) |
Families and Households in Palmetto
Median Family Size in Palmetto
The median family size in Palmetto is 3.24 persons per family, with married-couple families (825 | 70.6%) accounting for the largest median family size of 3.45 persons per family. On the other hand, single male/father families (17 | 1.5%) represent the smallest median family size with 2.35 persons per family.
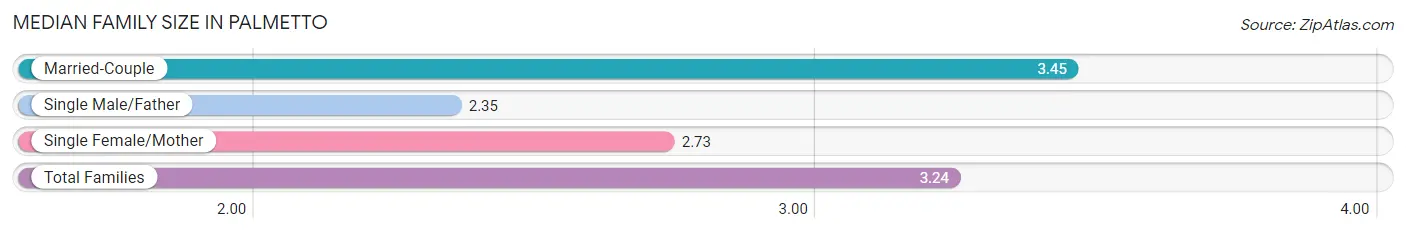
| Family Type | # Families | Family Size |
| Married-Couple | 825 (70.6%) | 3.45 |
| Single Male/Father | 17 (1.5%) | 2.35 |
| Single Female/Mother | 326 (27.9%) | 2.73 |
| Total Families | 1,168 (100.0%) | 3.24 |
Median Household Size in Palmetto
The median household size in Palmetto is 2.43 persons per household, with married-couple households (825 | 43.9%) accounting for the largest median household size of 3.51 persons per household. non-family households (712 | 37.9%) represent the smallest median household size with 1.05 persons per household.
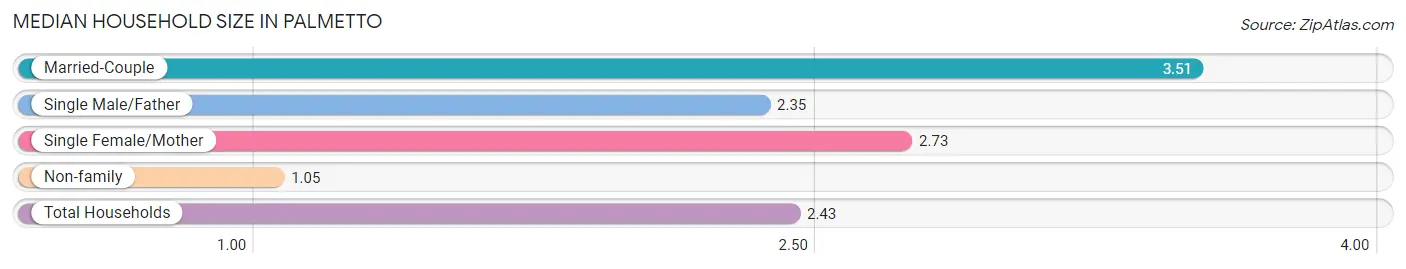
| Household Type | # Households | Household Size |
| Married-Couple | 825 (43.9%) | 3.51 |
| Single Male/Father | 17 (0.9%) | 2.35 |
| Single Female/Mother | 326 (17.3%) | 2.73 |
| Non-family | 712 (37.9%) | 1.05 |
| Total Households | 1,880 (100.0%) | 2.43 |
Household Size by Marriage Status in Palmetto
Out of a total of 1,880 households in Palmetto, 1,168 (62.1%) are family households, while 712 (37.9%) are nonfamily households. The most numerous type of family households are 2-person households, comprising 503, and the most common type of nonfamily households are 1-person households, comprising 693.
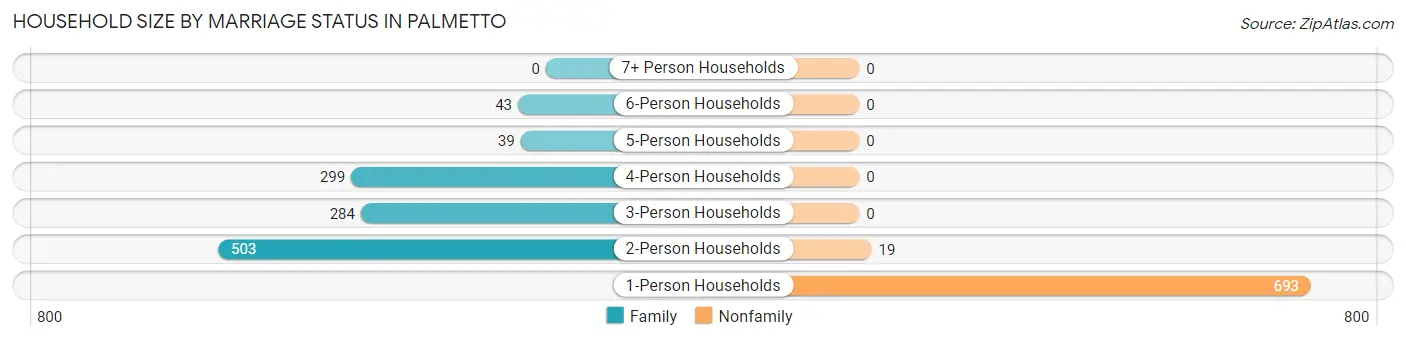
| Household Size | Family Households | Nonfamily Households |
| 1-Person Households | - | 693 (36.9%) |
| 2-Person Households | 503 (26.8%) | 19 (1.0%) |
| 3-Person Households | 284 (15.1%) | 0 (0.0%) |
| 4-Person Households | 299 (15.9%) | 0 (0.0%) |
| 5-Person Households | 39 (2.1%) | 0 (0.0%) |
| 6-Person Households | 43 (2.3%) | 0 (0.0%) |
| 7+ Person Households | 0 (0.0%) | 0 (0.0%) |
| Total | 1,168 (62.1%) | 712 (37.9%) |
Female Fertility in Palmetto
Fertility by Age in Palmetto
Average fertility rate in Palmetto is 57.0 births per 1,000 women. Women in the age bracket of 35 to 50 years have the highest fertility rate with 113.0 births per 1,000 women. Women in the age bracket of 35 to 50 years acount for 100.0% of all women with births.
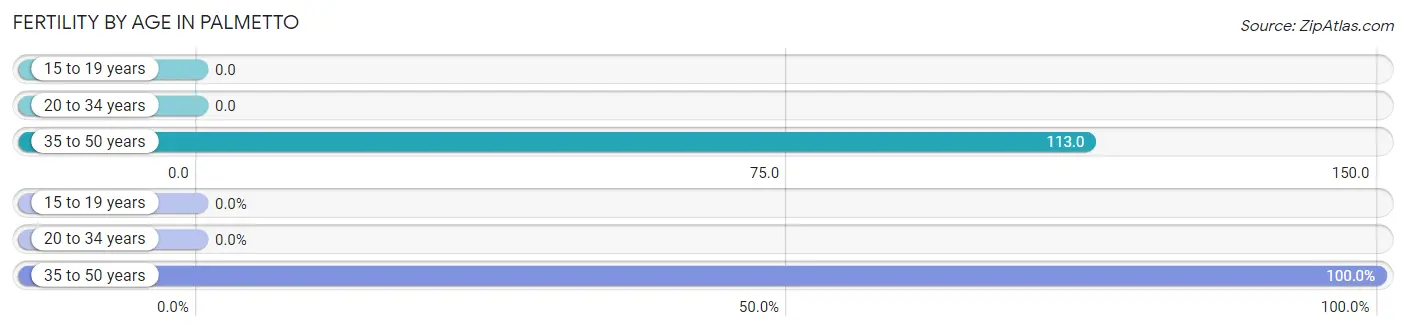
| Age Bracket | Women with Births | Births / 1,000 Women |
| 15 to 19 years | 0 (0.0%) | 0.0 |
| 20 to 34 years | 0 (0.0%) | 0.0 |
| 35 to 50 years | 53 (100.0%) | 113.0 |
| Total | 53 (100.0%) | 57.0 |
Fertility by Age by Marriage Status in Palmetto
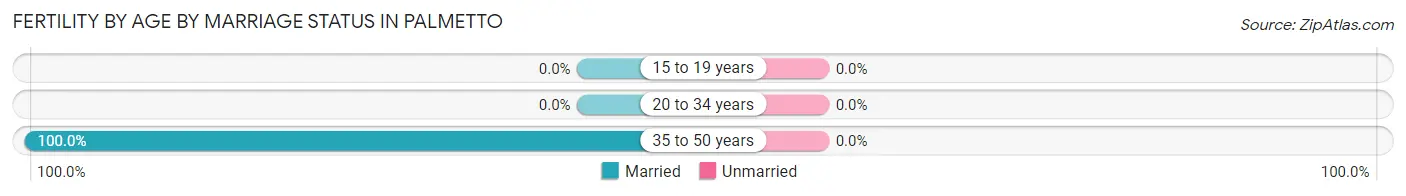
| Age Bracket | Married | Unmarried |
| 15 to 19 years | 0 (0.0%) | 0 (0.0%) |
| 20 to 34 years | 0 (0.0%) | 0 (0.0%) |
| 35 to 50 years | 53 (100.0%) | 0 (0.0%) |
| Total | 53 (100.0%) | 0 (0.0%) |
Fertility by Education in Palmetto
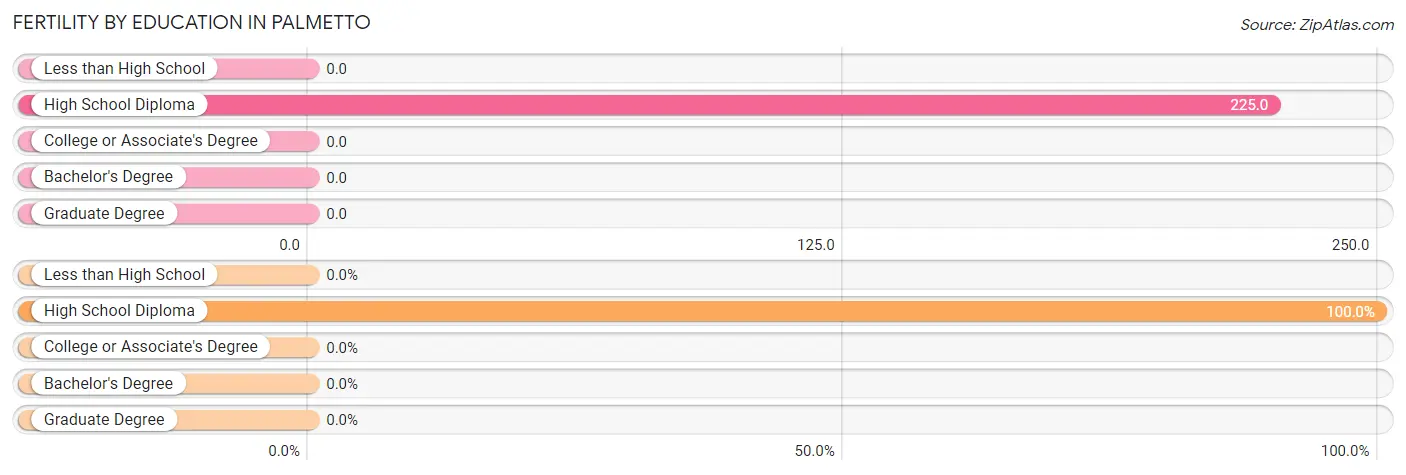
| Educational Attainment | Women with Births | Births / 1,000 Women |
| Less than High School | 0 (0.0%) | 0.0 |
| High School Diploma | 53 (100.0%) | 225.0 |
| College or Associate's Degree | 0 (0.0%) | 0.0 |
| Bachelor's Degree | 0 (0.0%) | 0.0 |
| Graduate Degree | 0 (0.0%) | 0.0 |
| Total | 53 (100.0%) | 57.0 |
Fertility by Education by Marriage Status in Palmetto
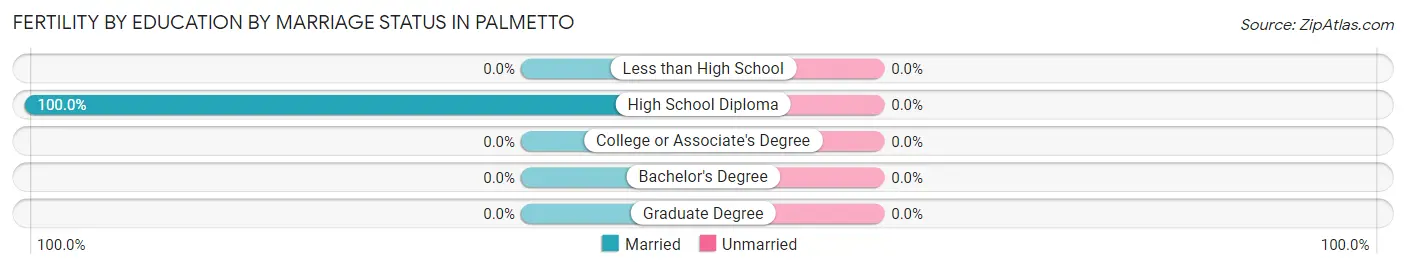
| Educational Attainment | Married | Unmarried |
| Less than High School | 0 (0.0%) | 0 (0.0%) |
| High School Diploma | 53 (100.0%) | 0 (0.0%) |
| College or Associate's Degree | 0 (0.0%) | 0 (0.0%) |
| Bachelor's Degree | 0 (0.0%) | 0 (0.0%) |
| Graduate Degree | 0 (0.0%) | 0 (0.0%) |
| Total | 53 (100.0%) | 0 (0.0%) |
Employment Characteristics in Palmetto
Employment by Class of Employer in Palmetto
Among the 2,320 employed individuals in Palmetto, private company employees (1,592 | 68.6%), local government employees (221 | 9.5%), and federal government employees (134 | 5.8%) make up the most common classes of employment.
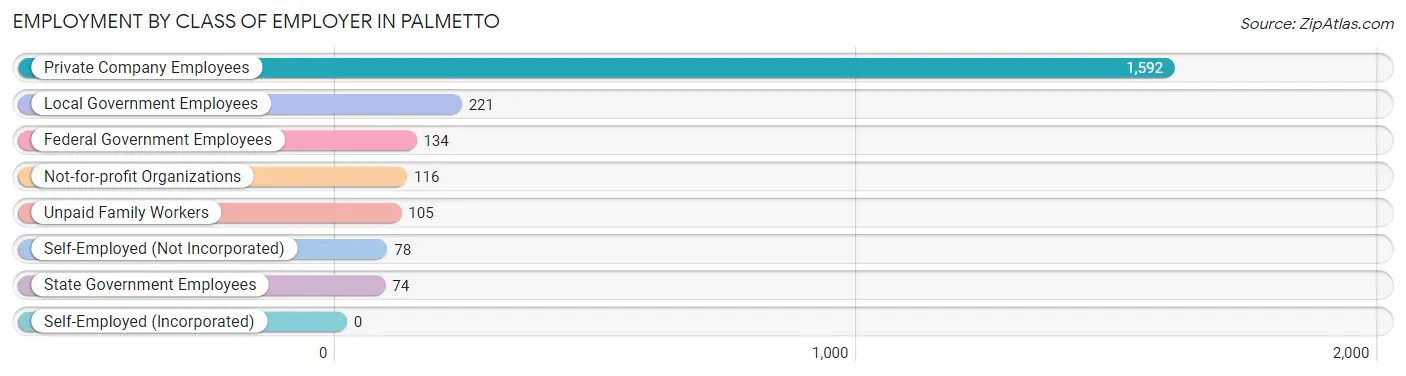
| Employer Class | # Employees | % Employees |
| Private Company Employees | 1,592 | 68.6% |
| Self-Employed (Incorporated) | 0 | 0.0% |
| Self-Employed (Not Incorporated) | 78 | 3.4% |
| Not-for-profit Organizations | 116 | 5.0% |
| Local Government Employees | 221 | 9.5% |
| State Government Employees | 74 | 3.2% |
| Federal Government Employees | 134 | 5.8% |
| Unpaid Family Workers | 105 | 4.5% |
| Total | 2,320 | 100.0% |
Employment Status by Age in Palmetto
According to the labor force statistics for Palmetto, out of the total population over 16 years of age (3,710), 70.6% or 2,619 individuals are in the labor force, with 6.9% or 181 of them unemployed. The age group with the highest labor force participation rate is 35 to 44 years, with 100.0% or 583 individuals in the labor force. Within the labor force, the 20 to 24 years age range has the highest percentage of unemployed individuals, with 30.3% or 109 of them being unemployed.
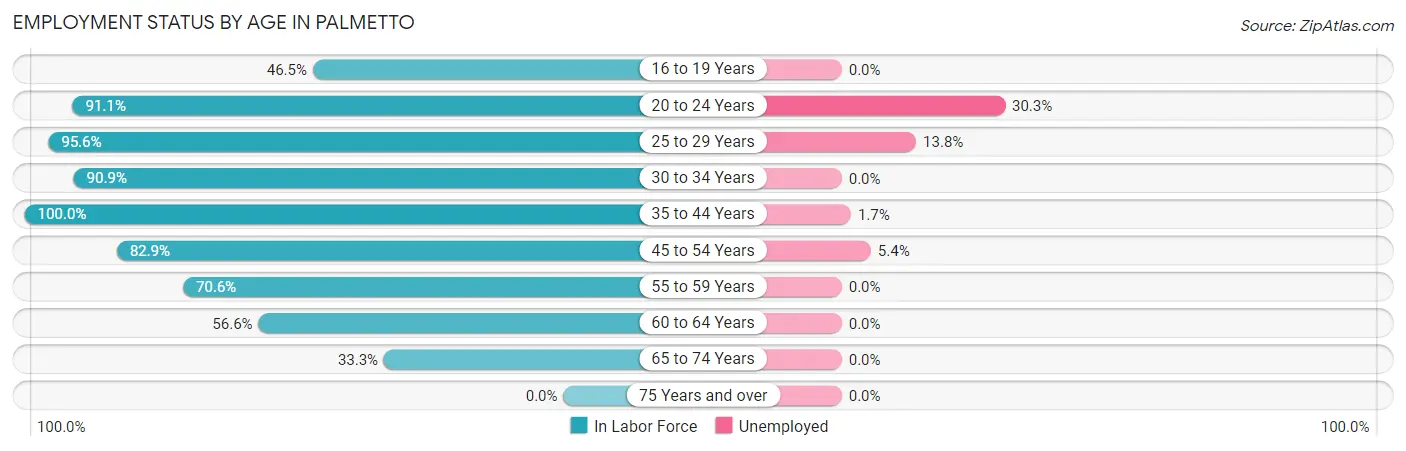
| Age Bracket | In Labor Force | Unemployed |
| 16 to 19 Years | 138 (46.5%) | 0 (0.0%) |
| 20 to 24 Years | 360 (91.1%) | 109 (30.3%) |
| 25 to 29 Years | 240 (95.6%) | 33 (13.8%) |
| 30 to 34 Years | 150 (90.9%) | 0 (0.0%) |
| 35 to 44 Years | 583 (100.0%) | 10 (1.7%) |
| 45 to 54 Years | 542 (82.9%) | 29 (5.4%) |
| 55 to 59 Years | 307 (70.6%) | 0 (0.0%) |
| 60 to 64 Years | 179 (56.6%) | 0 (0.0%) |
| 65 to 74 Years | 119 (33.3%) | 0 (0.0%) |
| 75 Years and over | 0 (0.0%) | 0 (0.0%) |
| Total | 2,619 (70.6%) | 181 (6.9%) |
Employment Status by Educational Attainment in Palmetto
According to labor force statistics for Palmetto, 83.2% of individuals (2,000) out of the total population between 25 and 64 years of age (2,404) are in the labor force, with 3.6% or 72 of them being unemployed. The group with the highest labor force participation rate are those with the educational attainment of bachelor's degree or higher, with 100.0% or 506 individuals in the labor force. Within the labor force, individuals with less than high school education have the highest percentage of unemployment, with 15.6% or 33 of them being unemployed.
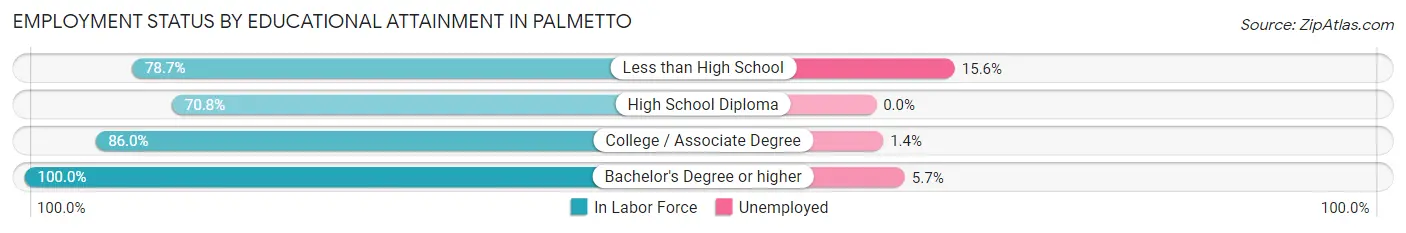
| Educational Attainment | In Labor Force | Unemployed |
| Less than High School | 211 (78.7%) | 42 (15.6%) |
| High School Diploma | 550 (70.8%) | 0 (0.0%) |
| College / Associate Degree | 734 (86.0%) | 12 (1.4%) |
| Bachelor's Degree or higher | 506 (100.0%) | 29 (5.7%) |
| Total | 2,000 (83.2%) | 87 (3.6%) |
Employment Occupations by Sex in Palmetto
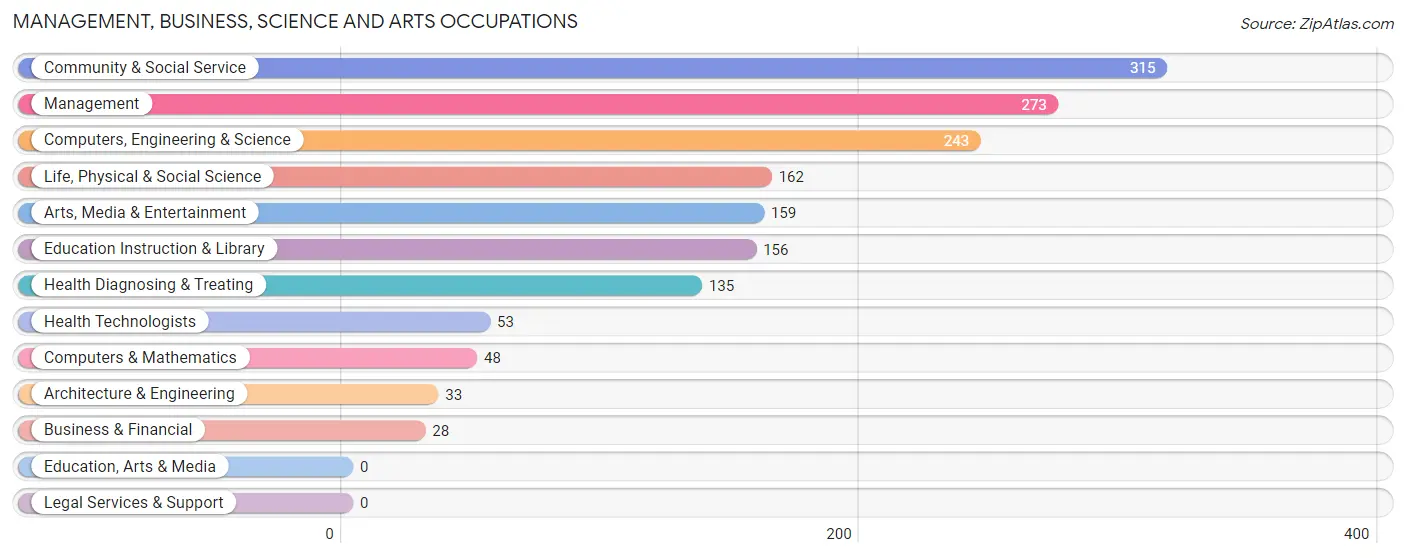
Management, Business, Science and Arts Occupations
The most common Management, Business, Science and Arts occupations in Palmetto are Community & Social Service (315 | 12.9%), Management (273 | 11.2%), Computers, Engineering & Science (243 | 10.0%), Life, Physical & Social Science (162 | 6.7%), and Arts, Media & Entertainment (159 | 6.5%).
Management, Business, Science and Arts Occupations by Sex
Within the Management, Business, Science and Arts occupations in Palmetto, the most male-oriented occupations are Architecture & Engineering (100.0%), Arts, Media & Entertainment (59.1%), and Management (39.9%), while the most female-oriented occupations are Business & Financial (100.0%), Life, Physical & Social Science (100.0%), and Education Instruction & Library (100.0%).
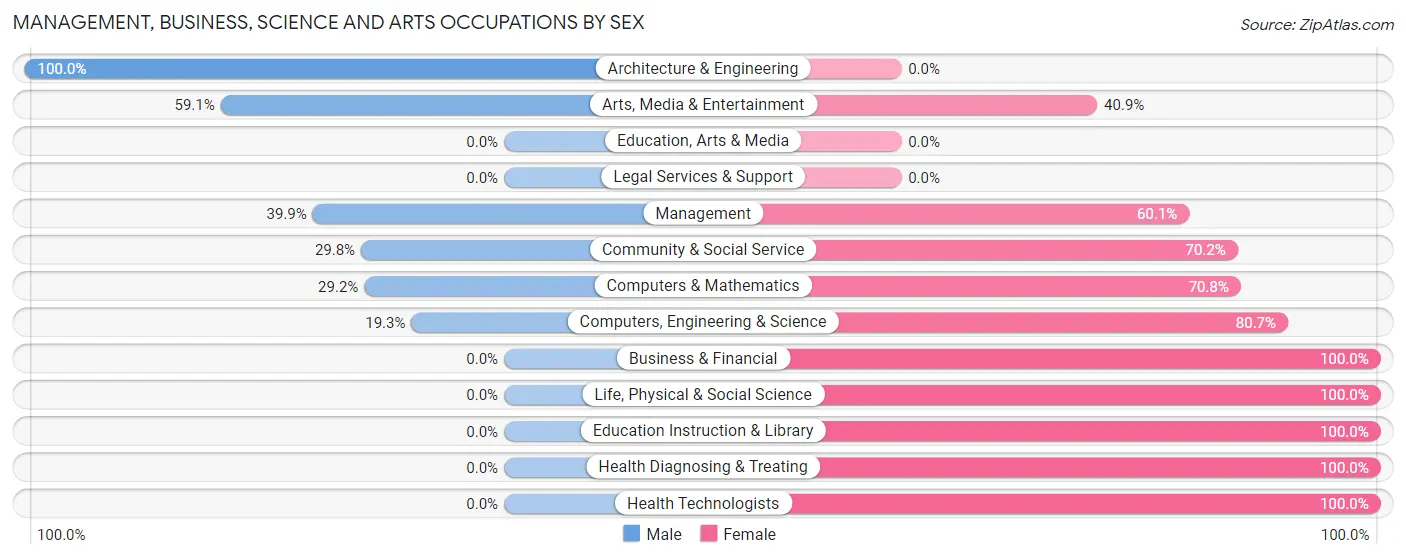
| Occupation | Male | Female |
| Management | 109 (39.9%) | 164 (60.1%) |
| Business & Financial | 0 (0.0%) | 28 (100.0%) |
| Computers, Engineering & Science | 47 (19.3%) | 196 (80.7%) |
| Computers & Mathematics | 14 (29.2%) | 34 (70.8%) |
| Architecture & Engineering | 33 (100.0%) | 0 (0.0%) |
| Life, Physical & Social Science | 0 (0.0%) | 162 (100.0%) |
| Community & Social Service | 94 (29.8%) | 221 (70.2%) |
| Education, Arts & Media | 0 (0.0%) | 0 (0.0%) |
| Legal Services & Support | 0 (0.0%) | 0 (0.0%) |
| Education Instruction & Library | 0 (0.0%) | 156 (100.0%) |
| Arts, Media & Entertainment | 94 (59.1%) | 65 (40.9%) |
| Health Diagnosing & Treating | 0 (0.0%) | 135 (100.0%) |
| Health Technologists | 0 (0.0%) | 53 (100.0%) |
| Total (Category) | 250 (25.2%) | 744 (74.9%) |
| Total (Overall) | 1,216 (49.9%) | 1,221 (50.1%) |
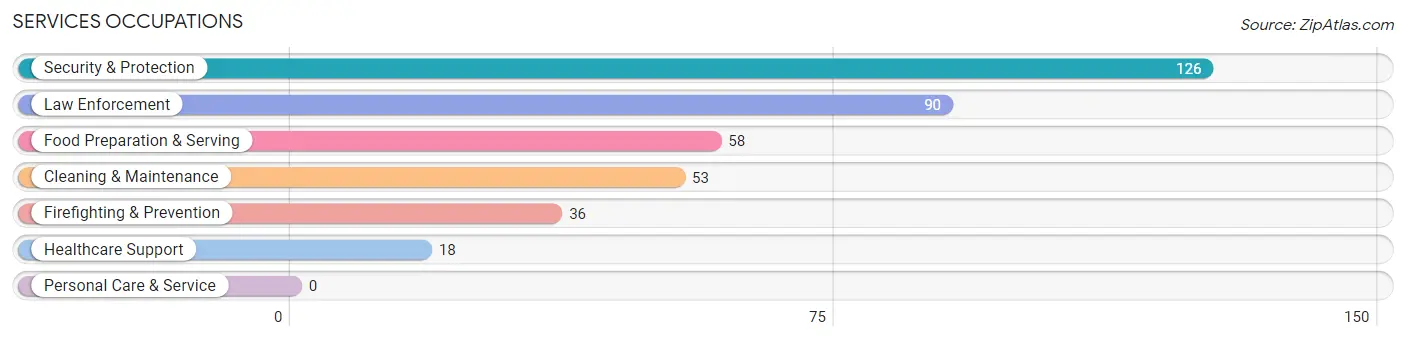
Services Occupations
The most common Services occupations in Palmetto are Security & Protection (126 | 5.2%), Law Enforcement (90 | 3.7%), Food Preparation & Serving (58 | 2.4%), Cleaning & Maintenance (53 | 2.2%), and Firefighting & Prevention (36 | 1.5%).
Services Occupations by Sex
Within the Services occupations in Palmetto, the most male-oriented occupations are Security & Protection (100.0%), Firefighting & Prevention (100.0%), and Law Enforcement (100.0%), while the most female-oriented occupations are Healthcare Support (100.0%), Cleaning & Maintenance (66.0%), and Food Preparation & Serving (36.2%).
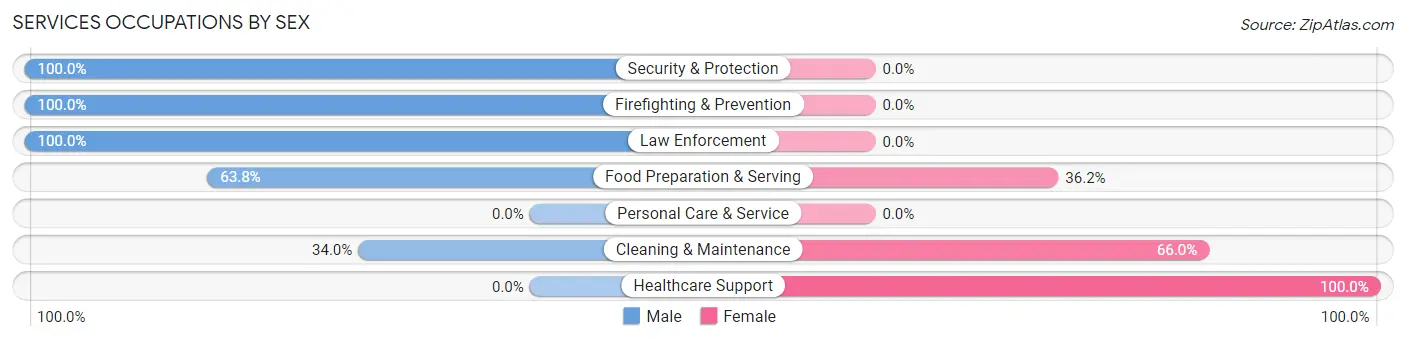
| Occupation | Male | Female |
| Healthcare Support | 0 (0.0%) | 18 (100.0%) |
| Security & Protection | 126 (100.0%) | 0 (0.0%) |
| Firefighting & Prevention | 36 (100.0%) | 0 (0.0%) |
| Law Enforcement | 90 (100.0%) | 0 (0.0%) |
| Food Preparation & Serving | 37 (63.8%) | 21 (36.2%) |
| Cleaning & Maintenance | 18 (34.0%) | 35 (66.0%) |
| Personal Care & Service | 0 (0.0%) | 0 (0.0%) |
| Total (Category) | 181 (71.0%) | 74 (29.0%) |
| Total (Overall) | 1,216 (49.9%) | 1,221 (50.1%) |
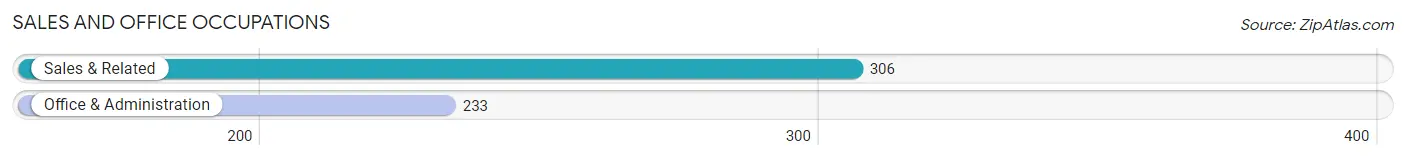
Sales and Office Occupations
The most common Sales and Office occupations in Palmetto are Sales & Related (306 | 12.6%), and Office & Administration (233 | 9.6%).
Sales and Office Occupations by Sex
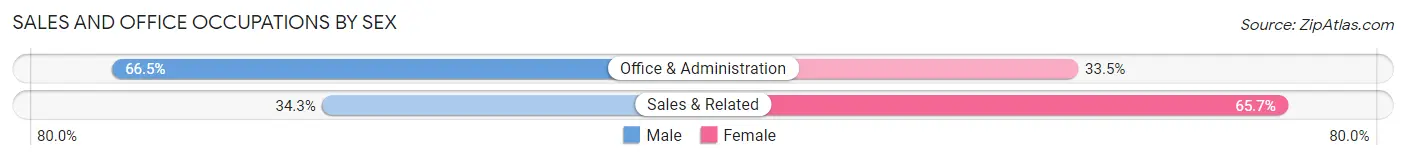
| Occupation | Male | Female |
| Sales & Related | 105 (34.3%) | 201 (65.7%) |
| Office & Administration | 155 (66.5%) | 78 (33.5%) |
| Total (Category) | 260 (48.2%) | 279 (51.8%) |
| Total (Overall) | 1,216 (49.9%) | 1,221 (50.1%) |
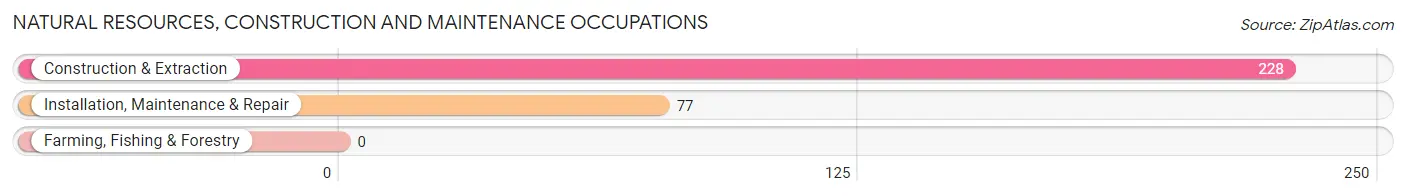
Natural Resources, Construction and Maintenance Occupations
The most common Natural Resources, Construction and Maintenance occupations in Palmetto are Construction & Extraction (228 | 9.4%), and Installation, Maintenance & Repair (77 | 3.2%).
Natural Resources, Construction and Maintenance Occupations by Sex
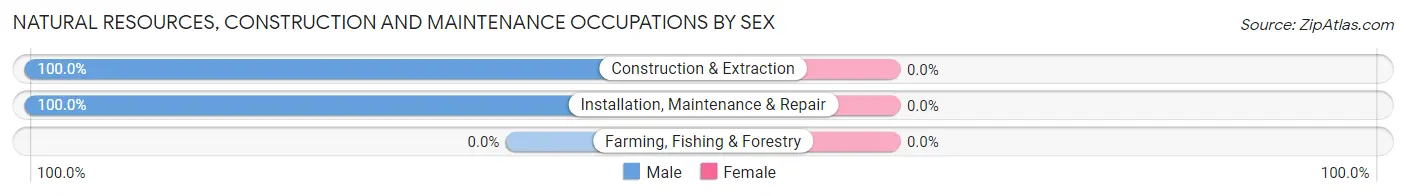
| Occupation | Male | Female |
| Farming, Fishing & Forestry | 0 (0.0%) | 0 (0.0%) |
| Construction & Extraction | 228 (100.0%) | 0 (0.0%) |
| Installation, Maintenance & Repair | 77 (100.0%) | 0 (0.0%) |
| Total (Category) | 305 (100.0%) | 0 (0.0%) |
| Total (Overall) | 1,216 (49.9%) | 1,221 (50.1%) |
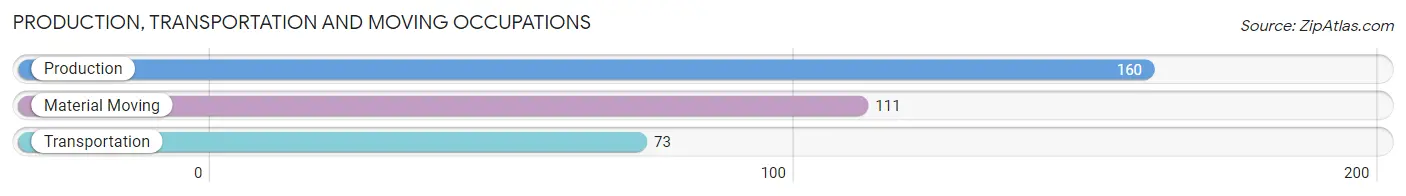
Production, Transportation and Moving Occupations
The most common Production, Transportation and Moving occupations in Palmetto are Production (160 | 6.6%), Material Moving (111 | 4.5%), and Transportation (73 | 3.0%).
Production, Transportation and Moving Occupations by Sex
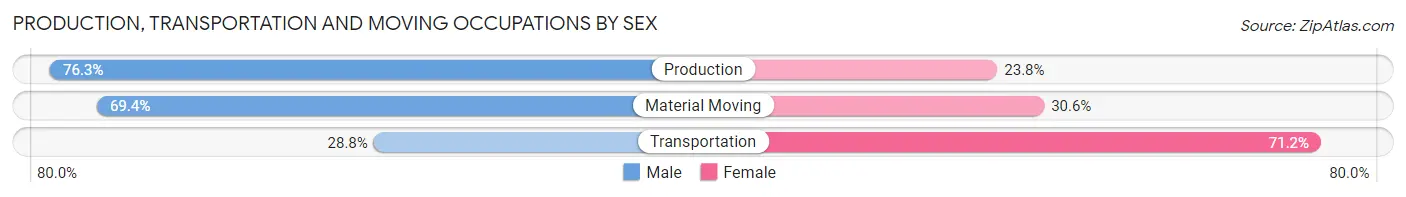
| Occupation | Male | Female |
| Production | 122 (76.2%) | 38 (23.7%) |
| Transportation | 21 (28.8%) | 52 (71.2%) |
| Material Moving | 77 (69.4%) | 34 (30.6%) |
| Total (Category) | 220 (63.9%) | 124 (36.0%) |
| Total (Overall) | 1,216 (49.9%) | 1,221 (50.1%) |
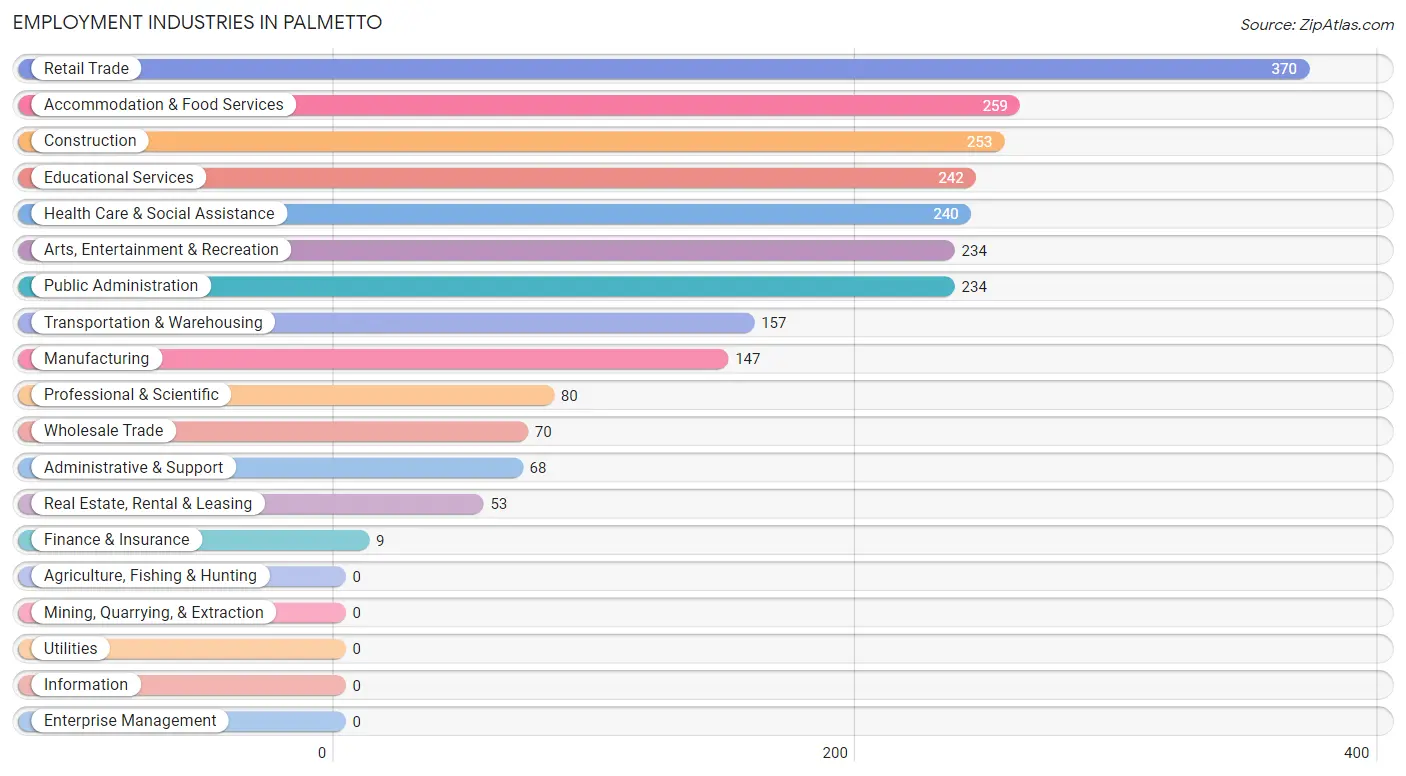
Employment Industries by Sex in Palmetto
Employment Industries in Palmetto
The major employment industries in Palmetto include Retail Trade (370 | 15.2%), Accommodation & Food Services (259 | 10.6%), Construction (253 | 10.4%), Educational Services (242 | 9.9%), and Health Care & Social Assistance (240 | 9.9%).
Employment Industries by Sex in Palmetto
The Palmetto industries that see more men than women are Wholesale Trade (100.0%), Professional & Scientific (100.0%), and Construction (90.1%), whereas the industries that tend to have a higher number of women are Finance & Insurance (100.0%), Health Care & Social Assistance (100.0%), and Educational Services (91.3%).
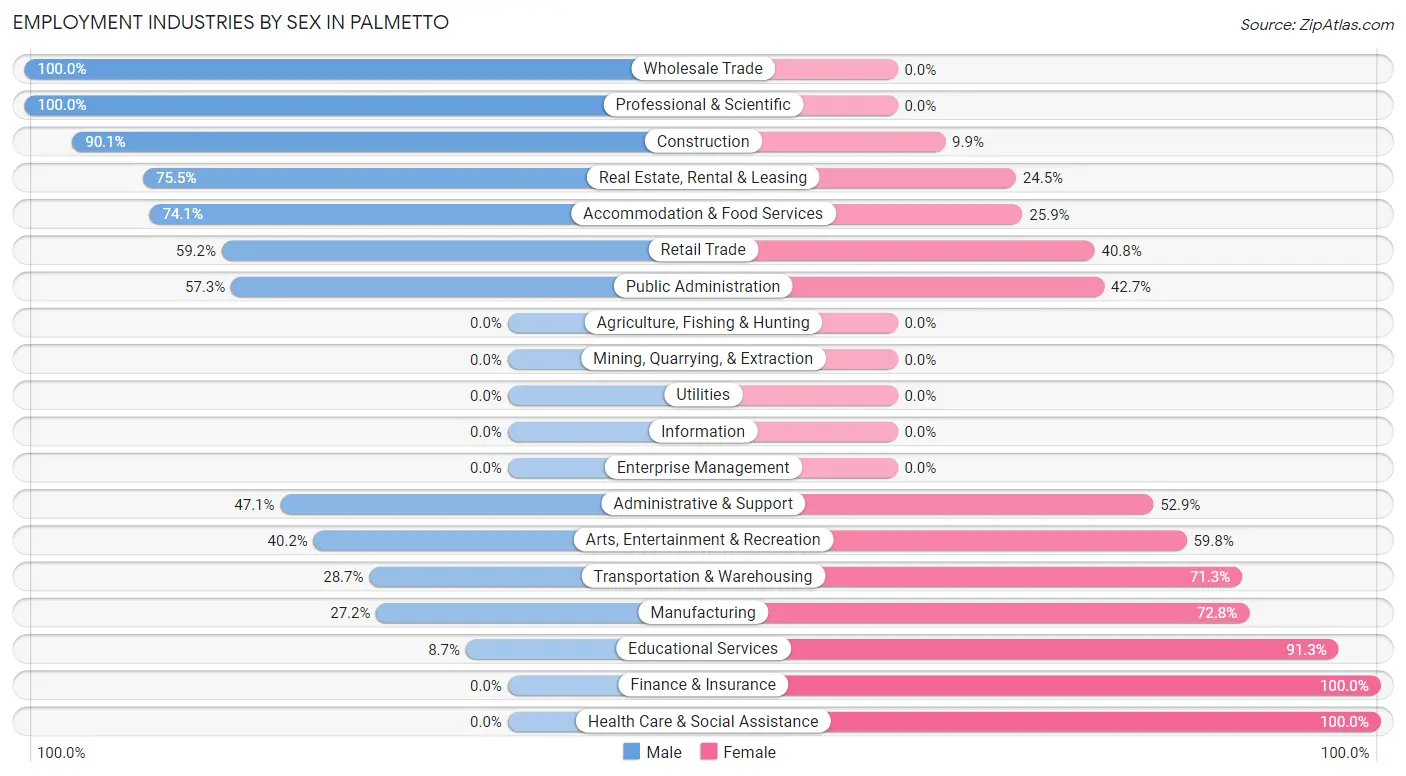
| Industry | Male | Female |
| Agriculture, Fishing & Hunting | 0 (0.0%) | 0 (0.0%) |
| Mining, Quarrying, & Extraction | 0 (0.0%) | 0 (0.0%) |
| Construction | 228 (90.1%) | 25 (9.9%) |
| Manufacturing | 40 (27.2%) | 107 (72.8%) |
| Wholesale Trade | 70 (100.0%) | 0 (0.0%) |
| Retail Trade | 219 (59.2%) | 151 (40.8%) |
| Transportation & Warehousing | 45 (28.7%) | 112 (71.3%) |
| Utilities | 0 (0.0%) | 0 (0.0%) |
| Information | 0 (0.0%) | 0 (0.0%) |
| Finance & Insurance | 0 (0.0%) | 9 (100.0%) |
| Real Estate, Rental & Leasing | 40 (75.5%) | 13 (24.5%) |
| Professional & Scientific | 80 (100.0%) | 0 (0.0%) |
| Enterprise Management | 0 (0.0%) | 0 (0.0%) |
| Administrative & Support | 32 (47.1%) | 36 (52.9%) |
| Educational Services | 21 (8.7%) | 221 (91.3%) |
| Health Care & Social Assistance | 0 (0.0%) | 240 (100.0%) |
| Arts, Entertainment & Recreation | 94 (40.2%) | 140 (59.8%) |
| Accommodation & Food Services | 192 (74.1%) | 67 (25.9%) |
| Public Administration | 134 (57.3%) | 100 (42.7%) |
| Total | 1,216 (49.9%) | 1,221 (50.1%) |
Education in Palmetto
School Enrollment in Palmetto
The most common levels of schooling among the 1,160 students in Palmetto are elementary school (478 | 41.2%), high school (262 | 22.6%), and middle school (210 | 18.1%).
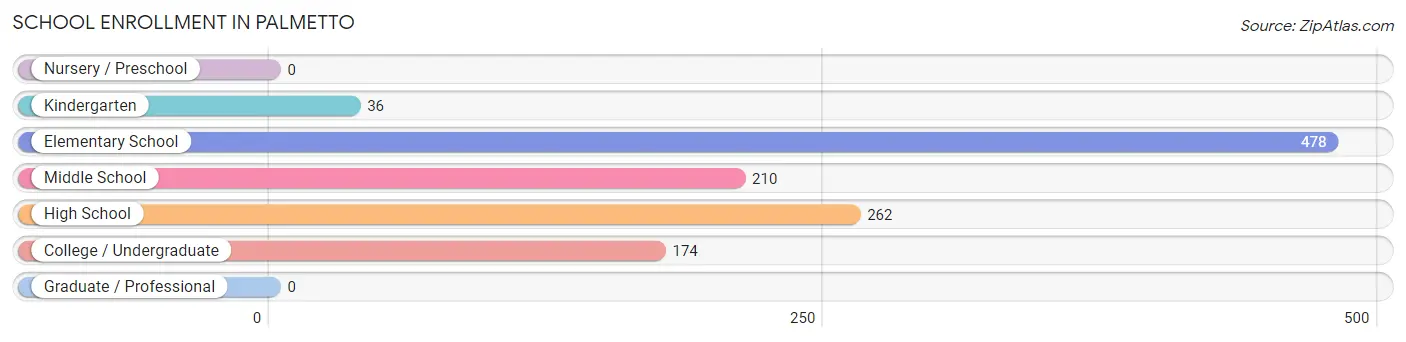
| School Level | # Students | % Students |
| Nursery / Preschool | 0 | 0.0% |
| Kindergarten | 36 | 3.1% |
| Elementary School | 478 | 41.2% |
| Middle School | 210 | 18.1% |
| High School | 262 | 22.6% |
| College / Undergraduate | 174 | 15.0% |
| Graduate / Professional | 0 | 0.0% |
| Total | 1,160 | 100.0% |
School Enrollment by Age by Funding Source in Palmetto
Out of a total of 1,160 students who are enrolled in schools in Palmetto, 109 (9.4%) attend a private institution, while the remaining 1,051 (90.6%) are enrolled in public schools. The age group of 35 years and over has the highest likelihood of being enrolled in private schools, with 58 (47.1% in the age bracket) enrolled. Conversely, the age group of 15 to 17 year olds has the lowest likelihood of being enrolled in a private school, with 165 (100.0% in the age bracket) attending a public institution.
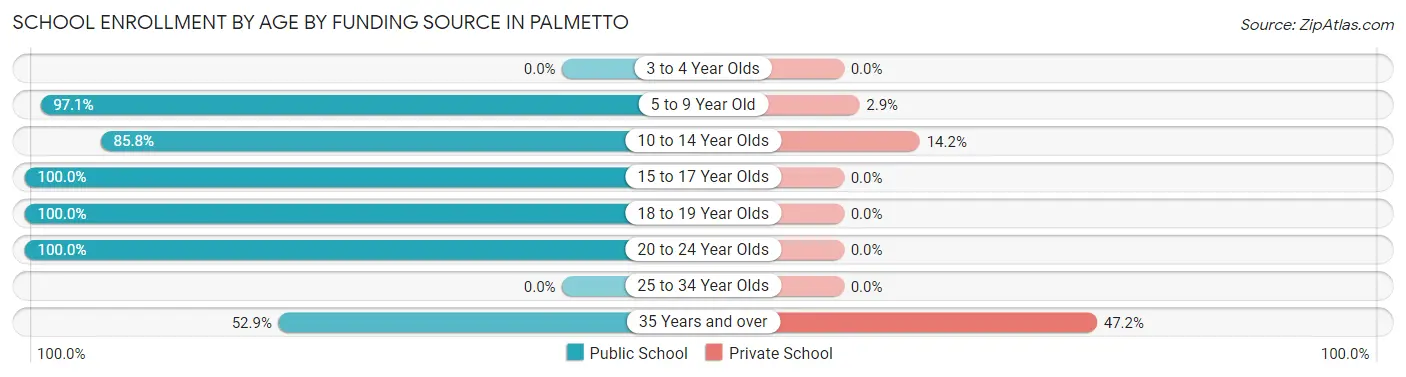
| Age Bracket | Public School | Private School |
| 3 to 4 Year Olds | 0 (0.0%) | 0 (0.0%) |
| 5 to 9 Year Old | 499 (97.1%) | 15 (2.9%) |
| 10 to 14 Year Olds | 218 (85.8%) | 36 (14.2%) |
| 15 to 17 Year Olds | 165 (100.0%) | 0 (0.0%) |
| 18 to 19 Year Olds | 71 (100.0%) | 0 (0.0%) |
| 20 to 24 Year Olds | 33 (100.0%) | 0 (0.0%) |
| 25 to 34 Year Olds | 0 (0.0%) | 0 (0.0%) |
| 35 Years and over | 65 (52.8%) | 58 (47.1%) |
| Total | 1,051 (90.6%) | 109 (9.4%) |
Educational Attainment by Field of Study in Palmetto
Business (196 | 30.8%), social sciences (159 | 25.0%), bio, nature & agricultural (100 | 15.7%), science & technology (34 | 5.3%), and engineering (33 | 5.2%) are the most common fields of study among 637 individuals in Palmetto who have obtained a bachelor's degree or higher.
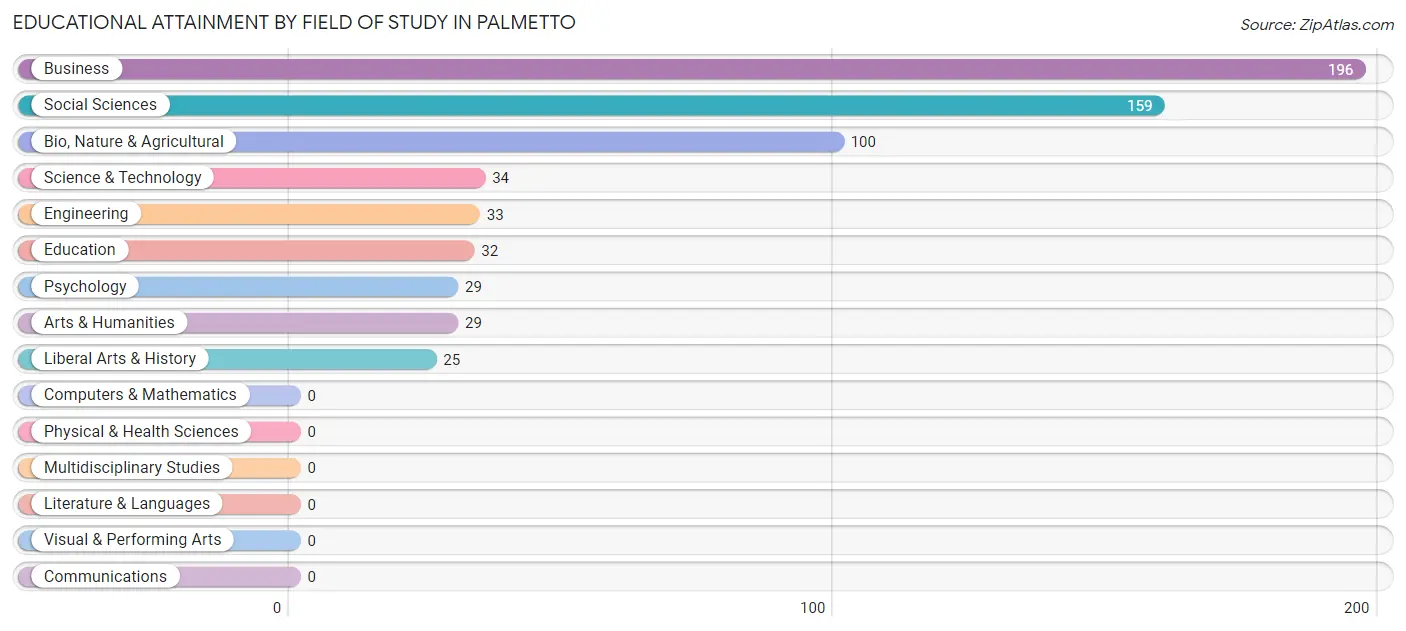
| Field of Study | # Graduates | % Graduates |
| Computers & Mathematics | 0 | 0.0% |
| Bio, Nature & Agricultural | 100 | 15.7% |
| Physical & Health Sciences | 0 | 0.0% |
| Psychology | 29 | 4.5% |
| Social Sciences | 159 | 25.0% |
| Engineering | 33 | 5.2% |
| Multidisciplinary Studies | 0 | 0.0% |
| Science & Technology | 34 | 5.3% |
| Business | 196 | 30.8% |
| Education | 32 | 5.0% |
| Literature & Languages | 0 | 0.0% |
| Liberal Arts & History | 25 | 3.9% |
| Visual & Performing Arts | 0 | 0.0% |
| Communications | 0 | 0.0% |
| Arts & Humanities | 29 | 4.5% |
| Total | 637 | 100.0% |
Transportation & Commute in Palmetto
Vehicle Availability by Sex in Palmetto
The most prevalent vehicle ownership categories in Palmetto are males with 2 vehicles (502, accounting for 41.3%) and females with 2 vehicles (477, making up 45.5%).
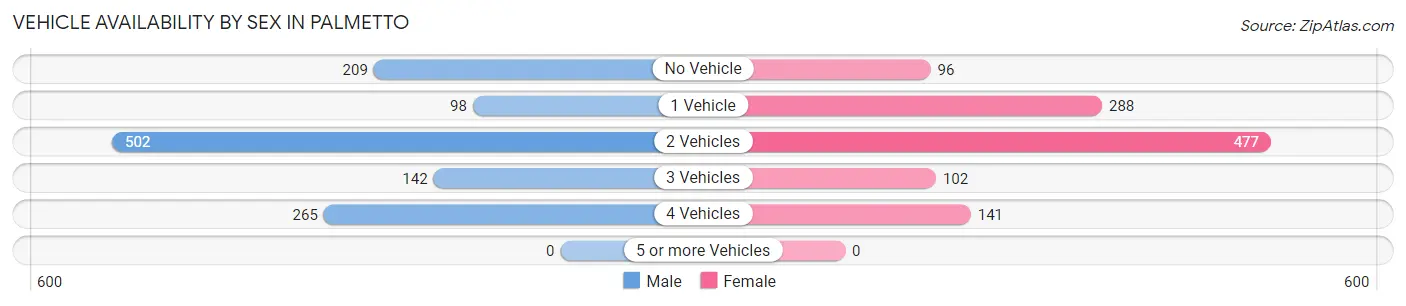
| Vehicles Available | Male | Female |
| No Vehicle | 209 (17.2%) | 96 (8.7%) |
| 1 Vehicle | 98 (8.1%) | 288 (26.1%) |
| 2 Vehicles | 502 (41.3%) | 477 (43.2%) |
| 3 Vehicles | 142 (11.7%) | 102 (9.2%) |
| 4 Vehicles | 265 (21.8%) | 141 (12.8%) |
| 5 or more Vehicles | 0 (0.0%) | 0 (0.0%) |
| Total | 1,216 (100.0%) | 1,104 (100.0%) |
Commute Time in Palmetto
The most frequently occuring commute durations in Palmetto are 20 to 24 minutes (507 commuters, 24.5%), 15 to 19 minutes (331 commuters, 16.0%), and 60 to 89 minutes (304 commuters, 14.7%).
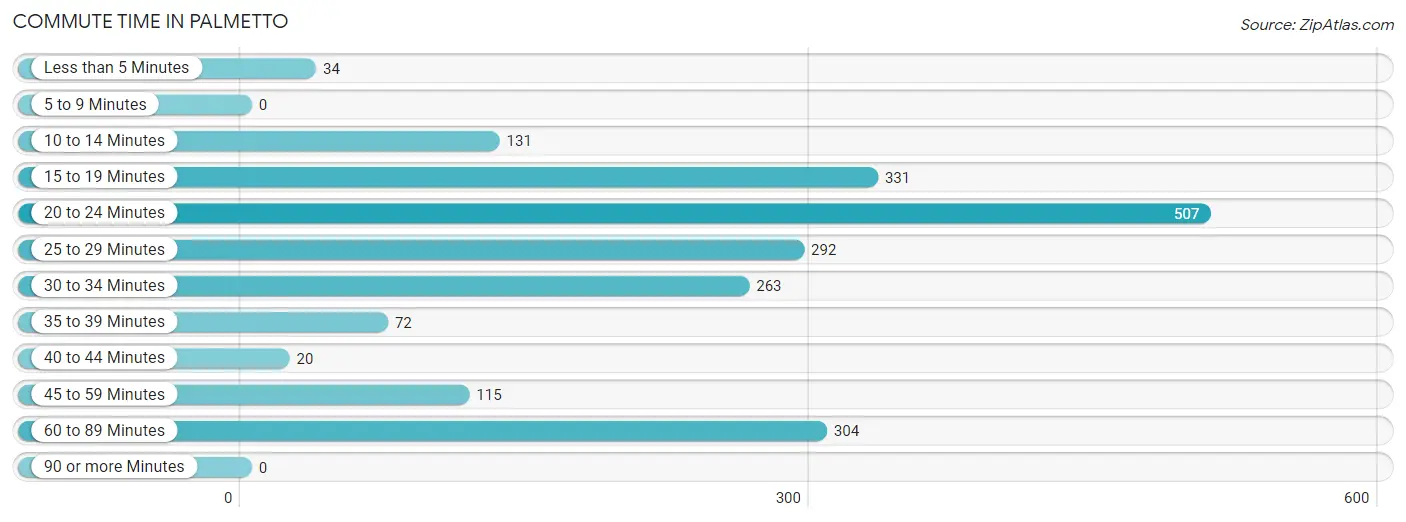
| Commute Time | # Commuters | % Commuters |
| Less than 5 Minutes | 34 | 1.6% |
| 5 to 9 Minutes | 0 | 0.0% |
| 10 to 14 Minutes | 131 | 6.3% |
| 15 to 19 Minutes | 331 | 16.0% |
| 20 to 24 Minutes | 507 | 24.5% |
| 25 to 29 Minutes | 292 | 14.1% |
| 30 to 34 Minutes | 263 | 12.7% |
| 35 to 39 Minutes | 72 | 3.5% |
| 40 to 44 Minutes | 20 | 1.0% |
| 45 to 59 Minutes | 115 | 5.6% |
| 60 to 89 Minutes | 304 | 14.7% |
| 90 or more Minutes | 0 | 0.0% |
Commute Time by Sex in Palmetto
The most common commute times in Palmetto are 20 to 24 minutes (400 commuters, 33.8%) for males and 15 to 19 minutes (247 commuters, 27.9%) for females.
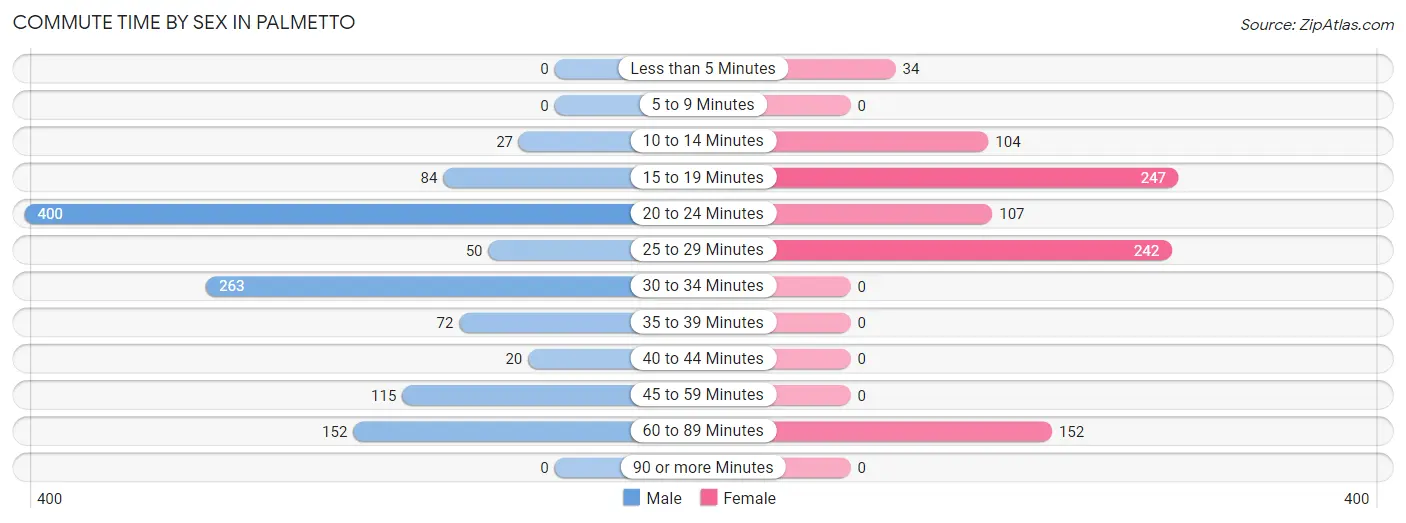
| Commute Time | Male | Female |
| Less than 5 Minutes | 0 (0.0%) | 34 (3.8%) |
| 5 to 9 Minutes | 0 (0.0%) | 0 (0.0%) |
| 10 to 14 Minutes | 27 (2.3%) | 104 (11.7%) |
| 15 to 19 Minutes | 84 (7.1%) | 247 (27.9%) |
| 20 to 24 Minutes | 400 (33.8%) | 107 (12.1%) |
| 25 to 29 Minutes | 50 (4.2%) | 242 (27.3%) |
| 30 to 34 Minutes | 263 (22.2%) | 0 (0.0%) |
| 35 to 39 Minutes | 72 (6.1%) | 0 (0.0%) |
| 40 to 44 Minutes | 20 (1.7%) | 0 (0.0%) |
| 45 to 59 Minutes | 115 (9.7%) | 0 (0.0%) |
| 60 to 89 Minutes | 152 (12.9%) | 152 (17.2%) |
| 90 or more Minutes | 0 (0.0%) | 0 (0.0%) |
Time of Departure to Work by Sex in Palmetto
The most frequent times of departure to work in Palmetto are 5:00 AM to 5:29 AM (227, 19.2%) for males and 8:00 AM to 8:29 AM (159, 17.9%) for females.
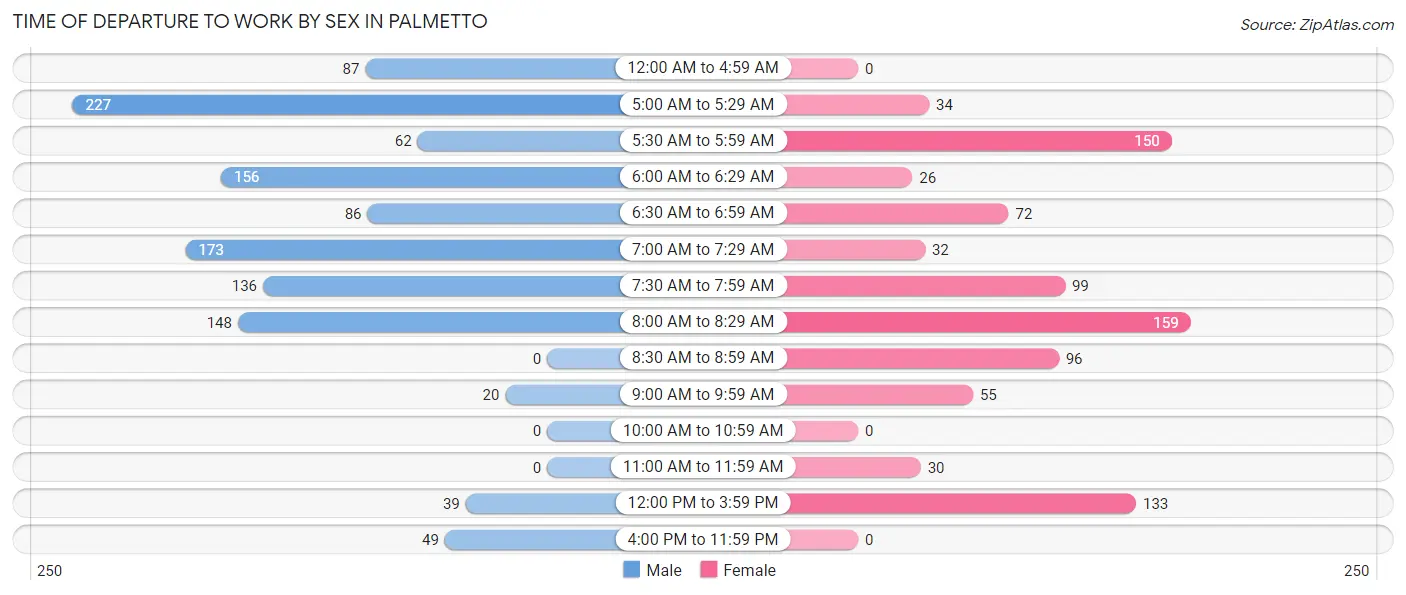
| Time of Departure | Male | Female |
| 12:00 AM to 4:59 AM | 87 (7.3%) | 0 (0.0%) |
| 5:00 AM to 5:29 AM | 227 (19.2%) | 34 (3.8%) |
| 5:30 AM to 5:59 AM | 62 (5.2%) | 150 (16.9%) |
| 6:00 AM to 6:29 AM | 156 (13.2%) | 26 (2.9%) |
| 6:30 AM to 6:59 AM | 86 (7.3%) | 72 (8.1%) |
| 7:00 AM to 7:29 AM | 173 (14.6%) | 32 (3.6%) |
| 7:30 AM to 7:59 AM | 136 (11.5%) | 99 (11.2%) |
| 8:00 AM to 8:29 AM | 148 (12.5%) | 159 (17.9%) |
| 8:30 AM to 8:59 AM | 0 (0.0%) | 96 (10.8%) |
| 9:00 AM to 9:59 AM | 20 (1.7%) | 55 (6.2%) |
| 10:00 AM to 10:59 AM | 0 (0.0%) | 0 (0.0%) |
| 11:00 AM to 11:59 AM | 0 (0.0%) | 30 (3.4%) |
| 12:00 PM to 3:59 PM | 39 (3.3%) | 133 (15.0%) |
| 4:00 PM to 11:59 PM | 49 (4.1%) | 0 (0.0%) |
| Total | 1,183 (100.0%) | 886 (100.0%) |
Housing Occupancy in Palmetto
Occupancy by Ownership in Palmetto
Of the total 1,880 dwellings in Palmetto, owner-occupied units account for 1,001 (53.2%), while renter-occupied units make up 879 (46.8%).
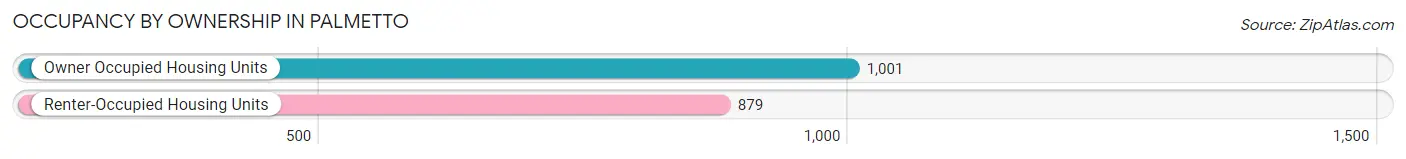
| Occupancy | # Housing Units | % Housing Units |
| Owner Occupied Housing Units | 1,001 | 53.2% |
| Renter-Occupied Housing Units | 879 | 46.8% |
| Total Occupied Housing Units | 1,880 | 100.0% |
Occupancy by Household Size in Palmetto
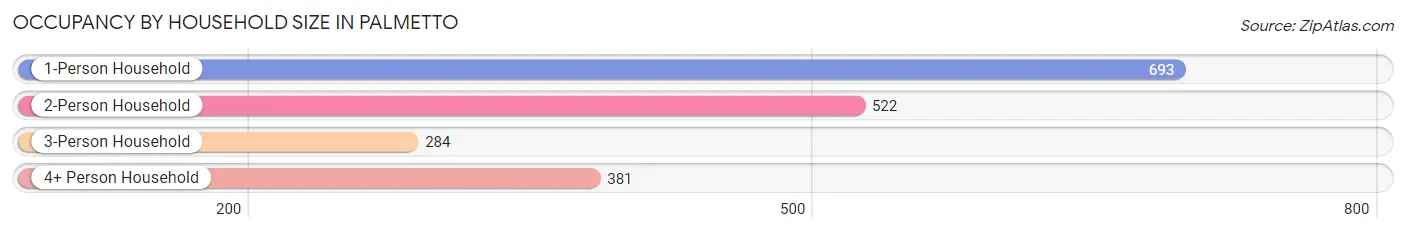
| Household Size | # Housing Units | % Housing Units |
| 1-Person Household | 693 | 36.9% |
| 2-Person Household | 522 | 27.8% |
| 3-Person Household | 284 | 15.1% |
| 4+ Person Household | 381 | 20.3% |
| Total Housing Units | 1,880 | 100.0% |
Occupancy by Ownership by Household Size in Palmetto
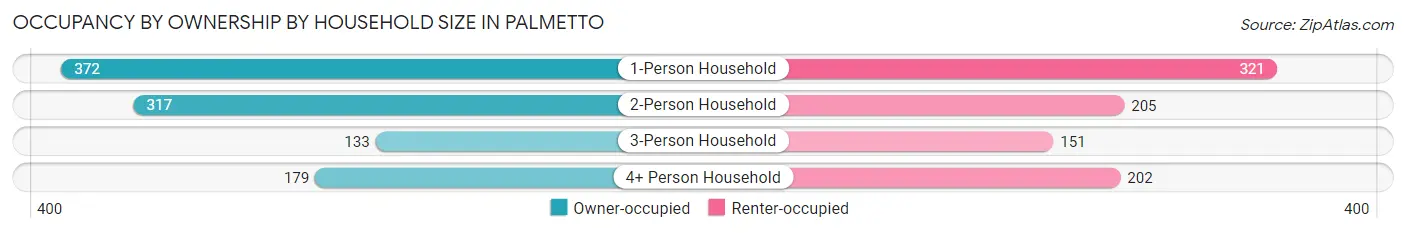
| Household Size | Owner-occupied | Renter-occupied |
| 1-Person Household | 372 (53.7%) | 321 (46.3%) |
| 2-Person Household | 317 (60.7%) | 205 (39.3%) |
| 3-Person Household | 133 (46.8%) | 151 (53.2%) |
| 4+ Person Household | 179 (47.0%) | 202 (53.0%) |
| Total Housing Units | 1,001 (53.2%) | 879 (46.8%) |
Occupancy by Educational Attainment in Palmetto
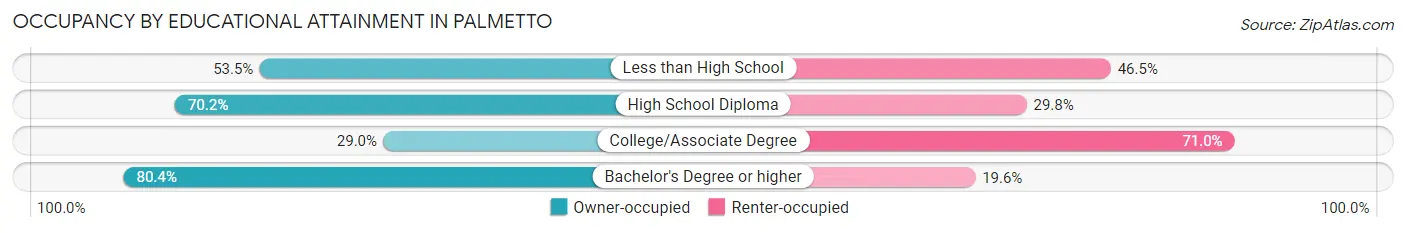
| Household Size | Owner-occupied | Renter-occupied |
| Less than High School | 115 (53.5%) | 100 (46.5%) |
| High School Diploma | 353 (70.2%) | 150 (29.8%) |
| College/Associate Degree | 226 (29.0%) | 554 (71.0%) |
| Bachelor's Degree or higher | 307 (80.4%) | 75 (19.6%) |
Occupancy by Age of Householder in Palmetto
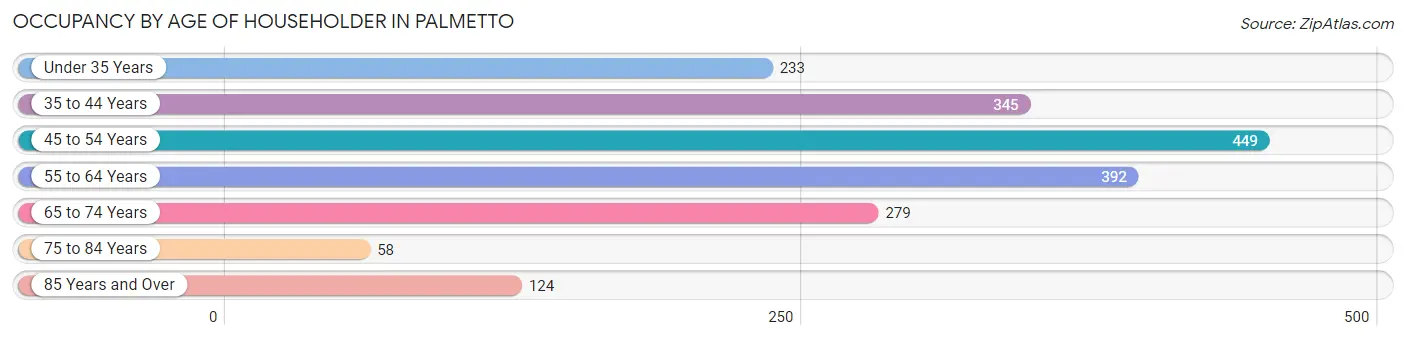
| Age Bracket | # Households | % Households |
| Under 35 Years | 233 | 12.4% |
| 35 to 44 Years | 345 | 18.3% |
| 45 to 54 Years | 449 | 23.9% |
| 55 to 64 Years | 392 | 20.8% |
| 65 to 74 Years | 279 | 14.8% |
| 75 to 84 Years | 58 | 3.1% |
| 85 Years and Over | 124 | 6.6% |
| Total | 1,880 | 100.0% |
Housing Finances in Palmetto
Median Income by Occupancy in Palmetto
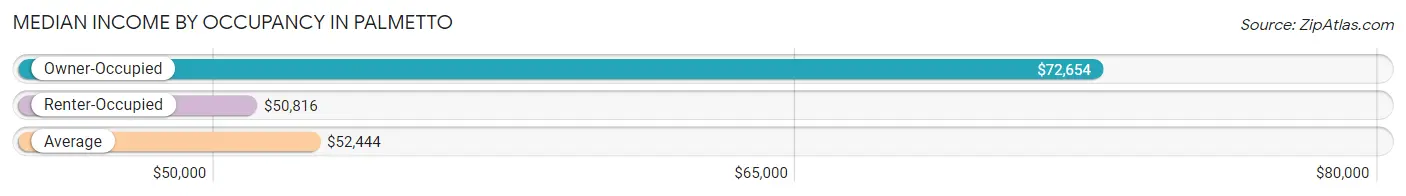
| Occupancy Type | # Households | Median Income |
| Owner-Occupied | 1,001 (53.2%) | $72,654 |
| Renter-Occupied | 879 (46.8%) | $50,816 |
| Average | 1,880 (100.0%) | $52,444 |
Occupancy by Householder Income Bracket in Palmetto
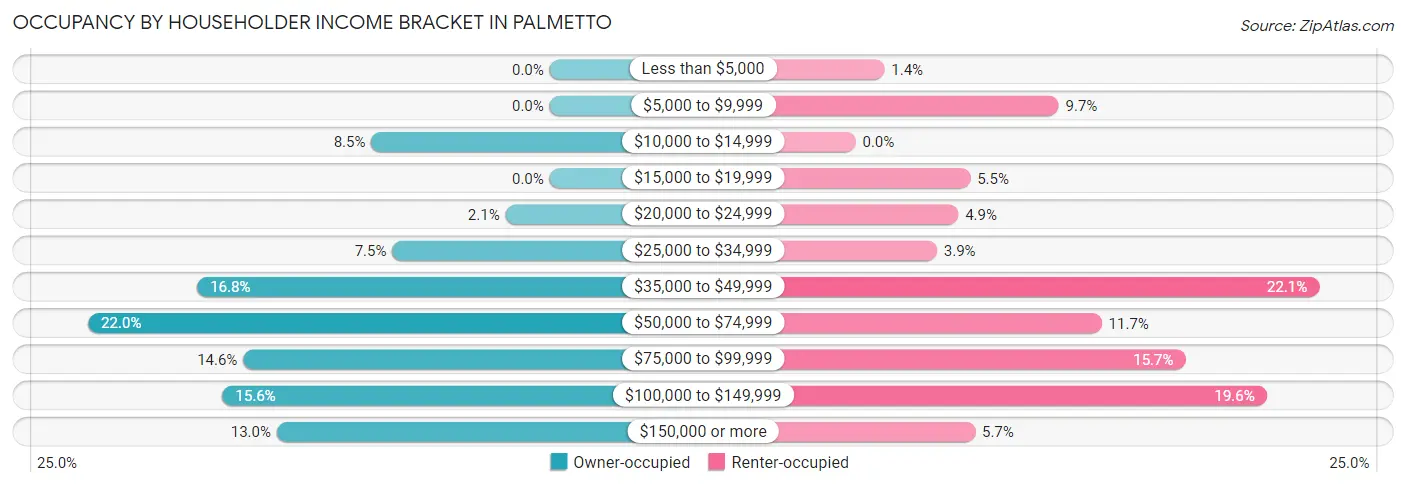
| Income Bracket | Owner-occupied | Renter-occupied |
| Less than $5,000 | 0 (0.0%) | 12 (1.4%) |
| $5,000 to $9,999 | 0 (0.0%) | 85 (9.7%) |
| $10,000 to $14,999 | 85 (8.5%) | 0 (0.0%) |
| $15,000 to $19,999 | 0 (0.0%) | 48 (5.5%) |
| $20,000 to $24,999 | 21 (2.1%) | 43 (4.9%) |
| $25,000 to $34,999 | 75 (7.5%) | 34 (3.9%) |
| $35,000 to $49,999 | 168 (16.8%) | 194 (22.1%) |
| $50,000 to $74,999 | 220 (22.0%) | 103 (11.7%) |
| $75,000 to $99,999 | 146 (14.6%) | 138 (15.7%) |
| $100,000 to $149,999 | 156 (15.6%) | 172 (19.6%) |
| $150,000 or more | 130 (13.0%) | 50 (5.7%) |
| Total | 1,001 (100.0%) | 879 (100.0%) |
Monthly Housing Cost Tiers in Palmetto
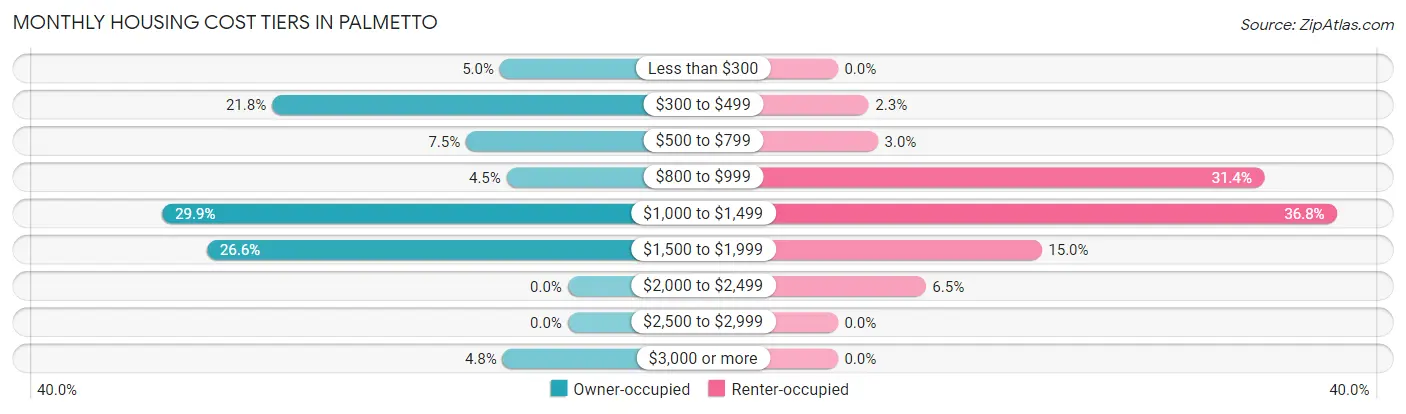
| Monthly Cost | Owner-occupied | Renter-occupied |
| Less than $300 | 50 (5.0%) | 0 (0.0%) |
| $300 to $499 | 218 (21.8%) | 20 (2.3%) |
| $500 to $799 | 75 (7.5%) | 26 (3.0%) |
| $800 to $999 | 45 (4.5%) | 276 (31.4%) |
| $1,000 to $1,499 | 299 (29.9%) | 323 (36.7%) |
| $1,500 to $1,999 | 266 (26.6%) | 132 (15.0%) |
| $2,000 to $2,499 | 0 (0.0%) | 57 (6.5%) |
| $2,500 to $2,999 | 0 (0.0%) | 0 (0.0%) |
| $3,000 or more | 48 (4.8%) | 0 (0.0%) |
| Total | 1,001 (100.0%) | 879 (100.0%) |
Physical Housing Characteristics in Palmetto
Housing Structures in Palmetto
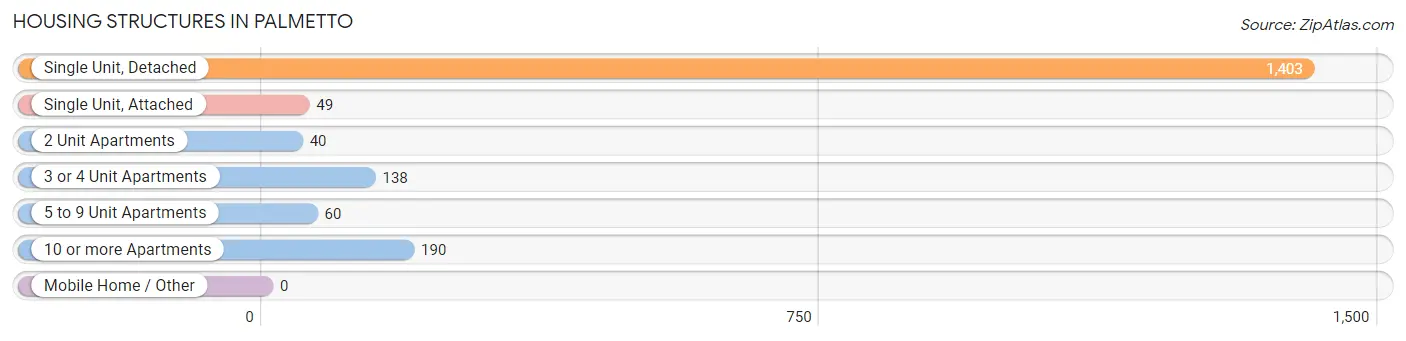
| Structure Type | # Housing Units | % Housing Units |
| Single Unit, Detached | 1,403 | 74.6% |
| Single Unit, Attached | 49 | 2.6% |
| 2 Unit Apartments | 40 | 2.1% |
| 3 or 4 Unit Apartments | 138 | 7.3% |
| 5 to 9 Unit Apartments | 60 | 3.2% |
| 10 or more Apartments | 190 | 10.1% |
| Mobile Home / Other | 0 | 0.0% |
| Total | 1,880 | 100.0% |
Housing Structures by Occupancy in Palmetto
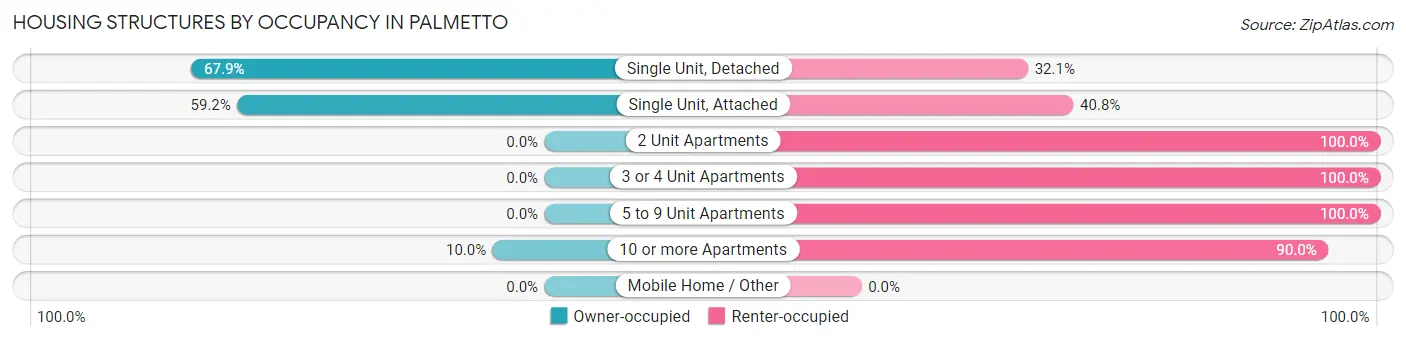
| Structure Type | Owner-occupied | Renter-occupied |
| Single Unit, Detached | 953 (67.9%) | 450 (32.1%) |
| Single Unit, Attached | 29 (59.2%) | 20 (40.8%) |
| 2 Unit Apartments | 0 (0.0%) | 40 (100.0%) |
| 3 or 4 Unit Apartments | 0 (0.0%) | 138 (100.0%) |
| 5 to 9 Unit Apartments | 0 (0.0%) | 60 (100.0%) |
| 10 or more Apartments | 19 (10.0%) | 171 (90.0%) |
| Mobile Home / Other | 0 (0.0%) | 0 (0.0%) |
| Total | 1,001 (53.2%) | 879 (46.8%) |
Housing Structures by Number of Rooms in Palmetto
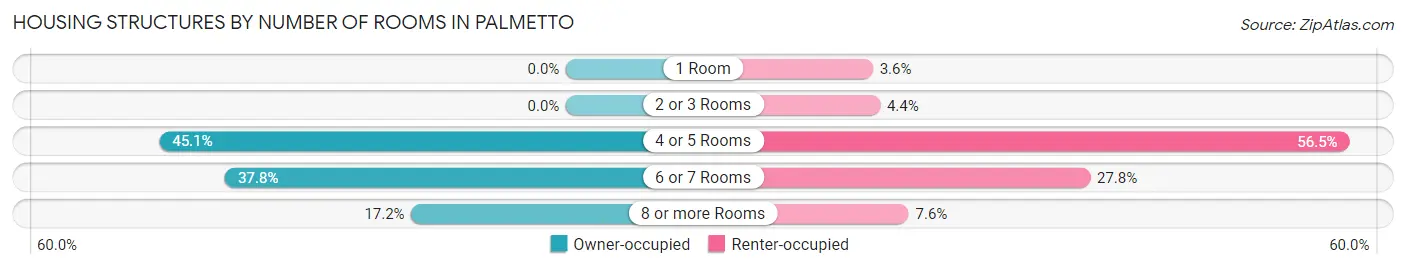
| Number of Rooms | Owner-occupied | Renter-occupied |
| 1 Room | 0 (0.0%) | 32 (3.6%) |
| 2 or 3 Rooms | 0 (0.0%) | 39 (4.4%) |
| 4 or 5 Rooms | 451 (45.1%) | 497 (56.5%) |
| 6 or 7 Rooms | 378 (37.8%) | 244 (27.8%) |
| 8 or more Rooms | 172 (17.2%) | 67 (7.6%) |
| Total | 1,001 (100.0%) | 879 (100.0%) |
Housing Structure by Heating Type in Palmetto
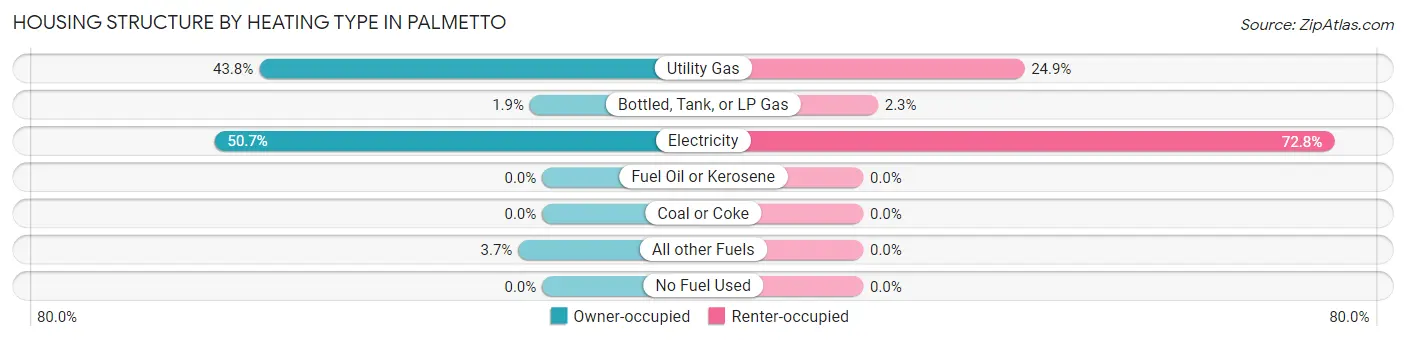
| Heating Type | Owner-occupied | Renter-occupied |
| Utility Gas | 438 (43.8%) | 219 (24.9%) |
| Bottled, Tank, or LP Gas | 19 (1.9%) | 20 (2.3%) |
| Electricity | 507 (50.6%) | 640 (72.8%) |
| Fuel Oil or Kerosene | 0 (0.0%) | 0 (0.0%) |
| Coal or Coke | 0 (0.0%) | 0 (0.0%) |
| All other Fuels | 37 (3.7%) | 0 (0.0%) |
| No Fuel Used | 0 (0.0%) | 0 (0.0%) |
| Total | 1,001 (100.0%) | 879 (100.0%) |
Household Vehicle Usage in Palmetto
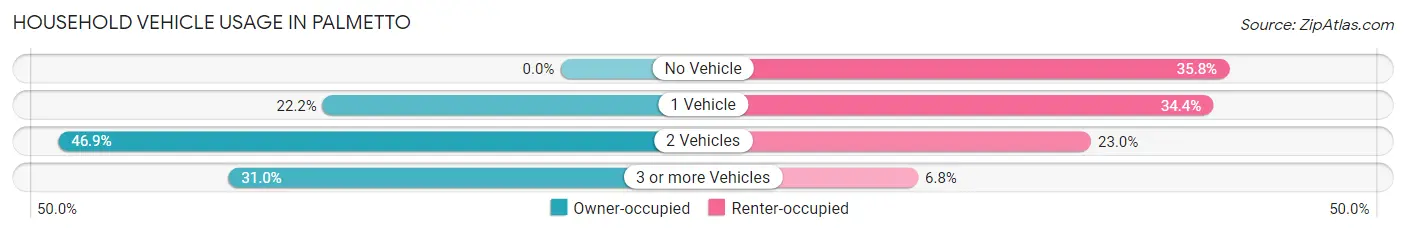
| Vehicles per Household | Owner-occupied | Renter-occupied |
| No Vehicle | 0 (0.0%) | 315 (35.8%) |
| 1 Vehicle | 222 (22.2%) | 302 (34.4%) |
| 2 Vehicles | 469 (46.9%) | 202 (23.0%) |
| 3 or more Vehicles | 310 (31.0%) | 60 (6.8%) |
| Total | 1,001 (100.0%) | 879 (100.0%) |
Real Estate & Mortgages in Palmetto
Real Estate and Mortgage Overview in Palmetto
| Characteristic | Without Mortgage | With Mortgage |
| Housing Units | 408 | 593 |
| Median Property Value | $140,800 | $167,800 |
| Median Household Income | - | - |
| Monthly Housing Costs | $462 | $29 |
| Real Estate Taxes | $1,030 | $40 |
Property Value by Mortgage Status in Palmetto
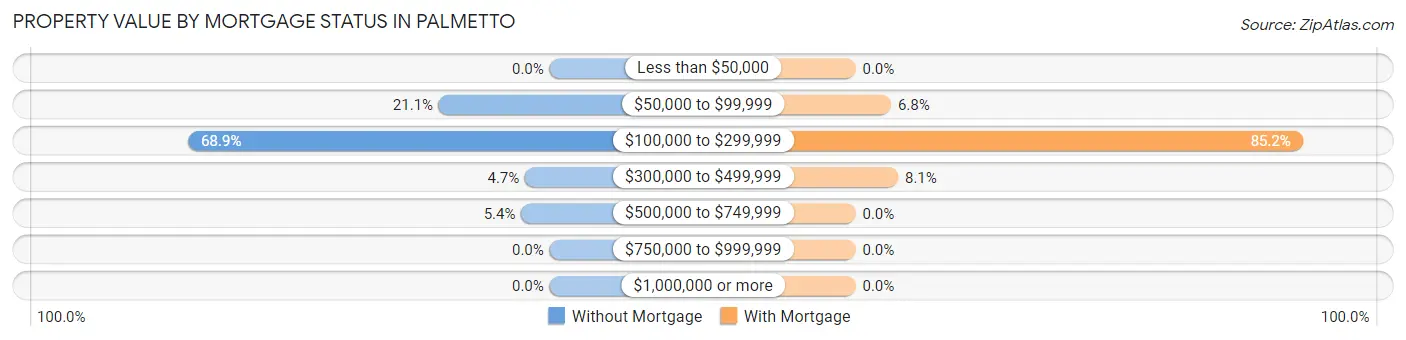
| Property Value | Without Mortgage | With Mortgage |
| Less than $50,000 | 0 (0.0%) | 0 (0.0%) |
| $50,000 to $99,999 | 86 (21.1%) | 40 (6.8%) |
| $100,000 to $299,999 | 281 (68.9%) | 505 (85.2%) |
| $300,000 to $499,999 | 19 (4.7%) | 48 (8.1%) |
| $500,000 to $749,999 | 22 (5.4%) | 0 (0.0%) |
| $750,000 to $999,999 | 0 (0.0%) | 0 (0.0%) |
| $1,000,000 or more | 0 (0.0%) | 0 (0.0%) |
| Total | 408 (100.0%) | 593 (100.0%) |
Household Income by Mortgage Status in Palmetto
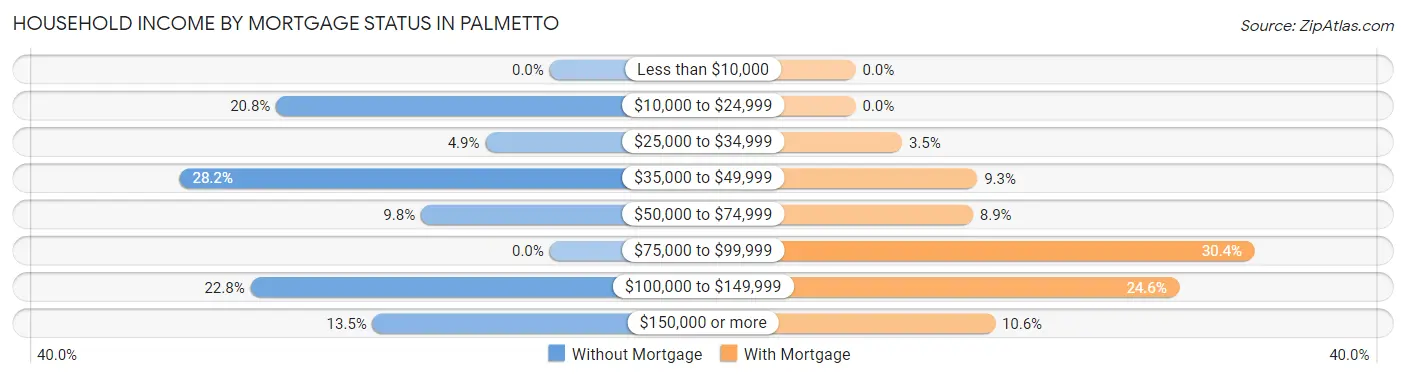
| Household Income | Without Mortgage | With Mortgage |
| Less than $10,000 | 0 (0.0%) | 0 (0.0%) |
| $10,000 to $24,999 | 85 (20.8%) | 0 (0.0%) |
| $25,000 to $34,999 | 20 (4.9%) | 21 (3.5%) |
| $35,000 to $49,999 | 115 (28.2%) | 55 (9.3%) |
| $50,000 to $74,999 | 40 (9.8%) | 53 (8.9%) |
| $75,000 to $99,999 | 0 (0.0%) | 180 (30.3%) |
| $100,000 to $149,999 | 93 (22.8%) | 146 (24.6%) |
| $150,000 or more | 55 (13.5%) | 63 (10.6%) |
| Total | 408 (100.0%) | 593 (100.0%) |
Property Value to Household Income Ratio in Palmetto
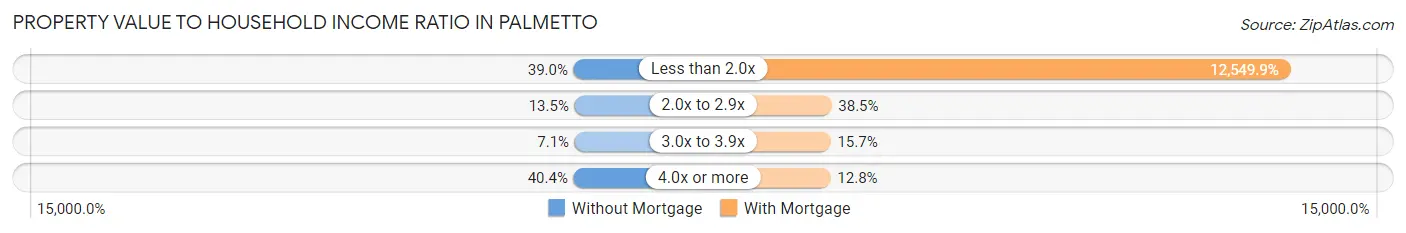
| Value-to-Income Ratio | Without Mortgage | With Mortgage |
| Less than 2.0x | 159 (39.0%) | 74,421 (12,549.9%) |
| 2.0x to 2.9x | 55 (13.5%) | 228 (38.5%) |
| 3.0x to 3.9x | 29 (7.1%) | 93 (15.7%) |
| 4.0x or more | 165 (40.4%) | 76 (12.8%) |
| Total | 408 (100.0%) | 593 (100.0%) |
Real Estate Taxes by Mortgage Status in Palmetto
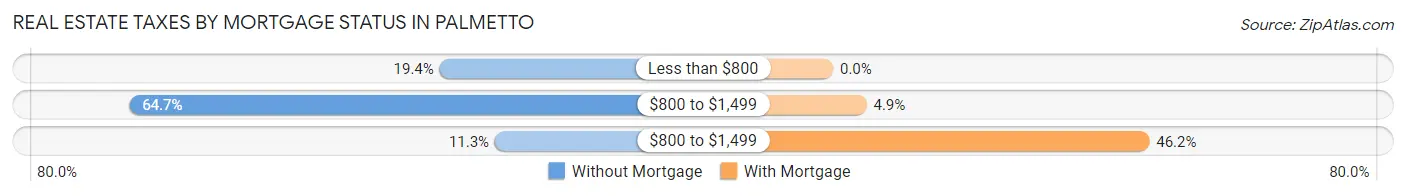
| Property Taxes | Without Mortgage | With Mortgage |
| Less than $800 | 79 (19.4%) | 0 (0.0%) |
| $800 to $1,499 | 264 (64.7%) | 29 (4.9%) |
| $800 to $1,499 | 46 (11.3%) | 274 (46.2%) |
| Total | 408 (100.0%) | 593 (100.0%) |
Health & Disability in Palmetto
Health Insurance Coverage by Age in Palmetto
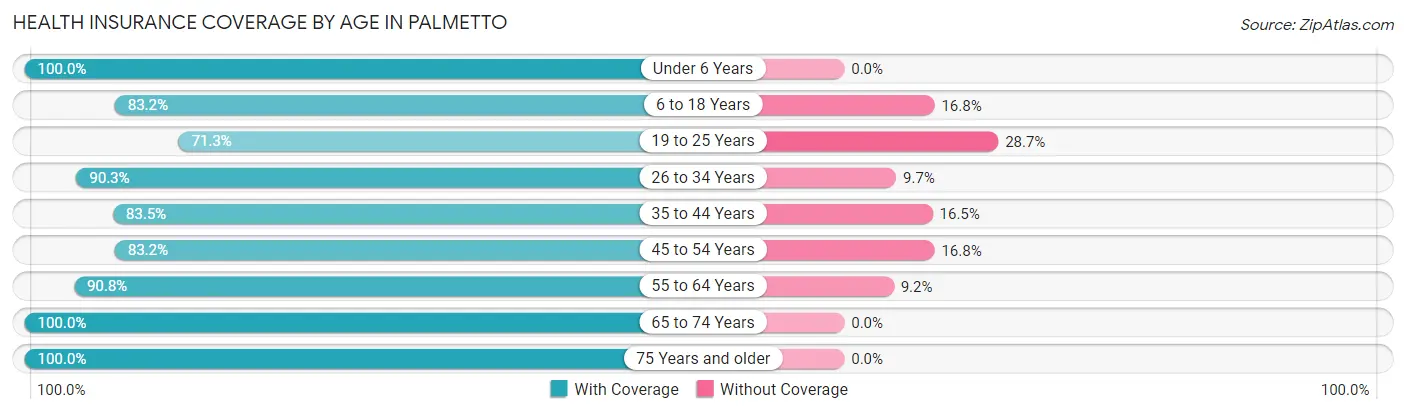
| Age Bracket | With Coverage | Without Coverage |
| Under 6 Years | 293 (100.0%) | 0 (0.0%) |
| 6 to 18 Years | 742 (83.2%) | 150 (16.8%) |
| 19 to 25 Years | 318 (71.3%) | 128 (28.7%) |
| 26 to 34 Years | 346 (90.3%) | 37 (9.7%) |
| 35 to 44 Years | 487 (83.5%) | 96 (16.5%) |
| 45 to 54 Years | 544 (83.2%) | 110 (16.8%) |
| 55 to 64 Years | 680 (90.8%) | 69 (9.2%) |
| 65 to 74 Years | 357 (100.0%) | 0 (0.0%) |
| 75 Years and older | 253 (100.0%) | 0 (0.0%) |
| Total | 4,020 (87.2%) | 590 (12.8%) |
Health Insurance Coverage by Citizenship Status in Palmetto
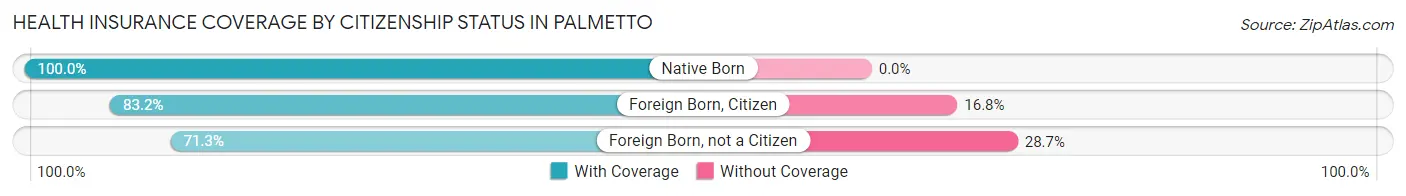
| Citizenship Status | With Coverage | Without Coverage |
| Native Born | 293 (100.0%) | 0 (0.0%) |
| Foreign Born, Citizen | 742 (83.2%) | 150 (16.8%) |
| Foreign Born, not a Citizen | 318 (71.3%) | 128 (28.7%) |
Health Insurance Coverage by Household Income in Palmetto
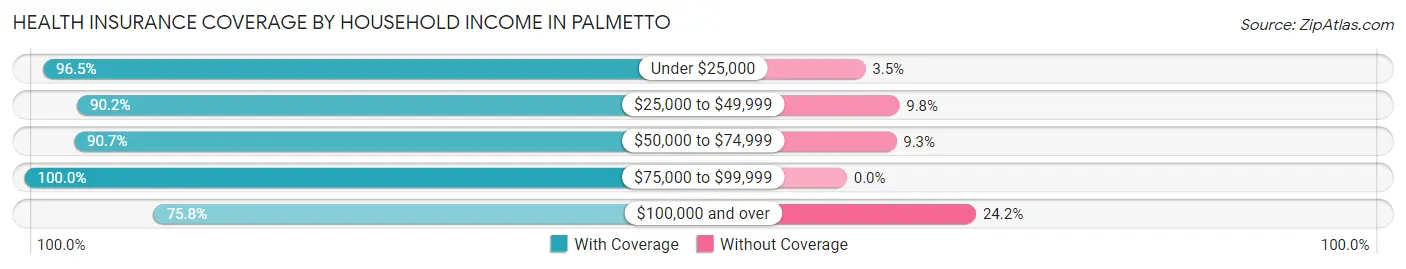
| Household Income | With Coverage | Without Coverage |
| Under $25,000 | 472 (96.5%) | 17 (3.5%) |
| $25,000 to $49,999 | 926 (90.2%) | 101 (9.8%) |
| $50,000 to $74,999 | 558 (90.7%) | 57 (9.3%) |
| $75,000 to $99,999 | 848 (100.0%) | 0 (0.0%) |
| $100,000 and over | 1,206 (75.8%) | 385 (24.2%) |
Public vs Private Health Insurance Coverage by Age in Palmetto
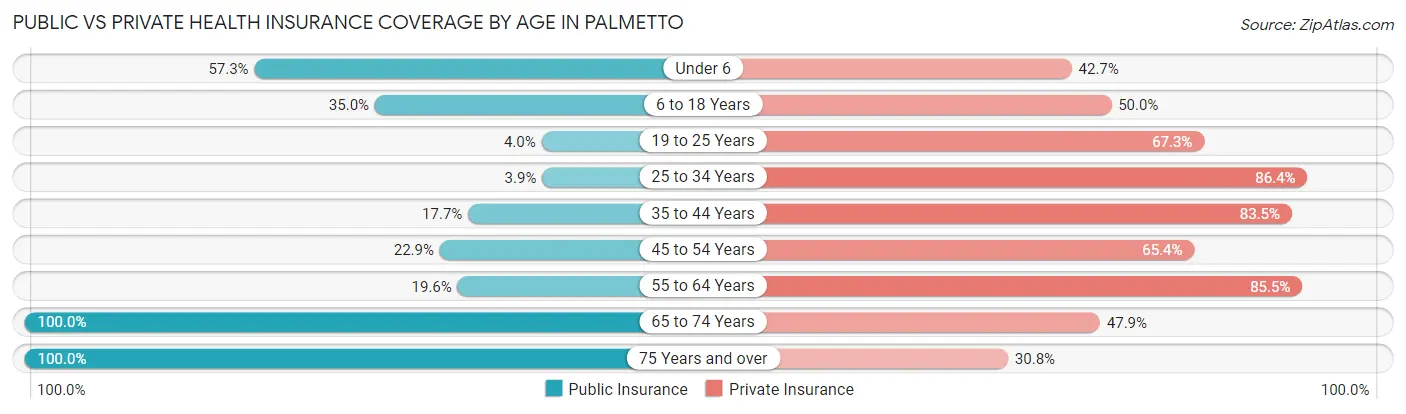
| Age Bracket | Public Insurance | Private Insurance |
| Under 6 | 168 (57.3%) | 125 (42.7%) |
| 6 to 18 Years | 312 (35.0%) | 446 (50.0%) |
| 19 to 25 Years | 18 (4.0%) | 300 (67.3%) |
| 25 to 34 Years | 15 (3.9%) | 331 (86.4%) |
| 35 to 44 Years | 103 (17.7%) | 487 (83.5%) |
| 45 to 54 Years | 150 (22.9%) | 428 (65.4%) |
| 55 to 64 Years | 147 (19.6%) | 640 (85.5%) |
| 65 to 74 Years | 357 (100.0%) | 171 (47.9%) |
| 75 Years and over | 253 (100.0%) | 78 (30.8%) |
| Total | 1,523 (33.0%) | 3,006 (65.2%) |
Disability Status by Sex by Age in Palmetto
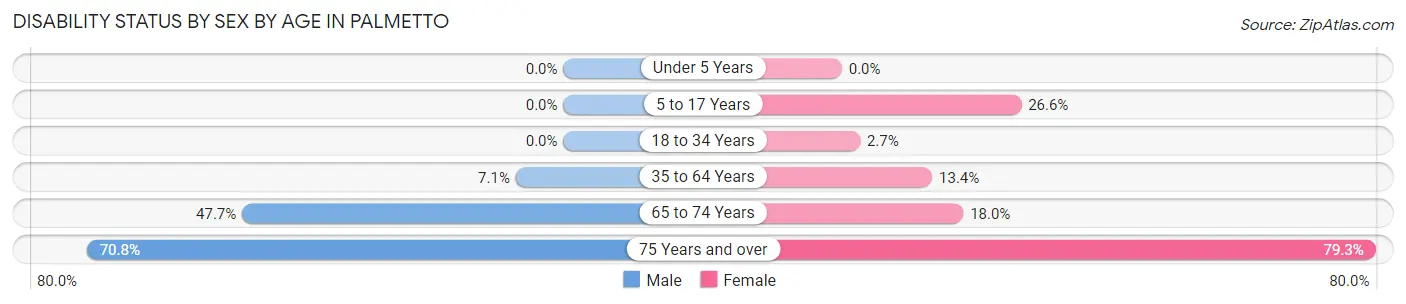
| Age Bracket | Male | Female |
| Under 5 Years | 0 (0.0%) | 0 (0.0%) |
| 5 to 17 Years | 0 (0.0%) | 158 (26.6%) |
| 18 to 34 Years | 0 (0.0%) | 11 (2.7%) |
| 35 to 64 Years | 65 (7.1%) | 143 (13.4%) |
| 65 to 74 Years | 83 (47.7%) | 33 (18.0%) |
| 75 Years and over | 46 (70.8%) | 149 (79.3%) |
Disability Class by Sex by Age in Palmetto
Disability Class: Hearing Difficulty
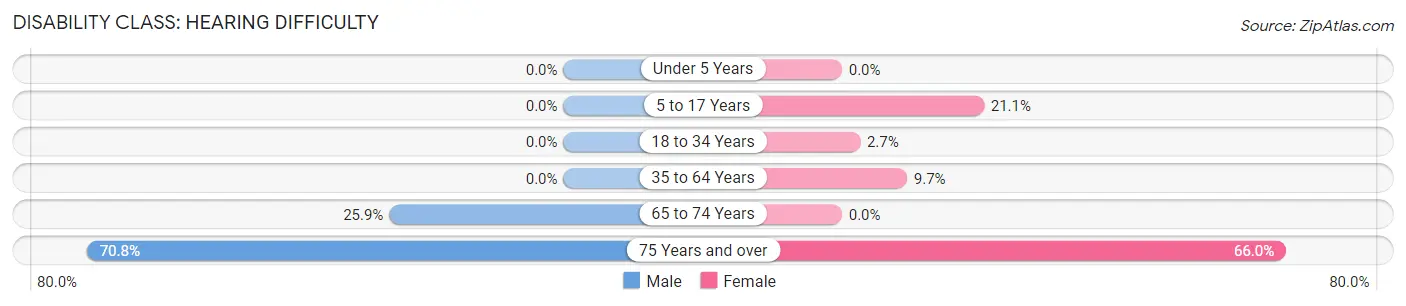
| Age Bracket | Male | Female |
| Under 5 Years | 0 (0.0%) | 0 (0.0%) |
| 5 to 17 Years | 0 (0.0%) | 125 (21.1%) |
| 18 to 34 Years | 0 (0.0%) | 11 (2.7%) |
| 35 to 64 Years | 0 (0.0%) | 103 (9.7%) |
| 65 to 74 Years | 45 (25.9%) | 0 (0.0%) |
| 75 Years and over | 46 (70.8%) | 124 (66.0%) |
Disability Class: Vision Difficulty
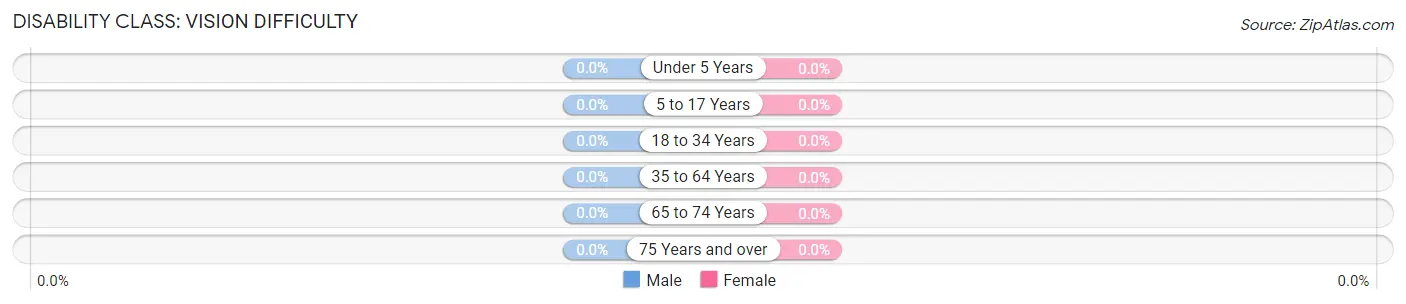
| Age Bracket | Male | Female |
| Under 5 Years | 0 (0.0%) | 0 (0.0%) |
| 5 to 17 Years | 0 (0.0%) | 0 (0.0%) |
| 18 to 34 Years | 0 (0.0%) | 0 (0.0%) |
| 35 to 64 Years | 0 (0.0%) | 0 (0.0%) |
| 65 to 74 Years | 0 (0.0%) | 0 (0.0%) |
| 75 Years and over | 0 (0.0%) | 0 (0.0%) |
Disability Class: Cognitive Difficulty
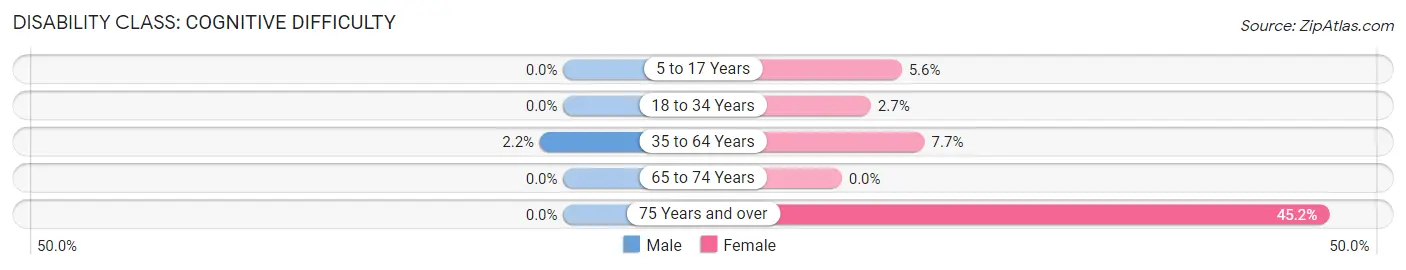
| Age Bracket | Male | Female |
| 5 to 17 Years | 0 (0.0%) | 33 (5.6%) |
| 18 to 34 Years | 0 (0.0%) | 11 (2.7%) |
| 35 to 64 Years | 20 (2.2%) | 82 (7.7%) |
| 65 to 74 Years | 0 (0.0%) | 0 (0.0%) |
| 75 Years and over | 0 (0.0%) | 85 (45.2%) |
Disability Class: Ambulatory Difficulty
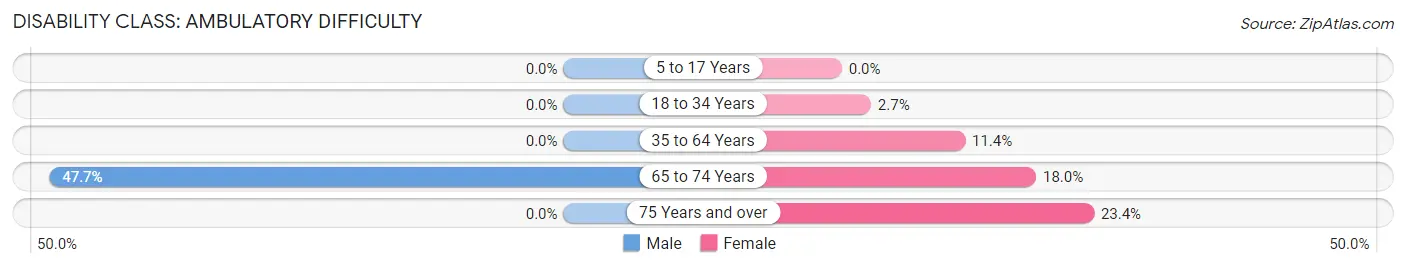
| Age Bracket | Male | Female |
| 5 to 17 Years | 0 (0.0%) | 0 (0.0%) |
| 18 to 34 Years | 0 (0.0%) | 11 (2.7%) |
| 35 to 64 Years | 0 (0.0%) | 122 (11.4%) |
| 65 to 74 Years | 83 (47.7%) | 33 (18.0%) |
| 75 Years and over | 0 (0.0%) | 44 (23.4%) |
Disability Class: Self-Care Difficulty
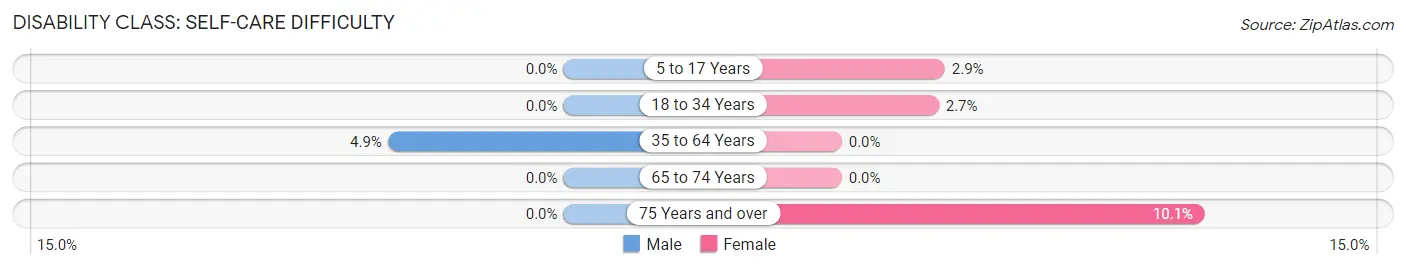
| Age Bracket | Male | Female |
| 5 to 17 Years | 0 (0.0%) | 17 (2.9%) |
| 18 to 34 Years | 0 (0.0%) | 11 (2.7%) |
| 35 to 64 Years | 45 (4.9%) | 0 (0.0%) |
| 65 to 74 Years | 0 (0.0%) | 0 (0.0%) |
| 75 Years and over | 0 (0.0%) | 19 (10.1%) |
Technology Access in Palmetto
Computing Device Access in Palmetto
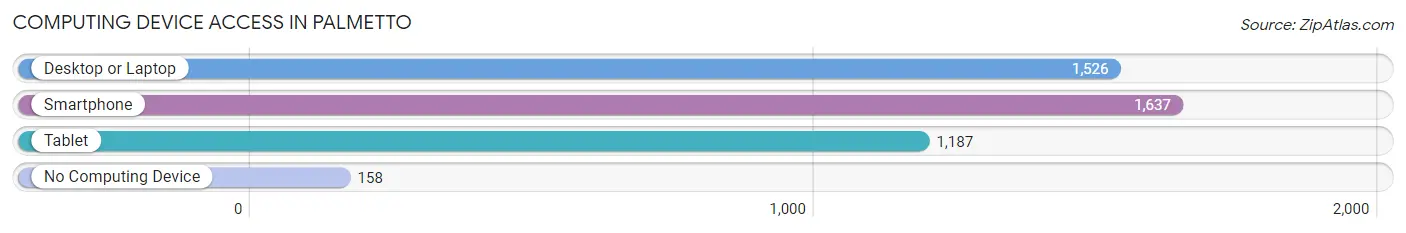
| Device Type | # Households | % Households |
| Desktop or Laptop | 1,526 | 81.2% |
| Smartphone | 1,637 | 87.1% |
| Tablet | 1,187 | 63.1% |
| No Computing Device | 158 | 8.4% |
| Total | 1,880 | 100.0% |
Internet Access in Palmetto
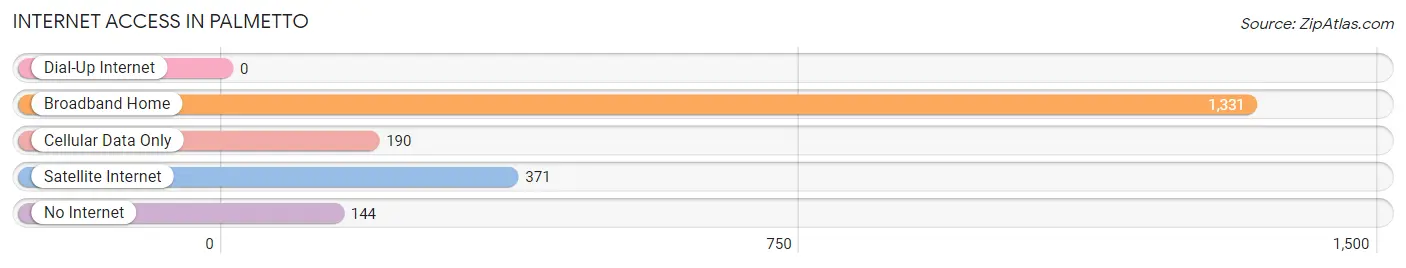
| Internet Type | # Households | % Households |
| Dial-Up Internet | 0 | 0.0% |
| Broadband Home | 1,331 | 70.8% |
| Cellular Data Only | 190 | 10.1% |
| Satellite Internet | 371 | 19.7% |
| No Internet | 144 | 7.7% |
| Total | 1,880 | 100.0% |
Palmetto Summary
Palmetto, Georgia is a small city located in the northwestern part of the state, about 30 miles south of Atlanta. It is part of the Atlanta metropolitan area and is the county seat of Fulton County. The city has a population of approximately 5,000 people and is known for its historic downtown area, which is home to a variety of shops, restaurants, and other businesses.
History
Palmetto was founded in 1854 by a group of settlers from South Carolina. The city was named after the palmetto trees that grew in the area. The city was incorporated in 1859 and quickly became a center of commerce and industry. The city was home to several cotton mills, a railroad, and a variety of other businesses.
In the late 19th century, Palmetto was a popular destination for tourists, who came to enjoy the city’s natural beauty and its many attractions. The city was also home to a number of prominent citizens, including the first African-American mayor of a Georgia city, William H. Anderson.
Geography
Palmetto is located in the northwestern part of Georgia, about 30 miles south of Atlanta. The city is situated in the foothills of the Appalachian Mountains and is surrounded by rolling hills and forests. The city is located on the banks of the Chattahoochee River, which provides a scenic backdrop for the city.
The climate in Palmetto is mild and humid, with hot summers and mild winters. The average annual temperature is around 70 degrees Fahrenheit. The city receives an average of 48 inches of rain per year.
Economy
Palmetto’s economy is largely based on agriculture and manufacturing. The city is home to several large farms, which produce a variety of crops, including cotton, corn, soybeans, and peanuts. The city is also home to several manufacturing plants, which produce a variety of products, including furniture, textiles, and automotive parts.
The city is also home to a number of small businesses, including restaurants, shops, and other services. The city is also home to a number of government offices, including the county courthouse and the local police department.
Demographics
As of the 2010 census, Palmetto had a population of 5,000 people. The racial makeup of the city was 79.3% White, 15.2% African American, 0.7% Native American, 0.7% Asian, and 4.1% from other races. The median household income was $37,000, and the median family income was $45,000.
Palmetto is a diverse city, with a variety of cultures and backgrounds represented. The city is home to a large Hispanic population, as well as a growing number of immigrants from other countries. The city is also home to a number of churches, including Baptist, Methodist, and Catholic.
Conclusion
Palmetto, Georgia is a small city located in the northwestern part of the state, about 30 miles south of Atlanta. It is part of the Atlanta metropolitan area and is the county seat of Fulton County. The city has a population of approximately 5,000 people and is known for its historic downtown area, which is home to a variety of shops, restaurants, and other businesses. The city’s economy is largely based on agriculture and manufacturing, and the city is home to a diverse population with a variety of cultures and backgrounds. Palmetto is a great place to live and work, and it is a great place to visit for its natural beauty and its many attractions.
Common Questions
What is Per Capita Income in Palmetto?
Per Capita income in Palmetto is $30,907.
What is the Median Family Income in Palmetto?
Median Family Income in Palmetto is $83,523.
What is the Median Household income in Palmetto?
Median Household Income in Palmetto is $52,444.
What is Income or Wage Gap in Palmetto?
Income or Wage Gap in Palmetto is 3.1%.
Women in Palmetto earn 96.9 cents for every dollar earned by a man.
What is Inequality or Gini Index in Palmetto?
Inequality or Gini Index in Palmetto is 0.37.
What is the Total Population of Palmetto?
Total Population of Palmetto is 4,650.
What is the Total Male Population of Palmetto?
Total Male Population of Palmetto is 2,119.
What is the Total Female Population of Palmetto?
Total Female Population of Palmetto is 2,531.
What is the Ratio of Males per 100 Females in Palmetto?
There are 83.72 Males per 100 Females in Palmetto.
What is the Ratio of Females per 100 Males in Palmetto?
There are 119.44 Females per 100 Males in Palmetto.
What is the Median Population Age in Palmetto?
Median Population Age in Palmetto is 38.2 Years.
What is the Average Family Size in Palmetto
Average Family Size in Palmetto is 3.2 People.
What is the Average Household Size in Palmetto
Average Household Size in Palmetto is 2.4 People.
How Large is the Labor Force in Palmetto?
There are 2,619 People in the Labor Forcein in Palmetto.
What is the Percentage of People in the Labor Force in Palmetto?
70.6% of People are in the Labor Force in Palmetto.
What is the Unemployment Rate in Palmetto?
Unemployment Rate in Palmetto is 6.9%.