Kempton, IN Map & Demographics
Kempton Map
Kempton Overview
$24,943
PER CAPITA INCOME
$44,609
AVG FAMILY INCOME
$44,323
AVG HOUSEHOLD INCOME
40.5%
WAGE / INCOME GAP [ % ]
59.5¢/ $1
WAGE / INCOME GAP [ $ ]
0.34
INEQUALITY / GINI INDEX
280
TOTAL POPULATION
140
MALE POPULATION
140
FEMALE POPULATION
100.00
MALES / 100 FEMALES
100.00
FEMALES / 100 MALES
50.3
MEDIAN AGE
2.6
AVG FAMILY SIZE
2.4
AVG HOUSEHOLD SIZE
107
LABOR FORCE [ PEOPLE ]
46.9%
PERCENT IN LABOR FORCE
1.9%
UNEMPLOYMENT RATE
Kempton Zip Codes
Kempton Area Codes
Income in Kempton
Income Overview in Kempton
Per Capita Income in Kempton is $24,943, while median incomes of families and households are $44,609 and $44,323 respectively.
| Characteristic | Number | Measure |
| Per Capita Income | 280 | $24,943 |
| Median Family Income | 93 | $44,609 |
| Mean Family Income | 93 | $54,890 |
| Median Household Income | 119 | $44,323 |
| Mean Household Income | 119 | $55,895 |
| Income Deficit | 93 | $0 |
| Wage / Income Gap (%) | 280 | 40.48% |
| Wage / Income Gap ($) | 280 | 59.52¢ per $1 |
| Gini / Inequality Index | 280 | 0.34 |
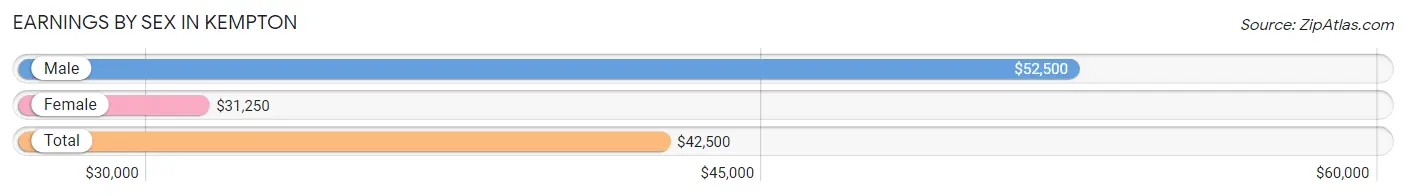
Earnings by Sex in Kempton
Average Earnings in Kempton are $42,500, $52,500 for men and $31,250 for women, a difference of 40.5%.
| Sex | Number | Average Earnings |
| Male | 68 (61.8%) | $52,500 |
| Female | 42 (38.2%) | $31,250 |
| Total | 110 (100.0%) | $42,500 |
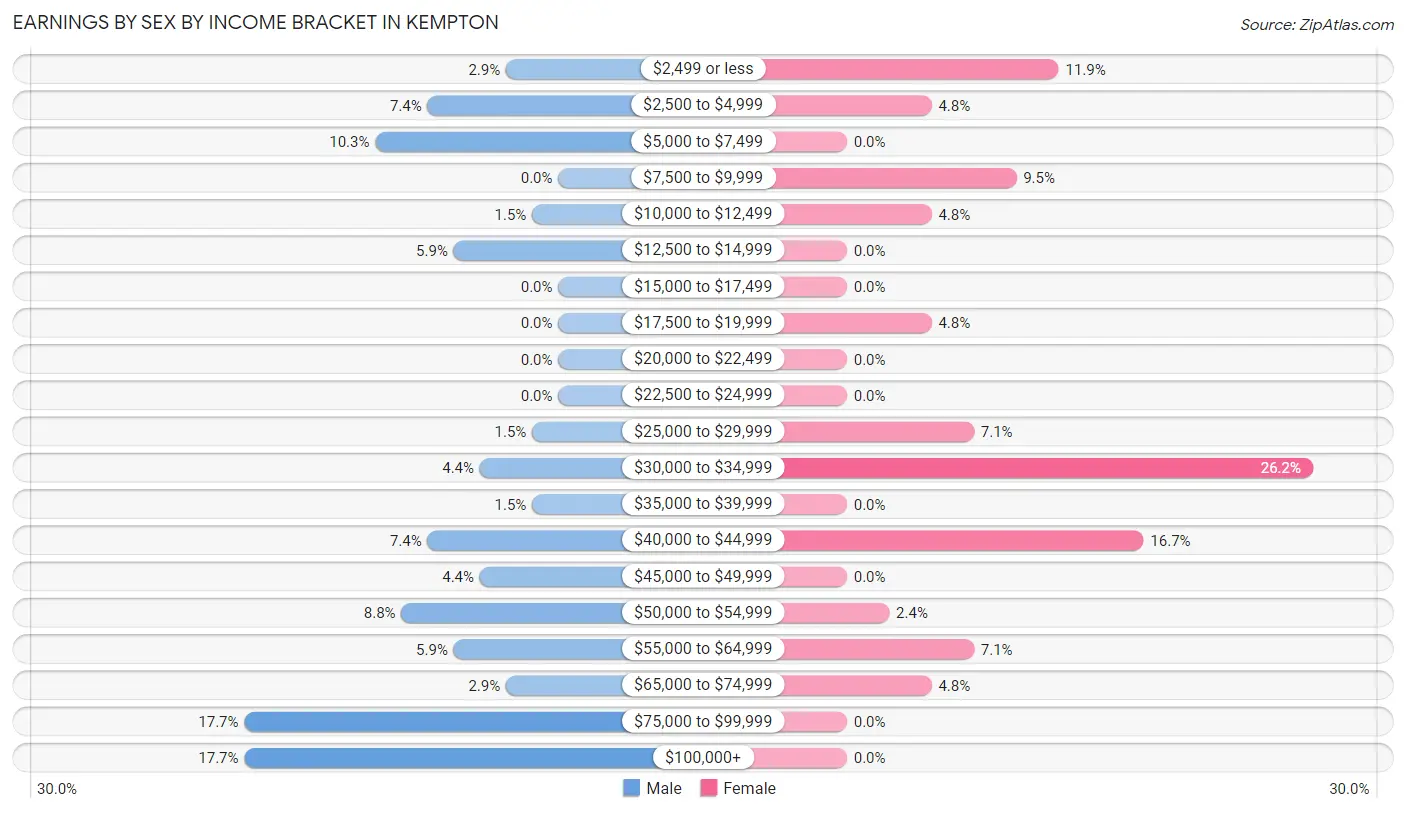
Earnings by Sex by Income Bracket in Kempton
The most common earnings brackets in Kempton are $75,000 to $99,999 for men (12 | 17.6%) and $30,000 to $34,999 for women (11 | 26.2%).
| Income | Male | Female |
| $2,499 or less | 2 (2.9%) | 5 (11.9%) |
| $2,500 to $4,999 | 5 (7.3%) | 2 (4.8%) |
| $5,000 to $7,499 | 7 (10.3%) | 0 (0.0%) |
| $7,500 to $9,999 | 0 (0.0%) | 4 (9.5%) |
| $10,000 to $12,499 | 1 (1.5%) | 2 (4.8%) |
| $12,500 to $14,999 | 4 (5.9%) | 0 (0.0%) |
| $15,000 to $17,499 | 0 (0.0%) | 0 (0.0%) |
| $17,500 to $19,999 | 0 (0.0%) | 2 (4.8%) |
| $20,000 to $22,499 | 0 (0.0%) | 0 (0.0%) |
| $22,500 to $24,999 | 0 (0.0%) | 0 (0.0%) |
| $25,000 to $29,999 | 1 (1.5%) | 3 (7.1%) |
| $30,000 to $34,999 | 3 (4.4%) | 11 (26.2%) |
| $35,000 to $39,999 | 1 (1.5%) | 0 (0.0%) |
| $40,000 to $44,999 | 5 (7.3%) | 7 (16.7%) |
| $45,000 to $49,999 | 3 (4.4%) | 0 (0.0%) |
| $50,000 to $54,999 | 6 (8.8%) | 1 (2.4%) |
| $55,000 to $64,999 | 4 (5.9%) | 3 (7.1%) |
| $65,000 to $74,999 | 2 (2.9%) | 2 (4.8%) |
| $75,000 to $99,999 | 12 (17.6%) | 0 (0.0%) |
| $100,000+ | 12 (17.6%) | 0 (0.0%) |
| Total | 68 (100.0%) | 42 (100.0%) |
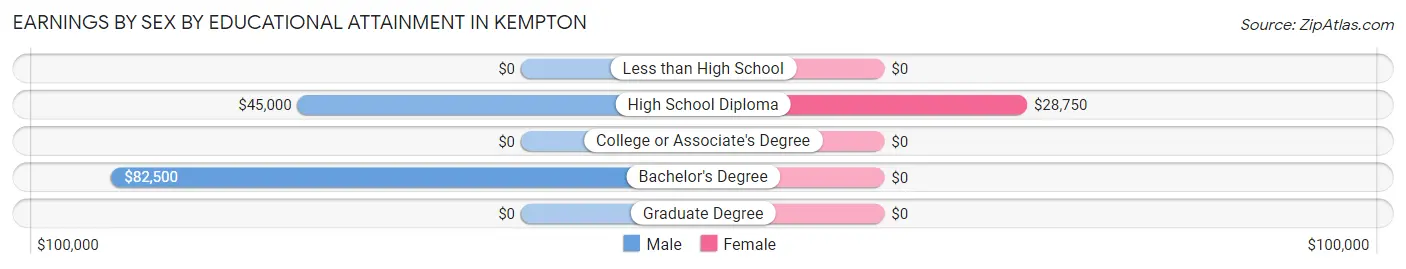
Earnings by Sex by Educational Attainment in Kempton
Average earnings in Kempton are $53,438 for men and $32,292 for women, a difference of 39.6%. Men with an educational attainment of bachelor's degree enjoy the highest average annual earnings of $82,500, while those with high school diploma education earn the least with $45,000. Women with an educational attainment of high school diploma earn the most with the average annual earnings of $28,750, while those with high school diploma education have the smallest earnings of $28,750.
| Educational Attainment | Male Income | Female Income |
| Less than High School | - | - |
| High School Diploma | $45,000 | $28,750 |
| College or Associate's Degree | - | - |
| Bachelor's Degree | $82,500 | $0 |
| Graduate Degree | - | - |
| Total | $53,438 | $32,292 |
Family Income in Kempton
Family Income Brackets in Kempton
According to the Kempton family income data, there are 20 families falling into the $50,000 to $74,999 income range, which is the most common income bracket and makes up 21.5% of all families.
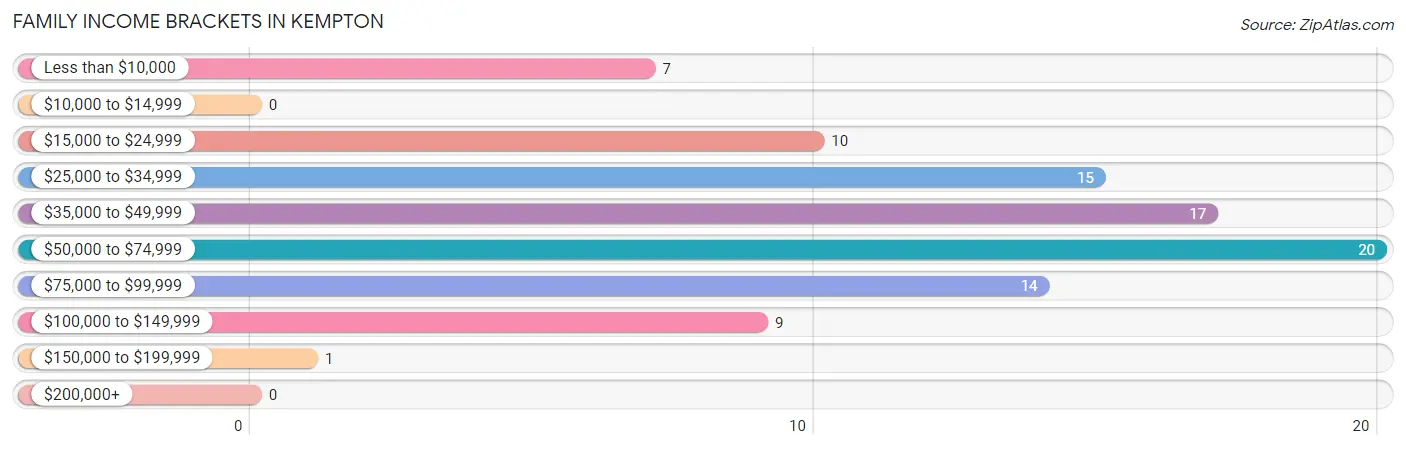
| Income Bracket | # Families | % Families |
| Less than $10,000 | 7 | 7.5% |
| $10,000 to $14,999 | 0 | 0.0% |
| $15,000 to $24,999 | 10 | 10.8% |
| $25,000 to $34,999 | 15 | 16.1% |
| $35,000 to $49,999 | 17 | 18.3% |
| $50,000 to $74,999 | 20 | 21.5% |
| $75,000 to $99,999 | 14 | 15.1% |
| $100,000 to $149,999 | 9 | 9.7% |
| $150,000 to $199,999 | 1 | 1.1% |
| $200,000+ | 0 | 0.0% |
Family Income by Famaliy Size in Kempton
2-person families (53 | 57.0%) account for the highest median family income in Kempton with $52,708 per family, while 2-person families (53 | 57.0%) have the highest median income of $26,354 per family member.
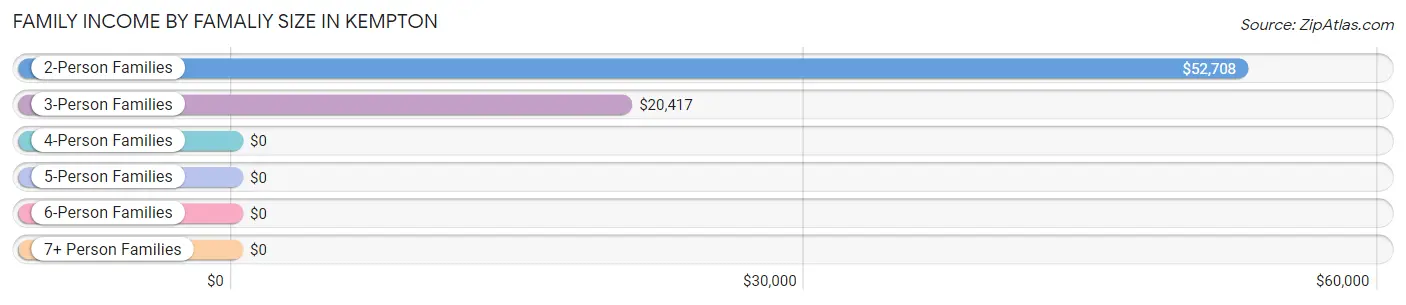
| Income Bracket | # Families | Median Income |
| 2-Person Families | 53 (57.0%) | $52,708 |
| 3-Person Families | 16 (17.2%) | $20,417 |
| 4-Person Families | 22 (23.7%) | $0 |
| 5-Person Families | 0 (0.0%) | $0 |
| 6-Person Families | 2 (2.1%) | $0 |
| 7+ Person Families | 0 (0.0%) | $0 |
| Total | 93 (100.0%) | $44,609 |
Family Income by Number of Earners in Kempton
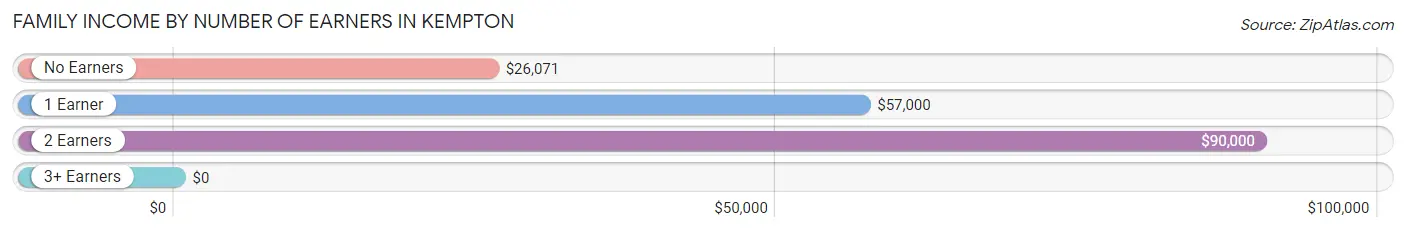
| Number of Earners | # Families | Median Income |
| No Earners | 36 (38.7%) | $26,071 |
| 1 Earner | 32 (34.4%) | $57,000 |
| 2 Earners | 22 (23.7%) | $90,000 |
| 3+ Earners | 3 (3.2%) | $0 |
| Total | 93 (100.0%) | $44,609 |
Household Income in Kempton
Household Income Brackets in Kempton
With 26 households falling in the category, the $25,000 to $34,999 income range is the most frequent in Kempton, accounting for 21.8% of all households.
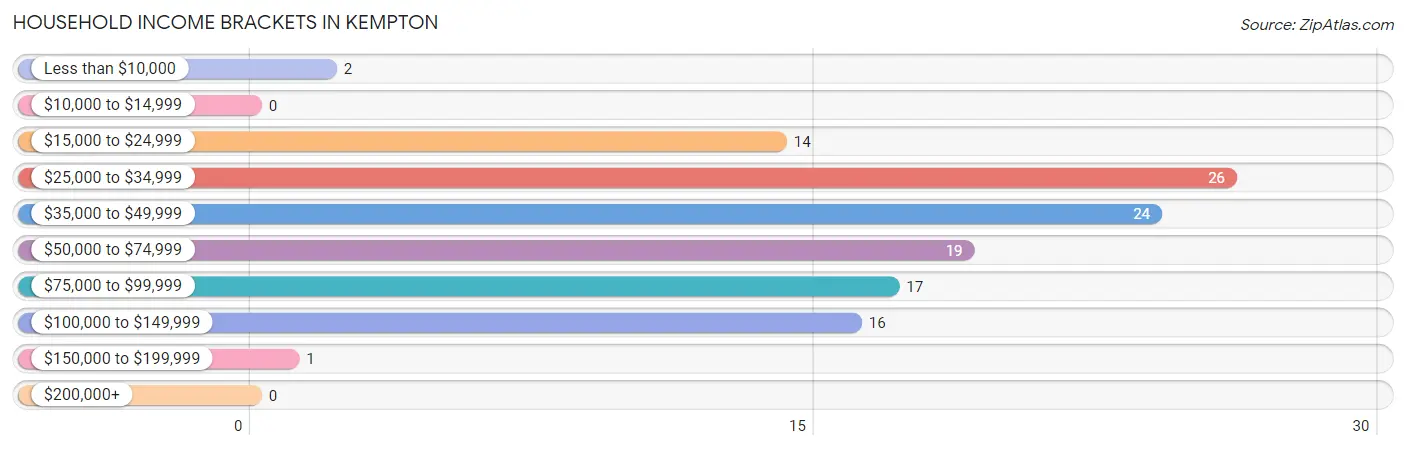
| Income Bracket | # Households | % Households |
| Less than $10,000 | 2 | 1.7% |
| $10,000 to $14,999 | 0 | 0.0% |
| $15,000 to $24,999 | 14 | 11.8% |
| $25,000 to $34,999 | 26 | 21.8% |
| $35,000 to $49,999 | 24 | 20.2% |
| $50,000 to $74,999 | 19 | 16.0% |
| $75,000 to $99,999 | 17 | 14.3% |
| $100,000 to $149,999 | 16 | 13.4% |
| $150,000 to $199,999 | 1 | 0.8% |
| $200,000+ | 0 | 0.0% |
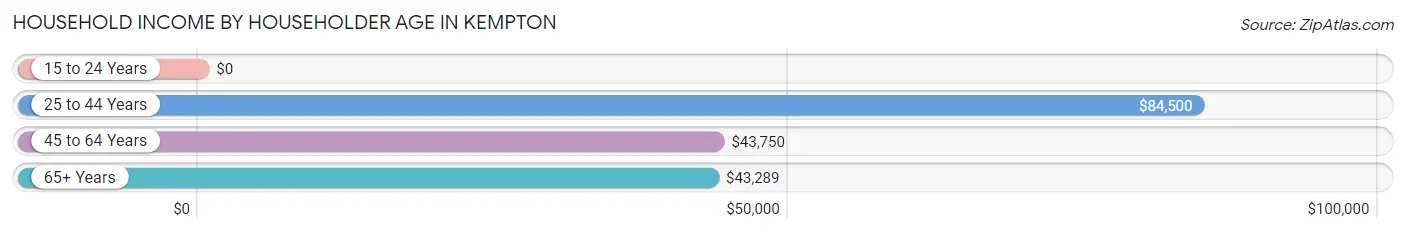
Household Income by Householder Age in Kempton
The median household income in Kempton is $44,323, with the highest median household income of $84,500 found in the 25 to 44 years age bracket for the primary householder. A total of 22 households (18.5%) fall into this category. Meanwhile, the 15 to 24 years age bracket for the primary householder has the lowest median household income of $0, with 4 households (3.4%) in this group.
| Income Bracket | # Households | Median Income |
| 15 to 24 Years | 4 (3.4%) | $0 |
| 25 to 44 Years | 22 (18.5%) | $84,500 |
| 45 to 64 Years | 53 (44.5%) | $43,750 |
| 65+ Years | 40 (33.6%) | $43,289 |
| Total | 119 (100.0%) | $44,323 |
Poverty in Kempton
Income Below Poverty by Sex and Age in Kempton
With 25.0% poverty level for males and 32.1% for females among the residents of Kempton, under 5 year old males and 15 year old females are the most vulnerable to poverty, with 5 males (83.3%) and 5 females (100.0%) in their respective age groups living below the poverty level.
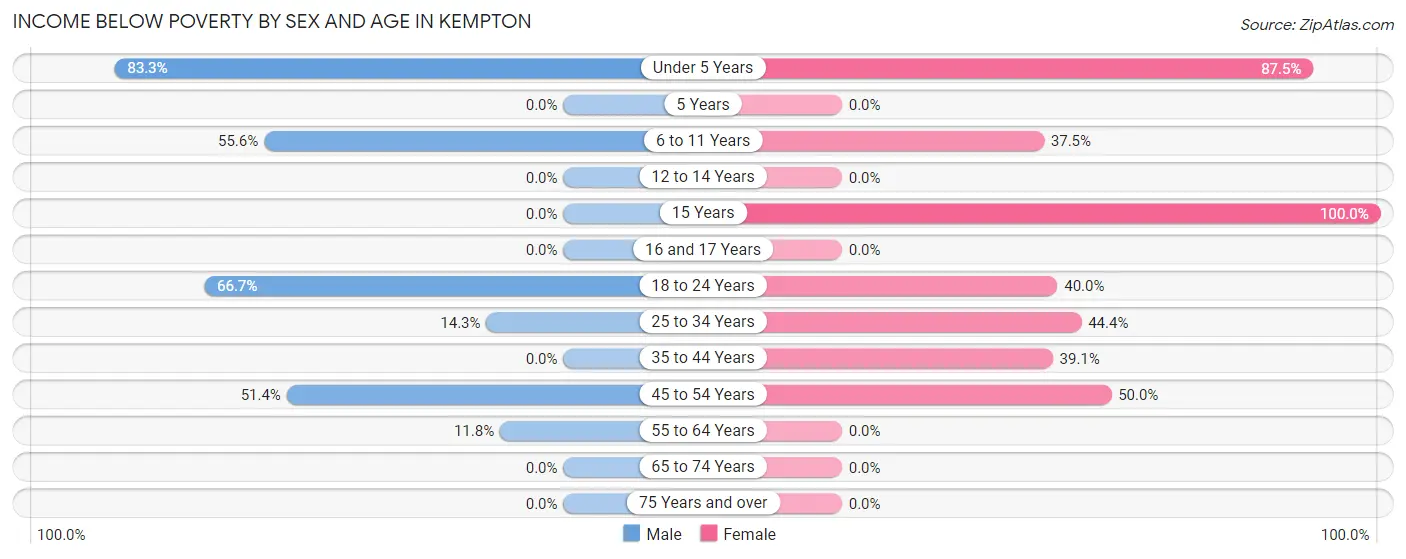
| Age Bracket | Male | Female |
| Under 5 Years | 5 (83.3%) | 7 (87.5%) |
| 5 Years | 0 (0.0%) | 0 (0.0%) |
| 6 to 11 Years | 5 (55.6%) | 6 (37.5%) |
| 12 to 14 Years | 0 (0.0%) | 0 (0.0%) |
| 15 Years | 0 (0.0%) | 5 (100.0%) |
| 16 and 17 Years | 0 (0.0%) | 0 (0.0%) |
| 18 to 24 Years | 2 (66.7%) | 2 (40.0%) |
| 25 to 34 Years | 2 (14.3%) | 4 (44.4%) |
| 35 to 44 Years | 0 (0.0%) | 9 (39.1%) |
| 45 to 54 Years | 19 (51.3%) | 12 (50.0%) |
| 55 to 64 Years | 2 (11.8%) | 0 (0.0%) |
| 65 to 74 Years | 0 (0.0%) | 0 (0.0%) |
| 75 Years and over | 0 (0.0%) | 0 (0.0%) |
| Total | 35 (25.0%) | 45 (32.1%) |
Income Above Poverty by Sex and Age in Kempton
According to the poverty statistics in Kempton, males aged 5 years and females aged 12 to 14 years are the age groups that are most secure financially, with 100.0% of males and 100.0% of females in these age groups living above the poverty line.
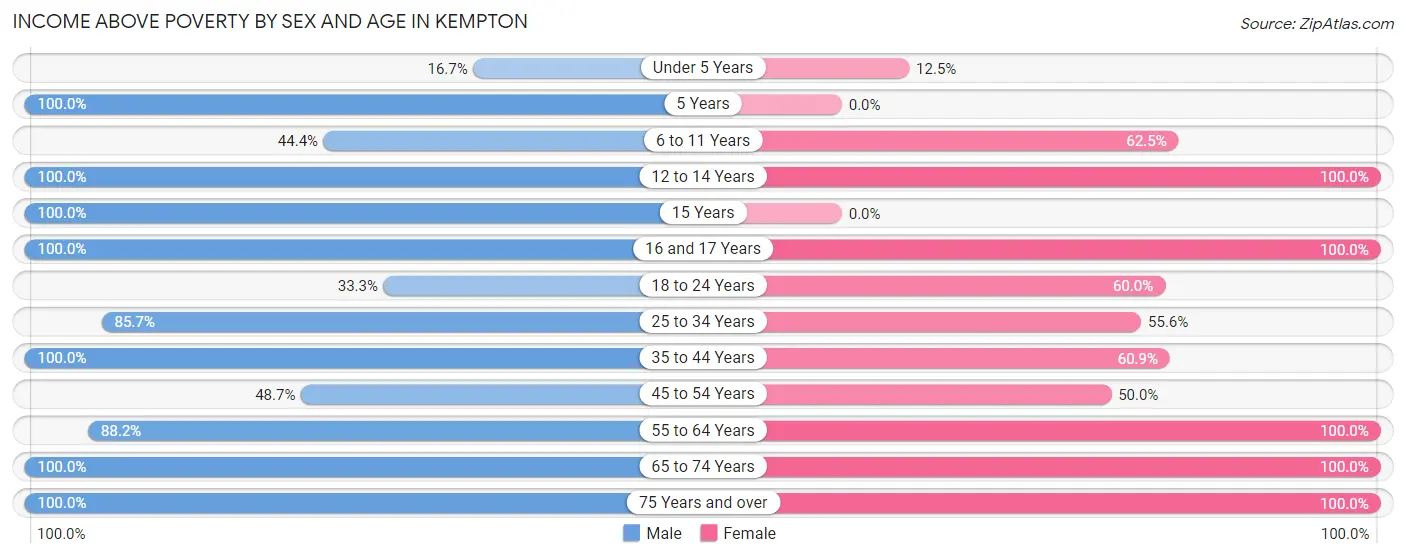
| Age Bracket | Male | Female |
| Under 5 Years | 1 (16.7%) | 1 (12.5%) |
| 5 Years | 1 (100.0%) | 0 (0.0%) |
| 6 to 11 Years | 4 (44.4%) | 10 (62.5%) |
| 12 to 14 Years | 3 (100.0%) | 2 (100.0%) |
| 15 Years | 2 (100.0%) | 0 (0.0%) |
| 16 and 17 Years | 2 (100.0%) | 4 (100.0%) |
| 18 to 24 Years | 1 (33.3%) | 3 (60.0%) |
| 25 to 34 Years | 12 (85.7%) | 5 (55.6%) |
| 35 to 44 Years | 7 (100.0%) | 14 (60.9%) |
| 45 to 54 Years | 18 (48.6%) | 12 (50.0%) |
| 55 to 64 Years | 15 (88.2%) | 18 (100.0%) |
| 65 to 74 Years | 27 (100.0%) | 22 (100.0%) |
| 75 Years and over | 12 (100.0%) | 4 (100.0%) |
| Total | 105 (75.0%) | 95 (67.9%) |
Income Below Poverty Among Married-Couple Families in Kempton
The poverty statistics for married-couple families in Kempton show that 13.6% or 9 of the total 66 families live below the poverty line. Families with 1 or 2 children have the highest poverty rate of 50.0%, comprising of 9 families. On the other hand, families with no children have the lowest poverty rate of 0.0%, which includes 0 families.
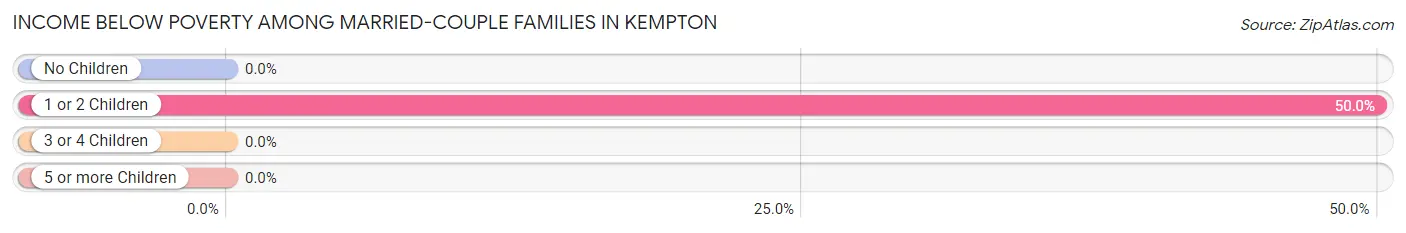
| Children | Above Poverty | Below Poverty |
| No Children | 47 (100.0%) | 0 (0.0%) |
| 1 or 2 Children | 9 (50.0%) | 9 (50.0%) |
| 3 or 4 Children | 1 (100.0%) | 0 (0.0%) |
| 5 or more Children | 0 (0.0%) | 0 (0.0%) |
| Total | 57 (86.4%) | 9 (13.6%) |
Income Below Poverty Among Single-Parent Households in Kempton
According to the poverty data in Kempton, 77.8% or 7 single-father households and 33.3% or 6 single-mother households are living below the poverty line. Among single-father households, those with 1 or 2 children have the highest poverty rate, with 7 households (77.8%) experiencing poverty. Likewise, among single-mother households, those with 1 or 2 children have the highest poverty rate, with 6 households (37.5%) falling below the poverty line.
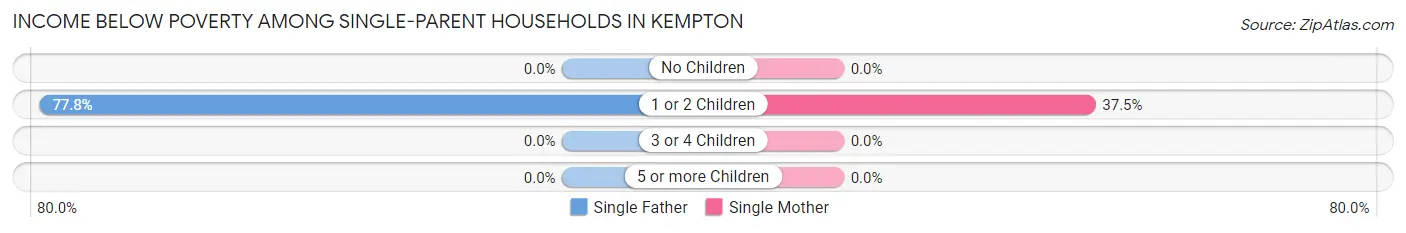
| Children | Single Father | Single Mother |
| No Children | 0 (0.0%) | 0 (0.0%) |
| 1 or 2 Children | 7 (77.8%) | 6 (37.5%) |
| 3 or 4 Children | 0 (0.0%) | 0 (0.0%) |
| 5 or more Children | 0 (0.0%) | 0 (0.0%) |
| Total | 7 (77.8%) | 6 (33.3%) |
Income Below Poverty Among Married-Couple vs Single-Parent Households in Kempton
The poverty data for Kempton shows that 9 of the married-couple family households (13.6%) and 13 of the single-parent households (48.1%) are living below the poverty level. Within the married-couple family households, those with 1 or 2 children have the highest poverty rate, with 9 households (50.0%) falling below the poverty line. Among the single-parent households, those with 1 or 2 children have the highest poverty rate, with 13 household (52.0%) living below poverty.
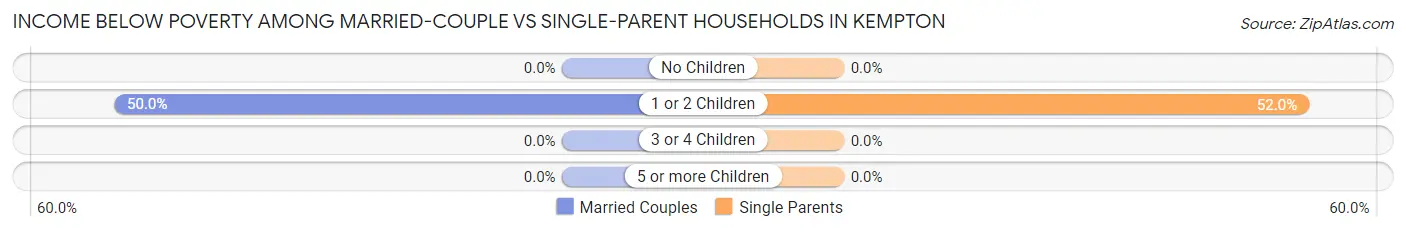
| Children | Married-Couple Families | Single-Parent Households |
| No Children | 0 (0.0%) | 0 (0.0%) |
| 1 or 2 Children | 9 (50.0%) | 13 (52.0%) |
| 3 or 4 Children | 0 (0.0%) | 0 (0.0%) |
| 5 or more Children | 0 (0.0%) | 0 (0.0%) |
| Total | 9 (13.6%) | 13 (48.1%) |
Race in Kempton
The most populous races in Kempton are White / Caucasian (251 | 89.6%), and Two or more Races (29 | 10.4%).
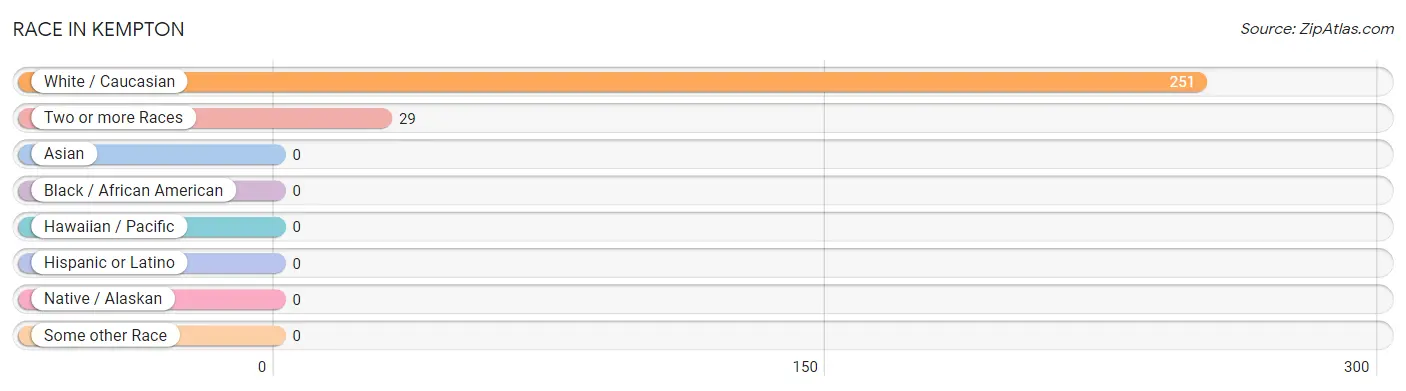
| Race | # Population | % Population |
| Asian | 0 | 0.0% |
| Black / African American | 0 | 0.0% |
| Hawaiian / Pacific | 0 | 0.0% |
| Hispanic or Latino | 0 | 0.0% |
| Native / Alaskan | 0 | 0.0% |
| White / Caucasian | 251 | 89.6% |
| Two or more Races | 29 | 10.4% |
| Some other Race | 0 | 0.0% |
| Total | 280 | 100.0% |
Ancestry in Kempton
The most populous ancestries reported in Kempton are German (66 | 23.6%), American (55 | 19.6%), English (37 | 13.2%), Italian (22 | 7.9%), and Iranian (16 | 5.7%), together accounting for 70.0% of all Kempton residents.

| Ancestry | # Population | % Population |
| American | 55 | 19.6% |
| Cherokee | 3 | 1.1% |
| Dutch | 3 | 1.1% |
| English | 37 | 13.2% |
| European | 2 | 0.7% |
| French | 1 | 0.4% |
| German | 66 | 23.6% |
| Ghanaian | 5 | 1.8% |
| Iranian | 16 | 5.7% |
| Irish | 16 | 5.7% |
| Italian | 22 | 7.9% |
| Scandinavian | 2 | 0.7% |
| Seminole | 11 | 3.9% |
| Subsaharan African | 5 | 1.8% |
| Swiss | 1 | 0.4% |
| Welsh | 1 | 0.4% | View All 16 Rows |
Immigrants in Kempton

| Immigration Origin | # Population | % Population | View All 0 Rows |
Sex and Age in Kempton
Sex and Age in Kempton
The most populous age groups in Kempton are 50 to 54 Years (26 | 18.6%) for men and 70 to 74 Years (19 | 13.6%) for women.
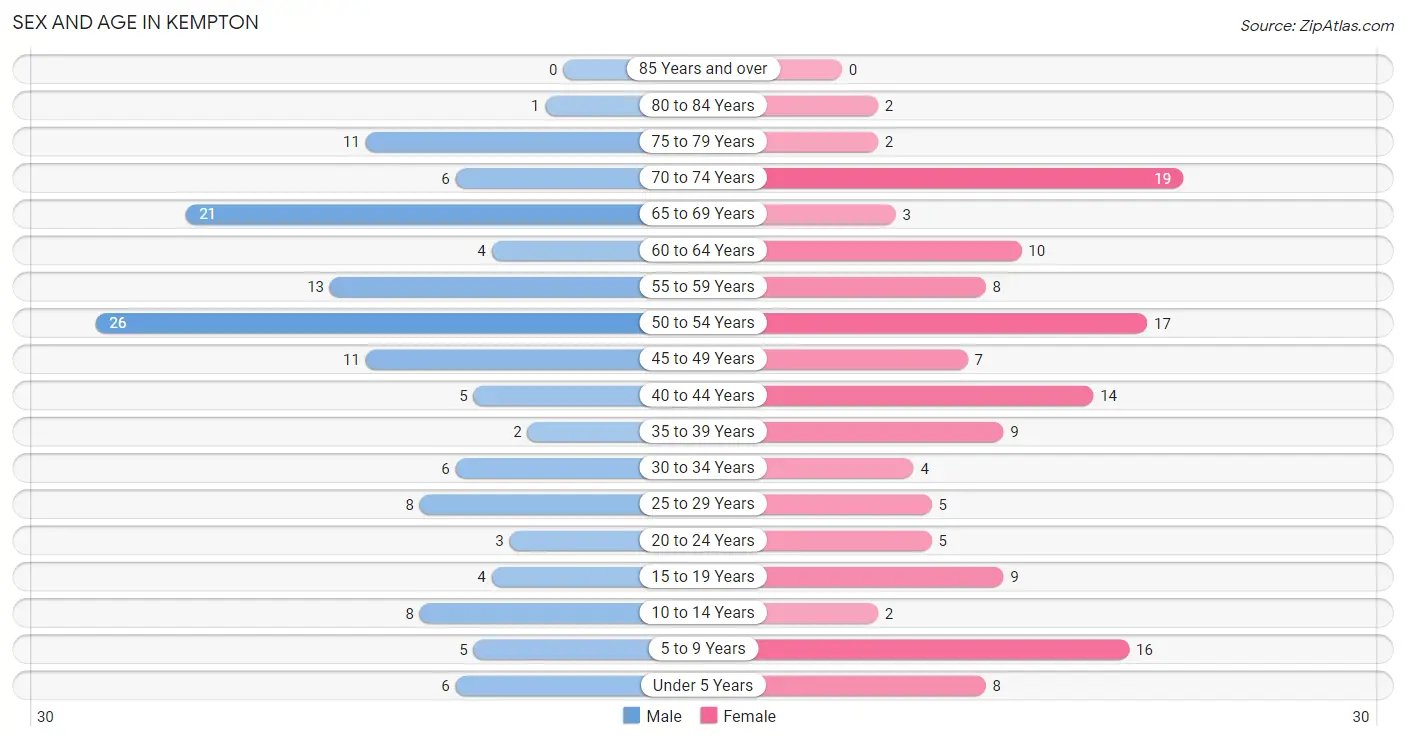
| Age Bracket | Male | Female |
| Under 5 Years | 6 (4.3%) | 8 (5.7%) |
| 5 to 9 Years | 5 (3.6%) | 16 (11.4%) |
| 10 to 14 Years | 8 (5.7%) | 2 (1.4%) |
| 15 to 19 Years | 4 (2.9%) | 9 (6.4%) |
| 20 to 24 Years | 3 (2.1%) | 5 (3.6%) |
| 25 to 29 Years | 8 (5.7%) | 5 (3.6%) |
| 30 to 34 Years | 6 (4.3%) | 4 (2.9%) |
| 35 to 39 Years | 2 (1.4%) | 9 (6.4%) |
| 40 to 44 Years | 5 (3.6%) | 14 (10.0%) |
| 45 to 49 Years | 11 (7.9%) | 7 (5.0%) |
| 50 to 54 Years | 26 (18.6%) | 17 (12.1%) |
| 55 to 59 Years | 13 (9.3%) | 8 (5.7%) |
| 60 to 64 Years | 4 (2.9%) | 10 (7.1%) |
| 65 to 69 Years | 21 (15.0%) | 3 (2.1%) |
| 70 to 74 Years | 6 (4.3%) | 19 (13.6%) |
| 75 to 79 Years | 11 (7.9%) | 2 (1.4%) |
| 80 to 84 Years | 1 (0.7%) | 2 (1.4%) |
| 85 Years and over | 0 (0.0%) | 0 (0.0%) |
| Total | 140 (100.0%) | 140 (100.0%) |
Families and Households in Kempton
Median Family Size in Kempton
The median family size in Kempton is 2.56 persons per family, with single female/mother families (18 | 19.4%) accounting for the largest median family size of 2.61 persons per family. On the other hand, single male/father families (9 | 9.7%) represent the smallest median family size with 2.22 persons per family.
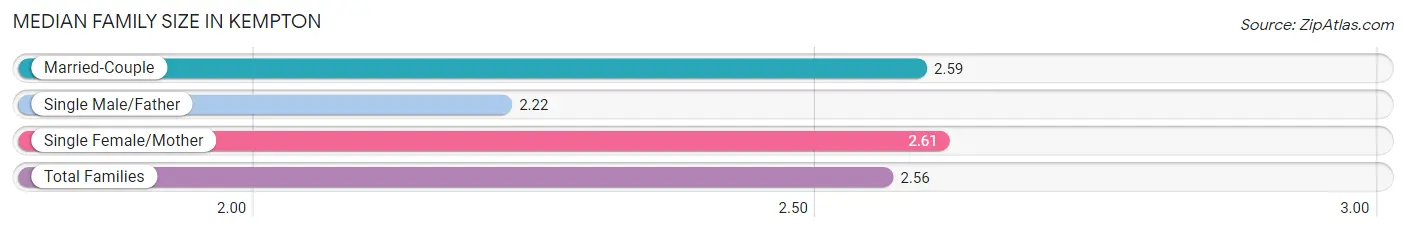
| Family Type | # Families | Family Size |
| Married-Couple | 66 (71.0%) | 2.59 |
| Single Male/Father | 9 (9.7%) | 2.22 |
| Single Female/Mother | 18 (19.4%) | 2.61 |
| Total Families | 93 (100.0%) | 2.56 |
Median Household Size in Kempton
The median household size in Kempton is 2.35 persons per household, with single male/father households (9 | 7.6%) accounting for the largest median household size of 3.11 persons per household. non-family households (26 | 21.8%) represent the smallest median household size with 1.08 persons per household.
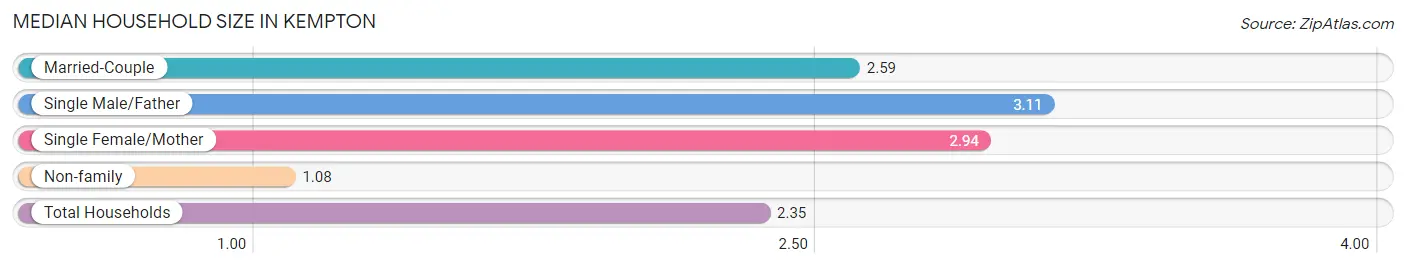
| Household Type | # Households | Household Size |
| Married-Couple | 66 (55.5%) | 2.59 |
| Single Male/Father | 9 (7.6%) | 3.11 |
| Single Female/Mother | 18 (15.1%) | 2.94 |
| Non-family | 26 (21.8%) | 1.08 |
| Total Households | 119 (100.0%) | 2.35 |
Household Size by Marriage Status in Kempton
Out of a total of 119 households in Kempton, 93 (78.1%) are family households, while 26 (21.8%) are nonfamily households. The most numerous type of family households are 2-person households, comprising 51, and the most common type of nonfamily households are 1-person households, comprising 24.
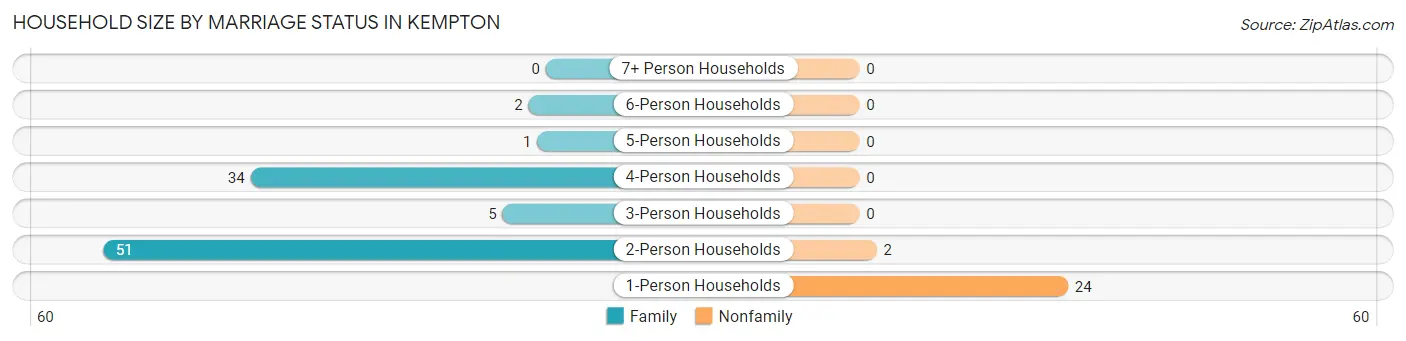
| Household Size | Family Households | Nonfamily Households |
| 1-Person Households | - | 24 (20.2%) |
| 2-Person Households | 51 (42.9%) | 2 (1.7%) |
| 3-Person Households | 5 (4.2%) | 0 (0.0%) |
| 4-Person Households | 34 (28.6%) | 0 (0.0%) |
| 5-Person Households | 1 (0.8%) | 0 (0.0%) |
| 6-Person Households | 2 (1.7%) | 0 (0.0%) |
| 7+ Person Households | 0 (0.0%) | 0 (0.0%) |
| Total | 93 (78.1%) | 26 (21.8%) |
Female Fertility in Kempton
Fertility by Age in Kempton
Average fertility rate in Kempton is 130.0 births per 1,000 women. Women in the age bracket of 35 to 50 years have the highest fertility rate with 161.0 births per 1,000 women. Women in the age bracket of 35 to 50 years acount for 71.4% of all women with births.
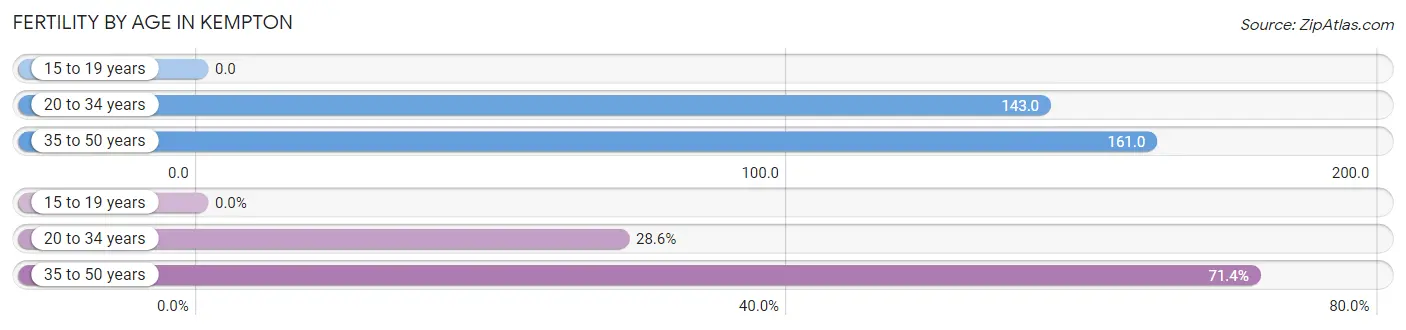
| Age Bracket | Women with Births | Births / 1,000 Women |
| 15 to 19 years | 0 (0.0%) | 0.0 |
| 20 to 34 years | 2 (28.6%) | 143.0 |
| 35 to 50 years | 5 (71.4%) | 161.0 |
| Total | 7 (100.0%) | 130.0 |
Fertility by Age by Marriage Status in Kempton
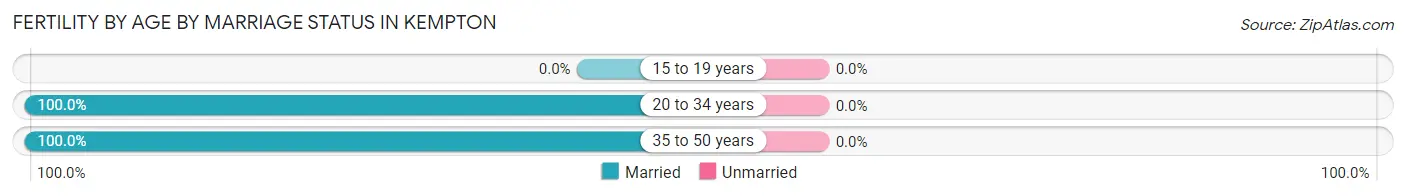
| Age Bracket | Married | Unmarried |
| 15 to 19 years | 0 (0.0%) | 0 (0.0%) |
| 20 to 34 years | 2 (100.0%) | 0 (0.0%) |
| 35 to 50 years | 5 (100.0%) | 0 (0.0%) |
| Total | 7 (100.0%) | 0 (0.0%) |
Fertility by Education in Kempton
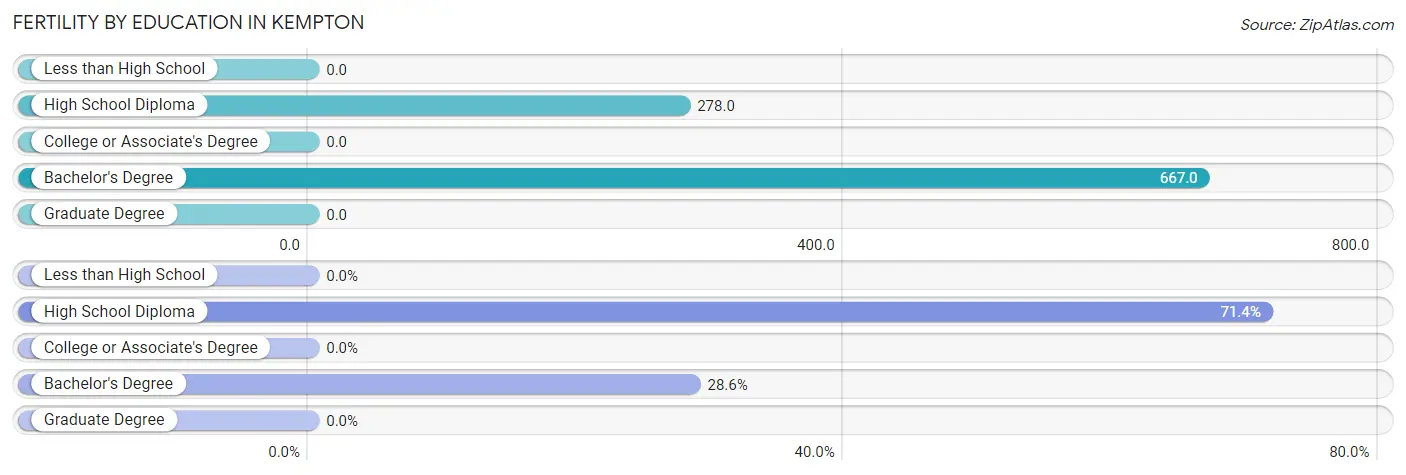
| Educational Attainment | Women with Births | Births / 1,000 Women |
| Less than High School | 0 (0.0%) | 0.0 |
| High School Diploma | 5 (71.4%) | 278.0 |
| College or Associate's Degree | 0 (0.0%) | 0.0 |
| Bachelor's Degree | 2 (28.6%) | 667.0 |
| Graduate Degree | 0 (0.0%) | 0.0 |
| Total | 7 (100.0%) | 130.0 |
Fertility by Education by Marriage Status in Kempton
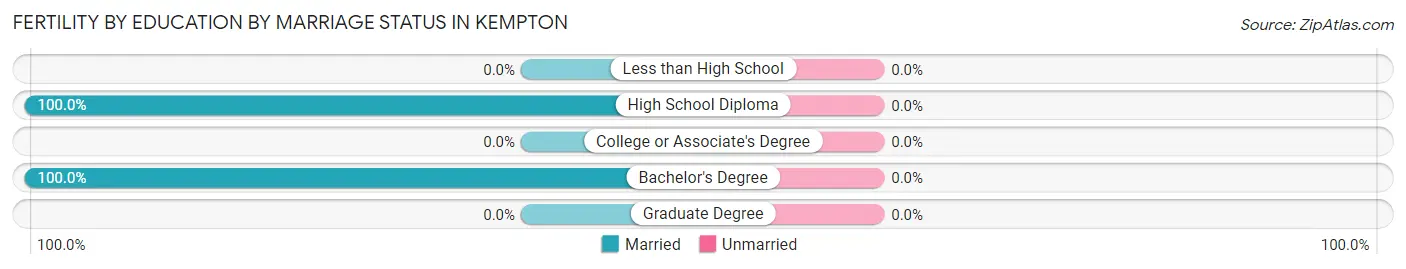
| Educational Attainment | Married | Unmarried |
| Less than High School | 0 (0.0%) | 0 (0.0%) |
| High School Diploma | 5 (100.0%) | 0 (0.0%) |
| College or Associate's Degree | 0 (0.0%) | 0 (0.0%) |
| Bachelor's Degree | 2 (100.0%) | 0 (0.0%) |
| Graduate Degree | 0 (0.0%) | 0 (0.0%) |
| Total | 7 (100.0%) | 0 (0.0%) |
Employment Characteristics in Kempton
Employment by Class of Employer in Kempton
Among the 97 employed individuals in Kempton, private company employees (76 | 78.3%), self-employed (not incorporated) (9 | 9.3%), and local government employees (5 | 5.1%) make up the most common classes of employment.
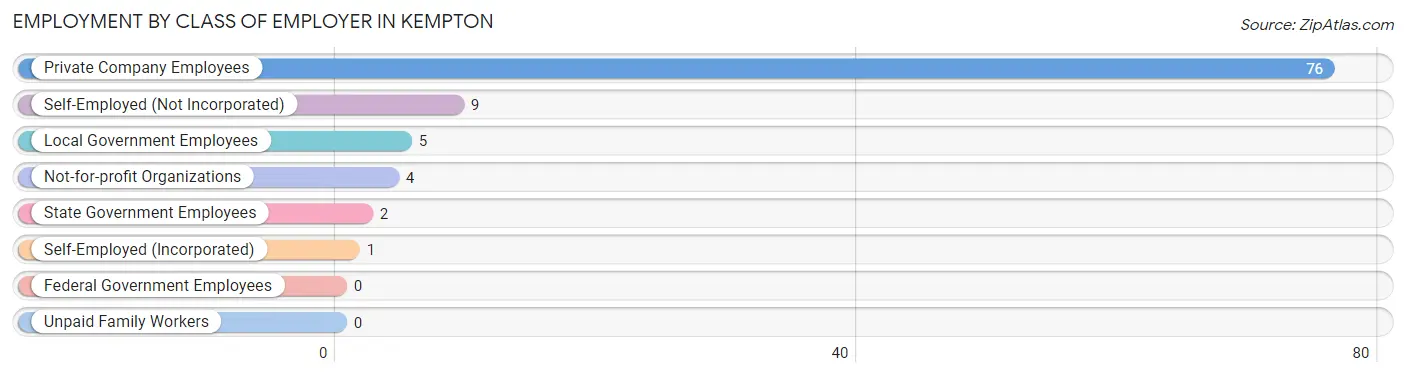
| Employer Class | # Employees | % Employees |
| Private Company Employees | 76 | 78.3% |
| Self-Employed (Incorporated) | 1 | 1.0% |
| Self-Employed (Not Incorporated) | 9 | 9.3% |
| Not-for-profit Organizations | 4 | 4.1% |
| Local Government Employees | 5 | 5.1% |
| State Government Employees | 2 | 2.1% |
| Federal Government Employees | 0 | 0.0% |
| Unpaid Family Workers | 0 | 0.0% |
| Total | 97 | 100.0% |
Employment Status by Age in Kempton
According to the labor force statistics for Kempton, out of the total population over 16 years of age (228), 46.9% or 107 individuals are in the labor force, with 1.9% or 2 of them unemployed. The age group with the highest labor force participation rate is 55 to 59 years, with 100.0% or 21 individuals in the labor force. Within the labor force, the 45 to 54 years age range has the highest percentage of unemployed individuals, with 6.5% or 2 of them being unemployed.
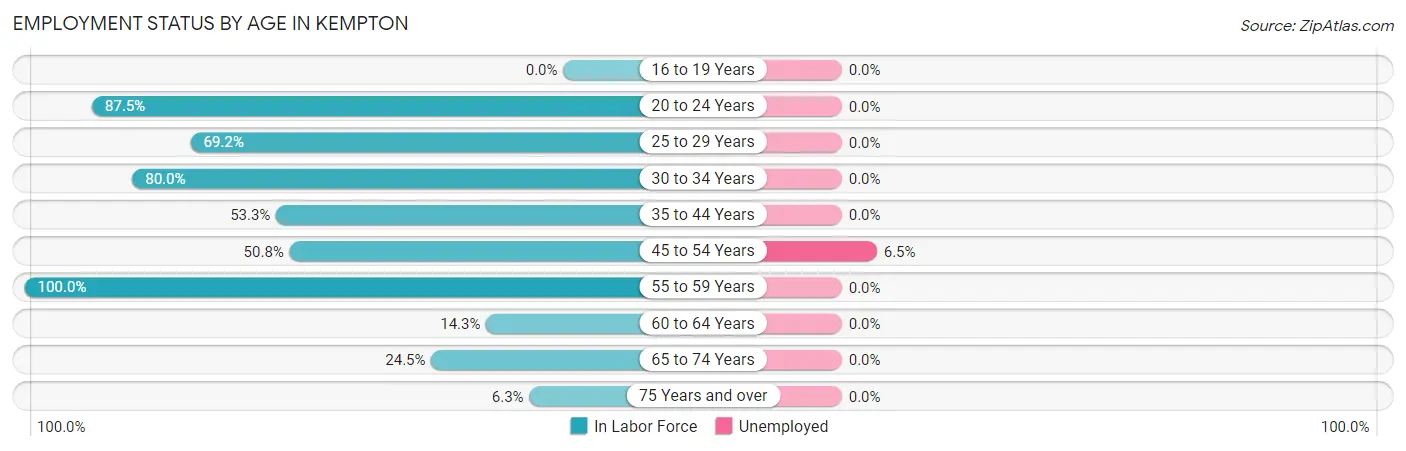
| Age Bracket | In Labor Force | Unemployed |
| 16 to 19 Years | 0 (0.0%) | 0 (0.0%) |
| 20 to 24 Years | 7 (87.5%) | 0 (0.0%) |
| 25 to 29 Years | 9 (69.2%) | 0 (0.0%) |
| 30 to 34 Years | 8 (80.0%) | 0 (0.0%) |
| 35 to 44 Years | 16 (53.3%) | 0 (0.0%) |
| 45 to 54 Years | 31 (50.8%) | 2 (6.5%) |
| 55 to 59 Years | 21 (100.0%) | 0 (0.0%) |
| 60 to 64 Years | 2 (14.3%) | 0 (0.0%) |
| 65 to 74 Years | 12 (24.5%) | 0 (0.0%) |
| 75 Years and over | 1 (6.3%) | 0 (0.0%) |
| Total | 107 (46.9%) | 2 (1.9%) |
Employment Status by Educational Attainment in Kempton
According to labor force statistics for Kempton, 58.4% of individuals (87) out of the total population between 25 and 64 years of age (149) are in the labor force, with 2.3% or 2 of them being unemployed. The group with the highest labor force participation rate are those with the educational attainment of bachelor's degree or higher, with 100.0% or 18 individuals in the labor force. Within the labor force, individuals with less than high school education have the highest percentage of unemployment, with 25.0% or 2 of them being unemployed.
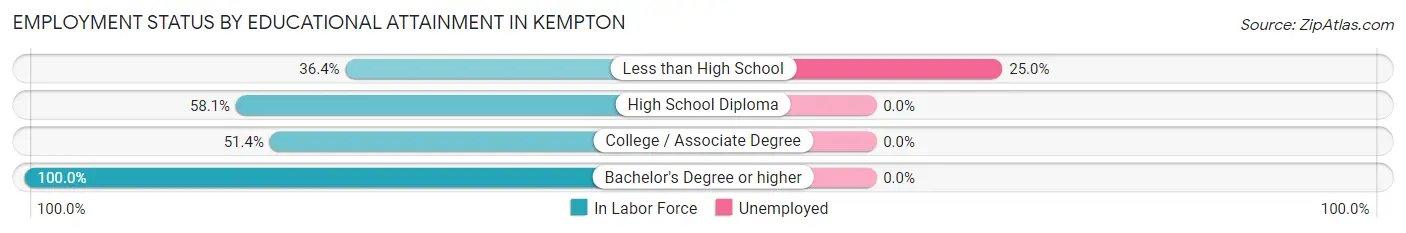
| Educational Attainment | In Labor Force | Unemployed |
| Less than High School | 8 (36.4%) | 6 (25.0%) |
| High School Diploma | 43 (58.1%) | 0 (0.0%) |
| College / Associate Degree | 18 (51.4%) | 0 (0.0%) |
| Bachelor's Degree or higher | 18 (100.0%) | 0 (0.0%) |
| Total | 87 (58.4%) | 3 (2.3%) |
Employment Occupations by Sex in Kempton
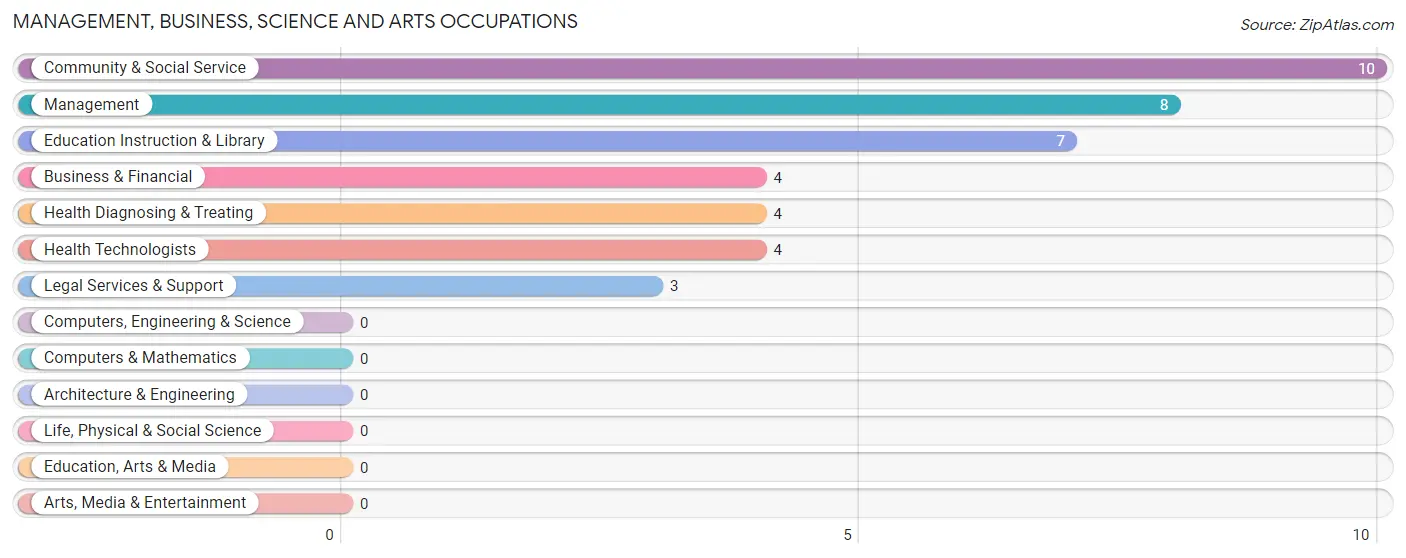
Management, Business, Science and Arts Occupations
The most common Management, Business, Science and Arts occupations in Kempton are Community & Social Service (10 | 9.5%), Management (8 | 7.6%), Education Instruction & Library (7 | 6.7%), Business & Financial (4 | 3.8%), and Health Diagnosing & Treating (4 | 3.8%).
Management, Business, Science and Arts Occupations by Sex
Within the Management, Business, Science and Arts occupations in Kempton, the most male-oriented occupations are Management (87.5%), Education Instruction & Library (57.1%), and Community & Social Service (50.0%), while the most female-oriented occupations are Business & Financial (100.0%), Health Diagnosing & Treating (100.0%), and Health Technologists (100.0%).
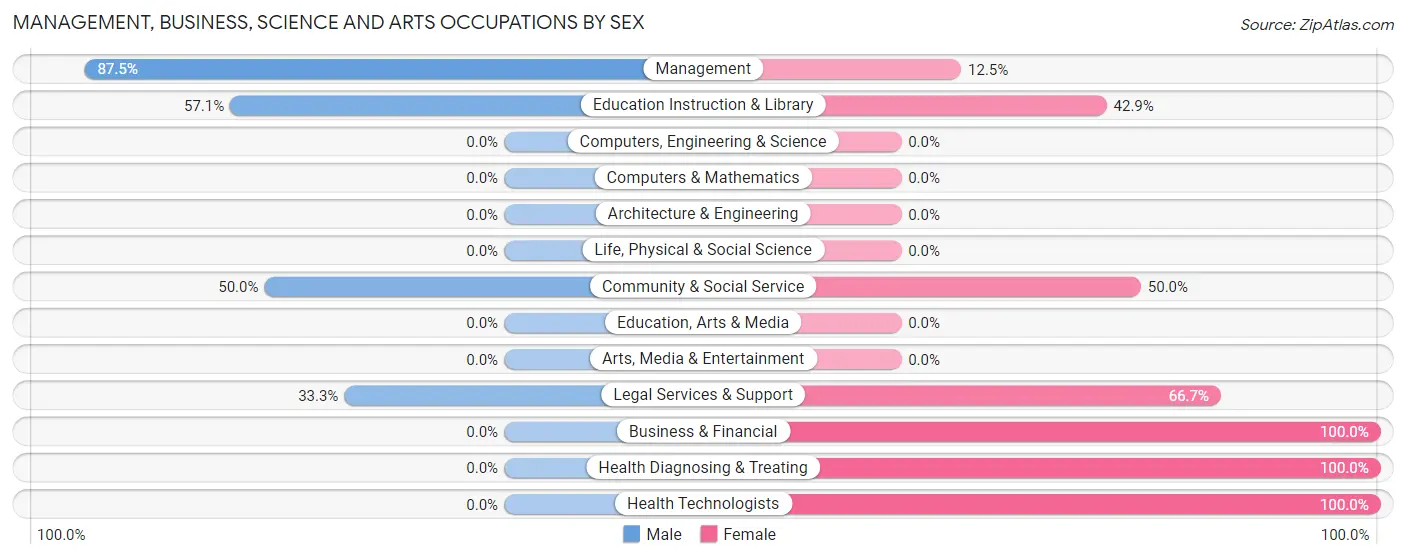
| Occupation | Male | Female |
| Management | 7 (87.5%) | 1 (12.5%) |
| Business & Financial | 0 (0.0%) | 4 (100.0%) |
| Computers, Engineering & Science | 0 (0.0%) | 0 (0.0%) |
| Computers & Mathematics | 0 (0.0%) | 0 (0.0%) |
| Architecture & Engineering | 0 (0.0%) | 0 (0.0%) |
| Life, Physical & Social Science | 0 (0.0%) | 0 (0.0%) |
| Community & Social Service | 5 (50.0%) | 5 (50.0%) |
| Education, Arts & Media | 0 (0.0%) | 0 (0.0%) |
| Legal Services & Support | 1 (33.3%) | 2 (66.7%) |
| Education Instruction & Library | 4 (57.1%) | 3 (42.9%) |
| Arts, Media & Entertainment | 0 (0.0%) | 0 (0.0%) |
| Health Diagnosing & Treating | 0 (0.0%) | 4 (100.0%) |
| Health Technologists | 0 (0.0%) | 4 (100.0%) |
| Total (Category) | 12 (46.2%) | 14 (53.8%) |
| Total (Overall) | 66 (62.9%) | 39 (37.1%) |
Services Occupations
The most common Services occupations in Kempton are Cleaning & Maintenance (5 | 4.8%), Healthcare Support (3 | 2.9%), Food Preparation & Serving (2 | 1.9%), Security & Protection (1 | 0.9%), and Law Enforcement (1 | 0.9%).
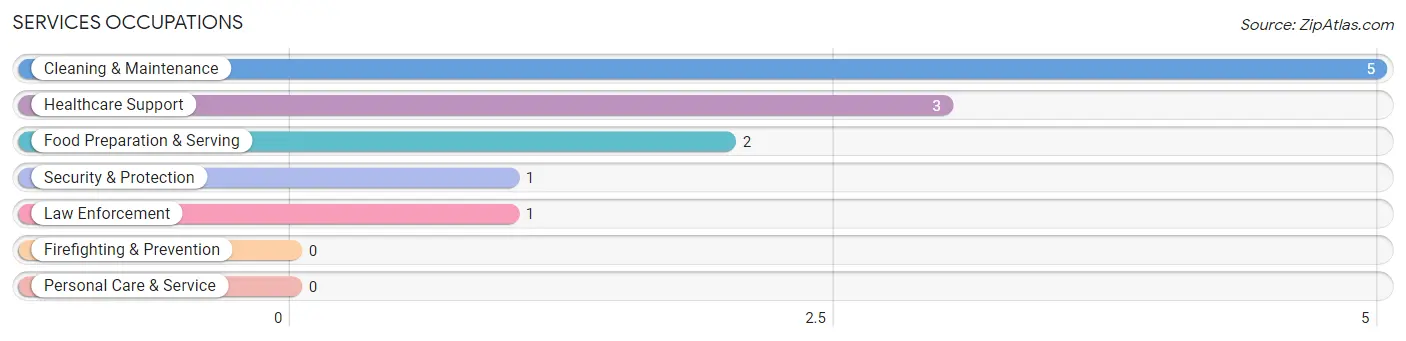
Services Occupations by Sex
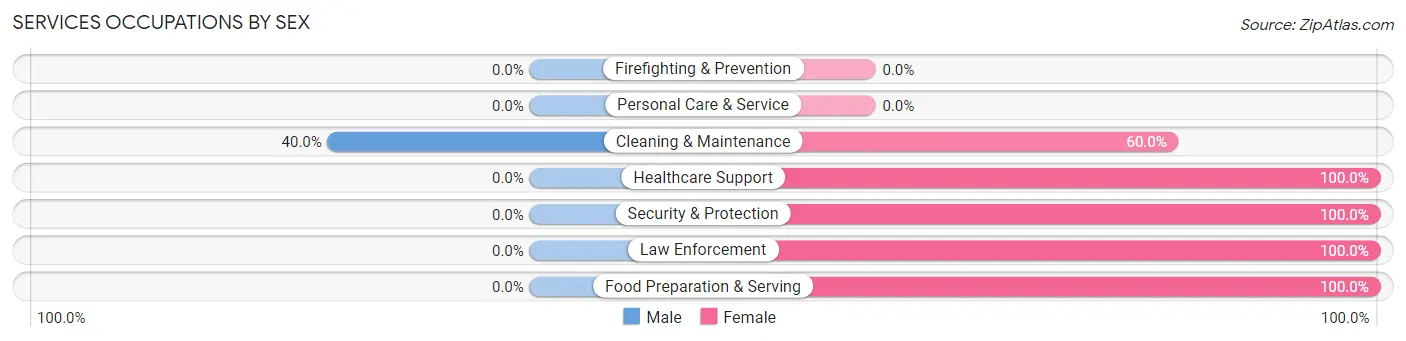
| Occupation | Male | Female |
| Healthcare Support | 0 (0.0%) | 3 (100.0%) |
| Security & Protection | 0 (0.0%) | 1 (100.0%) |
| Firefighting & Prevention | 0 (0.0%) | 0 (0.0%) |
| Law Enforcement | 0 (0.0%) | 1 (100.0%) |
| Food Preparation & Serving | 0 (0.0%) | 2 (100.0%) |
| Cleaning & Maintenance | 2 (40.0%) | 3 (60.0%) |
| Personal Care & Service | 0 (0.0%) | 0 (0.0%) |
| Total (Category) | 2 (18.2%) | 9 (81.8%) |
| Total (Overall) | 66 (62.9%) | 39 (37.1%) |
Sales and Office Occupations
The most common Sales and Office occupations in Kempton are Sales & Related (16 | 15.2%), and Office & Administration (5 | 4.8%).
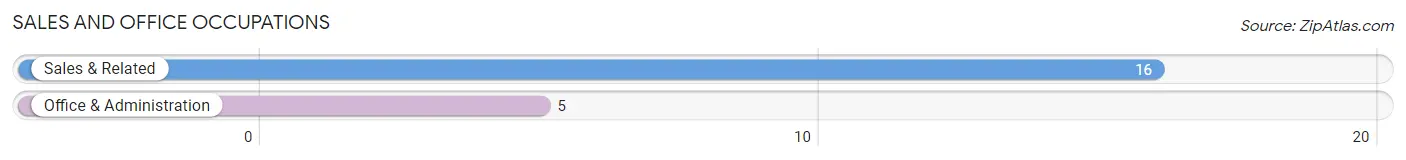
Sales and Office Occupations by Sex
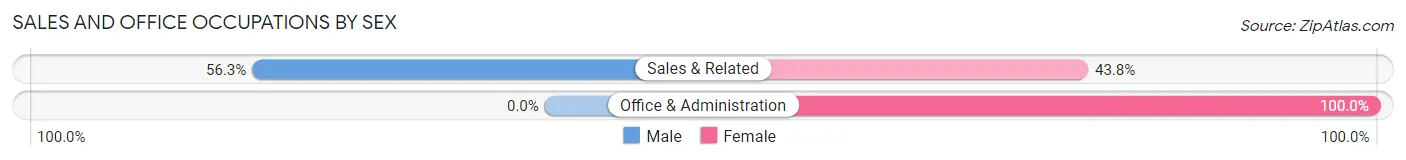
| Occupation | Male | Female |
| Sales & Related | 9 (56.2%) | 7 (43.8%) |
| Office & Administration | 0 (0.0%) | 5 (100.0%) |
| Total (Category) | 9 (42.9%) | 12 (57.1%) |
| Total (Overall) | 66 (62.9%) | 39 (37.1%) |
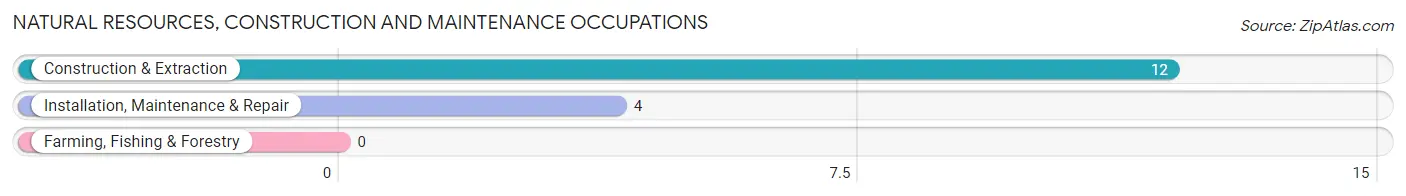
Natural Resources, Construction and Maintenance Occupations
The most common Natural Resources, Construction and Maintenance occupations in Kempton are Construction & Extraction (12 | 11.4%), and Installation, Maintenance & Repair (4 | 3.8%).
Natural Resources, Construction and Maintenance Occupations by Sex
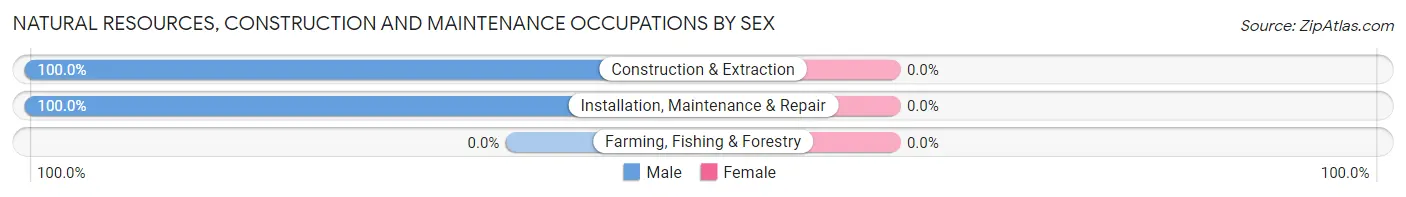
| Occupation | Male | Female |
| Farming, Fishing & Forestry | 0 (0.0%) | 0 (0.0%) |
| Construction & Extraction | 12 (100.0%) | 0 (0.0%) |
| Installation, Maintenance & Repair | 4 (100.0%) | 0 (0.0%) |
| Total (Category) | 16 (100.0%) | 0 (0.0%) |
| Total (Overall) | 66 (62.9%) | 39 (37.1%) |
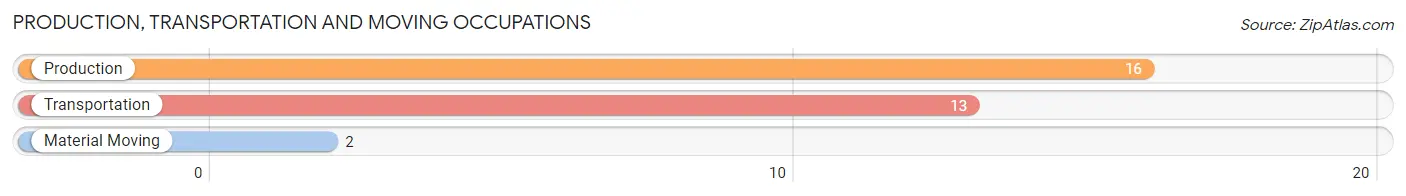
Production, Transportation and Moving Occupations
The most common Production, Transportation and Moving occupations in Kempton are Production (16 | 15.2%), Transportation (13 | 12.4%), and Material Moving (2 | 1.9%).
Production, Transportation and Moving Occupations by Sex
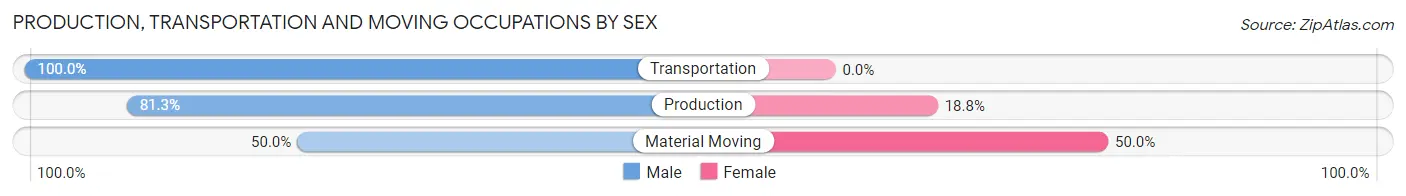
| Occupation | Male | Female |
| Production | 13 (81.2%) | 3 (18.8%) |
| Transportation | 13 (100.0%) | 0 (0.0%) |
| Material Moving | 1 (50.0%) | 1 (50.0%) |
| Total (Category) | 27 (87.1%) | 4 (12.9%) |
| Total (Overall) | 66 (62.9%) | 39 (37.1%) |
Employment Industries by Sex in Kempton
Employment Industries in Kempton
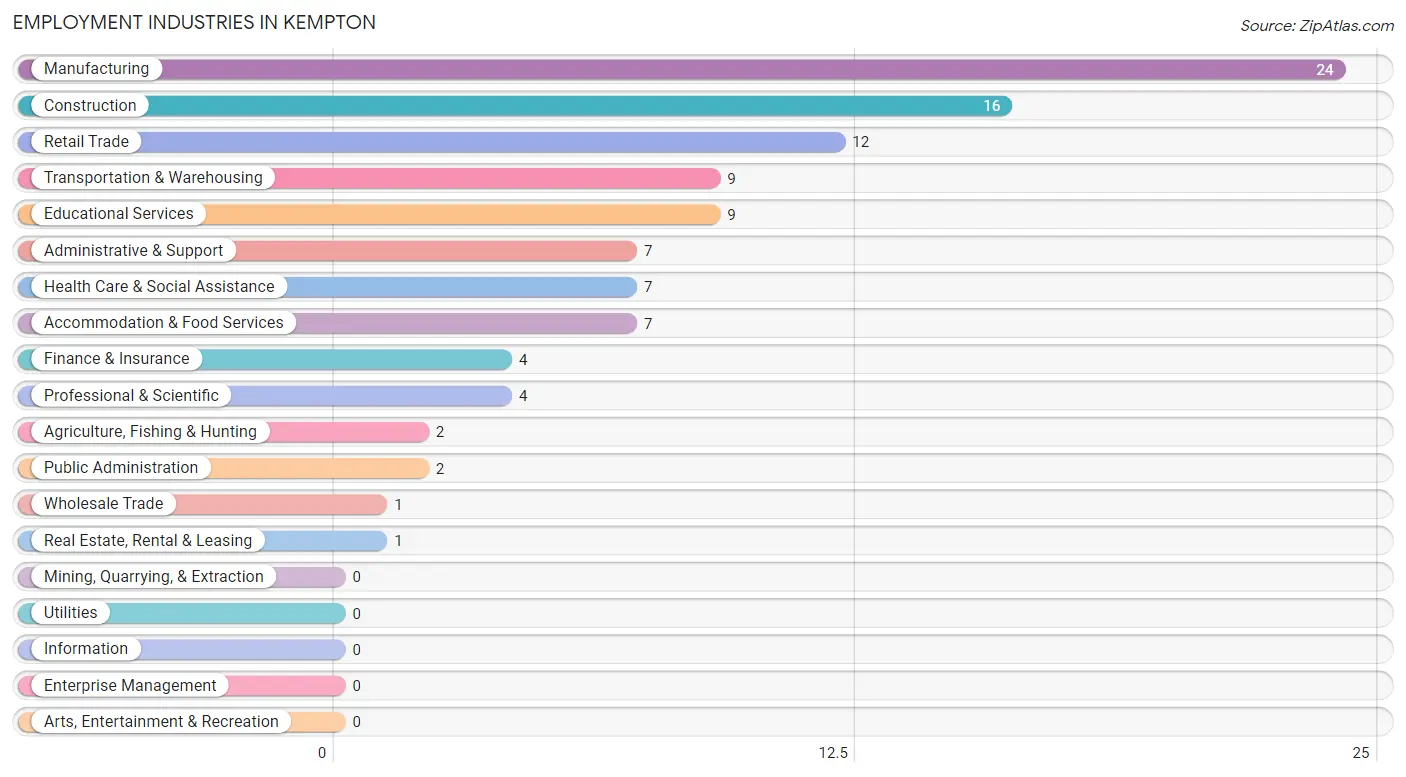
The major employment industries in Kempton include Manufacturing (24 | 22.9%), Construction (16 | 15.2%), Retail Trade (12 | 11.4%), Transportation & Warehousing (9 | 8.6%), and Educational Services (9 | 8.6%).
Employment Industries by Sex in Kempton
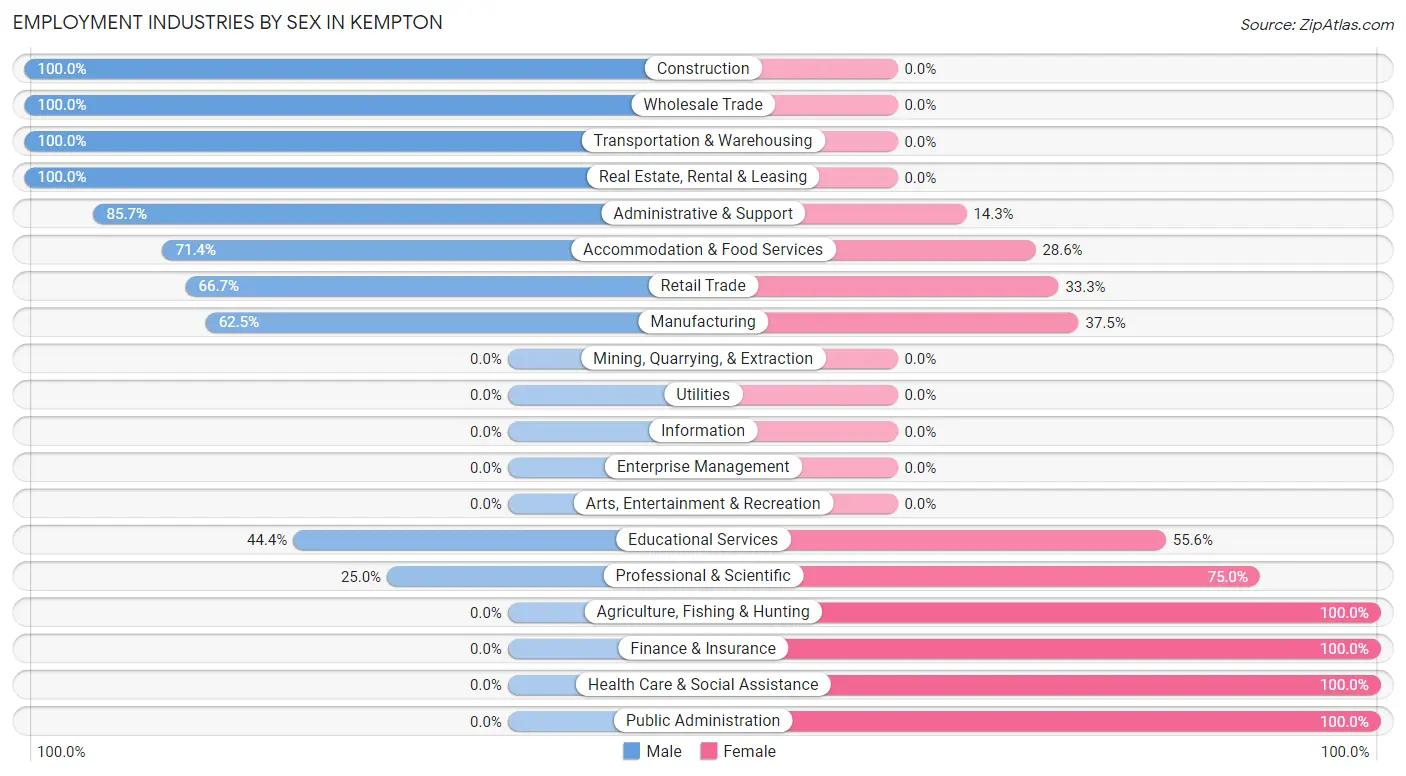
The Kempton industries that see more men than women are Construction (100.0%), Wholesale Trade (100.0%), and Transportation & Warehousing (100.0%), whereas the industries that tend to have a higher number of women are Agriculture, Fishing & Hunting (100.0%), Finance & Insurance (100.0%), and Health Care & Social Assistance (100.0%).
| Industry | Male | Female |
| Agriculture, Fishing & Hunting | 0 (0.0%) | 2 (100.0%) |
| Mining, Quarrying, & Extraction | 0 (0.0%) | 0 (0.0%) |
| Construction | 16 (100.0%) | 0 (0.0%) |
| Manufacturing | 15 (62.5%) | 9 (37.5%) |
| Wholesale Trade | 1 (100.0%) | 0 (0.0%) |
| Retail Trade | 8 (66.7%) | 4 (33.3%) |
| Transportation & Warehousing | 9 (100.0%) | 0 (0.0%) |
| Utilities | 0 (0.0%) | 0 (0.0%) |
| Information | 0 (0.0%) | 0 (0.0%) |
| Finance & Insurance | 0 (0.0%) | 4 (100.0%) |
| Real Estate, Rental & Leasing | 1 (100.0%) | 0 (0.0%) |
| Professional & Scientific | 1 (25.0%) | 3 (75.0%) |
| Enterprise Management | 0 (0.0%) | 0 (0.0%) |
| Administrative & Support | 6 (85.7%) | 1 (14.3%) |
| Educational Services | 4 (44.4%) | 5 (55.6%) |
| Health Care & Social Assistance | 0 (0.0%) | 7 (100.0%) |
| Arts, Entertainment & Recreation | 0 (0.0%) | 0 (0.0%) |
| Accommodation & Food Services | 5 (71.4%) | 2 (28.6%) |
| Public Administration | 0 (0.0%) | 2 (100.0%) |
| Total | 66 (62.9%) | 39 (37.1%) |
Education in Kempton
School Enrollment in Kempton
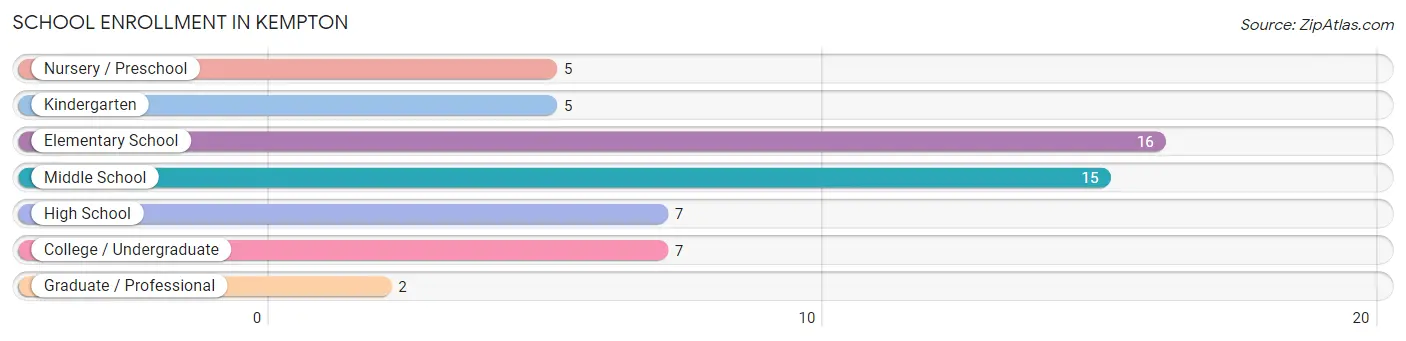
The most common levels of schooling among the 57 students in Kempton are elementary school (16 | 28.1%), middle school (15 | 26.3%), and high school (7 | 12.3%).
| School Level | # Students | % Students |
| Nursery / Preschool | 5 | 8.8% |
| Kindergarten | 5 | 8.8% |
| Elementary School | 16 | 28.1% |
| Middle School | 15 | 26.3% |
| High School | 7 | 12.3% |
| College / Undergraduate | 7 | 12.3% |
| Graduate / Professional | 2 | 3.5% |
| Total | 57 | 100.0% |
School Enrollment by Age by Funding Source in Kempton
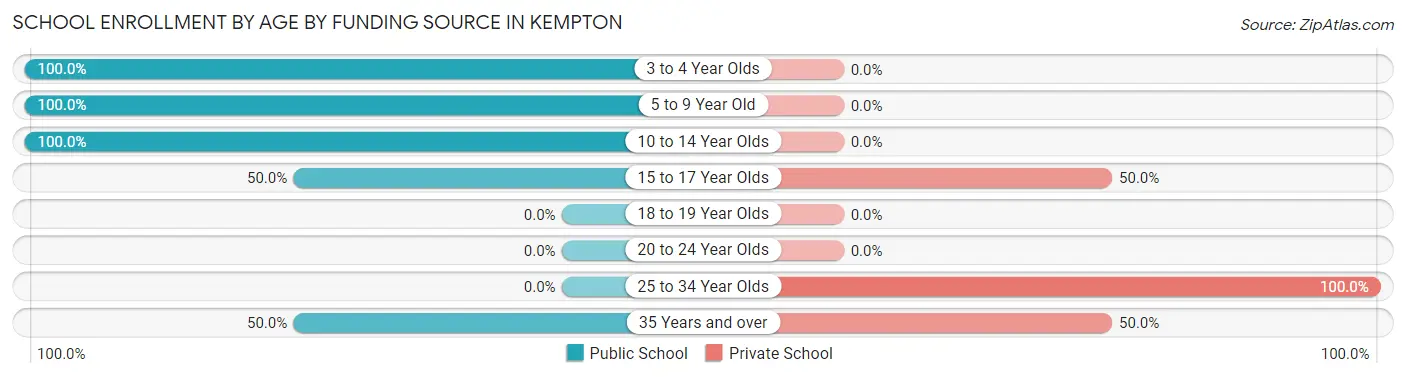
Out of a total of 57 students who are enrolled in schools in Kempton, 13 (22.8%) attend a private institution, while the remaining 44 (77.2%) are enrolled in public schools. The age group of 25 to 34 year olds has the highest likelihood of being enrolled in private schools, with 5 (100.0% in the age bracket) enrolled. Conversely, the age group of 3 to 4 year olds has the lowest likelihood of being enrolled in a private school, with 5 (100.0% in the age bracket) attending a public institution.
| Age Bracket | Public School | Private School |
| 3 to 4 Year Olds | 5 (100.0%) | 0 (0.0%) |
| 5 to 9 Year Old | 21 (100.0%) | 0 (0.0%) |
| 10 to 14 Year Olds | 10 (100.0%) | 0 (0.0%) |
| 15 to 17 Year Olds | 6 (50.0%) | 6 (50.0%) |
| 18 to 19 Year Olds | 0 (0.0%) | 0 (0.0%) |
| 20 to 24 Year Olds | 0 (0.0%) | 0 (0.0%) |
| 25 to 34 Year Olds | 0 (0.0%) | 5 (100.0%) |
| 35 Years and over | 2 (50.0%) | 2 (50.0%) |
| Total | 44 (77.2%) | 13 (22.8%) |
Educational Attainment by Field of Study in Kempton
Business (11 | 35.5%), engineering (8 | 25.8%), bio, nature & agricultural (4 | 12.9%), science & technology (3 | 9.7%), and computers & mathematics (2 | 6.5%) are the most common fields of study among 31 individuals in Kempton who have obtained a bachelor's degree or higher.
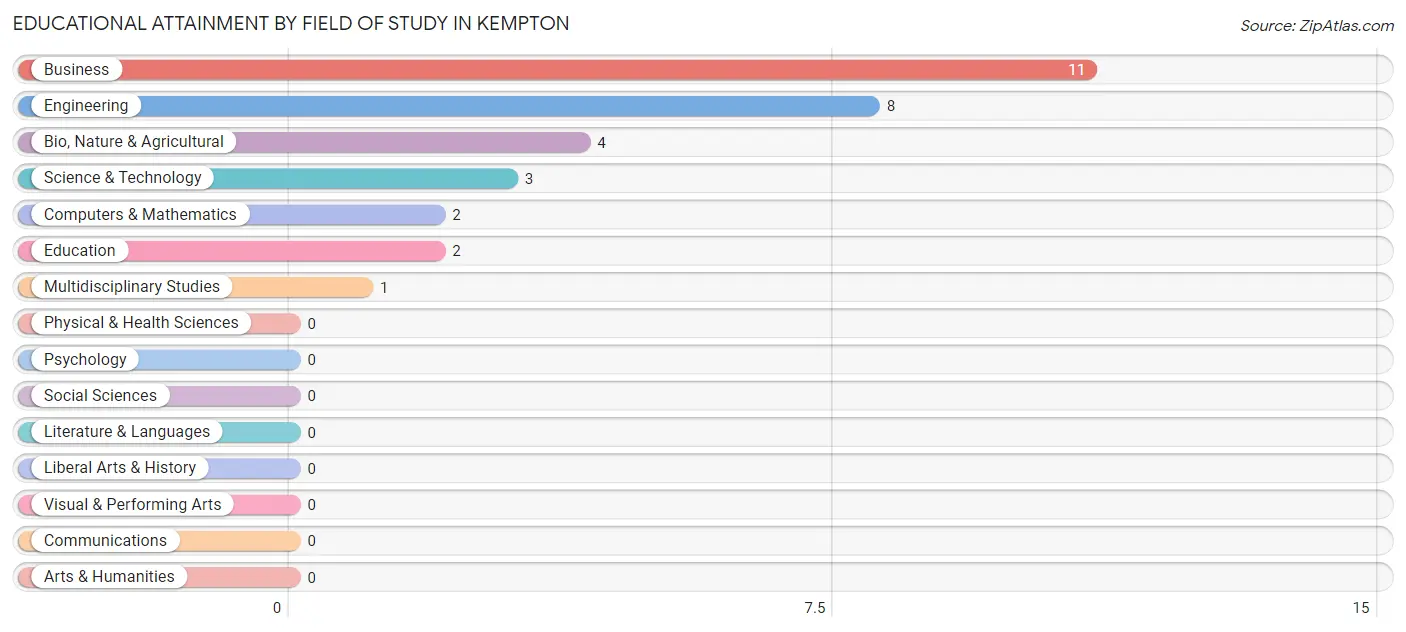
| Field of Study | # Graduates | % Graduates |
| Computers & Mathematics | 2 | 6.5% |
| Bio, Nature & Agricultural | 4 | 12.9% |
| Physical & Health Sciences | 0 | 0.0% |
| Psychology | 0 | 0.0% |
| Social Sciences | 0 | 0.0% |
| Engineering | 8 | 25.8% |
| Multidisciplinary Studies | 1 | 3.2% |
| Science & Technology | 3 | 9.7% |
| Business | 11 | 35.5% |
| Education | 2 | 6.5% |
| Literature & Languages | 0 | 0.0% |
| Liberal Arts & History | 0 | 0.0% |
| Visual & Performing Arts | 0 | 0.0% |
| Communications | 0 | 0.0% |
| Arts & Humanities | 0 | 0.0% |
| Total | 31 | 100.0% |
Transportation & Commute in Kempton
Vehicle Availability by Sex in Kempton
The most prevalent vehicle ownership categories in Kempton are males with 2 vehicles (25, accounting for 43.1%) and females with 2 vehicles (25, making up 64.1%).
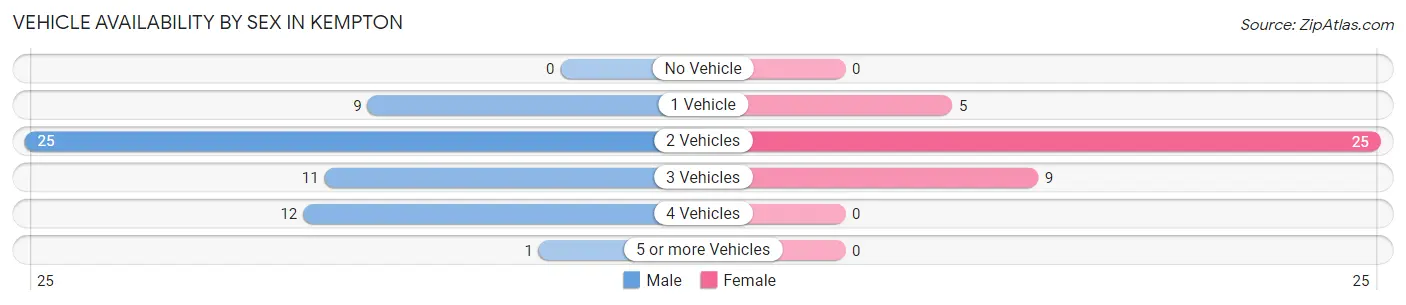
| Vehicles Available | Male | Female |
| No Vehicle | 0 (0.0%) | 0 (0.0%) |
| 1 Vehicle | 9 (15.5%) | 5 (12.8%) |
| 2 Vehicles | 25 (43.1%) | 25 (64.1%) |
| 3 Vehicles | 11 (19.0%) | 9 (23.1%) |
| 4 Vehicles | 12 (20.7%) | 0 (0.0%) |
| 5 or more Vehicles | 1 (1.7%) | 0 (0.0%) |
| Total | 58 (100.0%) | 39 (100.0%) |
Commute Time in Kempton
The most frequently occuring commute durations in Kempton are 30 to 34 minutes (21 commuters, 23.3%), 25 to 29 minutes (10 commuters, 11.1%), and 20 to 24 minutes (9 commuters, 10.0%).
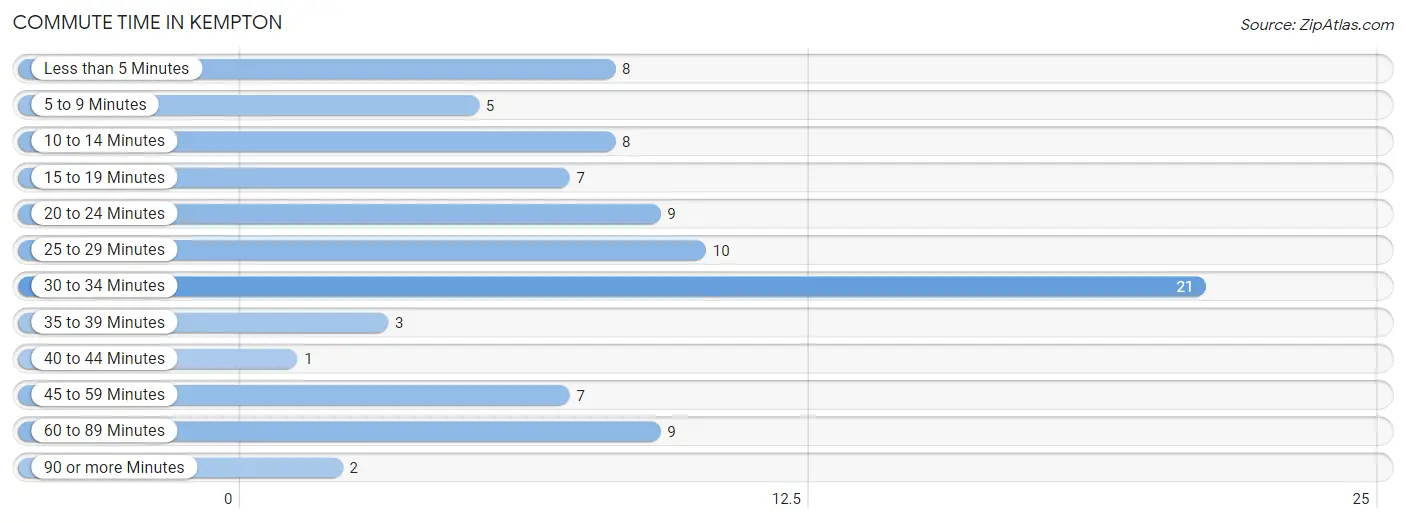
| Commute Time | # Commuters | % Commuters |
| Less than 5 Minutes | 8 | 8.9% |
| 5 to 9 Minutes | 5 | 5.6% |
| 10 to 14 Minutes | 8 | 8.9% |
| 15 to 19 Minutes | 7 | 7.8% |
| 20 to 24 Minutes | 9 | 10.0% |
| 25 to 29 Minutes | 10 | 11.1% |
| 30 to 34 Minutes | 21 | 23.3% |
| 35 to 39 Minutes | 3 | 3.3% |
| 40 to 44 Minutes | 1 | 1.1% |
| 45 to 59 Minutes | 7 | 7.8% |
| 60 to 89 Minutes | 9 | 10.0% |
| 90 or more Minutes | 2 | 2.2% |
Commute Time by Sex in Kempton
The most common commute times in Kempton are 30 to 34 minutes (17 commuters, 29.3%) for males and 10 to 14 minutes (8 commuters, 25.0%) for females.
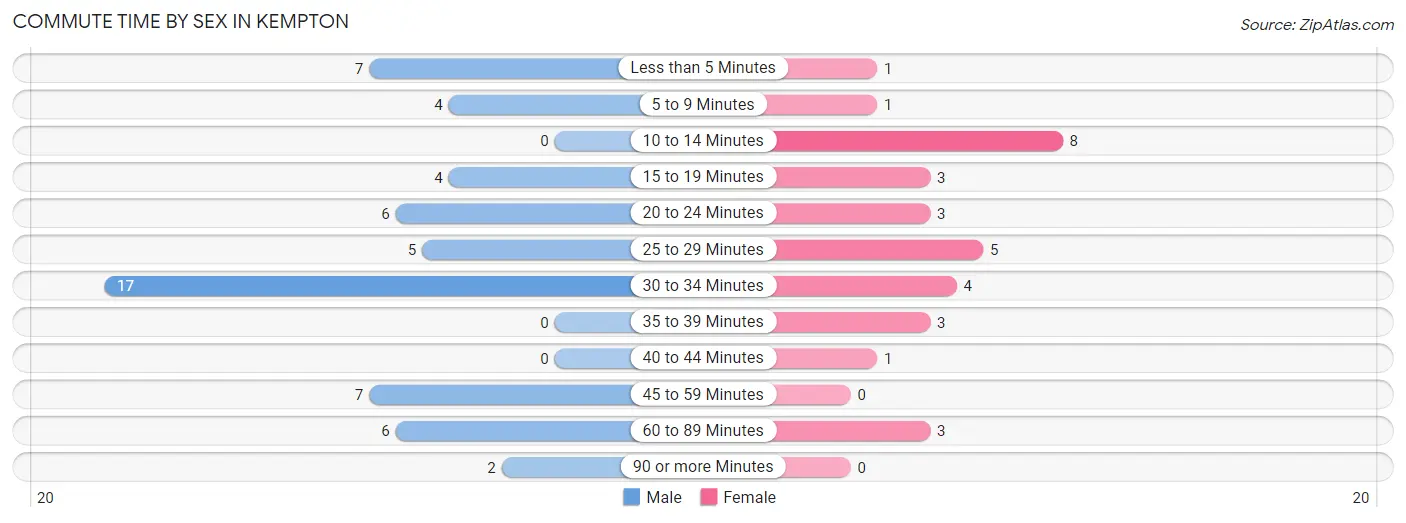
| Commute Time | Male | Female |
| Less than 5 Minutes | 7 (12.1%) | 1 (3.1%) |
| 5 to 9 Minutes | 4 (6.9%) | 1 (3.1%) |
| 10 to 14 Minutes | 0 (0.0%) | 8 (25.0%) |
| 15 to 19 Minutes | 4 (6.9%) | 3 (9.4%) |
| 20 to 24 Minutes | 6 (10.3%) | 3 (9.4%) |
| 25 to 29 Minutes | 5 (8.6%) | 5 (15.6%) |
| 30 to 34 Minutes | 17 (29.3%) | 4 (12.5%) |
| 35 to 39 Minutes | 0 (0.0%) | 3 (9.4%) |
| 40 to 44 Minutes | 0 (0.0%) | 1 (3.1%) |
| 45 to 59 Minutes | 7 (12.1%) | 0 (0.0%) |
| 60 to 89 Minutes | 6 (10.3%) | 3 (9.4%) |
| 90 or more Minutes | 2 (3.5%) | 0 (0.0%) |
Time of Departure to Work by Sex in Kempton
The most frequent times of departure to work in Kempton are 6:00 AM to 6:29 AM (11, 19.0%) for males and 6:30 AM to 6:59 AM (7, 21.9%) for females.
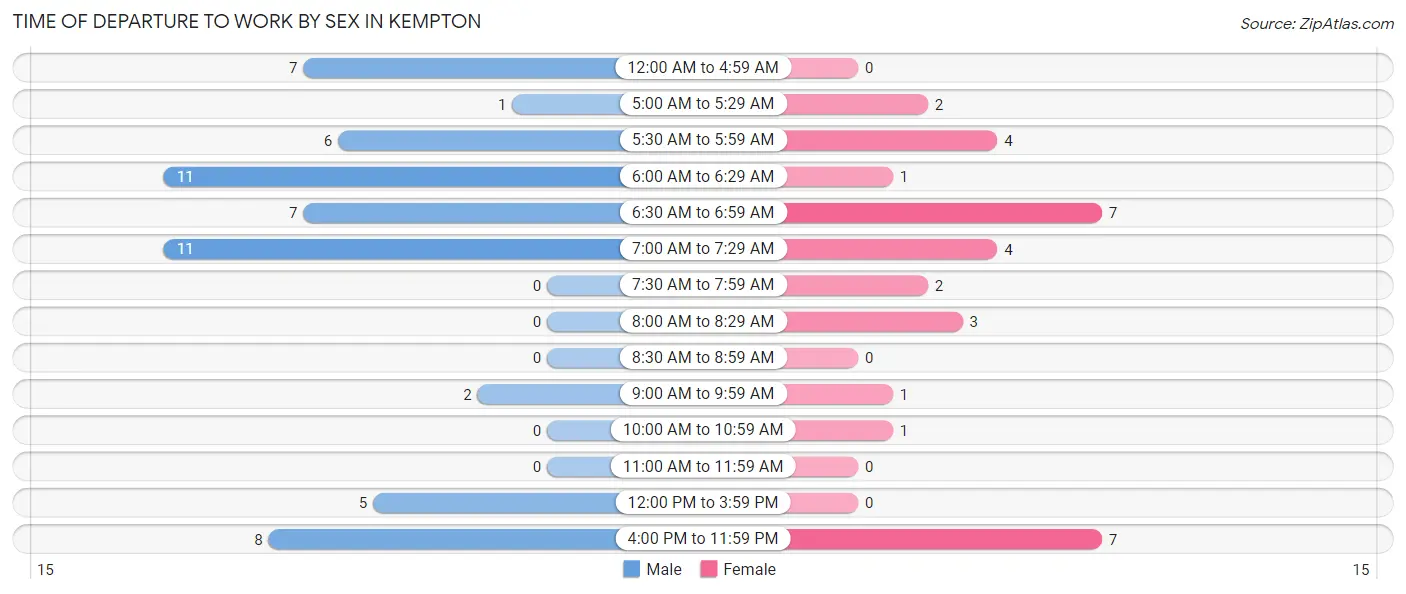
| Time of Departure | Male | Female |
| 12:00 AM to 4:59 AM | 7 (12.1%) | 0 (0.0%) |
| 5:00 AM to 5:29 AM | 1 (1.7%) | 2 (6.2%) |
| 5:30 AM to 5:59 AM | 6 (10.3%) | 4 (12.5%) |
| 6:00 AM to 6:29 AM | 11 (19.0%) | 1 (3.1%) |
| 6:30 AM to 6:59 AM | 7 (12.1%) | 7 (21.9%) |
| 7:00 AM to 7:29 AM | 11 (19.0%) | 4 (12.5%) |
| 7:30 AM to 7:59 AM | 0 (0.0%) | 2 (6.2%) |
| 8:00 AM to 8:29 AM | 0 (0.0%) | 3 (9.4%) |
| 8:30 AM to 8:59 AM | 0 (0.0%) | 0 (0.0%) |
| 9:00 AM to 9:59 AM | 2 (3.5%) | 1 (3.1%) |
| 10:00 AM to 10:59 AM | 0 (0.0%) | 1 (3.1%) |
| 11:00 AM to 11:59 AM | 0 (0.0%) | 0 (0.0%) |
| 12:00 PM to 3:59 PM | 5 (8.6%) | 0 (0.0%) |
| 4:00 PM to 11:59 PM | 8 (13.8%) | 7 (21.9%) |
| Total | 58 (100.0%) | 32 (100.0%) |
Housing Occupancy in Kempton
Occupancy by Ownership in Kempton
Of the total 119 dwellings in Kempton, owner-occupied units account for 101 (84.9%), while renter-occupied units make up 18 (15.1%).
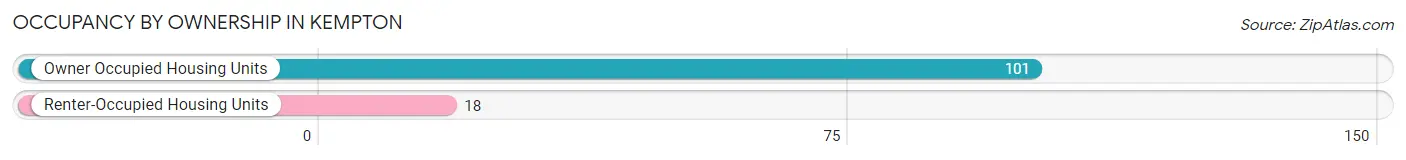
| Occupancy | # Housing Units | % Housing Units |
| Owner Occupied Housing Units | 101 | 84.9% |
| Renter-Occupied Housing Units | 18 | 15.1% |
| Total Occupied Housing Units | 119 | 100.0% |
Occupancy by Household Size in Kempton
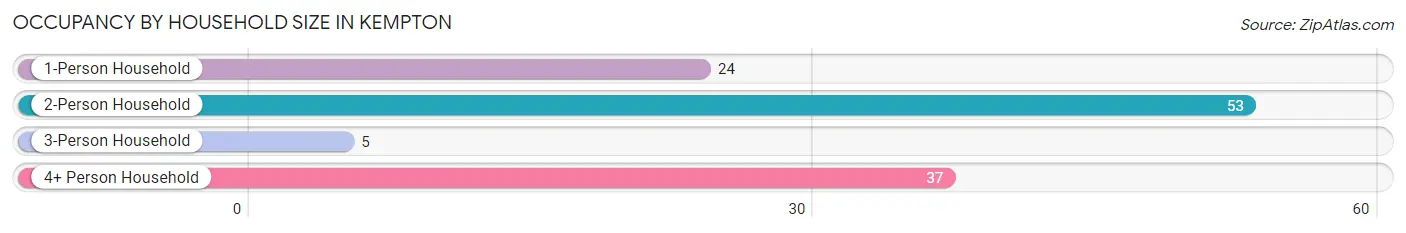
| Household Size | # Housing Units | % Housing Units |
| 1-Person Household | 24 | 20.2% |
| 2-Person Household | 53 | 44.5% |
| 3-Person Household | 5 | 4.2% |
| 4+ Person Household | 37 | 31.1% |
| Total Housing Units | 119 | 100.0% |
Occupancy by Ownership by Household Size in Kempton
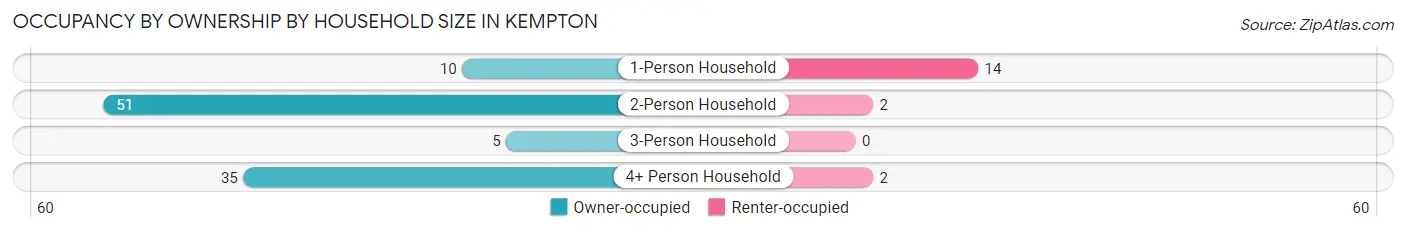
| Household Size | Owner-occupied | Renter-occupied |
| 1-Person Household | 10 (41.7%) | 14 (58.3%) |
| 2-Person Household | 51 (96.2%) | 2 (3.8%) |
| 3-Person Household | 5 (100.0%) | 0 (0.0%) |
| 4+ Person Household | 35 (94.6%) | 2 (5.4%) |
| Total Housing Units | 101 (84.9%) | 18 (15.1%) |
Occupancy by Educational Attainment in Kempton
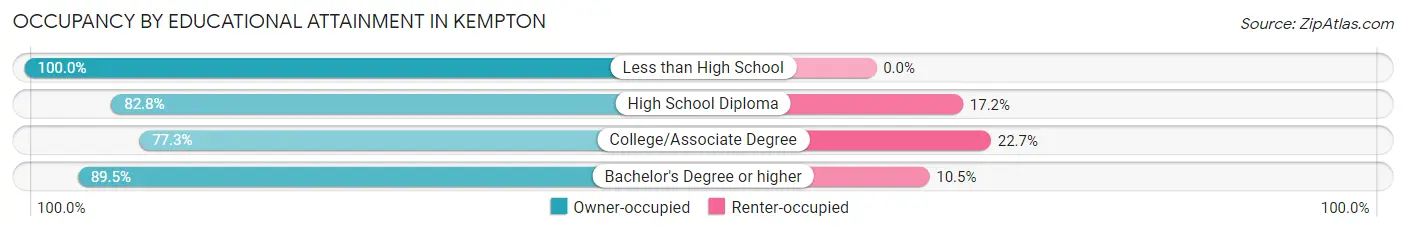
| Household Size | Owner-occupied | Renter-occupied |
| Less than High School | 14 (100.0%) | 0 (0.0%) |
| High School Diploma | 53 (82.8%) | 11 (17.2%) |
| College/Associate Degree | 17 (77.3%) | 5 (22.7%) |
| Bachelor's Degree or higher | 17 (89.5%) | 2 (10.5%) |
Occupancy by Age of Householder in Kempton
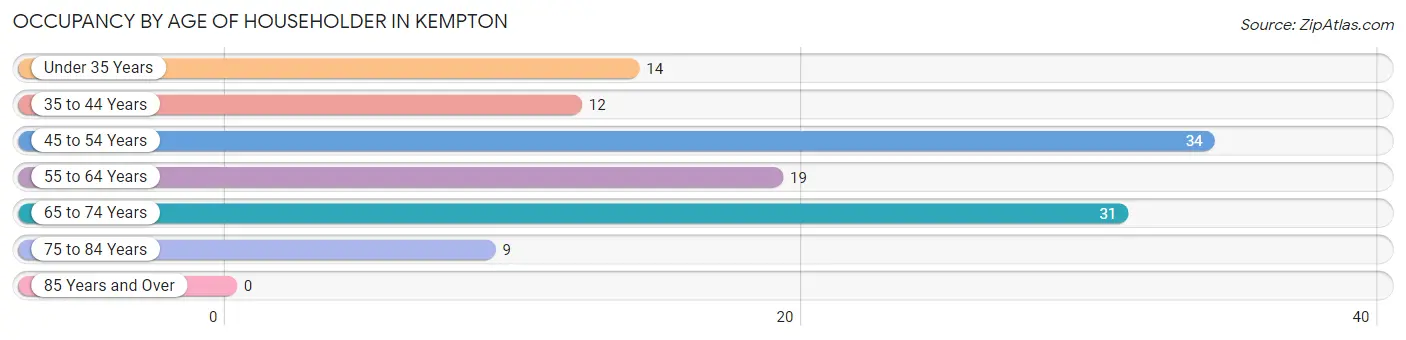
| Age Bracket | # Households | % Households |
| Under 35 Years | 14 | 11.8% |
| 35 to 44 Years | 12 | 10.1% |
| 45 to 54 Years | 34 | 28.6% |
| 55 to 64 Years | 19 | 16.0% |
| 65 to 74 Years | 31 | 26.1% |
| 75 to 84 Years | 9 | 7.6% |
| 85 Years and Over | 0 | 0.0% |
| Total | 119 | 100.0% |
Housing Finances in Kempton
Median Income by Occupancy in Kempton
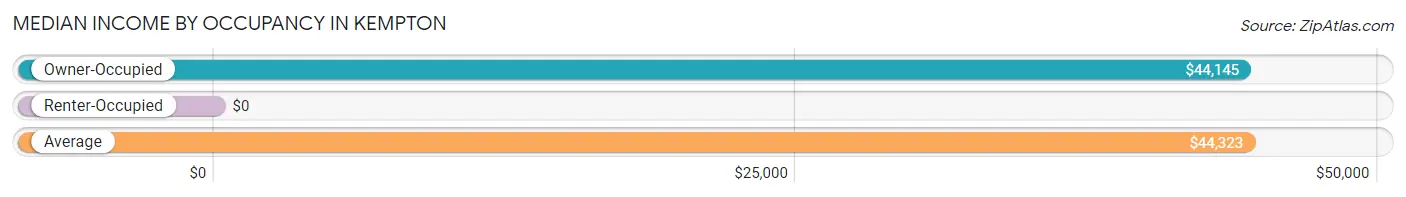
| Occupancy Type | # Households | Median Income |
| Owner-Occupied | 101 (84.9%) | $44,145 |
| Renter-Occupied | 18 (15.1%) | $0 |
| Average | 119 (100.0%) | $44,323 |
Occupancy by Householder Income Bracket in Kempton
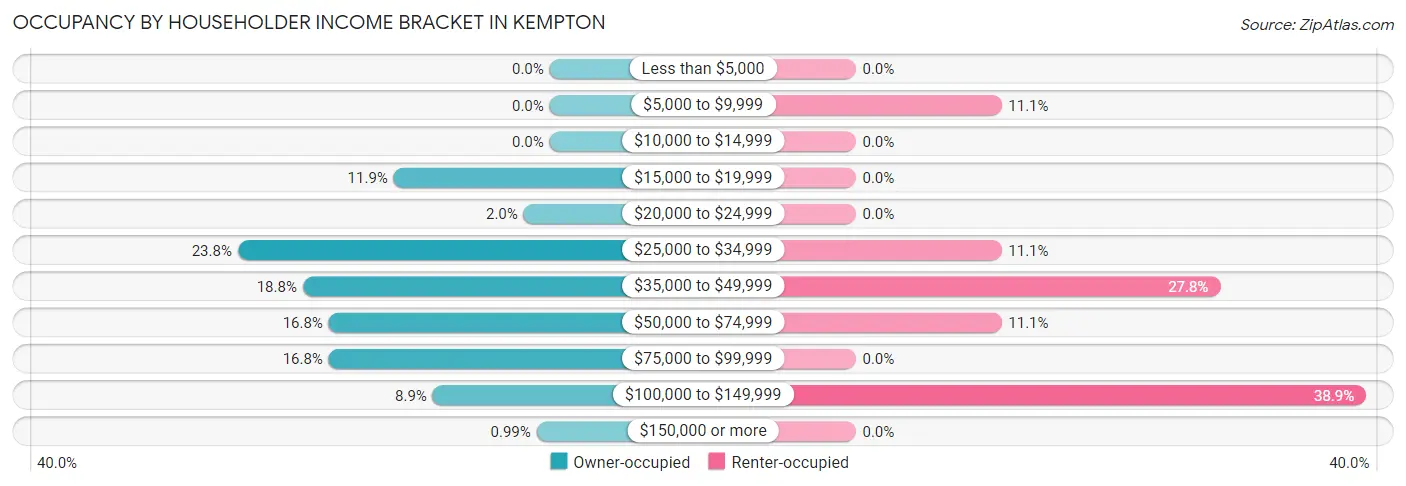
| Income Bracket | Owner-occupied | Renter-occupied |
| Less than $5,000 | 0 (0.0%) | 0 (0.0%) |
| $5,000 to $9,999 | 0 (0.0%) | 2 (11.1%) |
| $10,000 to $14,999 | 0 (0.0%) | 0 (0.0%) |
| $15,000 to $19,999 | 12 (11.9%) | 0 (0.0%) |
| $20,000 to $24,999 | 2 (2.0%) | 0 (0.0%) |
| $25,000 to $34,999 | 24 (23.8%) | 2 (11.1%) |
| $35,000 to $49,999 | 19 (18.8%) | 5 (27.8%) |
| $50,000 to $74,999 | 17 (16.8%) | 2 (11.1%) |
| $75,000 to $99,999 | 17 (16.8%) | 0 (0.0%) |
| $100,000 to $149,999 | 9 (8.9%) | 7 (38.9%) |
| $150,000 or more | 1 (1.0%) | 0 (0.0%) |
| Total | 101 (100.0%) | 18 (100.0%) |
Monthly Housing Cost Tiers in Kempton
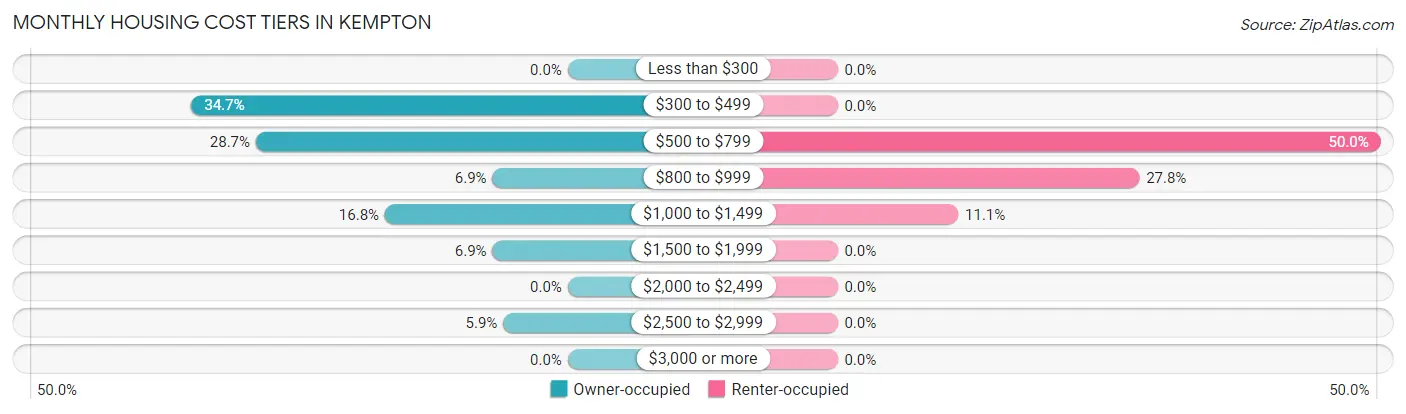
| Monthly Cost | Owner-occupied | Renter-occupied |
| Less than $300 | 0 (0.0%) | 0 (0.0%) |
| $300 to $499 | 35 (34.6%) | 0 (0.0%) |
| $500 to $799 | 29 (28.7%) | 9 (50.0%) |
| $800 to $999 | 7 (6.9%) | 5 (27.8%) |
| $1,000 to $1,499 | 17 (16.8%) | 2 (11.1%) |
| $1,500 to $1,999 | 7 (6.9%) | 0 (0.0%) |
| $2,000 to $2,499 | 0 (0.0%) | 0 (0.0%) |
| $2,500 to $2,999 | 6 (5.9%) | 0 (0.0%) |
| $3,000 or more | 0 (0.0%) | 0 (0.0%) |
| Total | 101 (100.0%) | 18 (100.0%) |
Physical Housing Characteristics in Kempton
Housing Structures in Kempton
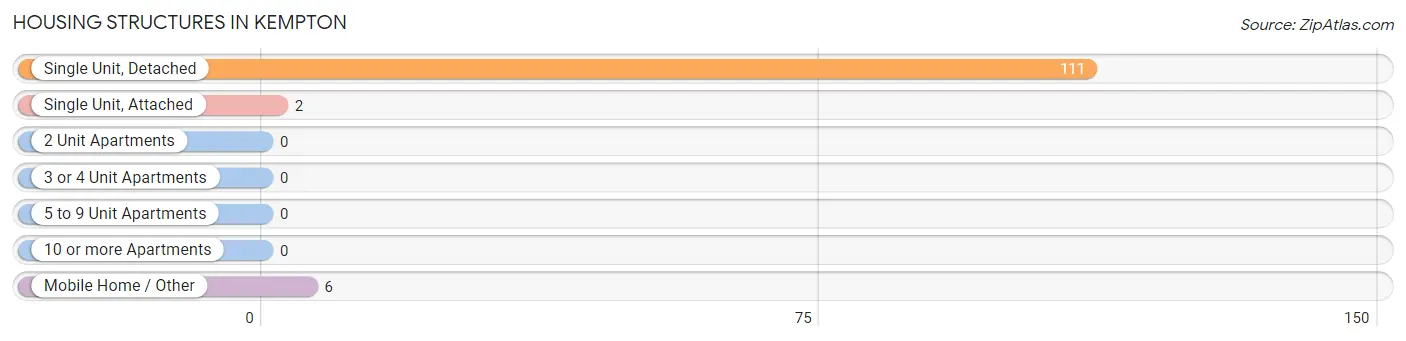
| Structure Type | # Housing Units | % Housing Units |
| Single Unit, Detached | 111 | 93.3% |
| Single Unit, Attached | 2 | 1.7% |
| 2 Unit Apartments | 0 | 0.0% |
| 3 or 4 Unit Apartments | 0 | 0.0% |
| 5 to 9 Unit Apartments | 0 | 0.0% |
| 10 or more Apartments | 0 | 0.0% |
| Mobile Home / Other | 6 | 5.0% |
| Total | 119 | 100.0% |
Housing Structures by Occupancy in Kempton
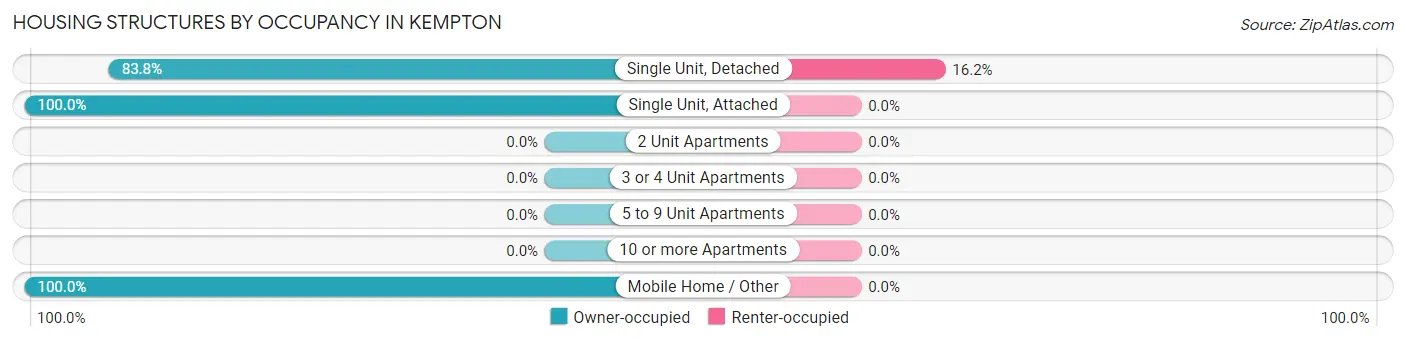
| Structure Type | Owner-occupied | Renter-occupied |
| Single Unit, Detached | 93 (83.8%) | 18 (16.2%) |
| Single Unit, Attached | 2 (100.0%) | 0 (0.0%) |
| 2 Unit Apartments | 0 (0.0%) | 0 (0.0%) |
| 3 or 4 Unit Apartments | 0 (0.0%) | 0 (0.0%) |
| 5 to 9 Unit Apartments | 0 (0.0%) | 0 (0.0%) |
| 10 or more Apartments | 0 (0.0%) | 0 (0.0%) |
| Mobile Home / Other | 6 (100.0%) | 0 (0.0%) |
| Total | 101 (84.9%) | 18 (15.1%) |
Housing Structures by Number of Rooms in Kempton
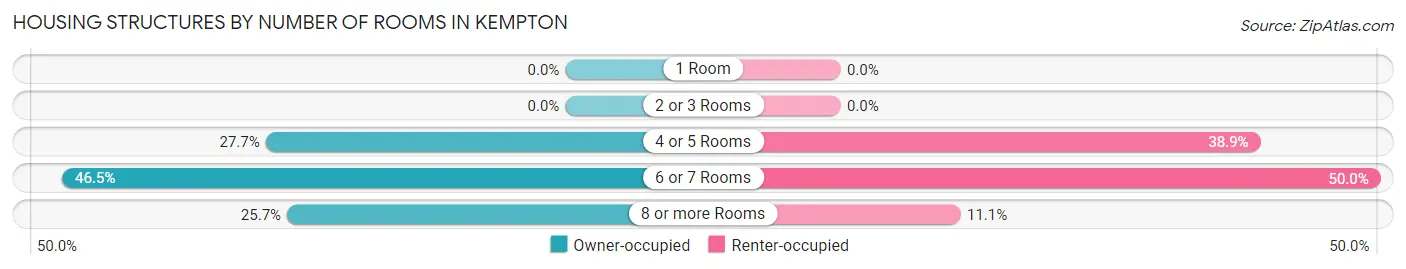
| Number of Rooms | Owner-occupied | Renter-occupied |
| 1 Room | 0 (0.0%) | 0 (0.0%) |
| 2 or 3 Rooms | 0 (0.0%) | 0 (0.0%) |
| 4 or 5 Rooms | 28 (27.7%) | 7 (38.9%) |
| 6 or 7 Rooms | 47 (46.5%) | 9 (50.0%) |
| 8 or more Rooms | 26 (25.7%) | 2 (11.1%) |
| Total | 101 (100.0%) | 18 (100.0%) |
Housing Structure by Heating Type in Kempton
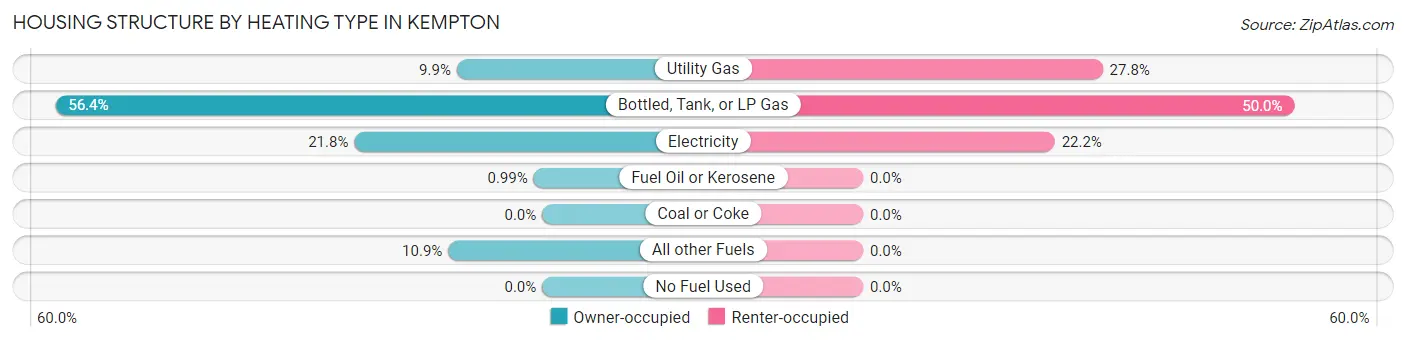
| Heating Type | Owner-occupied | Renter-occupied |
| Utility Gas | 10 (9.9%) | 5 (27.8%) |
| Bottled, Tank, or LP Gas | 57 (56.4%) | 9 (50.0%) |
| Electricity | 22 (21.8%) | 4 (22.2%) |
| Fuel Oil or Kerosene | 1 (1.0%) | 0 (0.0%) |
| Coal or Coke | 0 (0.0%) | 0 (0.0%) |
| All other Fuels | 11 (10.9%) | 0 (0.0%) |
| No Fuel Used | 0 (0.0%) | 0 (0.0%) |
| Total | 101 (100.0%) | 18 (100.0%) |
Household Vehicle Usage in Kempton
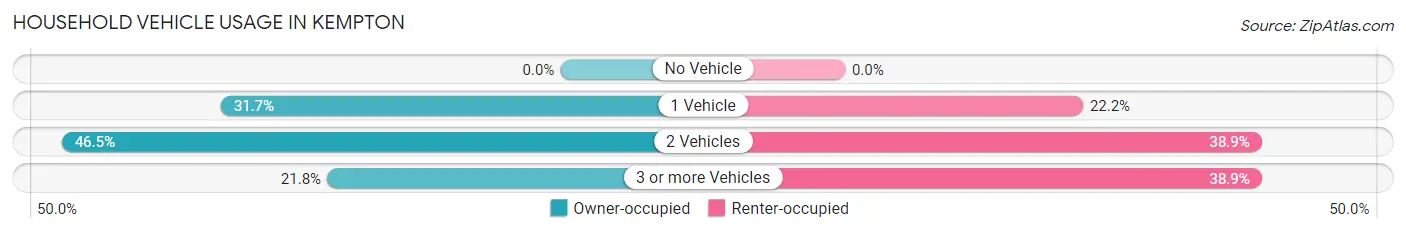
| Vehicles per Household | Owner-occupied | Renter-occupied |
| No Vehicle | 0 (0.0%) | 0 (0.0%) |
| 1 Vehicle | 32 (31.7%) | 4 (22.2%) |
| 2 Vehicles | 47 (46.5%) | 7 (38.9%) |
| 3 or more Vehicles | 22 (21.8%) | 7 (38.9%) |
| Total | 101 (100.0%) | 18 (100.0%) |
Real Estate & Mortgages in Kempton
Real Estate and Mortgage Overview in Kempton
| Characteristic | Without Mortgage | With Mortgage |
| Housing Units | 57 | 44 |
| Median Property Value | $53,700 | $106,300 |
| Median Household Income | $42,578 | $1 |
| Monthly Housing Costs | $456 | $0 |
| Real Estate Taxes | $570 | $2 |
Property Value by Mortgage Status in Kempton
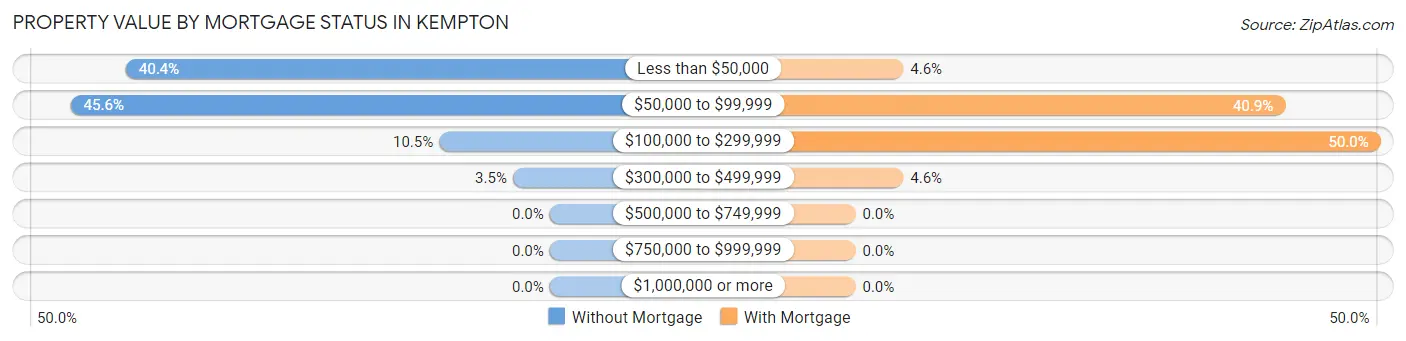
| Property Value | Without Mortgage | With Mortgage |
| Less than $50,000 | 23 (40.4%) | 2 (4.5%) |
| $50,000 to $99,999 | 26 (45.6%) | 18 (40.9%) |
| $100,000 to $299,999 | 6 (10.5%) | 22 (50.0%) |
| $300,000 to $499,999 | 2 (3.5%) | 2 (4.5%) |
| $500,000 to $749,999 | 0 (0.0%) | 0 (0.0%) |
| $750,000 to $999,999 | 0 (0.0%) | 0 (0.0%) |
| $1,000,000 or more | 0 (0.0%) | 0 (0.0%) |
| Total | 57 (100.0%) | 44 (100.0%) |
Household Income by Mortgage Status in Kempton
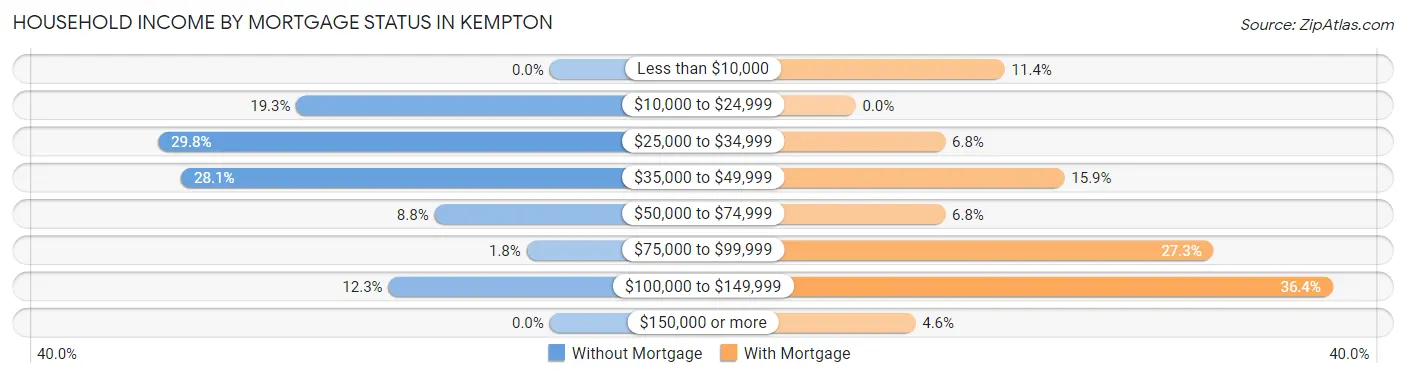
| Household Income | Without Mortgage | With Mortgage |
| Less than $10,000 | 0 (0.0%) | 5 (11.4%) |
| $10,000 to $24,999 | 11 (19.3%) | 0 (0.0%) |
| $25,000 to $34,999 | 17 (29.8%) | 3 (6.8%) |
| $35,000 to $49,999 | 16 (28.1%) | 7 (15.9%) |
| $50,000 to $74,999 | 5 (8.8%) | 3 (6.8%) |
| $75,000 to $99,999 | 1 (1.8%) | 12 (27.3%) |
| $100,000 to $149,999 | 7 (12.3%) | 16 (36.4%) |
| $150,000 or more | 0 (0.0%) | 2 (4.5%) |
| Total | 57 (100.0%) | 44 (100.0%) |
Property Value to Household Income Ratio in Kempton
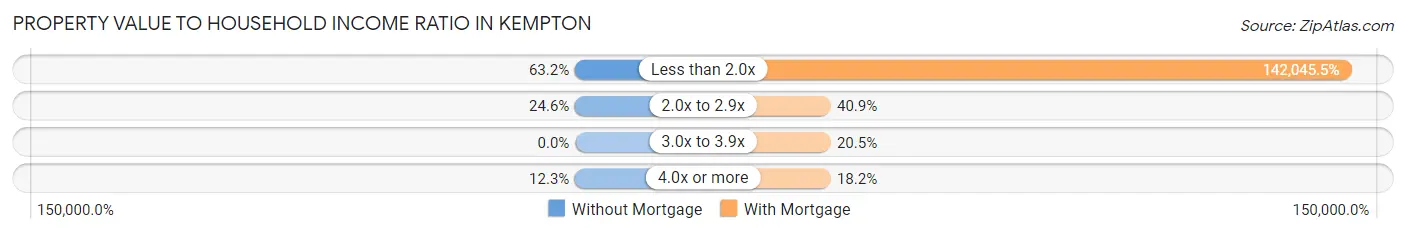
| Value-to-Income Ratio | Without Mortgage | With Mortgage |
| Less than 2.0x | 36 (63.2%) | 62,500 (142,045.5%) |
| 2.0x to 2.9x | 14 (24.6%) | 18 (40.9%) |
| 3.0x to 3.9x | 0 (0.0%) | 9 (20.4%) |
| 4.0x or more | 7 (12.3%) | 8 (18.2%) |
| Total | 57 (100.0%) | 44 (100.0%) |
Real Estate Taxes by Mortgage Status in Kempton
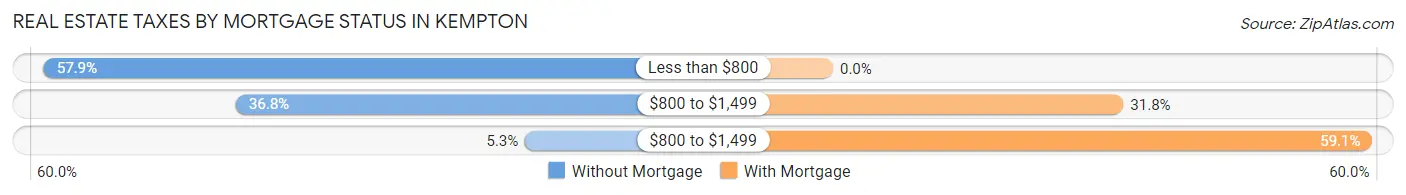
| Property Taxes | Without Mortgage | With Mortgage |
| Less than $800 | 33 (57.9%) | 0 (0.0%) |
| $800 to $1,499 | 21 (36.8%) | 14 (31.8%) |
| $800 to $1,499 | 3 (5.3%) | 26 (59.1%) |
| Total | 57 (100.0%) | 44 (100.0%) |
Health & Disability in Kempton
Health Insurance Coverage by Age in Kempton
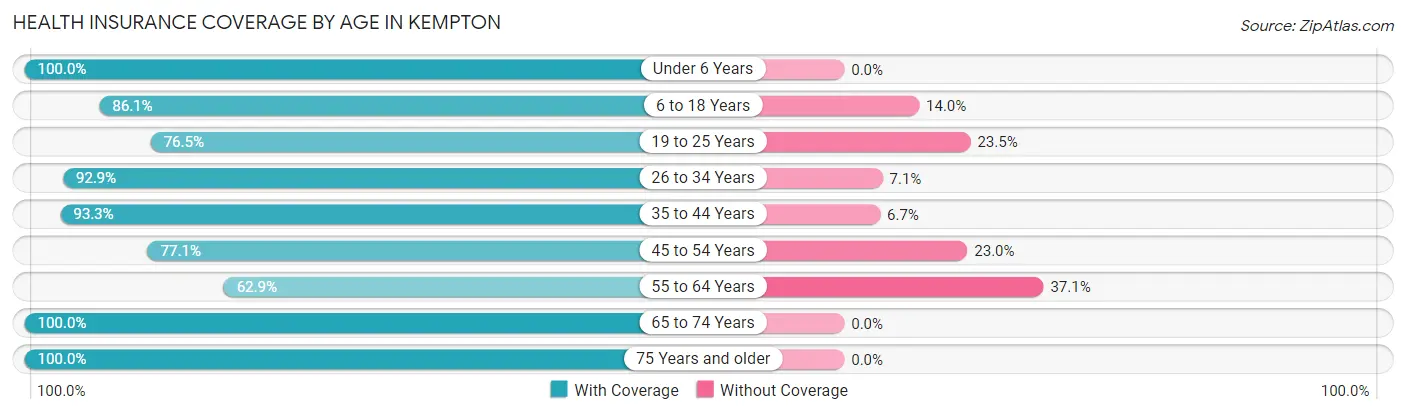
| Age Bracket | With Coverage | Without Coverage |
| Under 6 Years | 15 (100.0%) | 0 (0.0%) |
| 6 to 18 Years | 37 (86.1%) | 6 (14.0%) |
| 19 to 25 Years | 13 (76.5%) | 4 (23.5%) |
| 26 to 34 Years | 13 (92.9%) | 1 (7.1%) |
| 35 to 44 Years | 28 (93.3%) | 2 (6.7%) |
| 45 to 54 Years | 47 (77.0%) | 14 (23.0%) |
| 55 to 64 Years | 22 (62.9%) | 13 (37.1%) |
| 65 to 74 Years | 49 (100.0%) | 0 (0.0%) |
| 75 Years and older | 16 (100.0%) | 0 (0.0%) |
| Total | 240 (85.7%) | 40 (14.3%) |
Health Insurance Coverage by Citizenship Status in Kempton
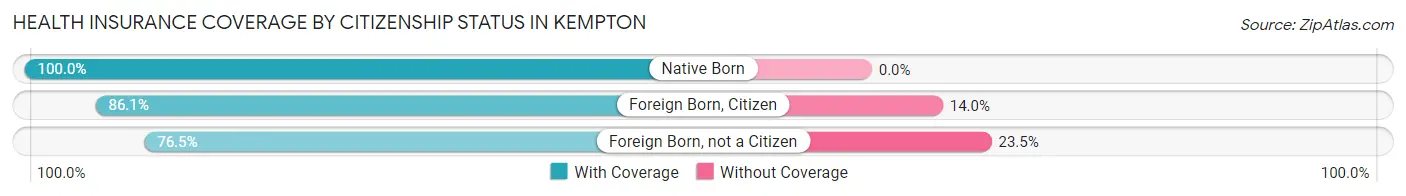
| Citizenship Status | With Coverage | Without Coverage |
| Native Born | 15 (100.0%) | 0 (0.0%) |
| Foreign Born, Citizen | 37 (86.1%) | 6 (14.0%) |
| Foreign Born, not a Citizen | 13 (76.5%) | 4 (23.5%) |
Health Insurance Coverage by Household Income in Kempton
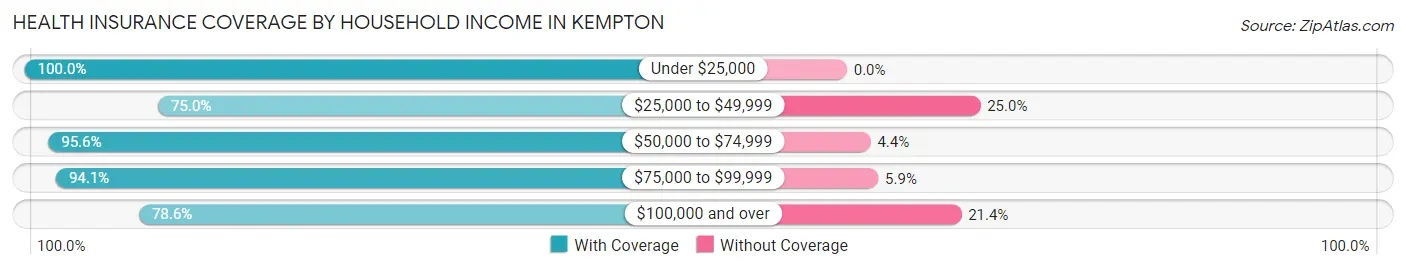
| Household Income | With Coverage | Without Coverage |
| Under $25,000 | 38 (100.0%) | 0 (0.0%) |
| $25,000 to $49,999 | 78 (75.0%) | 26 (25.0%) |
| $50,000 to $74,999 | 43 (95.6%) | 2 (4.4%) |
| $75,000 to $99,999 | 48 (94.1%) | 3 (5.9%) |
| $100,000 and over | 33 (78.6%) | 9 (21.4%) |
Public vs Private Health Insurance Coverage by Age in Kempton
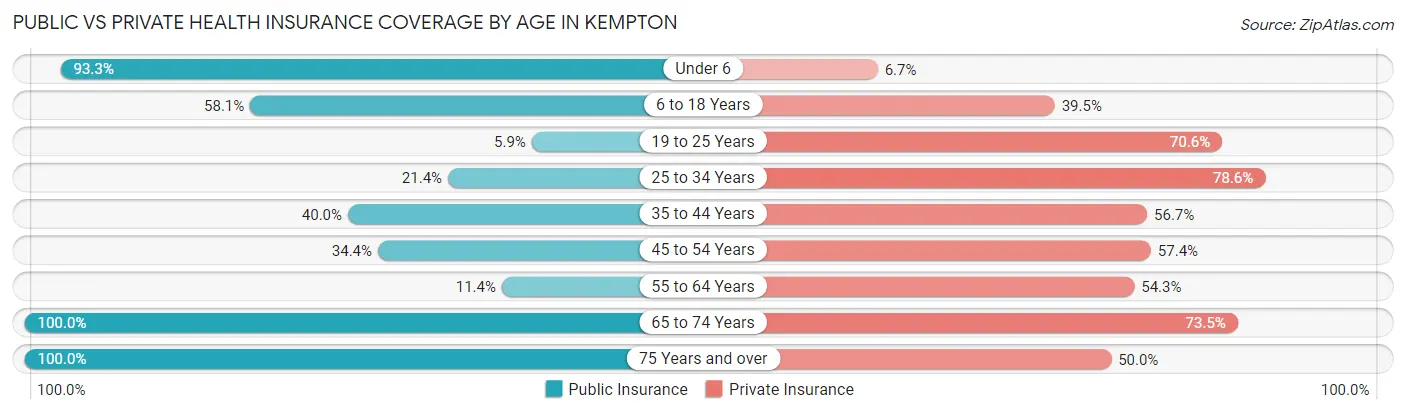
| Age Bracket | Public Insurance | Private Insurance |
| Under 6 | 14 (93.3%) | 1 (6.7%) |
| 6 to 18 Years | 25 (58.1%) | 17 (39.5%) |
| 19 to 25 Years | 1 (5.9%) | 12 (70.6%) |
| 25 to 34 Years | 3 (21.4%) | 11 (78.6%) |
| 35 to 44 Years | 12 (40.0%) | 17 (56.7%) |
| 45 to 54 Years | 21 (34.4%) | 35 (57.4%) |
| 55 to 64 Years | 4 (11.4%) | 19 (54.3%) |
| 65 to 74 Years | 49 (100.0%) | 36 (73.5%) |
| 75 Years and over | 16 (100.0%) | 8 (50.0%) |
| Total | 145 (51.8%) | 156 (55.7%) |
Disability Status by Sex by Age in Kempton
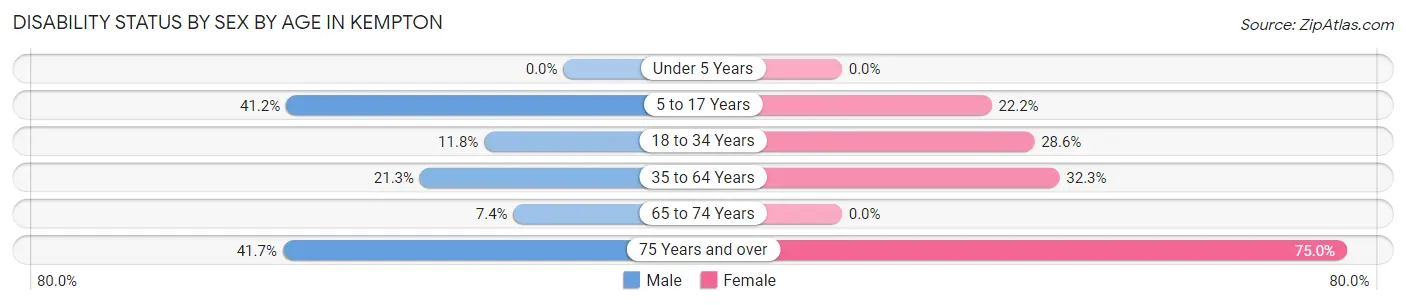
| Age Bracket | Male | Female |
| Under 5 Years | 0 (0.0%) | 0 (0.0%) |
| 5 to 17 Years | 7 (41.2%) | 6 (22.2%) |
| 18 to 34 Years | 2 (11.8%) | 4 (28.6%) |
| 35 to 64 Years | 13 (21.3%) | 21 (32.3%) |
| 65 to 74 Years | 2 (7.4%) | 0 (0.0%) |
| 75 Years and over | 5 (41.7%) | 3 (75.0%) |
Disability Class by Sex by Age in Kempton
Disability Class: Hearing Difficulty
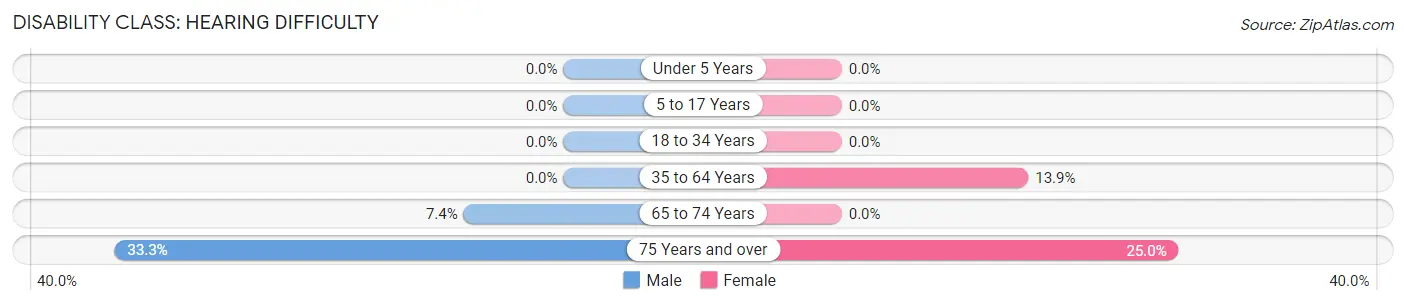
| Age Bracket | Male | Female |
| Under 5 Years | 0 (0.0%) | 0 (0.0%) |
| 5 to 17 Years | 0 (0.0%) | 0 (0.0%) |
| 18 to 34 Years | 0 (0.0%) | 0 (0.0%) |
| 35 to 64 Years | 0 (0.0%) | 9 (13.9%) |
| 65 to 74 Years | 2 (7.4%) | 0 (0.0%) |
| 75 Years and over | 4 (33.3%) | 1 (25.0%) |
Disability Class: Vision Difficulty
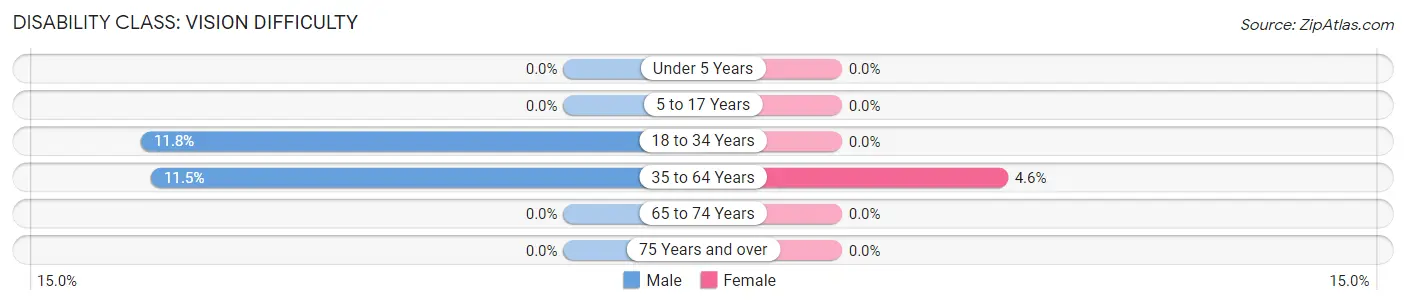
| Age Bracket | Male | Female |
| Under 5 Years | 0 (0.0%) | 0 (0.0%) |
| 5 to 17 Years | 0 (0.0%) | 0 (0.0%) |
| 18 to 34 Years | 2 (11.8%) | 0 (0.0%) |
| 35 to 64 Years | 7 (11.5%) | 3 (4.6%) |
| 65 to 74 Years | 0 (0.0%) | 0 (0.0%) |
| 75 Years and over | 0 (0.0%) | 0 (0.0%) |
Disability Class: Cognitive Difficulty
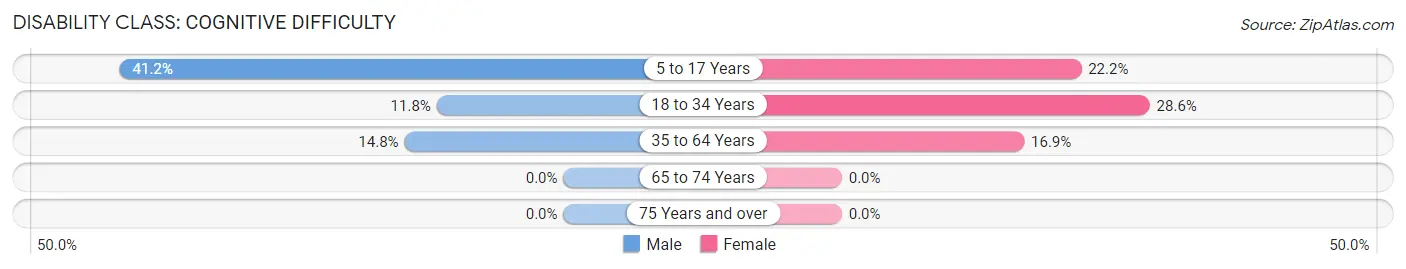
| Age Bracket | Male | Female |
| 5 to 17 Years | 7 (41.2%) | 6 (22.2%) |
| 18 to 34 Years | 2 (11.8%) | 4 (28.6%) |
| 35 to 64 Years | 9 (14.7%) | 11 (16.9%) |
| 65 to 74 Years | 0 (0.0%) | 0 (0.0%) |
| 75 Years and over | 0 (0.0%) | 0 (0.0%) |
Disability Class: Ambulatory Difficulty
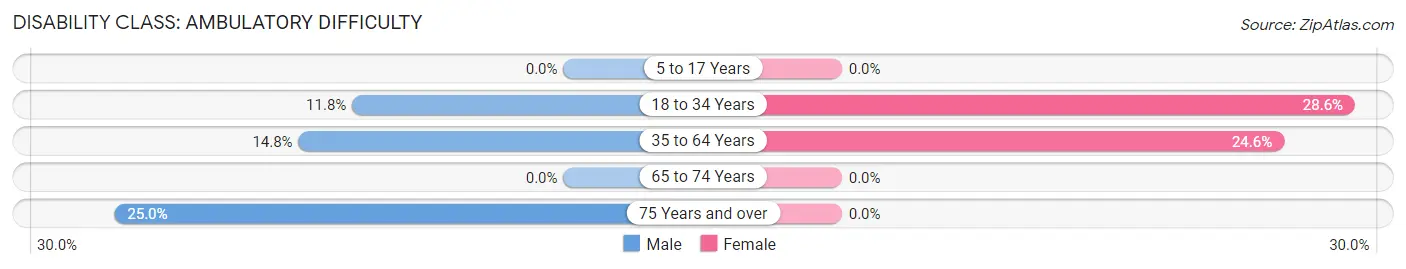
| Age Bracket | Male | Female |
| 5 to 17 Years | 0 (0.0%) | 0 (0.0%) |
| 18 to 34 Years | 2 (11.8%) | 4 (28.6%) |
| 35 to 64 Years | 9 (14.7%) | 16 (24.6%) |
| 65 to 74 Years | 0 (0.0%) | 0 (0.0%) |
| 75 Years and over | 3 (25.0%) | 0 (0.0%) |
Disability Class: Self-Care Difficulty
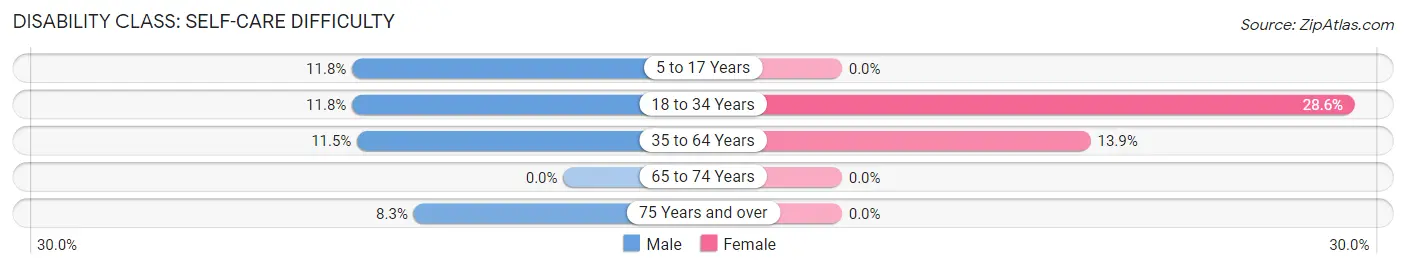
| Age Bracket | Male | Female |
| 5 to 17 Years | 2 (11.8%) | 0 (0.0%) |
| 18 to 34 Years | 2 (11.8%) | 4 (28.6%) |
| 35 to 64 Years | 7 (11.5%) | 9 (13.9%) |
| 65 to 74 Years | 0 (0.0%) | 0 (0.0%) |
| 75 Years and over | 1 (8.3%) | 0 (0.0%) |
Technology Access in Kempton
Computing Device Access in Kempton
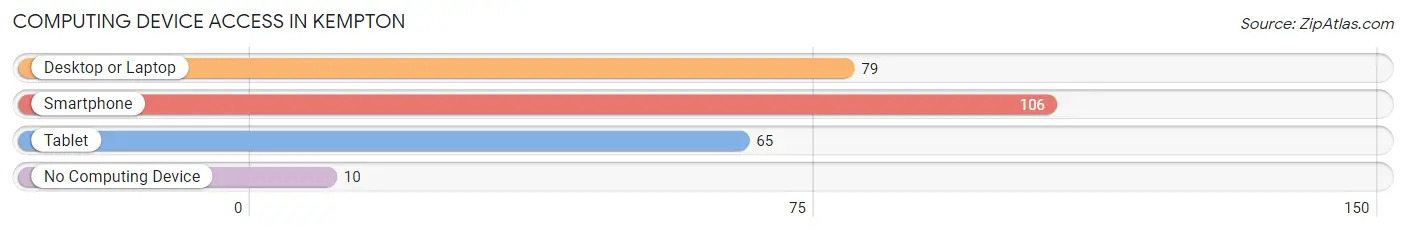
| Device Type | # Households | % Households |
| Desktop or Laptop | 79 | 66.4% |
| Smartphone | 106 | 89.1% |
| Tablet | 65 | 54.6% |
| No Computing Device | 10 | 8.4% |
| Total | 119 | 100.0% |
Internet Access in Kempton
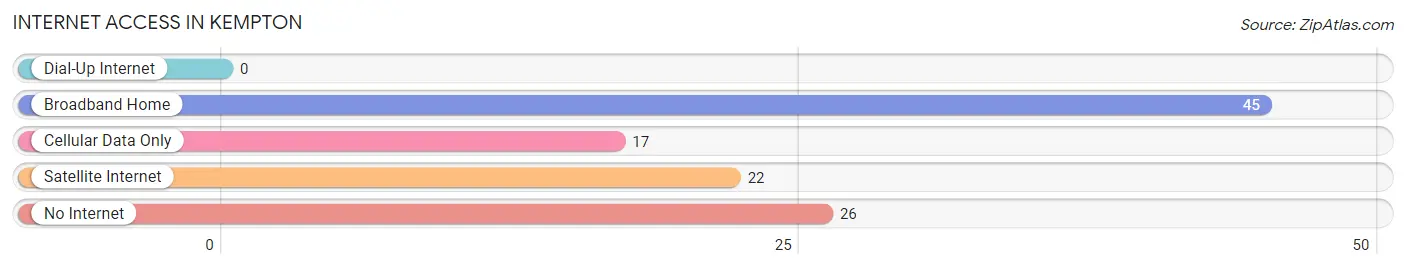
| Internet Type | # Households | % Households |
| Dial-Up Internet | 0 | 0.0% |
| Broadband Home | 45 | 37.8% |
| Cellular Data Only | 17 | 14.3% |
| Satellite Internet | 22 | 18.5% |
| No Internet | 26 | 21.8% |
| Total | 119 | 100.0% |
Kempton Summary
Kempton is a small town located in Tipton County, Indiana, United States. It is situated in the northwest corner of the state, approximately 40 miles north of Indianapolis. The population of Kempton was estimated to be 1,093 in 2019.
History
Kempton was founded in 1837 by a group of settlers from Ohio. The town was named after the Kempton family, who were among the first settlers. The town was originally known as Kemptonville, but the name was changed to Kempton in 1851.
The first post office in Kempton was established in 1838 The town was incorporated in 1867
Kempton was a major stop on the Indianapolis and Cincinnati Railroad, which ran through the town from 1853 to 1871. The railroad brought many new settlers to the area, and the town grew rapidly.
In the late 19th century, Kempton was a thriving agricultural community. The town was home to several grain elevators, a flour mill, a sawmill, and a brickyard.
Geography
Kempton is located in the northwest corner of Tipton County, Indiana. It is situated at the intersection of State Road 19 and State Road 28. The town is approximately 40 miles north of Indianapolis.
The town is situated on the banks of the Wildcat Creek, which flows through the town. The creek is a tributary of the Wabash River.
The town is located in a rural area, with rolling hills and farmland. The surrounding area is mostly agricultural, with corn and soybean fields.
Economy
Kempton is a small, rural town with a limited economy. The town is home to several small businesses, including a grocery store, a hardware store, and a few restaurants.
The town is also home to several manufacturing companies, including a plastics manufacturer and a metal fabrication company.
The town is also home to a few farms which produce corn soybeans and other crops
Demographics
Kempton is a small, rural town with a population of 1,093 in 2019. The town is predominantly white, with a small African American population.
The median household income in Kempton is $45,000, and the median home value is $90,000. The town has a poverty rate of 16.3%, which is higher than the national average.
Conclusion
Kempton is a small, rural town located in Tipton County, Indiana. The town was founded in 1837 and has a population of 1,093. The town is situated on the banks of the Wildcat Creek and is home to several small businesses and manufacturing companies. The median household income in Kempton is $45,000, and the median home value is $90,000. The town has a poverty rate of 16.3%, which is higher than the national average.
Common Questions
What is Per Capita Income in Kempton?
Per Capita income in Kempton is $24,943.
What is the Median Family Income in Kempton?
Median Family Income in Kempton is $44,609.
What is the Median Household income in Kempton?
Median Household Income in Kempton is $44,323.
What is Income or Wage Gap in Kempton?
Income or Wage Gap in Kempton is 40.5%.
Women in Kempton earn 59.5 cents for every dollar earned by a man.
What is Inequality or Gini Index in Kempton?
Inequality or Gini Index in Kempton is 0.34.
What is the Total Population of Kempton?
Total Population of Kempton is 280.
What is the Total Male Population of Kempton?
Total Male Population of Kempton is 140.
What is the Total Female Population of Kempton?
Total Female Population of Kempton is 140.
What is the Ratio of Males per 100 Females in Kempton?
There are 100.00 Males per 100 Females in Kempton.
What is the Ratio of Females per 100 Males in Kempton?
There are 100.00 Females per 100 Males in Kempton.
What is the Median Population Age in Kempton?
Median Population Age in Kempton is 50.3 Years.
What is the Average Family Size in Kempton
Average Family Size in Kempton is 2.6 People.
What is the Average Household Size in Kempton
Average Household Size in Kempton is 2.4 People.
How Large is the Labor Force in Kempton?
There are 107 People in the Labor Forcein in Kempton.
What is the Percentage of People in the Labor Force in Kempton?
46.9% of People are in the Labor Force in Kempton.
What is the Unemployment Rate in Kempton?
Unemployment Rate in Kempton is 1.9%.