Burtonsville, MD Map & Demographics
Burtonsville Map
Burtonsville Overview
$48,711
PER CAPITA INCOME
$147,222
AVG FAMILY INCOME
$138,416
AVG HOUSEHOLD INCOME
28.6%
WAGE / INCOME GAP [ % ]
71.4¢/ $1
WAGE / INCOME GAP [ $ ]
0.35
INEQUALITY / GINI INDEX
10,316
TOTAL POPULATION
5,532
MALE POPULATION
4,784
FEMALE POPULATION
115.64
MALES / 100 FEMALES
86.48
FEMALES / 100 MALES
38.3
MEDIAN AGE
3.6
AVG FAMILY SIZE
3.3
AVG HOUSEHOLD SIZE
6,258
LABOR FORCE [ PEOPLE ]
76.2%
PERCENT IN LABOR FORCE
4.5%
UNEMPLOYMENT RATE
Burtonsville Zip Codes
Burtonsville Area Codes
Income in Burtonsville
Income Overview in Burtonsville
Per Capita Income in Burtonsville is $48,711, while median incomes of families and households are $147,222 and $138,416 respectively.
| Characteristic | Number | Measure |
| Per Capita Income | 10,316 | $48,711 |
| Median Family Income | 2,608 | $147,222 |
| Mean Family Income | 2,608 | $164,436 |
| Median Household Income | 3,082 | $138,416 |
| Mean Household Income | 3,082 | $159,953 |
| Income Deficit | 2,608 | $0 |
| Wage / Income Gap (%) | 10,316 | 28.56% |
| Wage / Income Gap ($) | 10,316 | 71.44¢ per $1 |
| Gini / Inequality Index | 10,316 | 0.35 |
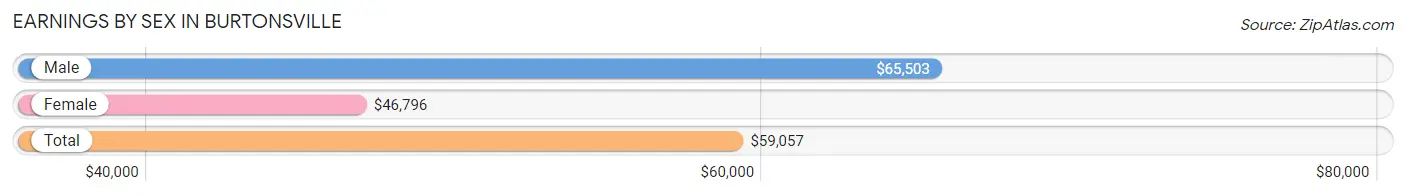
Earnings by Sex in Burtonsville
Average Earnings in Burtonsville are $59,057, $65,503 for men and $46,796 for women, a difference of 28.6%.
| Sex | Number | Average Earnings |
| Male | 3,546 (54.7%) | $65,503 |
| Female | 2,941 (45.3%) | $46,796 |
| Total | 6,487 (100.0%) | $59,057 |
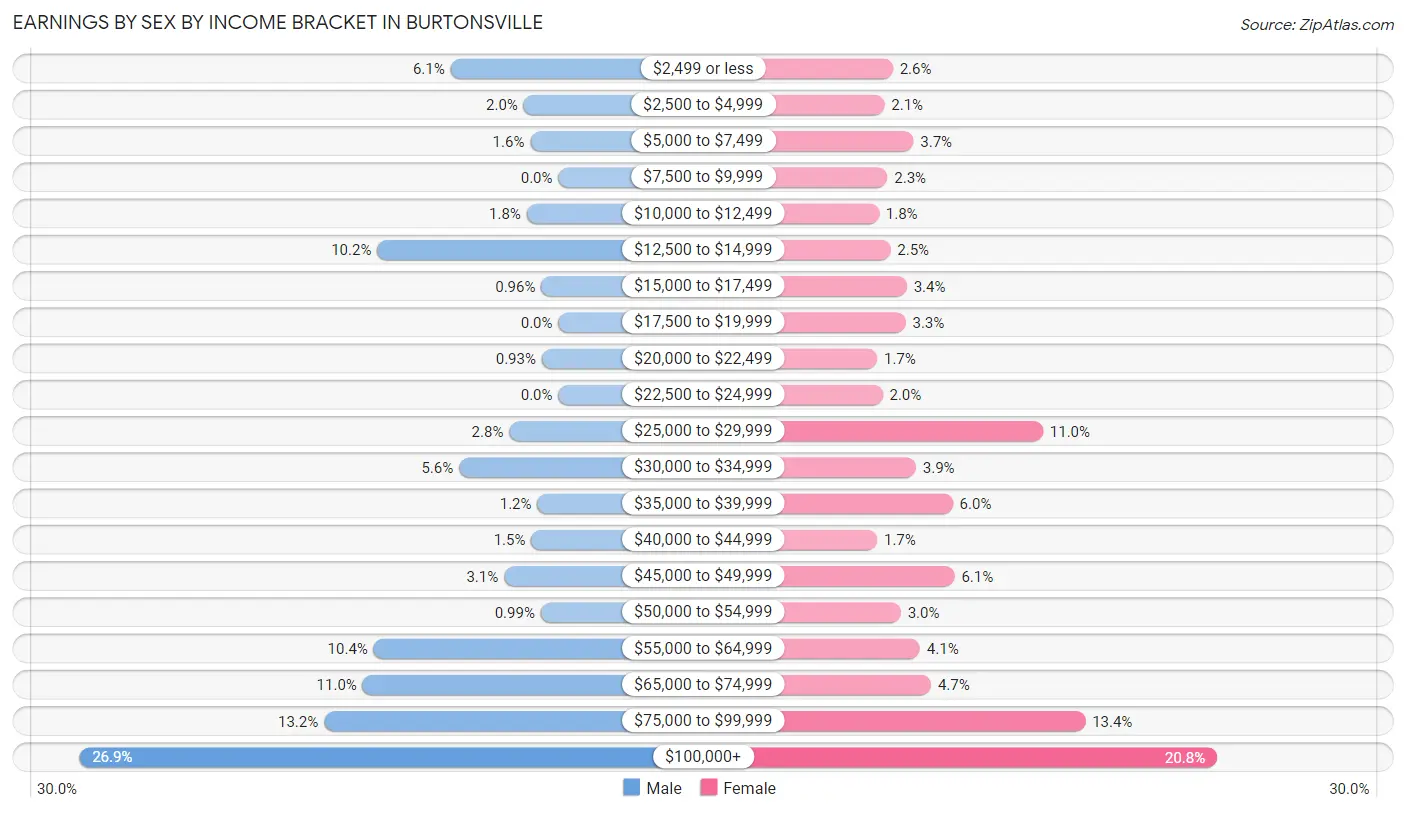
Earnings by Sex by Income Bracket in Burtonsville
The most common earnings brackets in Burtonsville are $100,000+ for men (955 | 26.9%) and $100,000+ for women (612 | 20.8%).
| Income | Male | Female |
| $2,499 or less | 215 (6.1%) | 76 (2.6%) |
| $2,500 to $4,999 | 69 (1.9%) | 62 (2.1%) |
| $5,000 to $7,499 | 56 (1.6%) | 110 (3.7%) |
| $7,500 to $9,999 | 0 (0.0%) | 67 (2.3%) |
| $10,000 to $12,499 | 63 (1.8%) | 53 (1.8%) |
| $12,500 to $14,999 | 361 (10.2%) | 72 (2.5%) |
| $15,000 to $17,499 | 34 (1.0%) | 99 (3.4%) |
| $17,500 to $19,999 | 0 (0.0%) | 97 (3.3%) |
| $20,000 to $22,499 | 33 (0.9%) | 50 (1.7%) |
| $22,500 to $24,999 | 0 (0.0%) | 59 (2.0%) |
| $25,000 to $29,999 | 98 (2.8%) | 324 (11.0%) |
| $30,000 to $34,999 | 198 (5.6%) | 114 (3.9%) |
| $35,000 to $39,999 | 42 (1.2%) | 175 (5.9%) |
| $40,000 to $44,999 | 54 (1.5%) | 50 (1.7%) |
| $45,000 to $49,999 | 108 (3.0%) | 178 (6.0%) |
| $50,000 to $54,999 | 35 (1.0%) | 89 (3.0%) |
| $55,000 to $64,999 | 368 (10.4%) | 121 (4.1%) |
| $65,000 to $74,999 | 390 (11.0%) | 139 (4.7%) |
| $75,000 to $99,999 | 467 (13.2%) | 394 (13.4%) |
| $100,000+ | 955 (26.9%) | 612 (20.8%) |
| Total | 3,546 (100.0%) | 2,941 (100.0%) |
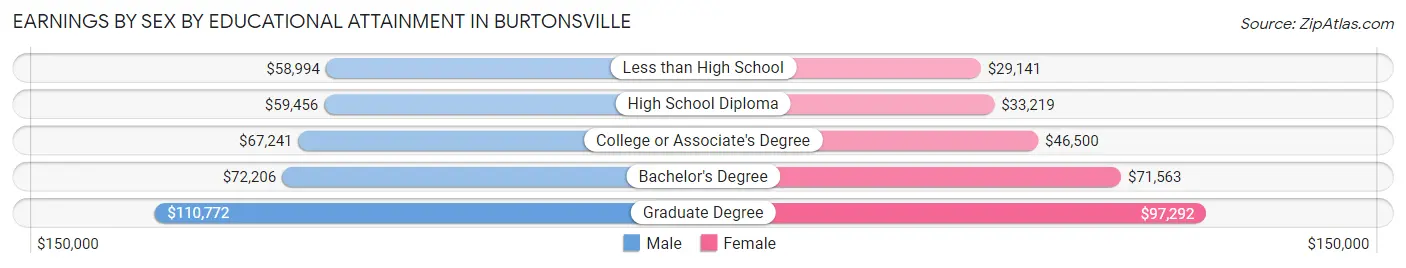
Earnings by Sex by Educational Attainment in Burtonsville
Average earnings in Burtonsville are $68,388 for men and $49,821 for women, a difference of 27.2%. Men with an educational attainment of graduate degree enjoy the highest average annual earnings of $110,772, while those with less than high school education earn the least with $58,994. Women with an educational attainment of graduate degree earn the most with the average annual earnings of $97,292, while those with less than high school education have the smallest earnings of $29,141.
| Educational Attainment | Male Income | Female Income |
| Less than High School | $58,994 | $29,141 |
| High School Diploma | $59,456 | $33,219 |
| College or Associate's Degree | $67,241 | $46,500 |
| Bachelor's Degree | $72,206 | $71,563 |
| Graduate Degree | $110,772 | $97,292 |
| Total | $68,388 | $49,821 |
Family Income in Burtonsville
Family Income Brackets in Burtonsville
According to the Burtonsville family income data, there are 642 families falling into the $100,000 to $149,999 income range, which is the most common income bracket and makes up 24.6% of all families. Conversely, the less than $10,000 income bracket is the least frequent group with only 5 families (0.2%) belonging to this category.
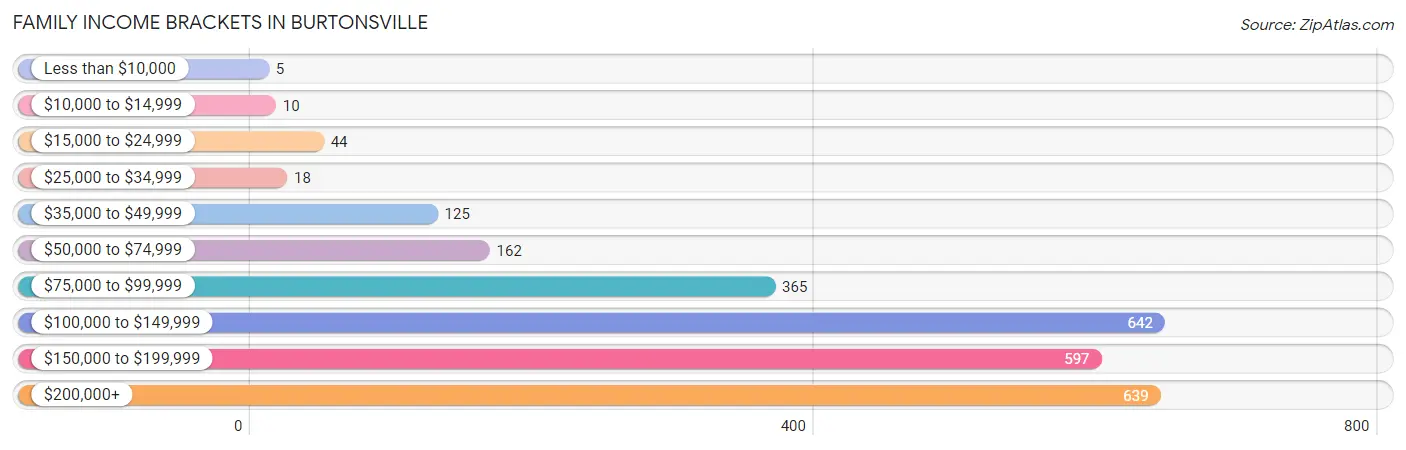
| Income Bracket | # Families | % Families |
| Less than $10,000 | 5 | 0.2% |
| $10,000 to $14,999 | 10 | 0.4% |
| $15,000 to $24,999 | 44 | 1.7% |
| $25,000 to $34,999 | 18 | 0.7% |
| $35,000 to $49,999 | 125 | 4.8% |
| $50,000 to $74,999 | 162 | 6.2% |
| $75,000 to $99,999 | 365 | 14.0% |
| $100,000 to $149,999 | 642 | 24.6% |
| $150,000 to $199,999 | 597 | 22.9% |
| $200,000+ | 639 | 24.5% |
Family Income by Famaliy Size in Burtonsville
6-person families (113 | 4.3%) account for the highest median family income in Burtonsville with $222,019 per family, while 3-person families (539 | 20.7%) have the highest median income of $60,020 per family member.
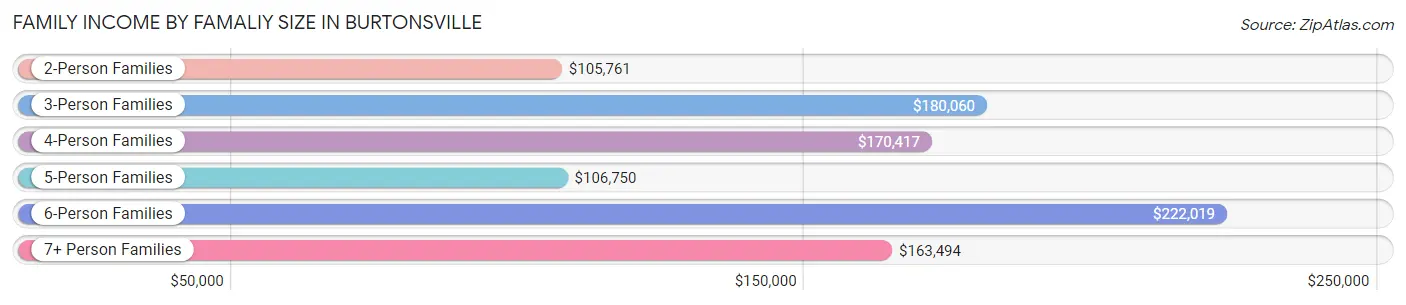
| Income Bracket | # Families | Median Income |
| 2-Person Families | 806 (30.9%) | $105,761 |
| 3-Person Families | 539 (20.7%) | $180,060 |
| 4-Person Families | 875 (33.6%) | $170,417 |
| 5-Person Families | 163 (6.2%) | $106,750 |
| 6-Person Families | 113 (4.3%) | $222,019 |
| 7+ Person Families | 112 (4.3%) | $163,494 |
| Total | 2,608 (100.0%) | $147,222 |
Family Income by Number of Earners in Burtonsville
The median family income in Burtonsville is $147,222, with families comprising 3+ earners (708) having the highest median family income of $192,000, while families with no earners (153) have the lowest median family income of $85,855, accounting for 27.2% and 5.9% of families, respectively.
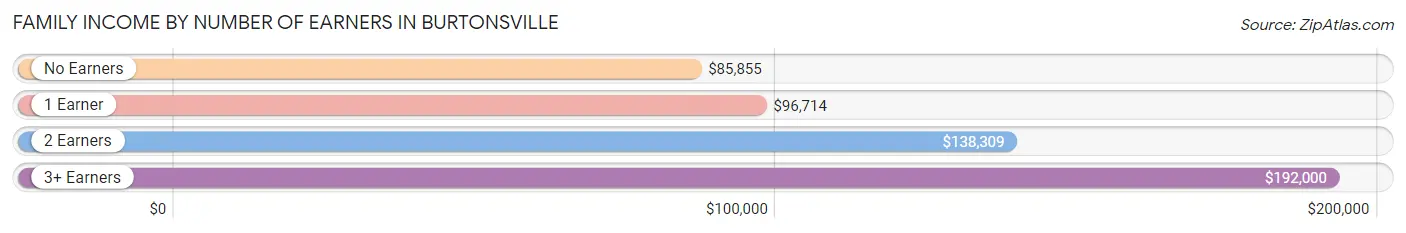
| Number of Earners | # Families | Median Income |
| No Earners | 153 (5.9%) | $85,855 |
| 1 Earner | 587 (22.5%) | $96,714 |
| 2 Earners | 1,160 (44.5%) | $138,309 |
| 3+ Earners | 708 (27.2%) | $192,000 |
| Total | 2,608 (100.0%) | $147,222 |
Household Income in Burtonsville
Household Income Brackets in Burtonsville
With 774 households falling in the category, the $200,000+ income range is the most frequent in Burtonsville, accounting for 25.1% of all households. In contrast, only 18 households (0.6%) fall into the $25,000 to $34,999 income bracket, making it the least populous group.
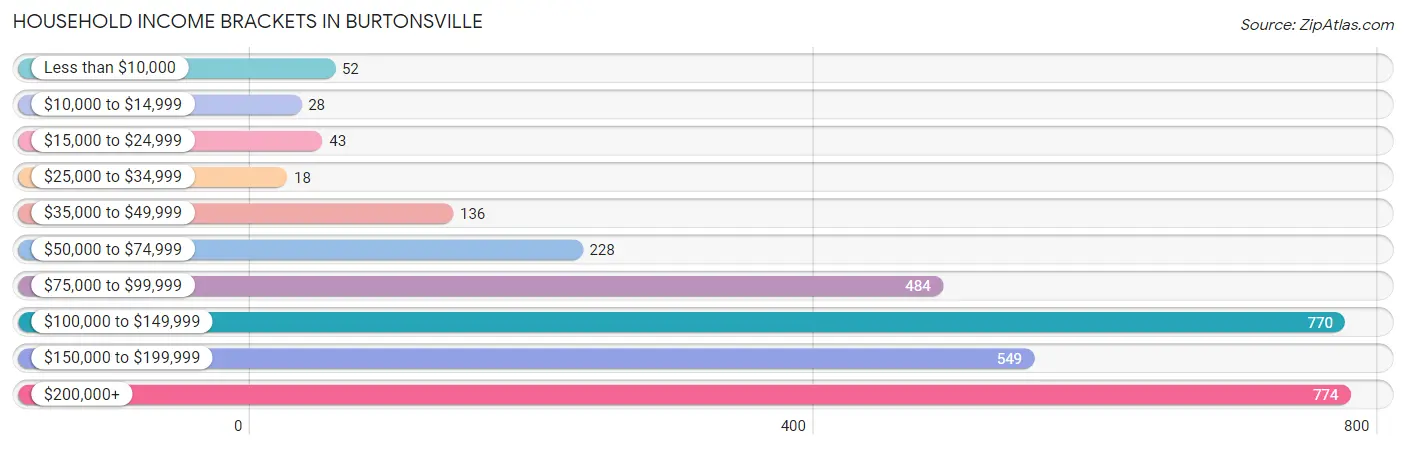
| Income Bracket | # Households | % Households |
| Less than $10,000 | 52 | 1.7% |
| $10,000 to $14,999 | 28 | 0.9% |
| $15,000 to $24,999 | 43 | 1.4% |
| $25,000 to $34,999 | 18 | 0.6% |
| $35,000 to $49,999 | 136 | 4.4% |
| $50,000 to $74,999 | 228 | 7.4% |
| $75,000 to $99,999 | 484 | 15.7% |
| $100,000 to $149,999 | 770 | 25.0% |
| $150,000 to $199,999 | 549 | 17.8% |
| $200,000+ | 774 | 25.1% |
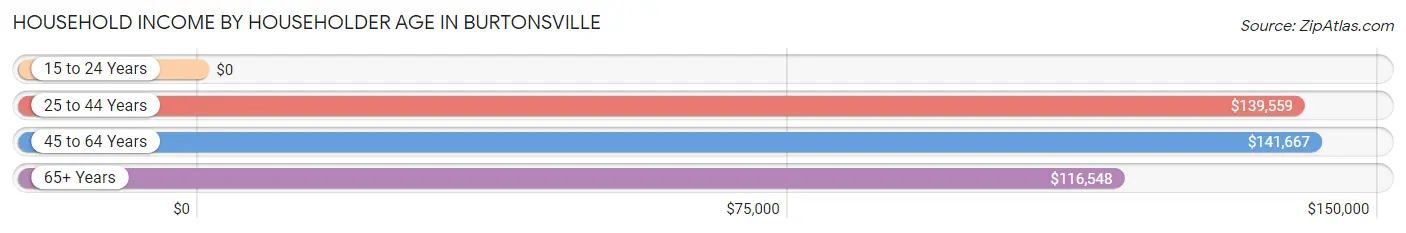
Household Income by Householder Age in Burtonsville
The median household income in Burtonsville is $138,416, with the highest median household income of $141,667 found in the 45 to 64 years age bracket for the primary householder. A total of 1,232 households (40.0%) fall into this category. Meanwhile, the 15 to 24 years age bracket for the primary householder has the lowest median household income of $0, with 74 households (2.4%) in this group.
| Income Bracket | # Households | Median Income |
| 15 to 24 Years | 74 (2.4%) | $0 |
| 25 to 44 Years | 1,242 (40.3%) | $139,559 |
| 45 to 64 Years | 1,232 (40.0%) | $141,667 |
| 65+ Years | 534 (17.3%) | $116,548 |
| Total | 3,082 (100.0%) | $138,416 |
Poverty in Burtonsville
Income Below Poverty by Sex and Age in Burtonsville
With 2.6% poverty level for males and 3.8% for females among the residents of Burtonsville, 18 to 24 year old males and 18 to 24 year old females are the most vulnerable to poverty, with 60 males (11.2%) and 43 females (16.0%) in their respective age groups living below the poverty level.

| Age Bracket | Male | Female |
| Under 5 Years | 0 (0.0%) | 0 (0.0%) |
| 5 Years | 0 (0.0%) | 0 (0.0%) |
| 6 to 11 Years | 0 (0.0%) | 37 (8.5%) |
| 12 to 14 Years | 0 (0.0%) | 0 (0.0%) |
| 15 Years | 0 (0.0%) | 0 (0.0%) |
| 16 and 17 Years | 0 (0.0%) | 0 (0.0%) |
| 18 to 24 Years | 60 (11.2%) | 43 (16.0%) |
| 25 to 34 Years | 0 (0.0%) | 31 (4.9%) |
| 35 to 44 Years | 19 (2.1%) | 16 (1.7%) |
| 45 to 54 Years | 49 (7.1%) | 17 (3.1%) |
| 55 to 64 Years | 0 (0.0%) | 9 (1.1%) |
| 65 to 74 Years | 10 (1.8%) | 13 (3.5%) |
| 75 Years and over | 6 (2.1%) | 18 (10.7%) |
| Total | 144 (2.6%) | 184 (3.8%) |
Income Above Poverty by Sex and Age in Burtonsville
According to the poverty statistics in Burtonsville, males aged under 5 years and females aged under 5 years are the age groups that are most secure financially, with 100.0% of males and 100.0% of females in these age groups living above the poverty line.
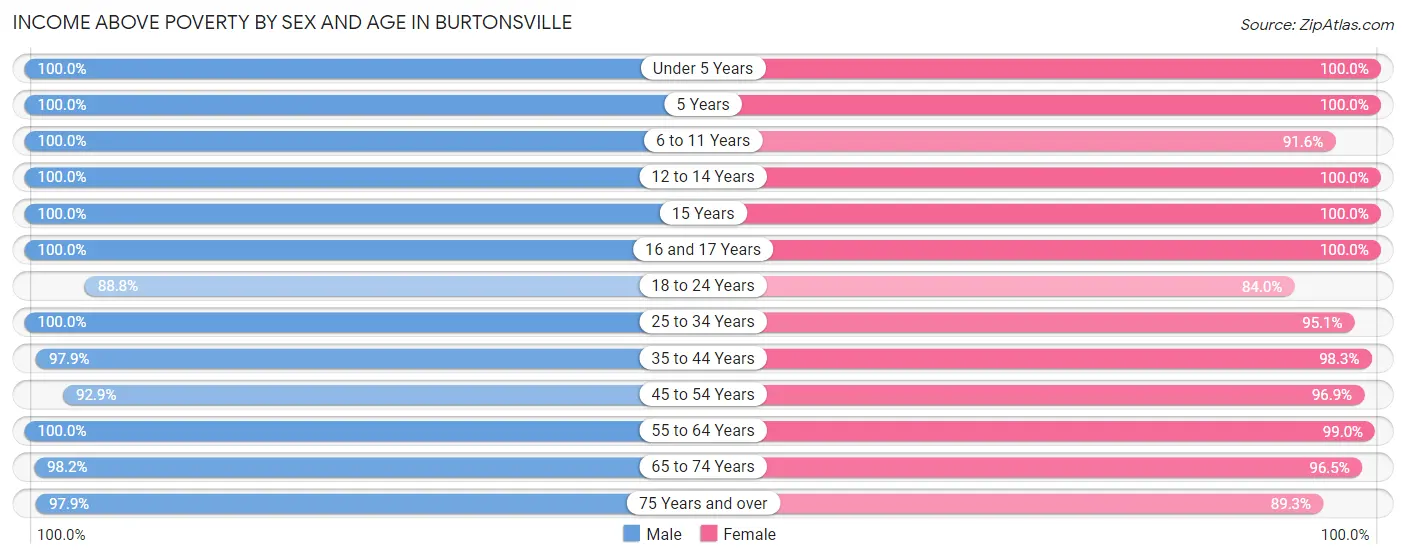
| Age Bracket | Male | Female |
| Under 5 Years | 431 (100.0%) | 186 (100.0%) |
| 5 Years | 23 (100.0%) | 62 (100.0%) |
| 6 to 11 Years | 490 (100.0%) | 401 (91.5%) |
| 12 to 14 Years | 202 (100.0%) | 188 (100.0%) |
| 15 Years | 25 (100.0%) | 14 (100.0%) |
| 16 and 17 Years | 153 (100.0%) | 131 (100.0%) |
| 18 to 24 Years | 476 (88.8%) | 225 (84.0%) |
| 25 to 34 Years | 667 (100.0%) | 604 (95.1%) |
| 35 to 44 Years | 864 (97.9%) | 905 (98.3%) |
| 45 to 54 Years | 637 (92.9%) | 533 (96.9%) |
| 55 to 64 Years | 542 (100.0%) | 847 (99.0%) |
| 65 to 74 Years | 553 (98.2%) | 354 (96.5%) |
| 75 Years and over | 278 (97.9%) | 150 (89.3%) |
| Total | 5,341 (97.4%) | 4,600 (96.2%) |
Income Below Poverty Among Married-Couple Families in Burtonsville
The poverty statistics for married-couple families in Burtonsville show that 1.6% or 35 of the total 2,166 families live below the poverty line. Families with 1 or 2 children have the highest poverty rate of 2.4%, comprising of 19 families. On the other hand, families with 3 or 4 children have the lowest poverty rate of 0.0%, which includes 0 families.
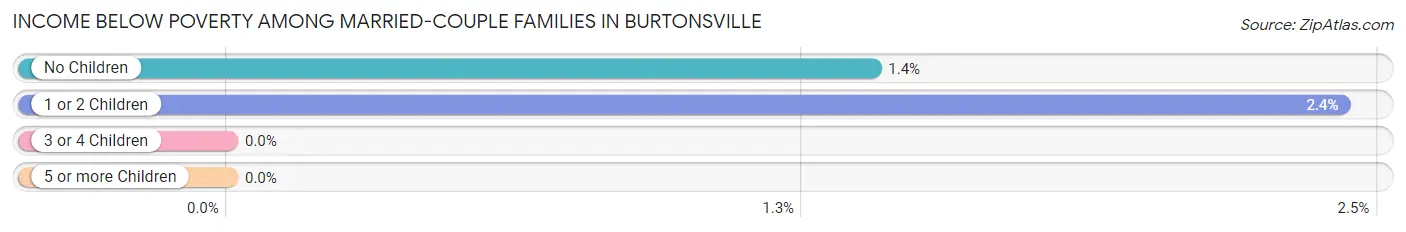
| Children | Above Poverty | Below Poverty |
| No Children | 1,125 (98.6%) | 16 (1.4%) |
| 1 or 2 Children | 766 (97.6%) | 19 (2.4%) |
| 3 or 4 Children | 217 (100.0%) | 0 (0.0%) |
| 5 or more Children | 23 (100.0%) | 0 (0.0%) |
| Total | 2,131 (98.4%) | 35 (1.6%) |
Income Below Poverty Among Single-Parent Households in Burtonsville
According to the poverty data in Burtonsville, 27.4% or 34 single-father households and 3.1% or 10 single-mother households are living below the poverty line. Among single-father households, those with no children have the highest poverty rate, with 34 households (56.7%) experiencing poverty. Likewise, among single-mother households, those with no children have the highest poverty rate, with 10 households (9.8%) falling below the poverty line.
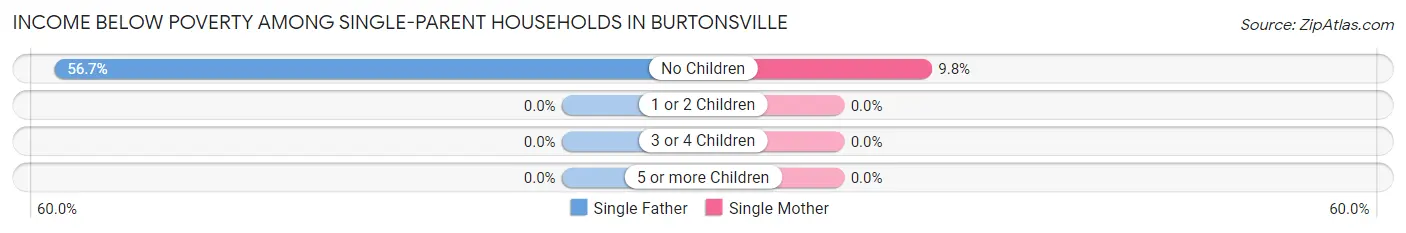
| Children | Single Father | Single Mother |
| No Children | 34 (56.7%) | 10 (9.8%) |
| 1 or 2 Children | 0 (0.0%) | 0 (0.0%) |
| 3 or 4 Children | 0 (0.0%) | 0 (0.0%) |
| 5 or more Children | 0 (0.0%) | 0 (0.0%) |
| Total | 34 (27.4%) | 10 (3.1%) |
Income Below Poverty Among Married-Couple vs Single-Parent Households in Burtonsville
The poverty data for Burtonsville shows that 35 of the married-couple family households (1.6%) and 44 of the single-parent households (10.0%) are living below the poverty level. Within the married-couple family households, those with 1 or 2 children have the highest poverty rate, with 19 households (2.4%) falling below the poverty line. Among the single-parent households, those with no children have the highest poverty rate, with 44 household (27.2%) living below poverty.
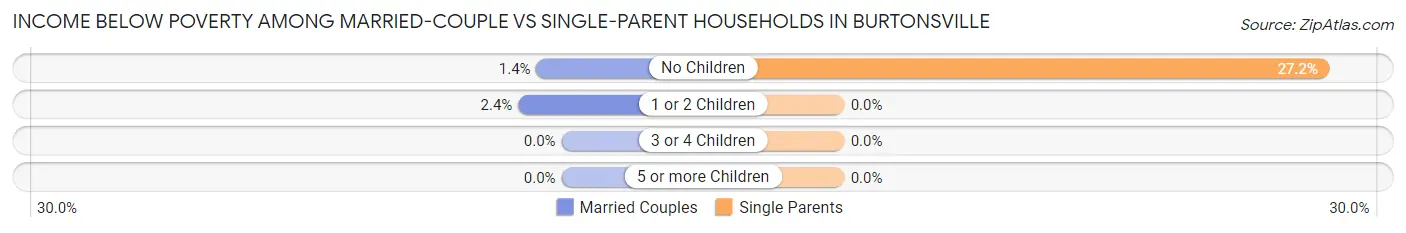
| Children | Married-Couple Families | Single-Parent Households |
| No Children | 16 (1.4%) | 44 (27.2%) |
| 1 or 2 Children | 19 (2.4%) | 0 (0.0%) |
| 3 or 4 Children | 0 (0.0%) | 0 (0.0%) |
| 5 or more Children | 0 (0.0%) | 0 (0.0%) |
| Total | 35 (1.6%) | 44 (10.0%) |
Race in Burtonsville
The most populous races in Burtonsville are Black / African American (3,865 | 37.5%), Asian (2,639 | 25.6%), and White / Caucasian (2,546 | 24.7%).
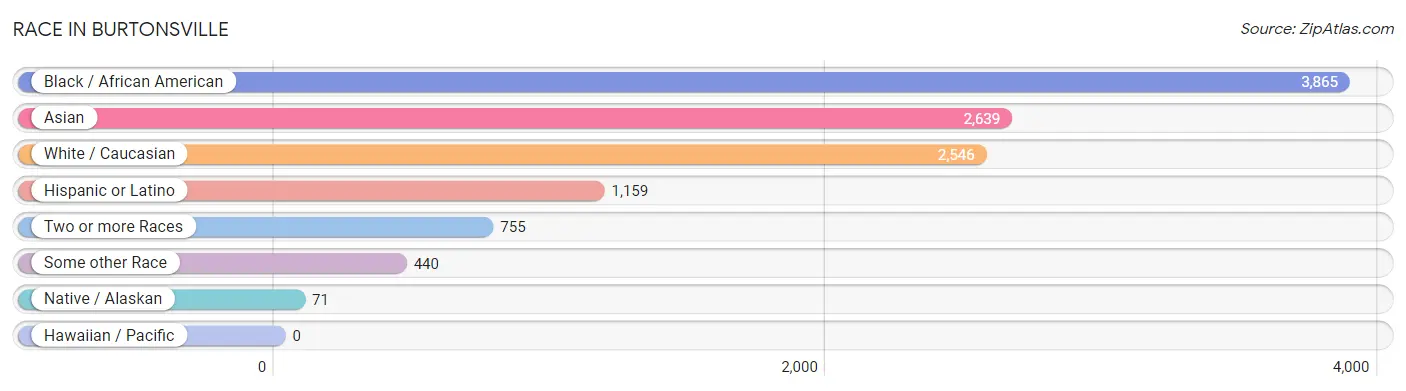
| Race | # Population | % Population |
| Asian | 2,639 | 25.6% |
| Black / African American | 3,865 | 37.5% |
| Hawaiian / Pacific | 0 | 0.0% |
| Hispanic or Latino | 1,159 | 11.2% |
| Native / Alaskan | 71 | 0.7% |
| White / Caucasian | 2,546 | 24.7% |
| Two or more Races | 755 | 7.3% |
| Some other Race | 440 | 4.3% |
| Total | 10,316 | 100.0% |
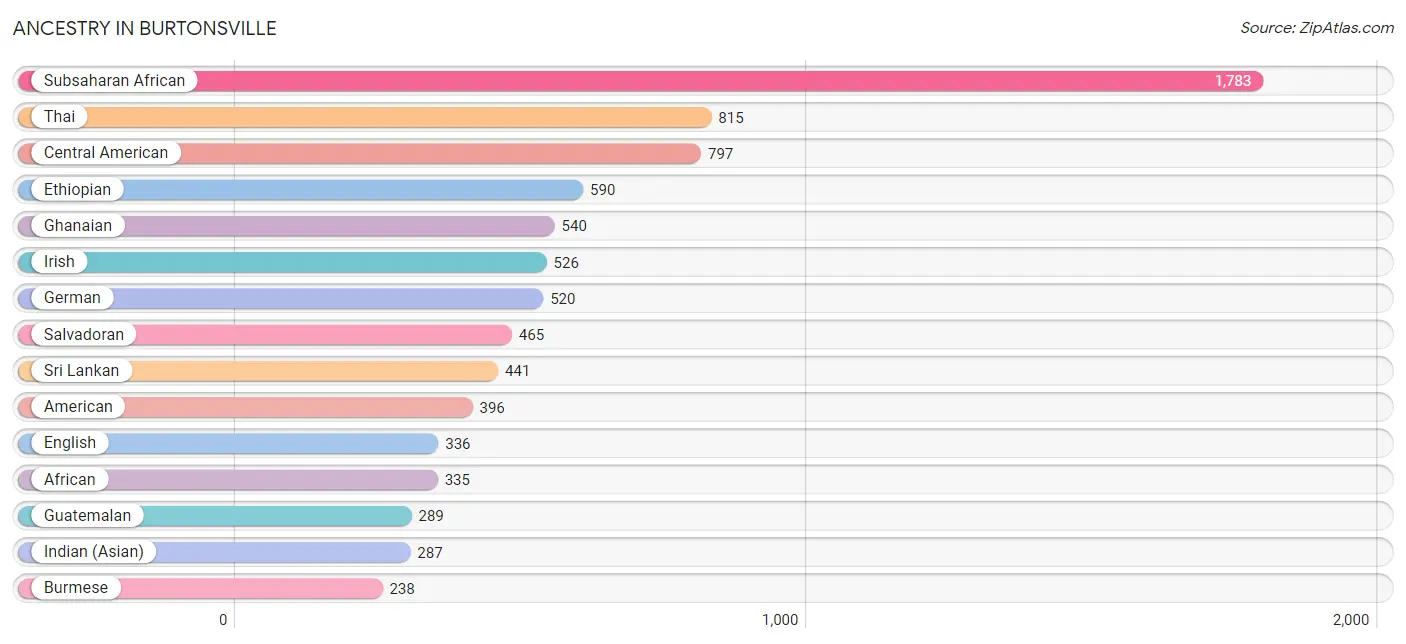
Ancestry in Burtonsville
The most populous ancestries reported in Burtonsville are Subsaharan African (1,783 | 17.3%), Thai (815 | 7.9%), Central American (797 | 7.7%), Ethiopian (590 | 5.7%), and Ghanaian (540 | 5.2%), together accounting for 43.9% of all Burtonsville residents.
| Ancestry | # Population | % Population |
| Afghan | 4 | 0.0% |
| African | 335 | 3.3% |
| American | 396 | 3.8% |
| Arab | 54 | 0.5% |
| Austrian | 6 | 0.1% |
| Barbadian | 24 | 0.2% |
| Belizean | 90 | 0.9% |
| Bhutanese | 9 | 0.1% |
| Bolivian | 21 | 0.2% |
| British | 103 | 1.0% |
| British West Indian | 8 | 0.1% |
| Burmese | 238 | 2.3% |
| Central American | 797 | 7.7% |
| Cherokee | 62 | 0.6% |
| Costa Rican | 43 | 0.4% |
| Cuban | 17 | 0.2% |
| Danish | 15 | 0.2% |
| Dutch | 22 | 0.2% |
| Eastern European | 17 | 0.2% |
| Ecuadorian | 77 | 0.7% |
| English | 336 | 3.3% |
| Ethiopian | 590 | 5.7% |
| European | 63 | 0.6% |
| Filipino | 1 | 0.0% |
| Finnish | 11 | 0.1% |
| French | 105 | 1.0% |
| German | 520 | 5.0% |
| Ghanaian | 540 | 5.2% |
| Guatemalan | 289 | 2.8% |
| Haitian | 23 | 0.2% |
| Hungarian | 12 | 0.1% |
| Indian (Asian) | 287 | 2.8% |
| Irish | 526 | 5.1% |
| Italian | 118 | 1.1% |
| Jamaican | 59 | 0.6% |
| Japanese | 8 | 0.1% |
| Korean | 180 | 1.7% |
| Lithuanian | 86 | 0.8% |
| Mexican | 8 | 0.1% |
| Mexican American Indian | 16 | 0.2% |
| Nigerian | 71 | 0.7% |
| Norwegian | 25 | 0.2% |
| Polish | 211 | 2.1% |
| Puerto Rican | 173 | 1.7% |
| Russian | 151 | 1.5% |
| Salvadoran | 465 | 4.5% |
| Scotch-Irish | 17 | 0.2% |
| Scottish | 11 | 0.1% |
| Senegalese | 58 | 0.6% |
| Slovak | 10 | 0.1% |
| South American | 98 | 0.9% |
| Spaniard | 6 | 0.1% |
| Sri Lankan | 441 | 4.3% |
| Subsaharan African | 1,783 | 17.3% |
| Thai | 815 | 7.9% |
| Ukrainian | 12 | 0.1% |
| Vietnamese | 24 | 0.2% |
| Welsh | 18 | 0.2% | View All 58 Rows |
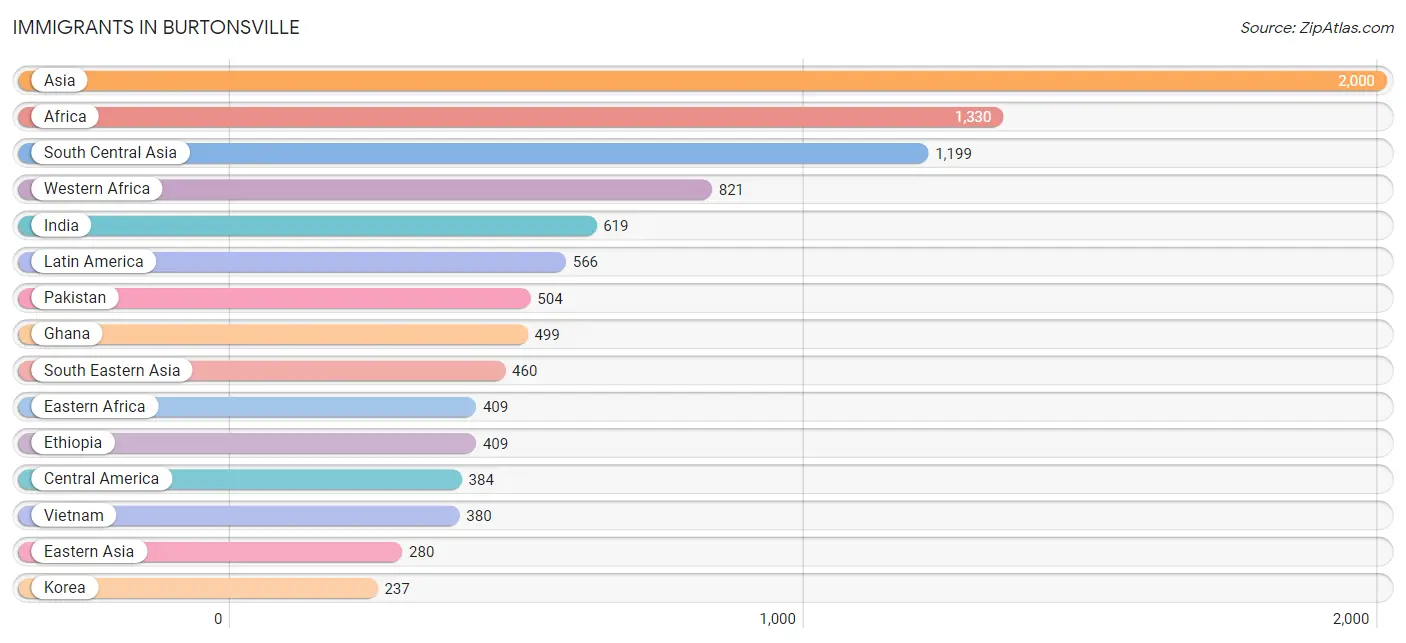
Immigrants in Burtonsville
The most numerous immigrant groups reported in Burtonsville came from Asia (2,000 | 19.4%), Africa (1,330 | 12.9%), South Central Asia (1,199 | 11.6%), Western Africa (821 | 8.0%), and India (619 | 6.0%), together accounting for 57.9% of all Burtonsville residents.
| Immigration Origin | # Population | % Population |
| Afghanistan | 2 | 0.0% |
| Africa | 1,330 | 12.9% |
| Asia | 2,000 | 19.4% |
| Bangladesh | 16 | 0.2% |
| Belize | 57 | 0.5% |
| Bolivia | 10 | 0.1% |
| Cameroon | 90 | 0.9% |
| Caribbean | 80 | 0.8% |
| Central America | 384 | 3.7% |
| China | 43 | 0.4% |
| Colombia | 15 | 0.2% |
| Costa Rica | 43 | 0.4% |
| Eastern Africa | 409 | 4.0% |
| Eastern Asia | 280 | 2.7% |
| Eastern Europe | 67 | 0.6% |
| Ecuador | 77 | 0.7% |
| El Salvador | 178 | 1.7% |
| England | 23 | 0.2% |
| Ethiopia | 409 | 4.0% |
| Europe | 180 | 1.7% |
| France | 84 | 0.8% |
| Ghana | 499 | 4.8% |
| Guatemala | 98 | 0.9% |
| Haiti | 49 | 0.5% |
| India | 619 | 6.0% |
| Jamaica | 31 | 0.3% |
| Korea | 237 | 2.3% |
| Latin America | 566 | 5.5% |
| Liberia | 10 | 0.1% |
| Malaysia | 33 | 0.3% |
| Mexico | 8 | 0.1% |
| Middle Africa | 90 | 0.9% |
| Morocco | 10 | 0.1% |
| Nepal | 58 | 0.6% |
| Nigeria | 43 | 0.4% |
| Northern Africa | 10 | 0.1% |
| Northern Europe | 23 | 0.2% |
| Pakistan | 504 | 4.9% |
| Philippines | 47 | 0.5% |
| Poland | 9 | 0.1% |
| Russia | 58 | 0.6% |
| Senegal | 28 | 0.3% |
| Sierra Leone | 47 | 0.5% |
| South America | 102 | 1.0% |
| South Central Asia | 1,199 | 11.6% |
| South Eastern Asia | 460 | 4.5% |
| Southern Europe | 6 | 0.1% |
| Spain | 6 | 0.1% |
| Taiwan | 1 | 0.0% |
| Vietnam | 380 | 3.7% |
| Western Africa | 821 | 8.0% |
| Western Asia | 43 | 0.4% |
| Western Europe | 84 | 0.8% |
| Yemen | 43 | 0.4% | View All 54 Rows |
Sex and Age in Burtonsville
Sex and Age in Burtonsville
The most populous age groups in Burtonsville are 15 to 19 Years (510 | 9.2%) for men and 60 to 64 Years (619 | 12.9%) for women.
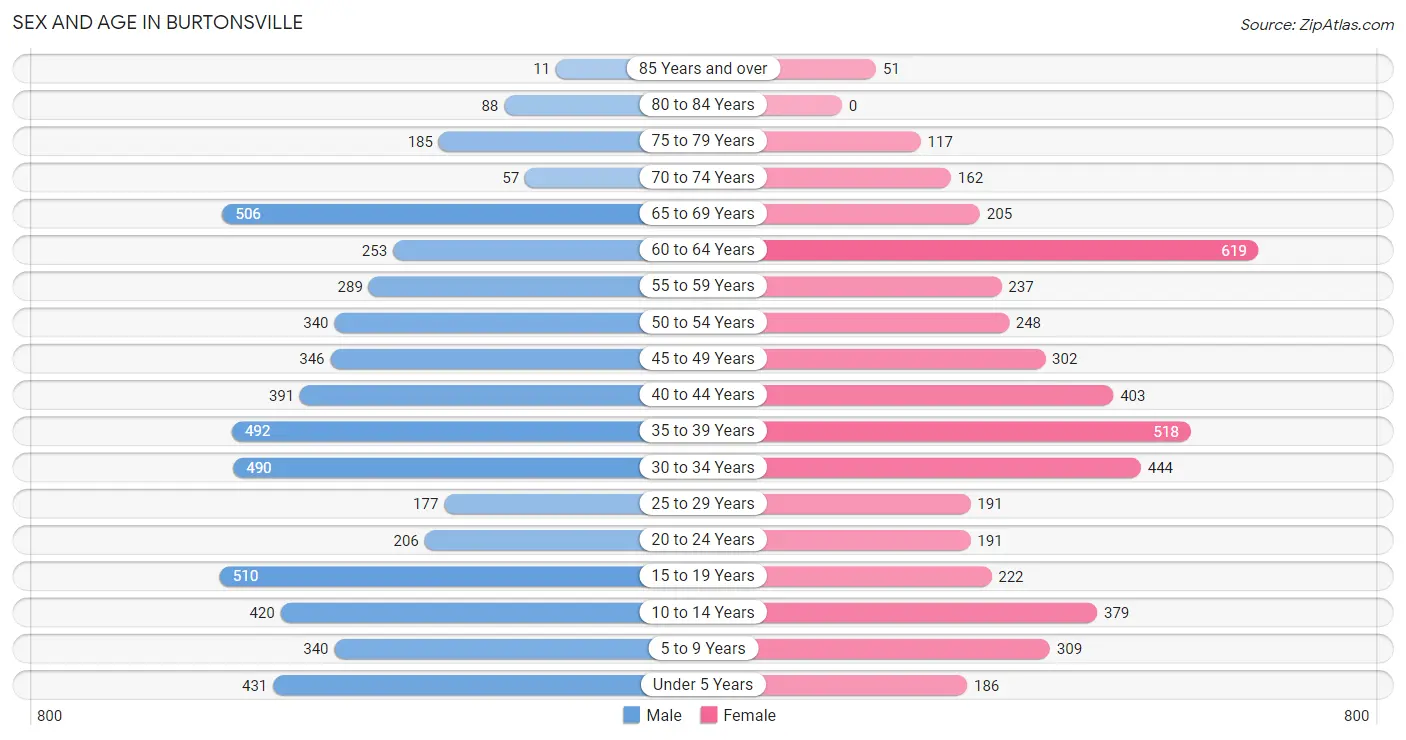
| Age Bracket | Male | Female |
| Under 5 Years | 431 (7.8%) | 186 (3.9%) |
| 5 to 9 Years | 340 (6.1%) | 309 (6.5%) |
| 10 to 14 Years | 420 (7.6%) | 379 (7.9%) |
| 15 to 19 Years | 510 (9.2%) | 222 (4.6%) |
| 20 to 24 Years | 206 (3.7%) | 191 (4.0%) |
| 25 to 29 Years | 177 (3.2%) | 191 (4.0%) |
| 30 to 34 Years | 490 (8.9%) | 444 (9.3%) |
| 35 to 39 Years | 492 (8.9%) | 518 (10.8%) |
| 40 to 44 Years | 391 (7.1%) | 403 (8.4%) |
| 45 to 49 Years | 346 (6.2%) | 302 (6.3%) |
| 50 to 54 Years | 340 (6.1%) | 248 (5.2%) |
| 55 to 59 Years | 289 (5.2%) | 237 (5.0%) |
| 60 to 64 Years | 253 (4.6%) | 619 (12.9%) |
| 65 to 69 Years | 506 (9.1%) | 205 (4.3%) |
| 70 to 74 Years | 57 (1.0%) | 162 (3.4%) |
| 75 to 79 Years | 185 (3.3%) | 117 (2.5%) |
| 80 to 84 Years | 88 (1.6%) | 0 (0.0%) |
| 85 Years and over | 11 (0.2%) | 51 (1.1%) |
| Total | 5,532 (100.0%) | 4,784 (100.0%) |
Families and Households in Burtonsville
Median Family Size in Burtonsville
The median family size in Burtonsville is 3.56 persons per family, with single female/mother families (318 | 12.2%) accounting for the largest median family size of 3.77 persons per family. On the other hand, single male/father families (124 | 4.8%) represent the smallest median family size with 3.11 persons per family.
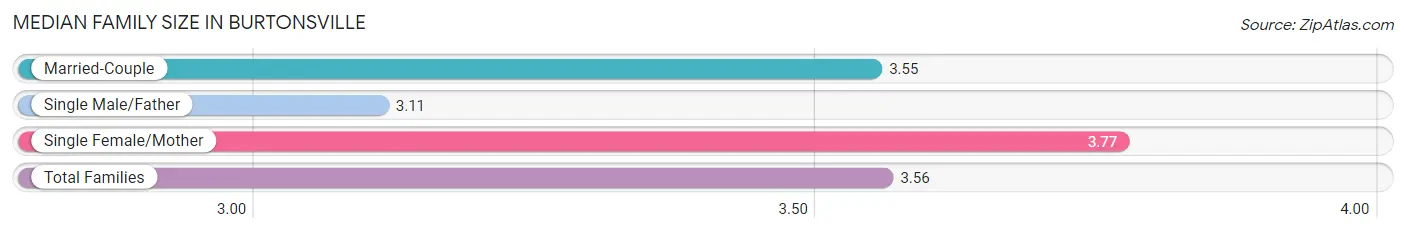
| Family Type | # Families | Family Size |
| Married-Couple | 2,166 (83.1%) | 3.55 |
| Single Male/Father | 124 (4.8%) | 3.11 |
| Single Female/Mother | 318 (12.2%) | 3.77 |
| Total Families | 2,608 (100.0%) | 3.56 |
Median Household Size in Burtonsville
The median household size in Burtonsville is 3.34 persons per household, with single female/mother households (318 | 10.3%) accounting for the largest median household size of 3.88 persons per household. non-family households (474 | 15.4%) represent the smallest median household size with 1.86 persons per household.
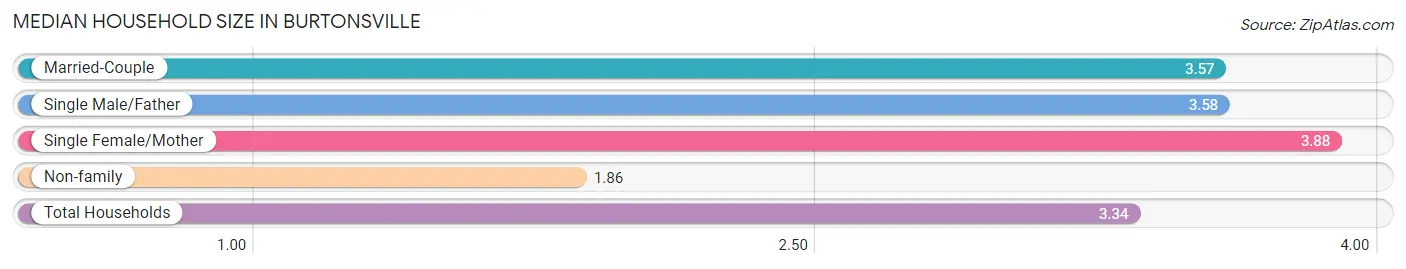
| Household Type | # Households | Household Size |
| Married-Couple | 2,166 (70.3%) | 3.57 |
| Single Male/Father | 124 (4.0%) | 3.58 |
| Single Female/Mother | 318 (10.3%) | 3.88 |
| Non-family | 474 (15.4%) | 1.86 |
| Total Households | 3,082 (100.0%) | 3.34 |
Household Size by Marriage Status in Burtonsville
Out of a total of 3,082 households in Burtonsville, 2,608 (84.6%) are family households, while 474 (15.4%) are nonfamily households. The most numerous type of family households are 4-person households, comprising 816, and the most common type of nonfamily households are 1-person households, comprising 350.
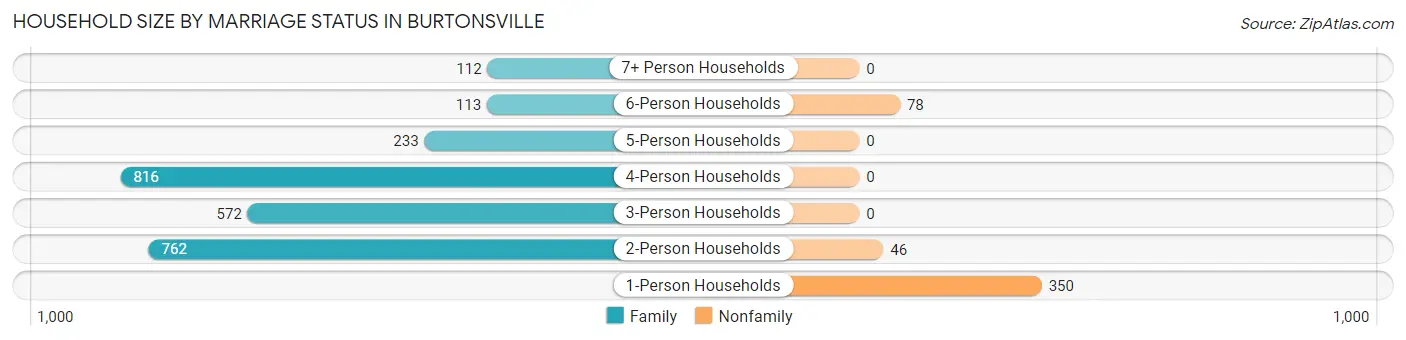
| Household Size | Family Households | Nonfamily Households |
| 1-Person Households | - | 350 (11.4%) |
| 2-Person Households | 762 (24.7%) | 46 (1.5%) |
| 3-Person Households | 572 (18.6%) | 0 (0.0%) |
| 4-Person Households | 816 (26.5%) | 0 (0.0%) |
| 5-Person Households | 233 (7.6%) | 0 (0.0%) |
| 6-Person Households | 113 (3.7%) | 78 (2.5%) |
| 7+ Person Households | 112 (3.6%) | 0 (0.0%) |
| Total | 2,608 (84.6%) | 474 (15.4%) |
Female Fertility in Burtonsville
Fertility by Age in Burtonsville
Average fertility rate in Burtonsville is 77.0 births per 1,000 women. Women in the age bracket of 20 to 34 years have the highest fertility rate with 163.0 births per 1,000 women. Women in the age bracket of 20 to 34 years acount for 75.8% of all women with births.
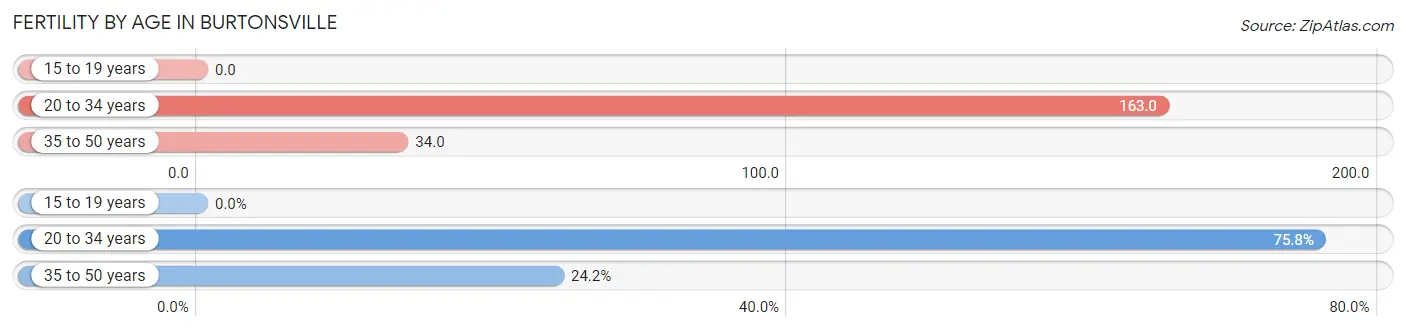
| Age Bracket | Women with Births | Births / 1,000 Women |
| 15 to 19 years | 0 (0.0%) | 0.0 |
| 20 to 34 years | 135 (75.8%) | 163.0 |
| 35 to 50 years | 43 (24.2%) | 34.0 |
| Total | 178 (100.0%) | 77.0 |
Fertility by Age by Marriage Status in Burtonsville
59.0% of women with births (178) in Burtonsville are married. The highest percentage of unmarried women with births falls into 20 to 34 years age bracket with 43.0% of them unmarried at the time of birth, while the lowest percentage of unmarried women with births belong to 35 to 50 years age bracket with 34.9% of them unmarried.
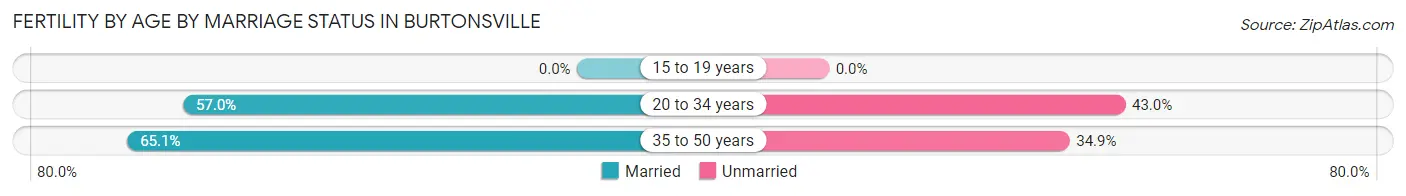
| Age Bracket | Married | Unmarried |
| 15 to 19 years | 0 (0.0%) | 0 (0.0%) |
| 20 to 34 years | 77 (57.0%) | 58 (43.0%) |
| 35 to 50 years | 28 (65.1%) | 15 (34.9%) |
| Total | 105 (59.0%) | 73 (41.0%) |
Fertility by Education in Burtonsville
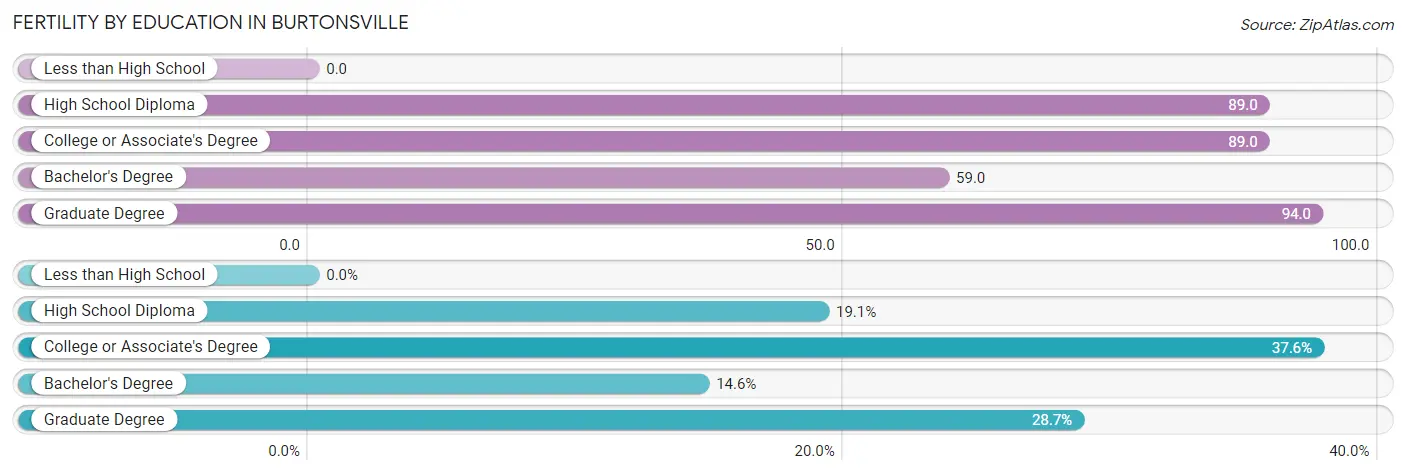
| Educational Attainment | Women with Births | Births / 1,000 Women |
| Less than High School | 0 (0.0%) | 0.0 |
| High School Diploma | 34 (19.1%) | 89.0 |
| College or Associate's Degree | 67 (37.6%) | 89.0 |
| Bachelor's Degree | 26 (14.6%) | 59.0 |
| Graduate Degree | 51 (28.6%) | 94.0 |
| Total | 178 (100.0%) | 77.0 |
Fertility by Education by Marriage Status in Burtonsville
41.0% of women with births in Burtonsville are unmarried. Women with the educational attainment of bachelor's degree are most likely to be married with 100.0% of them married at childbirth, while women with the educational attainment of graduate degree are least likely to be married with 100.0% of them unmarried at childbirth.
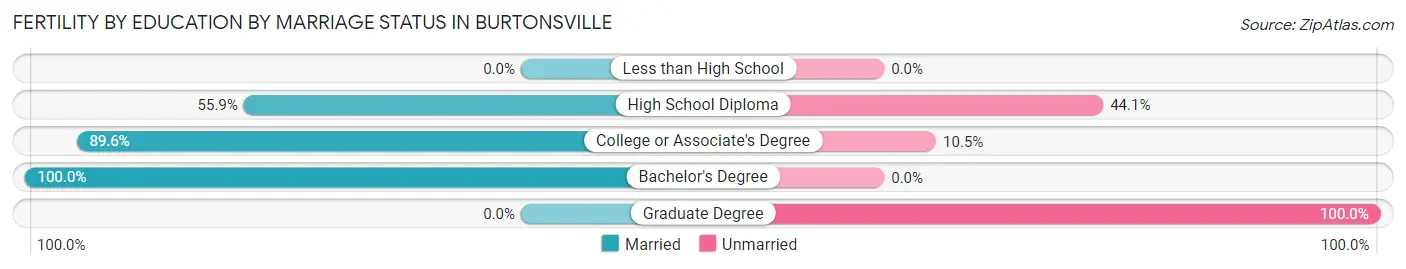
| Educational Attainment | Married | Unmarried |
| Less than High School | 0 (0.0%) | 0 (0.0%) |
| High School Diploma | 19 (55.9%) | 15 (44.1%) |
| College or Associate's Degree | 60 (89.5%) | 7 (10.4%) |
| Bachelor's Degree | 26 (100.0%) | 0 (0.0%) |
| Graduate Degree | 0 (0.0%) | 51 (100.0%) |
| Total | 105 (59.0%) | 73 (41.0%) |
Employment Characteristics in Burtonsville
Employment by Class of Employer in Burtonsville
Among the 5,861 employed individuals in Burtonsville, private company employees (3,678 | 62.7%), federal government employees (558 | 9.5%), and local government employees (473 | 8.1%) make up the most common classes of employment.
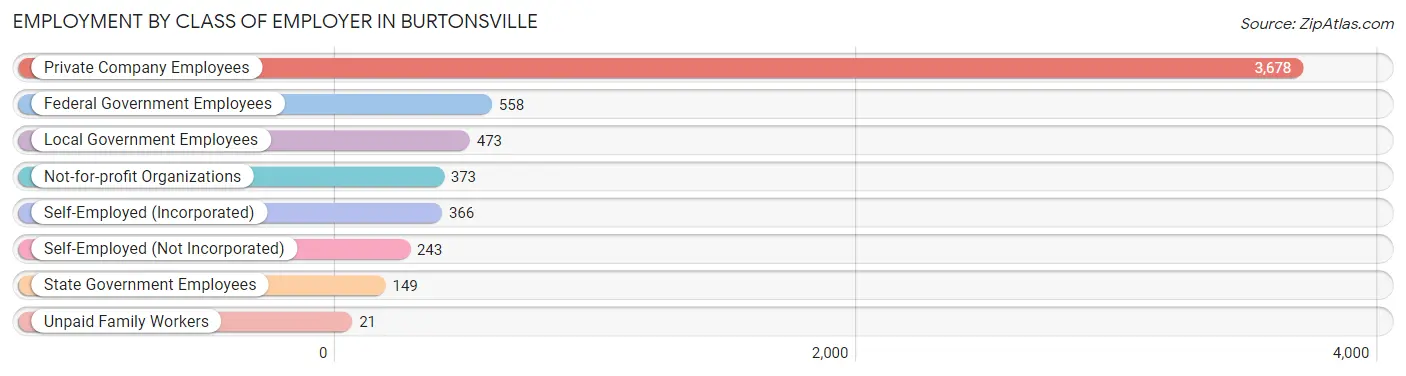
| Employer Class | # Employees | % Employees |
| Private Company Employees | 3,678 | 62.7% |
| Self-Employed (Incorporated) | 366 | 6.2% |
| Self-Employed (Not Incorporated) | 243 | 4.2% |
| Not-for-profit Organizations | 373 | 6.4% |
| Local Government Employees | 473 | 8.1% |
| State Government Employees | 149 | 2.5% |
| Federal Government Employees | 558 | 9.5% |
| Unpaid Family Workers | 21 | 0.4% |
| Total | 5,861 | 100.0% |
Employment Status by Age in Burtonsville
According to the labor force statistics for Burtonsville, out of the total population over 16 years of age (8,212), 76.2% or 6,258 individuals are in the labor force, with 4.5% or 282 of them unemployed. The age group with the highest labor force participation rate is 45 to 54 years, with 94.6% or 1,169 individuals in the labor force. Within the labor force, the 16 to 19 years age range has the highest percentage of unemployed individuals, with 12.3% or 21 of them being unemployed.
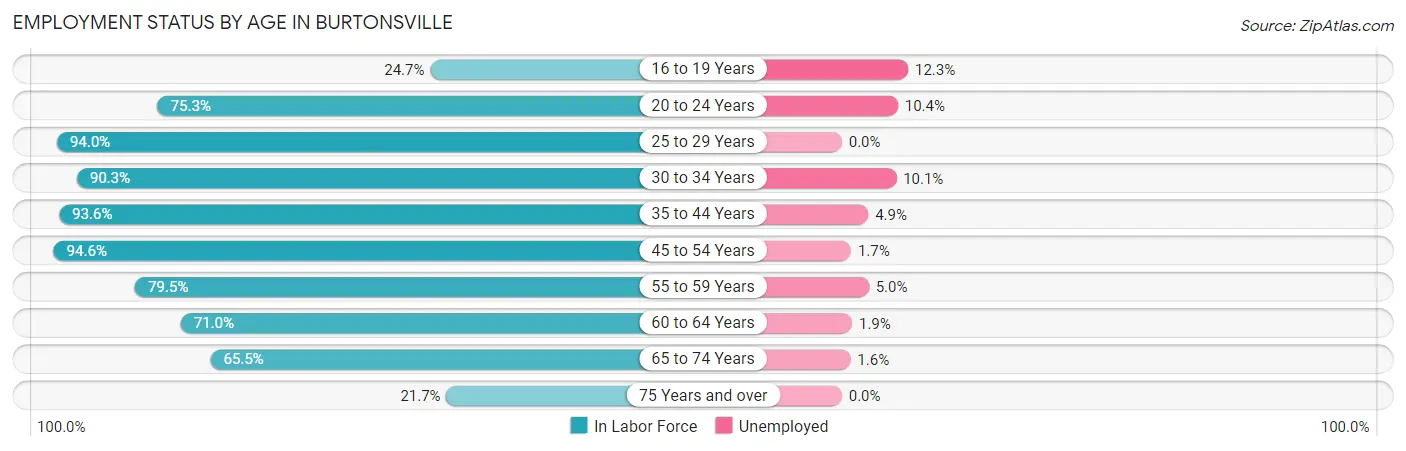
| Age Bracket | In Labor Force | Unemployed |
| 16 to 19 Years | 171 (24.7%) | 21 (12.3%) |
| 20 to 24 Years | 299 (75.3%) | 31 (10.4%) |
| 25 to 29 Years | 346 (94.0%) | 0 (0.0%) |
| 30 to 34 Years | 843 (90.3%) | 85 (10.1%) |
| 35 to 44 Years | 1,689 (93.6%) | 83 (4.9%) |
| 45 to 54 Years | 1,169 (94.6%) | 20 (1.7%) |
| 55 to 59 Years | 418 (79.5%) | 21 (5.0%) |
| 60 to 64 Years | 619 (71.0%) | 12 (1.9%) |
| 65 to 74 Years | 609 (65.5%) | 10 (1.6%) |
| 75 Years and over | 98 (21.7%) | 0 (0.0%) |
| Total | 6,258 (76.2%) | 282 (4.5%) |
Employment Status by Educational Attainment in Burtonsville
According to labor force statistics for Burtonsville, 88.6% of individuals (5,086) out of the total population between 25 and 64 years of age (5,740) are in the labor force, with 4.3% or 219 of them being unemployed. The group with the highest labor force participation rate are those with the educational attainment of high school diploma, with 97.9% or 875 individuals in the labor force. Within the labor force, individuals with high school diploma education have the highest percentage of unemployment, with 6.4% or 56 of them being unemployed.
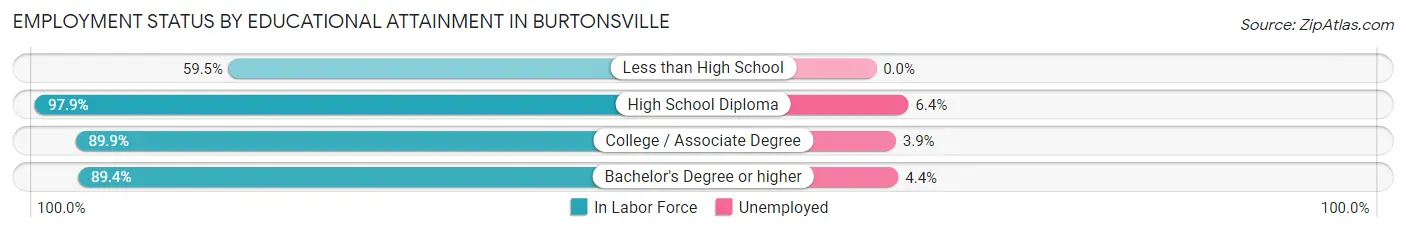
| Educational Attainment | In Labor Force | Unemployed |
| Less than High School | 264 (59.5%) | 0 (0.0%) |
| High School Diploma | 875 (97.9%) | 57 (6.4%) |
| College / Associate Degree | 1,647 (89.9%) | 71 (3.9%) |
| Bachelor's Degree or higher | 2,298 (89.4%) | 113 (4.4%) |
| Total | 5,086 (88.6%) | 247 (4.3%) |
Employment Occupations by Sex in Burtonsville
Management, Business, Science and Arts Occupations
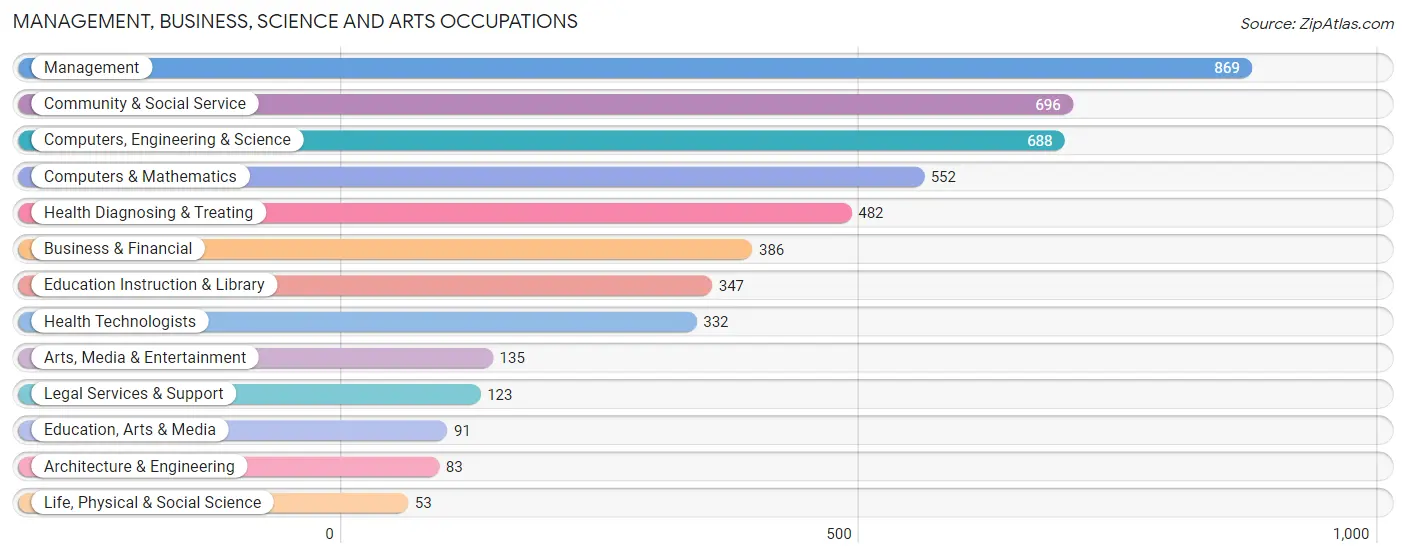
The most common Management, Business, Science and Arts occupations in Burtonsville are Management (869 | 14.5%), Community & Social Service (696 | 11.6%), Computers, Engineering & Science (688 | 11.5%), Computers & Mathematics (552 | 9.2%), and Health Diagnosing & Treating (482 | 8.1%).
Management, Business, Science and Arts Occupations by Sex
Within the Management, Business, Science and Arts occupations in Burtonsville, the most male-oriented occupations are Architecture & Engineering (100.0%), Life, Physical & Social Science (88.7%), and Computers, Engineering & Science (82.6%), while the most female-oriented occupations are Legal Services & Support (100.0%), Health Diagnosing & Treating (88.6%), and Health Technologists (83.4%).
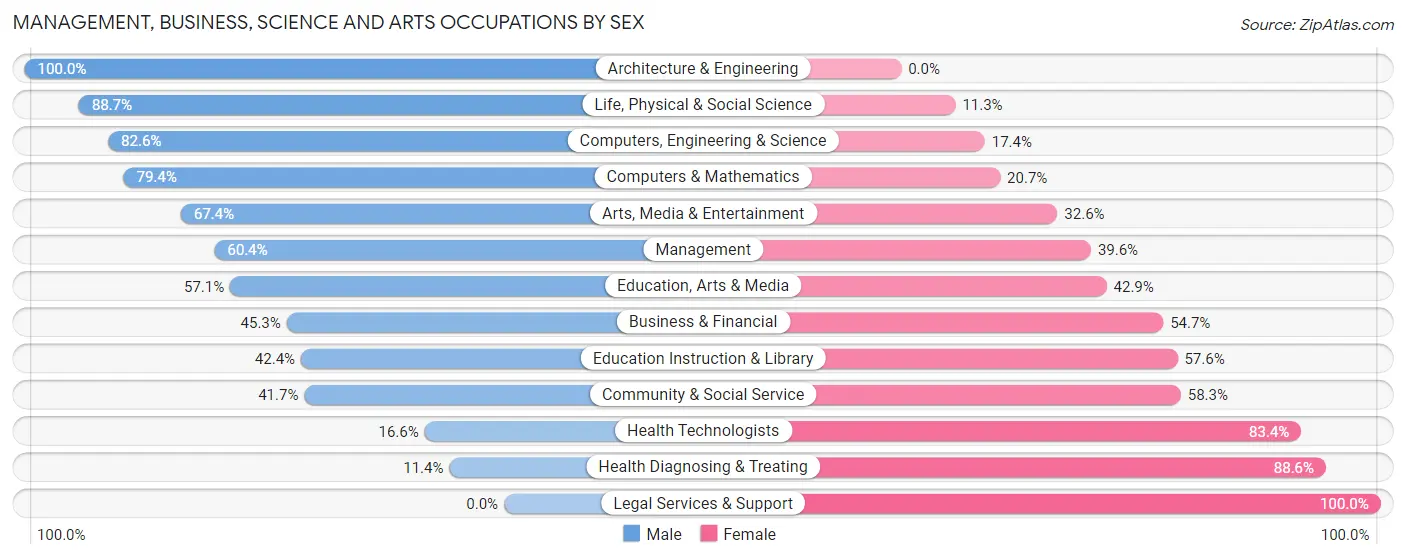
| Occupation | Male | Female |
| Management | 525 (60.4%) | 344 (39.6%) |
| Business & Financial | 175 (45.3%) | 211 (54.7%) |
| Computers, Engineering & Science | 568 (82.6%) | 120 (17.4%) |
| Computers & Mathematics | 438 (79.3%) | 114 (20.6%) |
| Architecture & Engineering | 83 (100.0%) | 0 (0.0%) |
| Life, Physical & Social Science | 47 (88.7%) | 6 (11.3%) |
| Community & Social Service | 290 (41.7%) | 406 (58.3%) |
| Education, Arts & Media | 52 (57.1%) | 39 (42.9%) |
| Legal Services & Support | 0 (0.0%) | 123 (100.0%) |
| Education Instruction & Library | 147 (42.4%) | 200 (57.6%) |
| Arts, Media & Entertainment | 91 (67.4%) | 44 (32.6%) |
| Health Diagnosing & Treating | 55 (11.4%) | 427 (88.6%) |
| Health Technologists | 55 (16.6%) | 277 (83.4%) |
| Total (Category) | 1,613 (51.7%) | 1,508 (48.3%) |
| Total (Overall) | 3,135 (52.4%) | 2,844 (47.6%) |
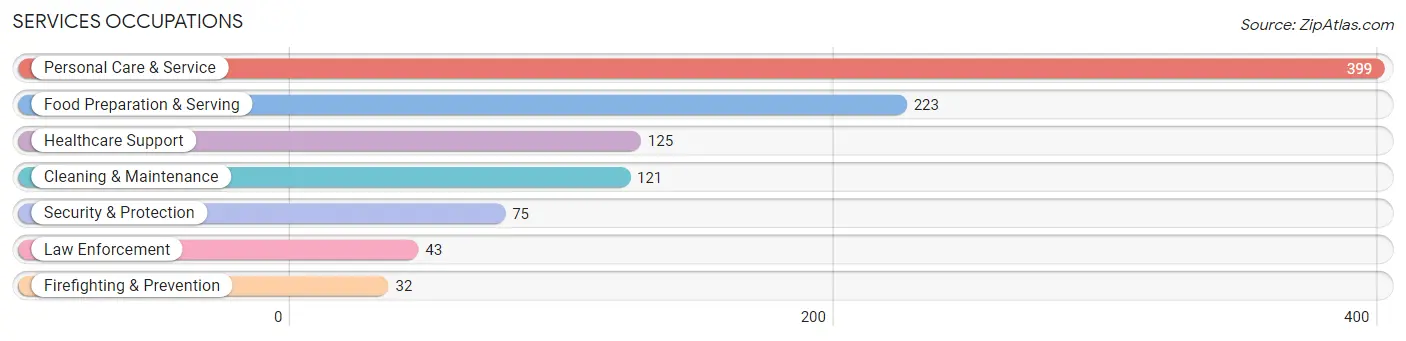
Services Occupations
The most common Services occupations in Burtonsville are Personal Care & Service (399 | 6.7%), Food Preparation & Serving (223 | 3.7%), Healthcare Support (125 | 2.1%), Cleaning & Maintenance (121 | 2.0%), and Security & Protection (75 | 1.3%).
Services Occupations by Sex
Within the Services occupations in Burtonsville, the most male-oriented occupations are Security & Protection (100.0%), Firefighting & Prevention (100.0%), and Law Enforcement (100.0%), while the most female-oriented occupations are Healthcare Support (100.0%), Personal Care & Service (85.0%), and Food Preparation & Serving (70.4%).
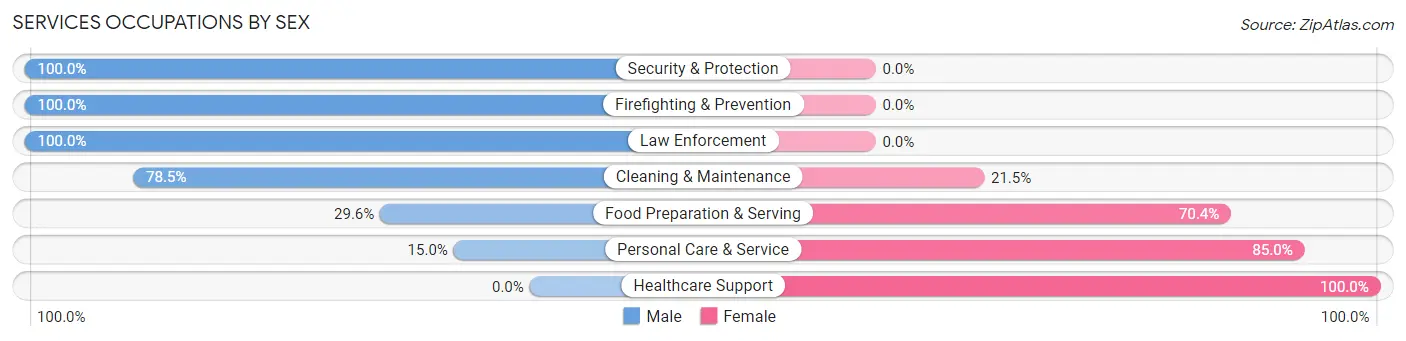
| Occupation | Male | Female |
| Healthcare Support | 0 (0.0%) | 125 (100.0%) |
| Security & Protection | 75 (100.0%) | 0 (0.0%) |
| Firefighting & Prevention | 32 (100.0%) | 0 (0.0%) |
| Law Enforcement | 43 (100.0%) | 0 (0.0%) |
| Food Preparation & Serving | 66 (29.6%) | 157 (70.4%) |
| Cleaning & Maintenance | 95 (78.5%) | 26 (21.5%) |
| Personal Care & Service | 60 (15.0%) | 339 (85.0%) |
| Total (Category) | 296 (31.4%) | 647 (68.6%) |
| Total (Overall) | 3,135 (52.4%) | 2,844 (47.6%) |
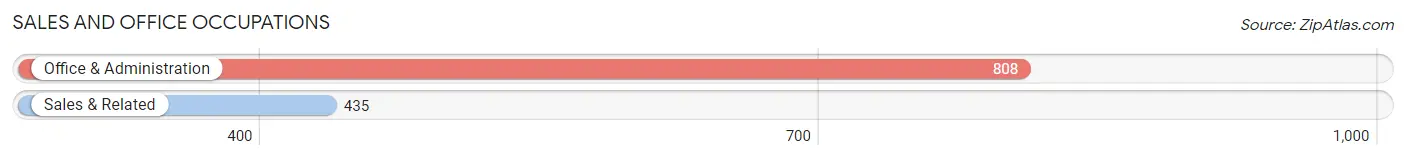
Sales and Office Occupations
The most common Sales and Office occupations in Burtonsville are Office & Administration (808 | 13.5%), and Sales & Related (435 | 7.3%).
Sales and Office Occupations by Sex
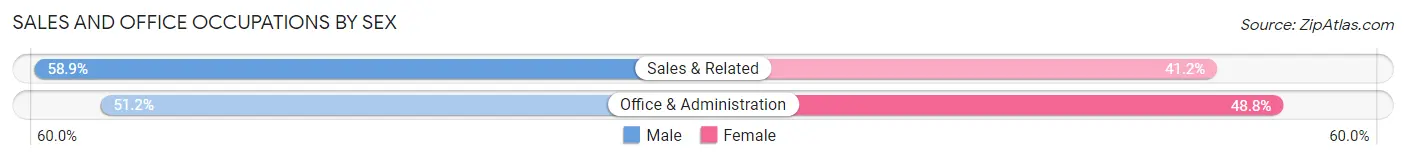
| Occupation | Male | Female |
| Sales & Related | 256 (58.9%) | 179 (41.1%) |
| Office & Administration | 414 (51.2%) | 394 (48.8%) |
| Total (Category) | 670 (53.9%) | 573 (46.1%) |
| Total (Overall) | 3,135 (52.4%) | 2,844 (47.6%) |
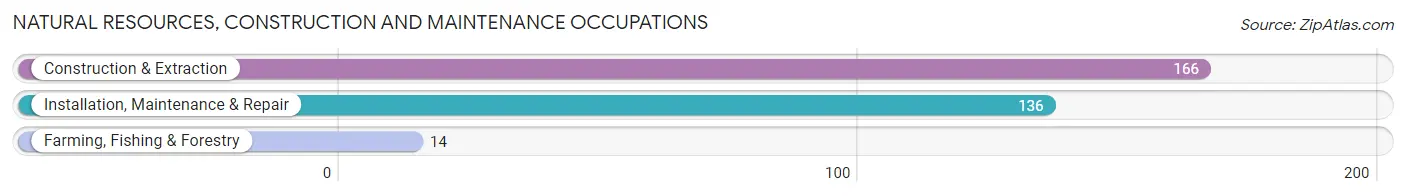
Natural Resources, Construction and Maintenance Occupations
The most common Natural Resources, Construction and Maintenance occupations in Burtonsville are Construction & Extraction (166 | 2.8%), Installation, Maintenance & Repair (136 | 2.3%), and Farming, Fishing & Forestry (14 | 0.2%).
Natural Resources, Construction and Maintenance Occupations by Sex
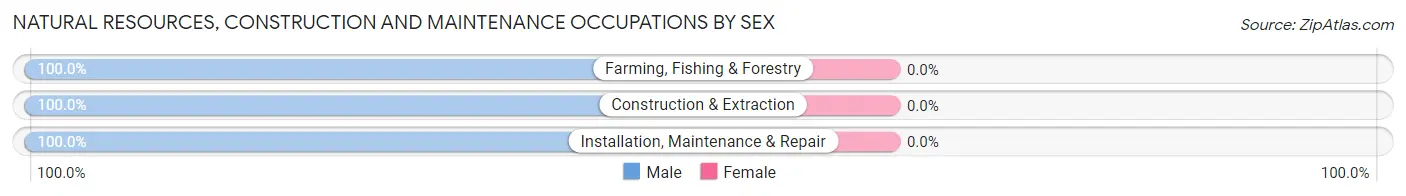
| Occupation | Male | Female |
| Farming, Fishing & Forestry | 14 (100.0%) | 0 (0.0%) |
| Construction & Extraction | 166 (100.0%) | 0 (0.0%) |
| Installation, Maintenance & Repair | 136 (100.0%) | 0 (0.0%) |
| Total (Category) | 316 (100.0%) | 0 (0.0%) |
| Total (Overall) | 3,135 (52.4%) | 2,844 (47.6%) |
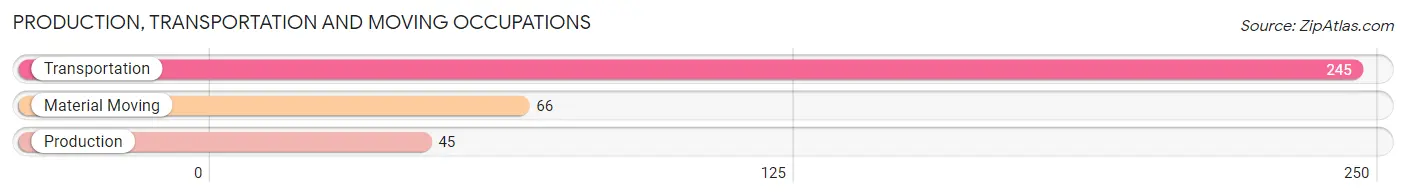
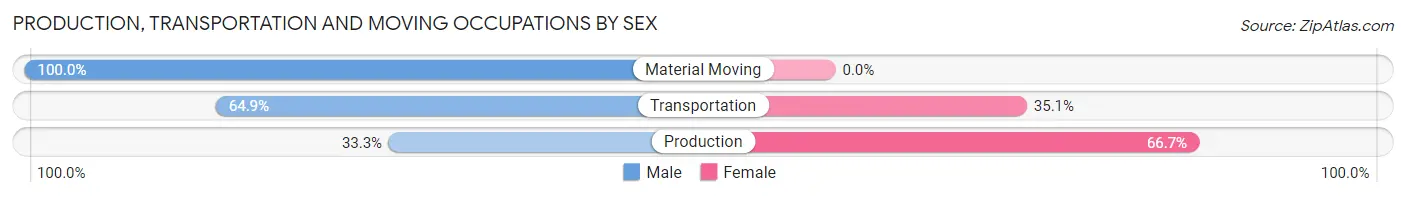
Production, Transportation and Moving Occupations
The most common Production, Transportation and Moving occupations in Burtonsville are Transportation (245 | 4.1%), Material Moving (66 | 1.1%), and Production (45 | 0.7%).
Production, Transportation and Moving Occupations by Sex
| Occupation | Male | Female |
| Production | 15 (33.3%) | 30 (66.7%) |
| Transportation | 159 (64.9%) | 86 (35.1%) |
| Material Moving | 66 (100.0%) | 0 (0.0%) |
| Total (Category) | 240 (67.4%) | 116 (32.6%) |
| Total (Overall) | 3,135 (52.4%) | 2,844 (47.6%) |
Employment Industries by Sex in Burtonsville
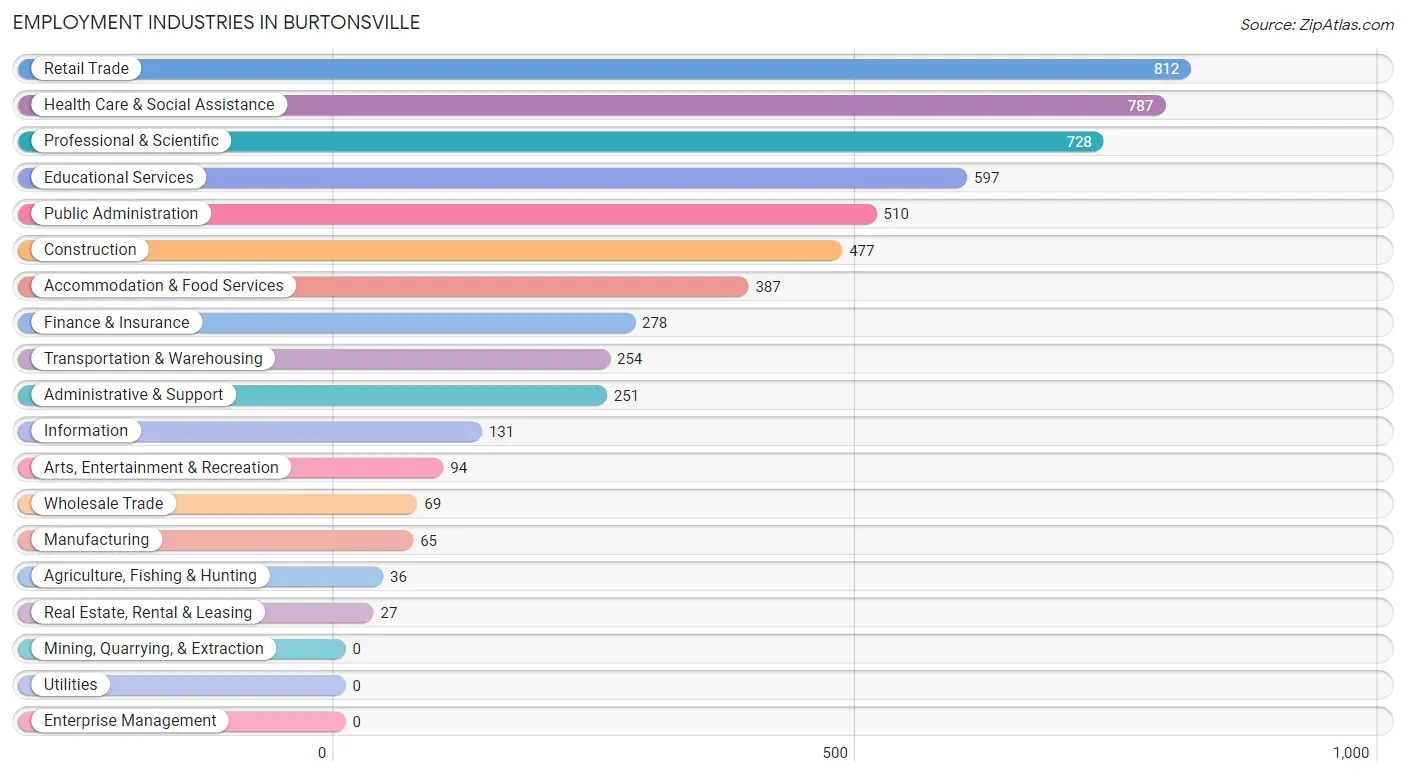
Employment Industries in Burtonsville
The major employment industries in Burtonsville include Retail Trade (812 | 13.6%), Health Care & Social Assistance (787 | 13.2%), Professional & Scientific (728 | 12.2%), Educational Services (597 | 10.0%), and Public Administration (510 | 8.5%).
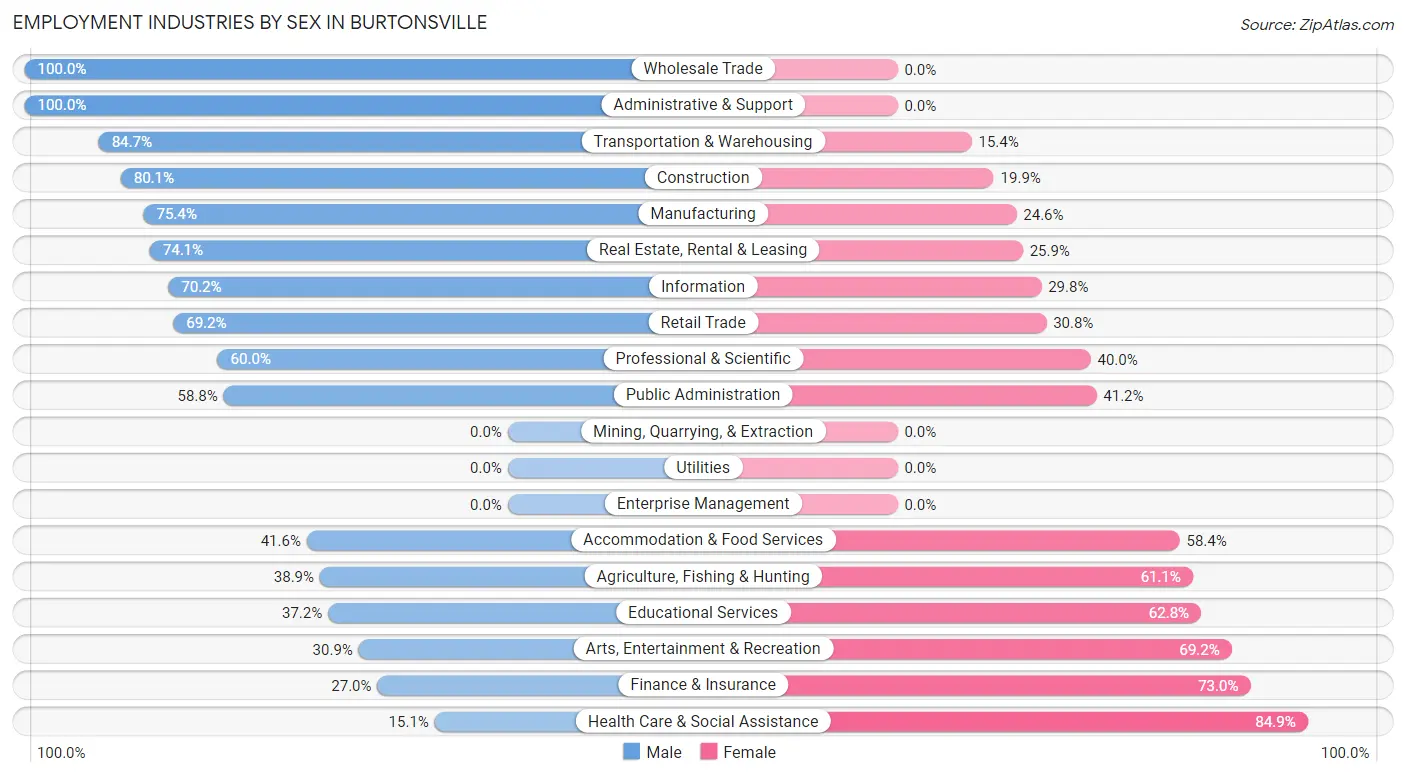
Employment Industries by Sex in Burtonsville
The Burtonsville industries that see more men than women are Wholesale Trade (100.0%), Administrative & Support (100.0%), and Transportation & Warehousing (84.7%), whereas the industries that tend to have a higher number of women are Health Care & Social Assistance (84.9%), Finance & Insurance (73.0%), and Arts, Entertainment & Recreation (69.2%).
| Industry | Male | Female |
| Agriculture, Fishing & Hunting | 14 (38.9%) | 22 (61.1%) |
| Mining, Quarrying, & Extraction | 0 (0.0%) | 0 (0.0%) |
| Construction | 382 (80.1%) | 95 (19.9%) |
| Manufacturing | 49 (75.4%) | 16 (24.6%) |
| Wholesale Trade | 69 (100.0%) | 0 (0.0%) |
| Retail Trade | 562 (69.2%) | 250 (30.8%) |
| Transportation & Warehousing | 215 (84.7%) | 39 (15.3%) |
| Utilities | 0 (0.0%) | 0 (0.0%) |
| Information | 92 (70.2%) | 39 (29.8%) |
| Finance & Insurance | 75 (27.0%) | 203 (73.0%) |
| Real Estate, Rental & Leasing | 20 (74.1%) | 7 (25.9%) |
| Professional & Scientific | 437 (60.0%) | 291 (40.0%) |
| Enterprise Management | 0 (0.0%) | 0 (0.0%) |
| Administrative & Support | 251 (100.0%) | 0 (0.0%) |
| Educational Services | 222 (37.2%) | 375 (62.8%) |
| Health Care & Social Assistance | 119 (15.1%) | 668 (84.9%) |
| Arts, Entertainment & Recreation | 29 (30.8%) | 65 (69.2%) |
| Accommodation & Food Services | 161 (41.6%) | 226 (58.4%) |
| Public Administration | 300 (58.8%) | 210 (41.2%) |
| Total | 3,135 (52.4%) | 2,844 (47.6%) |
Education in Burtonsville
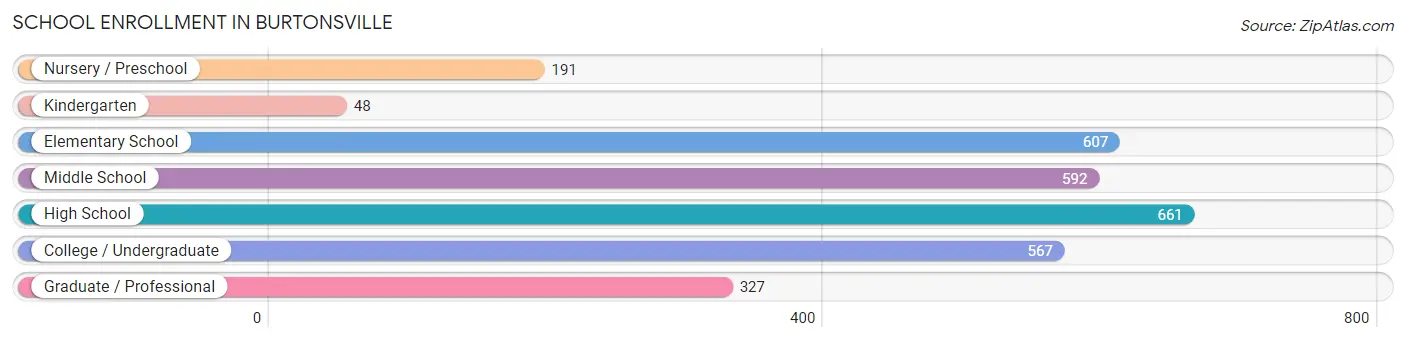
School Enrollment in Burtonsville
The most common levels of schooling among the 2,993 students in Burtonsville are high school (661 | 22.1%), elementary school (607 | 20.3%), and middle school (592 | 19.8%).
| School Level | # Students | % Students |
| Nursery / Preschool | 191 | 6.4% |
| Kindergarten | 48 | 1.6% |
| Elementary School | 607 | 20.3% |
| Middle School | 592 | 19.8% |
| High School | 661 | 22.1% |
| College / Undergraduate | 567 | 18.9% |
| Graduate / Professional | 327 | 10.9% |
| Total | 2,993 | 100.0% |
School Enrollment by Age by Funding Source in Burtonsville
Out of a total of 2,993 students who are enrolled in schools in Burtonsville, 422 (14.1%) attend a private institution, while the remaining 2,571 (85.9%) are enrolled in public schools. The age group of 25 to 34 year olds has the highest likelihood of being enrolled in private schools, with 151 (78.2% in the age bracket) enrolled. Conversely, the age group of 10 to 14 year olds has the lowest likelihood of being enrolled in a private school, with 789 (98.8% in the age bracket) attending a public institution.
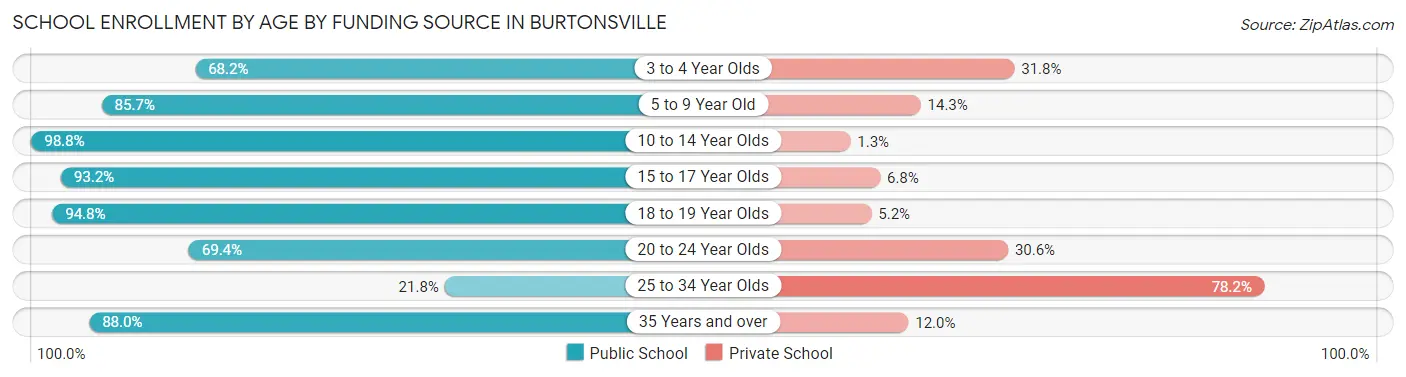
| Age Bracket | Public School | Private School |
| 3 to 4 Year Olds | 88 (68.2%) | 41 (31.8%) |
| 5 to 9 Year Old | 556 (85.7%) | 93 (14.3%) |
| 10 to 14 Year Olds | 789 (98.8%) | 10 (1.3%) |
| 15 to 17 Year Olds | 303 (93.2%) | 22 (6.8%) |
| 18 to 19 Year Olds | 386 (94.8%) | 21 (5.2%) |
| 20 to 24 Year Olds | 93 (69.4%) | 41 (30.6%) |
| 25 to 34 Year Olds | 42 (21.8%) | 151 (78.2%) |
| 35 Years and over | 314 (88.0%) | 43 (12.0%) |
| Total | 2,571 (85.9%) | 422 (14.1%) |
Educational Attainment by Field of Study in Burtonsville
Business (757 | 20.5%), science & technology (568 | 15.4%), education (337 | 9.1%), arts & humanities (331 | 9.0%), and computers & mathematics (317 | 8.6%) are the most common fields of study among 3,684 individuals in Burtonsville who have obtained a bachelor's degree or higher.
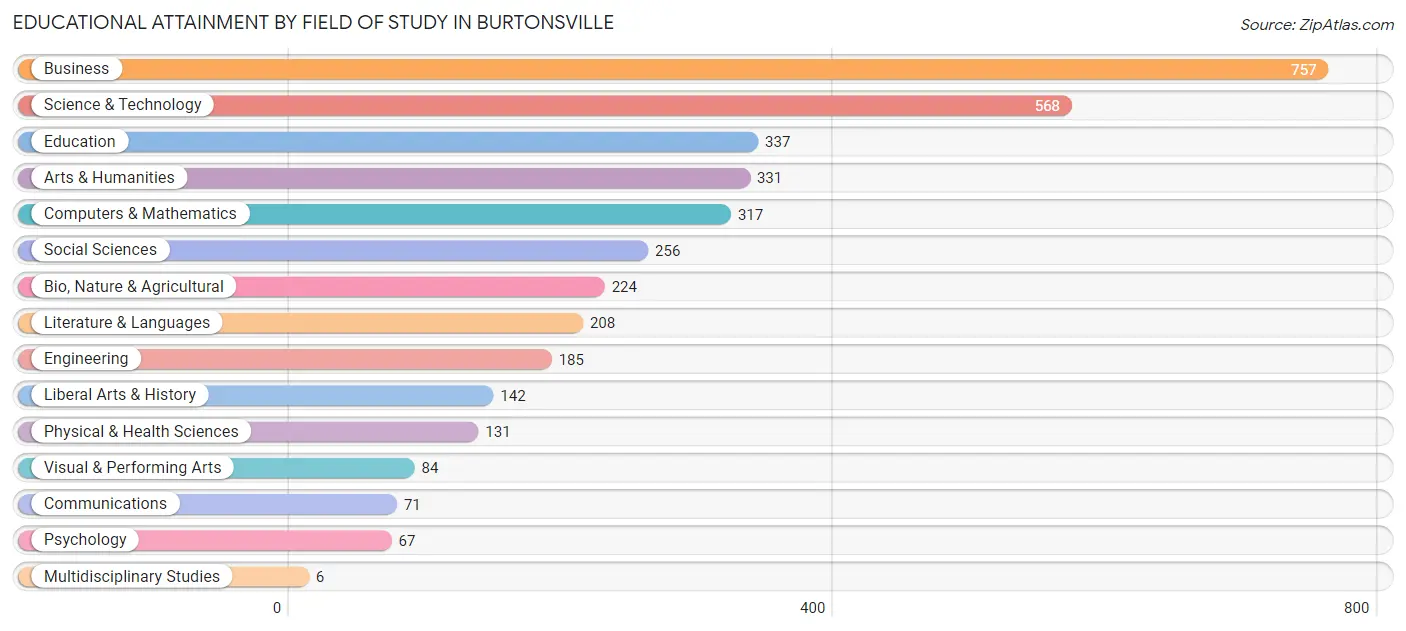
| Field of Study | # Graduates | % Graduates |
| Computers & Mathematics | 317 | 8.6% |
| Bio, Nature & Agricultural | 224 | 6.1% |
| Physical & Health Sciences | 131 | 3.6% |
| Psychology | 67 | 1.8% |
| Social Sciences | 256 | 7.0% |
| Engineering | 185 | 5.0% |
| Multidisciplinary Studies | 6 | 0.2% |
| Science & Technology | 568 | 15.4% |
| Business | 757 | 20.5% |
| Education | 337 | 9.1% |
| Literature & Languages | 208 | 5.7% |
| Liberal Arts & History | 142 | 3.8% |
| Visual & Performing Arts | 84 | 2.3% |
| Communications | 71 | 1.9% |
| Arts & Humanities | 331 | 9.0% |
| Total | 3,684 | 100.0% |
Transportation & Commute in Burtonsville
Vehicle Availability by Sex in Burtonsville
The most prevalent vehicle ownership categories in Burtonsville are males with 3 vehicles (1,148, accounting for 36.8%) and females with 3 vehicles (860, making up 41.9%).
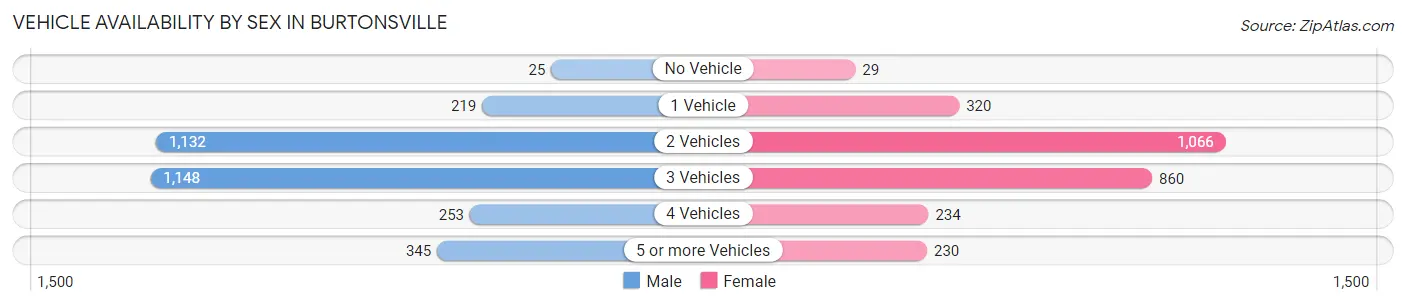
| Vehicles Available | Male | Female |
| No Vehicle | 25 (0.8%) | 29 (1.1%) |
| 1 Vehicle | 219 (7.0%) | 320 (11.7%) |
| 2 Vehicles | 1,132 (36.3%) | 1,066 (38.9%) |
| 3 Vehicles | 1,148 (36.8%) | 860 (31.4%) |
| 4 Vehicles | 253 (8.1%) | 234 (8.5%) |
| 5 or more Vehicles | 345 (11.1%) | 230 (8.4%) |
| Total | 3,122 (100.0%) | 2,739 (100.0%) |
Commute Time in Burtonsville
The most frequently occuring commute durations in Burtonsville are 40 to 44 minutes (1,003 commuters, 20.3%), 30 to 34 minutes (852 commuters, 17.2%), and 20 to 24 minutes (644 commuters, 13.0%).
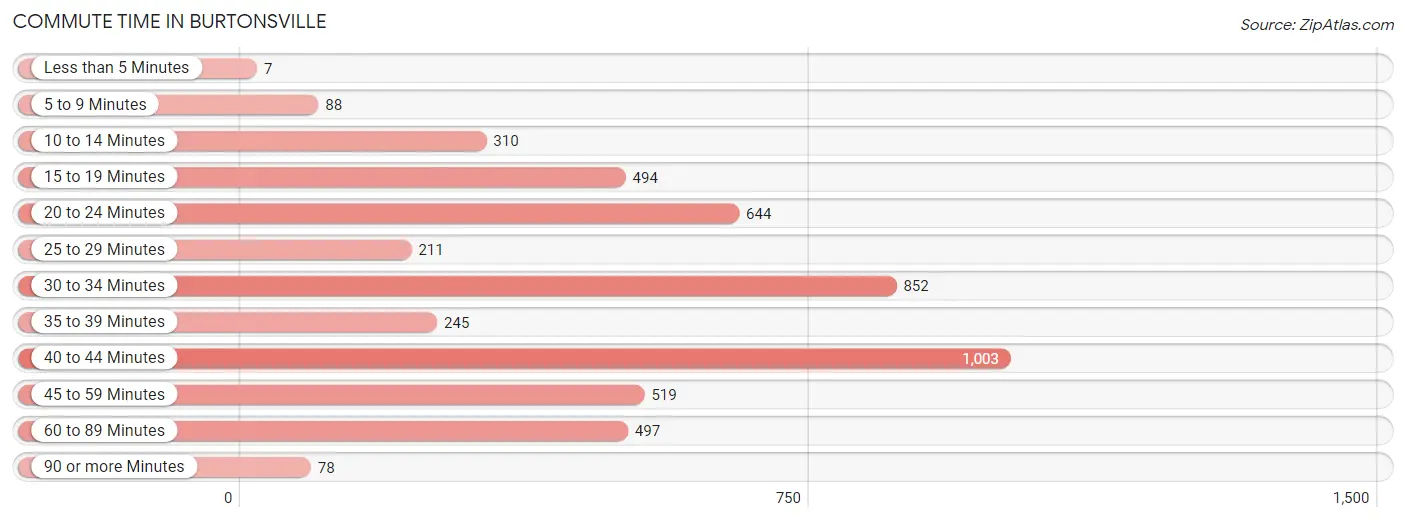
| Commute Time | # Commuters | % Commuters |
| Less than 5 Minutes | 7 | 0.1% |
| 5 to 9 Minutes | 88 | 1.8% |
| 10 to 14 Minutes | 310 | 6.3% |
| 15 to 19 Minutes | 494 | 10.0% |
| 20 to 24 Minutes | 644 | 13.0% |
| 25 to 29 Minutes | 211 | 4.3% |
| 30 to 34 Minutes | 852 | 17.2% |
| 35 to 39 Minutes | 245 | 5.0% |
| 40 to 44 Minutes | 1,003 | 20.3% |
| 45 to 59 Minutes | 519 | 10.5% |
| 60 to 89 Minutes | 497 | 10.0% |
| 90 or more Minutes | 78 | 1.6% |
Commute Time by Sex in Burtonsville
The most common commute times in Burtonsville are 40 to 44 minutes (689 commuters, 25.6%) for males and 20 to 24 minutes (407 commuters, 18.0%) for females.
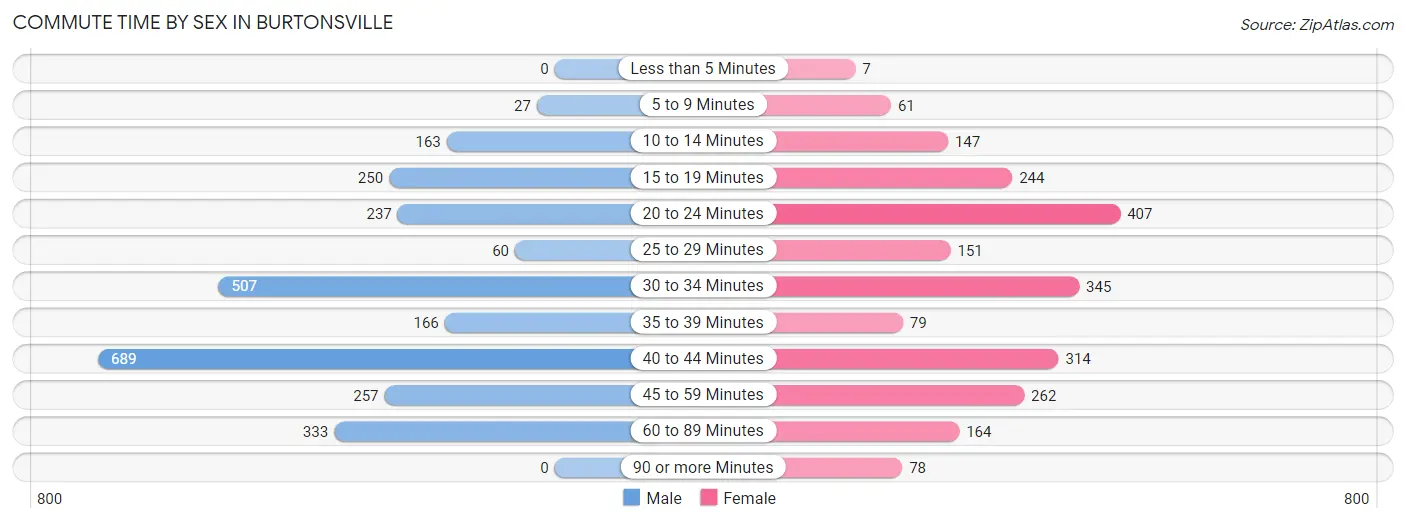
| Commute Time | Male | Female |
| Less than 5 Minutes | 0 (0.0%) | 7 (0.3%) |
| 5 to 9 Minutes | 27 (1.0%) | 61 (2.7%) |
| 10 to 14 Minutes | 163 (6.1%) | 147 (6.5%) |
| 15 to 19 Minutes | 250 (9.3%) | 244 (10.8%) |
| 20 to 24 Minutes | 237 (8.8%) | 407 (18.0%) |
| 25 to 29 Minutes | 60 (2.2%) | 151 (6.7%) |
| 30 to 34 Minutes | 507 (18.9%) | 345 (15.3%) |
| 35 to 39 Minutes | 166 (6.2%) | 79 (3.5%) |
| 40 to 44 Minutes | 689 (25.6%) | 314 (13.9%) |
| 45 to 59 Minutes | 257 (9.6%) | 262 (11.6%) |
| 60 to 89 Minutes | 333 (12.4%) | 164 (7.3%) |
| 90 or more Minutes | 0 (0.0%) | 78 (3.5%) |
Time of Departure to Work by Sex in Burtonsville
The most frequent times of departure to work in Burtonsville are 8:00 AM to 8:29 AM (779, 29.0%) for males and 7:00 AM to 7:29 AM (289, 12.8%) for females.
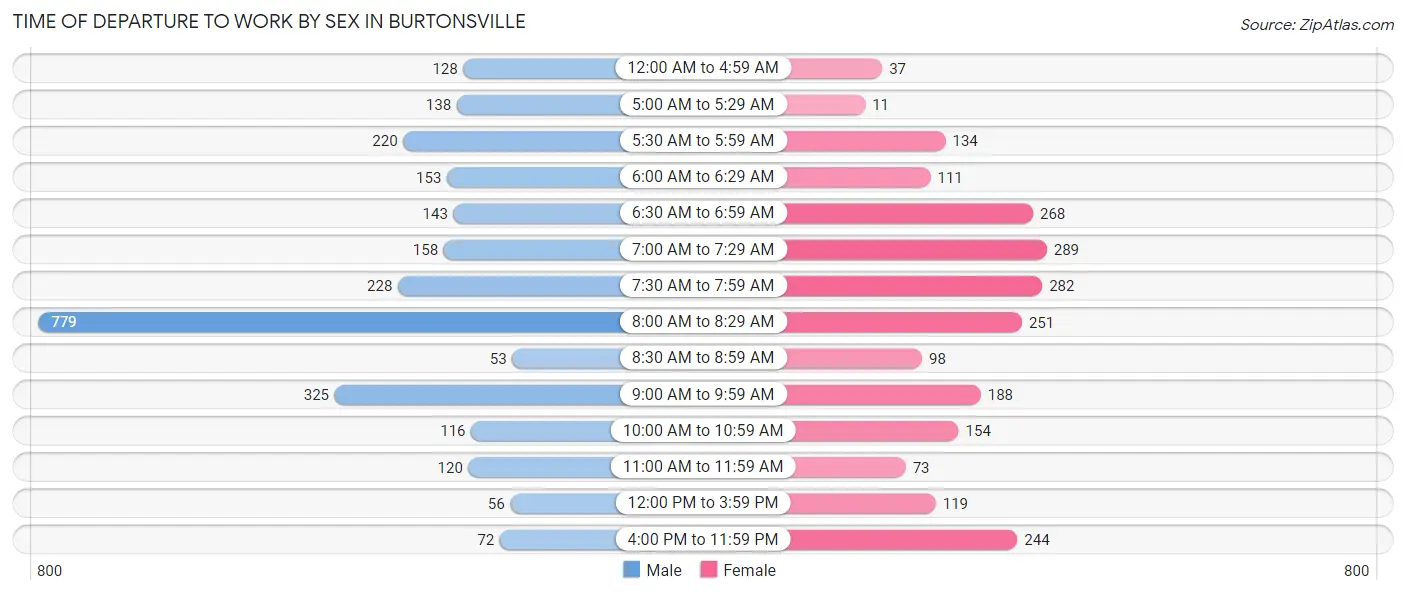
| Time of Departure | Male | Female |
| 12:00 AM to 4:59 AM | 128 (4.8%) | 37 (1.6%) |
| 5:00 AM to 5:29 AM | 138 (5.1%) | 11 (0.5%) |
| 5:30 AM to 5:59 AM | 220 (8.2%) | 134 (5.9%) |
| 6:00 AM to 6:29 AM | 153 (5.7%) | 111 (4.9%) |
| 6:30 AM to 6:59 AM | 143 (5.3%) | 268 (11.9%) |
| 7:00 AM to 7:29 AM | 158 (5.9%) | 289 (12.8%) |
| 7:30 AM to 7:59 AM | 228 (8.5%) | 282 (12.5%) |
| 8:00 AM to 8:29 AM | 779 (29.0%) | 251 (11.1%) |
| 8:30 AM to 8:59 AM | 53 (2.0%) | 98 (4.3%) |
| 9:00 AM to 9:59 AM | 325 (12.1%) | 188 (8.3%) |
| 10:00 AM to 10:59 AM | 116 (4.3%) | 154 (6.8%) |
| 11:00 AM to 11:59 AM | 120 (4.5%) | 73 (3.2%) |
| 12:00 PM to 3:59 PM | 56 (2.1%) | 119 (5.3%) |
| 4:00 PM to 11:59 PM | 72 (2.7%) | 244 (10.8%) |
| Total | 2,689 (100.0%) | 2,259 (100.0%) |
Housing Occupancy in Burtonsville
Occupancy by Ownership in Burtonsville
Of the total 3,082 dwellings in Burtonsville, owner-occupied units account for 2,546 (82.6%), while renter-occupied units make up 536 (17.4%).
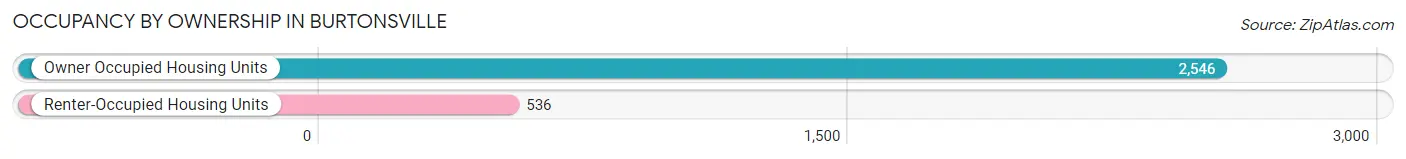
| Occupancy | # Housing Units | % Housing Units |
| Owner Occupied Housing Units | 2,546 | 82.6% |
| Renter-Occupied Housing Units | 536 | 17.4% |
| Total Occupied Housing Units | 3,082 | 100.0% |
Occupancy by Household Size in Burtonsville
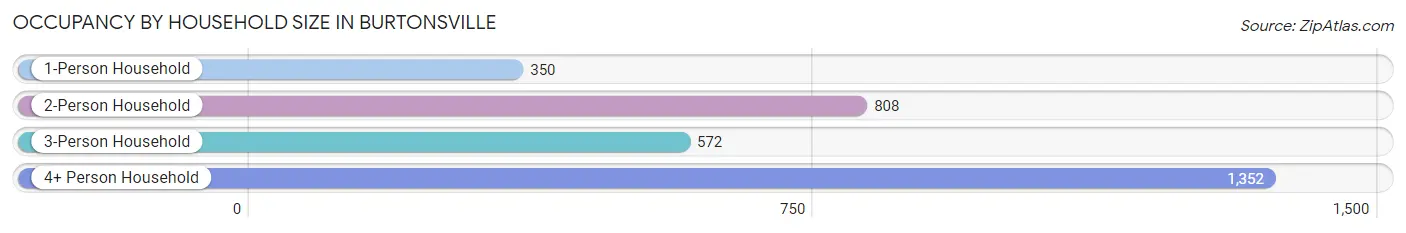
| Household Size | # Housing Units | % Housing Units |
| 1-Person Household | 350 | 11.4% |
| 2-Person Household | 808 | 26.2% |
| 3-Person Household | 572 | 18.6% |
| 4+ Person Household | 1,352 | 43.9% |
| Total Housing Units | 3,082 | 100.0% |
Occupancy by Ownership by Household Size in Burtonsville
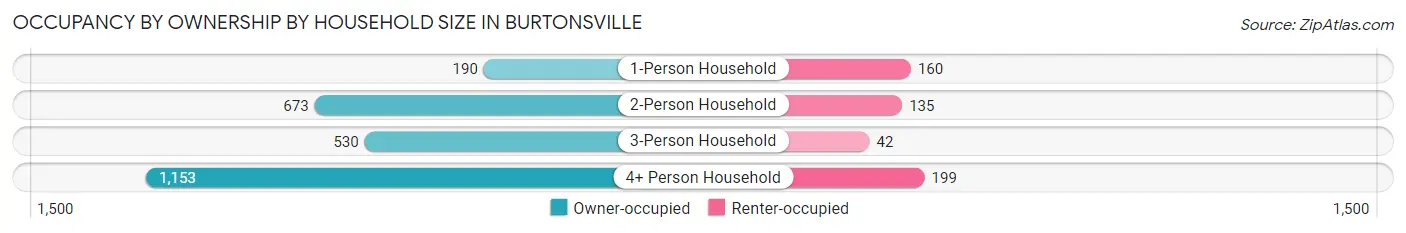
| Household Size | Owner-occupied | Renter-occupied |
| 1-Person Household | 190 (54.3%) | 160 (45.7%) |
| 2-Person Household | 673 (83.3%) | 135 (16.7%) |
| 3-Person Household | 530 (92.7%) | 42 (7.3%) |
| 4+ Person Household | 1,153 (85.3%) | 199 (14.7%) |
| Total Housing Units | 2,546 (82.6%) | 536 (17.4%) |
Occupancy by Educational Attainment in Burtonsville
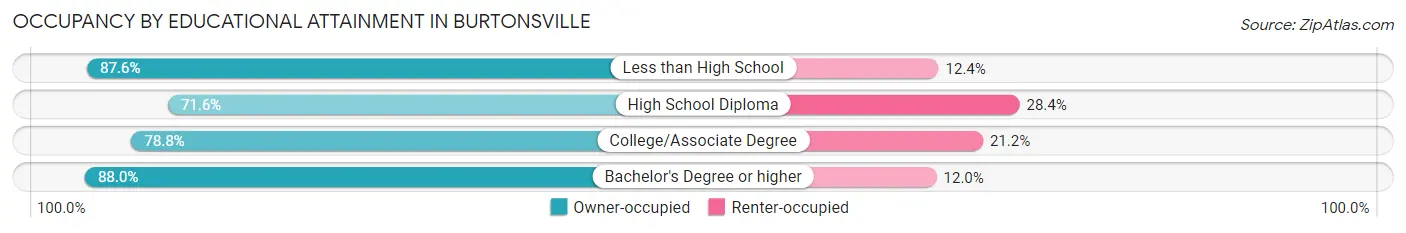
| Household Size | Owner-occupied | Renter-occupied |
| Less than High School | 92 (87.6%) | 13 (12.4%) |
| High School Diploma | 350 (71.6%) | 139 (28.4%) |
| College/Associate Degree | 737 (78.8%) | 198 (21.2%) |
| Bachelor's Degree or higher | 1,367 (88.0%) | 186 (12.0%) |
Occupancy by Age of Householder in Burtonsville
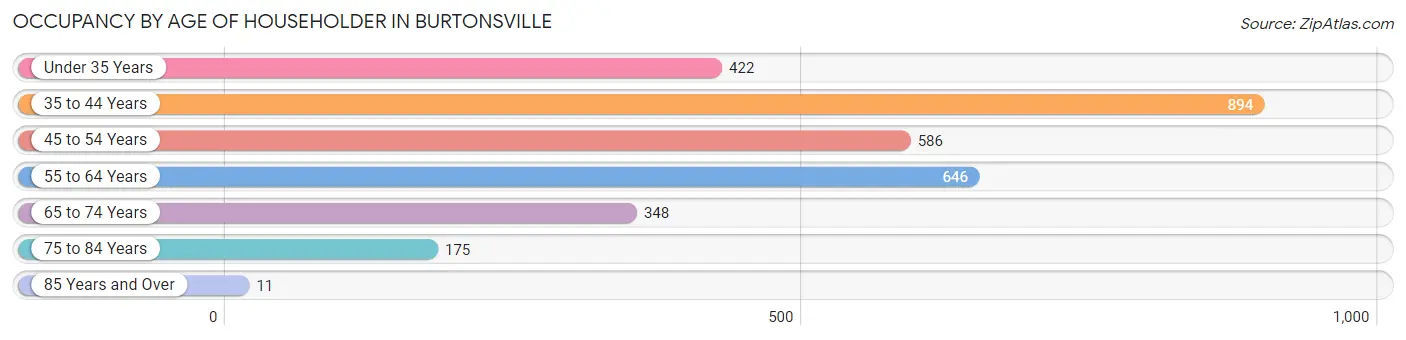
| Age Bracket | # Households | % Households |
| Under 35 Years | 422 | 13.7% |
| 35 to 44 Years | 894 | 29.0% |
| 45 to 54 Years | 586 | 19.0% |
| 55 to 64 Years | 646 | 21.0% |
| 65 to 74 Years | 348 | 11.3% |
| 75 to 84 Years | 175 | 5.7% |
| 85 Years and Over | 11 | 0.4% |
| Total | 3,082 | 100.0% |
Housing Finances in Burtonsville
Median Income by Occupancy in Burtonsville
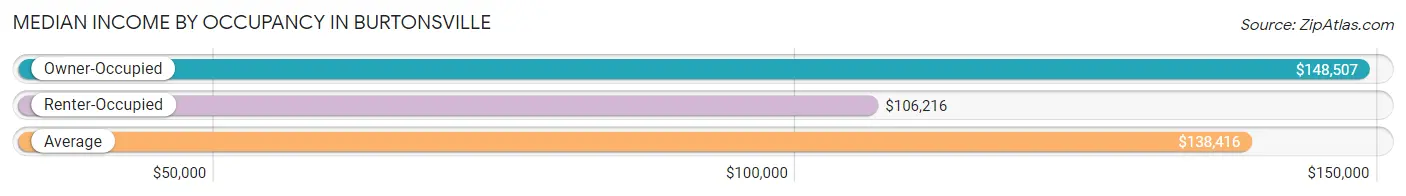
| Occupancy Type | # Households | Median Income |
| Owner-Occupied | 2,546 (82.6%) | $148,507 |
| Renter-Occupied | 536 (17.4%) | $106,216 |
| Average | 3,082 (100.0%) | $138,416 |
Occupancy by Householder Income Bracket in Burtonsville
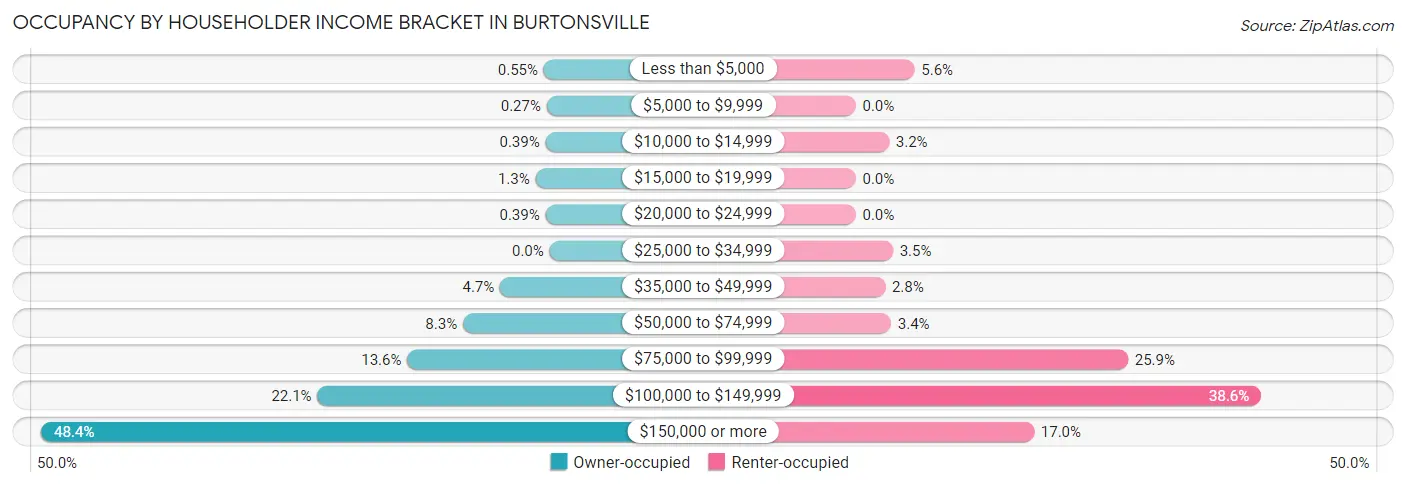
| Income Bracket | Owner-occupied | Renter-occupied |
| Less than $5,000 | 14 (0.5%) | 30 (5.6%) |
| $5,000 to $9,999 | 7 (0.3%) | 0 (0.0%) |
| $10,000 to $14,999 | 10 (0.4%) | 17 (3.2%) |
| $15,000 to $19,999 | 34 (1.3%) | 0 (0.0%) |
| $20,000 to $24,999 | 10 (0.4%) | 0 (0.0%) |
| $25,000 to $34,999 | 0 (0.0%) | 19 (3.5%) |
| $35,000 to $49,999 | 120 (4.7%) | 15 (2.8%) |
| $50,000 to $74,999 | 210 (8.3%) | 18 (3.4%) |
| $75,000 to $99,999 | 345 (13.6%) | 139 (25.9%) |
| $100,000 to $149,999 | 563 (22.1%) | 207 (38.6%) |
| $150,000 or more | 1,233 (48.4%) | 91 (17.0%) |
| Total | 2,546 (100.0%) | 536 (100.0%) |
Monthly Housing Cost Tiers in Burtonsville
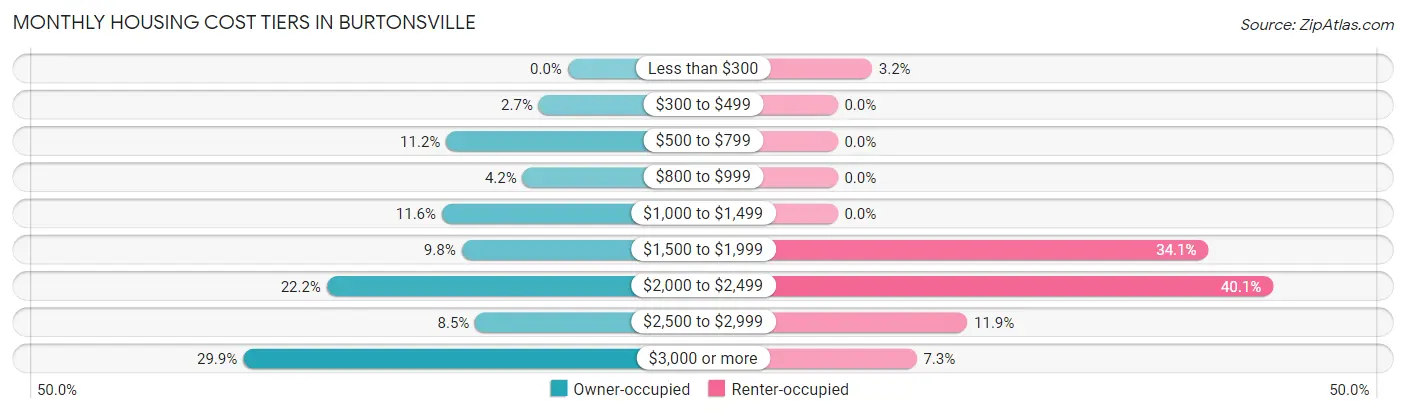
| Monthly Cost | Owner-occupied | Renter-occupied |
| Less than $300 | 0 (0.0%) | 17 (3.2%) |
| $300 to $499 | 68 (2.7%) | 0 (0.0%) |
| $500 to $799 | 285 (11.2%) | 0 (0.0%) |
| $800 to $999 | 106 (4.2%) | 0 (0.0%) |
| $1,000 to $1,499 | 295 (11.6%) | 0 (0.0%) |
| $1,500 to $1,999 | 249 (9.8%) | 183 (34.1%) |
| $2,000 to $2,499 | 565 (22.2%) | 215 (40.1%) |
| $2,500 to $2,999 | 217 (8.5%) | 64 (11.9%) |
| $3,000 or more | 761 (29.9%) | 39 (7.3%) |
| Total | 2,546 (100.0%) | 536 (100.0%) |
Physical Housing Characteristics in Burtonsville
Housing Structures in Burtonsville
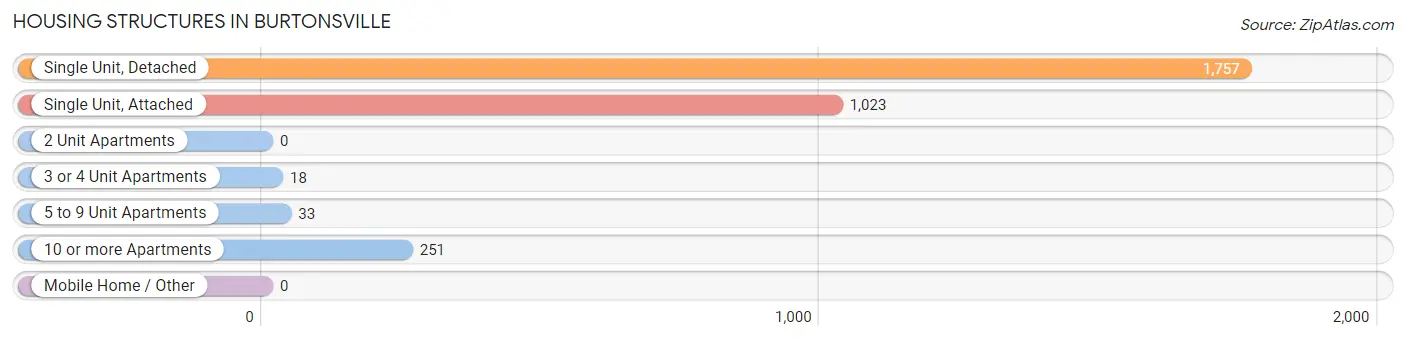
| Structure Type | # Housing Units | % Housing Units |
| Single Unit, Detached | 1,757 | 57.0% |
| Single Unit, Attached | 1,023 | 33.2% |
| 2 Unit Apartments | 0 | 0.0% |
| 3 or 4 Unit Apartments | 18 | 0.6% |
| 5 to 9 Unit Apartments | 33 | 1.1% |
| 10 or more Apartments | 251 | 8.1% |
| Mobile Home / Other | 0 | 0.0% |
| Total | 3,082 | 100.0% |
Housing Structures by Occupancy in Burtonsville
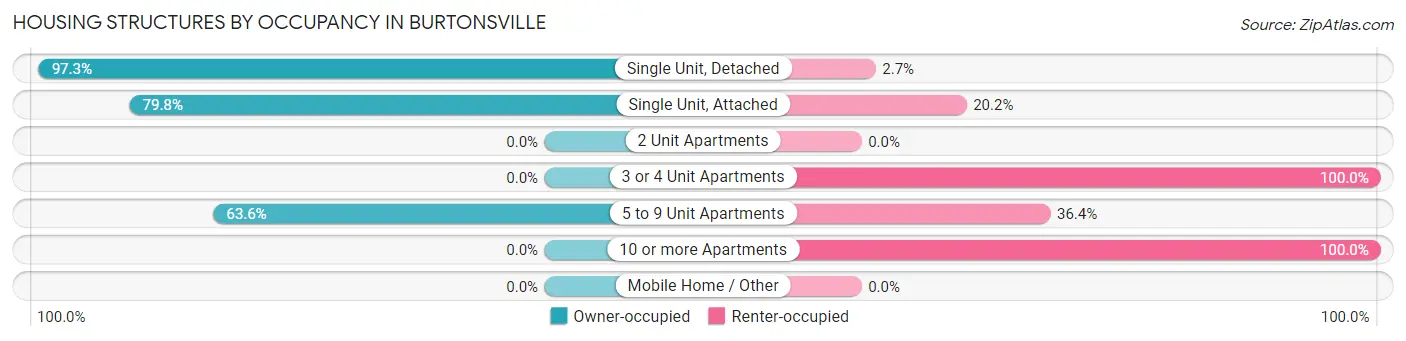
| Structure Type | Owner-occupied | Renter-occupied |
| Single Unit, Detached | 1,709 (97.3%) | 48 (2.7%) |
| Single Unit, Attached | 816 (79.8%) | 207 (20.2%) |
| 2 Unit Apartments | 0 (0.0%) | 0 (0.0%) |
| 3 or 4 Unit Apartments | 0 (0.0%) | 18 (100.0%) |
| 5 to 9 Unit Apartments | 21 (63.6%) | 12 (36.4%) |
| 10 or more Apartments | 0 (0.0%) | 251 (100.0%) |
| Mobile Home / Other | 0 (0.0%) | 0 (0.0%) |
| Total | 2,546 (82.6%) | 536 (17.4%) |
Housing Structures by Number of Rooms in Burtonsville
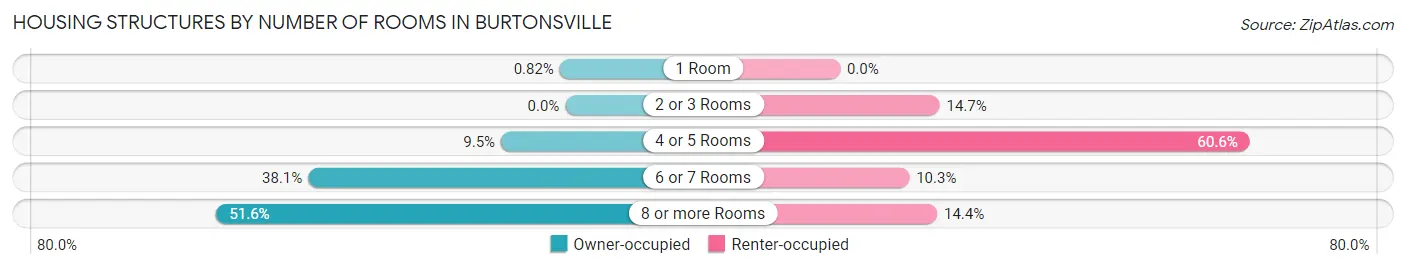
| Number of Rooms | Owner-occupied | Renter-occupied |
| 1 Room | 21 (0.8%) | 0 (0.0%) |
| 2 or 3 Rooms | 0 (0.0%) | 79 (14.7%) |
| 4 or 5 Rooms | 242 (9.5%) | 325 (60.6%) |
| 6 or 7 Rooms | 969 (38.1%) | 55 (10.3%) |
| 8 or more Rooms | 1,314 (51.6%) | 77 (14.4%) |
| Total | 2,546 (100.0%) | 536 (100.0%) |
Housing Structure by Heating Type in Burtonsville
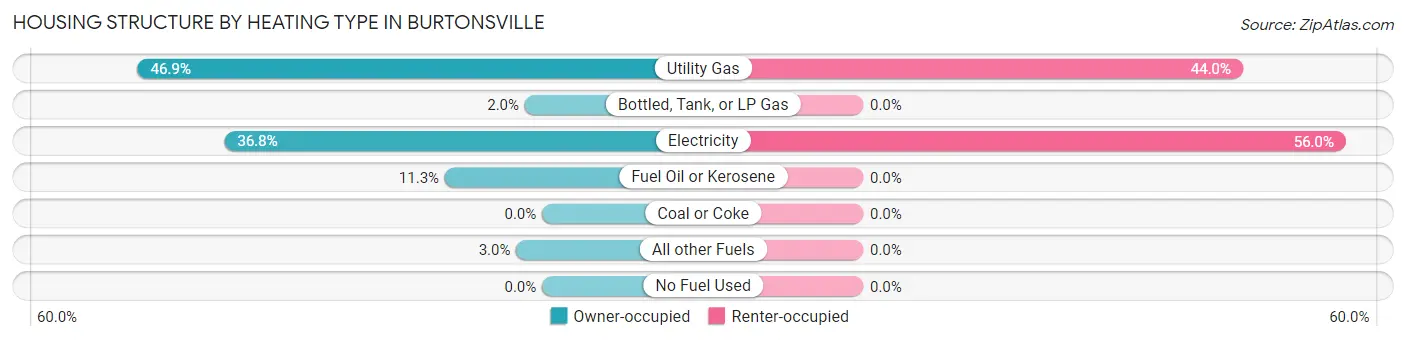
| Heating Type | Owner-occupied | Renter-occupied |
| Utility Gas | 1,194 (46.9%) | 236 (44.0%) |
| Bottled, Tank, or LP Gas | 51 (2.0%) | 0 (0.0%) |
| Electricity | 938 (36.8%) | 300 (56.0%) |
| Fuel Oil or Kerosene | 287 (11.3%) | 0 (0.0%) |
| Coal or Coke | 0 (0.0%) | 0 (0.0%) |
| All other Fuels | 76 (3.0%) | 0 (0.0%) |
| No Fuel Used | 0 (0.0%) | 0 (0.0%) |
| Total | 2,546 (100.0%) | 536 (100.0%) |
Household Vehicle Usage in Burtonsville
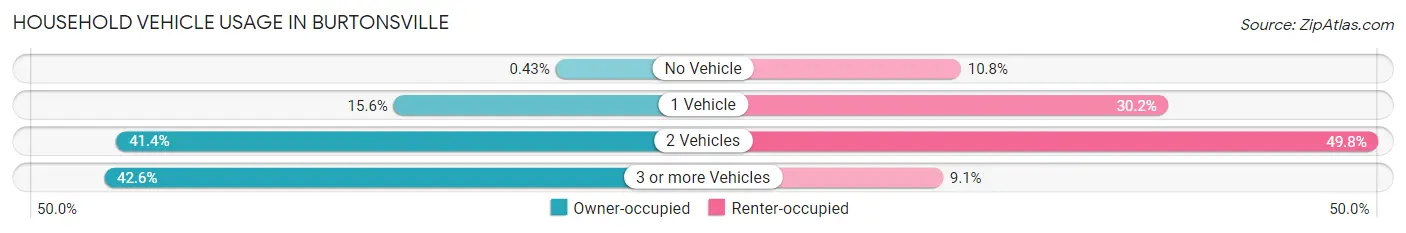
| Vehicles per Household | Owner-occupied | Renter-occupied |
| No Vehicle | 11 (0.4%) | 58 (10.8%) |
| 1 Vehicle | 396 (15.5%) | 162 (30.2%) |
| 2 Vehicles | 1,055 (41.4%) | 267 (49.8%) |
| 3 or more Vehicles | 1,084 (42.6%) | 49 (9.1%) |
| Total | 2,546 (100.0%) | 536 (100.0%) |
Real Estate & Mortgages in Burtonsville
Real Estate and Mortgage Overview in Burtonsville
| Characteristic | Without Mortgage | With Mortgage |
| Housing Units | 463 | 2,083 |
| Median Property Value | $537,700 | $465,800 |
| Median Household Income | $101,350 | $1,096 |
| Monthly Housing Costs | $863 | $761 |
| Real Estate Taxes | $5,387 | $26 |
Property Value by Mortgage Status in Burtonsville
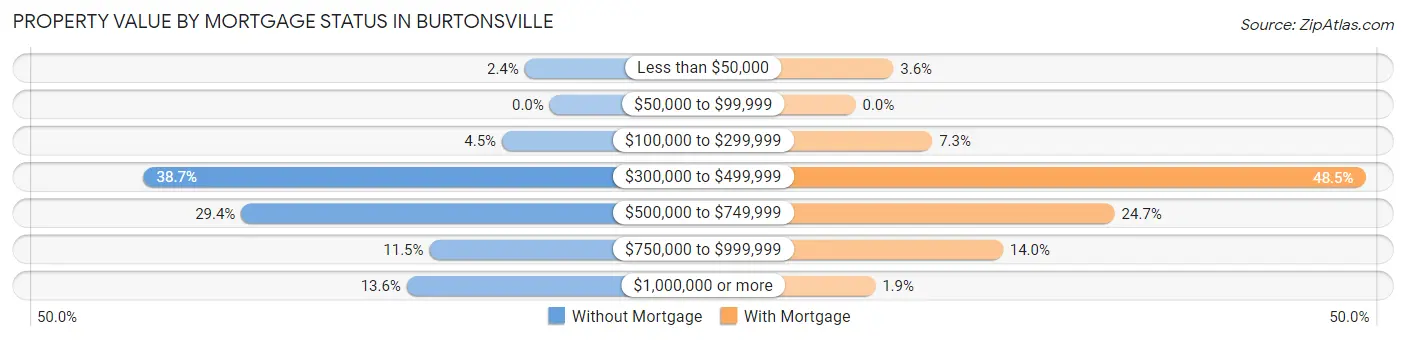
| Property Value | Without Mortgage | With Mortgage |
| Less than $50,000 | 11 (2.4%) | 75 (3.6%) |
| $50,000 to $99,999 | 0 (0.0%) | 0 (0.0%) |
| $100,000 to $299,999 | 21 (4.5%) | 152 (7.3%) |
| $300,000 to $499,999 | 179 (38.7%) | 1,011 (48.5%) |
| $500,000 to $749,999 | 136 (29.4%) | 514 (24.7%) |
| $750,000 to $999,999 | 53 (11.5%) | 292 (14.0%) |
| $1,000,000 or more | 63 (13.6%) | 39 (1.9%) |
| Total | 463 (100.0%) | 2,083 (100.0%) |
Household Income by Mortgage Status in Burtonsville
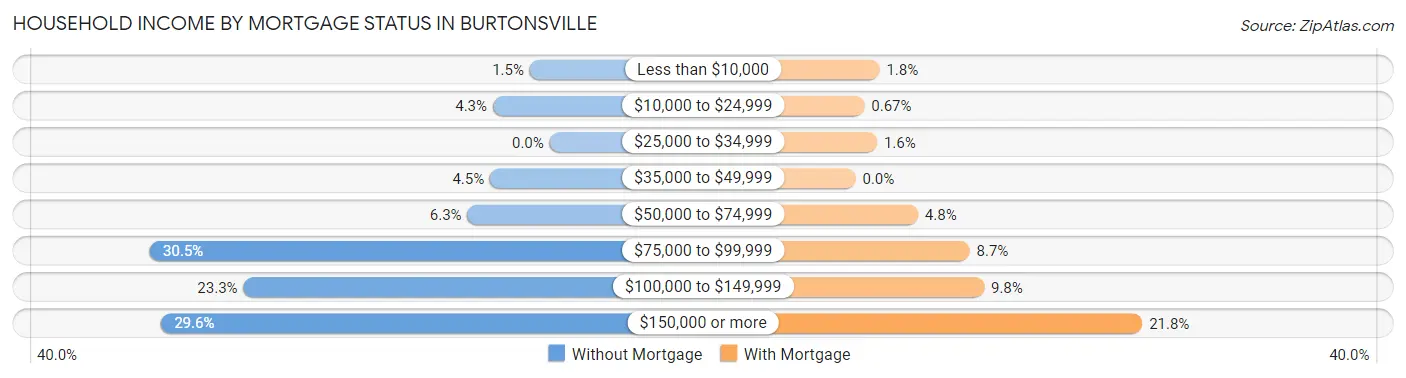
| Household Income | Without Mortgage | With Mortgage |
| Less than $10,000 | 7 (1.5%) | 38 (1.8%) |
| $10,000 to $24,999 | 20 (4.3%) | 14 (0.7%) |
| $25,000 to $34,999 | 0 (0.0%) | 34 (1.6%) |
| $35,000 to $49,999 | 21 (4.5%) | 0 (0.0%) |
| $50,000 to $74,999 | 29 (6.3%) | 99 (4.8%) |
| $75,000 to $99,999 | 141 (30.4%) | 181 (8.7%) |
| $100,000 to $149,999 | 108 (23.3%) | 204 (9.8%) |
| $150,000 or more | 137 (29.6%) | 455 (21.8%) |
| Total | 463 (100.0%) | 2,083 (100.0%) |
Property Value to Household Income Ratio in Burtonsville
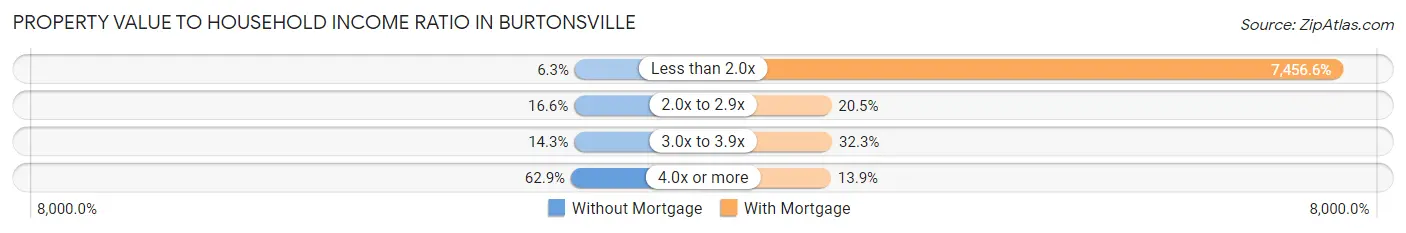
| Value-to-Income Ratio | Without Mortgage | With Mortgage |
| Less than 2.0x | 29 (6.3%) | 155,320 (7,456.6%) |
| 2.0x to 2.9x | 77 (16.6%) | 426 (20.4%) |
| 3.0x to 3.9x | 66 (14.2%) | 672 (32.3%) |
| 4.0x or more | 291 (62.8%) | 290 (13.9%) |
| Total | 463 (100.0%) | 2,083 (100.0%) |
Real Estate Taxes by Mortgage Status in Burtonsville
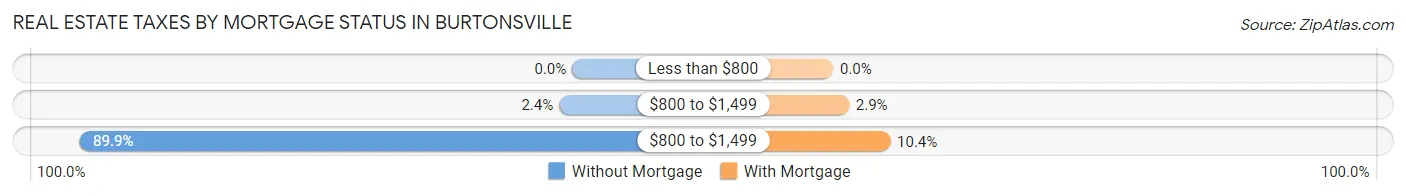
| Property Taxes | Without Mortgage | With Mortgage |
| Less than $800 | 0 (0.0%) | 0 (0.0%) |
| $800 to $1,499 | 11 (2.4%) | 60 (2.9%) |
| $800 to $1,499 | 416 (89.8%) | 217 (10.4%) |
| Total | 463 (100.0%) | 2,083 (100.0%) |
Health & Disability in Burtonsville
Health Insurance Coverage by Age in Burtonsville
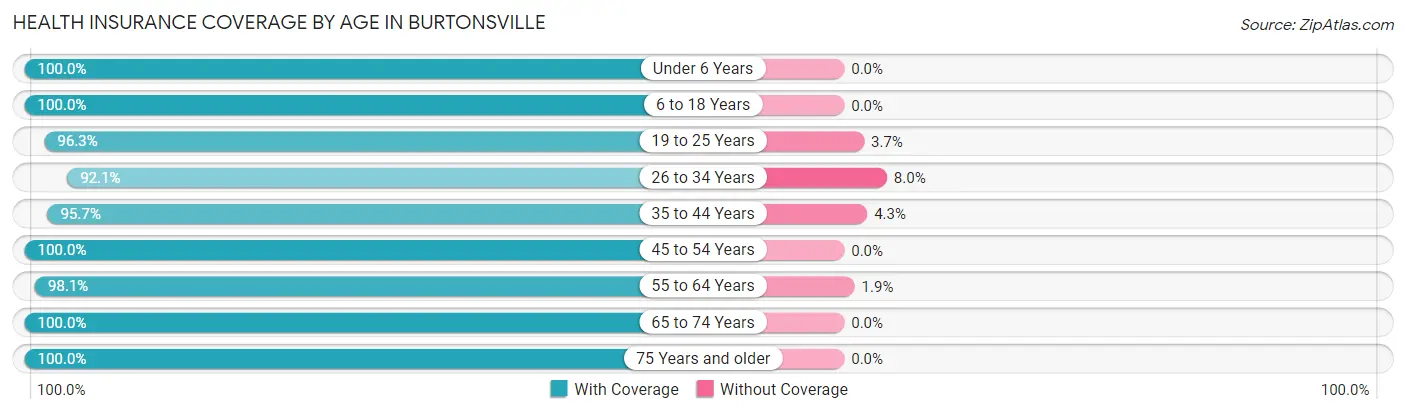
| Age Bracket | With Coverage | Without Coverage |
| Under 6 Years | 702 (100.0%) | 0 (0.0%) |
| 6 to 18 Years | 1,845 (100.0%) | 0 (0.0%) |
| 19 to 25 Years | 652 (96.3%) | 25 (3.7%) |
| 26 to 34 Years | 1,169 (92.0%) | 101 (8.0%) |
| 35 to 44 Years | 1,727 (95.7%) | 77 (4.3%) |
| 45 to 54 Years | 1,236 (100.0%) | 0 (0.0%) |
| 55 to 64 Years | 1,371 (98.1%) | 27 (1.9%) |
| 65 to 74 Years | 930 (100.0%) | 0 (0.0%) |
| 75 Years and older | 452 (100.0%) | 0 (0.0%) |
| Total | 10,084 (97.8%) | 230 (2.2%) |
Health Insurance Coverage by Citizenship Status in Burtonsville
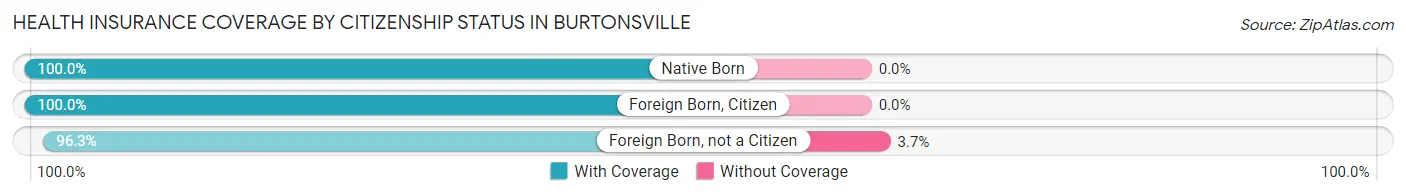
| Citizenship Status | With Coverage | Without Coverage |
| Native Born | 702 (100.0%) | 0 (0.0%) |
| Foreign Born, Citizen | 1,845 (100.0%) | 0 (0.0%) |
| Foreign Born, not a Citizen | 652 (96.3%) | 25 (3.7%) |
Health Insurance Coverage by Household Income in Burtonsville
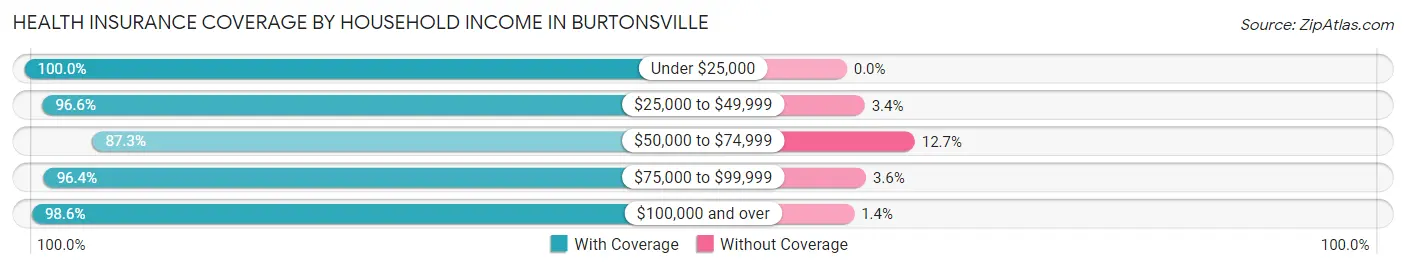
| Household Income | With Coverage | Without Coverage |
| Under $25,000 | 225 (100.0%) | 0 (0.0%) |
| $25,000 to $49,999 | 460 (96.6%) | 16 (3.4%) |
| $50,000 to $74,999 | 404 (87.3%) | 59 (12.7%) |
| $75,000 to $99,999 | 1,236 (96.4%) | 46 (3.6%) |
| $100,000 and over | 7,745 (98.6%) | 109 (1.4%) |
Public vs Private Health Insurance Coverage by Age in Burtonsville
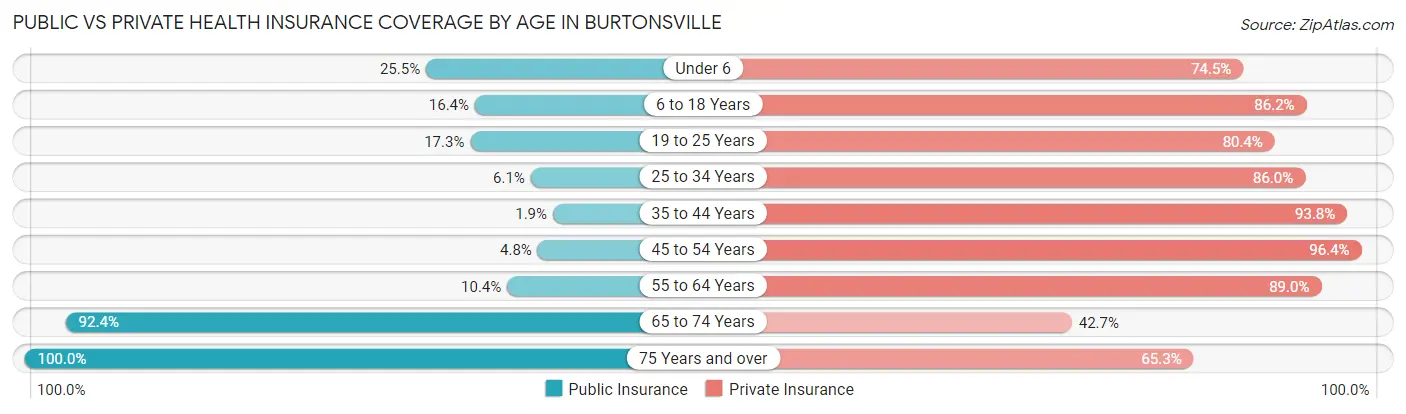
| Age Bracket | Public Insurance | Private Insurance |
| Under 6 | 179 (25.5%) | 523 (74.5%) |
| 6 to 18 Years | 303 (16.4%) | 1,591 (86.2%) |
| 19 to 25 Years | 117 (17.3%) | 544 (80.3%) |
| 25 to 34 Years | 77 (6.1%) | 1,092 (86.0%) |
| 35 to 44 Years | 35 (1.9%) | 1,692 (93.8%) |
| 45 to 54 Years | 59 (4.8%) | 1,192 (96.4%) |
| 55 to 64 Years | 146 (10.4%) | 1,244 (89.0%) |
| 65 to 74 Years | 859 (92.4%) | 397 (42.7%) |
| 75 Years and over | 452 (100.0%) | 295 (65.3%) |
| Total | 2,227 (21.6%) | 8,570 (83.1%) |
Disability Status by Sex by Age in Burtonsville
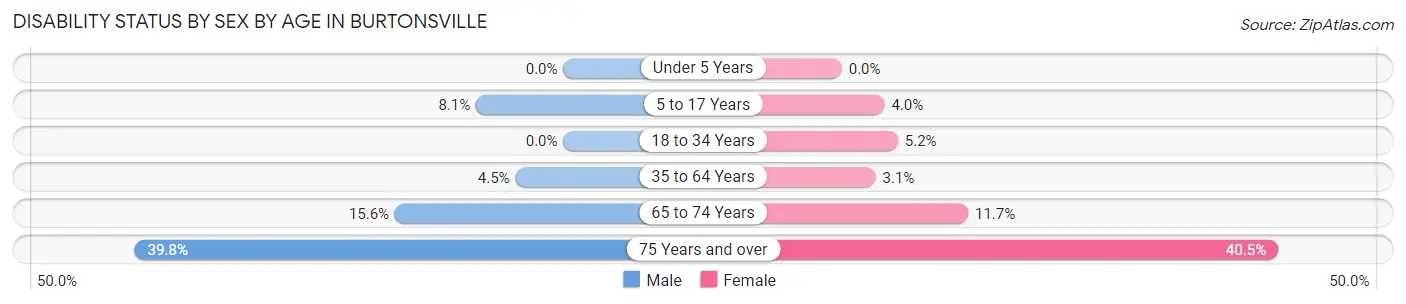
| Age Bracket | Male | Female |
| Under 5 Years | 0 (0.0%) | 0 (0.0%) |
| 5 to 17 Years | 76 (8.1%) | 33 (4.0%) |
| 18 to 34 Years | 0 (0.0%) | 47 (5.2%) |
| 35 to 64 Years | 94 (4.4%) | 73 (3.1%) |
| 65 to 74 Years | 88 (15.6%) | 43 (11.7%) |
| 75 Years and over | 113 (39.8%) | 68 (40.5%) |
Disability Class by Sex by Age in Burtonsville
Disability Class: Hearing Difficulty
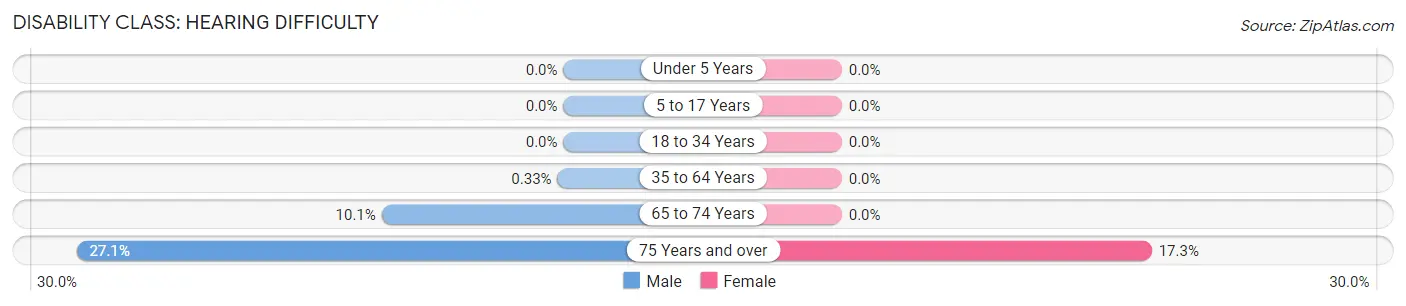
| Age Bracket | Male | Female |
| Under 5 Years | 0 (0.0%) | 0 (0.0%) |
| 5 to 17 Years | 0 (0.0%) | 0 (0.0%) |
| 18 to 34 Years | 0 (0.0%) | 0 (0.0%) |
| 35 to 64 Years | 7 (0.3%) | 0 (0.0%) |
| 65 to 74 Years | 57 (10.1%) | 0 (0.0%) |
| 75 Years and over | 77 (27.1%) | 29 (17.3%) |
Disability Class: Vision Difficulty
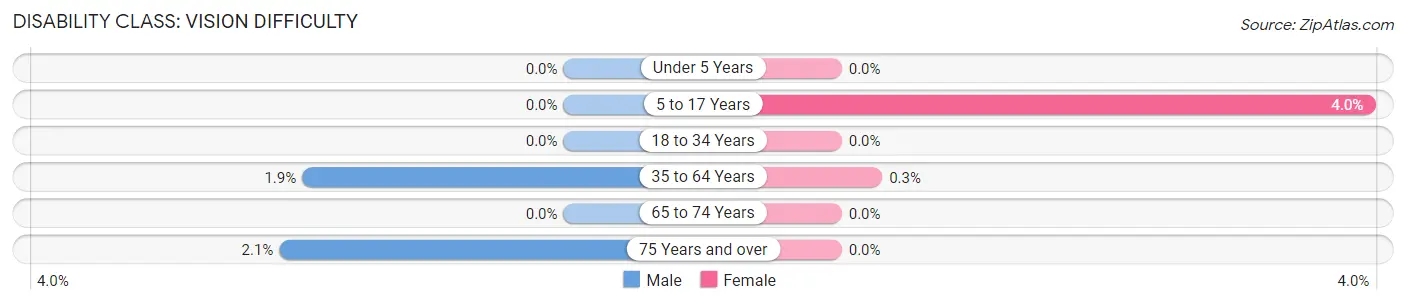
| Age Bracket | Male | Female |
| Under 5 Years | 0 (0.0%) | 0 (0.0%) |
| 5 to 17 Years | 0 (0.0%) | 33 (4.0%) |
| 18 to 34 Years | 0 (0.0%) | 0 (0.0%) |
| 35 to 64 Years | 41 (1.9%) | 7 (0.3%) |
| 65 to 74 Years | 0 (0.0%) | 0 (0.0%) |
| 75 Years and over | 6 (2.1%) | 0 (0.0%) |
Disability Class: Cognitive Difficulty
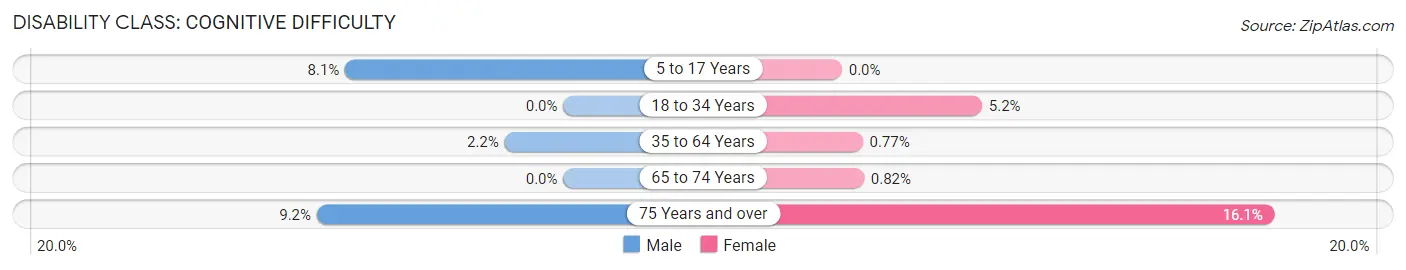
| Age Bracket | Male | Female |
| 5 to 17 Years | 76 (8.1%) | 0 (0.0%) |
| 18 to 34 Years | 0 (0.0%) | 47 (5.2%) |
| 35 to 64 Years | 46 (2.2%) | 18 (0.8%) |
| 65 to 74 Years | 0 (0.0%) | 3 (0.8%) |
| 75 Years and over | 26 (9.1%) | 27 (16.1%) |
Disability Class: Ambulatory Difficulty
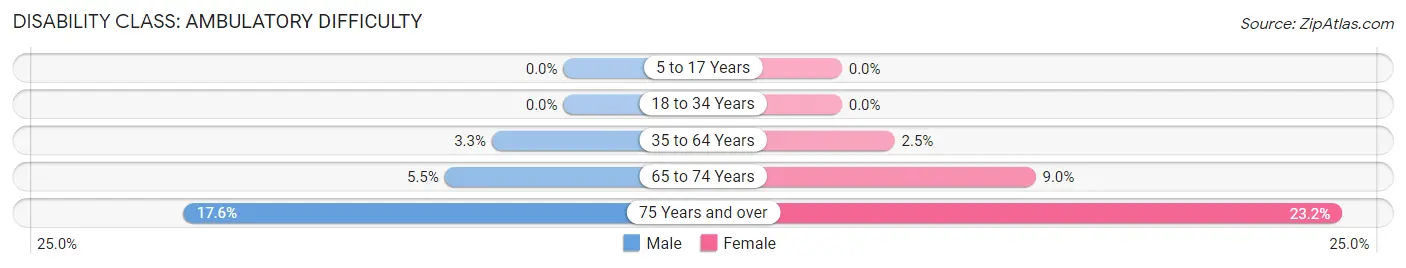
| Age Bracket | Male | Female |
| 5 to 17 Years | 0 (0.0%) | 0 (0.0%) |
| 18 to 34 Years | 0 (0.0%) | 0 (0.0%) |
| 35 to 64 Years | 70 (3.3%) | 57 (2.5%) |
| 65 to 74 Years | 31 (5.5%) | 33 (9.0%) |
| 75 Years and over | 50 (17.6%) | 39 (23.2%) |
Disability Class: Self-Care Difficulty
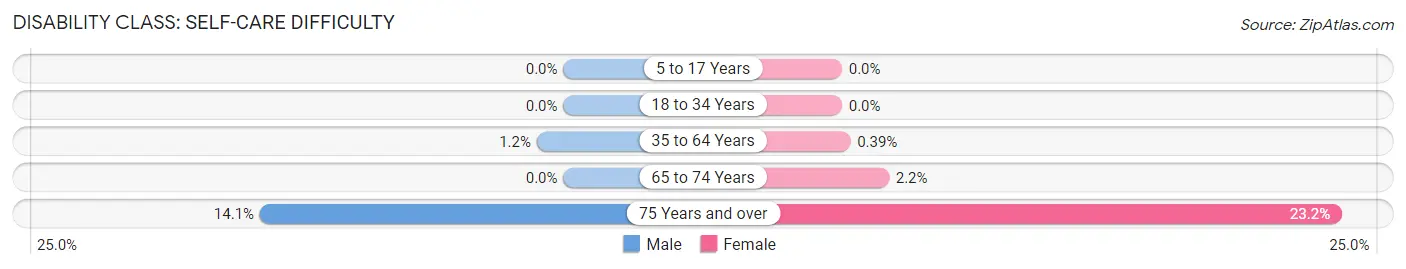
| Age Bracket | Male | Female |
| 5 to 17 Years | 0 (0.0%) | 0 (0.0%) |
| 18 to 34 Years | 0 (0.0%) | 0 (0.0%) |
| 35 to 64 Years | 26 (1.2%) | 9 (0.4%) |
| 65 to 74 Years | 0 (0.0%) | 8 (2.2%) |
| 75 Years and over | 40 (14.1%) | 39 (23.2%) |
Technology Access in Burtonsville
Computing Device Access in Burtonsville
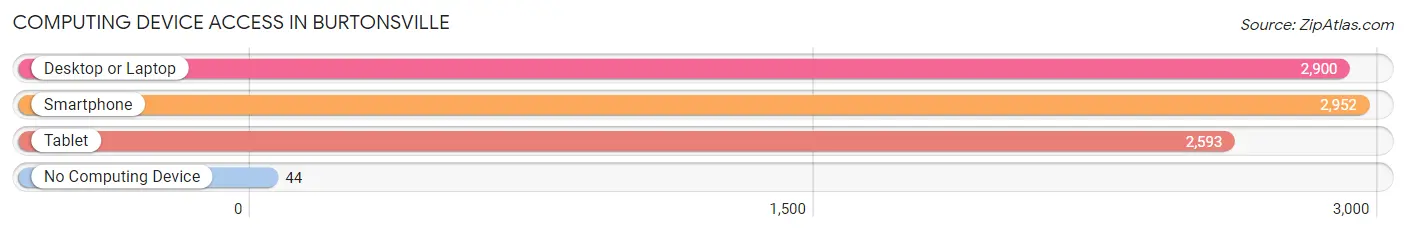
| Device Type | # Households | % Households |
| Desktop or Laptop | 2,900 | 94.1% |
| Smartphone | 2,952 | 95.8% |
| Tablet | 2,593 | 84.1% |
| No Computing Device | 44 | 1.4% |
| Total | 3,082 | 100.0% |
Internet Access in Burtonsville
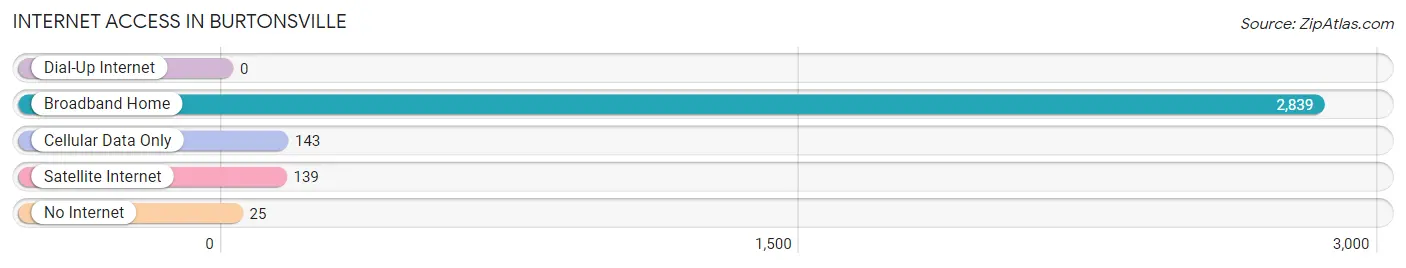
| Internet Type | # Households | % Households |
| Dial-Up Internet | 0 | 0.0% |
| Broadband Home | 2,839 | 92.1% |
| Cellular Data Only | 143 | 4.6% |
| Satellite Internet | 139 | 4.5% |
| No Internet | 25 | 0.8% |
| Total | 3,082 | 100.0% |
Burtonsville Summary
Burtonsville is an unincorporated community located in Montgomery County, Maryland, United States. It is located approximately 20 miles north of Washington, D.C. and is part of the Washington metropolitan area. The population of Burtonsville was estimated to be around 10,000 in 2020.
History
Burtonsville was first settled in the late 1700s by the Burton family, who were among the first settlers in the area. The family owned a large tract of land in the area, which was eventually divided up and sold off to other settlers. The area was known as Burton's Crossroads, and the community was officially established in 1871.
The area was primarily agricultural until the 1950s, when the construction of the Washington Beltway and other highways made it easier for people to commute to Washington, D.C. and other nearby cities. This led to an influx of new residents and businesses, and the area began to develop rapidly.
Geography
Burtonsville is located in Montgomery County, Maryland, approximately 20 miles north of Washington, D.C. It is bordered by the towns of Olney to the north, Silver Spring to the east, and Columbia to the south. The area is mostly flat, with some rolling hills in the northern part of the community. The area is also home to several parks and recreational areas, including the Patuxent River State Park and the Burtonsville Community Park.
Economy
Burtonsville is primarily a residential community, but it is also home to several businesses and industries. The area is home to several large retail stores, including a Walmart Supercenter, a Target, and a Home Depot. There are also several restaurants, banks, and other businesses located in the area.
The area is also home to several government agencies, including the National Institutes of Health, the National Institute of Standards and Technology, and the National Oceanic and Atmospheric Administration.
Demographics
As of the 2010 census, the population of Burtonsville was estimated to be around 10,000. The racial makeup of the community was 57.3% White, 22.2% African American, 0.3% Native American, 8.2% Asian, 0.1% Pacific Islander, and 11.9% from other races. The median household income was $90,945, and the median family income was $103,945.
Burtonsville is a diverse community, with a variety of cultures and backgrounds represented. The area is home to a large Hispanic population, as well as a growing Asian population. The area is also home to a large Jewish population, with several synagogues located in the area.
Common Questions
What is Per Capita Income in Burtonsville?
Per Capita income in Burtonsville is $48,711.
What is the Median Family Income in Burtonsville?
Median Family Income in Burtonsville is $147,222.
What is the Median Household income in Burtonsville?
Median Household Income in Burtonsville is $138,416.
What is Income or Wage Gap in Burtonsville?
Income or Wage Gap in Burtonsville is 28.6%.
Women in Burtonsville earn 71.4 cents for every dollar earned by a man.
What is Inequality or Gini Index in Burtonsville?
Inequality or Gini Index in Burtonsville is 0.35.
What is the Total Population of Burtonsville?
Total Population of Burtonsville is 10,316.
What is the Total Male Population of Burtonsville?
Total Male Population of Burtonsville is 5,532.
What is the Total Female Population of Burtonsville?
Total Female Population of Burtonsville is 4,784.
What is the Ratio of Males per 100 Females in Burtonsville?
There are 115.64 Males per 100 Females in Burtonsville.
What is the Ratio of Females per 100 Males in Burtonsville?
There are 86.48 Females per 100 Males in Burtonsville.
What is the Median Population Age in Burtonsville?
Median Population Age in Burtonsville is 38.3 Years.
What is the Average Family Size in Burtonsville
Average Family Size in Burtonsville is 3.6 People.
What is the Average Household Size in Burtonsville
Average Household Size in Burtonsville is 3.3 People.
How Large is the Labor Force in Burtonsville?
There are 6,258 People in the Labor Forcein in Burtonsville.
What is the Percentage of People in the Labor Force in Burtonsville?
76.2% of People are in the Labor Force in Burtonsville.
What is the Unemployment Rate in Burtonsville?
Unemployment Rate in Burtonsville is 4.5%.