Pendergrass, GA Map & Demographics
Pendergrass Map
Pendergrass Overview
$23,879
PER CAPITA INCOME
$61,654
AVG FAMILY INCOME
$73,947
AVG HOUSEHOLD INCOME
39.1%
WAGE / INCOME GAP [ % ]
60.9¢/ $1
WAGE / INCOME GAP [ $ ]
0.36
INEQUALITY / GINI INDEX
1,705
TOTAL POPULATION
848
MALE POPULATION
857
FEMALE POPULATION
98.95
MALES / 100 FEMALES
101.06
FEMALES / 100 MALES
31.8
MEDIAN AGE
3.5
AVG FAMILY SIZE
3.2
AVG HOUSEHOLD SIZE
911
LABOR FORCE [ PEOPLE ]
78.7%
PERCENT IN LABOR FORCE
2.9%
UNEMPLOYMENT RATE
Pendergrass Zip Codes
Pendergrass Area Codes
Income in Pendergrass
Income Overview in Pendergrass
Per Capita Income in Pendergrass is $23,879, while median incomes of families and households are $61,654 and $73,947 respectively.
| Characteristic | Number | Measure |
| Per Capita Income | 1,705 | $23,879 |
| Median Family Income | 425 | $61,654 |
| Mean Family Income | 425 | $69,681 |
| Median Household Income | 524 | $73,947 |
| Mean Household Income | 524 | $73,718 |
| Income Deficit | 425 | $0 |
| Wage / Income Gap (%) | 1,705 | 39.06% |
| Wage / Income Gap ($) | 1,705 | 60.94¢ per $1 |
| Gini / Inequality Index | 1,705 | 0.36 |
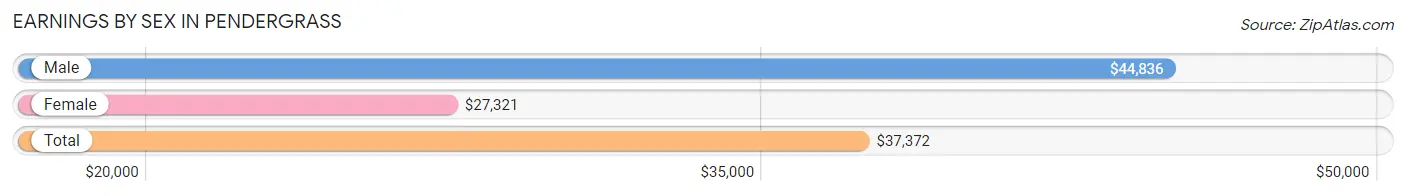
Earnings by Sex in Pendergrass
Average Earnings in Pendergrass are $37,372, $44,836 for men and $27,321 for women, a difference of 39.1%.
| Sex | Number | Average Earnings |
| Male | 493 (53.5%) | $44,836 |
| Female | 429 (46.5%) | $27,321 |
| Total | 922 (100.0%) | $37,372 |
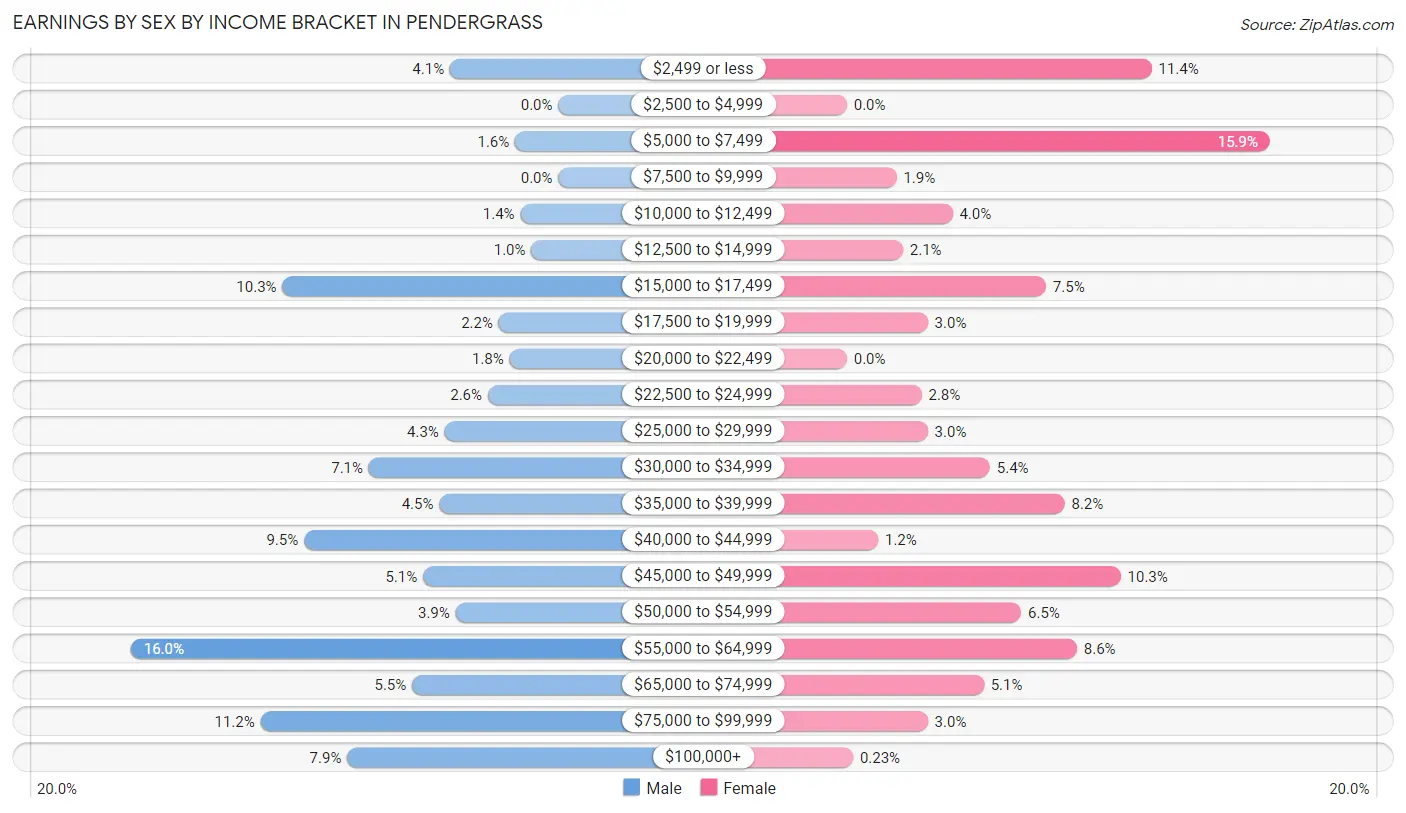
Earnings by Sex by Income Bracket in Pendergrass
The most common earnings brackets in Pendergrass are $55,000 to $64,999 for men (79 | 16.0%) and $5,000 to $7,499 for women (68 | 15.9%).
| Income | Male | Female |
| $2,499 or less | 20 (4.1%) | 49 (11.4%) |
| $2,500 to $4,999 | 0 (0.0%) | 0 (0.0%) |
| $5,000 to $7,499 | 8 (1.6%) | 68 (15.9%) |
| $7,500 to $9,999 | 0 (0.0%) | 8 (1.9%) |
| $10,000 to $12,499 | 7 (1.4%) | 17 (4.0%) |
| $12,500 to $14,999 | 5 (1.0%) | 9 (2.1%) |
| $15,000 to $17,499 | 51 (10.3%) | 32 (7.5%) |
| $17,500 to $19,999 | 11 (2.2%) | 13 (3.0%) |
| $20,000 to $22,499 | 9 (1.8%) | 0 (0.0%) |
| $22,500 to $24,999 | 13 (2.6%) | 12 (2.8%) |
| $25,000 to $29,999 | 21 (4.3%) | 13 (3.0%) |
| $30,000 to $34,999 | 35 (7.1%) | 23 (5.4%) |
| $35,000 to $39,999 | 22 (4.5%) | 35 (8.2%) |
| $40,000 to $44,999 | 47 (9.5%) | 5 (1.2%) |
| $45,000 to $49,999 | 25 (5.1%) | 44 (10.3%) |
| $50,000 to $54,999 | 19 (3.8%) | 28 (6.5%) |
| $55,000 to $64,999 | 79 (16.0%) | 37 (8.6%) |
| $65,000 to $74,999 | 27 (5.5%) | 22 (5.1%) |
| $75,000 to $99,999 | 55 (11.2%) | 13 (3.0%) |
| $100,000+ | 39 (7.9%) | 1 (0.2%) |
| Total | 493 (100.0%) | 429 (100.0%) |
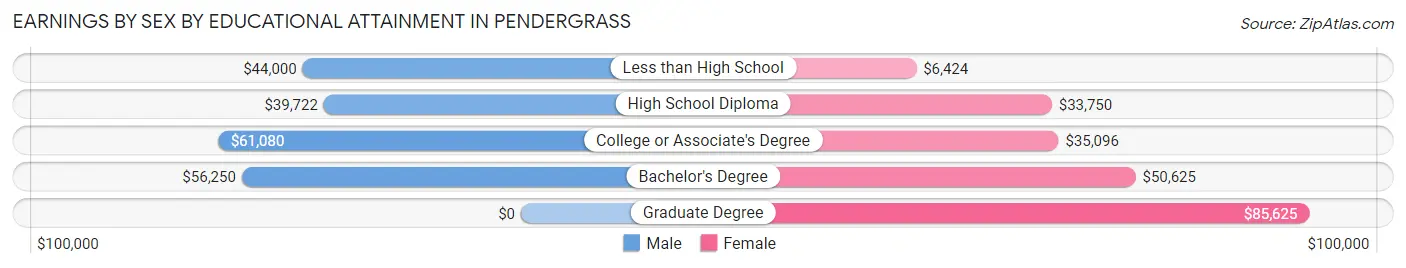
Earnings by Sex by Educational Attainment in Pendergrass
Average earnings in Pendergrass are $45,208 for men and $32,578 for women, a difference of 27.9%. Men with an educational attainment of college or associate's degree enjoy the highest average annual earnings of $61,080, while those with high school diploma education earn the least with $39,722. Women with an educational attainment of graduate degree earn the most with the average annual earnings of $85,625, while those with less than high school education have the smallest earnings of $6,424.
| Educational Attainment | Male Income | Female Income |
| Less than High School | $44,000 | $6,424 |
| High School Diploma | $39,722 | $33,750 |
| College or Associate's Degree | $61,080 | $35,096 |
| Bachelor's Degree | $56,250 | $50,625 |
| Graduate Degree | - | - |
| Total | $45,208 | $32,578 |
Family Income in Pendergrass
Family Income Brackets in Pendergrass
According to the Pendergrass family income data, there are 91 families falling into the $50,000 to $74,999 income range, which is the most common income bracket and makes up 21.4% of all families. Conversely, the $15,000 to $24,999 income bracket is the least frequent group with only 3 families (0.7%) belonging to this category.
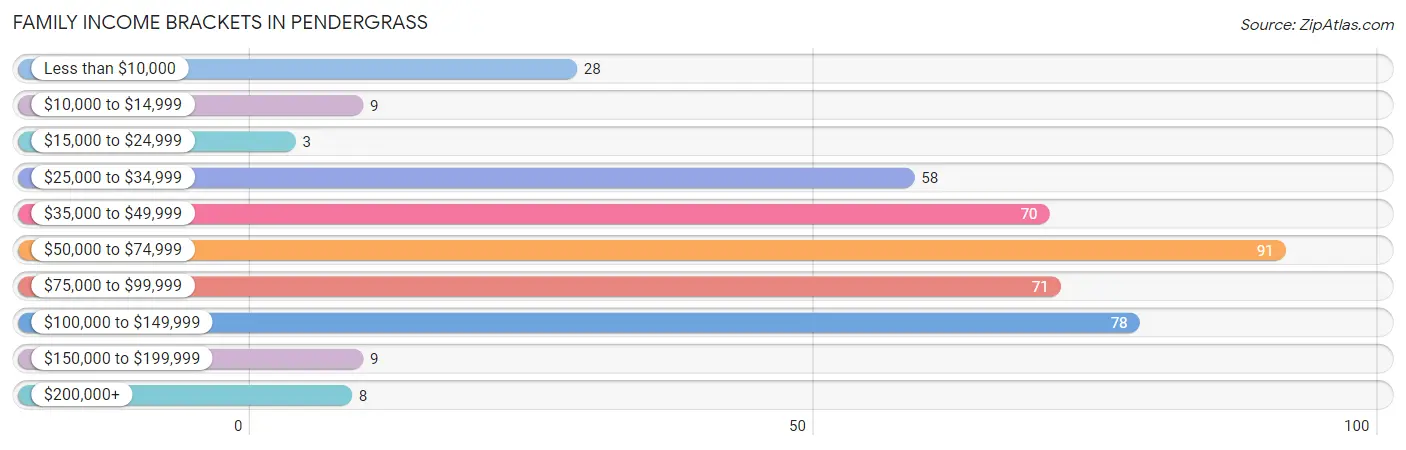
| Income Bracket | # Families | % Families |
| Less than $10,000 | 28 | 6.6% |
| $10,000 to $14,999 | 9 | 2.1% |
| $15,000 to $24,999 | 3 | 0.7% |
| $25,000 to $34,999 | 58 | 13.6% |
| $35,000 to $49,999 | 70 | 16.5% |
| $50,000 to $74,999 | 91 | 21.4% |
| $75,000 to $99,999 | 71 | 16.7% |
| $100,000 to $149,999 | 78 | 18.4% |
| $150,000 to $199,999 | 9 | 2.1% |
| $200,000+ | 8 | 1.9% |
Family Income by Famaliy Size in Pendergrass
7+ person families (9 | 2.1%) account for the highest median family income in Pendergrass with $129,583 per family, while 2-person families (155 | 36.5%) have the highest median income of $21,094 per family member.
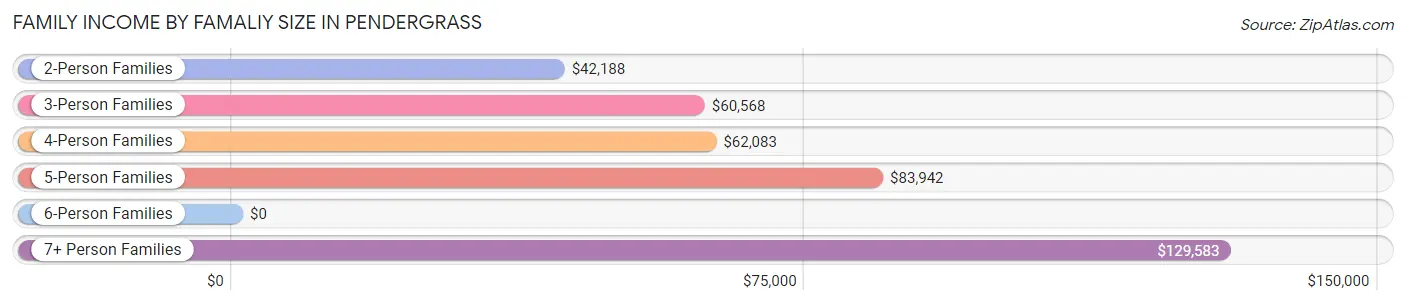
| Income Bracket | # Families | Median Income |
| 2-Person Families | 155 (36.5%) | $42,188 |
| 3-Person Families | 98 (23.1%) | $60,568 |
| 4-Person Families | 106 (24.9%) | $62,083 |
| 5-Person Families | 47 (11.1%) | $83,942 |
| 6-Person Families | 10 (2.4%) | $0 |
| 7+ Person Families | 9 (2.1%) | $129,583 |
| Total | 425 (100.0%) | $61,654 |
Family Income by Number of Earners in Pendergrass
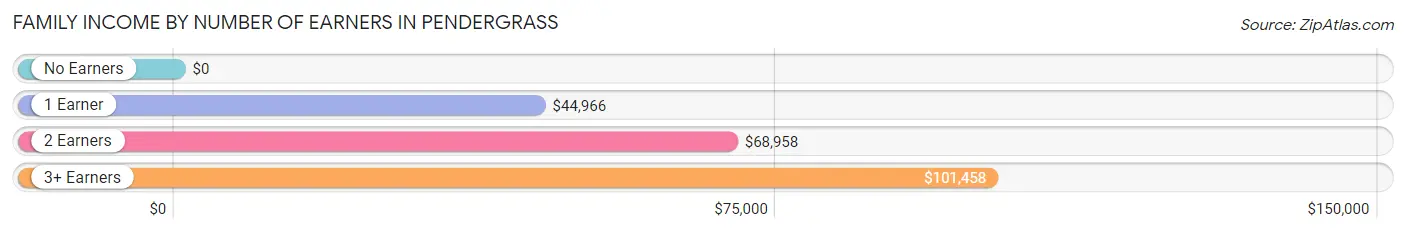
| Number of Earners | # Families | Median Income |
| No Earners | 18 (4.2%) | $0 |
| 1 Earner | 201 (47.3%) | $44,966 |
| 2 Earners | 163 (38.4%) | $68,958 |
| 3+ Earners | 43 (10.1%) | $101,458 |
| Total | 425 (100.0%) | $61,654 |
Household Income in Pendergrass
Household Income Brackets in Pendergrass
With 115 households falling in the category, the $100,000 to $149,999 income range is the most frequent in Pendergrass, accounting for 22.0% of all households. In contrast, only 8 households (1.5%) fall into the $15,000 to $24,999 income bracket, making it the least populous group.
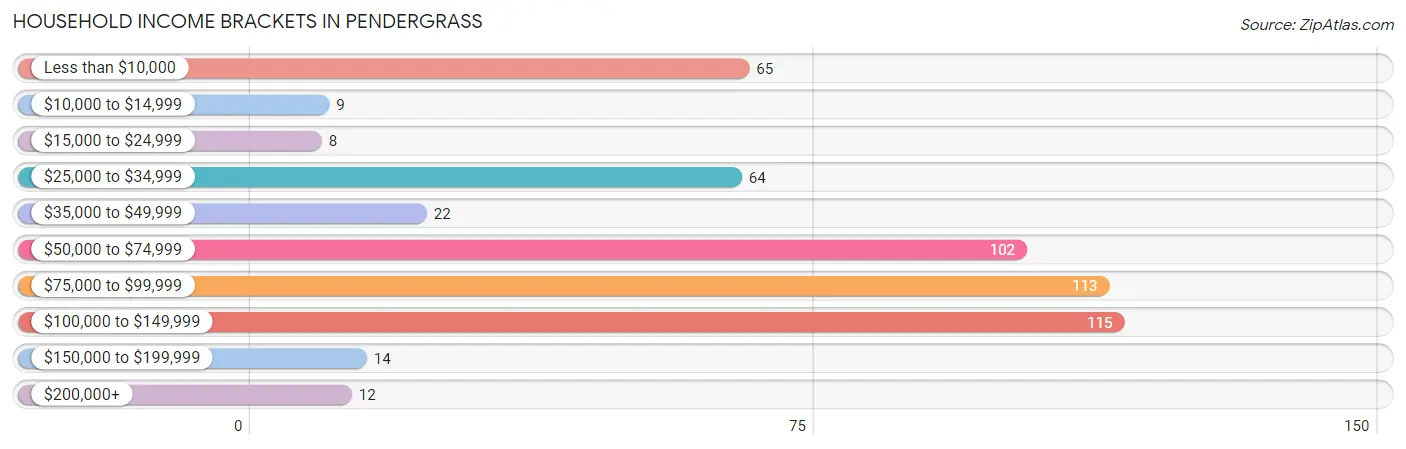
| Income Bracket | # Households | % Households |
| Less than $10,000 | 65 | 12.4% |
| $10,000 to $14,999 | 9 | 1.7% |
| $15,000 to $24,999 | 8 | 1.5% |
| $25,000 to $34,999 | 64 | 12.2% |
| $35,000 to $49,999 | 22 | 4.2% |
| $50,000 to $74,999 | 102 | 19.5% |
| $75,000 to $99,999 | 113 | 21.6% |
| $100,000 to $149,999 | 115 | 21.9% |
| $150,000 to $199,999 | 14 | 2.7% |
| $200,000+ | 12 | 2.3% |
Household Income by Householder Age in Pendergrass
The median household income in Pendergrass is $73,947, with the highest median household income of $90,250 found in the 25 to 44 years age bracket for the primary householder. A total of 236 households (45.0%) fall into this category. Meanwhile, the 15 to 24 years age bracket for the primary householder has the lowest median household income of $0, with 14 households (2.7%) in this group.
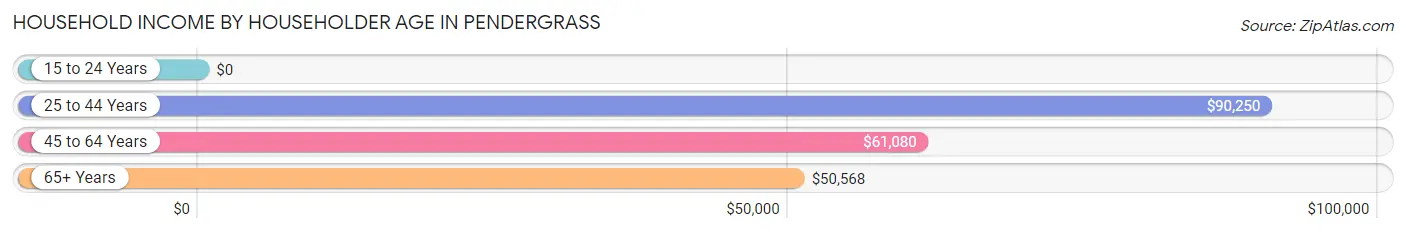
| Income Bracket | # Households | Median Income |
| 15 to 24 Years | 14 (2.7%) | $0 |
| 25 to 44 Years | 236 (45.0%) | $90,250 |
| 45 to 64 Years | 227 (43.3%) | $61,080 |
| 65+ Years | 47 (9.0%) | $50,568 |
| Total | 524 (100.0%) | $73,947 |
Poverty in Pendergrass
Income Below Poverty by Sex and Age in Pendergrass
With 9.6% poverty level for males and 9.0% for females among the residents of Pendergrass, under 5 year old males and 55 to 64 year old females are the most vulnerable to poverty, with 20 males (41.7%) and 40 females (43.5%) in their respective age groups living below the poverty level.
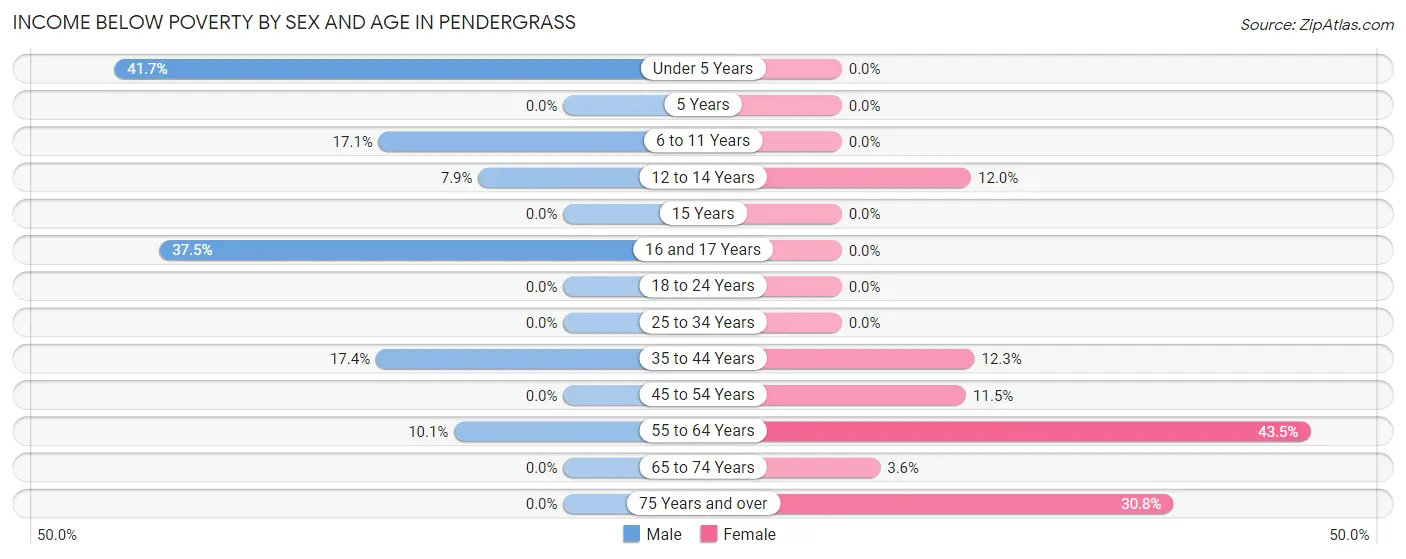
| Age Bracket | Male | Female |
| Under 5 Years | 20 (41.7%) | 0 (0.0%) |
| 5 Years | 0 (0.0%) | 0 (0.0%) |
| 6 to 11 Years | 24 (17.1%) | 0 (0.0%) |
| 12 to 14 Years | 6 (7.9%) | 3 (12.0%) |
| 15 Years | 0 (0.0%) | 0 (0.0%) |
| 16 and 17 Years | 3 (37.5%) | 0 (0.0%) |
| 18 to 24 Years | 0 (0.0%) | 0 (0.0%) |
| 25 to 34 Years | 0 (0.0%) | 0 (0.0%) |
| 35 to 44 Years | 20 (17.4%) | 17 (12.3%) |
| 45 to 54 Years | 0 (0.0%) | 12 (11.5%) |
| 55 to 64 Years | 8 (10.1%) | 40 (43.5%) |
| 65 to 74 Years | 0 (0.0%) | 1 (3.6%) |
| 75 Years and over | 0 (0.0%) | 4 (30.8%) |
| Total | 81 (9.6%) | 77 (9.0%) |
Income Above Poverty by Sex and Age in Pendergrass
According to the poverty statistics in Pendergrass, males aged 5 years and females aged under 5 years are the age groups that are most secure financially, with 100.0% of males and 100.0% of females in these age groups living above the poverty line.
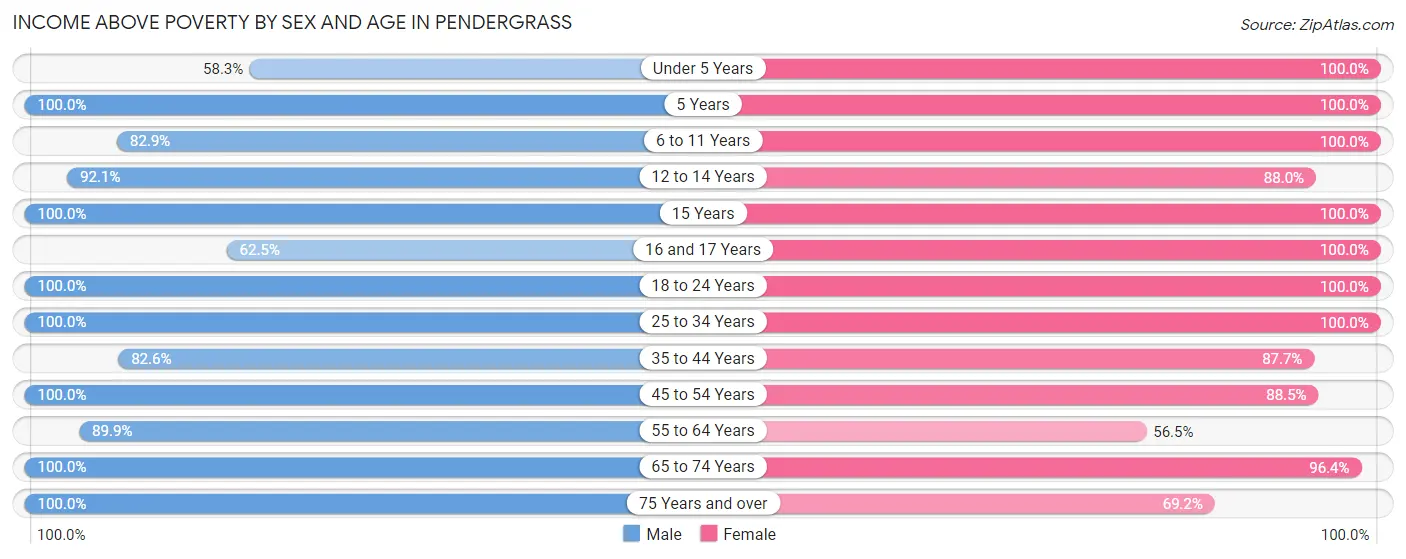
| Age Bracket | Male | Female |
| Under 5 Years | 28 (58.3%) | 53 (100.0%) |
| 5 Years | 19 (100.0%) | 4 (100.0%) |
| 6 to 11 Years | 116 (82.9%) | 156 (100.0%) |
| 12 to 14 Years | 70 (92.1%) | 22 (88.0%) |
| 15 Years | 2 (100.0%) | 25 (100.0%) |
| 16 and 17 Years | 5 (62.5%) | 39 (100.0%) |
| 18 to 24 Years | 41 (100.0%) | 59 (100.0%) |
| 25 to 34 Years | 205 (100.0%) | 121 (100.0%) |
| 35 to 44 Years | 95 (82.6%) | 121 (87.7%) |
| 45 to 54 Years | 95 (100.0%) | 92 (88.5%) |
| 55 to 64 Years | 71 (89.9%) | 52 (56.5%) |
| 65 to 74 Years | 16 (100.0%) | 27 (96.4%) |
| 75 Years and over | 4 (100.0%) | 9 (69.2%) |
| Total | 767 (90.4%) | 780 (91.0%) |
Income Below Poverty Among Married-Couple Families in Pendergrass
The poverty statistics for married-couple families in Pendergrass show that 10.1% or 28 of the total 276 families live below the poverty line. Families with 1 or 2 children have the highest poverty rate of 13.3%, comprising of 20 families. On the other hand, families with 3 or 4 children have the lowest poverty rate of 0.0%, which includes 0 families.
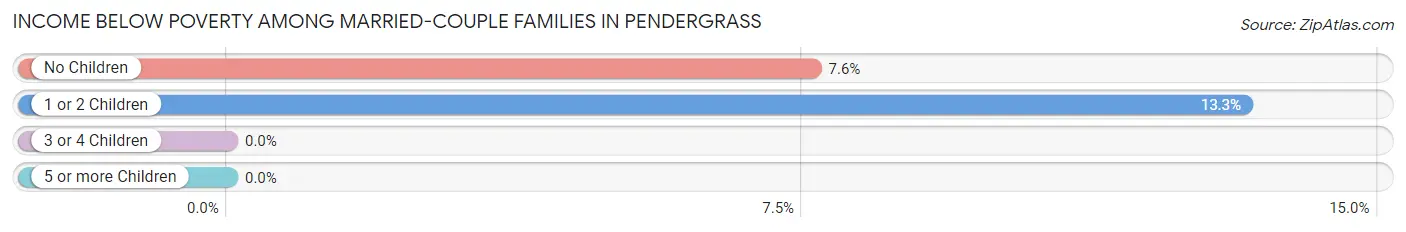
| Children | Above Poverty | Below Poverty |
| No Children | 97 (92.4%) | 8 (7.6%) |
| 1 or 2 Children | 131 (86.8%) | 20 (13.3%) |
| 3 or 4 Children | 20 (100.0%) | 0 (0.0%) |
| 5 or more Children | 0 (0.0%) | 0 (0.0%) |
| Total | 248 (89.9%) | 28 (10.1%) |
Income Below Poverty Among Single-Parent Households in Pendergrass
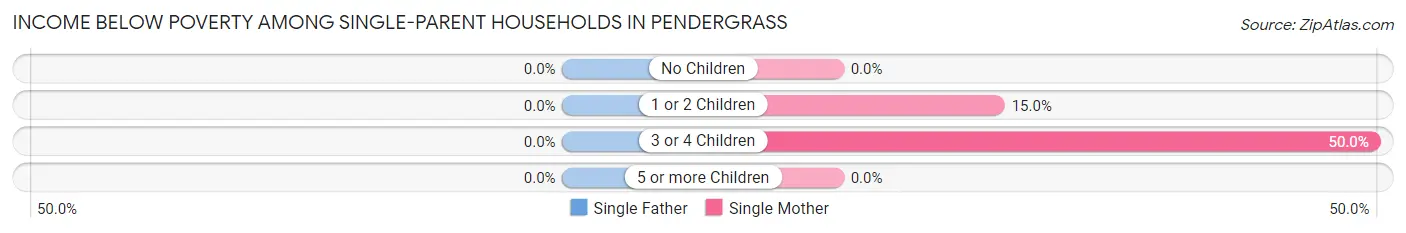
| Children | Single Father | Single Mother |
| No Children | 0 (0.0%) | 0 (0.0%) |
| 1 or 2 Children | 0 (0.0%) | 9 (15.0%) |
| 3 or 4 Children | 0 (0.0%) | 3 (50.0%) |
| 5 or more Children | 0 (0.0%) | 0 (0.0%) |
| Total | 0 (0.0%) | 12 (15.8%) |
Income Below Poverty Among Married-Couple vs Single-Parent Households in Pendergrass
The poverty data for Pendergrass shows that 28 of the married-couple family households (10.1%) and 12 of the single-parent households (8.1%) are living below the poverty level. Within the married-couple family households, those with 1 or 2 children have the highest poverty rate, with 20 households (13.3%) falling below the poverty line. Among the single-parent households, those with 3 or 4 children have the highest poverty rate, with 3 household (50.0%) living below poverty.
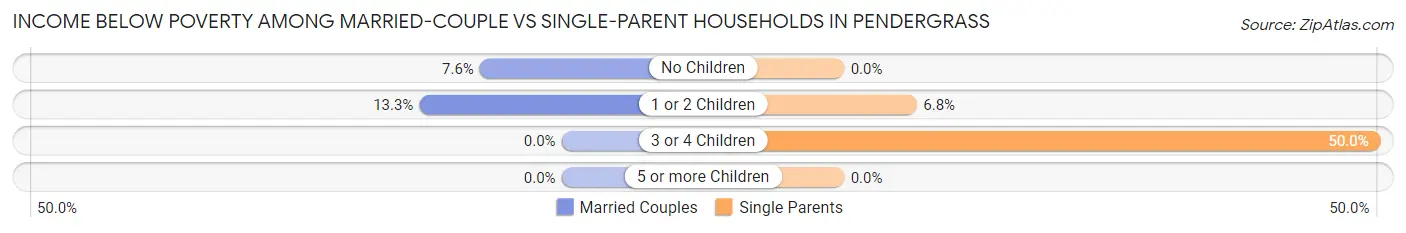
| Children | Married-Couple Families | Single-Parent Households |
| No Children | 8 (7.6%) | 0 (0.0%) |
| 1 or 2 Children | 20 (13.3%) | 9 (6.8%) |
| 3 or 4 Children | 0 (0.0%) | 3 (50.0%) |
| 5 or more Children | 0 (0.0%) | 0 (0.0%) |
| Total | 28 (10.1%) | 12 (8.1%) |
Race in Pendergrass
The most populous races in Pendergrass are White / Caucasian (1,118 | 65.6%), Hispanic or Latino (342 | 20.1%), and Black / African American (261 | 15.3%).
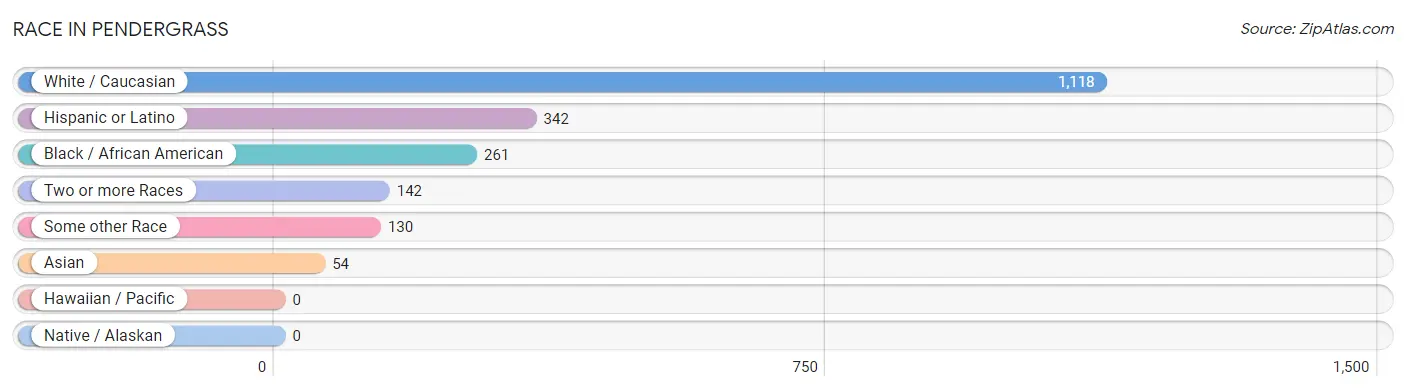
| Race | # Population | % Population |
| Asian | 54 | 3.2% |
| Black / African American | 261 | 15.3% |
| Hawaiian / Pacific | 0 | 0.0% |
| Hispanic or Latino | 342 | 20.1% |
| Native / Alaskan | 0 | 0.0% |
| White / Caucasian | 1,118 | 65.6% |
| Two or more Races | 142 | 8.3% |
| Some other Race | 130 | 7.6% |
| Total | 1,705 | 100.0% |
Ancestry in Pendergrass
The most populous ancestries reported in Pendergrass are English (234 | 13.7%), Mexican (133 | 7.8%), South American (104 | 6.1%), German (88 | 5.2%), and Ecuadorian (87 | 5.1%), together accounting for 37.9% of all Pendergrass residents.
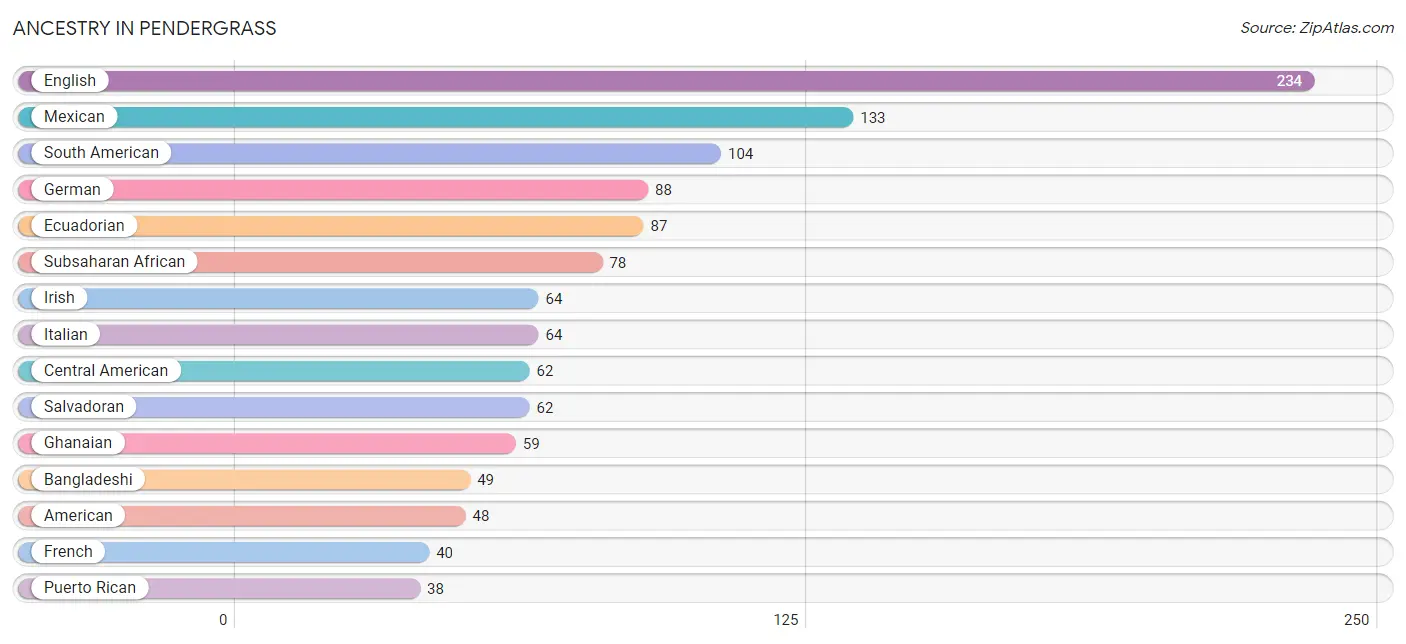
| Ancestry | # Population | % Population |
| African | 19 | 1.1% |
| American | 48 | 2.8% |
| Arab | 2 | 0.1% |
| Bangladeshi | 49 | 2.9% |
| Bhutanese | 6 | 0.4% |
| British | 1 | 0.1% |
| Central American | 62 | 3.6% |
| Cherokee | 29 | 1.7% |
| Colombian | 7 | 0.4% |
| Dutch | 8 | 0.5% |
| Ecuadorian | 87 | 5.1% |
| Egyptian | 2 | 0.1% |
| English | 234 | 13.7% |
| European | 20 | 1.2% |
| French | 40 | 2.4% |
| German | 88 | 5.2% |
| Ghanaian | 59 | 3.5% |
| Greek | 3 | 0.2% |
| Hungarian | 7 | 0.4% |
| Irish | 64 | 3.7% |
| Italian | 64 | 3.7% |
| Jamaican | 14 | 0.8% |
| Mexican | 133 | 7.8% |
| Puerto Rican | 38 | 2.2% |
| Salvadoran | 62 | 3.6% |
| Scandinavian | 1 | 0.1% |
| Scotch-Irish | 19 | 1.1% |
| Scottish | 27 | 1.6% |
| South American | 104 | 6.1% |
| Spanish | 5 | 0.3% |
| Sri Lankan | 6 | 0.4% |
| Subsaharan African | 78 | 4.6% |
| Thai | 1 | 0.1% |
| Venezuelan | 10 | 0.6% | View All 34 Rows |
Immigrants in Pendergrass
The most numerous immigrant groups reported in Pendergrass came from Latin America (126 | 7.4%), South America (94 | 5.5%), Ecuador (80 | 4.7%), Africa (61 | 3.6%), and Ghana (59 | 3.5%), together accounting for 24.6% of all Pendergrass residents.
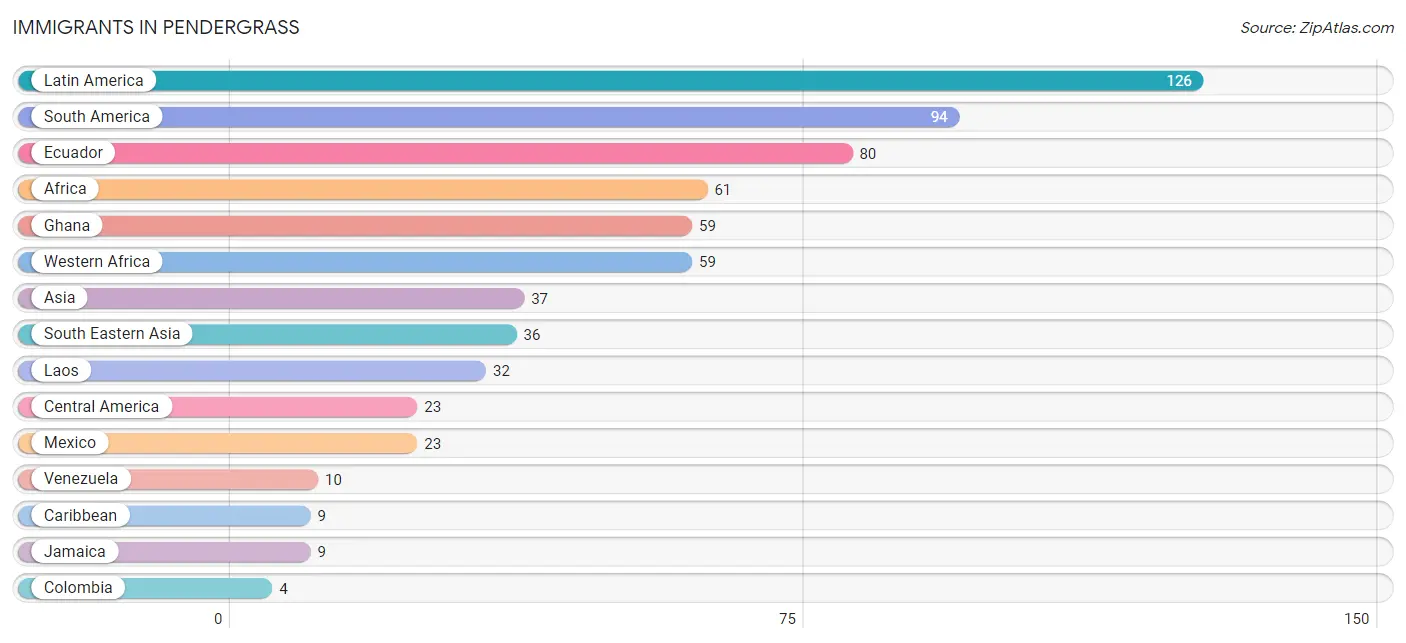
| Immigration Origin | # Population | % Population |
| Africa | 61 | 3.6% |
| Asia | 37 | 2.2% |
| Caribbean | 9 | 0.5% |
| Central America | 23 | 1.3% |
| Colombia | 4 | 0.2% |
| Ecuador | 80 | 4.7% |
| Egypt | 2 | 0.1% |
| Ghana | 59 | 3.5% |
| India | 1 | 0.1% |
| Jamaica | 9 | 0.5% |
| Laos | 32 | 1.9% |
| Latin America | 126 | 7.4% |
| Mexico | 23 | 1.3% |
| Northern Africa | 2 | 0.1% |
| South America | 94 | 5.5% |
| South Central Asia | 1 | 0.1% |
| South Eastern Asia | 36 | 2.1% |
| Venezuela | 10 | 0.6% |
| Vietnam | 4 | 0.2% |
| Western Africa | 59 | 3.5% | View All 20 Rows |
Sex and Age in Pendergrass
Sex and Age in Pendergrass
The most populous age groups in Pendergrass are 30 to 34 Years (163 | 19.2%) for men and 10 to 14 Years (98 | 11.4%) for women.
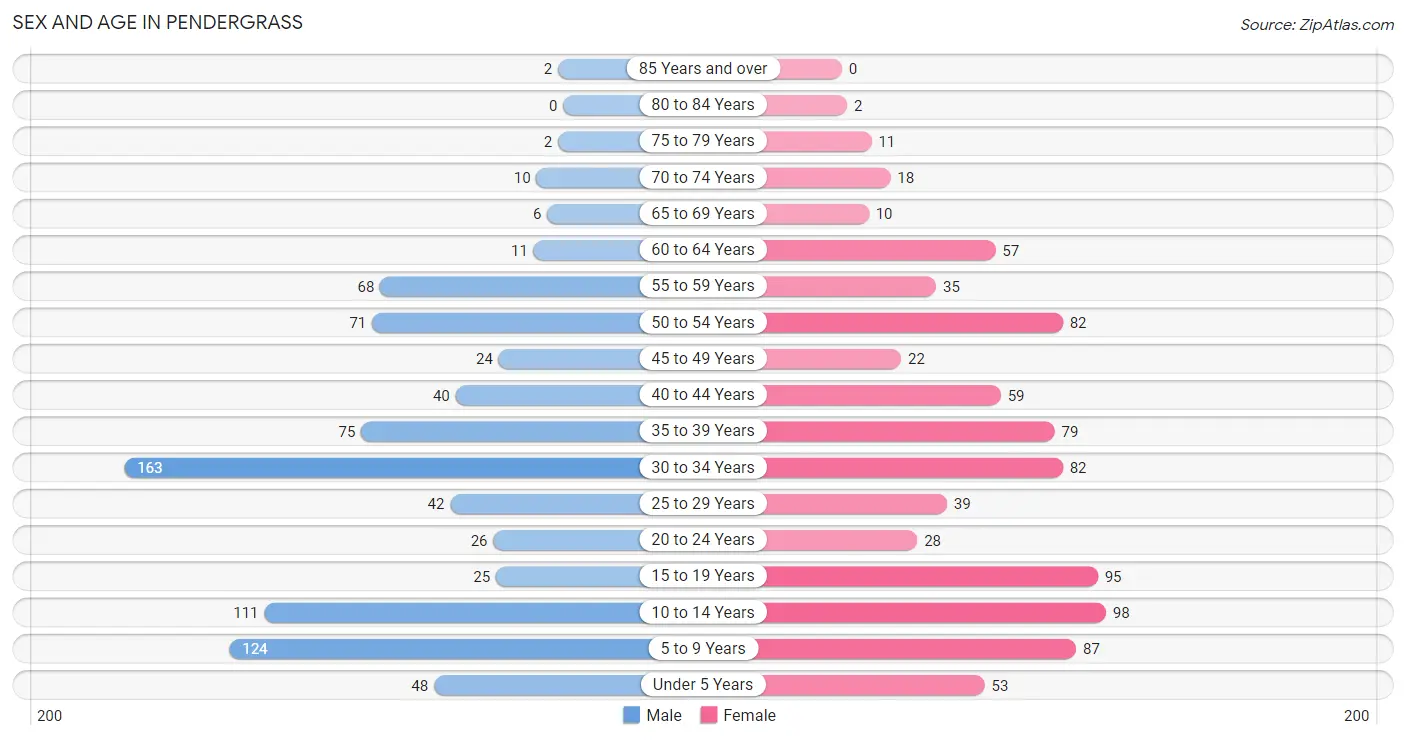
| Age Bracket | Male | Female |
| Under 5 Years | 48 (5.7%) | 53 (6.2%) |
| 5 to 9 Years | 124 (14.6%) | 87 (10.2%) |
| 10 to 14 Years | 111 (13.1%) | 98 (11.4%) |
| 15 to 19 Years | 25 (2.9%) | 95 (11.1%) |
| 20 to 24 Years | 26 (3.1%) | 28 (3.3%) |
| 25 to 29 Years | 42 (5.0%) | 39 (4.5%) |
| 30 to 34 Years | 163 (19.2%) | 82 (9.6%) |
| 35 to 39 Years | 75 (8.8%) | 79 (9.2%) |
| 40 to 44 Years | 40 (4.7%) | 59 (6.9%) |
| 45 to 49 Years | 24 (2.8%) | 22 (2.6%) |
| 50 to 54 Years | 71 (8.4%) | 82 (9.6%) |
| 55 to 59 Years | 68 (8.0%) | 35 (4.1%) |
| 60 to 64 Years | 11 (1.3%) | 57 (6.7%) |
| 65 to 69 Years | 6 (0.7%) | 10 (1.2%) |
| 70 to 74 Years | 10 (1.2%) | 18 (2.1%) |
| 75 to 79 Years | 2 (0.2%) | 11 (1.3%) |
| 80 to 84 Years | 0 (0.0%) | 2 (0.2%) |
| 85 Years and over | 2 (0.2%) | 0 (0.0%) |
| Total | 848 (100.0%) | 857 (100.0%) |
Families and Households in Pendergrass
Median Family Size in Pendergrass
The median family size in Pendergrass is 3.53 persons per family, with married-couple families (276 | 64.9%) accounting for the largest median family size of 4.1 persons per family. On the other hand, single male/father families (73 | 17.2%) represent the smallest median family size with 2.29 persons per family.
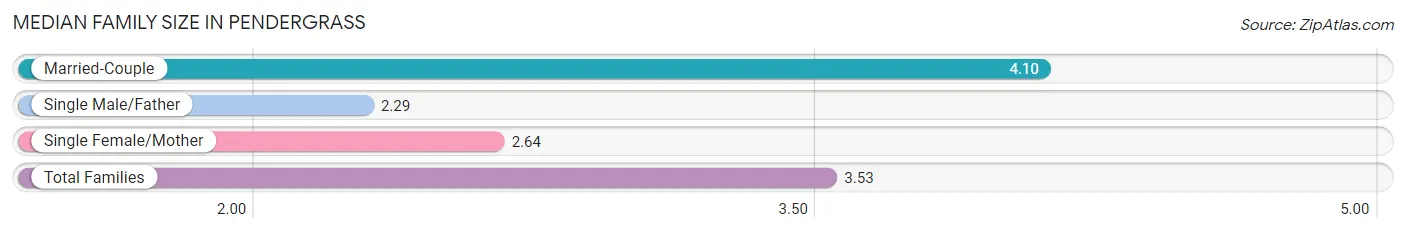
| Family Type | # Families | Family Size |
| Married-Couple | 276 (64.9%) | 4.10 |
| Single Male/Father | 73 (17.2%) | 2.29 |
| Single Female/Mother | 76 (17.9%) | 2.64 |
| Total Families | 425 (100.0%) | 3.53 |
Median Household Size in Pendergrass
The median household size in Pendergrass is 3.25 persons per household, with married-couple households (276 | 52.7%) accounting for the largest median household size of 4.1 persons per household. non-family households (99 | 18.9%) represent the smallest median household size with 1.46 persons per household.
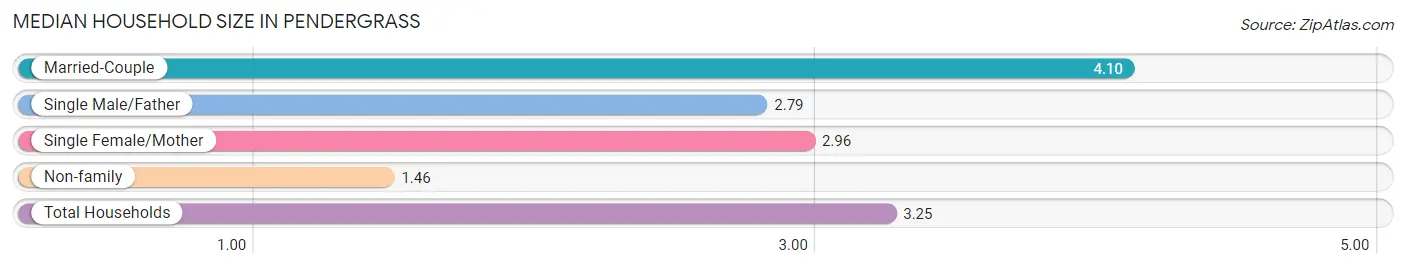
| Household Type | # Households | Household Size |
| Married-Couple | 276 (52.7%) | 4.10 |
| Single Male/Father | 73 (13.9%) | 2.79 |
| Single Female/Mother | 76 (14.5%) | 2.96 |
| Non-family | 99 (18.9%) | 1.46 |
| Total Households | 524 (100.0%) | 3.25 |
Household Size by Marriage Status in Pendergrass
Out of a total of 524 households in Pendergrass, 425 (81.1%) are family households, while 99 (18.9%) are nonfamily households. The most numerous type of family households are 4-person households, comprising 143, and the most common type of nonfamily households are 1-person households, comprising 83.
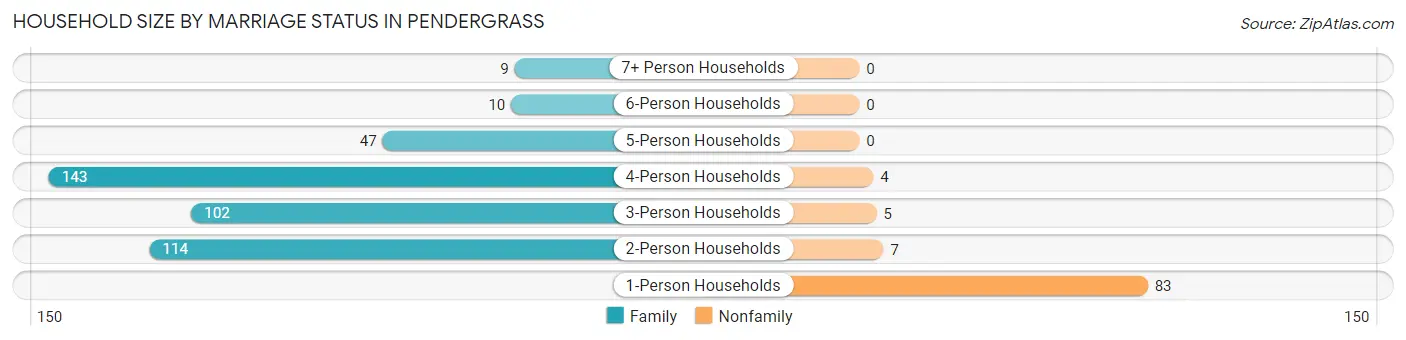
| Household Size | Family Households | Nonfamily Households |
| 1-Person Households | - | 83 (15.8%) |
| 2-Person Households | 114 (21.8%) | 7 (1.3%) |
| 3-Person Households | 102 (19.5%) | 5 (0.9%) |
| 4-Person Households | 143 (27.3%) | 4 (0.8%) |
| 5-Person Households | 47 (9.0%) | 0 (0.0%) |
| 6-Person Households | 10 (1.9%) | 0 (0.0%) |
| 7+ Person Households | 9 (1.7%) | 0 (0.0%) |
| Total | 425 (81.1%) | 99 (18.9%) |
Female Fertility in Pendergrass
Fertility by Age in Pendergrass
Average fertility rate in Pendergrass is 14.0 births per 1,000 women. Women in the age bracket of 35 to 50 years have the highest fertility rate with 32.0 births per 1,000 women. Women in the age bracket of 35 to 50 years acount for 100.0% of all women with births.
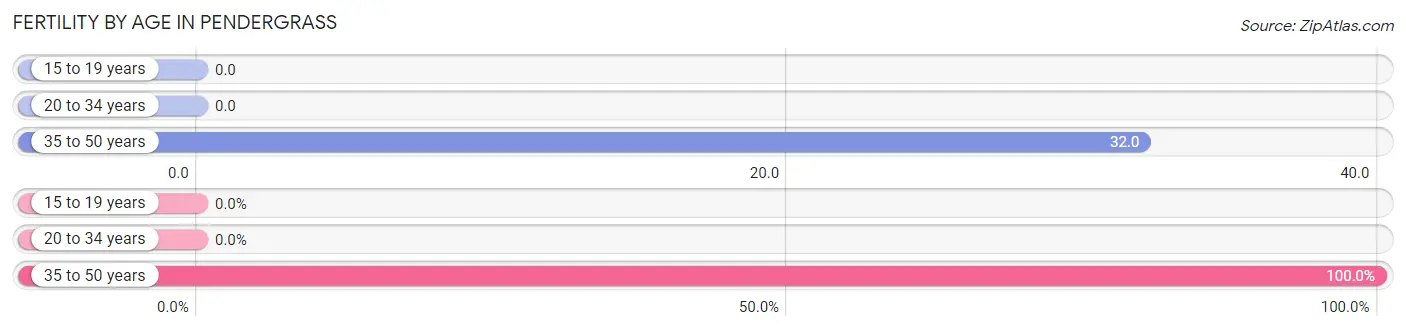
| Age Bracket | Women with Births | Births / 1,000 Women |
| 15 to 19 years | 0 (0.0%) | 0.0 |
| 20 to 34 years | 0 (0.0%) | 0.0 |
| 35 to 50 years | 6 (100.0%) | 32.0 |
| Total | 6 (100.0%) | 14.0 |
Fertility by Age by Marriage Status in Pendergrass
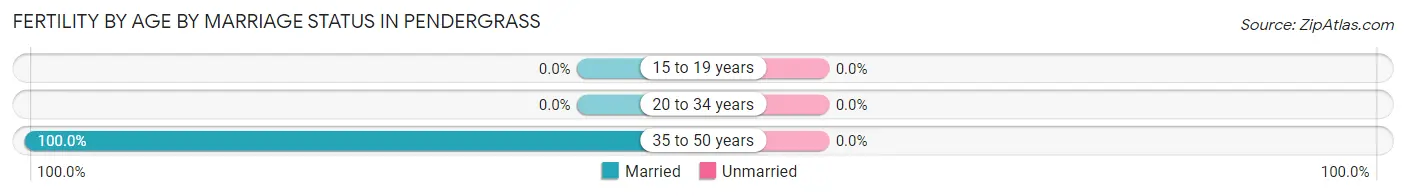
| Age Bracket | Married | Unmarried |
| 15 to 19 years | 0 (0.0%) | 0 (0.0%) |
| 20 to 34 years | 0 (0.0%) | 0 (0.0%) |
| 35 to 50 years | 6 (100.0%) | 0 (0.0%) |
| Total | 6 (100.0%) | 0 (0.0%) |
Fertility by Education in Pendergrass
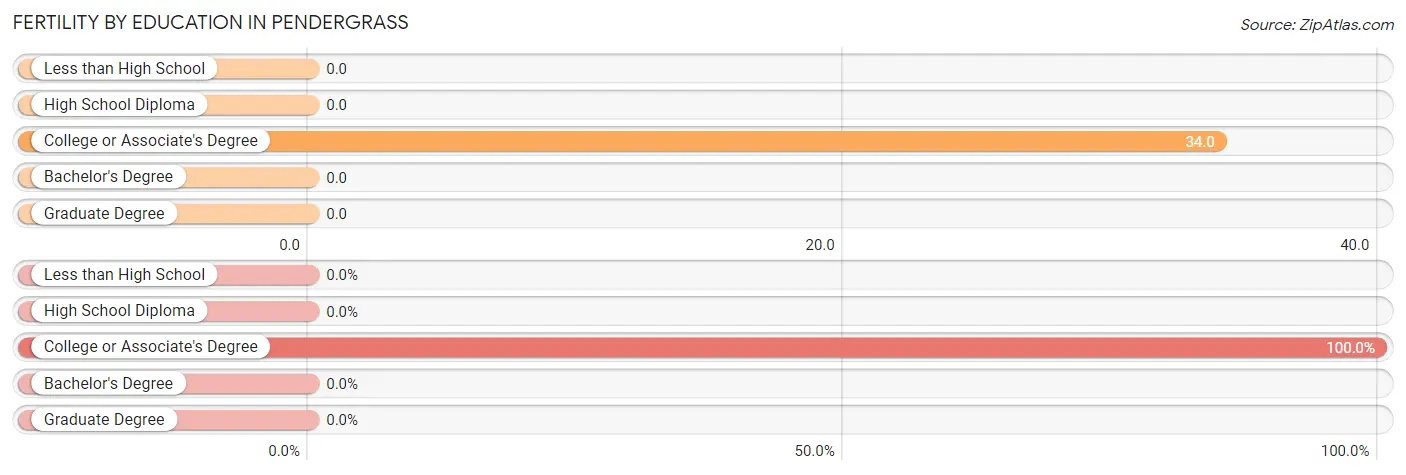
| Educational Attainment | Women with Births | Births / 1,000 Women |
| Less than High School | 0 (0.0%) | 0.0 |
| High School Diploma | 0 (0.0%) | 0.0 |
| College or Associate's Degree | 6 (100.0%) | 34.0 |
| Bachelor's Degree | 0 (0.0%) | 0.0 |
| Graduate Degree | 0 (0.0%) | 0.0 |
| Total | 6 (100.0%) | 14.0 |
Fertility by Education by Marriage Status in Pendergrass
| Educational Attainment | Married | Unmarried |
| Less than High School | 0 (0.0%) | 0 (0.0%) |
| High School Diploma | 0 (0.0%) | 0 (0.0%) |
| College or Associate's Degree | 6 (100.0%) | 0 (0.0%) |
| Bachelor's Degree | 0 (0.0%) | 0 (0.0%) |
| Graduate Degree | 0 (0.0%) | 0 (0.0%) |
| Total | 6 (100.0%) | 0 (0.0%) |
Employment Characteristics in Pendergrass
Employment by Class of Employer in Pendergrass
Among the 810 employed individuals in Pendergrass, private company employees (559 | 69.0%), local government employees (81 | 10.0%), and not-for-profit organizations (80 | 9.9%) make up the most common classes of employment.
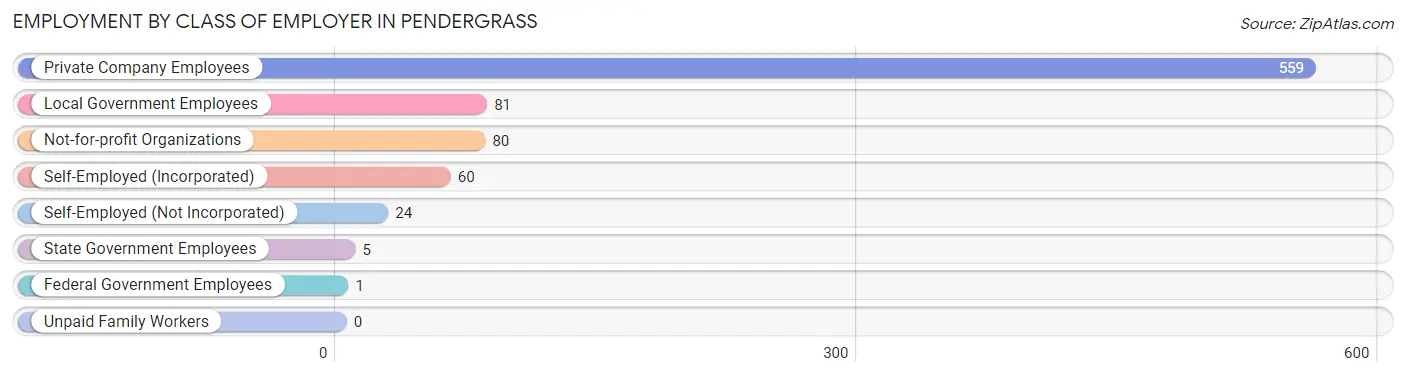
| Employer Class | # Employees | % Employees |
| Private Company Employees | 559 | 69.0% |
| Self-Employed (Incorporated) | 60 | 7.4% |
| Self-Employed (Not Incorporated) | 24 | 3.0% |
| Not-for-profit Organizations | 80 | 9.9% |
| Local Government Employees | 81 | 10.0% |
| State Government Employees | 5 | 0.6% |
| Federal Government Employees | 1 | 0.1% |
| Unpaid Family Workers | 0 | 0.0% |
| Total | 810 | 100.0% |
Employment Status by Age in Pendergrass
According to the labor force statistics for Pendergrass, out of the total population over 16 years of age (1,157), 78.7% or 911 individuals are in the labor force, with 2.9% or 26 of them unemployed. The age group with the highest labor force participation rate is 25 to 29 years, with 100.0% or 81 individuals in the labor force. Within the labor force, the 20 to 24 years age range has the highest percentage of unemployed individuals, with 13.2% or 5 of them being unemployed.
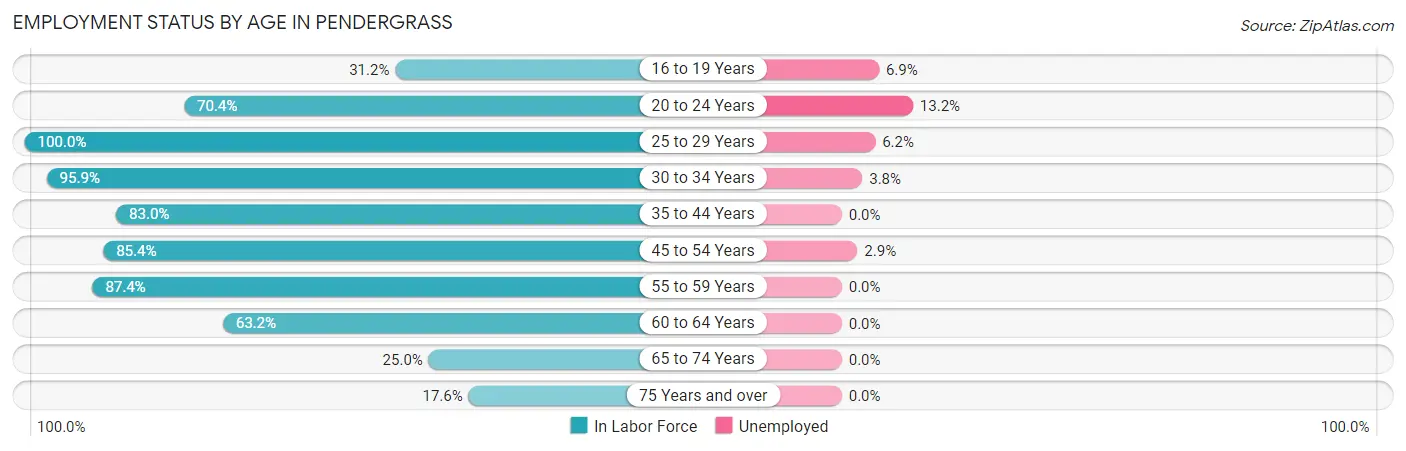
| Age Bracket | In Labor Force | Unemployed |
| 16 to 19 Years | 29 (31.2%) | 2 (6.9%) |
| 20 to 24 Years | 38 (70.4%) | 5 (13.2%) |
| 25 to 29 Years | 81 (100.0%) | 5 (6.2%) |
| 30 to 34 Years | 235 (95.9%) | 9 (3.8%) |
| 35 to 44 Years | 210 (83.0%) | 0 (0.0%) |
| 45 to 54 Years | 170 (85.4%) | 5 (2.9%) |
| 55 to 59 Years | 90 (87.4%) | 0 (0.0%) |
| 60 to 64 Years | 43 (63.2%) | 0 (0.0%) |
| 65 to 74 Years | 11 (25.0%) | 0 (0.0%) |
| 75 Years and over | 3 (17.6%) | 0 (0.0%) |
| Total | 911 (78.7%) | 26 (2.9%) |
Employment Status by Educational Attainment in Pendergrass
According to labor force statistics for Pendergrass, 87.4% of individuals (829) out of the total population between 25 and 64 years of age (949) are in the labor force, with 2.3% or 19 of them being unemployed. The group with the highest labor force participation rate are those with the educational attainment of college / associate degree, with 91.5% or 322 individuals in the labor force. Within the labor force, individuals with less than high school education have the highest percentage of unemployment, with 10.4% or 14 of them being unemployed.
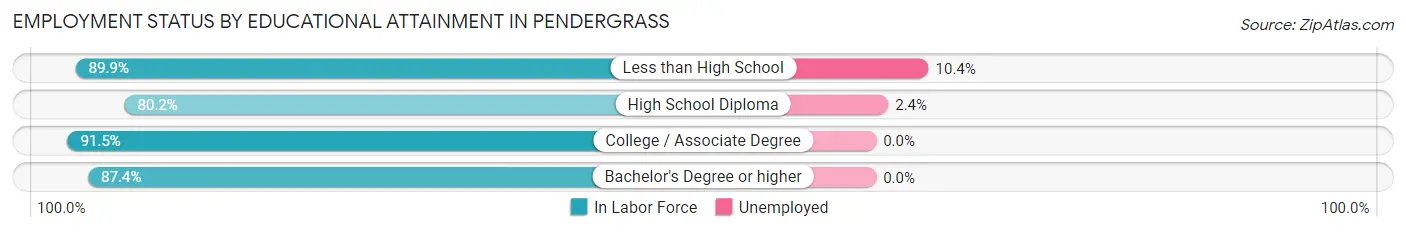
| Educational Attainment | In Labor Force | Unemployed |
| Less than High School | 134 (89.9%) | 15 (10.4%) |
| High School Diploma | 207 (80.2%) | 6 (2.4%) |
| College / Associate Degree | 322 (91.5%) | 0 (0.0%) |
| Bachelor's Degree or higher | 166 (87.4%) | 0 (0.0%) |
| Total | 829 (87.4%) | 22 (2.3%) |
Employment Occupations by Sex in Pendergrass
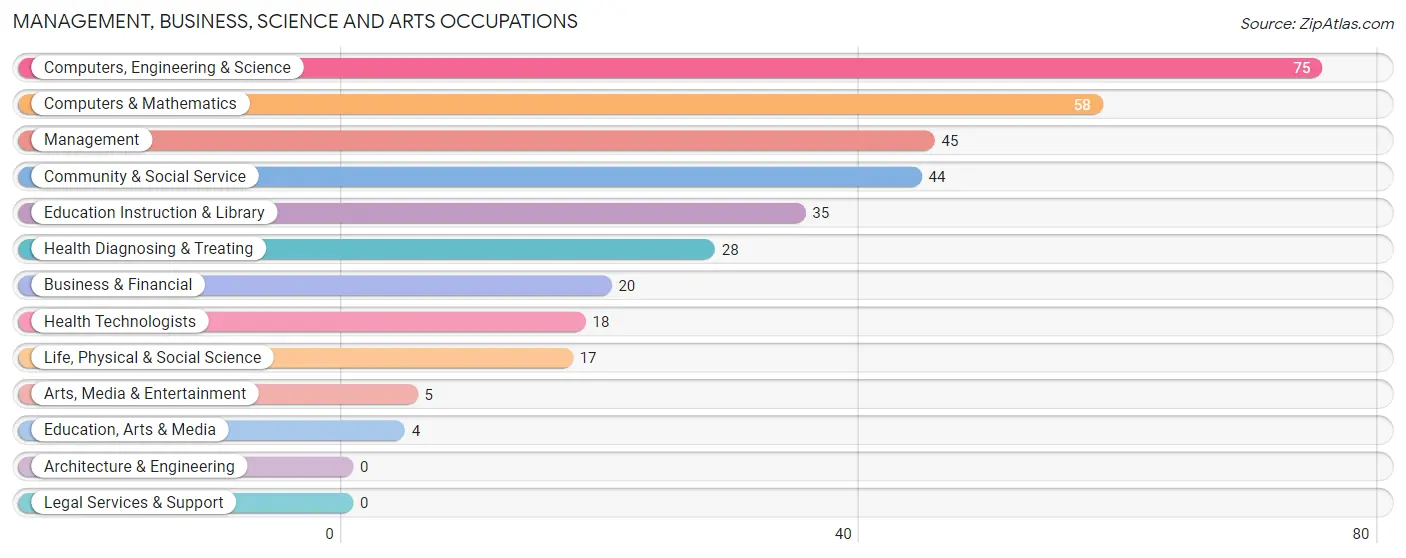
Management, Business, Science and Arts Occupations
The most common Management, Business, Science and Arts occupations in Pendergrass are Computers, Engineering & Science (75 | 8.5%), Computers & Mathematics (58 | 6.6%), Management (45 | 5.1%), Community & Social Service (44 | 5.0%), and Education Instruction & Library (35 | 4.0%).
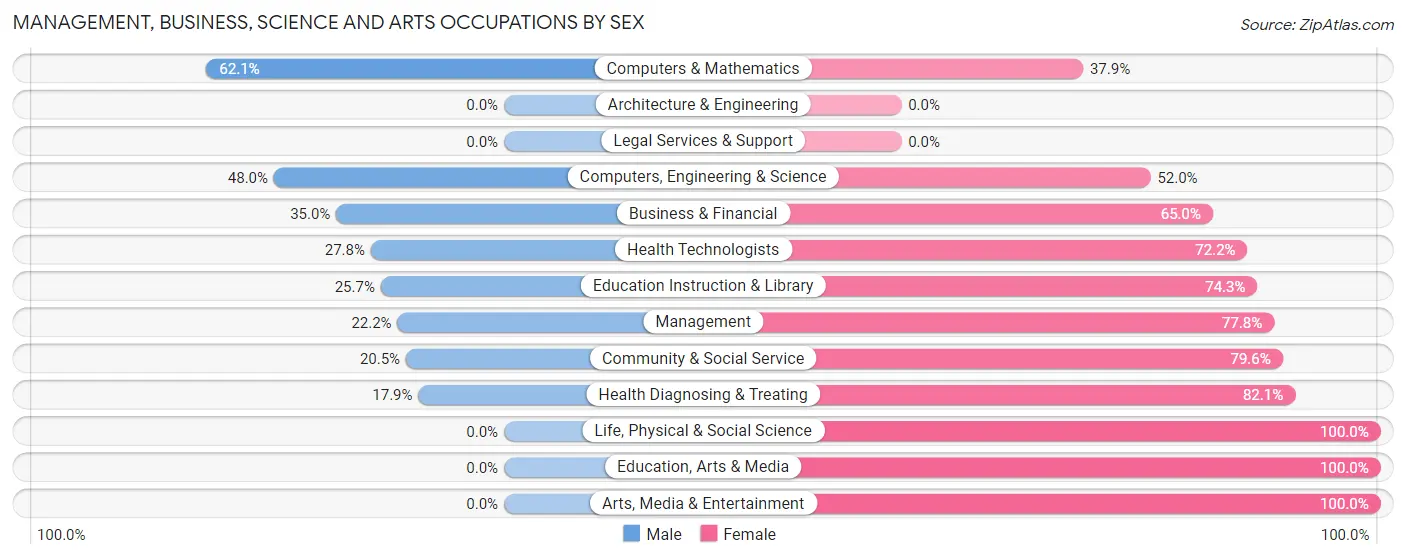
Management, Business, Science and Arts Occupations by Sex
Within the Management, Business, Science and Arts occupations in Pendergrass, the most male-oriented occupations are Computers & Mathematics (62.1%), Computers, Engineering & Science (48.0%), and Business & Financial (35.0%), while the most female-oriented occupations are Life, Physical & Social Science (100.0%), Education, Arts & Media (100.0%), and Arts, Media & Entertainment (100.0%).
| Occupation | Male | Female |
| Management | 10 (22.2%) | 35 (77.8%) |
| Business & Financial | 7 (35.0%) | 13 (65.0%) |
| Computers, Engineering & Science | 36 (48.0%) | 39 (52.0%) |
| Computers & Mathematics | 36 (62.1%) | 22 (37.9%) |
| Architecture & Engineering | 0 (0.0%) | 0 (0.0%) |
| Life, Physical & Social Science | 0 (0.0%) | 17 (100.0%) |
| Community & Social Service | 9 (20.4%) | 35 (79.5%) |
| Education, Arts & Media | 0 (0.0%) | 4 (100.0%) |
| Legal Services & Support | 0 (0.0%) | 0 (0.0%) |
| Education Instruction & Library | 9 (25.7%) | 26 (74.3%) |
| Arts, Media & Entertainment | 0 (0.0%) | 5 (100.0%) |
| Health Diagnosing & Treating | 5 (17.9%) | 23 (82.1%) |
| Health Technologists | 5 (27.8%) | 13 (72.2%) |
| Total (Category) | 67 (31.6%) | 145 (68.4%) |
| Total (Overall) | 476 (53.8%) | 408 (46.2%) |
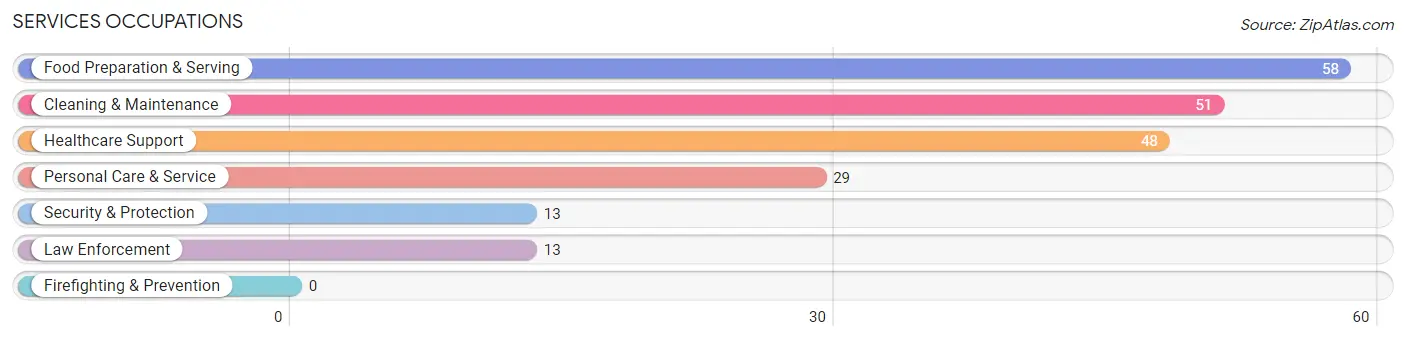
Services Occupations
The most common Services occupations in Pendergrass are Food Preparation & Serving (58 | 6.6%), Cleaning & Maintenance (51 | 5.8%), Healthcare Support (48 | 5.4%), Personal Care & Service (29 | 3.3%), and Security & Protection (13 | 1.5%).
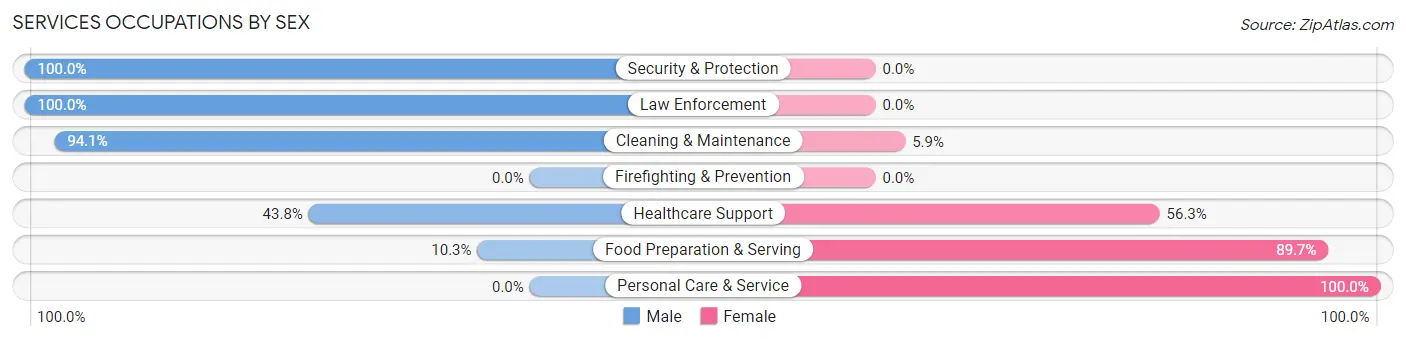
Services Occupations by Sex
Within the Services occupations in Pendergrass, the most male-oriented occupations are Security & Protection (100.0%), Law Enforcement (100.0%), and Cleaning & Maintenance (94.1%), while the most female-oriented occupations are Personal Care & Service (100.0%), Food Preparation & Serving (89.7%), and Healthcare Support (56.2%).
| Occupation | Male | Female |
| Healthcare Support | 21 (43.8%) | 27 (56.2%) |
| Security & Protection | 13 (100.0%) | 0 (0.0%) |
| Firefighting & Prevention | 0 (0.0%) | 0 (0.0%) |
| Law Enforcement | 13 (100.0%) | 0 (0.0%) |
| Food Preparation & Serving | 6 (10.3%) | 52 (89.7%) |
| Cleaning & Maintenance | 48 (94.1%) | 3 (5.9%) |
| Personal Care & Service | 0 (0.0%) | 29 (100.0%) |
| Total (Category) | 88 (44.2%) | 111 (55.8%) |
| Total (Overall) | 476 (53.8%) | 408 (46.2%) |
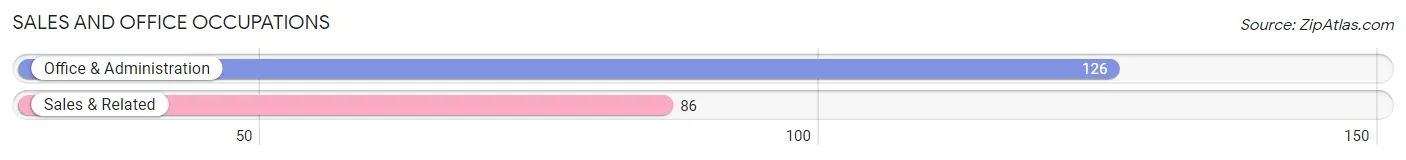
Sales and Office Occupations
The most common Sales and Office occupations in Pendergrass are Office & Administration (126 | 14.2%), and Sales & Related (86 | 9.7%).
Sales and Office Occupations by Sex
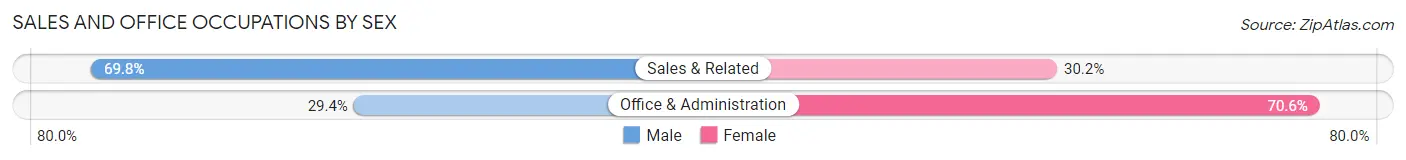
| Occupation | Male | Female |
| Sales & Related | 60 (69.8%) | 26 (30.2%) |
| Office & Administration | 37 (29.4%) | 89 (70.6%) |
| Total (Category) | 97 (45.8%) | 115 (54.2%) |
| Total (Overall) | 476 (53.8%) | 408 (46.2%) |
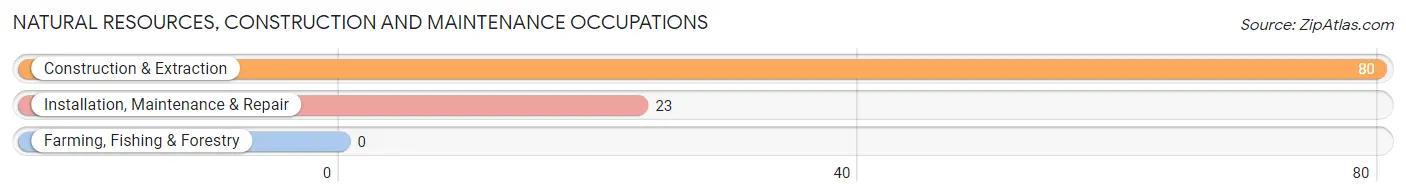
Natural Resources, Construction and Maintenance Occupations
The most common Natural Resources, Construction and Maintenance occupations in Pendergrass are Construction & Extraction (80 | 9.0%), and Installation, Maintenance & Repair (23 | 2.6%).
Natural Resources, Construction and Maintenance Occupations by Sex
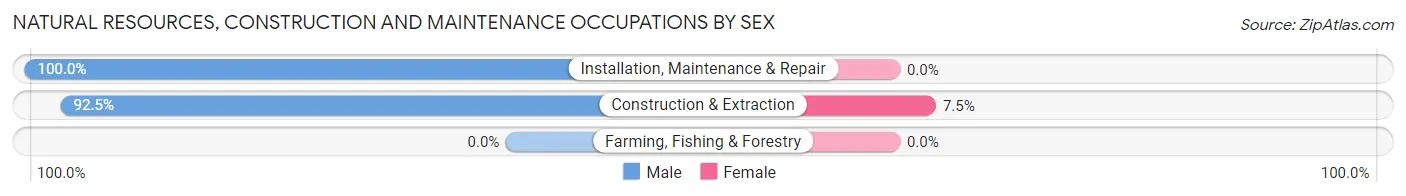
| Occupation | Male | Female |
| Farming, Fishing & Forestry | 0 (0.0%) | 0 (0.0%) |
| Construction & Extraction | 74 (92.5%) | 6 (7.5%) |
| Installation, Maintenance & Repair | 23 (100.0%) | 0 (0.0%) |
| Total (Category) | 97 (94.2%) | 6 (5.8%) |
| Total (Overall) | 476 (53.8%) | 408 (46.2%) |
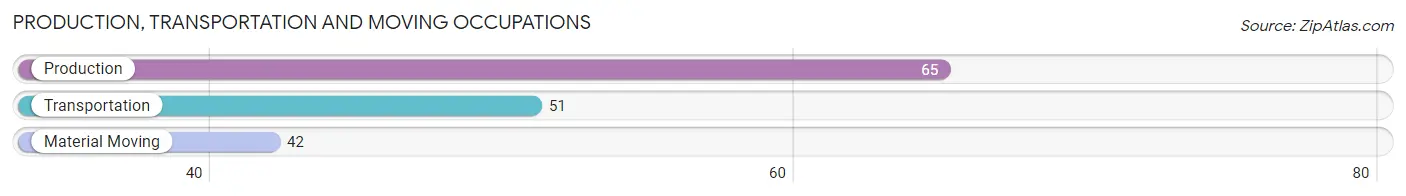
Production, Transportation and Moving Occupations
The most common Production, Transportation and Moving occupations in Pendergrass are Production (65 | 7.3%), Transportation (51 | 5.8%), and Material Moving (42 | 4.8%).
Production, Transportation and Moving Occupations by Sex
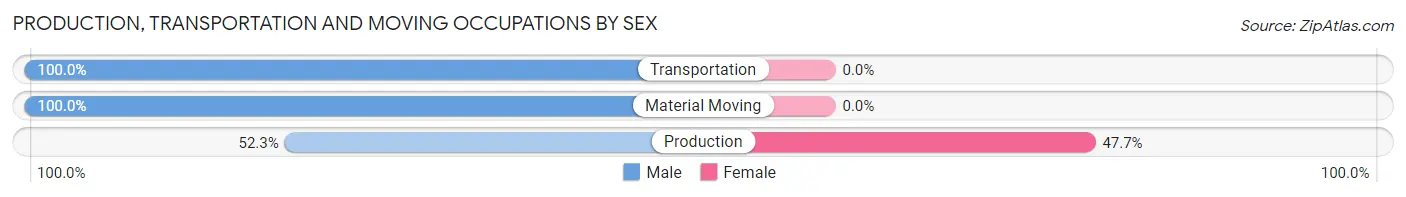
| Occupation | Male | Female |
| Production | 34 (52.3%) | 31 (47.7%) |
| Transportation | 51 (100.0%) | 0 (0.0%) |
| Material Moving | 42 (100.0%) | 0 (0.0%) |
| Total (Category) | 127 (80.4%) | 31 (19.6%) |
| Total (Overall) | 476 (53.8%) | 408 (46.2%) |
Employment Industries by Sex in Pendergrass
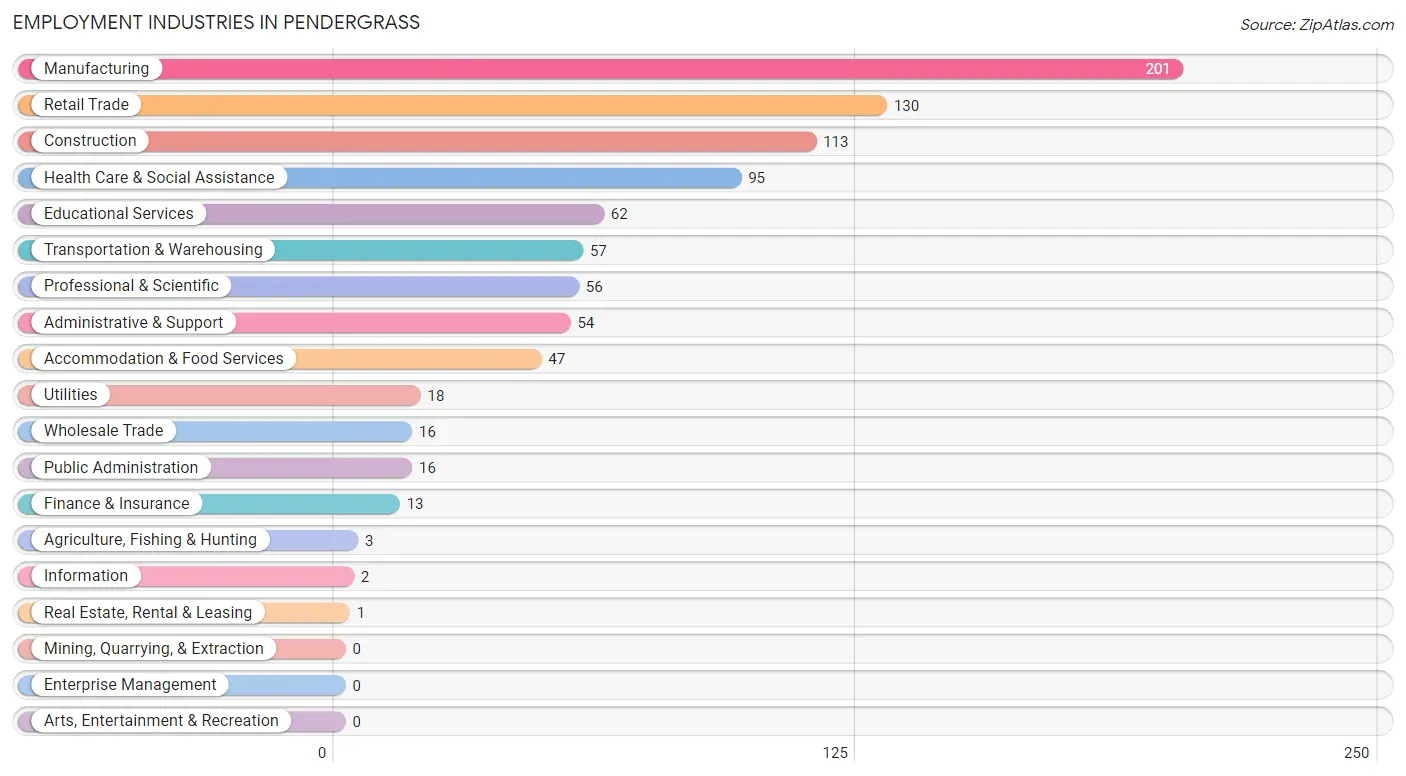
Employment Industries in Pendergrass
The major employment industries in Pendergrass include Manufacturing (201 | 22.7%), Retail Trade (130 | 14.7%), Construction (113 | 12.8%), Health Care & Social Assistance (95 | 10.7%), and Educational Services (62 | 7.0%).
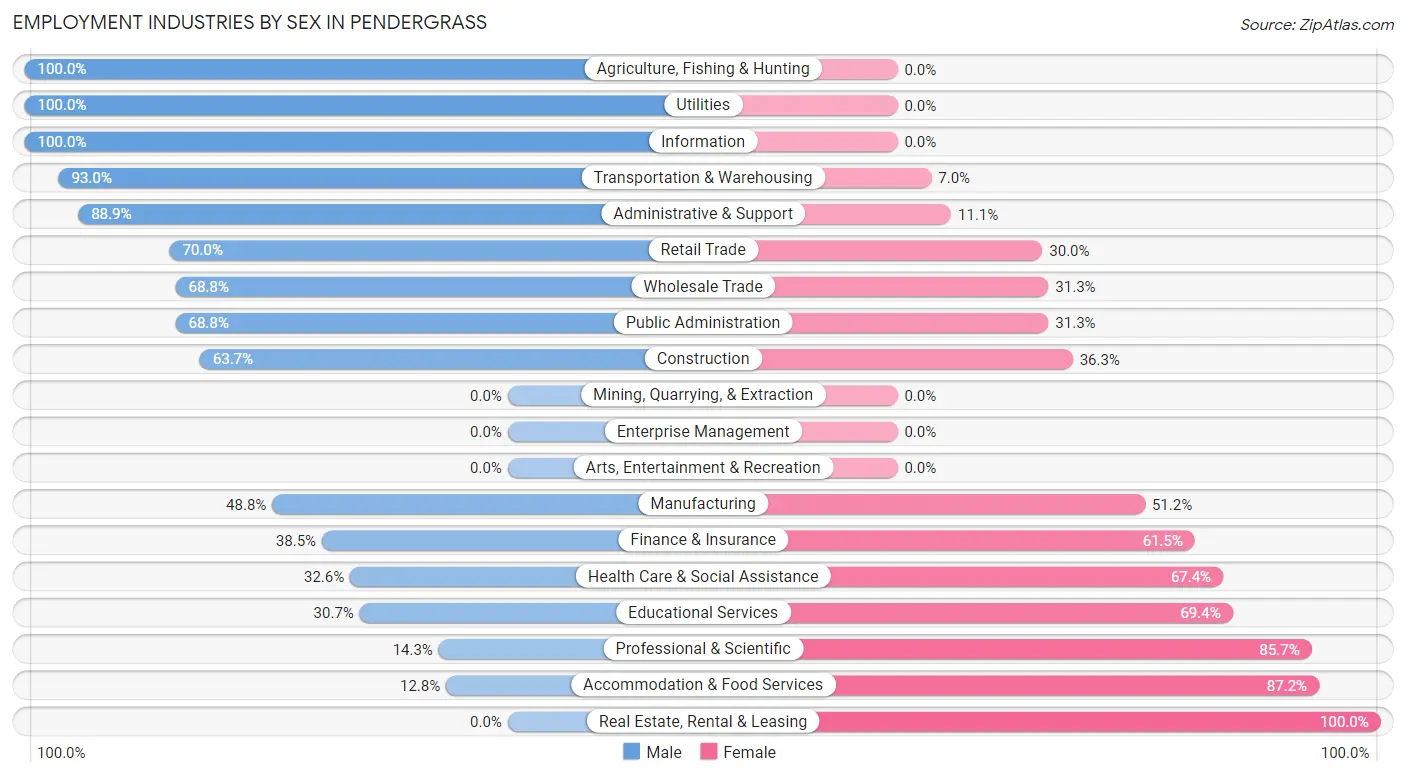
Employment Industries by Sex in Pendergrass
The Pendergrass industries that see more men than women are Agriculture, Fishing & Hunting (100.0%), Utilities (100.0%), and Information (100.0%), whereas the industries that tend to have a higher number of women are Real Estate, Rental & Leasing (100.0%), Accommodation & Food Services (87.2%), and Professional & Scientific (85.7%).
| Industry | Male | Female |
| Agriculture, Fishing & Hunting | 3 (100.0%) | 0 (0.0%) |
| Mining, Quarrying, & Extraction | 0 (0.0%) | 0 (0.0%) |
| Construction | 72 (63.7%) | 41 (36.3%) |
| Manufacturing | 98 (48.8%) | 103 (51.2%) |
| Wholesale Trade | 11 (68.8%) | 5 (31.2%) |
| Retail Trade | 91 (70.0%) | 39 (30.0%) |
| Transportation & Warehousing | 53 (93.0%) | 4 (7.0%) |
| Utilities | 18 (100.0%) | 0 (0.0%) |
| Information | 2 (100.0%) | 0 (0.0%) |
| Finance & Insurance | 5 (38.5%) | 8 (61.5%) |
| Real Estate, Rental & Leasing | 0 (0.0%) | 1 (100.0%) |
| Professional & Scientific | 8 (14.3%) | 48 (85.7%) |
| Enterprise Management | 0 (0.0%) | 0 (0.0%) |
| Administrative & Support | 48 (88.9%) | 6 (11.1%) |
| Educational Services | 19 (30.6%) | 43 (69.4%) |
| Health Care & Social Assistance | 31 (32.6%) | 64 (67.4%) |
| Arts, Entertainment & Recreation | 0 (0.0%) | 0 (0.0%) |
| Accommodation & Food Services | 6 (12.8%) | 41 (87.2%) |
| Public Administration | 11 (68.8%) | 5 (31.2%) |
| Total | 476 (53.8%) | 408 (46.2%) |
Education in Pendergrass
School Enrollment in Pendergrass
The most common levels of schooling among the 634 students in Pendergrass are elementary school (176 | 27.8%), middle school (166 | 26.2%), and high school (130 | 20.5%).
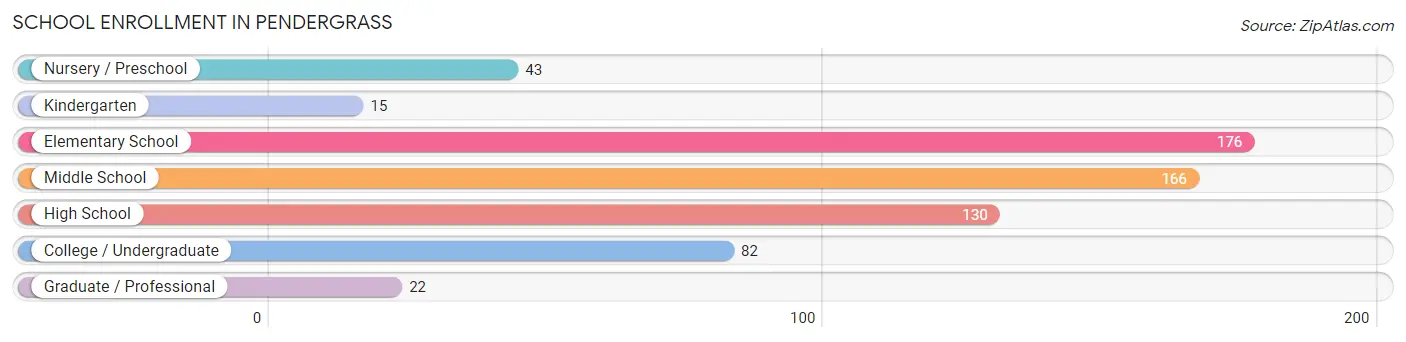
| School Level | # Students | % Students |
| Nursery / Preschool | 43 | 6.8% |
| Kindergarten | 15 | 2.4% |
| Elementary School | 176 | 27.8% |
| Middle School | 166 | 26.2% |
| High School | 130 | 20.5% |
| College / Undergraduate | 82 | 12.9% |
| Graduate / Professional | 22 | 3.5% |
| Total | 634 | 100.0% |
School Enrollment by Age by Funding Source in Pendergrass
Out of a total of 634 students who are enrolled in schools in Pendergrass, 56 (8.8%) attend a private institution, while the remaining 578 (91.2%) are enrolled in public schools. The age group of 18 to 19 year olds has the highest likelihood of being enrolled in private schools, with 24 (54.5% in the age bracket) enrolled. Conversely, the age group of 15 to 17 year olds has the lowest likelihood of being enrolled in a private school, with 74 (100.0% in the age bracket) attending a public institution.
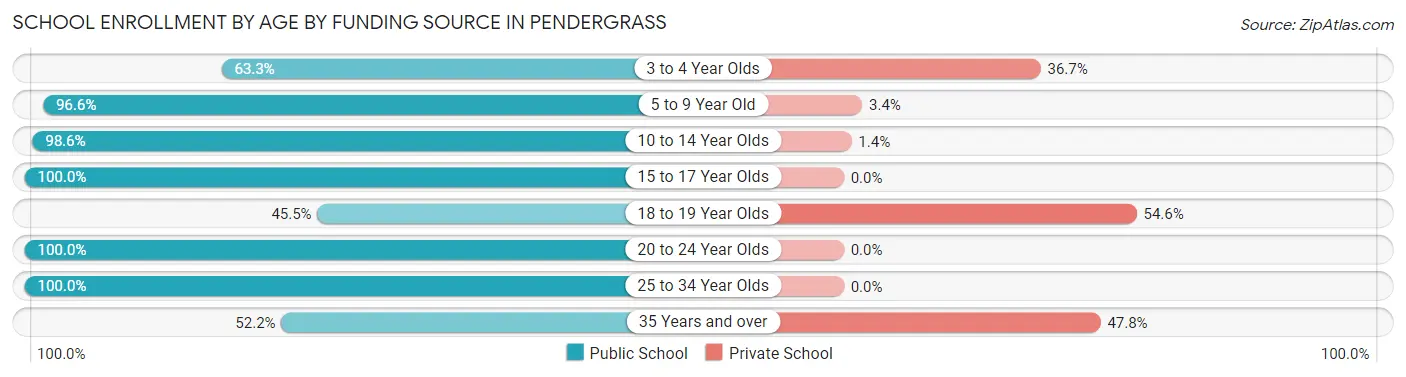
| Age Bracket | Public School | Private School |
| 3 to 4 Year Olds | 19 (63.3%) | 11 (36.7%) |
| 5 to 9 Year Old | 197 (96.6%) | 7 (3.4%) |
| 10 to 14 Year Olds | 206 (98.6%) | 3 (1.4%) |
| 15 to 17 Year Olds | 74 (100.0%) | 0 (0.0%) |
| 18 to 19 Year Olds | 20 (45.5%) | 24 (54.5%) |
| 20 to 24 Year Olds | 11 (100.0%) | 0 (0.0%) |
| 25 to 34 Year Olds | 39 (100.0%) | 0 (0.0%) |
| 35 Years and over | 12 (52.2%) | 11 (47.8%) |
| Total | 578 (91.2%) | 56 (8.8%) |
Educational Attainment by Field of Study in Pendergrass
Liberal arts & history (54 | 25.5%), business (25 | 11.8%), education (22 | 10.4%), multidisciplinary studies (21 | 9.9%), and bio, nature & agricultural (17 | 8.0%) are the most common fields of study among 212 individuals in Pendergrass who have obtained a bachelor's degree or higher.
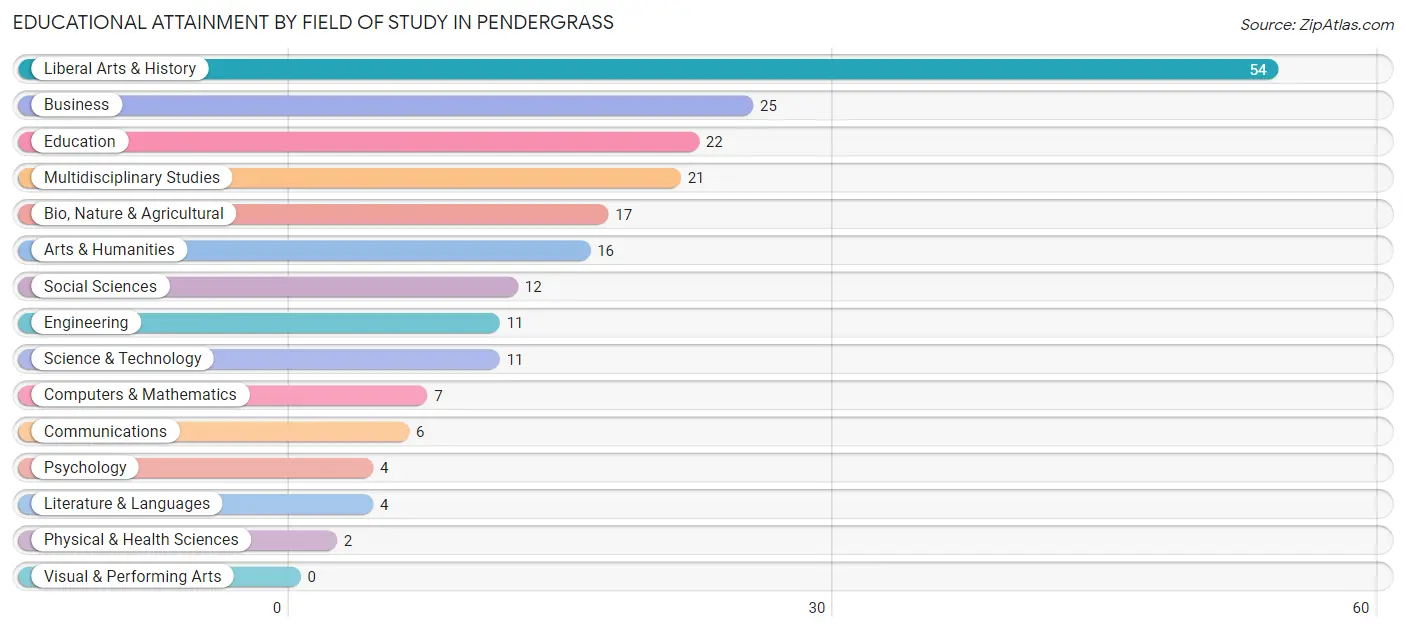
| Field of Study | # Graduates | % Graduates |
| Computers & Mathematics | 7 | 3.3% |
| Bio, Nature & Agricultural | 17 | 8.0% |
| Physical & Health Sciences | 2 | 0.9% |
| Psychology | 4 | 1.9% |
| Social Sciences | 12 | 5.7% |
| Engineering | 11 | 5.2% |
| Multidisciplinary Studies | 21 | 9.9% |
| Science & Technology | 11 | 5.2% |
| Business | 25 | 11.8% |
| Education | 22 | 10.4% |
| Literature & Languages | 4 | 1.9% |
| Liberal Arts & History | 54 | 25.5% |
| Visual & Performing Arts | 0 | 0.0% |
| Communications | 6 | 2.8% |
| Arts & Humanities | 16 | 7.5% |
| Total | 212 | 100.0% |
Transportation & Commute in Pendergrass
Vehicle Availability by Sex in Pendergrass
The most prevalent vehicle ownership categories in Pendergrass are males with 2 vehicles (238, accounting for 54.8%) and females with 2 vehicles (155, making up 63.3%).
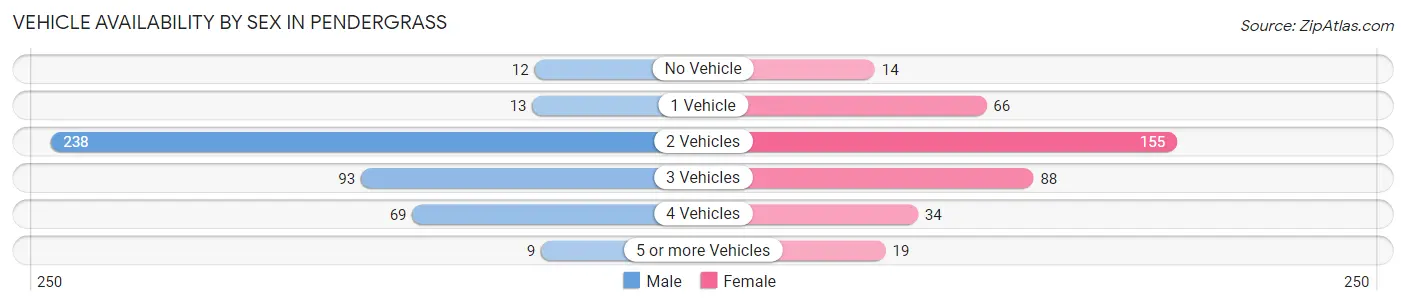
| Vehicles Available | Male | Female |
| No Vehicle | 12 (2.8%) | 14 (3.7%) |
| 1 Vehicle | 13 (3.0%) | 66 (17.5%) |
| 2 Vehicles | 238 (54.8%) | 155 (41.2%) |
| 3 Vehicles | 93 (21.4%) | 88 (23.4%) |
| 4 Vehicles | 69 (15.9%) | 34 (9.0%) |
| 5 or more Vehicles | 9 (2.1%) | 19 (5.1%) |
| Total | 434 (100.0%) | 376 (100.0%) |
Commute Time in Pendergrass
The most frequently occuring commute durations in Pendergrass are 30 to 34 minutes (132 commuters, 17.1%), 15 to 19 minutes (110 commuters, 14.2%), and 10 to 14 minutes (92 commuters, 11.9%).
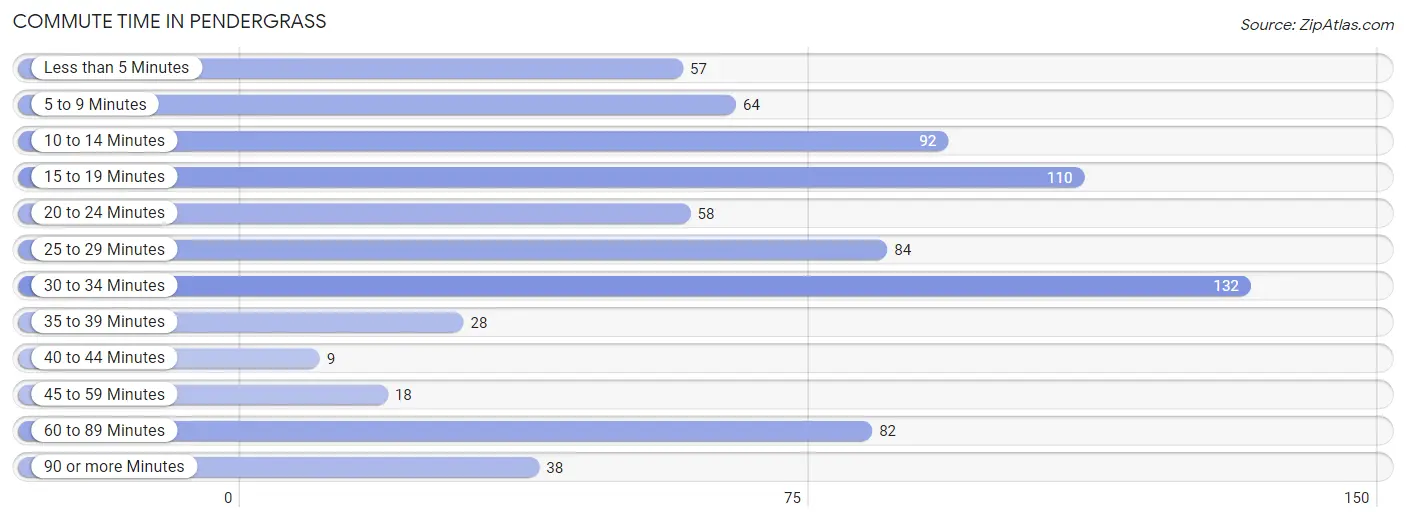
| Commute Time | # Commuters | % Commuters |
| Less than 5 Minutes | 57 | 7.4% |
| 5 to 9 Minutes | 64 | 8.3% |
| 10 to 14 Minutes | 92 | 11.9% |
| 15 to 19 Minutes | 110 | 14.2% |
| 20 to 24 Minutes | 58 | 7.5% |
| 25 to 29 Minutes | 84 | 10.9% |
| 30 to 34 Minutes | 132 | 17.1% |
| 35 to 39 Minutes | 28 | 3.6% |
| 40 to 44 Minutes | 9 | 1.2% |
| 45 to 59 Minutes | 18 | 2.3% |
| 60 to 89 Minutes | 82 | 10.6% |
| 90 or more Minutes | 38 | 4.9% |
Commute Time by Sex in Pendergrass
The most common commute times in Pendergrass are 15 to 19 minutes (67 commuters, 16.4%) for males and 30 to 34 minutes (65 commuters, 17.9%) for females.
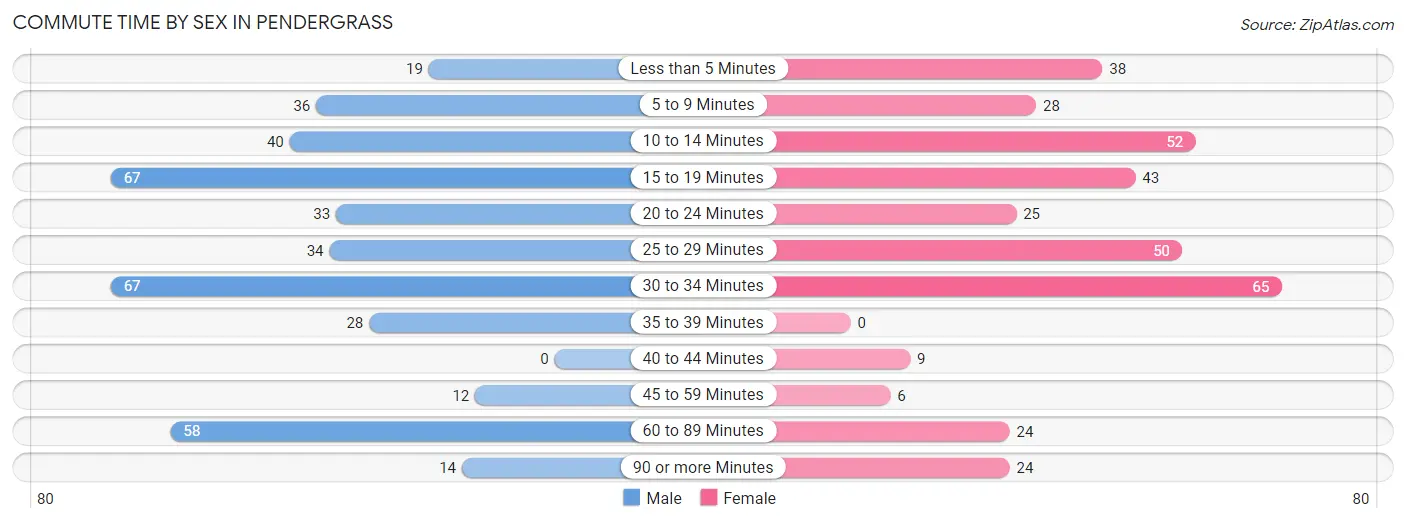
| Commute Time | Male | Female |
| Less than 5 Minutes | 19 (4.7%) | 38 (10.4%) |
| 5 to 9 Minutes | 36 (8.8%) | 28 (7.7%) |
| 10 to 14 Minutes | 40 (9.8%) | 52 (14.3%) |
| 15 to 19 Minutes | 67 (16.4%) | 43 (11.8%) |
| 20 to 24 Minutes | 33 (8.1%) | 25 (6.9%) |
| 25 to 29 Minutes | 34 (8.3%) | 50 (13.7%) |
| 30 to 34 Minutes | 67 (16.4%) | 65 (17.9%) |
| 35 to 39 Minutes | 28 (6.9%) | 0 (0.0%) |
| 40 to 44 Minutes | 0 (0.0%) | 9 (2.5%) |
| 45 to 59 Minutes | 12 (2.9%) | 6 (1.7%) |
| 60 to 89 Minutes | 58 (14.2%) | 24 (6.6%) |
| 90 or more Minutes | 14 (3.4%) | 24 (6.6%) |
Time of Departure to Work by Sex in Pendergrass
The most frequent times of departure to work in Pendergrass are 6:00 AM to 6:29 AM (77, 18.9%) for males and 5:30 AM to 5:59 AM (82, 22.5%) for females.
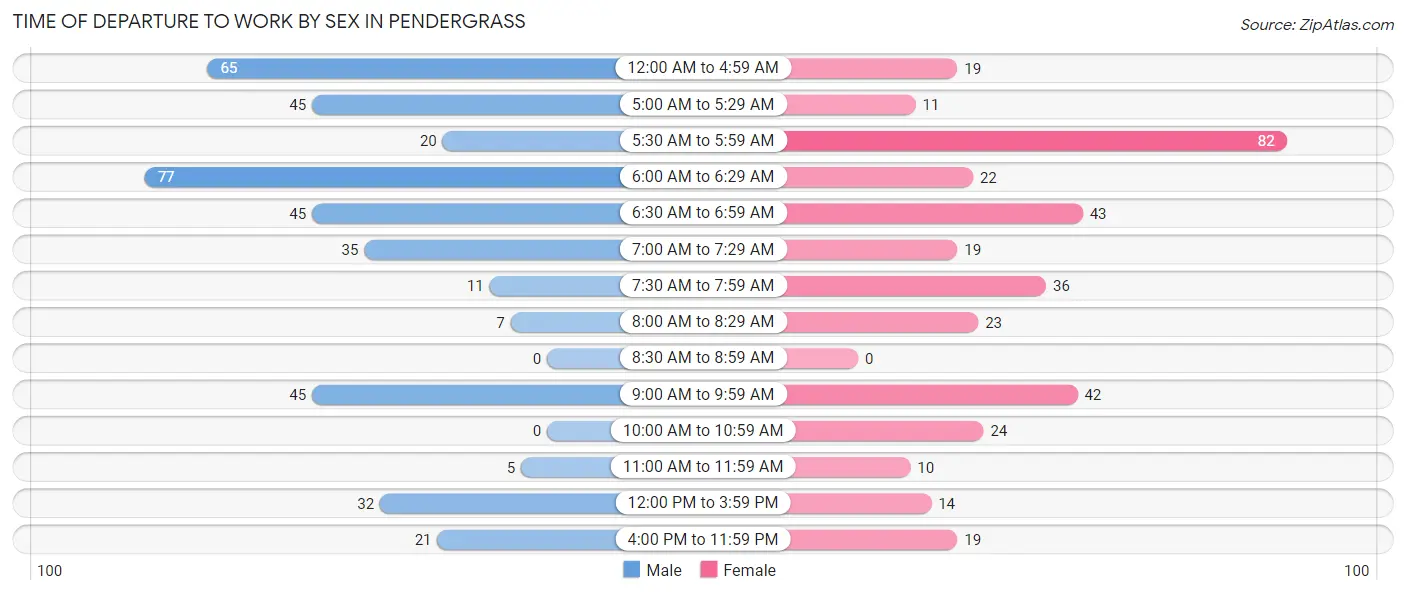
| Time of Departure | Male | Female |
| 12:00 AM to 4:59 AM | 65 (15.9%) | 19 (5.2%) |
| 5:00 AM to 5:29 AM | 45 (11.0%) | 11 (3.0%) |
| 5:30 AM to 5:59 AM | 20 (4.9%) | 82 (22.5%) |
| 6:00 AM to 6:29 AM | 77 (18.9%) | 22 (6.0%) |
| 6:30 AM to 6:59 AM | 45 (11.0%) | 43 (11.8%) |
| 7:00 AM to 7:29 AM | 35 (8.6%) | 19 (5.2%) |
| 7:30 AM to 7:59 AM | 11 (2.7%) | 36 (9.9%) |
| 8:00 AM to 8:29 AM | 7 (1.7%) | 23 (6.3%) |
| 8:30 AM to 8:59 AM | 0 (0.0%) | 0 (0.0%) |
| 9:00 AM to 9:59 AM | 45 (11.0%) | 42 (11.5%) |
| 10:00 AM to 10:59 AM | 0 (0.0%) | 24 (6.6%) |
| 11:00 AM to 11:59 AM | 5 (1.2%) | 10 (2.8%) |
| 12:00 PM to 3:59 PM | 32 (7.8%) | 14 (3.8%) |
| 4:00 PM to 11:59 PM | 21 (5.1%) | 19 (5.2%) |
| Total | 408 (100.0%) | 364 (100.0%) |
Housing Occupancy in Pendergrass
Occupancy by Ownership in Pendergrass
Of the total 524 dwellings in Pendergrass, owner-occupied units account for 391 (74.6%), while renter-occupied units make up 133 (25.4%).
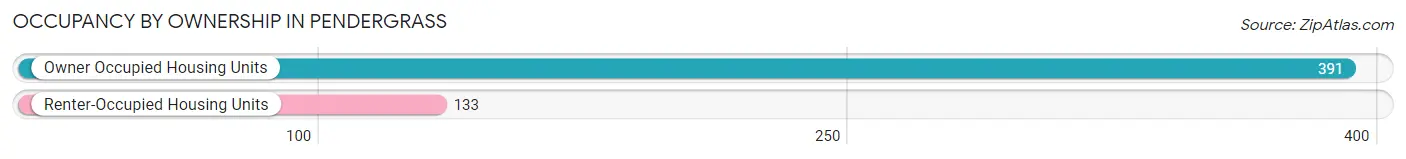
| Occupancy | # Housing Units | % Housing Units |
| Owner Occupied Housing Units | 391 | 74.6% |
| Renter-Occupied Housing Units | 133 | 25.4% |
| Total Occupied Housing Units | 524 | 100.0% |
Occupancy by Household Size in Pendergrass
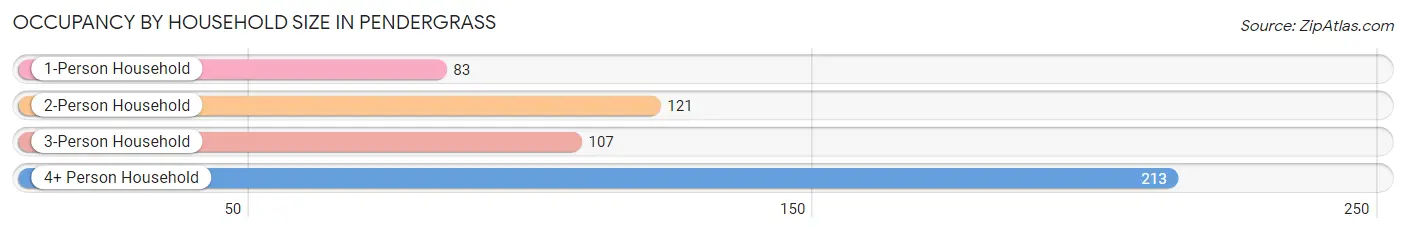
| Household Size | # Housing Units | % Housing Units |
| 1-Person Household | 83 | 15.8% |
| 2-Person Household | 121 | 23.1% |
| 3-Person Household | 107 | 20.4% |
| 4+ Person Household | 213 | 40.6% |
| Total Housing Units | 524 | 100.0% |
Occupancy by Ownership by Household Size in Pendergrass
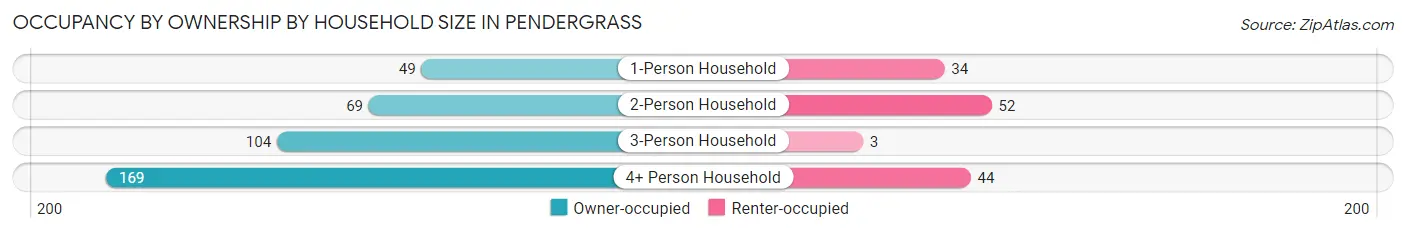
| Household Size | Owner-occupied | Renter-occupied |
| 1-Person Household | 49 (59.0%) | 34 (41.0%) |
| 2-Person Household | 69 (57.0%) | 52 (43.0%) |
| 3-Person Household | 104 (97.2%) | 3 (2.8%) |
| 4+ Person Household | 169 (79.3%) | 44 (20.7%) |
| Total Housing Units | 391 (74.6%) | 133 (25.4%) |
Occupancy by Educational Attainment in Pendergrass
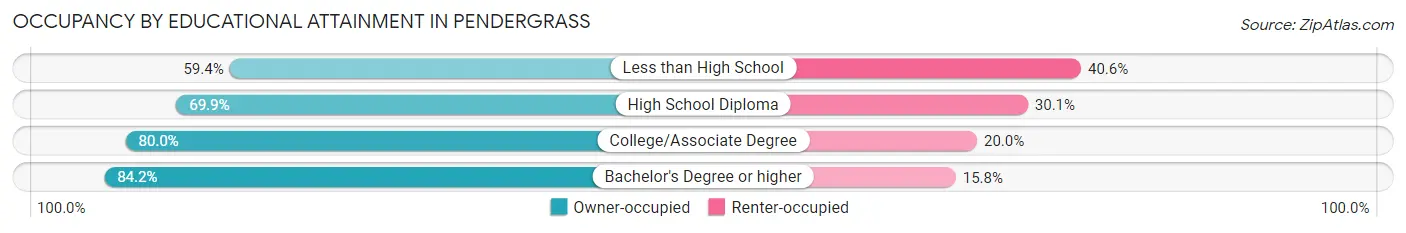
| Household Size | Owner-occupied | Renter-occupied |
| Less than High School | 57 (59.4%) | 39 (40.6%) |
| High School Diploma | 86 (69.9%) | 37 (30.1%) |
| College/Associate Degree | 168 (80.0%) | 42 (20.0%) |
| Bachelor's Degree or higher | 80 (84.2%) | 15 (15.8%) |
Occupancy by Age of Householder in Pendergrass
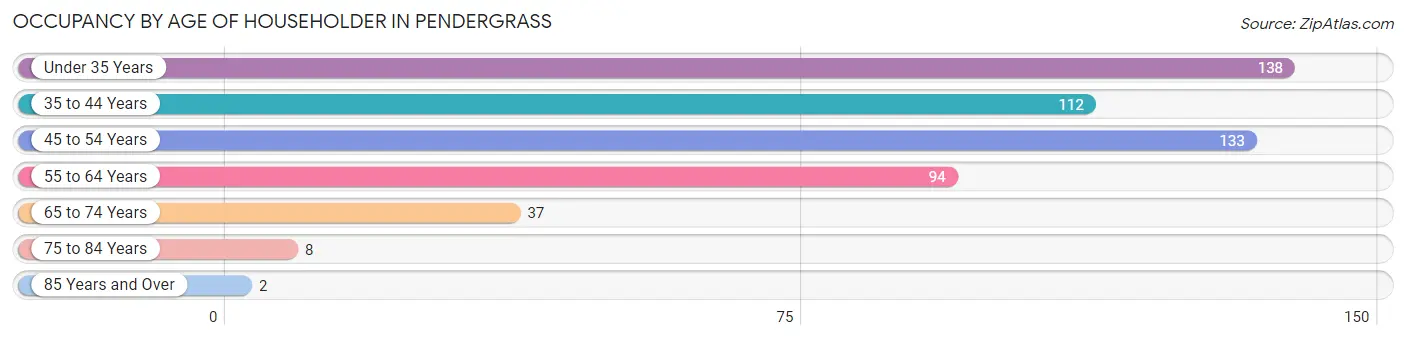
| Age Bracket | # Households | % Households |
| Under 35 Years | 138 | 26.3% |
| 35 to 44 Years | 112 | 21.4% |
| 45 to 54 Years | 133 | 25.4% |
| 55 to 64 Years | 94 | 17.9% |
| 65 to 74 Years | 37 | 7.1% |
| 75 to 84 Years | 8 | 1.5% |
| 85 Years and Over | 2 | 0.4% |
| Total | 524 | 100.0% |
Housing Finances in Pendergrass
Median Income by Occupancy in Pendergrass
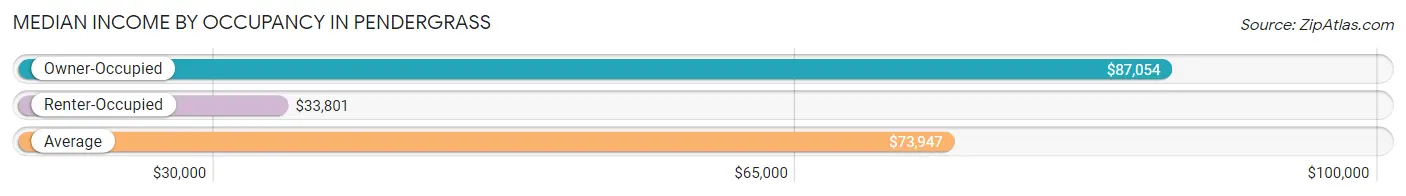
| Occupancy Type | # Households | Median Income |
| Owner-Occupied | 391 (74.6%) | $87,054 |
| Renter-Occupied | 133 (25.4%) | $33,801 |
| Average | 524 (100.0%) | $73,947 |
Occupancy by Householder Income Bracket in Pendergrass
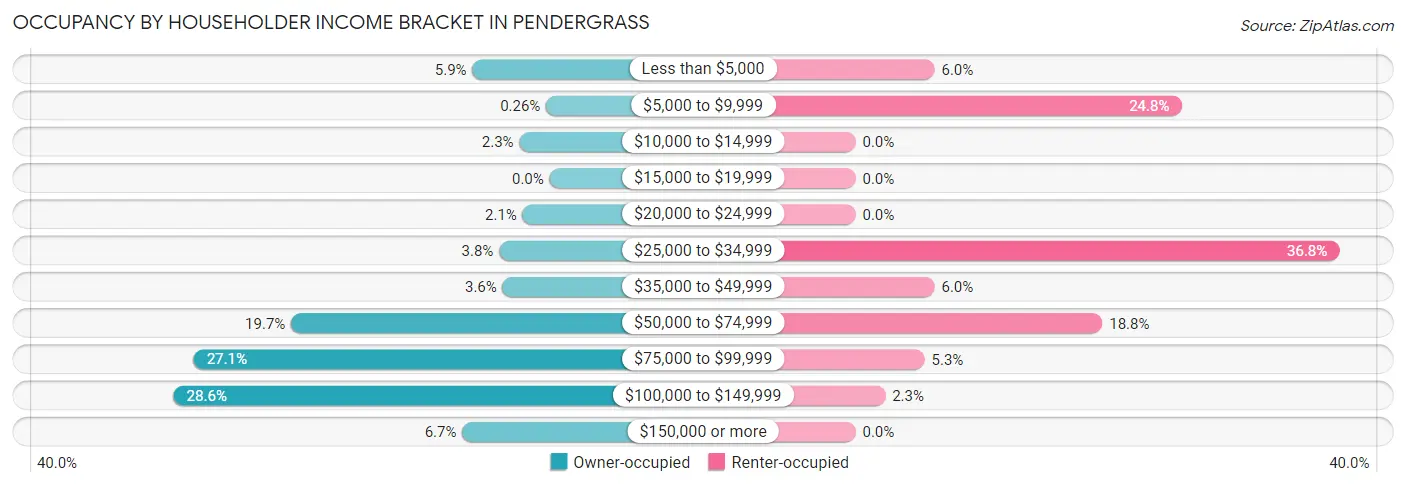
| Income Bracket | Owner-occupied | Renter-occupied |
| Less than $5,000 | 23 (5.9%) | 8 (6.0%) |
| $5,000 to $9,999 | 1 (0.3%) | 33 (24.8%) |
| $10,000 to $14,999 | 9 (2.3%) | 0 (0.0%) |
| $15,000 to $19,999 | 0 (0.0%) | 0 (0.0%) |
| $20,000 to $24,999 | 8 (2.1%) | 0 (0.0%) |
| $25,000 to $34,999 | 15 (3.8%) | 49 (36.8%) |
| $35,000 to $49,999 | 14 (3.6%) | 8 (6.0%) |
| $50,000 to $74,999 | 77 (19.7%) | 25 (18.8%) |
| $75,000 to $99,999 | 106 (27.1%) | 7 (5.3%) |
| $100,000 to $149,999 | 112 (28.6%) | 3 (2.3%) |
| $150,000 or more | 26 (6.7%) | 0 (0.0%) |
| Total | 391 (100.0%) | 133 (100.0%) |
Monthly Housing Cost Tiers in Pendergrass
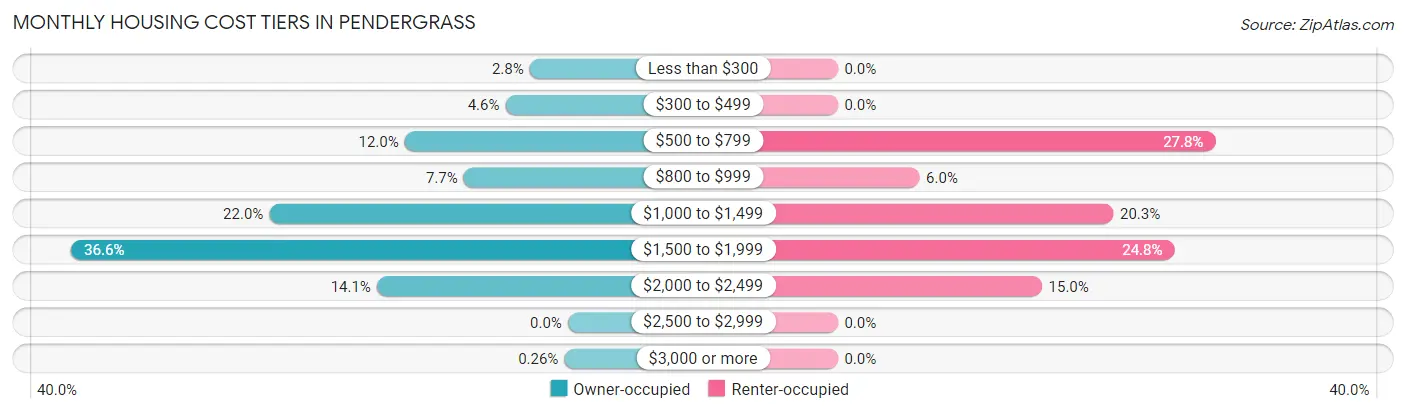
| Monthly Cost | Owner-occupied | Renter-occupied |
| Less than $300 | 11 (2.8%) | 0 (0.0%) |
| $300 to $499 | 18 (4.6%) | 0 (0.0%) |
| $500 to $799 | 47 (12.0%) | 37 (27.8%) |
| $800 to $999 | 30 (7.7%) | 8 (6.0%) |
| $1,000 to $1,499 | 86 (22.0%) | 27 (20.3%) |
| $1,500 to $1,999 | 143 (36.6%) | 33 (24.8%) |
| $2,000 to $2,499 | 55 (14.1%) | 20 (15.0%) |
| $2,500 to $2,999 | 0 (0.0%) | 0 (0.0%) |
| $3,000 or more | 1 (0.3%) | 0 (0.0%) |
| Total | 391 (100.0%) | 133 (100.0%) |
Physical Housing Characteristics in Pendergrass
Housing Structures in Pendergrass
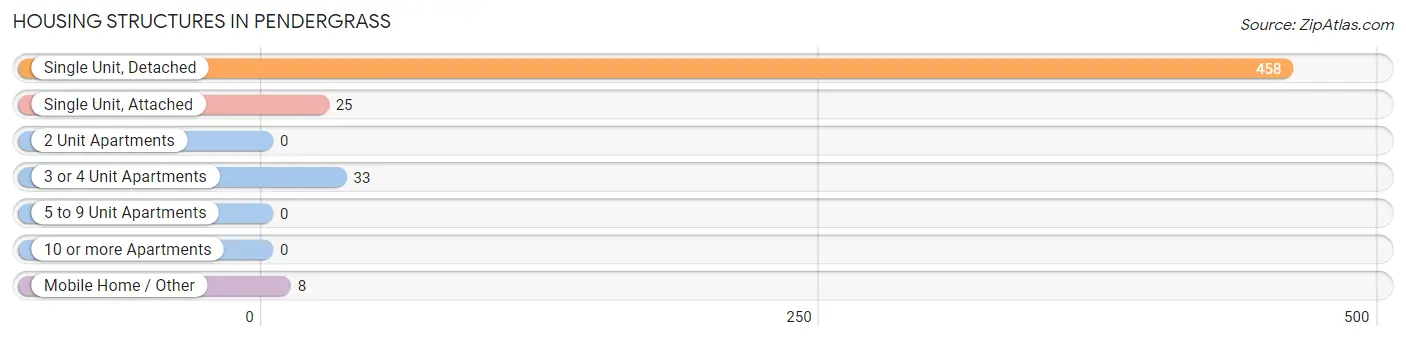
| Structure Type | # Housing Units | % Housing Units |
| Single Unit, Detached | 458 | 87.4% |
| Single Unit, Attached | 25 | 4.8% |
| 2 Unit Apartments | 0 | 0.0% |
| 3 or 4 Unit Apartments | 33 | 6.3% |
| 5 to 9 Unit Apartments | 0 | 0.0% |
| 10 or more Apartments | 0 | 0.0% |
| Mobile Home / Other | 8 | 1.5% |
| Total | 524 | 100.0% |
Housing Structures by Occupancy in Pendergrass
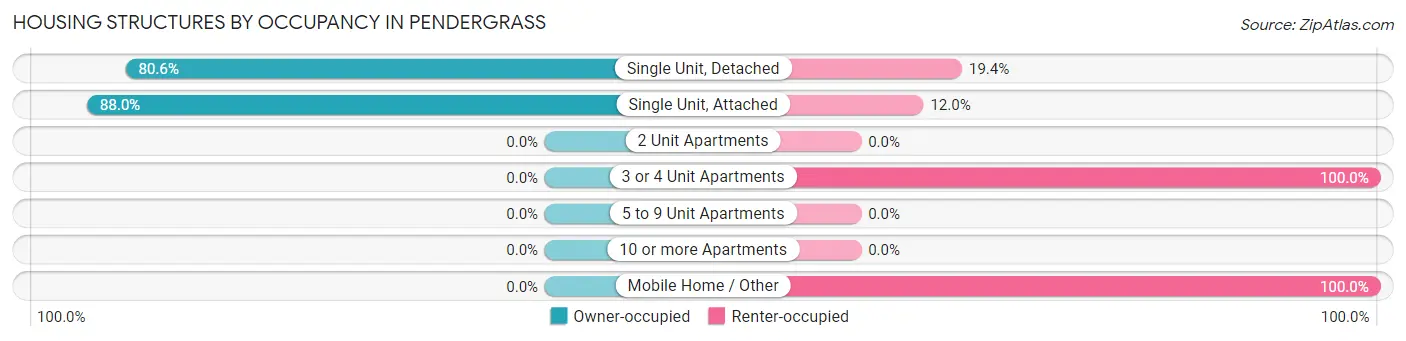
| Structure Type | Owner-occupied | Renter-occupied |
| Single Unit, Detached | 369 (80.6%) | 89 (19.4%) |
| Single Unit, Attached | 22 (88.0%) | 3 (12.0%) |
| 2 Unit Apartments | 0 (0.0%) | 0 (0.0%) |
| 3 or 4 Unit Apartments | 0 (0.0%) | 33 (100.0%) |
| 5 to 9 Unit Apartments | 0 (0.0%) | 0 (0.0%) |
| 10 or more Apartments | 0 (0.0%) | 0 (0.0%) |
| Mobile Home / Other | 0 (0.0%) | 8 (100.0%) |
| Total | 391 (74.6%) | 133 (25.4%) |
Housing Structures by Number of Rooms in Pendergrass
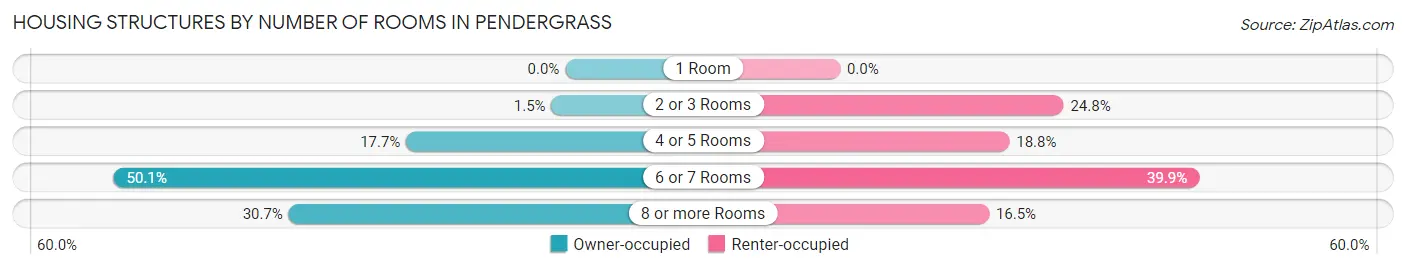
| Number of Rooms | Owner-occupied | Renter-occupied |
| 1 Room | 0 (0.0%) | 0 (0.0%) |
| 2 or 3 Rooms | 6 (1.5%) | 33 (24.8%) |
| 4 or 5 Rooms | 69 (17.6%) | 25 (18.8%) |
| 6 or 7 Rooms | 196 (50.1%) | 53 (39.9%) |
| 8 or more Rooms | 120 (30.7%) | 22 (16.5%) |
| Total | 391 (100.0%) | 133 (100.0%) |
Housing Structure by Heating Type in Pendergrass
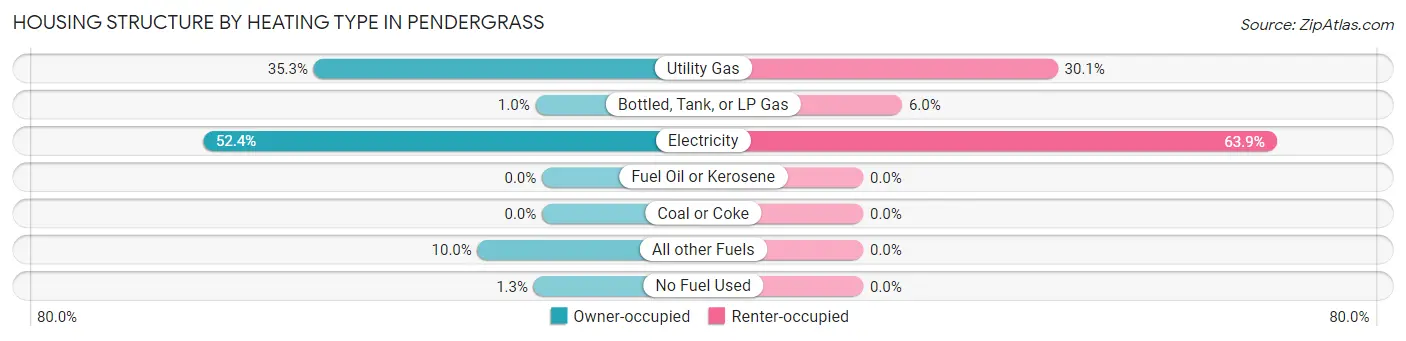
| Heating Type | Owner-occupied | Renter-occupied |
| Utility Gas | 138 (35.3%) | 40 (30.1%) |
| Bottled, Tank, or LP Gas | 4 (1.0%) | 8 (6.0%) |
| Electricity | 205 (52.4%) | 85 (63.9%) |
| Fuel Oil or Kerosene | 0 (0.0%) | 0 (0.0%) |
| Coal or Coke | 0 (0.0%) | 0 (0.0%) |
| All other Fuels | 39 (10.0%) | 0 (0.0%) |
| No Fuel Used | 5 (1.3%) | 0 (0.0%) |
| Total | 391 (100.0%) | 133 (100.0%) |
Household Vehicle Usage in Pendergrass
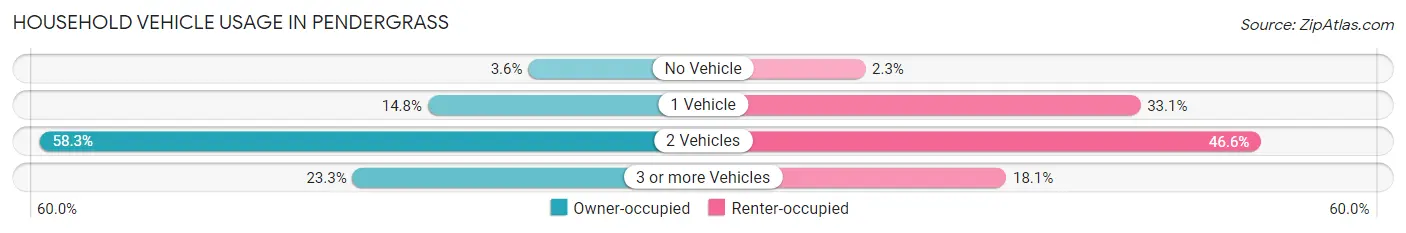
| Vehicles per Household | Owner-occupied | Renter-occupied |
| No Vehicle | 14 (3.6%) | 3 (2.3%) |
| 1 Vehicle | 58 (14.8%) | 44 (33.1%) |
| 2 Vehicles | 228 (58.3%) | 62 (46.6%) |
| 3 or more Vehicles | 91 (23.3%) | 24 (18.0%) |
| Total | 391 (100.0%) | 133 (100.0%) |
Real Estate & Mortgages in Pendergrass
Real Estate and Mortgage Overview in Pendergrass
| Characteristic | Without Mortgage | With Mortgage |
| Housing Units | 78 | 313 |
| Median Property Value | $272,000 | $275,400 |
| Median Household Income | $91,214 | $25 |
| Monthly Housing Costs | $523 | $1 |
| Real Estate Taxes | $2,480 | $19 |
Property Value by Mortgage Status in Pendergrass
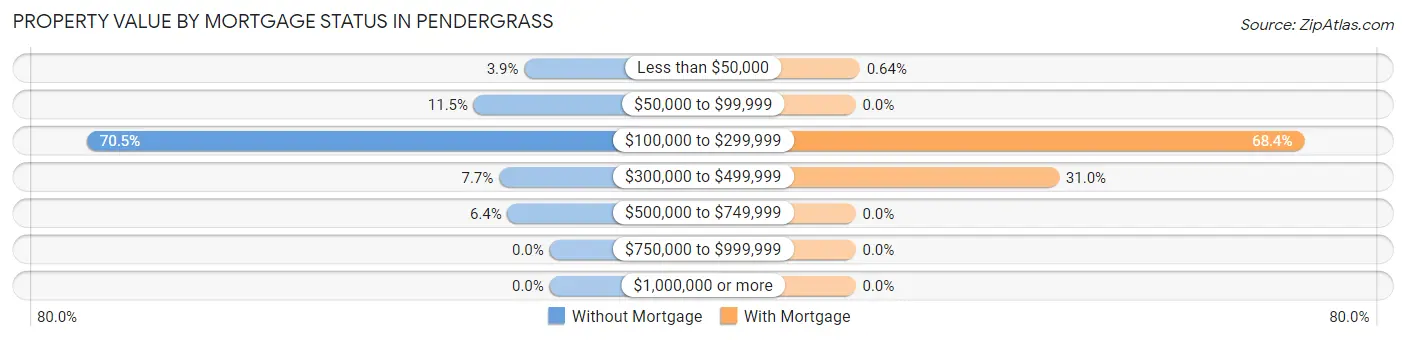
| Property Value | Without Mortgage | With Mortgage |
| Less than $50,000 | 3 (3.8%) | 2 (0.6%) |
| $50,000 to $99,999 | 9 (11.5%) | 0 (0.0%) |
| $100,000 to $299,999 | 55 (70.5%) | 214 (68.4%) |
| $300,000 to $499,999 | 6 (7.7%) | 97 (31.0%) |
| $500,000 to $749,999 | 5 (6.4%) | 0 (0.0%) |
| $750,000 to $999,999 | 0 (0.0%) | 0 (0.0%) |
| $1,000,000 or more | 0 (0.0%) | 0 (0.0%) |
| Total | 78 (100.0%) | 313 (100.0%) |
Household Income by Mortgage Status in Pendergrass
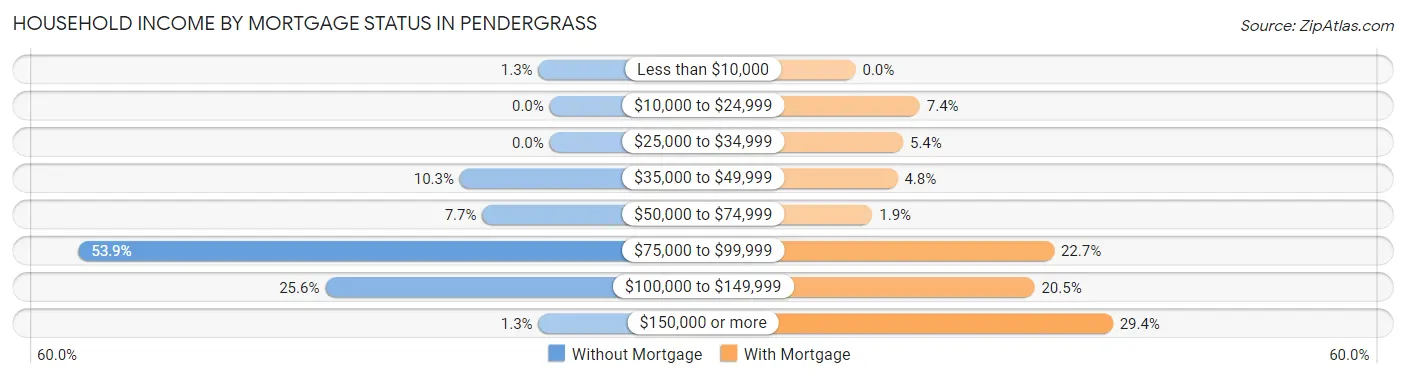
| Household Income | Without Mortgage | With Mortgage |
| Less than $10,000 | 1 (1.3%) | 0 (0.0%) |
| $10,000 to $24,999 | 0 (0.0%) | 23 (7.3%) |
| $25,000 to $34,999 | 0 (0.0%) | 17 (5.4%) |
| $35,000 to $49,999 | 8 (10.3%) | 15 (4.8%) |
| $50,000 to $74,999 | 6 (7.7%) | 6 (1.9%) |
| $75,000 to $99,999 | 42 (53.8%) | 71 (22.7%) |
| $100,000 to $149,999 | 20 (25.6%) | 64 (20.4%) |
| $150,000 or more | 1 (1.3%) | 92 (29.4%) |
| Total | 78 (100.0%) | 313 (100.0%) |
Property Value to Household Income Ratio in Pendergrass
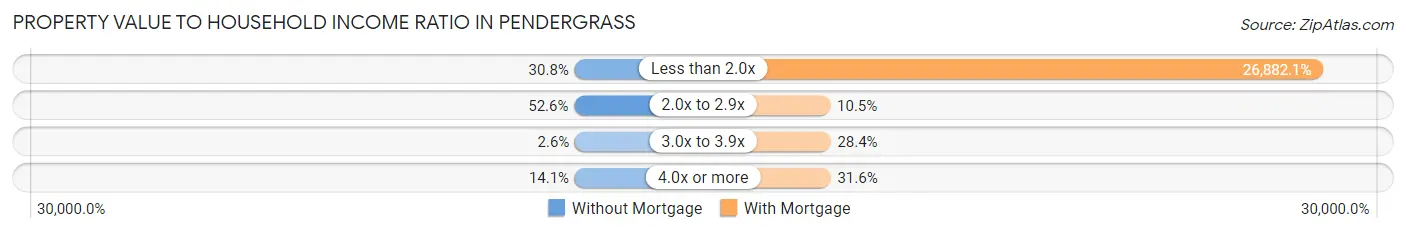
| Value-to-Income Ratio | Without Mortgage | With Mortgage |
| Less than 2.0x | 24 (30.8%) | 84,141 (26,882.1%) |
| 2.0x to 2.9x | 41 (52.6%) | 33 (10.5%) |
| 3.0x to 3.9x | 2 (2.6%) | 89 (28.4%) |
| 4.0x or more | 11 (14.1%) | 99 (31.6%) |
| Total | 78 (100.0%) | 313 (100.0%) |
Real Estate Taxes by Mortgage Status in Pendergrass
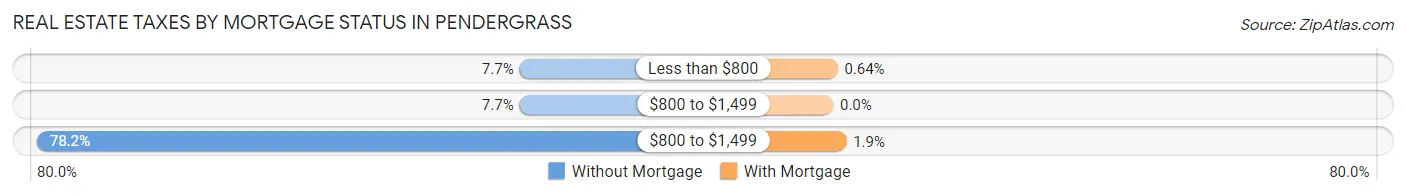
| Property Taxes | Without Mortgage | With Mortgage |
| Less than $800 | 6 (7.7%) | 2 (0.6%) |
| $800 to $1,499 | 6 (7.7%) | 0 (0.0%) |
| $800 to $1,499 | 61 (78.2%) | 6 (1.9%) |
| Total | 78 (100.0%) | 313 (100.0%) |
Health & Disability in Pendergrass
Health Insurance Coverage by Age in Pendergrass
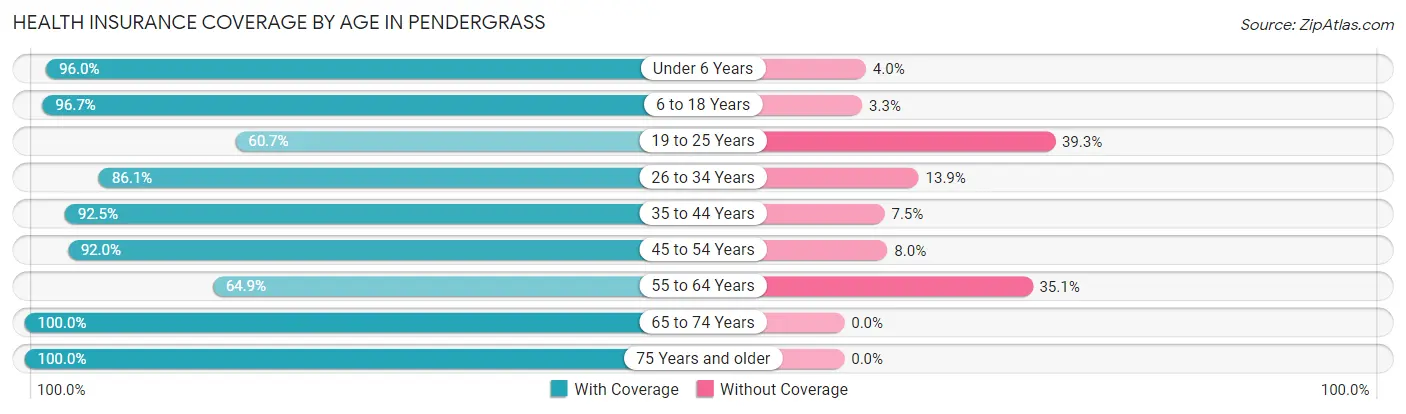
| Age Bracket | With Coverage | Without Coverage |
| Under 6 Years | 119 (96.0%) | 5 (4.0%) |
| 6 to 18 Years | 493 (96.7%) | 17 (3.3%) |
| 19 to 25 Years | 51 (60.7%) | 33 (39.3%) |
| 26 to 34 Years | 261 (86.1%) | 42 (13.9%) |
| 35 to 44 Years | 234 (92.5%) | 19 (7.5%) |
| 45 to 54 Years | 183 (92.0%) | 16 (8.0%) |
| 55 to 64 Years | 111 (64.9%) | 60 (35.1%) |
| 65 to 74 Years | 44 (100.0%) | 0 (0.0%) |
| 75 Years and older | 17 (100.0%) | 0 (0.0%) |
| Total | 1,513 (88.7%) | 192 (11.3%) |
Health Insurance Coverage by Citizenship Status in Pendergrass
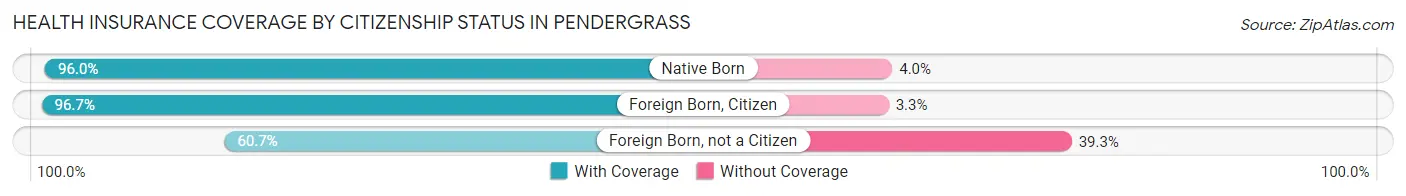
| Citizenship Status | With Coverage | Without Coverage |
| Native Born | 119 (96.0%) | 5 (4.0%) |
| Foreign Born, Citizen | 493 (96.7%) | 17 (3.3%) |
| Foreign Born, not a Citizen | 51 (60.7%) | 33 (39.3%) |
Health Insurance Coverage by Household Income in Pendergrass
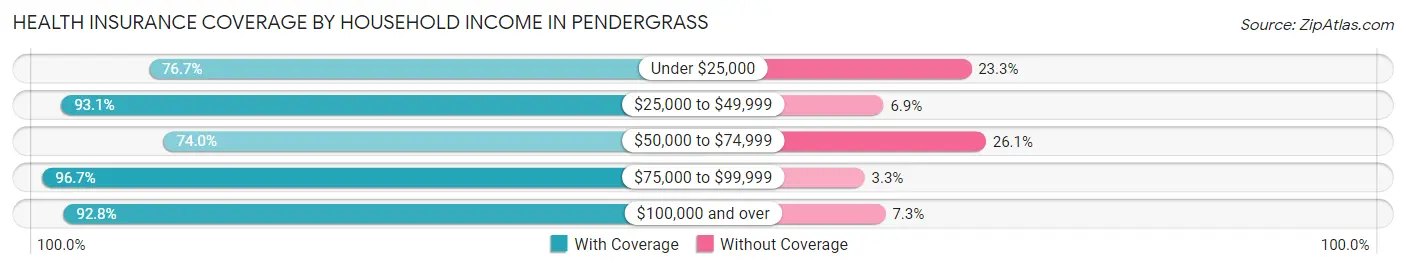
| Household Income | With Coverage | Without Coverage |
| Under $25,000 | 125 (76.7%) | 38 (23.3%) |
| $25,000 to $49,999 | 244 (93.1%) | 18 (6.9%) |
| $50,000 to $74,999 | 230 (74.0%) | 81 (26.1%) |
| $75,000 to $99,999 | 377 (96.7%) | 13 (3.3%) |
| $100,000 and over | 537 (92.7%) | 42 (7.2%) |
Public vs Private Health Insurance Coverage by Age in Pendergrass
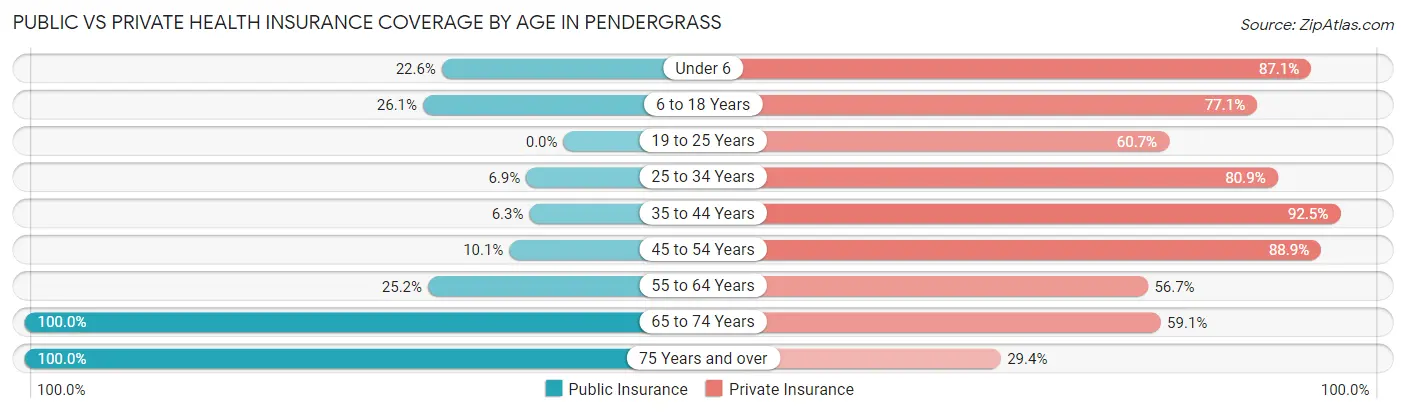
| Age Bracket | Public Insurance | Private Insurance |
| Under 6 | 28 (22.6%) | 108 (87.1%) |
| 6 to 18 Years | 133 (26.1%) | 393 (77.1%) |
| 19 to 25 Years | 0 (0.0%) | 51 (60.7%) |
| 25 to 34 Years | 21 (6.9%) | 245 (80.9%) |
| 35 to 44 Years | 16 (6.3%) | 234 (92.5%) |
| 45 to 54 Years | 20 (10.1%) | 177 (88.9%) |
| 55 to 64 Years | 43 (25.2%) | 97 (56.7%) |
| 65 to 74 Years | 44 (100.0%) | 26 (59.1%) |
| 75 Years and over | 17 (100.0%) | 5 (29.4%) |
| Total | 322 (18.9%) | 1,336 (78.4%) |
Disability Status by Sex by Age in Pendergrass
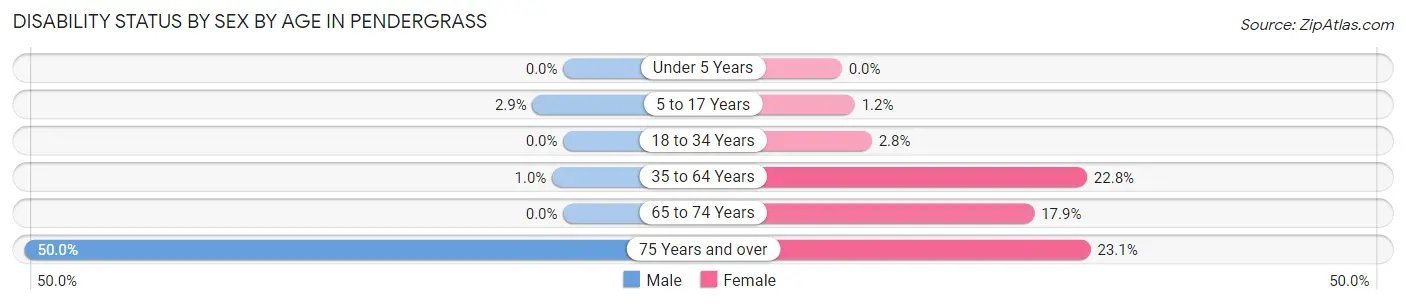
| Age Bracket | Male | Female |
| Under 5 Years | 0 (0.0%) | 0 (0.0%) |
| 5 to 17 Years | 7 (2.9%) | 3 (1.2%) |
| 18 to 34 Years | 0 (0.0%) | 5 (2.8%) |
| 35 to 64 Years | 3 (1.0%) | 76 (22.8%) |
| 65 to 74 Years | 0 (0.0%) | 5 (17.9%) |
| 75 Years and over | 2 (50.0%) | 3 (23.1%) |
Disability Class by Sex by Age in Pendergrass
Disability Class: Hearing Difficulty
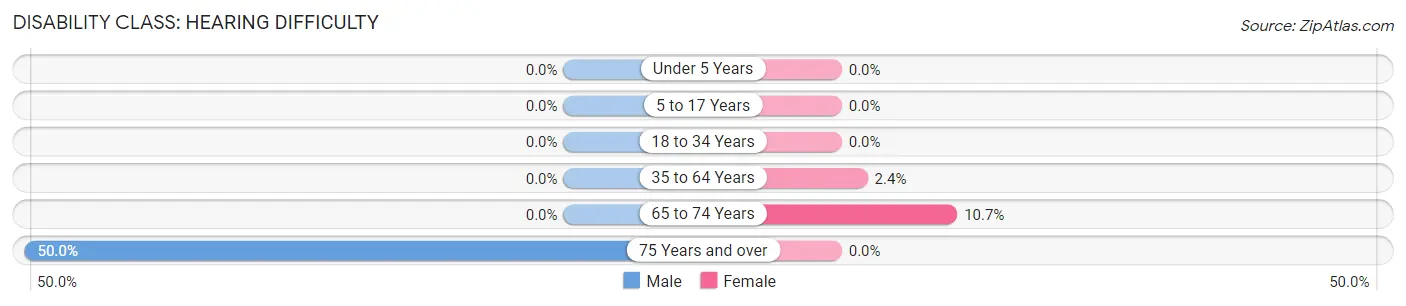
| Age Bracket | Male | Female |
| Under 5 Years | 0 (0.0%) | 0 (0.0%) |
| 5 to 17 Years | 0 (0.0%) | 0 (0.0%) |
| 18 to 34 Years | 0 (0.0%) | 0 (0.0%) |
| 35 to 64 Years | 0 (0.0%) | 8 (2.4%) |
| 65 to 74 Years | 0 (0.0%) | 3 (10.7%) |
| 75 Years and over | 2 (50.0%) | 0 (0.0%) |
Disability Class: Vision Difficulty
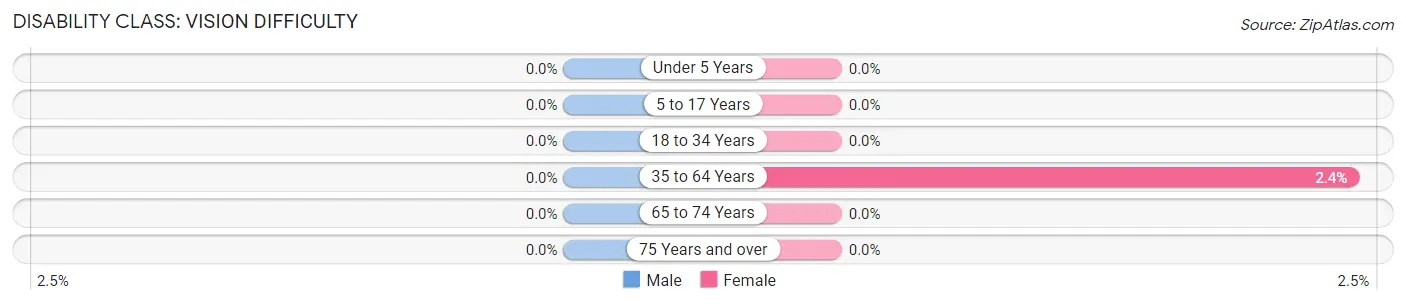
| Age Bracket | Male | Female |
| Under 5 Years | 0 (0.0%) | 0 (0.0%) |
| 5 to 17 Years | 0 (0.0%) | 0 (0.0%) |
| 18 to 34 Years | 0 (0.0%) | 0 (0.0%) |
| 35 to 64 Years | 0 (0.0%) | 8 (2.4%) |
| 65 to 74 Years | 0 (0.0%) | 0 (0.0%) |
| 75 Years and over | 0 (0.0%) | 0 (0.0%) |
Disability Class: Cognitive Difficulty
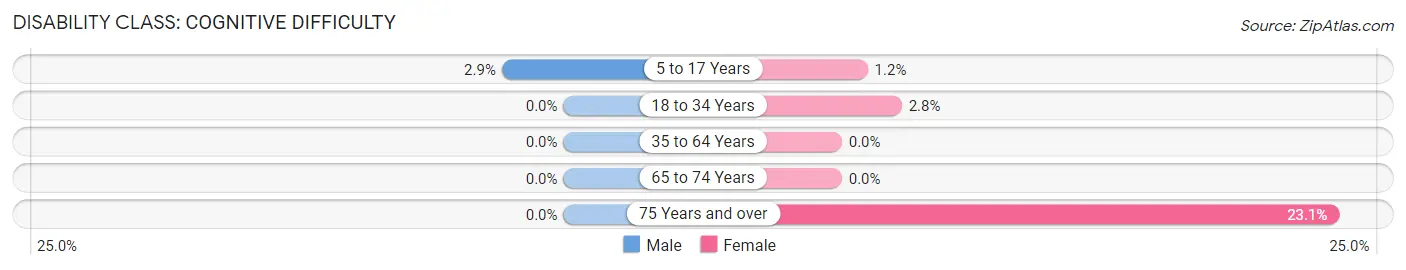
| Age Bracket | Male | Female |
| 5 to 17 Years | 7 (2.9%) | 3 (1.2%) |
| 18 to 34 Years | 0 (0.0%) | 5 (2.8%) |
| 35 to 64 Years | 0 (0.0%) | 0 (0.0%) |
| 65 to 74 Years | 0 (0.0%) | 0 (0.0%) |
| 75 Years and over | 0 (0.0%) | 3 (23.1%) |
Disability Class: Ambulatory Difficulty
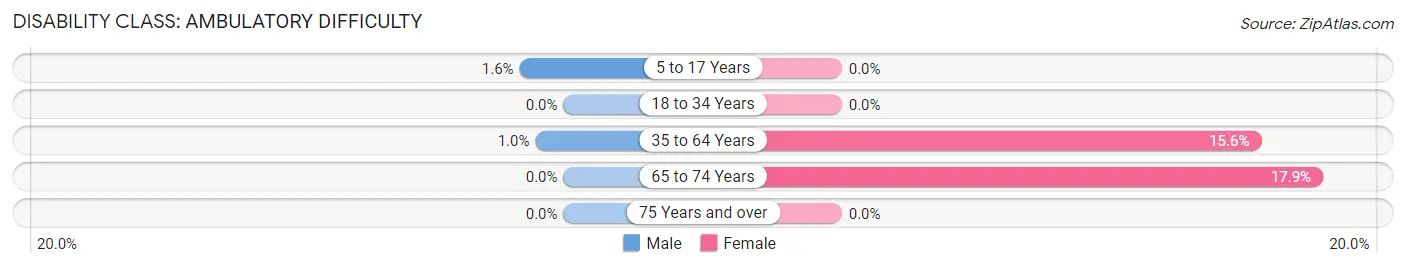
| Age Bracket | Male | Female |
| 5 to 17 Years | 4 (1.6%) | 0 (0.0%) |
| 18 to 34 Years | 0 (0.0%) | 0 (0.0%) |
| 35 to 64 Years | 3 (1.0%) | 52 (15.6%) |
| 65 to 74 Years | 0 (0.0%) | 5 (17.9%) |
| 75 Years and over | 0 (0.0%) | 0 (0.0%) |
Disability Class: Self-Care Difficulty
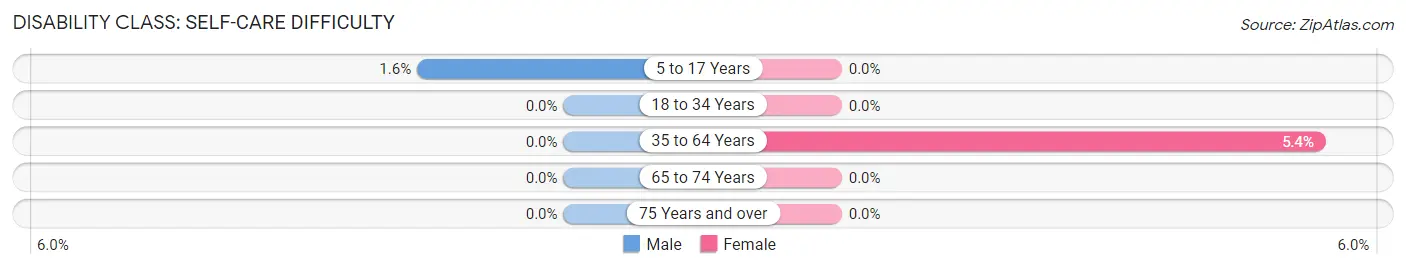
| Age Bracket | Male | Female |
| 5 to 17 Years | 4 (1.6%) | 0 (0.0%) |
| 18 to 34 Years | 0 (0.0%) | 0 (0.0%) |
| 35 to 64 Years | 0 (0.0%) | 18 (5.4%) |
| 65 to 74 Years | 0 (0.0%) | 0 (0.0%) |
| 75 Years and over | 0 (0.0%) | 0 (0.0%) |
Technology Access in Pendergrass
Computing Device Access in Pendergrass
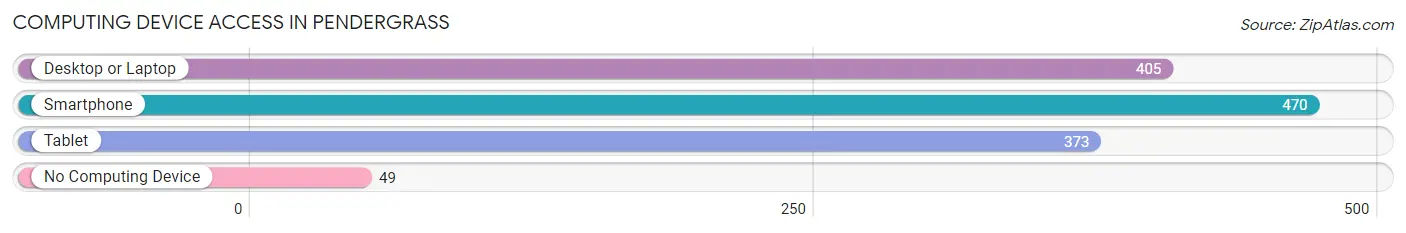
| Device Type | # Households | % Households |
| Desktop or Laptop | 405 | 77.3% |
| Smartphone | 470 | 89.7% |
| Tablet | 373 | 71.2% |
| No Computing Device | 49 | 9.3% |
| Total | 524 | 100.0% |
Internet Access in Pendergrass
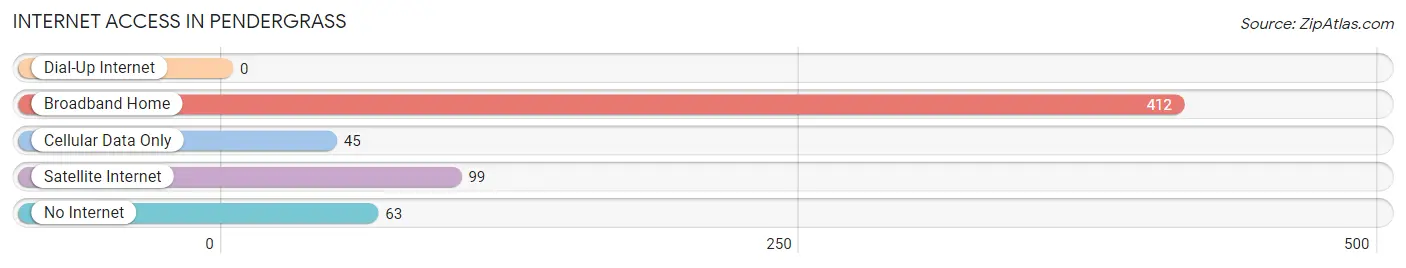
| Internet Type | # Households | % Households |
| Dial-Up Internet | 0 | 0.0% |
| Broadband Home | 412 | 78.6% |
| Cellular Data Only | 45 | 8.6% |
| Satellite Internet | 99 | 18.9% |
| No Internet | 63 | 12.0% |
| Total | 524 | 100.0% |
Pendergrass Summary
Pendergrass is a small town located in Jackson County, Georgia, United States. It is situated in the foothills of the Blue Ridge Mountains, approximately 50 miles northeast of Atlanta. The town was founded in 1883 and was named after the Pendergrass family, who were early settlers in the area. As of the 2010 census, the population of Pendergrass was 1,845.
History
The area that is now Pendergrass was originally inhabited by the Cherokee Indians. In 1832, the Cherokee were forced to move west on the Trail of Tears. After the Cherokee were removed, the area was settled by European-American settlers. The first settler in the area was William Pendergrass, who arrived in 1833. He was followed by other settlers, including the families of John and William Pendergrass, who established a small community in the area.
In 1883, the town of Pendergrass was officially incorporated. The town was named after the Pendergrass family, who were early settlers in the area. The town quickly grew and by the early 1900s, it had become a thriving agricultural community. The town was also home to several businesses, including a sawmill, a gristmill, and a cotton gin.
Geography
Pendergrass is located in Jackson County, Georgia, approximately 50 miles northeast of Atlanta. The town is situated in the foothills of the Blue Ridge Mountains. The town is located at an elevation of 1,068 feet above sea level. The town is bordered by the cities of Commerce and Jefferson to the north, Hoschton to the east, and Talmo to the south.
The town covers an area of 2.2 square miles, all of which is land. The town is located along the banks of the South Fork of the Broad River. The town is also home to several small lakes, including Lake Pendergrass and Lake Lanier.
Economy
The economy of Pendergrass is largely based on agriculture. The town is home to several farms, which produce a variety of crops, including corn, soybeans, and cotton. The town is also home to several small businesses, including a sawmill, a gristmill, and a cotton gin.
The town is also home to several manufacturing companies, including a furniture factory and a plastics factory. The town is also home to several retail stores, including a grocery store, a hardware store, and a pharmacy.
Demographics
As of the 2010 census, the population of Pendergrass was 1,845. The racial makeup of the town was 94.3% White, 3.2% African American, 0.3% Native American, 0.2% Asian, 0.1% Pacific Islander, 0.7% from other races, and 1.3% from two or more races. Hispanic or Latino of any race were 2.2% of the population.
The median household income in Pendergrass was $37,917, and the median family income was $45,625. The per capita income in the town was $18,945. About 11.2% of the population was below the poverty line.
Common Questions
What is Per Capita Income in Pendergrass?
Per Capita income in Pendergrass is $23,879.
What is the Median Family Income in Pendergrass?
Median Family Income in Pendergrass is $61,654.
What is the Median Household income in Pendergrass?
Median Household Income in Pendergrass is $73,947.
What is Income or Wage Gap in Pendergrass?
Income or Wage Gap in Pendergrass is 39.1%.
Women in Pendergrass earn 60.9 cents for every dollar earned by a man.
What is Inequality or Gini Index in Pendergrass?
Inequality or Gini Index in Pendergrass is 0.36.
What is the Total Population of Pendergrass?
Total Population of Pendergrass is 1,705.
What is the Total Male Population of Pendergrass?
Total Male Population of Pendergrass is 848.
What is the Total Female Population of Pendergrass?
Total Female Population of Pendergrass is 857.
What is the Ratio of Males per 100 Females in Pendergrass?
There are 98.95 Males per 100 Females in Pendergrass.
What is the Ratio of Females per 100 Males in Pendergrass?
There are 101.06 Females per 100 Males in Pendergrass.
What is the Median Population Age in Pendergrass?
Median Population Age in Pendergrass is 31.8 Years.
What is the Average Family Size in Pendergrass
Average Family Size in Pendergrass is 3.5 People.
What is the Average Household Size in Pendergrass
Average Household Size in Pendergrass is 3.2 People.
How Large is the Labor Force in Pendergrass?
There are 911 People in the Labor Forcein in Pendergrass.
What is the Percentage of People in the Labor Force in Pendergrass?
78.7% of People are in the Labor Force in Pendergrass.
What is the Unemployment Rate in Pendergrass?
Unemployment Rate in Pendergrass is 2.9%.