Holladay, UT Map & Demographics
Holladay Map
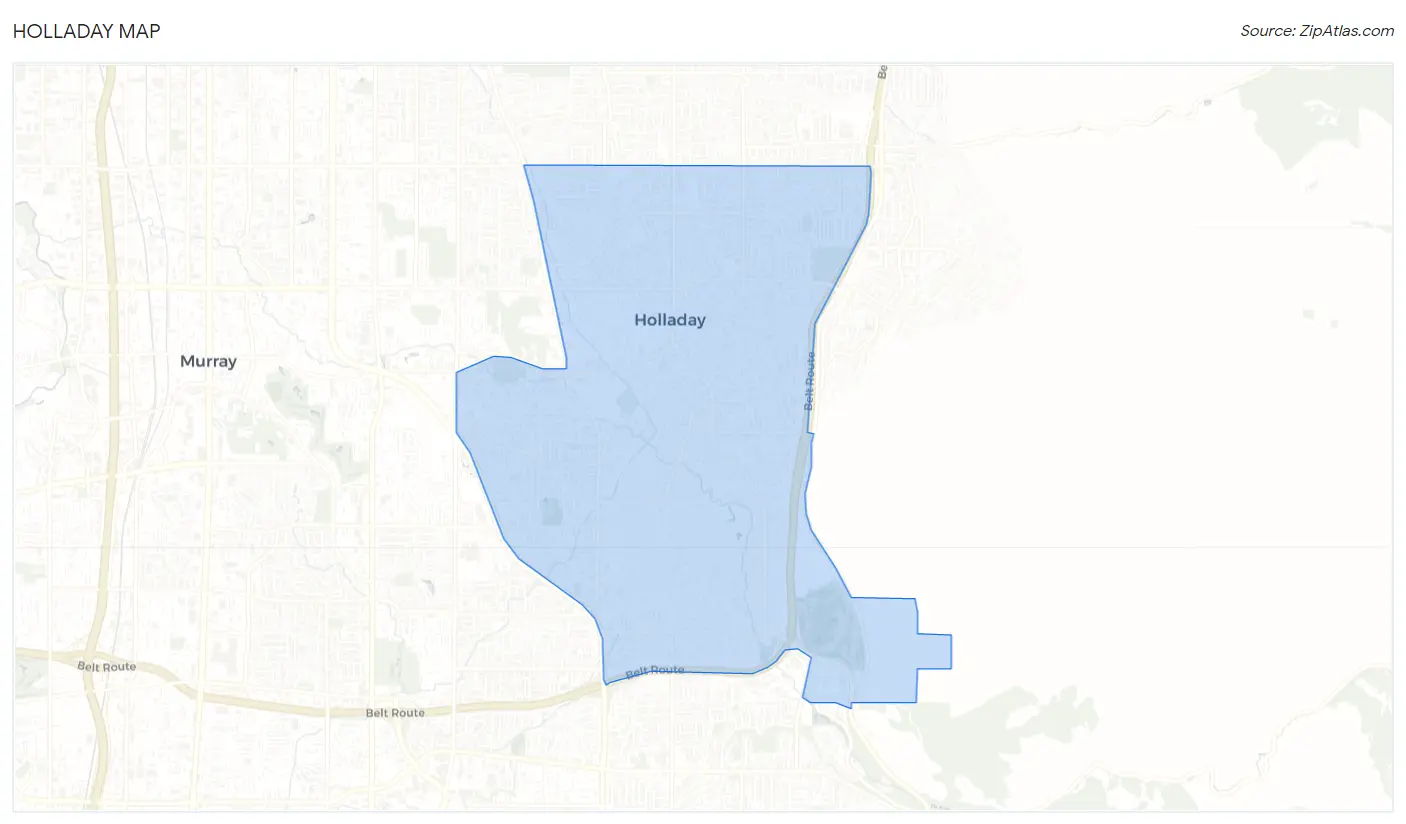
Holladay Overview
$58,208
PER CAPITA INCOME
$133,137
AVG FAMILY INCOME
$106,099
AVG HOUSEHOLD INCOME
39.1%
WAGE / INCOME GAP [ % ]
60.9¢/ $1
WAGE / INCOME GAP [ $ ]
$11,236
FAMILY INCOME DEFICIT
0.48
INEQUALITY / GINI INDEX
31,563
TOTAL POPULATION
15,669
MALE POPULATION
15,894
FEMALE POPULATION
98.58
MALES / 100 FEMALES
101.44
FEMALES / 100 MALES
39.6
MEDIAN AGE
3.2
AVG FAMILY SIZE
2.7
AVG HOUSEHOLD SIZE
15,938
LABOR FORCE [ PEOPLE ]
64.3%
PERCENT IN LABOR FORCE
3.1%
UNEMPLOYMENT RATE
Income in Holladay
Income Overview in Holladay
Per Capita Income in Holladay is $58,208, while median incomes of families and households are $133,137 and $106,099 respectively.
| Characteristic | Number | Measure |
| Per Capita Income | 31,563 | $58,208 |
| Median Family Income | 8,226 | $133,137 |
| Mean Family Income | 8,226 | $184,894 |
| Median Household Income | 11,727 | $106,099 |
| Mean Household Income | 11,727 | $153,937 |
| Income Deficit | 8,226 | $11,236 |
| Wage / Income Gap (%) | 31,563 | 39.10% |
| Wage / Income Gap ($) | 31,563 | 60.90¢ per $1 |
| Gini / Inequality Index | 31,563 | 0.48 |
Earnings by Sex in Holladay
Average Earnings in Holladay are $50,214, $63,145 for men and $38,455 for women, a difference of 39.1%.
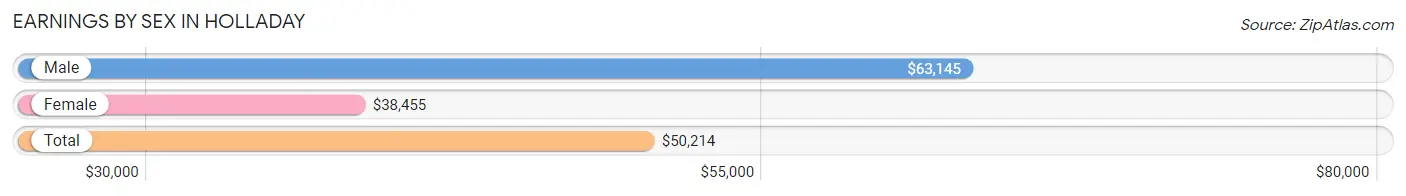
| Sex | Number | Average Earnings |
| Male | 9,510 (56.1%) | $63,145 |
| Female | 7,454 (43.9%) | $38,455 |
| Total | 16,964 (100.0%) | $50,214 |
Earnings by Sex by Income Bracket in Holladay
The most common earnings brackets in Holladay are $100,000+ for men (3,330 | 35.0%) and $100,000+ for women (1,059 | 14.2%).
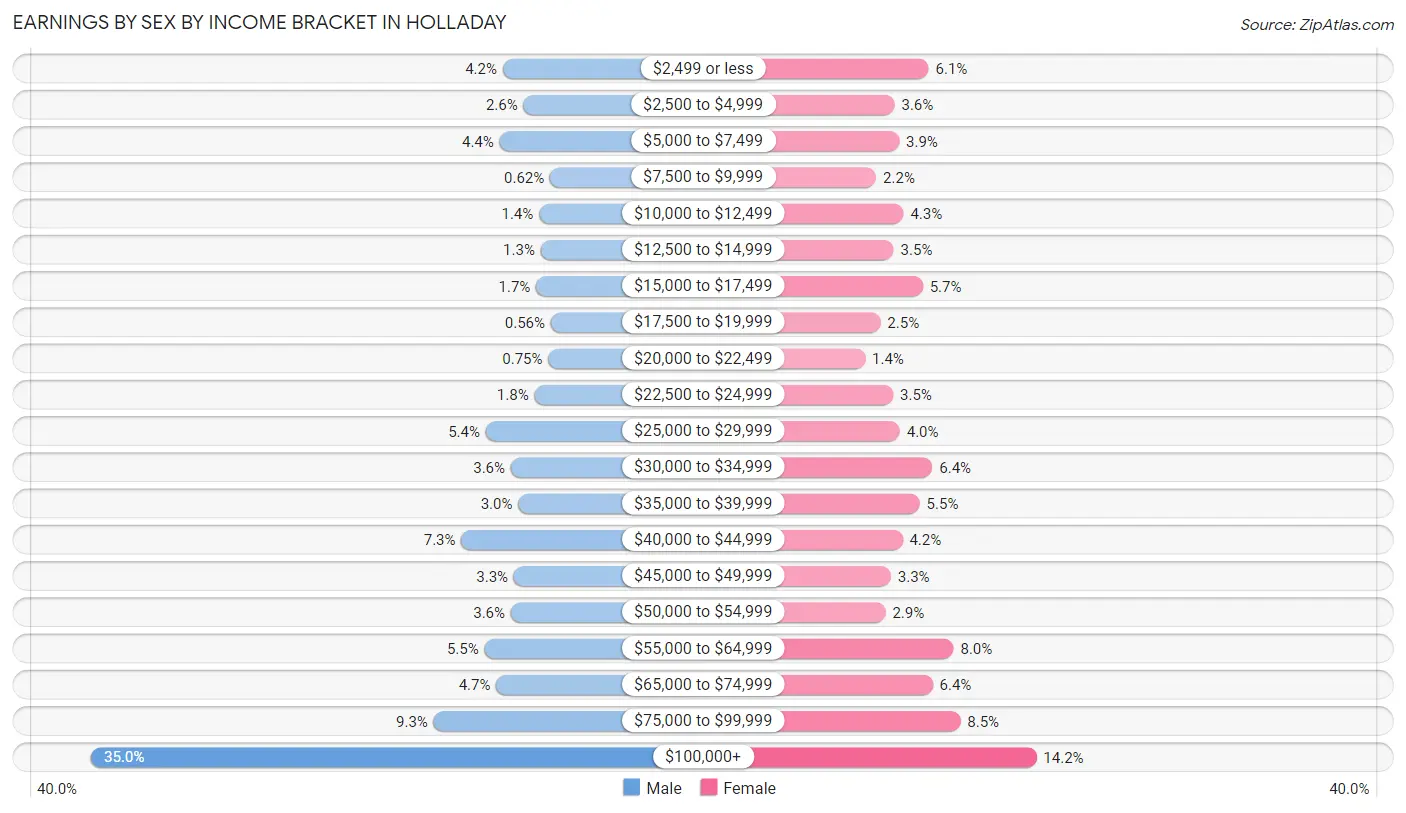
| Income | Male | Female |
| $2,499 or less | 396 (4.2%) | 457 (6.1%) |
| $2,500 to $4,999 | 248 (2.6%) | 267 (3.6%) |
| $5,000 to $7,499 | 418 (4.4%) | 292 (3.9%) |
| $7,500 to $9,999 | 59 (0.6%) | 164 (2.2%) |
| $10,000 to $12,499 | 137 (1.4%) | 317 (4.3%) |
| $12,500 to $14,999 | 126 (1.3%) | 262 (3.5%) |
| $15,000 to $17,499 | 158 (1.7%) | 424 (5.7%) |
| $17,500 to $19,999 | 53 (0.6%) | 188 (2.5%) |
| $20,000 to $22,499 | 71 (0.7%) | 102 (1.4%) |
| $22,500 to $24,999 | 170 (1.8%) | 259 (3.5%) |
| $25,000 to $29,999 | 517 (5.4%) | 296 (4.0%) |
| $30,000 to $34,999 | 339 (3.6%) | 478 (6.4%) |
| $35,000 to $39,999 | 285 (3.0%) | 407 (5.5%) |
| $40,000 to $44,999 | 691 (7.3%) | 311 (4.2%) |
| $45,000 to $49,999 | 317 (3.3%) | 246 (3.3%) |
| $50,000 to $54,999 | 339 (3.6%) | 216 (2.9%) |
| $55,000 to $64,999 | 526 (5.5%) | 596 (8.0%) |
| $65,000 to $74,999 | 442 (4.6%) | 479 (6.4%) |
| $75,000 to $99,999 | 888 (9.3%) | 634 (8.5%) |
| $100,000+ | 3,330 (35.0%) | 1,059 (14.2%) |
| Total | 9,510 (100.0%) | 7,454 (100.0%) |
Earnings by Sex by Educational Attainment in Holladay
Average earnings in Holladay are $77,702 for men and $46,131 for women, a difference of 40.6%. Men with an educational attainment of graduate degree enjoy the highest average annual earnings of $153,135, while those with less than high school education earn the least with $42,059. Women with an educational attainment of graduate degree earn the most with the average annual earnings of $74,000, while those with high school diploma education have the smallest earnings of $30,856.
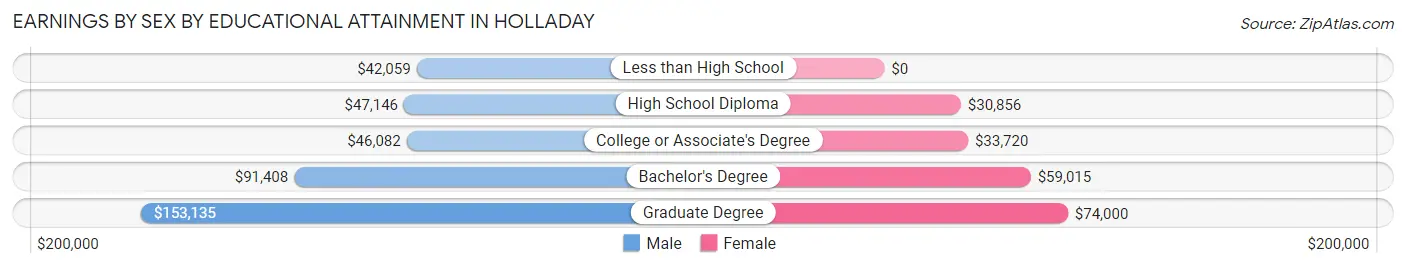
| Educational Attainment | Male Income | Female Income |
| Less than High School | $42,059 | $0 |
| High School Diploma | $47,146 | $30,856 |
| College or Associate's Degree | $46,082 | $33,720 |
| Bachelor's Degree | $91,408 | $59,015 |
| Graduate Degree | $153,135 | $74,000 |
| Total | $77,702 | $46,131 |
Family Income in Holladay
Family Income Brackets in Holladay
According to the Holladay family income data, there are 2,418 families falling into the $200,000+ income range, which is the most common income bracket and makes up 29.4% of all families. Conversely, the $10,000 to $14,999 income bracket is the least frequent group with only 49 families (0.6%) belonging to this category.
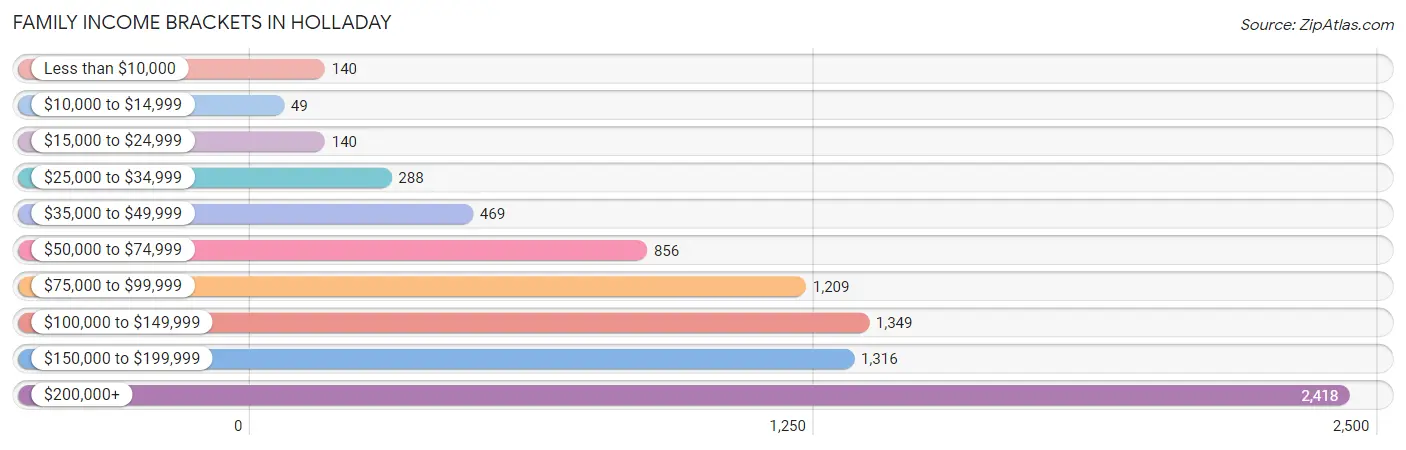
| Income Bracket | # Families | % Families |
| Less than $10,000 | 140 | 1.7% |
| $10,000 to $14,999 | 49 | 0.6% |
| $15,000 to $24,999 | 140 | 1.7% |
| $25,000 to $34,999 | 288 | 3.5% |
| $35,000 to $49,999 | 469 | 5.7% |
| $50,000 to $74,999 | 856 | 10.4% |
| $75,000 to $99,999 | 1,209 | 14.7% |
| $100,000 to $149,999 | 1,349 | 16.4% |
| $150,000 to $199,999 | 1,316 | 16.0% |
| $200,000+ | 2,418 | 29.4% |
Family Income by Famaliy Size in Holladay
6-person families (481 | 5.9%) account for the highest median family income in Holladay with $250,001 per family, while 4-person families (1,381 | 16.8%) have the highest median income of $48,301 per family member.
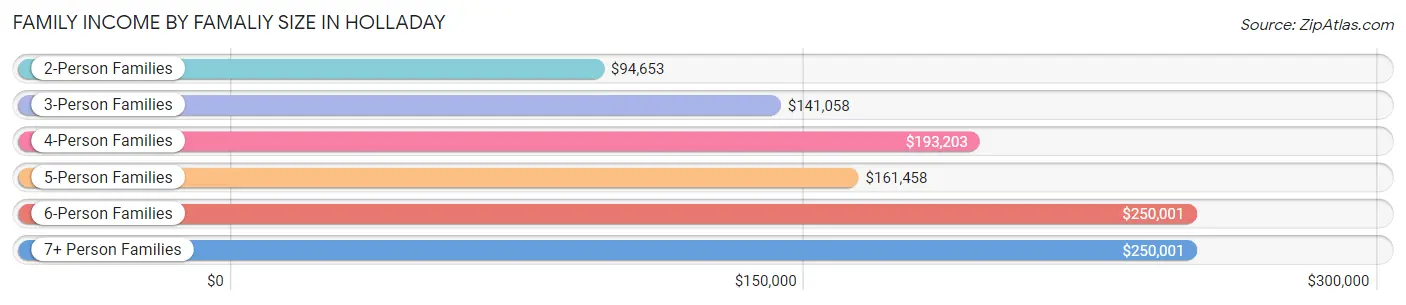
| Income Bracket | # Families | Median Income |
| 2-Person Families | 4,050 (49.2%) | $94,653 |
| 3-Person Families | 1,443 (17.5%) | $141,058 |
| 4-Person Families | 1,381 (16.8%) | $193,203 |
| 5-Person Families | 673 (8.2%) | $161,458 |
| 6-Person Families | 481 (5.9%) | $250,001 |
| 7+ Person Families | 198 (2.4%) | $250,001 |
| Total | 8,226 (100.0%) | $133,137 |
Family Income by Number of Earners in Holladay
The median family income in Holladay is $133,137, with families comprising 3+ earners (1,235) having the highest median family income of $223,125, while families with no earners (1,246) have the lowest median family income of $67,099, accounting for 15.0% and 15.1% of families, respectively.
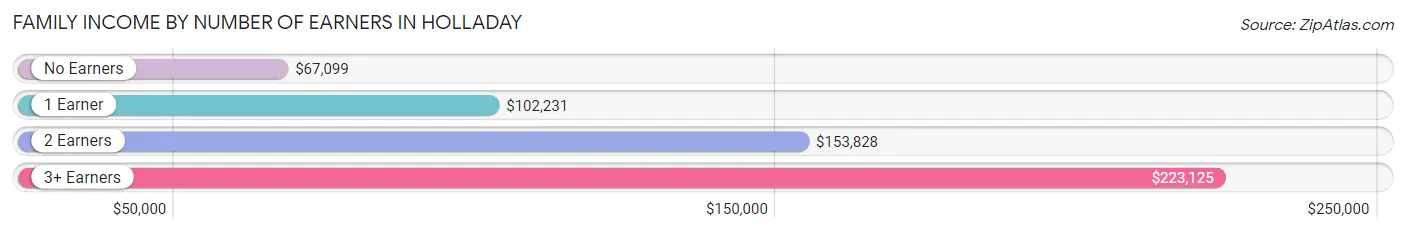
| Number of Earners | # Families | Median Income |
| No Earners | 1,246 (15.1%) | $67,099 |
| 1 Earner | 2,584 (31.4%) | $102,231 |
| 2 Earners | 3,161 (38.4%) | $153,828 |
| 3+ Earners | 1,235 (15.0%) | $223,125 |
| Total | 8,226 (100.0%) | $133,137 |
Household Income in Holladay
Household Income Brackets in Holladay
With 2,592 households falling in the category, the $200,000+ income range is the most frequent in Holladay, accounting for 22.1% of all households. In contrast, only 129 households (1.1%) fall into the $10,000 to $14,999 income bracket, making it the least populous group.
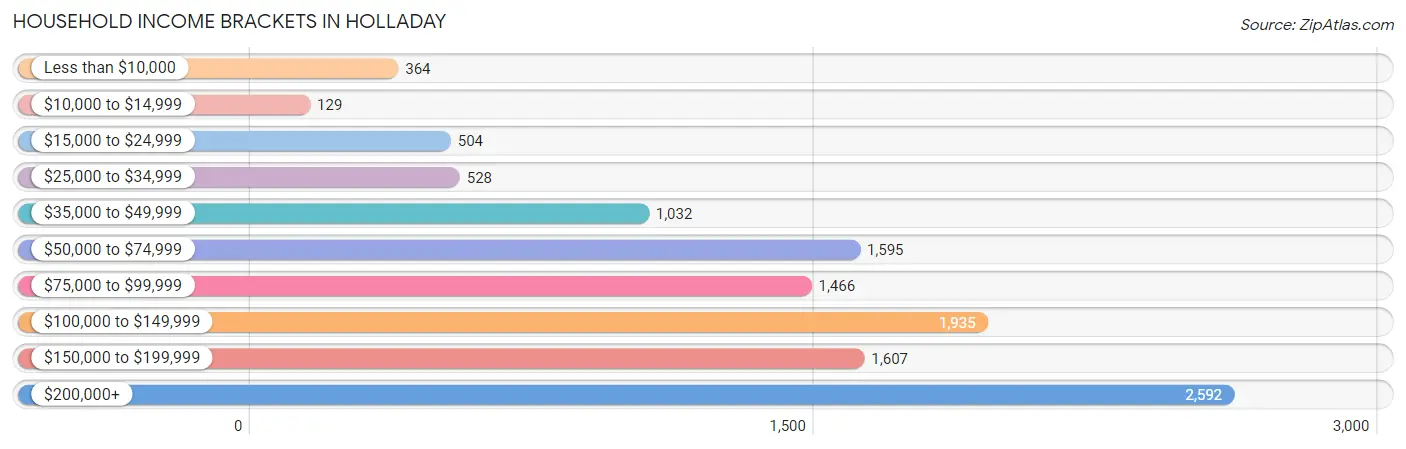
| Income Bracket | # Households | % Households |
| Less than $10,000 | 364 | 3.1% |
| $10,000 to $14,999 | 129 | 1.1% |
| $15,000 to $24,999 | 504 | 4.3% |
| $25,000 to $34,999 | 528 | 4.5% |
| $35,000 to $49,999 | 1,032 | 8.8% |
| $50,000 to $74,999 | 1,595 | 13.6% |
| $75,000 to $99,999 | 1,466 | 12.5% |
| $100,000 to $149,999 | 1,935 | 16.5% |
| $150,000 to $199,999 | 1,607 | 13.7% |
| $200,000+ | 2,592 | 22.1% |
Household Income by Householder Age in Holladay
The median household income in Holladay is $106,099, with the highest median household income of $135,858 found in the 25 to 44 years age bracket for the primary householder. A total of 3,533 households (30.1%) fall into this category. Meanwhile, the 15 to 24 years age bracket for the primary householder has the lowest median household income of $46,974, with 186 households (1.6%) in this group.
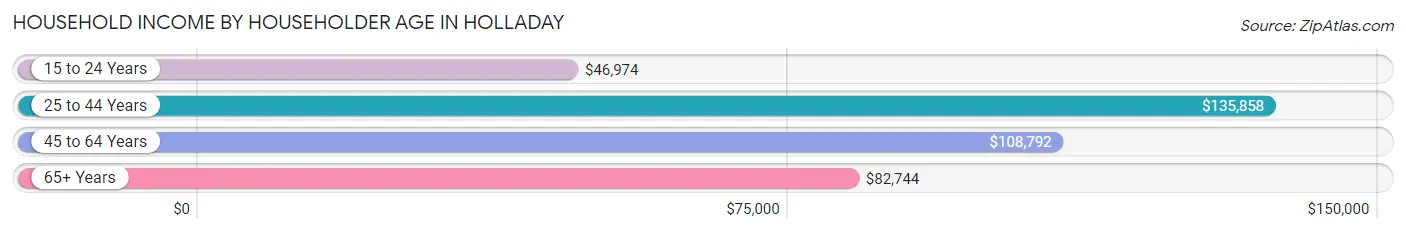
| Income Bracket | # Households | Median Income |
| 15 to 24 Years | 186 (1.6%) | $46,974 |
| 25 to 44 Years | 3,533 (30.1%) | $135,858 |
| 45 to 64 Years | 4,395 (37.5%) | $108,792 |
| 65+ Years | 3,613 (30.8%) | $82,744 |
| Total | 11,727 (100.0%) | $106,099 |
Poverty in Holladay
Income Below Poverty by Sex and Age in Holladay
With 4.1% poverty level for males and 5.8% for females among the residents of Holladay, 6 to 11 year old males and 18 to 24 year old females are the most vulnerable to poverty, with 128 males (9.6%) and 127 females (10.5%) in their respective age groups living below the poverty level.
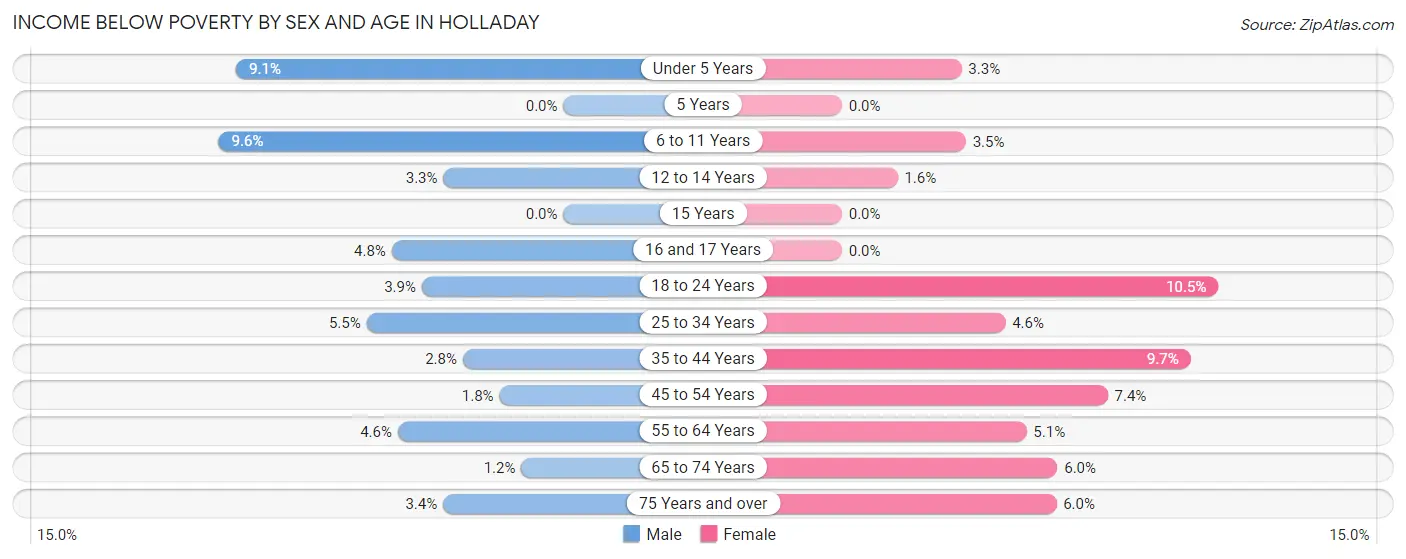
| Age Bracket | Male | Female |
| Under 5 Years | 74 (9.1%) | 35 (3.3%) |
| 5 Years | 0 (0.0%) | 0 (0.0%) |
| 6 to 11 Years | 128 (9.6%) | 39 (3.5%) |
| 12 to 14 Years | 31 (3.3%) | 10 (1.5%) |
| 15 Years | 0 (0.0%) | 0 (0.0%) |
| 16 and 17 Years | 31 (4.8%) | 0 (0.0%) |
| 18 to 24 Years | 37 (3.9%) | 127 (10.5%) |
| 25 to 34 Years | 105 (5.5%) | 90 (4.5%) |
| 35 to 44 Years | 61 (2.8%) | 196 (9.7%) |
| 45 to 54 Years | 36 (1.8%) | 141 (7.4%) |
| 55 to 64 Years | 85 (4.6%) | 89 (5.1%) |
| 65 to 74 Years | 17 (1.2%) | 106 (6.0%) |
| 75 Years and over | 37 (3.4%) | 86 (6.0%) |
| Total | 642 (4.1%) | 919 (5.8%) |
Income Above Poverty by Sex and Age in Holladay
According to the poverty statistics in Holladay, males aged 5 years and females aged 5 years are the age groups that are most secure financially, with 100.0% of males and 100.0% of females in these age groups living above the poverty line.
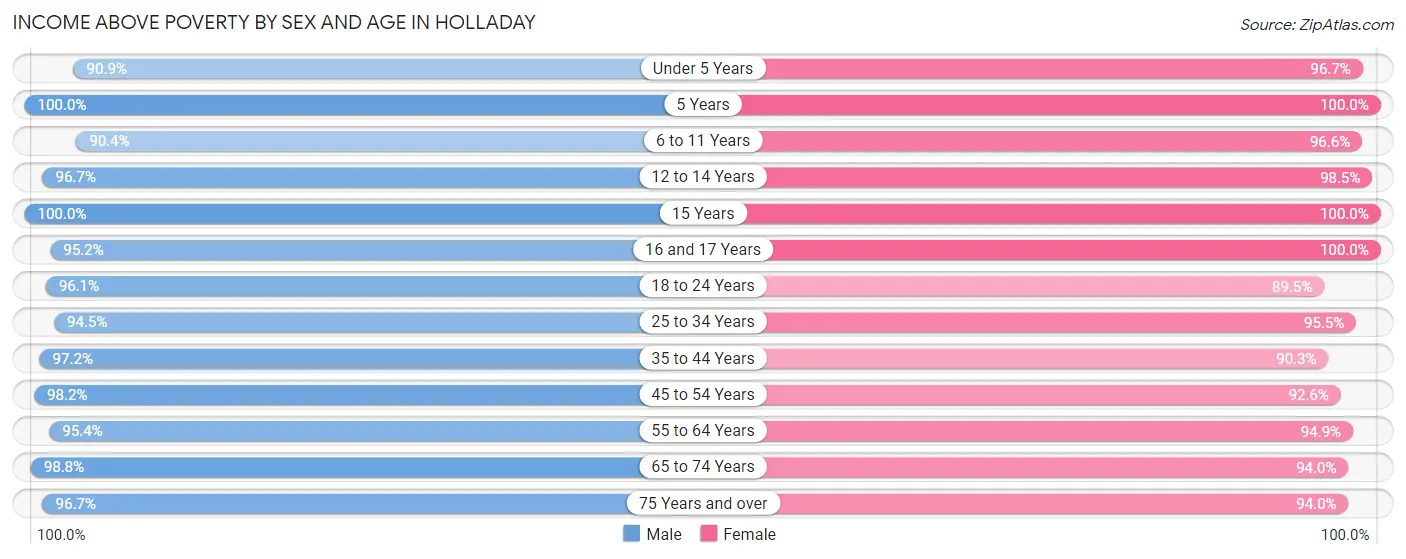
| Age Bracket | Male | Female |
| Under 5 Years | 738 (90.9%) | 1,015 (96.7%) |
| 5 Years | 216 (100.0%) | 182 (100.0%) |
| 6 to 11 Years | 1,205 (90.4%) | 1,090 (96.6%) |
| 12 to 14 Years | 896 (96.7%) | 636 (98.5%) |
| 15 Years | 168 (100.0%) | 244 (100.0%) |
| 16 and 17 Years | 618 (95.2%) | 460 (100.0%) |
| 18 to 24 Years | 901 (96.1%) | 1,085 (89.5%) |
| 25 to 34 Years | 1,812 (94.5%) | 1,886 (95.5%) |
| 35 to 44 Years | 2,121 (97.2%) | 1,823 (90.3%) |
| 45 to 54 Years | 1,990 (98.2%) | 1,765 (92.6%) |
| 55 to 64 Years | 1,759 (95.4%) | 1,641 (94.9%) |
| 65 to 74 Years | 1,442 (98.8%) | 1,661 (94.0%) |
| 75 Years and over | 1,069 (96.7%) | 1,354 (94.0%) |
| Total | 14,935 (95.9%) | 14,842 (94.2%) |
Income Below Poverty Among Married-Couple Families in Holladay
The poverty statistics for married-couple families in Holladay show that 1.9% or 121 of the total 6,376 families live below the poverty line. Families with 3 or 4 children have the highest poverty rate of 3.6%, comprising of 31 families. On the other hand, families with 5 or more children have the lowest poverty rate of 0.0%, which includes 0 families.
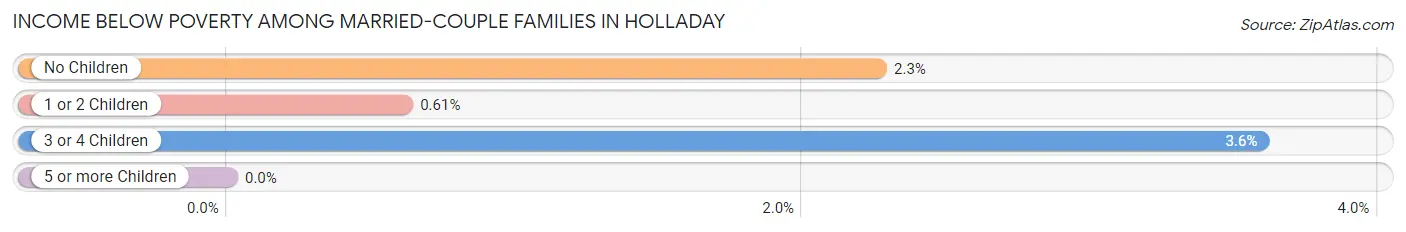
| Children | Above Poverty | Below Poverty |
| No Children | 3,380 (97.7%) | 78 (2.3%) |
| 1 or 2 Children | 1,940 (99.4%) | 12 (0.6%) |
| 3 or 4 Children | 832 (96.4%) | 31 (3.6%) |
| 5 or more Children | 103 (100.0%) | 0 (0.0%) |
| Total | 6,255 (98.1%) | 121 (1.9%) |
Income Below Poverty Among Single-Parent Households in Holladay
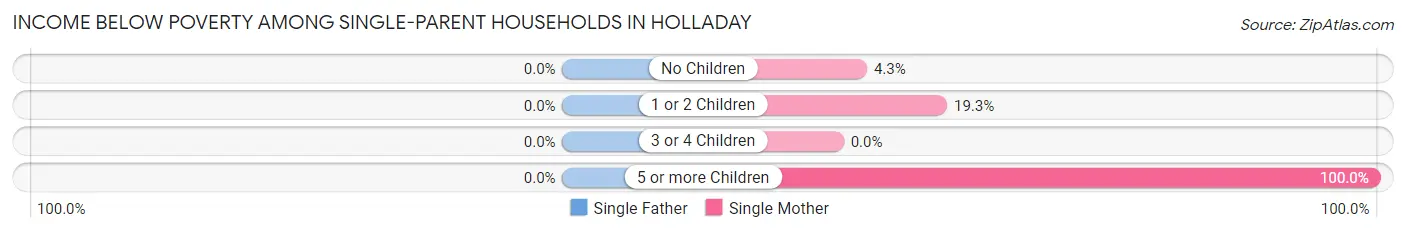
| Children | Single Father | Single Mother |
| No Children | 0 (0.0%) | 20 (4.3%) |
| 1 or 2 Children | 0 (0.0%) | 136 (19.3%) |
| 3 or 4 Children | 0 (0.0%) | 0 (0.0%) |
| 5 or more Children | 0 (0.0%) | 14 (100.0%) |
| Total | 0 (0.0%) | 170 (14.1%) |
Income Below Poverty Among Married-Couple vs Single-Parent Households in Holladay
The poverty data for Holladay shows that 121 of the married-couple family households (1.9%) and 170 of the single-parent households (9.2%) are living below the poverty level. Within the married-couple family households, those with 3 or 4 children have the highest poverty rate, with 31 households (3.6%) falling below the poverty line. Among the single-parent households, those with 5 or more children have the highest poverty rate, with 14 household (100.0%) living below poverty.
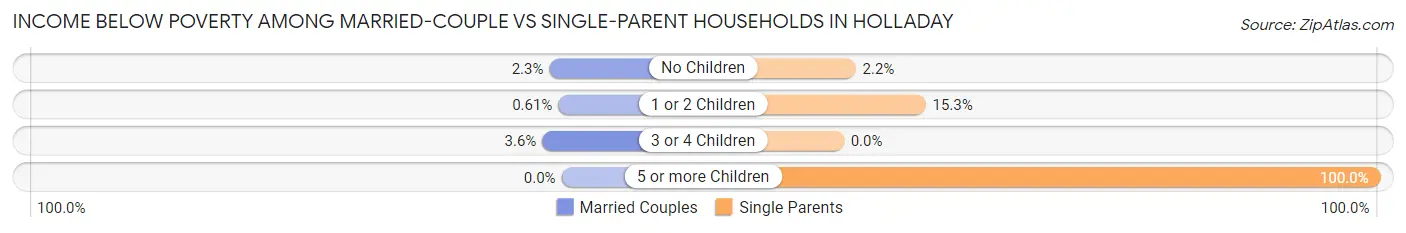
| Children | Married-Couple Families | Single-Parent Households |
| No Children | 78 (2.3%) | 20 (2.2%) |
| 1 or 2 Children | 12 (0.6%) | 136 (15.2%) |
| 3 or 4 Children | 31 (3.6%) | 0 (0.0%) |
| 5 or more Children | 0 (0.0%) | 14 (100.0%) |
| Total | 121 (1.9%) | 170 (9.2%) |
Race in Holladay
The most populous races in Holladay are White / Caucasian (27,798 | 88.1%), Hispanic or Latino (2,035 | 6.5%), and Two or more Races (1,875 | 5.9%).
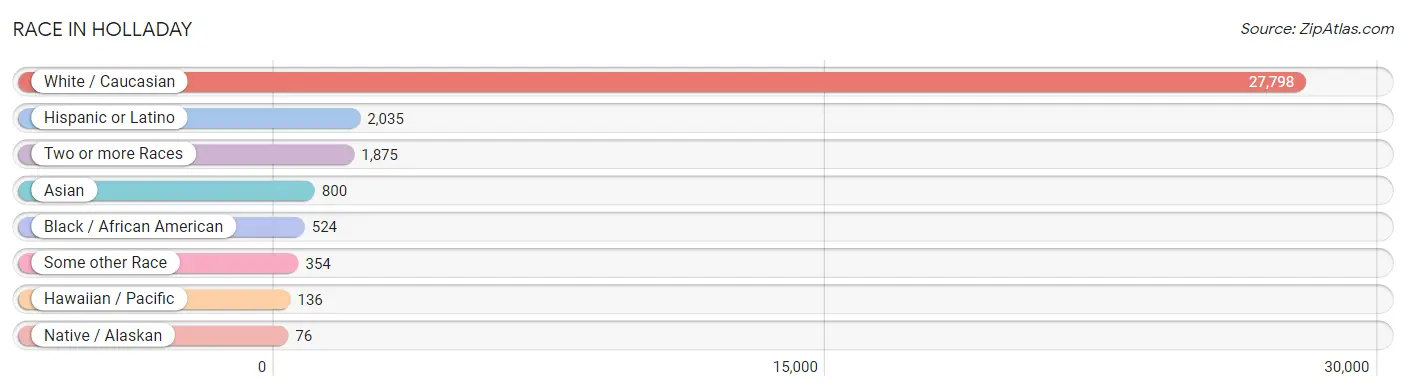
| Race | # Population | % Population |
| Asian | 800 | 2.5% |
| Black / African American | 524 | 1.7% |
| Hawaiian / Pacific | 136 | 0.4% |
| Hispanic or Latino | 2,035 | 6.5% |
| Native / Alaskan | 76 | 0.2% |
| White / Caucasian | 27,798 | 88.1% |
| Two or more Races | 1,875 | 5.9% |
| Some other Race | 354 | 1.1% |
| Total | 31,563 | 100.0% |
Ancestry in Holladay
The most populous ancestries reported in Holladay are English (10,283 | 32.6%), German (3,246 | 10.3%), Irish (2,721 | 8.6%), Scottish (1,797 | 5.7%), and Danish (1,720 | 5.4%), together accounting for 62.6% of all Holladay residents.
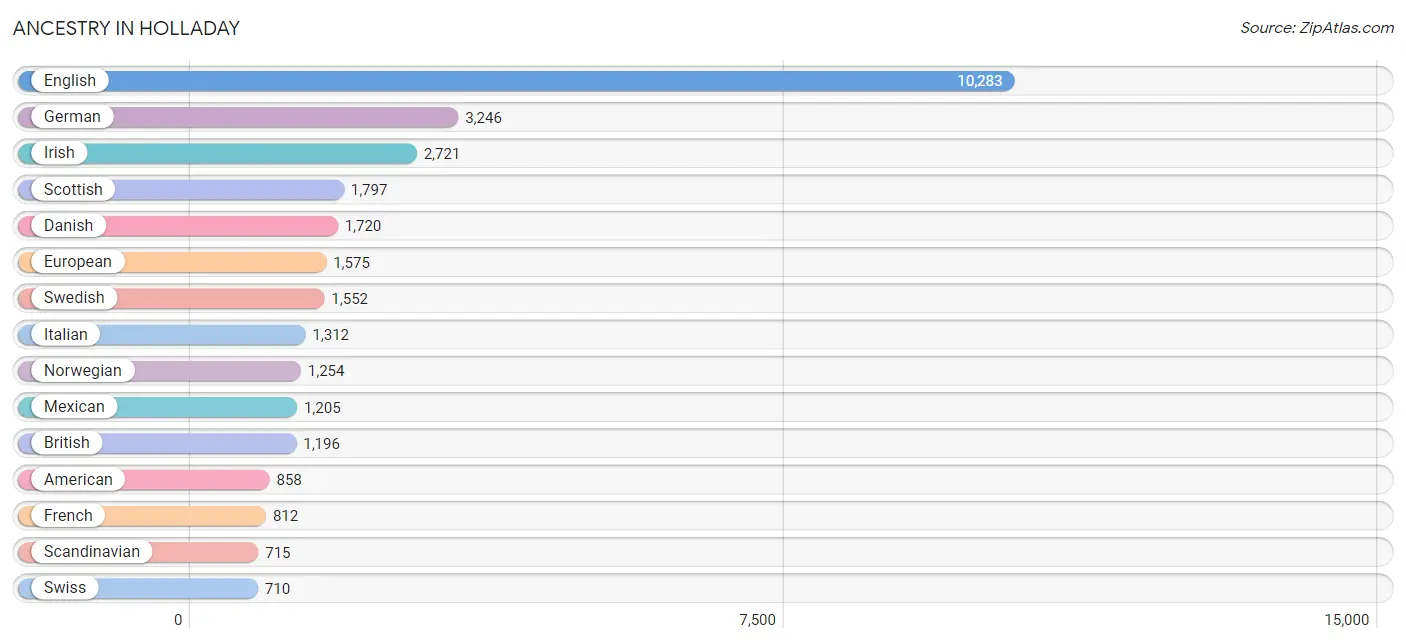
| Ancestry | # Population | % Population |
| Afghan | 77 | 0.2% |
| African | 83 | 0.3% |
| American | 858 | 2.7% |
| Arab | 96 | 0.3% |
| Argentinean | 73 | 0.2% |
| Australian | 43 | 0.1% |
| Austrian | 12 | 0.0% |
| Basque | 60 | 0.2% |
| Belgian | 15 | 0.1% |
| Bhutanese | 119 | 0.4% |
| Blackfeet | 22 | 0.1% |
| Brazilian | 40 | 0.1% |
| British | 1,196 | 3.8% |
| Burmese | 72 | 0.2% |
| Cajun | 35 | 0.1% |
| Canadian | 33 | 0.1% |
| Central American | 134 | 0.4% |
| Cherokee | 68 | 0.2% |
| Chickasaw | 25 | 0.1% |
| Chilean | 60 | 0.2% |
| Colombian | 21 | 0.1% |
| Costa Rican | 14 | 0.0% |
| Croatian | 21 | 0.1% |
| Cuban | 17 | 0.1% |
| Czech | 113 | 0.4% |
| Danish | 1,720 | 5.4% |
| Dutch | 642 | 2.0% |
| Eastern European | 45 | 0.1% |
| English | 10,283 | 32.6% |
| European | 1,575 | 5.0% |
| French | 812 | 2.6% |
| French Canadian | 32 | 0.1% |
| German | 3,246 | 10.3% |
| Ghanaian | 17 | 0.1% |
| Greek | 226 | 0.7% |
| Guatemalan | 70 | 0.2% |
| Hungarian | 50 | 0.2% |
| Indian (Asian) | 174 | 0.5% |
| Iranian | 98 | 0.3% |
| Irish | 2,721 | 8.6% |
| Italian | 1,312 | 4.2% |
| Korean | 74 | 0.2% |
| Laotian | 20 | 0.1% |
| Latvian | 7 | 0.0% |
| Lebanese | 79 | 0.3% |
| Mexican | 1,205 | 3.8% |
| Mongolian | 52 | 0.2% |
| Native Hawaiian | 329 | 1.0% |
| Navajo | 25 | 0.1% |
| New Zealander | 6 | 0.0% |
| Northern European | 193 | 0.6% |
| Norwegian | 1,254 | 4.0% |
| Pakistani | 10 | 0.0% |
| Palestinian | 17 | 0.1% |
| Peruvian | 73 | 0.2% |
| Polish | 321 | 1.0% |
| Portuguese | 18 | 0.1% |
| Puerto Rican | 11 | 0.0% |
| Russian | 76 | 0.2% |
| Salvadoran | 50 | 0.2% |
| Scandinavian | 715 | 2.3% |
| Scotch-Irish | 294 | 0.9% |
| Scottish | 1,797 | 5.7% |
| Serbian | 13 | 0.0% |
| Sioux | 57 | 0.2% |
| Slovak | 20 | 0.1% |
| Slovene | 2 | 0.0% |
| South African | 7 | 0.0% |
| South American | 279 | 0.9% |
| Spaniard | 61 | 0.2% |
| Spanish | 118 | 0.4% |
| Sri Lankan | 69 | 0.2% |
| Subsaharan African | 193 | 0.6% |
| Sudanese | 86 | 0.3% |
| Swedish | 1,552 | 4.9% |
| Swiss | 710 | 2.2% |
| Thai | 345 | 1.1% |
| Tongan | 148 | 0.5% |
| Ukrainian | 49 | 0.2% |
| Uruguayan | 12 | 0.0% |
| Ute | 40 | 0.1% |
| Venezuelan | 40 | 0.1% |
| Welsh | 607 | 1.9% |
| West Indian | 40 | 0.1% |
| Yaqui | 8 | 0.0% |
| Yugoslavian | 202 | 0.6% | View All 86 Rows |
Immigrants in Holladay
The most numerous immigrant groups reported in Holladay came from Asia (659 | 2.1%), Latin America (492 | 1.6%), Europe (476 | 1.5%), South Central Asia (432 | 1.4%), and Central America (355 | 1.1%), together accounting for 7.6% of all Holladay residents.
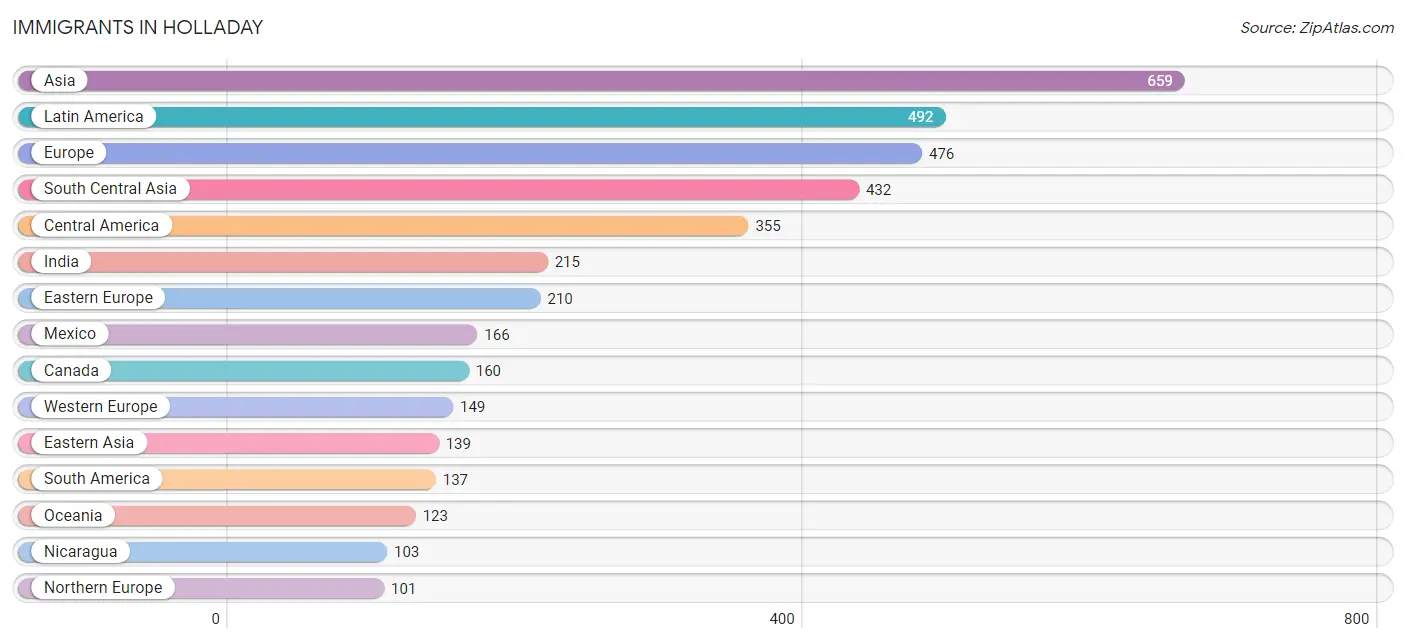
| Immigration Origin | # Population | % Population |
| Afghanistan | 96 | 0.3% |
| Africa | 76 | 0.2% |
| Asia | 659 | 2.1% |
| Australia | 59 | 0.2% |
| Austria | 9 | 0.0% |
| Belarus | 45 | 0.1% |
| Bosnia and Herzegovina | 79 | 0.3% |
| Brazil | 22 | 0.1% |
| Canada | 160 | 0.5% |
| Central America | 355 | 1.1% |
| Chile | 44 | 0.1% |
| China | 60 | 0.2% |
| Czechoslovakia | 20 | 0.1% |
| Denmark | 16 | 0.1% |
| Eastern Africa | 50 | 0.2% |
| Eastern Asia | 139 | 0.4% |
| Eastern Europe | 210 | 0.7% |
| El Salvador | 16 | 0.1% |
| England | 53 | 0.2% |
| Europe | 476 | 1.5% |
| Germany | 36 | 0.1% |
| Ghana | 17 | 0.1% |
| Greece | 16 | 0.1% |
| Guatemala | 70 | 0.2% |
| India | 215 | 0.7% |
| Indonesia | 7 | 0.0% |
| Iran | 71 | 0.2% |
| Israel | 7 | 0.0% |
| Japan | 40 | 0.1% |
| Kenya | 3 | 0.0% |
| Korea | 39 | 0.1% |
| Latin America | 492 | 1.6% |
| Lebanon | 8 | 0.0% |
| Malaysia | 18 | 0.1% |
| Mexico | 166 | 0.5% |
| Morocco | 9 | 0.0% |
| Netherlands | 92 | 0.3% |
| Nicaragua | 103 | 0.3% |
| Northern Africa | 9 | 0.0% |
| Northern Europe | 101 | 0.3% |
| Oceania | 123 | 0.4% |
| Pakistan | 50 | 0.2% |
| Peru | 9 | 0.0% |
| Philippines | 27 | 0.1% |
| Poland | 14 | 0.0% |
| Russia | 19 | 0.1% |
| Saudi Arabia | 8 | 0.0% |
| South America | 137 | 0.4% |
| South Central Asia | 432 | 1.4% |
| South Eastern Asia | 52 | 0.2% |
| Southern Europe | 16 | 0.1% |
| Switzerland | 12 | 0.0% |
| Syria | 13 | 0.0% |
| Uruguay | 12 | 0.0% |
| Venezuela | 41 | 0.1% |
| Western Africa | 17 | 0.1% |
| Western Asia | 36 | 0.1% |
| Western Europe | 149 | 0.5% | View All 58 Rows |
Sex and Age in Holladay
Sex and Age in Holladay
The most populous age groups in Holladay are 10 to 14 Years (1,281 | 8.2%) for men and Under 5 Years (1,088 | 6.9%) for women.
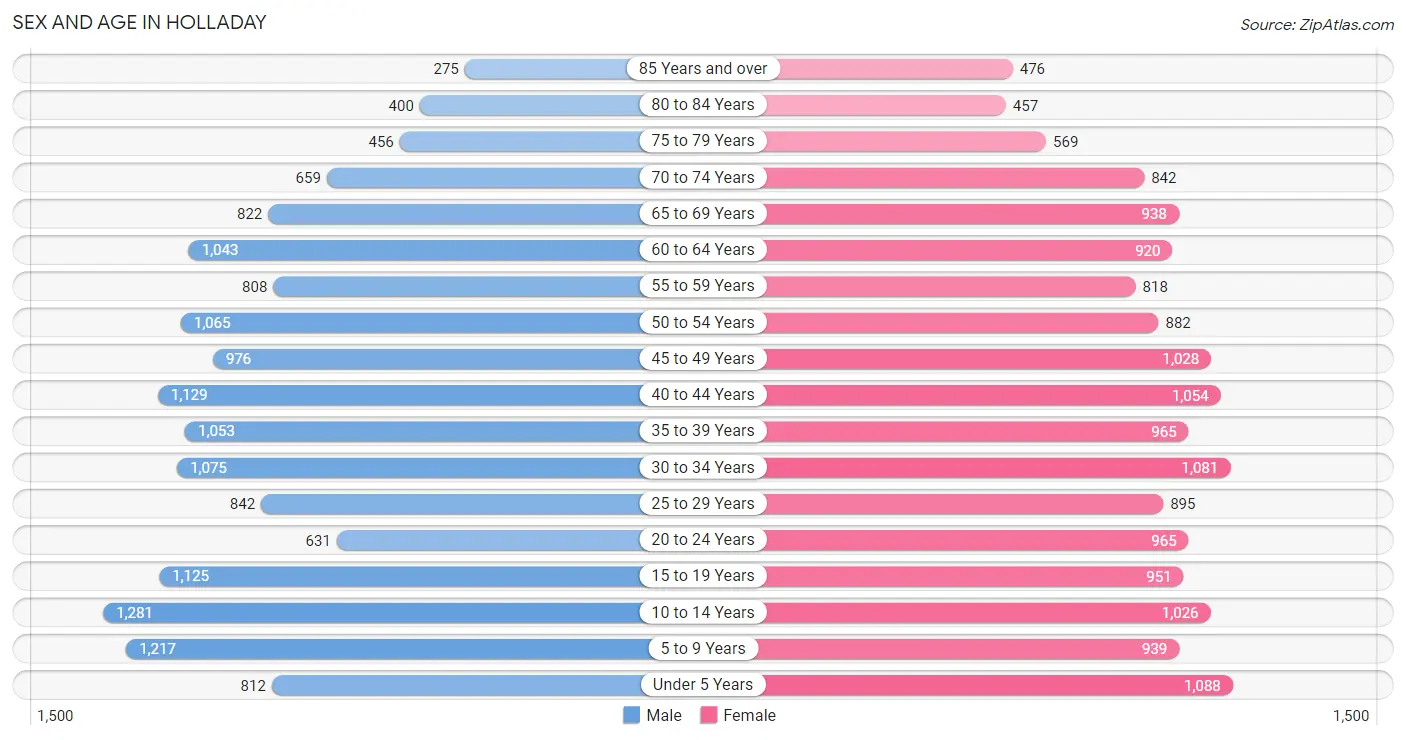
| Age Bracket | Male | Female |
| Under 5 Years | 812 (5.2%) | 1,088 (6.9%) |
| 5 to 9 Years | 1,217 (7.8%) | 939 (5.9%) |
| 10 to 14 Years | 1,281 (8.2%) | 1,026 (6.5%) |
| 15 to 19 Years | 1,125 (7.2%) | 951 (6.0%) |
| 20 to 24 Years | 631 (4.0%) | 965 (6.1%) |
| 25 to 29 Years | 842 (5.4%) | 895 (5.6%) |
| 30 to 34 Years | 1,075 (6.9%) | 1,081 (6.8%) |
| 35 to 39 Years | 1,053 (6.7%) | 965 (6.1%) |
| 40 to 44 Years | 1,129 (7.2%) | 1,054 (6.6%) |
| 45 to 49 Years | 976 (6.2%) | 1,028 (6.5%) |
| 50 to 54 Years | 1,065 (6.8%) | 882 (5.6%) |
| 55 to 59 Years | 808 (5.2%) | 818 (5.1%) |
| 60 to 64 Years | 1,043 (6.7%) | 920 (5.8%) |
| 65 to 69 Years | 822 (5.2%) | 938 (5.9%) |
| 70 to 74 Years | 659 (4.2%) | 842 (5.3%) |
| 75 to 79 Years | 456 (2.9%) | 569 (3.6%) |
| 80 to 84 Years | 400 (2.5%) | 457 (2.9%) |
| 85 Years and over | 275 (1.8%) | 476 (3.0%) |
| Total | 15,669 (100.0%) | 15,894 (100.0%) |
Families and Households in Holladay
Median Family Size in Holladay
The median family size in Holladay is 3.16 persons per family, with married-couple families (6,376 | 77.5%) accounting for the largest median family size of 3.34 persons per family. On the other hand, single male/father families (646 | 7.9%) represent the smallest median family size with 2.37 persons per family.
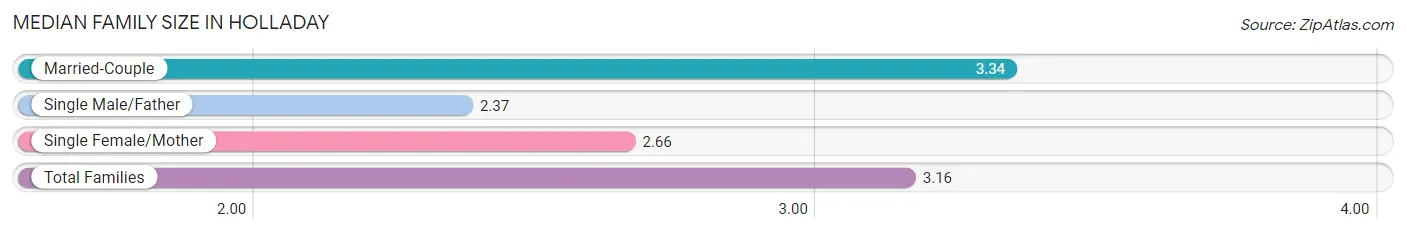
| Family Type | # Families | Family Size |
| Married-Couple | 6,376 (77.5%) | 3.34 |
| Single Male/Father | 646 (7.9%) | 2.37 |
| Single Female/Mother | 1,204 (14.6%) | 2.66 |
| Total Families | 8,226 (100.0%) | 3.16 |
Median Household Size in Holladay
The median household size in Holladay is 2.68 persons per household, with married-couple households (6,376 | 54.4%) accounting for the largest median household size of 3.36 persons per household. non-family households (3,501 | 29.8%) represent the smallest median household size with 1.41 persons per household.
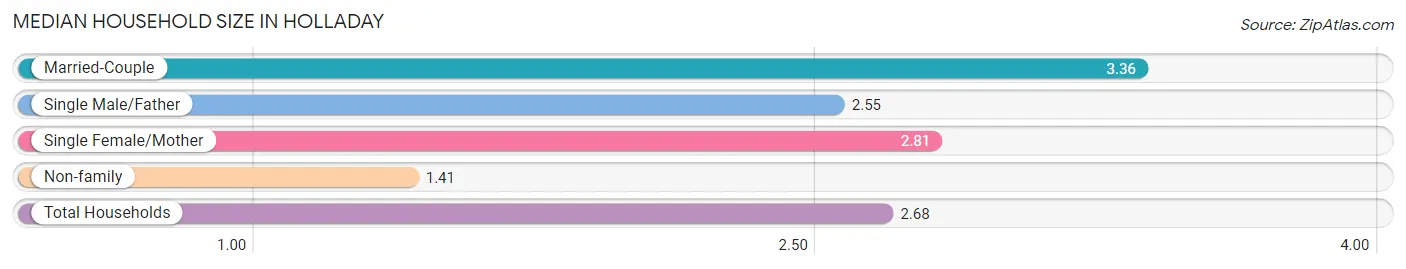
| Household Type | # Households | Household Size |
| Married-Couple | 6,376 (54.4%) | 3.36 |
| Single Male/Father | 646 (5.5%) | 2.55 |
| Single Female/Mother | 1,204 (10.3%) | 2.81 |
| Non-family | 3,501 (29.8%) | 1.41 |
| Total Households | 11,727 (100.0%) | 2.68 |
Household Size by Marriage Status in Holladay
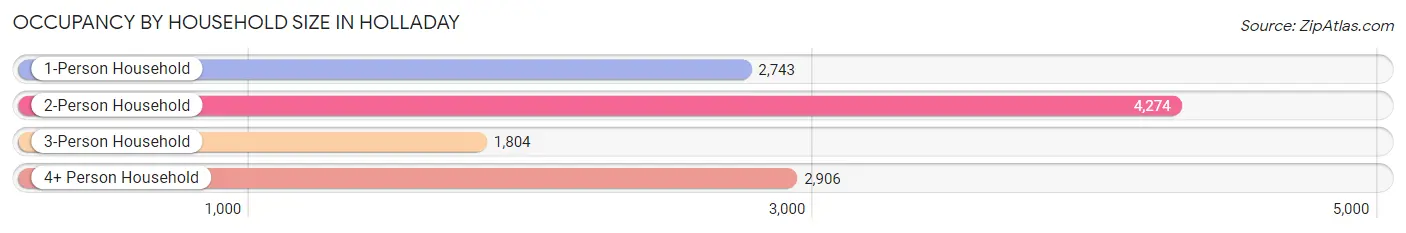
Out of a total of 11,727 households in Holladay, 8,226 (70.2%) are family households, while 3,501 (29.8%) are nonfamily households. The most numerous type of family households are 2-person households, comprising 3,790, and the most common type of nonfamily households are 1-person households, comprising 2,743.
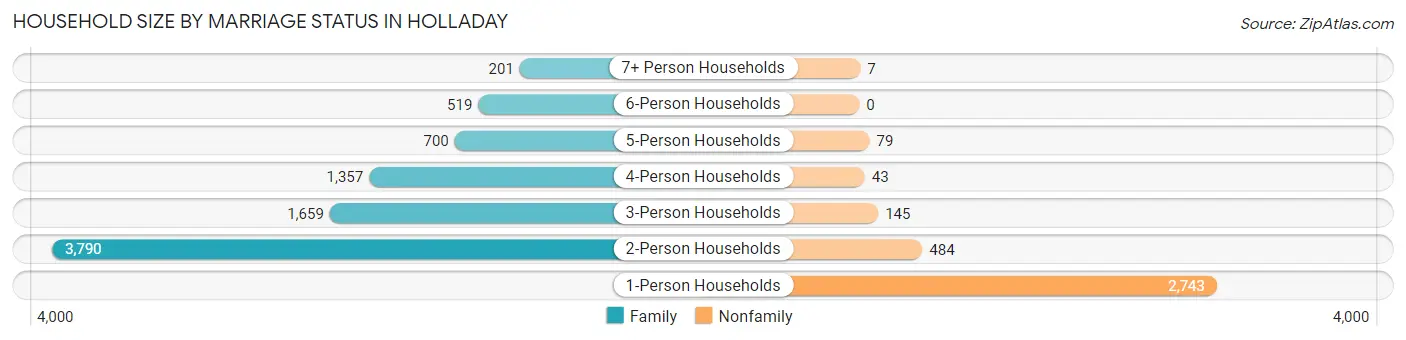
| Household Size | Family Households | Nonfamily Households |
| 1-Person Households | - | 2,743 (23.4%) |
| 2-Person Households | 3,790 (32.3%) | 484 (4.1%) |
| 3-Person Households | 1,659 (14.1%) | 145 (1.2%) |
| 4-Person Households | 1,357 (11.6%) | 43 (0.4%) |
| 5-Person Households | 700 (6.0%) | 79 (0.7%) |
| 6-Person Households | 519 (4.4%) | 0 (0.0%) |
| 7+ Person Households | 201 (1.7%) | 7 (0.1%) |
| Total | 8,226 (70.2%) | 3,501 (29.8%) |
Female Fertility in Holladay
Fertility by Age in Holladay
Average fertility rate in Holladay is 49.0 births per 1,000 women. Women in the age bracket of 20 to 34 years have the highest fertility rate with 89.0 births per 1,000 women. Women in the age bracket of 20 to 34 years acount for 74.4% of all women with births.
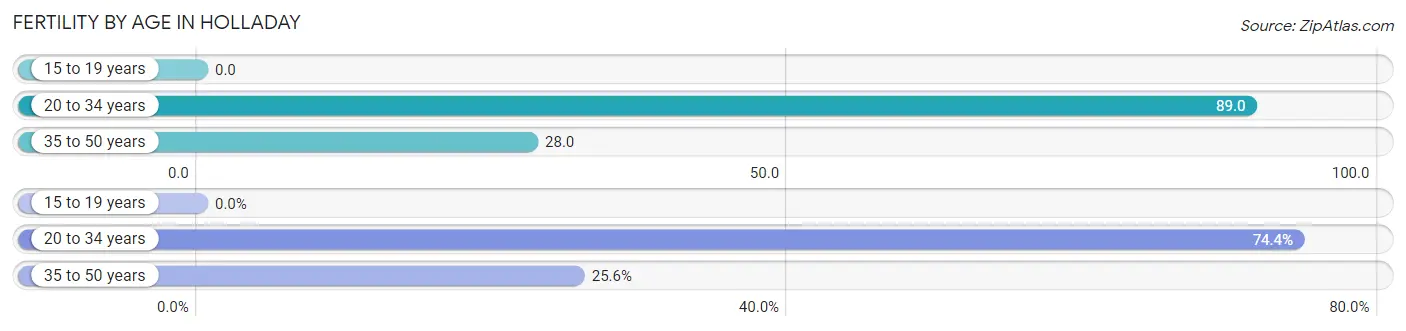
| Age Bracket | Women with Births | Births / 1,000 Women |
| 15 to 19 years | 0 (0.0%) | 0.0 |
| 20 to 34 years | 262 (74.4%) | 89.0 |
| 35 to 50 years | 90 (25.6%) | 28.0 |
| Total | 352 (100.0%) | 49.0 |
Fertility by Age by Marriage Status in Holladay
88.4% of women with births (352) in Holladay are married. The highest percentage of unmarried women with births falls into 35 to 50 years age bracket with 45.6% of them unmarried at the time of birth, while the lowest percentage of unmarried women with births belong to 20 to 34 years age bracket with 0.0% of them unmarried.
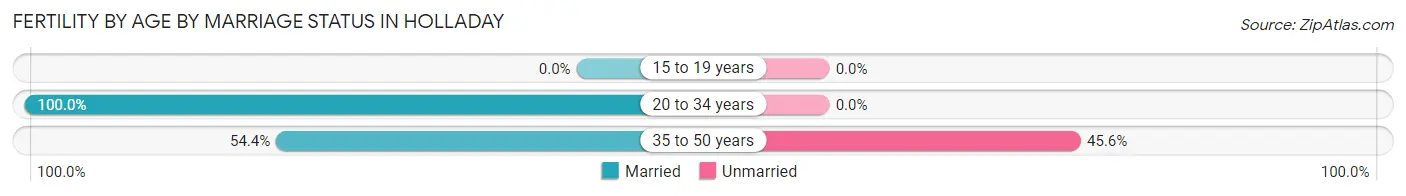
| Age Bracket | Married | Unmarried |
| 15 to 19 years | 0 (0.0%) | 0 (0.0%) |
| 20 to 34 years | 262 (100.0%) | 0 (0.0%) |
| 35 to 50 years | 49 (54.4%) | 41 (45.6%) |
| Total | 311 (88.3%) | 41 (11.7%) |
Fertility by Education in Holladay
Average fertility rate in Holladay is 49.0 births per 1,000 women. Women with the education attainment of bachelor's degree have the highest fertility rate of 88.0 births per 1,000 women, while women with the education attainment of less than high school have the lowest fertility at 3.0 births per 1,000 women. Women with the education attainment of bachelor's degree represent 56.8% of all women with births.
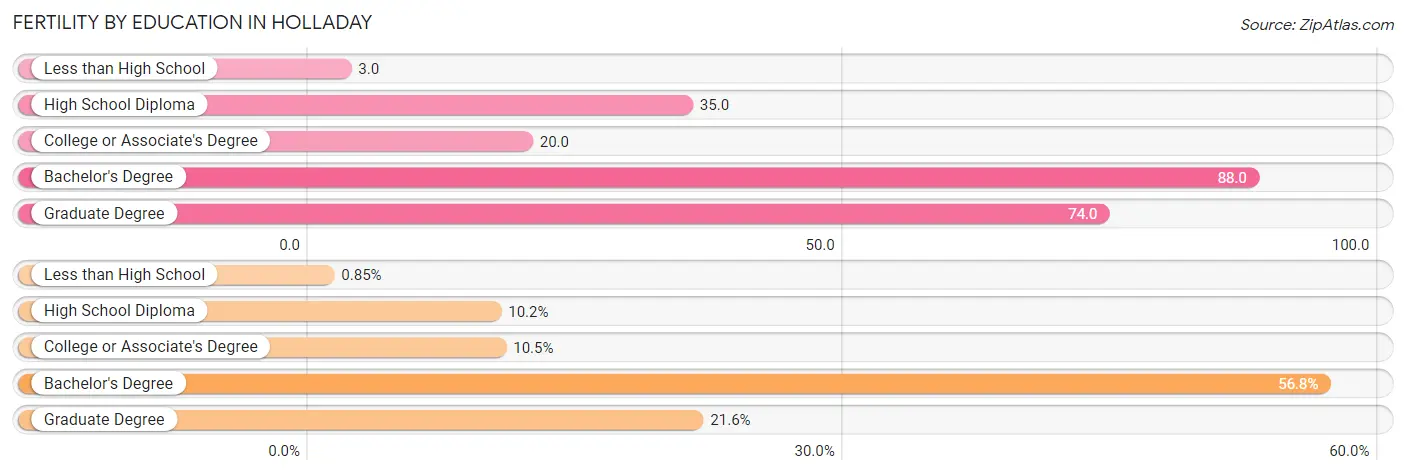
| Educational Attainment | Women with Births | Births / 1,000 Women |
| Less than High School | 3 (0.9%) | 3.0 |
| High School Diploma | 36 (10.2%) | 35.0 |
| College or Associate's Degree | 37 (10.5%) | 20.0 |
| Bachelor's Degree | 200 (56.8%) | 88.0 |
| Graduate Degree | 76 (21.6%) | 74.0 |
| Total | 352 (100.0%) | 49.0 |
Fertility by Education by Marriage Status in Holladay
11.7% of women with births in Holladay are unmarried. Women with the educational attainment of less than high school are most likely to be married with 100.0% of them married at childbirth, while women with the educational attainment of bachelor's degree are least likely to be married with 20.5% of them unmarried at childbirth.
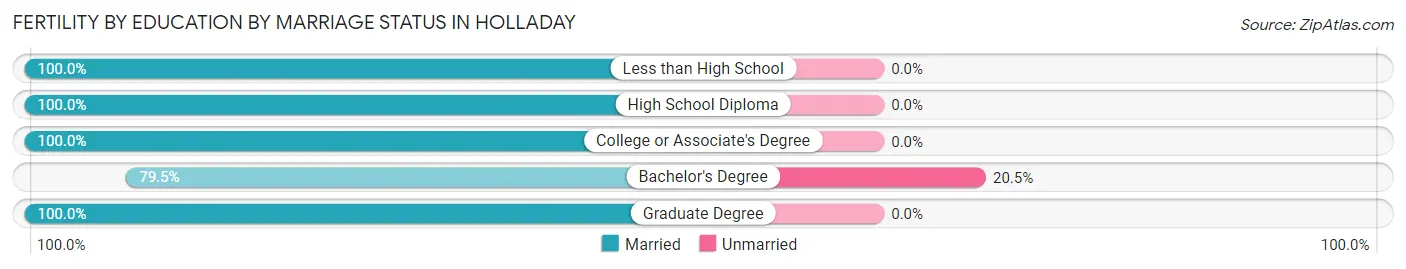
| Educational Attainment | Married | Unmarried |
| Less than High School | 3 (100.0%) | 0 (0.0%) |
| High School Diploma | 36 (100.0%) | 0 (0.0%) |
| College or Associate's Degree | 37 (100.0%) | 0 (0.0%) |
| Bachelor's Degree | 159 (79.5%) | 41 (20.5%) |
| Graduate Degree | 76 (100.0%) | 0 (0.0%) |
| Total | 311 (88.3%) | 41 (11.7%) |
Employment Characteristics in Holladay
Employment by Class of Employer in Holladay
Among the 15,166 employed individuals in Holladay, private company employees (9,653 | 63.6%), not-for-profit organizations (1,337 | 8.8%), and self-employed (incorporated) (1,166 | 7.7%) make up the most common classes of employment.
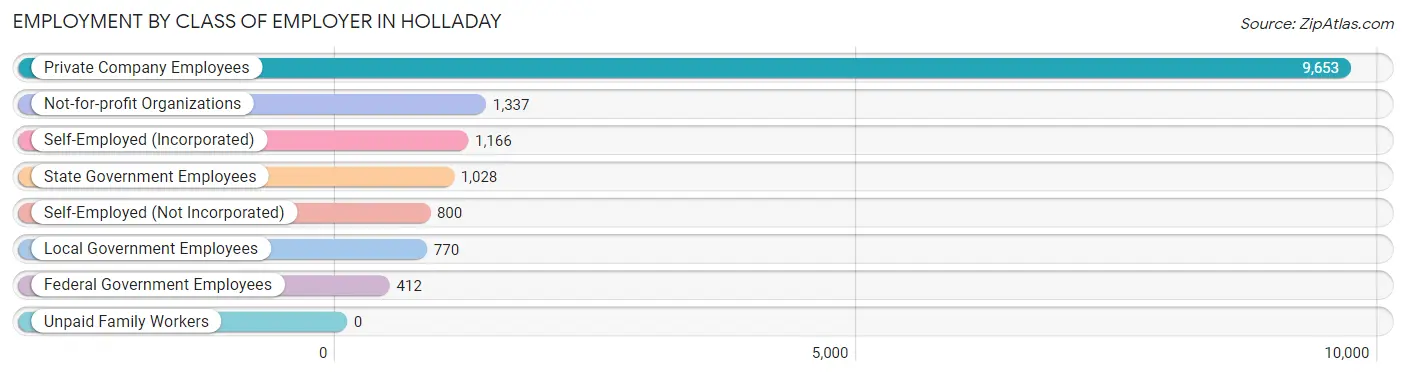
| Employer Class | # Employees | % Employees |
| Private Company Employees | 9,653 | 63.6% |
| Self-Employed (Incorporated) | 1,166 | 7.7% |
| Self-Employed (Not Incorporated) | 800 | 5.3% |
| Not-for-profit Organizations | 1,337 | 8.8% |
| Local Government Employees | 770 | 5.1% |
| State Government Employees | 1,028 | 6.8% |
| Federal Government Employees | 412 | 2.7% |
| Unpaid Family Workers | 0 | 0.0% |
| Total | 15,166 | 100.0% |
Employment Status by Age in Holladay
According to the labor force statistics for Holladay, out of the total population over 16 years of age (24,787), 64.3% or 15,938 individuals are in the labor force, with 3.1% or 494 of them unemployed. The age group with the highest labor force participation rate is 25 to 29 years, with 86.2% or 1,497 individuals in the labor force. Within the labor force, the 20 to 24 years age range has the highest percentage of unemployed individuals, with 14.7% or 191 of them being unemployed.
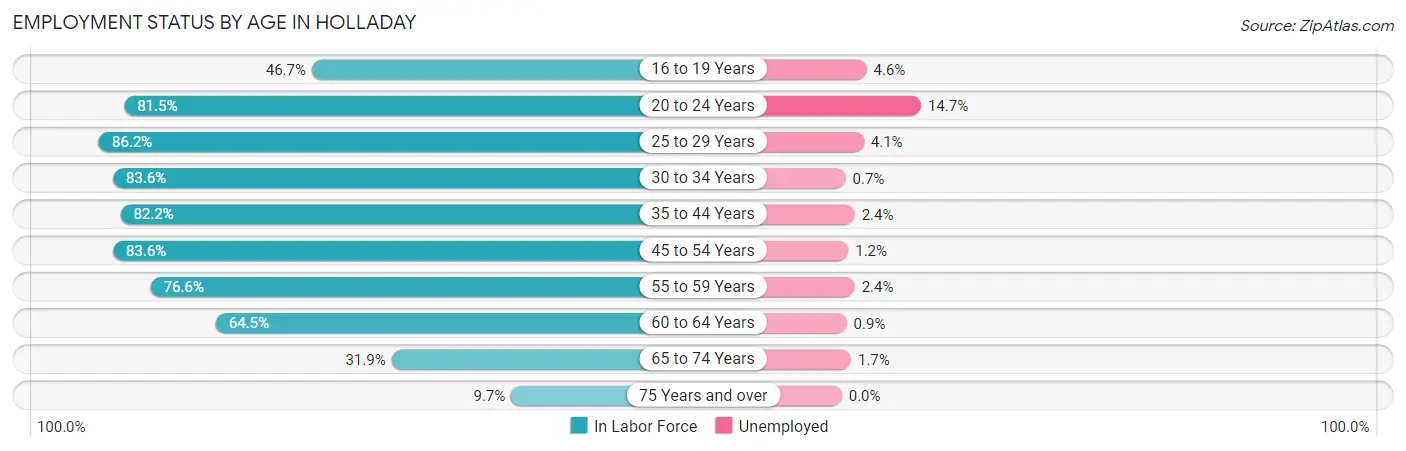
| Age Bracket | In Labor Force | Unemployed |
| 16 to 19 Years | 777 (46.7%) | 36 (4.6%) |
| 20 to 24 Years | 1,301 (81.5%) | 191 (14.7%) |
| 25 to 29 Years | 1,497 (86.2%) | 61 (4.1%) |
| 30 to 34 Years | 1,802 (83.6%) | 13 (0.7%) |
| 35 to 44 Years | 3,453 (82.2%) | 83 (2.4%) |
| 45 to 54 Years | 3,303 (83.6%) | 40 (1.2%) |
| 55 to 59 Years | 1,246 (76.6%) | 30 (2.4%) |
| 60 to 64 Years | 1,266 (64.5%) | 11 (0.9%) |
| 65 to 74 Years | 1,040 (31.9%) | 18 (1.7%) |
| 75 Years and over | 255 (9.7%) | 0 (0.0%) |
| Total | 15,938 (64.3%) | 494 (3.1%) |
Employment Status by Educational Attainment in Holladay
According to labor force statistics for Holladay, 80.4% of individuals (12,570) out of the total population between 25 and 64 years of age (15,634) are in the labor force, with 1.9% or 239 of them being unemployed. The group with the highest labor force participation rate are those with the educational attainment of bachelor's degree or higher, with 83.4% or 7,619 individuals in the labor force. Within the labor force, individuals with college / associate degree education have the highest percentage of unemployment, with 2.5% or 85 of them being unemployed.
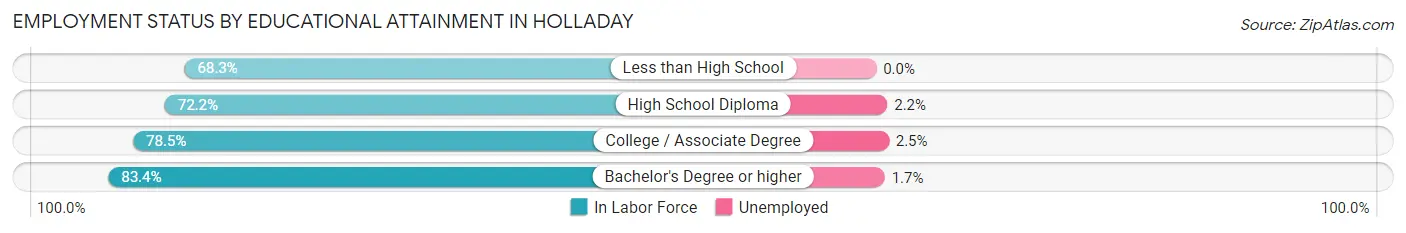
| Educational Attainment | In Labor Force | Unemployed |
| Less than High School | 298 (68.3%) | 0 (0.0%) |
| High School Diploma | 1,240 (72.2%) | 38 (2.2%) |
| College / Associate Degree | 3,412 (78.5%) | 109 (2.5%) |
| Bachelor's Degree or higher | 7,619 (83.4%) | 155 (1.7%) |
| Total | 12,570 (80.4%) | 297 (1.9%) |
Employment Occupations by Sex in Holladay
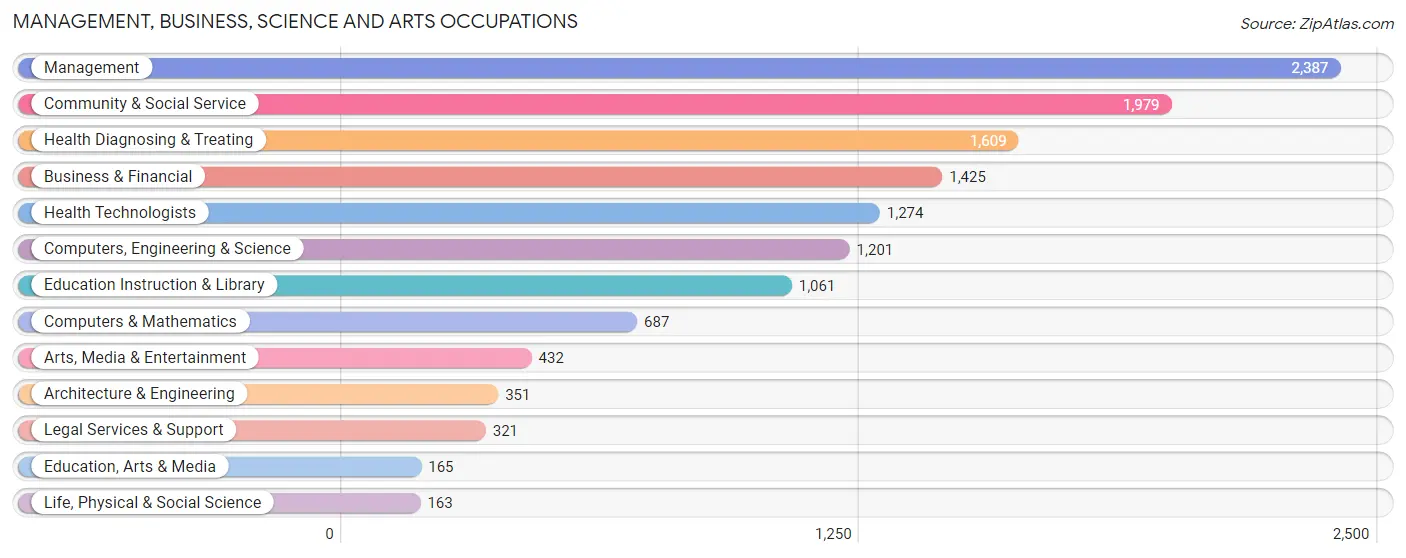
Management, Business, Science and Arts Occupations
The most common Management, Business, Science and Arts occupations in Holladay are Management (2,387 | 15.5%), Community & Social Service (1,979 | 12.8%), Health Diagnosing & Treating (1,609 | 10.4%), Business & Financial (1,425 | 9.2%), and Health Technologists (1,274 | 8.3%).
Management, Business, Science and Arts Occupations by Sex
Within the Management, Business, Science and Arts occupations in Holladay, the most male-oriented occupations are Architecture & Engineering (86.9%), Computers, Engineering & Science (82.4%), and Computers & Mathematics (81.1%), while the most female-oriented occupations are Arts, Media & Entertainment (67.1%), Education, Arts & Media (60.6%), and Community & Social Service (57.8%).
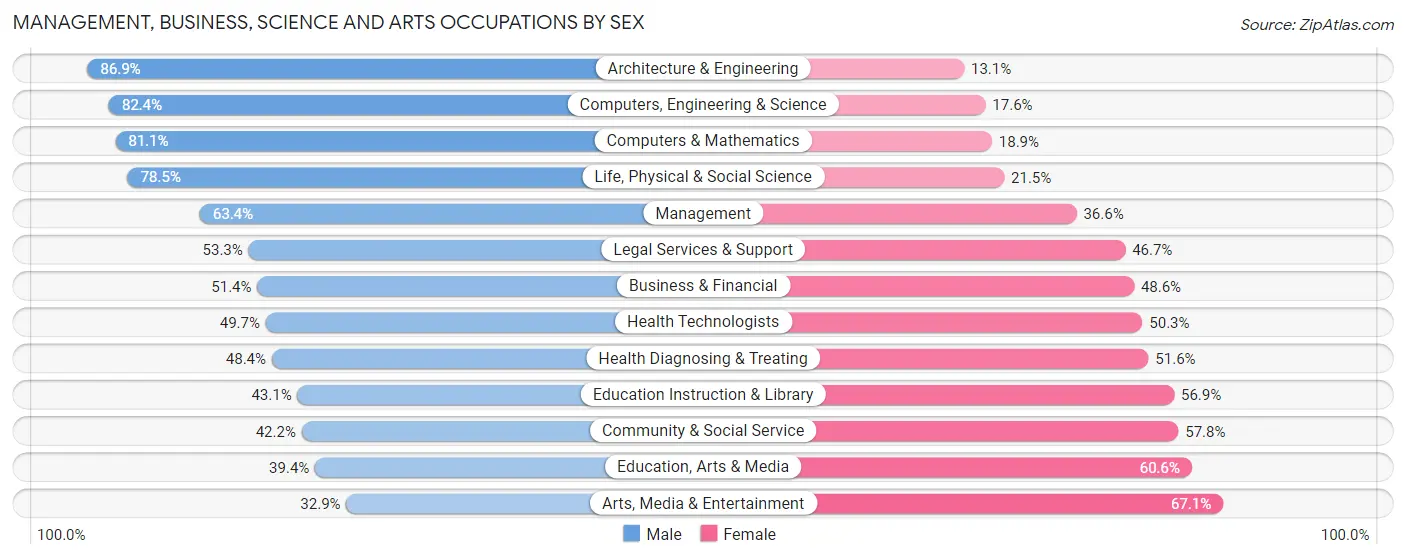
| Occupation | Male | Female |
| Management | 1,514 (63.4%) | 873 (36.6%) |
| Business & Financial | 733 (51.4%) | 692 (48.6%) |
| Computers, Engineering & Science | 990 (82.4%) | 211 (17.6%) |
| Computers & Mathematics | 557 (81.1%) | 130 (18.9%) |
| Architecture & Engineering | 305 (86.9%) | 46 (13.1%) |
| Life, Physical & Social Science | 128 (78.5%) | 35 (21.5%) |
| Community & Social Service | 835 (42.2%) | 1,144 (57.8%) |
| Education, Arts & Media | 65 (39.4%) | 100 (60.6%) |
| Legal Services & Support | 171 (53.3%) | 150 (46.7%) |
| Education Instruction & Library | 457 (43.1%) | 604 (56.9%) |
| Arts, Media & Entertainment | 142 (32.9%) | 290 (67.1%) |
| Health Diagnosing & Treating | 779 (48.4%) | 830 (51.6%) |
| Health Technologists | 633 (49.7%) | 641 (50.3%) |
| Total (Category) | 4,851 (56.4%) | 3,750 (43.6%) |
| Total (Overall) | 8,681 (56.2%) | 6,753 (43.8%) |
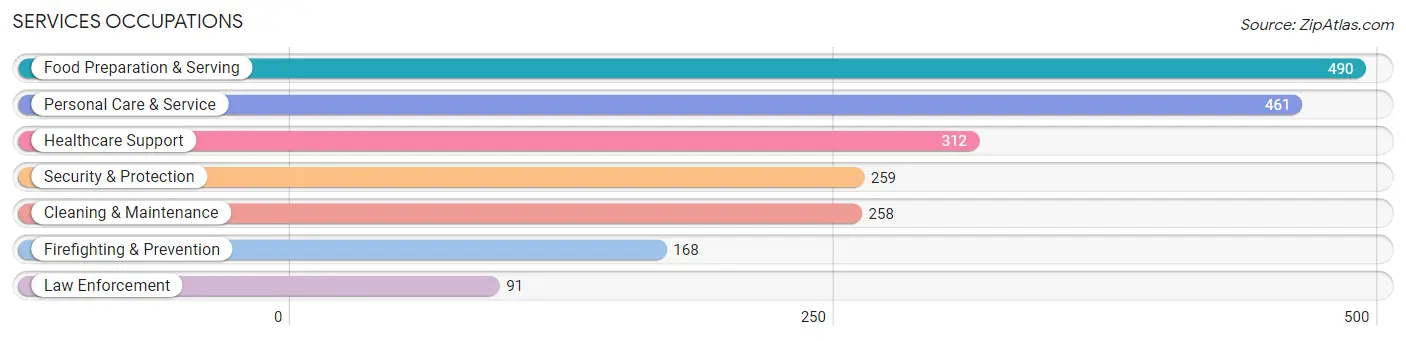
Services Occupations
The most common Services occupations in Holladay are Food Preparation & Serving (490 | 3.2%), Personal Care & Service (461 | 3.0%), Healthcare Support (312 | 2.0%), Security & Protection (259 | 1.7%), and Cleaning & Maintenance (258 | 1.7%).
Services Occupations by Sex
Within the Services occupations in Holladay, the most male-oriented occupations are Cleaning & Maintenance (74.8%), Law Enforcement (69.2%), and Security & Protection (66.8%), while the most female-oriented occupations are Personal Care & Service (76.6%), Healthcare Support (56.4%), and Food Preparation & Serving (51.6%).
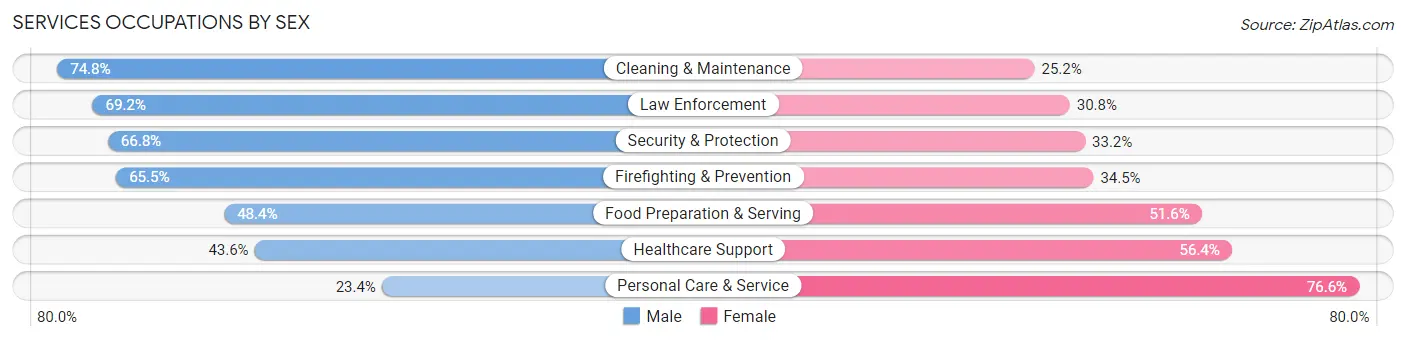
| Occupation | Male | Female |
| Healthcare Support | 136 (43.6%) | 176 (56.4%) |
| Security & Protection | 173 (66.8%) | 86 (33.2%) |
| Firefighting & Prevention | 110 (65.5%) | 58 (34.5%) |
| Law Enforcement | 63 (69.2%) | 28 (30.8%) |
| Food Preparation & Serving | 237 (48.4%) | 253 (51.6%) |
| Cleaning & Maintenance | 193 (74.8%) | 65 (25.2%) |
| Personal Care & Service | 108 (23.4%) | 353 (76.6%) |
| Total (Category) | 847 (47.6%) | 933 (52.4%) |
| Total (Overall) | 8,681 (56.2%) | 6,753 (43.8%) |
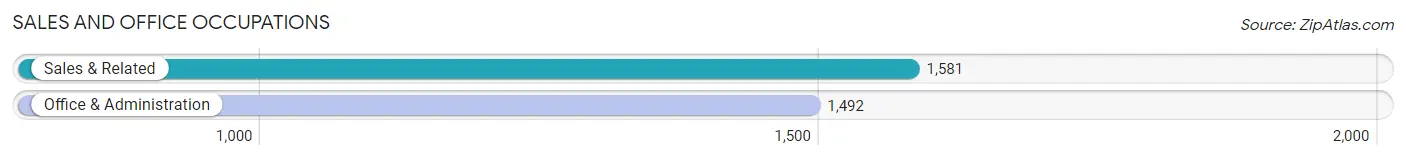
Sales and Office Occupations
The most common Sales and Office occupations in Holladay are Sales & Related (1,581 | 10.2%), and Office & Administration (1,492 | 9.7%).
Sales and Office Occupations by Sex
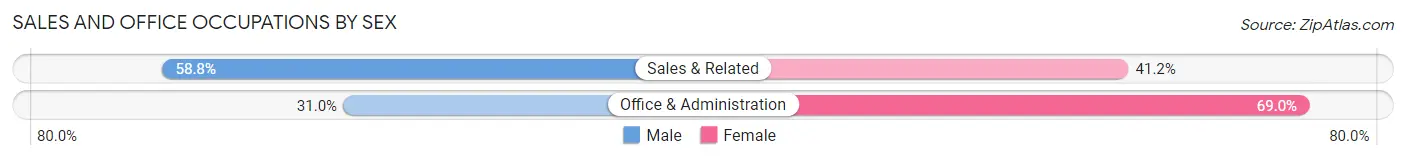
| Occupation | Male | Female |
| Sales & Related | 929 (58.8%) | 652 (41.2%) |
| Office & Administration | 463 (31.0%) | 1,029 (69.0%) |
| Total (Category) | 1,392 (45.3%) | 1,681 (54.7%) |
| Total (Overall) | 8,681 (56.2%) | 6,753 (43.8%) |
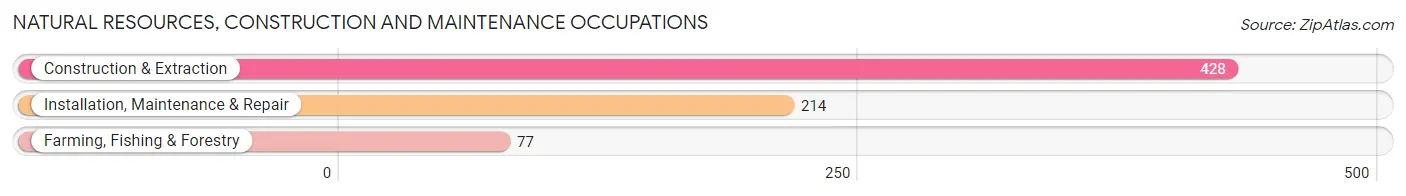
Natural Resources, Construction and Maintenance Occupations
The most common Natural Resources, Construction and Maintenance occupations in Holladay are Construction & Extraction (428 | 2.8%), Installation, Maintenance & Repair (214 | 1.4%), and Farming, Fishing & Forestry (77 | 0.5%).
Natural Resources, Construction and Maintenance Occupations by Sex
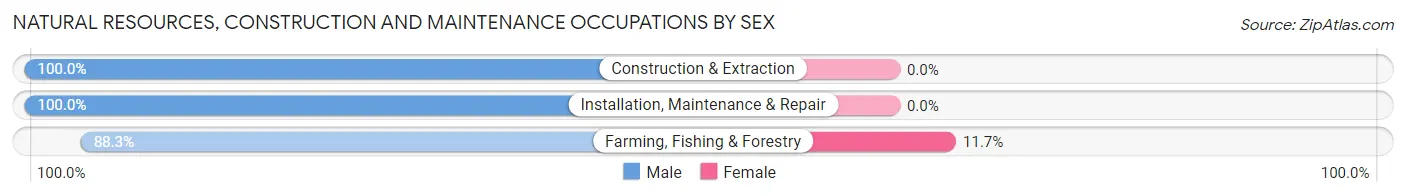
| Occupation | Male | Female |
| Farming, Fishing & Forestry | 68 (88.3%) | 9 (11.7%) |
| Construction & Extraction | 428 (100.0%) | 0 (0.0%) |
| Installation, Maintenance & Repair | 214 (100.0%) | 0 (0.0%) |
| Total (Category) | 710 (98.8%) | 9 (1.3%) |
| Total (Overall) | 8,681 (56.2%) | 6,753 (43.8%) |
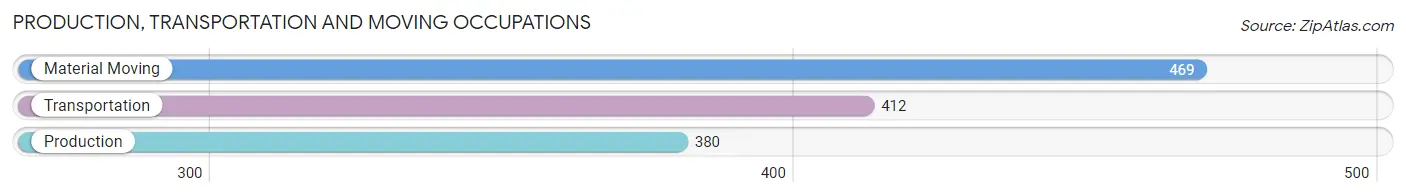
Production, Transportation and Moving Occupations
The most common Production, Transportation and Moving occupations in Holladay are Material Moving (469 | 3.0%), Transportation (412 | 2.7%), and Production (380 | 2.5%).
Production, Transportation and Moving Occupations by Sex
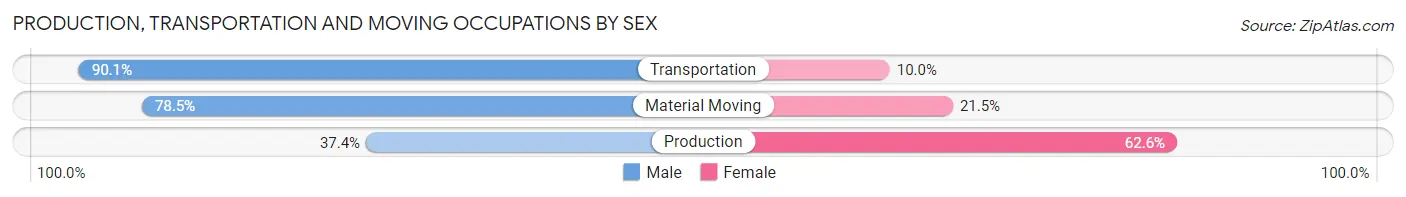
| Occupation | Male | Female |
| Production | 142 (37.4%) | 238 (62.6%) |
| Transportation | 371 (90.0%) | 41 (10.0%) |
| Material Moving | 368 (78.5%) | 101 (21.5%) |
| Total (Category) | 881 (69.9%) | 380 (30.1%) |
| Total (Overall) | 8,681 (56.2%) | 6,753 (43.8%) |
Employment Industries by Sex in Holladay
Employment Industries in Holladay
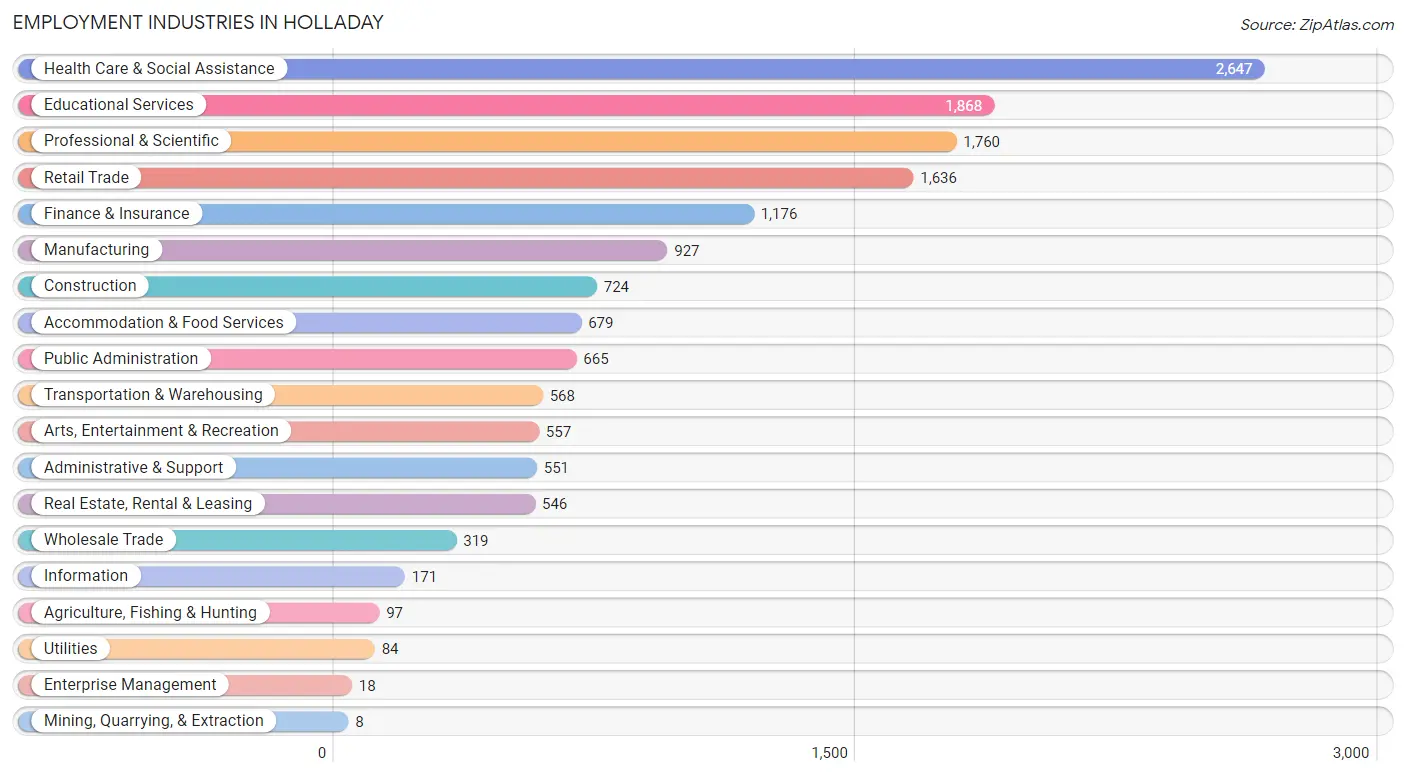
The major employment industries in Holladay include Health Care & Social Assistance (2,647 | 17.2%), Educational Services (1,868 | 12.1%), Professional & Scientific (1,760 | 11.4%), Retail Trade (1,636 | 10.6%), and Finance & Insurance (1,176 | 7.6%).
Employment Industries by Sex in Holladay
The Holladay industries that see more men than women are Mining, Quarrying, & Extraction (100.0%), Agriculture, Fishing & Hunting (90.7%), and Construction (88.7%), whereas the industries that tend to have a higher number of women are Enterprise Management (77.8%), Accommodation & Food Services (61.1%), and Educational Services (59.1%).
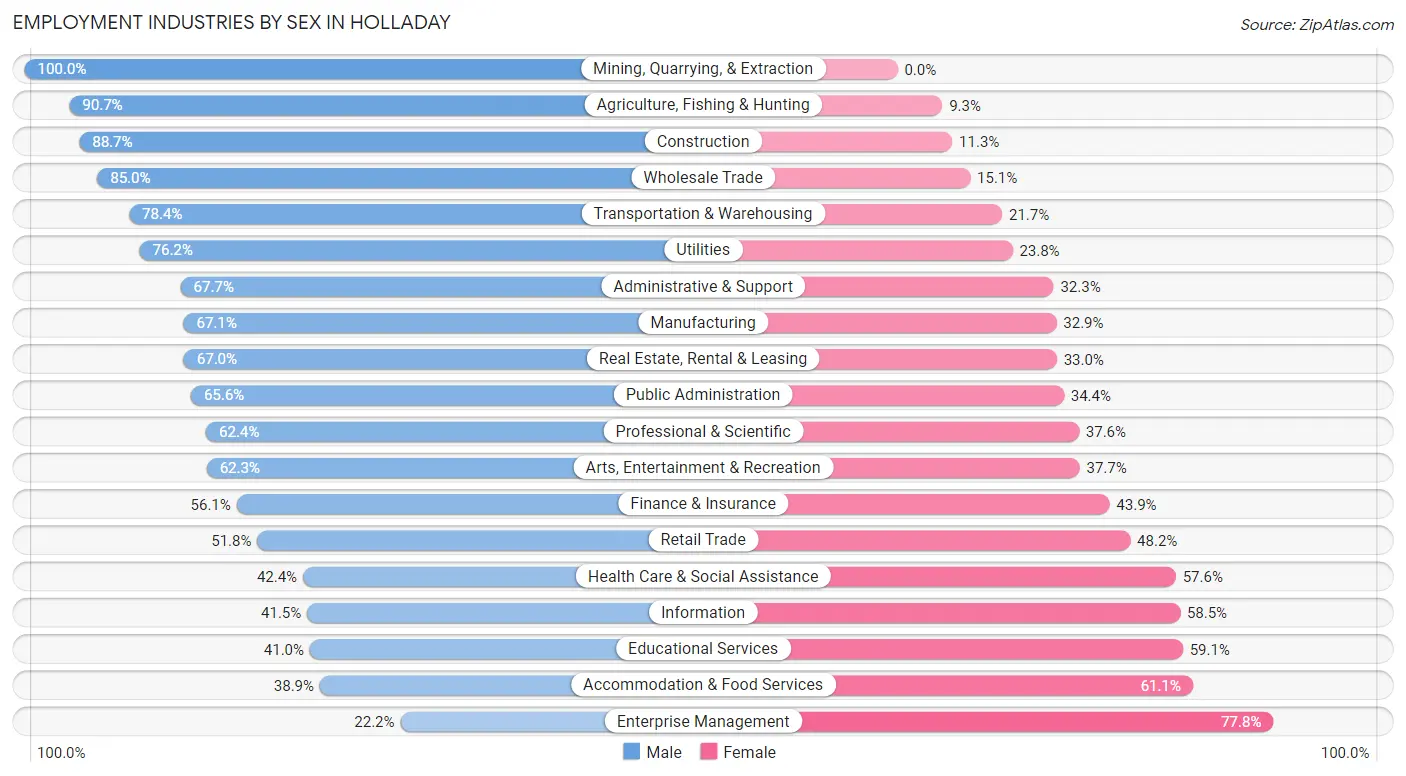
| Industry | Male | Female |
| Agriculture, Fishing & Hunting | 88 (90.7%) | 9 (9.3%) |
| Mining, Quarrying, & Extraction | 8 (100.0%) | 0 (0.0%) |
| Construction | 642 (88.7%) | 82 (11.3%) |
| Manufacturing | 622 (67.1%) | 305 (32.9%) |
| Wholesale Trade | 271 (85.0%) | 48 (15.0%) |
| Retail Trade | 848 (51.8%) | 788 (48.2%) |
| Transportation & Warehousing | 445 (78.3%) | 123 (21.6%) |
| Utilities | 64 (76.2%) | 20 (23.8%) |
| Information | 71 (41.5%) | 100 (58.5%) |
| Finance & Insurance | 660 (56.1%) | 516 (43.9%) |
| Real Estate, Rental & Leasing | 366 (67.0%) | 180 (33.0%) |
| Professional & Scientific | 1,099 (62.4%) | 661 (37.6%) |
| Enterprise Management | 4 (22.2%) | 14 (77.8%) |
| Administrative & Support | 373 (67.7%) | 178 (32.3%) |
| Educational Services | 765 (40.9%) | 1,103 (59.1%) |
| Health Care & Social Assistance | 1,122 (42.4%) | 1,525 (57.6%) |
| Arts, Entertainment & Recreation | 347 (62.3%) | 210 (37.7%) |
| Accommodation & Food Services | 264 (38.9%) | 415 (61.1%) |
| Public Administration | 436 (65.6%) | 229 (34.4%) |
| Total | 8,681 (56.2%) | 6,753 (43.8%) |
Education in Holladay
School Enrollment in Holladay
The most common levels of schooling among the 8,360 students in Holladay are high school (2,010 | 24.0%), middle school (1,719 | 20.6%), and college / undergraduate (1,599 | 19.1%).
| School Level | # Students | % Students |
| Nursery / Preschool | 609 | 7.3% |
| Kindergarten | 517 | 6.2% |
| Elementary School | 1,499 | 17.9% |
| Middle School | 1,719 | 20.6% |
| High School | 2,010 | 24.0% |
| College / Undergraduate | 1,599 | 19.1% |
| Graduate / Professional | 407 | 4.9% |
| Total | 8,360 | 100.0% |
School Enrollment by Age by Funding Source in Holladay
Out of a total of 8,360 students who are enrolled in schools in Holladay, 1,965 (23.5%) attend a private institution, while the remaining 6,395 (76.5%) are enrolled in public schools. The age group of 3 to 4 year olds has the highest likelihood of being enrolled in private schools, with 252 (55.4% in the age bracket) enrolled. Conversely, the age group of 25 to 34 year olds has the lowest likelihood of being enrolled in a private school, with 389 (85.5% in the age bracket) attending a public institution.
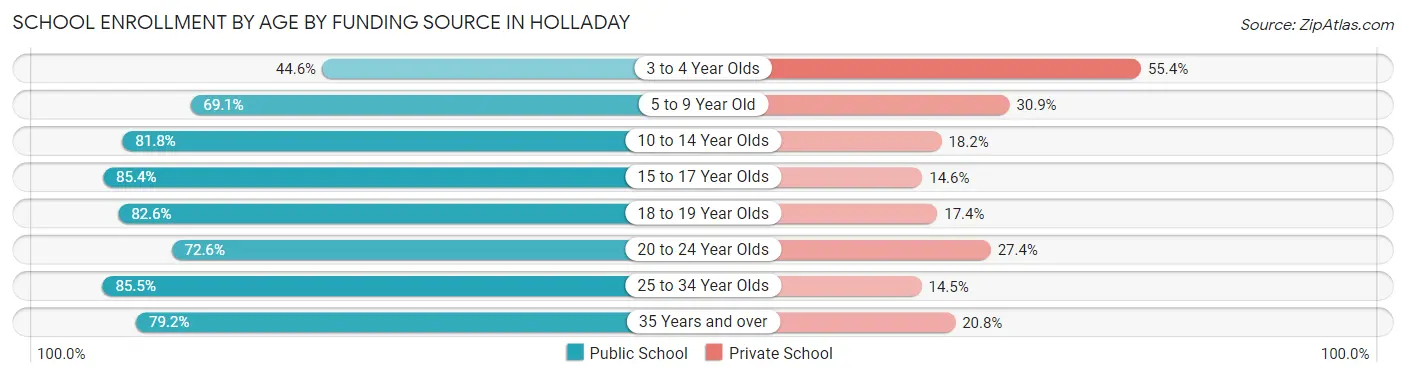
| Age Bracket | Public School | Private School |
| 3 to 4 Year Olds | 203 (44.6%) | 252 (55.4%) |
| 5 to 9 Year Old | 1,390 (69.1%) | 621 (30.9%) |
| 10 to 14 Year Olds | 1,863 (81.8%) | 415 (18.2%) |
| 15 to 17 Year Olds | 1,201 (85.4%) | 206 (14.6%) |
| 18 to 19 Year Olds | 336 (82.6%) | 71 (17.4%) |
| 20 to 24 Year Olds | 562 (72.6%) | 212 (27.4%) |
| 25 to 34 Year Olds | 389 (85.5%) | 66 (14.5%) |
| 35 Years and over | 454 (79.2%) | 119 (20.8%) |
| Total | 6,395 (76.5%) | 1,965 (23.5%) |
Educational Attainment by Field of Study in Holladay
Business (2,228 | 16.3%), social sciences (1,551 | 11.4%), science & technology (1,541 | 11.3%), education (1,490 | 10.9%), and literature & languages (856 | 6.3%) are the most common fields of study among 13,643 individuals in Holladay who have obtained a bachelor's degree or higher.
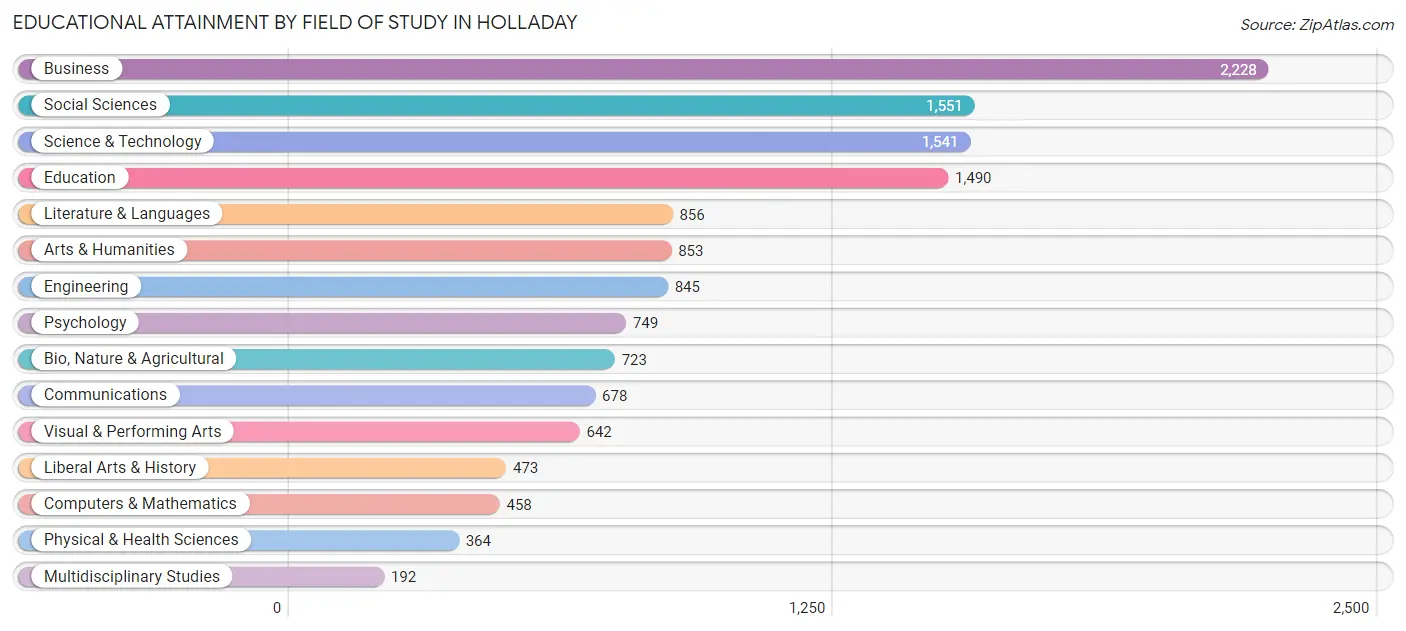
| Field of Study | # Graduates | % Graduates |
| Computers & Mathematics | 458 | 3.4% |
| Bio, Nature & Agricultural | 723 | 5.3% |
| Physical & Health Sciences | 364 | 2.7% |
| Psychology | 749 | 5.5% |
| Social Sciences | 1,551 | 11.4% |
| Engineering | 845 | 6.2% |
| Multidisciplinary Studies | 192 | 1.4% |
| Science & Technology | 1,541 | 11.3% |
| Business | 2,228 | 16.3% |
| Education | 1,490 | 10.9% |
| Literature & Languages | 856 | 6.3% |
| Liberal Arts & History | 473 | 3.5% |
| Visual & Performing Arts | 642 | 4.7% |
| Communications | 678 | 5.0% |
| Arts & Humanities | 853 | 6.2% |
| Total | 13,643 | 100.0% |
Transportation & Commute in Holladay
Vehicle Availability by Sex in Holladay
The most prevalent vehicle ownership categories in Holladay are males with 2 vehicles (3,594, accounting for 41.9%) and females with 2 vehicles (2,681, making up 54.5%).
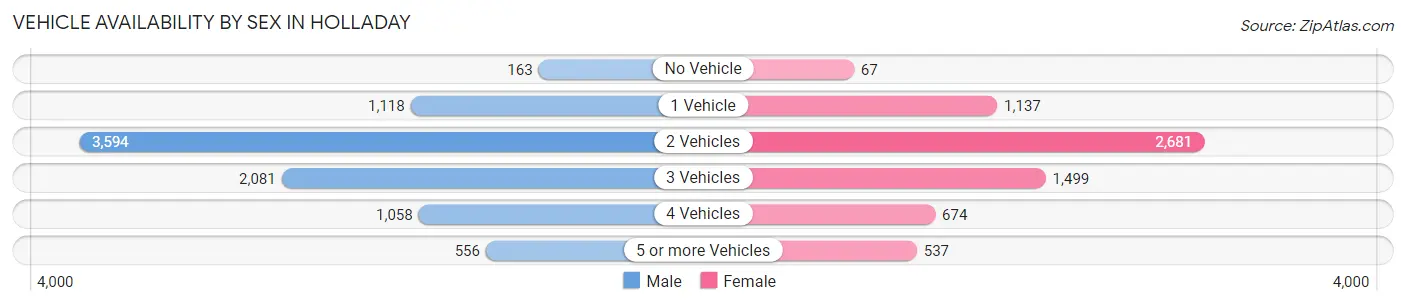
| Vehicles Available | Male | Female |
| No Vehicle | 163 (1.9%) | 67 (1.0%) |
| 1 Vehicle | 1,118 (13.1%) | 1,137 (17.2%) |
| 2 Vehicles | 3,594 (41.9%) | 2,681 (40.6%) |
| 3 Vehicles | 2,081 (24.3%) | 1,499 (22.7%) |
| 4 Vehicles | 1,058 (12.3%) | 674 (10.2%) |
| 5 or more Vehicles | 556 (6.5%) | 537 (8.1%) |
| Total | 8,570 (100.0%) | 6,595 (100.0%) |
Commute Time in Holladay
The most frequently occuring commute durations in Holladay are 20 to 24 minutes (2,879 commuters, 23.8%), 15 to 19 minutes (2,372 commuters, 19.6%), and 10 to 14 minutes (2,107 commuters, 17.4%).
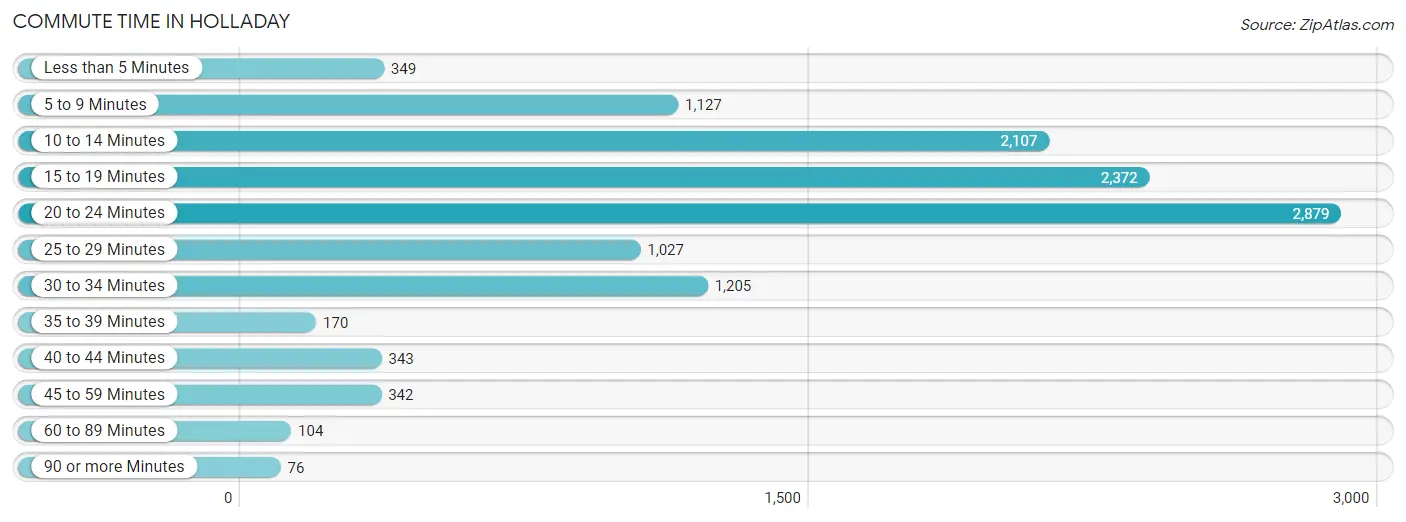
| Commute Time | # Commuters | % Commuters |
| Less than 5 Minutes | 349 | 2.9% |
| 5 to 9 Minutes | 1,127 | 9.3% |
| 10 to 14 Minutes | 2,107 | 17.4% |
| 15 to 19 Minutes | 2,372 | 19.6% |
| 20 to 24 Minutes | 2,879 | 23.8% |
| 25 to 29 Minutes | 1,027 | 8.5% |
| 30 to 34 Minutes | 1,205 | 10.0% |
| 35 to 39 Minutes | 170 | 1.4% |
| 40 to 44 Minutes | 343 | 2.8% |
| 45 to 59 Minutes | 342 | 2.8% |
| 60 to 89 Minutes | 104 | 0.9% |
| 90 or more Minutes | 76 | 0.6% |
Commute Time by Sex in Holladay
The most common commute times in Holladay are 20 to 24 minutes (1,713 commuters, 24.4%) for males and 20 to 24 minutes (1,166 commuters, 22.9%) for females.
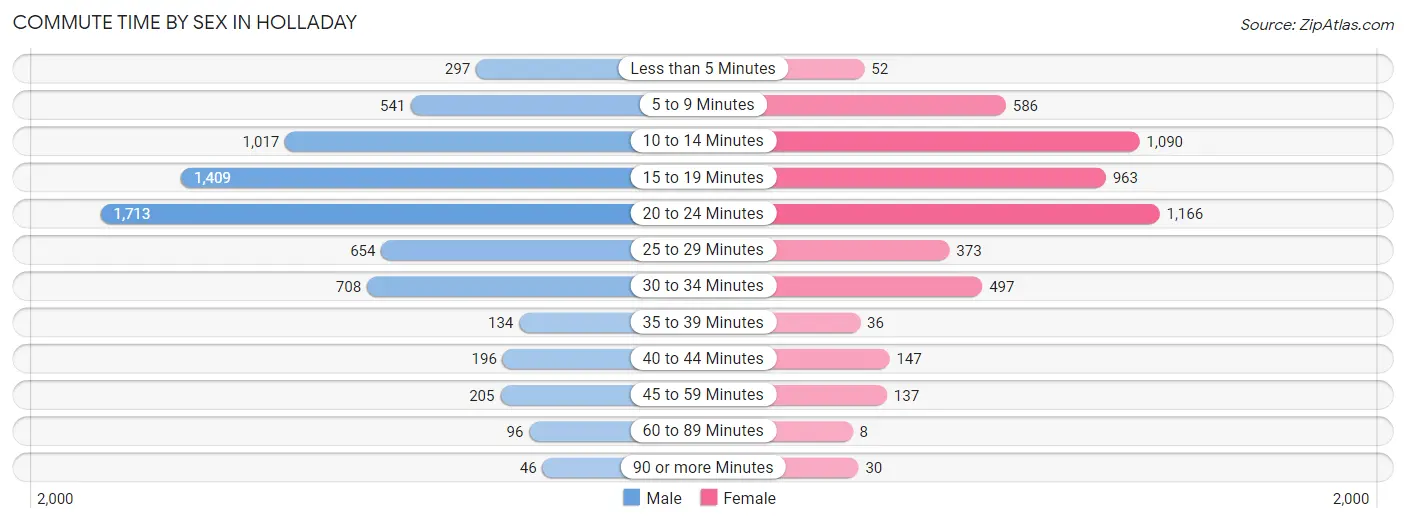
| Commute Time | Male | Female |
| Less than 5 Minutes | 297 (4.2%) | 52 (1.0%) |
| 5 to 9 Minutes | 541 (7.7%) | 586 (11.5%) |
| 10 to 14 Minutes | 1,017 (14.5%) | 1,090 (21.4%) |
| 15 to 19 Minutes | 1,409 (20.1%) | 963 (18.9%) |
| 20 to 24 Minutes | 1,713 (24.4%) | 1,166 (22.9%) |
| 25 to 29 Minutes | 654 (9.3%) | 373 (7.3%) |
| 30 to 34 Minutes | 708 (10.1%) | 497 (9.8%) |
| 35 to 39 Minutes | 134 (1.9%) | 36 (0.7%) |
| 40 to 44 Minutes | 196 (2.8%) | 147 (2.9%) |
| 45 to 59 Minutes | 205 (2.9%) | 137 (2.7%) |
| 60 to 89 Minutes | 96 (1.4%) | 8 (0.2%) |
| 90 or more Minutes | 46 (0.7%) | 30 (0.6%) |
Time of Departure to Work by Sex in Holladay
The most frequent times of departure to work in Holladay are 8:00 AM to 8:29 AM (1,495, 21.3%) for males and 8:00 AM to 8:29 AM (922, 18.1%) for females.
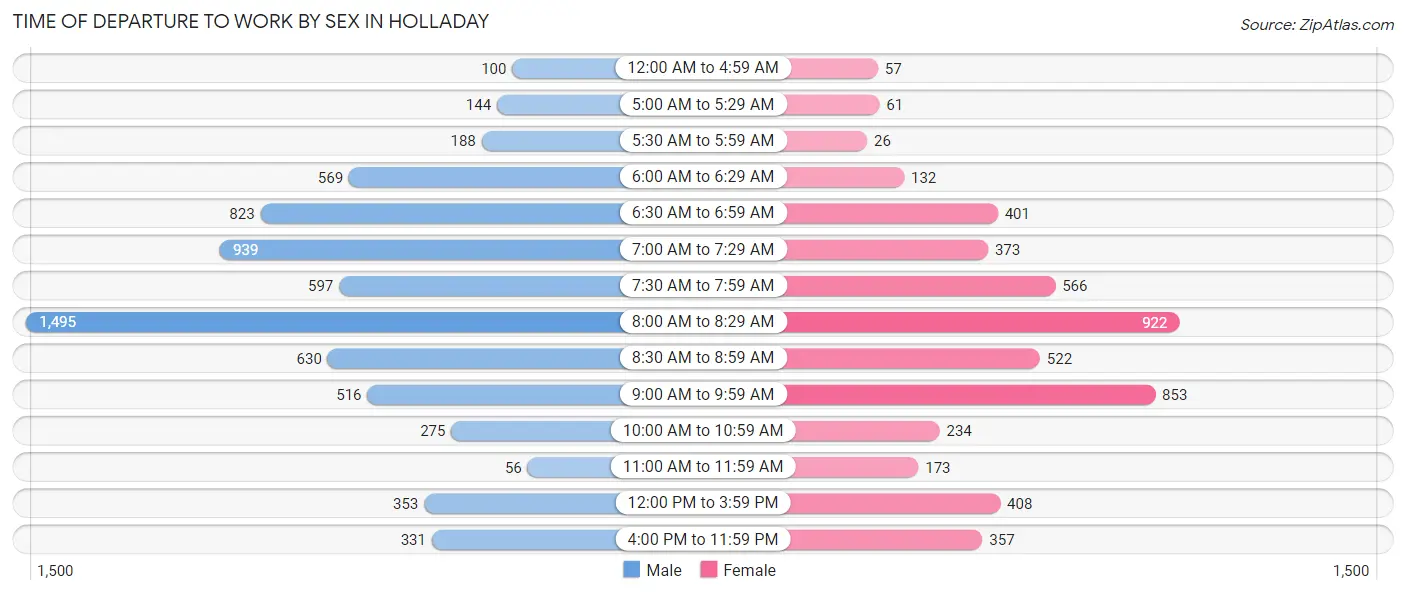
| Time of Departure | Male | Female |
| 12:00 AM to 4:59 AM | 100 (1.4%) | 57 (1.1%) |
| 5:00 AM to 5:29 AM | 144 (2.1%) | 61 (1.2%) |
| 5:30 AM to 5:59 AM | 188 (2.7%) | 26 (0.5%) |
| 6:00 AM to 6:29 AM | 569 (8.1%) | 132 (2.6%) |
| 6:30 AM to 6:59 AM | 823 (11.7%) | 401 (7.9%) |
| 7:00 AM to 7:29 AM | 939 (13.4%) | 373 (7.3%) |
| 7:30 AM to 7:59 AM | 597 (8.5%) | 566 (11.1%) |
| 8:00 AM to 8:29 AM | 1,495 (21.3%) | 922 (18.1%) |
| 8:30 AM to 8:59 AM | 630 (9.0%) | 522 (10.3%) |
| 9:00 AM to 9:59 AM | 516 (7.3%) | 853 (16.8%) |
| 10:00 AM to 10:59 AM | 275 (3.9%) | 234 (4.6%) |
| 11:00 AM to 11:59 AM | 56 (0.8%) | 173 (3.4%) |
| 12:00 PM to 3:59 PM | 353 (5.0%) | 408 (8.0%) |
| 4:00 PM to 11:59 PM | 331 (4.7%) | 357 (7.0%) |
| Total | 7,016 (100.0%) | 5,085 (100.0%) |
Housing Occupancy in Holladay
Occupancy by Ownership in Holladay
Of the total 11,727 dwellings in Holladay, owner-occupied units account for 9,163 (78.1%), while renter-occupied units make up 2,564 (21.9%).
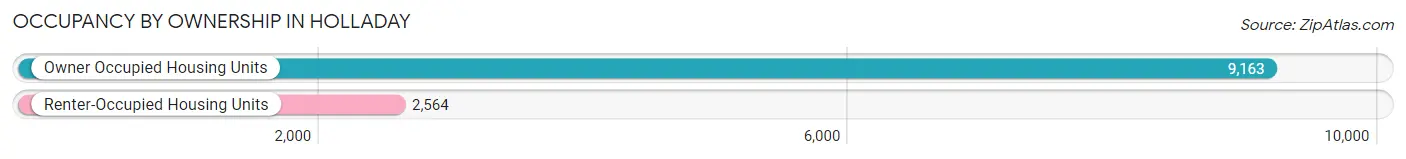
| Occupancy | # Housing Units | % Housing Units |
| Owner Occupied Housing Units | 9,163 | 78.1% |
| Renter-Occupied Housing Units | 2,564 | 21.9% |
| Total Occupied Housing Units | 11,727 | 100.0% |
Occupancy by Household Size in Holladay
| Household Size | # Housing Units | % Housing Units |
| 1-Person Household | 2,743 | 23.4% |
| 2-Person Household | 4,274 | 36.4% |
| 3-Person Household | 1,804 | 15.4% |
| 4+ Person Household | 2,906 | 24.8% |
| Total Housing Units | 11,727 | 100.0% |
Occupancy by Ownership by Household Size in Holladay
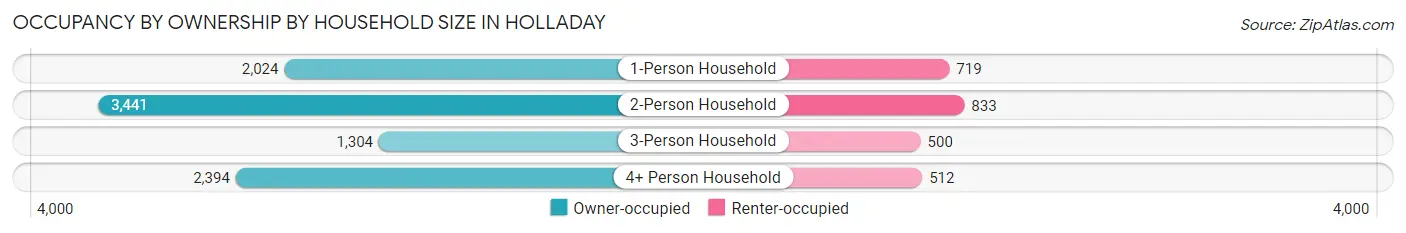
| Household Size | Owner-occupied | Renter-occupied |
| 1-Person Household | 2,024 (73.8%) | 719 (26.2%) |
| 2-Person Household | 3,441 (80.5%) | 833 (19.5%) |
| 3-Person Household | 1,304 (72.3%) | 500 (27.7%) |
| 4+ Person Household | 2,394 (82.4%) | 512 (17.6%) |
| Total Housing Units | 9,163 (78.1%) | 2,564 (21.9%) |
Occupancy by Educational Attainment in Holladay
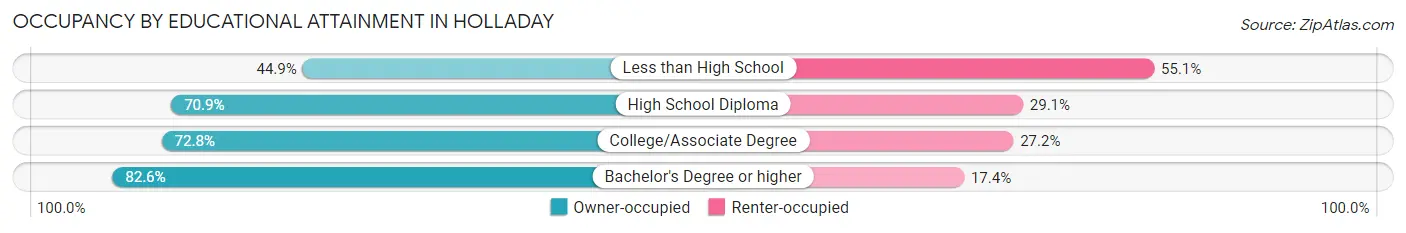
| Household Size | Owner-occupied | Renter-occupied |
| Less than High School | 132 (44.9%) | 162 (55.1%) |
| High School Diploma | 612 (70.9%) | 251 (29.1%) |
| College/Associate Degree | 2,315 (72.8%) | 864 (27.2%) |
| Bachelor's Degree or higher | 6,104 (82.6%) | 1,287 (17.4%) |
Occupancy by Age of Householder in Holladay
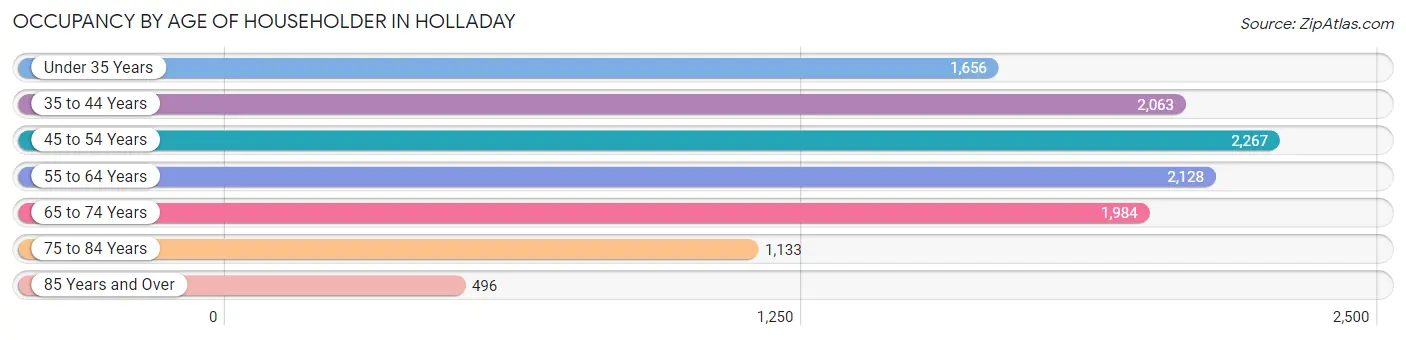
| Age Bracket | # Households | % Households |
| Under 35 Years | 1,656 | 14.1% |
| 35 to 44 Years | 2,063 | 17.6% |
| 45 to 54 Years | 2,267 | 19.3% |
| 55 to 64 Years | 2,128 | 18.1% |
| 65 to 74 Years | 1,984 | 16.9% |
| 75 to 84 Years | 1,133 | 9.7% |
| 85 Years and Over | 496 | 4.2% |
| Total | 11,727 | 100.0% |
Housing Finances in Holladay
Median Income by Occupancy in Holladay
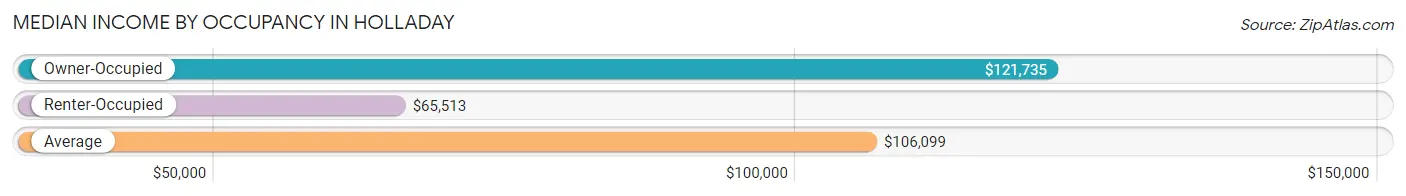
| Occupancy Type | # Households | Median Income |
| Owner-Occupied | 9,163 (78.1%) | $121,735 |
| Renter-Occupied | 2,564 (21.9%) | $65,513 |
| Average | 11,727 (100.0%) | $106,099 |
Occupancy by Householder Income Bracket in Holladay
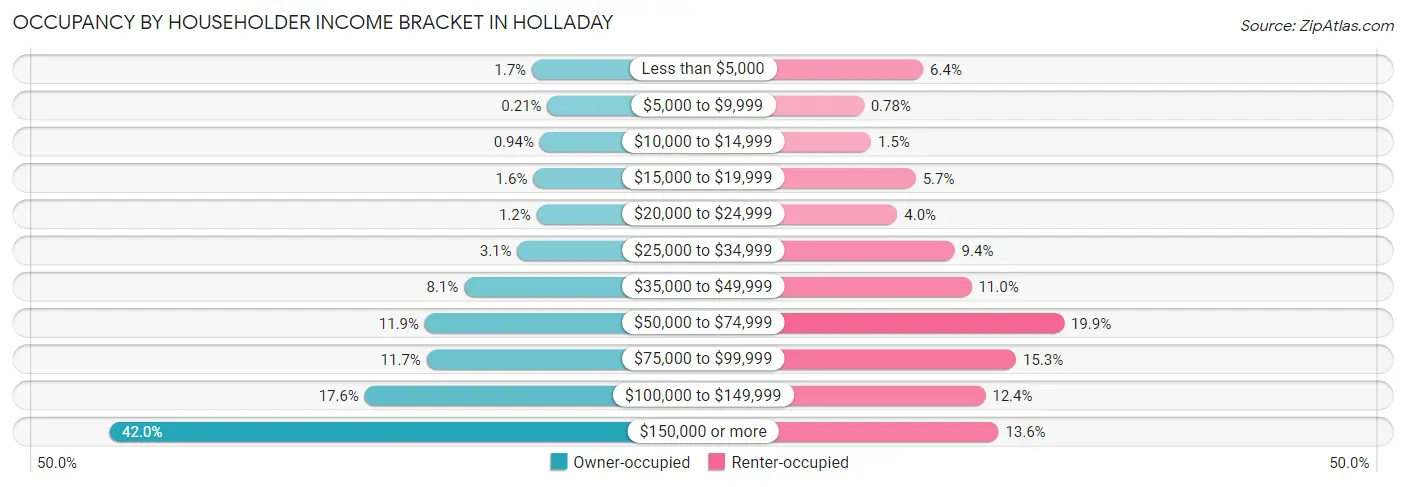
| Income Bracket | Owner-occupied | Renter-occupied |
| Less than $5,000 | 154 (1.7%) | 165 (6.4%) |
| $5,000 to $9,999 | 19 (0.2%) | 20 (0.8%) |
| $10,000 to $14,999 | 86 (0.9%) | 38 (1.5%) |
| $15,000 to $19,999 | 143 (1.6%) | 147 (5.7%) |
| $20,000 to $24,999 | 114 (1.2%) | 102 (4.0%) |
| $25,000 to $34,999 | 281 (3.1%) | 242 (9.4%) |
| $35,000 to $49,999 | 746 (8.1%) | 283 (11.0%) |
| $50,000 to $74,999 | 1,089 (11.9%) | 509 (19.9%) |
| $75,000 to $99,999 | 1,073 (11.7%) | 392 (15.3%) |
| $100,000 to $149,999 | 1,614 (17.6%) | 317 (12.4%) |
| $150,000 or more | 3,844 (41.9%) | 349 (13.6%) |
| Total | 9,163 (100.0%) | 2,564 (100.0%) |
Monthly Housing Cost Tiers in Holladay
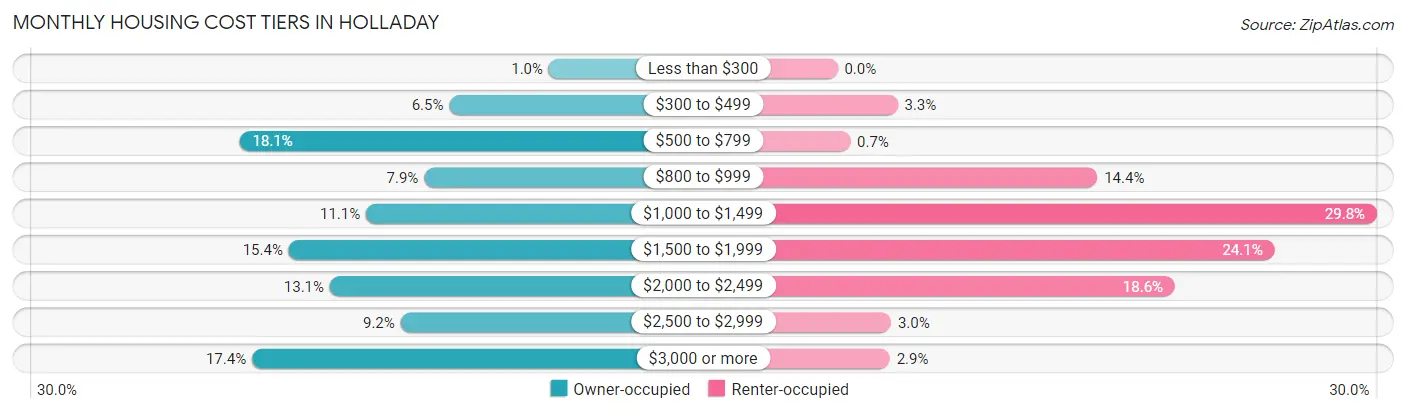
| Monthly Cost | Owner-occupied | Renter-occupied |
| Less than $300 | 95 (1.0%) | 0 (0.0%) |
| $300 to $499 | 599 (6.5%) | 85 (3.3%) |
| $500 to $799 | 1,661 (18.1%) | 18 (0.7%) |
| $800 to $999 | 727 (7.9%) | 368 (14.3%) |
| $1,000 to $1,499 | 1,021 (11.1%) | 764 (29.8%) |
| $1,500 to $1,999 | 1,412 (15.4%) | 619 (24.1%) |
| $2,000 to $2,499 | 1,204 (13.1%) | 478 (18.6%) |
| $2,500 to $2,999 | 846 (9.2%) | 76 (3.0%) |
| $3,000 or more | 1,598 (17.4%) | 74 (2.9%) |
| Total | 9,163 (100.0%) | 2,564 (100.0%) |
Physical Housing Characteristics in Holladay
Housing Structures in Holladay
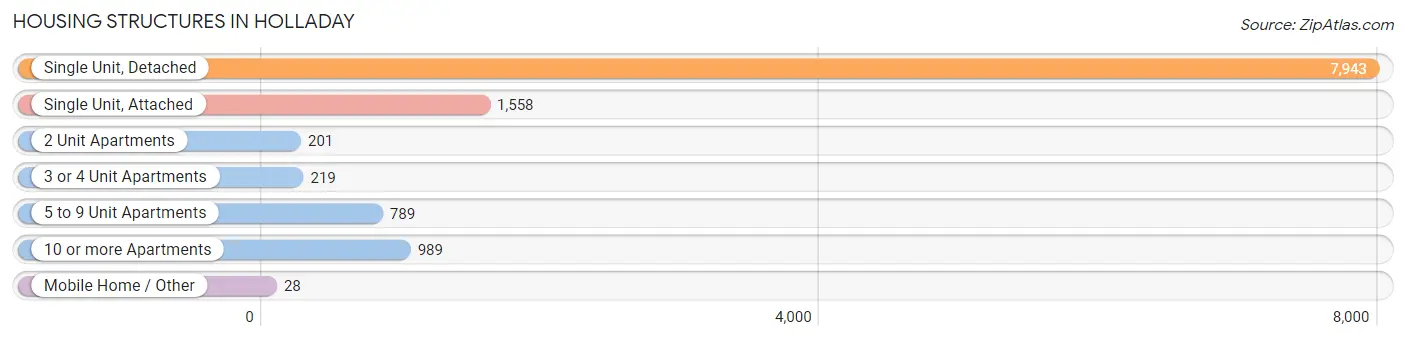
| Structure Type | # Housing Units | % Housing Units |
| Single Unit, Detached | 7,943 | 67.7% |
| Single Unit, Attached | 1,558 | 13.3% |
| 2 Unit Apartments | 201 | 1.7% |
| 3 or 4 Unit Apartments | 219 | 1.9% |
| 5 to 9 Unit Apartments | 789 | 6.7% |
| 10 or more Apartments | 989 | 8.4% |
| Mobile Home / Other | 28 | 0.2% |
| Total | 11,727 | 100.0% |
Housing Structures by Occupancy in Holladay
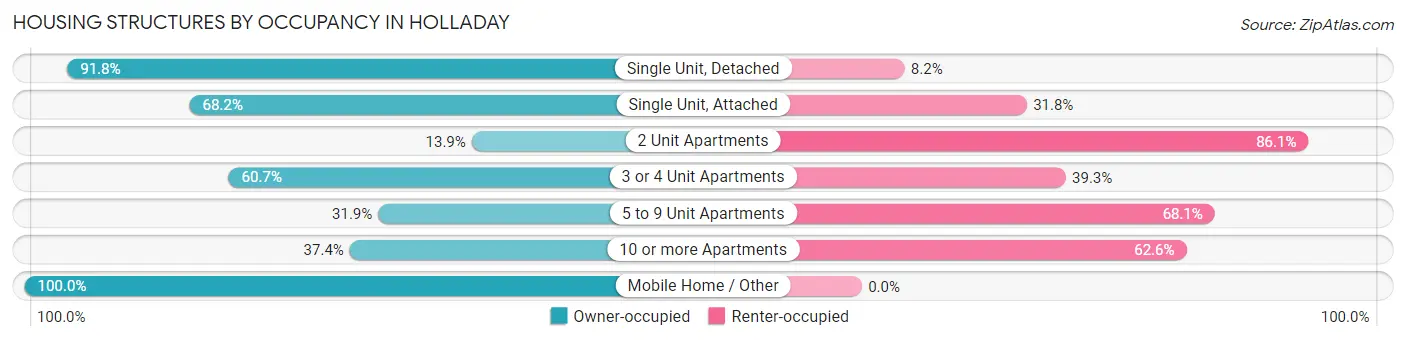
| Structure Type | Owner-occupied | Renter-occupied |
| Single Unit, Detached | 7,289 (91.8%) | 654 (8.2%) |
| Single Unit, Attached | 1,063 (68.2%) | 495 (31.8%) |
| 2 Unit Apartments | 28 (13.9%) | 173 (86.1%) |
| 3 or 4 Unit Apartments | 133 (60.7%) | 86 (39.3%) |
| 5 to 9 Unit Apartments | 252 (31.9%) | 537 (68.1%) |
| 10 or more Apartments | 370 (37.4%) | 619 (62.6%) |
| Mobile Home / Other | 28 (100.0%) | 0 (0.0%) |
| Total | 9,163 (78.1%) | 2,564 (21.9%) |
Housing Structures by Number of Rooms in Holladay
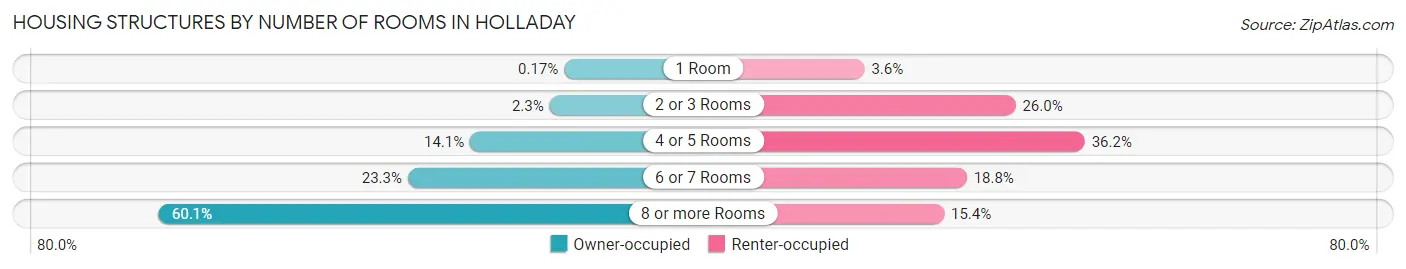
| Number of Rooms | Owner-occupied | Renter-occupied |
| 1 Room | 16 (0.2%) | 93 (3.6%) |
| 2 or 3 Rooms | 213 (2.3%) | 666 (26.0%) |
| 4 or 5 Rooms | 1,290 (14.1%) | 929 (36.2%) |
| 6 or 7 Rooms | 2,134 (23.3%) | 481 (18.8%) |
| 8 or more Rooms | 5,510 (60.1%) | 395 (15.4%) |
| Total | 9,163 (100.0%) | 2,564 (100.0%) |
Housing Structure by Heating Type in Holladay
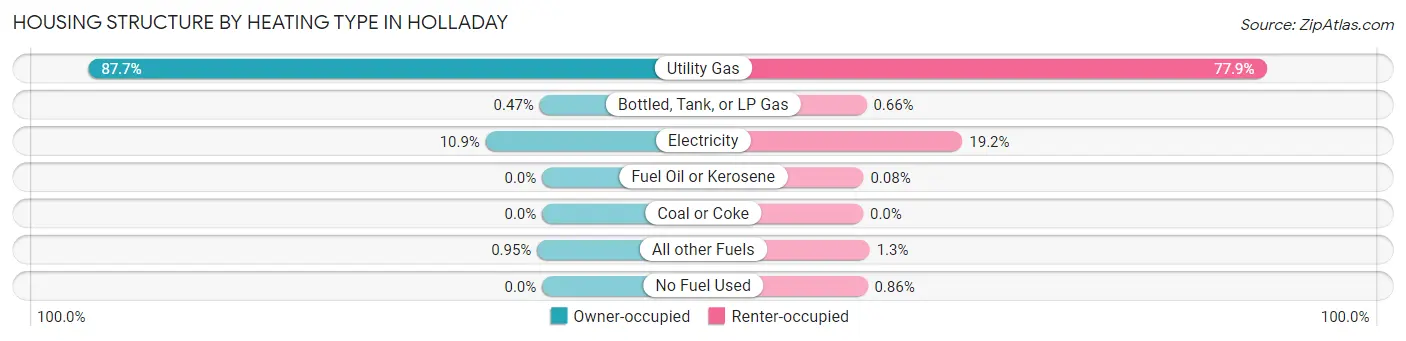
| Heating Type | Owner-occupied | Renter-occupied |
| Utility Gas | 8,034 (87.7%) | 1,998 (77.9%) |
| Bottled, Tank, or LP Gas | 43 (0.5%) | 17 (0.7%) |
| Electricity | 999 (10.9%) | 492 (19.2%) |
| Fuel Oil or Kerosene | 0 (0.0%) | 2 (0.1%) |
| Coal or Coke | 0 (0.0%) | 0 (0.0%) |
| All other Fuels | 87 (0.9%) | 33 (1.3%) |
| No Fuel Used | 0 (0.0%) | 22 (0.9%) |
| Total | 9,163 (100.0%) | 2,564 (100.0%) |
Household Vehicle Usage in Holladay
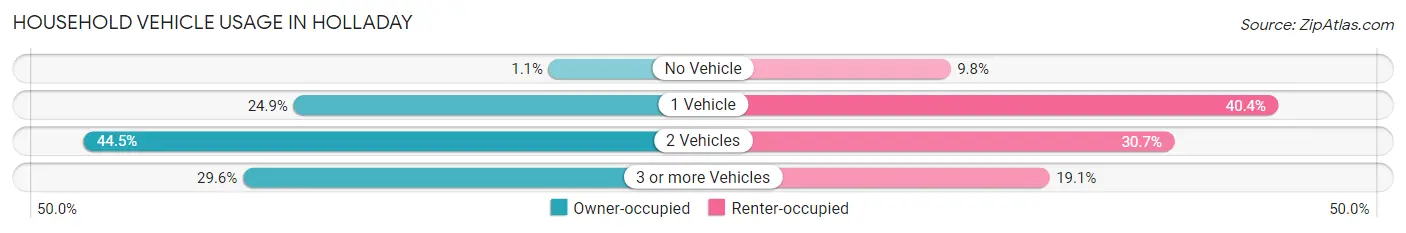
| Vehicles per Household | Owner-occupied | Renter-occupied |
| No Vehicle | 97 (1.1%) | 252 (9.8%) |
| 1 Vehicle | 2,280 (24.9%) | 1,036 (40.4%) |
| 2 Vehicles | 4,074 (44.5%) | 787 (30.7%) |
| 3 or more Vehicles | 2,712 (29.6%) | 489 (19.1%) |
| Total | 9,163 (100.0%) | 2,564 (100.0%) |
Real Estate & Mortgages in Holladay
Real Estate and Mortgage Overview in Holladay
| Characteristic | Without Mortgage | With Mortgage |
| Housing Units | 3,432 | 5,731 |
| Median Property Value | $650,800 | $628,000 |
| Median Household Income | $100,938 | $2,704 |
| Monthly Housing Costs | $700 | $1,517 |
| Real Estate Taxes | $3,360 | $59 |
Property Value by Mortgage Status in Holladay
| Property Value | Without Mortgage | With Mortgage |
| Less than $50,000 | 71 (2.1%) | 80 (1.4%) |
| $50,000 to $99,999 | 28 (0.8%) | 22 (0.4%) |
| $100,000 to $299,999 | 98 (2.9%) | 585 (10.2%) |
| $300,000 to $499,999 | 731 (21.3%) | 1,240 (21.6%) |
| $500,000 to $749,999 | 1,306 (38.1%) | 1,833 (32.0%) |
| $750,000 to $999,999 | 555 (16.2%) | 915 (16.0%) |
| $1,000,000 or more | 643 (18.7%) | 1,056 (18.4%) |
| Total | 3,432 (100.0%) | 5,731 (100.0%) |
Household Income by Mortgage Status in Holladay
| Household Income | Without Mortgage | With Mortgage |
| Less than $10,000 | 85 (2.5%) | 117 (2.0%) |
| $10,000 to $24,999 | 277 (8.1%) | 88 (1.5%) |
| $25,000 to $34,999 | 120 (3.5%) | 66 (1.1%) |
| $35,000 to $49,999 | 269 (7.8%) | 161 (2.8%) |
| $50,000 to $74,999 | 562 (16.4%) | 477 (8.3%) |
| $75,000 to $99,999 | 388 (11.3%) | 527 (9.2%) |
| $100,000 to $149,999 | 591 (17.2%) | 685 (11.9%) |
| $150,000 or more | 1,140 (33.2%) | 1,023 (17.8%) |
| Total | 3,432 (100.0%) | 5,731 (100.0%) |
Property Value to Household Income Ratio in Holladay
| Value-to-Income Ratio | Without Mortgage | With Mortgage |
| Less than 2.0x | 293 (8.5%) | 139,375 (2,432.0%) |
| 2.0x to 2.9x | 294 (8.6%) | 554 (9.7%) |
| 3.0x to 3.9x | 568 (16.6%) | 1,213 (21.2%) |
| 4.0x or more | 2,251 (65.6%) | 841 (14.7%) |
| Total | 3,432 (100.0%) | 5,731 (100.0%) |
Real Estate Taxes by Mortgage Status in Holladay
| Property Taxes | Without Mortgage | With Mortgage |
| Less than $800 | 65 (1.9%) | 41 (0.7%) |
| $800 to $1,499 | 188 (5.5%) | 254 (4.4%) |
| $800 to $1,499 | 3,139 (91.5%) | 351 (6.1%) |
| Total | 3,432 (100.0%) | 5,731 (100.0%) |
Health & Disability in Holladay
Health Insurance Coverage by Age in Holladay
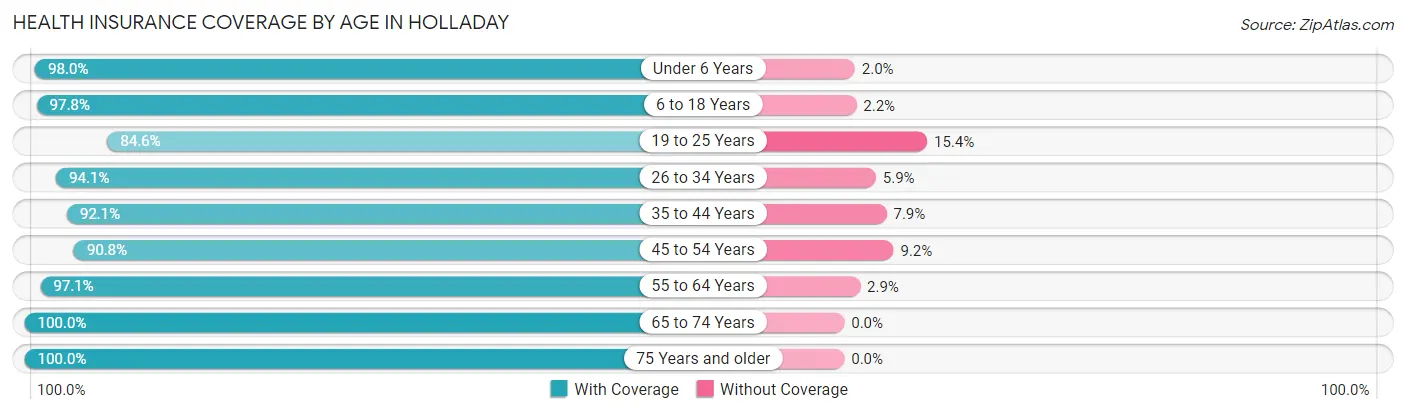
| Age Bracket | With Coverage | Without Coverage |
| Under 6 Years | 2,253 (98.0%) | 45 (2.0%) |
| 6 to 18 Years | 5,710 (97.8%) | 131 (2.2%) |
| 19 to 25 Years | 1,889 (84.6%) | 345 (15.4%) |
| 26 to 34 Years | 3,345 (94.1%) | 209 (5.9%) |
| 35 to 44 Years | 3,860 (92.1%) | 330 (7.9%) |
| 45 to 54 Years | 3,563 (90.8%) | 360 (9.2%) |
| 55 to 64 Years | 3,469 (97.1%) | 105 (2.9%) |
| 65 to 74 Years | 3,226 (100.0%) | 0 (0.0%) |
| 75 Years and older | 2,546 (100.0%) | 0 (0.0%) |
| Total | 29,861 (95.1%) | 1,525 (4.9%) |
Health Insurance Coverage by Citizenship Status in Holladay
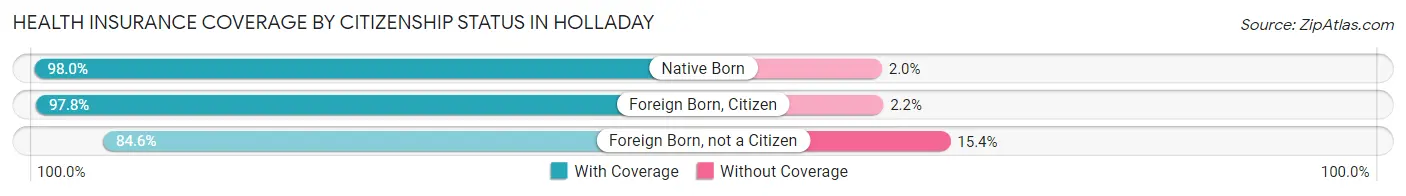
| Citizenship Status | With Coverage | Without Coverage |
| Native Born | 2,253 (98.0%) | 45 (2.0%) |
| Foreign Born, Citizen | 5,710 (97.8%) | 131 (2.2%) |
| Foreign Born, not a Citizen | 1,889 (84.6%) | 345 (15.4%) |
Health Insurance Coverage by Household Income in Holladay
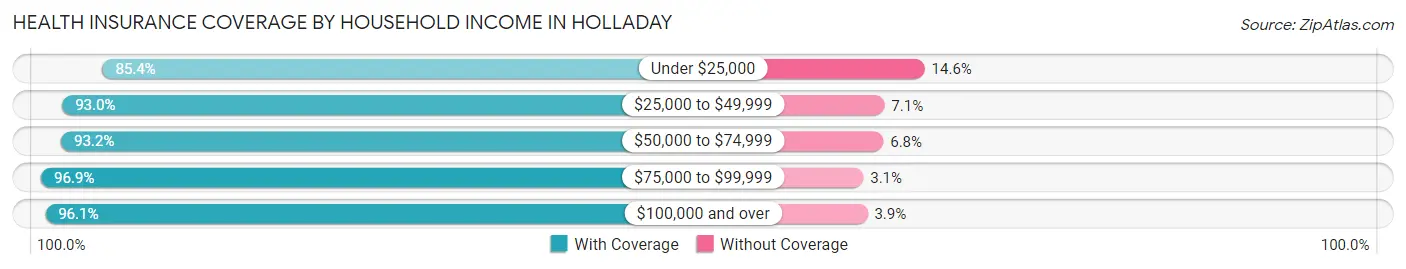
| Household Income | With Coverage | Without Coverage |
| Under $25,000 | 1,253 (85.4%) | 214 (14.6%) |
| $25,000 to $49,999 | 2,677 (92.9%) | 203 (7.0%) |
| $50,000 to $74,999 | 2,861 (93.2%) | 210 (6.8%) |
| $75,000 to $99,999 | 3,767 (96.9%) | 120 (3.1%) |
| $100,000 and over | 19,285 (96.1%) | 777 (3.9%) |
Public vs Private Health Insurance Coverage by Age in Holladay
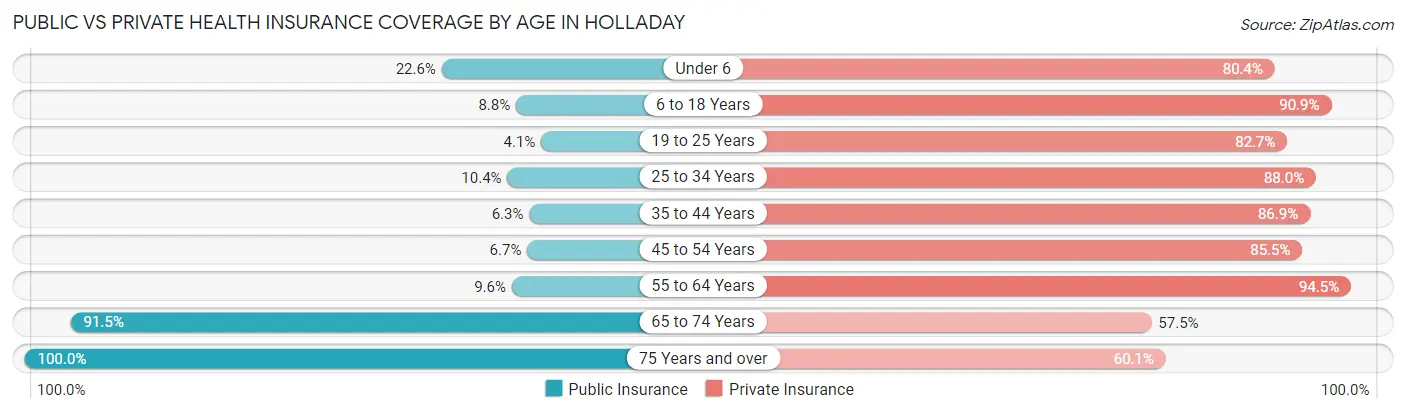
| Age Bracket | Public Insurance | Private Insurance |
| Under 6 | 519 (22.6%) | 1,847 (80.4%) |
| 6 to 18 Years | 512 (8.8%) | 5,307 (90.9%) |
| 19 to 25 Years | 92 (4.1%) | 1,847 (82.7%) |
| 25 to 34 Years | 369 (10.4%) | 3,128 (88.0%) |
| 35 to 44 Years | 265 (6.3%) | 3,641 (86.9%) |
| 45 to 54 Years | 263 (6.7%) | 3,353 (85.5%) |
| 55 to 64 Years | 342 (9.6%) | 3,378 (94.5%) |
| 65 to 74 Years | 2,951 (91.5%) | 1,854 (57.5%) |
| 75 Years and over | 2,546 (100.0%) | 1,531 (60.1%) |
| Total | 7,859 (25.0%) | 25,886 (82.5%) |
Disability Status by Sex by Age in Holladay
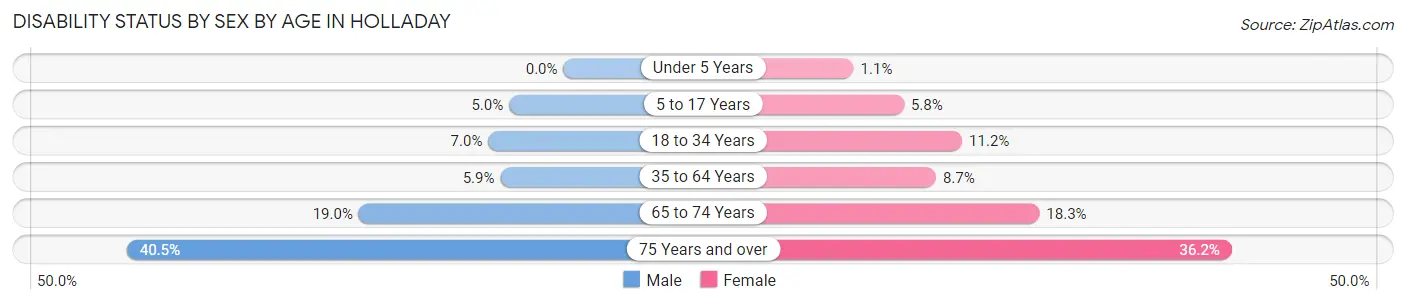
| Age Bracket | Male | Female |
| Under 5 Years | 0 (0.0%) | 12 (1.1%) |
| 5 to 17 Years | 167 (5.0%) | 154 (5.8%) |
| 18 to 34 Years | 199 (7.0%) | 356 (11.2%) |
| 35 to 64 Years | 353 (5.9%) | 494 (8.7%) |
| 65 to 74 Years | 277 (19.0%) | 324 (18.3%) |
| 75 Years and over | 448 (40.5%) | 521 (36.2%) |
Disability Class by Sex by Age in Holladay
Disability Class: Hearing Difficulty
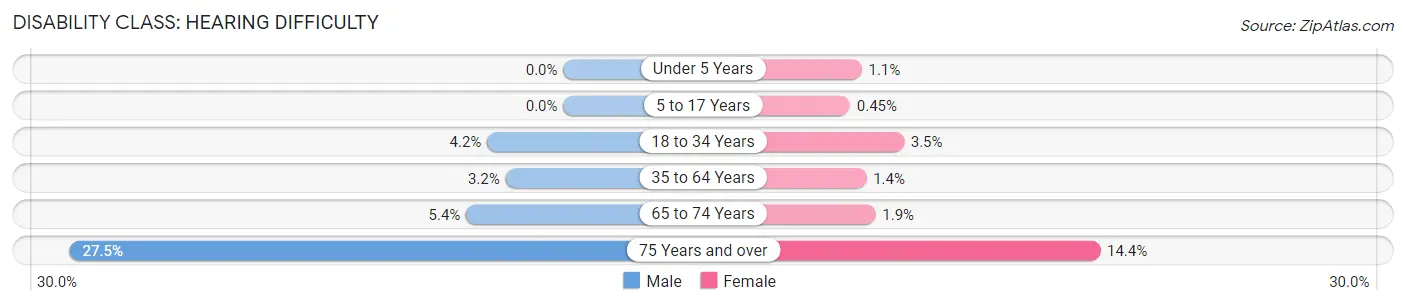
| Age Bracket | Male | Female |
| Under 5 Years | 0 (0.0%) | 12 (1.1%) |
| 5 to 17 Years | 0 (0.0%) | 12 (0.4%) |
| 18 to 34 Years | 121 (4.2%) | 110 (3.5%) |
| 35 to 64 Years | 194 (3.2%) | 77 (1.4%) |
| 65 to 74 Years | 79 (5.4%) | 33 (1.9%) |
| 75 Years and over | 304 (27.5%) | 207 (14.4%) |
Disability Class: Vision Difficulty
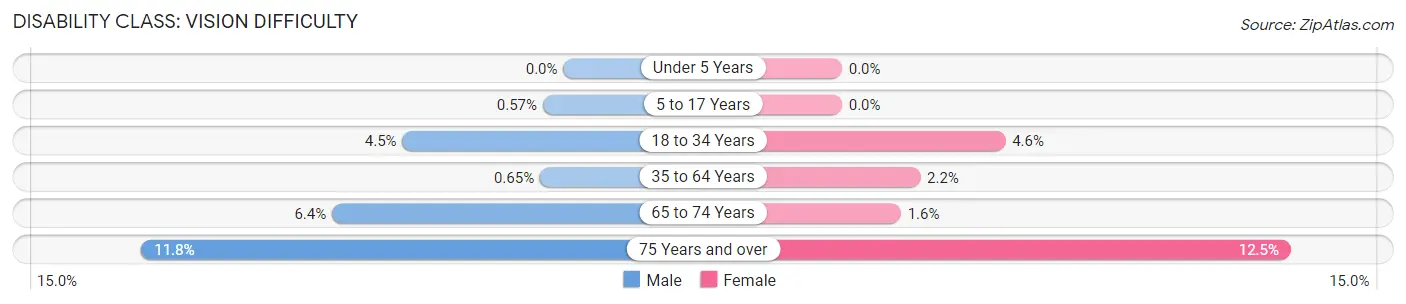
| Age Bracket | Male | Female |
| Under 5 Years | 0 (0.0%) | 0 (0.0%) |
| 5 to 17 Years | 19 (0.6%) | 0 (0.0%) |
| 18 to 34 Years | 128 (4.5%) | 145 (4.5%) |
| 35 to 64 Years | 39 (0.6%) | 123 (2.2%) |
| 65 to 74 Years | 94 (6.4%) | 29 (1.6%) |
| 75 Years and over | 130 (11.7%) | 180 (12.5%) |
Disability Class: Cognitive Difficulty
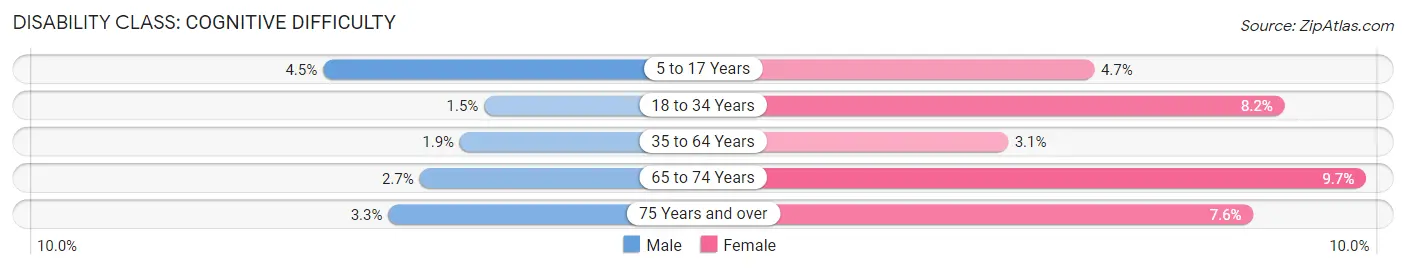
| Age Bracket | Male | Female |
| 5 to 17 Years | 148 (4.5%) | 125 (4.7%) |
| 18 to 34 Years | 42 (1.5%) | 262 (8.2%) |
| 35 to 64 Years | 116 (1.9%) | 174 (3.1%) |
| 65 to 74 Years | 39 (2.7%) | 172 (9.7%) |
| 75 Years and over | 36 (3.3%) | 110 (7.6%) |
Disability Class: Ambulatory Difficulty
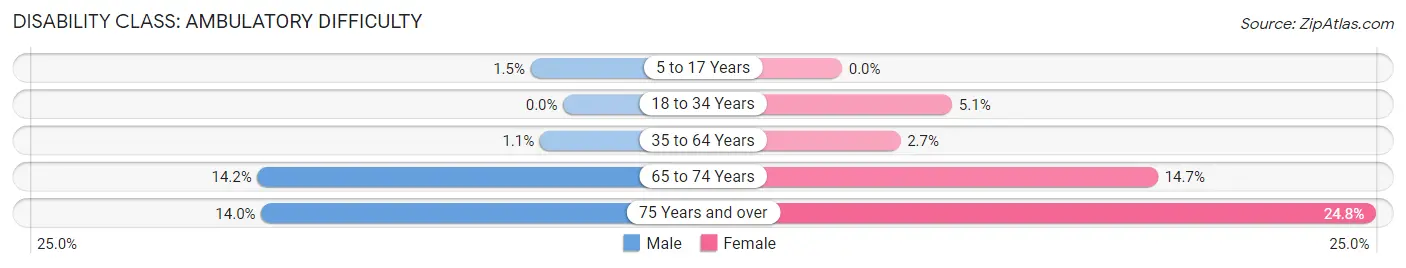
| Age Bracket | Male | Female |
| 5 to 17 Years | 50 (1.5%) | 0 (0.0%) |
| 18 to 34 Years | 0 (0.0%) | 163 (5.1%) |
| 35 to 64 Years | 65 (1.1%) | 153 (2.7%) |
| 65 to 74 Years | 207 (14.2%) | 259 (14.7%) |
| 75 Years and over | 155 (14.0%) | 357 (24.8%) |
Disability Class: Self-Care Difficulty
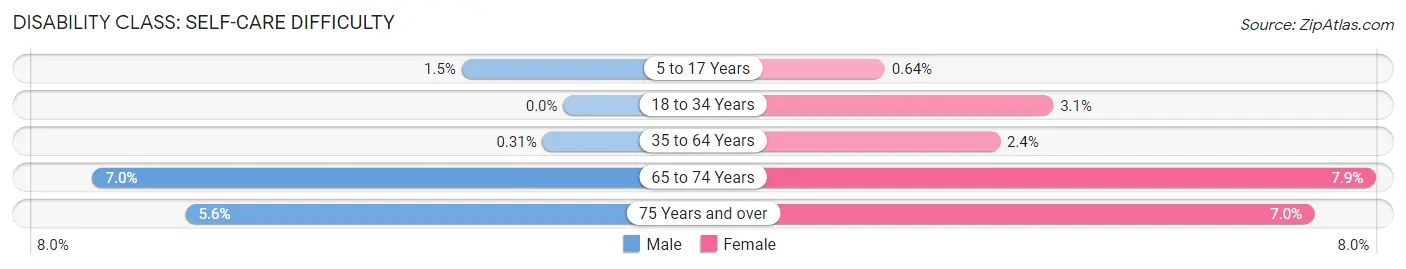
| Age Bracket | Male | Female |
| 5 to 17 Years | 50 (1.5%) | 17 (0.6%) |
| 18 to 34 Years | 0 (0.0%) | 100 (3.1%) |
| 35 to 64 Years | 19 (0.3%) | 133 (2.4%) |
| 65 to 74 Years | 102 (7.0%) | 140 (7.9%) |
| 75 Years and over | 62 (5.6%) | 101 (7.0%) |
Technology Access in Holladay
Computing Device Access in Holladay
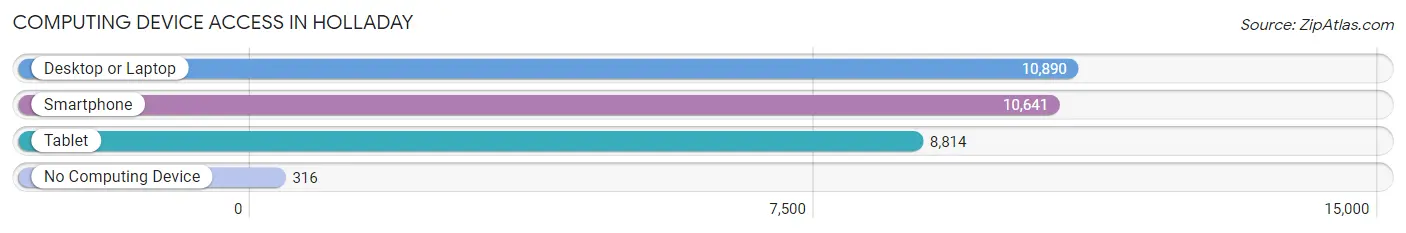
| Device Type | # Households | % Households |
| Desktop or Laptop | 10,890 | 92.9% |
| Smartphone | 10,641 | 90.7% |
| Tablet | 8,814 | 75.2% |
| No Computing Device | 316 | 2.7% |
| Total | 11,727 | 100.0% |
Internet Access in Holladay
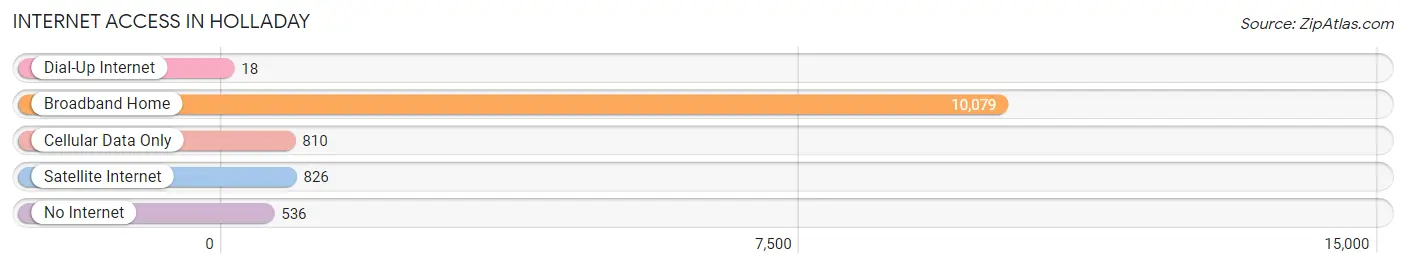
| Internet Type | # Households | % Households |
| Dial-Up Internet | 18 | 0.2% |
| Broadband Home | 10,079 | 86.0% |
| Cellular Data Only | 810 | 6.9% |
| Satellite Internet | 826 | 7.0% |
| No Internet | 536 | 4.6% |
| Total | 11,727 | 100.0% |
Holladay Summary
Holladay, Utah is a city located in Salt Lake County, Utah, United States. It is part of the Salt Lake City metropolitan area. The population was 26,472 at the 2010 census, making it the most populous city in the county.
History
Holladay was first settled in 1847 by John Holladay, a pioneer from Tennessee. He was the first settler in the area and established a farm and a trading post. The area was known as Holladay's Settlement until 1859 when it was renamed Holladay'sville. In 1868, the name was changed to Holladay.
The city was incorporated in 1999 and is now the largest city in Salt Lake County
Geography
Holladay is located in the foothills of the Wasatch Mountains, about 10 miles (16 km) south of Salt Lake City. It is bordered by Murray to the north, Cottonwood Heights to the east, and Taylorsville to the south.
The city has a total area of 8 2 square miles 21 2 km2 all of it land
Economy
Holladay is home to several large employers, including the University of Utah, Intermountain Healthcare, and the Salt Lake City International Airport. The city also has a thriving retail sector, with several shopping centers and malls.
Demographics
As of the 2010 census, there were 26,472 people, 9,945 households, and 7,072 families residing in the city. The population density was 3,219.7 people per square mile (1,241.3/km2). There were 10,541 housing units at an average density of 1,288.3 per square mile (496.7/km2). The racial makeup of the city was 87.2% White, 2.2% African American, 0.5% Native American, 4.2% Asian, 0.2% Pacific Islander, 3.2% from other races, and 2.7% from two or more races. Hispanic or Latino of any race were 8.2% of the population.
There were 9,945 households, out of which 33.2% had children under the age of 18 living with them, 58.2% were married couples living together, 9.3% had a female householder with no husband present, and 28.7% were non-families. 22.2% of all households were made up of individuals, and 8.2% had someone living alone who was 65 years of age or older. The average household size was 2.67 and the average family size was 3.15.
In the city, the population was spread out, with 25.2% under the age of 18, 8.2% from 18 to 24, 27.2% from 25 to 44, 25.7% from 45 to 64, and 13.7% who were 65 years of age or older. The median age was 37 years. For every 100 females, there were 94.2 males. For every 100 females age 18 and over, there were 91.2 males.
The median income for a household in the city was $62,945, and the median income for a family was $71,945. Males had a median income of $50,945 versus $36,945 for females. The per capita income for the city was $30,945. About 4.2% of families and 5.7% of the population were below the poverty line, including 6.7% of those under age 18 and 4.2% of those age 65 or over.
Common Questions
What is Per Capita Income in Holladay?
Per Capita income in Holladay is $58,208.
What is the Median Family Income in Holladay?
Median Family Income in Holladay is $133,137.
What is the Median Household income in Holladay?
Median Household Income in Holladay is $106,099.
What is Income or Wage Gap in Holladay?
Income or Wage Gap in Holladay is 39.1%.
Women in Holladay earn 60.9 cents for every dollar earned by a man.
What is Family Income Deficit in Holladay?
Family Income Deficit in Holladay is $11,236.
Families that are below poverty line in Holladay earn $11,236 less on average than the poverty threshold level.
What is Inequality or Gini Index in Holladay?
Inequality or Gini Index in Holladay is 0.48.
What is the Total Population of Holladay?
Total Population of Holladay is 31,563.
What is the Total Male Population of Holladay?
Total Male Population of Holladay is 15,669.
What is the Total Female Population of Holladay?
Total Female Population of Holladay is 15,894.
What is the Ratio of Males per 100 Females in Holladay?
There are 98.58 Males per 100 Females in Holladay.
What is the Ratio of Females per 100 Males in Holladay?
There are 101.44 Females per 100 Males in Holladay.
What is the Median Population Age in Holladay?
Median Population Age in Holladay is 39.6 Years.
What is the Average Family Size in Holladay
Average Family Size in Holladay is 3.2 People.
What is the Average Household Size in Holladay
Average Household Size in Holladay is 2.7 People.
How Large is the Labor Force in Holladay?
There are 15,938 People in the Labor Forcein in Holladay.
What is the Percentage of People in the Labor Force in Holladay?
64.3% of People are in the Labor Force in Holladay.
What is the Unemployment Rate in Holladay?
Unemployment Rate in Holladay is 3.1%.