Riverton, UT Map & Demographics
Riverton Map
Riverton Overview
$39,442
PER CAPITA INCOME
$122,743
AVG FAMILY INCOME
$115,869
AVG HOUSEHOLD INCOME
50.5%
WAGE / INCOME GAP [ % ]
49.5¢/ $1
WAGE / INCOME GAP [ $ ]
0.36
INEQUALITY / GINI INDEX
44,864
TOTAL POPULATION
23,209
MALE POPULATION
21,655
FEMALE POPULATION
107.18
MALES / 100 FEMALES
93.30
FEMALES / 100 MALES
33.4
MEDIAN AGE
3.7
AVG FAMILY SIZE
3.4
AVG HOUSEHOLD SIZE
23,137
LABOR FORCE [ PEOPLE ]
72.3%
PERCENT IN LABOR FORCE
3.5%
UNEMPLOYMENT RATE
Riverton Zip Codes
Income in Riverton
Income Overview in Riverton
Per Capita Income in Riverton is $39,442, while median incomes of families and households are $122,743 and $115,869 respectively.
| Characteristic | Number | Measure |
| Per Capita Income | 44,864 | $39,442 |
| Median Family Income | 11,115 | $122,743 |
| Mean Family Income | 11,115 | $140,309 |
| Median Household Income | 13,185 | $115,869 |
| Mean Household Income | 13,185 | $132,243 |
| Income Deficit | 11,115 | $0 |
| Wage / Income Gap (%) | 44,864 | 50.48% |
| Wage / Income Gap ($) | 44,864 | 49.52¢ per $1 |
| Gini / Inequality Index | 44,864 | 0.36 |
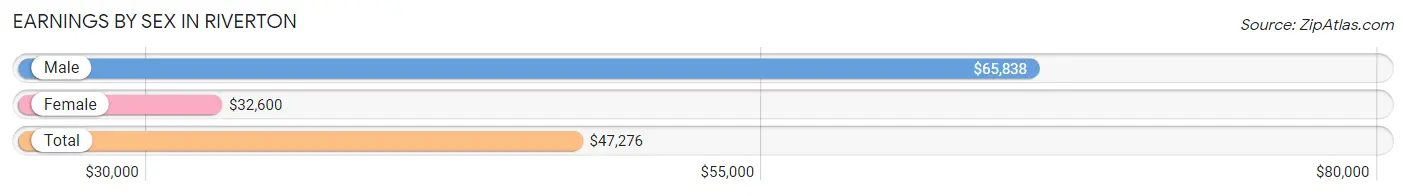
Earnings by Sex in Riverton
Average Earnings in Riverton are $47,276, $65,838 for men and $32,600 for women, a difference of 50.5%.
| Sex | Number | Average Earnings |
| Male | 13,506 (55.9%) | $65,838 |
| Female | 10,652 (44.1%) | $32,600 |
| Total | 24,158 (100.0%) | $47,276 |
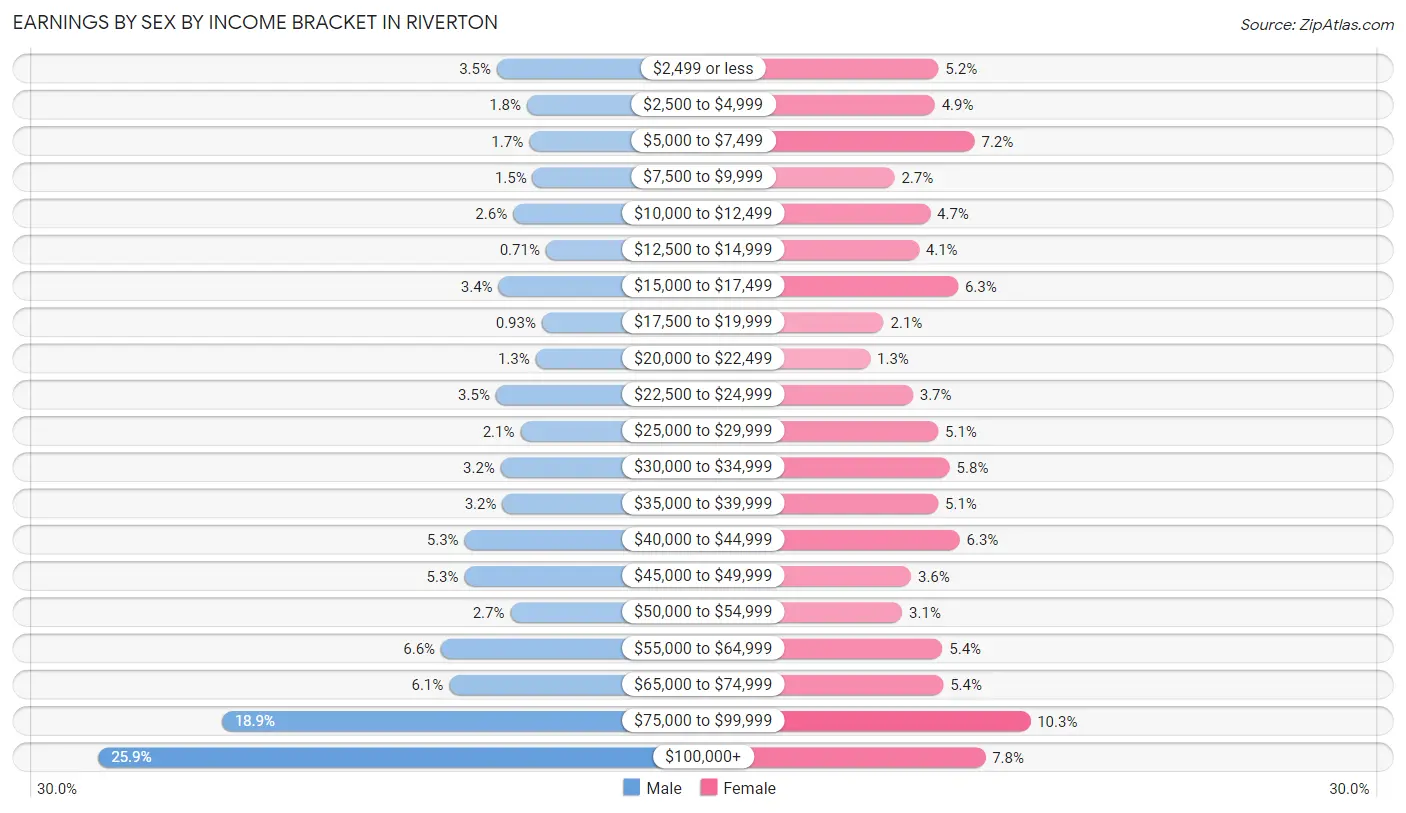
Earnings by Sex by Income Bracket in Riverton
The most common earnings brackets in Riverton are $100,000+ for men (3,492 | 25.9%) and $75,000 to $99,999 for women (1,098 | 10.3%).
| Income | Male | Female |
| $2,499 or less | 467 (3.5%) | 549 (5.1%) |
| $2,500 to $4,999 | 239 (1.8%) | 526 (4.9%) |
| $5,000 to $7,499 | 223 (1.7%) | 765 (7.2%) |
| $7,500 to $9,999 | 196 (1.5%) | 286 (2.7%) |
| $10,000 to $12,499 | 345 (2.5%) | 498 (4.7%) |
| $12,500 to $14,999 | 96 (0.7%) | 431 (4.1%) |
| $15,000 to $17,499 | 455 (3.4%) | 666 (6.2%) |
| $17,500 to $19,999 | 125 (0.9%) | 221 (2.1%) |
| $20,000 to $22,499 | 173 (1.3%) | 140 (1.3%) |
| $22,500 to $24,999 | 475 (3.5%) | 395 (3.7%) |
| $25,000 to $29,999 | 289 (2.1%) | 546 (5.1%) |
| $30,000 to $34,999 | 438 (3.2%) | 616 (5.8%) |
| $35,000 to $39,999 | 426 (3.2%) | 546 (5.1%) |
| $40,000 to $44,999 | 713 (5.3%) | 675 (6.3%) |
| $45,000 to $49,999 | 715 (5.3%) | 385 (3.6%) |
| $50,000 to $54,999 | 364 (2.7%) | 331 (3.1%) |
| $55,000 to $64,999 | 891 (6.6%) | 572 (5.4%) |
| $65,000 to $74,999 | 829 (6.1%) | 577 (5.4%) |
| $75,000 to $99,999 | 2,555 (18.9%) | 1,098 (10.3%) |
| $100,000+ | 3,492 (25.9%) | 829 (7.8%) |
| Total | 13,506 (100.0%) | 10,652 (100.0%) |
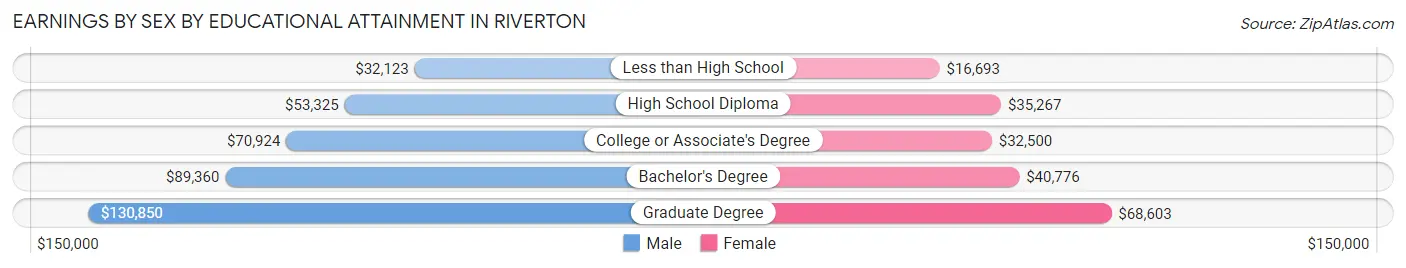
Earnings by Sex by Educational Attainment in Riverton
Average earnings in Riverton are $76,357 for men and $38,302 for women, a difference of 49.8%. Men with an educational attainment of graduate degree enjoy the highest average annual earnings of $130,850, while those with less than high school education earn the least with $32,123. Women with an educational attainment of graduate degree earn the most with the average annual earnings of $68,603, while those with less than high school education have the smallest earnings of $16,693.
| Educational Attainment | Male Income | Female Income |
| Less than High School | $32,123 | $16,693 |
| High School Diploma | $53,325 | $35,267 |
| College or Associate's Degree | $70,924 | $32,500 |
| Bachelor's Degree | $89,360 | $40,776 |
| Graduate Degree | $130,850 | $68,603 |
| Total | $76,357 | $38,302 |
Family Income in Riverton
Family Income Brackets in Riverton
According to the Riverton family income data, there are 2,656 families falling into the $100,000 to $149,999 income range, which is the most common income bracket and makes up 23.9% of all families. Conversely, the less than $10,000 income bracket is the least frequent group with only 33 families (0.3%) belonging to this category.
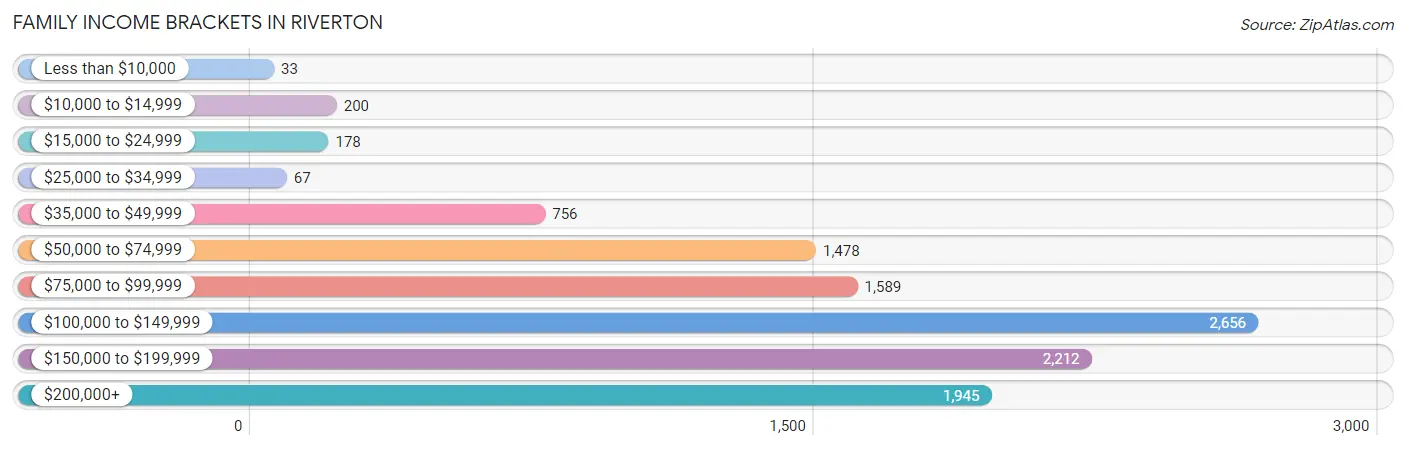
| Income Bracket | # Families | % Families |
| Less than $10,000 | 33 | 0.3% |
| $10,000 to $14,999 | 200 | 1.8% |
| $15,000 to $24,999 | 178 | 1.6% |
| $25,000 to $34,999 | 67 | 0.6% |
| $35,000 to $49,999 | 756 | 6.8% |
| $50,000 to $74,999 | 1,478 | 13.3% |
| $75,000 to $99,999 | 1,589 | 14.3% |
| $100,000 to $149,999 | 2,656 | 23.9% |
| $150,000 to $199,999 | 2,212 | 19.9% |
| $200,000+ | 1,945 | 17.5% |
Family Income by Famaliy Size in Riverton
6-person families (920 | 8.3%) account for the highest median family income in Riverton with $163,261 per family, while 3-person families (1,969 | 17.7%) have the highest median income of $45,133 per family member.
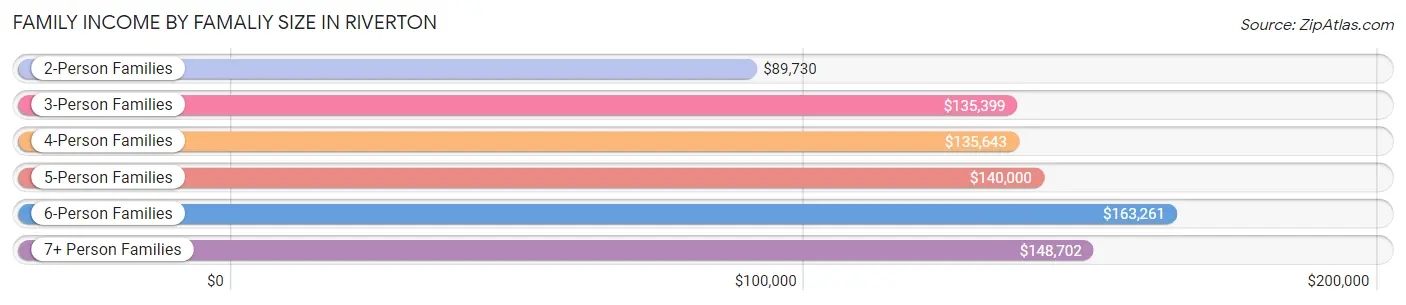
| Income Bracket | # Families | Median Income |
| 2-Person Families | 3,635 (32.7%) | $89,730 |
| 3-Person Families | 1,969 (17.7%) | $135,399 |
| 4-Person Families | 2,556 (23.0%) | $135,643 |
| 5-Person Families | 1,440 (13.0%) | $140,000 |
| 6-Person Families | 920 (8.3%) | $163,261 |
| 7+ Person Families | 595 (5.3%) | $148,702 |
| Total | 11,115 (100.0%) | $122,743 |
Family Income by Number of Earners in Riverton
The median family income in Riverton is $122,743, with families comprising 3+ earners (2,514) having the highest median family income of $172,763, while families with no earners (947) have the lowest median family income of $70,568, accounting for 22.6% and 8.5% of families, respectively.
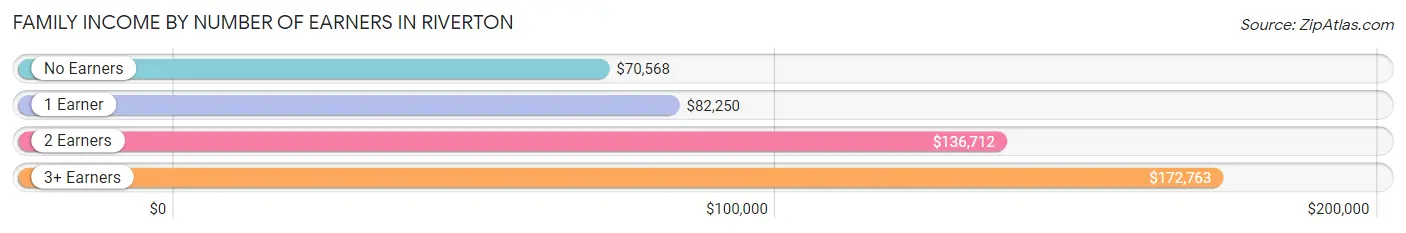
| Number of Earners | # Families | Median Income |
| No Earners | 947 (8.5%) | $70,568 |
| 1 Earner | 2,929 (26.4%) | $82,250 |
| 2 Earners | 4,725 (42.5%) | $136,712 |
| 3+ Earners | 2,514 (22.6%) | $172,763 |
| Total | 11,115 (100.0%) | $122,743 |
Household Income in Riverton
Household Income Brackets in Riverton
With 2,835 households falling in the category, the $100,000 to $149,999 income range is the most frequent in Riverton, accounting for 21.5% of all households. In contrast, only 53 households (0.4%) fall into the $10,000 to $14,999 income bracket, making it the least populous group.
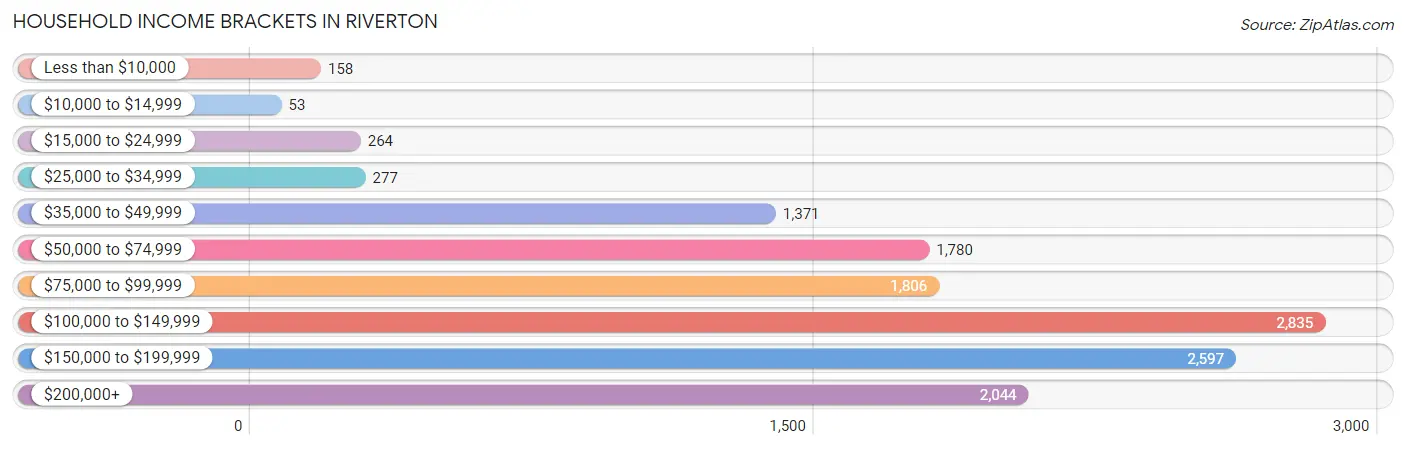
| Income Bracket | # Households | % Households |
| Less than $10,000 | 158 | 1.2% |
| $10,000 to $14,999 | 53 | 0.4% |
| $15,000 to $24,999 | 264 | 2.0% |
| $25,000 to $34,999 | 277 | 2.1% |
| $35,000 to $49,999 | 1,371 | 10.4% |
| $50,000 to $74,999 | 1,780 | 13.5% |
| $75,000 to $99,999 | 1,806 | 13.7% |
| $100,000 to $149,999 | 2,835 | 21.5% |
| $150,000 to $199,999 | 2,597 | 19.7% |
| $200,000+ | 2,044 | 15.5% |
Household Income by Householder Age in Riverton
The median household income in Riverton is $115,869, with the highest median household income of $137,500 found in the 45 to 64 years age bracket for the primary householder. A total of 4,842 households (36.7%) fall into this category. Meanwhile, the 65+ years age bracket for the primary householder has the lowest median household income of $66,643, with 2,514 households (19.1%) in this group.
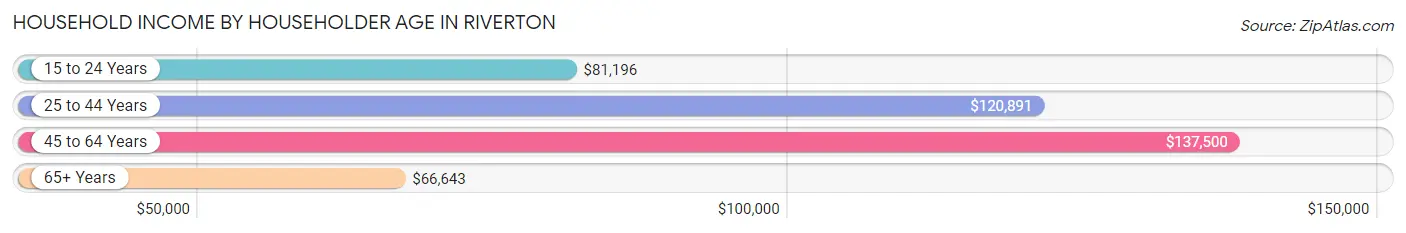
| Income Bracket | # Households | Median Income |
| 15 to 24 Years | 132 (1.0%) | $81,196 |
| 25 to 44 Years | 5,697 (43.2%) | $120,891 |
| 45 to 64 Years | 4,842 (36.7%) | $137,500 |
| 65+ Years | 2,514 (19.1%) | $66,643 |
| Total | 13,185 (100.0%) | $115,869 |
Poverty in Riverton
Income Below Poverty by Sex and Age in Riverton
With 2.9% poverty level for males and 4.2% for females among the residents of Riverton, under 5 year old males and 65 to 74 year old females are the most vulnerable to poverty, with 246 males (12.9%) and 139 females (8.4%) in their respective age groups living below the poverty level.
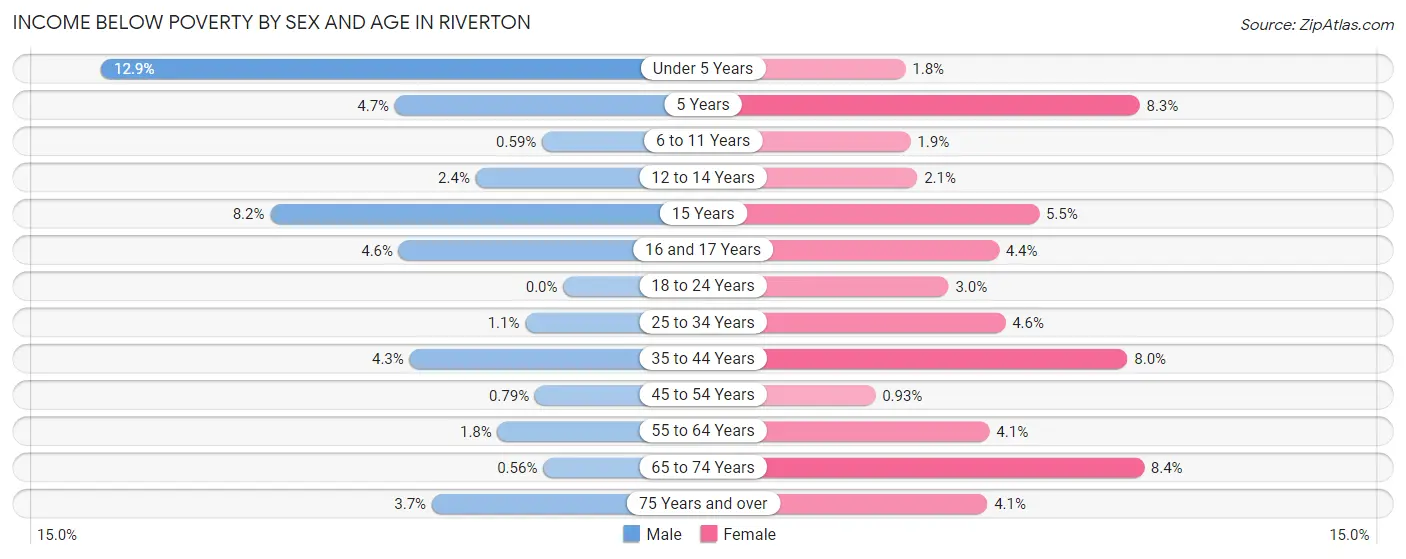
| Age Bracket | Male | Female |
| Under 5 Years | 246 (12.9%) | 34 (1.8%) |
| 5 Years | 22 (4.7%) | 31 (8.3%) |
| 6 to 11 Years | 16 (0.6%) | 42 (1.9%) |
| 12 to 14 Years | 33 (2.4%) | 24 (2.1%) |
| 15 Years | 39 (8.2%) | 13 (5.5%) |
| 16 and 17 Years | 33 (4.6%) | 21 (4.4%) |
| 18 to 24 Years | 0 (0.0%) | 43 (3.0%) |
| 25 to 34 Years | 34 (1.1%) | 138 (4.5%) |
| 35 to 44 Years | 152 (4.3%) | 272 (8.0%) |
| 45 to 54 Years | 23 (0.8%) | 22 (0.9%) |
| 55 to 64 Years | 42 (1.8%) | 100 (4.1%) |
| 65 to 74 Years | 8 (0.6%) | 139 (8.4%) |
| 75 Years and over | 21 (3.7%) | 36 (4.1%) |
| Total | 669 (2.9%) | 915 (4.2%) |
Income Above Poverty by Sex and Age in Riverton
According to the poverty statistics in Riverton, males aged 18 to 24 years and females aged 45 to 54 years are the age groups that are most secure financially, with 100.0% of males and 99.1% of females in these age groups living above the poverty line.
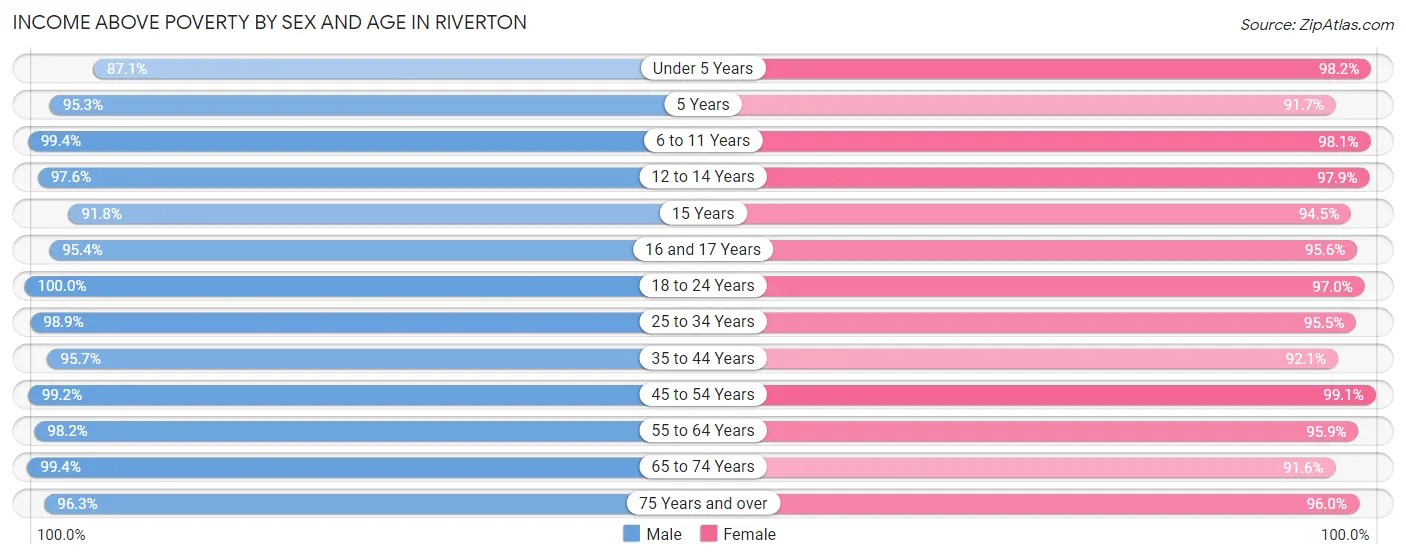
| Age Bracket | Male | Female |
| Under 5 Years | 1,666 (87.1%) | 1,882 (98.2%) |
| 5 Years | 447 (95.3%) | 343 (91.7%) |
| 6 to 11 Years | 2,707 (99.4%) | 2,159 (98.1%) |
| 12 to 14 Years | 1,317 (97.6%) | 1,120 (97.9%) |
| 15 Years | 439 (91.8%) | 224 (94.5%) |
| 16 and 17 Years | 688 (95.4%) | 460 (95.6%) |
| 18 to 24 Years | 1,574 (100.0%) | 1,404 (97.0%) |
| 25 to 34 Years | 3,188 (98.9%) | 2,896 (95.5%) |
| 35 to 44 Years | 3,402 (95.7%) | 3,151 (92.0%) |
| 45 to 54 Years | 2,873 (99.2%) | 2,345 (99.1%) |
| 55 to 64 Years | 2,248 (98.2%) | 2,333 (95.9%) |
| 65 to 74 Years | 1,431 (99.4%) | 1,513 (91.6%) |
| 75 Years and over | 552 (96.3%) | 853 (96.0%) |
| Total | 22,532 (97.1%) | 20,683 (95.8%) |
Income Below Poverty Among Married-Couple Families in Riverton
The poverty statistics for married-couple families in Riverton show that 0.8% or 76 of the total 9,555 families live below the poverty line. Families with 1 or 2 children have the highest poverty rate of 1.2%, comprising of 38 families. On the other hand, families with 5 or more children have the lowest poverty rate of 0.0%, which includes 0 families.
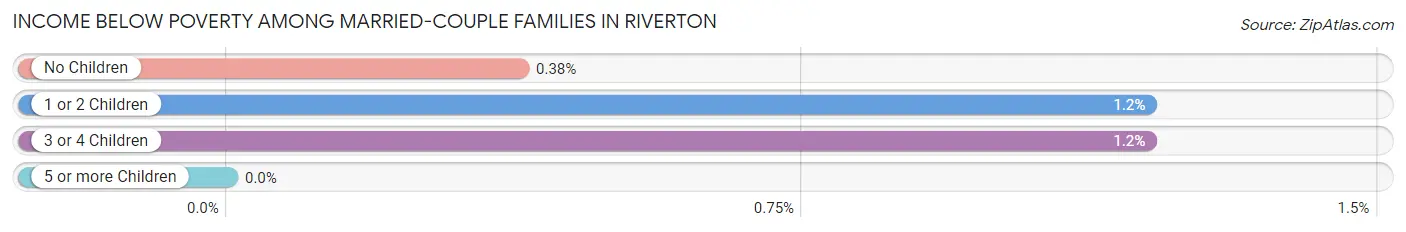
| Children | Above Poverty | Below Poverty |
| No Children | 4,243 (99.6%) | 16 (0.4%) |
| 1 or 2 Children | 3,137 (98.8%) | 38 (1.2%) |
| 3 or 4 Children | 1,806 (98.8%) | 22 (1.2%) |
| 5 or more Children | 293 (100.0%) | 0 (0.0%) |
| Total | 9,479 (99.2%) | 76 (0.8%) |
Income Below Poverty Among Single-Parent Households in Riverton
According to the poverty data in Riverton, 2.4% or 11 single-father households and 20.0% or 222 single-mother households are living below the poverty line. Among single-father households, those with 1 or 2 children have the highest poverty rate, with 11 households (9.1%) experiencing poverty. Likewise, among single-mother households, those with 3 or 4 children have the highest poverty rate, with 16 households (61.5%) falling below the poverty line.
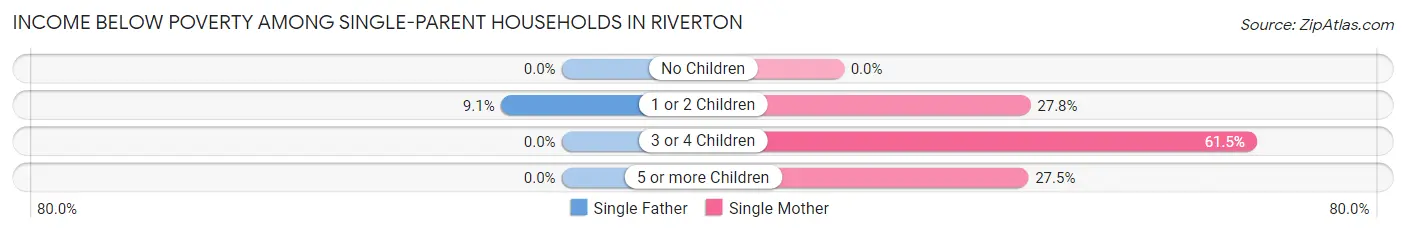
| Children | Single Father | Single Mother |
| No Children | 0 (0.0%) | 0 (0.0%) |
| 1 or 2 Children | 11 (9.1%) | 195 (27.8%) |
| 3 or 4 Children | 0 (0.0%) | 16 (61.5%) |
| 5 or more Children | 0 (0.0%) | 11 (27.5%) |
| Total | 11 (2.4%) | 222 (20.0%) |
Income Below Poverty Among Married-Couple vs Single-Parent Households in Riverton
The poverty data for Riverton shows that 76 of the married-couple family households (0.8%) and 233 of the single-parent households (14.9%) are living below the poverty level. Within the married-couple family households, those with 1 or 2 children have the highest poverty rate, with 38 households (1.2%) falling below the poverty line. Among the single-parent households, those with 3 or 4 children have the highest poverty rate, with 16 household (28.6%) living below poverty.
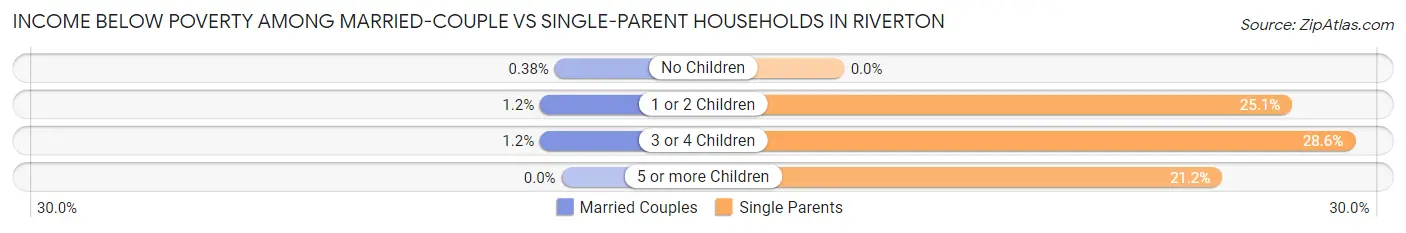
| Children | Married-Couple Families | Single-Parent Households |
| No Children | 16 (0.4%) | 0 (0.0%) |
| 1 or 2 Children | 38 (1.2%) | 206 (25.1%) |
| 3 or 4 Children | 22 (1.2%) | 16 (28.6%) |
| 5 or more Children | 0 (0.0%) | 11 (21.1%) |
| Total | 76 (0.8%) | 233 (14.9%) |
Race in Riverton
The most populous races in Riverton are White / Caucasian (39,310 | 87.6%), Hispanic or Latino (4,714 | 10.5%), and Two or more Races (1,899 | 4.2%).
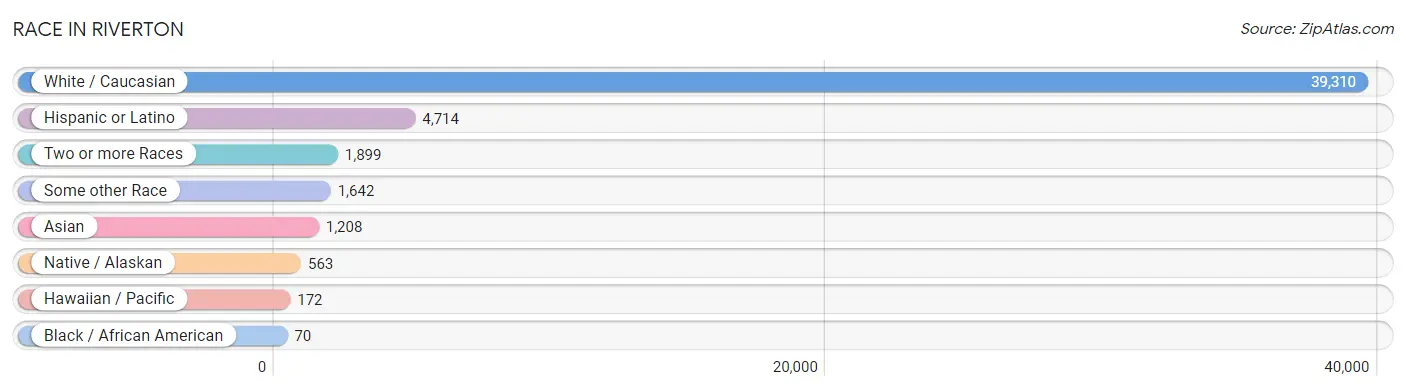
| Race | # Population | % Population |
| Asian | 1,208 | 2.7% |
| Black / African American | 70 | 0.2% |
| Hawaiian / Pacific | 172 | 0.4% |
| Hispanic or Latino | 4,714 | 10.5% |
| Native / Alaskan | 563 | 1.3% |
| White / Caucasian | 39,310 | 87.6% |
| Two or more Races | 1,899 | 4.2% |
| Some other Race | 1,642 | 3.7% |
| Total | 44,864 | 100.0% |
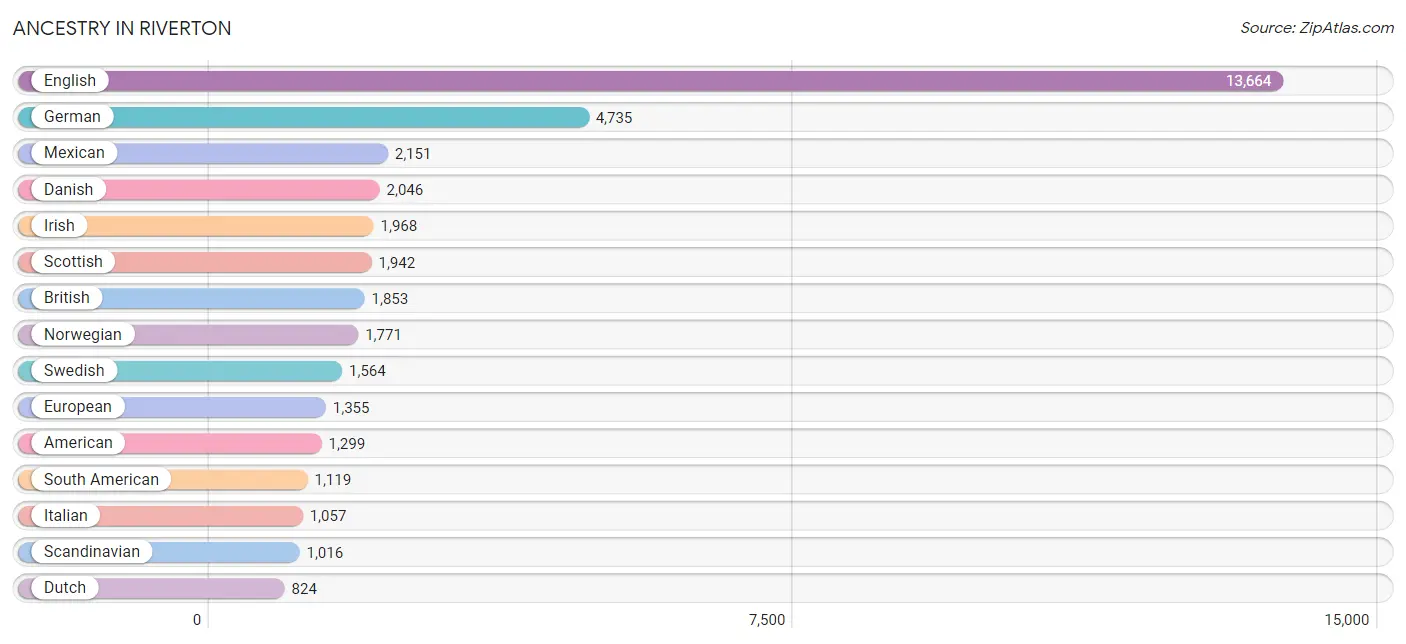
Ancestry in Riverton
The most populous ancestries reported in Riverton are English (13,664 | 30.5%), German (4,735 | 10.5%), Mexican (2,151 | 4.8%), Danish (2,046 | 4.6%), and Irish (1,968 | 4.4%), together accounting for 54.7% of all Riverton residents.
| Ancestry | # Population | % Population |
| African | 14 | 0.0% |
| American | 1,299 | 2.9% |
| Arab | 25 | 0.1% |
| Argentinean | 19 | 0.0% |
| Armenian | 6 | 0.0% |
| Australian | 104 | 0.2% |
| Austrian | 29 | 0.1% |
| Basque | 7 | 0.0% |
| Belgian | 72 | 0.2% |
| Bhutanese | 76 | 0.2% |
| Bolivian | 6 | 0.0% |
| Brazilian | 13 | 0.0% |
| British | 1,853 | 4.1% |
| Burmese | 39 | 0.1% |
| Canadian | 138 | 0.3% |
| Central American | 313 | 0.7% |
| Cherokee | 62 | 0.1% |
| Colombian | 283 | 0.6% |
| Costa Rican | 31 | 0.1% |
| Croatian | 9 | 0.0% |
| Cuban | 3 | 0.0% |
| Czech | 152 | 0.3% |
| Czechoslovakian | 25 | 0.1% |
| Danish | 2,046 | 4.6% |
| Dutch | 824 | 1.8% |
| Eastern European | 7 | 0.0% |
| Ecuadorian | 5 | 0.0% |
| English | 13,664 | 30.5% |
| European | 1,355 | 3.0% |
| Filipino | 64 | 0.1% |
| Finnish | 8 | 0.0% |
| French | 529 | 1.2% |
| French Canadian | 27 | 0.1% |
| German | 4,735 | 10.5% |
| Greek | 259 | 0.6% |
| Guatemalan | 67 | 0.2% |
| Honduran | 6 | 0.0% |
| Hungarian | 72 | 0.2% |
| Icelander | 76 | 0.2% |
| Indian (Asian) | 239 | 0.5% |
| Iranian | 64 | 0.1% |
| Irish | 1,968 | 4.4% |
| Iroquois | 48 | 0.1% |
| Italian | 1,057 | 2.4% |
| Korean | 212 | 0.5% |
| Lebanese | 12 | 0.0% |
| Lithuanian | 8 | 0.0% |
| Mexican | 2,151 | 4.8% |
| Mexican American Indian | 17 | 0.0% |
| Native Hawaiian | 105 | 0.2% |
| Navajo | 68 | 0.2% |
| Northern European | 140 | 0.3% |
| Norwegian | 1,771 | 4.0% |
| Pakistani | 25 | 0.1% |
| Pennsylvania German | 15 | 0.0% |
| Peruvian | 8 | 0.0% |
| Pima | 87 | 0.2% |
| Polish | 203 | 0.4% |
| Portuguese | 59 | 0.1% |
| Puerto Rican | 526 | 1.2% |
| Romanian | 22 | 0.1% |
| Russian | 172 | 0.4% |
| Salvadoran | 195 | 0.4% |
| Samoan | 197 | 0.4% |
| Scandinavian | 1,016 | 2.3% |
| Scotch-Irish | 216 | 0.5% |
| Scottish | 1,942 | 4.3% |
| Shoshone | 274 | 0.6% |
| Slovak | 12 | 0.0% |
| South American | 1,119 | 2.5% |
| Spaniard | 73 | 0.2% |
| Spanish | 421 | 0.9% |
| Sri Lankan | 513 | 1.1% |
| Subsaharan African | 14 | 0.0% |
| Swedish | 1,564 | 3.5% |
| Swiss | 488 | 1.1% |
| Thai | 363 | 0.8% |
| Tongan | 38 | 0.1% |
| Venezuelan | 798 | 1.8% |
| Welsh | 484 | 1.1% |
| Yugoslavian | 18 | 0.0% |
| Yup'ik | 16 | 0.0% | View All 82 Rows |
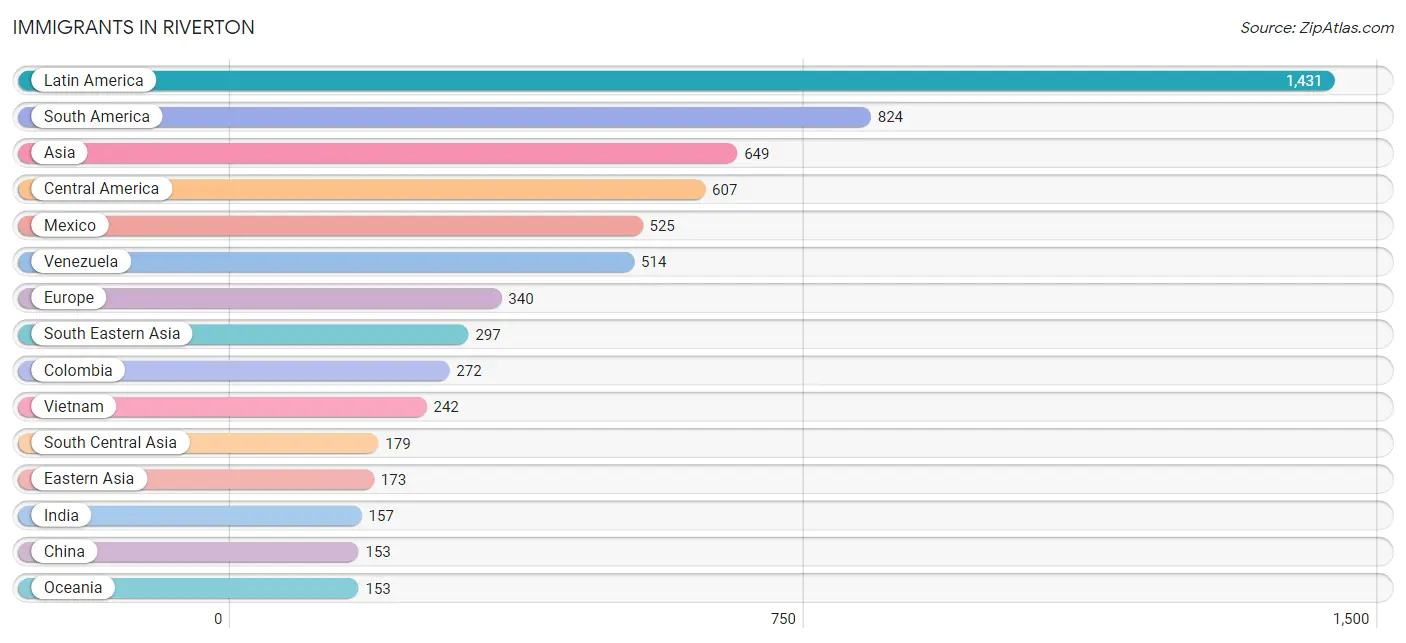
Immigrants in Riverton
The most numerous immigrant groups reported in Riverton came from Latin America (1,431 | 3.2%), South America (824 | 1.8%), Asia (649 | 1.5%), Central America (607 | 1.3%), and Mexico (525 | 1.2%), together accounting for 9.0% of all Riverton residents.
| Immigration Origin | # Population | % Population |
| Asia | 649 | 1.5% |
| Australia | 50 | 0.1% |
| Bolivia | 5 | 0.0% |
| Brazil | 25 | 0.1% |
| Canada | 66 | 0.2% |
| Central America | 607 | 1.3% |
| China | 153 | 0.3% |
| Colombia | 272 | 0.6% |
| Eastern Asia | 173 | 0.4% |
| Eastern Europe | 119 | 0.3% |
| El Salvador | 54 | 0.1% |
| England | 78 | 0.2% |
| Europe | 340 | 0.8% |
| Germany | 51 | 0.1% |
| Guatemala | 22 | 0.1% |
| Honduras | 6 | 0.0% |
| Hong Kong | 102 | 0.2% |
| Hungary | 40 | 0.1% |
| India | 157 | 0.4% |
| Indonesia | 13 | 0.0% |
| Italy | 9 | 0.0% |
| Korea | 20 | 0.0% |
| Latin America | 1,431 | 3.2% |
| Mexico | 525 | 1.2% |
| Northern Europe | 139 | 0.3% |
| Oceania | 153 | 0.3% |
| Pakistan | 11 | 0.0% |
| Peru | 8 | 0.0% |
| Philippines | 42 | 0.1% |
| Poland | 16 | 0.0% |
| Portugal | 9 | 0.0% |
| Romania | 9 | 0.0% |
| Russia | 54 | 0.1% |
| Scotland | 9 | 0.0% |
| South America | 824 | 1.8% |
| South Central Asia | 179 | 0.4% |
| South Eastern Asia | 297 | 0.7% |
| Southern Europe | 31 | 0.1% |
| Spain | 13 | 0.0% |
| Sri Lanka | 11 | 0.0% |
| Sweden | 12 | 0.0% |
| Taiwan | 16 | 0.0% |
| Venezuela | 514 | 1.1% |
| Vietnam | 242 | 0.5% |
| Western Europe | 51 | 0.1% | View All 45 Rows |
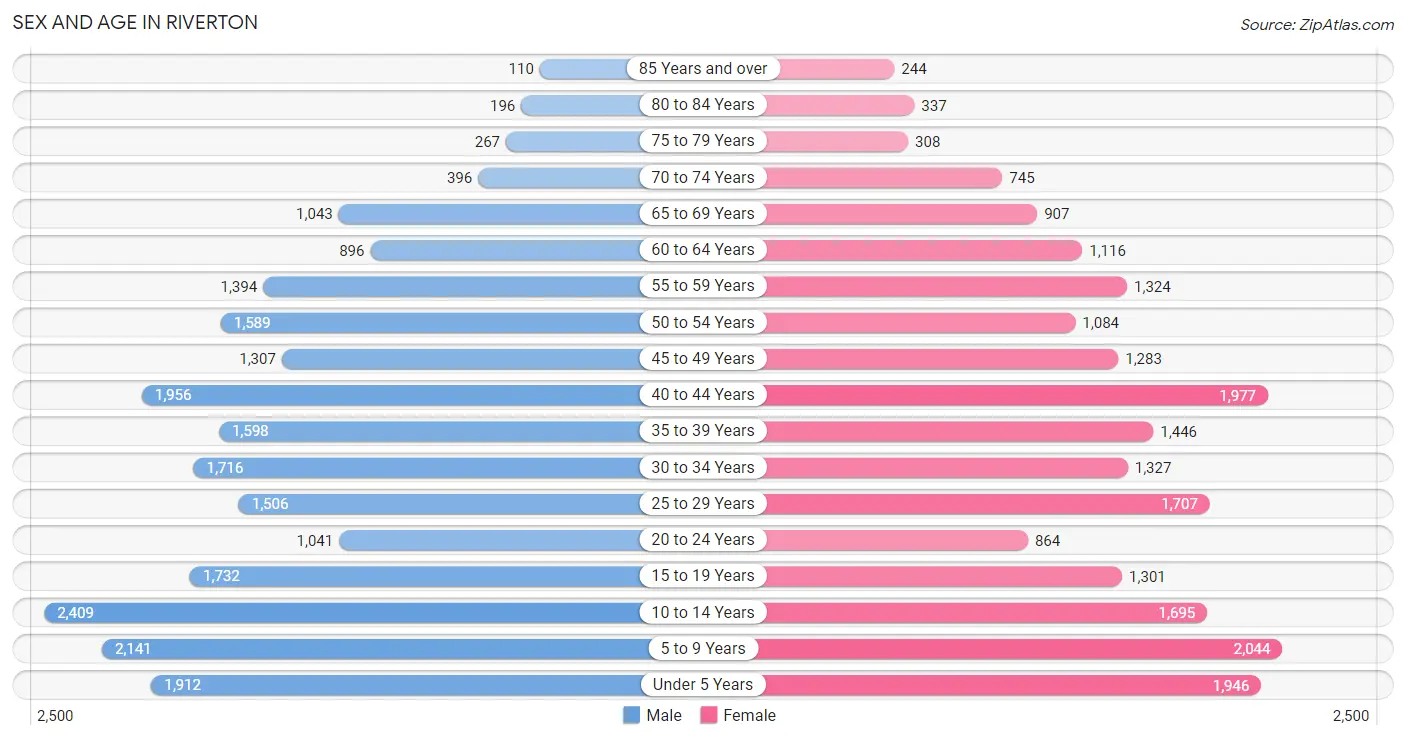
Sex and Age in Riverton
Sex and Age in Riverton
The most populous age groups in Riverton are 10 to 14 Years (2,409 | 10.4%) for men and 5 to 9 Years (2,044 | 9.4%) for women.
| Age Bracket | Male | Female |
| Under 5 Years | 1,912 (8.2%) | 1,946 (9.0%) |
| 5 to 9 Years | 2,141 (9.2%) | 2,044 (9.4%) |
| 10 to 14 Years | 2,409 (10.4%) | 1,695 (7.8%) |
| 15 to 19 Years | 1,732 (7.5%) | 1,301 (6.0%) |
| 20 to 24 Years | 1,041 (4.5%) | 864 (4.0%) |
| 25 to 29 Years | 1,506 (6.5%) | 1,707 (7.9%) |
| 30 to 34 Years | 1,716 (7.4%) | 1,327 (6.1%) |
| 35 to 39 Years | 1,598 (6.9%) | 1,446 (6.7%) |
| 40 to 44 Years | 1,956 (8.4%) | 1,977 (9.1%) |
| 45 to 49 Years | 1,307 (5.6%) | 1,283 (5.9%) |
| 50 to 54 Years | 1,589 (6.9%) | 1,084 (5.0%) |
| 55 to 59 Years | 1,394 (6.0%) | 1,324 (6.1%) |
| 60 to 64 Years | 896 (3.9%) | 1,116 (5.1%) |
| 65 to 69 Years | 1,043 (4.5%) | 907 (4.2%) |
| 70 to 74 Years | 396 (1.7%) | 745 (3.4%) |
| 75 to 79 Years | 267 (1.1%) | 308 (1.4%) |
| 80 to 84 Years | 196 (0.8%) | 337 (1.6%) |
| 85 Years and over | 110 (0.5%) | 244 (1.1%) |
| Total | 23,209 (100.0%) | 21,655 (100.0%) |
Families and Households in Riverton
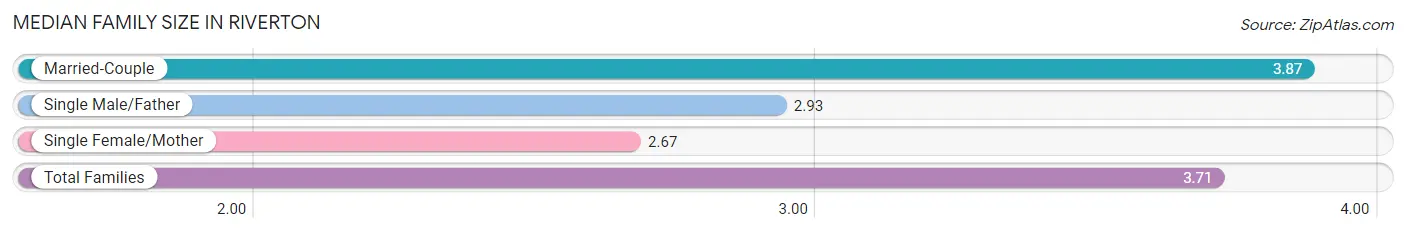
Median Family Size in Riverton
The median family size in Riverton is 3.71 persons per family, with married-couple families (9,555 | 86.0%) accounting for the largest median family size of 3.87 persons per family. On the other hand, single female/mother families (1,110 | 10.0%) represent the smallest median family size with 2.67 persons per family.
| Family Type | # Families | Family Size |
| Married-Couple | 9,555 (86.0%) | 3.87 |
| Single Male/Father | 450 (4.1%) | 2.93 |
| Single Female/Mother | 1,110 (10.0%) | 2.67 |
| Total Families | 11,115 (100.0%) | 3.71 |
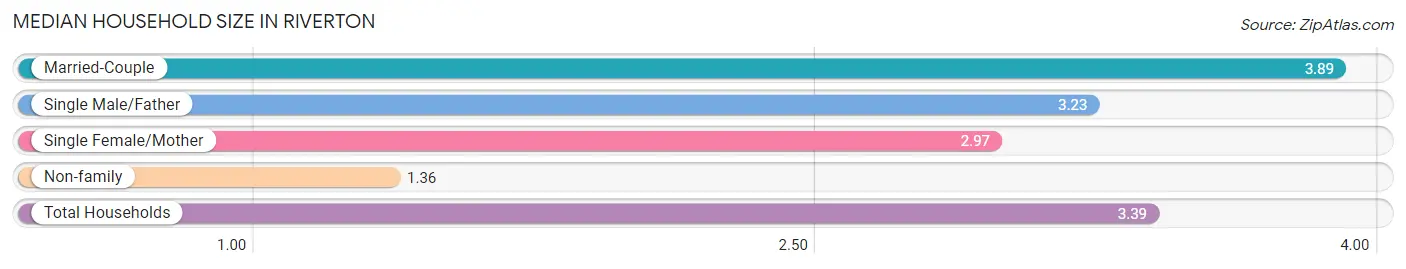
Median Household Size in Riverton
The median household size in Riverton is 3.39 persons per household, with married-couple households (9,555 | 72.5%) accounting for the largest median household size of 3.89 persons per household. non-family households (2,070 | 15.7%) represent the smallest median household size with 1.36 persons per household.
| Household Type | # Households | Household Size |
| Married-Couple | 9,555 (72.5%) | 3.89 |
| Single Male/Father | 450 (3.4%) | 3.23 |
| Single Female/Mother | 1,110 (8.4%) | 2.97 |
| Non-family | 2,070 (15.7%) | 1.36 |
| Total Households | 13,185 (100.0%) | 3.39 |
Household Size by Marriage Status in Riverton
Out of a total of 13,185 households in Riverton, 11,115 (84.3%) are family households, while 2,070 (15.7%) are nonfamily households. The most numerous type of family households are 2-person households, comprising 3,177, and the most common type of nonfamily households are 1-person households, comprising 1,727.
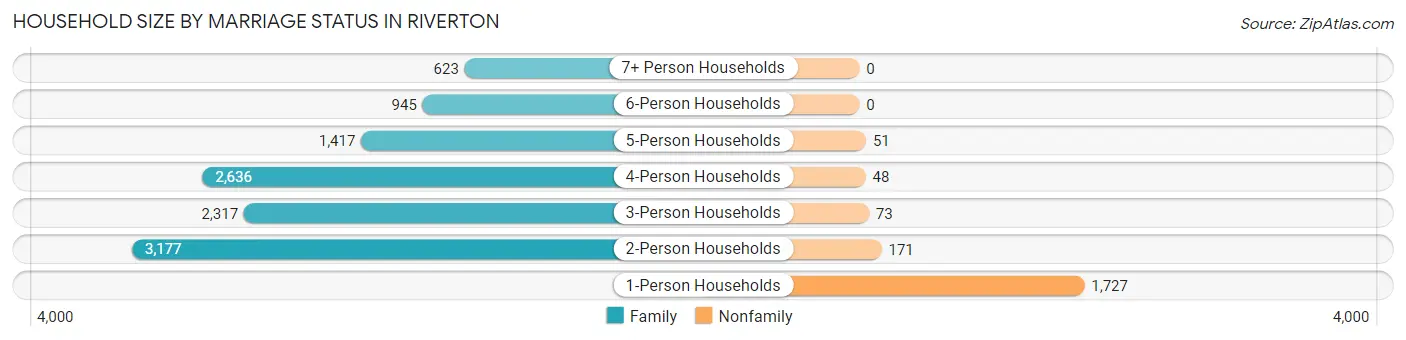
| Household Size | Family Households | Nonfamily Households |
| 1-Person Households | - | 1,727 (13.1%) |
| 2-Person Households | 3,177 (24.1%) | 171 (1.3%) |
| 3-Person Households | 2,317 (17.6%) | 73 (0.5%) |
| 4-Person Households | 2,636 (20.0%) | 48 (0.4%) |
| 5-Person Households | 1,417 (10.7%) | 51 (0.4%) |
| 6-Person Households | 945 (7.2%) | 0 (0.0%) |
| 7+ Person Households | 623 (4.7%) | 0 (0.0%) |
| Total | 11,115 (84.3%) | 2,070 (15.7%) |
Female Fertility in Riverton
Fertility by Age in Riverton
Average fertility rate in Riverton is 65.0 births per 1,000 women. Women in the age bracket of 20 to 34 years have the highest fertility rate with 145.0 births per 1,000 women. Women in the age bracket of 20 to 34 years acount for 85.6% of all women with births.
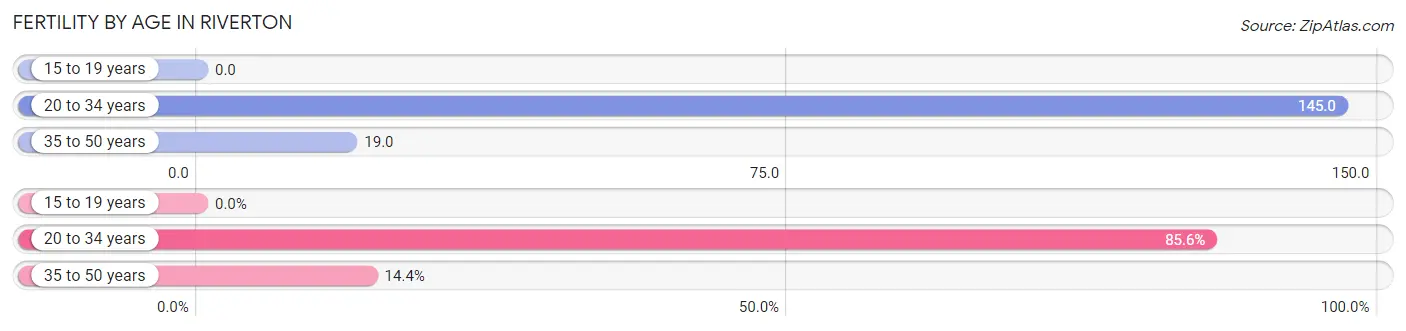
| Age Bracket | Women with Births | Births / 1,000 Women |
| 15 to 19 years | 0 (0.0%) | 0.0 |
| 20 to 34 years | 565 (85.6%) | 145.0 |
| 35 to 50 years | 95 (14.4%) | 19.0 |
| Total | 660 (100.0%) | 65.0 |
Fertility by Age by Marriage Status in Riverton
95.6% of women with births (660) in Riverton are married. The highest percentage of unmarried women with births falls into 35 to 50 years age bracket with 13.7% of them unmarried at the time of birth, while the lowest percentage of unmarried women with births belong to 20 to 34 years age bracket with 2.8% of them unmarried.
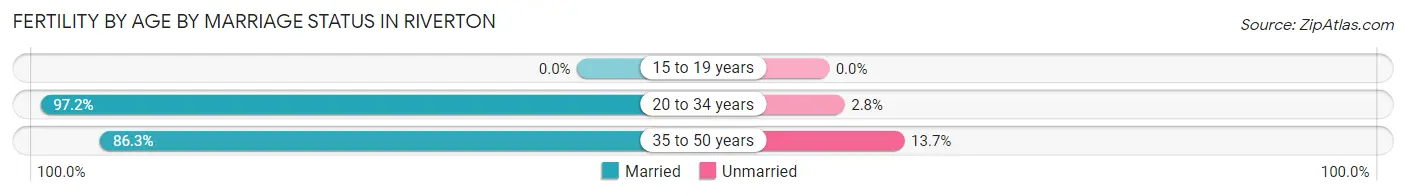
| Age Bracket | Married | Unmarried |
| 15 to 19 years | 0 (0.0%) | 0 (0.0%) |
| 20 to 34 years | 549 (97.2%) | 16 (2.8%) |
| 35 to 50 years | 82 (86.3%) | 13 (13.7%) |
| Total | 631 (95.6%) | 29 (4.4%) |
Fertility by Education in Riverton
Average fertility rate in Riverton is 65.0 births per 1,000 women. Women with the education attainment of bachelor's degree have the highest fertility rate of 105.0 births per 1,000 women, while women with the education attainment of less than high school have the lowest fertility at 10.0 births per 1,000 women. Women with the education attainment of bachelor's degree represent 37.3% of all women with births.
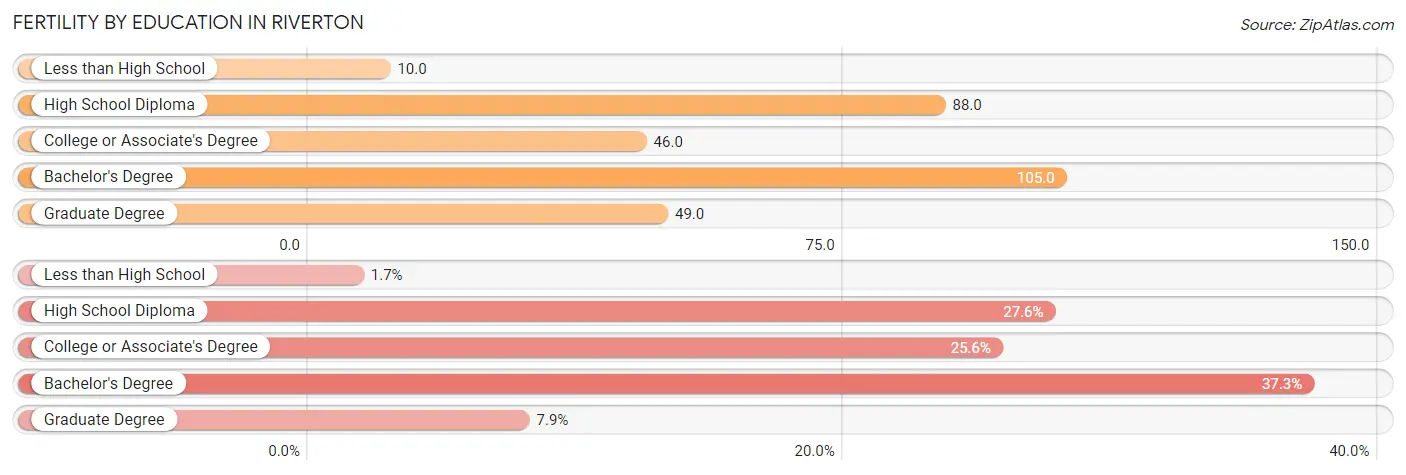
| Educational Attainment | Women with Births | Births / 1,000 Women |
| Less than High School | 11 (1.7%) | 10.0 |
| High School Diploma | 182 (27.6%) | 88.0 |
| College or Associate's Degree | 169 (25.6%) | 46.0 |
| Bachelor's Degree | 246 (37.3%) | 105.0 |
| Graduate Degree | 52 (7.9%) | 49.0 |
| Total | 660 (100.0%) | 65.0 |
Fertility by Education by Marriage Status in Riverton
4.4% of women with births in Riverton are unmarried. Women with the educational attainment of high school diploma are most likely to be married with 100.0% of them married at childbirth, while women with the educational attainment of less than high school are least likely to be married with 100.0% of them unmarried at childbirth.
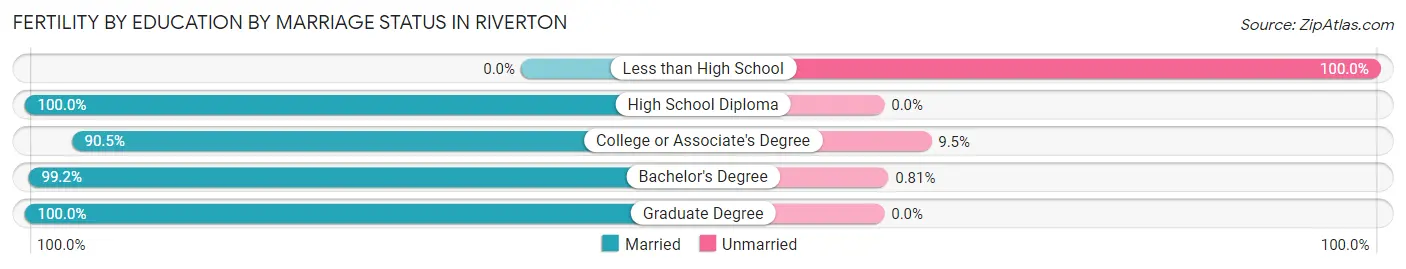
| Educational Attainment | Married | Unmarried |
| Less than High School | 0 (0.0%) | 11 (100.0%) |
| High School Diploma | 182 (100.0%) | 0 (0.0%) |
| College or Associate's Degree | 153 (90.5%) | 16 (9.5%) |
| Bachelor's Degree | 244 (99.2%) | 2 (0.8%) |
| Graduate Degree | 52 (100.0%) | 0 (0.0%) |
| Total | 631 (95.6%) | 29 (4.4%) |
Employment Characteristics in Riverton
Employment by Class of Employer in Riverton
Among the 22,102 employed individuals in Riverton, private company employees (14,721 | 66.6%), not-for-profit organizations (1,615 | 7.3%), and self-employed (incorporated) (1,447 | 6.6%) make up the most common classes of employment.
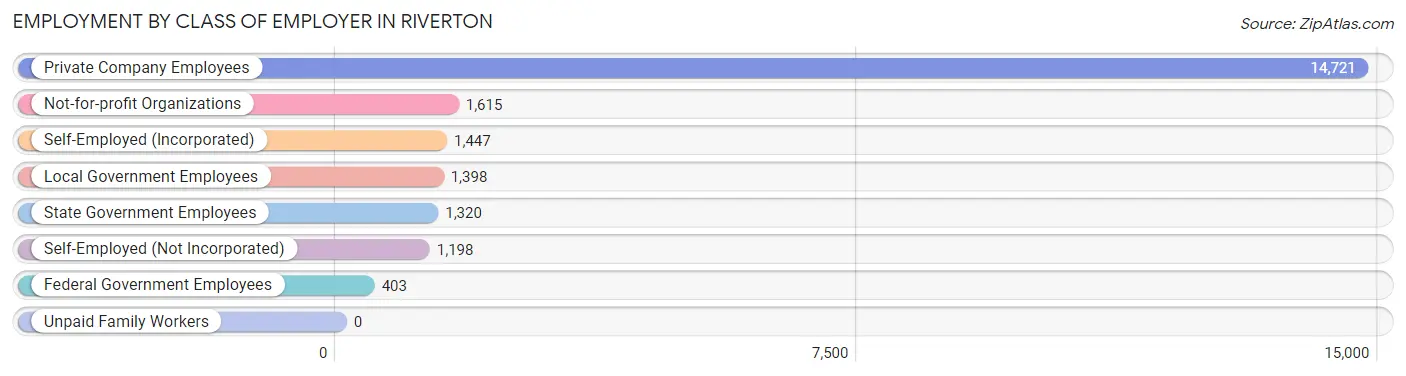
| Employer Class | # Employees | % Employees |
| Private Company Employees | 14,721 | 66.6% |
| Self-Employed (Incorporated) | 1,447 | 6.6% |
| Self-Employed (Not Incorporated) | 1,198 | 5.4% |
| Not-for-profit Organizations | 1,615 | 7.3% |
| Local Government Employees | 1,398 | 6.3% |
| State Government Employees | 1,320 | 6.0% |
| Federal Government Employees | 403 | 1.8% |
| Unpaid Family Workers | 0 | 0.0% |
| Total | 22,102 | 100.0% |
Employment Status by Age in Riverton
According to the labor force statistics for Riverton, out of the total population over 16 years of age (32,002), 72.3% or 23,137 individuals are in the labor force, with 3.5% or 810 of them unemployed. The age group with the highest labor force participation rate is 25 to 29 years, with 89.7% or 2,882 individuals in the labor force. Within the labor force, the 16 to 19 years age range has the highest percentage of unemployed individuals, with 9.5% or 131 of them being unemployed.
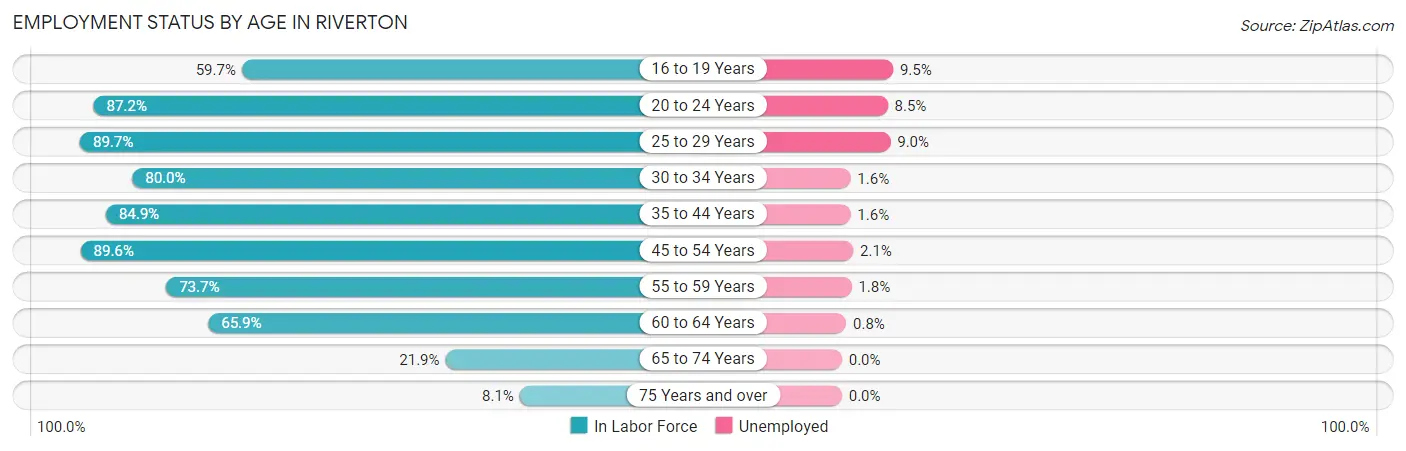
| Age Bracket | In Labor Force | Unemployed |
| 16 to 19 Years | 1,384 (59.7%) | 131 (9.5%) |
| 20 to 24 Years | 1,661 (87.2%) | 141 (8.5%) |
| 25 to 29 Years | 2,882 (89.7%) | 259 (9.0%) |
| 30 to 34 Years | 2,434 (80.0%) | 39 (1.6%) |
| 35 to 44 Years | 5,923 (84.9%) | 95 (1.6%) |
| 45 to 54 Years | 4,716 (89.6%) | 99 (2.1%) |
| 55 to 59 Years | 2,003 (73.7%) | 36 (1.8%) |
| 60 to 64 Years | 1,326 (65.9%) | 11 (0.8%) |
| 65 to 74 Years | 677 (21.9%) | 0 (0.0%) |
| 75 Years and over | 118 (8.1%) | 0 (0.0%) |
| Total | 23,137 (72.3%) | 810 (3.5%) |
Employment Status by Educational Attainment in Riverton
According to labor force statistics for Riverton, 83.0% of individuals (19,278) out of the total population between 25 and 64 years of age (23,226) are in the labor force, with 2.8% or 540 of them being unemployed. The group with the highest labor force participation rate are those with the educational attainment of less than high school, with 87.0% or 1,537 individuals in the labor force. Within the labor force, individuals with college / associate degree education have the highest percentage of unemployment, with 5.1% or 348 of them being unemployed.
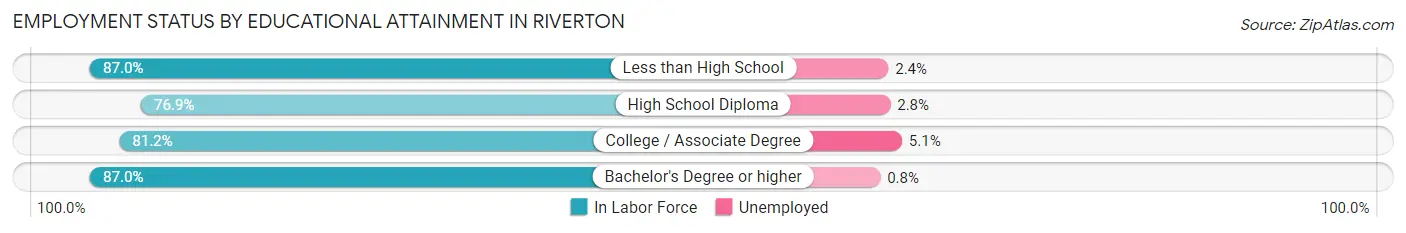
| Educational Attainment | In Labor Force | Unemployed |
| Less than High School | 1,537 (87.0%) | 42 (2.4%) |
| High School Diploma | 3,275 (76.9%) | 119 (2.8%) |
| College / Associate Degree | 6,823 (81.2%) | 429 (5.1%) |
| Bachelor's Degree or higher | 7,653 (87.0%) | 70 (0.8%) |
| Total | 19,278 (83.0%) | 650 (2.8%) |
Employment Occupations by Sex in Riverton
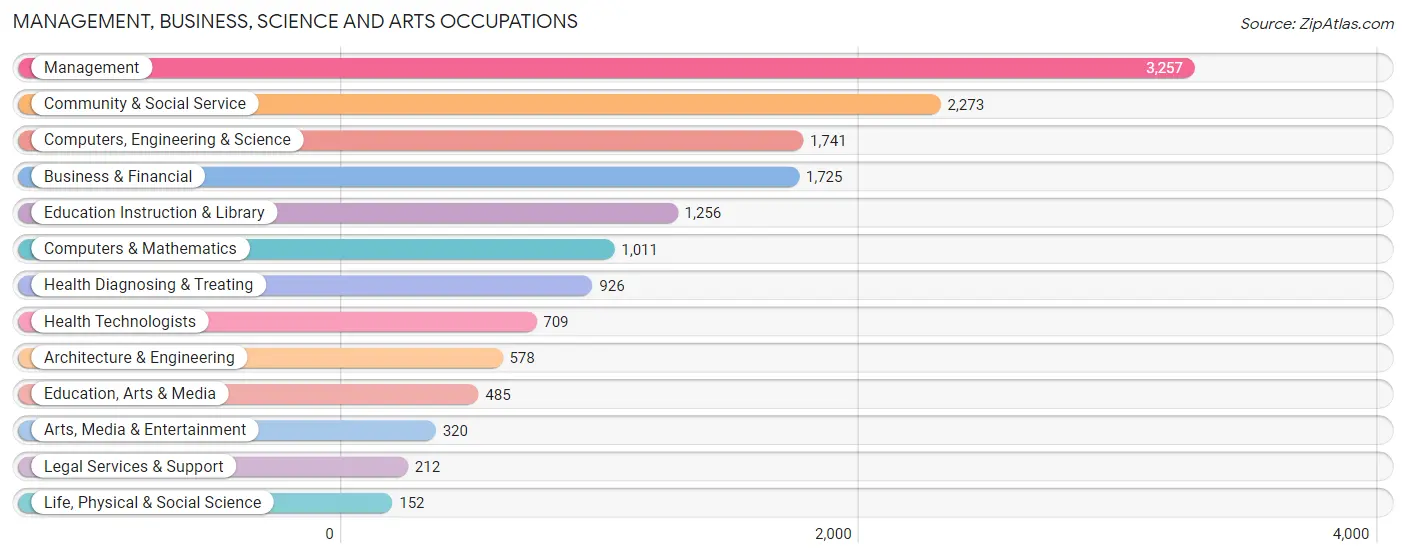
Management, Business, Science and Arts Occupations
The most common Management, Business, Science and Arts occupations in Riverton are Management (3,257 | 14.6%), Community & Social Service (2,273 | 10.2%), Computers, Engineering & Science (1,741 | 7.8%), Business & Financial (1,725 | 7.7%), and Education Instruction & Library (1,256 | 5.6%).
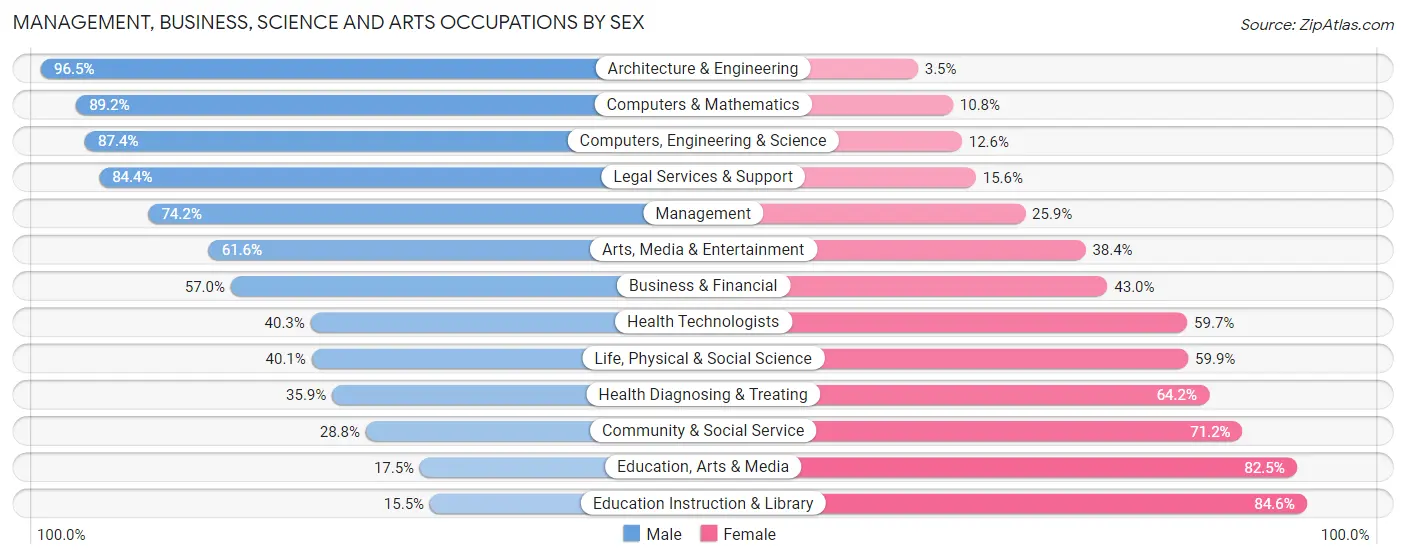
Management, Business, Science and Arts Occupations by Sex
Within the Management, Business, Science and Arts occupations in Riverton, the most male-oriented occupations are Architecture & Engineering (96.5%), Computers & Mathematics (89.2%), and Computers, Engineering & Science (87.4%), while the most female-oriented occupations are Education Instruction & Library (84.6%), Education, Arts & Media (82.5%), and Community & Social Service (71.2%).
| Occupation | Male | Female |
| Management | 2,415 (74.2%) | 842 (25.9%) |
| Business & Financial | 983 (57.0%) | 742 (43.0%) |
| Computers, Engineering & Science | 1,521 (87.4%) | 220 (12.6%) |
| Computers & Mathematics | 902 (89.2%) | 109 (10.8%) |
| Architecture & Engineering | 558 (96.5%) | 20 (3.5%) |
| Life, Physical & Social Science | 61 (40.1%) | 91 (59.9%) |
| Community & Social Service | 655 (28.8%) | 1,618 (71.2%) |
| Education, Arts & Media | 85 (17.5%) | 400 (82.5%) |
| Legal Services & Support | 179 (84.4%) | 33 (15.6%) |
| Education Instruction & Library | 194 (15.4%) | 1,062 (84.6%) |
| Arts, Media & Entertainment | 197 (61.6%) | 123 (38.4%) |
| Health Diagnosing & Treating | 332 (35.8%) | 594 (64.1%) |
| Health Technologists | 286 (40.3%) | 423 (59.7%) |
| Total (Category) | 5,906 (59.5%) | 4,016 (40.5%) |
| Total (Overall) | 12,667 (56.9%) | 9,616 (43.1%) |
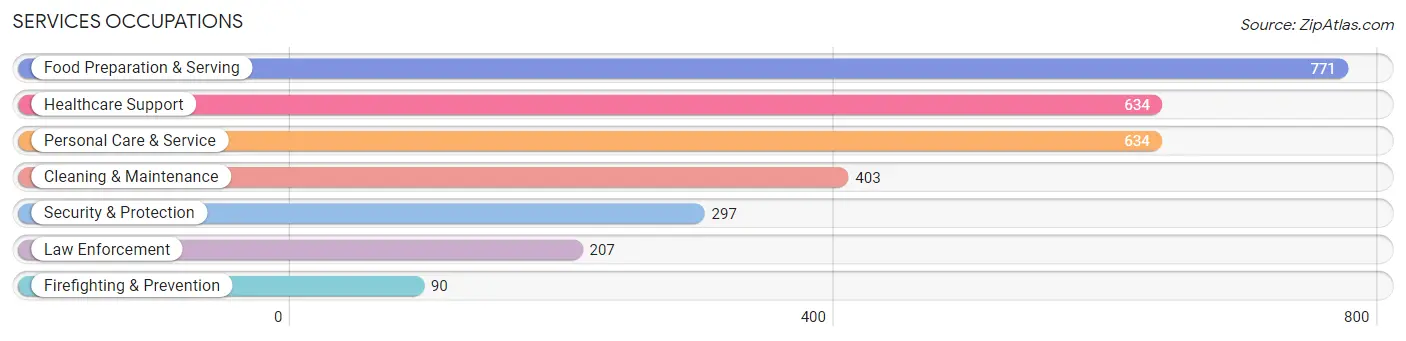
Services Occupations
The most common Services occupations in Riverton are Food Preparation & Serving (771 | 3.5%), Healthcare Support (634 | 2.9%), Personal Care & Service (634 | 2.9%), Cleaning & Maintenance (403 | 1.8%), and Security & Protection (297 | 1.3%).
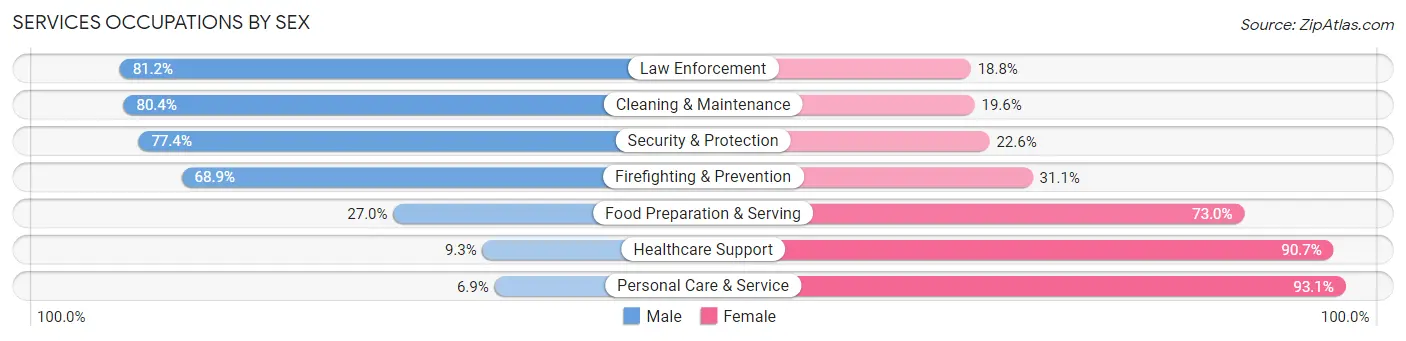
Services Occupations by Sex
Within the Services occupations in Riverton, the most male-oriented occupations are Law Enforcement (81.2%), Cleaning & Maintenance (80.4%), and Security & Protection (77.4%), while the most female-oriented occupations are Personal Care & Service (93.1%), Healthcare Support (90.7%), and Food Preparation & Serving (73.0%).
| Occupation | Male | Female |
| Healthcare Support | 59 (9.3%) | 575 (90.7%) |
| Security & Protection | 230 (77.4%) | 67 (22.6%) |
| Firefighting & Prevention | 62 (68.9%) | 28 (31.1%) |
| Law Enforcement | 168 (81.2%) | 39 (18.8%) |
| Food Preparation & Serving | 208 (27.0%) | 563 (73.0%) |
| Cleaning & Maintenance | 324 (80.4%) | 79 (19.6%) |
| Personal Care & Service | 44 (6.9%) | 590 (93.1%) |
| Total (Category) | 865 (31.6%) | 1,874 (68.4%) |
| Total (Overall) | 12,667 (56.9%) | 9,616 (43.1%) |
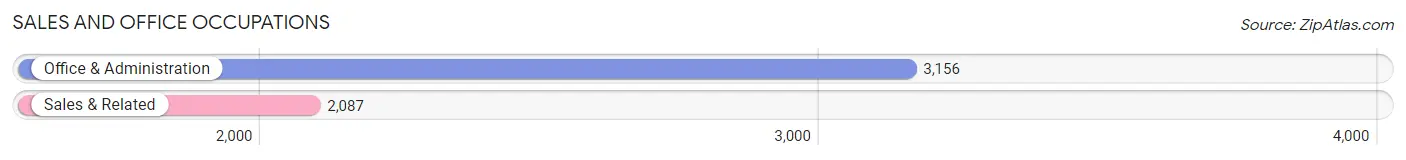
Sales and Office Occupations
The most common Sales and Office occupations in Riverton are Office & Administration (3,156 | 14.2%), and Sales & Related (2,087 | 9.4%).
Sales and Office Occupations by Sex
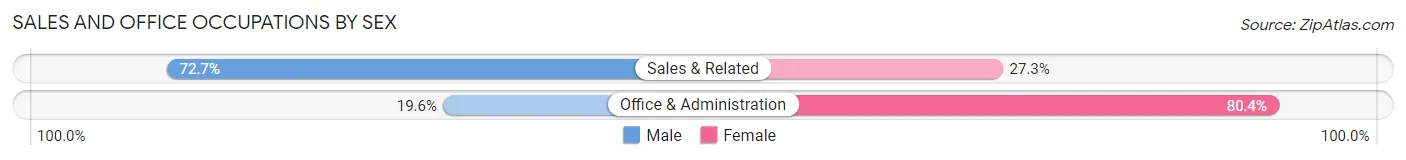
| Occupation | Male | Female |
| Sales & Related | 1,517 (72.7%) | 570 (27.3%) |
| Office & Administration | 618 (19.6%) | 2,538 (80.4%) |
| Total (Category) | 2,135 (40.7%) | 3,108 (59.3%) |
| Total (Overall) | 12,667 (56.9%) | 9,616 (43.1%) |
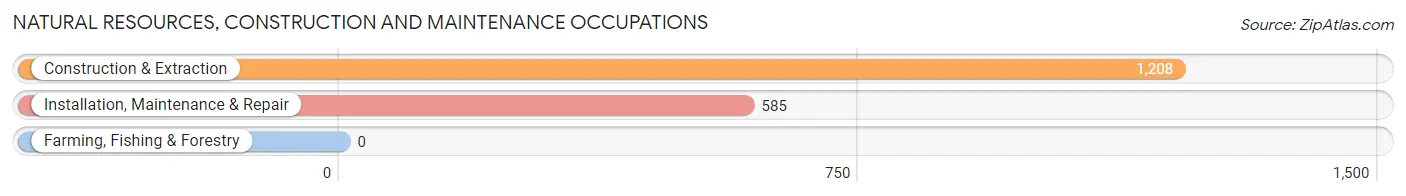
Natural Resources, Construction and Maintenance Occupations
The most common Natural Resources, Construction and Maintenance occupations in Riverton are Construction & Extraction (1,208 | 5.4%), and Installation, Maintenance & Repair (585 | 2.6%).
Natural Resources, Construction and Maintenance Occupations by Sex
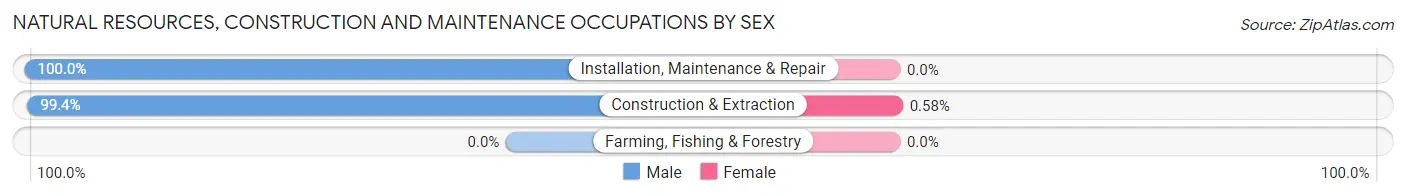
| Occupation | Male | Female |
| Farming, Fishing & Forestry | 0 (0.0%) | 0 (0.0%) |
| Construction & Extraction | 1,201 (99.4%) | 7 (0.6%) |
| Installation, Maintenance & Repair | 585 (100.0%) | 0 (0.0%) |
| Total (Category) | 1,786 (99.6%) | 7 (0.4%) |
| Total (Overall) | 12,667 (56.9%) | 9,616 (43.1%) |
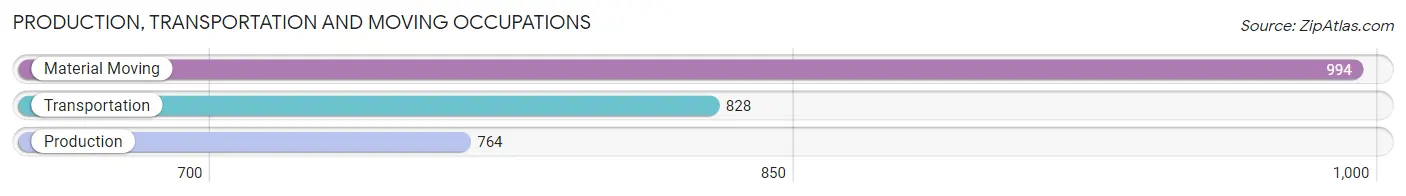
Production, Transportation and Moving Occupations
The most common Production, Transportation and Moving occupations in Riverton are Material Moving (994 | 4.5%), Transportation (828 | 3.7%), and Production (764 | 3.4%).
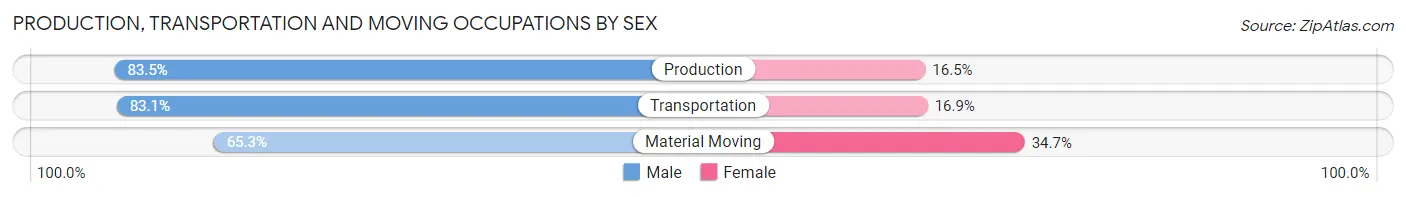
Production, Transportation and Moving Occupations by Sex
| Occupation | Male | Female |
| Production | 638 (83.5%) | 126 (16.5%) |
| Transportation | 688 (83.1%) | 140 (16.9%) |
| Material Moving | 649 (65.3%) | 345 (34.7%) |
| Total (Category) | 1,975 (76.4%) | 611 (23.6%) |
| Total (Overall) | 12,667 (56.9%) | 9,616 (43.1%) |
Employment Industries by Sex in Riverton
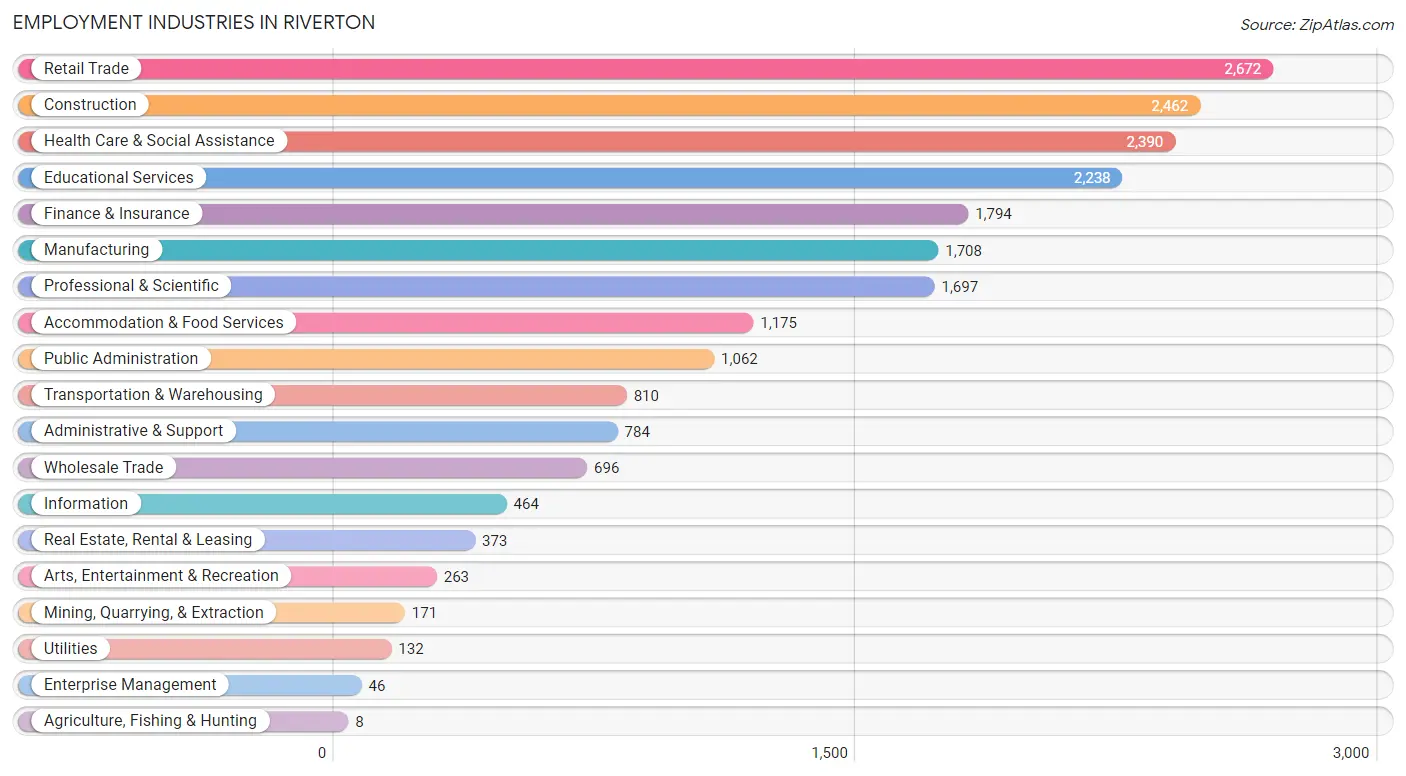
Employment Industries in Riverton
The major employment industries in Riverton include Retail Trade (2,672 | 12.0%), Construction (2,462 | 11.1%), Health Care & Social Assistance (2,390 | 10.7%), Educational Services (2,238 | 10.0%), and Finance & Insurance (1,794 | 8.1%).
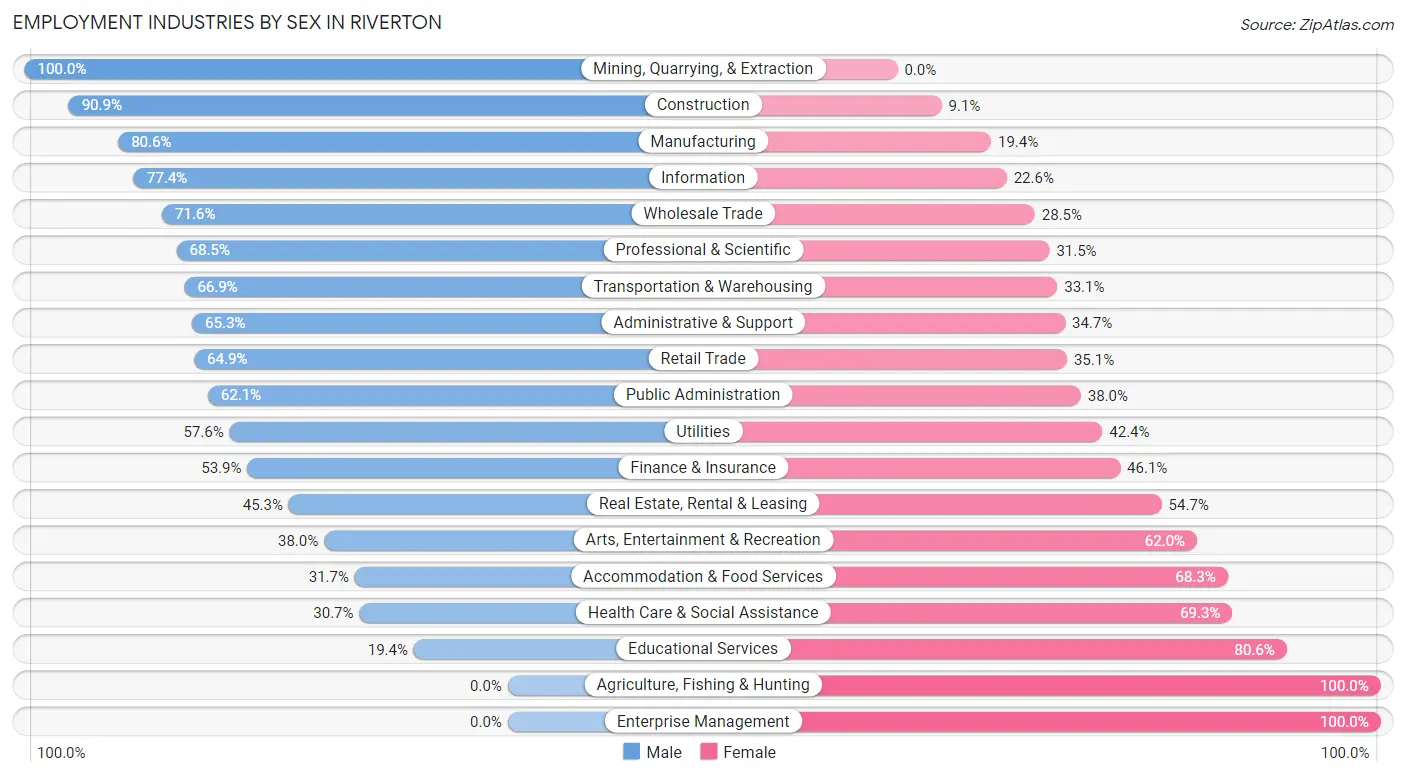
Employment Industries by Sex in Riverton
The Riverton industries that see more men than women are Mining, Quarrying, & Extraction (100.0%), Construction (90.9%), and Manufacturing (80.6%), whereas the industries that tend to have a higher number of women are Agriculture, Fishing & Hunting (100.0%), Enterprise Management (100.0%), and Educational Services (80.6%).
| Industry | Male | Female |
| Agriculture, Fishing & Hunting | 0 (0.0%) | 8 (100.0%) |
| Mining, Quarrying, & Extraction | 171 (100.0%) | 0 (0.0%) |
| Construction | 2,237 (90.9%) | 225 (9.1%) |
| Manufacturing | 1,377 (80.6%) | 331 (19.4%) |
| Wholesale Trade | 498 (71.6%) | 198 (28.4%) |
| Retail Trade | 1,734 (64.9%) | 938 (35.1%) |
| Transportation & Warehousing | 542 (66.9%) | 268 (33.1%) |
| Utilities | 76 (57.6%) | 56 (42.4%) |
| Information | 359 (77.4%) | 105 (22.6%) |
| Finance & Insurance | 967 (53.9%) | 827 (46.1%) |
| Real Estate, Rental & Leasing | 169 (45.3%) | 204 (54.7%) |
| Professional & Scientific | 1,163 (68.5%) | 534 (31.5%) |
| Enterprise Management | 0 (0.0%) | 46 (100.0%) |
| Administrative & Support | 512 (65.3%) | 272 (34.7%) |
| Educational Services | 435 (19.4%) | 1,803 (80.6%) |
| Health Care & Social Assistance | 734 (30.7%) | 1,656 (69.3%) |
| Arts, Entertainment & Recreation | 100 (38.0%) | 163 (62.0%) |
| Accommodation & Food Services | 372 (31.7%) | 803 (68.3%) |
| Public Administration | 659 (62.1%) | 403 (38.0%) |
| Total | 12,667 (56.9%) | 9,616 (43.1%) |
Education in Riverton
School Enrollment in Riverton
The most common levels of schooling among the 13,289 students in Riverton are middle school (3,465 | 26.1%), elementary school (3,264 | 24.6%), and high school (2,609 | 19.6%).
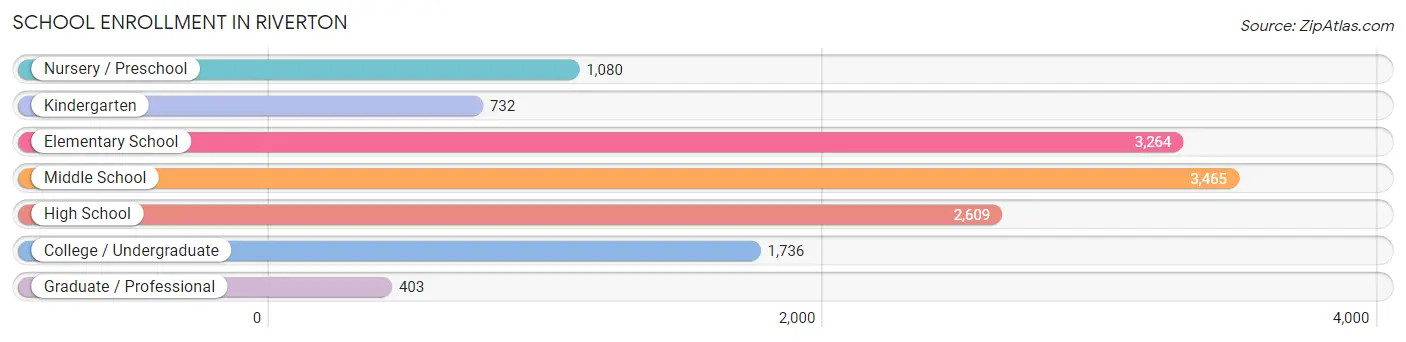
| School Level | # Students | % Students |
| Nursery / Preschool | 1,080 | 8.1% |
| Kindergarten | 732 | 5.5% |
| Elementary School | 3,264 | 24.6% |
| Middle School | 3,465 | 26.1% |
| High School | 2,609 | 19.6% |
| College / Undergraduate | 1,736 | 13.1% |
| Graduate / Professional | 403 | 3.0% |
| Total | 13,289 | 100.0% |
School Enrollment by Age by Funding Source in Riverton
Out of a total of 13,289 students who are enrolled in schools in Riverton, 1,648 (12.4%) attend a private institution, while the remaining 11,641 (87.6%) are enrolled in public schools. The age group of 3 to 4 year olds has the highest likelihood of being enrolled in private schools, with 487 (57.8% in the age bracket) enrolled. Conversely, the age group of 15 to 17 year olds has the lowest likelihood of being enrolled in a private school, with 1,859 (98.9% in the age bracket) attending a public institution.
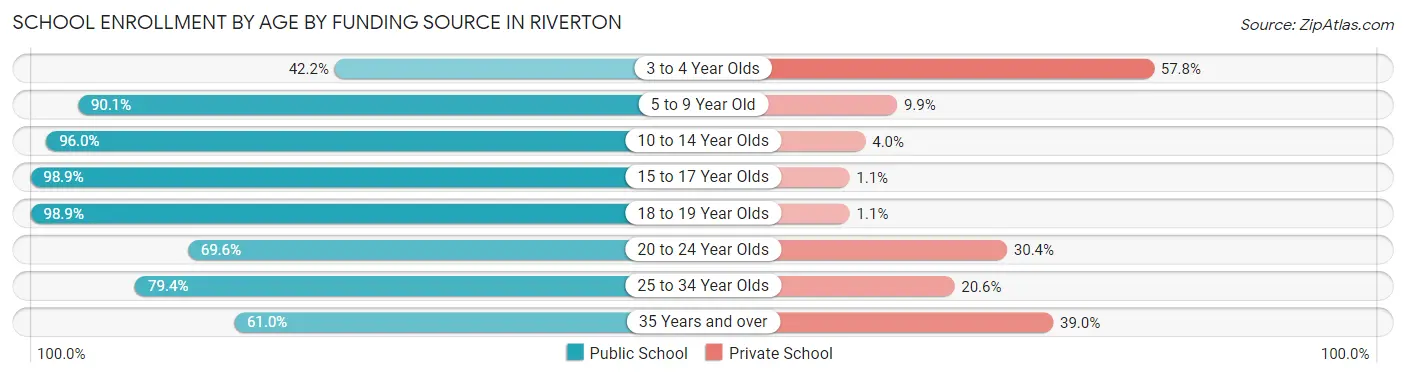
| Age Bracket | Public School | Private School |
| 3 to 4 Year Olds | 356 (42.2%) | 487 (57.8%) |
| 5 to 9 Year Old | 3,501 (90.1%) | 386 (9.9%) |
| 10 to 14 Year Olds | 3,904 (96.0%) | 164 (4.0%) |
| 15 to 17 Year Olds | 1,859 (98.9%) | 20 (1.1%) |
| 18 to 19 Year Olds | 707 (98.9%) | 8 (1.1%) |
| 20 to 24 Year Olds | 474 (69.6%) | 207 (30.4%) |
| 25 to 34 Year Olds | 424 (79.4%) | 110 (20.6%) |
| 35 Years and over | 416 (61.0%) | 266 (39.0%) |
| Total | 11,641 (87.6%) | 1,648 (12.4%) |
Educational Attainment by Field of Study in Riverton
Business (2,605 | 24.2%), education (1,309 | 12.2%), science & technology (1,002 | 9.3%), arts & humanities (856 | 8.0%), and engineering (827 | 7.7%) are the most common fields of study among 10,768 individuals in Riverton who have obtained a bachelor's degree or higher.
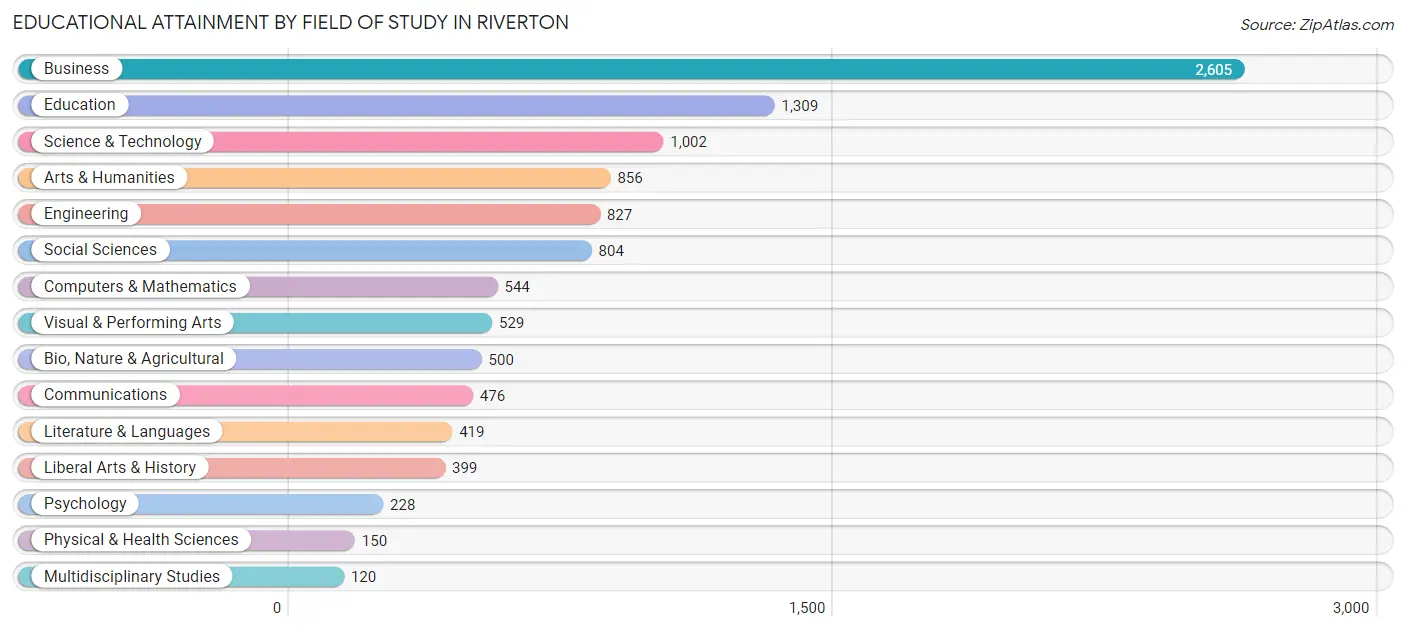
| Field of Study | # Graduates | % Graduates |
| Computers & Mathematics | 544 | 5.1% |
| Bio, Nature & Agricultural | 500 | 4.6% |
| Physical & Health Sciences | 150 | 1.4% |
| Psychology | 228 | 2.1% |
| Social Sciences | 804 | 7.5% |
| Engineering | 827 | 7.7% |
| Multidisciplinary Studies | 120 | 1.1% |
| Science & Technology | 1,002 | 9.3% |
| Business | 2,605 | 24.2% |
| Education | 1,309 | 12.2% |
| Literature & Languages | 419 | 3.9% |
| Liberal Arts & History | 399 | 3.7% |
| Visual & Performing Arts | 529 | 4.9% |
| Communications | 476 | 4.4% |
| Arts & Humanities | 856 | 8.0% |
| Total | 10,768 | 100.0% |
Transportation & Commute in Riverton
Vehicle Availability by Sex in Riverton
The most prevalent vehicle ownership categories in Riverton are males with 2 vehicles (4,299, accounting for 34.1%) and females with 2 vehicles (2,859, making up 45.2%).
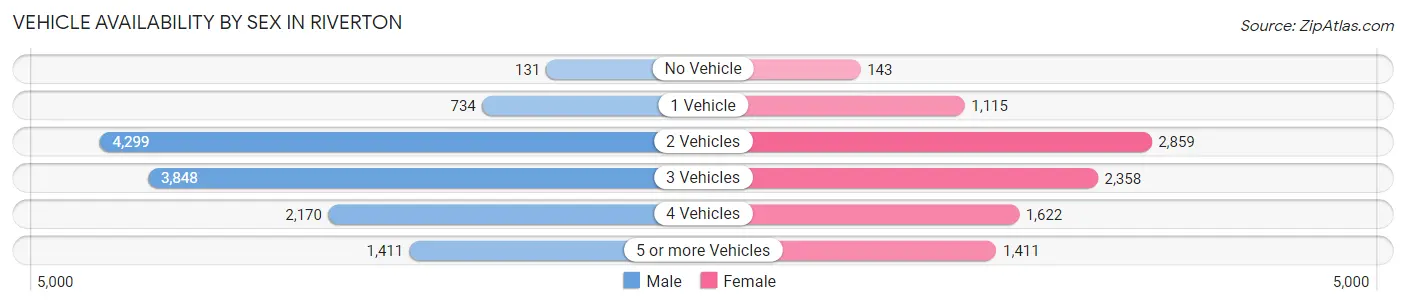
| Vehicles Available | Male | Female |
| No Vehicle | 131 (1.0%) | 143 (1.5%) |
| 1 Vehicle | 734 (5.8%) | 1,115 (11.7%) |
| 2 Vehicles | 4,299 (34.1%) | 2,859 (30.1%) |
| 3 Vehicles | 3,848 (30.6%) | 2,358 (24.8%) |
| 4 Vehicles | 2,170 (17.2%) | 1,622 (17.1%) |
| 5 or more Vehicles | 1,411 (11.2%) | 1,411 (14.8%) |
| Total | 12,593 (100.0%) | 9,508 (100.0%) |
Commute Time in Riverton
The most frequently occuring commute durations in Riverton are 15 to 19 minutes (3,246 commuters, 17.7%), 30 to 34 minutes (2,996 commuters, 16.4%), and 20 to 24 minutes (2,099 commuters, 11.5%).
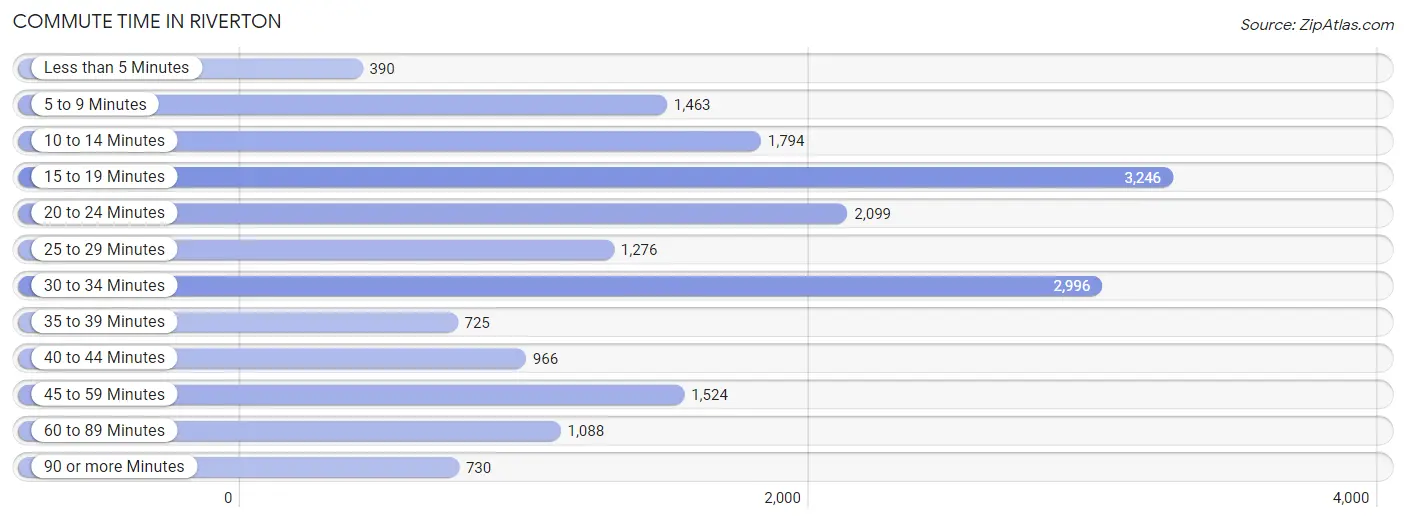
| Commute Time | # Commuters | % Commuters |
| Less than 5 Minutes | 390 | 2.1% |
| 5 to 9 Minutes | 1,463 | 8.0% |
| 10 to 14 Minutes | 1,794 | 9.8% |
| 15 to 19 Minutes | 3,246 | 17.7% |
| 20 to 24 Minutes | 2,099 | 11.5% |
| 25 to 29 Minutes | 1,276 | 7.0% |
| 30 to 34 Minutes | 2,996 | 16.4% |
| 35 to 39 Minutes | 725 | 4.0% |
| 40 to 44 Minutes | 966 | 5.3% |
| 45 to 59 Minutes | 1,524 | 8.3% |
| 60 to 89 Minutes | 1,088 | 5.9% |
| 90 or more Minutes | 730 | 4.0% |
Commute Time by Sex in Riverton
The most common commute times in Riverton are 30 to 34 minutes (2,234 commuters, 21.0%) for males and 15 to 19 minutes (1,464 commuters, 19.1%) for females.
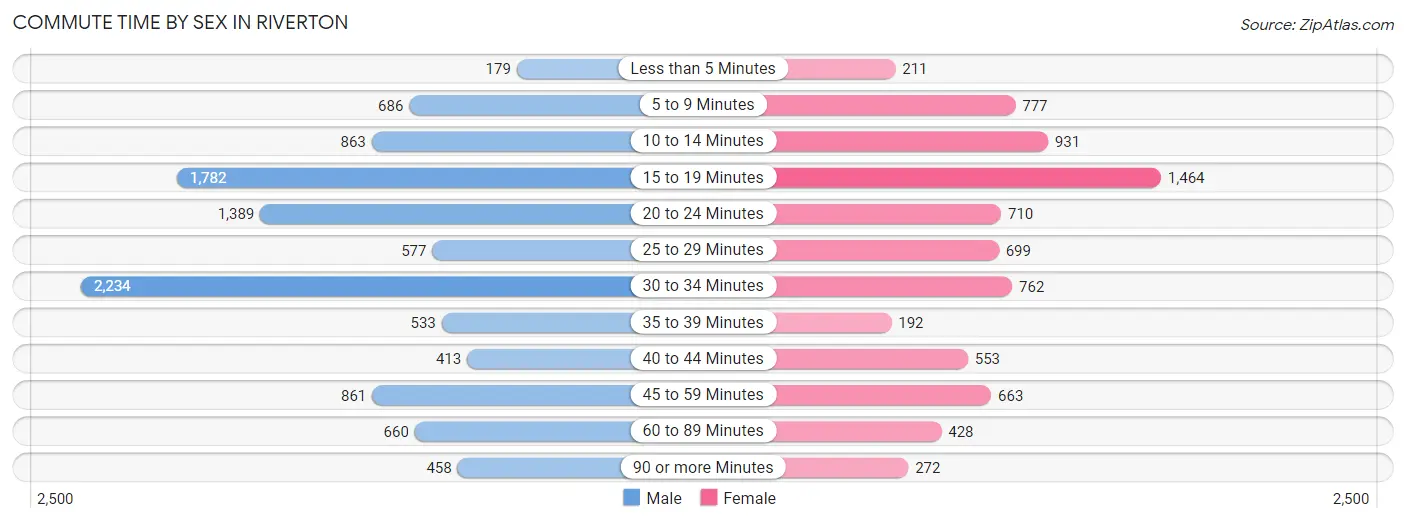
| Commute Time | Male | Female |
| Less than 5 Minutes | 179 (1.7%) | 211 (2.8%) |
| 5 to 9 Minutes | 686 (6.5%) | 777 (10.1%) |
| 10 to 14 Minutes | 863 (8.1%) | 931 (12.1%) |
| 15 to 19 Minutes | 1,782 (16.8%) | 1,464 (19.1%) |
| 20 to 24 Minutes | 1,389 (13.1%) | 710 (9.3%) |
| 25 to 29 Minutes | 577 (5.4%) | 699 (9.1%) |
| 30 to 34 Minutes | 2,234 (21.0%) | 762 (10.0%) |
| 35 to 39 Minutes | 533 (5.0%) | 192 (2.5%) |
| 40 to 44 Minutes | 413 (3.9%) | 553 (7.2%) |
| 45 to 59 Minutes | 861 (8.1%) | 663 (8.6%) |
| 60 to 89 Minutes | 660 (6.2%) | 428 (5.6%) |
| 90 or more Minutes | 458 (4.3%) | 272 (3.5%) |
Time of Departure to Work by Sex in Riverton
The most frequent times of departure to work in Riverton are 7:00 AM to 7:29 AM (1,766, 16.6%) for males and 6:30 AM to 6:59 AM (1,033, 13.5%) for females.
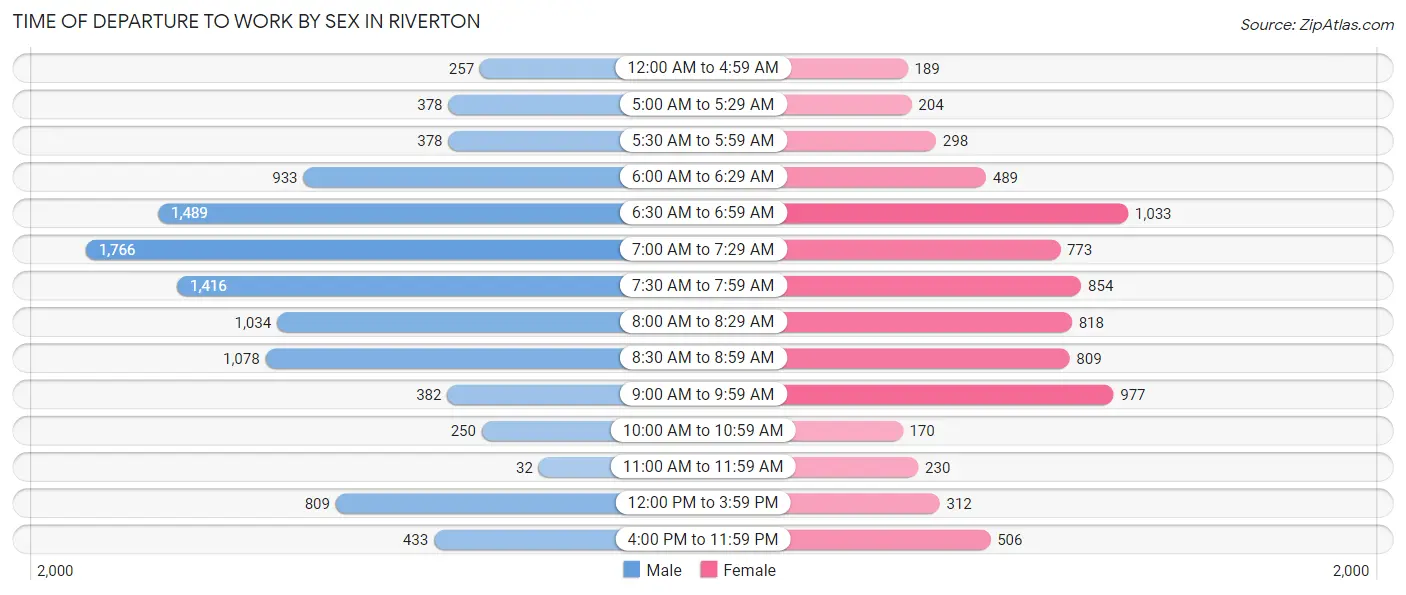
| Time of Departure | Male | Female |
| 12:00 AM to 4:59 AM | 257 (2.4%) | 189 (2.5%) |
| 5:00 AM to 5:29 AM | 378 (3.5%) | 204 (2.7%) |
| 5:30 AM to 5:59 AM | 378 (3.5%) | 298 (3.9%) |
| 6:00 AM to 6:29 AM | 933 (8.8%) | 489 (6.4%) |
| 6:30 AM to 6:59 AM | 1,489 (14.0%) | 1,033 (13.5%) |
| 7:00 AM to 7:29 AM | 1,766 (16.6%) | 773 (10.1%) |
| 7:30 AM to 7:59 AM | 1,416 (13.3%) | 854 (11.2%) |
| 8:00 AM to 8:29 AM | 1,034 (9.7%) | 818 (10.7%) |
| 8:30 AM to 8:59 AM | 1,078 (10.1%) | 809 (10.6%) |
| 9:00 AM to 9:59 AM | 382 (3.6%) | 977 (12.8%) |
| 10:00 AM to 10:59 AM | 250 (2.4%) | 170 (2.2%) |
| 11:00 AM to 11:59 AM | 32 (0.3%) | 230 (3.0%) |
| 12:00 PM to 3:59 PM | 809 (7.6%) | 312 (4.1%) |
| 4:00 PM to 11:59 PM | 433 (4.1%) | 506 (6.6%) |
| Total | 10,635 (100.0%) | 7,662 (100.0%) |
Housing Occupancy in Riverton
Occupancy by Ownership in Riverton
Of the total 13,185 dwellings in Riverton, owner-occupied units account for 11,377 (86.3%), while renter-occupied units make up 1,808 (13.7%).
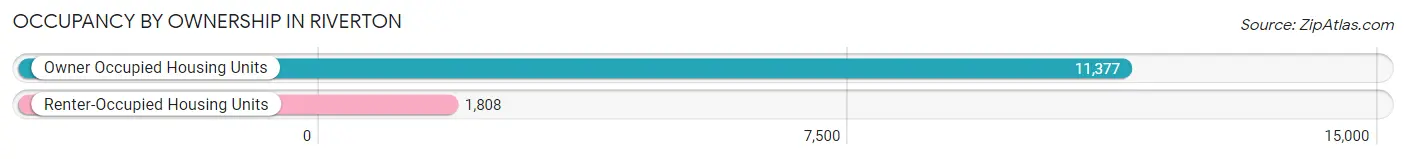
| Occupancy | # Housing Units | % Housing Units |
| Owner Occupied Housing Units | 11,377 | 86.3% |
| Renter-Occupied Housing Units | 1,808 | 13.7% |
| Total Occupied Housing Units | 13,185 | 100.0% |
Occupancy by Household Size in Riverton
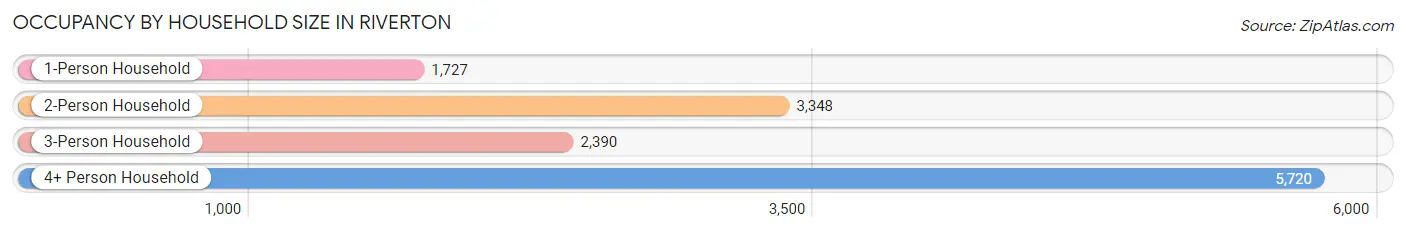
| Household Size | # Housing Units | % Housing Units |
| 1-Person Household | 1,727 | 13.1% |
| 2-Person Household | 3,348 | 25.4% |
| 3-Person Household | 2,390 | 18.1% |
| 4+ Person Household | 5,720 | 43.4% |
| Total Housing Units | 13,185 | 100.0% |
Occupancy by Ownership by Household Size in Riverton
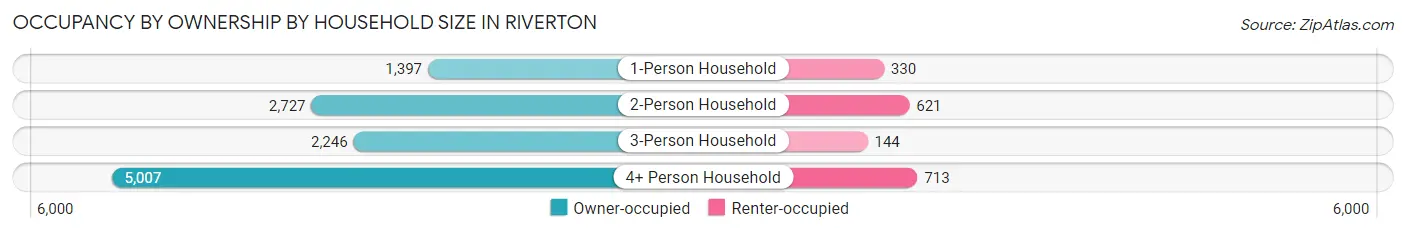
| Household Size | Owner-occupied | Renter-occupied |
| 1-Person Household | 1,397 (80.9%) | 330 (19.1%) |
| 2-Person Household | 2,727 (81.5%) | 621 (18.5%) |
| 3-Person Household | 2,246 (94.0%) | 144 (6.0%) |
| 4+ Person Household | 5,007 (87.5%) | 713 (12.5%) |
| Total Housing Units | 11,377 (86.3%) | 1,808 (13.7%) |
Occupancy by Educational Attainment in Riverton
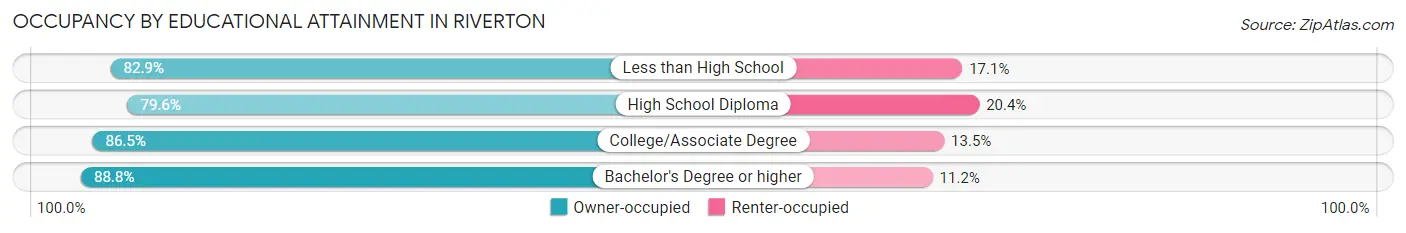
| Household Size | Owner-occupied | Renter-occupied |
| Less than High School | 452 (82.9%) | 93 (17.1%) |
| High School Diploma | 1,535 (79.6%) | 394 (20.4%) |
| College/Associate Degree | 4,608 (86.5%) | 718 (13.5%) |
| Bachelor's Degree or higher | 4,782 (88.8%) | 603 (11.2%) |
Occupancy by Age of Householder in Riverton
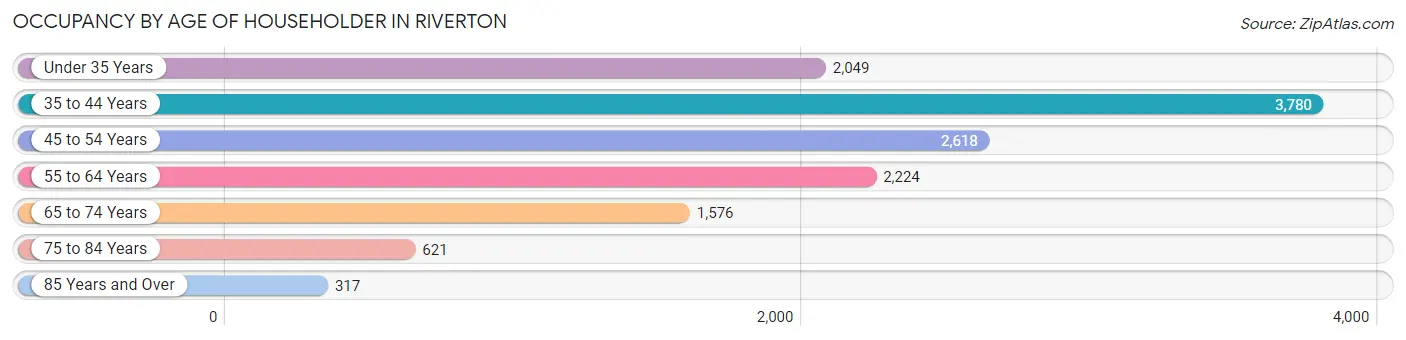
| Age Bracket | # Households | % Households |
| Under 35 Years | 2,049 | 15.5% |
| 35 to 44 Years | 3,780 | 28.7% |
| 45 to 54 Years | 2,618 | 19.9% |
| 55 to 64 Years | 2,224 | 16.9% |
| 65 to 74 Years | 1,576 | 11.9% |
| 75 to 84 Years | 621 | 4.7% |
| 85 Years and Over | 317 | 2.4% |
| Total | 13,185 | 100.0% |
Housing Finances in Riverton
Median Income by Occupancy in Riverton
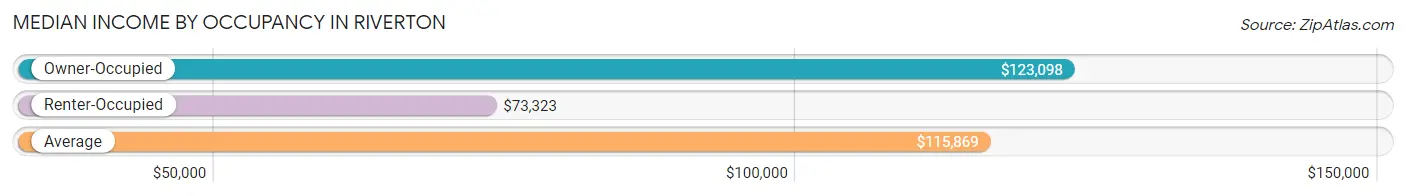
| Occupancy Type | # Households | Median Income |
| Owner-Occupied | 11,377 (86.3%) | $123,098 |
| Renter-Occupied | 1,808 (13.7%) | $73,323 |
| Average | 13,185 (100.0%) | $115,869 |
Occupancy by Householder Income Bracket in Riverton
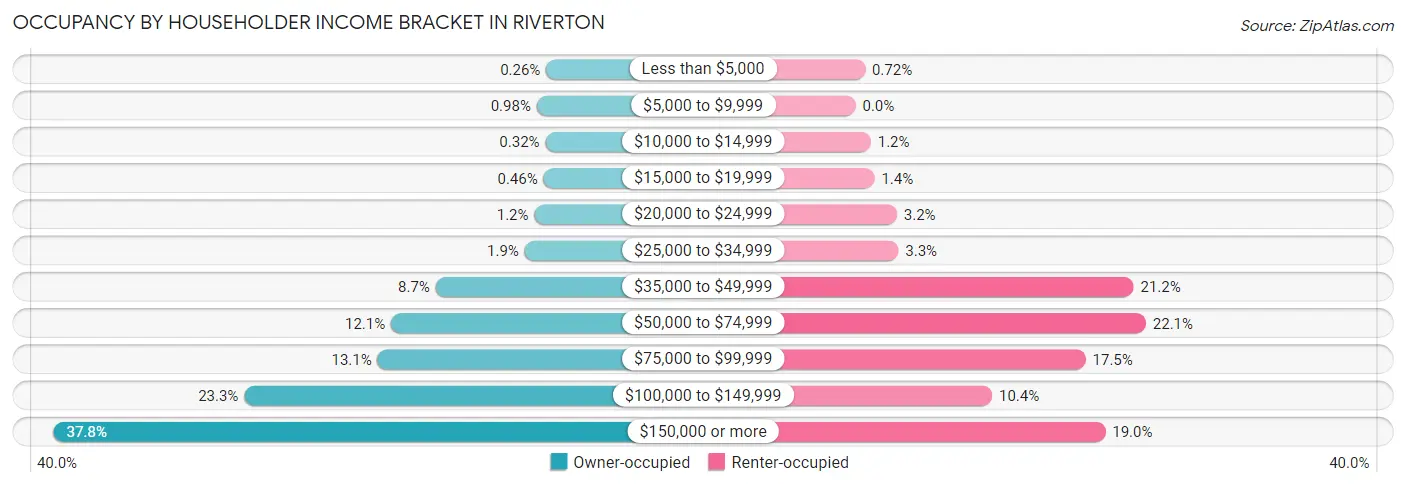
| Income Bracket | Owner-occupied | Renter-occupied |
| Less than $5,000 | 30 (0.3%) | 13 (0.7%) |
| $5,000 to $9,999 | 112 (1.0%) | 0 (0.0%) |
| $10,000 to $14,999 | 36 (0.3%) | 21 (1.2%) |
| $15,000 to $19,999 | 52 (0.5%) | 26 (1.4%) |
| $20,000 to $24,999 | 132 (1.2%) | 57 (3.2%) |
| $25,000 to $34,999 | 216 (1.9%) | 59 (3.3%) |
| $35,000 to $49,999 | 988 (8.7%) | 383 (21.2%) |
| $50,000 to $74,999 | 1,374 (12.1%) | 400 (22.1%) |
| $75,000 to $99,999 | 1,491 (13.1%) | 317 (17.5%) |
| $100,000 to $149,999 | 2,647 (23.3%) | 188 (10.4%) |
| $150,000 or more | 4,299 (37.8%) | 344 (19.0%) |
| Total | 11,377 (100.0%) | 1,808 (100.0%) |
Monthly Housing Cost Tiers in Riverton
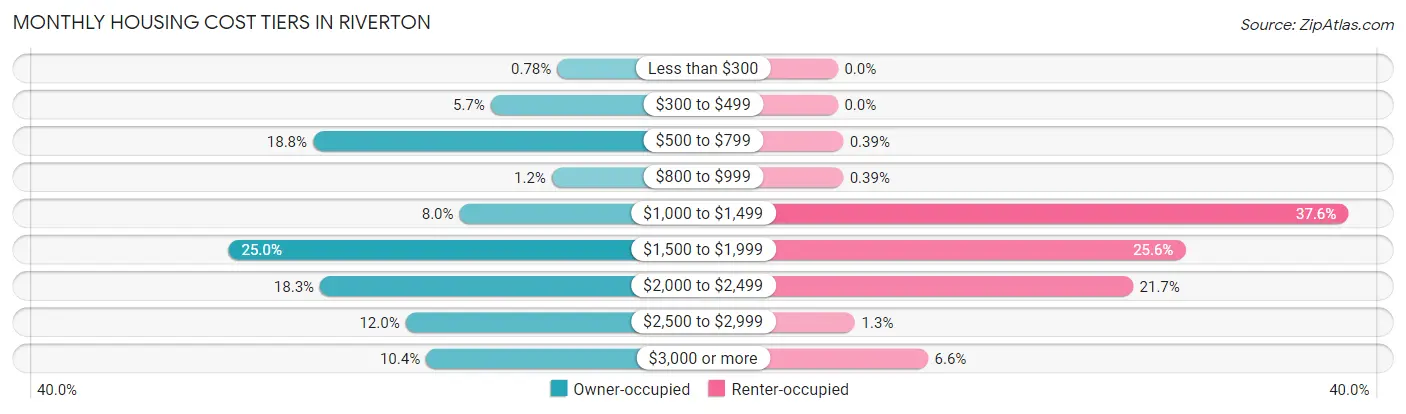
| Monthly Cost | Owner-occupied | Renter-occupied |
| Less than $300 | 89 (0.8%) | 0 (0.0%) |
| $300 to $499 | 646 (5.7%) | 0 (0.0%) |
| $500 to $799 | 2,135 (18.8%) | 7 (0.4%) |
| $800 to $999 | 134 (1.2%) | 7 (0.4%) |
| $1,000 to $1,499 | 908 (8.0%) | 680 (37.6%) |
| $1,500 to $1,999 | 2,842 (25.0%) | 463 (25.6%) |
| $2,000 to $2,499 | 2,076 (18.2%) | 393 (21.7%) |
| $2,500 to $2,999 | 1,359 (11.9%) | 23 (1.3%) |
| $3,000 or more | 1,188 (10.4%) | 120 (6.6%) |
| Total | 11,377 (100.0%) | 1,808 (100.0%) |
Physical Housing Characteristics in Riverton
Housing Structures in Riverton
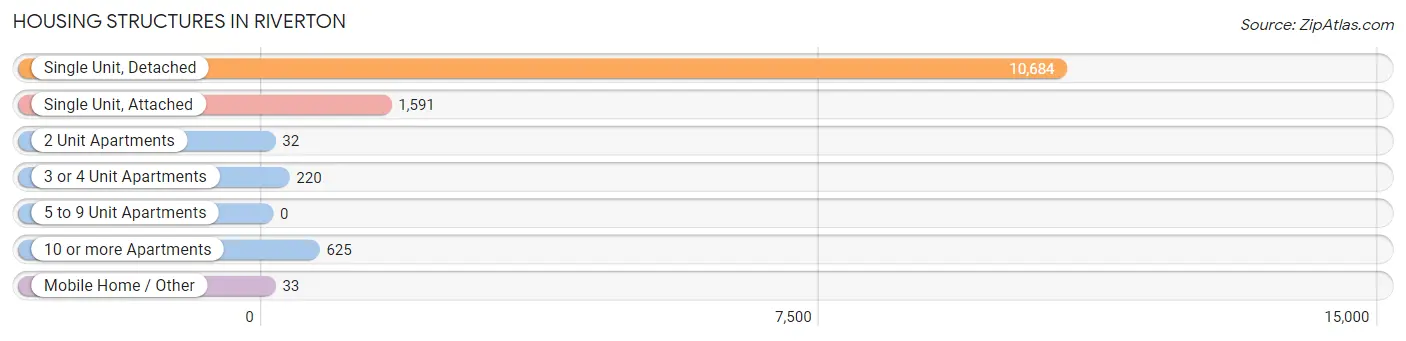
| Structure Type | # Housing Units | % Housing Units |
| Single Unit, Detached | 10,684 | 81.0% |
| Single Unit, Attached | 1,591 | 12.1% |
| 2 Unit Apartments | 32 | 0.2% |
| 3 or 4 Unit Apartments | 220 | 1.7% |
| 5 to 9 Unit Apartments | 0 | 0.0% |
| 10 or more Apartments | 625 | 4.7% |
| Mobile Home / Other | 33 | 0.3% |
| Total | 13,185 | 100.0% |
Housing Structures by Occupancy in Riverton
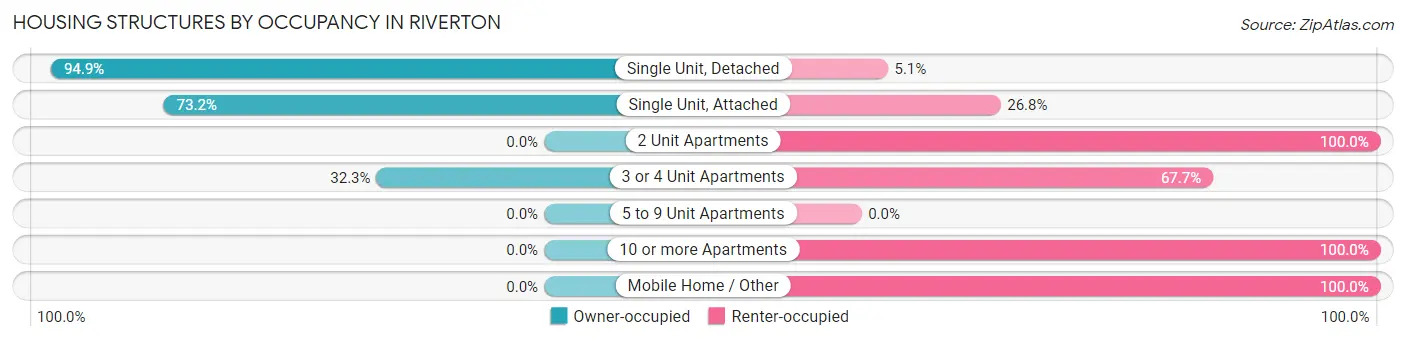
| Structure Type | Owner-occupied | Renter-occupied |
| Single Unit, Detached | 10,141 (94.9%) | 543 (5.1%) |
| Single Unit, Attached | 1,165 (73.2%) | 426 (26.8%) |
| 2 Unit Apartments | 0 (0.0%) | 32 (100.0%) |
| 3 or 4 Unit Apartments | 71 (32.3%) | 149 (67.7%) |
| 5 to 9 Unit Apartments | 0 (0.0%) | 0 (0.0%) |
| 10 or more Apartments | 0 (0.0%) | 625 (100.0%) |
| Mobile Home / Other | 0 (0.0%) | 33 (100.0%) |
| Total | 11,377 (86.3%) | 1,808 (13.7%) |
Housing Structures by Number of Rooms in Riverton
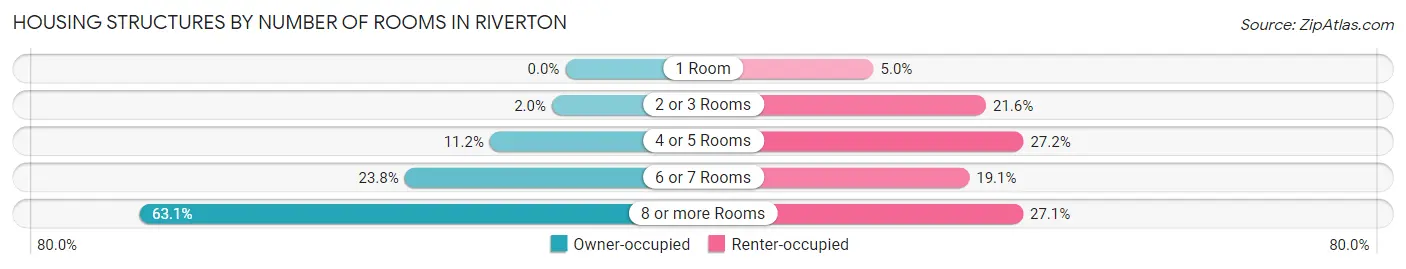
| Number of Rooms | Owner-occupied | Renter-occupied |
| 1 Room | 0 (0.0%) | 90 (5.0%) |
| 2 or 3 Rooms | 226 (2.0%) | 391 (21.6%) |
| 4 or 5 Rooms | 1,271 (11.2%) | 491 (27.2%) |
| 6 or 7 Rooms | 2,706 (23.8%) | 346 (19.1%) |
| 8 or more Rooms | 7,174 (63.1%) | 490 (27.1%) |
| Total | 11,377 (100.0%) | 1,808 (100.0%) |
Housing Structure by Heating Type in Riverton
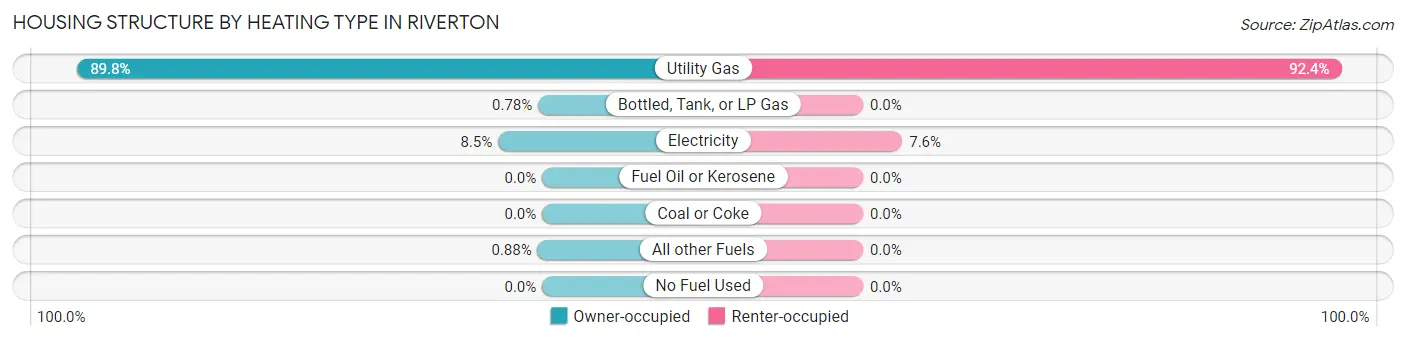
| Heating Type | Owner-occupied | Renter-occupied |
| Utility Gas | 10,220 (89.8%) | 1,671 (92.4%) |
| Bottled, Tank, or LP Gas | 89 (0.8%) | 0 (0.0%) |
| Electricity | 968 (8.5%) | 137 (7.6%) |
| Fuel Oil or Kerosene | 0 (0.0%) | 0 (0.0%) |
| Coal or Coke | 0 (0.0%) | 0 (0.0%) |
| All other Fuels | 100 (0.9%) | 0 (0.0%) |
| No Fuel Used | 0 (0.0%) | 0 (0.0%) |
| Total | 11,377 (100.0%) | 1,808 (100.0%) |
Household Vehicle Usage in Riverton
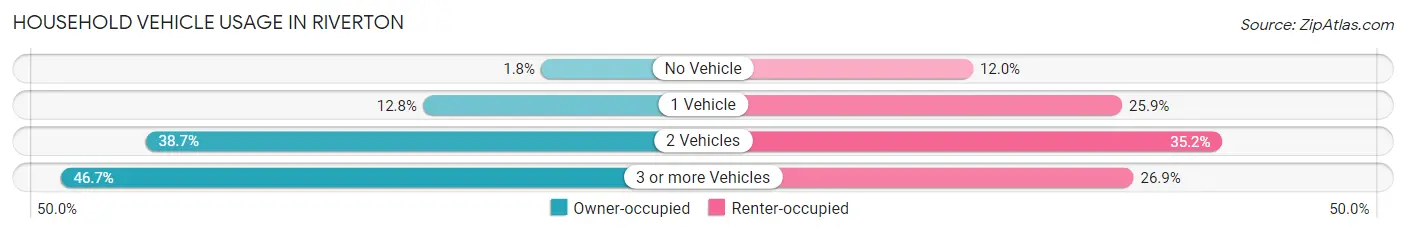
| Vehicles per Household | Owner-occupied | Renter-occupied |
| No Vehicle | 206 (1.8%) | 216 (11.9%) |
| 1 Vehicle | 1,460 (12.8%) | 468 (25.9%) |
| 2 Vehicles | 4,404 (38.7%) | 637 (35.2%) |
| 3 or more Vehicles | 5,307 (46.7%) | 487 (26.9%) |
| Total | 11,377 (100.0%) | 1,808 (100.0%) |
Real Estate & Mortgages in Riverton
Real Estate and Mortgage Overview in Riverton
| Characteristic | Without Mortgage | With Mortgage |
| Housing Units | 2,845 | 8,532 |
| Median Property Value | $481,100 | $477,400 |
| Median Household Income | $107,554 | $3,396 |
| Monthly Housing Costs | $600 | $1,156 |
| Real Estate Taxes | $2,959 | $164 |
Property Value by Mortgage Status in Riverton
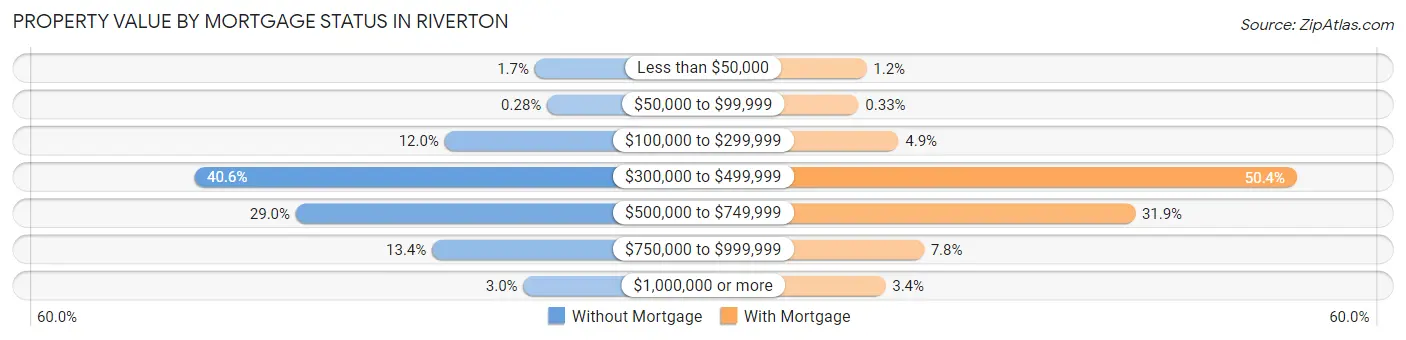
| Property Value | Without Mortgage | With Mortgage |
| Less than $50,000 | 48 (1.7%) | 105 (1.2%) |
| $50,000 to $99,999 | 8 (0.3%) | 28 (0.3%) |
| $100,000 to $299,999 | 341 (12.0%) | 417 (4.9%) |
| $300,000 to $499,999 | 1,156 (40.6%) | 4,303 (50.4%) |
| $500,000 to $749,999 | 825 (29.0%) | 2,724 (31.9%) |
| $750,000 to $999,999 | 382 (13.4%) | 665 (7.8%) |
| $1,000,000 or more | 85 (3.0%) | 290 (3.4%) |
| Total | 2,845 (100.0%) | 8,532 (100.0%) |
Household Income by Mortgage Status in Riverton
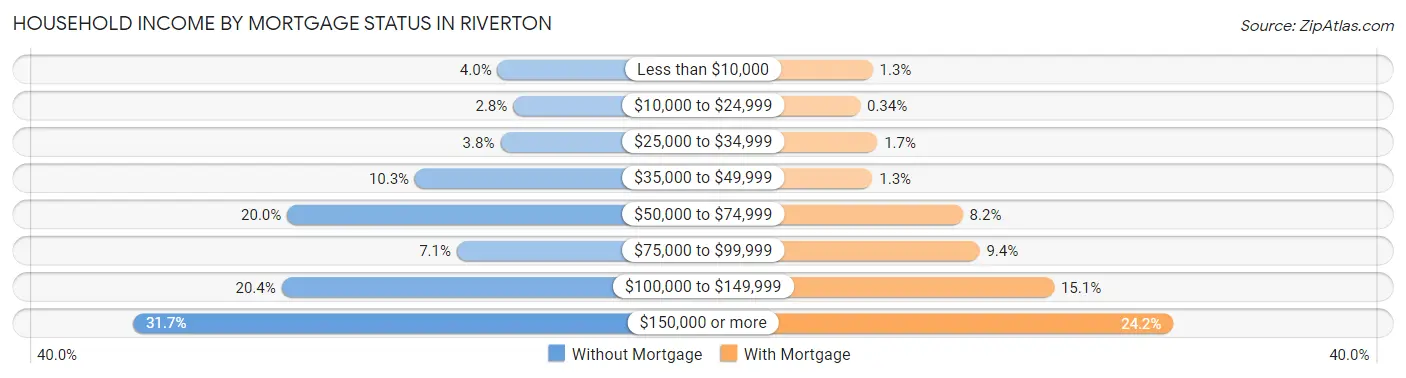
| Household Income | Without Mortgage | With Mortgage |
| Less than $10,000 | 113 (4.0%) | 111 (1.3%) |
| $10,000 to $24,999 | 79 (2.8%) | 29 (0.3%) |
| $25,000 to $34,999 | 107 (3.8%) | 141 (1.7%) |
| $35,000 to $49,999 | 292 (10.3%) | 109 (1.3%) |
| $50,000 to $74,999 | 569 (20.0%) | 696 (8.2%) |
| $75,000 to $99,999 | 201 (7.1%) | 805 (9.4%) |
| $100,000 to $149,999 | 581 (20.4%) | 1,290 (15.1%) |
| $150,000 or more | 903 (31.7%) | 2,066 (24.2%) |
| Total | 2,845 (100.0%) | 8,532 (100.0%) |
Property Value to Household Income Ratio in Riverton
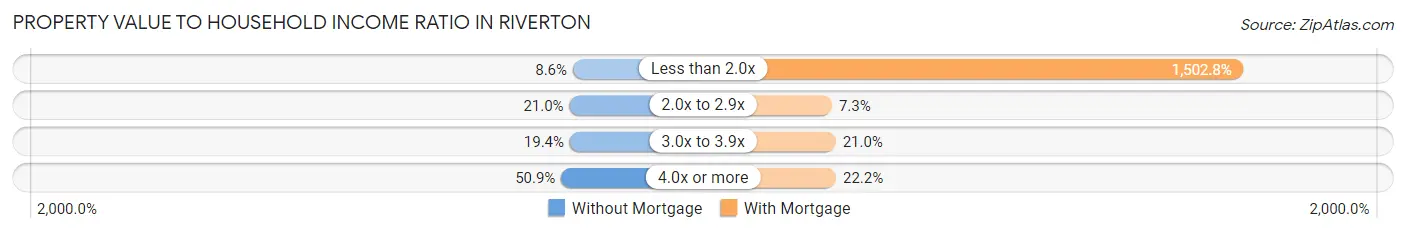
| Value-to-Income Ratio | Without Mortgage | With Mortgage |
| Less than 2.0x | 245 (8.6%) | 128,218 (1,502.8%) |
| 2.0x to 2.9x | 598 (21.0%) | 625 (7.3%) |
| 3.0x to 3.9x | 553 (19.4%) | 1,793 (21.0%) |
| 4.0x or more | 1,449 (50.9%) | 1,890 (22.2%) |
| Total | 2,845 (100.0%) | 8,532 (100.0%) |
Real Estate Taxes by Mortgage Status in Riverton
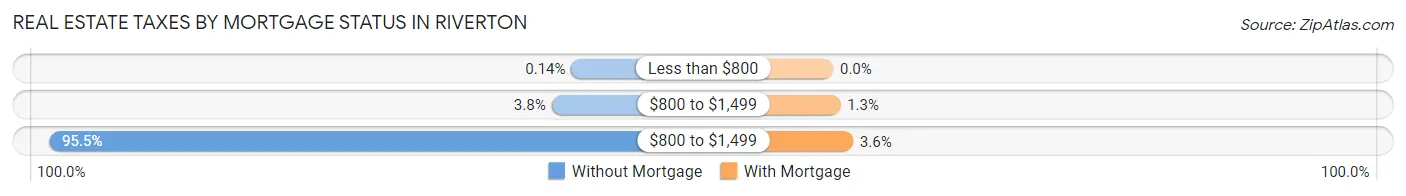
| Property Taxes | Without Mortgage | With Mortgage |
| Less than $800 | 4 (0.1%) | 0 (0.0%) |
| $800 to $1,499 | 107 (3.8%) | 112 (1.3%) |
| $800 to $1,499 | 2,718 (95.5%) | 310 (3.6%) |
| Total | 2,845 (100.0%) | 8,532 (100.0%) |
Health & Disability in Riverton
Health Insurance Coverage by Age in Riverton
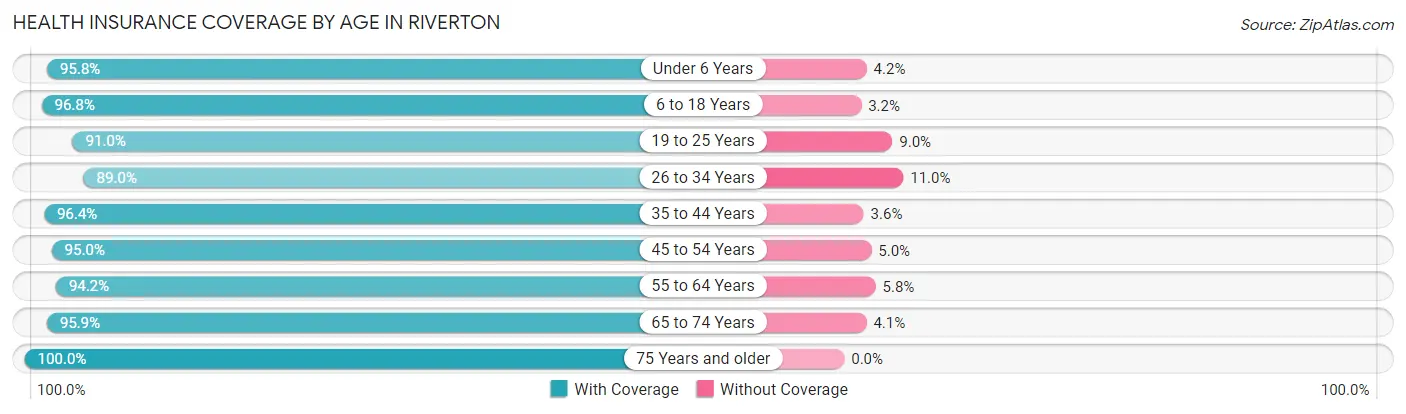
| Age Bracket | With Coverage | Without Coverage |
| Under 6 Years | 4,505 (95.8%) | 196 (4.2%) |
| 6 to 18 Years | 9,710 (96.8%) | 317 (3.2%) |
| 19 to 25 Years | 2,612 (91.0%) | 257 (9.0%) |
| 26 to 34 Years | 5,112 (89.0%) | 632 (11.0%) |
| 35 to 44 Years | 6,705 (96.4%) | 251 (3.6%) |
| 45 to 54 Years | 4,988 (95.0%) | 265 (5.0%) |
| 55 to 64 Years | 4,447 (94.2%) | 276 (5.8%) |
| 65 to 74 Years | 2,963 (95.9%) | 128 (4.1%) |
| 75 Years and older | 1,462 (100.0%) | 0 (0.0%) |
| Total | 42,504 (94.8%) | 2,322 (5.2%) |
Health Insurance Coverage by Citizenship Status in Riverton
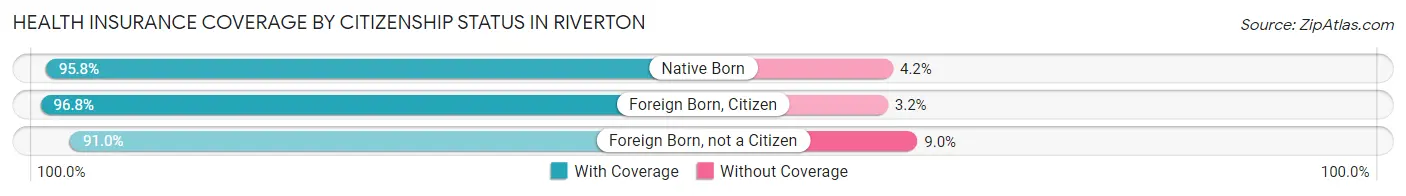
| Citizenship Status | With Coverage | Without Coverage |
| Native Born | 4,505 (95.8%) | 196 (4.2%) |
| Foreign Born, Citizen | 9,710 (96.8%) | 317 (3.2%) |
| Foreign Born, not a Citizen | 2,612 (91.0%) | 257 (9.0%) |
Health Insurance Coverage by Household Income in Riverton
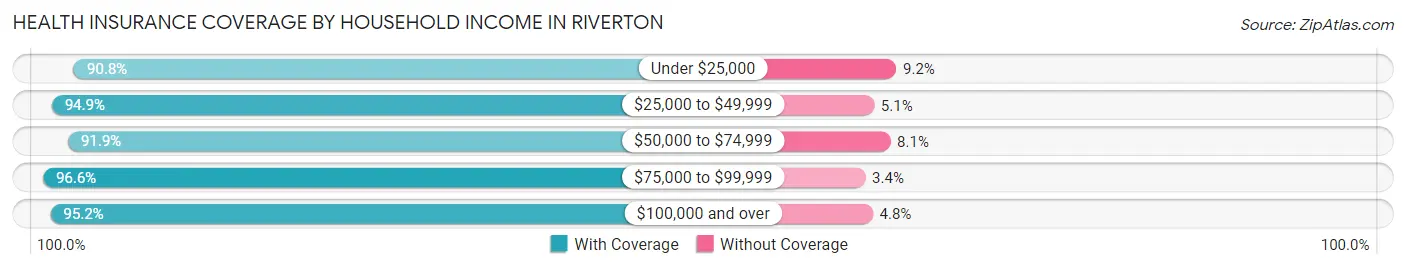
| Household Income | With Coverage | Without Coverage |
| Under $25,000 | 786 (90.8%) | 80 (9.2%) |
| $25,000 to $49,999 | 3,736 (94.9%) | 200 (5.1%) |
| $50,000 to $74,999 | 5,080 (91.9%) | 449 (8.1%) |
| $75,000 to $99,999 | 4,882 (96.6%) | 174 (3.4%) |
| $100,000 and over | 27,901 (95.2%) | 1,419 (4.8%) |
Public vs Private Health Insurance Coverage by Age in Riverton
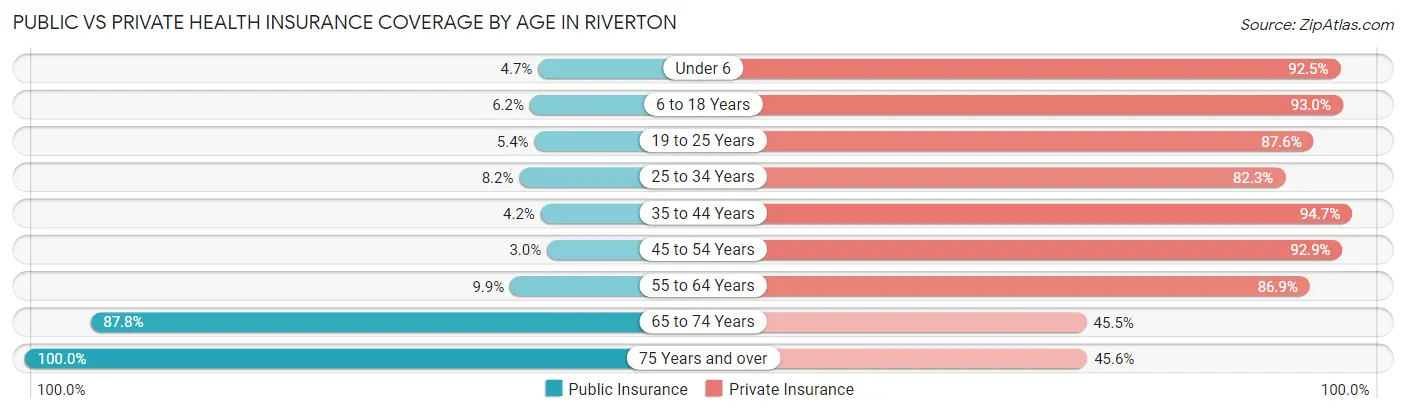
| Age Bracket | Public Insurance | Private Insurance |
| Under 6 | 220 (4.7%) | 4,350 (92.5%) |
| 6 to 18 Years | 625 (6.2%) | 9,323 (93.0%) |
| 19 to 25 Years | 154 (5.4%) | 2,512 (87.6%) |
| 25 to 34 Years | 470 (8.2%) | 4,727 (82.3%) |
| 35 to 44 Years | 293 (4.2%) | 6,587 (94.7%) |
| 45 to 54 Years | 159 (3.0%) | 4,881 (92.9%) |
| 55 to 64 Years | 467 (9.9%) | 4,102 (86.9%) |
| 65 to 74 Years | 2,714 (87.8%) | 1,405 (45.5%) |
| 75 Years and over | 1,462 (100.0%) | 666 (45.6%) |
| Total | 6,564 (14.6%) | 38,553 (86.0%) |
Disability Status by Sex by Age in Riverton
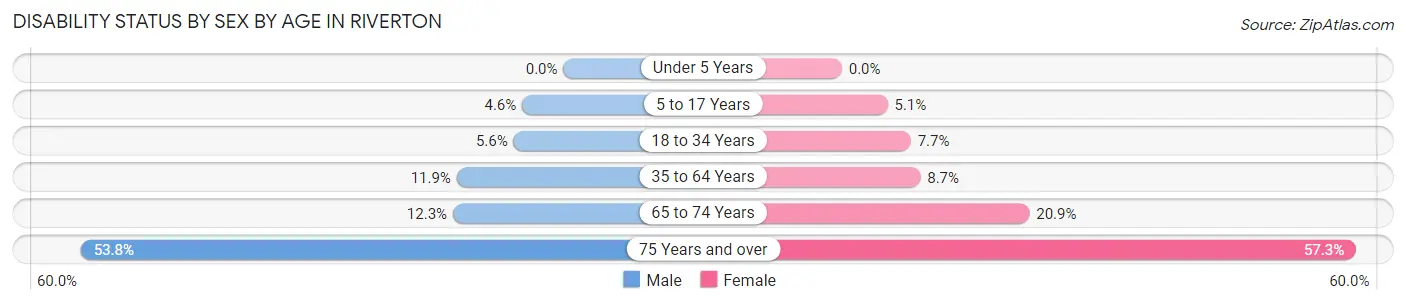
| Age Bracket | Male | Female |
| Under 5 Years | 0 (0.0%) | 0 (0.0%) |
| 5 to 17 Years | 264 (4.6%) | 227 (5.1%) |
| 18 to 34 Years | 266 (5.6%) | 344 (7.7%) |
| 35 to 64 Years | 1,035 (11.9%) | 719 (8.7%) |
| 65 to 74 Years | 177 (12.3%) | 345 (20.9%) |
| 75 Years and over | 308 (53.7%) | 509 (57.3%) |
Disability Class by Sex by Age in Riverton
Disability Class: Hearing Difficulty
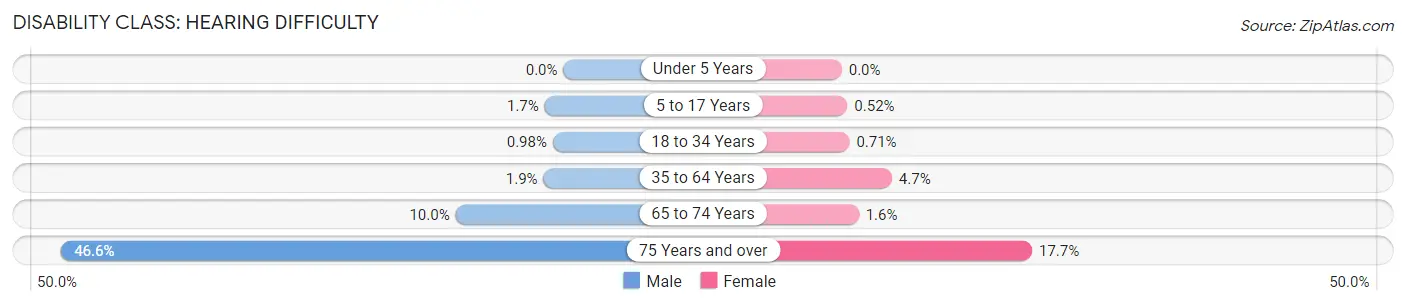
| Age Bracket | Male | Female |
| Under 5 Years | 0 (0.0%) | 0 (0.0%) |
| 5 to 17 Years | 100 (1.7%) | 23 (0.5%) |
| 18 to 34 Years | 47 (1.0%) | 32 (0.7%) |
| 35 to 64 Years | 161 (1.8%) | 382 (4.6%) |
| 65 to 74 Years | 144 (10.0%) | 26 (1.6%) |
| 75 Years and over | 267 (46.6%) | 157 (17.7%) |
Disability Class: Vision Difficulty
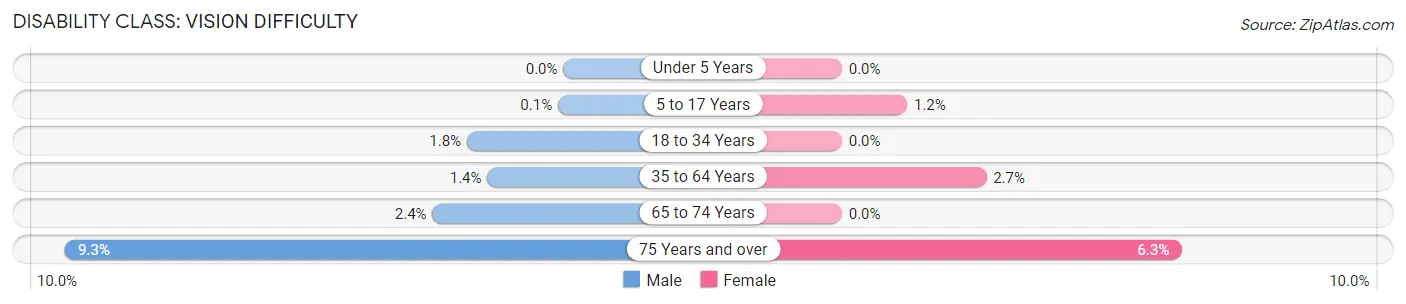
| Age Bracket | Male | Female |
| Under 5 Years | 0 (0.0%) | 0 (0.0%) |
| 5 to 17 Years | 6 (0.1%) | 54 (1.2%) |
| 18 to 34 Years | 86 (1.8%) | 0 (0.0%) |
| 35 to 64 Years | 123 (1.4%) | 220 (2.7%) |
| 65 to 74 Years | 35 (2.4%) | 0 (0.0%) |
| 75 Years and over | 53 (9.2%) | 56 (6.3%) |
Disability Class: Cognitive Difficulty
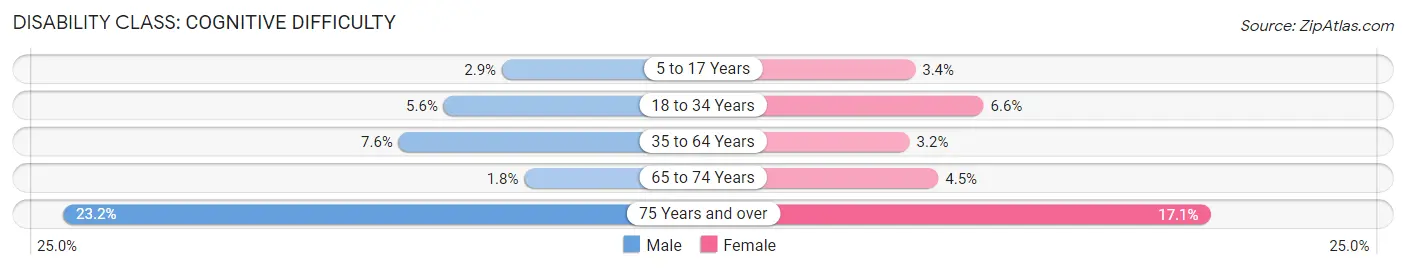
| Age Bracket | Male | Female |
| 5 to 17 Years | 164 (2.9%) | 152 (3.4%) |
| 18 to 34 Years | 266 (5.6%) | 295 (6.6%) |
| 35 to 64 Years | 665 (7.6%) | 259 (3.2%) |
| 65 to 74 Years | 26 (1.8%) | 74 (4.5%) |
| 75 Years and over | 133 (23.2%) | 152 (17.1%) |
Disability Class: Ambulatory Difficulty
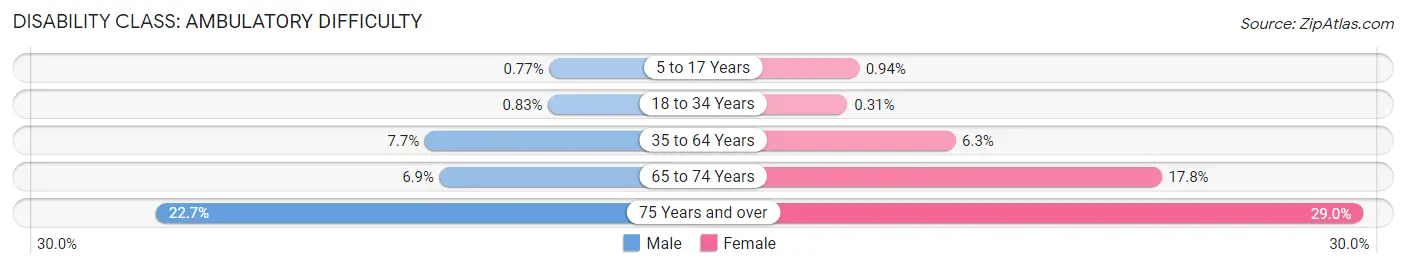
| Age Bracket | Male | Female |
| 5 to 17 Years | 44 (0.8%) | 42 (0.9%) |
| 18 to 34 Years | 40 (0.8%) | 14 (0.3%) |
| 35 to 64 Years | 671 (7.7%) | 519 (6.3%) |
| 65 to 74 Years | 99 (6.9%) | 294 (17.8%) |
| 75 Years and over | 130 (22.7%) | 258 (29.0%) |
Disability Class: Self-Care Difficulty
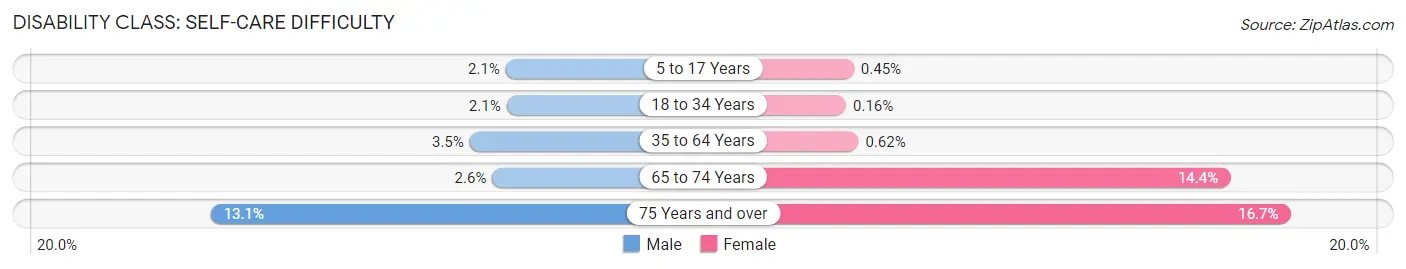
| Age Bracket | Male | Female |
| 5 to 17 Years | 123 (2.1%) | 20 (0.4%) |
| 18 to 34 Years | 101 (2.1%) | 7 (0.2%) |
| 35 to 64 Years | 303 (3.5%) | 51 (0.6%) |
| 65 to 74 Years | 38 (2.6%) | 238 (14.4%) |
| 75 Years and over | 75 (13.1%) | 148 (16.7%) |
Technology Access in Riverton
Computing Device Access in Riverton
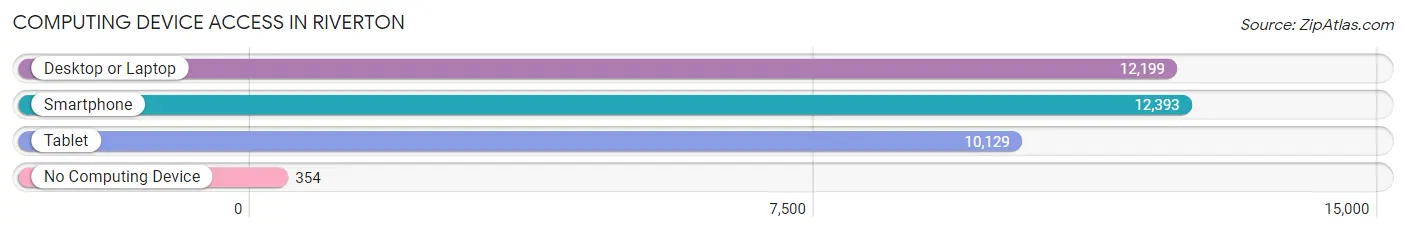
| Device Type | # Households | % Households |
| Desktop or Laptop | 12,199 | 92.5% |
| Smartphone | 12,393 | 94.0% |
| Tablet | 10,129 | 76.8% |
| No Computing Device | 354 | 2.7% |
| Total | 13,185 | 100.0% |
Internet Access in Riverton
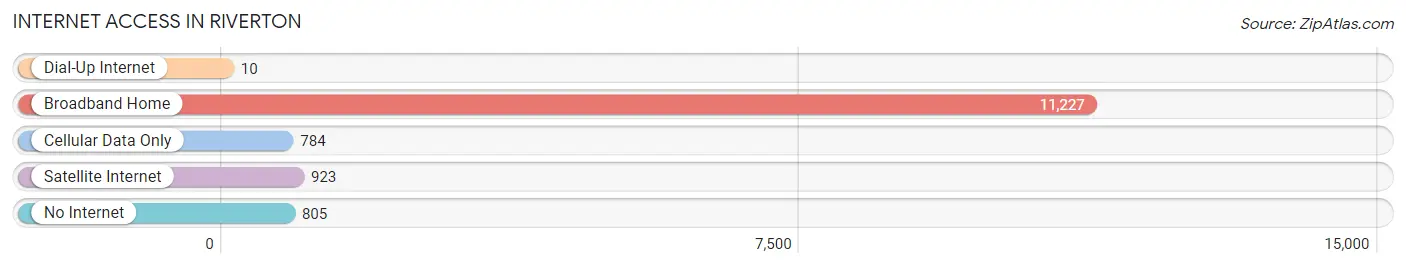
| Internet Type | # Households | % Households |
| Dial-Up Internet | 10 | 0.1% |
| Broadband Home | 11,227 | 85.2% |
| Cellular Data Only | 784 | 5.9% |
| Satellite Internet | 923 | 7.0% |
| No Internet | 805 | 6.1% |
| Total | 13,185 | 100.0% |
Riverton Summary
Riverton, Utah is a city located in Salt Lake County, Utah, United States. It is part of the Salt Lake City metropolitan area. The population was 38,753 at the 2010 census, making it the fourth-largest city in the county.
History
The area that is now Riverton was first settled in 1848 by a group of Mormon pioneers led by John Holladay. The area was originally known as "Holladay's Settlement" and was later renamed "Riverton" after the nearby Jordan River. The city was incorporated in 1868 and has since grown to become one of the largest cities in Salt Lake County.
Geography
Riverton is located in the western part of Salt Lake County, about 15 miles south of Salt Lake City. It is bordered by the cities of South Jordan to the north, Herriman to the west, and Draper to the south. The city covers an area of approximately 11.5 square miles and has an elevation of 4,400 feet.
The city is situated in the foothills of the Wasatch Mountains and is home to several parks and trails, including the Jordan River Parkway Trail, which runs along the Jordan River. The city is also home to the Riverton Golf Course, which is a popular destination for golfers.
Economy
Riverton is home to a variety of businesses and industries, including retail, manufacturing, and healthcare. The city is home to several large employers, including Walmart, Smith's Food and Drug, and Intermountain Healthcare.
The city is also home to several small businesses, including restaurants, shops, and service providers. The city is also home to several technology companies, including Adobe, Ancestry.com, and Vivint.
Demographics
As of the 2010 census, the population of Riverton was 38,753. The racial makeup of the city was 87.3% White, 2.2% African American, 0.7% Native American, 2.7% Asian, 0.2% Pacific Islander, 4.2% from other races, and 3.1% from two or more races. Hispanic or Latino of any race were 8.7% of the population.
The median income for a household in the city was $71,845, and the median income for a family was $80,945. The per capita income for the city was $30,945. About 4.2% of families and 5.7% of the population were below the poverty line, including 6.7% of those under age 18 and 4.2% of those age 65 or over.
Riverton is a diverse and vibrant city with a strong economy and a variety of businesses and industries. The city is home to a variety of parks and trails, as well as a golf course, making it a great place to live and work.
Common Questions
What is Per Capita Income in Riverton?
Per Capita income in Riverton is $39,442.
What is the Median Family Income in Riverton?
Median Family Income in Riverton is $122,743.
What is the Median Household income in Riverton?
Median Household Income in Riverton is $115,869.
What is Income or Wage Gap in Riverton?
Income or Wage Gap in Riverton is 50.5%.
Women in Riverton earn 49.5 cents for every dollar earned by a man.
What is Inequality or Gini Index in Riverton?
Inequality or Gini Index in Riverton is 0.36.
What is the Total Population of Riverton?
Total Population of Riverton is 44,864.
What is the Total Male Population of Riverton?
Total Male Population of Riverton is 23,209.
What is the Total Female Population of Riverton?
Total Female Population of Riverton is 21,655.
What is the Ratio of Males per 100 Females in Riverton?
There are 107.18 Males per 100 Females in Riverton.
What is the Ratio of Females per 100 Males in Riverton?
There are 93.30 Females per 100 Males in Riverton.
What is the Median Population Age in Riverton?
Median Population Age in Riverton is 33.4 Years.
What is the Average Family Size in Riverton
Average Family Size in Riverton is 3.7 People.
What is the Average Household Size in Riverton
Average Household Size in Riverton is 3.4 People.
How Large is the Labor Force in Riverton?
There are 23,137 People in the Labor Forcein in Riverton.
What is the Percentage of People in the Labor Force in Riverton?
72.3% of People are in the Labor Force in Riverton.
What is the Unemployment Rate in Riverton?
Unemployment Rate in Riverton is 3.5%.