Elk Ridge, UT Map & Demographics
Elk Ridge Map
Elk Ridge Overview
$36,724
PER CAPITA INCOME
$129,904
AVG FAMILY INCOME
$126,131
AVG HOUSEHOLD INCOME
59.4%
WAGE / INCOME GAP [ % ]
40.6¢/ $1
WAGE / INCOME GAP [ $ ]
0.32
INEQUALITY / GINI INDEX
4,658
TOTAL POPULATION
2,394
MALE POPULATION
2,264
FEMALE POPULATION
105.74
MALES / 100 FEMALES
94.57
FEMALES / 100 MALES
30.7
MEDIAN AGE
3.8
AVG FAMILY SIZE
3.8
AVG HOUSEHOLD SIZE
1,988
LABOR FORCE [ PEOPLE ]
63.3%
PERCENT IN LABOR FORCE
4.8%
UNEMPLOYMENT RATE
Elk Ridge Area Codes
Income in Elk Ridge
Income Overview in Elk Ridge
Per Capita Income in Elk Ridge is $36,724, while median incomes of families and households are $129,904 and $126,131 respectively.
| Characteristic | Number | Measure |
| Per Capita Income | 4,658 | $36,724 |
| Median Family Income | 1,181 | $129,904 |
| Mean Family Income | 1,181 | $144,787 |
| Median Household Income | 1,229 | $126,131 |
| Mean Household Income | 1,229 | $141,985 |
| Income Deficit | 1,181 | $0 |
| Wage / Income Gap (%) | 4,658 | 59.38% |
| Wage / Income Gap ($) | 4,658 | 40.62¢ per $1 |
| Gini / Inequality Index | 4,658 | 0.32 |
Earnings by Sex in Elk Ridge
Average Earnings in Elk Ridge are $51,294, $70,875 for men and $28,790 for women, a difference of 59.4%.
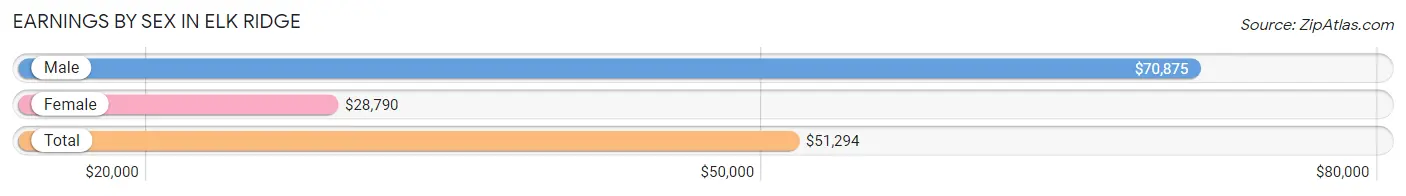
| Sex | Number | Average Earnings |
| Male | 1,300 (59.9%) | $70,875 |
| Female | 870 (40.1%) | $28,790 |
| Total | 2,170 (100.0%) | $51,294 |
Earnings by Sex by Income Bracket in Elk Ridge
The most common earnings brackets in Elk Ridge are $100,000+ for men (375 | 28.8%) and $55,000 to $64,999 for women (143 | 16.4%).
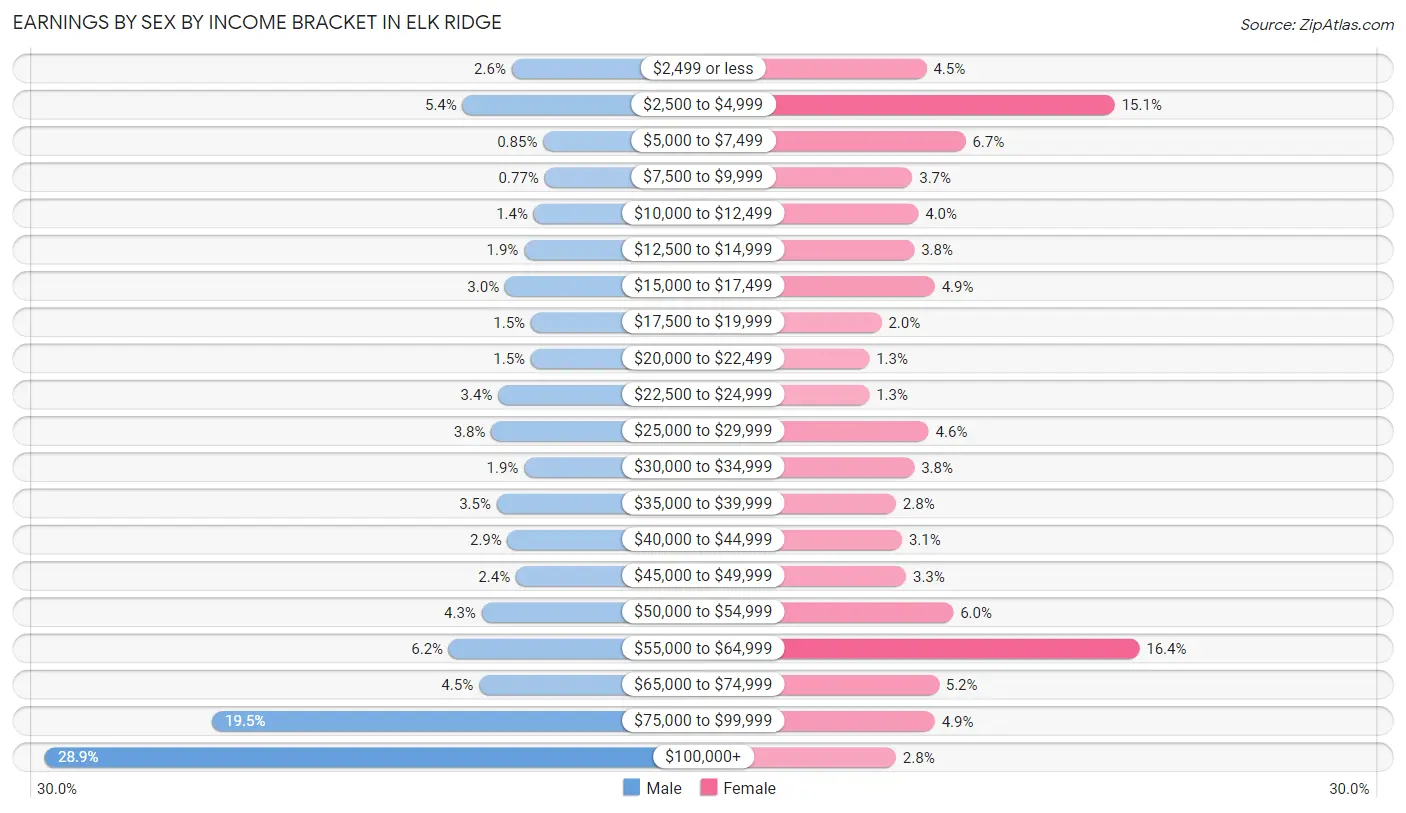
| Income | Male | Female |
| $2,499 or less | 34 (2.6%) | 39 (4.5%) |
| $2,500 to $4,999 | 70 (5.4%) | 131 (15.1%) |
| $5,000 to $7,499 | 11 (0.9%) | 58 (6.7%) |
| $7,500 to $9,999 | 10 (0.8%) | 32 (3.7%) |
| $10,000 to $12,499 | 18 (1.4%) | 35 (4.0%) |
| $12,500 to $14,999 | 25 (1.9%) | 33 (3.8%) |
| $15,000 to $17,499 | 39 (3.0%) | 43 (4.9%) |
| $17,500 to $19,999 | 20 (1.5%) | 17 (1.9%) |
| $20,000 to $22,499 | 20 (1.5%) | 11 (1.3%) |
| $22,500 to $24,999 | 44 (3.4%) | 11 (1.3%) |
| $25,000 to $29,999 | 49 (3.8%) | 40 (4.6%) |
| $30,000 to $34,999 | 25 (1.9%) | 33 (3.8%) |
| $35,000 to $39,999 | 45 (3.5%) | 24 (2.8%) |
| $40,000 to $44,999 | 37 (2.9%) | 27 (3.1%) |
| $45,000 to $49,999 | 31 (2.4%) | 29 (3.3%) |
| $50,000 to $54,999 | 56 (4.3%) | 52 (6.0%) |
| $55,000 to $64,999 | 80 (6.1%) | 143 (16.4%) |
| $65,000 to $74,999 | 58 (4.5%) | 45 (5.2%) |
| $75,000 to $99,999 | 253 (19.5%) | 43 (4.9%) |
| $100,000+ | 375 (28.8%) | 24 (2.8%) |
| Total | 1,300 (100.0%) | 870 (100.0%) |
Earnings by Sex by Educational Attainment in Elk Ridge
Average earnings in Elk Ridge are $86,696 for men and $46,000 for women, a difference of 46.9%. Men with an educational attainment of bachelor's degree enjoy the highest average annual earnings of $94,286, while those with high school diploma education earn the least with $60,938. Women with an educational attainment of graduate degree earn the most with the average annual earnings of $64,886, while those with high school diploma education have the smallest earnings of $29,808.
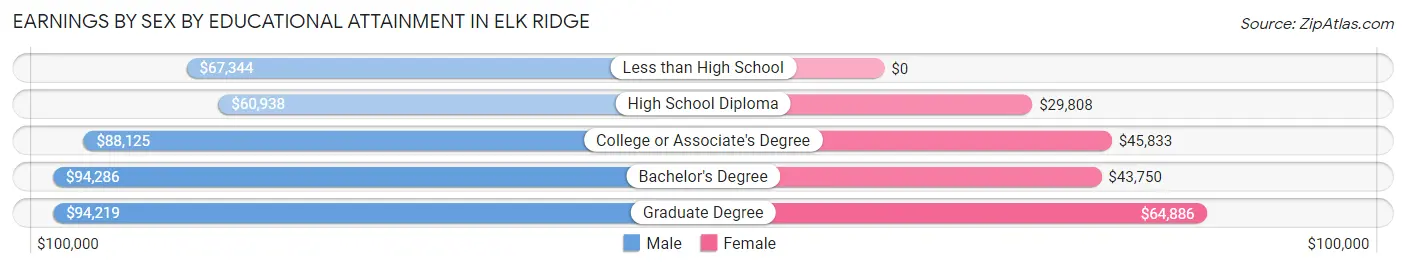
| Educational Attainment | Male Income | Female Income |
| Less than High School | $67,344 | $0 |
| High School Diploma | $60,938 | $29,808 |
| College or Associate's Degree | $88,125 | $45,833 |
| Bachelor's Degree | $94,286 | $43,750 |
| Graduate Degree | $94,219 | $64,886 |
| Total | $86,696 | $46,000 |
Family Income in Elk Ridge
Family Income Brackets in Elk Ridge
According to the Elk Ridge family income data, there are 458 families falling into the $100,000 to $149,999 income range, which is the most common income bracket and makes up 38.8% of all families.
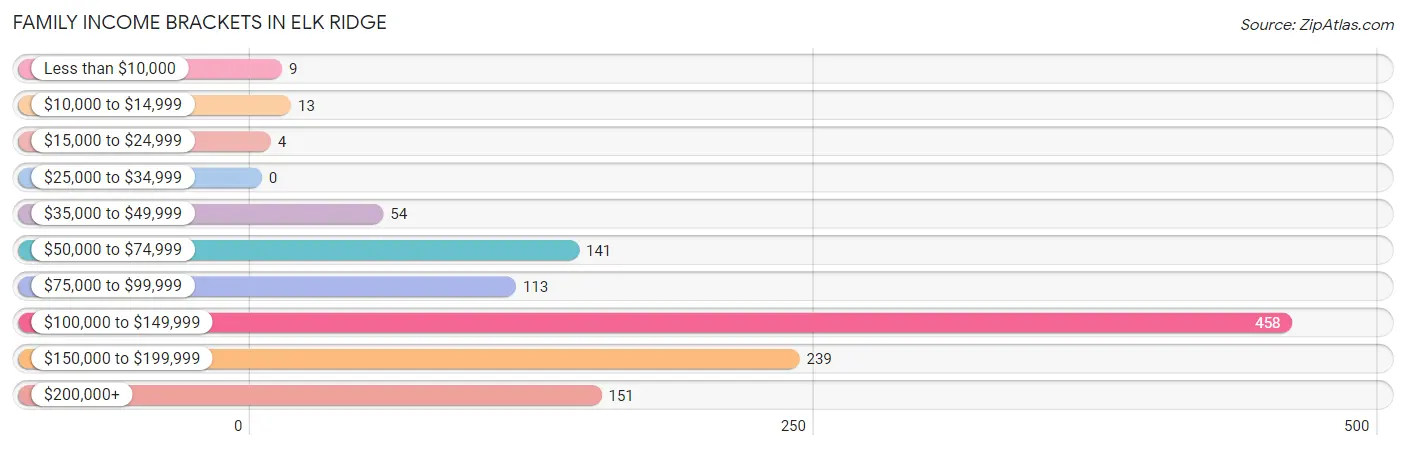
| Income Bracket | # Families | % Families |
| Less than $10,000 | 9 | 0.8% |
| $10,000 to $14,999 | 13 | 1.1% |
| $15,000 to $24,999 | 4 | 0.3% |
| $25,000 to $34,999 | 0 | 0.0% |
| $35,000 to $49,999 | 54 | 4.6% |
| $50,000 to $74,999 | 141 | 11.9% |
| $75,000 to $99,999 | 113 | 9.6% |
| $100,000 to $149,999 | 458 | 38.8% |
| $150,000 to $199,999 | 239 | 20.2% |
| $200,000+ | 151 | 12.8% |
Family Income by Famaliy Size in Elk Ridge
7+ person families (95 | 8.0%) account for the highest median family income in Elk Ridge with $177,153 per family, while 2-person families (431 | 36.5%) have the highest median income of $54,973 per family member.
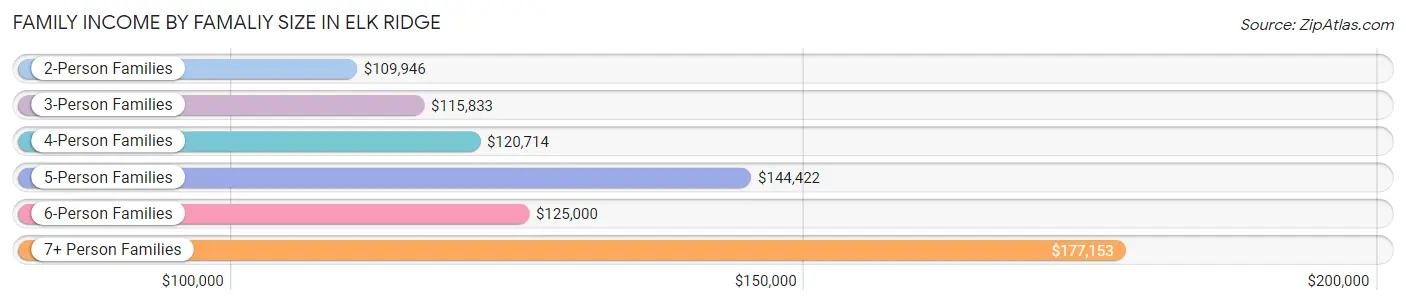
| Income Bracket | # Families | Median Income |
| 2-Person Families | 431 (36.5%) | $109,946 |
| 3-Person Families | 126 (10.7%) | $115,833 |
| 4-Person Families | 182 (15.4%) | $120,714 |
| 5-Person Families | 193 (16.3%) | $144,422 |
| 6-Person Families | 154 (13.0%) | $125,000 |
| 7+ Person Families | 95 (8.0%) | $177,153 |
| Total | 1,181 (100.0%) | $129,904 |
Family Income by Number of Earners in Elk Ridge
The median family income in Elk Ridge is $129,904, with families comprising 3+ earners (207) having the highest median family income of $176,520, while families with no earners (107) have the lowest median family income of $70,417, accounting for 17.5% and 9.1% of families, respectively.
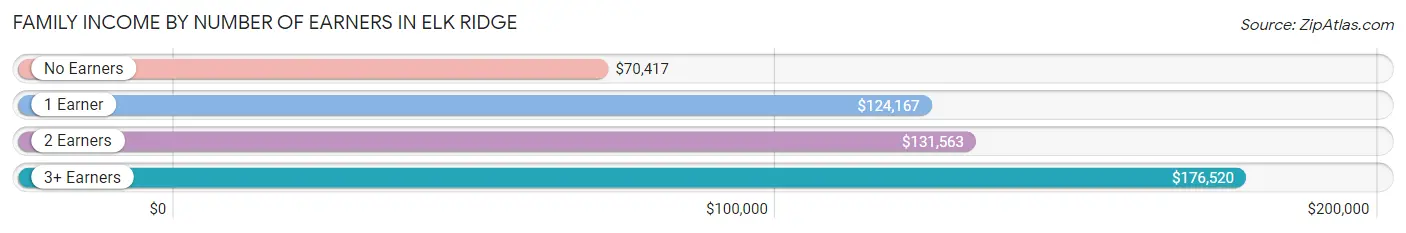
| Number of Earners | # Families | Median Income |
| No Earners | 107 (9.1%) | $70,417 |
| 1 Earner | 390 (33.0%) | $124,167 |
| 2 Earners | 477 (40.4%) | $131,563 |
| 3+ Earners | 207 (17.5%) | $176,520 |
| Total | 1,181 (100.0%) | $129,904 |
Household Income in Elk Ridge
Household Income Brackets in Elk Ridge
With 461 households falling in the category, the $100,000 to $149,999 income range is the most frequent in Elk Ridge, accounting for 37.5% of all households. In contrast, only 2 households (0.2%) fall into the $25,000 to $34,999 income bracket, making it the least populous group.
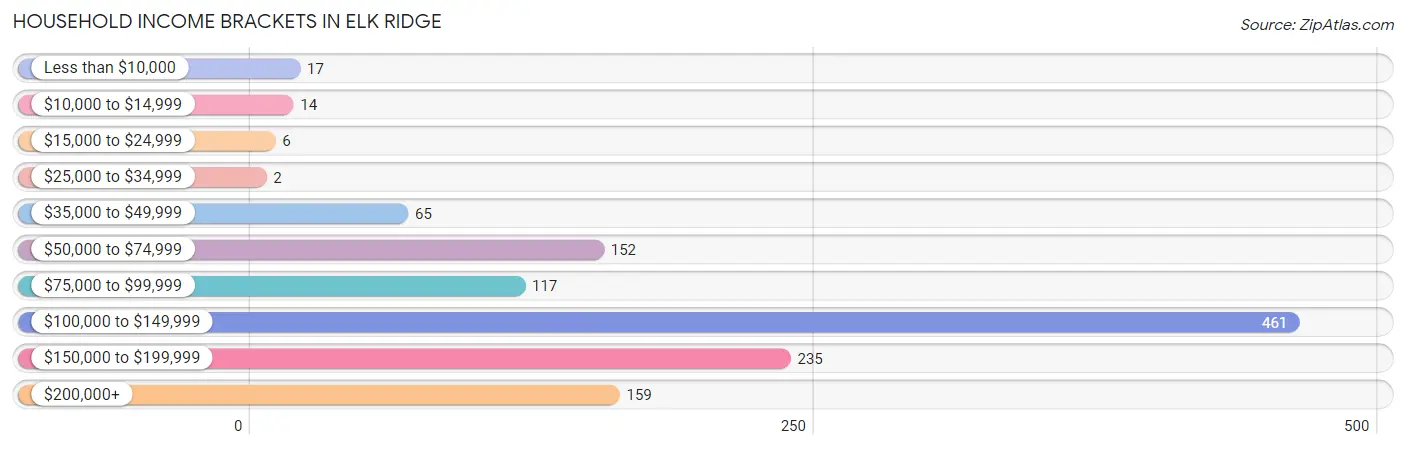
| Income Bracket | # Households | % Households |
| Less than $10,000 | 17 | 1.4% |
| $10,000 to $14,999 | 14 | 1.1% |
| $15,000 to $24,999 | 6 | 0.5% |
| $25,000 to $34,999 | 2 | 0.2% |
| $35,000 to $49,999 | 65 | 5.3% |
| $50,000 to $74,999 | 152 | 12.4% |
| $75,000 to $99,999 | 117 | 9.5% |
| $100,000 to $149,999 | 461 | 37.5% |
| $150,000 to $199,999 | 235 | 19.1% |
| $200,000+ | 159 | 12.9% |
Household Income by Householder Age in Elk Ridge
The median household income in Elk Ridge is $126,131, with the highest median household income of $147,295 found in the 45 to 64 years age bracket for the primary householder. A total of 541 households (44.0%) fall into this category. Meanwhile, the 15 to 24 years age bracket for the primary householder has the lowest median household income of $0, with 13 households (1.1%) in this group.
| Income Bracket | # Households | Median Income |
| 15 to 24 Years | 13 (1.1%) | $0 |
| 25 to 44 Years | 448 (36.4%) | $127,955 |
| 45 to 64 Years | 541 (44.0%) | $147,295 |
| 65+ Years | 227 (18.5%) | $74,097 |
| Total | 1,229 (100.0%) | $126,131 |
Poverty in Elk Ridge
Income Below Poverty by Sex and Age in Elk Ridge
With 3.0% poverty level for males and 2.9% for females among the residents of Elk Ridge, 15 year old males and 18 to 24 year old females are the most vulnerable to poverty, with 7 males (35.0%) and 28 females (15.5%) in their respective age groups living below the poverty level.
| Age Bracket | Male | Female |
| Under 5 Years | 0 (0.0%) | 0 (0.0%) |
| 5 Years | 0 (0.0%) | 0 (0.0%) |
| 6 to 11 Years | 10 (2.9%) | 7 (2.6%) |
| 12 to 14 Years | 5 (3.7%) | 3 (2.8%) |
| 15 Years | 7 (35.0%) | 0 (0.0%) |
| 16 and 17 Years | 2 (1.7%) | 4 (5.2%) |
| 18 to 24 Years | 21 (9.0%) | 28 (15.5%) |
| 25 to 34 Years | 10 (4.0%) | 0 (0.0%) |
| 35 to 44 Years | 4 (1.5%) | 11 (6.3%) |
| 45 to 54 Years | 5 (2.2%) | 3 (1.3%) |
| 55 to 64 Years | 0 (0.0%) | 3 (1.0%) |
| 65 to 74 Years | 7 (5.8%) | 6 (4.6%) |
| 75 Years and over | 0 (0.0%) | 0 (0.0%) |
| Total | 71 (3.0%) | 65 (2.9%) |
Income Above Poverty by Sex and Age in Elk Ridge
According to the poverty statistics in Elk Ridge, males aged under 5 years and females aged under 5 years are the age groups that are most secure financially, with 100.0% of males and 100.0% of females in these age groups living above the poverty line.
| Age Bracket | Male | Female |
| Under 5 Years | 243 (100.0%) | 257 (100.0%) |
| 5 Years | 35 (100.0%) | 31 (100.0%) |
| 6 to 11 Years | 338 (97.1%) | 259 (97.4%) |
| 12 to 14 Years | 131 (96.3%) | 103 (97.2%) |
| 15 Years | 13 (65.0%) | 76 (100.0%) |
| 16 and 17 Years | 119 (98.4%) | 73 (94.8%) |
| 18 to 24 Years | 211 (90.9%) | 153 (84.5%) |
| 25 to 34 Years | 240 (96.0%) | 360 (100.0%) |
| 35 to 44 Years | 268 (98.5%) | 164 (93.7%) |
| 45 to 54 Years | 227 (97.8%) | 220 (98.7%) |
| 55 to 64 Years | 279 (100.0%) | 306 (99.0%) |
| 65 to 74 Years | 113 (94.2%) | 123 (95.4%) |
| 75 Years and over | 98 (100.0%) | 74 (100.0%) |
| Total | 2,315 (97.0%) | 2,199 (97.1%) |
Income Below Poverty Among Married-Couple Families in Elk Ridge
The poverty statistics for married-couple families in Elk Ridge show that 2.6% or 29 of the total 1,099 families live below the poverty line. Families with 5 or more children have the highest poverty rate of 9.8%, comprising of 5 families. On the other hand, families with 1 or 2 children have the lowest poverty rate of 0.0%, which includes 0 families.
| Children | Above Poverty | Below Poverty |
| No Children | 484 (96.0%) | 20 (4.0%) |
| 1 or 2 Children | 246 (100.0%) | 0 (0.0%) |
| 3 or 4 Children | 294 (98.7%) | 4 (1.3%) |
| 5 or more Children | 46 (90.2%) | 5 (9.8%) |
| Total | 1,070 (97.4%) | 29 (2.6%) |
Income Below Poverty Among Single-Parent Households in Elk Ridge
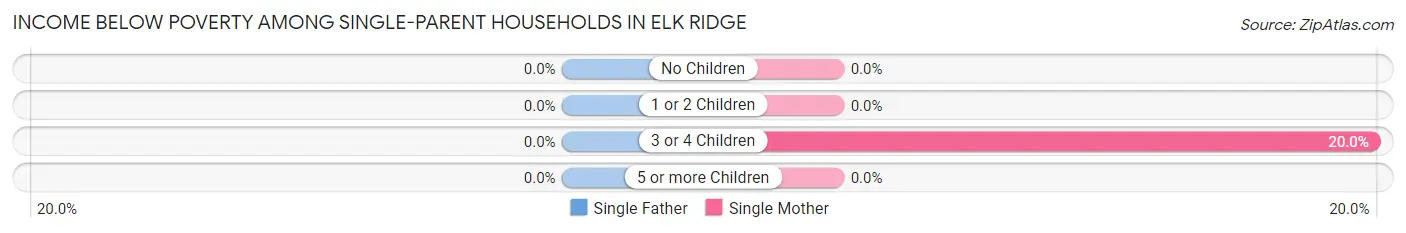
| Children | Single Father | Single Mother |
| No Children | 0 (0.0%) | 0 (0.0%) |
| 1 or 2 Children | 0 (0.0%) | 0 (0.0%) |
| 3 or 4 Children | 0 (0.0%) | 2 (20.0%) |
| 5 or more Children | 0 (0.0%) | 0 (0.0%) |
| Total | 0 (0.0%) | 2 (3.3%) |
Income Below Poverty Among Married-Couple vs Single-Parent Households in Elk Ridge
The poverty data for Elk Ridge shows that 29 of the married-couple family households (2.6%) and 2 of the single-parent households (2.4%) are living below the poverty level. Within the married-couple family households, those with 5 or more children have the highest poverty rate, with 5 households (9.8%) falling below the poverty line. Among the single-parent households, those with 3 or 4 children have the highest poverty rate, with 2 household (20.0%) living below poverty.
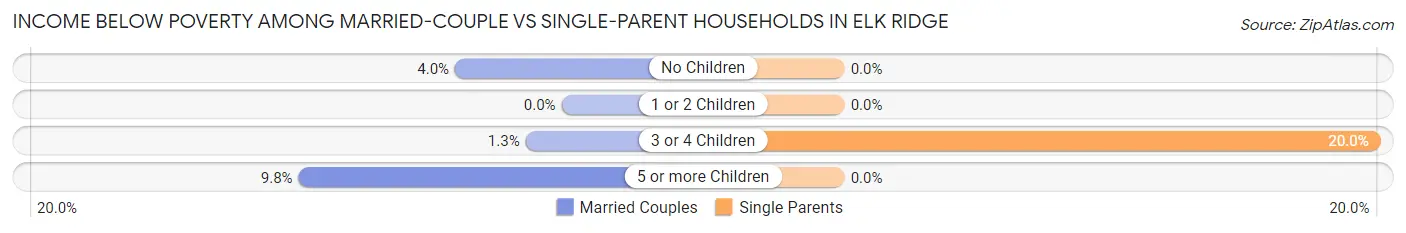
| Children | Married-Couple Families | Single-Parent Households |
| No Children | 20 (4.0%) | 0 (0.0%) |
| 1 or 2 Children | 0 (0.0%) | 0 (0.0%) |
| 3 or 4 Children | 4 (1.3%) | 2 (20.0%) |
| 5 or more Children | 5 (9.8%) | 0 (0.0%) |
| Total | 29 (2.6%) | 2 (2.4%) |
Race in Elk Ridge
The most populous races in Elk Ridge are White / Caucasian (4,378 | 94.0%), Hispanic or Latino (201 | 4.3%), and Two or more Races (176 | 3.8%).
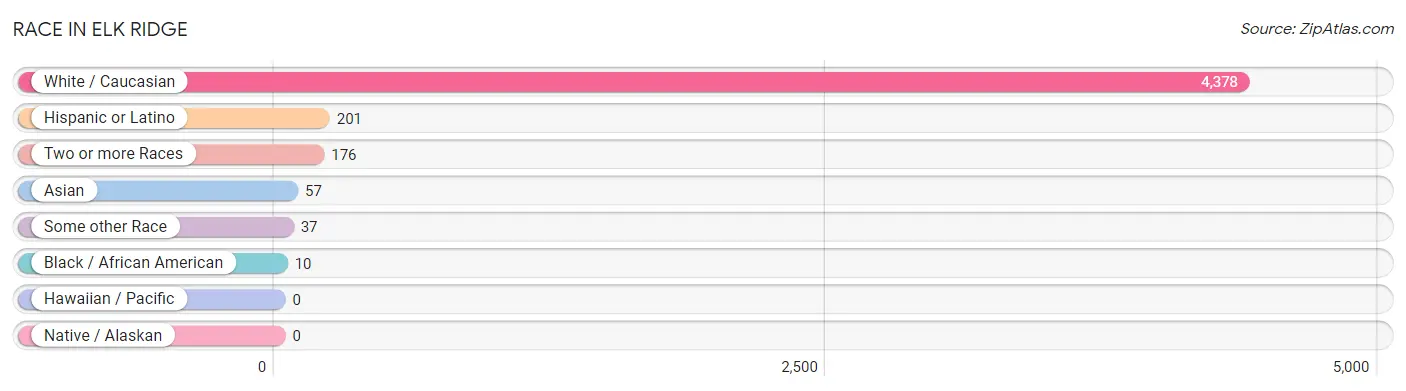
| Race | # Population | % Population |
| Asian | 57 | 1.2% |
| Black / African American | 10 | 0.2% |
| Hawaiian / Pacific | 0 | 0.0% |
| Hispanic or Latino | 201 | 4.3% |
| Native / Alaskan | 0 | 0.0% |
| White / Caucasian | 4,378 | 94.0% |
| Two or more Races | 176 | 3.8% |
| Some other Race | 37 | 0.8% |
| Total | 4,658 | 100.0% |
Ancestry in Elk Ridge
The most populous ancestries reported in Elk Ridge are English (1,643 | 35.3%), German (537 | 11.5%), Danish (406 | 8.7%), Dutch (279 | 6.0%), and American (203 | 4.4%), together accounting for 65.9% of all Elk Ridge residents.
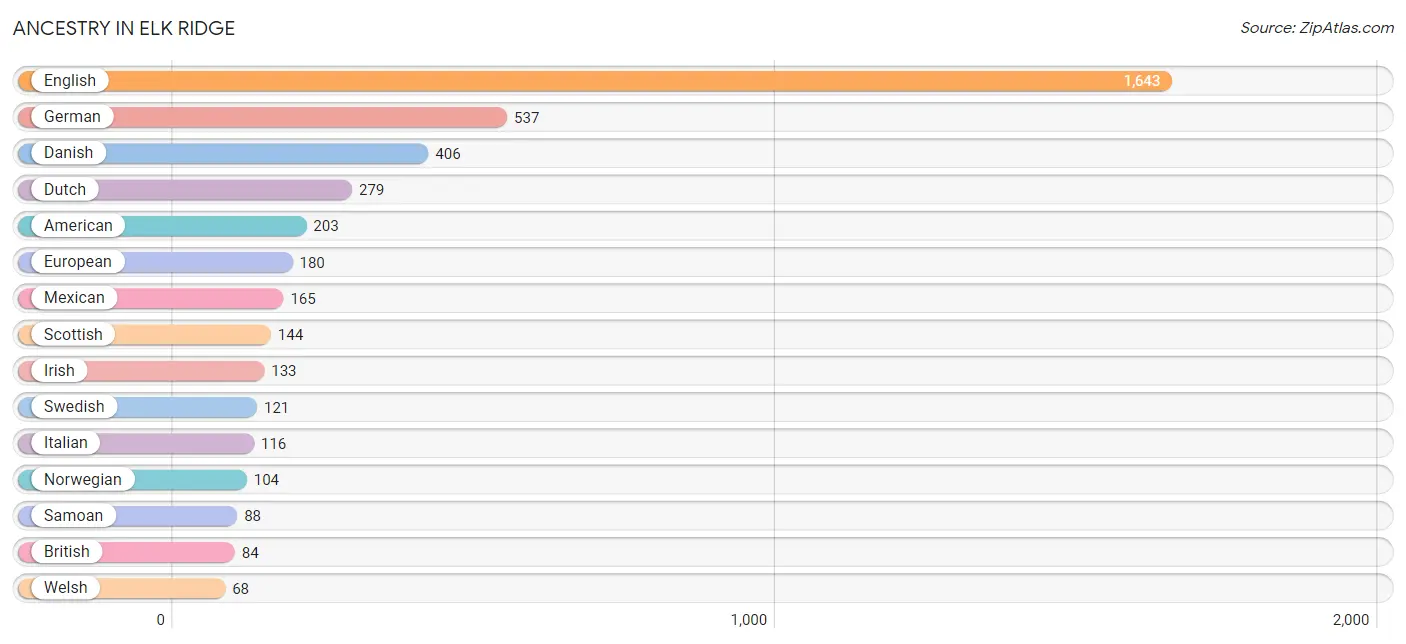
| Ancestry | # Population | % Population |
| American | 203 | 4.4% |
| Argentinean | 3 | 0.1% |
| Bhutanese | 4 | 0.1% |
| British | 84 | 1.8% |
| Burmese | 26 | 0.6% |
| Canadian | 4 | 0.1% |
| Central American | 8 | 0.2% |
| Choctaw | 15 | 0.3% |
| Croatian | 4 | 0.1% |
| Cuban | 7 | 0.2% |
| Czech | 3 | 0.1% |
| Danish | 406 | 8.7% |
| Dutch | 279 | 6.0% |
| English | 1,643 | 35.3% |
| European | 180 | 3.9% |
| Finnish | 5 | 0.1% |
| French | 38 | 0.8% |
| German | 537 | 11.5% |
| Greek | 14 | 0.3% |
| Guatemalan | 8 | 0.2% |
| Indian (Asian) | 49 | 1.1% |
| Irish | 133 | 2.9% |
| Italian | 116 | 2.5% |
| Lithuanian | 4 | 0.1% |
| Malaysian | 5 | 0.1% |
| Mexican | 165 | 3.5% |
| Native Hawaiian | 17 | 0.4% |
| Navajo | 16 | 0.3% |
| Northern European | 23 | 0.5% |
| Norwegian | 104 | 2.2% |
| Pakistani | 3 | 0.1% |
| Polish | 6 | 0.1% |
| Portuguese | 17 | 0.4% |
| Romanian | 9 | 0.2% |
| Russian | 7 | 0.2% |
| Samoan | 88 | 1.9% |
| Scandinavian | 56 | 1.2% |
| Scotch-Irish | 67 | 1.4% |
| Scottish | 144 | 3.1% |
| Slovene | 22 | 0.5% |
| South American | 3 | 0.1% |
| Spaniard | 18 | 0.4% |
| Swedish | 121 | 2.6% |
| Swiss | 12 | 0.3% |
| Ute | 10 | 0.2% |
| Welsh | 68 | 1.5% | View All 46 Rows |
Immigrants in Elk Ridge
The most numerous immigrant groups reported in Elk Ridge came from Asia (34 | 0.7%), Eastern Asia (20 | 0.4%), China (16 | 0.3%), Europe (15 | 0.3%), and South Eastern Asia (14 | 0.3%), together accounting for 2.1% of all Elk Ridge residents.
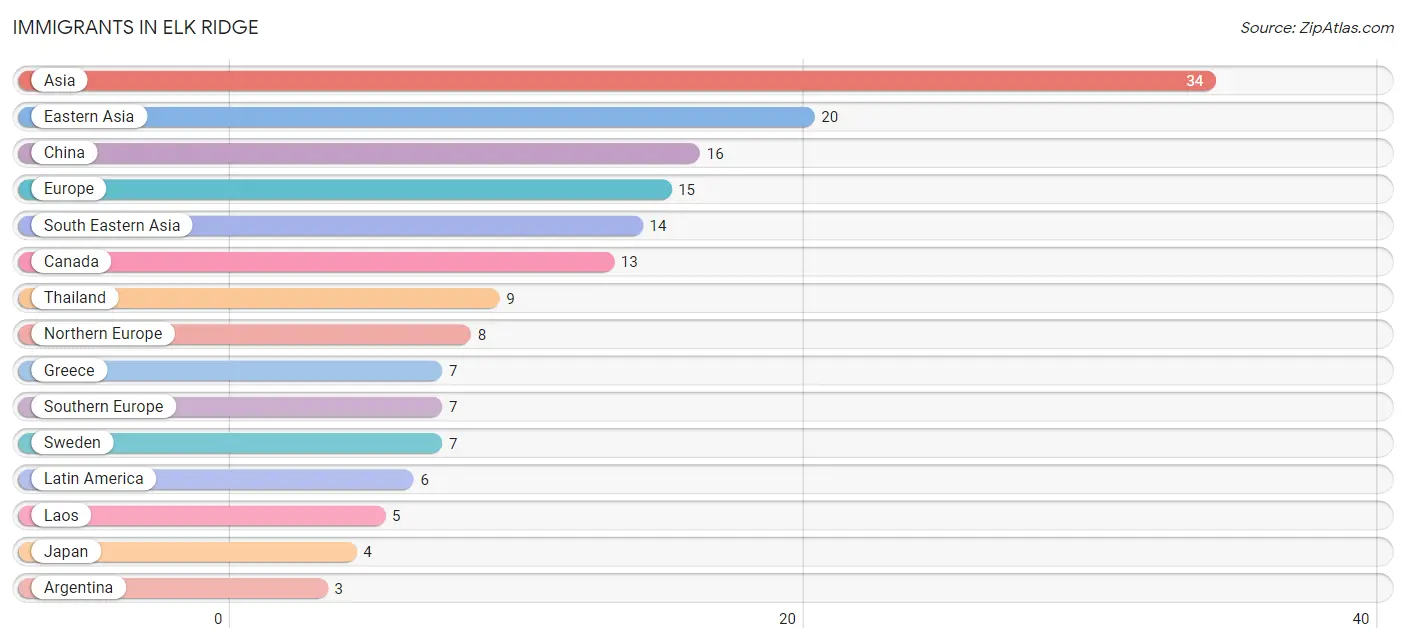
| Immigration Origin | # Population | % Population |
| Argentina | 3 | 0.1% |
| Asia | 34 | 0.7% |
| Canada | 13 | 0.3% |
| Central America | 3 | 0.1% |
| China | 16 | 0.3% |
| Eastern Asia | 20 | 0.4% |
| England | 1 | 0.0% |
| Europe | 15 | 0.3% |
| Greece | 7 | 0.2% |
| Guatemala | 3 | 0.1% |
| Japan | 4 | 0.1% |
| Laos | 5 | 0.1% |
| Latin America | 6 | 0.1% |
| Northern Europe | 8 | 0.2% |
| South America | 3 | 0.1% |
| South Eastern Asia | 14 | 0.3% |
| Southern Europe | 7 | 0.2% |
| Sweden | 7 | 0.2% |
| Thailand | 9 | 0.2% | View All 19 Rows |
Sex and Age in Elk Ridge
Sex and Age in Elk Ridge
The most populous age groups in Elk Ridge are 5 to 9 Years (326 | 13.6%) for men and 30 to 34 Years (275 | 12.1%) for women.
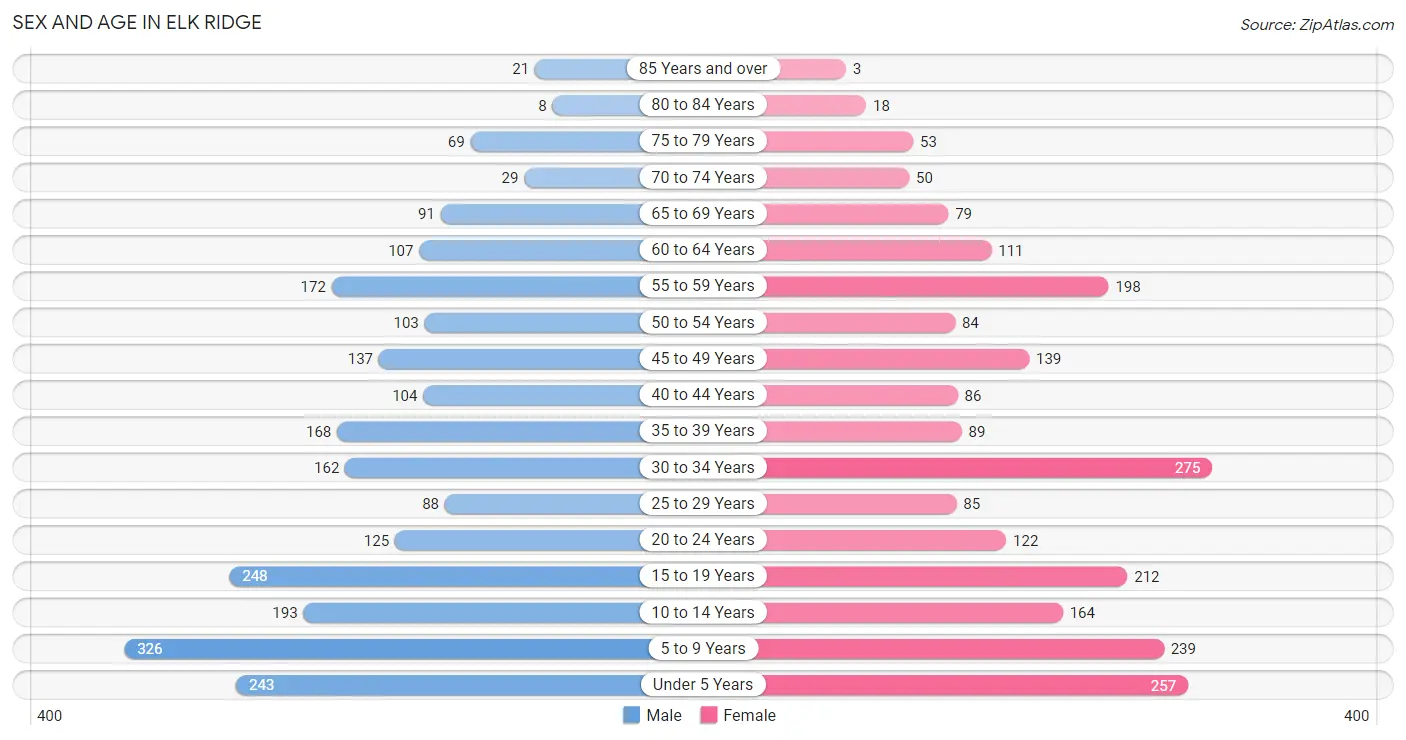
| Age Bracket | Male | Female |
| Under 5 Years | 243 (10.2%) | 257 (11.4%) |
| 5 to 9 Years | 326 (13.6%) | 239 (10.6%) |
| 10 to 14 Years | 193 (8.1%) | 164 (7.2%) |
| 15 to 19 Years | 248 (10.4%) | 212 (9.4%) |
| 20 to 24 Years | 125 (5.2%) | 122 (5.4%) |
| 25 to 29 Years | 88 (3.7%) | 85 (3.7%) |
| 30 to 34 Years | 162 (6.8%) | 275 (12.1%) |
| 35 to 39 Years | 168 (7.0%) | 89 (3.9%) |
| 40 to 44 Years | 104 (4.3%) | 86 (3.8%) |
| 45 to 49 Years | 137 (5.7%) | 139 (6.1%) |
| 50 to 54 Years | 103 (4.3%) | 84 (3.7%) |
| 55 to 59 Years | 172 (7.2%) | 198 (8.7%) |
| 60 to 64 Years | 107 (4.5%) | 111 (4.9%) |
| 65 to 69 Years | 91 (3.8%) | 79 (3.5%) |
| 70 to 74 Years | 29 (1.2%) | 50 (2.2%) |
| 75 to 79 Years | 69 (2.9%) | 53 (2.3%) |
| 80 to 84 Years | 8 (0.3%) | 18 (0.8%) |
| 85 Years and over | 21 (0.9%) | 3 (0.1%) |
| Total | 2,394 (100.0%) | 2,264 (100.0%) |
Families and Households in Elk Ridge
Median Family Size in Elk Ridge
The median family size in Elk Ridge is 3.84 persons per family, with married-couple families (1,099 | 93.1%) accounting for the largest median family size of 3.84 persons per family. On the other hand, single male/father families (22 | 1.9%) represent the smallest median family size with 3.68 persons per family.
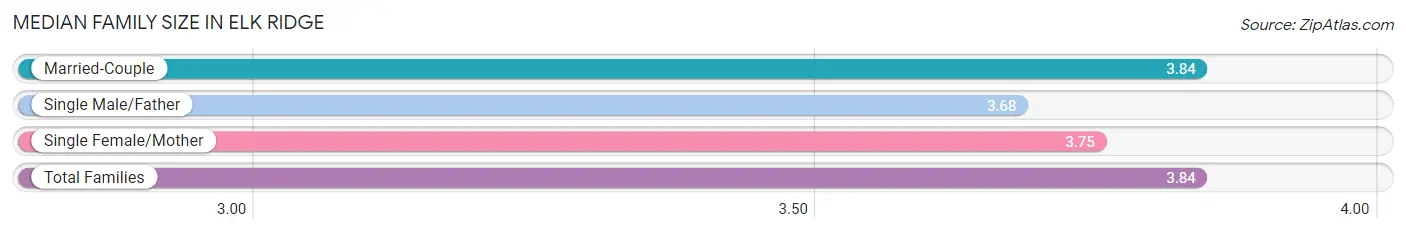
| Family Type | # Families | Family Size |
| Married-Couple | 1,099 (93.1%) | 3.84 |
| Single Male/Father | 22 (1.9%) | 3.68 |
| Single Female/Mother | 60 (5.1%) | 3.75 |
| Total Families | 1,181 (100.0%) | 3.84 |
Median Household Size in Elk Ridge
The median household size in Elk Ridge is 3.78 persons per household, with married-couple households (1,099 | 89.4%) accounting for the largest median household size of 3.9 persons per household. non-family households (48 | 3.9%) represent the smallest median household size with 1.08 persons per household.
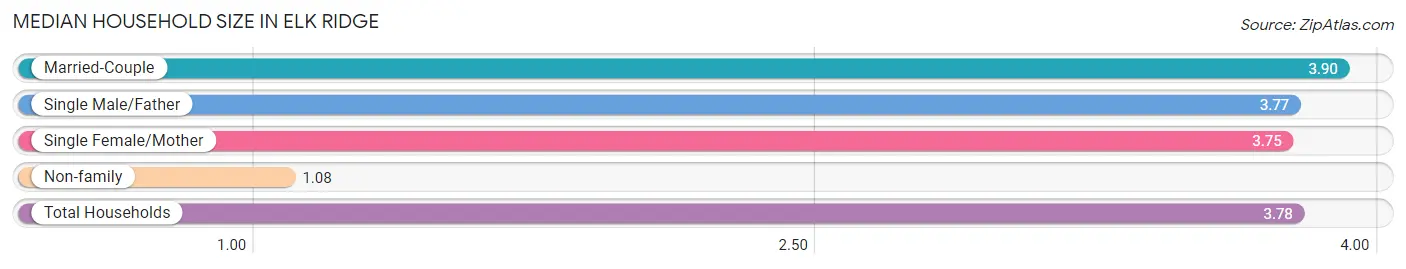
| Household Type | # Households | Household Size |
| Married-Couple | 1,099 (89.4%) | 3.90 |
| Single Male/Father | 22 (1.8%) | 3.77 |
| Single Female/Mother | 60 (4.9%) | 3.75 |
| Non-family | 48 (3.9%) | 1.08 |
| Total Households | 1,229 (100.0%) | 3.78 |
Household Size by Marriage Status in Elk Ridge
Out of a total of 1,229 households in Elk Ridge, 1,181 (96.1%) are family households, while 48 (3.9%) are nonfamily households. The most numerous type of family households are 2-person households, comprising 429, and the most common type of nonfamily households are 1-person households, comprising 44.
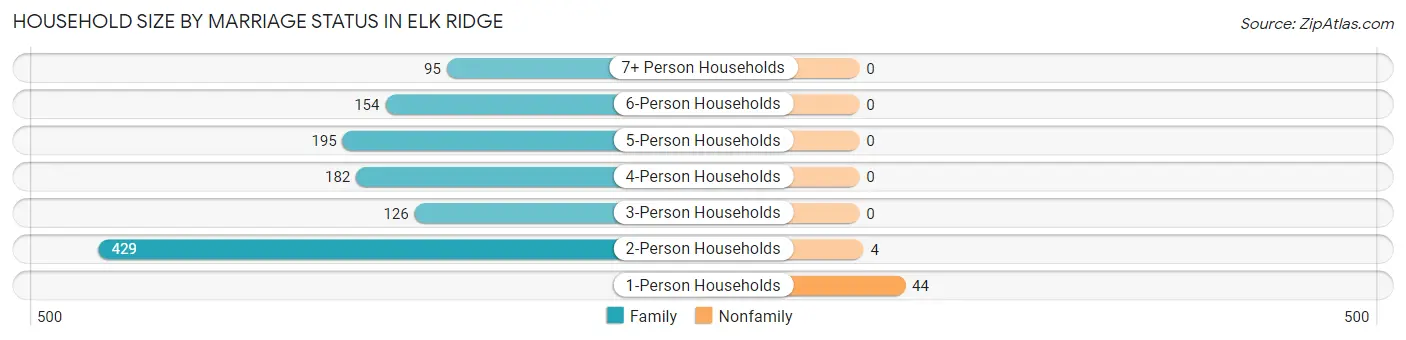
| Household Size | Family Households | Nonfamily Households |
| 1-Person Households | - | 44 (3.6%) |
| 2-Person Households | 429 (34.9%) | 4 (0.3%) |
| 3-Person Households | 126 (10.2%) | 0 (0.0%) |
| 4-Person Households | 182 (14.8%) | 0 (0.0%) |
| 5-Person Households | 195 (15.9%) | 0 (0.0%) |
| 6-Person Households | 154 (12.5%) | 0 (0.0%) |
| 7+ Person Households | 95 (7.7%) | 0 (0.0%) |
| Total | 1,181 (96.1%) | 48 (3.9%) |
Female Fertility in Elk Ridge
Fertility by Age in Elk Ridge
Average fertility rate in Elk Ridge is 82.0 births per 1,000 women. Women in the age bracket of 20 to 34 years have the highest fertility rate with 145.0 births per 1,000 women. Women in the age bracket of 20 to 34 years acount for 83.3% of all women with births.
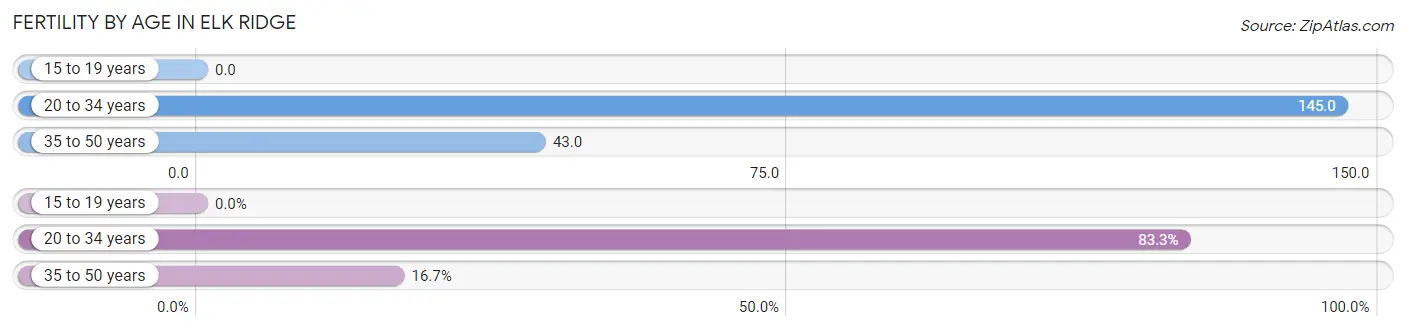
| Age Bracket | Women with Births | Births / 1,000 Women |
| 15 to 19 years | 0 (0.0%) | 0.0 |
| 20 to 34 years | 70 (83.3%) | 145.0 |
| 35 to 50 years | 14 (16.7%) | 43.0 |
| Total | 84 (100.0%) | 82.0 |
Fertility by Age by Marriage Status in Elk Ridge
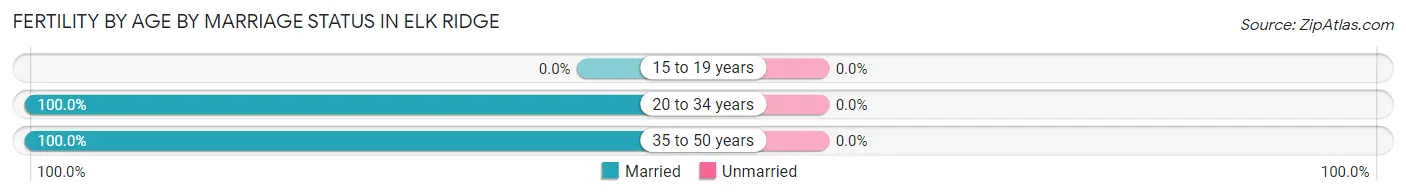
| Age Bracket | Married | Unmarried |
| 15 to 19 years | 0 (0.0%) | 0 (0.0%) |
| 20 to 34 years | 70 (100.0%) | 0 (0.0%) |
| 35 to 50 years | 14 (100.0%) | 0 (0.0%) |
| Total | 84 (100.0%) | 0 (0.0%) |
Fertility by Education in Elk Ridge
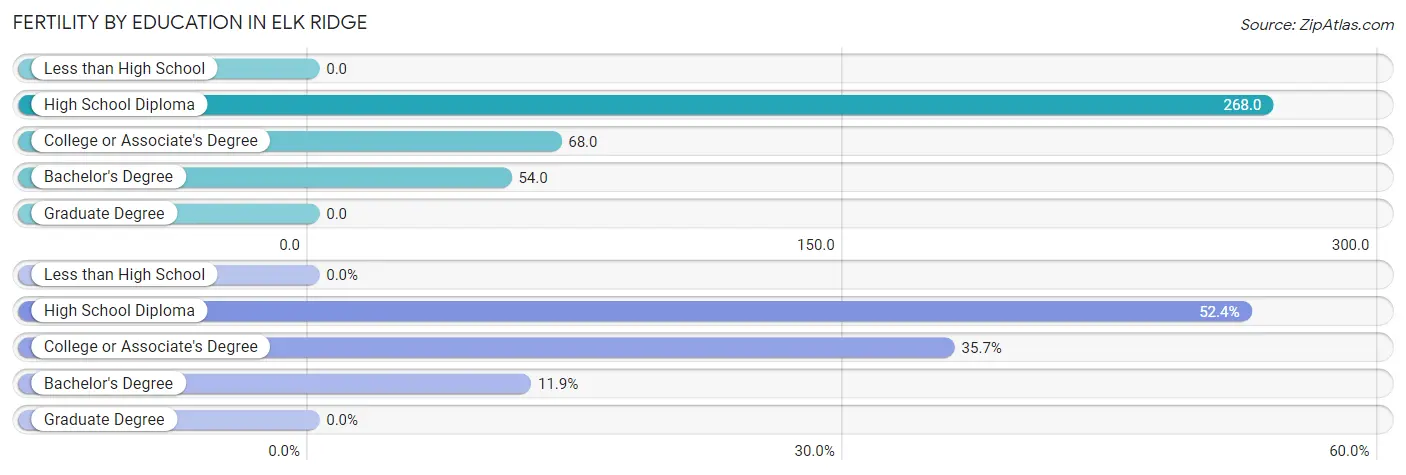
| Educational Attainment | Women with Births | Births / 1,000 Women |
| Less than High School | 0 (0.0%) | 0.0 |
| High School Diploma | 44 (52.4%) | 268.0 |
| College or Associate's Degree | 30 (35.7%) | 68.0 |
| Bachelor's Degree | 10 (11.9%) | 54.0 |
| Graduate Degree | 0 (0.0%) | 0.0 |
| Total | 84 (100.0%) | 82.0 |
Fertility by Education by Marriage Status in Elk Ridge
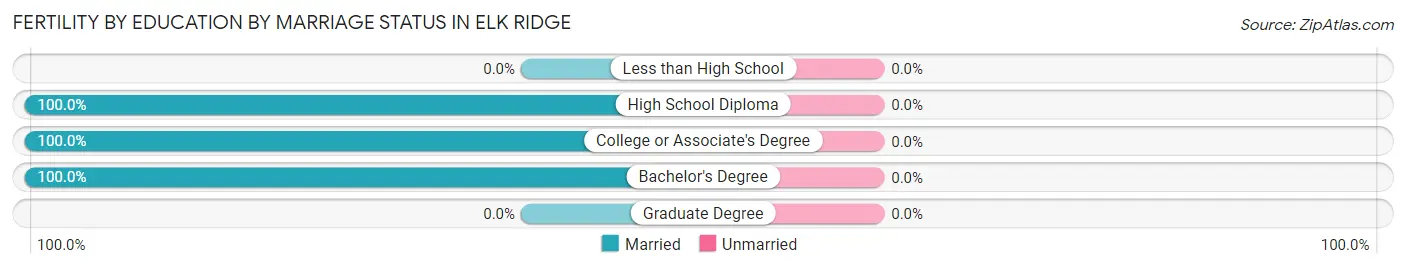
| Educational Attainment | Married | Unmarried |
| Less than High School | 0 (0.0%) | 0 (0.0%) |
| High School Diploma | 44 (100.0%) | 0 (0.0%) |
| College or Associate's Degree | 30 (100.0%) | 0 (0.0%) |
| Bachelor's Degree | 10 (100.0%) | 0 (0.0%) |
| Graduate Degree | 0 (0.0%) | 0 (0.0%) |
| Total | 84 (100.0%) | 0 (0.0%) |
Employment Characteristics in Elk Ridge
Employment by Class of Employer in Elk Ridge
Among the 1,885 employed individuals in Elk Ridge, private company employees (1,334 | 70.8%), not-for-profit organizations (133 | 7.1%), and self-employed (not incorporated) (131 | 7.0%) make up the most common classes of employment.
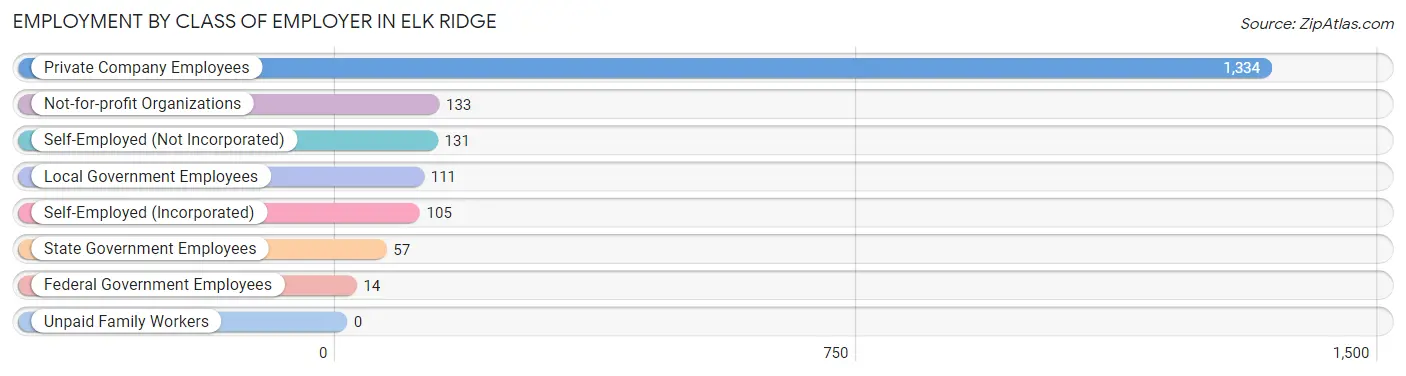
| Employer Class | # Employees | % Employees |
| Private Company Employees | 1,334 | 70.8% |
| Self-Employed (Incorporated) | 105 | 5.6% |
| Self-Employed (Not Incorporated) | 131 | 7.0% |
| Not-for-profit Organizations | 133 | 7.1% |
| Local Government Employees | 111 | 5.9% |
| State Government Employees | 57 | 3.0% |
| Federal Government Employees | 14 | 0.7% |
| Unpaid Family Workers | 0 | 0.0% |
| Total | 1,885 | 100.0% |
Employment Status by Age in Elk Ridge
According to the labor force statistics for Elk Ridge, out of the total population over 16 years of age (3,140), 63.3% or 1,988 individuals are in the labor force, with 4.8% or 95 of them unemployed. The age group with the highest labor force participation rate is 45 to 54 years, with 84.0% or 389 individuals in the labor force. Within the labor force, the 16 to 19 years age range has the highest percentage of unemployed individuals, with 19.9% or 38 of them being unemployed.
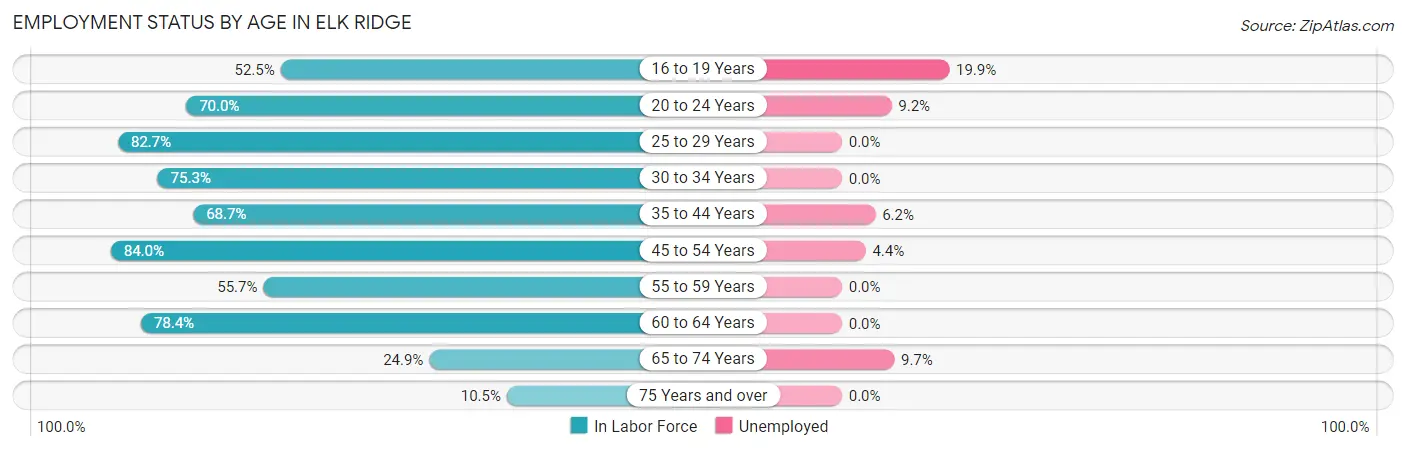
| Age Bracket | In Labor Force | Unemployed |
| 16 to 19 Years | 191 (52.5%) | 38 (19.9%) |
| 20 to 24 Years | 173 (70.0%) | 16 (9.2%) |
| 25 to 29 Years | 143 (82.7%) | 0 (0.0%) |
| 30 to 34 Years | 329 (75.3%) | 0 (0.0%) |
| 35 to 44 Years | 307 (68.7%) | 19 (6.2%) |
| 45 to 54 Years | 389 (84.0%) | 17 (4.4%) |
| 55 to 59 Years | 206 (55.7%) | 0 (0.0%) |
| 60 to 64 Years | 171 (78.4%) | 0 (0.0%) |
| 65 to 74 Years | 62 (24.9%) | 6 (9.7%) |
| 75 Years and over | 18 (10.5%) | 0 (0.0%) |
| Total | 1,988 (63.3%) | 95 (4.8%) |
Employment Status by Educational Attainment in Elk Ridge
According to labor force statistics for Elk Ridge, 73.3% of individuals (1,545) out of the total population between 25 and 64 years of age (2,108) are in the labor force, with 2.3% or 36 of them being unemployed. The group with the highest labor force participation rate are those with the educational attainment of bachelor's degree or higher, with 79.3% or 595 individuals in the labor force. Within the labor force, individuals with high school diploma education have the highest percentage of unemployment, with 6.9% or 17 of them being unemployed.
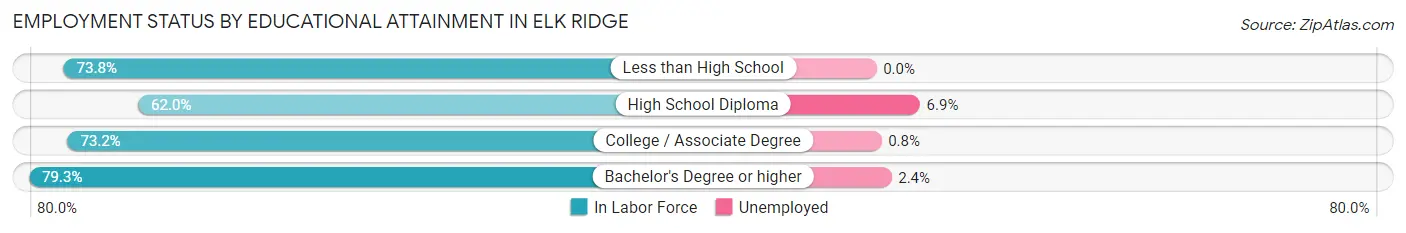
| Educational Attainment | In Labor Force | Unemployed |
| Less than High School | 45 (73.8%) | 0 (0.0%) |
| High School Diploma | 246 (62.0%) | 27 (6.9%) |
| College / Associate Degree | 659 (73.2%) | 7 (0.8%) |
| Bachelor's Degree or higher | 595 (79.3%) | 18 (2.4%) |
| Total | 1,545 (73.3%) | 48 (2.3%) |
Employment Occupations by Sex in Elk Ridge
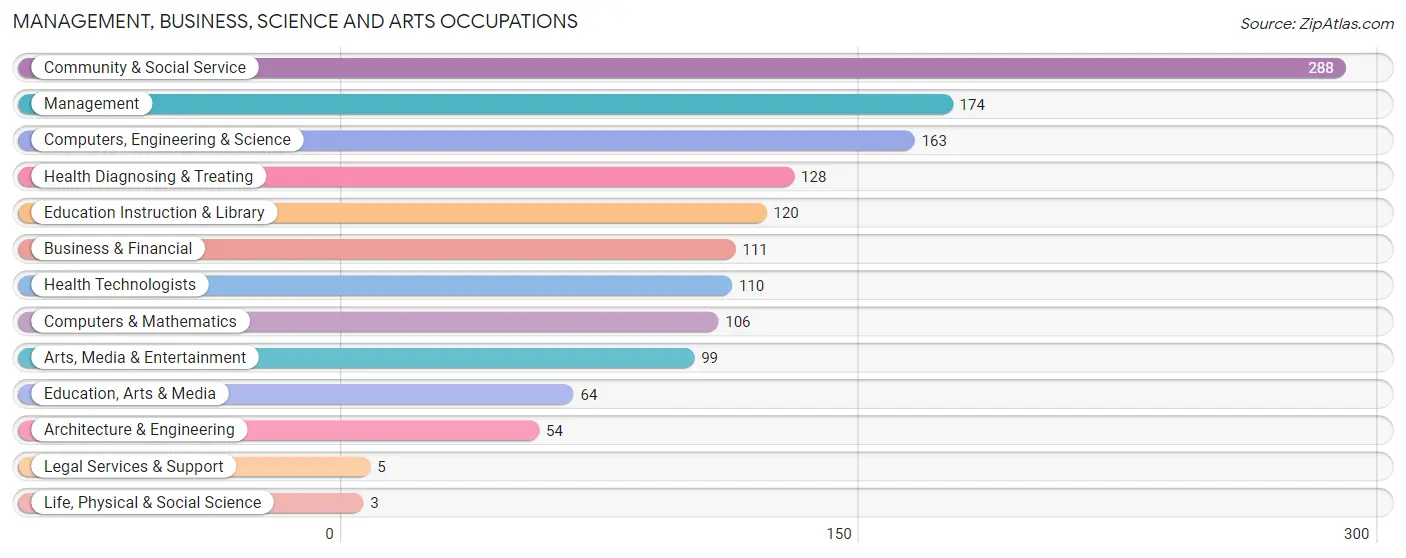
Management, Business, Science and Arts Occupations
The most common Management, Business, Science and Arts occupations in Elk Ridge are Community & Social Service (288 | 15.2%), Management (174 | 9.2%), Computers, Engineering & Science (163 | 8.6%), Health Diagnosing & Treating (128 | 6.8%), and Education Instruction & Library (120 | 6.3%).
Management, Business, Science and Arts Occupations by Sex
Within the Management, Business, Science and Arts occupations in Elk Ridge, the most male-oriented occupations are Life, Physical & Social Science (100.0%), Computers & Mathematics (96.2%), and Computers, Engineering & Science (95.7%), while the most female-oriented occupations are Legal Services & Support (100.0%), Education, Arts & Media (82.8%), and Arts, Media & Entertainment (80.8%).
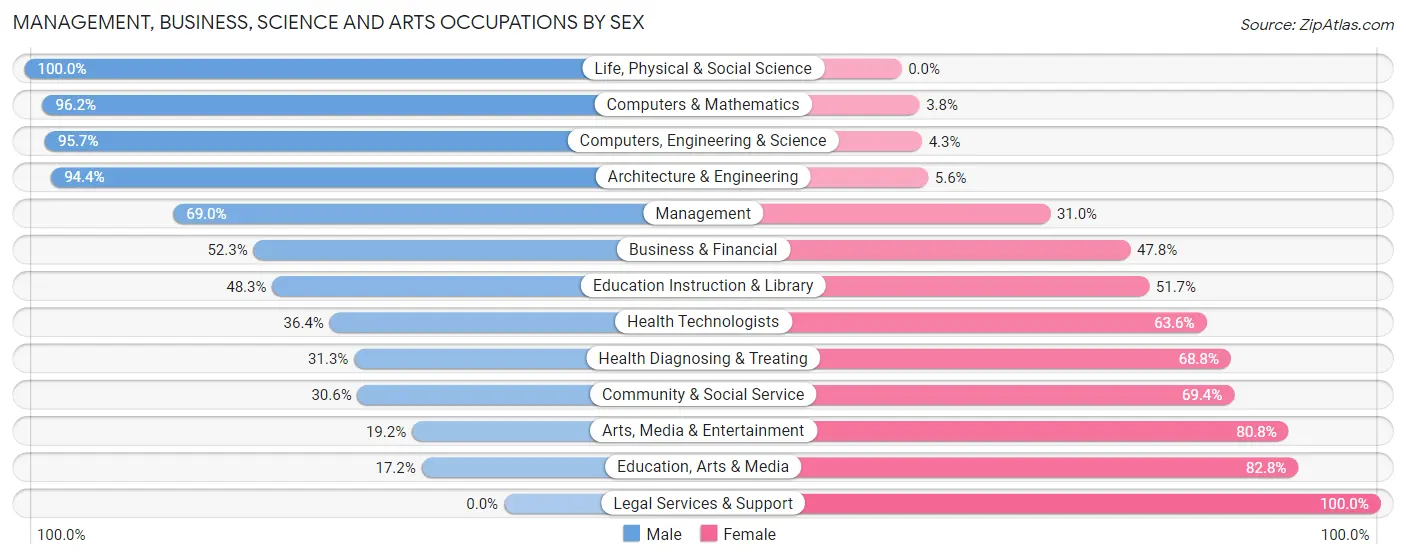
| Occupation | Male | Female |
| Management | 120 (69.0%) | 54 (31.0%) |
| Business & Financial | 58 (52.2%) | 53 (47.7%) |
| Computers, Engineering & Science | 156 (95.7%) | 7 (4.3%) |
| Computers & Mathematics | 102 (96.2%) | 4 (3.8%) |
| Architecture & Engineering | 51 (94.4%) | 3 (5.6%) |
| Life, Physical & Social Science | 3 (100.0%) | 0 (0.0%) |
| Community & Social Service | 88 (30.6%) | 200 (69.4%) |
| Education, Arts & Media | 11 (17.2%) | 53 (82.8%) |
| Legal Services & Support | 0 (0.0%) | 5 (100.0%) |
| Education Instruction & Library | 58 (48.3%) | 62 (51.7%) |
| Arts, Media & Entertainment | 19 (19.2%) | 80 (80.8%) |
| Health Diagnosing & Treating | 40 (31.2%) | 88 (68.8%) |
| Health Technologists | 40 (36.4%) | 70 (63.6%) |
| Total (Category) | 462 (53.5%) | 402 (46.5%) |
| Total (Overall) | 1,146 (60.5%) | 747 (39.5%) |
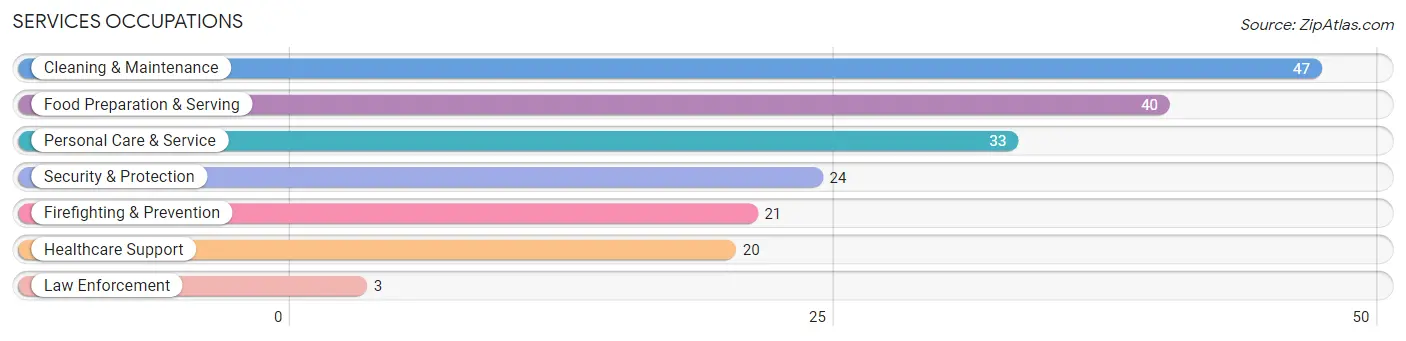
Services Occupations
The most common Services occupations in Elk Ridge are Cleaning & Maintenance (47 | 2.5%), Food Preparation & Serving (40 | 2.1%), Personal Care & Service (33 | 1.7%), Security & Protection (24 | 1.3%), and Firefighting & Prevention (21 | 1.1%).
Services Occupations by Sex
Within the Services occupations in Elk Ridge, the most male-oriented occupations are Security & Protection (100.0%), Firefighting & Prevention (100.0%), and Law Enforcement (100.0%), while the most female-oriented occupations are Personal Care & Service (100.0%), Food Preparation & Serving (90.0%), and Healthcare Support (70.0%).
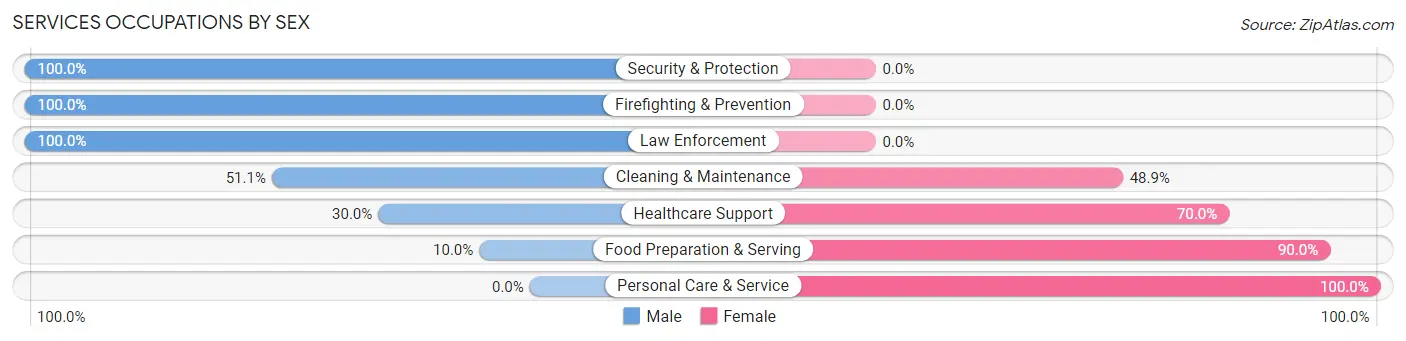
| Occupation | Male | Female |
| Healthcare Support | 6 (30.0%) | 14 (70.0%) |
| Security & Protection | 24 (100.0%) | 0 (0.0%) |
| Firefighting & Prevention | 21 (100.0%) | 0 (0.0%) |
| Law Enforcement | 3 (100.0%) | 0 (0.0%) |
| Food Preparation & Serving | 4 (10.0%) | 36 (90.0%) |
| Cleaning & Maintenance | 24 (51.1%) | 23 (48.9%) |
| Personal Care & Service | 0 (0.0%) | 33 (100.0%) |
| Total (Category) | 58 (35.4%) | 106 (64.6%) |
| Total (Overall) | 1,146 (60.5%) | 747 (39.5%) |
Sales and Office Occupations
The most common Sales and Office occupations in Elk Ridge are Office & Administration (191 | 10.1%), and Sales & Related (181 | 9.6%).

Sales and Office Occupations by Sex

| Occupation | Male | Female |
| Sales & Related | 150 (82.9%) | 31 (17.1%) |
| Office & Administration | 42 (22.0%) | 149 (78.0%) |
| Total (Category) | 192 (51.6%) | 180 (48.4%) |
| Total (Overall) | 1,146 (60.5%) | 747 (39.5%) |
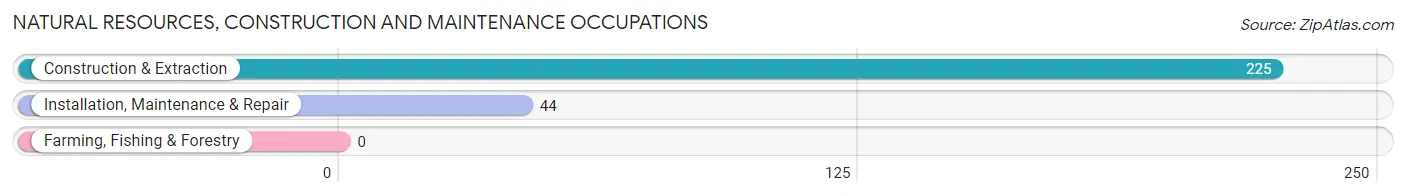
Natural Resources, Construction and Maintenance Occupations
The most common Natural Resources, Construction and Maintenance occupations in Elk Ridge are Construction & Extraction (225 | 11.9%), and Installation, Maintenance & Repair (44 | 2.3%).
Natural Resources, Construction and Maintenance Occupations by Sex

| Occupation | Male | Female |
| Farming, Fishing & Forestry | 0 (0.0%) | 0 (0.0%) |
| Construction & Extraction | 220 (97.8%) | 5 (2.2%) |
| Installation, Maintenance & Repair | 44 (100.0%) | 0 (0.0%) |
| Total (Category) | 264 (98.1%) | 5 (1.9%) |
| Total (Overall) | 1,146 (60.5%) | 747 (39.5%) |
Production, Transportation and Moving Occupations
The most common Production, Transportation and Moving occupations in Elk Ridge are Transportation (99 | 5.2%), Production (68 | 3.6%), and Material Moving (57 | 3.0%).
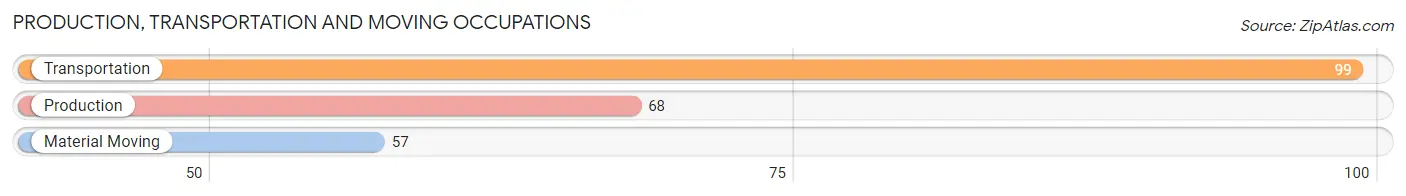
Production, Transportation and Moving Occupations by Sex

| Occupation | Male | Female |
| Production | 44 (64.7%) | 24 (35.3%) |
| Transportation | 93 (93.9%) | 6 (6.1%) |
| Material Moving | 33 (57.9%) | 24 (42.1%) |
| Total (Category) | 170 (75.9%) | 54 (24.1%) |
| Total (Overall) | 1,146 (60.5%) | 747 (39.5%) |
Employment Industries by Sex in Elk Ridge
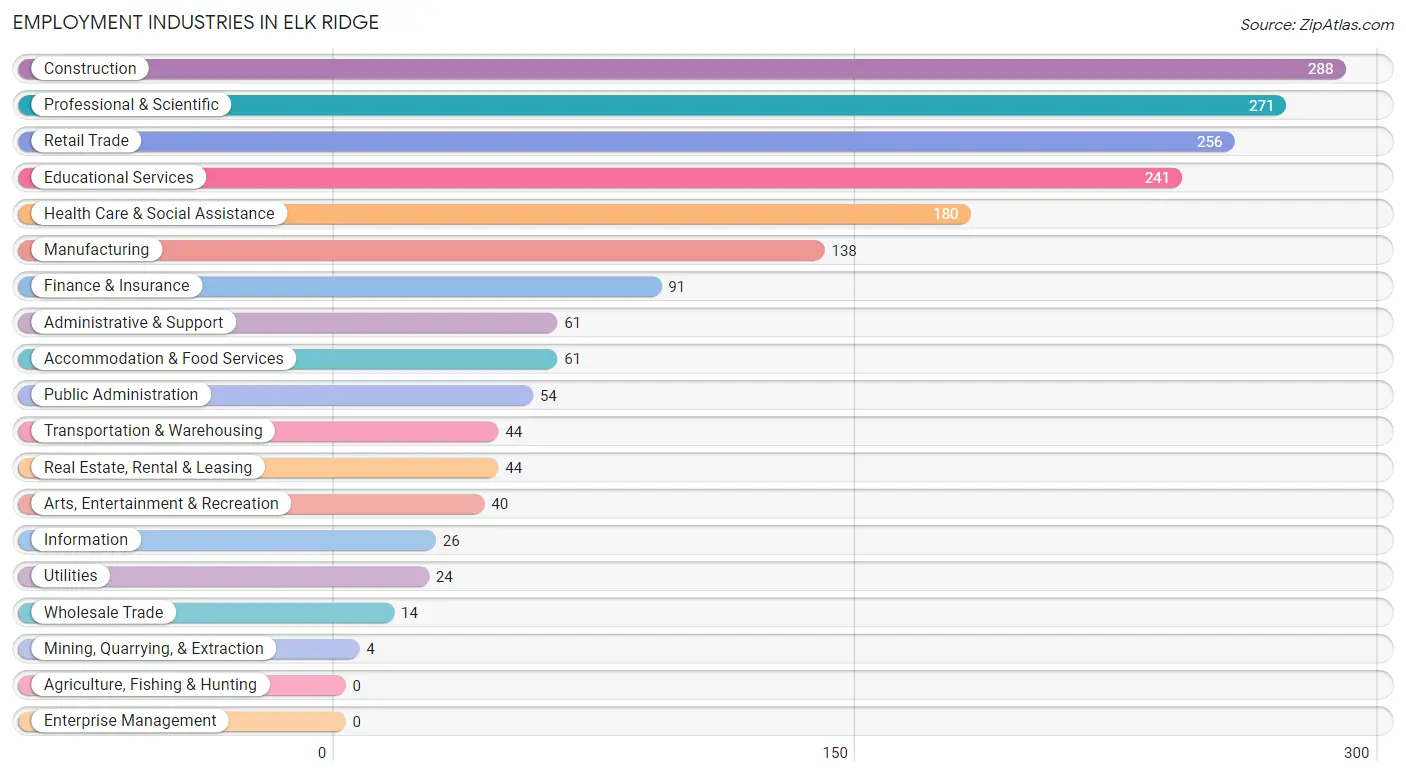
Employment Industries in Elk Ridge
The major employment industries in Elk Ridge include Construction (288 | 15.2%), Professional & Scientific (271 | 14.3%), Retail Trade (256 | 13.5%), Educational Services (241 | 12.7%), and Health Care & Social Assistance (180 | 9.5%).
Employment Industries by Sex in Elk Ridge
The Elk Ridge industries that see more men than women are Mining, Quarrying, & Extraction (100.0%), Transportation & Warehousing (100.0%), and Utilities (87.5%), whereas the industries that tend to have a higher number of women are Accommodation & Food Services (86.9%), Health Care & Social Assistance (72.2%), and Real Estate, Rental & Leasing (59.1%).
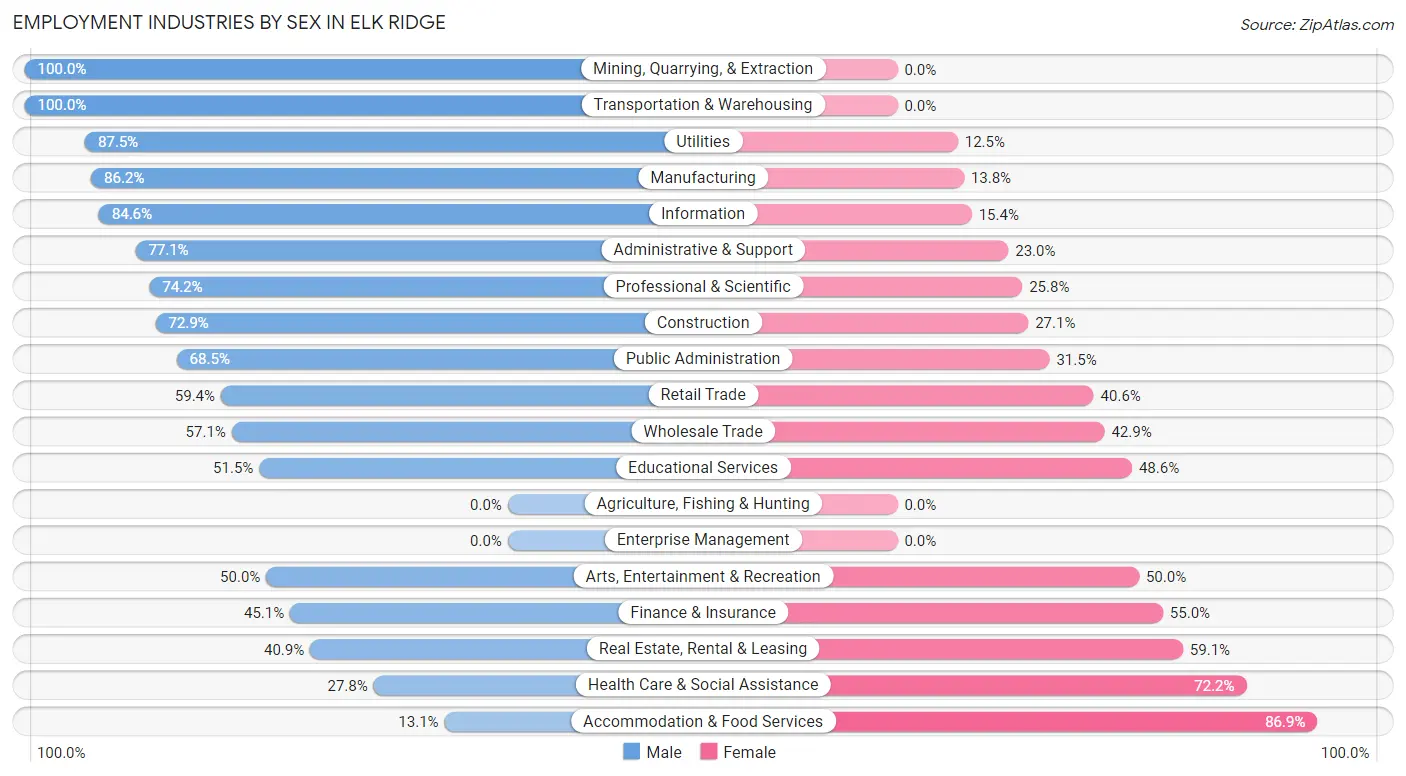
| Industry | Male | Female |
| Agriculture, Fishing & Hunting | 0 (0.0%) | 0 (0.0%) |
| Mining, Quarrying, & Extraction | 4 (100.0%) | 0 (0.0%) |
| Construction | 210 (72.9%) | 78 (27.1%) |
| Manufacturing | 119 (86.2%) | 19 (13.8%) |
| Wholesale Trade | 8 (57.1%) | 6 (42.9%) |
| Retail Trade | 152 (59.4%) | 104 (40.6%) |
| Transportation & Warehousing | 44 (100.0%) | 0 (0.0%) |
| Utilities | 21 (87.5%) | 3 (12.5%) |
| Information | 22 (84.6%) | 4 (15.4%) |
| Finance & Insurance | 41 (45.1%) | 50 (54.9%) |
| Real Estate, Rental & Leasing | 18 (40.9%) | 26 (59.1%) |
| Professional & Scientific | 201 (74.2%) | 70 (25.8%) |
| Enterprise Management | 0 (0.0%) | 0 (0.0%) |
| Administrative & Support | 47 (77.0%) | 14 (23.0%) |
| Educational Services | 124 (51.4%) | 117 (48.5%) |
| Health Care & Social Assistance | 50 (27.8%) | 130 (72.2%) |
| Arts, Entertainment & Recreation | 20 (50.0%) | 20 (50.0%) |
| Accommodation & Food Services | 8 (13.1%) | 53 (86.9%) |
| Public Administration | 37 (68.5%) | 17 (31.5%) |
| Total | 1,146 (60.5%) | 747 (39.5%) |
Education in Elk Ridge
School Enrollment in Elk Ridge
The most common levels of schooling among the 1,572 students in Elk Ridge are high school (439 | 27.9%), elementary school (412 | 26.2%), and middle school (273 | 17.4%).
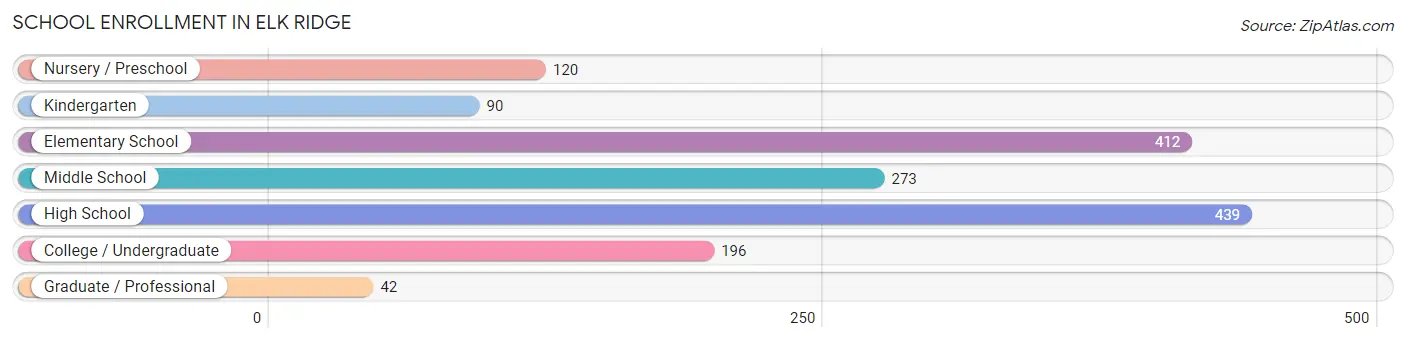
| School Level | # Students | % Students |
| Nursery / Preschool | 120 | 7.6% |
| Kindergarten | 90 | 5.7% |
| Elementary School | 412 | 26.2% |
| Middle School | 273 | 17.4% |
| High School | 439 | 27.9% |
| College / Undergraduate | 196 | 12.5% |
| Graduate / Professional | 42 | 2.7% |
| Total | 1,572 | 100.0% |
School Enrollment by Age by Funding Source in Elk Ridge
Out of a total of 1,572 students who are enrolled in schools in Elk Ridge, 223 (14.2%) attend a private institution, while the remaining 1,349 (85.8%) are enrolled in public schools. The age group of 25 to 34 year olds has the highest likelihood of being enrolled in private schools, with 32 (49.2% in the age bracket) enrolled. Conversely, the age group of 15 to 17 year olds has the lowest likelihood of being enrolled in a private school, with 289 (98.3% in the age bracket) attending a public institution.
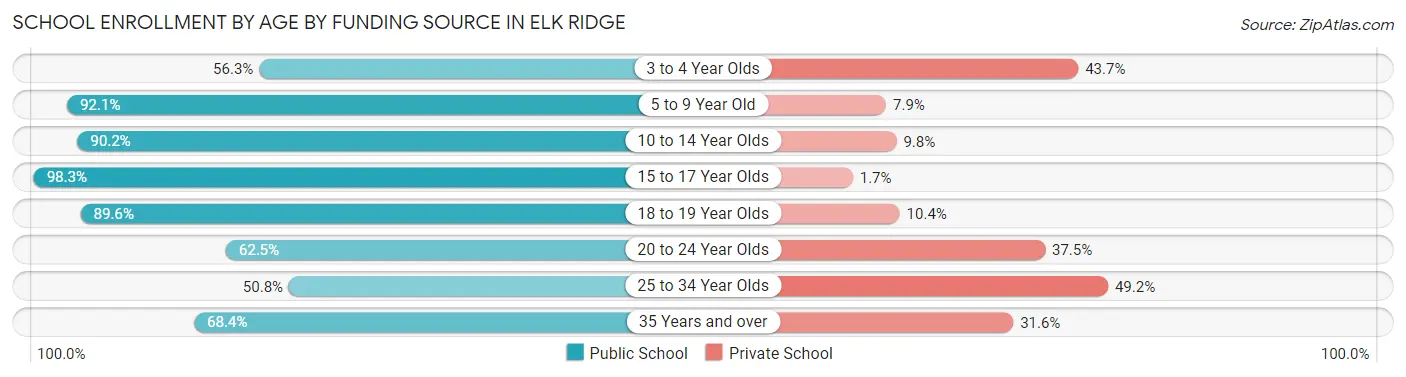
| Age Bracket | Public School | Private School |
| 3 to 4 Year Olds | 58 (56.3%) | 45 (43.7%) |
| 5 to 9 Year Old | 478 (92.1%) | 41 (7.9%) |
| 10 to 14 Year Olds | 284 (90.2%) | 31 (9.8%) |
| 15 to 17 Year Olds | 289 (98.3%) | 5 (1.7%) |
| 18 to 19 Year Olds | 103 (89.6%) | 12 (10.4%) |
| 20 to 24 Year Olds | 65 (62.5%) | 39 (37.5%) |
| 25 to 34 Year Olds | 33 (50.8%) | 32 (49.2%) |
| 35 Years and over | 39 (68.4%) | 18 (31.6%) |
| Total | 1,349 (85.8%) | 223 (14.2%) |
Educational Attainment by Field of Study in Elk Ridge
Business (243 | 25.5%), education (175 | 18.3%), arts & humanities (128 | 13.4%), science & technology (81 | 8.5%), and social sciences (64 | 6.7%) are the most common fields of study among 955 individuals in Elk Ridge who have obtained a bachelor's degree or higher.
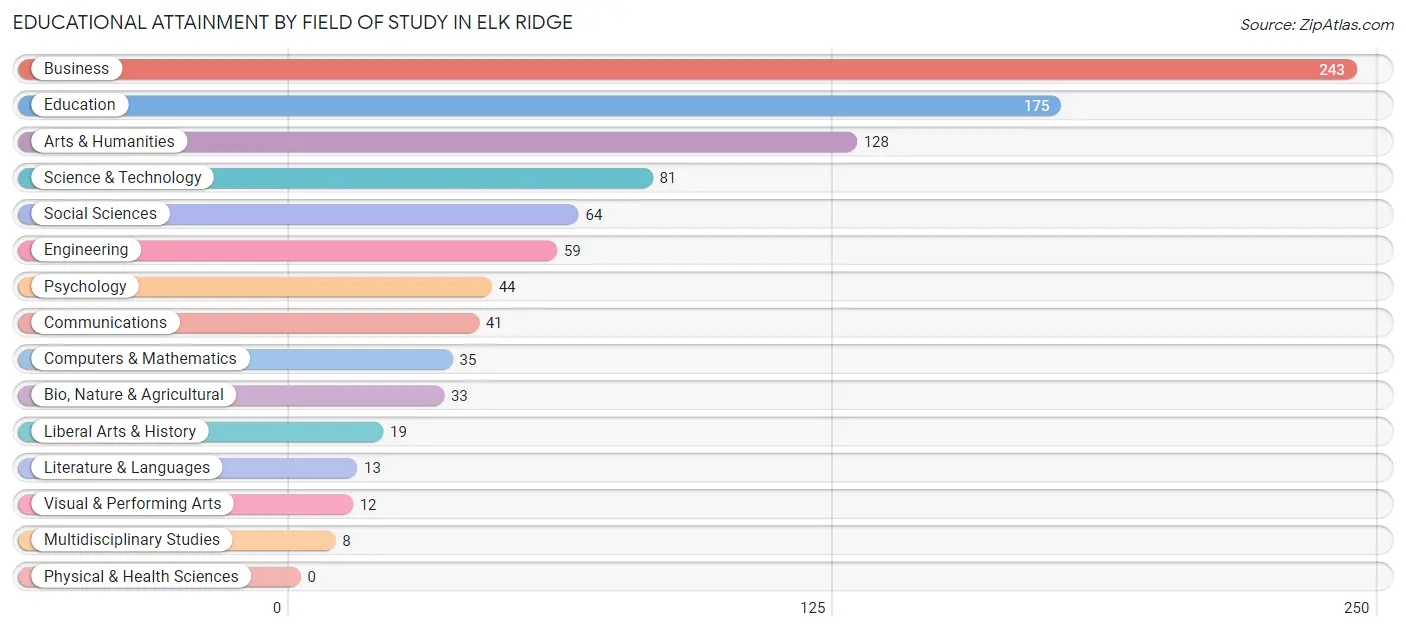
| Field of Study | # Graduates | % Graduates |
| Computers & Mathematics | 35 | 3.7% |
| Bio, Nature & Agricultural | 33 | 3.5% |
| Physical & Health Sciences | 0 | 0.0% |
| Psychology | 44 | 4.6% |
| Social Sciences | 64 | 6.7% |
| Engineering | 59 | 6.2% |
| Multidisciplinary Studies | 8 | 0.8% |
| Science & Technology | 81 | 8.5% |
| Business | 243 | 25.5% |
| Education | 175 | 18.3% |
| Literature & Languages | 13 | 1.4% |
| Liberal Arts & History | 19 | 2.0% |
| Visual & Performing Arts | 12 | 1.3% |
| Communications | 41 | 4.3% |
| Arts & Humanities | 128 | 13.4% |
| Total | 955 | 100.0% |
Transportation & Commute in Elk Ridge
Vehicle Availability by Sex in Elk Ridge
The most prevalent vehicle ownership categories in Elk Ridge are males with 2 vehicles (409, accounting for 35.8%) and females with 2 vehicles (297, making up 55.0%).
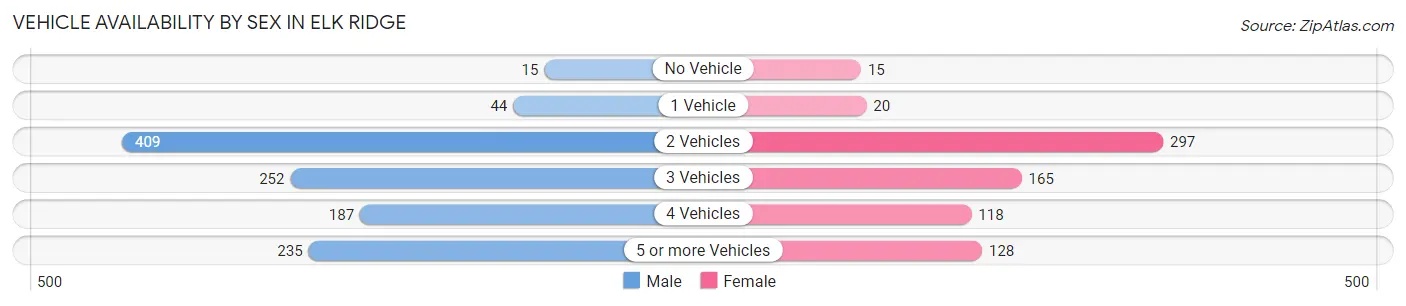
| Vehicles Available | Male | Female |
| No Vehicle | 15 (1.3%) | 15 (2.0%) |
| 1 Vehicle | 44 (3.8%) | 20 (2.7%) |
| 2 Vehicles | 409 (35.8%) | 297 (40.0%) |
| 3 Vehicles | 252 (22.1%) | 165 (22.2%) |
| 4 Vehicles | 187 (16.4%) | 118 (15.9%) |
| 5 or more Vehicles | 235 (20.6%) | 128 (17.2%) |
| Total | 1,142 (100.0%) | 743 (100.0%) |
Commute Time in Elk Ridge
The most frequently occuring commute durations in Elk Ridge are 30 to 34 minutes (274 commuters, 17.3%), 15 to 19 minutes (264 commuters, 16.7%), and 20 to 24 minutes (223 commuters, 14.1%).
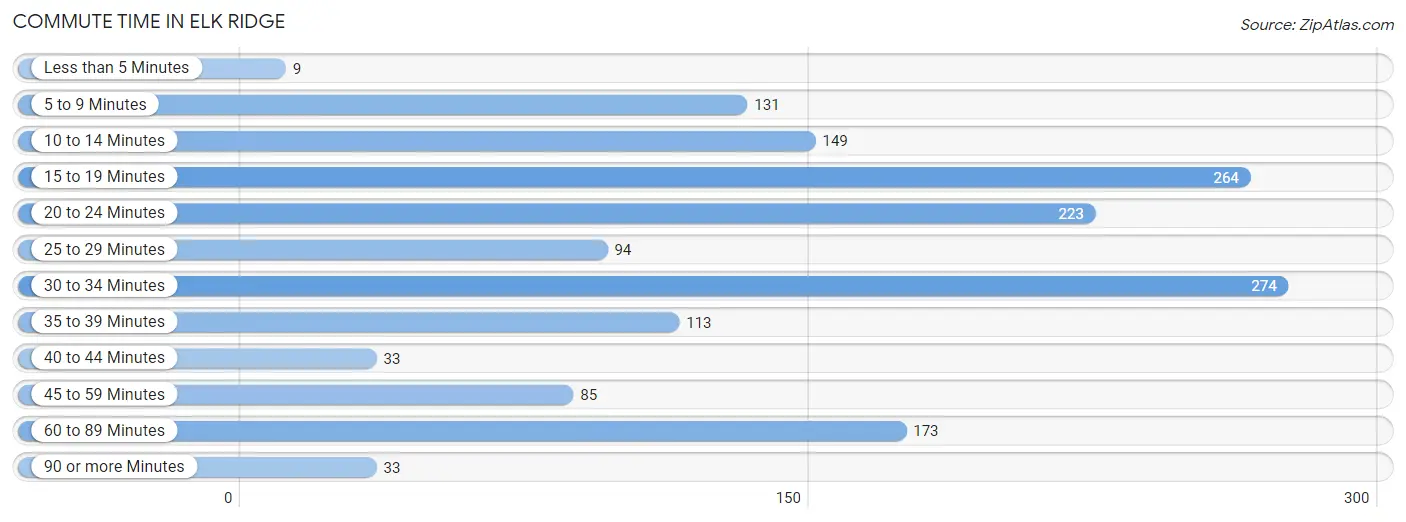
| Commute Time | # Commuters | % Commuters |
| Less than 5 Minutes | 9 | 0.6% |
| 5 to 9 Minutes | 131 | 8.3% |
| 10 to 14 Minutes | 149 | 9.4% |
| 15 to 19 Minutes | 264 | 16.7% |
| 20 to 24 Minutes | 223 | 14.1% |
| 25 to 29 Minutes | 94 | 5.9% |
| 30 to 34 Minutes | 274 | 17.3% |
| 35 to 39 Minutes | 113 | 7.1% |
| 40 to 44 Minutes | 33 | 2.1% |
| 45 to 59 Minutes | 85 | 5.4% |
| 60 to 89 Minutes | 173 | 10.9% |
| 90 or more Minutes | 33 | 2.1% |
Commute Time by Sex in Elk Ridge
The most common commute times in Elk Ridge are 15 to 19 minutes (197 commuters, 20.0%) for males and 20 to 24 minutes (134 commuters, 22.4%) for females.
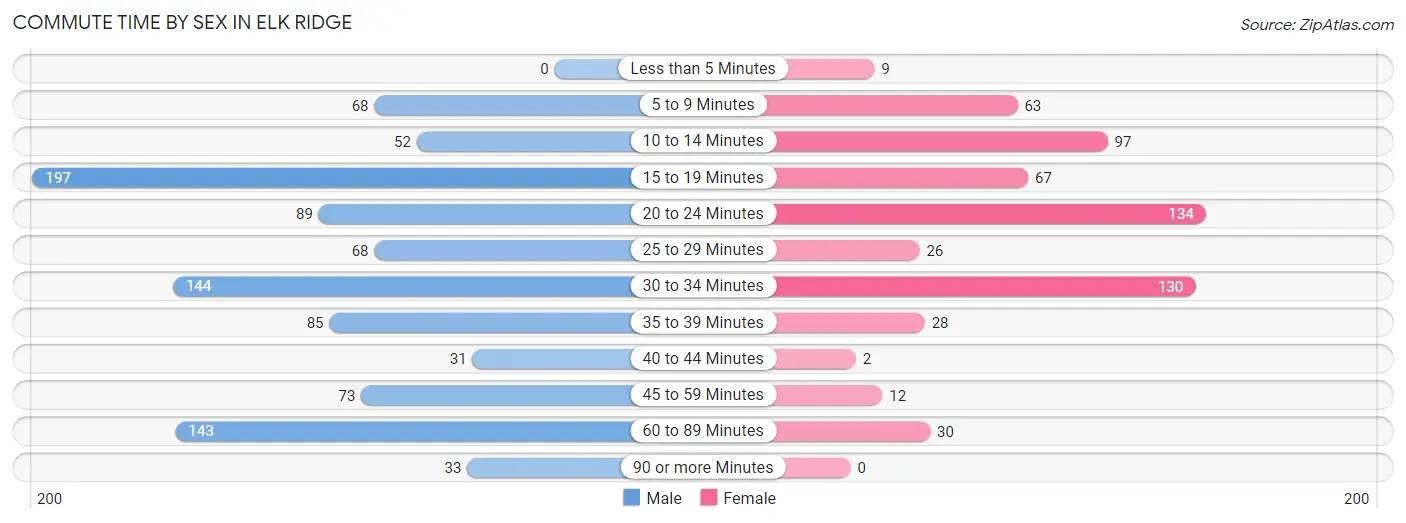
| Commute Time | Male | Female |
| Less than 5 Minutes | 0 (0.0%) | 9 (1.5%) |
| 5 to 9 Minutes | 68 (6.9%) | 63 (10.5%) |
| 10 to 14 Minutes | 52 (5.3%) | 97 (16.2%) |
| 15 to 19 Minutes | 197 (20.0%) | 67 (11.2%) |
| 20 to 24 Minutes | 89 (9.0%) | 134 (22.4%) |
| 25 to 29 Minutes | 68 (6.9%) | 26 (4.3%) |
| 30 to 34 Minutes | 144 (14.6%) | 130 (21.7%) |
| 35 to 39 Minutes | 85 (8.6%) | 28 (4.7%) |
| 40 to 44 Minutes | 31 (3.2%) | 2 (0.3%) |
| 45 to 59 Minutes | 73 (7.4%) | 12 (2.0%) |
| 60 to 89 Minutes | 143 (14.5%) | 30 (5.0%) |
| 90 or more Minutes | 33 (3.4%) | 0 (0.0%) |
Time of Departure to Work by Sex in Elk Ridge
The most frequent times of departure to work in Elk Ridge are 7:00 AM to 7:29 AM (188, 19.1%) for males and 7:00 AM to 7:29 AM (164, 27.4%) for females.
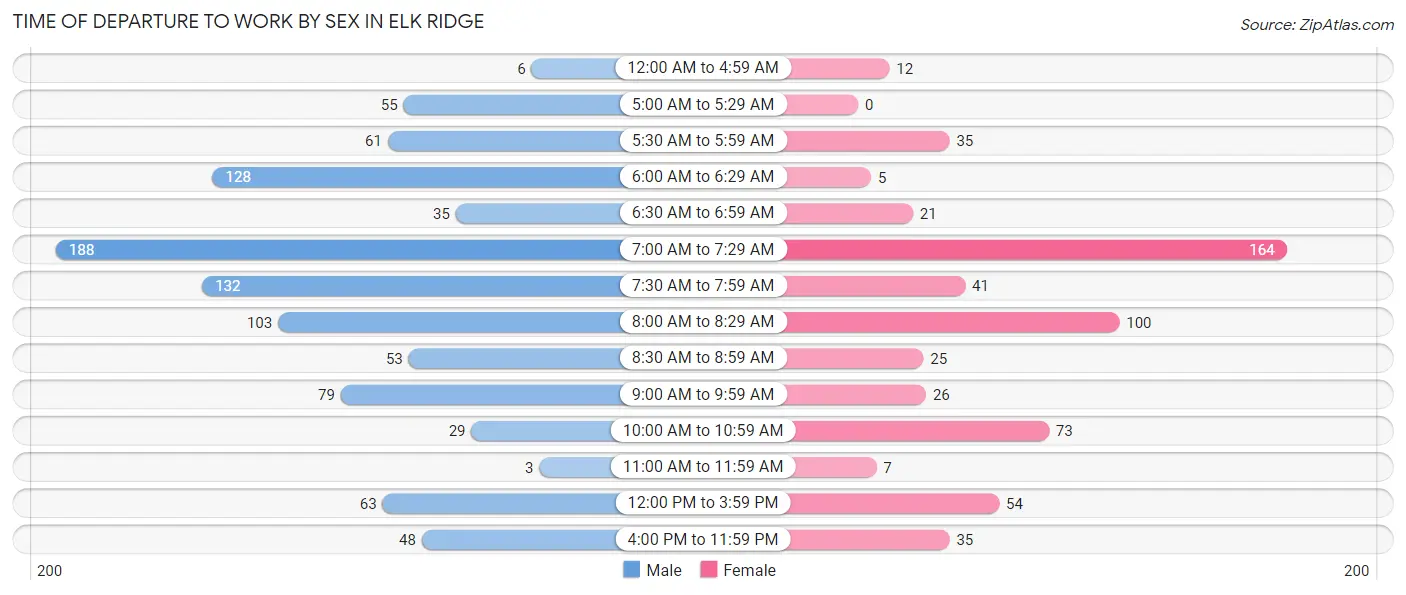
| Time of Departure | Male | Female |
| 12:00 AM to 4:59 AM | 6 (0.6%) | 12 (2.0%) |
| 5:00 AM to 5:29 AM | 55 (5.6%) | 0 (0.0%) |
| 5:30 AM to 5:59 AM | 61 (6.2%) | 35 (5.9%) |
| 6:00 AM to 6:29 AM | 128 (13.0%) | 5 (0.8%) |
| 6:30 AM to 6:59 AM | 35 (3.6%) | 21 (3.5%) |
| 7:00 AM to 7:29 AM | 188 (19.1%) | 164 (27.4%) |
| 7:30 AM to 7:59 AM | 132 (13.4%) | 41 (6.9%) |
| 8:00 AM to 8:29 AM | 103 (10.5%) | 100 (16.7%) |
| 8:30 AM to 8:59 AM | 53 (5.4%) | 25 (4.2%) |
| 9:00 AM to 9:59 AM | 79 (8.0%) | 26 (4.3%) |
| 10:00 AM to 10:59 AM | 29 (2.9%) | 73 (12.2%) |
| 11:00 AM to 11:59 AM | 3 (0.3%) | 7 (1.2%) |
| 12:00 PM to 3:59 PM | 63 (6.4%) | 54 (9.0%) |
| 4:00 PM to 11:59 PM | 48 (4.9%) | 35 (5.9%) |
| Total | 983 (100.0%) | 598 (100.0%) |
Housing Occupancy in Elk Ridge
Occupancy by Ownership in Elk Ridge
Of the total 1,229 dwellings in Elk Ridge, owner-occupied units account for 1,223 (99.5%), while renter-occupied units make up 6 (0.5%).
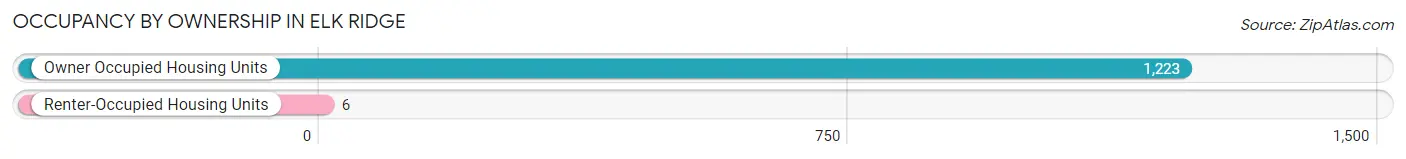
| Occupancy | # Housing Units | % Housing Units |
| Owner Occupied Housing Units | 1,223 | 99.5% |
| Renter-Occupied Housing Units | 6 | 0.5% |
| Total Occupied Housing Units | 1,229 | 100.0% |
Occupancy by Household Size in Elk Ridge
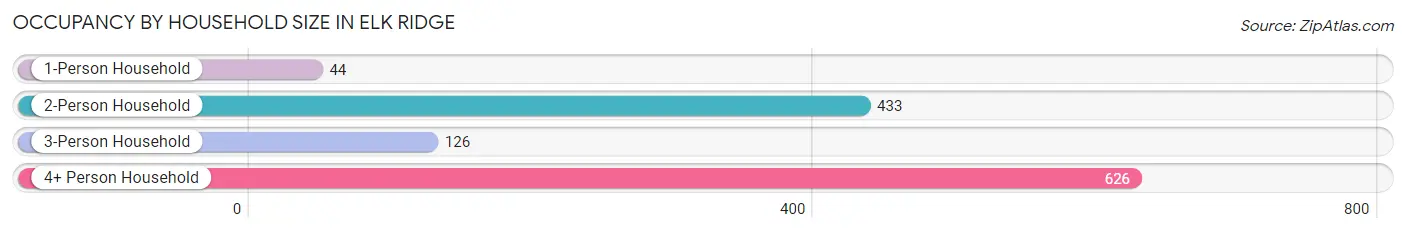
| Household Size | # Housing Units | % Housing Units |
| 1-Person Household | 44 | 3.6% |
| 2-Person Household | 433 | 35.2% |
| 3-Person Household | 126 | 10.2% |
| 4+ Person Household | 626 | 50.9% |
| Total Housing Units | 1,229 | 100.0% |
Occupancy by Ownership by Household Size in Elk Ridge
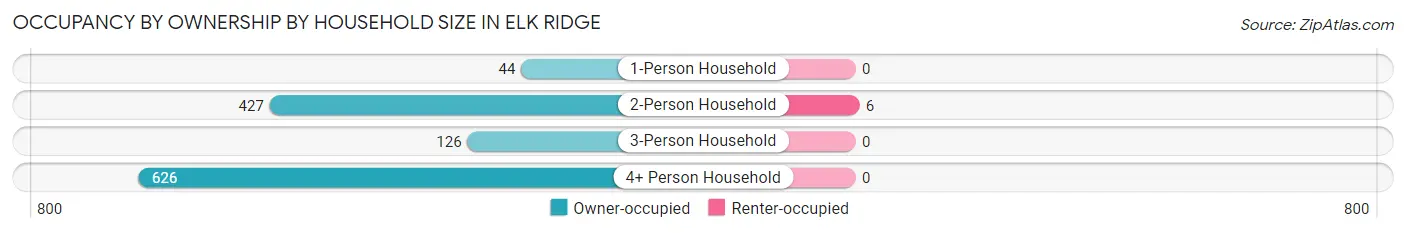
| Household Size | Owner-occupied | Renter-occupied |
| 1-Person Household | 44 (100.0%) | 0 (0.0%) |
| 2-Person Household | 427 (98.6%) | 6 (1.4%) |
| 3-Person Household | 126 (100.0%) | 0 (0.0%) |
| 4+ Person Household | 626 (100.0%) | 0 (0.0%) |
| Total Housing Units | 1,223 (99.5%) | 6 (0.5%) |
Occupancy by Educational Attainment in Elk Ridge
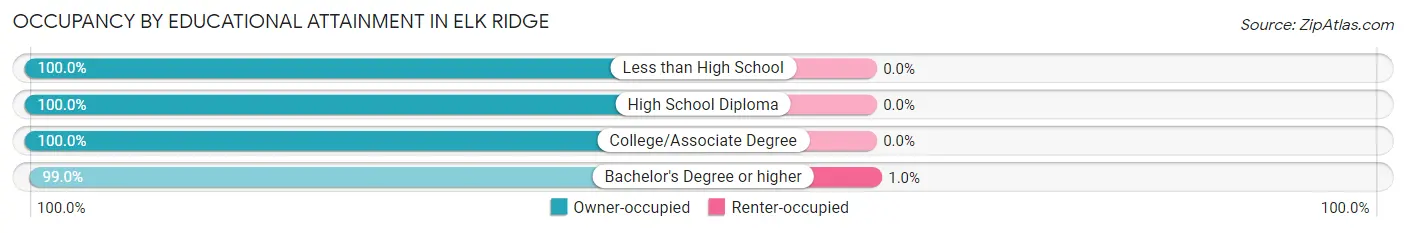
| Household Size | Owner-occupied | Renter-occupied |
| Less than High School | 34 (100.0%) | 0 (0.0%) |
| High School Diploma | 120 (100.0%) | 0 (0.0%) |
| College/Associate Degree | 481 (100.0%) | 0 (0.0%) |
| Bachelor's Degree or higher | 588 (99.0%) | 6 (1.0%) |
Occupancy by Age of Householder in Elk Ridge
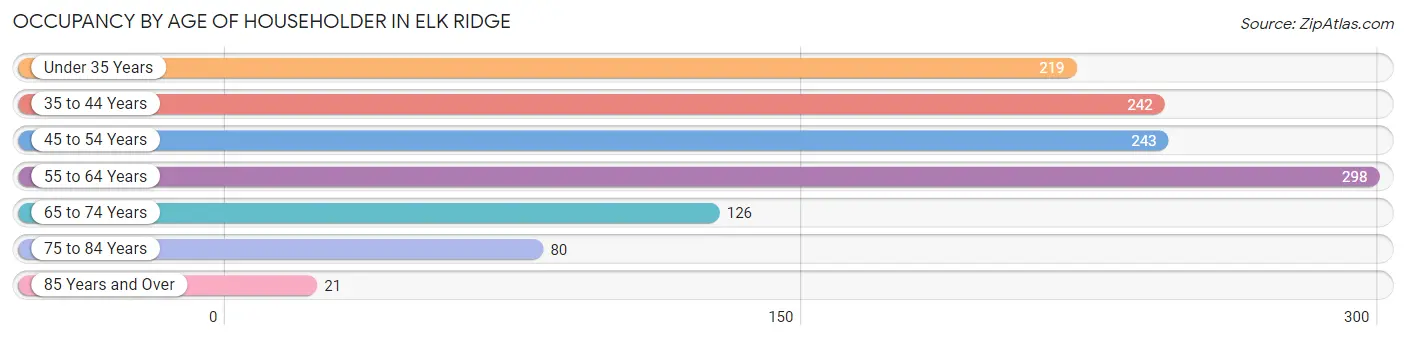
| Age Bracket | # Households | % Households |
| Under 35 Years | 219 | 17.8% |
| 35 to 44 Years | 242 | 19.7% |
| 45 to 54 Years | 243 | 19.8% |
| 55 to 64 Years | 298 | 24.2% |
| 65 to 74 Years | 126 | 10.2% |
| 75 to 84 Years | 80 | 6.5% |
| 85 Years and Over | 21 | 1.7% |
| Total | 1,229 | 100.0% |
Housing Finances in Elk Ridge
Median Income by Occupancy in Elk Ridge
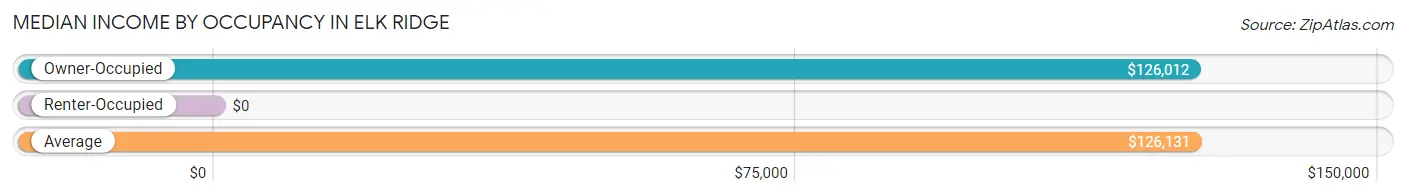
| Occupancy Type | # Households | Median Income |
| Owner-Occupied | 1,223 (99.5%) | $126,012 |
| Renter-Occupied | 6 (0.5%) | $0 |
| Average | 1,229 (100.0%) | $126,131 |
Occupancy by Householder Income Bracket in Elk Ridge
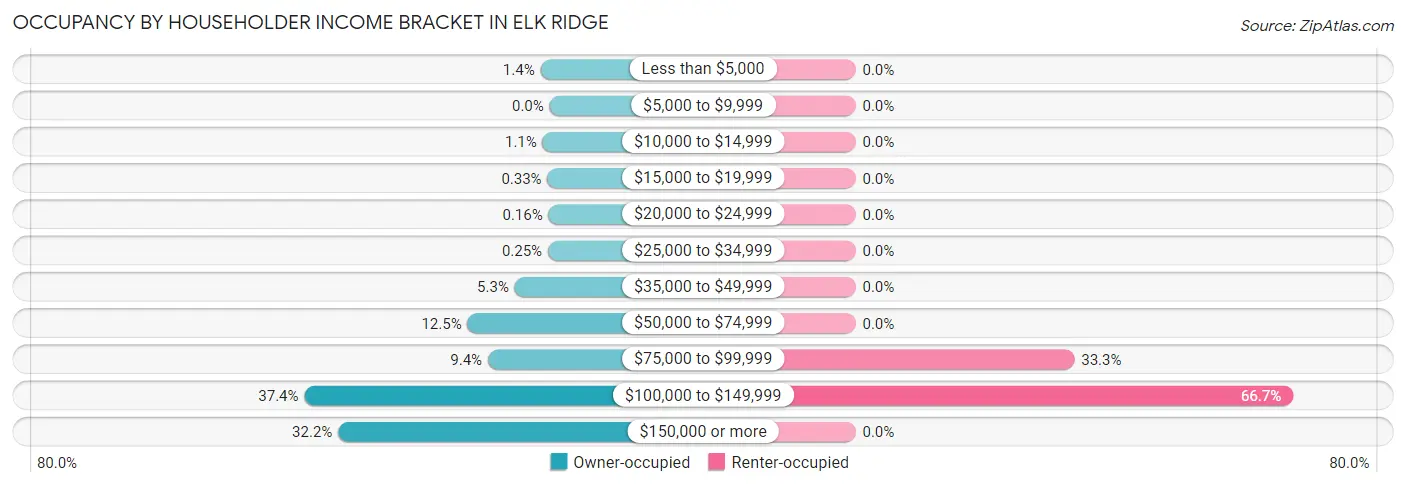
| Income Bracket | Owner-occupied | Renter-occupied |
| Less than $5,000 | 17 (1.4%) | 0 (0.0%) |
| $5,000 to $9,999 | 0 (0.0%) | 0 (0.0%) |
| $10,000 to $14,999 | 13 (1.1%) | 0 (0.0%) |
| $15,000 to $19,999 | 4 (0.3%) | 0 (0.0%) |
| $20,000 to $24,999 | 2 (0.2%) | 0 (0.0%) |
| $25,000 to $34,999 | 3 (0.3%) | 0 (0.0%) |
| $35,000 to $49,999 | 65 (5.3%) | 0 (0.0%) |
| $50,000 to $74,999 | 153 (12.5%) | 0 (0.0%) |
| $75,000 to $99,999 | 115 (9.4%) | 2 (33.3%) |
| $100,000 to $149,999 | 457 (37.4%) | 4 (66.7%) |
| $150,000 or more | 394 (32.2%) | 0 (0.0%) |
| Total | 1,223 (100.0%) | 6 (100.0%) |
Monthly Housing Cost Tiers in Elk Ridge
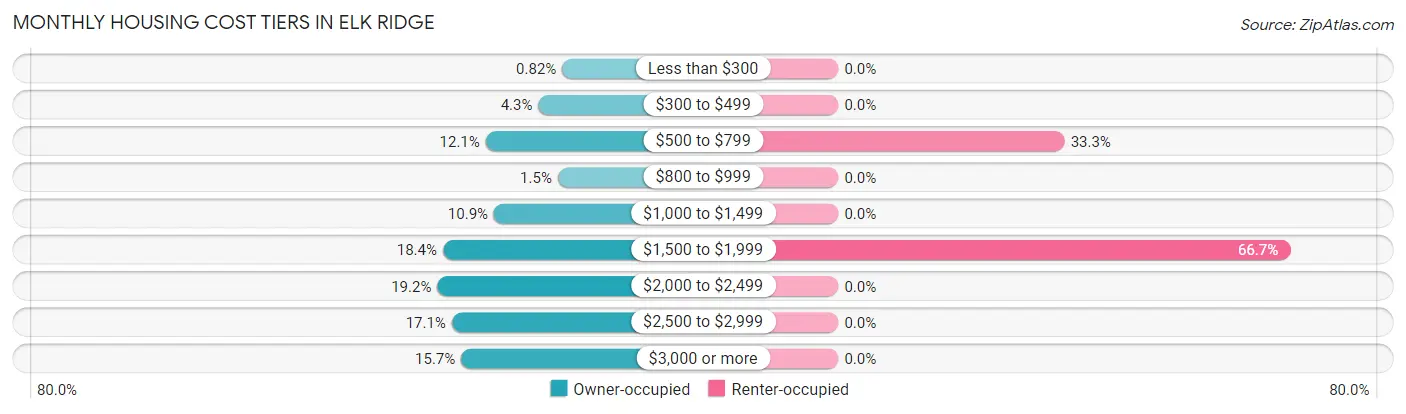
| Monthly Cost | Owner-occupied | Renter-occupied |
| Less than $300 | 10 (0.8%) | 0 (0.0%) |
| $300 to $499 | 53 (4.3%) | 0 (0.0%) |
| $500 to $799 | 148 (12.1%) | 2 (33.3%) |
| $800 to $999 | 18 (1.5%) | 0 (0.0%) |
| $1,000 to $1,499 | 133 (10.9%) | 0 (0.0%) |
| $1,500 to $1,999 | 225 (18.4%) | 4 (66.7%) |
| $2,000 to $2,499 | 235 (19.2%) | 0 (0.0%) |
| $2,500 to $2,999 | 209 (17.1%) | 0 (0.0%) |
| $3,000 or more | 192 (15.7%) | 0 (0.0%) |
| Total | 1,223 (100.0%) | 6 (100.0%) |
Physical Housing Characteristics in Elk Ridge
Housing Structures in Elk Ridge
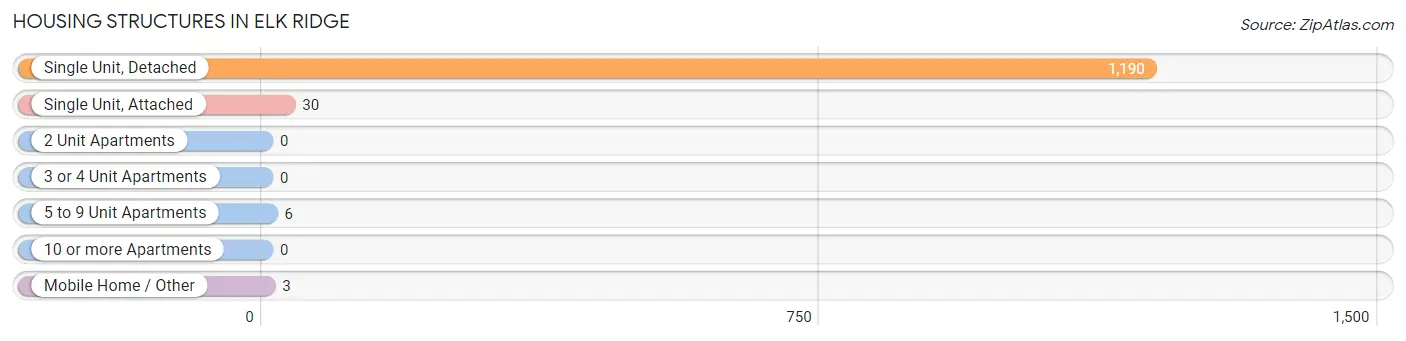
| Structure Type | # Housing Units | % Housing Units |
| Single Unit, Detached | 1,190 | 96.8% |
| Single Unit, Attached | 30 | 2.4% |
| 2 Unit Apartments | 0 | 0.0% |
| 3 or 4 Unit Apartments | 0 | 0.0% |
| 5 to 9 Unit Apartments | 6 | 0.5% |
| 10 or more Apartments | 0 | 0.0% |
| Mobile Home / Other | 3 | 0.2% |
| Total | 1,229 | 100.0% |
Housing Structures by Occupancy in Elk Ridge
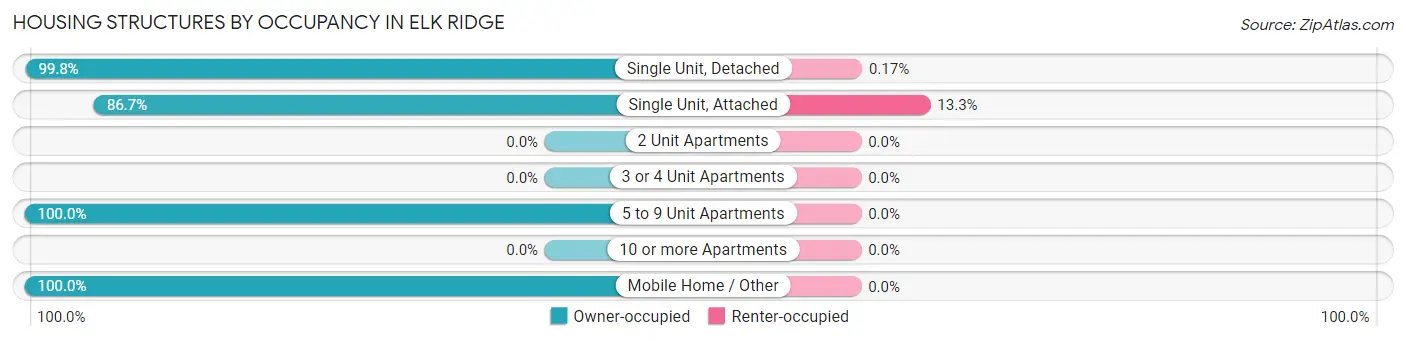
| Structure Type | Owner-occupied | Renter-occupied |
| Single Unit, Detached | 1,188 (99.8%) | 2 (0.2%) |
| Single Unit, Attached | 26 (86.7%) | 4 (13.3%) |
| 2 Unit Apartments | 0 (0.0%) | 0 (0.0%) |
| 3 or 4 Unit Apartments | 0 (0.0%) | 0 (0.0%) |
| 5 to 9 Unit Apartments | 6 (100.0%) | 0 (0.0%) |
| 10 or more Apartments | 0 (0.0%) | 0 (0.0%) |
| Mobile Home / Other | 3 (100.0%) | 0 (0.0%) |
| Total | 1,223 (99.5%) | 6 (0.5%) |
Housing Structures by Number of Rooms in Elk Ridge
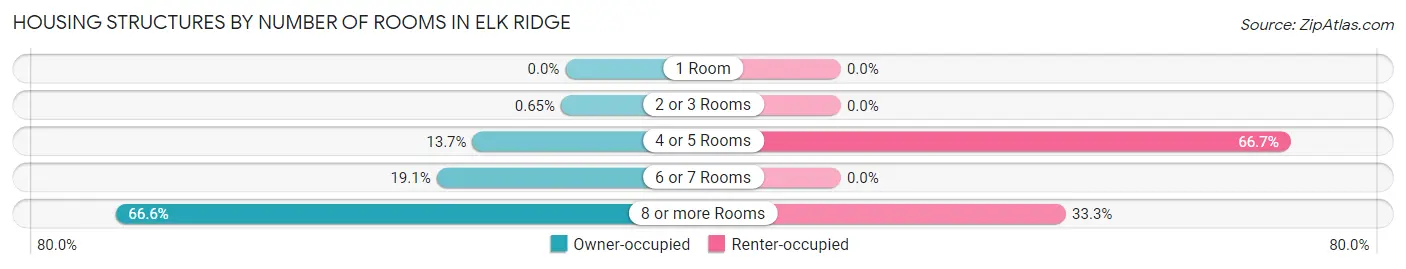
| Number of Rooms | Owner-occupied | Renter-occupied |
| 1 Room | 0 (0.0%) | 0 (0.0%) |
| 2 or 3 Rooms | 8 (0.6%) | 0 (0.0%) |
| 4 or 5 Rooms | 168 (13.7%) | 4 (66.7%) |
| 6 or 7 Rooms | 233 (19.1%) | 0 (0.0%) |
| 8 or more Rooms | 814 (66.6%) | 2 (33.3%) |
| Total | 1,223 (100.0%) | 6 (100.0%) |
Housing Structure by Heating Type in Elk Ridge
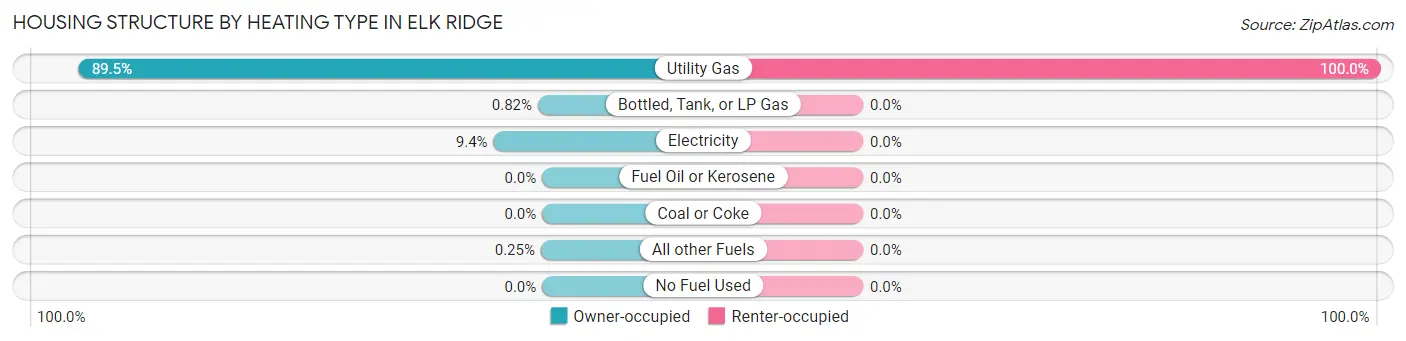
| Heating Type | Owner-occupied | Renter-occupied |
| Utility Gas | 1,095 (89.5%) | 6 (100.0%) |
| Bottled, Tank, or LP Gas | 10 (0.8%) | 0 (0.0%) |
| Electricity | 115 (9.4%) | 0 (0.0%) |
| Fuel Oil or Kerosene | 0 (0.0%) | 0 (0.0%) |
| Coal or Coke | 0 (0.0%) | 0 (0.0%) |
| All other Fuels | 3 (0.3%) | 0 (0.0%) |
| No Fuel Used | 0 (0.0%) | 0 (0.0%) |
| Total | 1,223 (100.0%) | 6 (100.0%) |
Household Vehicle Usage in Elk Ridge
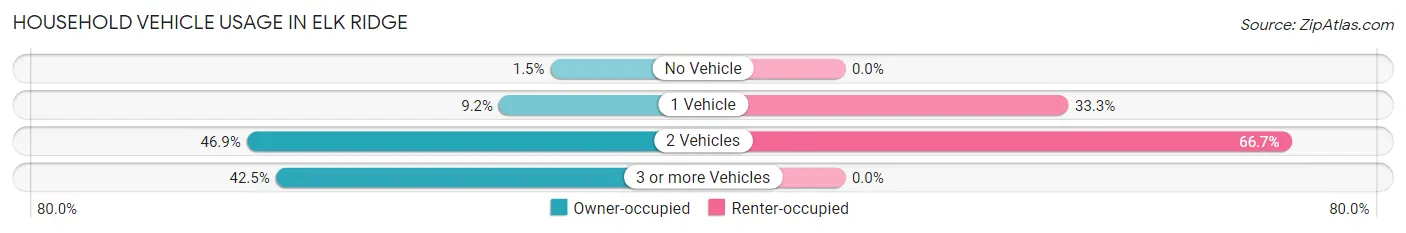
| Vehicles per Household | Owner-occupied | Renter-occupied |
| No Vehicle | 18 (1.5%) | 0 (0.0%) |
| 1 Vehicle | 112 (9.2%) | 2 (33.3%) |
| 2 Vehicles | 573 (46.9%) | 4 (66.7%) |
| 3 or more Vehicles | 520 (42.5%) | 0 (0.0%) |
| Total | 1,223 (100.0%) | 6 (100.0%) |
Real Estate & Mortgages in Elk Ridge
Real Estate and Mortgage Overview in Elk Ridge
| Characteristic | Without Mortgage | With Mortgage |
| Housing Units | 202 | 1,021 |
| Median Property Value | $428,600 | $542,800 |
| Median Household Income | $103,571 | $351 |
| Monthly Housing Costs | $576 | $192 |
| Real Estate Taxes | $2,463 | $5 |
Property Value by Mortgage Status in Elk Ridge

| Property Value | Without Mortgage | With Mortgage |
| Less than $50,000 | 11 (5.4%) | 41 (4.0%) |
| $50,000 to $99,999 | 9 (4.5%) | 0 (0.0%) |
| $100,000 to $299,999 | 42 (20.8%) | 63 (6.2%) |
| $300,000 to $499,999 | 79 (39.1%) | 325 (31.8%) |
| $500,000 to $749,999 | 49 (24.3%) | 476 (46.6%) |
| $750,000 to $999,999 | 7 (3.5%) | 102 (10.0%) |
| $1,000,000 or more | 5 (2.5%) | 14 (1.4%) |
| Total | 202 (100.0%) | 1,021 (100.0%) |
Household Income by Mortgage Status in Elk Ridge
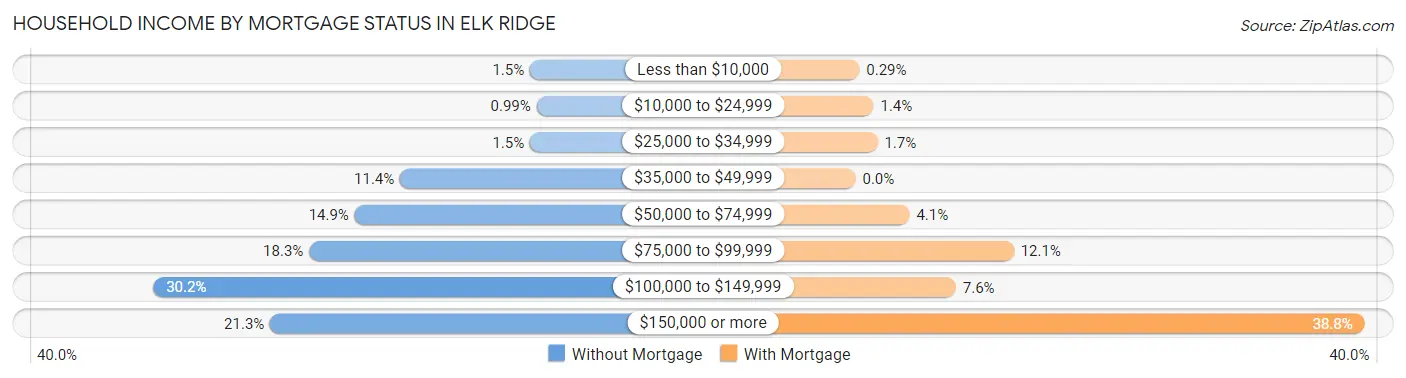
| Household Income | Without Mortgage | With Mortgage |
| Less than $10,000 | 3 (1.5%) | 3 (0.3%) |
| $10,000 to $24,999 | 2 (1.0%) | 14 (1.4%) |
| $25,000 to $34,999 | 3 (1.5%) | 17 (1.7%) |
| $35,000 to $49,999 | 23 (11.4%) | 0 (0.0%) |
| $50,000 to $74,999 | 30 (14.8%) | 42 (4.1%) |
| $75,000 to $99,999 | 37 (18.3%) | 123 (12.0%) |
| $100,000 to $149,999 | 61 (30.2%) | 78 (7.6%) |
| $150,000 or more | 43 (21.3%) | 396 (38.8%) |
| Total | 202 (100.0%) | 1,021 (100.0%) |
Property Value to Household Income Ratio in Elk Ridge
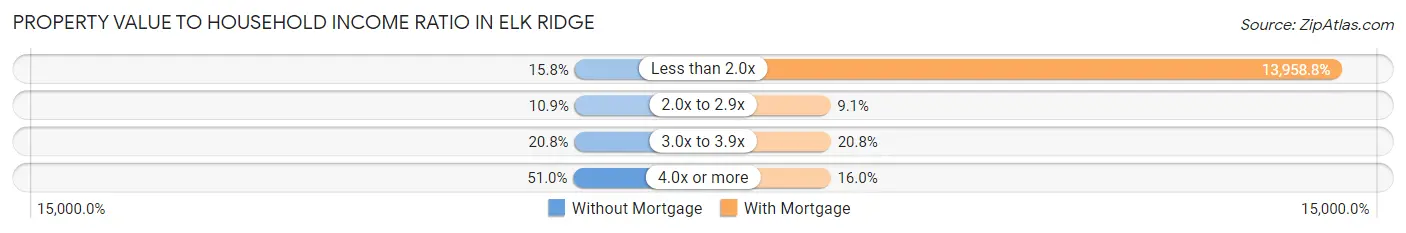
| Value-to-Income Ratio | Without Mortgage | With Mortgage |
| Less than 2.0x | 32 (15.8%) | 142,519 (13,958.8%) |
| 2.0x to 2.9x | 22 (10.9%) | 93 (9.1%) |
| 3.0x to 3.9x | 42 (20.8%) | 212 (20.8%) |
| 4.0x or more | 103 (51.0%) | 163 (16.0%) |
| Total | 202 (100.0%) | 1,021 (100.0%) |
Real Estate Taxes by Mortgage Status in Elk Ridge

| Property Taxes | Without Mortgage | With Mortgage |
| Less than $800 | 3 (1.5%) | 12 (1.2%) |
| $800 to $1,499 | 14 (6.9%) | 46 (4.5%) |
| $800 to $1,499 | 175 (86.6%) | 69 (6.8%) |
| Total | 202 (100.0%) | 1,021 (100.0%) |
Health & Disability in Elk Ridge
Health Insurance Coverage by Age in Elk Ridge
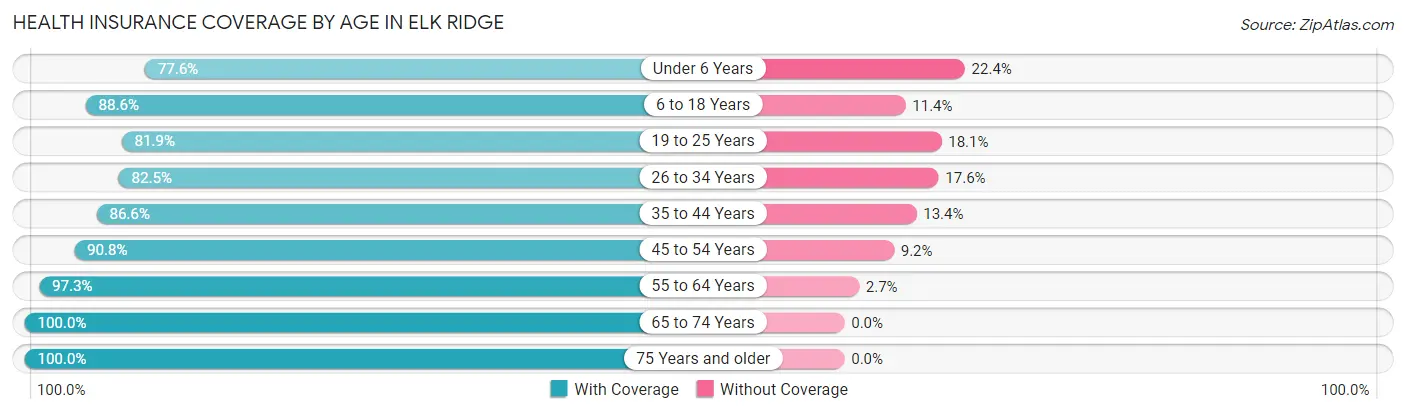
| Age Bracket | With Coverage | Without Coverage |
| Under 6 Years | 439 (77.6%) | 127 (22.4%) |
| 6 to 18 Years | 1,136 (88.6%) | 146 (11.4%) |
| 19 to 25 Years | 249 (81.9%) | 55 (18.1%) |
| 26 to 34 Years | 484 (82.5%) | 103 (17.5%) |
| 35 to 44 Years | 387 (86.6%) | 60 (13.4%) |
| 45 to 54 Years | 413 (90.8%) | 42 (9.2%) |
| 55 to 64 Years | 572 (97.3%) | 16 (2.7%) |
| 65 to 74 Years | 249 (100.0%) | 0 (0.0%) |
| 75 Years and older | 172 (100.0%) | 0 (0.0%) |
| Total | 4,101 (88.2%) | 549 (11.8%) |
Health Insurance Coverage by Citizenship Status in Elk Ridge

| Citizenship Status | With Coverage | Without Coverage |
| Native Born | 439 (77.6%) | 127 (22.4%) |
| Foreign Born, Citizen | 1,136 (88.6%) | 146 (11.4%) |
| Foreign Born, not a Citizen | 249 (81.9%) | 55 (18.1%) |
Health Insurance Coverage by Household Income in Elk Ridge
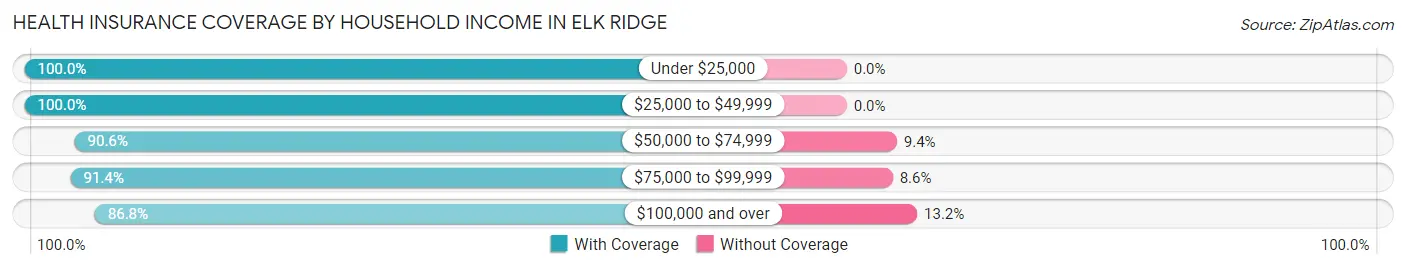
| Household Income | With Coverage | Without Coverage |
| Under $25,000 | 79 (100.0%) | 0 (0.0%) |
| $25,000 to $49,999 | 154 (100.0%) | 0 (0.0%) |
| $50,000 to $74,999 | 348 (90.6%) | 36 (9.4%) |
| $75,000 to $99,999 | 361 (91.4%) | 34 (8.6%) |
| $100,000 and over | 3,159 (86.8%) | 479 (13.2%) |
Public vs Private Health Insurance Coverage by Age in Elk Ridge
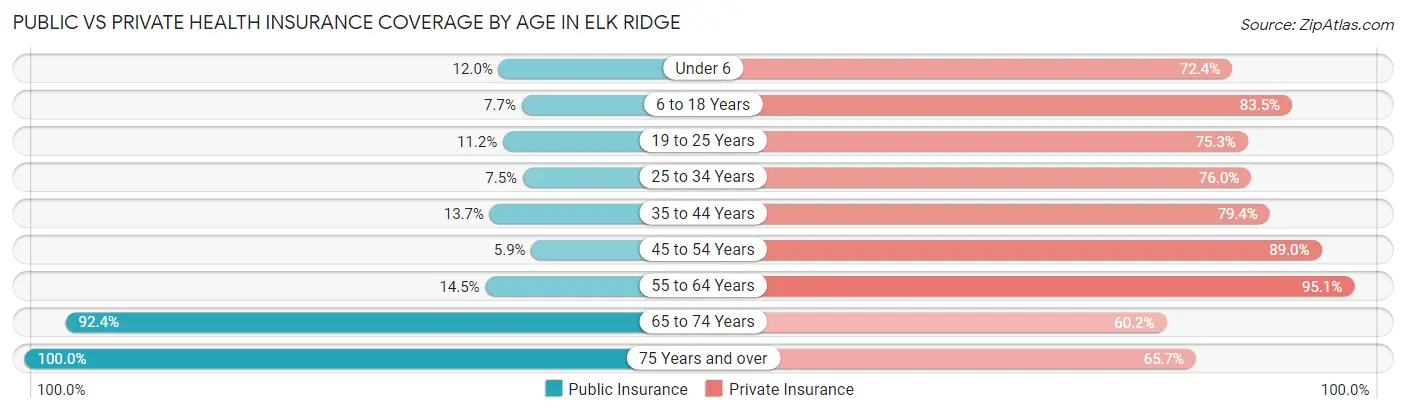
| Age Bracket | Public Insurance | Private Insurance |
| Under 6 | 68 (12.0%) | 410 (72.4%) |
| 6 to 18 Years | 99 (7.7%) | 1,071 (83.5%) |
| 19 to 25 Years | 34 (11.2%) | 229 (75.3%) |
| 25 to 34 Years | 44 (7.5%) | 446 (76.0%) |
| 35 to 44 Years | 61 (13.7%) | 355 (79.4%) |
| 45 to 54 Years | 27 (5.9%) | 405 (89.0%) |
| 55 to 64 Years | 85 (14.5%) | 559 (95.1%) |
| 65 to 74 Years | 230 (92.4%) | 150 (60.2%) |
| 75 Years and over | 172 (100.0%) | 113 (65.7%) |
| Total | 820 (17.6%) | 3,738 (80.4%) |
Disability Status by Sex by Age in Elk Ridge
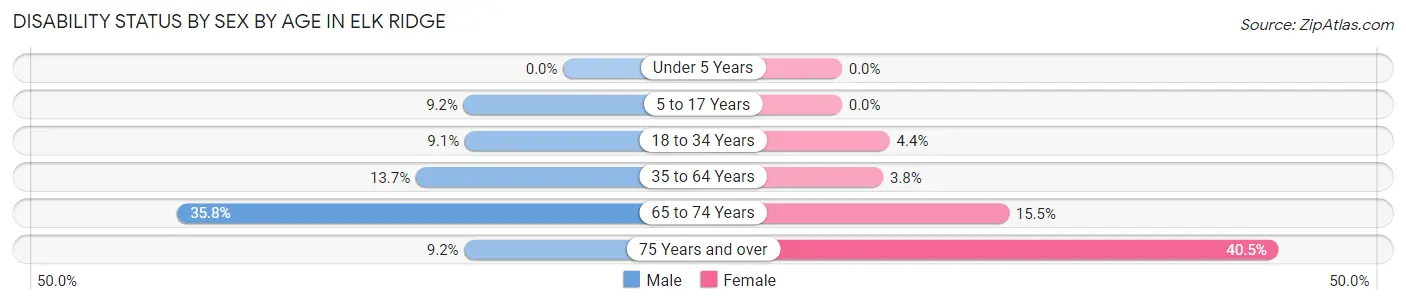
| Age Bracket | Male | Female |
| Under 5 Years | 0 (0.0%) | 0 (0.0%) |
| 5 to 17 Years | 61 (9.2%) | 0 (0.0%) |
| 18 to 34 Years | 44 (9.1%) | 24 (4.4%) |
| 35 to 64 Years | 107 (13.7%) | 27 (3.8%) |
| 65 to 74 Years | 43 (35.8%) | 20 (15.5%) |
| 75 Years and over | 9 (9.2%) | 30 (40.5%) |
Disability Class by Sex by Age in Elk Ridge
Disability Class: Hearing Difficulty
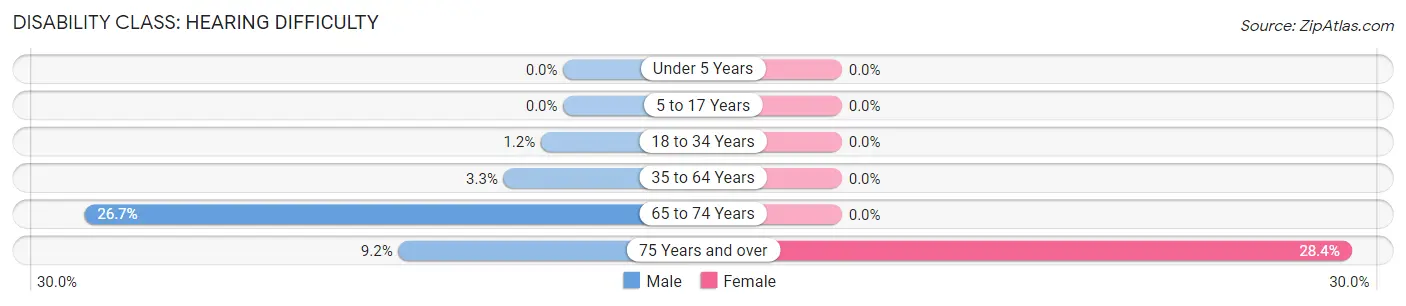
| Age Bracket | Male | Female |
| Under 5 Years | 0 (0.0%) | 0 (0.0%) |
| 5 to 17 Years | 0 (0.0%) | 0 (0.0%) |
| 18 to 34 Years | 6 (1.2%) | 0 (0.0%) |
| 35 to 64 Years | 26 (3.3%) | 0 (0.0%) |
| 65 to 74 Years | 32 (26.7%) | 0 (0.0%) |
| 75 Years and over | 9 (9.2%) | 21 (28.4%) |
Disability Class: Vision Difficulty
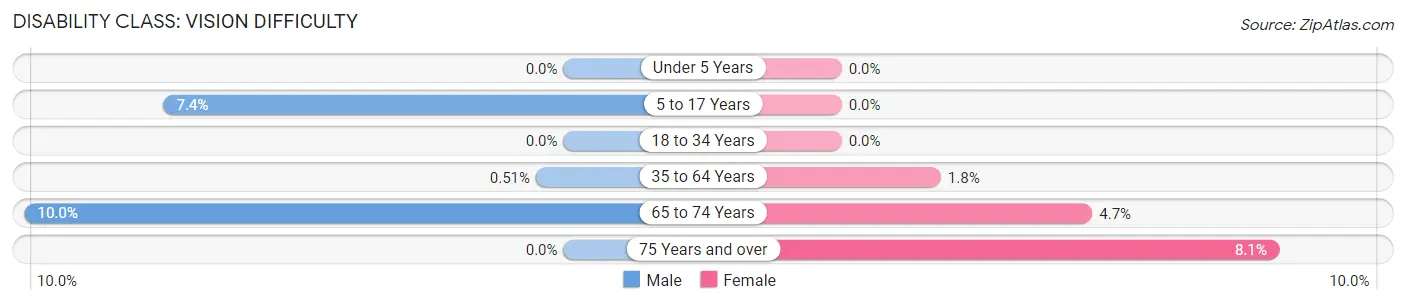
| Age Bracket | Male | Female |
| Under 5 Years | 0 (0.0%) | 0 (0.0%) |
| 5 to 17 Years | 49 (7.4%) | 0 (0.0%) |
| 18 to 34 Years | 0 (0.0%) | 0 (0.0%) |
| 35 to 64 Years | 4 (0.5%) | 13 (1.8%) |
| 65 to 74 Years | 12 (10.0%) | 6 (4.6%) |
| 75 Years and over | 0 (0.0%) | 6 (8.1%) |
Disability Class: Cognitive Difficulty
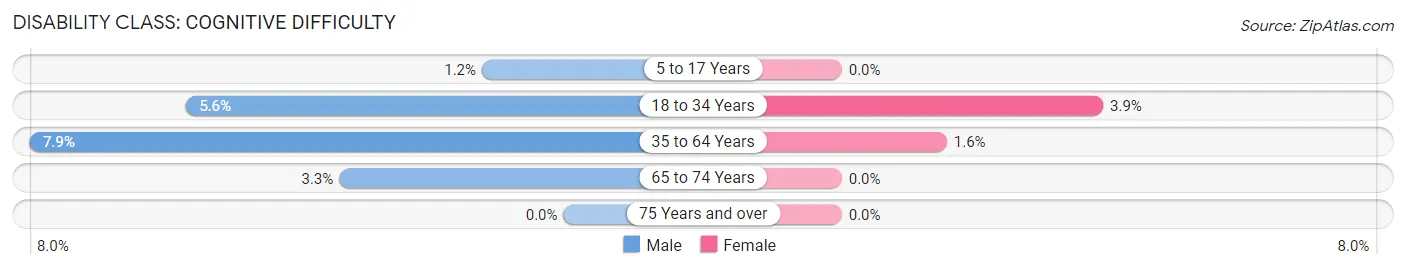
| Age Bracket | Male | Female |
| 5 to 17 Years | 8 (1.2%) | 0 (0.0%) |
| 18 to 34 Years | 27 (5.6%) | 21 (3.9%) |
| 35 to 64 Years | 62 (7.9%) | 11 (1.6%) |
| 65 to 74 Years | 4 (3.3%) | 0 (0.0%) |
| 75 Years and over | 0 (0.0%) | 0 (0.0%) |
Disability Class: Ambulatory Difficulty
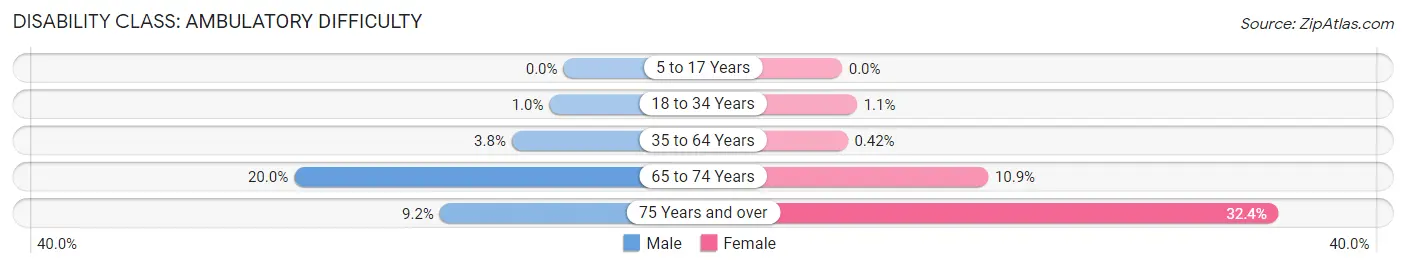
| Age Bracket | Male | Female |
| 5 to 17 Years | 0 (0.0%) | 0 (0.0%) |
| 18 to 34 Years | 5 (1.0%) | 6 (1.1%) |
| 35 to 64 Years | 30 (3.8%) | 3 (0.4%) |
| 65 to 74 Years | 24 (20.0%) | 14 (10.8%) |
| 75 Years and over | 9 (9.2%) | 24 (32.4%) |
Disability Class: Self-Care Difficulty
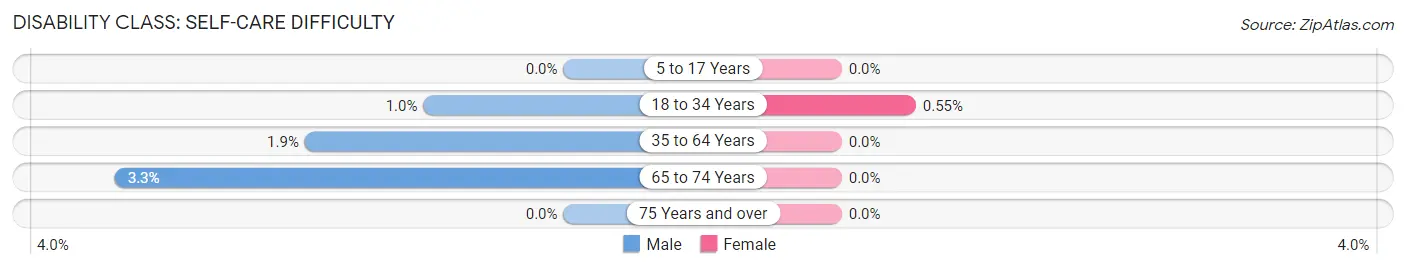
| Age Bracket | Male | Female |
| 5 to 17 Years | 0 (0.0%) | 0 (0.0%) |
| 18 to 34 Years | 5 (1.0%) | 3 (0.5%) |
| 35 to 64 Years | 15 (1.9%) | 0 (0.0%) |
| 65 to 74 Years | 4 (3.3%) | 0 (0.0%) |
| 75 Years and over | 0 (0.0%) | 0 (0.0%) |
Technology Access in Elk Ridge
Computing Device Access in Elk Ridge
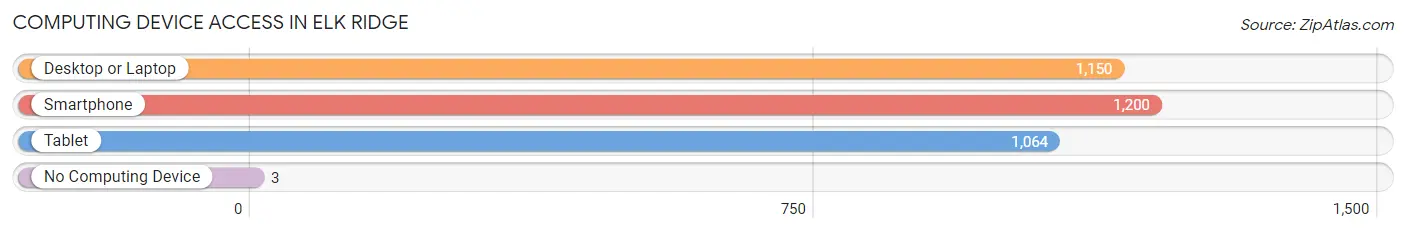
| Device Type | # Households | % Households |
| Desktop or Laptop | 1,150 | 93.6% |
| Smartphone | 1,200 | 97.6% |
| Tablet | 1,064 | 86.6% |
| No Computing Device | 3 | 0.2% |
| Total | 1,229 | 100.0% |
Internet Access in Elk Ridge
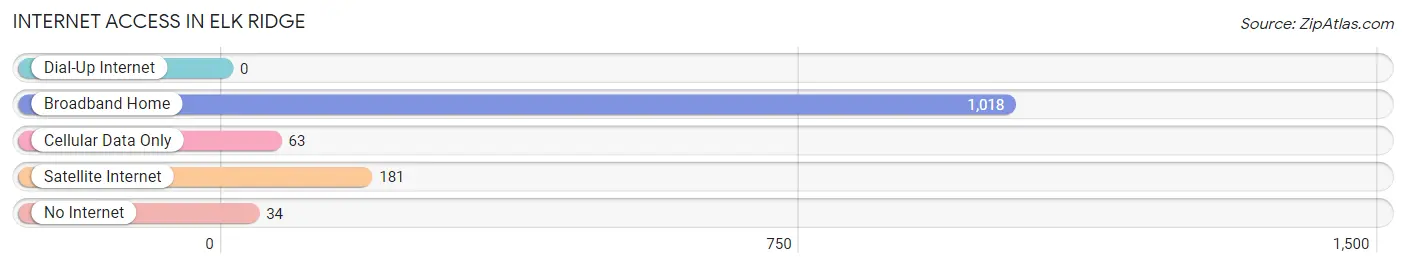
| Internet Type | # Households | % Households |
| Dial-Up Internet | 0 | 0.0% |
| Broadband Home | 1,018 | 82.8% |
| Cellular Data Only | 63 | 5.1% |
| Satellite Internet | 181 | 14.7% |
| No Internet | 34 | 2.8% |
| Total | 1,229 | 100.0% |
Elk Ridge Summary
Elk Ridge is a small city located in Utah, United States. It is situated in the foothills of the Wasatch Mountains, about 25 miles south of Salt Lake City. The city has a population of approximately 4,000 people and is part of the Provo-Orem metropolitan area.
Geography
Elk Ridge is located in the foothills of the Wasatch Mountains, at an elevation of 4,890 feet. The city is situated in the northern part of Utah County, and is bordered by the cities of Springville, Mapleton, and Spanish Fork. The city is located in a semi-arid climate, with hot summers and cold winters. The average annual precipitation is approximately 16 inches.
The city is home to several parks and recreational areas, including the Elk Ridge City Park, which features a playground, picnic areas, and a walking trail. The city also has a golf course, a swimming pool, and a skate park.
Economy
The economy of Elk Ridge is largely based on agriculture and tourism. The city is home to several farms, which produce a variety of crops, including corn, wheat, and hay. The city also has several tourist attractions, including the Elk Ridge City Park, the golf course, and the swimming pool.
The city is also home to several businesses, including a grocery store, a hardware store, and a restaurant. The city is also home to several manufacturing companies, including a plastics manufacturer and a metal fabrication company.
Demographics
As of the 2010 census, the population of Elk Ridge was 4,000. The racial makeup of the city was 94.3% White, 0.7% African American, 0.3% Native American, 0.3% Asian, 0.1% Pacific Islander, and 4.3% from other races. The median household income was $50,000, and the median family income was $55,000.
The city is served by the Elk Ridge School District, which includes two elementary schools, a middle school, and a high school. The city is also home to several churches, including the Church of Jesus Christ of Latter-day Saints, the Catholic Church, and the United Methodist Church.
Conclusion
Elk Ridge is a small city located in Utah, United States. It is situated in the foothills of the Wasatch Mountains, about 25 miles south of Salt Lake City. The city has a population of approximately 4,000 people and is part of the Provo-Orem metropolitan area. The economy of Elk Ridge is largely based on agriculture and tourism, and the city is home to several businesses, including a grocery store, a hardware store, and a restaurant. The racial makeup of the city is 94.3% White, 0.7% African American, 0.3% Native American, 0.3% Asian, 0.1% Pacific Islander, and 4.3% from other races. The city is served by the Elk Ridge School District, and is home to several churches, including the Church of Jesus Christ of Latter-day Saints, the Catholic Church, and the United Methodist Church.
Common Questions
What is Per Capita Income in Elk Ridge?
Per Capita income in Elk Ridge is $36,724.
What is the Median Family Income in Elk Ridge?
Median Family Income in Elk Ridge is $129,904.
What is the Median Household income in Elk Ridge?
Median Household Income in Elk Ridge is $126,131.
What is Income or Wage Gap in Elk Ridge?
Income or Wage Gap in Elk Ridge is 59.4%.
Women in Elk Ridge earn 40.6 cents for every dollar earned by a man.
What is Inequality or Gini Index in Elk Ridge?
Inequality or Gini Index in Elk Ridge is 0.32.
What is the Total Population of Elk Ridge?
Total Population of Elk Ridge is 4,658.
What is the Total Male Population of Elk Ridge?
Total Male Population of Elk Ridge is 2,394.
What is the Total Female Population of Elk Ridge?
Total Female Population of Elk Ridge is 2,264.
What is the Ratio of Males per 100 Females in Elk Ridge?
There are 105.74 Males per 100 Females in Elk Ridge.
What is the Ratio of Females per 100 Males in Elk Ridge?
There are 94.57 Females per 100 Males in Elk Ridge.
What is the Median Population Age in Elk Ridge?
Median Population Age in Elk Ridge is 30.7 Years.
What is the Average Family Size in Elk Ridge
Average Family Size in Elk Ridge is 3.8 People.
What is the Average Household Size in Elk Ridge
Average Household Size in Elk Ridge is 3.8 People.
How Large is the Labor Force in Elk Ridge?
There are 1,988 People in the Labor Forcein in Elk Ridge.
What is the Percentage of People in the Labor Force in Elk Ridge?
63.3% of People are in the Labor Force in Elk Ridge.
What is the Unemployment Rate in Elk Ridge?
Unemployment Rate in Elk Ridge is 4.8%.